The University of Alabama Libraries Special Collections - The ...
218
HAILERS: RETAIL SALESPEOPLE NEAR THE ENTRANCE OF THE STORE AND SHOPPERS‟ APPROACH-AVOIDANCE REACTIONS by CAROLYN FINDLEY MUSGROVE GEORGE R. FRANKE, COMMITTEE CO-CHAIR KRISTY E. REYNOLDS, COMMITTEE CO-CHAIR ALEX E. ELLINGER MICHELE KACMAR GLENN R. RICHEY XIAO TONG A DISSERTATION Submitted in partial fulfillment of the requirements for the degree of Doctor of Philosophy in the Department of Management and Marketing in the Graduate School of The University of Alabama TUSCALOOSA, ALABAMA 2011
-
Upload
khangminh22 -
Category
Documents
-
view
0 -
download
0
Transcript of The University of Alabama Libraries Special Collections - The ...
HAILERS: RETAIL SALESPEOPLE NEAR THE ENTRANCE OF THE STORE AND
SHOPPERS‟ APPROACH-AVOIDANCE REACTIONS
by
CAROLYN FINDLEY MUSGROVE
GEORGE R. FRANKE, COMMITTEE CO-CHAIR
KRISTY E. REYNOLDS, COMMITTEE CO-CHAIR
ALEX E. ELLINGER
MICHELE KACMAR
GLENN R. RICHEY
XIAO TONG
A DISSERTATION
Submitted in partial fulfillment of the requirements
for the degree of Doctor of Philosophy
in the Department of Management and Marketing
in the Graduate School of
The University of Alabama
TUSCALOOSA, ALABAMA
2011

Copyright Carolyn Findley Musgrove 2011
ALL RIGHTS RESERVED
ii
ABSTRACT
This research examines a retail salesperson behavior that has been largely overlooked in
the literature: retail salespeople standing and waiting for customers near the entrance of the store
in retail centers, such as in traditional shopping malls, as well as a variety of other retail
shopping contexts. These salespeople are referred to as “hailers.” The small amount of previous
work in the area and theory suggest that this practice is a positive influence. However, qualitative
interviews and quantitative results suggest the opposite. Many consumers feel uncomfortable
with a salesperson near the entrance of a retail store because they think that the hailer is going to
use high-pressure sales tactics.
The main study, which is grounded in approach-avoidance theory and emotional
contagion theory, consists of two experiments that examine the effects of retail salespeople near
the entrance of stores, as well as other environmental factors and salesperson characteristics. The
first study manipulates store familiarity and retail density in addition to the presence of a retail
salesperson. The second study focuses on particular characteristics of a salesperson present near
the entrance and manipulates the salesperson‟s demeanor and their level of activity. Each of the
stimuli consists of a photograph and scenario combination.
The results of experiment one show that the presence of a hailer has a negative influence
on consumers‟ feelings of pleasure and arousal. Feelings of pleasure (and dominance) have a
positive influence on approach attitudes and store patronage intentions, while arousal has an
inverted-U shaped relationship with store patronage intentions.

iii
The results from experiment two show that when a hailer must be present near the
entrance of the retail store, a salesperson‟s positive demeanor has a positive influence on feelings
of pleasure. In turn, pleasure has a positive relationship with approach attitudes and store
patronage intentions. An unexpected interaction between salesperson demeanor and level of
activity has a disordinal relationship with dominance. Further, dominance has a positive
influence on store patronage intentions.
This research contributes to the domains of retail sales, atmospherics, approach-
avoidance theory, and emotional contagion theory. The findings, managerial and academic
implications, limitations, and future research are discussed.

iv
LIST OF ABBREVIATIONS AND SYMBOLS
a Cronbach‟s index of internal consistency
df Degrees of freedom: number of values free to vary after certain restrictions have been
placed on the data
F Fisher‟s F ratio: A ration of two variances
M Mean: the sum of a set of measurements divided by the number of measurements in the
set
p Probability associated with the occurrence under the null hypothesis of a value as
extreme as or more extreme than the observed value
r Pearson product-moment correlation
t Computed value of t test
< Less than
= Equal to

v
ACKNOWLEDGMENTS
I thank several people for their support throughout the dissertation process and the entire
doctoral program. First, I thank my family for their support. I am grateful to my daughter, Megan
Mathewson, for sacrificing mother-daughter time so that I could work towards this goal. I really
appreciate my husband, Michael Musgrove, and mother, Deborah Dunn, for their emotional
support and child care assistance. I especially thank Michael for his editing skills and willingness
to proofread. Second, I am extremely grateful to my dissertation co-chairs, Dr. George Franke
and Dr. Kristy Reynolds. They both have been so wonderful. I will never be able to repay them
for everything they have done for me and taught me through this dissertation, as well as
throughout the doctoral program. Third, I am also very thankful to the members of the
committee, Dr. Alex Ellinger, Dr. Glenn Richey, Dr. Micki Kacmar, and Dr. Michelle Tong,
who gave valuable advice and input. Of the committee members, I especially thank Dr. Alex
Ellinger for his support and mentorship throughout the doctoral program, classes, dissertation,
and on-going projects. Finally, I thank the coordinator of my doctoral program, Dr. Sharon
Beatty, for her direction and supervision throughout my time at the University of Alabama.
vi
CONTENTS
ABSTRACT ii
LIST OF ABBREVIATIONS AND SYMBOLS iv
ACKNOWLEDGMENTS v
LIST OF TABLES ix
LIST OF FIGURES xii
I. INTRODUCTION
a. Introduction 1
b. Contribution 2
c. Overview of Conceptual Model 4
d. Organization of the Dissertation 5
II. LITERATURE REVIEW AND THEORETICAL FOUNDATIONS
a. Introduction 7
b. Retail Salespeople 7
c. Atmospherics 11
d. Approach-Avoidance Theory 17
e. Emotional Contagion Theory 22
III. EXPLORATORY RESEARCH AND MODEL DEVELOPMENT
a. Overview 26
b. Qualitative Phase 26
c. Facebook 26
vii
d. Retail Salesperson In-depth Interviews 29
e. Consumer In-depth Interviews 38
f. Quantitative Pretest 1 45
g. Quantitative Pretest 2 49
IV. HYPOTHESIS DEVELOPMENT
a. Introduction 54
b. Hypotheses and Rationales 56
c. Experiment One 56
d. Experiment Two 61
V. RESEARCH METHODS
a. Research Design 65
b. Manipulation Development 67
c. Operationalization of the Constructs 69
d. Manipulated Variables 69
e. Measured Variables 79
f. Covariates 81
g. Manipulation Realism, and Demand Checks 82
h. Data Collection Procedures 85
i. Pilot Tests 85
j. Main Test 86
k. Conclusion 87
VI. DATA ANALYSIS AND RESULTS
a. Introduction 99
viii
b. Pilot Test One Results 99
c. Experiment One of Pilot Test One 102
d. Experiment Two of Pilot Test One 113
e. Pilot Test Two Results 121
f. Main Test Results 130
g. Experiment One 133
h. Experiment Two 144
VII. DISCUSSION OF FINDINGS, IMPLICATIONS, LIMITATIONS, AND FUTURE
RESEARCH
a. Introduction 156
b. Discussion of Findings of Experiment One 156
c. Discussion of Findings of Experiment Two 160
d. Academic Implications 163
e. Managerial Implications 167
f. Limitations and Future Research 169
g. Conclusion 169
REFERENCES 171
APPENDIX A 179
APPENDIX B 190
ix
LIST OF TABLES
Table 3.1 Consumer Open-ended Responses via Facebook 27
Table 3.2 Retail Salesperson Interview Guide 30
Table 3.3 Consumer Interview Guide 38
Table 3.4 Pretest One Items 46
Table 3.5 Pretest One Results 48
Table 3.6 Pretest Two Items 49
Table 3.7 Pretest Two Results- Four Groups 51
Table 3.8 Pretest Two Results- Two Groups 53
Table 5.1 Measures in the Experimental Instrument 83
Table 6.1 Experiment One of Pilot Test One Means, Standard Deviations, Reliabilities,
Inter-Correlations, and Square-roots of the Average Variance Extracted 106
Table 6.2 Pilot One Experiment One Multivariate Analysis of Covariance
Between-Subjects Effects 108
Table 6.3 Pilot One Experiment One Multiple Regression Results (Approach) 110
Table 6.4 Pilot One Experiment One Multiple Regression Results (Patronage) 110
Table 6.5 Structural Results for Pilot Test One Experiment One 112
Table 6.6 Pilot One Experiment Two of Means, Standard Deviations, Reliabilities,
Inter-Correlations, and Square-roots of the Average Variance Extracted 116

x
Table 6.7 Pilot One Experiment Two Multivariate Analysis of Covariance
Between-Subjects Effects 117
Table 6.8 Pilot One Experiment Two Multiple Regression Results (Approach) 118
Table 6.9 Pilot One Experiment Two Multiple Regression Results (Patronage) 119
Table 6.10 Pilot Test One Experiment Two Structural Results 120
Table 6.11 Pilot Test Two Means, Standard Deviations, Reliabilities,
Inter-Correlations, and Square-roots of the Average Variance Extracted 125
Table 6.12 Pilot Two Experiment One Multiple Regression Results (Approach) 127
Table 6.13 Pilot Two Experiment One Multiple Regression Results (Patronage) 127
Table 6.14 Structural Results for Pilot Test Two 129
Table 6.15 Experiment One Means, Standard Deviations, Reliabilities,
Inter-Correlations, and Square-roots of the Average Variance Extracted 136
Table 6.16 Main Test Experiment One Multivariate Analysis of Covariance
Between-Subjects Effects 137
Table 6.17 Main Test Experiment One Multiple Regression Results (Approach) 140
Table 6.18 Main Test Experiment One Multiple Regression Results (Patronage) 140
Table 6.19 Structural Results for Main Test Experiment One 142
Table 6.20 Experiment Two Means, Standard Deviations, Reliabilities,
Inter-Correlations, and Square-roots of the Average Variance Extracted 146
Table 6.21 Main Test Experiment Two Multivariate Analysis of Covariance
Between-Subjects Effects 148
Table 6.22 Main Test Experiment Two Multiple Regression Results (Approach) 150
Table 6.23 Main Test Experiment Two Multiple Regression Results (Patronage) 150
Table 6.24 Structural Results for Experiment Two 152

xi
Table 6.25 Summary of Multivariate and Lisrel Results for Pilot Test One,
Pilot Test Two, and Main Test 155

xii
LIST OF FIGURES
Figure 1 Conceptual Model of the Main Tests 6
Figure 4 Conceptual Model of the Main Tests 55
Figure 5.1 Study 1: Store Characteristics 66
Figure 5.2 Study 2: Salesperson Characteristics 67
Figure 5.3 Examples of Photographic Manipulations 71
Figure 5.4 Simulation Interaction Graphs 88
Figure 6.1 Confirmatory Factor Analysis for Experiment One of Pilot Test One 104
Figure 6.2 Confirmatory Factor Analysis for Experiment Two of Pilot Test One 115
Figure 6.3 Confirmatory Factor Analysis for Pilot Test Two 124
Figure 6.4 Confirmatory Factor Analysis for Experiment One 135
Figure 6.5 Confirmatory Factor Analysis for Experiment Two 145
Figure 6.6 Interaction of Salesperson Demeanor and Salesperson Activity
on Dominance 149

xiii

xiv

1
CHAPTER I
INTRODUCTION
Introduction
Retail salespeople play a critical role in customers‟ perceptions of the retail environment
and retail experiences. They occupy a pivotal and boundary-spanning position for retailers, as
they are the primary point of contact between a retailer and customers (Bell, Menguc, and
Widing 2010). Westbrook (1981) named salespeople as the most influential component of
overall retail store satisfaction. Retail salesperson behavior is a critical influence on the success
or failure of a retailer because of its influence on consumer responses, including store patronage
and purchase intentions (Darian, Tucci, and Wiman 2001), purchase decisions (Babin, Babin,
and Boles 1999), perception of service quality (Mittal and Lassar 1996), and overall image of the
retail store (Weitzl, Schwarzkopf, and Peach 1989). This study examines a particular retail
salesperson behavior that has been largely overlooked in the literature: retail salespeople
standing and waiting for customers near the entrance of the store in retail centers, such as in
traditional shopping malls, and a variety of other retail shopping contexts. For purposes of this
research, these retail salespeople are called “hailers.”
There is an important difference between retail salespeople who greet customers at the
entrance of the store, or hailers, and specifically assigned „greeters,‟ based on their subsequent
behavior. Once retail salespeople greet a customer, they attempt to continue the interaction,
accompany the customer throughout the store, and attempt to influence the customer to make a
2
purchase. On the contrary, an employee who is a designated greeter simply says hello to
customers as they enter, possibly points them in the direction of particular merchandise or a
salesperson, watches for shoplifting, and physically remains near the entrance.
Theory and the small amount of previous research that incorporates, but does not focus
on, retail salespeople greeting customers as they enter the store suggests that a retail
salesperson‟s presence at the entrance of a store would be a positive influence. However,
anecdotal evidence and initial exploratory results suggest the opposite. Many consumers feel
uncomfortable with a hailer because they feel like the salesperson is waiting to use high pressure
sales tactics on them. This sort of image can lead to negative outcomes for the retailer. More
knowledge is needed to understand what conditions result in more or less favorable consumer
emotions and behaviors in response to a retail salesperson waiting near the entrance of a retail
store.
Contribution
This research makes contributions to multiple literatures in several ways. First, although a
small number of studies in the retail sales and atmospherics literature incorporate some related
aspects, no existing research specifically focuses on retail salespeople standing near the entrance
of stores waiting for customers, or hailers. As discussed in Chapter III, the qualitative interviews
and two quantitative pretests show that this activity is a fairly common practice. Some retailers
even train and require their salespeople to stand within the first few feet near the entrance. The
lack of research on this particular practice is surprising given the recognition of the importance
of retail salespeople (Babin, Babin, and Boles 1999; Darian, Tucci, and Wiman 2001; Westbrook
1981). Thus, the primary contribution of this research is the examination of this potentially
important retail sales strategy that has been largely overlooked in the retail sales literature.
3
Second, several authors make calls for research on how aspects of the salesperson and the
interaction between the salesperson and the customer interact with the physical environment, or
atmospheric variables. Specifically, Sharma and Stafford (2000) call for research on how
salesperson availability might be coordinated with other factors of the retail environment to
maximize persuasion. Similarly, in their study of salesperson characteristics and consumer
emotion, Lee and Dubinsky (2003) propose that the complicated nature of interpersonal
interaction and emotions in the consumption setting will remain a mystery unless it is considered
along with the physical environment of the retail store. Bitner (1992) also calls for research to
address the moderating effects of the environment on social interactions among customers and
employees. This study answers these calls by examining how a salesperson, being immediately
available at the entrance of a retail store, interacts with another atmospheric variable, retail
density, and a contextual factor, store familiarity, in order to produce effects on consumer
emotions and several customer responses (e.g. patronage intentions, attitudes) that are beneficial
to the firm. This integration of sales and atmospherics makes a contribution to both streams of
literature.
Third, this work addresses the calls that Babin, Babin, and Boles (1999) make for future
research to study 1) the antecedents of attitude toward the salesperson in retail settings and 2) the
effect of specific salesperson behaviors on a consumer‟s attitude toward the salesperson and the
retailer. This study also answers these calls by examining the effects of several potential
antecedents of consumer attitudes, including the focal retail salesperson behavior of standing
near the entrance of a store in a mall.
Fourth, retail salespeople are also subsumed under the social, or human, dimension in
atmospherics taxonomies. However, the social element of the environment has been largely
4
neglected in empirical research (Tombs and McColl-Kennedy 2003). This deficiency in the
literature is highlighted by the fact that there has been a paradigm shift to service-dominant logic
(Vargo and Lusch 2004) and its focus on co-creation of value that often includes an experiential
factor with service providers (Bitner 1992; Tombs and McColl-Kennedy 2003). This research
also seeks to answer these calls by empirically examining a social factor in the retail
servicescape.
Fifth, this research also elaborates on approach-avoidance theory (Mehrabian and Russell
1974) by adding to the list of environmental stimuli. By doing so, this work also elaborates on
the other retailing-specific or services-specific approach-avoidance conceptualizations and
taxonomies of retailing stimuli that are drawn from Mehrabian and Russell‟s (1974) original
theory, such as the work of Bitner (1992), Donovan and Rossiter (1981), Berman and Evans
(1982), and Turley and Milliman (2000).
Sixth, since this work will be the first to focus on this particular retail sales strategy of
retail salespeople standing near the entrance of retail stores, it will lay groundwork for future
research in the area. Some potential avenues for future research could examine differences in
types of shoppers or types of retail establishments. Personality characteristics of the customers as
well as the salespeople could play interesting mediating or moderating roles. Future research is
discussed in more depth in Chapter VII.
Overview of the Conceptual Model
Guided by Mehrabian and Russell‟s (1974) approach-avoidance theory, the proposed
research examines how consumers emotionally and behaviorally react to the presence of a retail
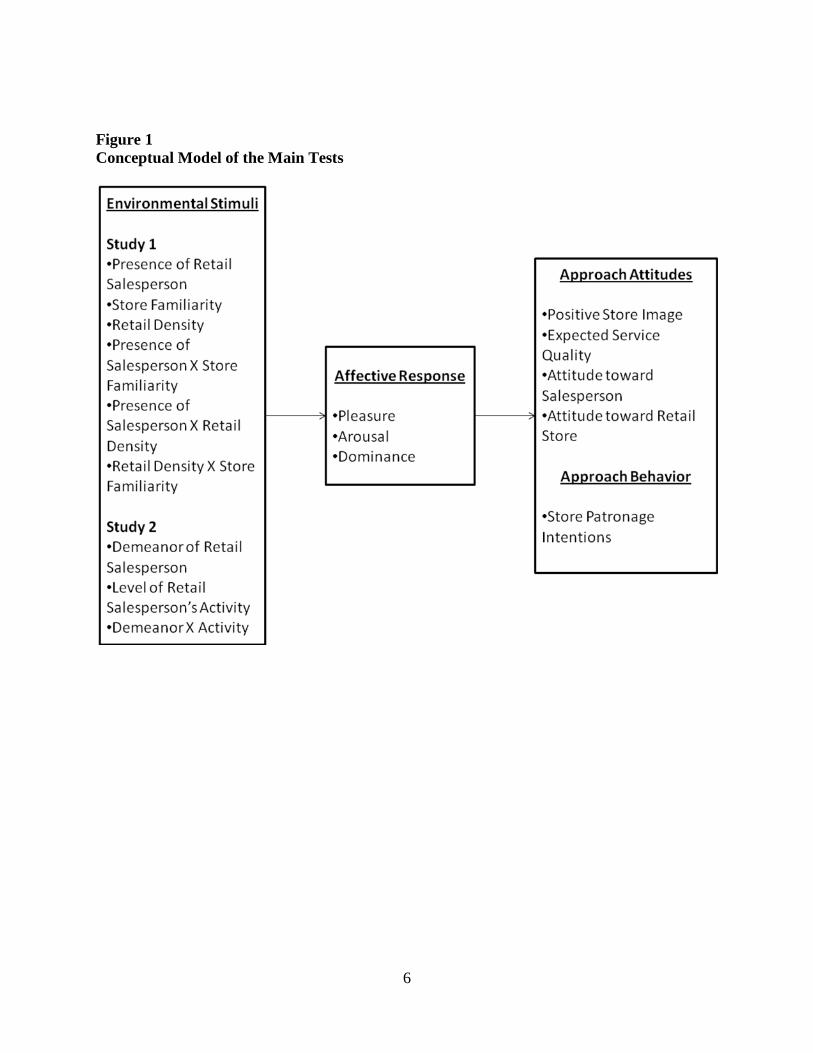
salesperson near the entrance of stores. Figure 1 displays the conceptual model for the two main
studies. The basic process of the model for both study 1 and study 2 is that when a consumer is
5
exposed to an environmental stimulus, or a combination of multiple stimuli, various levels of the
three primary emotions are evoked (pleasure, arousal, and dominance). In turn, the consumers‟
emotional responses influence various approach attitudes and behaviors (positive store image,
expected service quality, attitude toward the salesperson, attitude toward the retail store, and
store patronage intentions.
While the focal independent variable is the retail salesperson at the entrance, this research
also examines other environmental factors‟ interactions with retail salesperson presence, as well
as characteristics of the retail salesperson. In the first experiment of the main study, in addition to
the presence of a retail salesperson, store familiarity and retail density are also manipulated. The
second experiment of the main study focuses on characteristics of a salesperson present near the
entrance. In the second experiment, the salesperson‟s demeanor and level of activity are also
manipulated. Two-way interactions are also investigated in each of the experiments.
Organization of the Dissertation
This section provides an overview of the five chapters that comprise this proposal.
Chapter I provides an introduction to the topic area, the proposed contribution, and the
conceptual model for the main test. Chapter II reviews the literature on retail salespeople and
atmospherics as they relate to the current work, as well as the theoretical foundations of
approach-avoidance theory and emotional contagion theory. Chapter III offers a discussion of
qualitative and quantitative exploratory research that serves as a basis for the model
development. Chapter IV theoretically develops the hypotheses relating to the model. Chapter V
describes the research design and methodology for experiments one and two of the main study.
Chapter VI provides the analysis and results of the two pilot tests and main study. Chapter VII
offers a discussion of the results, limitations, and directions for future research.
6
Figure 1
Conceptual Model of the Main Tests
7
CHAPTER II
LITERATURE REVIEW AND THEORETICAL FOUNDATIONS
Introduction
This chapter reviews multiple streams of literature that are relevant to hailers. First, the
chapter begins with a discussion of related literature on retail salespeople. Second, the chapter
addresses relevant literature in the atmospherics stream. Third, the chapter reviews approach-
avoidance theory, which provides the primary theoretical basis for the main studies. Lastly, the
chapter discusses emotional contagion theory because it provides an additional theoretical basis
for the second experiment of the main study. Tables including literature in these topic areas are
available in Appendix A (retail salespeople) and Appendix B (atmospherics), however, the
literature that is directly related to this study is reviewed in the text of this chapter.
Retail Salespeople
Many authors in the sales literature proclaim that retail salespeople play a crucial role in
customers‟ reactions and other important consequences for the retailer. The way that retail and
other service employees relate to customers plays a significant role in business success (Mittal
and Lassar 1996). Salespeople greatly influence major retail purchase decisions (Babin, Babin,
and Boles 1999). The strength of good salespeople constitutes one of the few remaining ways to
achieve a competitive advantage in the retail industry (Sharma 2001). Because they may be the
only personal contact with the retail establishment that customers have, the impressions that
retail salespeople create are important to the retailer (Weitzel, Schwarzkopf, and Peach 1989).
8
Beatty, Mayer, Coleman, Reynolds, and Lee (1996) explicate how retail firms benefit from retail
salespeople developing relationships with customers through repeated interactions.
Researchers have uncovered a variety of important strategic outcome variables that stem
from customers‟ perceptions of retail salespeople. For example, Westbrook (1981) reports that
satisfaction with store salespeople is the most influential component of overall retail store
satisfaction. Other researchers show that customers‟ perceptions of a salesperson‟s attributes and
relationship building behaviors drive customer satisfaction (van Dolen, Lemmink, de Ruyter, and
de Jong 2002). Salesperson behavior ultimately influences customers‟ satisfaction with the
salesperson, retailer, product, and manufacturer (Goff et al. 1997). Teams of retail salespeople
that perform well may provide a competitive advantage by improving the overall image of the
retailer (Babin, Babin, and Boles 1999; Goff, Boles, Bellenger, and Stojack 1997; Hartline and
Ferrell 1996; Malhotra 1983). Consumers‟ perceptions of a salesperson also influence the image
of a retail store as well as the store‟s products (Weitzel et al. 1989). Consumers‟ attitudes toward
a retail salesperson influence purchase intentions through attitude toward the retailer (Babin,
Babin, and Boles 1999; Darian, Tucci, and Wiman 2001). Mittal and Lassar (1996) find that
personalization, or the social content of the interaction between retail salespeople and customers,
significantly influences customer perceptions of overall service quality and patronage behavior.
These effects are stronger for person-processing services than possession-processing.
Other research shows that various attributes of retail salespeople affect consumers‟
emotions and behaviors. Babin, Boles, and Darden (1995) find different salesperson categories
that are associated with different emotions are activated in the minds of consumers when
different salesperson characteristics are altered. Lee and Dubinsky (2003) propose that
trustworthiness, expertise, friendliness, similarity, enthusiasm, and professional appearance
9
encourage customers‟ positive emotions, ultimately affecting satisfaction and purchase intent.
Similarly, Guenzi, Johnson, and Cataido (2009) find that the trustworthiness of the salesperson
leads to loyalty intentions and perceived value through trust in the store. Yoo, Park, and
MacInnis (1998) report that salesperson service (as captured by knowledge, kindness,
forcefulness, and appropriateness) has a significant effect on both positive and negative emotions
of customers and an indirect effect on store attitude. Ponder, Lueg, and Williams (2006) also find
that customers often seek salesperson assistance because they are helpful, knowledgeable, and
friendly, but a potential drawback is that retail salespeople are sometimes pushy and pressure the
customers. Hedrick, Beverland, and Oppewal (2004) propose that a retail salesperson‟s delivery
has a direct positive relationship with patronage intentions. Darian, Wiman, and Tucci (2005)
also examine the relative importance of various salesperson attributes. They find that both a
salesperson‟s respect of the customer and prices compared to competitors are most important
followed by a salesperson‟s friendliness and knowledge, and responsiveness.
The physical appearance of retail salespeople and other service employees is another area
of research that is attracting attention. In their study of schema typicality of retail stores, Babin
and Babin (2001) include a manipulation for employee appearance, in terms of either matching
the local default expectations closely or not. They find that a salesperson‟s appearance has a
significant effect on typicality. In turn, typicality has an indirect effect on patronage intentions,
hedonic shopping value, and utilitarian shopping value through emotions such as excitement and
discomfort. Similarly, Shao, Baker, and Wagner (2004) find that consumers‟ perceptions of
appropriateness of service personnel‟s dress in the banking industry lead to higher service quality
expectations and purchase intent. They also find that these effects are strengthened in the
boundary conditions of low involvement and female subjects. Finally, through qualitative

10
methods, Kim, Lu, and Johnson (2009) find customers make associations between retail
salesperson appearance and both positive and negative customer emotions, thoughts about the
store image, and purchases.
While none of the sales literature specifically focuses on salespeople near the entrance of
retail stores, salesperson availability is somewhat similar. Naylor and Frank (2000) report that
customers report higher perceptions of overall value when the salesperson initiates contact than
when the customer initiates contact or there is no contact. Perception of a salesperson‟s
willingness to help is more influential on willingness to buy than perception of product quality
(Sweeney, Soutar, and Johnson 1997). As part of a salesperson‟s customer orientation, a
salesperson‟s availability to offer assistance is of utmost importance to customers (Sharma 2001;
Williams and Seminerio 1985). Sharma and Stafford (2000) find that salesperson availability has
a direct effect on credibility, persuasion, product evaluation, and buying intention. They also
examine the difference in prestige and discount stores to find that a reduction in the number of
retail salespeople does not affect buying intent for prestige stores, but an increase in the number
of salespeople does increase buying intentions in discount stores. Likewise, Grewal, Baker, Levy
and Voss (2003) find that prestige stores, with more visible salespeople available to offer
assistance, produce reduced perceived wait time, which leads to increased store patronage.
In the piece of work that is closest to the study at hand, Darian et al. (2001) qualitatively
find that in terms of salesperson availability, some customers prefer to be greeted immediately
upon entry to a retail store and others feel that it is aggressive or overzealous, but almost all of
their respondents feel it is important not to be pressured. However, as part of a conjoint analysis,
respondents indicated that they are more likely to select a store where a salesperson immediately
greets them as they enter over a store in which a salesperson is hard to find. While a few aspects
11
of Darian et al.‟s (2001) study are similar to the current study, fundamental differences exist.
Their study includes a greeting as a manipulation, but this aspect of the study receives only
marginal attention. In the current study, retail salespeople are manipulated as standing a few feet
inside of the entrance of the store. They appear poised to greet a customer, but have not yet done
so. In addition, unlike the greeting in Darian et al.‟s (2001) study, the retail salesperson‟s initial
interaction with the customer at the entrance of the store is the focus of the current study. Also,
their shopping context is moderately highly-priced items in a consumer electronics store,
whereas the current study‟s context is a variety of types of retail stores in a traditional mall.
Consumers often browse through malls and other types of retailing centers and can see whether a
salesperson is near the entrance before deciding whether to enter the store, unlike free-standing
stores where the customer has already decided to enter the store beforehand, and often cannot see
inside the doorway from outside. Finally, Darian et al. (2001) note that their context involves
extended decision making, which implies that customers may want to spend some time in the
store before interacting with salespeople. In contrast, the current study will not necessarily
involve an extended decision making context. Finally, these authors do not specifically examine
the location of the salesperson relative to the entrance or if the salesperson is visible to the
customers prior to entering the store. The current study specifically focuses on the retail entrance
location with the salesperson clearly visible to customers as they shop through a retail center.
Atmospherics
Another body of literature that is related to the current study is atmospherics.
Atmospheric variables, or stimuli in the retail environment, play an important role in retail
service encounters (Chebat and Dube 2000; Grewal, Baker, Levy, and Voss 2003; Sharma and
Stafford 2000; Turley and Milliman 2000). According to Bitner (1990), atmospheric planning

12
can make the difference between success and failure for a business (Bitner 1990). In short, the
buying environment can directly influence purchasing behavior (De Mozota 1990).
Kotler (1973) introduces the idea of atmospherics into the literature. He notes that in-
store environments have an effect on customers‟ perceptions, leading to their subsequent
behaviors. He predicts that they will become the chief form of competition. According to Kotler
(1973), customers perceive the atmospheric environment of a store through sensory cues,
including: visual (i.e., lighting, color), aural (i.e., music), tactile (i.e., cleanliness), and olfactory
(i.e., scent). The study of these facility-based effects is called by several names, such as
atmospherics, shelf-space studies, environmental psychology, and servicescapes. A wide range
of outcomes have been examined as consequences of atmospheric variables. Some of the most
common dependent variables are sales, purchase behavior, time spent in the store, and approach-
avoidance behaviors (Turley and Milliman 2000).
A wide variety of atmospheric variables are investigated in the literature. Turley and
Milliman (2000) provide a thorough review of the atmospheric variables using a modified
version of Berman and Evan‟s (1995) categorization as a framework. They extend the original
four categories to include a human dimension. The first category, external variables, includes
variables such as the storefront, marquee, entrances, display windows, building architecture, the
surrounding area, and parking. Very little research exists in this category. Turley and Milliman
(2000) point out that only four published articles examine the exterior of the store on buyer
behavior, at the time that their review piece was published. In contrast, the second category,
general interior variables, receives more attention in the literature that any other category. The
general interior variables category includes variables such as flooring/carpeting, lighting, scents,
music and other sounds, temperature, cleanliness, wall textures, and color usage. The third

13
category, layout and design, includes variables such as fixtures, allocation of floor space, product
groupings, traffic flow, department locations, and allocations within departments. Turley and
Milliman (2000) identify only three published studies in this category. The fourth category,
point-of-purchase and decoration, includes variables such as product displays, point-of-purchase
displays, posters, signs, cards, teletext messages, and wall decorations. Finally, the fifth category
is human variables, which includes variables such as customer crowding or density, privacy,
customer characteristics, personnel/employee characteristics, and employee uniforms. This
category can be subcategorized into two areas of research: the influence of other shoppers and
the influence of retail employees on shopping behavior. While research in the human variables
category is somewhat limited, most of the attention focuses on the impact of other customers on
shopping behavior, with an emphasis on shopper density and perceived crowding. Research on
the impact of retail salespeople as an atmospheric variable is extremely limited.
Although researchers focus on many different topics within the atmospherics literature,
the two atmospheric variables that are especially relevant to the current work are retail density,
or crowding, and retail salespeople as an atmospheric influence. These areas are discussed in
more detail in the following paragraphs.
Retail density, or crowding, is central to retail atmospherics, yet it is seldom taken into
consideration (Michon, Chebat, and Turley 2005). Although many researchers use the terms
consumer density, retail density, and crowding interchangeably, Stokols (1972) draws an
important distinction between density and crowding. Density is a physical condition involving
spatial limitation, as opposed to crowding which is a motivational or experiential state that is
perceived by an individual. Density is a necessary, but not sufficient, condition for the perception
of crowding. Social interference, restriction of movement, and other personal characteristics
14
influence individuals to perceive crowding. Hui and Bateson (1991) find that consumer density
indirectly effects pleasure, as mediated by both perceived crowding and perceived control.
Machleit, Erogulu, and Mantel (2000) focus on the complex relationship between perceived
retail crowding and shopping satisfaction. They find that the negative relationship between both
human and spatial crowding and shopping satisfaction is partially mediated by a variety of
emotions. Further, they show that this decrease in shopping satisfaction associated with crowding
is moderated by expectations of crowding, personal tolerance for crowding, and store type. As
part of their study of atmospherics in Egyptian shopping malls, El Sayed, Farrag, and Belk
(2003) find that behavior intentions and pleasure are significantly lower in conditions of
crowdedness. Recently, Pan and Siemens (2010) examine the differences in the impact of retail
density in goods versus service settings. They find that in a goods setting, there is an inverted U-
shaped crowding effect on store attitudes and behavioral intentions. In a service setting, the
relationship between retail crowding and outcome variables is linear, except in conditions of t ime
pressure. Interestingly, they show that consumers have more favorable attitudes and expect to
pay more as the level of crowding increases in service settings than in goods settings.
A recent trend in atmospherics research is to test multiple atmospheric variables
simultaneously so that the interaction effects between the variables can be explored (Wakefield
and Baker 1998). This approach has more external validity because consumers never encounter
individual atmospheric variables. They process environmental cues holistically (Babin and Suter
2003) within the context of several other environmental cues simultaneously presenting
themselves. Researchers are beginning to examine retail density and crowding in conjunction
with other atmospheric variables. Eroglu, Machleit, and Chebat (2005) examine the main and
interactive effects of retail density and music tempo. In regard to density, they find a main effect
15
on the total dollars spent. Consumers spend more money when there are higher levels of retail
density. They also find an interactive effect of music tempo and retail density on hedonic and
utilitarian shopping value. Both types of value are highest in conditions of moderate incongruity,
or fast music with high density and slow music with low density. Similarly, Michon et al. (2005),
jointly examine retail density and ambient odors. They find that ambient odors have a positive
effect on consumers‟ perceptions of the mall environment and emotions only during times of
medium retail density. This effect disappears under conditions of low or high retail density.
Finally, Mattila and Wirtz (2008) report that the joint effects of perceived crowding and
salesperson friendliness increase the likelihood of impulse purchasing.
According to Hoffman and Turley (2002), the interaction of the inanimate environment,
contact personnel, and other customers is an important area of study. However, the social, or
human, dimension of atmospherics is generally neglected in the literature, with the exception of
several crowding, or retail density, studies (Chebat and Dube 2000; Turley and Milliman 2000).
Very little is known about the role that employees play in the physical retail environment.
Particularly, no research in the atmospherics literature directly addresses the effects of a
retail salesperson standing near the entrance of a retail store, but a small number of studies
incorporate a retail salesperson or a salesperson greeting as a part of their stimuli. A set of papers
that stems from a common video manipulation include a social factor as a prestige-image store
environment. By using a video showing the experience of walking through a greeting card store,
the prestige-image is manipulated by using a simultaneous combination of three cues: 1) three
salespeople rather than one salesperson, 2) the salespeople wearing aprons versus not wearing
aprons, and 3) one salesperson greeting the customer versus no greeting (Baker, Levy, and
Grewal 1992; Baker, Grewal, and Parasuraman 1994; Baker, Parasuraman, Grewal, and Voss
16
2002; Grewal, Baker, Levy, and Voss 2003). These studies find a positive relationship between
this prestige social factor and arousal, pleasure, perceptions of merchandise quality and service
quality, and store patronage intentions. This set of studies is similar to the current study, in that a
salesperson is present and greets the customer. However, since these characteristics are only part
of the prestige-image manipulation, the individual effects of salesperson presence and the
greeting cannot be examined. Unlike the current study, these studies do not focus on activity near
the entrance of the store and the extent to which the salespeople are visible prior to entering the
store is unspecified.
In another set of studies that includes a retail salesperson, the scenarios for both high- and
low-personalized customer service conditions have a retail salesperson greeting the customer
after entering the store as part of a longer sequence of events (Hu and Jasper 2006, 2007).
However, since the greeting is included in both manipulations, the resulting data reveals no
information based on the greeting itself.
Hedrick, Beverland, and Oppewal (2004) argue that relationships exist among the retail
salesperson‟s delivery, store atmospheric cues, and patronage intentions. They propose that 1) a
retail salesperson‟s delivery will have a direct positive relationship with patronage intentions, 2)
store atmosphere cues will have a direct influence on customer‟s expectations of a retail
salesperson‟s delivery, and 3) a retail salesperson‟s delivery will moderate the relationship
between customer expectations of salesperson delivery and patronage intent. Later, these same
authors test their ideas about retail salesperson and customer interactions with a scenario-based
experiment. They find that there are significant differences in high and low level retail
salesperson interaction, in that those who are in the higher interaction group had lower ratings of
patronage intentions. The store atmosphere has a significant impact on customer expectations of

17
the retail salesperson, such that higher perceived ambience results in higher expectations of a
retail salesperson‟s behavior, but not in higher salesperson credibility. This study highlights the
significance of the relationship between store atmospherics and the retail salesperson interaction
on repatronage intentions because atmospherics impact customers‟ expectations of a retail
salesperson, which in turns influences customer satisfaction.
In summary, existing research on retail salespeople in the atmospherics literature is
limited, leaving much to be investigated. The proposed study will contribute to filling the gap in
the social dimension of the atmospherics literature by examining retail salespeople‟s behaviors,
and their interactions with different atmospheric variables.
Approach-Avoidance Theory
Theoretical support for this study is drawn from Mehrabian and Russell‟s (1974)
approach-avoidance theoretical framework that is also commonly referred to as Mehrabian and
Russell‟s approach-avoidance theory, Mehrabian‟s theory of emotion, and the M-R model. It is
based on the stimulus-organism-response (S-O-R) paradigm of environmental psychology.
Within this theory, an environmental stimulus (S) arouses emotions in an organism (O) that
consequently evoke behavioral responses (R). In this case, the focal stimulus is a hailer, the
organism is the consumer and his or her evoked emotions, and the response can encompass a
wide range of potential shopper behaviors. According to Mehrabian and Russell (1974), physical
or social stimuli in the environment affect the emotional state of a person, which in turn elicits a
behavioral response. In their model, both the environment (including sense modality variables
and information rate) and personality characteristics that are associated with emotion are
included as antecedents of the primary emotional responses. The model covers a wide range of
stimuli, although it does not include a comprehensive taxonomy.
18
The three primary emotional responses that mediate the relationship between a stimulus
and a behavioral response are pleasure, arousal, and dominance. These three emotions together
describe practically any emotional response to a stimulus (Mehrabian 1980). Pleasure, arousal,
and dominance are conceptualized as orthogonal. However, sometimes correlations exist among
the emotions, especially between pleasure and arousal. Pleasure is a feeling state that is described
by the degree to which a person feels good, joyful, happy, or satisfied in the situation. Arousal is
a feeling state of being excited, stimulated, alert, frenzied, or active in a situation. Finally,
dominance is the extent to which an individual feels in control of, influential, or free to act in the
situation (Donovan and Rossiter 1982; Ezeh and Harris 2007; Mehrabian and Russell 1974).
The behavioral responses that result from the three primary emotions compose two broad
groups comprised of approach and avoidance responses. Mehrabian and Russell (1974) label all
of the responses as behaviors, regardless of whether they are behaviors, emotions, or cognitions.
Approach-avoidance behaviors are the “physical movement toward, or away from, an
environment or stimulus, degree of attention, exploration, favorable attitudes such as verbally or
nonverbally expressed preference or liking, approach to a task (the level of performance), and
approach to another person (affiliation)” (Mehrabian and Russell 1974, p. 96). Specifically in a
retailing context, approach behaviors include a willingness or desire to move towards, stay in,
explore, interact with, perform in, and return to an environment. Avoidance behaviors include
deteriorated performance, dissatisfaction, anxiety, boredom, unfriendliness, and a desire to leave
the environment (Donovan and Rossiter 1982).
Feelings of pleasure are associated with approach behaviors. An important implication is
that pleasure may be produced by the object or person being approached. This associated
approach is not contingent on the approach behavior itself. Instead, approach is simply due to
19
pleasing characteristics that are associated with a particular environment or stimulus. The
pleasure-approach relationship may be understood in terms of reinforcement (Skinner 1961), as
pleasure-eliciting stimuli are positively reinforcing. Pleasure is a sufficient, but not necessary,
condition for positive reinforcement and approach behaviors (Mehrabian and Russell 1974).
According to approach-avoidance theory, feelings of arousal have an inverted U-shaped
relationship with approach and avoidance responses. Approach behaviors, such as physical
approach, preference, positive attitudes, and exploration, are most likely at moderate levels of
arousal. Extremely high or low levels of arousal are associated with avoidance behaviors
(Mehrabian and Russell 1974). Thus, if a stimulus influences a very low amount of arousal, then
it is boring. On the other hand, if a stimulus creates too much excitement or anxiety and is too
arousing, then it could be stressful. In either case, too little or too much arousal produces
avoidance responses.
Feelings of dominance are associated with approach behaviors. Conversely,
submissiveness is associated with avoidance behaviors (Donovan, Rossiter, Marcoolyn, and
Nesdale 1994; Mehrabian and Russell 1974). Therefore, if people feel that they are in control of
their situation and have freedom to act in the environment as they choose, then they will have
approach responses. Dominance receives the least attention of the three emotional dimensions in
the retail literature and there have been some equivocal findings. For example, Mehrabian and
Russell‟s (1974) theory predicts that feelings of dominance are associated with approach.
However, Mehrabian and Russell (1974) find the opposite in an empirical test of their theory in
their initial book. Dominance has been marginalized or even dropped in many studies (Donovan
and Rossiter 1982; Russell and Pratt 1980). However, Biggers and Rankis (1983) explain that in
Mehrabian and Russell‟s (1974) original work, the range of responses is restricted. They show
20
that dominance is actually the preferred state, meaning individuals approach dominance eliciting
situations, and they suggest that dominance be included in future research.
Donovan and Rossiter (1982, p. 37) extend Mehrabian and Russell‟s (1974) approach-
avoidance theory to retail environments. They provide a response taxonomy to describe approach
and avoidance behaviors in a retail setting:
1. The desire to physically stay in (approach) or leave (avoidance) the environment:
related to store patronage intentions.
2. The willingness to explore the environment (approach) or tendency to remain
inanimate with the surroundings (avoidance): related to the degree of in-store searching
and the range of merchandise to which the customer allows himself or herself to be
exposed.
3. The desire to communicate with others in the store (approach) or tendency to avoid any
interaction with others (avoidance): related to the interaction with the sales staff and other
customers.
4. The degree of enhancement (approach) or hindrance (avoidance) that the environment
gives to solving problems: related to satisfaction and repeat shopping frequency, as well
as the amount of time and money spent in the store.
Of Donovan and Rossiter‟s (1982) four aspects of approach-avoidance in retail settings,
the first and third responses have the most relevance to this study. First, physical approach or
avoidance relates to store patronage. Also, the desire to communicate approach or avoidance
relates to the consumers‟ responses to, and interactions with, a retail salesperson at the entrance
of a store. They find that pleasure and arousal relate particularly well to consumer behaviors in
retail settings, but dominance has much less predictive power. Specifically, pleasure is a
determinant of approach behaviors in retail stores, such as spending behavior. Arousal, or store-
induced alertness or excitement often due to lighting, music, or other atmospheric stimuli,
increases time spent in the store and willingness to interact with personnel.
Bitner (1992) further expands the approach-avoidance framework for retail and other
service settings in her development of a framework for understanding environment-user
relationships in service organizations that is referred to as the servicescape model. The
21
servicescape model builds on previous approach-avoidance theory by adding a taxonomy of
environmental stimuli that trigger the emotional responses. The stimulus variables in Bitner‟s
(1992) conceptual model are categorized into three environmental dimensions: 1) ambient
conditions, 2) space/function, and 3) signs, symbols, and artifacts. Also, the model incorporates
service employees as an important part of understanding how consumers relate to their
environment. However, in Bitner‟s model, employees are not considered as an environmental
stimulus, as they are in the present work. Instead, environmental stimuli influence employees‟
approach and avoidance responses in a way that parallels customers‟ responses.
The proposed research will build on Mehrabian and Russell‟s (1974) approach-avoidance
theory, as well as its subsequent extensions into retailing, in a number of ways. First, this
research will apply approach-avoidance theory to focus on a specific previously unexplored
environmental stimulus, hailers, answering calls to explore additional environmental stimuli
(Mehrabian and Russell 1974). Second, this research will elaborate on Bitner‟s (1992)
taxonomies of factors that drive approach-avoidance behaviors by investigating a social
dimension in general, as suggested by Turley and Milliman (2000) and Tombs and McColl-
Kennedy (2003). Third, this research investigates multiple environmental factors and their
interactions with the presence of a retail salesperson at the entrance of stores, answering several
calls (Bitner 1992; Lee and Dubinsky 2003; Sharma and Stafford 2000). Fourth, most of the
previous research focuses on single variables in isolation and more knowledge is needed on how
environmental stimuli interact with each other (Michon, Chebat, and Turley 2005). Mehrabian
and Russell‟s (1974) theory discusses interactions between pleasure, arousal, and dominance, but
does not address interactions among different environmental stimuli. Finally, this study will
consider dominance in the emotional responses to environmental stimuli. Dominance has been
22
marginalized or excluded from much empirical and theory-building research since Donovan and
Rossiter‟s (1982) introduction of approach-avoidance theory to the retailing literature and
finding of no strong effects for dominance.
Emotional Contagion Theory
The theory of emotional contagion provides a secondary theoretical basis for the
hypotheses in the second experiment in the main study. Emotional contagion is “the tendency to
automatically mimic and synchronize expressions, vocalizations, postures, and movements with
those of another person‟s and consequently, to converge emotionally” (Hatfield, Cacioppo, and
Rapson 1994, pp. 153-154). According to this theory, people mimic what they observe in others
continuously and unconsciously. Hatfield et al.‟s (1994) emotional contagion theory is also
known as primitive emotional contagion because of the automatic and unconscious aspect of
human reactions to other‟s emotional displays. People‟s subjective emotional experience is
continuously influenced by the activation of and feedback from various types of mimicry.
Therefore, people tend to „catch‟ the emotions of other people with whom they interact. The
awareness of emotional contagion has implications for a variety of areas of interpersonal
communication (Hatfield, Cacioppo, and Rapson 1993; Hatfield et al. 1994). Thus, in terms of
the context of the present study, emotional contagion theory suggests that customers‟ perceptions
are influenced by the emotions of retail salespeople with whom they interact. If the retail
salespeople are happy, then the customers should also become happy. Alternately, if the
salespeople appear unhappy or as if they do not want to be in the store environment, then
customers should feel similarly.
Researchers produce mixed findings over the existence of primitive emotional contagion.
For example, contrary to their expectations, Hennig-Thurau, Groth, Paul, and Gremler (2006)

23
find that the extent of smiling by service employees in a faux video store did not influence
customer emotions after a service experience, although there is a positive effect on customer-
employee rapport. However, they find that authenticity of the employee‟s emotional display does
have a significant effect on customer positive affect. They suggest that primitive emotion
contagion is more likely in the early phases of service encounters. In the context of the current
work, the interaction between the customers and the retail salesperson near the entrance of the
store takes place in the early stages of the service encounter, so the principles of primitive
emotional contagion should hold. Conversely, several other authors find sufficient evidence of
mimicry to support the concept of primitive emotional contagion. For example, Barger and
Grandey‟s (2006) findings support facial mimicry effects, as the strength of an employee‟s smile
has a direct positive effect on customers‟ own smile strength, service encounter satisfaction, and
service quality appraisal. In their study of the effects of threat and stress, Gump and Kulik (1997)
also find evidence of behavioral mimicry of facial expressions in emotional contagion.
Several researchers employ emotional contagion theory to explain how retail and service
employees‟ displays of emotion influence important strategic outcomes for customers and the
firm. Pugh (2001) establishes a direct positive relationship between employees displaying
positive emotions and customer affect and customer perceptions of service quality. Tsai (2001)
shows that positive emotional displays influence customer purchase decisions, customer
willingness to return to the store, and positive word-of-mouth. Wang (2009) demonstrates that
service personnel-displayed emotion hierarchically influences consumers‟ emotions, satisfaction
with service personnel, brand attitude, and patronage intention. Sharma and Levy (2003)
establish a positive relationship between retail salespeople‟s affect toward customers and their
24
sales performance. Sharma (1999) finds that if customers perceive that salespeople have positive
affect toward them, then they experience enhanced message processing and persuasion.
Furthermore, several researchers examine the boundary conditions and intervening
mechanisms of the relationship between employee emotional displays and customer reactions.
For example, Howard and Gengler (2001) find that the emotional contagion effects associated
with smiling can create a positive attitudinal product bias, mediated through facial mimicry. As
mentioned above, Hennig-Thurau et al. (2006) find that the authenticity of the smile serves as a
boundary condition for the effects of employee smiling on customer reactions. Some research
investigates salesperson individual differences in the effectiveness of emotional contagion. For
example, Sharma and Levy (2001) find that older and female salespeople demonstrate higher
levels of affect that translates to better sales performance. Verbeke (1997) finds individual
differences in salespeople, such that those who are sensitive to the emotions of others in
combination with being emotionally sensitive themselves are likely to have better performance.
Tsai and Huang (2002) build on Tsai‟s (2001) study by demonstrating that the influence of
employee affective delivery on customers‟ willingness to return to the store and pass positive
comments to others is mediated by customer in-store positive moods and perceived friendliness.
They also find that employee affective delivery has an indirect influence on customer behavioral
intentions through time spent in the store. Finally, Sönderland and Rosengren (2010) test the
effects of emotional contagion of both happy and unhappy service workers (rather than happy
versus neutral) on customers under conditions of poor and good technical service. They find that
smiling improves customer‟s satisfaction only if there is good technical service quality.
In summary, several studies suggest that emotional contagion operates through
salespeople and other service employees smiling and displaying positive emotions to influence

25
the emotions of customers, as well as several strategically important outcome variables. The
theory of emotional contagion (Hatfield et al. 1994) provides a theoretical basis for the
hypotheses in the second main study that concerns the demeanor of a salesperson standing near
the entrance of a retail store. This study builds on this stream of literature by demonstrating
another context in which emotional contagion could influence retail salesperson-customer
interactions. Furthermore, the current work answers calls for further investigation into variables
that may moderate the effects of emotional contagion (Pugh 2001; Sönderland and Rosengren
2010).
26
CHAPTER III
EXPLORATORY RESEARCH
Overview
Because hailers have not been the focus of previous retail sales or atmospherics research,
I begin with an exploratory approach. The exploratory research discussed in this chapter includes
three phases: one multiple-step qualitative phase and two scenario-based, experimental
quantitative pretests. Each subsequent study was designed to build on its predecessor. The results
of these studies serve as the basis for the present research study.
Qualitative Phase
The first phase of the exploratory research is qualitative. By using inductive, qualitative
methods, ideas and variables that may be related to consumers‟ reactions to hailers in retail stores
emerge and can be used to inform later quantitative steps in the research (Strauss and Corbin
1998). First, consumers provide preliminary feedback on their impressions via an online social
network, Facebook. Next, to gain deeper insight into the consumer-retail salesperson interaction,
33 in-depth interviews are conducted with retail salespeople (16) and consumers (17). The in-
depth interview method is appropriate when seeking to understand a phenomenon that has yet to
be extensively explored (Lincoln and Guba 1985; Strauss and Corbin 1998).
Initially, informal observation reveals that while many retail stores in traditional malls
position a salesperson near their entrance, many consumers have negative reactions to their
presence. In order to get a preliminary idea of how consumers feel about this practice, consumers
27
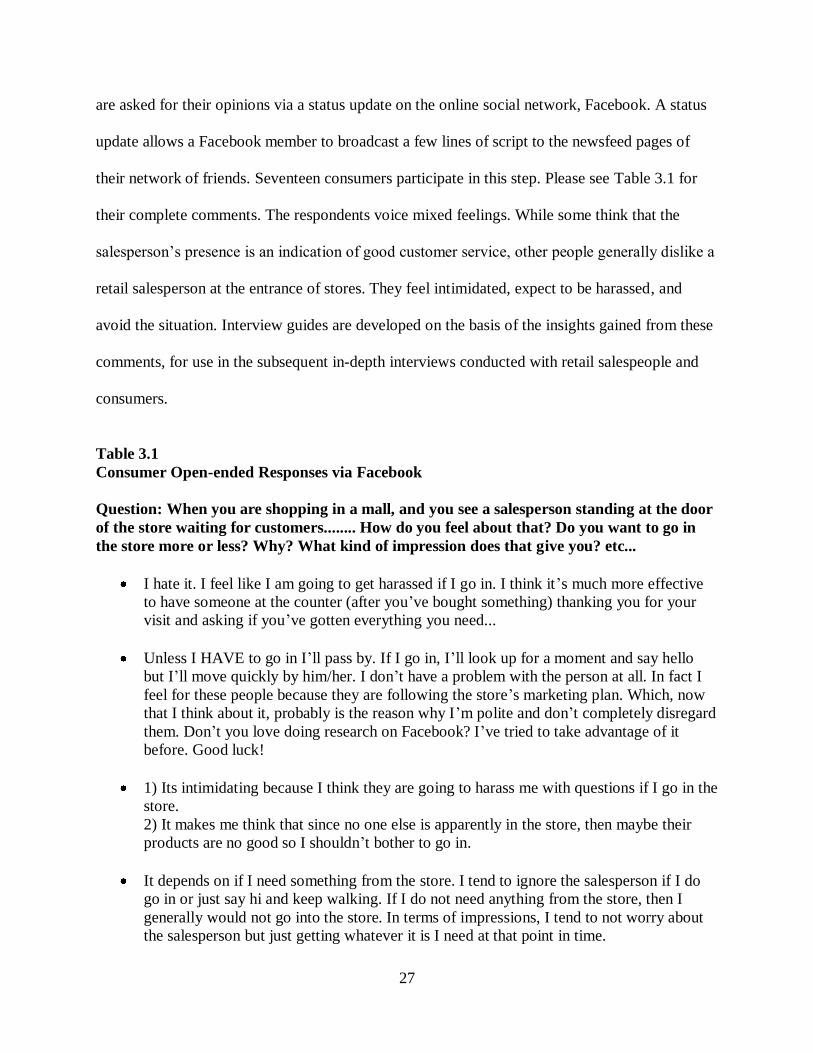
are asked for their opinions via a status update on the online social network, Facebook. A status
update allows a Facebook member to broadcast a few lines of script to the newsfeed pages of
their network of friends. Seventeen consumers participate in this step. Please see Table 3.1 for
their complete comments. The respondents voice mixed feelings. While some think that the
salesperson‟s presence is an indication of good customer service, other people generally dislike a
retail salesperson at the entrance of stores. They feel intimidated, expect to be harassed, and
avoid the situation. Interview guides are developed on the basis of the insights gained from these
comments, for use in the subsequent in-depth interviews conducted with retail salespeople and
consumers.
Table 3.1
Consumer Open-ended Responses via Facebook
Question: When you are shopping in a mall, and you see a salesperson standing at the door
of the store waiting for customers........ How do you feel about that? Do you want to go in
the store more or less? Why? What kind of impression does that give you? etc...
I hate it. I feel like I am going to get harassed if I go in. I think it‟s much more effective
to have someone at the counter (after you‟ve bought something) thanking you for your
visit and asking if you‟ve gotten everything you need...
Unless I HAVE to go in I‟ll pass by. If I go in, I‟ll look up for a moment and say hello
but I‟ll move quickly by him/her. I don‟t have a problem with the person at all. In fact I
feel for these people because they are following the store‟s marketing plan. Which, now
that I think about it, probably is the reason why I‟m polite and don‟t completely disregard
them. Don‟t you love doing research on Facebook? I‟ve tried to take advantage of it
before. Good luck!
1) Its intimidating because I think they are going to harass me with questions if I go in the
store.
2) It makes me think that since no one else is apparently in the store, then maybe their
products are no good so I shouldn‟t bother to go in.
It depends on if I need something from the store. I tend to ignore the salesperson if I do
go in or just say hi and keep walking. If I do not need anything from the store, then I
generally would not go into the store. In terms of impressions, I tend to not worry about
the salesperson but just getting whatever it is I need at that point in time.
28
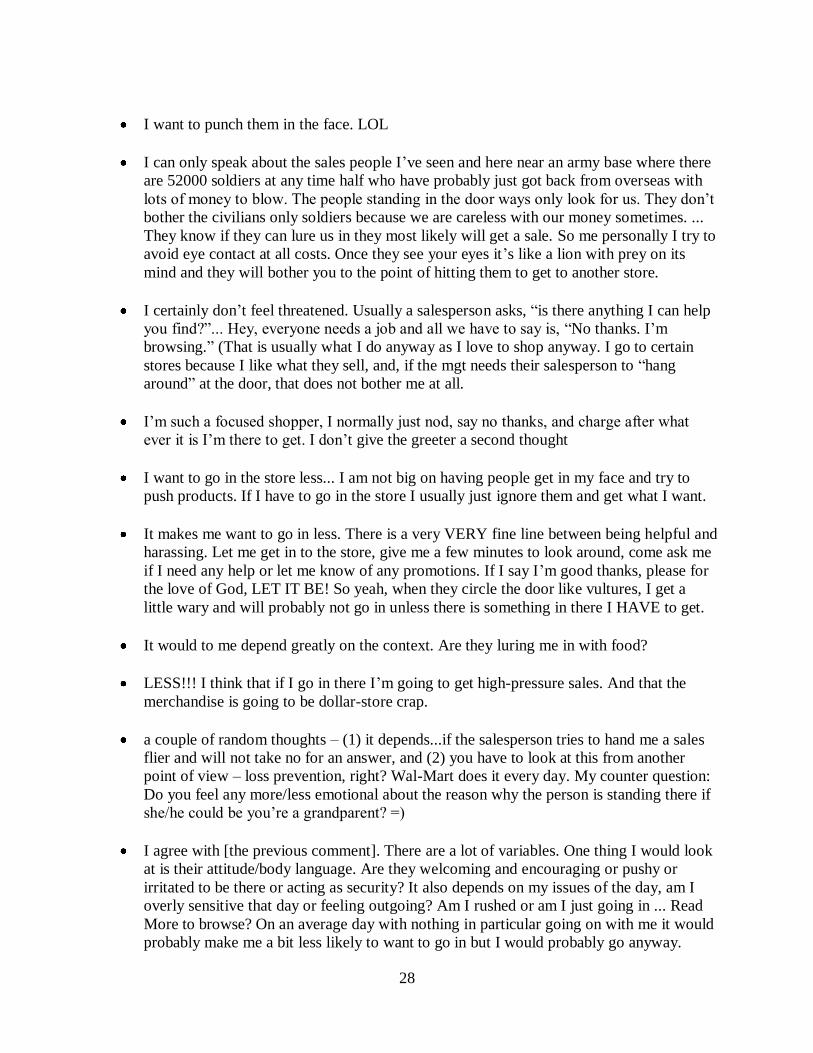
I want to punch them in the face. LOL
I can only speak about the sales people I‟ve seen and here near an army base where there
are 52000 soldiers at any time half who have probably just got back from overseas with
lots of money to blow. The people standing in the door ways only look for us. They don‟t
bother the civilians only soldiers because we are careless with our money sometimes. ...
They know if they can lure us in they most likely will get a sale. So me personally I try to
avoid eye contact at all costs. Once they see your eyes it‟s like a lion with prey on its
mind and they will bother you to the point of hitting them to get to another store.
I certainly don‟t feel threatened. Usually a salesperson asks, “is there anything I can help
you find?”... Hey, everyone needs a job and all we have to say is, “No thanks. I‟m
browsing.” (That is usually what I do anyway as I love to shop anyway. I go to certain
stores because I like what they sell, and, if the mgt needs their salesperson to “hang
around” at the door, that does not bother me at all.
I‟m such a focused shopper, I normally just nod, say no thanks, and charge after what
ever it is I‟m there to get. I don‟t give the greeter a second thought
I want to go in the store less... I am not big on having people get in my face and try to
push products. If I have to go in the store I usually just ignore them and get what I want.
It makes me want to go in less. There is a very VERY fine line between being helpful and
harassing. Let me get in to the store, give me a few minutes to look around, come ask me
if I need any help or let me know of any promotions. If I say I‟m good thanks, please for
the love of God, LET IT BE! So yeah, when they circle the door like vultures, I get a
little wary and will probably not go in unless there is something in there I HAVE to get.
It would to me depend greatly on the context. Are they luring me in with food?
LESS!!! I think that if I go in there I‟m going to get high-pressure sales. And that the
merchandise is going to be dollar-store crap.
a couple of random thoughts – (1) it depends...if the salesperson tries to hand me a sales
flier and will not take no for an answer, and (2) you have to look at this from another
point of view – loss prevention, right? Wal-Mart does it every day. My counter question:
Do you feel any more/less emotional about the reason why the person is standing there if
she/he could be you‟re a grandparent? =)
I agree with [the previous comment]. There are a lot of variables. One thing I would look
at is their attitude/body language. Are they welcoming and encouraging or pushy or
irritated to be there or acting as security? It also depends on my issues of the day, am I
overly sensitive that day or feeling outgoing? Am I rushed or am I just going in ... Read
More to browse? On an average day with nothing in particular going on with me it would
probably make me a bit less likely to want to go in but I would probably go anyway.
29
Agreed. I don‟t like feeling strong-armed before I even enter the store!
I don‟t feel intimidated by salespeople because I don‟t have any problem telling them that
I don‟t need their help. The only thought I‟d have about them standing there is that they
are probably a decent employee and more productive standing there available right away
rather slouching in the countertop.
It depends. Sometimes when I go by Abercrombie and Fitch, especially on Saturdays,
they have a male model with a twelve-pack standing there posing in nothing but a pair of
jeans. Then I like to stop and stare. And sometimes drool a little (but I normally can catch
it in time). But other than that, I think it depends on if I‟m actually going to buy
something or if I‟m just browsing. If I‟m definitely buying something, I find myself
smiling and saying hi back, but if I‟m just browsing, I tend to guiltily avoid them as if
I‟m going to disappoint once they find out I‟m just looking.
Retail Salesperson In-depth Interviews
The retail salespeople are recruited from a traditional indoor mall (University Mall,
Tuscaloosa, Alabama), as well as experienced salespeople in upper-level marketing courses to
serve as respondents. For the retail salespeople‟s interviews (who are recruited from the mall) took
place in the stores after the salespeople were verbally asked for their participation. The retail
salespeople, whose participation is solicited during class, give their interviews in a conference
room on campus. The tape-recorded interviews last approximately fifteen to thirty minutes each.
Of the sixteen retail salespeople, ten of the respondents work in various clothing or apparel stores,
two work in shoe stores, one works in a video game store, one works in an accessory and jewelry
store, one works in a perfume store, and one works in an outdoor equipment store. Two of the
respondents are managers, one is an assistant manager, and the others are employees, but all of
them serve customers in the capacity of a retail salesperson. Six of the interviewees are male and
ten of them are female. Twelve of the respondents are in their twenties, two are in their thirties,
and two are in their forties. Based on guidelines by Strauss and Corbin (1998), open-coding
methods are used to identify concepts with common properties and dimensions. Then, data are

30
clustered into categories and subcategories to develop themes. The goal of these interviews is to
uncover general information from the retail salesperson perspective, about the practice of standing
near the retail store entrance, customers‟ responses, and variables that may moderate the
relationship. During the in-depth interviews, the retail salespeople discuss how commonly retail
salespeople stand near the entrance of their stores and the existence and effectiveness of store
policies for engaging in the practice, the salesperson‟s behavior while near the entrance, various
reactions that consumers have to this practice, situational characteristics, customer characteristics,
and salesperson characteristics that make a difference in consumer reactions. Please see Table 3.2
for the interview guide.
Table 3.2
Retail Salesperson Interview Guide
1. Do you ever wait by the door for customers to enter so that you can approach them?
Why or why not? (make sure to phrase the rest of the questions in terms of their
answer)
2. Does your company have any policies, guidelines, or training about waiting near the
entrance for customers?
3. How appropriate do you feel those policies (or the lack of) are?
4. How effective do you feel these policies (or the lack of) are for increasing sales?
5. Under what situations do you think it would be positive to wait for customers at the
entrance?
6. Under what situations do you think it would be negative to wait for customers at the
entrance?
If the retail salesperson does stand by the door:
7. What types of reactions do you get when you approach customers as they enter the
store?
8. Please estimate the proportion of customers that have a favorable and an unfavorable
response to this behavior.
9. Please tell a story about a time you did this and got a very positive reaction from the
customer.
10. Please tell a story about a time you did this and got a very negative reaction from the
customer.
11. Can you think of any more stories about approaching customers at the door?
All retail salespeople:
31
12. Is there anything else you‟d like to add?
Store policies. Nearly every respondent in the sample often stands near the entrance of
the store, with the exception of one retail salesperson who stands behind a counter in a very
small store. Several of the retail salespeople specifically mention written store policy to stand
near the entrance of the store, although many more indicate that the manager gives verbal
instructions to do so. Some salespeople come to consider being near the entrance as part of the
store culture. Some retail stores have designated greeters who are required to stay within several
feet of the entrance and greet and direct customers to merchandise or other retail salespeople
further in the store. Again, these designated greeters are not the same as regular retail salespeople
because they only welcome the customer and give directions to a part of the store or an actual
retail salesperson.
We were always supposed to have someone in the front, when you walk in, just a few feet
from the door. (Men and women’s clothing, male)
Yes, actually, they have a policy about greeting everybody. If you are folding clothes or
whatever, you have to greet customers within like thirty seconds. It was in our
Educational Booklet. (Women’s clothing, female)
We don’t formally have a policy, but the manager encourages it, and talked about it
during our training, it is more of a cultural thing. (Women’s shoes, male)
When you come in, you get assigned a certain position in the store, and there is Fashion
First, and you’ll be assigned to stand in the front of the store, and it’s your job to greet
the customers when they come in and direct them to the destination in the store where
they need to go to. The rule is that you must greet the customers within five seconds of
them coming in the door. That was one of the things we learned in our orientation, to
stand near the door to greet customers. (Children’s clothes specialty store, female)
Generally, the retail salespeople feel that the practice and policies about waiting for the
customers at the entrance are appropriate and effective. They name several benefits. Most of the
respondents say that their presence provides customer service by making the customer feel

32
welcome to the store. Many of the retail salespeople feel that this practice increases sales,
especially through initiating an interaction with browsers. Finally, several of the respondents
discuss how being near the entrance is an effective form of loss prevention. Shoplifters are
discouraged because the salesperson near the entrance can monitor for theft as well as providing
service to customers.
When you walk into the store, you want to set the vibe for the store, and, you know, when
we have somebody there just inside the store who says hello to you and asks how are you
doing, then I make you feel welcome to the store, you know, then you might want give it
more of chance to stay longer and buy more (Video games, male)
It was easier to convert a sale from a window shopper if you identify who was on the
bubble of going on, or who might go ahead and buy something if you get out there and
say hello and that sort of thing. (Women’s shoes, male)
It keeps an eye on the front of the store. A big thing with us managers is shoplifting, and
we have to make sure our associates are aware of anybody that could be able to shoplift.
If we stay in the front of the store we can keep an eye on the front corners of the store.
(Women’s clothing, female, store manager)
However, some of the retail salespeople are somewhat resistant to the idea of having to
stand near the entrance of the store. They sometimes feel uncomfortable because they are
concerned that the customers may feel pressured or annoyed. However, these retail salespeople
are still required to engage in this practice because of written or verbal store policies.
There were a few times when I felt uncomfortable, because most people walking in the
door don’t want to be bombarded... I don’t like to be harassed when I shop, so I feel it is
a little forceful. (Men and women’s clothing, female)
Honestly, we don’t really like doing it that much, but we have to because the boss
watches us on the video camera…he wants to make sure the customers are satisfied…we
have to talk to them within a certain time of them being in the store, but it really just ticks
some of them off. (Outdoor gear, male)
Salesperson behavior. The retail salespeople also discuss exactly where they stand
relative to the door and what they do while standing there, at an operational level. Respondents
report standing in various locations relative to the doorway. The majority of the respondents
33
stand within several feet of the entrance, but several salespeople position themselves directly in
the doorway and just outside the doorway. Half of the respondents mention that they try to keep
busy near the entrance of the store by working on inventory, rather than simply standing near the
doorway idly. They feel that customers are more likely to come in to the store and feel more
comfortable when they are busy doing some task nearby. This sends the message that assistance
is available, but not forced on the customer. Other aspects of respondents‟ communication with
customers include telling them about promotions and smiling.
It depends on the day. Sometimes, if it is slow, I’ll actually go outside and, like, bring
people in, and it actually makes the difference in whether we make the day or don’t make
the day. (Men and women’s shoes, male)
We stand just right inside the entrance, because all the stores are laid out so there is a
display just inside the door and we stand near that display, about four or five feet in.
(Women’s clothes, female)
We have three tables at the front, and we will fold those tables and make eye contact with
them. We are always usually doing something. We try not to just stand there because then
I think customers might be overwhelmed if they walk up and like three people standing
there saying ‘how are you!’ (laughs). So if you are folding something and look up and
speak to them when they enter it is much better. (Women’s clothes, female)
Positive consumer reactions. When asked about a time that their customer had a very
positive response, the retail salespeople report three main categories of positive consumer
reactions: friendliness, appreciativeness, and purchasing. The most commonly mentioned
positive customer response is to be friendly to the salesperson, as they acknowledge their
greeting, smile, and talk to the salesperson. Several other respondents talk about how some
customers, who appreciate being greeted, engage the salespeople in lengthy conversations and
interaction.
One time, a lady came in and she wanted a backpack but didn’t know what kind she
wanted, and you have to be fitted for them and there are a lot of brands and features.
Sometimes, customers are shy to come up and say that they don’t know what they are
talking about. She appreciated the greeting and help. (Outdoor gear, male)

34
About a third of the respondents talk about a time that when they greeted a particular
customer, the customer needed considerable assistance and went on to make a large purchase.
Generally, these customers have purchase intentions, but do not know what particular product
would suit their needs, as in the case of purchasing for other people.
There was one time, there was a window shopper and she was on the border of coming
into the shop from the mall and looking at the displays. So, I went and talked with her
and once she got in, she went on some sort of binge or something, and bought like six
pairs of shoes. So that was good. (Women’s shoes, male)
Although several of the respondents feel that their presence has no effect on store
patronage, several other salespeople feel that being near the entrance creates a pleasant shopping
environment an opportunity to draw in browsers and convert them to customers.
If you are showing them that it is an open environment, and they feel welcome to come in,
then they are more likely to come in and enjoy their experience. Whereas if you don’t
give any customer service and you don’t speak to the customer when they come in the
door, then they might feel it is an uncomfortable environment and you didn’t make them
feel welcome, and they might not come back. (Children’s clothes specialty store, female)
Negative consumer reactions. Likewise, the respondents also discuss negative reactions
they‟ve experienced when standing near the entrance of the store. Almost every retail
salesperson reports that many customers regularly ignore them and walk right past them, despite
their greeting. Another common negative response is when the customers acknowledge the
presence of the salesperson, but then say that they are just looking. These customers do not want
any assistance, although they may still be polite.
You speak to them and right off the bat, they are like, I’m just looking, don’t bother me
I’m just looking. (Men and women’s shoes, male)
Sometimes they’ll speak to you and sometimes they’ll just walk right past you and not
acknowledge that you said anything to them… and you can tell that they heard you...But,
I try not to take it personally because people might be in a rush and not want to be
bothered that day…They aren’t actually mean to you, but they just ignore you.
(Children’s clothes specialty store, female)
35
A smaller number of customers who do not want any assistance from the salesperson
become annoyed and may even rudely tell the salesperson to leave them alone. One respondent
discusses how customers will even avoid entering the store if they see someone at the door.
A lot of people get really annoyed, and they are like no, and even if there is something
they wanted anyways, they might have a negative reaction, because you are being kind of
pushy… people don’t like someone right in their face (Men and women’s clothing,
female)
I’ve actually seen people walk by two or three times, and then wait until we are helping
someone else to come in the store, I think it is kind of weird. (Outdoor gear, male)
Situational characteristics. The retail salespeople also discuss different situations in
which they think it is better or worse for them to be near the entrance. Interestingly, the
respondents mentioned retail density, or the presence of other customers, as both a positive and
negative factor. Many respondents feel that when the store is busy with other customers, then
potential customers have a positive response to a salesperson near the entrance because the store
seems more desirable to others and there is assistance immediately available to them. However, a
few salespeople say that when the store is busy, then there is no time to be standing near the
entrance because that would mean neglecting the customers already in the store.
If we are all busy with other customers… it usually encourages the customer to come on
in because they see a nice smiling face of an employee waiting there to help them with all
their needs. (Women’s clothes, female, store manager)
If you have traffic in the store, then you simply don’t have time for it. That could be
detrimental. (Women’s shoes, male)
In the same fashion, several respondents mention holiday shopping times as important to
have someone near the entrance to help customers because during those times the stores are
crowded and the shoppers are often stressed. They believe their availability to offer service helps
to ease that stress. Finally, while several of the respondents think standing near the entrance as

36
always positive, several other retail salespeople discuss the type of store as a potential moderator,
but without a consistent direction. Several different types of stores are mentioned as a good for
standing near the entrance, including large department stores, big-box stores, high-end stores,
and smaller stores. Conversely, other respondents say that department stores and smaller stores
are not very good types of stores for standing near the entrance. Store type seems to play a role,
although that role is somewhat ambiguous.
Customer characteristics. Many of the respondents mention that their interaction with
customers at the entrance of the store depends on the customers themselves. Although there is
general agreement that there are differences among customers, the respondents are somewhat
unclear on exactly what the differences are. Several salespeople say that some customers simply
desire more attention and assistance than others, or attribute the difference to the customer‟s
mood.
It depends on the customer, some people want to be left alone to shop, and some people
want that attention. (Men and women’s shoes, male)
The most discussed individual characteristic is gender. Several respondents say that
females are much more receptive to the salesperson greeting them at the entrance. Men are much
less likely to want assistance. However, one salesperson talks about how males have a better
response when they are with a female.
Some people, you will ask them how they are doing and they will just ignore you…and it
is mainly most the time guys, women are mostly thankful. Now it is different if a female
comes in with a male, but usually if it is just a male…..he doesn’t respond that well to a
greet and a pitch. (Men and women’s clothes, male)
Salesperson characteristics. Finally, the salespeople discuss characteristics of themselves
that can make a difference in the way customers perceive them standing near the entrance of the
retail store. The most commonly mentioned theme is for the salesperson to have a smile and a
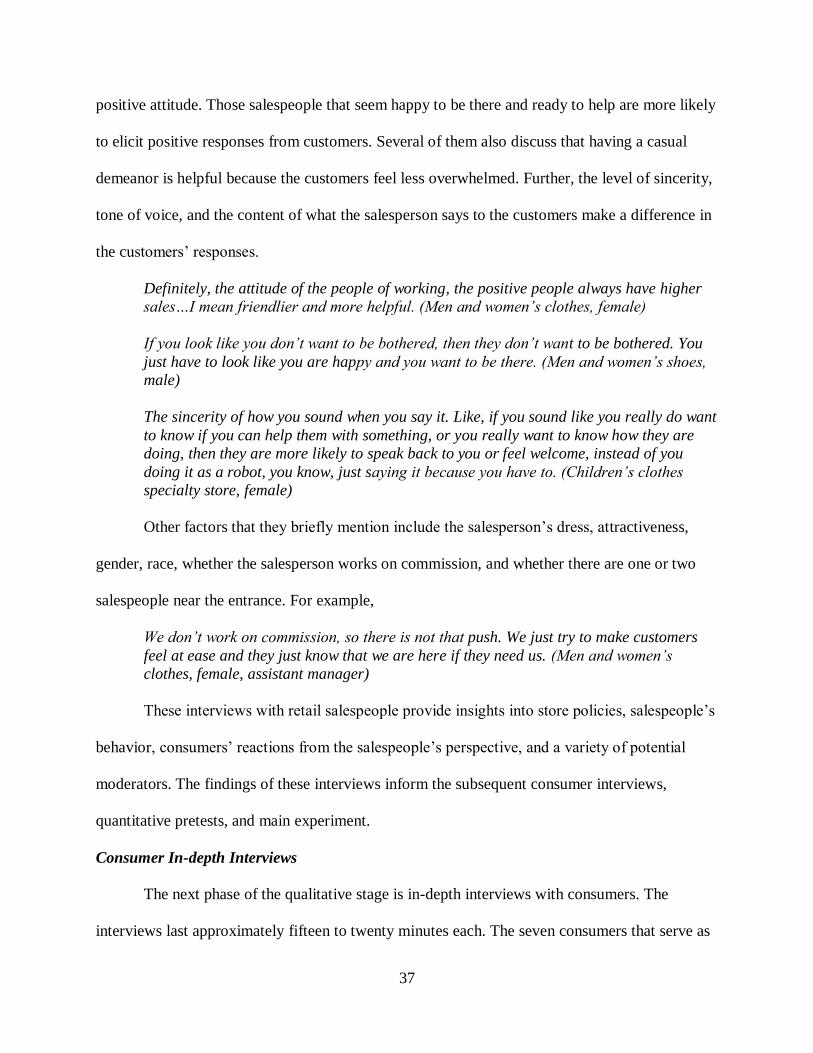
37
positive attitude. Those salespeople that seem happy to be there and ready to help are more likely
to elicit positive responses from customers. Several of them also discuss that having a casual
demeanor is helpful because the customers feel less overwhelmed. Further, the level of sincerity,
tone of voice, and the content of what the salesperson says to the customers make a difference in
the customers‟ responses.
Definitely, the attitude of the people of working, the positive people always have higher
sales…I mean friendlier and more helpful. (Men and women’s clothes, female)
If you look like you don’t want to be bothered, then they don’t want to be bothered. You
just have to look like you are happy and you want to be there. (Men and women’s shoes,
male)
The sincerity of how you sound when you say it. Like, if you sound like you really do want
to know if you can help them with something, or you really want to know how they are
doing, then they are more likely to speak back to you or feel welcome, instead of you
doing it as a robot, you know, just saying it because you have to. (Children’s clothes
specialty store, female)
Other factors that they briefly mention include the salesperson‟s dress, attractiveness,
gender, race, whether the salesperson works on commission, and whether there are one or two
salespeople near the entrance. For example,
We don’t work on commission, so there is not that push. We just try to make customers
feel at ease and they just know that we are here if they need us. (Men and women’s
clothes, female, assistant manager)
These interviews with retail salespeople provide insights into store policies, salespeople‟s
behavior, consumers‟ reactions from the salespeople‟s perspective, and a variety of potential
moderators. The findings of these interviews inform the subsequent consumer interviews,
quantitative pretests, and main experiment.
Consumer In-depth Interviews
The next phase of the qualitative stage is in-depth interviews with consumers. The
interviews last approximately fifteen to twenty minutes each. The seven consumers that serve as
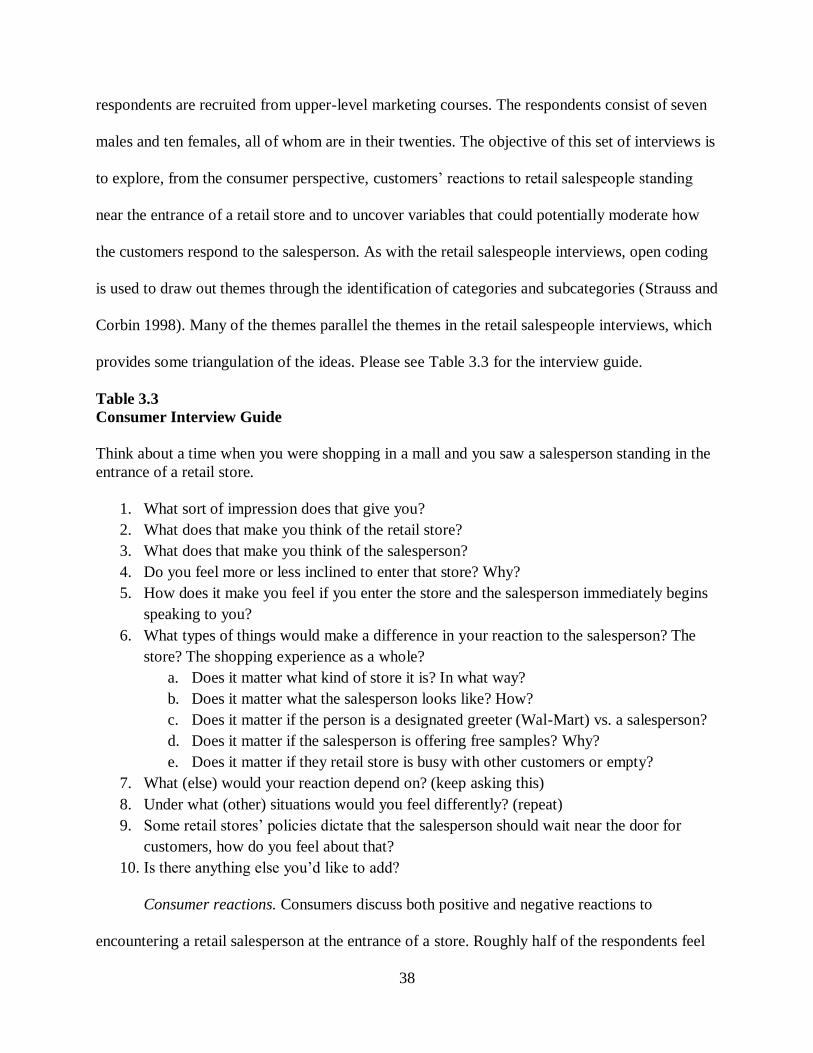
38
respondents are recruited from upper-level marketing courses. The respondents consist of seven
males and ten females, all of whom are in their twenties. The objective of this set of interviews is
to explore, from the consumer perspective, customers‟ reactions to retail salespeople standing
near the entrance of a retail store and to uncover variables that could potentially moderate how
the customers respond to the salesperson. As with the retail salespeople interviews, open coding
is used to draw out themes through the identification of categories and subcategories (Strauss and
Corbin 1998). Many of the themes parallel the themes in the retail salespeople interviews, which
provides some triangulation of the ideas. Please see Table 3.3 for the interview guide.
Table 3.3
Consumer Interview Guide
Think about a time when you were shopping in a mall and you saw a salesperson standing in the
entrance of a retail store.
1. What sort of impression does that give you?
2. What does that make you think of the retail store?
3. What does that make you think of the salesperson?
4. Do you feel more or less inclined to enter that store? Why?
5. How does it make you feel if you enter the store and the salesperson immediately begins
speaking to you?
6. What types of things would make a difference in your reaction to the salesperson? The
store? The shopping experience as a whole?
a. Does it matter what kind of store it is? In what way?
b. Does it matter what the salesperson looks like? How?
c. Does it matter if the person is a designated greeter (Wal-Mart) vs. a salesperson?
d. Does it matter if the salesperson is offering free samples? Why?
e. Does it matter if they retail store is busy with other customers or empty?
7. What (else) would your reaction depend on? (keep asking this)
8. Under what (other) situations would you feel differently? (repeat)
9. Some retail stores‟ policies dictate that the salesperson should wait near the door for
customers, how do you feel about that?
10. Is there anything else you‟d like to add?
Consumer reactions. Consumers discuss both positive and negative reactions to
encountering a retail salesperson at the entrance of a store. Roughly half of the respondents feel

39
their presence is an indicator that the salesperson intends to provide customer service. Several
respondents feel these salespeople are willing or anxious to help customers and are just doing
their jobs. A couple of respondents report that having a salesperson available to offer assistance
as they enter the store makes them feel important.
Overall, it gives a good impression because they seem anxious to help you when you
come in, it seems like their customer service is top notch. It makes me think it is a good
quality store. (male)
It gives me an impression that they are willing to help you, and they want to sell to you
and they are devoted to customer service. (female)
However, even many of the consumers who describe this practice as customer service
still mention that it is bothersome. Many of the consumers in the sample have strong negative
feelings about retail salespeople waiting near the entrance of stores. Many of the respondents talk
about feeling bothered, annoyed, attacked, overwhelmed, or bombarded by a salesperson near the
entrance. They feel that the salesperson is going to hassle them and use high pressure sales
tactics. Several mention that they usually do not want to be stopped, but will be polite if the
salesperson greets them. A common response is for the customers to say they do not need
assistance and they are just looking.
I don’t like it if they are standing near the entrance, like at [store] they are always
standing there, and before you even get into the store, they are saying hi to you and can
they help you, before you even get into the store! And then if you go into the store, they
are attacking you and won’t leave you alone. It is kind of annoying to me. They stand
just a little bit inside the entrance and if you go in, they are right on you. (female)
I saw them there and I thought they would follow me around the store the whole time. I’d
feel like they are going to attack or kind of bombard me or something. (female)
A variety of responses in terms of patronage intentions are described by the respondents.
While some of the consumers say that a salesperson‟s presence does not influence their choice to
patronize the retail store, many of the consumers feel that their presence is a major determinant
40
of whether they enter the store. The majority of the respondents in this sample say that they are
less likely to enter the store unless there is something specific that they really need if a
salesperson is standing near the entrance. Sometimes, they will enter the store, but still try to
avoid the salesperson. Conversely, a few of the customers say that they are more inclined to enter
retail stores if a salesperson is present near the entrance to provide service. In the retail
salesperson interviews, the salespeople usually talk about customers who ignore them as the
most typical negative consumer response. It appears that the salespeople may not be fully aware
of a worse reaction of some customers: deciding to not patronize the store when they see the
salesperson standing there.
That would make me think that I was going to be hassled if I go there and I probably
make me not even want to go in. It will be like, I walk in there and they will immediately
pressure me to buy things…It makes me think the salesperson is working on commission.
(female)
I’ll try to go around to the other side of the entrance…or if multiple people are walking
in, I will try to make my way around the other person so that they get called on first...I
just feel like I don’t want to sit there and talk to them for ten minutes. (female)
I feel more inclined to enter the store because I really like to get help finding what I want.
I usually go to boutiques and specialty stores because they do help you and stand by the
door. (female)
Situational characteristics. The consumers also discuss some situational characteristics
that play a role in how they view retail salespeople near the entrance of stores. Almost every
respondent agrees that samples are very positive, and that they have a much better attitude
toward a salesperson who is offering them something for free. However, a limitation on the
samples is consumers‟ positive feelings may not extend to samples in the form of product
demonstrations, such as lotion and perfume.
I would be more inclined to stop and hear what they have to say if they are going to give
me something, as opposed to just stopping me and telling me something. (male)
41
Echoing a finding in retail salespeople interviews, most of the consumers feel that retail
density, or the presence of other customers in the store, plays a role in how they perceive a retail
salesperson near the entrance of a store. Also consistent with the retail salespeople, there is not a
consensus on whether retail density is positive or negative. Some of the respondents say that
some retail density is positive because it shows that others like the store and they feel the
salesperson will not focus exclusively on them when there are other customers to divide their
attention. Some people will not patronize the store if they feel it is too crowded, regardless of
whether a salesperson is present or not.
I like there to be some customers, and like a good environment, so you are not so
bombarded by salespeople trying to get their commission and trying to sign you up for
credit cards. (female)
I think that if you notice that the store is busy, then that is a good sign because it draws a
lot of interest and there is a reason to be in there versus it being empty, I think, well you
aren’t getting any business, then why would I look. (female)
If it is busy, I will probably walk by and come back later. If it was a mall or something, I
would probably just cruise on. (male)
The respondents also mention the type of store, in terms of familiarity with the store and
being a high-end store, as situational characteristics that make a difference in their opinions of
retail salespeople near the entrance. Several of the respondents have more positive feelings
towards the salespeople if the store is new to them. If the store is familiar to the consumers, then
they are more likely to be bothered by a salesperson in the door because they already know their
way around and usually need less assistance. Several respondents also mention that they expect
to see a salesperson available to provide customer service at the entrance for high-end stores.
It makes a difference if it is like a new store, and I’ve really never been there, I would
kind of like them to maybe help me out. But, if it is a store that I’ve already been to and I
already kind of know my way around, I don’t want them to bother me. (male)
42
If you are in a high-end store, like a Neiman Marcus or Bloomingdale’s, I think those are
more expensive purchases, so they should really specialize in customer service. (female)
Customer characteristics. Unlike the retail salespeople, the consumers are much less
likely to name characteristics of themselves as potential moderator variables. A few respondents
mention that they appreciate a salesperson being available to help them if they do not have much
time and need expedited service. Similarly, other consumers suggest that whether they know
what they are looking for or they are browsing might make a difference in their perception of the
salesperson. Those who know what they want may be less likely to want or need service from a
salesperson. Finally, some of the consumers acknowledge that their own mood during the
shopping trip plays a role in the interaction.
If I was in a hurry or something, I would like to have somebody there to point me in the
right direction (male)
Usually when I walk into a store, I already know what I am looking for, and I would
probably approach the associate myself, and I would rather do that than have them
asking me ‘can I help you, can I help you.’ (female)
If I am having a bad day, it is my personal mood. That is what it depends on a lot of time.
Like, if I am in a bad mood, then I might not like shopping. (female)
Salesperson characteristics. The respondents discuss several characteristics of the retail
salesperson that make a difference in how consumers perceive them. These characteristics are
divided into characteristics that can be judged visually and those that require interaction.
Visually, the appearance of the salespeople‟s demeanor, their physical appearance, and where
they stand physically in relation to the entrance of the store are part of the first category. Like the
salespeople interviews, almost every consumer talks about the salesperson‟s demeanor, in terms
of whether they look like they want to be there or not. Consumers definitely prefer salespeople
who are smiling and appear friendly.

43
It depends on their emotions, or mood. If someone was cheerful and helpful and positive
before you walk into the store, compared to if someone were monotone or boring, you
kind of get in a bad mood before you walk in… I don’t want someone who is just acting
like they have to be there. (male)
If they have someone smiling and looking friendly, then it makes a good impression, but if
they look disinterested, then not really. (female)
Although most of the respondents say that the salesperson‟s individual physical
attractiveness does not play a role, several consumers mentioned that the salespeople should have
a neat appearance. If the store is a clothing store, consumers expect to see the salesperson
wearing the apparel that the store carries. A few of the male consumers, however, say that they
will enter a retail store based on whether the salesperson at the front of the store is an attractive
female.
You are going to want your better looking person in the front, definitely not someone
really ugly. (male)
If she was a good looking, attractive girl, I would slow down a little bit for her and be
more inclined to go in. (male)
Finally, practically all the respondents agree that the best location relative to the door for
a salesperson is a few feet inside the store. This position seems to create a more welcoming
environment without seeming threatening or predatory. When salespeople stand directly in the
doorway or a few feet outside the entrance, they give the impression of being too aggressive and
pushy.
I think it is better if they are in the inside the door, because if they are standing outside
the door…I feel like it is kind of overwhelming and intimidating. But, if they are inside
the store a little, then they are welcoming. (female)
I think right inside the door would be better, because if the salesperson is right in the
door or too far outside the door, it almost seems like they are begging for business. But if
they are close to the door, but inside, then it comes off like, oh, they are just working and
doing their jobs and greeting people as they come in the door. (female)
44
I don’t think they should be outside of the door or like right in the doorway, but if they
are at like the first table or display within say ten feet, then that is okay. (female)
The second category of salesperson characteristics that the respondents say could make a
difference in their perceptions cannot be assessed visually. Instead, these characteristics require
some degree of interaction. Several of the respondents mention that if salespeople work on
commission, then they are much more aggressive and pushy in their approach. This theme is
interesting because consumers often have little way of knowing whether or not a particular store
pays their salespeople on commission, but standing near the entrance gives that impression.
If I see them standing near the entrance it makes me think they work on commission and
that they have to sell to you. (female)
Many of the consumers also discuss that what the salespeople actually says and how their
delivery makes a difference in consumer perceptions. Several respondents mention that it is
better if the salesperson does not talk very much. Many consumers prefer for a salesperson to
welcome them to the store, but then leave them alone rather than going into a sales pitch of all
the current promotions. However, if the salesperson is going to give information after saying
hello, respondents much prefer information on promotions and sales rather than general
information. Several respondents mention that they prefer the salesperson make their presence
known, but let the customers look around the store for a while before approaching them.
If they just greeted me and said ‘hi, how are you’ instead of like forcing sales on
me….just be there if you need help and not in your face, it would make it a much more
positive experience. (female)
If they say ‘hello’ and ‘welcome to the [store],’ that is fine. But, I don’t like when they
are like ‘what can we help you find? We have a special on coats, on scarves’ like argh! I
can just find it myself, thanks. I don’t like that. Then I feel like I am being pestered… It is
better if they are just friendly and available to give help, but not coming on too strong.
(female)
If they were maybe letting me know of some type of sale or something, that would make
me feel happy, as opposed to just giving me some general type of information. (male)
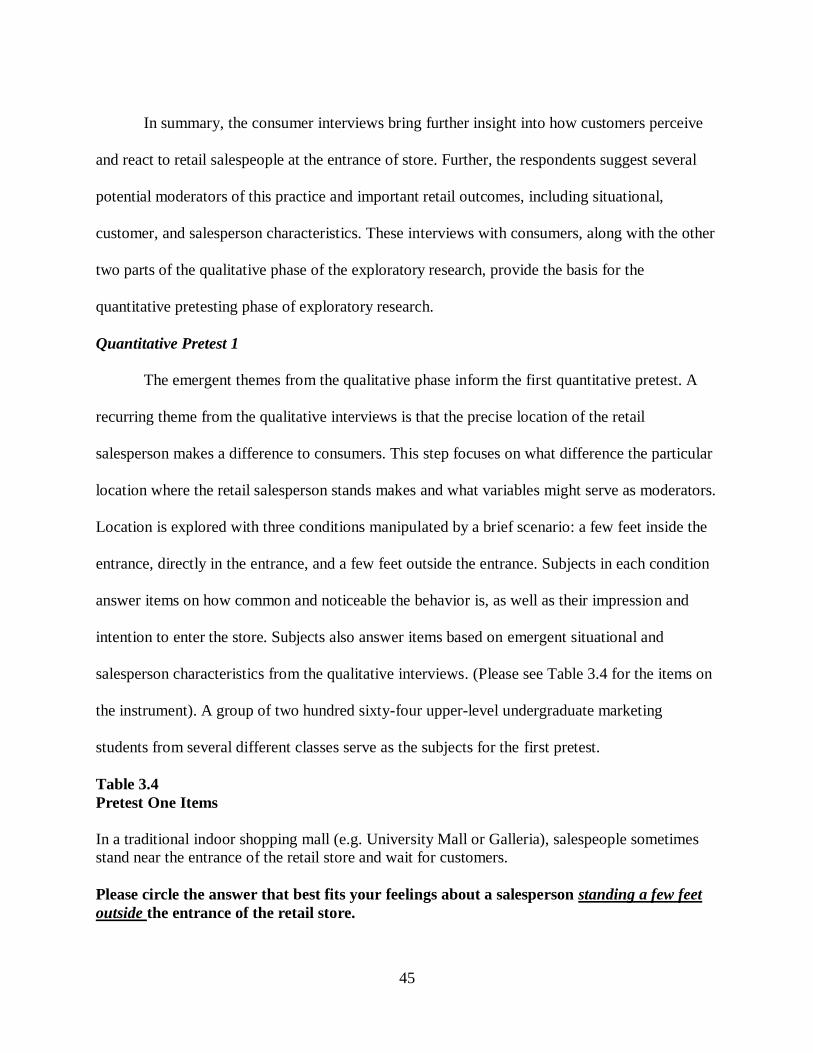
45
In summary, the consumer interviews bring further insight into how customers perceive
and react to retail salespeople at the entrance of store. Further, the respondents suggest several
potential moderators of this practice and important retail outcomes, including situational,
customer, and salesperson characteristics. These interviews with consumers, along with the other
two parts of the qualitative phase of the exploratory research, provide the basis for the
quantitative pretesting phase of exploratory research.
Quantitative Pretest 1
The emergent themes from the qualitative phase inform the first quantitative pretest. A
recurring theme from the qualitative interviews is that the precise location of the retail
salesperson makes a difference to consumers. This step focuses on what difference the particular
location where the retail salesperson stands makes and what variables might serve as moderators.
Location is explored with three conditions manipulated by a brief scenario: a few feet inside the
entrance, directly in the entrance, and a few feet outside the entrance. Subjects in each condition
answer items on how common and noticeable the behavior is, as well as their impression and
intention to enter the store. Subjects also answer items based on emergent situational and
salesperson characteristics from the qualitative interviews. (Please see Table 3.4 for the items on
the instrument). A group of two hundred sixty-four upper-level undergraduate marketing
students from several different classes serve as the subjects for the first pretest.
Table 3.4
Pretest One Items
In a traditional indoor shopping mall (e.g. University Mall or Galleria), salespeople sometimes
stand near the entrance of the retail store and wait for customers.
Please circle the answer that best fits your feelings about a salesperson standing a few feet
outside the entrance of the retail store.
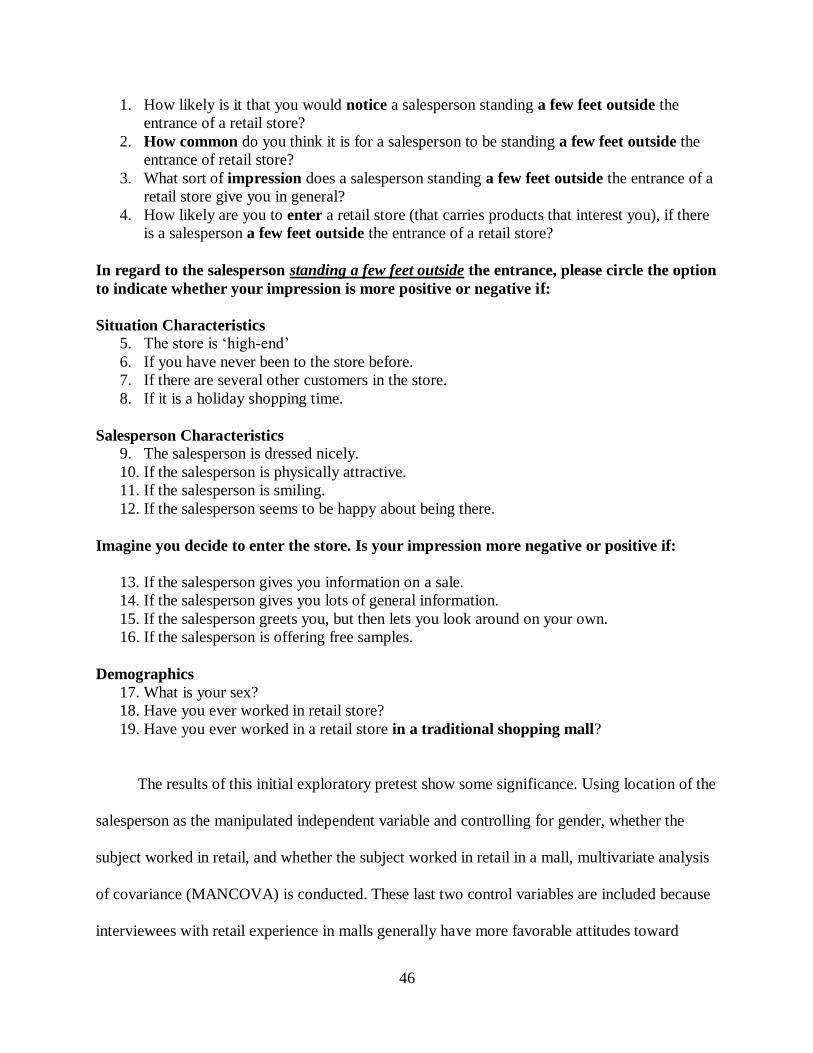
46
1. How likely is it that you would notice a salesperson standing a few feet outside the
entrance of a retail store?
2. How common do you think it is for a salesperson to be standing a few feet outside the
entrance of retail store?
3. What sort of impression does a salesperson standing a few feet outside the entrance of a
retail store give you in general?
4. How likely are you to enter a retail store (that carries products that interest you), if there
is a salesperson a few feet outside the entrance of a retail store?
In regard to the salesperson standing a few feet outside the entrance, please circle the option
to indicate whether your impression is more positive or negative if:
Situation Characteristics
5. The store is „high-end‟
6. If you have never been to the store before.
7. If there are several other customers in the store.
8. If it is a holiday shopping time.
Salesperson Characteristics
9. The salesperson is dressed nicely.
10. If the salesperson is physically attractive.
11. If the salesperson is smiling.
12. If the salesperson seems to be happy about being there.
Imagine you decide to enter the store. Is your impression more negative or positive if:
13. If the salesperson gives you information on a sale.
14. If the salesperson gives you lots of general information.
15. If the salesperson greets you, but then lets you look around on your own.
16. If the salesperson is offering free samples.
Demographics
17. What is your sex?
18. Have you ever worked in retail store?
19. Have you ever worked in a retail store in a traditional shopping mall?
The results of this initial exploratory pretest show some significance. Using location of the
salesperson as the manipulated independent variable and controlling for gender, whether the
subject worked in retail, and whether the subject worked in retail in a mall, multivariate analysis
of covariance (MANCOVA) is conducted. These last two control variables are included because
interviewees with retail experience in malls generally have more favorable attitudes toward

47
standing near the entrance of stores. First, the omnibus effects are examined, using Wilks‟
Lambda as the criterion. One covariate, gender (F(16, 235) =2.58, p < .01), and the manipulation,
location (F(32, 470) =2.15, p < .001), have significant omnibus effects. Examination of the
between-subjects effects shows that gender (coded as female) has a significant direct effect on it
making a difference if the salesperson is physically attractive (F(1, 250) = 8.65, p < .01), gives
general information (F(1, 250) = 4.70, p < .05), and greets customers quickly but then lets them
look around on their own (F(1, 250) =11.63, p = .001). These findings indicate that gender is an
appropriate control variable for this study. In terms of the independent variable, there is a
significant difference for how common subjects think the particular location of the retail
salesperson is (F(2, 250) = 12.11, p < .001). There is a significant difference between locations for
implications for impression if the store is high-end (F(2, 250) = 7.79, p < .01). Please see Table 3.5
for the between-subjects results.
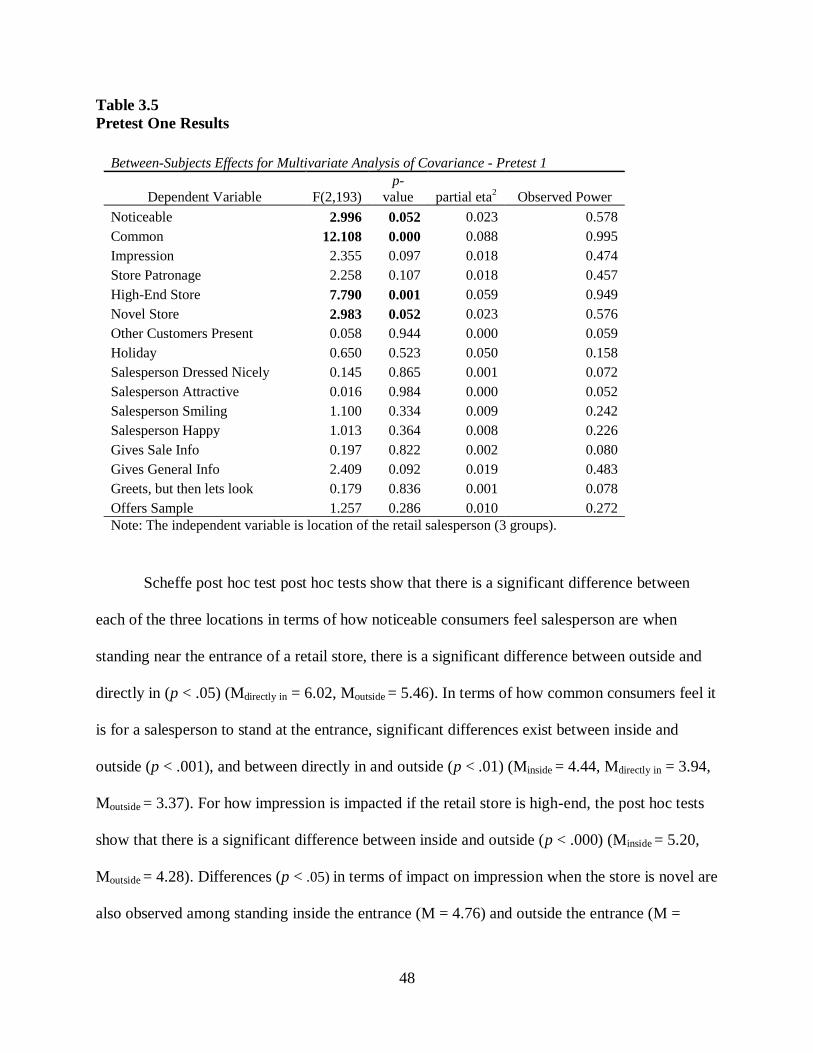
48
Table 3.5
Pretest One Results
Between-Subjects Effects for Multivariate Analysis of Covariance - Pretest 1
Dependent Variable F(2,193) p-
value partial eta2 Observed Power
Noticeable 2.996 0.052 0.023 0.578
Common 12.108 0.000 0.088 0.995
Impression 2.355 0.097 0.018 0.474
Store Patronage 2.258 0.107 0.018 0.457
High-End Store 7.790 0.001 0.059 0.949
Novel Store 2.983 0.052 0.023 0.576
Other Customers Present 0.058 0.944 0.000 0.059
Holiday 0.650 0.523 0.050 0.158
Salesperson Dressed Nicely 0.145 0.865 0.001 0.072
Salesperson Attractive 0.016 0.984 0.000 0.052
Salesperson Smiling 1.100 0.334 0.009 0.242
Salesperson Happy 1.013 0.364 0.008 0.226
Gives Sale Info 0.197 0.822 0.002 0.080
Gives General Info 2.409 0.092 0.019 0.483
Greets, but then lets look 0.179 0.836 0.001 0.078
Offers Sample 1.257 0.286 0.010 0.272 Note: The independent variable is location of the retail salesperson (3 groups).
Scheffe post hoc test post hoc tests show that there is a significant difference between
each of the three locations in terms of how noticeable consumers feel salesperson are when
standing near the entrance of a retail store, there is a significant difference between outside and
directly in (p < .05) (Mdirectly in = 6.02, Moutside = 5.46). In terms of how common consumers feel it
is for a salesperson to stand at the entrance, significant differences exist between inside and
outside (p < .001), and between directly in and outside (p < .01) (Minside = 4.44, Mdirectly in = 3.94,
Moutside = 3.37). For how impression is impacted if the retail store is high-end, the post hoc tests
show that there is a significant difference between inside and outside (p < .000) (Minside = 5.20,
Moutside = 4.28). Differences (p < .05) in terms of impact on impression when the store is novel are
also observed among standing inside the entrance (M = 4.76) and outside the entrance (M =
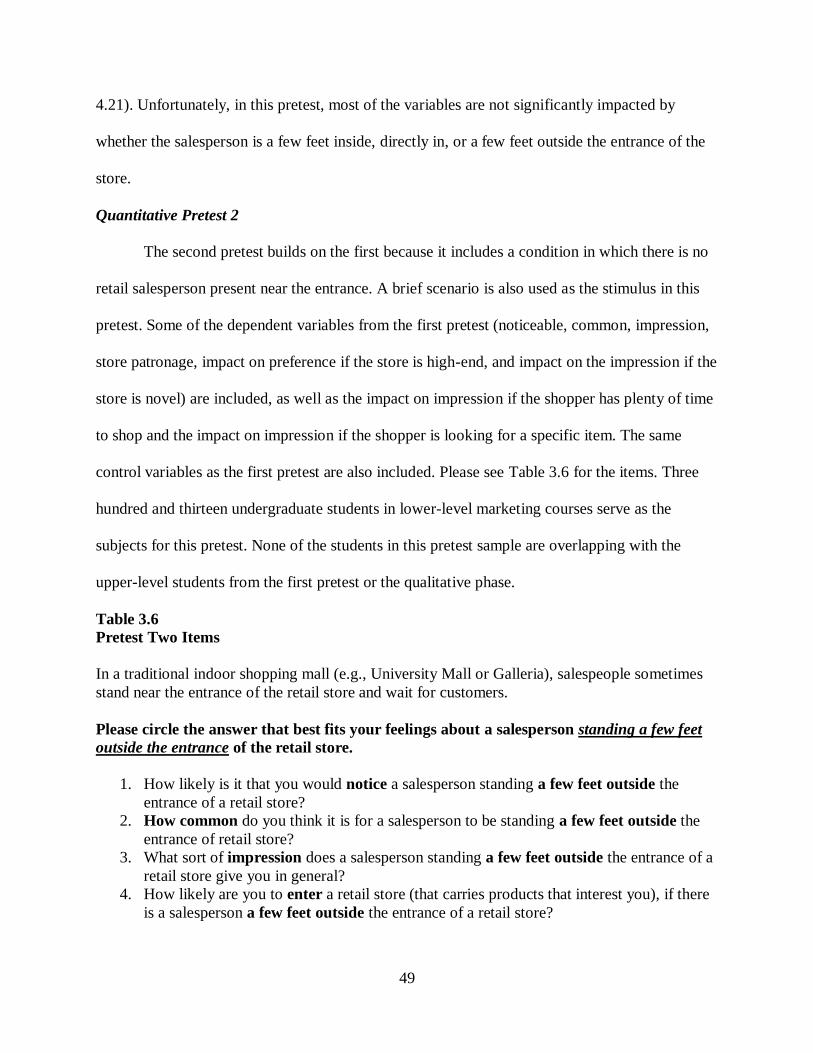
49
4.21). Unfortunately, in this pretest, most of the variables are not significantly impacted by
whether the salesperson is a few feet inside, directly in, or a few feet outside the entrance of the
store.
Quantitative Pretest 2
The second pretest builds on the first because it includes a condition in which there is no
retail salesperson present near the entrance. A brief scenario is also used as the stimulus in this
pretest. Some of the dependent variables from the first pretest (noticeable, common, impression,
store patronage, impact on preference if the store is high-end, and impact on the impression if the
store is novel) are included, as well as the impact on impression if the shopper has plenty of time
to shop and the impact on impression if the shopper is looking for a specific item. The same
control variables as the first pretest are also included. Please see Table 3.6 for the items. Three
hundred and thirteen undergraduate students in lower-level marketing courses serve as the
subjects for this pretest. None of the students in this pretest sample are overlapping with the
upper-level students from the first pretest or the qualitative phase.
Table 3.6
Pretest Two Items
In a traditional indoor shopping mall (e.g., University Mall or Galleria), salespeople sometimes
stand near the entrance of the retail store and wait for customers.
Please circle the answer that best fits your feelings about a salesperson standing a few feet
outside the entrance of the retail store.
1. How likely is it that you would notice a salesperson standing a few feet outside the
entrance of a retail store?
2. How common do you think it is for a salesperson to be standing a few feet outside the
entrance of retail store?
3. What sort of impression does a salesperson standing a few feet outside the entrance of a
retail store give you in general?
4. How likely are you to enter a retail store (that carries products that interest you), if there
is a salesperson a few feet outside the entrance of a retail store?
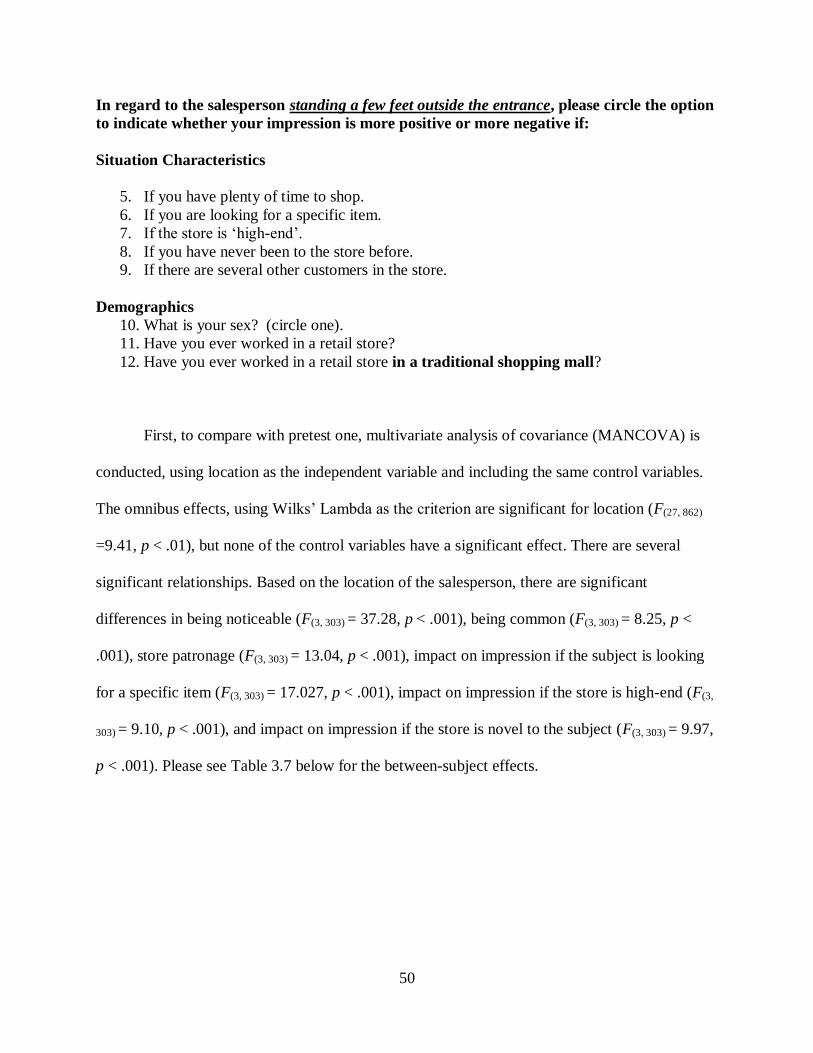
50
In regard to the salesperson standing a few feet outside the entrance, please circle the option
to indicate whether your impression is more positive or more negative if:
Situation Characteristics
5. If you have plenty of time to shop.
6. If you are looking for a specific item.
7. If the store is „high-end‟.
8. If you have never been to the store before.
9. If there are several other customers in the store.
Demographics
10. What is your sex? (circle one).
11. Have you ever worked in a retail store?
12. Have you ever worked in a retail store in a traditional shopping mall?
First, to compare with pretest one, multivariate analysis of covariance (MANCOVA) is
conducted, using location as the independent variable and including the same control variables.
The omnibus effects, using Wilks‟ Lambda as the criterion are significant for location (F(27, 862)
=9.41, p < .01), but none of the control variables have a significant effect. There are several
significant relationships. Based on the location of the salesperson, there are significant
differences in being noticeable (F(3, 303) = 37.28, p < .001), being common (F(3, 303) = 8.25, p <
.001), store patronage (F(3, 303) = 13.04, p < .001), impact on impression if the subject is looking
for a specific item (F(3, 303) = 17.027, p < .001), impact on impression if the store is high-end (F(3,
303) = 9.10, p < .001), and impact on impression if the store is novel to the subject (F(3, 303) = 9.97,
p < .001). Please see Table 3.7 below for the between-subject effects.
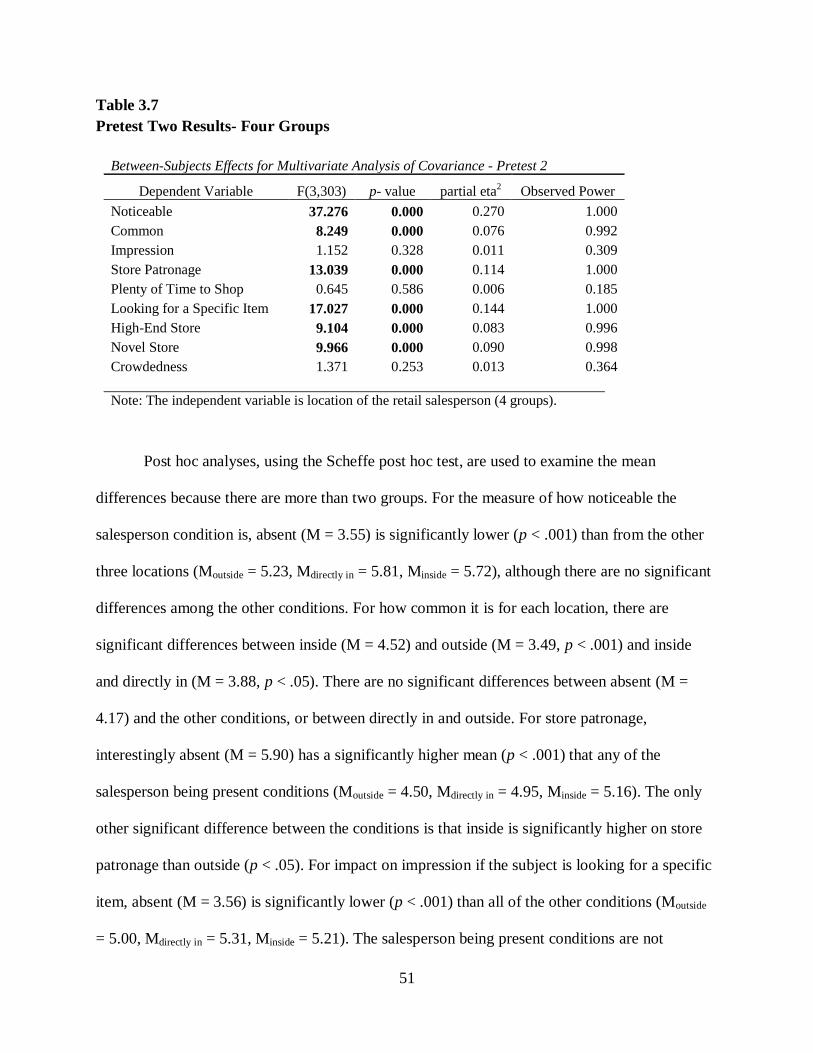
51
Table 3.7
Pretest Two Results- Four Groups
Between-Subjects Effects for Multivariate Analysis of Covariance - Pretest 2
Dependent Variable F(3,303) p- value partial eta2 Observed Power
Noticeable 37.276 0.000 0.270 1.000
Common 8.249 0.000 0.076 0.992
Impression 1.152 0.328 0.011 0.309
Store Patronage 13.039 0.000 0.114 1.000
Plenty of Time to Shop 0.645 0.586 0.006 0.185
Looking for a Specific Item 17.027 0.000 0.144 1.000
High-End Store 9.104 0.000 0.083 0.996
Novel Store 9.966 0.000 0.090 0.998
Crowdedness 1.371 0.253 0.013 0.364
Note: The independent variable is location of the retail salesperson (4 groups).
Post hoc analyses, using the Scheffe post hoc test, are used to examine the mean
differences because there are more than two groups. For the measure of how noticeable the
salesperson condition is, absent (M = 3.55) is significantly lower (p < .001) than from the other
three locations (Moutside = 5.23, Mdirectly in = 5.81, Minside = 5.72), although there are no significant
differences among the other conditions. For how common it is for each location, there are
significant differences between inside (M = 4.52) and outside (M = 3.49, p < .001) and inside
and directly in (M = 3.88, p < .05). There are no significant differences between absent (M =
4.17) and the other conditions, or between directly in and outside. For store patronage,
interestingly absent (M = 5.90) has a significantly higher mean (p < .001) that any of the
salesperson being present conditions (Moutside = 4.50, Mdirectly in = 4.95, Minside = 5.16). The only
other significant difference between the conditions is that inside is significantly higher on store
patronage than outside (p < .05). For impact on impression if the subject is looking for a specific
item, absent (M = 3.56) is significantly lower (p < .001) than all of the other conditions (Moutside
= 5.00, Mdirectly in = 5.31, Minside = 5.21). The salesperson being present conditions are not
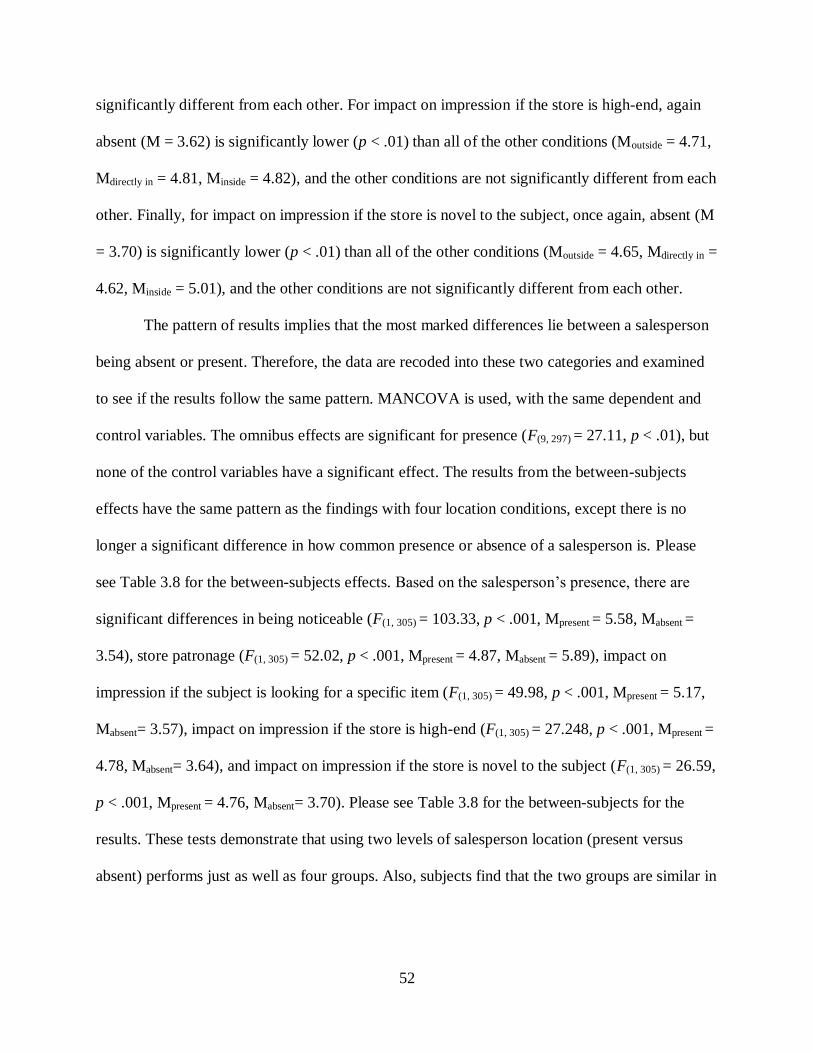
52
significantly different from each other. For impact on impression if the store is high-end, again
absent (M = 3.62) is significantly lower (p < .01) than all of the other conditions (Moutside = 4.71,
Mdirectly in = 4.81, Minside = 4.82), and the other conditions are not significantly different from each
other. Finally, for impact on impression if the store is novel to the subject, once again, absent (M
= 3.70) is significantly lower (p < .01) than all of the other conditions (Moutside = 4.65, Mdirectly in =
4.62, Minside = 5.01), and the other conditions are not significantly different from each other.
The pattern of results implies that the most marked differences lie between a salesperson
being absent or present. Therefore, the data are recoded into these two categories and examined
to see if the results follow the same pattern. MANCOVA is used, with the same dependent and
control variables. The omnibus effects are significant for presence (F(9, 297) = 27.11, p < .01), but
none of the control variables have a significant effect. The results from the between-subjects
effects have the same pattern as the findings with four location conditions, except there is no
longer a significant difference in how common presence or absence of a salesperson is. Please
see Table 3.8 for the between-subjects effects. Based on the salesperson‟s presence, there are
significant differences in being noticeable (F(1, 305) = 103.33, p < .001, Mpresent = 5.58, Mabsent =
3.54), store patronage (F(1, 305) = 52.02, p < .001, Mpresent = 4.87, Mabsent = 5.89), impact on
impression if the subject is looking for a specific item (F(1, 305) = 49.98, p < .001, Mpresent = 5.17,
Mabsent= 3.57), impact on impression if the store is high-end (F(1, 305) = 27.248, p < .001, Mpresent =
4.78, Mabsent= 3.64), and impact on impression if the store is novel to the subject (F(1, 305) = 26.59,
p < .001, Mpresent = 4.76, Mabsent= 3.70). Please see Table 3.8 for the between-subjects for the
results. These tests demonstrate that using two levels of salesperson location (present versus
absent) performs just as well as four groups. Also, subjects find that the two groups are similar in
53
terms of being common. Thus, only these two conditions (i.e., present/absent) are incorporated
moving forward.
Table 3.8
Pretest Two Results- Two Groups
Between-Subjects Effects for Multivariate Analysis of Covariance - Pretest 2
Dependent Variable F(1,305) p- value partial eta2 Observed Power
Noticeable 103.329 0.000 0.253 1.000
Common 1.105 0.294 0.004 0.182
Impression 0.272 0.602 0.001 0.082
Store Patronage 27.748 0.000 0.083 1.000
Plenty of Time to Shop 0.464 0.496 0.002 0.104
Looking for a Specific Item 49.977 0.000 0.141 1.000
High-End Store 27.248 0.000 0.082 0.999
Novel Store 26.594 0.000 0.080 0.999
Crowdedness 3.371 0.067 0.011 0.449 Note: The independent variable is presence of the retail salesperson (2 groups).
In summary, the exploratory phase of this research examines the practice of retail
salespeople standing near the entrance of stores through a variety of methods. The qualitative
phase includes an open-ended exploration on a social network, in-depth interviews with retail
salespeople, and in-depth interviews with consumers. The quantitative phase includes two
scenario-based, experimental pretests. The findings from all the stages in the exploratory phase
inform the development of the two experiments that make up the main study.
54
CHAPTER IV
HYPOTHESIS DEVELOPMENT
Introduction
This chapter develops and theoretically supports the hypotheses to be tested in both
experiments of the main study. Theoretical support for the hypotheses in both experiments
primarily comes from approach-avoidance theory, but some support for the second experiment
also comes from emotional contagion theory. Findings in previous literature and the emergent
results from the qualitative and exploratory quantitative pretests provide additional support for
the hypotheses.
The conceptual model in Figure 4 depicts the hypotheses to be tested in both experiments
of the main study. The conceptualization is primarily based on the stimulus-organism-response
model from environmental psychology and adapted from Mehrabian and Russell‟s (1974)
approach-avoidance model. In this model, several environmental stimuli and the two-way
interactions between them serve as exogenous variables that influence the three primary
emotions: pleasure, arousal, and dominance. The stimuli in the first study consist of easily
observable store characteristics: the presence of a retail salesperson near the entrance of the store
(hailer), store familiarity, and retail density. The stimuli in the second study involve behavioral
characteristics of a retail salesperson who is present near the entrance of the store: the retail
salesperson‟s demeanor and the retail salesperson‟s level of activity. The hypotheses in both
studies follow the same conceptual path to the endogenous variables through the primary
emotions. According to Mehrabian and Russell‟s (1974) original conceptualization, the three

55
primary emotions are orthogonal. The hypotheses in this chapter are grounded in approach-
avoidance theory‟s assumption of orthogonality, however, high correlations would render some
of the following hypotheses consistent, whereas they would function as competing hypotheses.
In turn, the three primary emotions influence consumers‟ approach attitudes and behavior. The
forms of approach are positive store image, expected service quality, attitude toward the
salesperson, attitude toward the retail store, and store patronage intentions. As shown in Figure 4,
these forms of approach conceptually are actually attitudes, with the exception of store patronage
intentions.
Figure 4
Conceptual Model of the Main Tests
56
Hypotheses and Rationales
Experiment One
Mehrabian and Russell‟s (1974) approach-avoidance theory explains that environmental
stimuli evoke three primary emotional responses (pleasure, arousal, and dominance) which
mediate the relationship between the stimuli and approach and avoidance behaviors. The first
six hypotheses are based on this premise of stimuli-influencing emotional responses.
The presence of a retail salesperson, or hailer, near the entrance of a store may be viewed
as a stimulus because it is an additional element in the environment that the customer visually
senses and with which the customer may interact. Previous research shows that retail salespeople
influence consumers‟ emotions. For example, Babin, Babin, and Boles (1995) show that various
types of salespeople elicit different consumer emotions. Approach-avoidance theory (Mehrabian
and Russell 1974) suggests that the spatial arrangement of persons in social settings has an effect
on pleasure because being in a condition of immediacy (being nearby) produces liking and
subsequent affiliative behaviors. Such a stimulus may also produce arousal for shoppers. Hu and
Jasper (2006) find evidence that shoppers experience increased pleasure and arousal in store
environments with more social cues. Retail salespeople are part of the social component of
shopping environments (Baker et al. 1994; Milliman and Turley 2000; Grewal et al. 2003).
Finally, theory suggests there are limits to the positive effect of immediacy. People react less
favorably to immediacy with strangers or forced immediacy because it reduces their feelings of
dominance. A limited amount of evidence in the existing literature indicates that consumers
sometimes feel intimidated by salespeople, especially when the salespeople are aggressive or
pushy (Darian et al. 2001; Ponder et al. 2006). Retail salespeople (usually strangers to the
customer) who position themselves at a store entrance are forcing their presence on the potential
57
customers, thus decreasing their freedom, or dominance. Therefore, based on findings in
previous research and as suggested by approach-avoidance theory, I hypothesize the following:
H1: The presence of a salesperson at the entrance of a retail store has a positive
relationship with a) pleasure and b) arousal, and a negative relationship with c)
dominance.
A contextual characteristic that may play a role in influencing the three primary emotions
is store familiarity (McGoldrick and Pieros 1998). When individuals are exposed to an object or
place on repeated occasions, they often develop more positive attitudes toward the object or
place due to the mere exposure effect (Kunst-Wilson and Zajonc 1980; Zajonc 1968; Zajonc and
Markus 1982). Ray and Chiagouris (2009) show that store familiarity directly influences both
affect and store loyalty. Cornelius, Natter, and Faure (2010) directly manipulate the store
familiarity by using national versus regional stores. They show that store familiarity moderates
the image spillover effects from storefront displays to retail stores, such that higher store
familiarity produces fewer spillover effects than lower store familiarity. Many previous studies
screen out subjects who are familiar with the store, which produces a gap in the knowledge
regarding its effects (Broekemier, Marquardt, and Gentry 2008; Donovan, Rossiter, Marcoolyn,
and Nesdale 1994). However, several researchers in the atmospherics literature indicate that
familiarity in terms of music does have an effect on shoppers‟ emotions (Bailery and Areni 2006;
Yalch and Spangenberg 2000). According to approach-avoidance theory, the increased
immediacy that is implicit in familiarity is associated with increased pleasure. However,
Mehrabian and Russell (1974) also say that familiarity with a stimulus (the retail store in this
case) is associated with decreased arousal and subsequent approach behavior over time.
Approach-avoidance theory also asserts that dominance relates to territoriality as well. When
people are in a familiar environment, they have a higher sense of dominance. Thus, as suggested
58
by previous research and approach-avoidance theory:
H2: Familiarity with the retail store has a positive relationship with a) pleasure, a
negative relationship with b) arousal, and a positive relationship with c) dominance.
An atmospheric variable that may be related to the three primary emotions is retail
density, or crowding. Machleit et al. (2000) find a negative relationship between pleasure and
both human crowding and spatial crowding, as well as a negative relationship between arousal
and spatial crowding. Similarly, El Sayed et al. (2003) find a negative relationship between
pleasure and crowding. Finally Hui and Bateson (1991) show that consumer density has a
negative indirect effect on pleasure. According to approach-avoidance theory, crowding is
usually associated with too much immediacy and therefore reduced pleasure. The presence of
more people in the environment should increase arousal because they represent visual sensory
information in a person‟s surroundings. Dominance is associated with freedom of choice and
movement. Crowding, or retail density, restricts freedom and control and thus reduces feelings of
dominance. Therefore, as predicted by previous work and approach-avoidance theory:
H3: Retail density has a negative relationship with a) pleasure, a positive relationship
with b) arousal, and a negative relationship with c) dominance.
Consumers do not experience environmental stimuli in a vacuum. Instead, they are
exposed to many of them simultaneously and process them holistically (Michon, Chebat, and
Turley 2005). Therefore, interaction effects are expected among the three stimulus variables
described above. Concerning salesperson presence and familiarity with the store, pleasure should
be increased due to both the immediacy of the salesperson and familiarity with the store (and
possibly the salesperson) producing liking. Also, when a salesperson is present at a familiar
store, a stimulus is introduced, so more arousal is expected than if no salesperson is present.
However, lower dominance is expected because there is restricted freedom of choice, since the

59
customer must negotiate the salesperson‟s presence in order to enter the store. Therefore, in
accordance with approach-avoidance theory, I hypothesize that:
H4: The presence of a salesperson at the entrance of a retail store and the level of
familiarity interact, such that:
H4a: While high store familiarity is always associated with higher levels of pleasure than
low store familiarity, when a salesperson is present, high store familiarity‟s relationship
with pleasure is increased more than when the salesperson is absent.
H4b: While high store familiarity is always associated with lower levels of arousal than
low store familiarity, when a salesperson is present, high store familiarity‟s relationship
with arousal is increased more than when a salesperson is absent.
H4c: While high store familiarity is always associated with higher levels of dominance
than low store familiarity, when a salesperson is present, low store familiarity‟s
relationship with dominance is reduced more than when a salesperson is absent.
Another possible interaction pertains to retail density and familiarity of the store. When a
store is more crowded, the positive effects of familiarity on pleasure and dominance should be
reduced because of forced immediacy and the reduced freedom of movement and choice that are
associated with crowds, although higher familiarity should still produce more pleasure and
dominance than if the customer has low familiarity with the store. There also should be a
stronger relationship with arousal because of more people in the environment serving as stimuli.
Therefore:
H5: The level of familiarity with the retail store and the level of retail density interact,
such that:
H5a: While higher store familiarity is always associated with higher levels of pleasure
than low familiarity, when there is high retail density, low store familiarity‟s relationship
pleasure is reduced more than when there is low retail density.
H5b: While high store familiarity is always associated with lower levels of arousal than
low familiarity, when there is high retail density, high store familiarity‟s relationship with
arousal is increased more than when there is low retail density.
H5c: While high store familiarity is always associated with higher levels of dominance,
when there is high retail density, low store familiarity‟s relationship with dominance is
reduced more than when there is low retail density.
A third expected two-way interaction involves the presence of a salesperson and the level
of retail density. When there are larger crowds in a store, a salesperson near the entrance should
60
increase pleasure for the customer because the combination of cues may create the impression of
the salesperson‟s ability to offer customer service despite the apparent popularity of the store.
The combination of multiple stimuli should increase arousal. Also, while the presence of a retail
salesperson near the entrance reduces feelings of dominance because of forced immediacy, an
available salesperson should increase feelings of dominance when the store is crowded because
the salesperson‟s availability to help provides more freedom of choice that may otherwise be
restricted by the crowd, so that the reduction in dominance due to the crowding is less severe
than if the salesperson is absent.
H6: The presence of a salesperson at the entrance of a retail store and the level of retail
density interact, such that:
H6a: While high retail density is always associated with lower levels of pleasure than low
retail density, when a salesperson is present, high retail density‟s relationship with
pleasure is increased more than when a salesperson is absent.
H6b: While higher retail density is always associated with higher levels of arousal than
low retail density, when a salesperson is present, high retail density‟s relationship with
arousal is increased more than when a salesperson is absent.
H6c: While high retail density is always associated with lower levels of dominance than
low retail density, when a salesperson is present, low retail density‟s relationship with
dominance is decreased more than when a salesperson is absent.
The following three hypotheses relate to the part of Mehrabian and Russell‟s (1974)
approach-avoidance theory which involves the relationships of the three primary emotions with a
range of approach behaviors and avoidance behaviors. As discussed in Chapter II, approach-
avoidance theory says that pleasure and dominance have positive relationships with, and arousal
has an inverted U-shaped relationship with, approach behaviors. When people find a stimulus to
be pleasurable, they desire greater proximity. Likewise, when people feel that they are in control
of an environment, or dominant, they are more comfortable approaching the situation. Also,
when a stimulus is boring, having too little arousal-producing qualities, or overstimulating,
producing too much arousal, then people move away from or avoid the situation entirely. On the
61
other hand, environments that provide a moderate amount of arousal are more attractive. These
relationships are established in Mehrabian and Russell‟s (1974) initial empirical tests of their
theory, as well as Donovan and Rossiter‟s (1982) subsequent introduction of approach-avoidance
theory into retailing. Thus, according to approach-avoidance theory:
H7: Pleasure is positively related to approach behaviors, including: a) positive store
image, b) expected service quality, c) attitude toward salesperson, d) attitude toward
retail store, and e) store patronage intentions.
H8: Arousal has an inverted U-shaped relationship with approach behaviors, including: a)
positive store image, b) expected service quality, c) attitude toward salesperson, d)
attitude toward retail store, and e) store patronage intentions.
H9: Dominance is positively related to approach behaviors, including: a) positive store
image, b) expected service quality, c) attitude toward salesperson, d) attitude toward
retail store, and e) store patronage intentions.
Experiment Two
As proposed in hypothesis one, the mere presence of a hailer should be a source of
arousal. As such, the next hypotheses focus only on pleasure and dominance. Again, the first
three hypotheses of this study are driven by approach-avoidance theory‟s (Mehrabian and
Russell 1974) prediction that environmental stimuli influence the primary emotions, which in
turn influence approach and avoidance behaviors. Emotional contagion theory (Hatfield et al.
1994) also provides theoretical support for the second study.
The general demeanor of the retail salesperson standing near the entrance of a retail store
is one salesperson characteristic that may influence consumers‟ perceptions. Pugh (2000) finds a
direct link between employees‟ displayed emotions and customer affect. Likewise, Wang (2009)
shows that consumers‟ emotions are influenced by the emotions that service employees display.
Approach-avoidance theory suggests that when people are friendly, feelings of pleasure are
produced and immediacy and affiliation are encouraged. Furthermore, the theory of emotional
62
contagion (Hatfield et al. 1994) states that people automatically mimic others in a variety of
ways, including facial expressions, posture, and movements. This mimicry actually results in
transference of emotion from one person to another. Therefore, a salesperson who is smiling and
appears happy should produce more pleasure than a salesperson who does not appear happy.
Therefore, in accordance with previous work, approach-avoidance theory, and emotional
contagion theory:
H10: A more positive demeanor of a retail salesperson near the entrance of a retail store
has a positive relationship with pleasure.
Another retail salesperson characteristic that may play a role is the salesperson‟s level of
activity in terms of whether the hailer is idly standing near the entrance of the store waiting for
customers to arrive or else performing work-related duties while waiting near the entrance for
customers. If a retail salesperson has a higher level of activity by doing some other task than only
being available to assist customers, then approach-avoidance suggests less pleasure will be
produced because the spatial arrangement is such that the salesperson and customer are less
likely to be facing one another. Previous research also supports the notion that customers have
more favorable responses to salesperson availability (Darian et al. 2001; Sharma and Stafford
2000; Sharma 2001). However, a retail salesperson who is near the entrance but is keeping busy
performing other tasks should be less intimidating to consumers than a salesperson who is simply
waiting near the entrance for the customers. Conversely, the inactive salesperson makes it clear
that he or she will force immediacy if the customer ventures in the store, reducing the customer‟s
feelings of dominance. Some retail salespeople in the qualitative interview stage mention that
they often will refold the same item of clothing near the front of the store throughout the day so
that they are near the entrance of the store, but do not appear to be specifically waiting for
customers to come in. Therefore, in alignment with approach-avoidance theory:
63
H11: A higher level of activity of a retail salesperson near the entrance of a retail store
has a negative relationship with a) pleasure and a positive relationship with b)
dominance.
It is likely that there is an interaction between the demeanor and the level of activity of a
retail salesperson near the entrance of a retail store. Both approach-avoidance and emotional
contagion theories suggest that friendliness, or a happy demeanor, is associated with higher
levels of pleasure than a salesperson with a negative demeanor. However, if a happy retail
salesperson is busy doing some task near the entrance of the store (high activity) then the theory
suggests there will be less pleasure than if the salesperson is standing near the entrance (low
activity), because the spatial arrangement would have less immediacy and be less likely to be
face-to-face. So, the combination of a salesperson without a happy demeanor with a higher level
of activity (and thus reduced availability to the customer) should produce a stronger negative
effect than if the salesperson has a happy demeanor. Also, when a salesperson has a more
positive demeanor, high activity should increase dominance because the immediacy would not
be forced (as with low activity), but the happy demeanor indicates that customer service (and
implied immediacy) is available if the consumer chooses it, versus if a salesperson is not near the
entrance.
H12: The demeanor of the retail salesperson and the level of activity of the salesperson
interact, such that:
H12a: While a happy demeanor is always associated with a higher level of pleasure than
a bored demeanor, when the salesperson has a high level of activity, the salesperson‟s
unhappy demeanor‟s relationship with pleasure decreases more than when there is a low
level of activity.
H12b: While a happy demeanor is always associated with a higher level of dominance
than a bored demeanor, when the salesperson has a high level of activity, the
salesperson‟s happy demeanor‟s relationship with dominance increases more than when
there is a low level of activity.
The following two hypotheses replicate hypotheses from the first study. However, they
are necessary in order to have mediation in the model for the second study. Only pleasure and
64
dominance are examined, as the variables in this second study imply that a retail salesperson is
present to serve as a stimulus for arousal.
H13: Pleasure is positively related to approach behaviors, including: a) positive store
image, b) expected service quality, c) attitude toward salesperson, d) attitude toward
retail store, and e) store patronage intentions.
H14: Dominance is positively related to approach behaviors, including: a) positive store
image, b) expected service quality, c) attitude toward salesperson, d) attitude toward
retail store, and e) store patronage intentions.
65
CHAPTER V
RESEARCH METHOD
Research Design
Theory and insights from the qualitative and quantitative pretests lay the groundwork for
the main study. Some of the emergent variables from the exploratory research stage, that appear
to play a role in the consumer-retail salesperson interaction, logically necessitate the assumption
that a retail salesperson be present. Therefore, the main test is divided into two experiments that
examine the effects of hailers as an atmospheric variable, as well as other store and salesperson
characteristics, on consumers‟ emotional responses and their approach and avoidance behaviors
in retailing. Experiment one manipulates several retail store characteristics. Experiment two
operates under the assumption of the presence of a retail salesperson and focuses on the retail
salesperson‟s characteristics that produce more favorable consumer responses. Both experiments
use a full factorial between-subjects design, in which the main effects and second order
interaction effects are examined. The methodology includes manipulations of several variables
through the use of both scenarios and photographs. To ensure that the experiments would run
smoothly and to make any necessary modifications before the main data collections, two pilot
studies are conducted among students. Scenarios and photo manipulations are relatively common
in the literature, with some using combinations of images and scenarios (Baker et al. 1994;
Cornelius et al. 2010; Grewal et al. 2003; Hedrick et al. 2007; Hu and Jasper 2007).
The focus of experiment one of the main test is store characteristics. It consists of a 2
(Presence of retail salesperson: present v. absent) X 2 (Store familiarity: novel v. familiar) X 2

66
(Retail density: other customers present v. other customers absent) full factorial between-subjects
design. This design results in 8 possible combinations of the stimuli, although the number of
actual stimuli is exponentially greater due to the use of various storefronts and salespeople.
Salesperson presence and retail density are manipulated photographically and store familiarity is
manipulated with an accompanying scenario. The levels of salesperson presence are one retail
salesperson near the entrance of the store versus no salesperson at all. The levels of store
familiarity are that the store is familiar to the customer versus the store is brand-new to the
customer. The levels of retail density are other shoppers in the background of the store versus no
other shoppers. Please see Figure 5.1 for a figure of the design.
Figure 5.1
Study 1: Store Characteristics
2 (Presence: Present v. Absent) X 2 (Novelty of store: Novel v. Familiar) X 2 (Retail Density: Other customers
present v. Other customers absent)
SALESPERSON
PRESENT
SALESPERSON
ABSENT
Customers
Present
Customers
Absent
Customers
Present
Customers
Absent
Novel Novel
Familiar Familiar
The focus of experiment two of the main test is retail salesperson characteristics. A
fundamental difference in this study and the first is that this study always has a salesperson
present near the entrance of the retail store. This study employs a 2 (Demeanor: smiling v. not
smiling) X 2 (Activity: standing v. active) full factorial between-subjects design. This design
results in four possible combinations of the stimuli, but there are many versions of the stimuli
given the use of multiple storefronts and salespeople. Similar to the first main study, salesperson
demeanor and salesperson activity are manipulated photographically. The levels of demeanor are
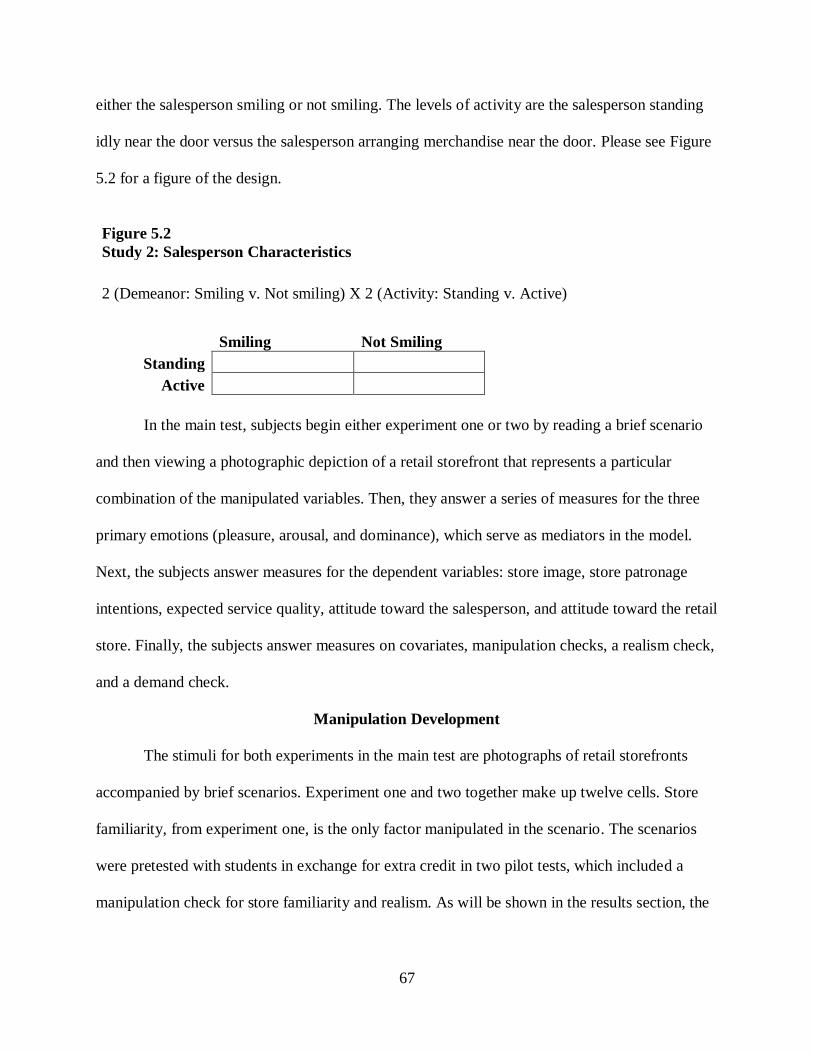
67
either the salesperson smiling or not smiling. The levels of activity are the salesperson standing
idly near the door versus the salesperson arranging merchandise near the door. Please see Figure
5.2 for a figure of the design.
Figure 5.2
Study 2: Salesperson Characteristics
2 (Demeanor: Smiling v. Not smiling) X 2 (Activity: Standing v. Active)
Smiling Not Smiling
Standing
Active
In the main test, subjects begin either experiment one or two by reading a brief scenario
and then viewing a photographic depiction of a retail storefront that represents a particular
combination of the manipulated variables. Then, they answer a series of measures for the three
primary emotions (pleasure, arousal, and dominance), which serve as mediators in the model.
Next, the subjects answer measures for the dependent variables: store image, store patronage
intentions, expected service quality, attitude toward the salesperson, and attitude toward the retail
store. Finally, the subjects answer measures on covariates, manipulation checks, a realism check,
and a demand check.
Manipulation Development
The stimuli for both experiments in the main test are photographs of retail storefronts
accompanied by brief scenarios. Experiment one and two together make up twelve cells. Store
familiarity, from experiment one, is the only factor manipulated in the scenario. The scenarios
were pretested with students in exchange for extra credit in two pilot tests, which included a
manipulation check for store familiarity and realism. As will be shown in the results section, the
68
reason that two pilot tests were necessary is that the manipulation check fails in experiment one.
The operationalization of the scenarios is discussed below.
As the other four of the five independent variables are visually manipulated, eight
different photographic combinations of variables are required. To control for any effect of
personal appearance characteristics of an individual retail salesperson appearing in the image that
are extraneous to our study, the particular salesperson seen in a stimulus is randomized. Seven
different models pose as hailers in the manipulations. The models are six graduate students and
one undergraduate student. Three of the models are males and four are female, and their ages
range from early twenties to early forties. Three of the models are Caucasian, two are African-
American, one is Hispanic, and one is South Korean. Furthermore, to control any effect due to a
particular storefront or type of store, the storefront is randomized. Five different storefronts at
University Mall, in Tuscaloosa, AL, are used. Two shoe stores (Sports Additions and Journey‟s),
two gift and collectibles stores (Things Remembered Gifts and Bob‟s Cards and Collectibles),
and one hat store (HS Hat Shack) participate in the manipulation development. However, none of
the names of the stores are visible in the photographs, in order to avoid a possible confound with
the store familiarity manipulation. Permission to take the photographs is granted by the mall
management and a manager at each individual store.
Each of the seven models posed for each of the eight combinations of poses in each of the
five storefronts (including both experiments where a salesperson is present). There are a resulting
280 possible combinations of models, storefronts, and cells. Because the professional
photographer took many additional photographs as extras, the raw file of photographic
combinations contains over 500 images. The photographs were initially screened by three
independent referees for realism and clarity of the manipulation (e.g., whether or not the
69
salesperson is clearly smiling). Disputes over acceptability were verbally resolved, resulting in
the elimination of some of the photographs. During the pilot testing, the photographs were
subjected to checks for how common the subject finds the scene, how realistic the subject finds
the scene, and a manipulation check for salesperson demeanor.
When combined with the scenario manipulation in the first experiment, there are 280
different possible photograph/scenario combinations that could be randomly assigned as the
stimulus for each subject. In the second experiment, all of the manipulations are photographic,
resulting in 140 different possible photographs that could serve as a stimulus.
Operationalization of the Constructs
Manipulated Variables
As previously mentioned, familiarity with the store is the only manipulated variable in
the scenario that accompanies the photographic manipulations in experiment one. In experiment
two, all of the variables are manipulated photographically. Therefore, the subjects in experiment
two all have the same accompanying scenario that is the same as in experiment one except for
the last sentence. All of the scenarios tell the subjects, “Imagine that you are browsing in a mall
by yourself and you have plenty of time for shopping. As you are walking through the mall, you
come across the store in this photograph. You see a salesperson wearing a white shirt in the
store.” The scenario ends at this point for the subjects in experiment two because it has no
scenario manipulation. If the subject is in experiment one, then the subject reads one of two
sentences based on the store familiarity condition. If the subject is in the high store familiarity
condition then the sentence says, “Assume that this is a store that you are familiar with and that
you have shopped in many times before.” If the subject is in the condition with low store

70
familiarity (or novelty) then the subject reads, “Assume that this is a store that you are not
familiar with and that you have never shopped in before.”
The remainder of the independent variables in experiment one and the variables in
experiment two are manipulated photographically. Retail salesperson presence is manipulated by
a randomly assigned model standing a few feet inside the doorway of a randomly assigned retail
store versus no model being near the entrance. Retail density is manipulated by other models
who are dressed in street clothes and are browsing in the store versus no other customers in the
store. In the photographs, three graduate students wearing casual street clothes pose as other
customers in the background. Of these models, one is a Caucasian male in his thirties, another is
a Caucasian female in her twenties, and the third one is a South Korean female in her twenties.
For experiment two, demeanor is manipulated with facial expression and posture, so that a happy
retail salesperson is portrayed as smiling and upright, while an unhappy, or bored, salesperson is
portrayed as not smiling and having poor posture. Activity is manipulated by whether the
salesperson model is simply standing versus if they are keeping active. Appearing busy or active
is operationalized as the retail salesperson straightening merchandise while he or she is standing
near the entrance. Sample photographs for each of the cells in the experimental design are
available in Figure 5.3.
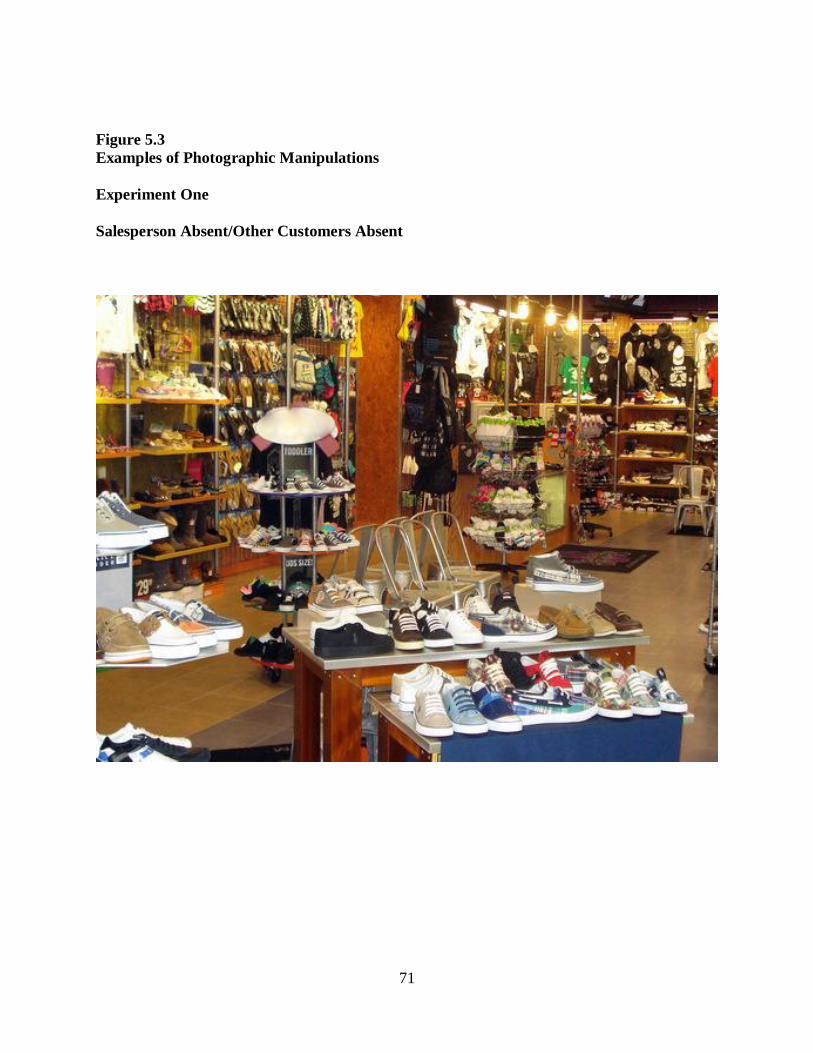
71
Figure 5.3
Examples of Photographic Manipulations
Experiment One
Salesperson Absent/Other Customers Absent
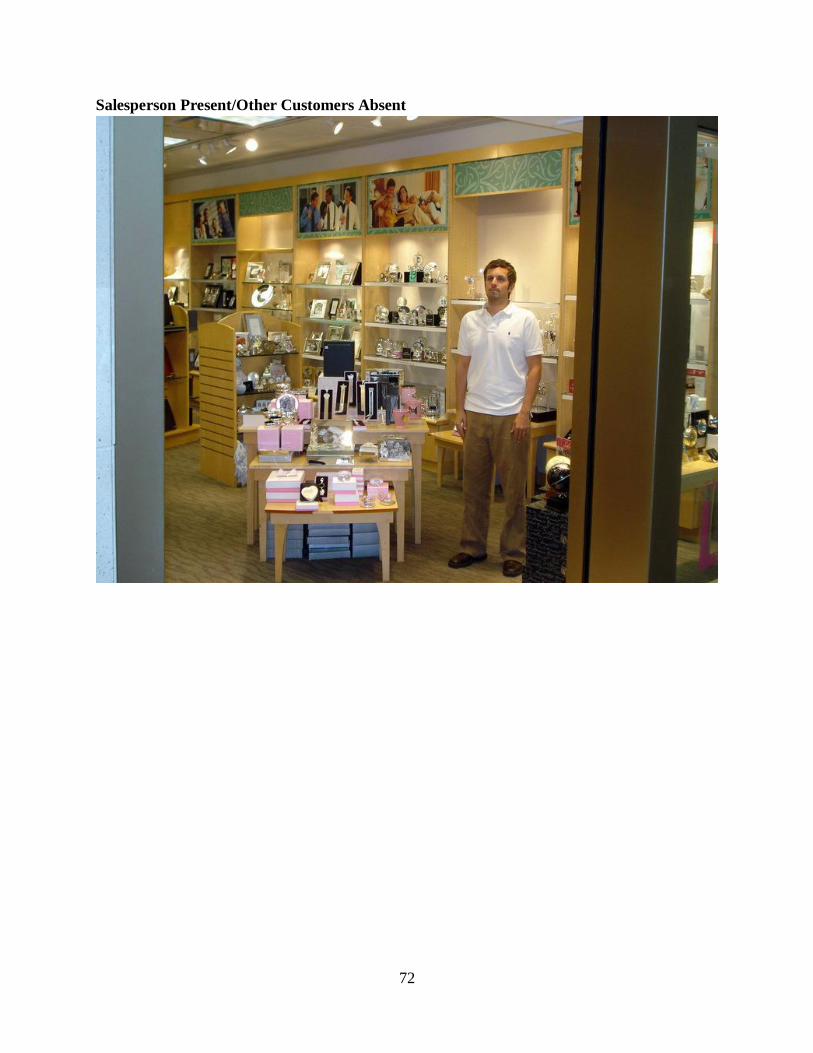
72
Salesperson Present/Other Customers Absent
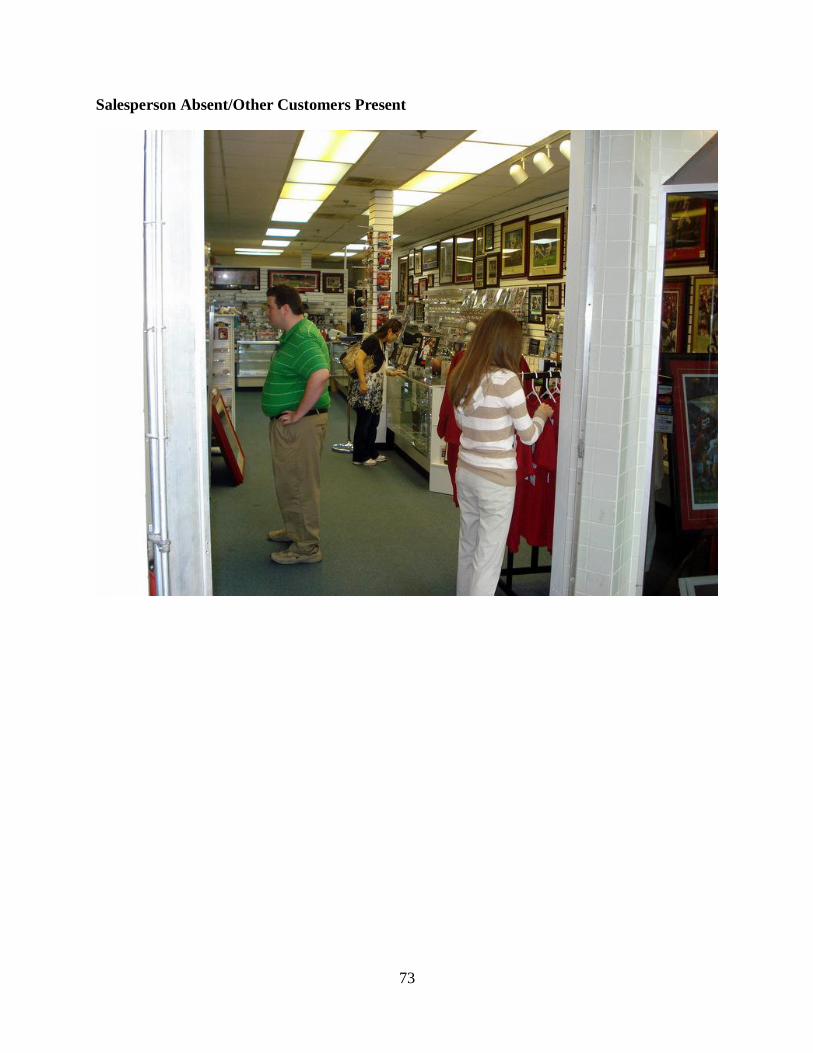
73
Salesperson Absent/Other Customers Present
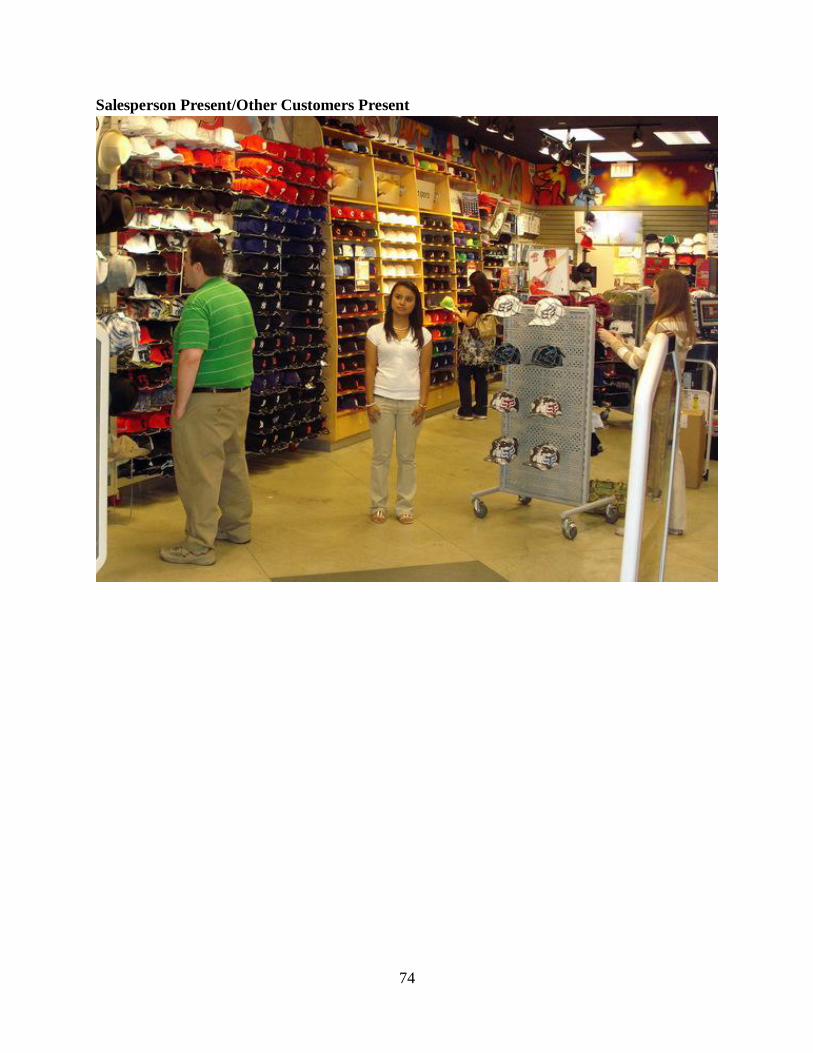
74
Salesperson Present/Other Customers Present
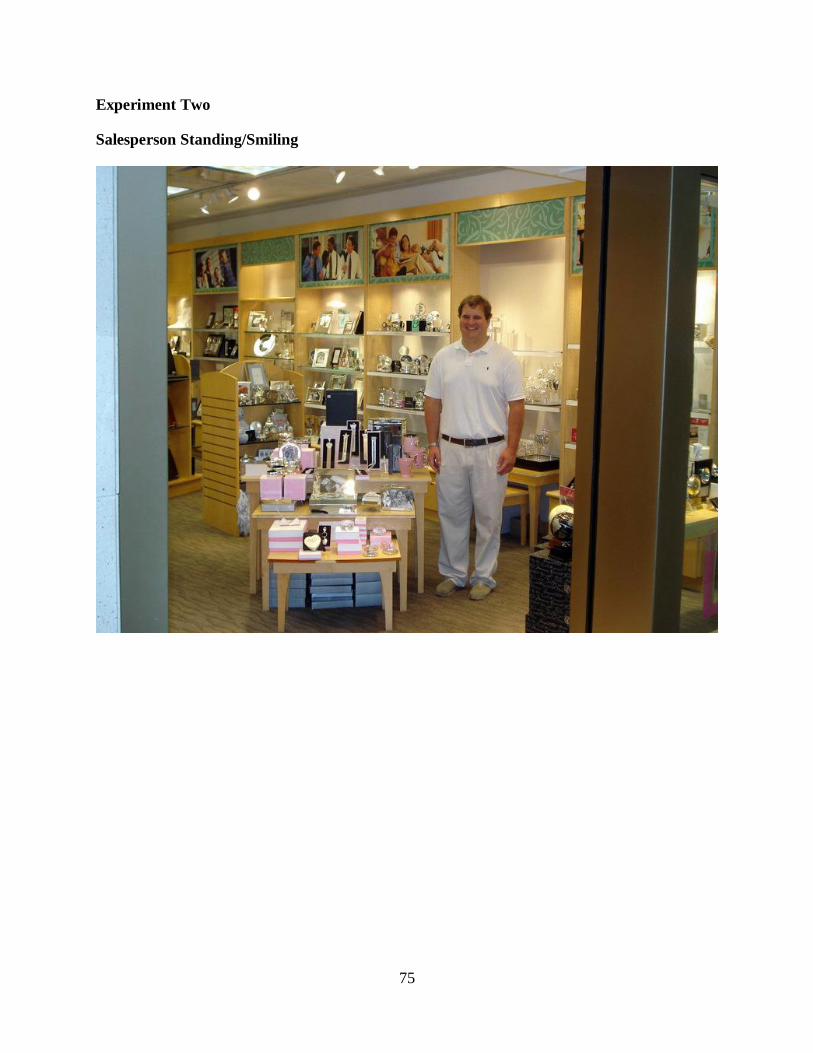
75
Experiment Two
Salesperson Standing/Smiling
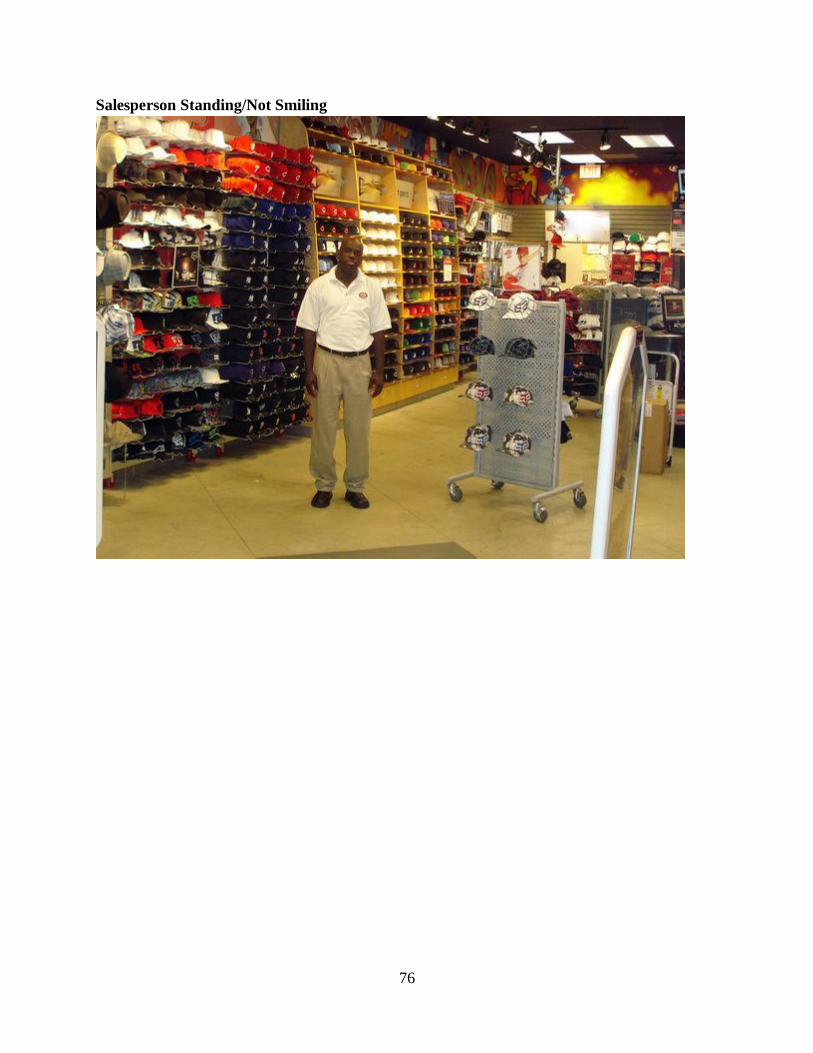
76
Salesperson Standing/Not Smiling
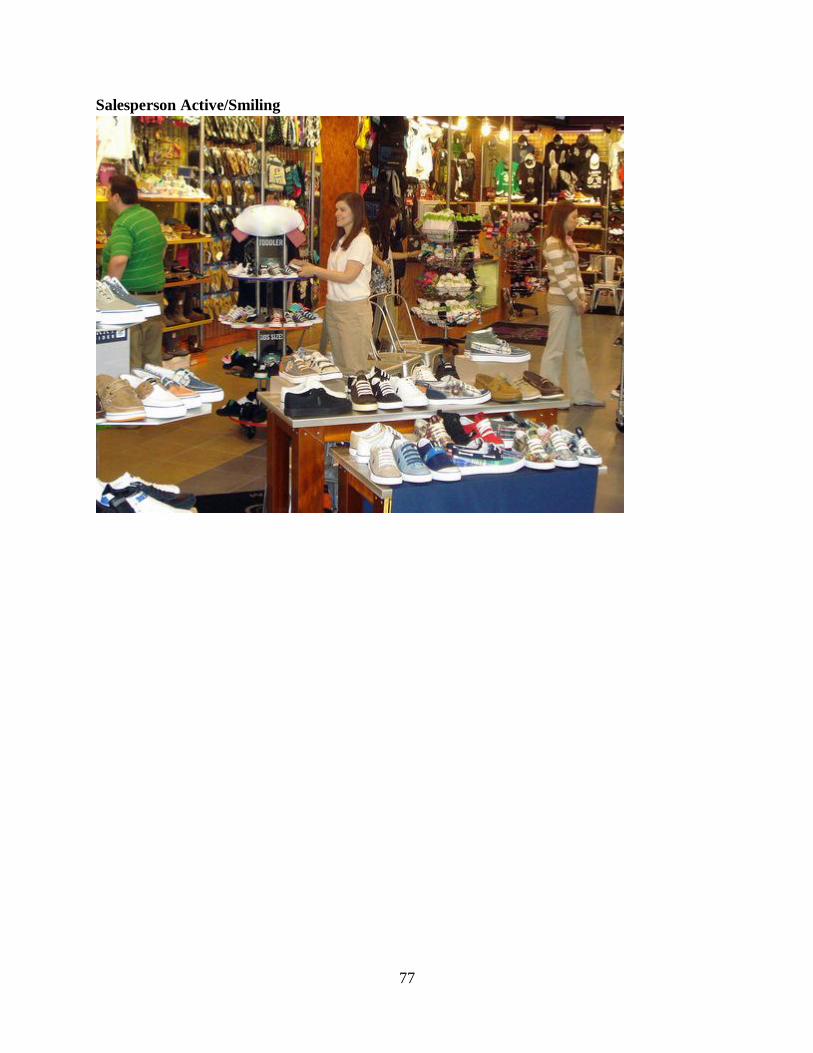
77
Salesperson Active/Smiling
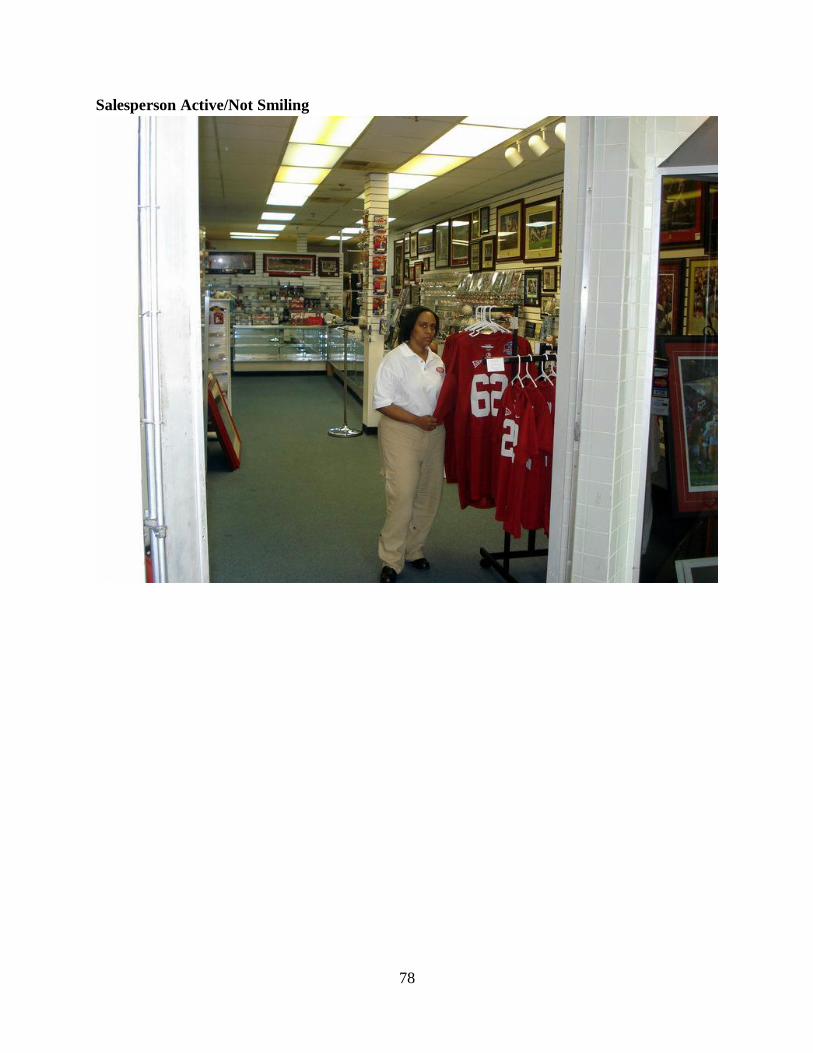
78
Salesperson Active/Not Smiling
79
Measured Variables
Several variables are measured after the subjects view the scenarios and photographic
manipulations. Both studies measure the same dependent variables, which are representative of
approach attitudes (store image, expected service quality, attitude toward salesperson, and
attitude toward retail store) and behaviors (store patronage intentions). The three primary
emotions, pleasure, arousal, and dominance are also measured and included as mediators in the
model, as suggested by Mehrabian and Russell‟s (1974) approach-avoidance theory. The items
of the measured variables are available in Table 5.1.
Several approach attitudes are measured as dependent variables, including store image
expected service quality, attitude toward the store, and attitude toward the salesperson. Store
image is measured using the store image, or store atmosphere, scale that is developed by Baker et
al. 1994, and later used in Grewal et al. (2003). This scale measures the degree to which a
customer holds positive perceptions of a retail store. It is a four-item, seven-point Likert scale,
anchored by strongly disagree and strongly agree. Expected service quality is measured using an
established scale developed by Baker et al. (1994) and also used in Baker et al. (2002). This scale
is also called a service quality inferences scale and a service quality of the store‟s employees
scale. This scale draws inspiration from the responsiveness and empathy dimensions of the
SERVQUAL scales (Parasuraman, Berry, and Zeithaml 1991). Attitude toward retail store is
measured with a general attitude toward the company scale (Goldsmith, Lafferty, and Newell
2001). This scale has also been called „liking‟ by Becker-Olson (2003) and „attitude toward the
sponsor‟ by Rodgers (2004). This scale assesses a person‟s general opinion of a company or
retailer. The items for this scale are semantic differential items and are measured on a seven-
point scale. The lead-in statement of this scale is modified from “my overall impression of the
_____ company is:” to “my overall impression of this retail store is:.” Likewise, attitude toward
80
the retail salesperson is measured with a modified version of this scale to gauge the subjects‟
general opinion of the retail salespeople in a store. Again, the items in this scale are assessed
with a seven-point Likert scale, anchored by strongly disagree and strongly agree.
The focal dependent approach behavior, store patronage intentions, is measured using an
established behavioral intentions measure that is utilized in several previous studies (Day and
Stafford 1997; Kukar-Kinney and Walters 2003; Stafford 1996; Wakefield and Baker 1998).
This three-item semantic differential scale measures the stated inclination of a person to engage
in a particular activity; store patronage in this case. The subjects answer these items on a seven-
point scale. The subjects rate how likely, probable, and possible it is that they will enter the retail
store that they view in their manipulation.
Pleasure, arousal, and dominance, the three primary emotions from Mehrabian and
Russell‟s (1974) approach and avoidance theory, serve as mediating variables in the model.
Pleasure is measured by seven items that are adapted by Donovan and Rossiter (1982) from
Mehrabian and Russell‟s (1974) original scale development, which they include in their book
that introduces approach-avoidance theory. Pleasure is the emotional reaction associated with
pleasant and happy feelings. Raghunathan and Irwin (2001) use this scale as a measure of mood.
The use of this pleasure scale is widespread (Aylesworth and MacKenzie 1998; Bateson and Hui
1992; Donovan et al. 1994; Wirtz, Matilla, and Tan 2000). The subjects are asked to rate their
emotions according to how the storefront image and scenario manipulation make them feel on a
series of seven-point semantic differential items.
A second emotion in Mehrabian and Russell‟s (1974) theory is arousal. Arousal describes
the degree to which subjects‟ senses are heightened, alerted, or excited. This measure of arousal
that is adapted by Donovan and Rossiter (1982) from Mehrabian and Russell‟s (1974) original
81
work is also used extensively in previous research (Donovan et al. 1994; Fisher and Dubé 2005;
Mattila and Wirtz 2001; Olney, Holbrook, and Batra 1991; Wirtz et al. 2000). Similar to the
pleasure scale, the subjects indicate their arousal by rating their emotions on a series of seven-
point semantic differential items.
The third of Mehrabian and Russell‟s (1974) primary emotions is dominance. Dominance
is the degree to which subjects feel in control of a situation and free to make choices. Of the
three emotions, dominance receives considerably less attention in the literature compared to
pleasure and arousal. After Donovan and Rossiter (1982) found that dominance had a weaker
effect than the other two primary emotions, many researchers began to omit dominance in their
studies (Donovan et al. 1994), although a small amount of research does include dominance with
some adaptation of Mehrabian and Russell‟s (1974) original scale (Biggers and Rankis 1983;
Gilboa and Rafaeli 2003; Machleit and Eroglu 2000). The subjects are asked to indicate their
emotions in regard to dominance using seven-point scales drawn from the original approach-
avoidance theory (Mehrabian and Russell 1974).
Covariates
This study uses several variables as covariates so that their effects are not confounded
with the results. Because the qualitative interviews suggest that previous experience working in
retail or in a mall may have an effect on consumers‟ perceptions of retail salespeople, a one-item
control measure is included for whether the subject has any retail work experience. Gender and
age are also collected to avoid any extraneous effects due to these demographic variables and to
assess the representativeness of the sample. Customers have more positive evaluations of
salespeople who appear to be like themselves, consistent with the theory of homophily (Jones,
Moore, Stanaland, and Wyatt 1998). Therefore, the gender combinations of the retail salesperson
82
model and the subject are used to form either a matched or unmatched designation for each pair
and examined for possible inclusion as covariates.
Manipulation, Realism and Demand Checks
Finally, the subjects complete a series of checks of the experimental design as part of
their participation. To test the store familiarity manipulation from the first experiment, subjects
are asked whether the scenario that they read indicates that they are familiar with the retail store
in their image, on a seven-point scale anchored with strongly disagree and strongly agree. In the
second experiment, to test whether the subjects notice the smiling condition of the salesperson, a
manipulation check asks the subjects to estimate the emotion of the retail salesperson in their
version of the manipulation. To accomplish this, subjects complete an affective response
measure (Elliot and Devine 1994; Spangenberg, Sprott, Grohmann, and Smith 2003) which is
modified so that it is oriented toward the salesperson. The subjects assess several items regarding
how they perceive that the retail salesperson in their manipulation feels. These seven-point
semantic differential items are anchored with strongly disagree and strongly agree. The presence
of a retail salesperson and other customers in the store (retail density) in the first experiment and
whether the salesperson is standing idly or active near the entrance do not need perceptual
manipulation checks because these are dichotomous variables and inquiring about them would
reveal the purpose of the study as well as create demand effects. Furthermore, the subjects
complete a seven-point semantic differential item anchored with extremely unrealistic and
extremely realistic to indicate their perceived realism of the scenario and photographic
manipulation. Lastly, a demand check is included at the end of the instrument in the form of an
open-ended question that asks the subjects what they believe the purpose of the study is. The
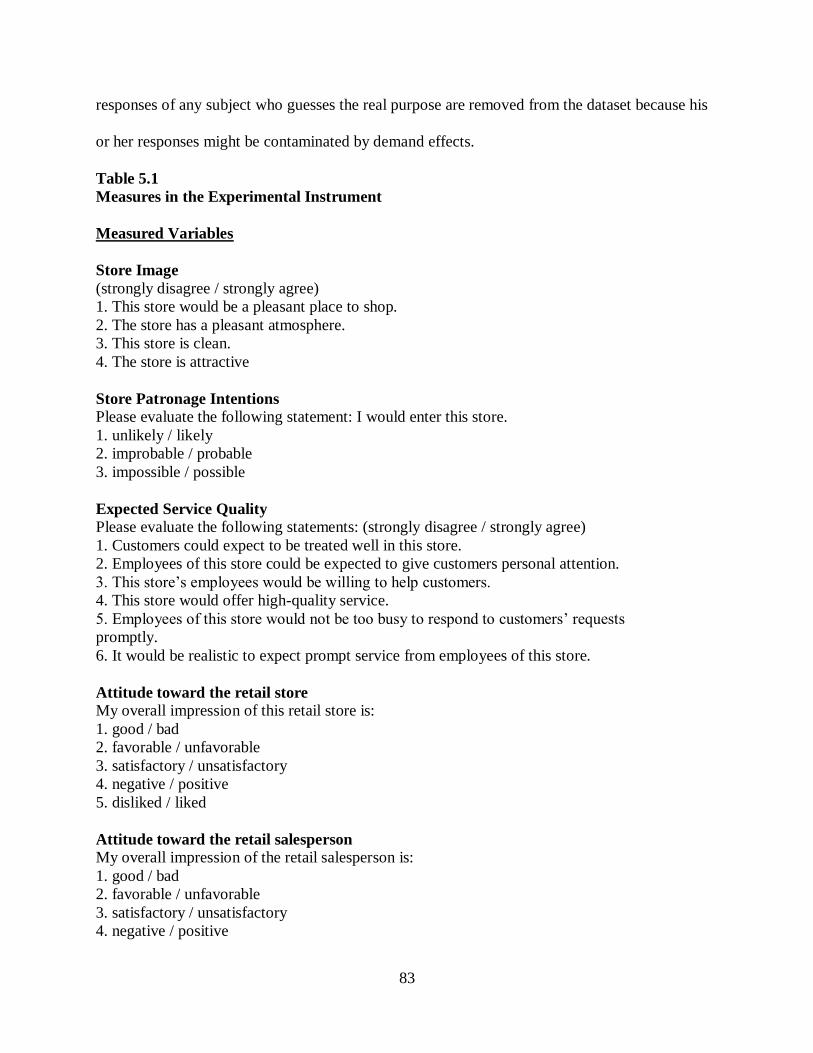
83
responses of any subject who guesses the real purpose are removed from the dataset because his
or her responses might be contaminated by demand effects.
Table 5.1
Measures in the Experimental Instrument
Measured Variables
Store Image
(strongly disagree / strongly agree)
1. This store would be a pleasant place to shop.
2. The store has a pleasant atmosphere.
3. This store is clean.
4. The store is attractive
Store Patronage Intentions
Please evaluate the following statement: I would enter this store.
1. unlikely / likely
2. improbable / probable
3. impossible / possible
Expected Service Quality
Please evaluate the following statements: (strongly disagree / strongly agree)
1. Customers could expect to be treated well in this store.
2. Employees of this store could be expected to give customers personal attention.
3. This store‟s employees would be willing to help customers.
4. This store would offer high-quality service.
5. Employees of this store would not be too busy to respond to customers‟ requests
promptly.
6. It would be realistic to expect prompt service from employees of this store.
Attitude toward the retail store
My overall impression of this retail store is:
1. good / bad
2. favorable / unfavorable
3. satisfactory / unsatisfactory
4. negative / positive
5. disliked / liked
Attitude toward the retail salesperson
My overall impression of the retail salesperson is:
1. good / bad
2. favorable / unfavorable
3. satisfactory / unsatisfactory
4. negative / positive
84
5. disliked / liked
Pleasure
Rate your emotions according to the way the scenario and photo make you feel.
1. happy / unhappy
2. pleased / annoyed
3. satisfied / unsatisfied
4. contented / melancholic
5. hopeful / despairing
6. relaxed / bored
7. joyful / not joyful
Arousal
Rate your emotions according to the way the scenario and photo make you feel.
1. stimulated / relaxed
2. excited / calm
3. frenzied / sluggish
4. jittery / dull
5. wide-awake / sleepy
6. aroused / unaroused
Dominance
Rate your emotions according to the way the scenario and photo make you feel.
1. controlling / controlled
2. influential / influenced
3. in control / cared-for
4. important / awed
5. dominant / submissive
6. autonomous / guided
Covariates
Retail Experience
1. Have you ever worked in retail? (yes / no)
Subject Demographics
1. Gender (female / male)
2. Age (enter a whole number)
3. Ethnicity (Caucasian / African American / Asian / Hispanic / Other)
Manipulation Checks
Store Familiarity Check (experiment one)
1. This scenario is a about a familiar store. (strongly disagree / strongly agree)
Salesperson Demeanor Check (experiment two)
85
The salesperson in the photograph appears to feel: (strongly disagree / strongly agree)
1. good
2. happy
3. optimistic
4. friendly
Common Check
1. The scene in the photograph above is common. (extremely uncommon/extremely common)
Realism Check
1. This scenario and photograph are realistic (strongly disagree / strongly agree)
Demand Check
1. What is the purpose of this study? (open-ended)
Data Collection Procedures
Pilot Tests
Before launching the main study data collection, two pilot tests were performed. In the
original proposal, only one pilot test was planned. However, as will be shown in the next chapter,
while the manipulation check for salesperson demeanor (experiment two) passes, the
manipulation check for store familiarity (experiment one) fails in the first pilot test. Therefore,
the store familiarity manipulation in the scenario is strengthened by using underlining and bold
font and experiment one is retested in a second pilot test.
The subjects of the pilot tests were undergraduate students who received extra credit for
their participation. The subjects accessed the experiment through an online research-hosting
website, Qualtrics. In each of the pilot tests, subjects go to the instrument online through a URL
to Qualtrics, where each subject is randomly assigned to a storefront photograph and scenario
combination. Finally, the subjects respond to the measured variables.
The pilot tests accomplish several goals. First, they help to test the questionnaire and
identify any typographic or grammatical errors that could be problematic for the main data
86
collection. Second, the psychometric properties of the scales used in the study are tested. Third,
the results from the pilot tests can serve as a manipulation check of the stimuli.
Main Test
The sample is drawn from adult U.S. members of an online panel, Opinionology
(formerly Western Watts). This market research service maintains online panels of millions of
potential respondents who answer surveys in exchange for points from the online panel‟s
program, which are worth cash and other prizes. They guarantee that their samples are nationally
representative. Opinionology also closely monitors the participation patterns of the panel
members and removes questionable respondents from the panel. The panel members are sent an
email invitation to solicit their participation in the study. The email contains a URL that they
follow in order to participate. The URL leads to the experimental instrument that is hosted on
Qualtrics. Initially, a soft launch is used, which means that only about ten percent of the data is
collected in order to ensure that the data collection is going as planned and the manipulations are
working. Once it is clear that everything is going well, then the data collection resumes until the
desired sample size is met.
In order to calculate the appropriate sample size for the main study, data were simulated
using a random number generator. Then, effect sizes for each of the relationships were estimated
based on available previous literature, theory, logic, and the exploratory pretests. These
estimated effect sizes were entered into the simulation which produced a series of regression
equations. Different sample sizes were tested to find out how many data points are necessary to
achieve statistical significance. Ultimately, a sample size of 300 subjects was determined to be
sufficient for significant results in either experiment. Further, the interaction terms from the
87
simulated data were graphed to visually show a representation of the expected pattern of results.
The interaction graphs are available in Figure 5.4.
Conclusion
To summarize the proposed methodology followed for the main study, a full factorial
between-subjects experimental design is adopted. The first experiment in the main study
photographically manipulates the presence of a retail salesperson near the entrance of the store
and retail density (the presence of other customers in the store). Store familiarity is also
manipulated in the first experiment through use of a scenario. The second experiment of the main
study photographically manipulates the demeanor and activity level of the retail salesperson. The
three primary emotions in Mehrabian and Russell‟s (1974) approach-avoidance theory, several
approach responses, covariates, manipulation checks, a realism check, and a demand check are
measured. After conducting two pilot tests with a student sample, the main data collection is
conducted through an online survey panel, Opinionology.

88
Figure 5.4
Simulation Interaction Graphs
H4a: Salesperson Presence X Store Familiarity on Pleasure (hypothesized result)

89
H4b: Salesperson Presence X Store Familiarity on Arousal (hypothesized result)

90
H4c: Salesperson Presence X Store Familiarity on Dominance (hypothesized result)
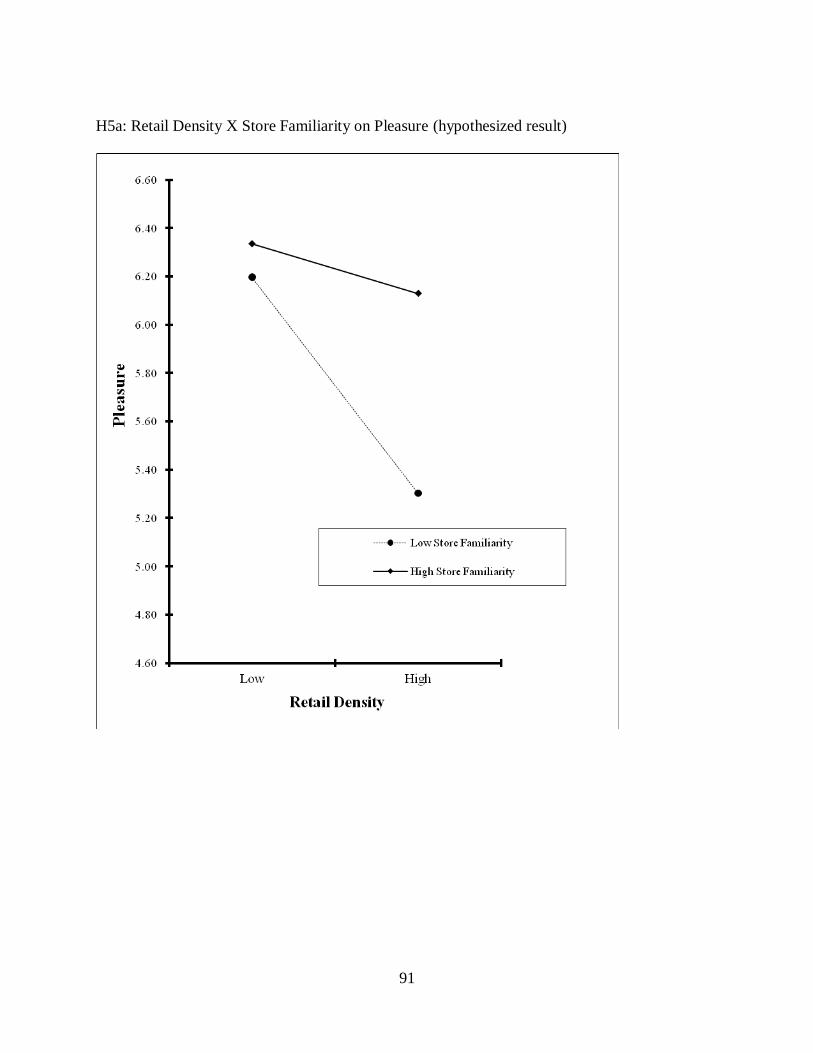
91
H5a: Retail Density X Store Familiarity on Pleasure (hypothesized result)
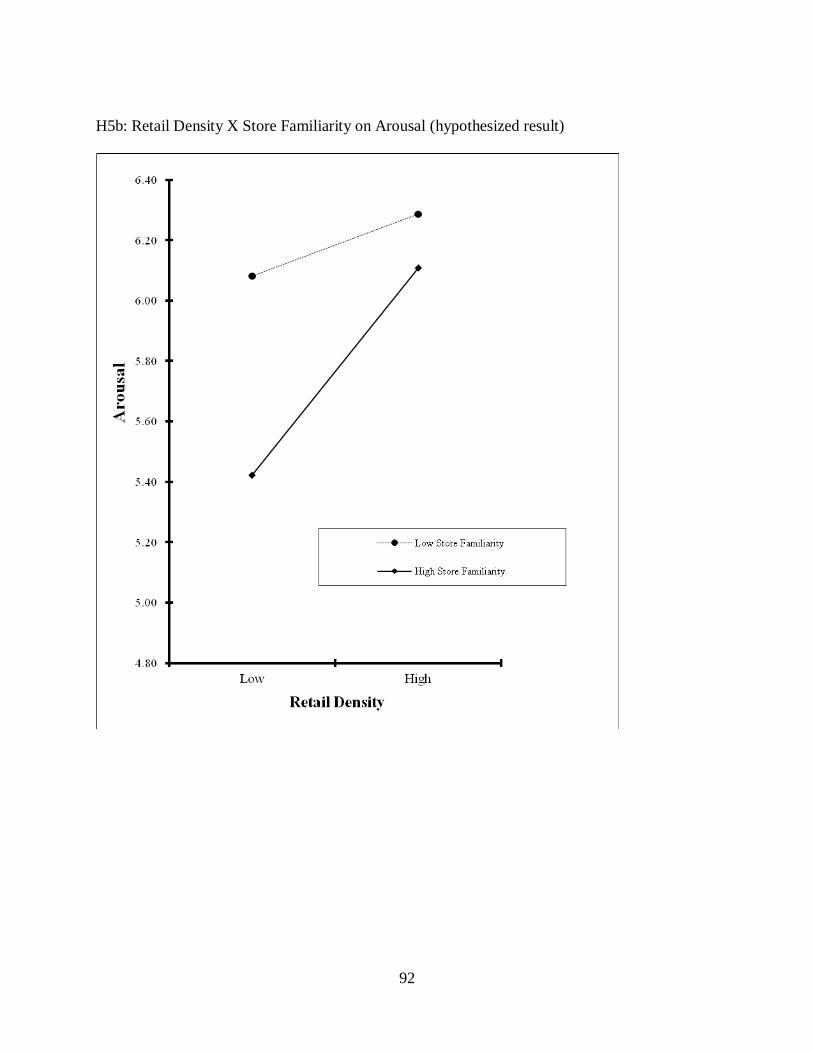
92
H5b: Retail Density X Store Familiarity on Arousal (hypothesized result)
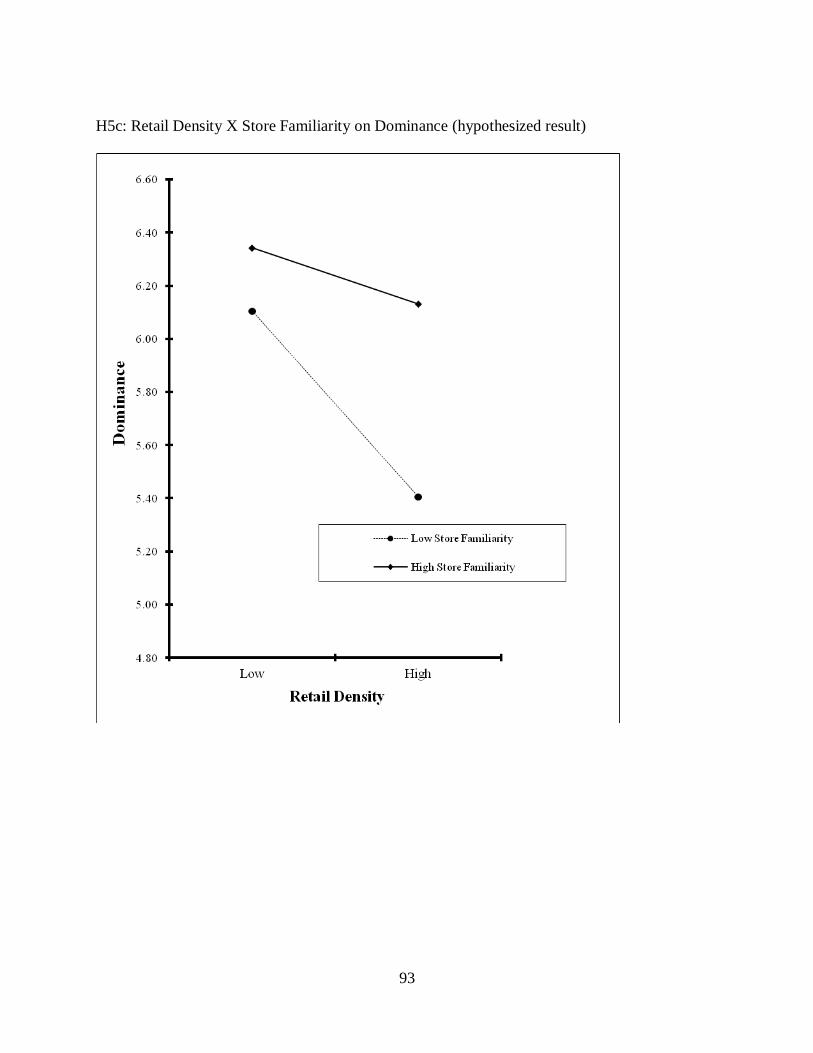
93
H5c: Retail Density X Store Familiarity on Dominance (hypothesized result)

94
H6a: Salesperson Presence X Retail Density on Pleasure (hypothesized result)
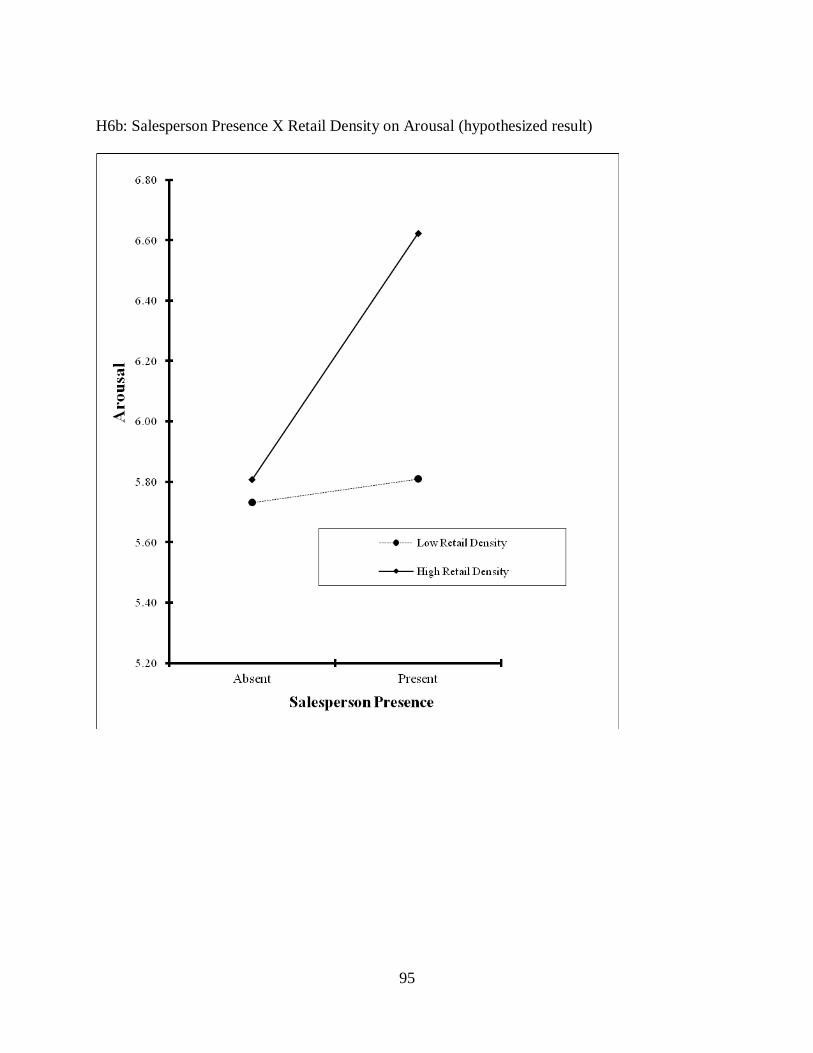
95
H6b: Salesperson Presence X Retail Density on Arousal (hypothesized result)
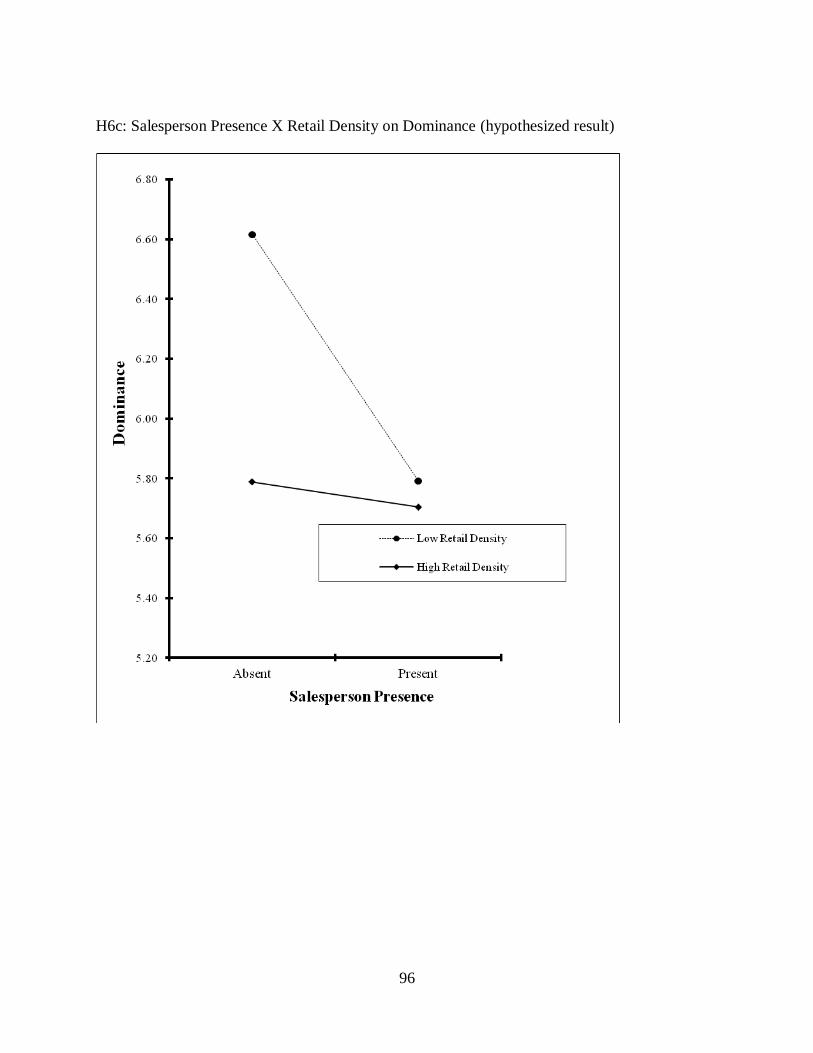
96
H6c: Salesperson Presence X Retail Density on Dominance (hypothesized result)
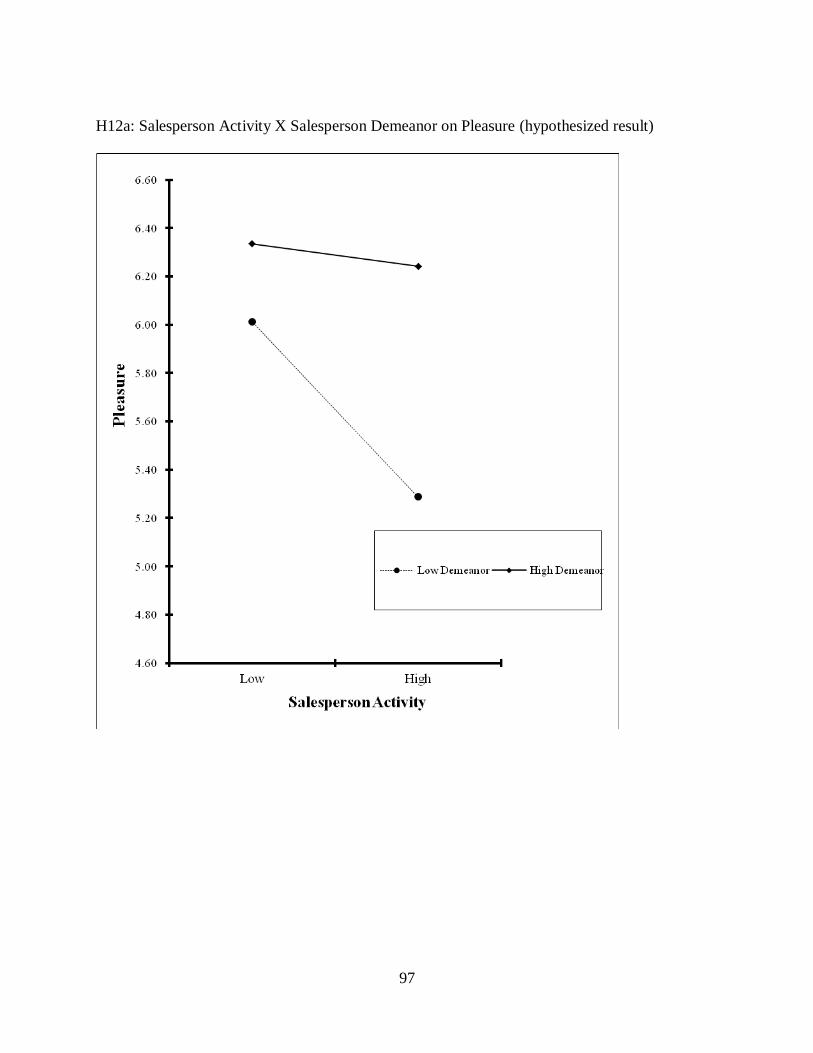
97
H12a: Salesperson Activity X Salesperson Demeanor on Pleasure (hypothesized result)

98
H12b: Salesperson Activity X Salesperson Demeanor on Dominance (hypothesized result)
99
CHAPTER VI
DATA ANALYSES AND RESULTS
Introduction
This chapter presents the results of the two pilot tests and the main study. Each of the
datasets is analyzed in a similar manner. In both experiments of the main study and in the pilot
tests, confirmatory factor analysis is used to ensure that the model has good fit. The scales are
checked for acceptable levels of reliability, validity, and item loadings. Checks for how realistic
and common the scenes in the photographs are to the subjects as well as manipulation checks are
performed. The data are analyzed in multiple ways. First, the first and second sections of the
proposed model are tested separately, using multivariate analysis of covariance (MANCOVA)
for the stimuli to mediator section, and multiple regression for the mediator to approach
outcomes section. Second, a structural equation model is used to examine the entire model
simultaneously. Advantages exist to each approach. MANCOVA is used to test the hypotheses
with categorical variables and interactions. Multiple regression is used to test the predicted linear
effects of pleasure and dominance and curvilinear effect of arousal on approach attitudes and
behavior. Also, these two piecemeal approaches to analyzing the model take the control variables
into consideration. Finally, the structural equation model has the advantage of testing the model
in its entirety, while accounting for measurement error.
Pilot Test One Results
Subjects in the first pretest were recruited from undergraduate marketing classes in
exchange for extra credit. The students were given a URL in order to access the instrument

100
online. They could also recruit another subject in order to receive additional extra credit. After
deleting incomplete responses and those in which the subject failed the demand check, 569
usable responses remain from an initial pool of 577 subjects. 287 subjects participated in
experiment one and 282 subjects participated in experiment two. In both experiments, the
majority of the subjects are female (experiment 1: 62.6%; experiment 2: 57.9%). Due to the
students recruiting additional subjects who are often older than the traditional college age, the
mean age in years of the subjects is 24.48 and 24.54 for experiments one and two, respectively.
However, the modal age for both experiments is 20 years of age. Roughly 20% of the sample for
each experiment is over 25 years of age. The majority of the subjects are Caucasian (experiment
1: 78.1%; experiment 2: 81.8%). African-Americans account for 12.0% and 11.6% of the
subjects in experiments one and two, respectively. Each of the Native American, Asian,
Hispanic, and „Other‟ groups represent less than 5% of the sample in either experiment. Finally,
45.3% and 45.0% of the subjects in experiments one and two have some experience working in
the retail industry.
Both experiment one and experiment two are included in the first pilot test. The results
for each experiment are discussed below. As in the main data collection, the subjects answer the
measures that are provided in Table 5.1. The particular storefront and salesperson (if in the
salesperson presence condition) that subjects see is randomized in order to mitigate any effect of
a particular store or salesperson. As a check for the existence of an effect due to either the
particular salesperson or storefront, each is entered into a separate multiple analysis of variance
(MANOVA) with the primary emotions, approach attitudes, and store patronage intentions as the
dependent variables for experiments one and two. For experiment one, using Wilks‟ Lambda as
the criterion, the salesperson does not have a significant omnibus effect (F(25, 486) = 1.43, p = ns),

101
but the storefront does have a significant omnibus effect (F(20, 923) = 2.19, p < .01). Examination
of the between-subjects effects for the storefront shows that the particular storefront has a
significant effect on approach attitudes (F(4, 282) = 3.16, p < .05) and store patronage intentions
(F(4, 282) = 3.19, p < .05), but does not have a significant effect on pleasure, arousal, or
dominance. For experiment two, using Wilks‟ Lambda as the criterion, neither the particular
salesperson (F(20, 820) = 0.76, p = ns) nor storefront (F(16, 837) = 1.276, p = ns) has significant
omnibus effects. Therefore, dummy variables for the storefronts are created and used as
covariates in experiment one, but not experiment two.
Likewise, the gender and race combinations of the retail salesperson model and the
subject are used to form either a matched or unmatched designation for each pair. According to
the theory of homophily (Jones, Moore, Stanaland, and Wyatt 1998), prior research shows that
customers may have more positive evaluations of salespeople who appear to be like themselves
in both gender and race. Therefore, gender match and race match are investigated as possible
covariates. Each of the match variables is entered into a separate multiple analysis of variance
(MANOVA) with the primary emotions, approach attitudes, and store patronage intentions as the
dependent variables for experiments one and two. For experiment one, using Wilks‟ Lambda as
the criterion, the gender match does not have a significant omnibus effect (F(5, 137) = .341, p =
ns), but the race match does have a significant omnibus effect (F(5, 137) = 3.69, p < .01).
Examination of the between-subjects effects for race match shows that having a matching race
combination between the salesperson and the subject has a significant effect on approach
attitudes (F(1,143) = 12.42, p < .01), store patronage intentions (F(1,143) = 6.36, p < .05), and
pleasure (F(1,143) = 6.36, p < .01), but does not have a significant effect on arousal or dominance.
For experiment two, using Wilks‟ Lambda as the criterion, neither the particular gender match

102
(F(5, 274) = .318, p = ns) nor race match (F(5, 275) = .974, p = ns) has significant omnibus effects.
Thus, gender match is not an issue in the data for experiment one or two of pilot test one, but
race match has an influence in the data for experiment one. However, because one of the
manipulated factors in experiment one is salesperson presence, race match has missing values for
half of the data that is in the salesperson absence condition. So, inclusion of race match as a
covariate in the analysis results in the generation of no coefficients for presence or any
interaction term that involves presence. As shown in the subsequent pilot test and the main test,
the significance of race match is specific to only the pilot one dataset. Because the effect for race
match does not persist in the other datasets and its inclusion in the MANCOVA model prevents
the generation of interpretable coefficients, a racial bias for experiment one of pilot two is
recognized as a limitation of this dataset.
Experiment One of Pilot Test One
Three factors are manipulated in experiment one: salesperson presence, store familiarity,
and retail density. The first part of the model includes paths from these stimuli to the three
primary emotional mediators (pleasure, arousal, and dominance). The second part of the model
includes paths from these three variables to the dependent approach variables. In the conceptual
model, the approach responses are divided into approach attitudes and one approach behavior:
store patronage intentions. The approach attitudes (store image, expected service quality, attitude
toward the store and attitude toward the salesperson) are highly correlated and they have
generally consistent relationships with the predictor variables. Thus, analyzing them separately is
redundant. The approach attitudes variables are combined into one higher-order construct, with
the exception of attitude toward the store. Although attitude toward the store exhibits the same
pattern of results as the other reflective indicators of approach attitude, it is dropped from the

103
analyses in order to maintain acceptable discriminant validity. Store patronage intentions remains
as a separate dependent variable because it is a behavioral intention rather than an attitude.
In order to determine whether the scenario manipulation for store familiarity (described
in Chapter V) is effective, the subjects answer an item on whether the store in the scenario is
familiar or unfamiliar to them. Unfortunately, a one-way analysis of variance (ANOVA) shows
that this manipulation check failed (F(1,285)= .004, p =ns, Mfamiliar = 3.63, Mnovel =3.62). Therefore,
the familiarity factor is excluded from further analysis in this pilot test, but is modified and re-
tested in the second pilot test.
Checks are also performed for the realism of the scenario and photograph, as well as how
common the scene in the photograph is to the subjects. One sample t-tests are used to compare
the means of these responses to the midpoint of the scale. The results show that the subjects find
the photograph to be realistic (t = 20.70, p < .001, M = 3.98/5.00), the scenario to be realistic (t =
17.48, p < .001, M = 3.85/5.00), and the scene to be common (t = 14.78, p < .001, M =
3.77/5/00).
Next, a confirmatory factor analysis using LISREL 8.51 is conducted in order to test the
measurement model to make sure that individual items load on their intended factors. Three of
the arousal items are dropped because their loadings and contribution to reliability are lower than
the other items. The path diagram is shown in Figure 6.1. Each of the items loads significantly on
the intended construct (t > 12.12). This analysis shows acceptable levels of fit for the
hypothesized seven-factor model (χ2 (133) = 274.11, p < .01), the mean square error of
approximation (RMSEA) is .06, the non-normed fit index (NNFI) is 0.94, the comparative fit
index (CFI) is 0.96, and the standardized RMR is .04.
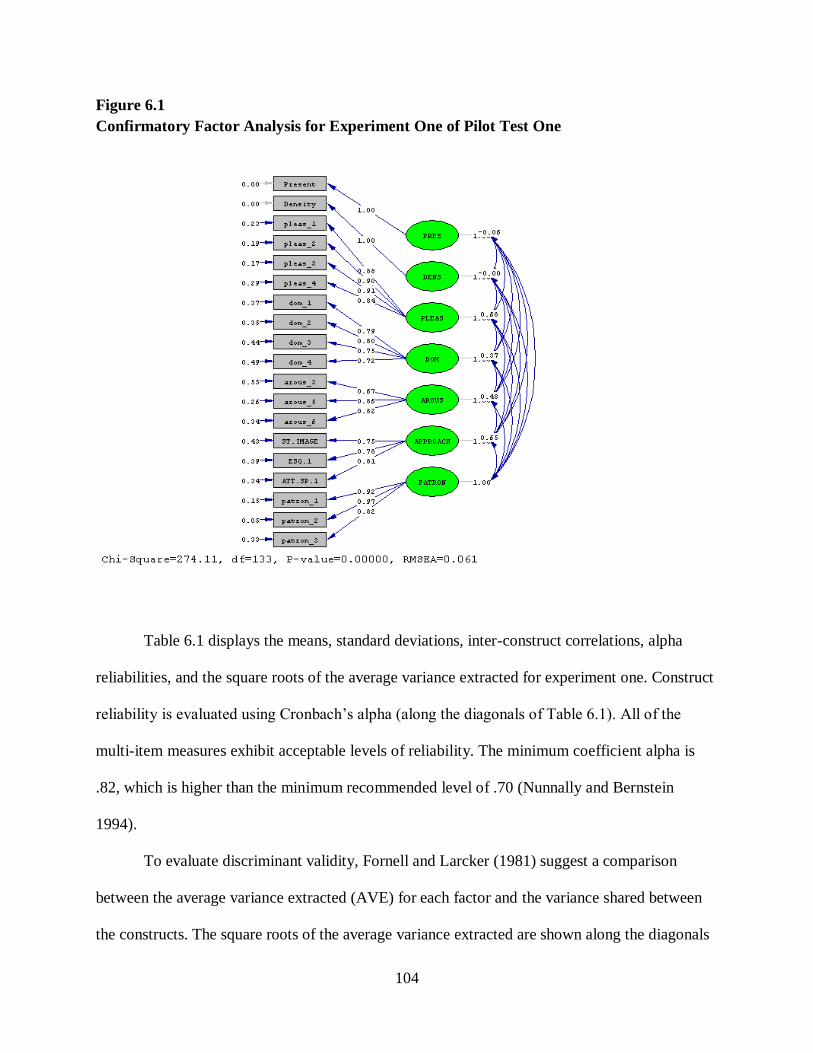
104
Figure 6.1
Confirmatory Factor Analysis for Experiment One of Pilot Test One
Table 6.1 displays the means, standard deviations, inter-construct correlations, alpha
reliabilities, and the square roots of the average variance extracted for experiment one. Construct
reliability is evaluated using Cronbach‟s alpha (along the diagonals of Table 6.1). All of the
multi-item measures exhibit acceptable levels of reliability. The minimum coefficient alpha is
.82, which is higher than the minimum recommended level of .70 (Nunnally and Bernstein
1994).
To evaluate discriminant validity, Fornell and Larcker (1981) suggest a comparison
between the average variance extracted (AVE) for each factor and the variance shared between
the constructs. The square roots of the average variance extracted are shown along the diagonals
105
of Table 6.1. As shown, the square roots of the average variance extracted exceed the
corresponding correlations in the same row and column. This illustrates that the amount of
variance within the scales is greater than the amount of covariance between any two of the
variables.
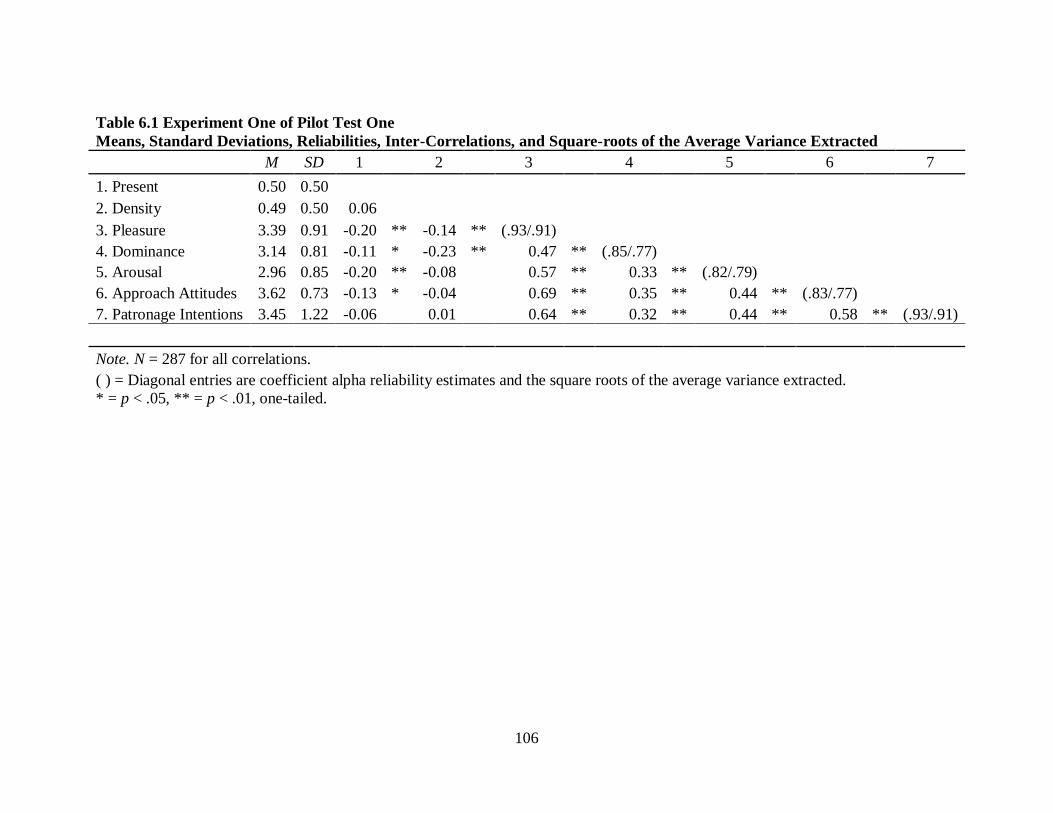
106
Table 6.1 Experiment One of Pilot Test One
Means, Standard Deviations, Reliabilities, Inter-Correlations, and Square-roots of the Average Variance Extracted
M SD 1 2 3 4 5 6 7
1. Present 0.50 0.50
2. Density 0.49 0.50 0.06
3. Pleasure 3.39 0.91 -0.20 ** -0.14 ** (.93/.91)
4. Dominance 3.14 0.81 -0.11 * -0.23 ** 0.47 ** (.85/.77)
5. Arousal 2.96 0.85 -0.20 ** -0.08
0.57 ** 0.33 ** (.82/.79)
6. Approach Attitudes 3.62 0.73 -0.13 * -0.04
0.69 ** 0.35 ** 0.44 ** (.83/.77)
7. Patronage Intentions 3.45 1.22 -0.06 0.01 0.64 ** 0.32 ** 0.44 ** 0.58 ** (.93/.91)
Note. N = 287 for all correlations.
( ) = Diagonal entries are coefficient alpha reliability estimates and the square roots of the average variance extracted.
* = p < .05, ** = p < .01, one-tailed.
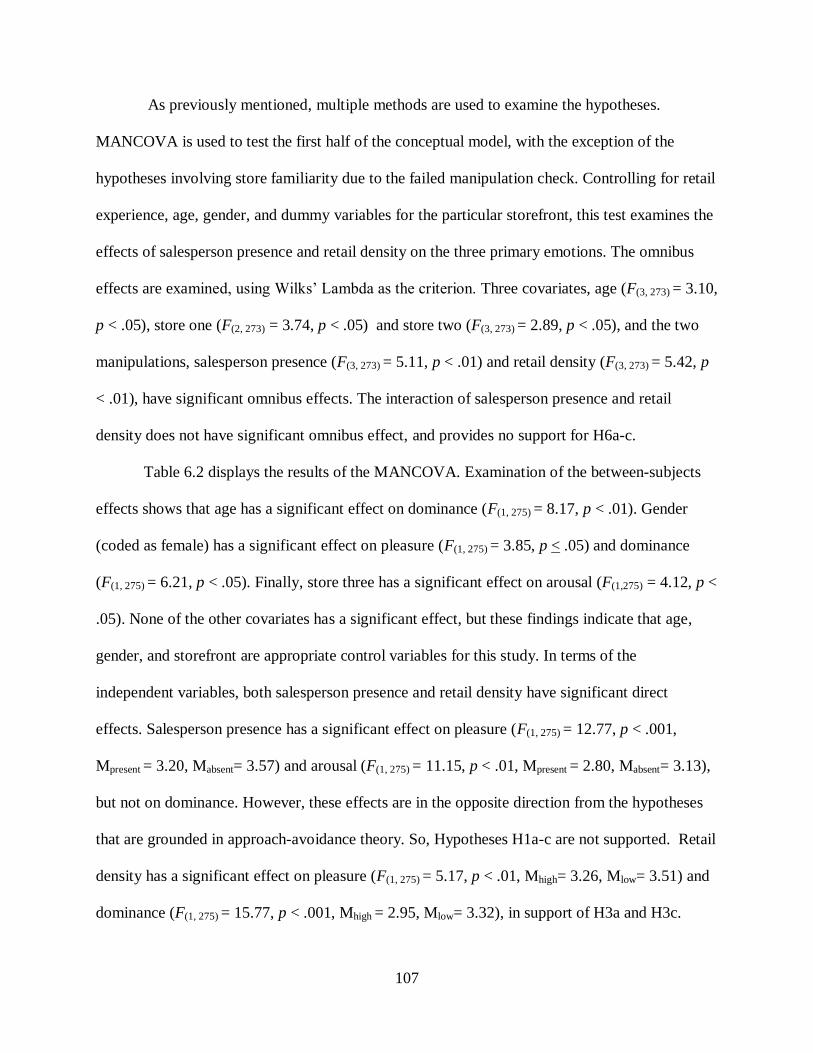
107
As previously mentioned, multiple methods are used to examine the hypotheses.
MANCOVA is used to test the first half of the conceptual model, with the exception of the
hypotheses involving store familiarity due to the failed manipulation check. Controlling for retail
experience, age, gender, and dummy variables for the particular storefront, this test examines the
effects of salesperson presence and retail density on the three primary emotions. The omnibus
effects are examined, using Wilks‟ Lambda as the criterion. Three covariates, age (F(3, 273) = 3.10,
p < .05), store one (F(2, 273) = 3.74, p < .05) and store two (F(3, 273) = 2.89, p < .05), and the two
manipulations, salesperson presence (F(3, 273) = 5.11, p < .01) and retail density (F(3, 273) = 5.42, p
< .01), have significant omnibus effects. The interaction of salesperson presence and retail
density does not have significant omnibus effect, and provides no support for H6a-c.
Table 6.2 displays the results of the MANCOVA. Examination of the between-subjects
effects shows that age has a significant effect on dominance (F(1, 275) = 8.17, p < .01). Gender
(coded as female) has a significant effect on pleasure (F(1, 275) = 3.85, p < .05) and dominance
(F(1, 275) = 6.21, p < .05). Finally, store three has a significant effect on arousal (F(1,275) = 4.12, p <
.05). None of the other covariates has a significant effect, but these findings indicate that age,
gender, and storefront are appropriate control variables for this study. In terms of the
independent variables, both salesperson presence and retail density have significant direct
effects. Salesperson presence has a significant effect on pleasure (F(1, 275) = 12.77, p < .001,
Mpresent = 3.20, Mabsent= 3.57) and arousal (F(1, 275) = 11.15, p < .01, Mpresent = 2.80, Mabsent= 3.13),
but not on dominance. However, these effects are in the opposite direction from the hypotheses
that are grounded in approach-avoidance theory. So, Hypotheses H1a-c are not supported. Retail
density has a significant effect on pleasure (F(1, 275) = 5.17, p < .01, Mhigh= 3.26, Mlow= 3.51) and
dominance (F(1, 275) = 15.77, p < .001, Mhigh = 2.95, Mlow= 3.32), in support of H3a and H3c.

108
However, H3b is not supported, as retail density does not have a significant effect on arousal.
Finally, H2a-c, H4a-c, and H5a-c, are not supported by this data because they involve store
familiarity and could not be examined due to the failed manipulation check.
Table 6.2 Pilot One Experiment One Multivariate Analysis of Covariance Between-Subjects Effects
Source Dependent Variable df Mean
Square F Significance
Intercept Pleasure 1 265.144 349.931 0.000
Intercept Arousal 1 152.012 369.740 0.000
Intercept Dominance 1 273.736 464.917 0.000
Retail Experience Pleasure 1 1.256 1.657 0.199
Retail Experience Arousal 1 0.216 0.320 0.572
Retail Experience Dominance 1 0.428 0.727 0.395
Age Pleasure 1 2.787 3.678 0.056
Age Arousal 1 2.301 3.389 0.067
Age Dominance 1 4.809 8.168 0.005
Gender Pleasure 1 2.915 3.847 0.051
Gender Arousal 1 0.195 1.341 0.248
Gender Dominance 1 0.708 6.209 0.013
Store 1 Pleasure 1 2.735 3.609 0.059
Store 1 Arousal 1 0.708 0.288 0.592
Store 1 Dominance 1 0.195 1.203 0.274
Store 2 Pleasure 1 2.121 2.799 0.095
Store 2 Arousal 1 0.816 1.202 0.274
Store 2 Dominance 1 0.278 0.473 0.492
Store 3 Pleasure 1 0.000 0.000 0.985
Store 3 Arousal 1 2.798 4.122 0.043
Store 3 Dominance 1 0.082 0.139 0.710
Store 4 Pleasure 1 1.687 2.226 0.137
Store 4 Arousal 1 0.455 0.670 0.414
Store 4 Dominance 1 0.080 0.137 0.712
Salesperson Presence Pleasure 1 9.674 12.768 0.000
Salesperson Presence Arousal 1 7.568 11.147 0.001
Salesperson Presence Dominance 1 1.617 2.746 0.099
Retail Density Pleasure 1 3.914 5.166 0.024
Retail Density Arousal 1 0.725 15.774 0.302
Retail Density Dominance 1 9.287 1.068 0.000
Salesperson Presence X Retail Density Pleasure 1 1.903 2.512 0.114
Salesperson Presence X Retail Density Arousal 1 0.074 0.074 0.742
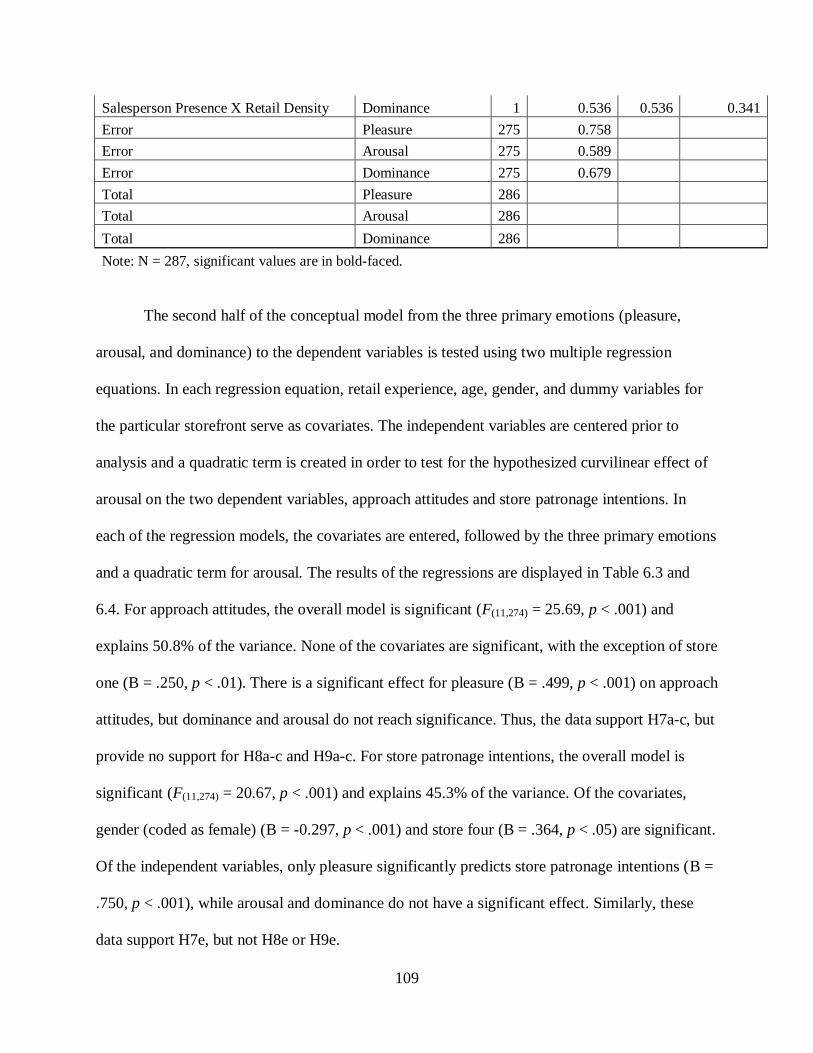
109
Salesperson Presence X Retail Density Dominance 1 0.536 0.536 0.341
Error Pleasure 275 0.758
Error Arousal 275 0.589
Error Dominance 275 0.679
Total Pleasure 286
Total Arousal 286
Total Dominance 286
Note: N = 287, significant values are in bold-faced.
The second half of the conceptual model from the three primary emotions (pleasure,
arousal, and dominance) to the dependent variables is tested using two multiple regression
equations. In each regression equation, retail experience, age, gender, and dummy variables for
the particular storefront serve as covariates. The independent variables are centered prior to
analysis and a quadratic term is created in order to test for the hypothesized curvilinear effect of
arousal on the two dependent variables, approach attitudes and store patronage intentions. In
each of the regression models, the covariates are entered, followed by the three primary emotions
and a quadratic term for arousal. The results of the regressions are displayed in Table 6.3 and
6.4. For approach attitudes, the overall model is significant (F(11,274) = 25.69, p < .001) and
explains 50.8% of the variance. None of the covariates are significant, with the exception of store
one (B = .250, p < .01). There is a significant effect for pleasure (B = .499, p < .001) on approach
attitudes, but dominance and arousal do not reach significance. Thus, the data support H7a-c, but
provide no support for H8a-c and H9a-c. For store patronage intentions, the overall model is
significant (F(11,274) = 20.67, p < .001) and explains 45.3% of the variance. Of the covariates,
gender (coded as female) (B = -0.297, p < .001) and store four (B = .364, p < .05) are significant.
Of the independent variables, only pleasure significantly predicts store patronage intentions (B =
.750, p < .001), while arousal and dominance do not have a significant effect. Similarly, these
data support H7e, but not H8e or H9e.
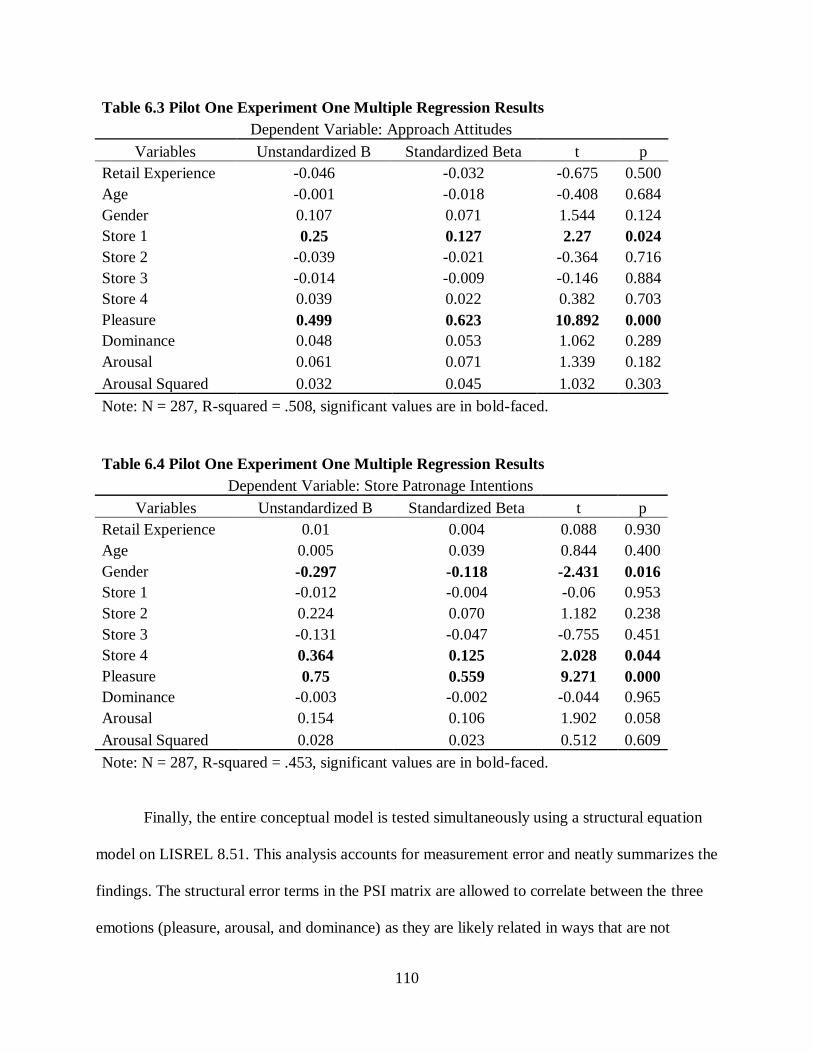
110
Table 6.3 Pilot One Experiment One Multiple Regression Results
Dependent Variable: Approach Attitudes
Variables Unstandardized B Standardized Beta t p
Retail Experience -0.046 -0.032 -0.675 0.500
Age -0.001 -0.018 -0.408 0.684
Gender 0.107 0.071 1.544 0.124
Store 1 0.25 0.127 2.27 0.024
Store 2 -0.039 -0.021 -0.364 0.716
Store 3 -0.014 -0.009 -0.146 0.884
Store 4 0.039 0.022 0.382 0.703
Pleasure 0.499 0.623 10.892 0.000
Dominance 0.048 0.053 1.062 0.289
Arousal 0.061 0.071 1.339 0.182
Arousal Squared 0.032 0.045 1.032 0.303
Note: N = 287, R-squared = .508, significant values are in bold-faced.
Table 6.4 Pilot One Experiment One Multiple Regression Results
Dependent Variable: Store Patronage Intentions
Variables Unstandardized B Standardized Beta t p
Retail Experience 0.01 0.004 0.088 0.930
Age 0.005 0.039 0.844 0.400
Gender -0.297 -0.118 -2.431 0.016
Store 1 -0.012 -0.004 -0.06 0.953
Store 2 0.224 0.070 1.182 0.238
Store 3 -0.131 -0.047 -0.755 0.451
Store 4 0.364 0.125 2.028 0.044
Pleasure 0.75 0.559 9.271 0.000
Dominance -0.003 -0.002 -0.044 0.965
Arousal 0.154 0.106 1.902 0.058
Arousal Squared 0.028 0.023 0.512 0.609
Note: N = 287, R-squared = .453, significant values are in bold-faced.
Finally, the entire conceptual model is tested simultaneously using a structural equation
model on LISREL 8.51. This analysis accounts for measurement error and neatly summarizes the
findings. The structural error terms in the PSI matrix are allowed to correlate between the three
emotions (pleasure, arousal, and dominance) as they are likely related in ways that are not
111
completely explained by this model. Also, the indicators in the λ-y matrix with the highest
loading on the appropriate construct are fixed to one. In addition, a beta path is estimated
between approach attitudes and store patronage intentions. This relationship between attitudes
and behavioral intentions is consistent with Fishbein and Ajzen‟s (1975) theory of reasoned
action. Overall, the model shows an acceptable fit to the data (χ2 (139) = 285.59 p < .01), the
RMSEA is .06, the NNFI is 0.95, the CFI is 0.96, and the standardized RMR is .05.
The structural results of the analysis are shown in Table 6.5. Salesperson presence has a
significant negative effect on pleasure (H1a) and arousal (H1b), but does not have a significant
effect on dominance (H1c). Although these findings are not surprising given the qualitative
results, the direction of the results is contrary to approach-avoidance theory and the
corresponding hypotheses. Therefore, H1a-c is not supported. The store familiarity hypotheses
(H2) are not included in the model due to the failed manipulation check. Retail density has a
significant negative effect on pleasure (H3a) and dominance (H3c), but not arousal (H3b). Thus,
H3a and H3c are supported, but H3b is not. Pleasure has a significant positive relationship with
approach attitudes (H7a-c) and store patronage intentions (H7e), giving support to these
hypotheses. The effects of arousal on approach attitudes (H8a-c) and store patronage intentions
(H8e) are not significant. Likewise, the effects of dominance on approach attitudes (H9a-c) and
store patronage intentions (H9e) are not significant. Thus, hypotheses H8 an H9 are not
supported.
Several significant effects exist in the model other than those that are specifically
hypothesized. A positive relationship between approach attitudes and store patronage intentions
is significant. In addition, salesperson presence and retail density both have significant negative
indirect effects on approach intentions and store patronage intentions. Finally, the effects of the

112
two factors and three primary emotions on the individual constructs that are indicators of
approach attitudes are given to illustrate that the same pattern of results holds for the higher-
order construct and its indicators.
Table 6.5 Structural Results for Pilot Test One Experiment One
Hypothesized Effects
Unstd.
Coeff.
Std.
Coeff. t p
H1a Salesperson Presence Pleasure -0.17 -0.19 -3.22 0.001
H1b Salesperson Presence Arousal -0.18 -0.21 -3.26 0.001
H1c Salesperson Presence Dominance -0.08 -0.09 -1.50 0.134
H3a Retail Density Pleasure -0.11 -0.13 -2.11 0.035
H3b Retail Density Arousal -0.06 -0.07 -1.12 0.263
H3c Retail Density Dominance -0.19 -0.24 -3.73 0.000
H7a-c Pleasure Approach Attitudes 0.67 0.75 8.89 0.000
H7e Pleasure Store Patronage Intentions 0.43 0.64 3.81 0.000
H8a-c Arousal Approach Attitudes 0.04 0.05 0.62 0.535
H8e Arousal Store Patronage Intentions 0.05 0.06 0.62 0.535
H9a-c Dominance Approach Attitudes 0.00 0.00 0.04 0.968
H9e Dominance Store Patronage Intentions 0.01 0.01 0.08 0.936
Other Effects
Approach Attitudes Store Patronage Intentions 0.37 0.31 3.25 0.001
Salesperson Presence Approach Attitudes -0.13 -0.15 -3.21 0.001
Salesperson Presence Store Patronage
Intentions -0.13 -0.13 -3.25 0.001
Retail Density Approach Attitudes -0.08 -0.10 -2.05 0.040
Retail Density Store Patronage Intentions -0.08 -0.09 -2.05 0.040
Pleasure Store Image 0.63 0.57 8.55 0.000
Pleasure Expected Service Quality 0.65 0.59 8.72 0.000
Pleasure Attitude to the Salesperson 0.67 0.61 8.89 0.000
Arousal Store Image 0.04 0.03 0.62 0.535
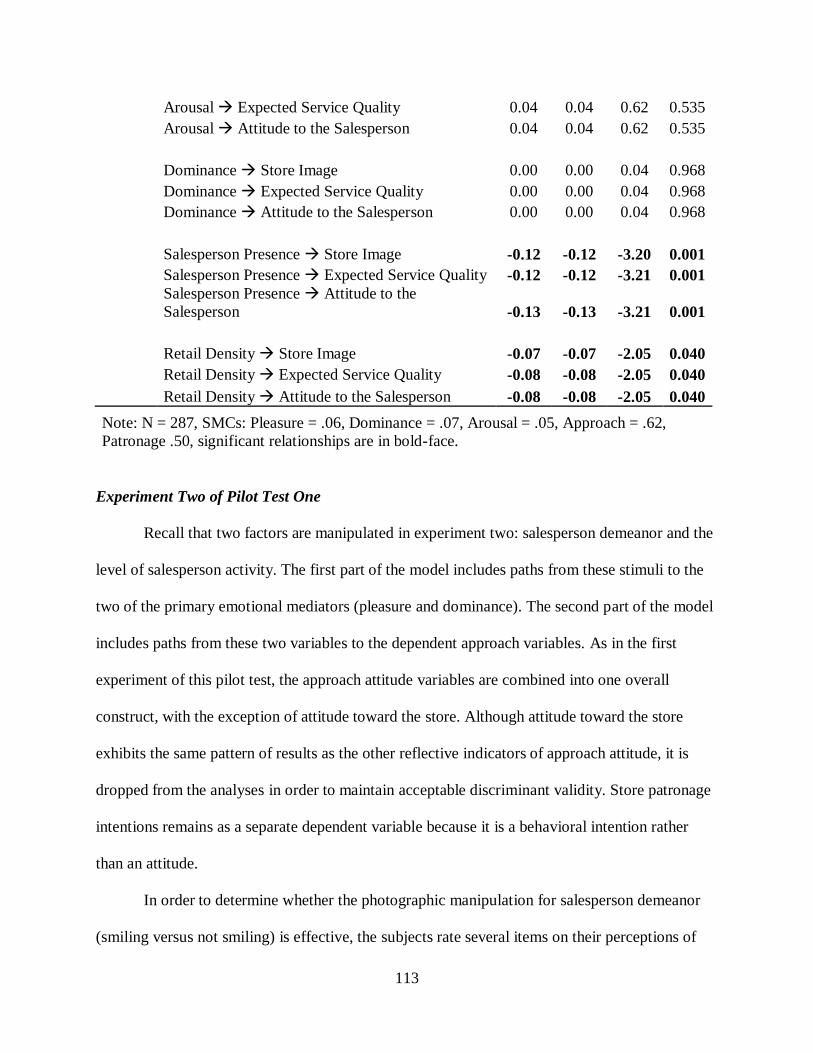
113
Arousal Expected Service Quality 0.04 0.04 0.62 0.535
Arousal Attitude to the Salesperson 0.04 0.04 0.62 0.535
Dominance Store Image 0.00 0.00 0.04 0.968
Dominance Expected Service Quality 0.00 0.00 0.04 0.968
Dominance Attitude to the Salesperson 0.00 0.00 0.04 0.968
Salesperson Presence Store Image -0.12 -0.12 -3.20 0.001
Salesperson Presence Expected Service Quality -0.12 -0.12 -3.21 0.001
Salesperson Presence Attitude to the
Salesperson -0.13 -0.13 -3.21 0.001
Retail Density Store Image -0.07 -0.07 -2.05 0.040
Retail Density Expected Service Quality -0.08 -0.08 -2.05 0.040
Retail Density Attitude to the Salesperson -0.08 -0.08 -2.05 0.040
Note: N = 287, SMCs: Pleasure = .06, Dominance = .07, Arousal = .05, Approach = .62,
Patronage .50, significant relationships are in bold-face.
Experiment Two of Pilot Test One
Recall that two factors are manipulated in experiment two: salesperson demeanor and the
level of salesperson activity. The first part of the model includes paths from these stimuli to the
two of the primary emotional mediators (pleasure and dominance). The second part of the model
includes paths from these two variables to the dependent approach variables. As in the first
experiment of this pilot test, the approach attitude variables are combined into one overall
construct, with the exception of attitude toward the store. Although attitude toward the store
exhibits the same pattern of results as the other reflective indicators of approach attitude, it is
dropped from the analyses in order to maintain acceptable discriminant validity. Store patronage
intentions remains as a separate dependent variable because it is a behavioral intention rather
than an attitude.
In order to determine whether the photographic manipulation for salesperson demeanor
(smiling versus not smiling) is effective, the subjects rate several items on their perceptions of
114
the particular salesperson that they see in their randomly assigned stimulus (see Table 5.1). An
ANOVA shows that this manipulation check is successful (F(1,285)=167.97, p < .001, Msmiling =
4.16, Mnot smiling =2.70).
Checks are also performed for the realism of the scenario and photograph, as well as how
common the scene in the photograph is to the subjects. One sample t-tests are used to compare
the means of these responses to the midpoint of the scale. The results show that the subjects find
the photograph to be realistic (t = 20.82, p < .001, M = 3.99/5.00), the scenario to be realistic (t =
22.22, p < .001, M = 3.99/5.00), and the scene to be common (t = 13.55, p < .001, M =
3.76/5.00).
Next, a confirmatory factor analysis using LISREL 8.51 is conducted in order to test the
measurement model to ensure that individual items load on their intended factors. Three of the
arousal items are dropped because their loadings and contribution to reliability are lower than the
other items. The path diagram is shown in Figure 6.2. Each of the items loads significantly on the
intended construct (t > 10.50). This analysis shows acceptable levels of fit for the hypothesized
six-factor model (χ2 (91) = 202.98, p < .01), the RMSEA is .07, the NNFI is 0.94, the CFI is
0.96, and the standardized RMR is .05.

115
Figure 6.2
Confirmatory Factor Analysis for Experiment Two of Pilot Test One
Table 6.6 displays the means, standard deviations, inter-construct correlations, alpha
reliabilities, and the square roots of the average variance extracted for experiment two. Construct
reliability is evaluated using Cronbach‟s alpha (along the diagonals of Table 6.6). All of the
multi-item measures exhibit acceptable levels of reliability. The minimum coefficient alpha is
.79.
To demonstrate discriminant validity, the square roots of the average variance extracted
are shown along the diagonals of Table 6.6 (Fornell and Larcker 1981). As shown, the square
roots of the average variance extracted exceed the corresponding correlations in the same row
and column, which illustrates that the amount of variance within the scales is greater than the
amount of covariance between any two of the variables.
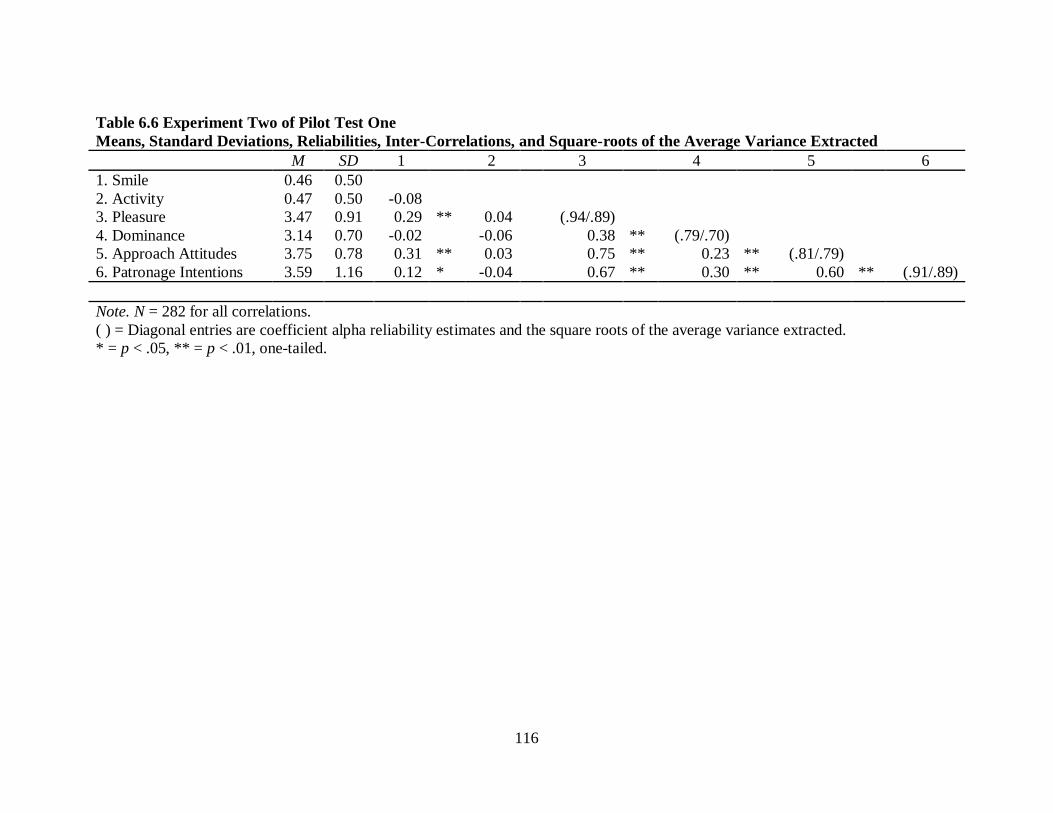
116
Table 6.6 Experiment Two of Pilot Test One
Means, Standard Deviations, Reliabilities, Inter-Correlations, and Square-roots of the Average Variance Extracted
M SD 1 2 3 4 5 6
1. Smile 0.46 0.50
2. Activity 0.47 0.50 -0.08
3. Pleasure 3.47 0.91 0.29 ** 0.04
(.94/.89)
4. Dominance 3.14 0.70 -0.02
-0.06
0.38 ** (.79/.70)
5. Approach Attitudes 3.75 0.78 0.31 ** 0.03
0.75 ** 0.23 ** (.81/.79)
6. Patronage Intentions 3.59 1.16 0.12 * -0.04 0.67 ** 0.30 ** 0.60 ** (.91/.89)
Note. N = 282 for all correlations.
( ) = Diagonal entries are coefficient alpha reliability estimates and the square roots of the average variance extracted.
* = p < .05, ** = p < .01, one-tailed.
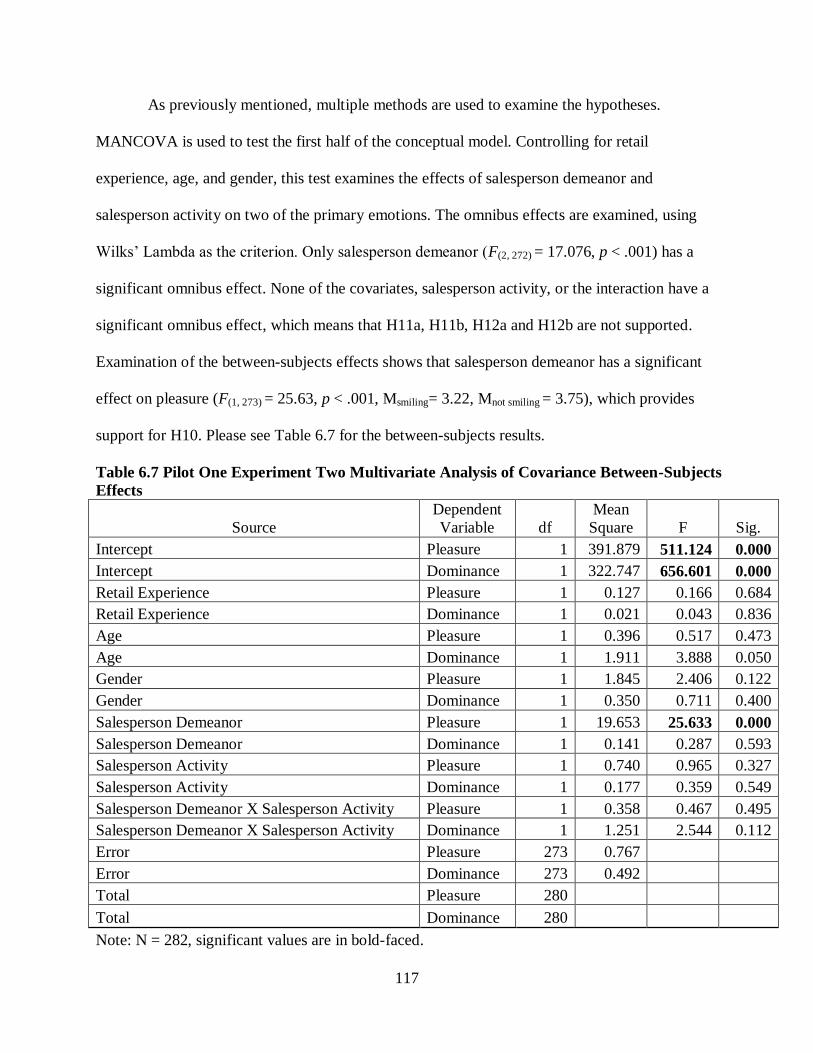
117
As previously mentioned, multiple methods are used to examine the hypotheses.
MANCOVA is used to test the first half of the conceptual model. Controlling for retail
experience, age, and gender, this test examines the effects of salesperson demeanor and
salesperson activity on two of the primary emotions. The omnibus effects are examined, using
Wilks‟ Lambda as the criterion. Only salesperson demeanor (F(2, 272) = 17.076, p < .001) has a
significant omnibus effect. None of the covariates, salesperson activity, or the interaction have a
significant omnibus effect, which means that H11a, H11b, H12a and H12b are not supported.
Examination of the between-subjects effects shows that salesperson demeanor has a significant
effect on pleasure (F(1, 273) = 25.63, p < .001, Msmiling= 3.22, Mnot smiling = 3.75), which provides
support for H10. Please see Table 6.7 for the between-subjects results.
Table 6.7 Pilot One Experiment Two Multivariate Analysis of Covariance Between-Subjects
Effects
Source
Dependent
Variable df
Mean
Square F Sig.
Intercept Pleasure 1 391.879 511.124 0.000
Intercept Dominance 1 322.747 656.601 0.000
Retail Experience Pleasure 1 0.127 0.166 0.684
Retail Experience Dominance 1 0.021 0.043 0.836
Age Pleasure 1 0.396 0.517 0.473
Age Dominance 1 1.911 3.888 0.050
Gender Pleasure 1 1.845 2.406 0.122
Gender Dominance 1 0.350 0.711 0.400
Salesperson Demeanor Pleasure 1 19.653 25.633 0.000
Salesperson Demeanor Dominance 1 0.141 0.287 0.593
Salesperson Activity Pleasure 1 0.740 0.965 0.327
Salesperson Activity Dominance 1 0.177 0.359 0.549
Salesperson Demeanor X Salesperson Activity Pleasure 1 0.358 0.467 0.495
Salesperson Demeanor X Salesperson Activity Dominance 1 1.251 2.544 0.112
Error Pleasure 273 0.767
Error Dominance 273 0.492
Total Pleasure 280
Total Dominance 280
Note: N = 282, significant values are in bold-faced.
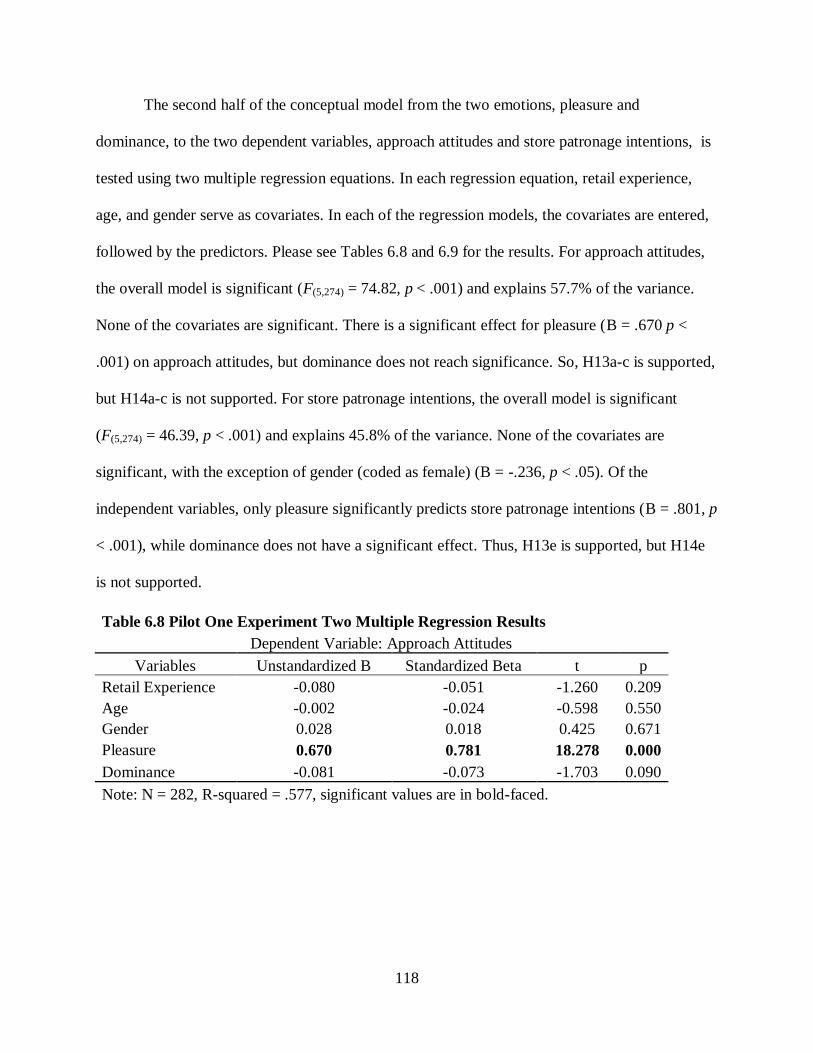
118
The second half of the conceptual model from the two emotions, pleasure and
dominance, to the two dependent variables, approach attitudes and store patronage intentions, is
tested using two multiple regression equations. In each regression equation, retail experience,
age, and gender serve as covariates. In each of the regression models, the covariates are entered,
followed by the predictors. Please see Tables 6.8 and 6.9 for the results. For approach attitudes,
the overall model is significant (F(5,274) = 74.82, p < .001) and explains 57.7% of the variance.
None of the covariates are significant. There is a significant effect for pleasure (B = .670 p <
.001) on approach attitudes, but dominance does not reach significance. So, H13a-c is supported,
but H14a-c is not supported. For store patronage intentions, the overall model is significant
(F(5,274) = 46.39, p < .001) and explains 45.8% of the variance. None of the covariates are
significant, with the exception of gender (coded as female) (B = -.236, p < .05). Of the
independent variables, only pleasure significantly predicts store patronage intentions (B = .801, p
< .001), while dominance does not have a significant effect. Thus, H13e is supported, but H14e
is not supported.
Table 6.8 Pilot One Experiment Two Multiple Regression Results
Dependent Variable: Approach Attitudes
Variables Unstandardized B Standardized Beta t p
Retail Experience -0.080 -0.051 -1.260 0.209
Age -0.002 -0.024 -0.598 0.550
Gender 0.028 0.018 0.425 0.671
Pleasure 0.670 0.781 18.278 0.000
Dominance -0.081 -0.073 -1.703 0.090
Note: N = 282, R-squared = .577, significant values are in bold-faced.
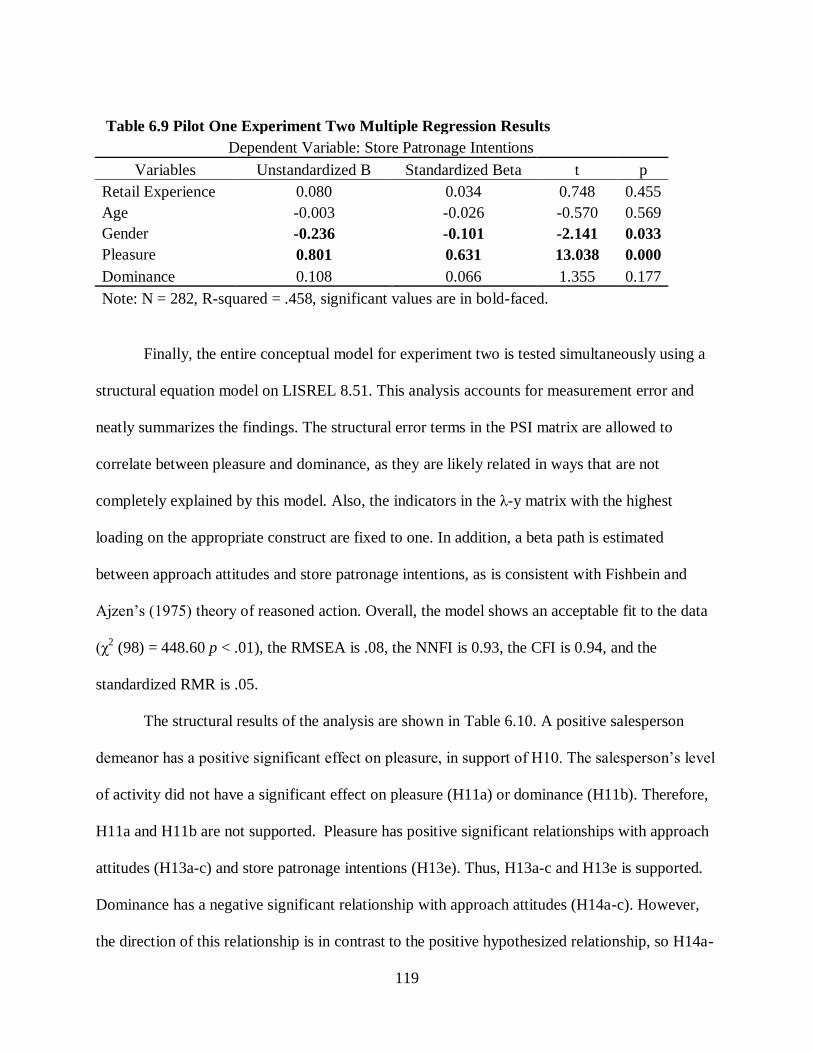
119
Table 6.9 Pilot One Experiment Two Multiple Regression Results
Dependent Variable: Store Patronage Intentions
Variables Unstandardized B Standardized Beta t p
Retail Experience 0.080 0.034 0.748 0.455
Age -0.003 -0.026 -0.570 0.569
Gender -0.236 -0.101 -2.141 0.033
Pleasure 0.801 0.631 13.038 0.000
Dominance 0.108 0.066 1.355 0.177
Note: N = 282, R-squared = .458, significant values are in bold-faced.
Finally, the entire conceptual model for experiment two is tested simultaneously using a
structural equation model on LISREL 8.51. This analysis accounts for measurement error and
neatly summarizes the findings. The structural error terms in the PSI matrix are allowed to
correlate between pleasure and dominance, as they are likely related in ways that are not
completely explained by this model. Also, the indicators in the λ-y matrix with the highest
loading on the appropriate construct are fixed to one. In addition, a beta path is estimated
between approach attitudes and store patronage intentions, as is consistent with Fishbein and
Ajzen‟s (1975) theory of reasoned action. Overall, the model shows an acceptable fit to the data
(χ2 (98) = 448.60 p < .01), the RMSEA is .08, the NNFI is 0.93, the CFI is 0.94, and the
standardized RMR is .05.
The structural results of the analysis are shown in Table 6.10. A positive salesperson
demeanor has a positive significant effect on pleasure, in support of H10. The salesperson‟s level
of activity did not have a significant effect on pleasure (H11a) or dominance (H11b). Therefore,
H11a and H11b are not supported. Pleasure has positive significant relationships with approach
attitudes (H13a-c) and store patronage intentions (H13e). Thus, H13a-c and H13e is supported.
Dominance has a negative significant relationship with approach attitudes (H14a-c). However,
the direction of this relationship is in contrast to the positive hypothesized relationship, so H14a-

120
c is not supported. H14e is also not supported as there is not a significant relationship between
dominance and store patronage intentions.
Several significant effects exist in the model other than those that are specifically
hypothesized. A positive salesperson demeanor has a positive significant indirect effect on
approach attitudes and store patronage intention, but salesperson activity does not have a
significant relationship with either dependent variable. Finally, the effects of the two factors and
two emotions on the individual constructs that are indicators of approach attitudes are given to
illustrate that the same pattern of results holds for the overall construct and its indicators.
Pleasure and a positive salesperson demeanor have positive significant relationships, dominance
has a negative significant relationship, and salesperson activity has no significant relationship
with store image, expected service quality, and attitude to the salesperson.
Table 6.10 Structural Results for Pilot Test One Experiment Two
Hypothesized Effects
Unstd.
Coeff.
Std.
Coeff. t p
H10 Salesperson Demeanor Pleasure 0.29 0.32 6.00 0.000
H11a Salesperson Activity Pleasure 0.05 0.06 1.01 0.312
H11b Salesperson Activity Dominance -0.05 -0.07 -1.02 0.308
H13a-c Pleasure Approach Attitudes 0.81 0.91 13.72 0.000
H13e Pleasure Store Patronage Intentions 0.50 0.48 3.65 0.000
H14a-c Dominance Approach Attitudes -0.13 -0.12 -2.19 0.029
H14e Dominance Store Patronage Intentions 0.09 0.08 1.24 0.215
Other Effects
Approach Attitudes Store Patronage Intentions 0.26 0.22 1.76 0.078
Salesperson Demeanor Approach Attitudes 0.24 0.29 5.67 0.000
Salesperson Demeanor Store Patronage Intentions 0.21 0.22 5.46 0.000
Salesperson Activity Approach Attitudes 0.05 0.06 1.23 0.219

121
Salesperson Activity Store Patronage Intentions 0.04 0.04 0.88 0.379
Pleasure Store Image 0.73 0.67 12.13 0.000
Pleasure Expected Service Quality 0.80 0.74 13.60 0.000
Pleasure Attitude to the Salesperson 0.81 0.74 13.72 0.000
Dominance Store Image -0.11 -0.09 -2.18 0.029
Dominance Expected Service Quality -0.13 -0.10 -2.18 0.029
Dominance Attitude to the Salesperson -0.13 -0.10 -2.19 0.029
Salesperson Demeanor Store Image 0.21 0.21 5.53 0.000
Salesperson Demeanor Expected Service Quality 0.23 0.23 5.66 0.000
Salesperson Demeanor Attitude to the Salesperson 0.24 0.24 5.67 0.000
Salesperson Activity Store Image 0.05 0.05 1.23 0.219
Salesperson Activity Expected Service Quality 0.05 0.05 1.23 0.219
Salesperson Activity Attitude to the Salesperson 0.05 0.05 1.23 0.219
Note: N = 282, SMCs: Pleasure = .10, Dominance = .00, Approach = .74, Patronage .51, significant
relationships are in bold-face.
Pilot Test Two Results
A second pilot test of experiment one is conducted because the manipulation check for
store familiarity failed in the first pilot test. In a similar manner to the first pretest, subjects in the
second pretest are recruited from undergraduate marketing classes in exchange for extra credit.
The students are given a URL in order to access the instrument online. They could also recruit
another subject in order to receive additional extra credit. After deleting incomplete responses
and those in which the subject failed the demand check, 429 usable responses remain from an
initial pool of 433 subjects. The majority of the subjects in this pilot test are male (53.8%). Due
to the students recruiting additional subjects who are often older than traditional college age, the
mean age in years of the subjects is 23.29. However, the modal age is 21 years. Roughly 10% of
the sample is over 25 years of age. The majority of the subjects are Caucasian (86.2%). African-
Americans account for 7.2% of the subjects. Each of the Native American, Asian, Hispanic, and
122
„Other‟ groups represent less than 5% of the sample. Finally, 47.3% f the subjects have some
experience working in the retail industry.
As in the main data collection and first pilot test, the subjects answer the measures that
are laid out in Table 5.1. The particular storefront and salesperson (if in the salesperson presence
condition) that subjects see is randomized in order to mitigate any effect of a particular store or
salesperson. As a check for the existence of an effect due to either the particular salesperson or
storefront, each is entered into a separate MANOVA with the primary emotions, approach
attitudes, and store patronage intentions as the dependent variables for experiment one and two.
Using Wilks‟ Lambda as the criterion, the salesperson did not have a significant omnibus effect
(F(30, 774) = 1.04, p = ns), but the storefront did have a significant omnibus effect (F(20, 923) = 3.05,
p < .001). Examination of the between-subjects effects for the storefront shows that the particular
storefront has a significant effect on approach attitudes (F(4, 424) = 5.55, p < .001), store patronage
intentions (F(4, 424) = 7.91, p < .001), and pleasure (F(4, 424) = 2.49, p < .05), but does not have a
significant effect on arousal or dominance. Therefore, dummy variables for the storefronts are
created and used as covariates in this experiment.
Similar to the first pilot test, gender match and race match are investigated as possible
covariates. So, the gender and race combinations of the retail salesperson model and the subject
are used to form either a matched or unmatched designation for each pair. Each of the match
variables is entered into a separate multiple analysis of variance (MANOVA) with the primary
emotions, approach attitudes, and store patronage intentions as the dependent variables. Using
Wilks‟ Lambda as the criterion, neither gender match (F(5, 198) = .583, p = ns) nor race match (F(5,
198) = .549, p = ns) have a significant omnibus effect. Therefore, gender match and race match
are not issues in the data for this experiment.
123
Three factors are manipulated in experiment one: salesperson presence, store familiarity,
and retail density. The first part of the model includes paths from these stimuli to the three
primary emotional mediators (pleasure, arousal, and dominance). The second part of the model
includes paths from these three variables to the dependent approach variables. In the conceptual
model, the approach responses are divided into approach attitudes and one approach behavior:
store patronage intentions. As in the first pilot test, the approach attitudes variables are combined
into one overall construct, with the exception of attitude toward the store. Although attitude
toward the store exhibits the same pattern of results as the other reflective indicators of approach
attitude, it is dropped from the analyses in order to maintain acceptable discriminant validity.
Store patronage intentions remains as a separate dependent variable because it is a behavioral
intention rather than an attitude.
Several checks are performed prior to the main analysis. In order to determine whether
the scenario manipulation for store familiarity is effective, the subjects answer an item on
whether the store in the scenario is familiar to them. Fortunately, an ANOVA shows that this
manipulation check passes (F(1,427)= 8.75, p < .01, Mfamiliar = 3.62, Mnovel =3.32). Checks are also
performed for the realism of the scenario and photograph, as well as how common the scene in
the photograph is to the subjects. One sample t-tests are used to compare the means of these
responses to the midpoint of the scale. The results show that the subjects find the photograph to
be realistic (t =18.36, p < .001, M = 3.86/5.00), the scenario to be realistic (t = 22.46, p < .001, M
= 3.72/5.00), and the scene to be common (t = 17.44, p < .001, M = 3.72/5.00).
Next, a confirmatory factor analysis using LISREL 8.51 is conducted in order to test the
measurement model to ensure that individual items load on their intended factors. Three of the
arousal items are dropped because their loadings and contribution to reliability are lower than the

124
other items. The path diagram is shown in Figure 6.3. Each of the items loads significantly on the
intended construct (t > 16.27). This analysis shows acceptable levels of fit for the hypothesized
eight-factor model (χ2 (145) = 341.49 p < .01), the RMSEA is .06, the NNFI is 0.94, the CFI is
0.96, and the standardized RMR is .04.
Figure 6.3
Confirmatory Factor Analysis for Pilot Test Two
Table 6.11 displays the means, standard deviations, inter-construct correlations, alpha
reliabilities, and the square roots of the average variance extracted for pilot test two. Construct
reliability is evaluated using Cronbach‟s alpha (along the diagonals of Table 6.11). All of the
multi-item measures exhibit acceptable levels of reliability. The minimum coefficient alpha is
.76. Fornell and Larcker „s(1981) test demonstrates discriminant validity as shown by the square
roots of the average variance explained on the diagonals of Table 6.11.
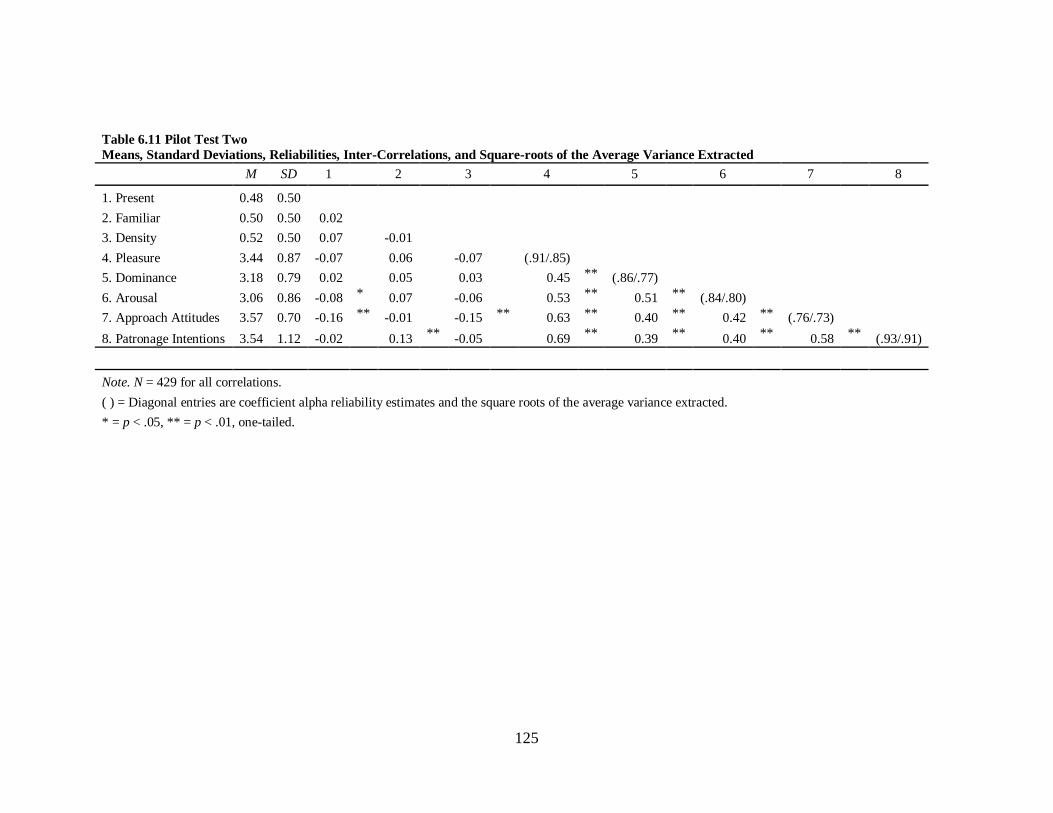
125
Table 6.11 Pilot Test Two
Means, Standard Deviations, Reliabilities, Inter-Correlations, and Square-roots of the Average Variance Extracted
M SD 1 2 3 4 5 6 7 8
1. Present 0.48 0.50
2. Familiar 0.50 0.50 0.02
3. Density 0.52 0.50 0.07 -0.01
4. Pleasure 3.44 0.87 -0.07 0.06 -0.07 (.91/.85)
5. Dominance 3.18 0.79 0.02 0.05 0.03 0.45 ** (.86/.77)
6. Arousal 3.06 0.86 -0.08 * 0.07 -0.06 0.53 ** 0.51 ** (.84/.80)
7. Approach Attitudes 3.57 0.70 -0.16 ** -0.01 -0.15 ** 0.63 ** 0.40 ** 0.42 ** (.76/.73)
8. Patronage Intentions 3.54 1.12 -0.02 0.13 ** -0.05 0.69 ** 0.39 ** 0.40 ** 0.58 ** (.93/.91)
Note. N = 429 for all correlations.
( ) = Diagonal entries are coefficient alpha reliability estimates and the square roots of the average variance extracted.
* = p < .05, ** = p < .01, one-tailed.
126
MANCOVA is used to test the first half of the conceptual model. Controlling for retail
experience, age, gender, and dummy variables for the particular storefront, this test examines the
effects of salesperson presence, store familiarity, and retail density on the three primary
emotions. The omnibus effects are examined first, using Wilks‟ Lambda as the criterion and only
one covariate, store four is significant (F(3,411) = 3.650, p < .05). Unfortunately, none of the other
covariates, factors, or interactions have significant omnibus effects. For illustrative purposes, the
omnibus tests for salesperson presence (F(3, 411) = 1.80, p = .146), store familiarity (F(3,411) = .889,
p = .447), and retail density (F(3,411) = 30.48, p = .214) are not significant. Therefore, the
between-subjects effects cannot be interpreted and the data in the second pilot test do not support
any of Hypotheses 1-6.
The second half of the conceptual model from the three primary emotions, pleasure,
arousal, and dominance, to the dependent variables is tested using two multiple regression
equations. In each regression equation, retail experience, age, gender, and dummy variables for
the particular storefront serve as covariates. The independent variables are centered prior to
analysis and a quadratic term is created in order to test for the hypothesized curvilinear effect of
arousal on the two dependent variables, approach attitudes and store patronage intentions. In
each of the regression models, the covariates are entered, followed by the three primary emotions
and a quadratic term for arousal. Please see Tables 6.12 and 6.13 for the results. For approach
attitudes, the overall model is significant (F(11,416) = 30.48, p < .001) and explains 44.6% of the
variance. None of the covariates are significant, with the exception of store four (B = .247, p <
.01). There is a significant effect for pleasure (B = .417, p < .001) and dominance (B = .087, p <
.001) on approach attitudes, but the quadratic term for arousal does not reach significance.
Therefore, H7a-c and H9a-c, but not H8a-c, are supported by this data. For store patronage
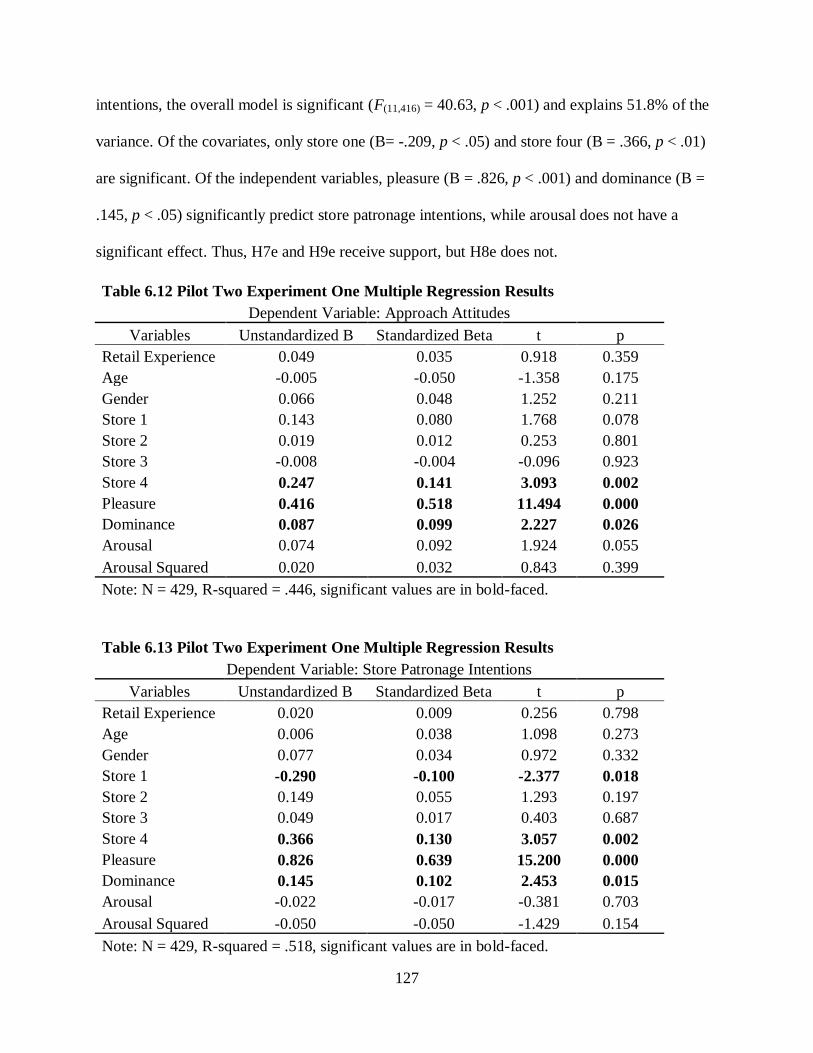
127
intentions, the overall model is significant (F(11,416) = 40.63, p < .001) and explains 51.8% of the
variance. Of the covariates, only store one (B= -.209, p < .05) and store four (B = .366, p < .01)
are significant. Of the independent variables, pleasure (B = .826, p < .001) and dominance (B =
.145, p < .05) significantly predict store patronage intentions, while arousal does not have a
significant effect. Thus, H7e and H9e receive support, but H8e does not.
Table 6.12 Pilot Two Experiment One Multiple Regression Results
Dependent Variable: Approach Attitudes
Variables Unstandardized B Standardized Beta t p
Retail Experience 0.049 0.035 0.918 0.359
Age -0.005 -0.050 -1.358 0.175
Gender 0.066 0.048 1.252 0.211
Store 1 0.143 0.080 1.768 0.078
Store 2 0.019 0.012 0.253 0.801
Store 3 -0.008 -0.004 -0.096 0.923
Store 4 0.247 0.141 3.093 0.002
Pleasure 0.416 0.518 11.494 0.000
Dominance 0.087 0.099 2.227 0.026
Arousal 0.074 0.092 1.924 0.055
Arousal Squared 0.020 0.032 0.843 0.399
Note: N = 429, R-squared = .446, significant values are in bold-faced.
Table 6.13 Pilot Two Experiment One Multiple Regression Results
Dependent Variable: Store Patronage Intentions
Variables Unstandardized B Standardized Beta t p
Retail Experience 0.020 0.009 0.256 0.798
Age 0.006 0.038 1.098 0.273
Gender 0.077 0.034 0.972 0.332
Store 1 -0.290 -0.100 -2.377 0.018
Store 2 0.149 0.055 1.293 0.197
Store 3 0.049 0.017 0.403 0.687
Store 4 0.366 0.130 3.057 0.002
Pleasure 0.826 0.639 15.200 0.000
Dominance 0.145 0.102 2.453 0.015
Arousal -0.022 -0.017 -0.381 0.703
Arousal Squared -0.050 -0.050 -1.429 0.154
Note: N = 429, R-squared = .518, significant values are in bold-faced.
128
Finally, the entire conceptual model is tested simultaneously using a structural equation
model on LISREL 8.51. This analysis accounts for measurement error and neatly summarizes the
findings. The structural error terms in the PSI matrix are allowed to correlate between the three
emotions (pleasure, arousal, and dominance) as they are likely related in ways that are not
completely explained by this model. Also, the indicators in the λ-y matrix with the highest
loading on the appropriate construct are fixed to one. Like the previous analyses, a beta path is
estimated between approach attitudes and store patronage intentions. Overall, the model shows
an acceptable fit to the data (χ2 (154) = 372.85, p < .01), the RMSEA is .06, the NNFI is 0.94, the
CFI is 0.95, and the standardized RMR is .05.
The structural results of the analysis are shown in Table 6.14. None of the manipulations
for salesperson presence, store familiarity, or retail density have a significant effect on any of the
three primary emotions, leading H1-H3 to be not supported. Pleasure has a significant positive
relationship with approach attitudes (H7a-c) and store patronage intentions (H7e), giving support
to these hypotheses. Arousal does not have a significant effect on approach attitudes (H8a-c) or
store patronage intentions (H8e). Thus, H8a-c and H8e are not supported. Dominance does have
a positive significant effect on approach attitudes (H9a-c), but not on store patronage intentions
(H9e). Thus, H9a-c is supported, but H9e is not.
A number of significant effects exist in the model other than those that are specifically
hypothesized. A positive relationship between approach attitudes and store patronage intentions
is significant, as is consistent with Fishbein and Ajzen‟s (1975) theory of reasoned action. The
effects of the two factors and three primary emotions on the individual constructs that are
indicators of approach attitudes are given to illustrate that the same pattern of results holds for

129
the higher-order construct and its indicators. Both pleasure and dominance have a significant
effect on store image, expected service quality, and attitude to the salesperson.
Table 6.14 Structural Results for Pilot Test Two
Hypothesized Effects
Unstd.
Coeff.
Std.
Coeff. t p
H1a Salesperson Presence Pleasure -0.07 -0.08 -1.55 0.121
H1b Salesperson Presence Arousal -0.08 -0.09 -1.80 0.072
H1c Salesperson Presence Dominance 0.01 0.01 0.23 0.818
H2a Store Familiarity Pleasure 0.07 0.07 1.49 0.136
H2b Store Familiarity Arousal 0.06 0.07 1.27 0.204
H2c Store Familiarity Dominance 0.04 0.05 1.05 0.294
H3a Retail Density Pleasure -0.06 -0.07 -1.42 0.156
H3b Retail Density Arousal -0.06 -0.07 -1.28 0.201
H3c Retail Density Dominance 0.02 0.03 0.51 0.610
H7a-c Pleasure Approach Attitudes 0.56 0.65 9.79 0.000
H7e Pleasure Store Patronage Intentions 0.58 0.54 7.44 0.000
H8a-c Arousal Approach Attitudes 0.05 0.06 0.85 0.395
H8e Arousal Store Patronage Intentions -0.06 -0.05 -0.93 0.352
H9a-c Dominance Approach Attitudes 0.10 0.13 2.07 0.038
H9e Dominance Store Patronage Intentions 0.12 0.08 1.60 0.110
Other Effects
Approach Attitudes Store Patronage Intentions 0.30 0.24 3.26 0.001
Salesperson Presence Approach Attitudes -0.04 -0.05 -1.41 0.159
Salesperson Presence Store Patronage Intentions -0.05 -0.05 -1.31 0.190
Store Familiarity Approach Attitudes 0.04 0.06 1.56 0.119
Store Familiarity Store Patronage Intentions 0.05 0.06 1.51 0.131
Retail Density Approach Attitudes -0.04 -0.05 -1.22 0.222
Retail Density Store Patronage Intentions -0.04 -0.04 -1.18 0.238
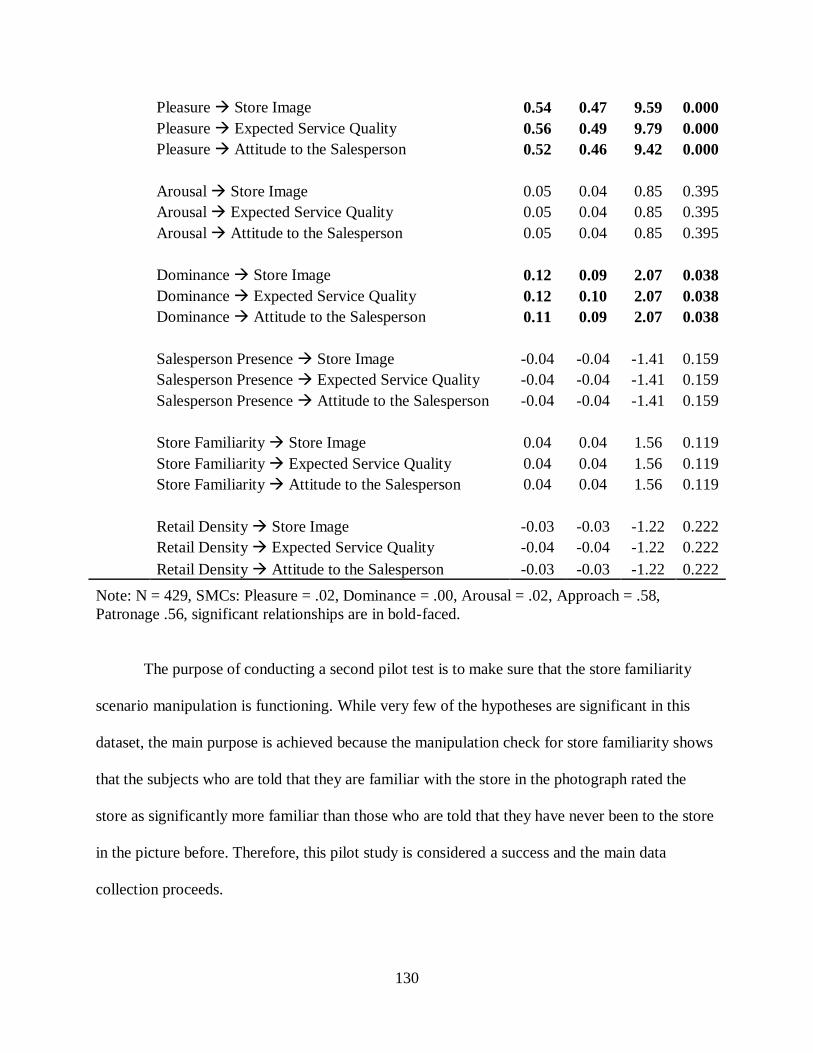
130
Pleasure Store Image 0.54 0.47 9.59 0.000
Pleasure Expected Service Quality 0.56 0.49 9.79 0.000
Pleasure Attitude to the Salesperson 0.52 0.46 9.42 0.000
Arousal Store Image 0.05 0.04 0.85 0.395
Arousal Expected Service Quality 0.05 0.04 0.85 0.395
Arousal Attitude to the Salesperson 0.05 0.04 0.85 0.395
Dominance Store Image 0.12 0.09 2.07 0.038
Dominance Expected Service Quality 0.12 0.10 2.07 0.038
Dominance Attitude to the Salesperson 0.11 0.09 2.07 0.038
Salesperson Presence Store Image -0.04 -0.04 -1.41 0.159
Salesperson Presence Expected Service Quality -0.04 -0.04 -1.41 0.159
Salesperson Presence Attitude to the Salesperson -0.04 -0.04 -1.41 0.159
Store Familiarity Store Image 0.04 0.04 1.56 0.119
Store Familiarity Expected Service Quality 0.04 0.04 1.56 0.119
Store Familiarity Attitude to the Salesperson 0.04 0.04 1.56 0.119
Retail Density Store Image -0.03 -0.03 -1.22 0.222
Retail Density Expected Service Quality -0.04 -0.04 -1.22 0.222
Retail Density Attitude to the Salesperson -0.03 -0.03 -1.22 0.222
Note: N = 429, SMCs: Pleasure = .02, Dominance = .00, Arousal = .02, Approach = .58,
Patronage .56, significant relationships are in bold-faced.
The purpose of conducting a second pilot test is to make sure that the store familiarity
scenario manipulation is functioning. While very few of the hypotheses are significant in this
dataset, the main purpose is achieved because the manipulation check for store familiarity shows
that the subjects who are told that they are familiar with the store in the photograph rated the
store as significantly more familiar than those who are told that they have never been to the store
in the picture before. Therefore, this pilot study is considered a success and the main data
collection proceeds.
131
Main Test Results
To collect additional data for the main test, subjects were recruited by using an online
survey panel, Opinionology (formerly Western Wats). The experimental instrument is still
hosted on Qualtrics, but Opinionology sends the URL to their panel members. Those who
participate are given an incentive through Opinionology‟s points rewards system.
After deleting incomplete responses and those in which the subject failed the demand
check, 811 usable responses remained from an initial pool of 820 subjects. Of these, 564 subjects
participated in experiment one and 265 subjects participated in experiment two. The instrument
for experiment one in pilot test two is identical to the instrument used for experiment one in the
panel dataset. Likewise, the instrument for experiment two in pilot test one and the instrument
for experiment two in the panel dataset are identical. The only real difference in the pilot test
datasets and the panel dataset is that the mean age is higher for the panel data, which is due to the
pilot data being collected through undergraduates. Therefore, age is included as a covariate and
the datasets are combined for the main analysis.
Using the combined datasets from the pilot tests and the Opinionology panel, experiment
one has a total of 975 subjects and experiment two has a total of 547 subjects. In both
experiments, close to half of the subjects are female (experiment 1: 48.4%; experiment 2:
56.7%). The mean age in years of the subjects is 35.95 and 34.23 for experiment one and two
respectively. In experiment one, the modal age is 21 years of age and the median is 26 years of
age. The modal age for experiment two is 20 years of age and the median is 25 years of age. In
both experiments, roughly 50% of the sample is over 25 years of age. The majority of the
subjects are Caucasian (experiment 1: 75.4%; experiment 2: 74.2%). African-Americans account
for 11.4% and 14.1% of the subjects in experiment one and two respectively. Each of the Native
132
American, Asian, Hispanic, and „Other‟ groups represent less than 6% of the sample each in
either experiment. Finally, 47.4% and 50.5% of the subjects in experiments one and two have
some experience working in the retail industry.
The subjects answered the measures that are given in Table 5.1. The particular storefront
and salesperson (if in the salesperson presence condition) that subjects saw was randomized in
order to mitigate any effect of a particular store or salesperson. As a check for the existence of an
effect due to either the particular salesperson or storefront, each is entered into a separate
MANOVA with the primary emotions, approach attitudes, and store patronage intentions as the
dependent variables for experiments one and two. For experiment one, using Wilks‟ Lambda as
the criterion, the salesperson did not have a significant omnibus effect (F(35, 4053) = 1.10, p = ns),
but the storefront did have a significant omnibus effect (F(20, 3025) = 5.36, p < .001). Examination
of the between-subjects effects for the storefront shows that the particular storefront has a
significant effect on pleasure (F(4, 970) = 7.22, p < .001), approach attitudes (F(4, 970) = 14.59, p <
.001), and store patronage intentions (F(4, 970) = 6.96, p < .001), but does not have a significant
effect on arousal or dominance. Similarly, for experiment two, using Wilks‟ Lambda as the
criterion, the salesperson did not have a significant omnibus effect (F(24, 1875) = 0.79, p = ns), but
the storefront did have a significant omnibus effect (F(16, 1647) = 2.38, p < .01). Examination of the
between-subjects effects for the storefront shows that the particular storefront has a significant
effect on approach attitudes (F(4, 542) = 3.05, p < .05), and store patronage intentions (F(4, 542) =
2.48, p < .05), but does not have a significant effect on pleasure, arousal, or dominance.
Therefore, dummy variables for the storefronts are created and used as covariates in both
experiment one and two.
133
Similar to the two pilot tests, gender match and race match are investigated as possible
covariates. The gender and race combinations of the retail salesperson model and the subject are
used to form either a matched or unmatched designation for each pair and entered into a separate
MANOVA with the primary emotions, approach attitudes, and store patronage intentions as the
dependent variables. For experiment one, using Wilks‟ Lambda as the criterion, neither gender
match (F(10, 1936) = 1.55, p = ns) nor race match (F(5, 472) = .896, p = ns) has a significant omnibus
effect. For experiment two, using Wilks‟ Lambda as the criterion, neither gender match (F(8, 1082)
= .447, p = ns) nor race match (F(4, 259) = .684, p = ns) has a significant omnibus effect.
Therefore, gender match and race match are not issues in this dataset for experiment one or
experiment two.
Experiment One
Three factors are manipulated in experiment one: salesperson presence, store familiarity,
and retail density. The first part of the model includes paths from these stimuli to the three
primary emotional mediators (pleasure, arousal, and dominance). The second part of the model
includes paths from these three variables to the dependent approach variables. As in the pilot
tests, the approach attitude variables are combined into one overall construct, with the exception
of attitude toward the store. Although attitude toward the store exhibits the same pattern of
results as the other reflective indicators of approach attitude, it is dropped from the analyses in
order to maintain acceptable discriminant validity. Store patronage intentions remains as a
separate dependent variable because it is a behavioral intention rather than an attitude.
Several checks of the data are performed prior to testing the hypotheses. In order to
determine whether the scenario manipulation for store familiarity is effective, the subjects
answer an item on whether the store in the scenario is familiar to them. Fortunately, an ANOVA
134
shows that this manipulation check passes (F(1,973)= 52.97, p < .001, Mfamiliar = 3.60, Mnovel =
3.13). Checks are also performed for the realism of the scenario and photograph, as well as how
common the scene in the photograph is to the subjects. One sample t-tests are used to compare
the means of these responses to the midpoint of the scale. The results show that the subjects find
the photograph to be realistic (t = 35.82, p < .001, 3.89/5.00), the scenario to be realistic (t =
31.23, p < .001, M = 3.78), and the scene to be common (t = 22.43, p < .001, M = 3.63/5.00).
Next, a confirmatory factor analysis using LISREL 8.51 is conducted in order to test the
measurement model to ensure that individual items load on their intended factors. Three of the
arousal items are dropped because their loadings and contribution to reliability are lower than the
other items. The path diagram is shown in Figure 6.4. Each of the items loads significantly on the
intended construct (t > 23.39). This analysis shows acceptable levels of fit for the hypothesized
eight-factor model (χ2 (145) = 608.51, p < .01), the RMSEA is .06, the NNFI is 0.95, the CFI is
0.96, and the standardized RMR is .04.
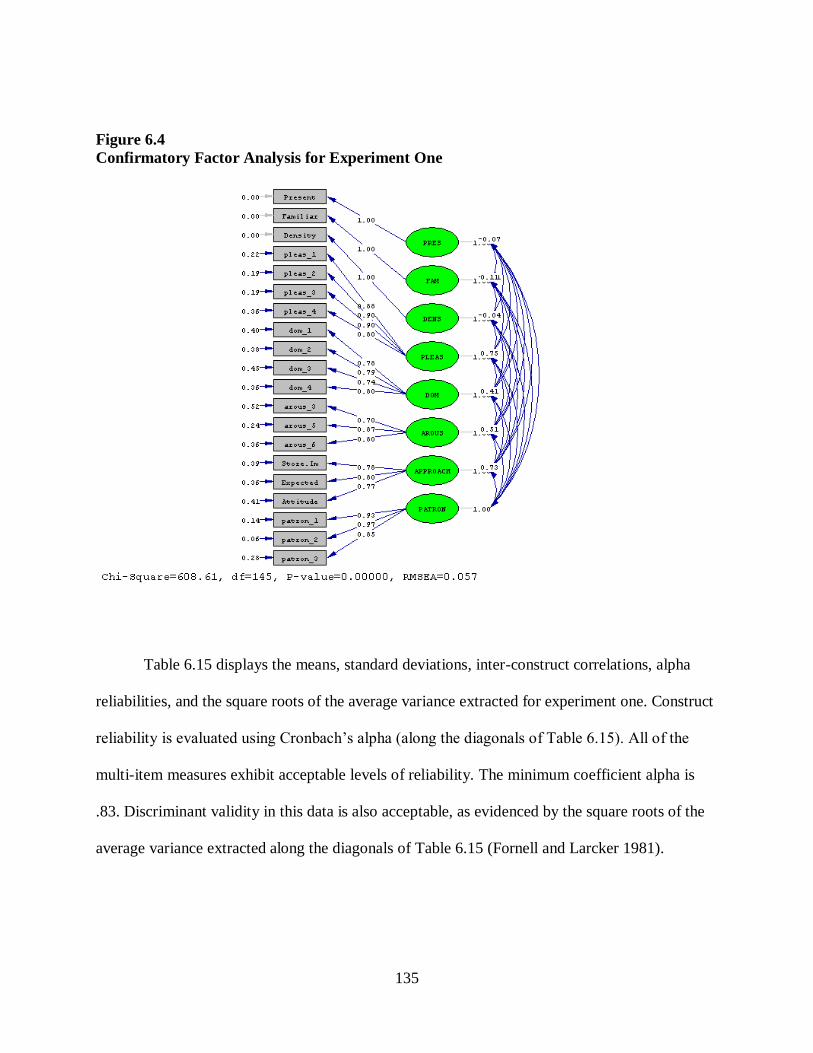
135
Figure 6.4
Confirmatory Factor Analysis for Experiment One
Table 6.15 displays the means, standard deviations, inter-construct correlations, alpha
reliabilities, and the square roots of the average variance extracted for experiment one. Construct
reliability is evaluated using Cronbach‟s alpha (along the diagonals of Table 6.15). All of the
multi-item measures exhibit acceptable levels of reliability. The minimum coefficient alpha is
.83. Discriminant validity in this data is also acceptable, as evidenced by the square roots of the
average variance extracted along the diagonals of Table 6.15 (Fornell and Larcker 1981).
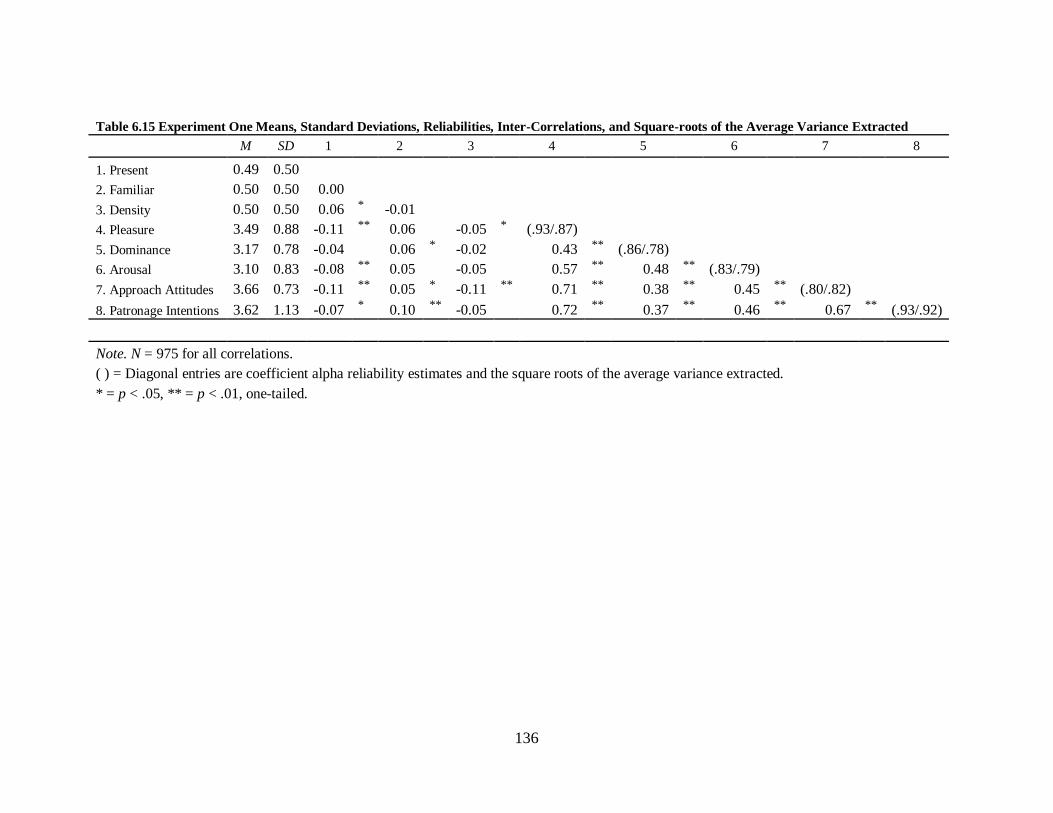
136
Table 6.15 Experiment One Means, Standard Deviations, Reliabilities, Inter-Correlations, and Square-roots of the Average Variance Extracted
M SD 1 2 3 4 5 6 7 8
1. Present 0.49 0.50
2. Familiar 0.50 0.50 0.00
3. Density 0.50 0.50 0.06 * -0.01
4. Pleasure 3.49 0.88 -0.11 ** 0.06 -0.05 * (.93/.87)
5. Dominance 3.17 0.78 -0.04 0.06 * -0.02 0.43 ** (.86/.78)
6. Arousal 3.10 0.83 -0.08 ** 0.05 -0.05 0.57 ** 0.48 ** (.83/.79)
7. Approach Attitudes 3.66 0.73 -0.11 ** 0.05 * -0.11 ** 0.71 ** 0.38 ** 0.45 ** (.80/.82)
8. Patronage Intentions 3.62 1.13 -0.07 * 0.10 ** -0.05 0.72 ** 0.37 ** 0.46 ** 0.67 ** (.93/.92)
Note. N = 975 for all correlations.
( ) = Diagonal entries are coefficient alpha reliability estimates and the square roots of the average variance extracted.
* = p < .05, ** = p < .01, one-tailed.

137
As previously mentioned, multiple methods are used to examine the hypotheses.
MANCOVA is used to test the first half of the conceptual model. Controlling for retail
experience, age, gender, and dummy variables for the particular storefront, this test examines the
effects of salesperson presence, store familiarity, retail density on the three primary emotions.
The omnibus effects are examined, using Wilks‟ Lambda as the criterion. Two covariates, store
one (F(3, 954) = 6.88, p < .001) and store four (F(3, 954) = 7.30, p < .001), and the manipulation for
salesperson presence (F(3, 954) = 3.88, p < .05) have significant omnibus effects. Store familiarity,
retail density, and the all of interactions do not have significant omnibus effects, making the
between-subjects effects for those variables uninterpretable and providing no support for H2, H3,
H4, H5, or H6.
Examination of the between-subjects effects for the covariates shows that store one has a
significant effect on pleasure (F(1, 956) = 10.95, p < .01), and store four has a significant effect on
pleasure (F(1, 956) = 9.19, p < .001). Salesperson presence has significant direct effects on pleasure
(F(1, 956) = 10.81, p < .01, Mpresent = 3.39, Mabsent = 3.58) and arousal (F(1, 956) = 5.55, p < .05,
Mpresent = 3.03, Mabsent = 3.16), but not for dominance. However, these effects are in the opposite
direction from the hypotheses that are grounded in approach-avoidance theory. So, Hypotheses
H1a-c are not supported. Please see Table 6.16 for the between subjects results.
Table 6.16 Main Test Experiment One Multivariate Analysis of Covariance Between-Subjects Effects
Source Dependent Variable df Mean Square F Significance
Intercept Pleasure 1 1050.192 1393.872 0.000
Intercept Arousal 1 917.032 1347.450 0.000
Intercept Dominance 1 978.717 1609.314 0.000
Retail Experience Pleasure 1 0.608 0.807 0.369
Retail Experience Arousal 1 3.689 5.420 0.020
Retail Experience Dominance 1 0.759 1.248 0.264

138
Age Pleasure 1 0.347 0.461 0.497
Age Arousal 1 0.802 1.178 0.278
Age Dominance 1 1.389 2.285 0.131
Gender Pleasure 1 2.305 3.059 0.081
Gender Arousal 1 0.950 1.396 0.238
Gender Dominance 1 0.267 0.439 0.508
Store 1 Pleasure 1 8.257 10.959 0.001
Store 1 Arousal 1 0.214 0.314 0.575
Store 1 Dominance 1 0.038 0.062 0.803
Store 2 Pleasure 1 0.182 0.241 0.623
Store 2 Arousal 1 0.882 1.296 0.255
Store 2 Dominance 1 0.206 0.339 0.560
Store 3 Pleasure 1 0.046 0.061 0.806
Store 3 Arousal 1 1.292 1.899 0.169
Store 3 Dominance 1 0.701 1.153 0.283
Store 4 Pleasure 1 6.923 9.189 0.003
Store 4 Arousal 1 0.642 0.943 0.332
Store 4 Dominance 1 1.554 2.556 0.110
Salesperson Presence Pleasure 1 8.148 10.815 0.001
Salesperson Presence Arousal 1 3.776 5.549 0.019
Salesperson Presence Dominance 1 0.580 0.954 0.329
Store Familiarity Pleasure 1 2.246 2.982 0.085
Store Familiarity Arousal 1 2.197 3.229 0.073
Store Familiarity Dominance 1 1.626 2.674 0.102
Retail Density Pleasure 1 1.605 2.130 0.145
Retail Density Arousal 1 1.407 2.067 0.151
Retail Density Dominance 1 0.182 0.299 0.585
Salesperson Presence X Store Familiarity Pleasure 1 0.005 0.006 0.937
Salesperson Presence X Store Familiarity Arousal 1 0.379 0.557 0.455
Salesperson Presence X Store Familiarity Dominance 1 0.001 0.002 0.966
Salesperson Presence X Retail Density Pleasure 1 0.606 0.805 0.370
Salesperson Presence X Retail Density Arousal 1 1.600 2.351 0.126
Salesperson Presence X Retail Density Dominance 1 0.088 0.144 0.705
Store Familiarity X Retail Density Pleasure 1 0.135 0.180 0.672
Store Familiarity X Retail Density Arousal 1 0.055 0.080 0.777
Store Familiarity X Retail Density Dominance 1 0.120 0.197 0.657
Three-way interaction Pleasure 1 0.099 0.132 0.716
Three-way interaction Arousal 1 0.361 0.531 0.467
Three-way interaction Dominance 1 0.017 0.028 0.868
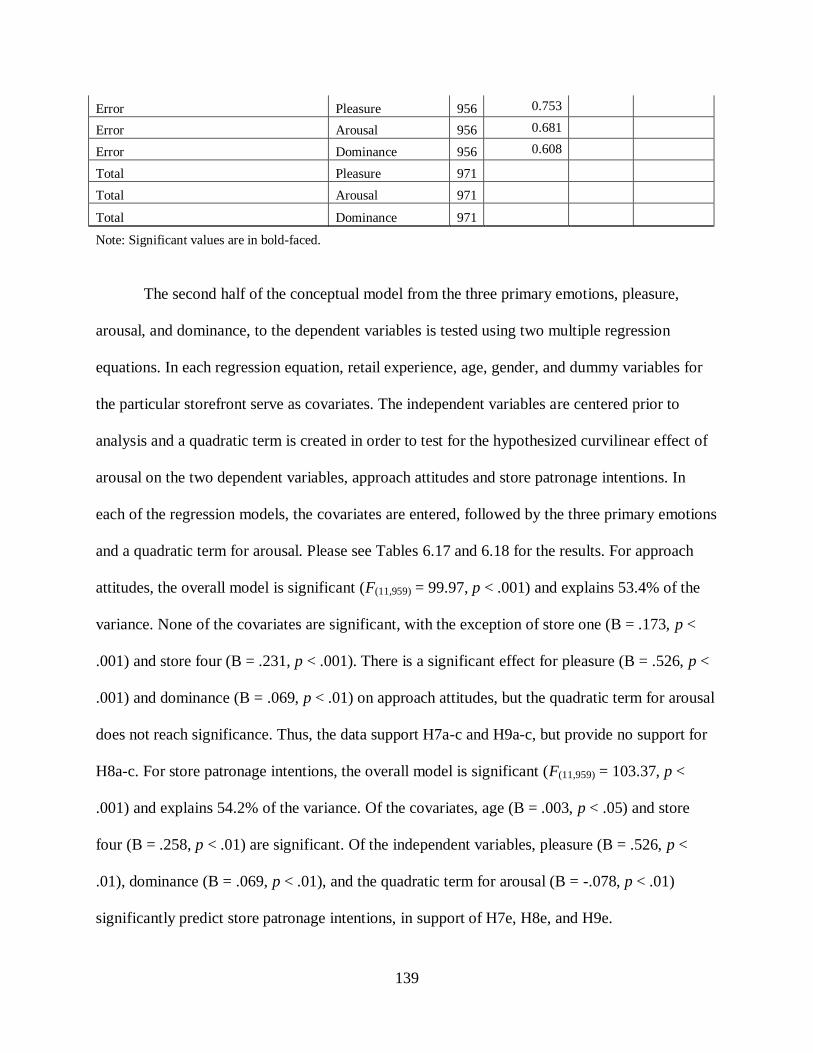
139
Error Pleasure 956 0.753
Error Arousal 956 0.681
Error Dominance 956 0.608
Total Pleasure 971
Total Arousal 971
Total Dominance 971
Note: Significant values are in bold-faced.
The second half of the conceptual model from the three primary emotions, pleasure,
arousal, and dominance, to the dependent variables is tested using two multiple regression
equations. In each regression equation, retail experience, age, gender, and dummy variables for
the particular storefront serve as covariates. The independent variables are centered prior to
analysis and a quadratic term is created in order to test for the hypothesized curvilinear effect of
arousal on the two dependent variables, approach attitudes and store patronage intentions. In
each of the regression models, the covariates are entered, followed by the three primary emotions
and a quadratic term for arousal. Please see Tables 6.17 and 6.18 for the results. For approach
attitudes, the overall model is significant (F(11,959) = 99.97, p < .001) and explains 53.4% of the
variance. None of the covariates are significant, with the exception of store one (B = .173, p <
.001) and store four (B = .231, p < .001). There is a significant effect for pleasure (B = .526, p <
.001) and dominance (B = .069, p < .01) on approach attitudes, but the quadratic term for arousal
does not reach significance. Thus, the data support H7a-c and H9a-c, but provide no support for
H8a-c. For store patronage intentions, the overall model is significant (F(11,959) = 103.37, p <
.001) and explains 54.2% of the variance. Of the covariates, age (B = .003, p < .05) and store
four (B = .258, p < .01) are significant. Of the independent variables, pleasure (B = .526, p <
.01), dominance (B = .069, p < .01), and the quadratic term for arousal (B = -.078, p < .01)
significantly predict store patronage intentions, in support of H7e, H8e, and H9e.
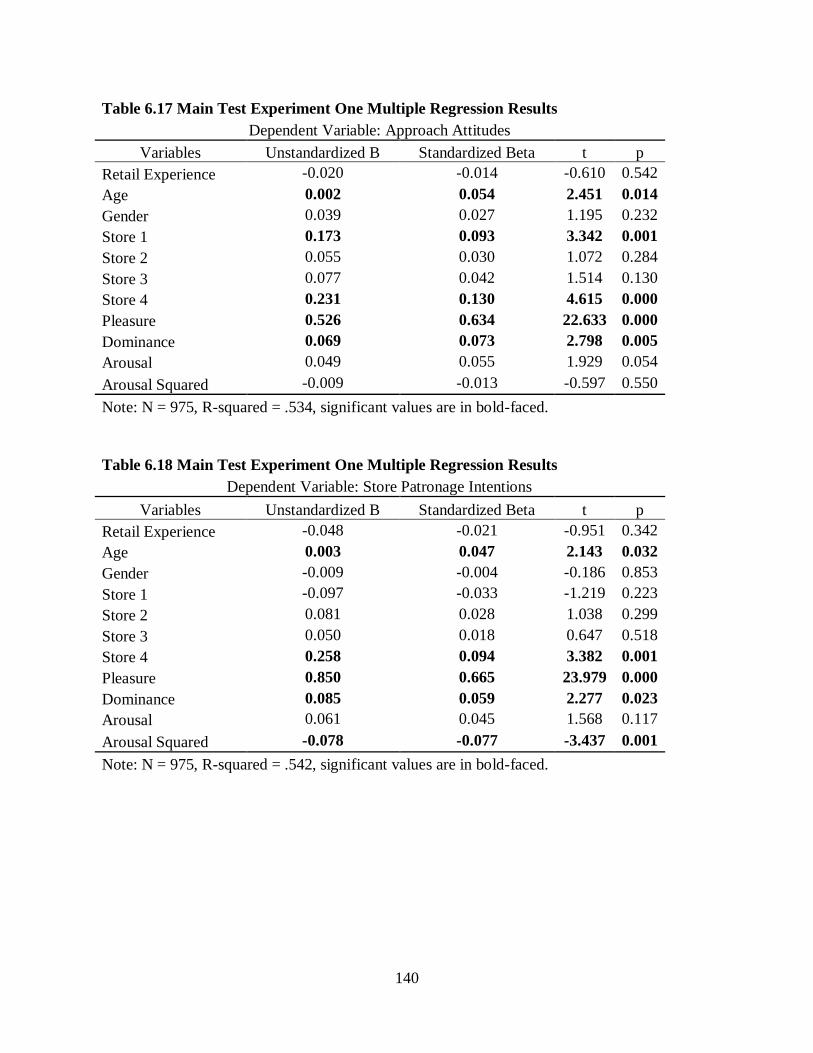
140
Table 6.17 Main Test Experiment One Multiple Regression Results
Dependent Variable: Approach Attitudes
Variables Unstandardized B Standardized Beta t p
Retail Experience -0.020 -0.014 -0.610 0.542
Age 0.002 0.054 2.451 0.014
Gender 0.039 0.027 1.195 0.232
Store 1 0.173 0.093 3.342 0.001
Store 2 0.055 0.030 1.072 0.284
Store 3 0.077 0.042 1.514 0.130
Store 4 0.231 0.130 4.615 0.000
Pleasure 0.526 0.634 22.633 0.000
Dominance 0.069 0.073 2.798 0.005
Arousal 0.049 0.055 1.929 0.054
Arousal Squared -0.009 -0.013 -0.597 0.550
Note: N = 975, R-squared = .534, significant values are in bold-faced.
Table 6.18 Main Test Experiment One Multiple Regression Results
Dependent Variable: Store Patronage Intentions
Variables Unstandardized B Standardized Beta t p
Retail Experience -0.048 -0.021 -0.951 0.342
Age 0.003 0.047 2.143 0.032
Gender -0.009 -0.004 -0.186 0.853
Store 1 -0.097 -0.033 -1.219 0.223
Store 2 0.081 0.028 1.038 0.299
Store 3 0.050 0.018 0.647 0.518
Store 4 0.258 0.094 3.382 0.001
Pleasure 0.850 0.665 23.979 0.000
Dominance 0.085 0.059 2.277 0.023
Arousal 0.061 0.045 1.568 0.117
Arousal Squared -0.078 -0.077 -3.437 0.001
Note: N = 975, R-squared = .542, significant values are in bold-faced.

141
Finally, the entire conceptual model is tested simultaneously using a structural equation
model on LISREL 8.51. This analysis accounts for measurement error and neatly summarizes the
findings. The structural error terms in the PSI matrix are allowed to correlate between the three
emotions (pleasure, arousal, and dominance) as they are likely related in ways that are not
completely explained by this model. Also, the indicators in the λ-y matrix with the highest
loading on the appropriate construct are fixed to one. In addition, a beta path is estimated
between approach attitudes and store patronage intentions. This relationship between attitudes
and behavioral intentions is consistent with Fishbein and Ajzen‟s (1975) theory of reasoned
action. Overall, the model shows an acceptable fit to the data (χ2 (154) = 625.51, p < .01), the
RMSEA is .06, the NNFI is 0.95, the CFI is 0.96, and the standardized RMR is .04.
The structural results of the analysis are shown in Table 6.19. Salesperson presence has a
significant negative effect on pleasure (H1a) and arousal (H1b), but does not have a significant
effect on dominance (H1c). Because the direction of the results is contrary to approach-
avoidance theory and the corresponding hypotheses, H1a-c is not supported. Store familiarity has
a significant positive effect on pleasure (H2a), but not arousal and dominance (H2b-c).
Therefore, this model supports H2a, but does not support H2b or H2c. Retail density does not
have a significant effect on pleasure (H3a), arousal (H3b), or dominance (H3c). Thus, H3a-c are
not supported. Pleasure has a significant positive relationship with approach attitudes (H7a-c)
and store patronage intentions (H7e), giving support to these hypotheses. The effects of arousal
on approach attitudes (H8a-c) and store patronage intentions (H8e) are not significant.
Dominance has a significant positive effect on approach attitudes (H9a-c), but not store
patronage intentions (H9e). Thus, H9a-c are supported, but H9e is not supported.
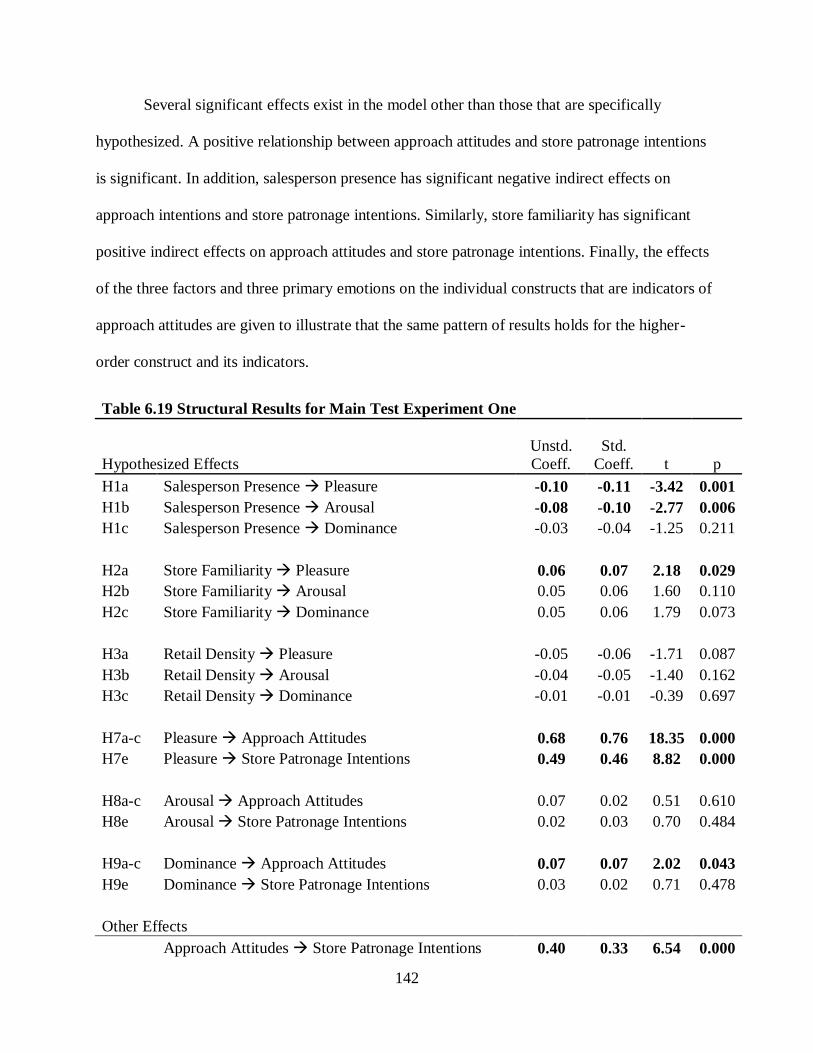
142
Several significant effects exist in the model other than those that are specifically
hypothesized. A positive relationship between approach attitudes and store patronage intentions
is significant. In addition, salesperson presence has significant negative indirect effects on
approach intentions and store patronage intentions. Similarly, store familiarity has significant
positive indirect effects on approach attitudes and store patronage intentions. Finally, the effects
of the three factors and three primary emotions on the individual constructs that are indicators of
approach attitudes are given to illustrate that the same pattern of results holds for the higher-
order construct and its indicators.
Table 6.19 Structural Results for Main Test Experiment One
Hypothesized Effects
Unstd.
Coeff.
Std.
Coeff. t p
H1a Salesperson Presence Pleasure -0.10 -0.11 -3.42 0.001
H1b Salesperson Presence Arousal -0.08 -0.10 -2.77 0.006
H1c Salesperson Presence Dominance -0.03 -0.04 -1.25 0.211
H2a Store Familiarity Pleasure 0.06 0.07 2.18 0.029
H2b Store Familiarity Arousal 0.05 0.06 1.60 0.110
H2c Store Familiarity Dominance 0.05 0.06 1.79 0.073
H3a Retail Density Pleasure -0.05 -0.06 -1.71 0.087
H3b Retail Density Arousal -0.04 -0.05 -1.40 0.162
H3c Retail Density Dominance -0.01 -0.01 -0.39 0.697
H7a-c Pleasure Approach Attitudes 0.68 0.76 18.35 0.000
H7e Pleasure Store Patronage Intentions 0.49 0.46 8.82 0.000
H8a-c Arousal Approach Attitudes 0.07 0.02 0.51 0.610
H8e Arousal Store Patronage Intentions 0.02 0.03 0.70 0.484
H9a-c Dominance Approach Attitudes 0.07 0.07 2.02 0.043
H9e Dominance Store Patronage Intentions 0.03 0.02 0.71 0.478
Other Effects
Approach Attitudes Store Patronage Intentions 0.40 0.33 6.54 0.000
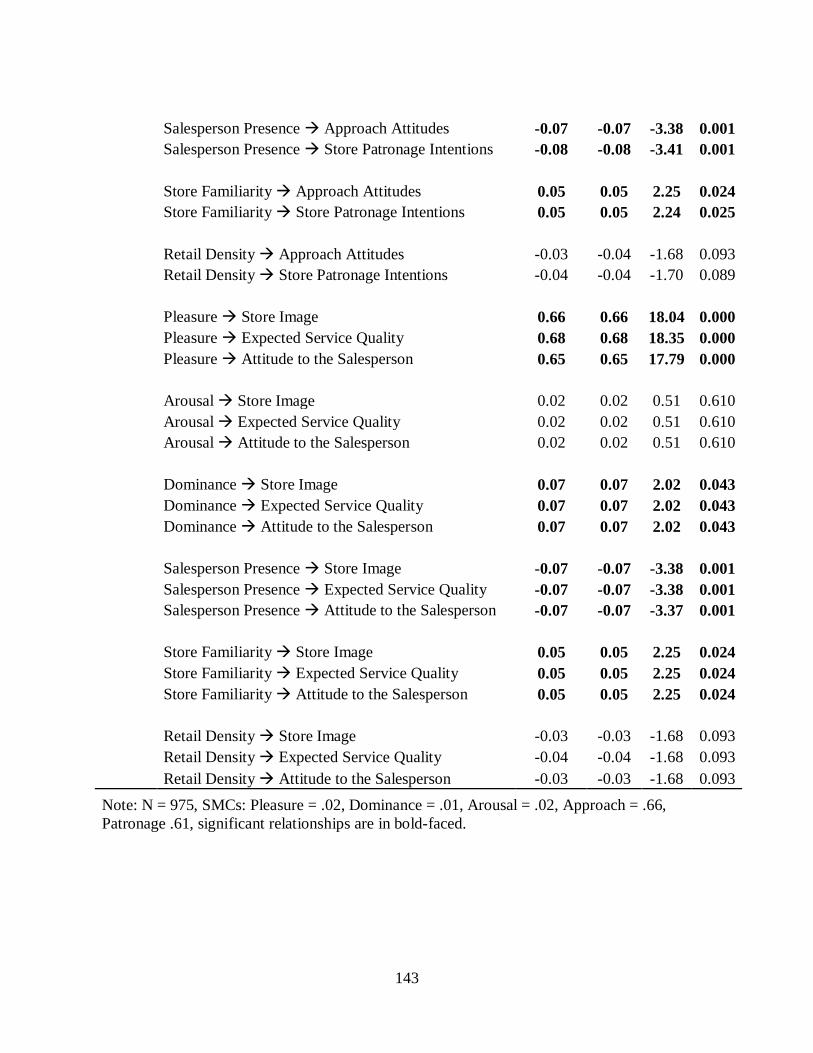
143
Salesperson Presence Approach Attitudes -0.07 -0.07 -3.38 0.001
Salesperson Presence Store Patronage Intentions -0.08 -0.08 -3.41 0.001
Store Familiarity Approach Attitudes 0.05 0.05 2.25 0.024
Store Familiarity Store Patronage Intentions 0.05 0.05 2.24 0.025
Retail Density Approach Attitudes -0.03 -0.04 -1.68 0.093
Retail Density Store Patronage Intentions -0.04 -0.04 -1.70 0.089
Pleasure Store Image 0.66 0.66 18.04 0.000
Pleasure Expected Service Quality 0.68 0.68 18.35 0.000
Pleasure Attitude to the Salesperson 0.65 0.65 17.79 0.000
Arousal Store Image 0.02 0.02 0.51 0.610
Arousal Expected Service Quality 0.02 0.02 0.51 0.610
Arousal Attitude to the Salesperson 0.02 0.02 0.51 0.610
Dominance Store Image 0.07 0.07 2.02 0.043
Dominance Expected Service Quality 0.07 0.07 2.02 0.043
Dominance Attitude to the Salesperson 0.07 0.07 2.02 0.043
Salesperson Presence Store Image -0.07 -0.07 -3.38 0.001
Salesperson Presence Expected Service Quality -0.07 -0.07 -3.38 0.001
Salesperson Presence Attitude to the Salesperson -0.07 -0.07 -3.37 0.001
Store Familiarity Store Image 0.05 0.05 2.25 0.024
Store Familiarity Expected Service Quality 0.05 0.05 2.25 0.024
Store Familiarity Attitude to the Salesperson 0.05 0.05 2.25 0.024
Retail Density Store Image -0.03 -0.03 -1.68 0.093
Retail Density Expected Service Quality -0.04 -0.04 -1.68 0.093
Retail Density Attitude to the Salesperson -0.03 -0.03 -1.68 0.093
Note: N = 975, SMCs: Pleasure = .02, Dominance = .01, Arousal = .02, Approach = .66,
Patronage .61, significant relationships are in bold-faced.
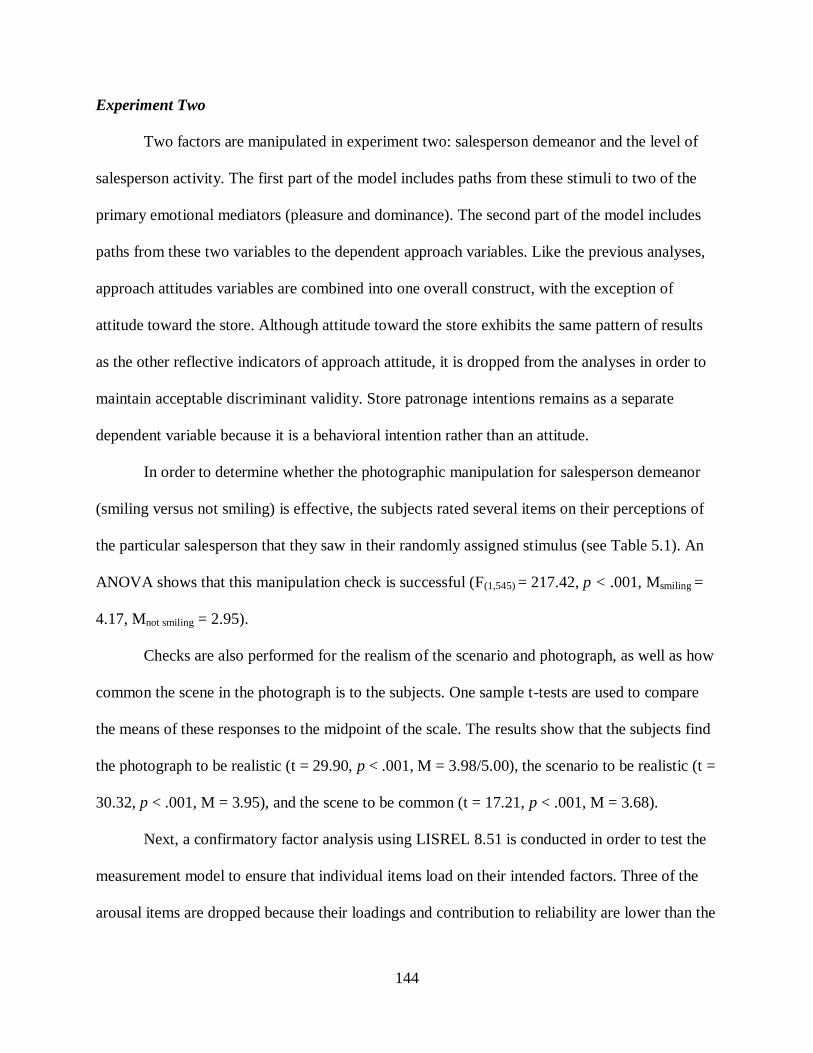
144
Experiment Two
Two factors are manipulated in experiment two: salesperson demeanor and the level of
salesperson activity. The first part of the model includes paths from these stimuli to two of the
primary emotional mediators (pleasure and dominance). The second part of the model includes
paths from these two variables to the dependent approach variables. Like the previous analyses,
approach attitudes variables are combined into one overall construct, with the exception of
attitude toward the store. Although attitude toward the store exhibits the same pattern of results
as the other reflective indicators of approach attitude, it is dropped from the analyses in order to
maintain acceptable discriminant validity. Store patronage intentions remains as a separate
dependent variable because it is a behavioral intention rather than an attitude.
In order to determine whether the photographic manipulation for salesperson demeanor
(smiling versus not smiling) is effective, the subjects rated several items on their perceptions of
the particular salesperson that they saw in their randomly assigned stimulus (see Table 5.1). An
ANOVA shows that this manipulation check is successful (F(1,545) = 217.42, p < .001, Msmiling =
4.17, Mnot smiling = 2.95).
Checks are also performed for the realism of the scenario and photograph, as well as how
common the scene in the photograph is to the subjects. One sample t-tests are used to compare
the means of these responses to the midpoint of the scale. The results show that the subjects find
the photograph to be realistic (t = 29.90, p < .001, M = 3.98/5.00), the scenario to be realistic (t =
30.32, p < .001, M = 3.95), and the scene to be common (t = 17.21, p < .001, M = 3.68).
Next, a confirmatory factor analysis using LISREL 8.51 is conducted in order to test the
measurement model to ensure that individual items load on their intended factors. Three of the
arousal items are dropped because their loadings and contribution to reliability are lower than the
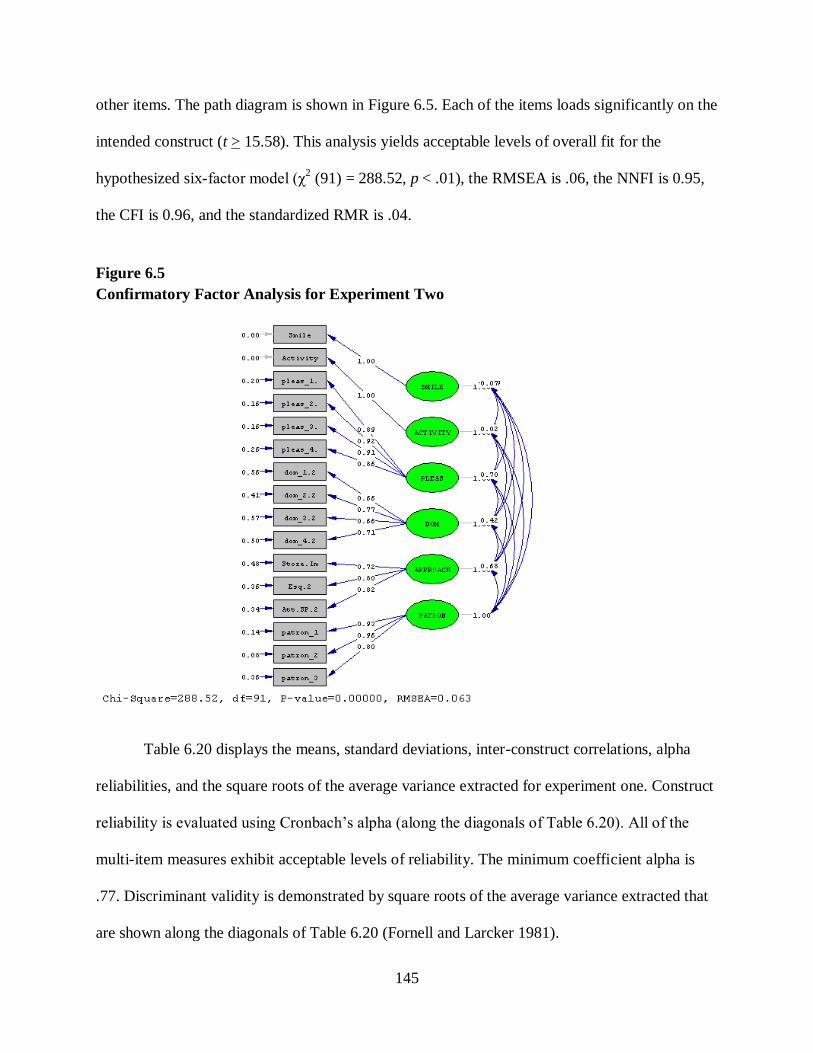
145
other items. The path diagram is shown in Figure 6.5. Each of the items loads significantly on the
intended construct (t > 15.58). This analysis yields acceptable levels of overall fit for the
hypothesized six-factor model (χ2 (91) = 288.52, p < .01), the RMSEA is .06, the NNFI is 0.95,
the CFI is 0.96, and the standardized RMR is .04.
Figure 6.5
Confirmatory Factor Analysis for Experiment Two
Table 6.20 displays the means, standard deviations, inter-construct correlations, alpha
reliabilities, and the square roots of the average variance extracted for experiment one. Construct
reliability is evaluated using Cronbach‟s alpha (along the diagonals of Table 6.20). All of the
multi-item measures exhibit acceptable levels of reliability. The minimum coefficient alpha is
.77. Discriminant validity is demonstrated by square roots of the average variance extracted that
are shown along the diagonals of Table 6.20 (Fornell and Larcker 1981).
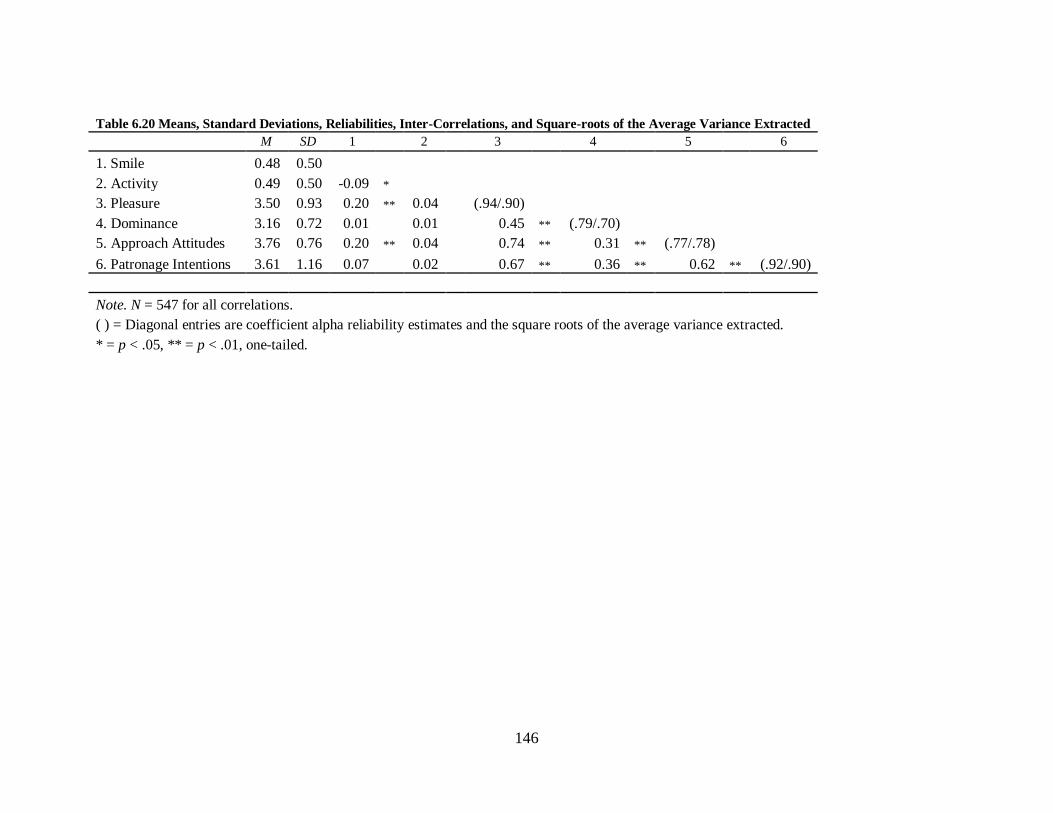
146
Table 6.20 Means, Standard Deviations, Reliabilities, Inter-Correlations, and Square-roots of the Average Variance Extracted
M SD 1 2 3 4 5 6
1. Smile 0.48 0.50 2. Activity 0.49 0.50 -0.09 *
3. Pleasure 3.50 0.93 0.20 ** 0.04
(.94/.90) 4. Dominance 3.16 0.72 0.01
0.01
0.45 ** (.79/.70) 5. Approach Attitudes 3.76 0.76 0.20 ** 0.04
0.74 ** 0.31 ** (.77/.78) 6. Patronage Intentions 3.61 1.16 0.07 0.02 0.67 ** 0.36 ** 0.62 ** (.92/.90)
Note. N = 547 for all correlations. ( ) = Diagonal entries are coefficient alpha reliability estimates and the square roots of the average variance extracted.
* = p < .05, ** = p < .01, one-tailed.

147
MANCOVA is used to test the first half of the conceptual model. Controlling for retail
experience, age, gender, and the particular storefront, this test examines the effects of
salesperson demeanor and salesperson activity on two of the primary emotions, pleasure and
dominance. First, the omnibus effects are examined, using Wilks‟ Lambda as the criterion. Of
the covariates, store one (F(2, 529) = 5.38, p < .01), store two (F(2, 529) = 3.45, p < .05), and store
four (F(2, 529) = 6.18, p < .01) have a significant omnibus effect. Also, the manipulation for
salesperson demeanor (F(2, 529) = 18.41, p < .001) and the interaction term for salesperson
demeanor and salesperson activity (F(2, 529) = 3.05, p < .01) are significant. Unfortunately, the
omnibus effects for salesperson activity are not significant, so H11a and H11b are not supported.
Please see Table 6.21 for the between-subjects effects. Examination of the between-
subjects effects shows that store one has a significant relationship with pleasure (F(1, 530) = 9.404,
p < .01), store two has a significant relationship with pleasure (F(2, 530) = 5.747, p < .05) and
dominance (F(2, 530) = 4.200, p < .05), and store four has a significant relationship with pleasure
(F(2, 530) = 12.639, p < .01). Of the independent variables, salesperson demeanor has a significant
effect on pleasure (F(1, 530) = 28.639, p < .001, Msmiling= 3.72, Mnot smiling = 3.29), giving support to
H10. The interaction between salesperson demeanor and salesperson activity has a significant
effect on dominance (F(2, 530) = 4.429, p < .05), but not for pleasure. Please see Figure 6.6 for a
graph of this interaction. While the interaction term is significant, the hypotheses predict an
ordinal interaction and the graph in Figure 6.6 shows that this interaction is unexpectedly
disordinal, which means that the two lines in the graph cross over one another. In other words,
salesperson demeanor has a positive relationship with the dominance for one level of salesperson
activity and a negative relationship with dominance for the other level of salesperson activity.
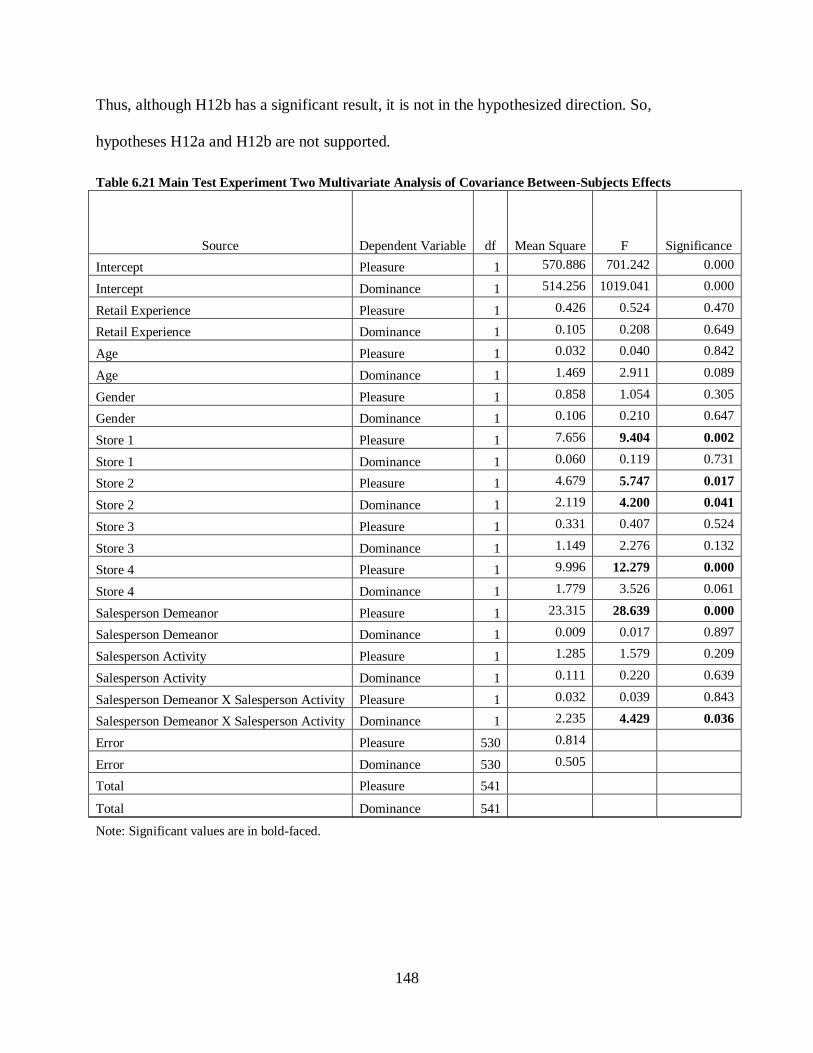
148
Thus, although H12b has a significant result, it is not in the hypothesized direction. So,
hypotheses H12a and H12b are not supported.
Table 6.21 Main Test Experiment Two Multivariate Analysis of Covariance Between-Subjects Effects
Source Dependent Variable df Mean Square F Significance
Intercept Pleasure 1 570.886 701.242 0.000
Intercept Dominance 1 514.256 1019.041 0.000
Retail Experience Pleasure 1 0.426 0.524 0.470
Retail Experience Dominance 1 0.105 0.208 0.649
Age Pleasure 1 0.032 0.040 0.842
Age Dominance 1 1.469 2.911 0.089
Gender Pleasure 1 0.858 1.054 0.305
Gender Dominance 1 0.106 0.210 0.647
Store 1 Pleasure 1 7.656 9.404 0.002
Store 1 Dominance 1 0.060 0.119 0.731
Store 2 Pleasure 1 4.679 5.747 0.017
Store 2 Dominance 1 2.119 4.200 0.041
Store 3 Pleasure 1 0.331 0.407 0.524
Store 3 Dominance 1 1.149 2.276 0.132
Store 4 Pleasure 1 9.996 12.279 0.000
Store 4 Dominance 1 1.779 3.526 0.061
Salesperson Demeanor Pleasure 1 23.315 28.639 0.000
Salesperson Demeanor Dominance 1 0.009 0.017 0.897
Salesperson Activity Pleasure 1 1.285 1.579 0.209
Salesperson Activity Dominance 1 0.111 0.220 0.639
Salesperson Demeanor X Salesperson Activity Pleasure 1 0.032 0.039 0.843
Salesperson Demeanor X Salesperson Activity Dominance 1 2.235 4.429 0.036
Error Pleasure 530 0.814
Error Dominance 530 0.505
Total Pleasure 541
Total Dominance 541
Note: Significant values are in bold-faced.
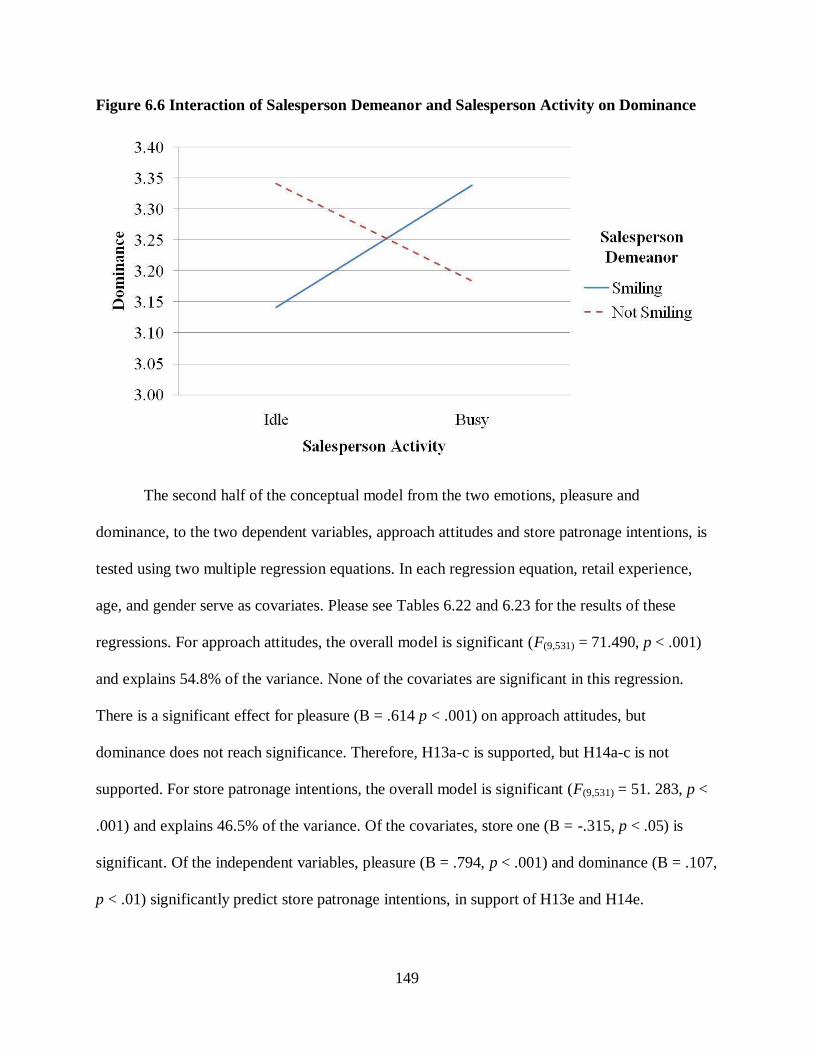
149
Figure 6.6 Interaction of Salesperson Demeanor and Salesperson Activity on Dominance
The second half of the conceptual model from the two emotions, pleasure and
dominance, to the two dependent variables, approach attitudes and store patronage intentions, is
tested using two multiple regression equations. In each regression equation, retail experience,
age, and gender serve as covariates. Please see Tables 6.22 and 6.23 for the results of these
regressions. For approach attitudes, the overall model is significant (F(9,531) = 71.490, p < .001)
and explains 54.8% of the variance. None of the covariates are significant in this regression.
There is a significant effect for pleasure (B = .614 p < .001) on approach attitudes, but
dominance does not reach significance. Therefore, H13a-c is supported, but H14a-c is not
supported. For store patronage intentions, the overall model is significant (F(9,531) = 51. 283, p <
.001) and explains 46.5% of the variance. Of the covariates, store one (B = -.315, p < .05) is
significant. Of the independent variables, pleasure (B = .794, p < .001) and dominance (B = .107,
p < .01) significantly predict store patronage intentions, in support of H13e and H14e.

150
Table 6.22 Main Test Experiment Two Multiple Regression Results
Dependent Variable: Approach Attitudes
Variables Unstandardized B Standardized Beta t p
Retail Experience -0.059 -0.038 -1.286 0.199
Age 0.000 0.003 0.110 0.913
Gender 0.001 0.001 0.023 0.982
Store 1 0.085 0.044 1.223 0.222
Store 2 0.019 0.010 0.266 0.790
Store 3 0.098 0.052 1.430 0.153
Store 4 0.050 0.026 0.705 0.481
Pleasure 0.614 0.747 22.710 0.000
Dominance -0.031 -0.029 -0.897 0.370
Note: N = 547, R-squared = .548, significant values are in bold-faced.
Table 6.23 Main Test Experiment Two Multiple Regression Results
Dependent Variable: Store Patronage Intentions
Variables Unstandardized B Standardized Beta t p
Retail Experience 0.064 0.014 0.426 0.670
Age -0.003 -0.053 -1.583 0.114
Gender -0.166 -0.065 -1.942 0.053
Store 1 -0.315 -0.094 -2.295 0.020
Store 2 -0.044 -0.010 -0.248 0.804
Store 3 -0.100 -0.040 -0.967 0.334
Store 4 0.002 0.025 0.596 0.551
Pleasure 0.794 0.582 15.892 0.000
Dominance 0.107 0.106 2.915 0.004
Note: N = 547, R-squared = .465, significant values are in bold-faced.
Finally, the entire conceptual model for experiment two is tested simultaneously using a
structural equation model on LISREL 8.51. This analysis accounts for measurement error and
neatly summarizes the findings. The structural error terms in the PSI matrix are allowed to
correlate between pleasure and dominance, as they are likely related in ways that are not
completely explained by this model. Also, the indicators in the λ-y matrix with the highest
loading on the appropriate construct are fixed to one. In addition, a beta path is estimated
151
between approach attitudes and store patronage intentions. Overall, the model shows an
acceptable fit to the data (χ2 (98) = 306.11, p < .01), the RMSEA is .06, the NNFI is 0.95, the
CFI is 0.96, and the standardized RMR is .04.
The structural results of the analysis are shown in Table 6.24. A positive salesperson
demeanor has a positive significant effect on pleasure, in support of H10. The salesperson‟s level
of activity did not have a significant effect on pleasure (H11a) or dominance (H11b). Therefore,
H11a and H11b are not supported. Pleasure has positive significant relationships with approach
attitudes (H13a-c) and store patronage intentions (H13e). Thus, H13a-c and H13e are supported.
Dominance has a positive significant relationship with store patronage intentions (H14e), but
does not have a significant relationship with approach attitudes (H14a-c). Therefore, H14e is
supported, but H14a-c is not supported.
Several significant effects exist in the model other than those that are specifically
hypothesized. A positive relationship between approach attitudes and store patronage intentions
is significant, as is consistent with Fishbein and Ajzen‟s (1975) theory of reasoned action. A
positive salesperson demeanor has a positive significant indirect effect on approach attitudes and
store patronage intention, but salesperson activity does not have a significant relationship with
either dependent variable. Finally, the effects of the two factors and two emotions on the
individual constructs that are indicators of approach attitudes are given to illustrate that the same
pattern of results holds for the higher-order construct and its indicators. Pleasure and a positive
salesperson demeanor have positive significant relationships, while dominance and salesperson
activity has no significant relationship with store image, expected service quality, and attitude to
the salesperson.
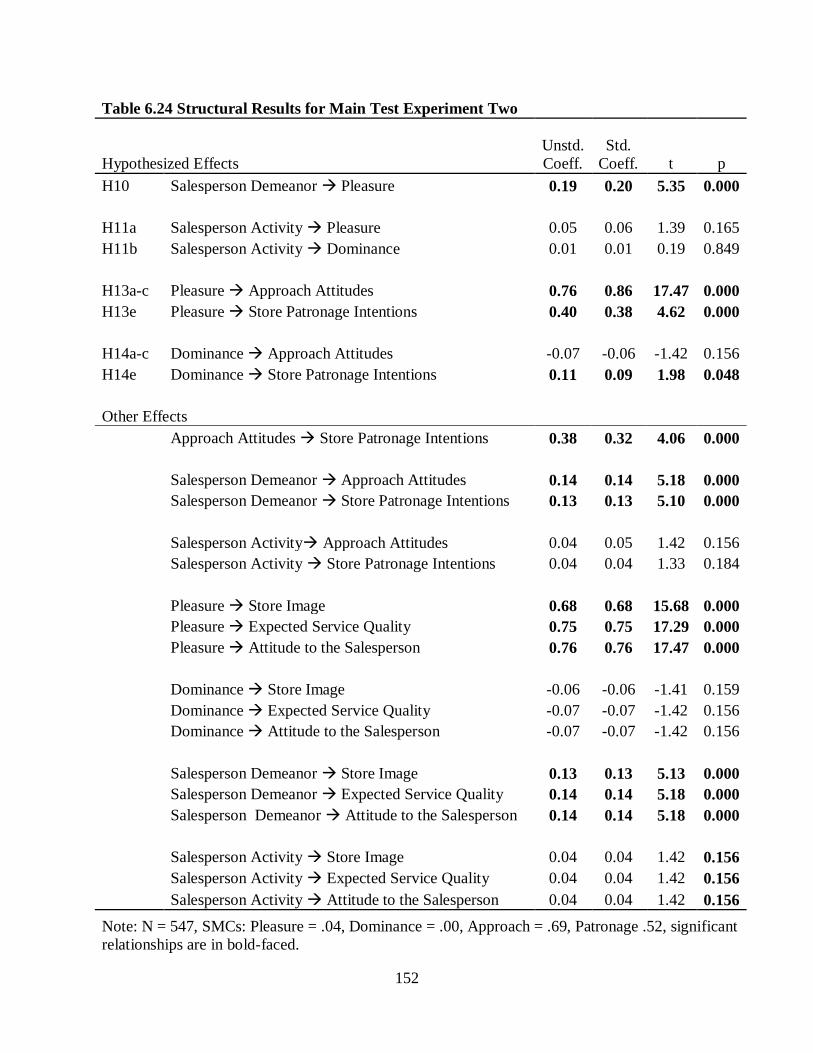
152
Table 6.24 Structural Results for Main Test Experiment Two
Hypothesized Effects
Unstd.
Coeff.
Std.
Coeff. t p
H10 Salesperson Demeanor Pleasure 0.19 0.20 5.35 0.000
H11a Salesperson Activity Pleasure 0.05 0.06 1.39 0.165
H11b Salesperson Activity Dominance 0.01 0.01 0.19 0.849
H13a-c Pleasure Approach Attitudes 0.76 0.86 17.47 0.000
H13e Pleasure Store Patronage Intentions 0.40 0.38 4.62 0.000
H14a-c Dominance Approach Attitudes -0.07 -0.06 -1.42 0.156
H14e Dominance Store Patronage Intentions 0.11 0.09 1.98 0.048
Other Effects
Approach Attitudes Store Patronage Intentions 0.38 0.32 4.06 0.000
Salesperson Demeanor Approach Attitudes 0.14 0.14 5.18 0.000
Salesperson Demeanor Store Patronage Intentions 0.13 0.13 5.10 0.000
Salesperson Activity Approach Attitudes 0.04 0.05 1.42 0.156
Salesperson Activity Store Patronage Intentions 0.04 0.04 1.33 0.184
Pleasure Store Image 0.68 0.68 15.68 0.000
Pleasure Expected Service Quality 0.75 0.75 17.29 0.000
Pleasure Attitude to the Salesperson 0.76 0.76 17.47 0.000
Dominance Store Image -0.06 -0.06 -1.41 0.159
Dominance Expected Service Quality -0.07 -0.07 -1.42 0.156
Dominance Attitude to the Salesperson -0.07 -0.07 -1.42 0.156
Salesperson Demeanor Store Image 0.13 0.13 5.13 0.000
Salesperson Demeanor Expected Service Quality 0.14 0.14 5.18 0.000
Salesperson Demeanor Attitude to the Salesperson 0.14 0.14 5.18 0.000
Salesperson Activity Store Image 0.04 0.04 1.42 0.156
Salesperson Activity Expected Service Quality 0.04 0.04 1.42 0.156
Salesperson Activity Attitude to the Salesperson 0.04 0.04 1.42 0.156
Note: N = 547, SMCs: Pleasure = .04, Dominance = .00, Approach = .69, Patronage .52, significant
relationships are in bold-faced.
153
In summary, through the use of various methods, each of the hypotheses is tested
multiple times throughout the two pilot tests and the main test. The pattern of results is largely
consistent. However, there are some small differences that could be explained in various ways.
Each of the models, whether it is MANCOVA, multiple regression, or structural equation model,
differs from the others in some way. The MANCOVA and multiple regression models include
several covariates, interaction terms, and sometimes a quadratic term, but require several
different models to examine the conceptual model. The structural equation models in LISREL do
not consider the covariates, interactions, or curvilinear effects, but they do account for
measurement error and allow for simultaneous examination of the first and second halves of the
conceptual model for each experiment. Advantages and drawbacks exist for each approach. For
ease of comprehension, please see Table 6.25 for a summary of the results from each of the tests.
154
Table 6.25 Summary of Multivariate and Lisrel Results for Pilot Test One, Pilot Test Two, and Main
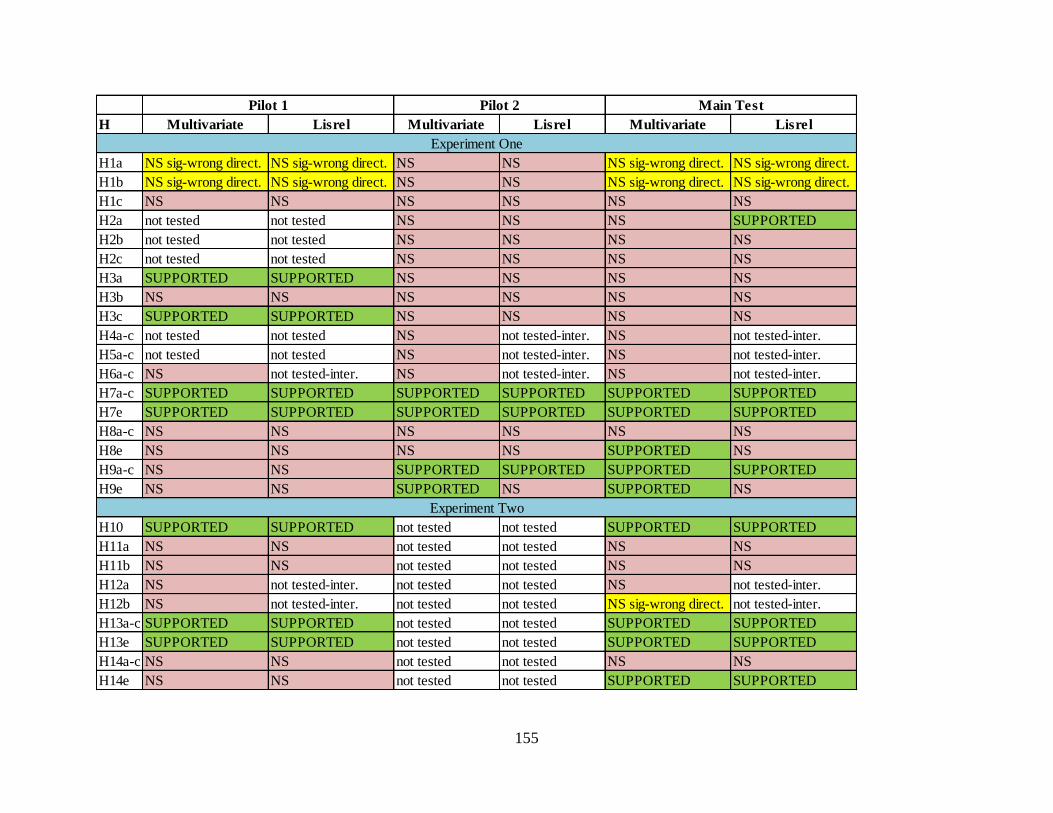
155
H Multivariate Lisrel Multivariate Lisrel Multivariate Lisrel
H1a NS sig-wrong direct. NS sig-wrong direct. NS NS NS sig-wrong direct. NS sig-wrong direct.
H1b NS sig-wrong direct. NS sig-wrong direct. NS NS NS sig-wrong direct. NS sig-wrong direct.
H1c NS NS NS NS NS NS
H2a not tested not tested NS NS NS SUPPORTED
H2b not tested not tested NS NS NS NS
H2c not tested not tested NS NS NS NS
H3a SUPPORTED SUPPORTED NS NS NS NS
H3b NS NS NS NS NS NS
H3c SUPPORTED SUPPORTED NS NS NS NS
H4a-c not tested not tested NS not tested-inter. NS not tested-inter.
H5a-c not tested not tested NS not tested-inter. NS not tested-inter.
H6a-c NS not tested-inter. NS not tested-inter. NS not tested-inter.
H7a-c SUPPORTED SUPPORTED SUPPORTED SUPPORTED SUPPORTED SUPPORTED
H7e SUPPORTED SUPPORTED SUPPORTED SUPPORTED SUPPORTED SUPPORTED
H8a-c NS NS NS NS NS NS
H8e NS NS NS NS SUPPORTED NS
H9a-c NS NS SUPPORTED SUPPORTED SUPPORTED SUPPORTED
H9e NS NS SUPPORTED NS SUPPORTED NS
H10 SUPPORTED SUPPORTED not tested not tested SUPPORTED SUPPORTED
H11a NS NS not tested not tested NS NS
H11b NS NS not tested not tested NS NS
H12a NS not tested-inter. not tested not tested NS not tested-inter.
H12b NS not tested-inter. not tested not tested NS sig-wrong direct. not tested-inter.
H13a-c SUPPORTED SUPPORTED not tested not tested SUPPORTED SUPPORTED
H13e SUPPORTED SUPPORTED not tested not tested SUPPORTED SUPPORTED
H14a-c NS NS not tested not tested NS NS
H14e NS NS not tested not tested SUPPORTED SUPPORTED
Main TestPilot 2Pilot 1
Experiment Two
Experiment One
156
CHAPTER VII
DISCUSSION OF FINDINGS, IMPLICATIONS, LIMITATIONS, AND FUTURE
RESEARCH
Introduction
The primary purpose of this chapter is to discuss the findings contained in Chapter VI.
The implications of these findings are then discussed from both academic and managerial
perspectives. Finally, limitations of the study are examined along with possible avenues for
future research.
Discussion of Findings of Experiment One
While several of the hypotheses are not supported, the results of experiment one still
provide some interesting and important information. The presence of a hailer, or retail
salesperson near the entrance of a retail store, is the central focus of this dissertation, as well as
the focal manipulation in experiment one. The results of the main test, as well as the results of
pilot test one, show that the presence of a retail salesperson near the entrance of a retail store has
a significantly negative effect on customers‟ pleasure and arousal. This finding is contrary to the
hypotheses that are based on approach-avoidance theory (Mehrabian and Russell 1974).
However, this negative effect of the hailer is not surprising considering the results of the
qualitative interviews. Many consumers have feelings of disdain toward these salespeople, often
likening them to vultures. Consistent with this negative finding, previous work by Hedrick et al.
(2004) find that customers who have more interaction with retail salespeople have lower ratings
of positive outcomes, such as patronage intentions. The result of hypothesis one is in contrast to

157
several instances of previous research in both the sales and atmospherics literature. For instance,
the previous work in salesperson availability suggests that when retail salespeople initiate contact
with customers, customers have the favorable response of increased value perceptions (Naylor
and Frank 2000). Also in contrast, Darian et al. (2001) find that customers have a more positive
response when salespeople immediately greet them upon entry than if the customers have to
search for the retail salesperson. But, these assertions assume that the customers actually want
assistance from a salesperson. Often, customers would rather be left alone to browse and shop on
their own. In terms of the atmospherics literature, this finding also contrasts the set of articles
which stem from the common dataset that includes a salesperson greeting the customer as part of
a larger prestige- image factor (Baker et al. 1992; Baker et al. 1994; Baker et al. 2002; Grewal et
al. 2003). These studies find a positive relationship between the prestige-image factor and
pleasure, arousal, and other positive outcomes. This set of studies substantially differs from the
current study because the customer has already made the decision to enter the store. Each of
these instances in the previous sales and atmospherics literature that contrast the results of
hypothesis one can be explained by differences in the situation. None of them specifically
examine customers‟ feelings or perceptions of when the retail salesperson is visibly waiting for
customers from the exterior of the storefront. In each of the related studies, the position of the
salesperson in relation to the entrance to the store is not as prominent as it is in the current work.
In fact, Ponder et al. (2006) and Darian et al. (2001) both concede that a potential drawback of
retail salesperson availability is that the salespeople could be perceived as aggressive or pushy.
The second manipulation in experiment one, store familiarity receives little to no support.
In the main test and pilot test two, the multivariate results do not provide support for any of the
related hypotheses, for store familiarity. Upon consideration, while the manipulation check for
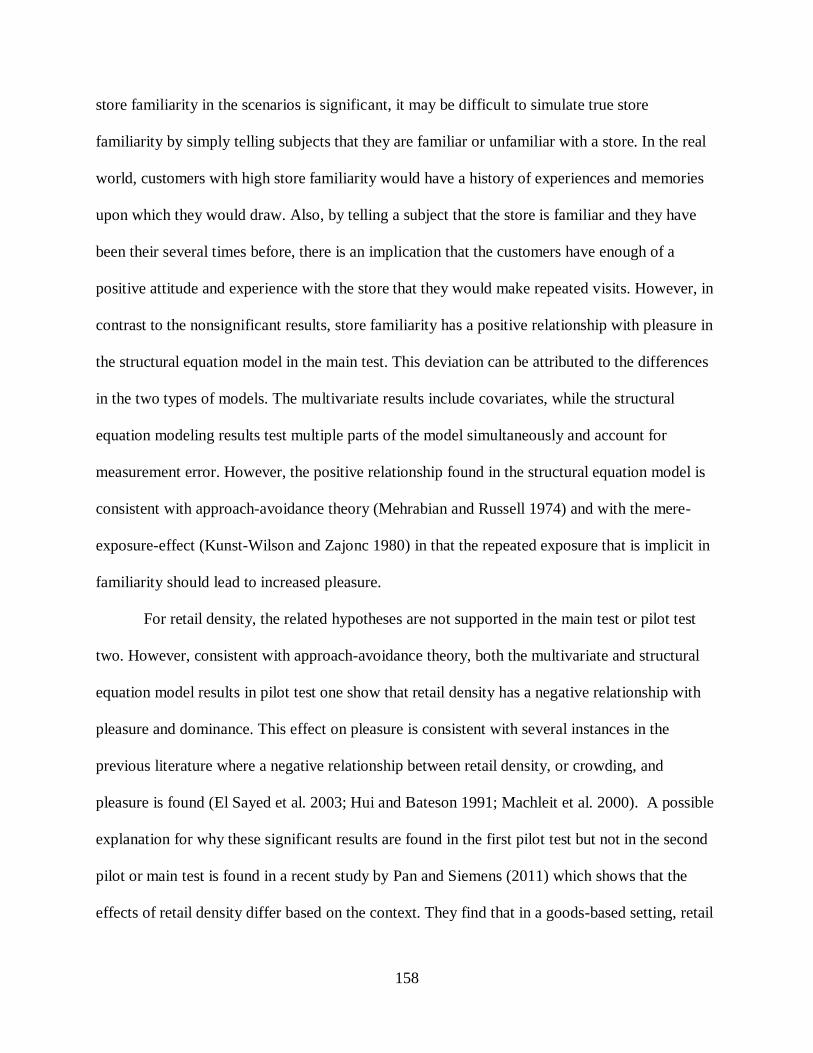
158
store familiarity in the scenarios is significant, it may be difficult to simulate true store
familiarity by simply telling subjects that they are familiar or unfamiliar with a store. In the real
world, customers with high store familiarity would have a history of experiences and memories
upon which they would draw. Also, by telling a subject that the store is familiar and they have
been their several times before, there is an implication that the customers have enough of a
positive attitude and experience with the store that they would make repeated visits. However, in
contrast to the nonsignificant results, store familiarity has a positive relationship with pleasure in
the structural equation model in the main test. This deviation can be attributed to the differences
in the two types of models. The multivariate results include covariates, while the structural
equation modeling results test multiple parts of the model simultaneously and account for
measurement error. However, the positive relationship found in the structural equation model is
consistent with approach-avoidance theory (Mehrabian and Russell 1974) and with the mere-
exposure-effect (Kunst-Wilson and Zajonc 1980) in that the repeated exposure that is implicit in
familiarity should lead to increased pleasure.
For retail density, the related hypotheses are not supported in the main test or pilot test
two. However, consistent with approach-avoidance theory, both the multivariate and structural
equation model results in pilot test one show that retail density has a negative relationship with
pleasure and dominance. This effect on pleasure is consistent with several instances in the
previous literature where a negative relationship between retail density, or crowding, and
pleasure is found (El Sayed et al. 2003; Hui and Bateson 1991; Machleit et al. 2000). A possible
explanation for why these significant results are found in the first pilot test but not in the second
pilot or main test is found in a recent study by Pan and Siemens (2011) which shows that the
effects of retail density differ based on the context. They find that in a goods-based setting, retail
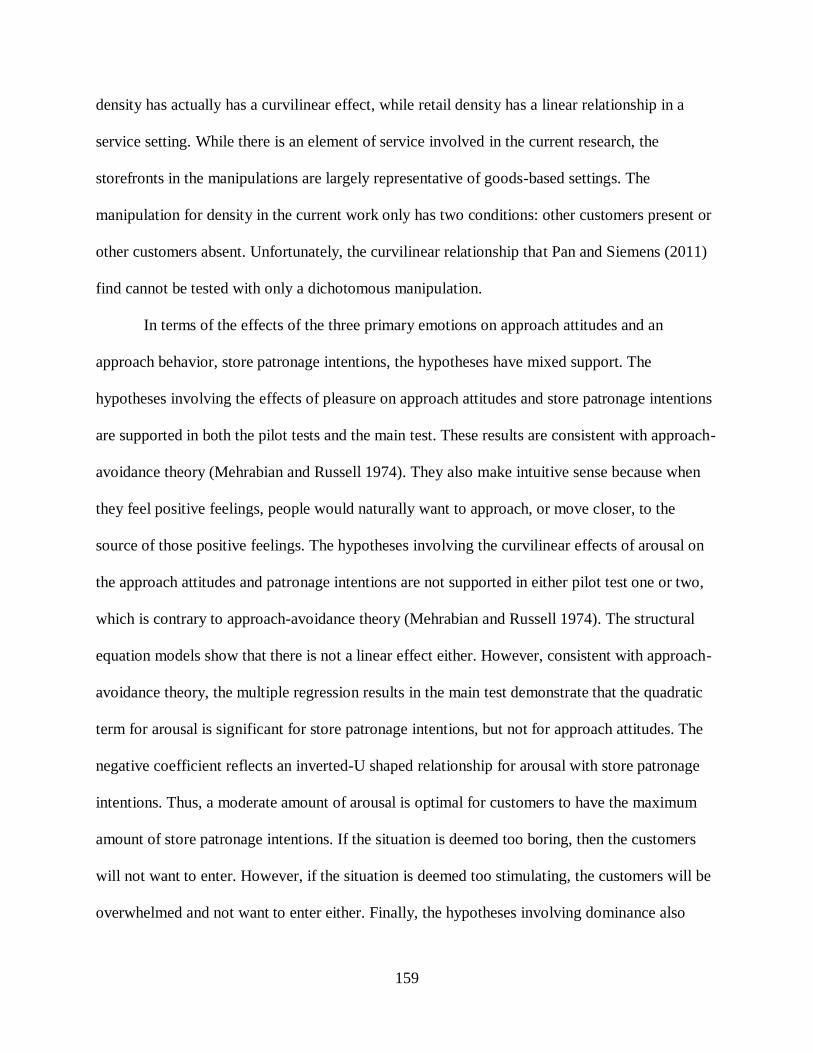
159
density has actually has a curvilinear effect, while retail density has a linear relationship in a
service setting. While there is an element of service involved in the current research, the
storefronts in the manipulations are largely representative of goods-based settings. The
manipulation for density in the current work only has two conditions: other customers present or
other customers absent. Unfortunately, the curvilinear relationship that Pan and Siemens (2011)
find cannot be tested with only a dichotomous manipulation.
In terms of the effects of the three primary emotions on approach attitudes and an
approach behavior, store patronage intentions, the hypotheses have mixed support. The
hypotheses involving the effects of pleasure on approach attitudes and store patronage intentions
are supported in both the pilot tests and the main test. These results are consistent with approach-
avoidance theory (Mehrabian and Russell 1974). They also make intuitive sense because when
they feel positive feelings, people would naturally want to approach, or move closer, to the
source of those positive feelings. The hypotheses involving the curvilinear effects of arousal on
the approach attitudes and patronage intentions are not supported in either pilot test one or two,
which is contrary to approach-avoidance theory (Mehrabian and Russell 1974). The structural
equation models show that there is not a linear effect either. However, consistent with approach-
avoidance theory, the multiple regression results in the main test demonstrate that the quadratic
term for arousal is significant for store patronage intentions, but not for approach attitudes. The
negative coefficient reflects an inverted-U shaped relationship for arousal with store patronage
intentions. Thus, a moderate amount of arousal is optimal for customers to have the maximum
amount of store patronage intentions. If the situation is deemed too boring, then the customers
will not want to enter. However, if the situation is deemed too stimulating, the customers will be
overwhelmed and not want to enter either. Finally, the hypotheses involving dominance also
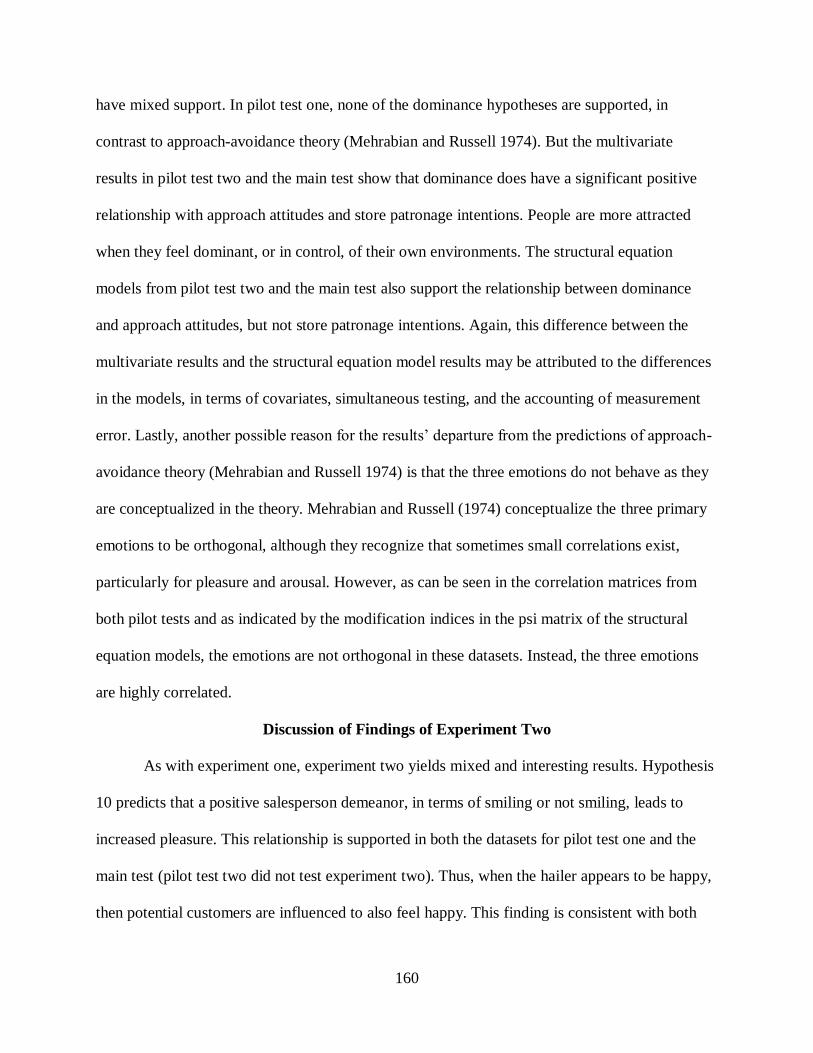
160
have mixed support. In pilot test one, none of the dominance hypotheses are supported, in
contrast to approach-avoidance theory (Mehrabian and Russell 1974). But the multivariate
results in pilot test two and the main test show that dominance does have a significant positive
relationship with approach attitudes and store patronage intentions. People are more attracted
when they feel dominant, or in control, of their own environments. The structural equation
models from pilot test two and the main test also support the relationship between dominance
and approach attitudes, but not store patronage intentions. Again, this difference between the
multivariate results and the structural equation model results may be attributed to the differences
in the models, in terms of covariates, simultaneous testing, and the accounting of measurement
error. Lastly, another possible reason for the results‟ departure from the predictions of approach-
avoidance theory (Mehrabian and Russell 1974) is that the three emotions do not behave as they
are conceptualized in the theory. Mehrabian and Russell (1974) conceptualize the three primary
emotions to be orthogonal, although they recognize that sometimes small correlations exist,
particularly for pleasure and arousal. However, as can be seen in the correlation matrices from
both pilot tests and as indicated by the modification indices in the psi matrix of the structural
equation models, the emotions are not orthogonal in these datasets. Instead, the three emotions
are highly correlated.
Discussion of Findings of Experiment Two
As with experiment one, experiment two yields mixed and interesting results. Hypothesis
10 predicts that a positive salesperson demeanor, in terms of smiling or not smiling, leads to
increased pleasure. This relationship is supported in both the datasets for pilot test one and the
main test (pilot test two did not test experiment two). Thus, when the hailer appears to be happy,
then potential customers are influenced to also feel happy. This finding is consistent with both

161
approach-avoidance theory (Mehrabian and Russell 1974) and emotional contagion theory
(Hatfield et al. 1994). This finding is also consistent with several instances of previous research.
For example, Hennig-Thurau et al. (2006) suggest that primitive emotional contagion (in the
form of smiling) is most pervasive in the early stages of service encounters, as is the case when
customers see a storefront with a retail salesperson near the entrance. These findings are also
consistent with the work of Pugh (2000), who finds a direct link between employees‟ displayed
emotions and customer affect, and Wang (2009), who shows that consumers‟ emotions are
influenced by the emotions that service employees display.
The other manipulation in experiment two is the retail salesperson‟s level of activity, in
terms of whether the retail salesperson is standing idly near the entrance of the store or
performing work-related activities such as straightening merchandise while near the entrance of
the store. Unfortunately, the salesperson‟s level of activity is not a significant predictor of
pleasure or dominance in either pilot test one or the main test. These findings are divergent from
the qualitative interviews and approach-avoidance theory (Mehrabian and Russell 1974). The
idea of keeping up another activity while physically near the entrance is an emergent theme from
the qualitative interviews. Several retail salespeople feel that if they are even superficially busy
with another task while they wait near the entrance of the store, then they are available to offer
assistance, but in a less intimidating way than if they were just standing idly. Approach-
avoidance theory suggests that by keeping busy, the hailer would give less feelings of forced
immediacy. These unsupported results suggest that some retail salespeople‟s tactic of keeping
their activity level up is ineffective in making a difference in consumers‟ feelings. When
consumers notice a retail salesperson near the entrance of a store they may imagine that the
salesperson will interact with them as soon as they enter the store. The fact that the salesperson
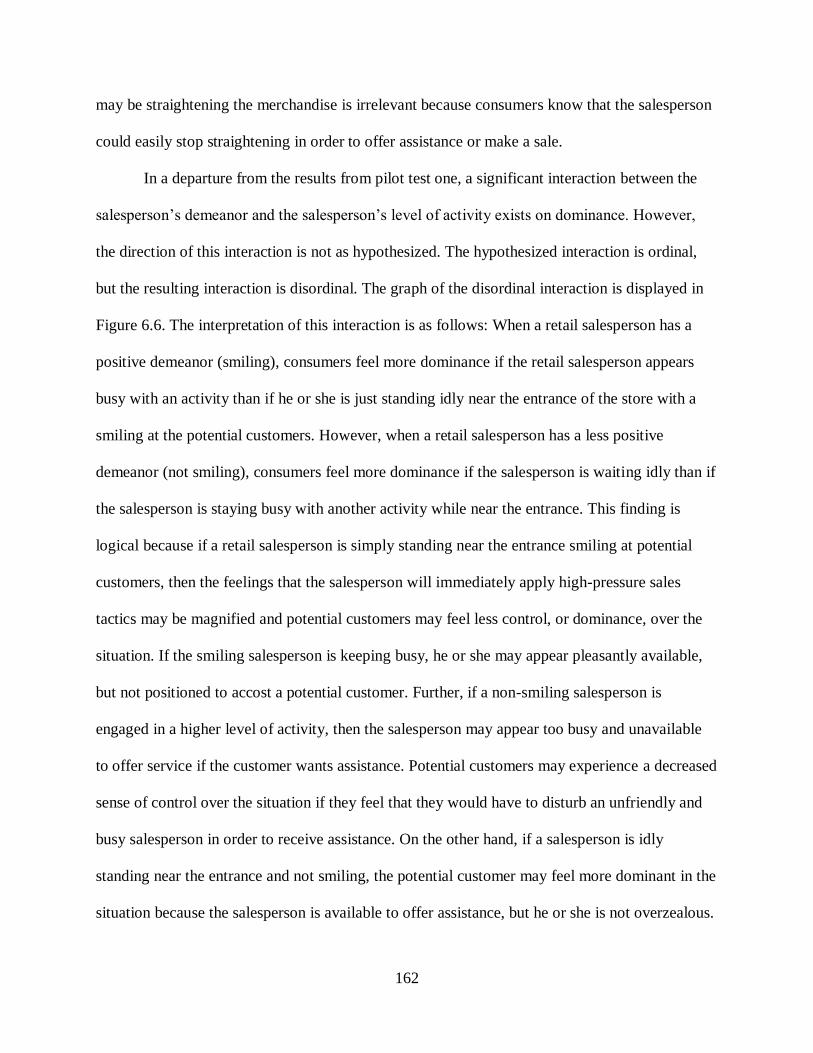
162
may be straightening the merchandise is irrelevant because consumers know that the salesperson
could easily stop straightening in order to offer assistance or make a sale.
In a departure from the results from pilot test one, a significant interaction between the
salesperson‟s demeanor and the salesperson‟s level of activity exists on dominance. However,
the direction of this interaction is not as hypothesized. The hypothesized interaction is ordinal,
but the resulting interaction is disordinal. The graph of the disordinal interaction is displayed in
Figure 6.6. The interpretation of this interaction is as follows: When a retail salesperson has a
positive demeanor (smiling), consumers feel more dominance if the retail salesperson appears
busy with an activity than if he or she is just standing idly near the entrance of the store with a
smiling at the potential customers. However, when a retail salesperson has a less positive
demeanor (not smiling), consumers feel more dominance if the salesperson is waiting idly than if
the salesperson is staying busy with another activity while near the entrance. This finding is
logical because if a retail salesperson is simply standing near the entrance smiling at potential
customers, then the feelings that the salesperson will immediately apply high-pressure sales
tactics may be magnified and potential customers may feel less control, or dominance, over the
situation. If the smiling salesperson is keeping busy, he or she may appear pleasantly available,
but not positioned to accost a potential customer. Further, if a non-smiling salesperson is
engaged in a higher level of activity, then the salesperson may appear too busy and unavailable
to offer service if the customer wants assistance. Potential customers may experience a decreased
sense of control over the situation if they feel that they would have to disturb an unfriendly and
busy salesperson in order to receive assistance. On the other hand, if a salesperson is idly
standing near the entrance and not smiling, the potential customer may feel more dominant in the
situation because the salesperson is available to offer assistance, but he or she is not overzealous.
163
The idle hailer who is not smiling may simply appear bored, just as many people might expect of
someone who stands near the entrance of a retail store for extended periods of time. Although
this particular disordinal interaction is not anticipated or hypothesized, precedents for
interactions of salespeople‟s emotional displays and other factors on customer reactions exist in
the literature. For example, Hennig-Thurau et al. (2006) find that the authenticity of the smile
serves as a boundary condition for the effect of employee smiling on customer reactions.
Sönderland and Rosengren (2010) find that smiling by service employees improves customer
satisfaction only under the condition that there is good technical service quality.
Finally, the hypotheses in experiment two that concern the primary emotions‟ effects on
pleasure and dominance in experiment two have mixed results. In terms of pleasure, in both pilot
test one and the main test, pleasure has a positive relationship with approach attitudes and
patronage intentions, just as predicted by approach-avoidance theory (Mehrabian and Russell
1974). These results are intuitively appealing because people are attracted by things that elicit
positive feelings. For dominance, the prediction that increased feelings of dominance will lead to
approach attitudes is not supported in either pilot test one or the main test, in contrast to
approach-avoidance theory. The hypothesis that dominance predicts store patronage intentions is
supported in the main test data, but not in the pilot test data. This result for the main test is
consistent with approach-avoidance theory (Mehrabian and Russell 1974). A possible
explanation for why the results from pilot test one and the main test differ is that the main test
has a much larger sample size than the pilot test, which provides more power to detect effects
that would otherwise not be significant in a smaller sample.
Academic Implications
This research has four academic contributions. First, the primary contribution of this
research is the examination of a largely overlooked retail strategy which builds upon existing
164
literature in the retail sales and atmospheric areas of research. A few studies incorporate some
aspects of the current research, but no prior work in retail sales or atmospherics literature
specifically examines retail salespeople standing near the entrance of stores. The practical dearth
of research on this topic is surprising, considering that both the qualitative and quantitative
results indicate that this is a fairly common practice, and the importance of retail salespeople is
widely recognized (Babin, Babin, and Boles 1999; Darian, Tucci, and Wiman 2001; Westbrook
1981). Since this research is the first to focus on this particular retail sales strategy of salespeople
standing near the entrance of retail stores, it lays the groundwork for future research in the area.
Second, this research elaborates on approach-avoidance theory (Mehrabian and Russell
1974) by adding to the list of environmental stimuli. By doing so, this work also expounds on
other retailing-specific or services-specific approach-avoidance conceptualizations and
taxonomies of retailing stimuli that are based on Mehrabian and Russell‟s (1974) original theory,
such as the work of Bitner (1992), Donovan and Rossiter (1981), Berman and Evans (1982), and
Turley and Milliman (2000).
A third academic contribution is the inclusion of dominance in experiment one and
experiment two. Ever since Donovan and Rossiter‟s (1982) early conclusion that dominance
does not have a substantial effect and that pleasure and arousal cover most situations in
marketing. Much of the previous work which uses approach-avoidance theory (Mehrabian and
Russell 1974) omits dominance. However, other researchers debate Donovan and Rossiter‟s
(1982) assertion (Biggers and Rankis 1983). This exclusion of dominance in much of the
previous research may have resulted in potentially meaningful findings being overlooked. By
incorporating dominance, this study contributes to the knowledge base on its causes and effects.
While most cases where dominance is the dependent variable in this research are not significant

165
as suggested would be the case by Donovan and Rossiter (1982), the one significant interaction
involves dominance as the outcome. Further, the results also give support to approach-avoidance
theory‟s prediction that dominance has a positive relationship with approach attitudes and
behaviors.
Fourth, this research answers several calls for further research in the previous retail sales
and atmospheric literature. Specifically, Sharma and Stafford (2000) call for research as to how
salesperson availability may be coordinated with other factors of the retail environment in order
to maximize persuasion. Similarly, in their study of salesperson characteristics and consumer
emotion, Lee and Dubinsky (2003) propose that the complicated nature of interpersonal
interaction and emotions in the consumption setting will remain a mystery unless it is considered
along with the physical environment of the retail store. Bitner (1992) also calls for research that
addresses the moderating effects of the environment on social interactions among customers and
employees. Finally, Tombs and McColl-Kennedy (2003) and Turley and Milliman (2000) make
calls for more research on the social, or human, dimension in the atmospherics literature. This
research answers these calls by examining how a salesperson who is immediately available at the
entrance of a retail store interacts with another atmospheric variable, retail density, and a
contextual factor, store familiarity, in order to produce effects on consumer emotions and several
customer responses (e.g. patronage intentions, attitudes) that are beneficial to the firm.
Managerial Implications
This research which focuses on hailers, or retail salespeople who stand near the entrance
of stores and wait for customers, has substantial implications for managers and retail
organizations. The qualitative interviews with retail salespeople and managers, as well as the
quantitative results, indicate that this practice is very common. Often, stores have a written
166
policy stating that a salesperson must remain within a certain number of feet from the entrance to
greet customers and provide better service as they enter and to serve as a deterrent for
shoplifters. More often, though, managers give their retail salespeople verbal instructions to be
present near the entrance of the store.
The finding in this research with the greatest managerial implications is that positioning a
retail salesperson near the entrance of the store is viewed negatively by potential customers. The
intent of this practice is to provide better customer service and increase sales, but positioning
hailers near the entrance may actually have the opposite effect. Instead, having a salesperson
present at the entrance of the retail store produces negative feelings for potential customers and
influences many customers to decide against patronizing the store. Thus, the presence of a hailer
at the entrance of a store may defeat the retailer‟s primary goal of making sales by reducing
positive approach attitudes and the likelihood that customers will even enter the store.
While some of the effect sizes of the relationships in this research are small, small effects
may nevertheless be able to create a sizable influence over many repetitions (Abelson 1985).
Each time a potential customer encounters a store front; he or she forms emotions and opinions,
and decides whether or not to enter the store. Thus, small effects on any single visit can turn into
big differences over many repetitions. Therefore, salespeople should do anything possible that
could increase the odds of a particular customer entering the store, including not standing near
the entrance of the retail store.
Given the situation that a hailer must be near the entrance of a retail store, such as in a
context where shoplifting is pervasive, experiment two provides some guidance as to how the
salesperson could behave in order to achieve a more positive reaction from potential customers.
The results show that hailers who have a positive demeanor increase consumers‟ pleasure and
167
that pleasure increases approach attitudes and store patronage intentions. So, although it seems
simple thing to do, a hailer generally maintaining a positive attitude could make a big difference
over time. However, the interaction effect between smiling and salesperson demeanor on
dominance shows that smiling is not always the best way for hailers to entice customers.
Often, employees are instructed to keep busy by straightening merchandise while waiting
for customers near the entrance of the store, resulting in some retail salespeople repeating
virtually meaningless tasks throughout the day. For example, one retail salesperson talks about
how she re-folds the same shirt throughout the day to appear to be busy while she waits near the
entrance for customers. Simply keeping busy is not enough to make a difference in customers‟
responses. However, the interaction effect of salesperson demeanor and the salesperson‟s level of
activity on dominance suggests that if a retail salesperson is near the entrance of the store, a more
positive outcome may be achieved by smiling while keeping busy. By doing so, the salesperson
is available to help but is not intimidating to potential customers. Salespeople who only idly
stand near the entrance and grin at potential customers may be off-putting because the
salesperson gives the appearance of being prepared to immediately launch a high-pressure sales
pitch, when many customers would prefer to be able to browse at their leisure.
Limitations and Future Research
This dissertation has generated several implications for both theory and practice.
However, like all research, these findings must be tempered by their limitations. Several
limitations are recognized and various related and unrelated recommendations for future research
are offered.
One limitation of this research is associated with the method by which the data are
collected. The instrument for the two experiments is hosted online. The subjects are given a URL
168
to the survey either by their instructor of an undergraduate class, an undergraduate student, or an
email from an online panel to which they belong. The subjects then access the URL at the time
and place of their convenience to view the stimuli and answer the items. Because of this method,
the subjects participate at a wide variety of times of day and in a wide variety of locations, where
many different distractions could be present. One might argue that this introduces an element of
randomness, but it also gives up a certain degree of control which would be afforded if the
experiments were conducted in a controlled environment. However, it would be difficult to test a
nationally-representative sample in a particular physical location. Future iterations of this project
may benefit from using an in-house laboratory.
Another limitation is that the variable created for race match in pilot one experiment one
has a significant effect. Fortunately, neither race match nor gender match has an effect in any of
the other experiments or datasets. This effect indicates that there is a racial bias in that part of the
data. However, that bias could not be controlled while also obtaining statistics for the salesperson
presence manipulation, since the race match variable has missing values for all of the salesperson
absent conditions. Future research that includes present/absent condition should be designed in a
way that accounts for this issue. Additionally, the majority of the sample is Caucasian. Future
work could include a higher proportion of minority ethnic groups.
A third limitation is that the instrument does not include an item that asks about
geographic location. While the panel data from Opinionology is guaranteed to be nationally
representative, the pilot tests used students of the University of Alabama and other people that
they recruit as the subjects. Therefore, due to the method of data collection, a disproportionately
high number of the subjects come from Alabama in the combined datasets. This information
would have been a useful control variable. Future work should include an item for geographic

169
location because hailers may be perceived differently in regions whose cultures include an
emphasis on friendliness or sociability.
Besides geographic location, several other contextual variables offer opportunities for
future research. As suggested by the qualitative findings, differences in consumers‟ feelings
about a retail salesperson near the entrance of a store may exist depending on whether the
context is regular shopping occasion or during a holiday shopping period. During the holidays,
shoppers are often under stress to find gifts and may welcome the increased salesperson
availability. Likewise, if the shopping context involves the purchase of high-technology
products, customers may be more welcoming of a salesperson near the entrance, especially if
they have little product knowledge. Similarly, the results may differ depending on whether the
store is a luxury or discount store, where shoppers‟ expectations of the level of available service
are differ.
A final opportunity for future research involves characteristics of the customers that
could play a mediating or moderating role in the relationships found in this research. Some
possible variables that emerge from the qualitative data are differing shopping motivations,
shoppers‟ transient mood, and different personality traits, such as trait anxiety, extroversion,
sociability, arousal-seeking, and decisiveness.
Conclusion
In conclusion, this research produces interesting results that have implications for both
theory and practice. Hailers‟ practice of standing near the entrance of retail stores is has a
negative effect on consumers‟ pleasure, and ultimate attitudes and behaviors. In general, smiling
produces pleasurable feelings for consumers. However, an interaction between smiling and
salesperson activity has a significant relationship with dominance. Consumers feel more
170
dominant, or in control of the situation, if a smiling salesperson is engaged some activity (e.g.
straightening merchandise) than if the hailer is simply standing near the entrance with a grin
glued on his or her face. This research contributes to multiple literatures, including retail
salespeople, atmospherics, and service. Theoretically, this work tests and extends approach-
avoidance theory and emotional contagion theory. The findings provide actionable suggestions
for retail managers and retail employees in practice.

171
REFERENCES
Abelson, Robert P. (1985). “A variance explanation paradox: When a little is a lot,”
Psychological Bulletin, 97 (1), 129-133.
Babin, Barry J. and Babin, Laurie (2001). “Seeking something different? A model of schema
typicality, consumer affect, purchase intentions, and perceived shopping value,” Journal
of Business Research, 54 (2), 89-96.
Babin, Laurie A., Babin, Barry J, and Boles, James S. (1999). “The effects of consumer
perceptions of the salesperson, product and dealer on purchase intentions,” Journal of
Retailing and Consumer Services, 6 (2), 91-97.
Bailey, Nicole and Areni, Charles S. (2006). “When a few minutes sound like a lifetime: Does
atmospheric music expand or contract perceived time?,” Journal of Retailing, 82 (3),
189-202.
Baker, Julie (1987) “The role of the environment in marketing services‟, in J. Shanahan (ed.) The
Services Challenge: Integrating for Competitive Advantage, pp. 79–84. Chicago, IL:
American Marketing Association.
Baker, Julie, Grewal, Dhruv, and Parasuraman, A. (1994). “The influence of store environment
on quality inferences and store image,” Journal of the Academy of Marketing Science, 22
(4), 328-339.
Baker, Julie, Levy, Michael, and Grewal, Dhruv (1992). “An experimental approach to making
retail store environmental decisions,” Journal of Retailing, 68 (4), 445-460.
Baker, Julie, Parasuraman, A., Grewal, Dhruv, and Voss, Glenn B. (2002). “The influence of
multiple store environment cues on perceived merchandise value and patronage
intentions,” Journal of Marketing, 66 (April) 120-141.
Beatty, Sharon E., Mayer, Morris, Coleman, James E., and Lee, Jungki (1996). “Customer-sales
associate retail relationships,” Journal of Retailing, 72 (3), 223-147.
Belk, Russell W. (1975). “Situational variables and consumer behavior,” Journal of Consumer
Research, 2 (December), 157–164.
Berman, Barry, and Evans, Joel R. (1995). Retail Management: A Strategic Approach, 6th
Edition, Prentice-Hall, Inc., Englewood Cliffs, NJ.
Beverland, Michael, Lim, Elison, A.C., Morrison, Michael, Terziovski, Mile (2006). “In-store
music and consumer-brand relationships: Relational transformation following
experiences of (mis)fit,” Journal of Business Research, 59 (9), 982-989.
172
Biggers, Thompson and Rankis, Olaf E. (1983). “Dominance-submissiveness as an effective
response to situations and as a predictor of approach-avoidance,” Social Behavior and
Personality, 11 (2), 61-69.
Bitner, Mary Jo (1990). “Evaluating service encounters: The effects of physical surroundings and
employee responses,” Journal of Marketing, 54 (April), 69–82.
Bitner, Mary Jo (1992) “Servicescapes: the impact of physical surroundings on customers and
employees,” Journal of Marketing, 56 (April), 57–71.
Chebat, Jean-Charles, and Dube, Laurette (2000). “Evolution and challenges facing retail
atmospherics: The apprentice sorcerer is dying,” Journal of Business Research, 49 (2),
89-90.
Cornelius, Britta, Natter, Martin, and Faure, Corinne (2010). “How storefront displays influence
retail store image,” Journal of Retailing and Consumer Services, 17 (2), 143-151.
Cronin, Joseph J. Jr. (2003). “Looking back to see forward in services marketing: Some ideas to
consider,” Managing Service Quality, 13 (5), 332-337.
Darian, Jean C., Tucci, Louis A., and Wiman Alan R. (2001). “Perceived salesperson service
attributes and retail patronage intentions,” International Journal of Retail & Distribution
Management, 29 (5), 205-213.
Darian, Jean C., Wiman, Alan R., and Tucci, Louis A. (2004). “Retail patronage intentions: The
relative importance of perceived prices and salesperson service attributes,” Journal of
Retailing and Consumer Services, 12 (1), 15-23.
Dawson, Scott, Bloch, Peter H., and Ridgway, Nancy M. (1990). “Shopping motives, emotional
states, and retail outcomes,” Journal of Retailing, 66 (4), 408-427.
De Mozota, Brigitte B. (1990). „Design as a strategic marketing tool‟, in M. Oakley (ed.), Design
Management, 73–84, Cambridge, MA: Blackwell Reference.
Donovan, Robert J. and Rossiter, John R. (1982). “Store Atmosphere: An environmental
psychology approach,” Journal of Retailing, 5 (1), 34-57.
Donovan, Robert J, Rossiter, John R., Marcoolyn, Gilian, and Nesdale, Andrew (1994). “Store
atmosphere and purchasing behavior,” Journal of Retailing, 70 (3), 283-294.
El Sayed, Ismail M., Farrag, Dalia A., and Belk, Russell (2003). “The effects of physical
surroundings on Egyptian consumers‟ emotional states and buying intentions,” Journal of
International Consumer Marketing, 16 (1), 5-27.
173
Eroglu, Sevgin A., Machleit, Karen A., and Chebat, Jean-Charles (2005). “The interaction of
retail density and music tempo: Effects on shopper responses,” Psychology & Marketing,
22 (7, July), 577-589.
Ezeh, Chris and Harris, Lloyd (2007). “Servicescape research: A review and research agenda,”
The Marketing Review, 7 (1), 59-78.
Feinberg, Richard A., Sheffler, Brent, Meoli, Jennifer, and Rummel, Amy (1989). “There‟s
something social happening at the mall,” Journal of Business and Psychology, 4 (1), 49-
63.
Fishbein, Martin and Ajzen, Icek (1975). Belief, Attitude, Intention, and Behavior: An
Introduction to Theory and Research, Reading, MA: Addison-Wesley.
Gagliano, Kathryn B. and Hathcote, Jan (1994). “Customer expectations and perceptions of
service quality in retail apparel specialty stores,” Journal of Services Marketing, 8 (1),
60-69.
Garlin, Francine V. and Owen, Katherine (2006). “Setting the tone with the tune: A meta-
analytic review of the effects of background music in retail settings,” Journal of Business
Research, 59 (6), 755-7654.
Gardner, Meryl P. and Siomkos (1986). “Toward a methodology for assessing effects of in-store
atmospherics,” in Richard J. Lutz ed., Advances in Consumer Research, Vol. 13, Provo,
UT: Association for Consumer Research, 27-31.
Gilboa, Shaked and Rafaeli, Anat (2003). “Store environment, emotions and approach behavior:
Applying environmental aesthetics to retailing,” International Review of Retail
Distribution and consumer Research, 13 (2), 195-211.
Goff, Brent G., Boles, James S., Bellenger, Danny N., and Stojack, Carrie (1997). “The influence
of salesperson selling behaviors on customer satisfaction with products,” Journal of
Retailing, 73 (2, Summer), 171-183.
Grewal, Dhruv, Baker, Julie, Levy, Michael, and Voss, Glenn (2003). “The effects of wait
expectations and store atmosphere evaluations on patronage intentions in service-
intensive retail stores,” Journal of Retailing, 79 (4), 259-268.
Guenzi, Paolo, Johnson, Michael D., and Castaldo, Sandro (2009). “A comprehensive model of
customer trust in two retail stores,” Journal of Service Management, 20 (3), 290-316.
Hartline, Michael D. and Jones, Keith C. (1996), "Employee performance cues in a hotel service
environment: influence on perceived service quality, value, and word-of-mouth
intentions,” Journal of Business Research, 35 (3), 207-215.

174
Hedrick, Natalie, Oppewal, Harmen, and Beverland, Michael (2007). “Store atmosphere effects
on customer perceptions of the retail sales person,” Proceedings of Association for
Consumer Research, 96-97.
Hedrick, Natalie, Beverland, Michael, and Oppewal, Harmen (2004). “The impact of retail
salespeople and store atmospherics on patronage intentions,” Proceedings of Australian
and New Zealand Marketing Academy, 1-8.
Hoffman, K. Douglas and Turley, L.W. (2002). “Atmospherics, service encounters and consumer
decision making: An integrative perspective,” Journal of Marketing Theory and Practice,
10 (3), 33-47.
Hu, Haiyan and Jasper, Cynthia (2006). “Social cues in the store environment and their impact
on store image,” International Journal of Retail & Distribution Management, 34 (1), 25-
48.
Hu, Haiyan and Jasper, Cynthia (2007). “A cross-cultural examination of the effects of social
perception styles on store image formation,” Journal of Business Research, 60 (3), 222-
230.
Hui, Michael K. and Bateson, John E.G. (1991). “Perceived control and the effects of crowding
and consumer choice on the service experience,” Journal of Consumer Research, 18
(September), 174-184.
Jiang, Ying and Wang, Cheng Lu (2006). “The impact of affect on service quality and
satisfaction: The moderation of service contexts,” Journal of Services Marketing, 20 (4),
211-218.
Keillor, Bruce, Parker R. Stephen, and Pettijohn, Charles E. (2000). “Relationship-oriented
Characteristics and Individual Salesperson Performance,” Journal of Business &
Industrial Marketing, 15 (1), 7-22.
Kim, Jae-Eun, Ju, Hae Won, and Johnson, Kim K.P. (2009). “Sales associates‟ appearance:
Links to consumers‟ emotions, store image, and purchases,” Journal of Retailing and
Consumer Services, 16 (5), 407-413.
Kotler, Philip (1973). “Atmospherics as a marketing tool,” Journal of Retailing, 49 (4), 48-64.
Lee, Sanghyun and Dubinsky, Alan J. (2003). “Influence of salesperson characteristics and
customer emotion on retail dyadic relationships,” The International Review of Retail,
Distribution and Consumer Research, 13 (1, January), 21-36.
Machleit, Karen A. and Eroglu, Sevgin A. (2000). “Describing and measuring emotional
response to shopping experience,” Journal of Business Research, 49 (2), 101-111.

175
Machleit, Karen A., Eroglu, Sevgin A., Mantel, Susan P. (2000). “Perceived retail crowding and
shopping satisfaction: What modifies this relationship?,” Journal of Consumer
Psychology, 9 (1), 29-42.
Malhotra, Naresh K. (1983) “A threshold model of store choice,” Journal of Retailing, 59 (2), 3-
21.
Mattila, Anna S. and Wirtz, Jochen (2001). “Congruency of scent and music as a driver of in-
store evaluations and behavior,” Journal of Retailing, 77 (22), 273-289.
Mattila, Anna S. and Wirtz, Jochen (2008). “The role of store environmental stimulation and
social factors on impulse purchasing,” Journal of Services Marketing, 22 (7), 562-567.
Mehrabian, Albert and Russell, James A. (1974). An Approach to Environmental Psychology,
The MIT Press: Cambridge, Massachusetts
Mehrabian, Albert (1980). Public Places and Private Spaces, Basic Books Inc. Publishers: New
York.
Michon, Richard and Chebat, Jean-Charles (2005). “Reaching out for mall shoppers: Shopping
value, mall atmosphere and approach behaviors,” Proceedings of ASAC 2005, Toronto,
Ontario, 114.
Michon, Richard and Chebat, Jean-Charles (2008). “Breaking open the consumer behavior black
box: SEM and retail atmospheric manipulations,” Journal of Marketing Theory and
Practice, 16 (4, Fall), 299-307.
Michon, Richard, Chebat, Jean-Charles, Turley, L.W. (2005). “Mall atmospherics: The
interaction effects of the mall environment on shopping behavior,” Journal of Business
Research, 58 (5), 576-583.
Mittal, Banwari, and Lassar Walfried (1996). “The role of personalization in service encounters,”
Journal of Retailing, 72 (1), 95-109.
Morrin, Maureen and Chebat, Jean-Charles (2005). “Person-place congruency: The interactive
effects of shopper style and atmospherics on consumer expenditures,” Journal of Service
Research, 8 (2), 181-191.
Naylor, Gillian and Frank, Kimberly E. (2000). “The impact of retail sales force responsiveness
on consumers‟ perceptions of value,” Journal of Services Marketing, 14 (4), 310-322.
Pan, Yue and Siemens, Jennifer C. (2011). “The differential effects of retail density: An
investigation of good versus service setting,” Journal of Business Research, 64 (2), 105-
112.
176
Ponder, Nicole, Lueg, Jason E., and Williams, Zachary (2006). “Salesperson assistance versus
self-service in retailing: Are they both a matter of convenience?,” Marketing
Management Journal, 16 (1), 72-87.
Puccinelli, Nancy M., Goodstein, Ronald C., Grewal, Dhruv, Price, Robert, Raghubir, Priya, and
Stewart, David (2009). “Customer Experience Management in Retailing: Understanding
the Buying Process,” Journal of Retailing, 85 (1), 15-30.
Ray, Ipshita and Larry Chiagouris (2009). “Customer retention: Examining the roles of store
affect and store loyalty as mediators in the management of retail strategies,” Journal of
Strategic Marketing, 17 (1, February), 1-20.
Russell, James A. and Pratt, Geraldine A. (1980). „Description of the affective quality attributed
to environments‟, Journal of Personality and Social Psychology 38 (2), 311–22.
Sharma, Arun (2001). “Consumer decision-making, salespeople‟s adaptive selling and retail
performance,” Journal of Business Research, 54 (2), 125–129.
Sharma, Arun and Levy, Michael (1995). “Categorization of customers by retail salespeople,”
Journal of Retailing, 71 (1), 71-81.
Sharma, Arun and Stafford, Thomas F. (2000). “The effect of retail atmospherics on customers‟
perceptions of salespeople and customer persuasion: An empirical investigation,” Journal
of Business Research, 49 (2), 183-191.
Sherman, Elaine, Mathur, Anil, and Smith, Ruth B. (1997). “Store environment and consumer
purchase behavior: Mediating role of consumer emotions,” Psychology & Marketing, 14
(4), 361-378.
Skinner, B.F. (1961). Cumulative record, Enlarged ed., New York: Appleton-Century Crofts.
Solomon, Michael R., Surprenant, Carol, Czepiel, John A., and Gutman, Evelyn G. (1985). “A
role theory perspective on dyadic interactions: The service encounter,” Journal of
Marketing, 49 (1), 99-111.
Spangenberg, Eric R., Crowley, Ayn E., and Henderson, Pamela W. (1996). “Improving the store
environment: Do olfactory cues affect evaluations and behaviors?,” Journal of
Marketing, 60, (April) 67-80.
Stanforth, Nancy F. and Lennon, Sharron J. (1997). “The effects of customer expectations and
store policies on retail salesperson service, satisfaction, and patronage,” Clothing and
Textiles Research Journal, 15 (2), 115-124.
Stokols, Daniel (1972). “On the distinction between density and crowding,” Psychological
Review, 79 (3) 275-277.
177
Summers, Teresa A. and Hebert, Paulette R. (2001). “Shedding some light on store atmospherics
influence of illumination on consumer behavior,” Journal of Business Research, 54 (2),
145-150.
Sweeney, Jillian C., Soutar, Geoffrey N., and Johnson, Lester W. (1997). "Retail service quality
and perceived value," Journal of Retailing and Consumer Services, 4 (1), 39-48.
Tombs, Alastair and McColl-Kennedy, Janet R. (2003). “Social-servicescape conceptual model,”
Marketing Theory, 3 (4), 447-475.
Turley, L.W. and Chebat, Jean-Charles (2002). “Linking retail strategy, atmospheric design, and
shopping behavior,” Journal of Marketing Management, 18 (1), 125-144.
Turley, L.W. and Milliman, Ronald E. (2000). “Atmospheric effects on shopping behavior: A
Review of the experimental evidence,” Journal of Business Research, 49 (2), 193-211.
Vargo, Stephen L., and Robert F. Lusch (2004). “Evolving to a New Dominant Logic for
Marketing,” Journal of Marketing, 68 (January), 1-17.
Wakefield, Kirk L. and Blodgett, Jeffrey G. (1996). “The effect of the servicescape on
customers‟ behavioural intentions in leisure service settings”, Journal of Services
Marketing, 10 (6) 45-61.
Weitz, Barton A. (1981). “Effectiveness in sales interactions: A contingency framework,”
Journal of Marketing, 45 (Winter), 85-103.
Weitzel, William, Schwarzkopf, Albert B. and Peach, E. Brian (1989). “The influence of
employee perceptions of customer service on retail store sales,” Journal of Retailing, 65
(1), 25-39.
Westbrook, Robert A. (1981). “Sources of consumer satisfaction with retail outlets,” Journal of
Retailing, 57 (3), 68-85.
Williams Alvin J. and Seminerio John (1985). “What buyers like from salesmen,” Industrial
Marketing Management, 14 (May), 75– 78.
Williams, Kaylene C. and Spiro, Rosann L. (1985). “Communication style in the salesperson-
customer dyad,” Journal of Marketing Research, 22 (November), 434-442.
Yalch, Richard F. and Spangenberg, Eric R. (2000). “The effects of music in a retail setting on
real and perceived shopping times,” Journal of Business Research, 49 (2), 139-147.
Yoo, Changjo, Park, Jonghee, and MacInnis, Deborah J. (1998). “Effects of store characteristics
and in-store emotional experiences on store attitude,” Journal of Business Research, 42
(3), 253-263.
178
Zemke, Dina Marie V. and Shoemaker, Stowe (2007). “Scent across a crowded room: Exploring
the effect of ambient scent on social interactions,” Hospitality Management, 26 (4), 927-
940.
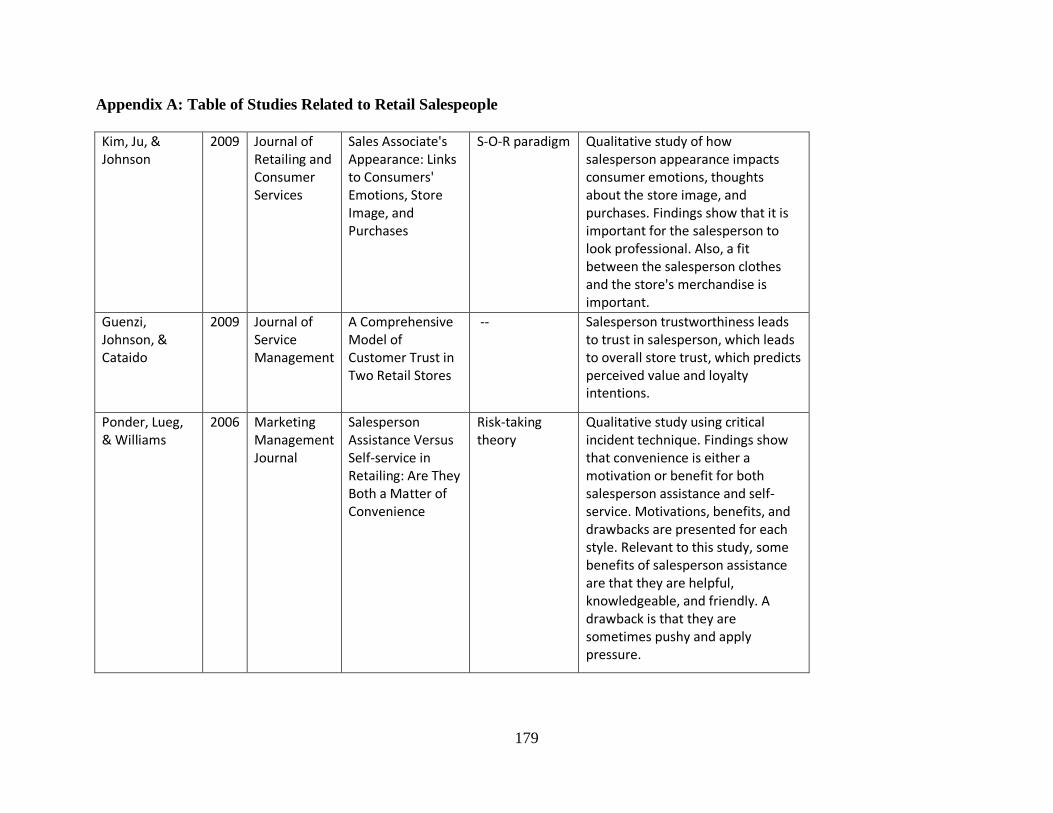
179
Appendix A: Table of Studies Related to Retail Salespeople
Kim, Ju, & Johnson
2009 Journal of Retailing and Consumer Services
Sales Associate's Appearance: Links to Consumers' Emotions, Store Image, and Purchases
S-O-R paradigm Qualitative study of how salesperson appearance impacts consumer emotions, thoughts about the store image, and purchases. Findings show that it is important for the salesperson to look professional. Also, a fit between the salesperson clothes and the store's merchandise is important.
Guenzi, Johnson, & Cataido
2009 Journal of Service Management
A Comprehensive Model of Customer Trust in Two Retail Stores
-- Salesperson trustworthiness leads to trust in salesperson, which leads to overall store trust, which predicts perceived value and loyalty intentions.
Ponder, Lueg, & Williams
2006 Marketing Management Journal
Salesperson Assistance Versus Self-service in Retailing: Are They Both a Matter of Convenience
Risk-taking theory
Qualitative study using critical incident technique. Findings show that convenience is either a motivation or benefit for both salesperson assistance and self-service. Motivations, benefits, and drawbacks are presented for each style. Relevant to this study, some benefits of salesperson assistance are that they are helpful, knowledgeable, and friendly. A drawback is that they are sometimes pushy and apply pressure.
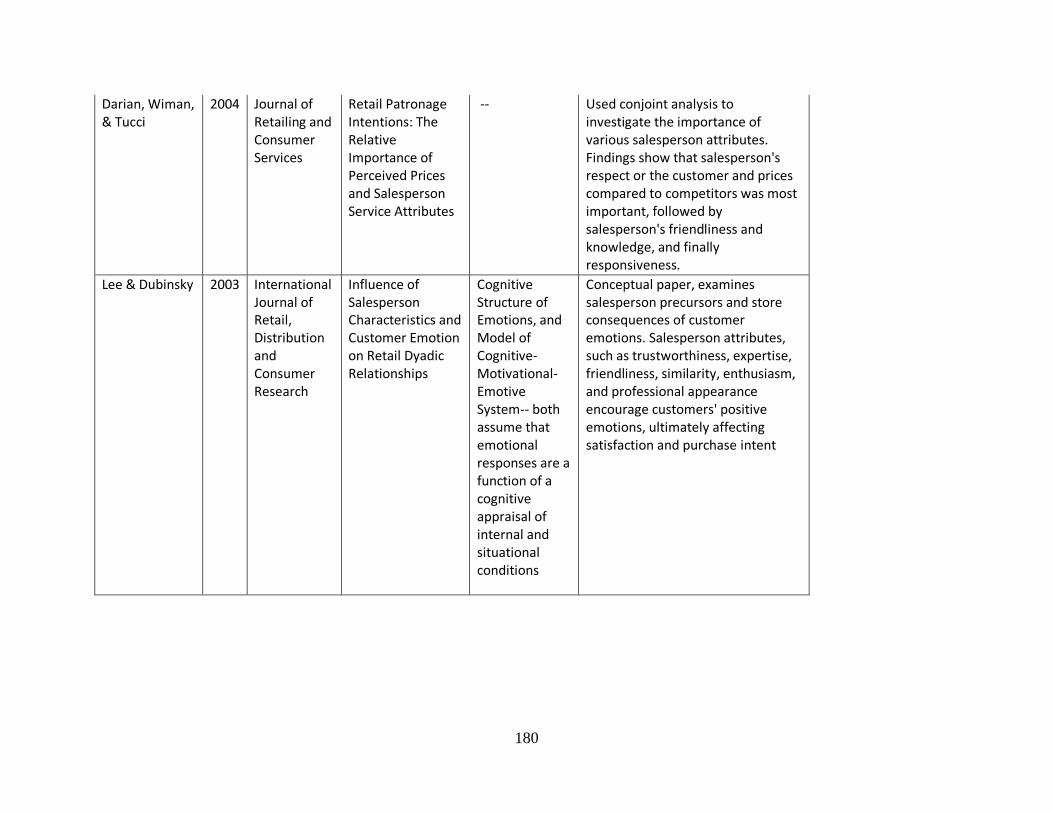
180
Darian, Wiman, & Tucci
2004 Journal of Retailing and Consumer Services
Retail Patronage Intentions: The Relative Importance of Perceived Prices and Salesperson Service Attributes
-- Used conjoint analysis to investigate the importance of various salesperson attributes. Findings show that salesperson's respect or the customer and prices compared to competitors was most important, followed by salesperson's friendliness and knowledge, and finally responsiveness.
Lee & Dubinsky 2003 International Journal of Retail, Distribution and Consumer Research
Influence of Salesperson Characteristics and Customer Emotion on Retail Dyadic Relationships
Cognitive Structure of Emotions, and Model of Cognitive-Motivational-Emotive System-- both assume that emotional responses are a function of a cognitive appraisal of internal and situational conditions
Conceptual paper, examines salesperson precursors and store consequences of customer emotions. Salesperson attributes, such as trustworthiness, expertise, friendliness, similarity, enthusiasm, and professional appearance encourage customers' positive emotions, ultimately affecting satisfaction and purchase intent
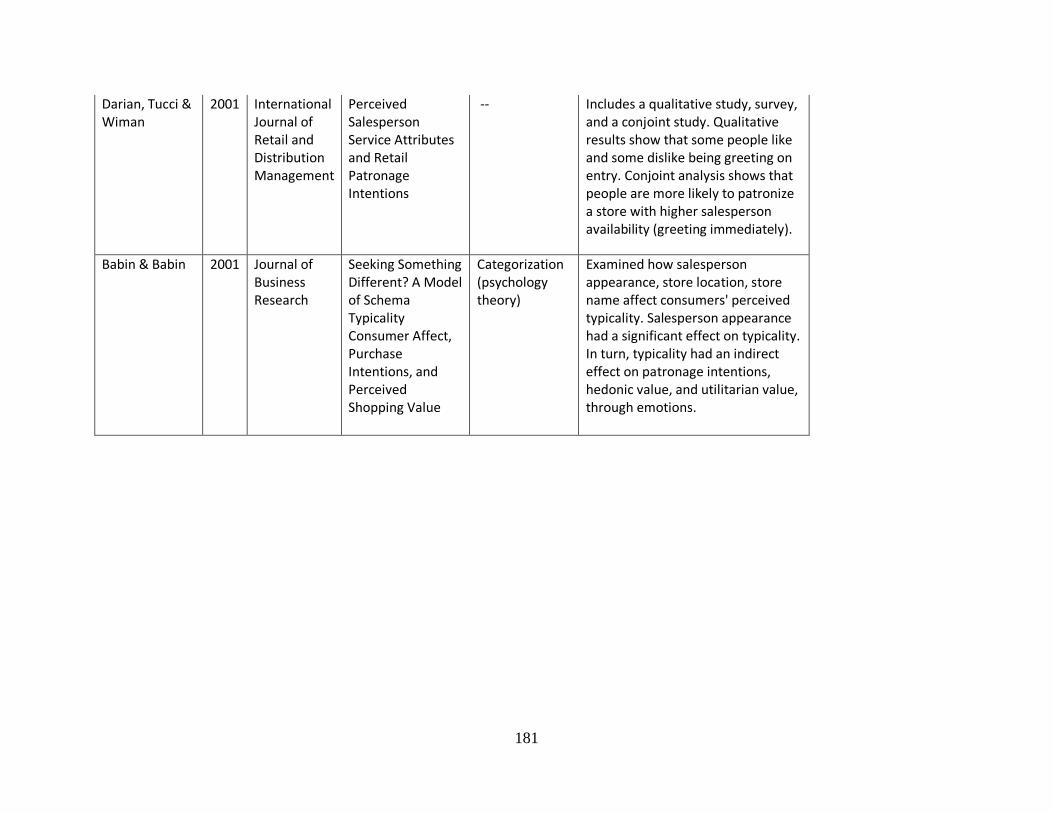
181
Darian, Tucci & Wiman
2001 International Journal of Retail and Distribution Management
Perceived Salesperson Service Attributes and Retail Patronage Intentions
-- Includes a qualitative study, survey, and a conjoint study. Qualitative results show that some people like and some dislike being greeting on entry. Conjoint analysis shows that people are more likely to patronize a store with higher salesperson availability (greeting immediately).
Babin & Babin 2001 Journal of Business Research
Seeking Something Different? A Model of Schema Typicality Consumer Affect, Purchase Intentions, and Perceived Shopping Value
Categorization (psychology theory)
Examined how salesperson appearance, store location, store name affect consumers' perceived typicality. Salesperson appearance had a significant effect on typicality. In turn, typicality had an indirect effect on patronage intentions, hedonic value, and utilitarian value, through emotions.

182
Sharma 2001 Journal of Business Research
Consumer Decision-making, Salespeople's Adaptive Selling and Retail Performance
Persuasion Knowledge Model (PKM)- consumers' knowledge contains persuasion elements (topic, persuasion, & agent knowledge Also, Signaling Theory (signaling cues suggests the importance of SP's behavior on consumer persuasion & perceptions of retailer and products
Conceptual paper discusses role of salespeople in consumer decision making & suggests strategies. Salesperson's customer orientation consists of empathy, affect, and availability. Availability is most related to this study, and it is ranked as very important to customers and increases persuasion.
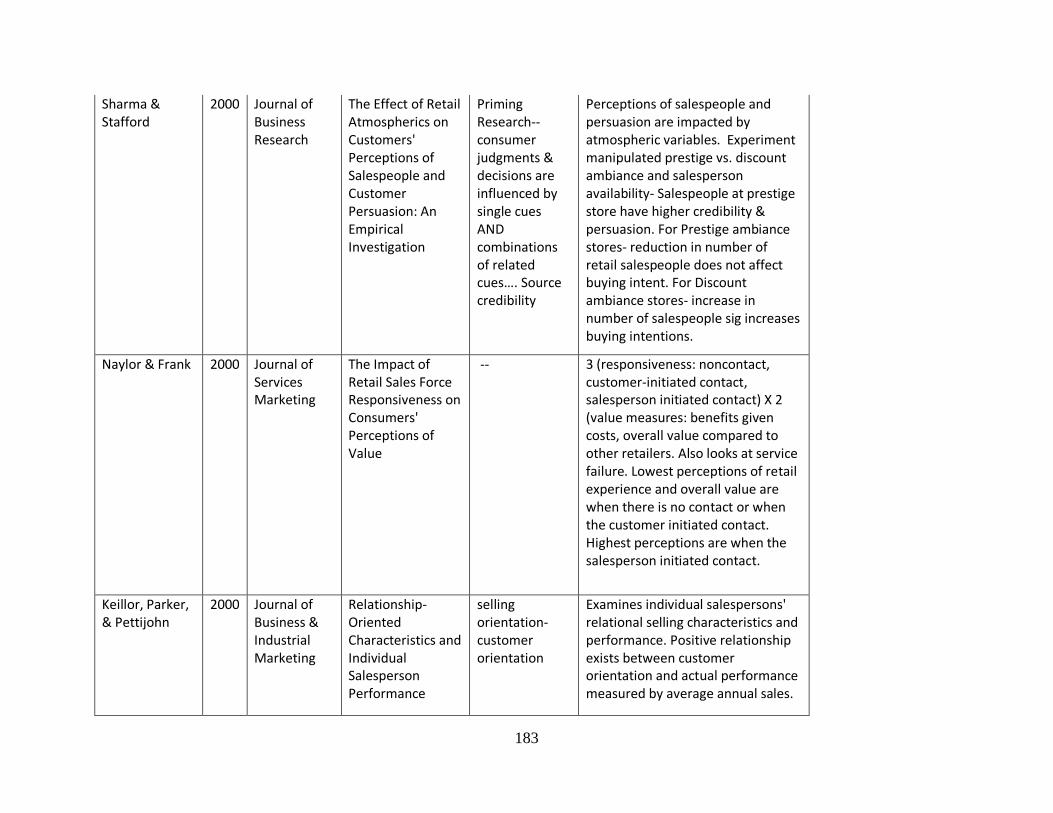
183
Sharma & Stafford
2000 Journal of Business Research
The Effect of Retail Atmospherics on Customers' Perceptions of Salespeople and Customer Persuasion: An Empirical Investigation
Priming Research-- consumer judgments & decisions are influenced by single cues AND combinations of related cues…. Source credibility
Perceptions of salespeople and persuasion are impacted by atmospheric variables. Experiment manipulated prestige vs. discount ambiance and salesperson availability- Salespeople at prestige store have higher credibility & persuasion. For Prestige ambiance stores- reduction in number of retail salespeople does not affect buying intent. For Discount ambiance stores- increase in number of salespeople sig increases buying intentions.
Naylor & Frank 2000 Journal of Services Marketing
The Impact of Retail Sales Force Responsiveness on Consumers' Perceptions of Value
-- 3 (responsiveness: noncontact, customer-initiated contact, salesperson initiated contact) X 2 (value measures: benefits given costs, overall value compared to other retailers. Also looks at service failure. Lowest perceptions of retail experience and overall value are when there is no contact or when the customer initiated contact. Highest perceptions are when the salesperson initiated contact.
Keillor, Parker, & Pettijohn
2000 Journal of Business & Industrial Marketing
Relationship-Oriented Characteristics and Individual Salesperson Performance
selling orientation-customer orientation
Examines individual salespersons' relational selling characteristics and performance. Positive relationship exists between customer orientation and actual performance measured by average annual sales.
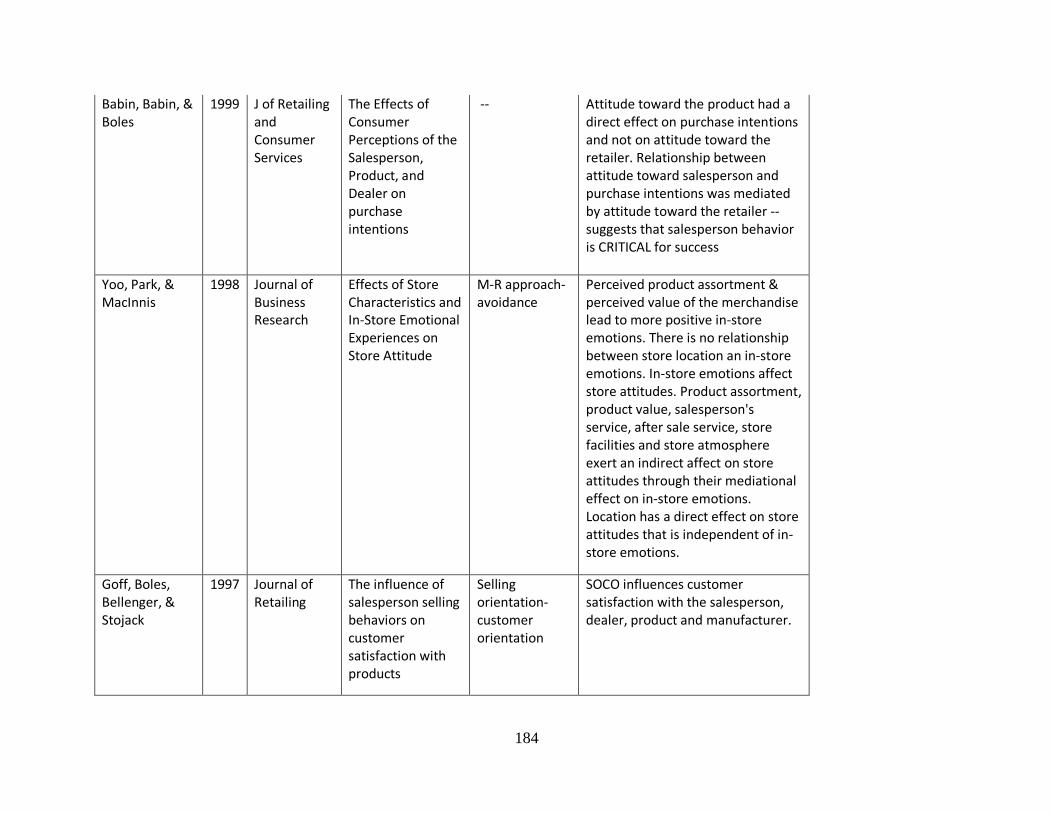
184
Babin, Babin, & Boles
1999 J of Retailing and Consumer Services
The Effects of Consumer Perceptions of the Salesperson, Product, and Dealer on purchase intentions
-- Attitude toward the product had a direct effect on purchase intentions and not on attitude toward the retailer. Relationship between attitude toward salesperson and purchase intentions was mediated by attitude toward the retailer -- suggests that salesperson behavior is CRITICAL for success
Yoo, Park, & MacInnis
1998 Journal of Business Research
Effects of Store Characteristics and In-Store Emotional Experiences on Store Attitude
M-R approach-avoidance
Perceived product assortment & perceived value of the merchandise lead to more positive in-store emotions. There is no relationship between store location an in-store emotions. In-store emotions affect store attitudes. Product assortment, product value, salesperson's service, after sale service, store facilities and store atmosphere exert an indirect affect on store attitudes through their mediational effect on in-store emotions. Location has a direct effect on store attitudes that is independent of in-store emotions.
Goff, Boles, Bellenger, & Stojack
1997 Journal of Retailing
The influence of salesperson selling behaviors on customer satisfaction with products
Selling orientation-customer orientation
SOCO influences customer satisfaction with the salesperson, dealer, product and manufacturer.
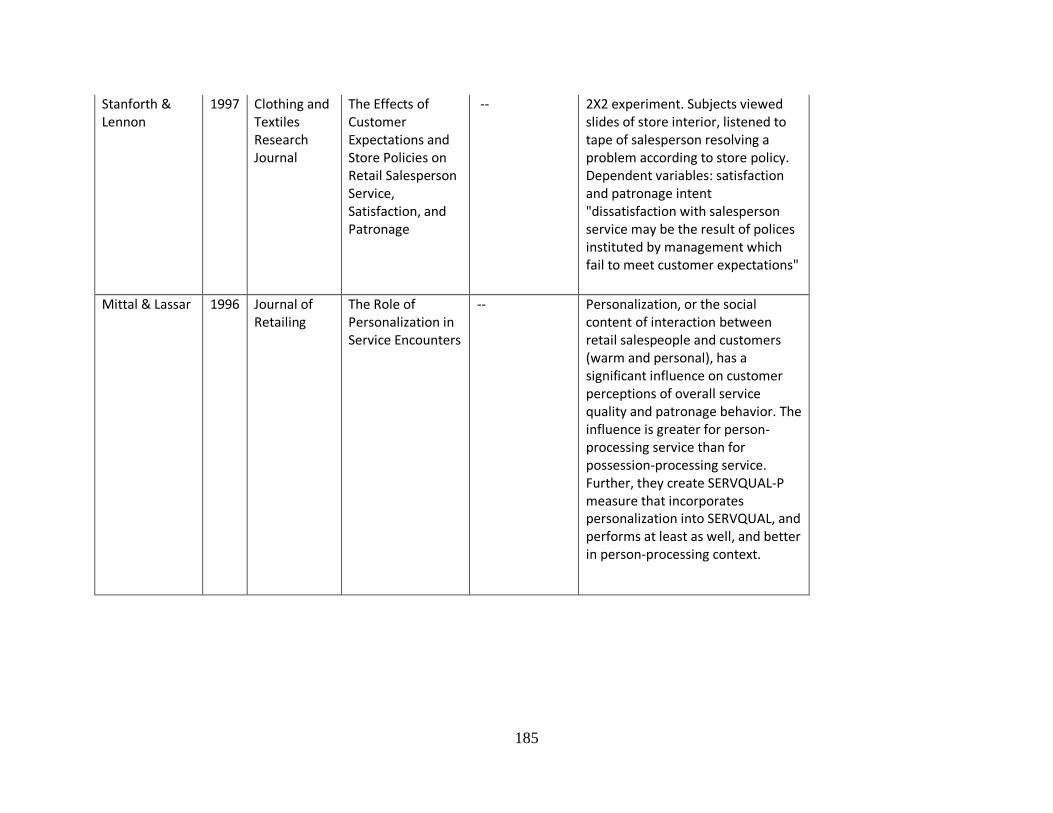
185
Stanforth & Lennon
1997 Clothing and Textiles Research Journal
The Effects of Customer Expectations and Store Policies on Retail Salesperson Service, Satisfaction, and Patronage
-- 2X2 experiment. Subjects viewed slides of store interior, listened to tape of salesperson resolving a problem according to store policy. Dependent variables: satisfaction and patronage intent "dissatisfaction with salesperson service may be the result of polices instituted by management which fail to meet customer expectations"
Mittal & Lassar 1996 Journal of Retailing
The Role of Personalization in Service Encounters
-- Personalization, or the social content of interaction between retail salespeople and customers (warm and personal), has a significant influence on customer perceptions of overall service quality and patronage behavior. The influence is greater for person-processing service than for possession-processing service. Further, they create SERVQUAL-P measure that incorporates personalization into SERVQUAL, and performs at least as well, and better in person-processing context.
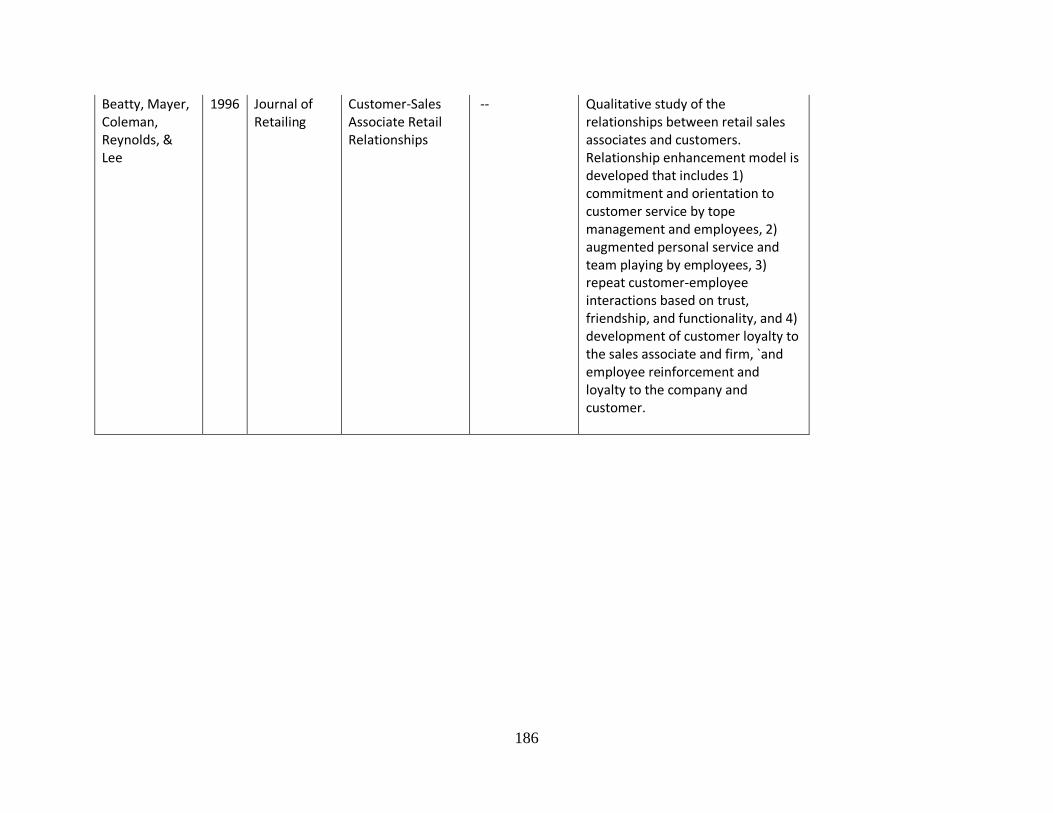
186
Beatty, Mayer, Coleman, Reynolds, & Lee
1996 Journal of Retailing
Customer-Sales Associate Retail Relationships
-- Qualitative study of the relationships between retail sales associates and customers. Relationship enhancement model is developed that includes 1) commitment and orientation to customer service by tope management and employees, 2) augmented personal service and team playing by employees, 3) repeat customer-employee interactions based on trust, friendship, and functionality, and 4) development of customer loyalty to the sales associate and firm, `and employee reinforcement and loyalty to the company and customer.

187
Sharma & Levy 1995 Journal of Retailing
Categorization of Customers by Retail Salespeople
Categorization (psychology theory)
Examines retail salespeople's categorization of customers and then examines differences among salespeople based on the manner in which they classify the customers. The main two categories of customers are those who need sales assistance and those who are looking for specific products. There were three clusters of salespeople, need based categorizers, decision styles categorizers, and training based categorizers. The need based categorizers have the best performance, but decision styles based categorizers had the highest adaptive selling.
Gagliano & Hathcote
1994 Journal of Services Marketing
Customer Expectations and Perceptions of Service Quality in Retail Apparel Specialty Stores
-- Factor analyzed SERVQUAL to come up with 4 dimensions (personal attention, reliability, tangibles, & convenience), found race differences for convenience, and marital and income differences for reliability
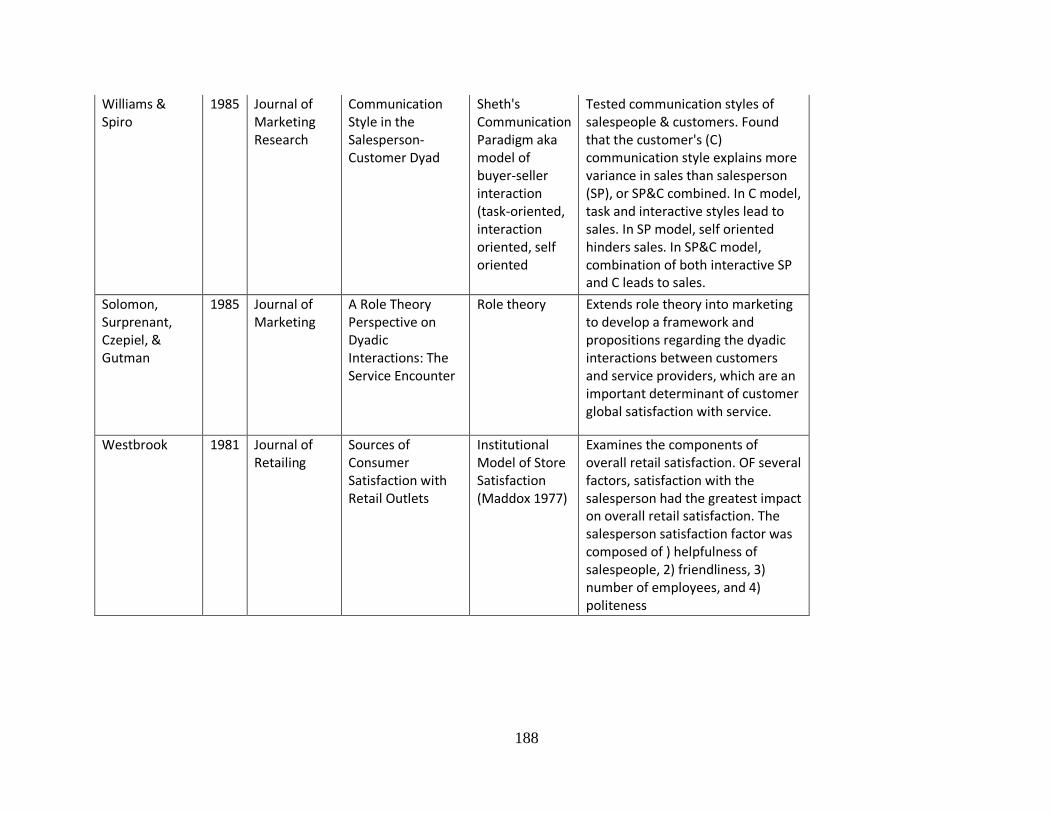
188
Williams & Spiro
1985 Journal of Marketing Research
Communication Style in the Salesperson- Customer Dyad
Sheth's Communication Paradigm aka model of buyer-seller interaction (task-oriented, interaction oriented, self oriented
Tested communication styles of salespeople & customers. Found that the customer's (C) communication style explains more variance in sales than salesperson (SP), or SP&C combined. In C model, task and interactive styles lead to sales. In SP model, self oriented hinders sales. In SP&C model, combination of both interactive SP and C leads to sales.
Solomon, Surprenant, Czepiel, & Gutman
1985 Journal of Marketing
A Role Theory Perspective on Dyadic Interactions: The Service Encounter
Role theory Extends role theory into marketing to develop a framework and propositions regarding the dyadic interactions between customers and service providers, which are an important determinant of customer global satisfaction with service.
Westbrook 1981 Journal of Retailing
Sources of Consumer Satisfaction with Retail Outlets
Institutional Model of Store Satisfaction (Maddox 1977)
Examines the components of overall retail satisfaction. OF several factors, satisfaction with the salesperson had the greatest impact on overall retail satisfaction. The salesperson satisfaction factor was composed of ) helpfulness of salespeople, 2) friendliness, 3) number of employees, and 4) politeness
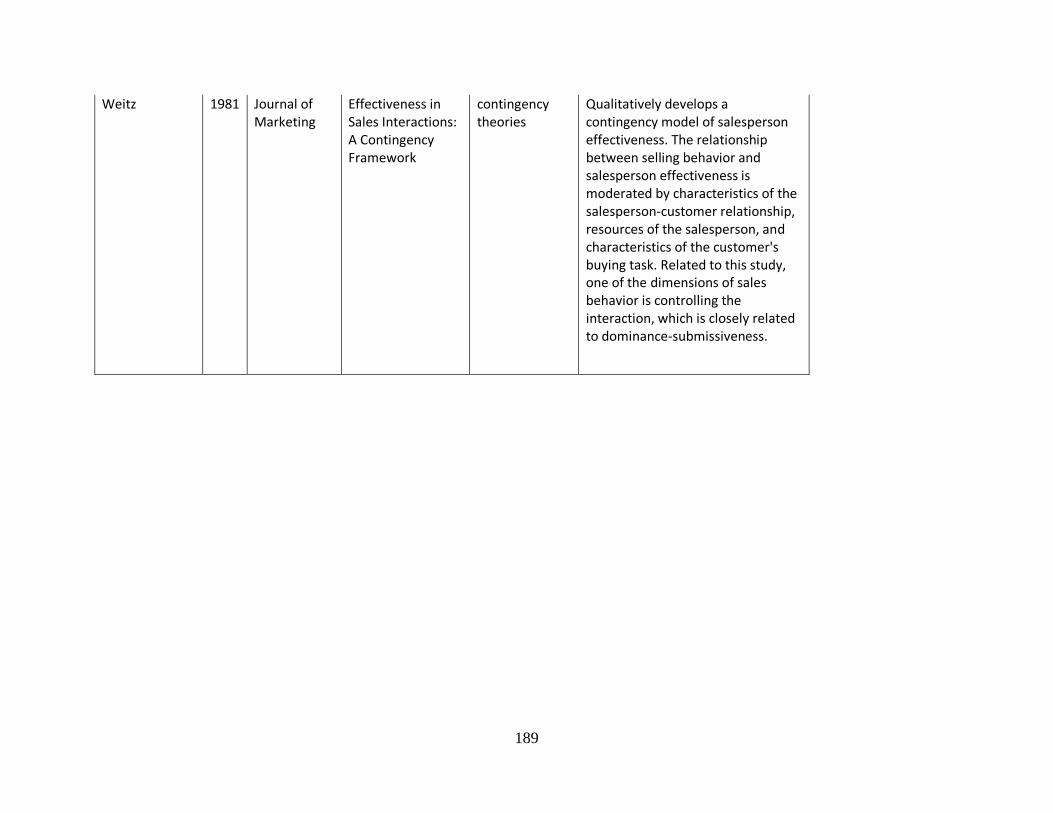
189
Weitz 1981 Journal of Marketing
Effectiveness in Sales Interactions: A Contingency Framework
contingency theories
Qualitatively develops a contingency model of salesperson effectiveness. The relationship between selling behavior and salesperson effectiveness is moderated by characteristics of the salesperson-customer relationship, resources of the salesperson, and characteristics of the customer's buying task. Related to this study, one of the dimensions of sales behavior is controlling the interaction, which is closely related to dominance-submissiveness.
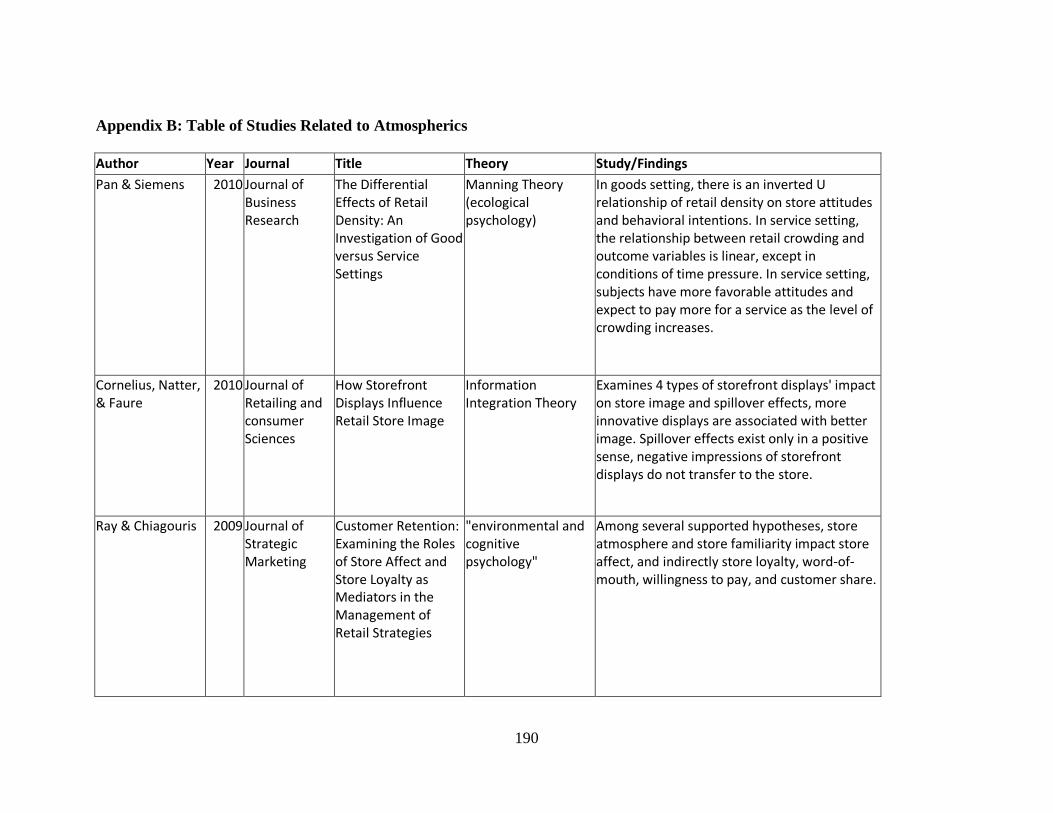
190
Appendix B: Table of Studies Related to Atmospherics
Author Year Journal Title Theory Study/Findings
Pan & Siemens 2010 Journal of Business Research
The Differential Effects of Retail Density: An Investigation of Good versus Service Settings
Manning Theory (ecological psychology)
In goods setting, there is an inverted U relationship of retail density on store attitudes and behavioral intentions. In service setting, the relationship between retail crowding and outcome variables is linear, except in conditions of time pressure. In service setting, subjects have more favorable attitudes and expect to pay more for a service as the level of crowding increases.
Cornelius, Natter, & Faure
2010 Journal of Retailing and consumer Sciences
How Storefront Displays Influence Retail Store Image
Information Integration Theory
Examines 4 types of storefront displays' impact on store image and spillover effects, more innovative displays are associated with better image. Spillover effects exist only in a positive sense, negative impressions of storefront displays do not transfer to the store.
Ray & Chiagouris 2009 Journal of Strategic Marketing
Customer Retention: Examining the Roles of Store Affect and Store Loyalty as Mediators in the Management of Retail Strategies
"environmental and cognitive psychology"
Among several supported hypotheses, store atmosphere and store familiarity impact store affect, and indirectly store loyalty, word-of-mouth, willingness to pay, and customer share.

191
Puccinelli, Goodstein, Grewal Price, Raghubir, & Stewart
2009 Journal of Retailing
Customer Experience Management in Retailing: Understanding the Buying Process
-- Reviews consumer behavior literature and relates different areas (of which atmospherics is one) to different stages of the consumer decision process. Suggests future research.
Mattila & Wirtz 2008 Journal of Services Marketing
The Role of Store Environmental Stimulation and Social Factors on Impulse Purchasing
M-R approach-avoidance
Field study in Singapore. Perceived overstimulation has a positive impact on impulse buying. The interaction term between perceived crowding and employee friendliness, and frequency of store visits also had a significant impact on impulse buying. Store type had no effect.
Michon & Chebat 2008 Journal of Marketing Theory and Practice
Breaking Open the Consumer Behavior Black Box: SEM and Retail Atmospheric Manipulations
-- Shows how SEM is useful for experimental designs in atmospherics
Ezeh & Harris 2007 The Marketing Review
Servicescape Research: a review and research agenda
M-R approach-avoidance, plus Bitner (1992) servicescape model
Provides a review of servicescape (atmospheric) research and outlines several gaps
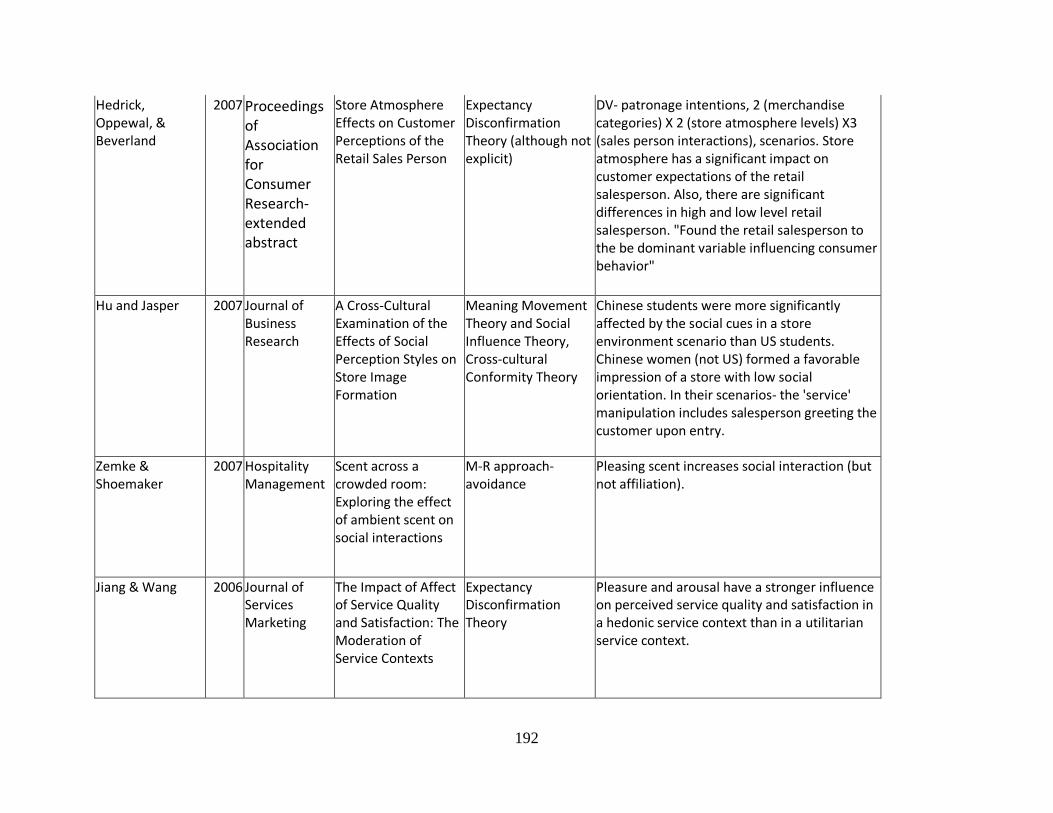
192
Hedrick, Oppewal, & Beverland
2007 Proceedings of Association for Consumer Research- extended abstract
Store Atmosphere Effects on Customer Perceptions of the Retail Sales Person
Expectancy Disconfirmation Theory (although not explicit)
DV- patronage intentions, 2 (merchandise categories) X 2 (store atmosphere levels) X3 (sales person interactions), scenarios. Store atmosphere has a significant impact on customer expectations of the retail salesperson. Also, there are significant differences in high and low level retail salesperson. "Found the retail salesperson to the be dominant variable influencing consumer behavior"
Hu and Jasper 2007 Journal of Business Research
A Cross-Cultural Examination of the Effects of Social Perception Styles on Store Image Formation
Meaning Movement Theory and Social Influence Theory, Cross-cultural Conformity Theory
Chinese students were more significantly affected by the social cues in a store environment scenario than US students. Chinese women (not US) formed a favorable impression of a store with low social orientation. In their scenarios- the 'service' manipulation includes salesperson greeting the customer upon entry.
Zemke & Shoemaker
2007 Hospitality Management
Scent across a crowded room: Exploring the effect of ambient scent on social interactions
M-R approach-avoidance
Pleasing scent increases social interaction (but not affiliation).
Jiang & Wang 2006 Journal of Services Marketing
The Impact of Affect of Service Quality and Satisfaction: The Moderation of Service Contexts
Expectancy Disconfirmation Theory
Pleasure and arousal have a stronger influence on perceived service quality and satisfaction in a hedonic service context than in a utilitarian service context.

193
Hu and Jasper 2006 International Journal of Retail & Distribution Management
Social Cues in the Store Environment and their Impact on Store Image
Meaning Movement Theory and Social Influence Theory
Consumers have a more favorable attitude toward merchandise and service quality and felt more aroused and pleased with the store when more social cues were present and when there is high-personalized service. Customers are more likely to shop in a store that had more in-store displays of graphics with social meaning.
Bailey and Areni 2006 Journal of Retailing
When a Few Minutes Sound Like a Lifetime: Does Atmospheric Music Expand or Contract Perceived Time?
Attentional vs. discrete events models of duration judgments
Exp 1: Estimated time was shorter when familiar music was played for people waiting idly, music had no effect on respondents ended in a memory task. Exp 2: Only when there are a sufficient number of songs, respondents waiting idly report shorter estimates when they hear familiar music, and those in a memory task reported longer estimates for familiar music
Garlin & Owen 2006 Journal of Business Research
Setting the Tone with the Tune: A Meta-Analytic Review of the Effects of Background Music in Retail Settings
M-R approach-avoidance
Meta-analysis of music atmospherics literature. Familiarity/liking has a positive effect on patronage, the presence of music has a positive effect on patronage and felt pleasure, Slower tempo, lower volume and familiar music results in subjects staying marginally longer at a venue than when the tempo or volume are high, or the music less familiar. A higher volume and tempo, and the less like the music, the longer customers perceive time duration. Tempo has the greatest effect on arousal.
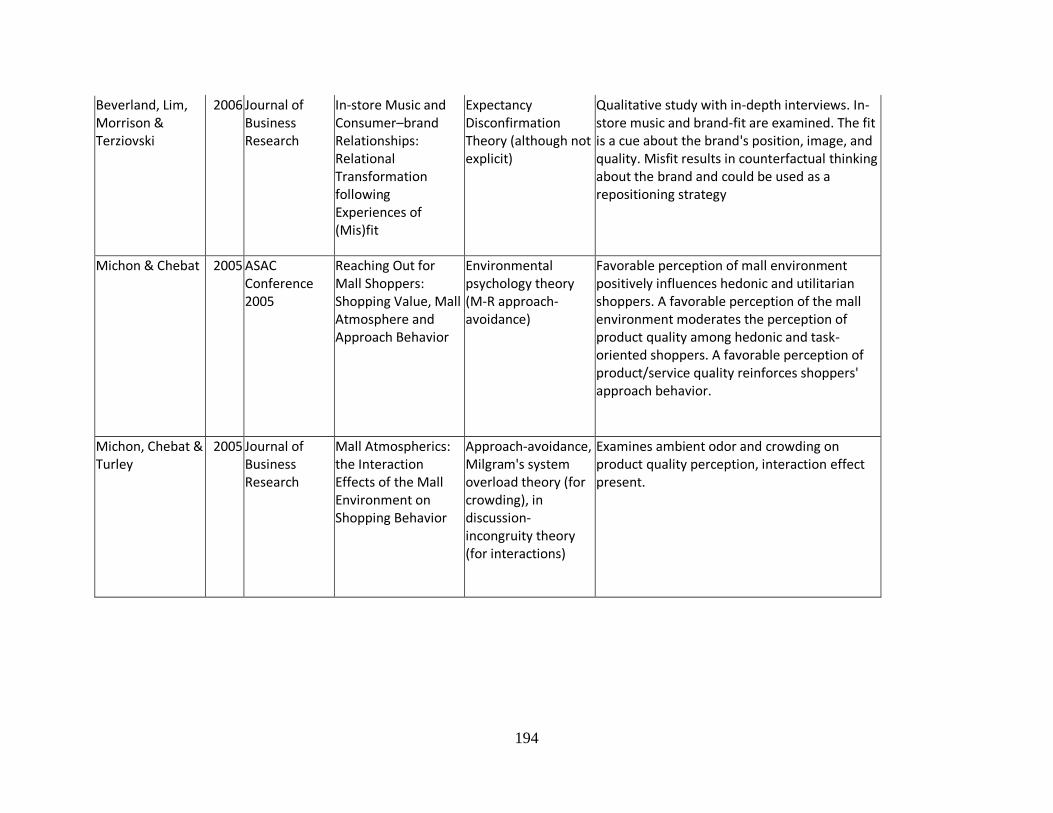
194
Beverland, Lim, Morrison & Terziovski
2006 Journal of Business Research
In-store Music and Consumer–brand Relationships: Relational Transformation following Experiences of (Mis)fit
Expectancy Disconfirmation Theory (although not explicit)
Qualitative study with in-depth interviews. In-store music and brand-fit are examined. The fit is a cue about the brand's position, image, and quality. Misfit results in counterfactual thinking about the brand and could be used as a repositioning strategy
Michon & Chebat 2005 ASAC Conference 2005
Reaching Out for Mall Shoppers: Shopping Value, Mall Atmosphere and Approach Behavior
Environmental psychology theory (M-R approach-avoidance)
Favorable perception of mall environment positively influences hedonic and utilitarian shoppers. A favorable perception of the mall environment moderates the perception of product quality among hedonic and task-oriented shoppers. A favorable perception of product/service quality reinforces shoppers' approach behavior.
Michon, Chebat & Turley
2005 Journal of Business Research
Mall Atmospherics: the Interaction Effects of the Mall Environment on Shopping Behavior
Approach-avoidance, Milgram's system overload theory (for crowding), in discussion-incongruity theory (for interactions)
Examines ambient odor and crowding on product quality perception, interaction effect present.

195
Morrin & Chebat 2005 Journal of Service Research
Person-place congruency: The interactive effects of shopper style ad atmospherics on Consumer Expenditures
M-R approach-avoidance
Propose a congruency model between impulse buying characteristics and atmospherics (music & scent), 2 (music) X2 (scent) X2 (shopping impulse), DVs- Dollar expenditures, mall attribute evaluations, affective quality of environment, hedonic and utilitarian shopping values, pleasure, arousal. This is an example of multiple environmental cues having an interaction effect as consumers perceive the environment holistically, complexity
Eroglu, Machleit, & Chebat
2005 Psychology & Marketing
The Interaction of Retail Density and Music Tempo: Effects on Shopper Responses
Schema incongruity model
Shopper hedonic and utilitarian evaluations of the shopping experience are highest under conditions of slow music/high density and fast music/low density. Also found main effects of music tempo are found for behavioral responses such as approach-avoidance tendency and the extent of browsing behavior
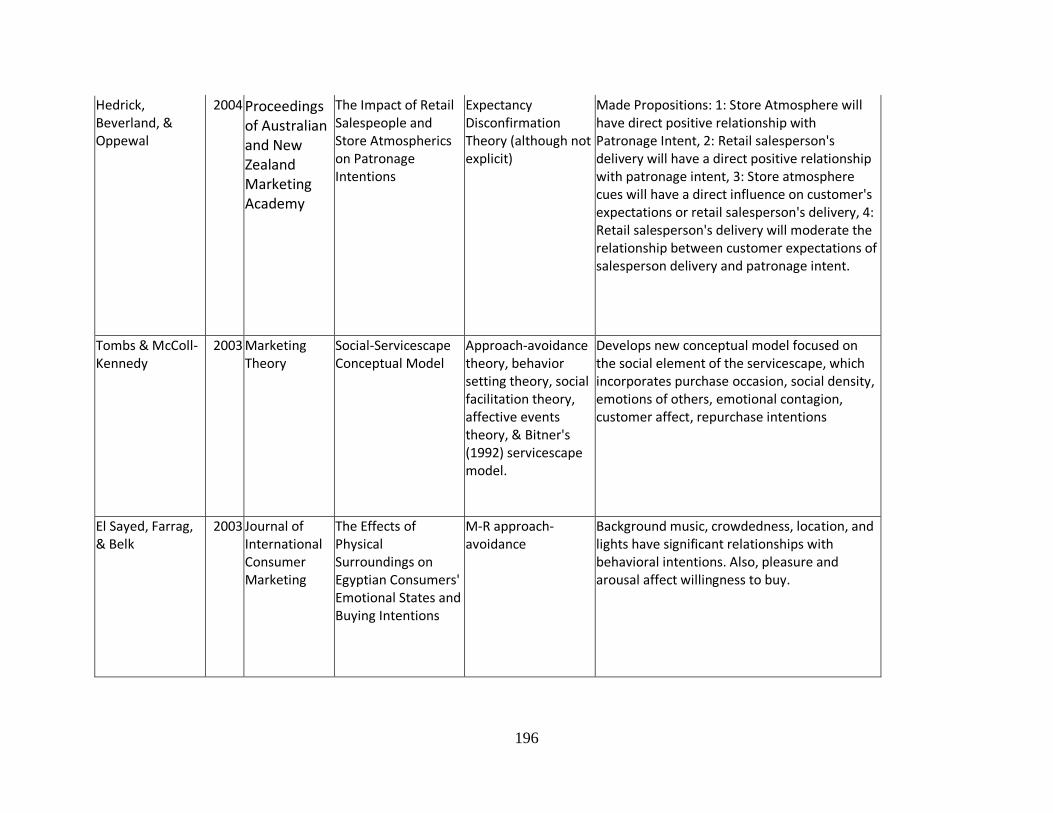
196
Hedrick, Beverland, & Oppewal
2004 Proceedings of Australian and New Zealand Marketing Academy
The Impact of Retail Salespeople and Store Atmospherics on Patronage Intentions
Expectancy Disconfirmation Theory (although not explicit)
Made Propositions: 1: Store Atmosphere will have direct positive relationship with Patronage Intent, 2: Retail salesperson's delivery will have a direct positive relationship with patronage intent, 3: Store atmosphere cues will have a direct influence on customer's expectations or retail salesperson's delivery, 4: Retail salesperson's delivery will moderate the relationship between customer expectations of salesperson delivery and patronage intent.
Tombs & McColl-Kennedy
2003 Marketing Theory
Social-Servicescape Conceptual Model
Approach-avoidance theory, behavior setting theory, social facilitation theory, affective events theory, & Bitner's (1992) servicescape model.
Develops new conceptual model focused on the social element of the servicescape, which incorporates purchase occasion, social density, emotions of others, emotional contagion, customer affect, repurchase intentions
El Sayed, Farrag, & Belk
2003 Journal of International Consumer Marketing
The Effects of Physical Surroundings on Egyptian Consumers' Emotional States and Buying Intentions
M-R approach-avoidance
Background music, crowdedness, location, and lights have significant relationships with behavioral intentions. Also, pleasure and arousal affect willingness to buy.
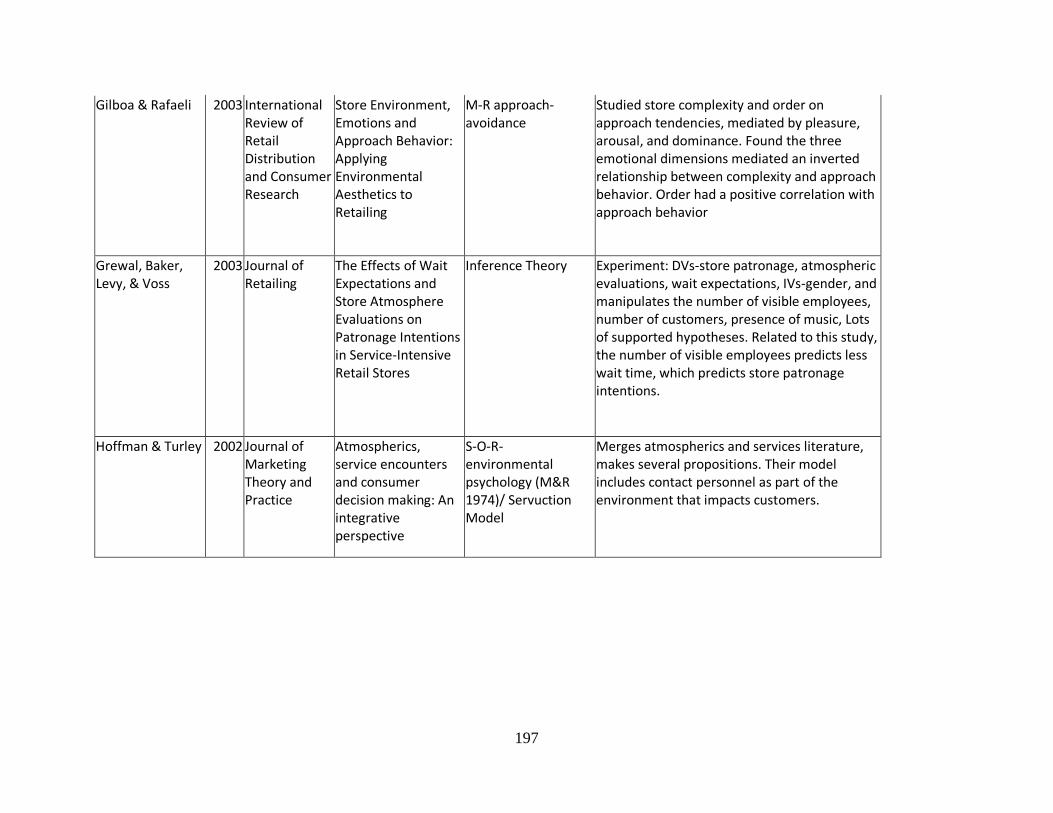
197
Gilboa & Rafaeli 2003 International Review of Retail Distribution and Consumer Research
Store Environment, Emotions and Approach Behavior: Applying Environmental Aesthetics to Retailing
M-R approach-avoidance
Studied store complexity and order on approach tendencies, mediated by pleasure, arousal, and dominance. Found the three emotional dimensions mediated an inverted relationship between complexity and approach behavior. Order had a positive correlation with approach behavior
Grewal, Baker, Levy, & Voss
2003 Journal of Retailing
The Effects of Wait Expectations and Store Atmosphere Evaluations on Patronage Intentions in Service-Intensive Retail Stores
Inference Theory Experiment: DVs-store patronage, atmospheric evaluations, wait expectations, IVs-gender, and manipulates the number of visible employees, number of customers, presence of music, Lots of supported hypotheses. Related to this study, the number of visible employees predicts less wait time, which predicts store patronage intentions.
Hoffman & Turley 2002 Journal of Marketing Theory and Practice
Atmospherics, service encounters and consumer decision making: An integrative perspective
S-O-R- environmental psychology (M&R 1974)/ Servuction Model
Merges atmospherics and services literature, makes several propositions. Their model includes contact personnel as part of the environment that impacts customers.
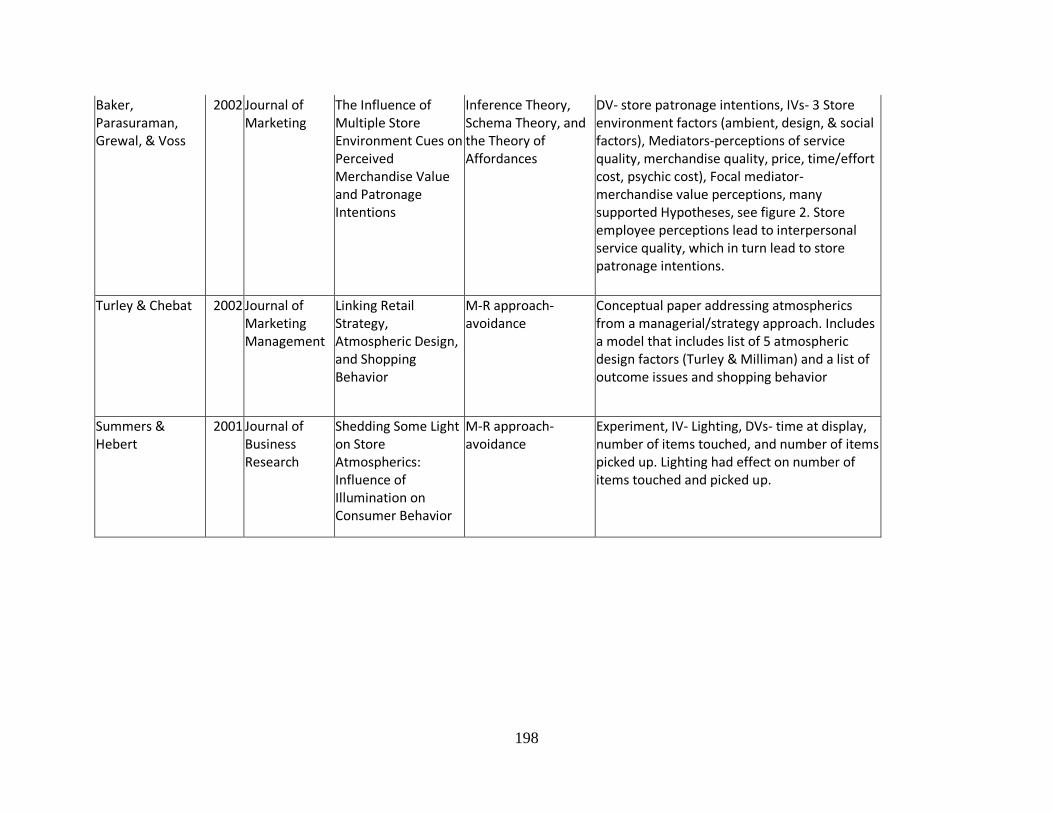
198
Baker, Parasuraman, Grewal, & Voss
2002 Journal of Marketing
The Influence of Multiple Store Environment Cues on Perceived Merchandise Value and Patronage Intentions
Inference Theory, Schema Theory, and the Theory of Affordances
DV- store patronage intentions, IVs- 3 Store environment factors (ambient, design, & social factors), Mediators-perceptions of service quality, merchandise quality, price, time/effort cost, psychic cost), Focal mediator-merchandise value perceptions, many supported Hypotheses, see figure 2. Store employee perceptions lead to interpersonal service quality, which in turn lead to store patronage intentions.
Turley & Chebat 2002 Journal of Marketing Management
Linking Retail Strategy, Atmospheric Design, and Shopping Behavior
M-R approach-avoidance
Conceptual paper addressing atmospherics from a managerial/strategy approach. Includes a model that includes list of 5 atmospheric design factors (Turley & Milliman) and a list of outcome issues and shopping behavior
Summers & Hebert
2001 Journal of Business Research
Shedding Some Light on Store Atmospherics: Influence of Illumination on Consumer Behavior
M-R approach-avoidance
Experiment, IV- Lighting, DVs- time at display, number of items touched, and number of items picked up. Lighting had effect on number of items touched and picked up.
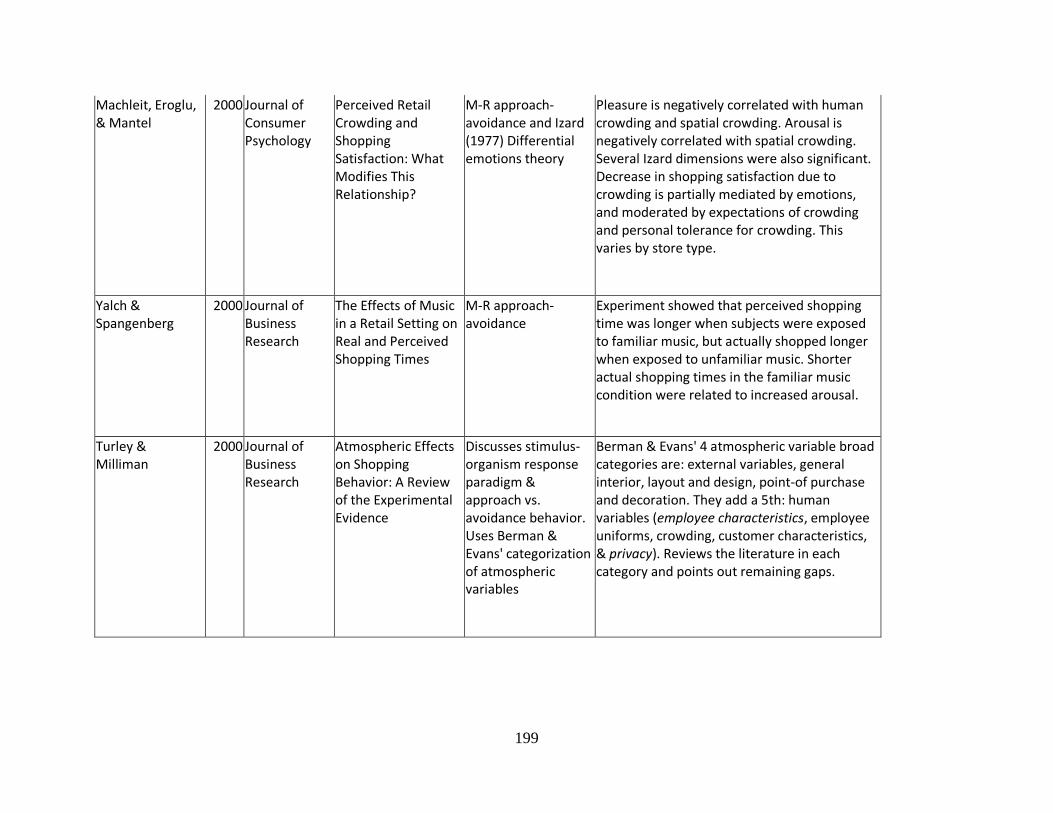
199
Machleit, Eroglu, & Mantel
2000 Journal of Consumer Psychology
Perceived Retail Crowding and Shopping Satisfaction: What Modifies This Relationship?
M-R approach-avoidance and Izard (1977) Differential emotions theory
Pleasure is negatively correlated with human crowding and spatial crowding. Arousal is negatively correlated with spatial crowding. Several Izard dimensions were also significant. Decrease in shopping satisfaction due to crowding is partially mediated by emotions, and moderated by expectations of crowding and personal tolerance for crowding. This varies by store type.
Yalch & Spangenberg
2000 Journal of Business Research
The Effects of Music in a Retail Setting on Real and Perceived Shopping Times
M-R approach-avoidance
Experiment showed that perceived shopping time was longer when subjects were exposed to familiar music, but actually shopped longer when exposed to unfamiliar music. Shorter actual shopping times in the familiar music condition were related to increased arousal.
Turley & Milliman
2000 Journal of Business Research
Atmospheric Effects on Shopping Behavior: A Review of the Experimental Evidence
Discusses stimulus-organism response paradigm & approach vs. avoidance behavior. Uses Berman & Evans' categorization of atmospheric variables
Berman & Evans' 4 atmospheric variable broad categories are: external variables, general interior, layout and design, point-of purchase and decoration. They add a 5th: human variables (employee characteristics, employee uniforms, crowding, customer characteristics, & privacy). Reviews the literature in each category and points out remaining gaps.
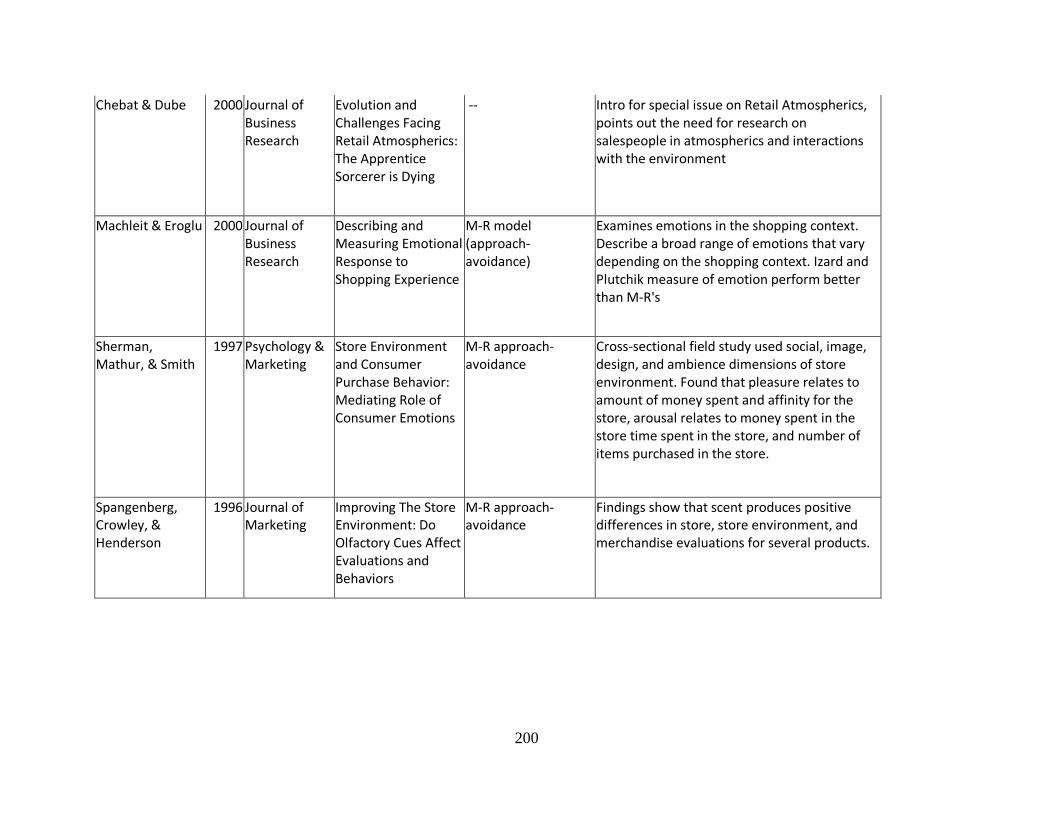
200
Chebat & Dube 2000 Journal of Business Research
Evolution and Challenges Facing Retail Atmospherics: The Apprentice Sorcerer is Dying
-- Intro for special issue on Retail Atmospherics, points out the need for research on salespeople in atmospherics and interactions with the environment
Machleit & Eroglu 2000 Journal of Business Research
Describing and Measuring Emotional Response to Shopping Experience
M-R model (approach-avoidance)
Examines emotions in the shopping context. Describe a broad range of emotions that vary depending on the shopping context. Izard and Plutchik measure of emotion perform better than M-R's
Sherman, Mathur, & Smith
1997 Psychology & Marketing
Store Environment and Consumer Purchase Behavior: Mediating Role of Consumer Emotions
M-R approach-avoidance
Cross-sectional field study used social, image, design, and ambience dimensions of store environment. Found that pleasure relates to amount of money spent and affinity for the store, arousal relates to money spent in the store time spent in the store, and number of items purchased in the store.
Spangenberg, Crowley, & Henderson
1996 Journal of Marketing
Improving The Store Environment: Do Olfactory Cues Affect Evaluations and Behaviors
M-R approach-avoidance
Findings show that scent produces positive differences in store, store environment, and merchandise evaluations for several products.
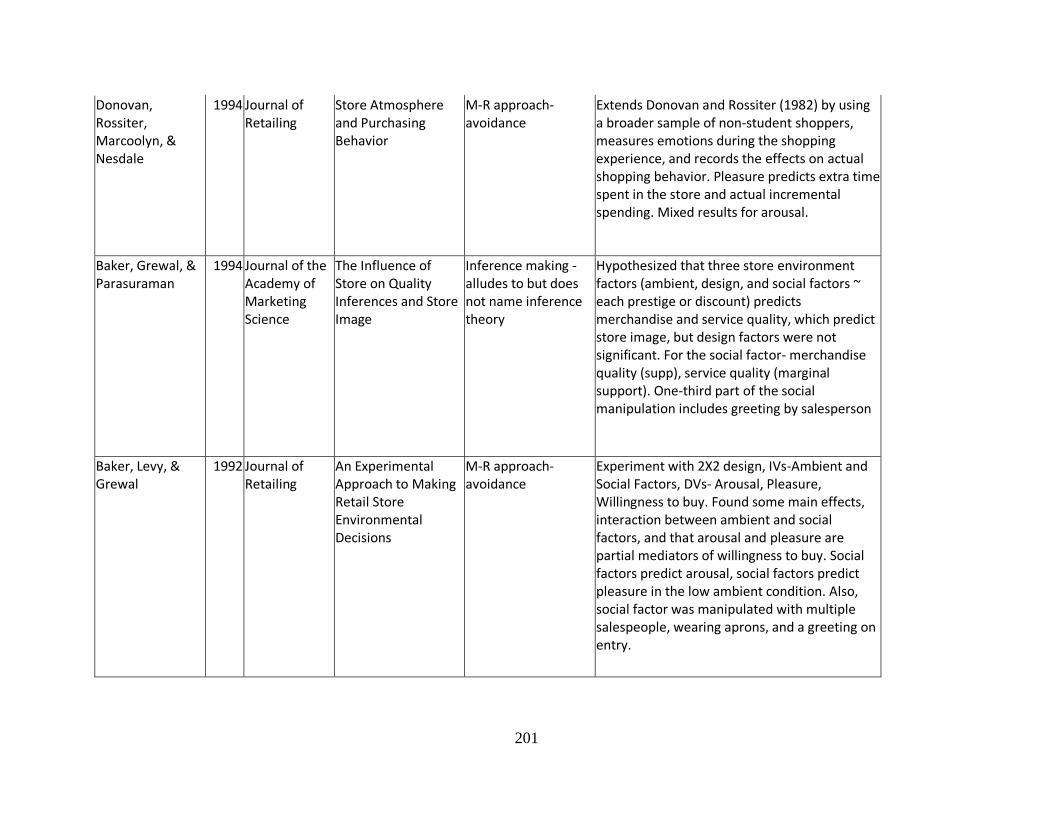
201
Donovan, Rossiter, Marcoolyn, & Nesdale
1994 Journal of Retailing
Store Atmosphere and Purchasing Behavior
M-R approach-avoidance
Extends Donovan and Rossiter (1982) by using a broader sample of non-student shoppers, measures emotions during the shopping experience, and records the effects on actual shopping behavior. Pleasure predicts extra time spent in the store and actual incremental spending. Mixed results for arousal.
Baker, Grewal, & Parasuraman
1994 Journal of the Academy of Marketing Science
The Influence of Store on Quality Inferences and Store Image
Inference making - alludes to but does not name inference theory
Hypothesized that three store environment factors (ambient, design, and social factors ~ each prestige or discount) predicts merchandise and service quality, which predict store image, but design factors were not significant. For the social factor- merchandise quality (supp), service quality (marginal support). One-third part of the social manipulation includes greeting by salesperson
Baker, Levy, & Grewal
1992 Journal of Retailing
An Experimental Approach to Making Retail Store Environmental Decisions
M-R approach-avoidance
Experiment with 2X2 design, IVs-Ambient and Social Factors, DVs- Arousal, Pleasure, Willingness to buy. Found some main effects, interaction between ambient and social factors, and that arousal and pleasure are partial mediators of willingness to buy. Social factors predict arousal, social factors predict pleasure in the low ambient condition. Also, social factor was manipulated with multiple salespeople, wearing aprons, and a greeting on entry.
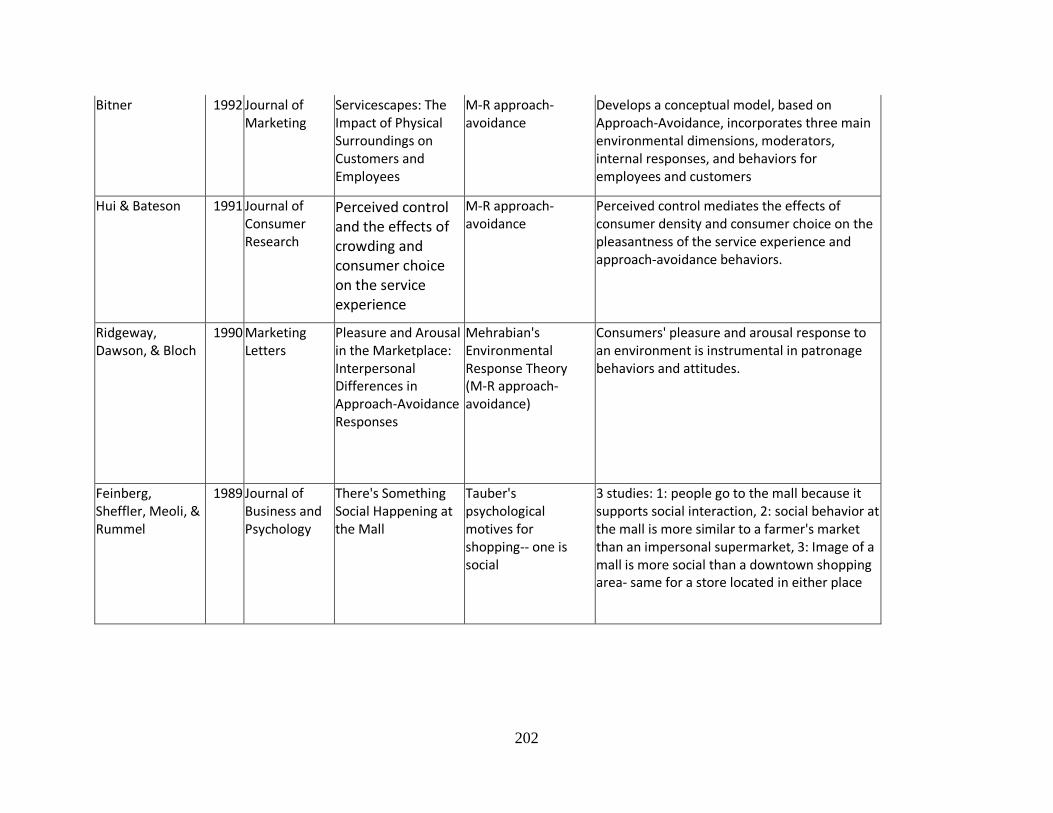
202
Bitner 1992 Journal of Marketing
Servicescapes: The Impact of Physical Surroundings on Customers and Employees
M-R approach-avoidance
Develops a conceptual model, based on Approach-Avoidance, incorporates three main environmental dimensions, moderators, internal responses, and behaviors for employees and customers
Hui & Bateson 1991 Journal of Consumer Research
Perceived control and the effects of crowding and consumer choice on the service experience
M-R approach-avoidance
Perceived control mediates the effects of consumer density and consumer choice on the pleasantness of the service experience and approach-avoidance behaviors.
Ridgeway, Dawson, & Bloch
1990 Marketing Letters
Pleasure and Arousal in the Marketplace: Interpersonal Differences in Approach-Avoidance Responses
Mehrabian's Environmental Response Theory (M-R approach-avoidance)
Consumers' pleasure and arousal response to an environment is instrumental in patronage behaviors and attitudes.
Feinberg, Sheffler, Meoli, & Rummel
1989 Journal of Business and Psychology
There's Something Social Happening at the Mall
Tauber's psychological motives for shopping-- one is social
3 studies: 1: people go to the mall because it supports social interaction, 2: social behavior at the mall is more similar to a farmer's market than an impersonal supermarket, 3: Image of a mall is more social than a downtown shopping area- same for a store located in either place
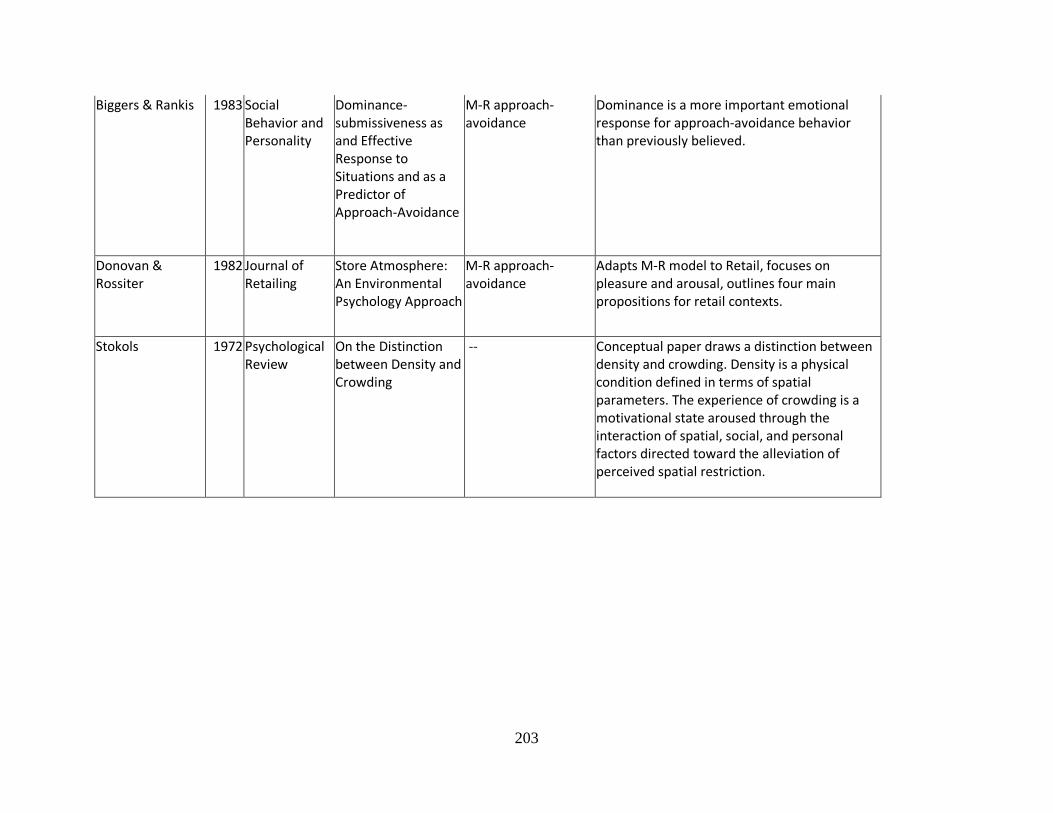
203
Biggers & Rankis 1983 Social Behavior and Personality
Dominance-submissiveness as and Effective Response to Situations and as a Predictor of Approach-Avoidance
M-R approach-avoidance
Dominance is a more important emotional response for approach-avoidance behavior than previously believed.
Donovan & Rossiter
1982 Journal of Retailing
Store Atmosphere: An Environmental Psychology Approach
M-R approach-avoidance
Adapts M-R model to Retail, focuses on pleasure and arousal, outlines four main propositions for retail contexts.
Stokols 1972 Psychological Review
On the Distinction between Density and Crowding
-- Conceptual paper draws a distinction between density and crowding. Density is a physical condition defined in terms of spatial parameters. The experience of crowding is a motivational state aroused through the interaction of spatial, social, and personal factors directed toward the alleviation of perceived spatial restriction.