
The U-Mart Project: New Research and Education Program for Market Mechanism
153
Transcript of The U-Mart Project: New Research and Education Program for Market Mechanism

Agent-Based Social SystemsVolume 2
Series Editor: Hiroshi Deguchi, Yokohama, Japan
ABSS—Agent-Based Social SystemsThis series is intended to further the creation of the science of agent-based social systems, a field that is establishing itself as a transdisciplinary and cross-cultural science. The series will cover a broad spectrum of sciences, such as social systems theory, sociology, business administration, management information science, organization science, computational mathematical organization theory, economics, evolutionary economics, international political science, jurisprudence, policy science, socioinformation studies, cognitive science, artificial intelligence, complex adaptive systems theory, philosophy of science, and other related disciplines.
The series will provide a systematic study of the various new cross-cultural arenas of the human sciences. Such an approach has been successfully tried several times in the history of the modern sciences of humanities and systems and has helped to create such important conceptual frameworks and theories as cybernetics, synergetics, general systems theory, cognitive science, and complex adaptive systems.
We want to create a conceptual framework and design theory for socioeconomic systems of the twenty-first century in a cross-cultural and transdisciplinary context. For this purpose we plan to take an agent-based approach. Developed over the last decade, agent-based modeling is a new trend within the social sciences and is a child of the modern sci-ences of humanities and systems. In this series the term “agent-based” is used across a broad spectrum that includes not only the classical usage of the normative and rational agent but also an interpretive and subjective agent. We seek the antinomy of the macro and micro, subjective and rational, functional and structural, bottom-up and top-down, global and local, and structure and agency within the social sciences. Agent-based model-ing includes both sides of these opposites. “Agent” is our grounding for modeling; simula-tion, theory, and real-world grounding are also required.
As an approach, agent-based simulation is an important tool for the new experimental fields of the social sciences; it can be used to provide explanations and decision support for real-world problems, and its theories include both conceptual and mathematical ones. A conceptual approach is vital for creating new frameworks of the worldview, and the mathematical approach is essential to clarify the logical structure of any new framework or model. Exploration of several different ways of real-world grounding is required for this approach. Other issues to be considered in the series include the systems design of this century’s global and local socioeconomic systems.
Series EditorHiroshi DeguchiChief of Center on Agent-Based Social Systems Sciences (CABSSS)Tokyo Institute of Technology4259 Nagatsuta-cho, Midori-ku, Yokohama 226-8502, Japan
Editorial BoardKathleen Carley, USA Kyoichi Kijima, JapanShu-Heng Chen, Taiwan, ROC Hajime Kita, JapanClaudio Cioffi-Revilla, USA Osamu Sudo, JapanNigel Gilbert, UK Takao Terano, JapanTakatoshi Imada, Japan Kazuo Yoshida, Japan
K. Arai, H. Deguchi, H. Matsui (Eds.)
Agent-Based Modeling Meets Gaming Simulation
With 72 Figures
Kiyoshi Arai, D.Eng.Professor, Faculty of Social Systems ScienceChiba Institute of Technology2-17-1 Tsudanuma, Narashino, Chiba 275-0016, Japan
Hiroshi Deguchi, D.Sc, D.Econ.Professor, Interdisciplinary Graduate School of Science and EngineeringTokyo Institute of Technology4259 Nagatsuta-cho, Midori-ku, Yokohama 226-8502, Japan
Hiroyuki Matsui, D.Eng.Associate ProfessorGraduate School of EconomicsKyoto UniversityYoshida-hommachi, Sakyo-ku, Kyoto 606-8501, Japan
Library of Congress Control Number: 2006925624
ISSN 1861-0803ISBN-10 4-431-29426-0 Springer-Verlag Tokyo Berlin Heidelberg New YorkISBN-13 978-4-431-29426-9 Springer-Verlag Tokyo Berlin Heidelberg New York
This work is subject to copyright. All rights are reserved, whether the whole or part of the material is concerned, specifically the rights of translation, reprinting, reuse of illustrations, recitation, broad-casting, reproduction on microfilms or in other ways, and storage in data banks.The use of registered names, trademarks, etc. in this publication does not imply, even in the absence of a specific statement, that such names are exempt from the relevant protective laws and regulations and therefore free for general use.
Springer is a part of Springer Science+Business Mediaspringer.com© Springer-Verlag Tokyo 2005Printed in Japan
Typesetting: SNP Best-set Typesetter Ltd., Hong KongPrinting and binding: Hicom, Japan
Printed on acid-free paperSeries number: 7188
Preface
This collection of excellent papers cultivates a new perspective on agent-based social system sciences, gaming simulation, and their hybridization. Most of the papers included here were presented in the special session titled Agent-Based Modeling Meets Gaming Simulation at ISAGA2003, the 34th annual conference of the International Simulation and Gaming Association (ISAGA) at Kazusa Akademia Park in Kisarazu, Chiba, Japan, August 25–29, 2003.
This post-proceedings was supported by the twenty-first century COE (Centers of Excellence) program Creation of Agent-Based Social Systems Sciences (ABSSS), established at the Tokyo Institute of Technology in 2004. The present volume comprises papers submitted to the special session of ISAGA2003 and provides a good example of the diverse scope and standard of research achieved in simulation and gaming today. The theme of the special session at ISAGA2003 was Agent-Based Modeling Meets Gaming Simulation.
Nowadays, agent-based simulation is becoming very popular for modeling and solving complex social phenomena. It is also used to arrive at practical solutions to social problems. At the same time, however, the validity of simulation does not exist in the magnificence of the model. R. Axelrod stresses the simplicity of the agent-based simulation model through the “Keep it simple, stupid” (KISS) principle: As an ideal, simple modeling is essential.
Many actual social phenomena are more complex than can be described by the simple modeling principle, however. We need to construct a model of complex phenomena as a replica of a real situation. It is difficult to combine reality and sim-plicity in a model, especially when the phenomena include many agents as decision makers. How can we make the two different modeling principles compatible?
Gaming and simulation offers an answer. If a human player can participate in a simulation model as a player–agent, then he can easily recognize the reality of the model. Hybrid simulation makes possible the hybridization of gaming simula-tion and agent-based simulation in a model. In a hybrid simulation, model human players and machine agents simulate (play) the model at the same time.
The papers collected in this volume are not limited to gaming simulation and its hybridization. Also included are contributions related to a participatory approach and real-world grounding in the broad sense. Social simulation is a
V
research field in which we study not only simulation technology but also its social implementation and communication among agents via a simulation model. Social simulation provides a social or organizational shared internal model, and that model gives us an anticipatory system for feed-forward management. Hybrid gaming technology can increase the total ability of feed-forward management in our global society in a participatory manner and can contribute to problem solving in this century.
We are happy to think that this book may contribute to the emerging new policy sciences where the participatory approach, social learning, and anticipa-tion via simulation play important roles in sharing in the problem situation and creating an acceptable accommodation. We expect the book to stimulate research-ers in the traditional gaming simulation field, where we are devoted to face-to-face communication. Consequently, we have made light of the relation between network gaming and computer simulation.
Gaming simulation also contributes to the exploration of new directions in decision sciences by creating a new experimental field in which highly structured and model-based decision making comes into play. It becomes a great challenge to explore new types of decision making by heterogeneous agents who have dif-ferent internal models and use the models for anticipation, coordination, and mutual reference as semantic activities.
Traditional gaming simulation was developed not for designing experiments but for pragmatic activities. Thus, compared with experimental economics, we do not provide any monetary incentive for game players. By contrast, most gaming simula-tion is well structured and has strong repeatability. Gaming simulation deals with agent interaction in which agents have different internal models for their anticipatory decision making and semantic activities. From the engineering point of view, our agent technology cannot catch up with the complexity of human gaming.
Social simulation research should accept that challenge. For this purpose we recommend that researchers of social simulation design human gaming simula-tions for understanding the varieties of human internal models and their mutual interactions. It is also essential to experience the repeatability of gaming under the given boundary condition and its structural change by varying the gaming boundary. Nowadays, hybrid gaming in our sense of the term is called role playing in the European research context of social simulation. From the context of social sciences, role playing has a different research history. This shows how little interaction there has been between the traditional social sciences and emerging agent-based social simulation.
In conclusion, we will be very pleased if this book can play a part in the devel-opment of both simulation and gaming research on the one hand and an agent-based approach on the other by inspiring both research groups to further theoretical and practical research bridging the two approaches.
March 1, 2006Kiyoshi Arai
Hiroshi DeguchiHiroyuki Matsui
VI Preface
Contents
Preface . . . . . . . . . . . . . . . . . . . . . . . . . . . . . . . . . . . . . . . . . . . . . . . . . . . . . . . . . V
Agent-Based Modeling Meets Gaming Simulation: Perspective on Future Collaborations
H. Deguchi . . . . . . . . . . . . . . . . . . . . . . . . . . . . . . . . . . . . . . . . . . . . . . . . . . . 1
A Horizon of Simulation and Gaming: Difficulties and Expectations of Facilitating Science, Technology, and Practice
K. Arai . . . . . . . . . . . . . . . . . . . . . . . . . . . . . . . . . . . . . . . . . . . . . . . . . . . . . . 15
The U-Mart Project: New Research and Education Program for Market Mechanism
H. Matsui, K. Taniguchi, Y. Nakajima, I. Ono, H. Sato, N. Mori, H. Kita, T. Terano, H. Deguchi, and Y. Shiozawa . . . . . . . . . . . . . . . . . 23
The Gaming of Firm Strategy in High-Tech Industry: Human Agents and Artificial Intelligence Agents Intermingled in a Simulation Model
H. Lee and H. Deguchi . . . . . . . . . . . . . . . . . . . . . . . . . . . . . . . . . . . . . . . . 31
Simulation Analysis Using the Garbage Can Model for Designing a Citizen Participation System for Comprehensive Municipal Planning
T. Kaneda and Y. Hattori . . . . . . . . . . . . . . . . . . . . . . . . . . . . . . . . . . . . . . 39
Exploring Business Gaming Strategies by Learning AgentsM. Kobayashi and T. Terano . . . . . . . . . . . . . . . . . . . . . . . . . . . . . . . . . . . 49
Business Simulator Development Cycle with Both Human and Computer Players
A. Morikawa and T. Terano . . . . . . . . . . . . . . . . . . . . . . . . . . . . . . . . . . . . 59
Analyzing Barnga Gaming Simulation Using an Agent-Based ModelY.I.L. Suematsu, K. Takadama, K. Shimohara, O. Katai, and K. Arai . . . . . . . . . . . . . . . . . . . . . . . . . . . . . . . . . . . . . . . . . . . . . . . . . . 69
VII
VIII Contents
User Type Identification in Virtual WorldsR. Thawonmas, J.-Y. Ho, and Y. Matsumoto . . . . . . . . . . . . . . . . . . . . . . 79
A Model for Collusive Tendering Based on a Multiagent ApproachJ. Tanimoto and H. Fujii . . . . . . . . . . . . . . . . . . . . . . . . . . . . . . . . . . . . . . . 89
An Agent-Based Simulation Model of Disruptive TechnologiesC. Buchta, D. Meyer, A. Mild, A. Pfister, and A. Taudes . . . . . . . . . . . . 101
Agent-Based Simulation on the Diffusion of Research and Development for Environmentally Conscious Products
K. Zaima . . . . . . . . . . . . . . . . . . . . . . . . . . . . . . . . . . . . . . . . . . . . . . . . . . . . 119
Evaluation of the Dealings Form in an Artificial Fruit and Vegetable Market II
S. Tsujioka and K. Yamamoto . . . . . . . . . . . . . . . . . . . . . . . . . . . . . . . . . . 139
Index . . . . . . . . . . . . . . . . . . . . . . . . . . . . . . . . . . . . . . . . . . . . . . . . . . . . . . . . . . 149

1
Agent-Based Modeling Meets Gaming Simulation: Perspective on Future CollaborationsHiroshi Deguchi
Tokyo Institute of Technology, Interdisciplinary Graduate School of Science and Engi-neering, 4259 Nagatsuta-cho, Midori-ku, Yokohama 226-8502, Japan
Introduction
Agent-based modeling (ABM), a simulation method involving autonomous agents, has attracted attention in recent years as a new and developing modeling method in the field of social science. Traditional methods that seek to understand, learn, and analyze the complicated features of socioeconomic systems by involv-ing human beings as players in gaming simulation (GS) are also exploring new directions by incorporating gaming with ABM. In the past, these two methods had very little to do with each other; however, it is very important to compare ABM with GS so as to determine ABM’s validity and ability to describe actual socioeconomic systems. It is possible that a hybrid model combining both GS with human players and ABM will create a far wider range of possibilities. This chapter will offer a methodological analysis of a research program based on the relationship between these two methods.
Currently, it seems that GS has taken root in Japan primarily as a technique with a wide range of applications in education and research [1]. There are two separate communities of researchers in the area of social simulation. One is investigating computer simulation such as agent-based simulation (ABS); the other is investigating GS. There are strong links between these two communities in Japan, with some cooperation in joint research projects [2–4]. This level of cooperation is not so common in the worldwide research network. One reason for this difference is that the Japanese research communities are smaller and a situation is now emerging where researchers are crossing over between the two communities.
However, when it comes to defining exactly what gaming is, it is difficult to claim that there is agreement or consensus among researchers [1,5–7]. In addi-tion, the level of understanding of GS among communities that use “gaming simulation” in a broader sense is open to debate. Primarily there are still research communities that think only of human gaming and not of computer simulation
2 H. Deguchi
when they hear the word simulation. Within these communities the impression of computer simulation is extremely negative. This is in part caused by past mis-conceptions, but mainly by the fact that the social science simulations of a decade ago were distinctly separate from the analysis of human group dynamics through gaming for sharing of understanding, problem solving, and education. However, the development of new-generation ABS and ABM is opening the way to under-standing societies and organizations from the bottom up through machine agent activities. The combination of this new-generation computer simulation and GS enables new research programs to be developed.
This chapter will analyze three points: first, the bottom-up modeling technique that is expected to be at the forefront of the new social science; second, examina-tion of the real-world grounding and validity of this new modeling method; and finally the possibility of hybrid GS, the combination of human gaming with ABM, that is developing as a tool for interactive education, risk communication, and a new method of policy science.
What Is Gaming?
GS is used across a broad range of fields including education, policy science, business studies, and skills training. One of the roots of gaming is the analysis of political systems, including international relations. However, nowadays, the usage of gaming in this area has declined, at least in the USA and Europe. In policy think-tanks such as Rand Corporation and the Brookings Institution there are few gaming researchers at the present time focusing on ABM, a new policy simu-lation technique. For example, the Brookings Institution has established a special-ized research center on social and economic dynamics and is taking the initiative in this field [8,9], but it has no relationship with GS societies. In Rand Corpora-tion there are both ABM researchers and GS researchers but there are few con-nections between them.
In Ritsumeikan University and other Japanese universities there are research-ers carrying on the work of Kanji Seki, who died several years ago, and a large-scale gaming of international relations is being utilized in classes [10]. Seki used to argue that international relations comprise a highly complex system with many actors, and to analyze these relations the method of gaming is one of the most effective approaches. Seki stated that analyzing the behaviors of complex systems, including the decision-making processes of the main actors, is recognized as the main purpose of GS. This approach is in common with that of R. Axelrod, an eminent scholar of international politics. Axelrod also thought simple repetitive games were not capable of analyzing international relations after the end of the Cold War and converted his research program to an agent-based approach. At the same time R. Axelrod emphasized the KISS principle, which is an abbrevia-tion of “keep it simple, stupid,” and used it as a modeling principle of ABS to achieve robust models [11].

Agent-Based Modeling Meets Gaming Simulation 3
In contrast, GS is an actively used technique throughout the world today to solve problems and formulate policies for cities and communities in the context of risk communication. At the local level, when designing cities, planning policy, and solving problems in communities and regions, the gaming method maintains its position as a policy science and design science with an interpretive and hermeneutic orientation.
In the field of business administration, business GS is widely used to help our understanding of business logic. Business gaming, along with case studies, also provides an important means of practical training in business administration. Business games offer a good opportunity for the virtual reality learning of par-ticular subjects such as marketing and accounting procedures as elements of business logic. Business GSs have various styles; one such GS is “the beer game,” the logic of which is relatively well known. It is a game that has the possibility of different scenarios being developed in response to the players’ actual behavior. Nowadays, however, GSs are not only designed for educational purposes but rather they are formulated so as to reconstruct both business logic and social architecture by studying and analyzing typical case examples of companies, indus-tries, and societies. When designing these complex GSs it is difficult to work with human players only.
Therefore, by combining ABM and GS, we would like to model real organiza-tions and social phenomena as hybrid multiagent systems consisting of both human and machine agents. This would enable the establishment of a system for analyzing, understanding, and solving problems. Through this concept, a scenario would be created that inevitably starts from the case example of a corporate organization or industrial structure. This would then in turn be analyzed and understood by creating a hybrid multiagent system and could be applied to the creation of industrial policy or business analysis. It would also be possible to create a social science research program based on such an approach.
In a similar way, hybrid GS is used in the fields of sociology and organizational theory for analyzing social phenomena. William Gamson’s Simsoc and several variations of Simsoc are the traditional GS of an artificial society, intended to recreate the problems within a given social structure [12]. We play Simsoc only with human players. Simsoc and the gaming of international relations by Ritsu-meikan University (mentioned above) are the largest examples of GS that use human players only. If we want to design a larger scale of gaming or to introduce more complex interactions we need the help of machine (software) agents in the model. Then the hybrid multiagent system can be introduced to traditional gaming and will open many new possibilities in this social science field.
When we broaden our viewpoint to include general education, risk communi-cation, social informed consent, and shared decision making, there are many wide-ranging applications in which gaming can be used. Within education, gaming is recognized as a highly effective method for keeping pupils’ attention and enhancing learning within the classroom. By taking part in gaming sessions, pupils are inevitably involved in the game and can concentrate and maintain their atten-tion, which is often not the case with passive or traditional classroom learning.
4 H. Deguchi
However, at its highest level, gaming has developed as a kind of art form to explore in many different ways and directions the relation between the subject studied and the pupils’ concentration and attention. There is an argument that through interaction within the gaming situation, the best gaming enables the creation of a high level of creative intelligence, such as is developed in the Socratic dialogue method. However, this ideal can only be realized at the highest level of the art of gaming.
In fact, many educational games do not follow the standard techniques of allocating players roles as in business and social gaming. For example, a technique may be used that creates a rather chaotic situation by giving the players contra-dictory information. An example of this technique was demonstrated by Jan H. G. Klabbers at the ISAGA 2002 conference, where his dialog about gaming was itself a kind of gaming. It was a brilliant piece of gaming involving all the participants at the venue. They ware asked to stand and by purposely providing a working thesis that it was impossible to compare gaming knowledge, those who were interested in gaming were bound to make a counter argument. The gaming stimulated and encouraged the dialog and led to a very creative discussion. This example illustrates how, simply by starting from the allotted roles, gaming can exceed the limited boundaries of the game and is an important method for inter-active learning.
Today, so-called e-learning is progressing in a rather tool-oriented direction and approaches education in terms of two axes; the first is the electronic and networking educational method and the second is the material to be studied. In contrast, gaming is a discipline seeking to explore a wide variety of interactive learning techniques. As a result, gaming experiments with different educational methods that are not seen in the existing e-learning approach; however, with gaming there is a requirement that players at least maintain an interest in the issues of the game, although their attention and interest can be encouraged by interaction with the facilitators.
Next we give a concrete example illuminating the relationship between GS and ABM and its hybridization.
Environment Management Gaming
Gaming Simulation of Common PasturelandEnvironment management gaming is a form of group gaming aimed at simulating a group of players who graze sheep on common pastureland [2,5]. Environment management gaming focuses on the tragedy of the commons. After the famous story of the tragedy of the commons by Garrett Hardin [13,14], many economists and sociologists have paid attention to the tragedy of the commons and its related topics.
GS is not a computer simulation; it is a game designed for human players. GS is also different from psychological role playing in which the roles of players are
Agent-Based Modeling Meets Gaming Simulation 5
given by subjective description. In GS the role for each agent (player) is definedconcretely and a player acts under the well-defined boundary conditions of the roles.
We assume that there is a limited amount of pastureland and the shepherds want to extend their flocks; however, the land is limited. The result is a social dilemma among agents. There is a dilemma between individual rationality and collective rationality as well.
A gaming facilitator coordinates all the transactions in the gaming session. The players can perform a series of transactions with the facilitator: buy, sell, or rent sheep, and buy food or other goods. There is a currency used in the transactions that is called a money unit (MOU). The goal of the players is to maximize their wealth by increasing the number of sheep they own.
The gaming session is divided into terms. At the end of each term the number of sheep owned by each player is multiplied by a reproduction rate. This rate depends on the total number of sheep on the pastureland. Players become wealthier by increasing the number of sheep they own, but the higher the total number of sheep on the pastureland the lower the reproduction rate. The players are thus posed a social dilemma.
Environment management gaming is played by at least five players and a gaming facilitator. The players must pay 2 MOUs for food every gaming term. The number of the term is written on a card and put in front of the player so that other players can see the card at any time. When a player rents some sheep from the facilitator, as payment, he must return twice that number of sheep after two gaming terms. The facilitator must keep track of all the rents and obligations of the players.
At the beginning of the gaming session, each player starts with three sheep and no cash. During the game, the player sells some sheep to pay for food and other goods. He can also rent or buy sheep from the facilitator paying him some money. Each sheep costs 2 MOUs. This price is constant throughout the game.
At the end of each term the facilitator calculates the reproduction rate and tells each player the resulting number of sheep with which they start the next term. The reproduction rate varies from 1.0 to 2.0 but the players do not know the exact way this rate is calculated. At the end of each term the players are informed about the total number of sheep and the reproduction rate by the facilitator. When the reproduction rate is 1, the number of sheep stays the same, which means that the parent sheep do not die.
If a player has rented some sheep, he must pay back twice that number two terms later. A player must pay for any sheep bought in cash. The only way to get cash is by selling sheep. The number of sheep to be sold or bought in a single term is limited to seven.
A player becomes bankrupt when he cannot return the rented sheep or cannot buy food. Players are allowed to sell rented sheep to pay for food, but cannot rent more sheep before returning all the sheep previously rented (if any). A player that goes bankrupt can return to the game with the initial three sheep.
6 H. Deguchi
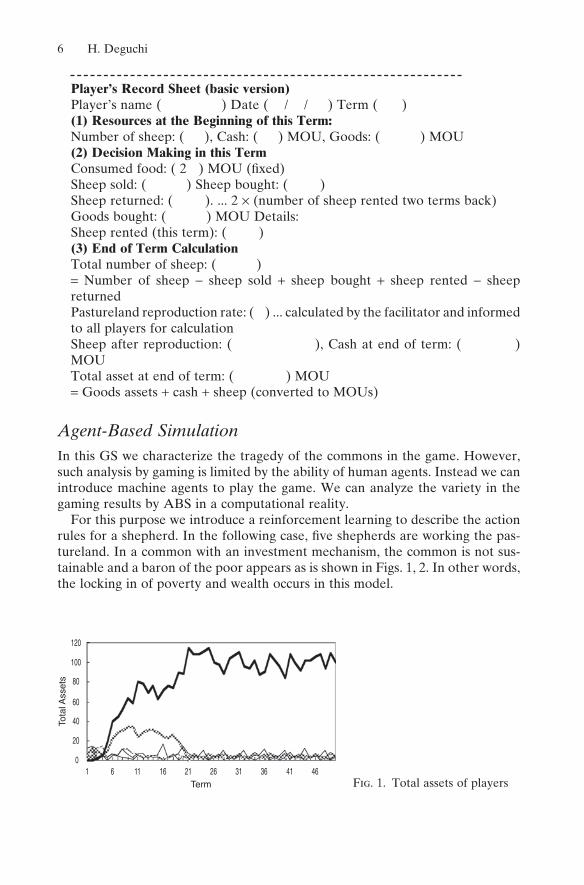
Player’s Record Sheet (basic version)Player’s name ( ) Date ( / / ) Term ( )(1) Resources at the Beginning of this Term:Number of sheep: ( ), Cash: ( ) MOU, Goods: ( ) MOU(2) Decision Making in this TermConsumed food: ( 2 ) MOU (fixed)Sheep sold: ( ) Sheep bought: ( )Sheep returned: ( ). ... 2 × (number of sheep rented two terms back)Goods bought: ( ) MOU Details:Sheep rented (this term): ( )(3) End of Term CalculationTotal number of sheep: ( )= Number of sheep − sheep sold + sheep bought + sheep rented − sheepreturnedPastureland reproduction rate: ( ) ... calculated by the facilitator and informed to all players for calculationSheep after reproduction: ( ), Cash at end of term: ( ) MOUTotal asset at end of term: ( ) MOU= Goods assets + cash + sheep (converted to MOUs)
Agent-Based SimulationIn this GS we characterize the tragedy of the commons in the game. However, such analysis by gaming is limited by the ability of human agents. Instead we can introduce machine agents to play the game. We can analyze the variety in the gaming results by ABS in a computational reality.
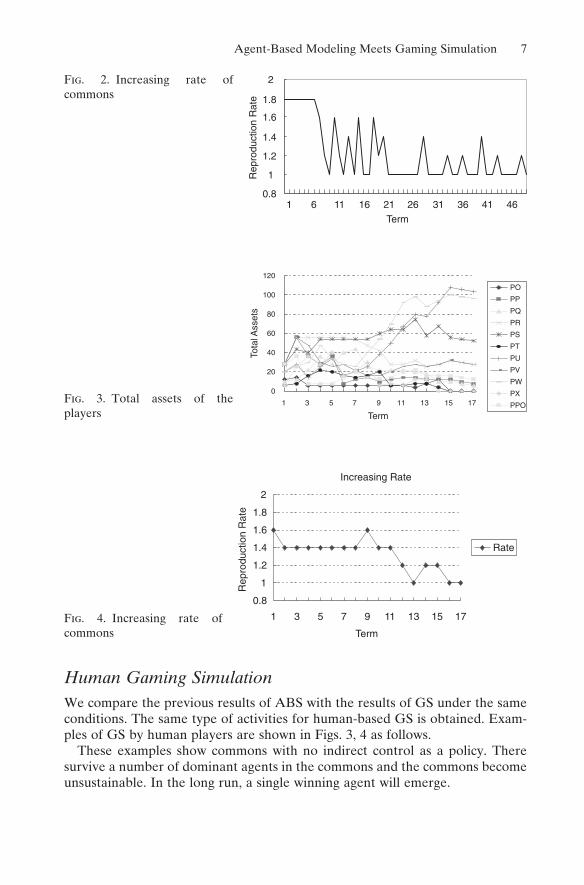
For this purpose we introduce a reinforcement learning to describe the action rules for a shepherd. In the following case, five shepherds are working the pas-tureland. In a common with an investment mechanism, the common is not sus-tainable and a baron of the poor appears as is shown in Figs. 1, 2. In other words, the locking in of poverty and wealth occurs in this model.
Fig. 1. Total assets of players
0
20
Tota
l Ass
ets
40
60
80
100
120
1 6 11 16 21Term
26 31 36 41 46
Agent-Based Modeling Meets Gaming Simulation 7
Human Gaming SimulationWe compare the previous results of ABS with the results of GS under the same conditions. The same type of activities for human-based GS is obtained. Exam-ples of GS by human players are shown in Figs. 3, 4 as follows.
These examples show commons with no indirect control as a policy. There survive a number of dominant agents in the commons and the commons become unsustainable. In the long run, a single winning agent will emerge.
Fig. 2. Increasing rate of commons
Fig. 3. Total assets of the players
Fig. 4. Increasing rate of commons
0.8
1
1.2
1.4
Rep
rodu
ctio
n R
ate
1.6
1.8
2
1 6 11 16 21 26
Term
31 36 41 46
0
20
40
60
80
100
120
1 3 5 7 9 11 13 15 17
Term
PO
PP
PQ
PR
PS
PT
PU
PV
PW
PX
PPO
Tota
l Ass
ets
Increasing Rate
0.8
1
1.2
1.4
1.6
1.8
2
1 3 5 7 9 11 13 15 17
Term
Rep
rodu
ctio
n R
ate
Rate
8 H. Deguchi
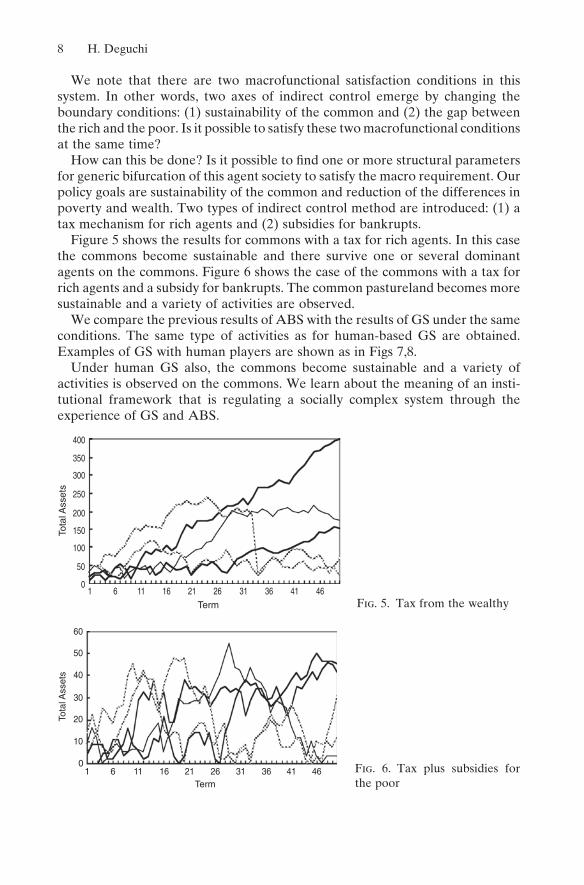
We note that there are two macrofunctional satisfaction conditions in this system. In other words, two axes of indirect control emerge by changing the boundary conditions: (1) sustainability of the common and (2) the gap between the rich and the poor. Is it possible to satisfy these two macrofunctional conditions at the same time?
How can this be done? Is it possible to find one or more structural parameters for generic bifurcation of this agent society to satisfy the macro requirement. Our policy goals are sustainability of the common and reduction of the differences in poverty and wealth. Two types of indirect control method are introduced: (1) a tax mechanism for rich agents and (2) subsidies for bankrupts.
Figure 5 shows the results for commons with a tax for rich agents. In this case the commons become sustainable and there survive one or several dominant agents on the commons. Figure 6 shows the case of the commons with a tax for rich agents and a subsidy for bankrupts. The common pastureland becomes more sustainable and a variety of activities are observed.
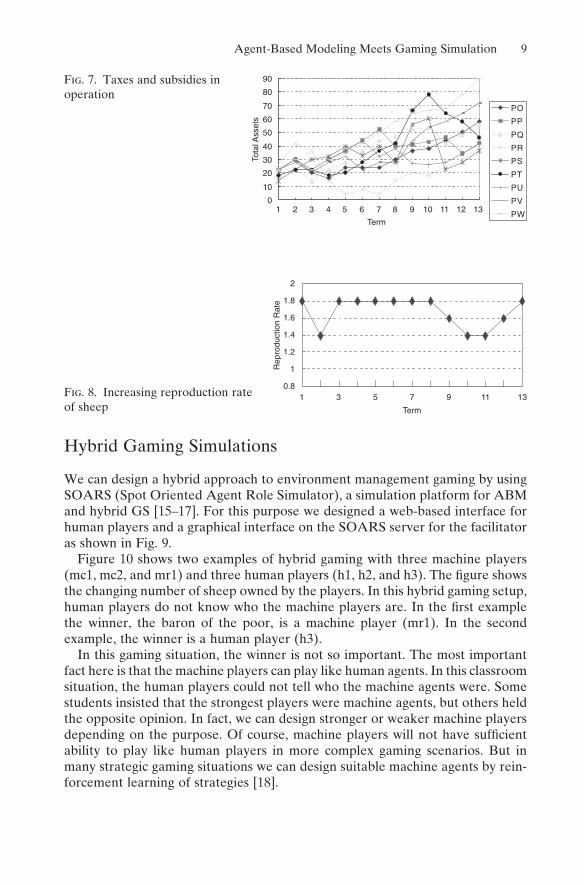
We compare the previous results of ABS with the results of GS under the same conditions. The same type of activities as for human-based GS are obtained. Examples of GS with human players are shown as in Figs 7,8.
Under human GS also, the commons become sustainable and a variety of activities is observed on the commons. We learn about the meaning of an insti-tutional framework that is regulating a socially complex system through the experience of GS and ABS.
Fig. 5. Tax from the wealthy
Fig. 6. Tax plus subsidies for the poor
0
50
100
150
200
Tota
l Ass
ets
250
300
350
400
1 6 11 16 21Term
26 31 36 41 46
0
10
20
30
40
Tota
l Ass
ets
Term
50
60
1 6 11 16 21 26 31 36 41 46
Agent-Based Modeling Meets Gaming Simulation 9
Hybrid Gaming Simulations
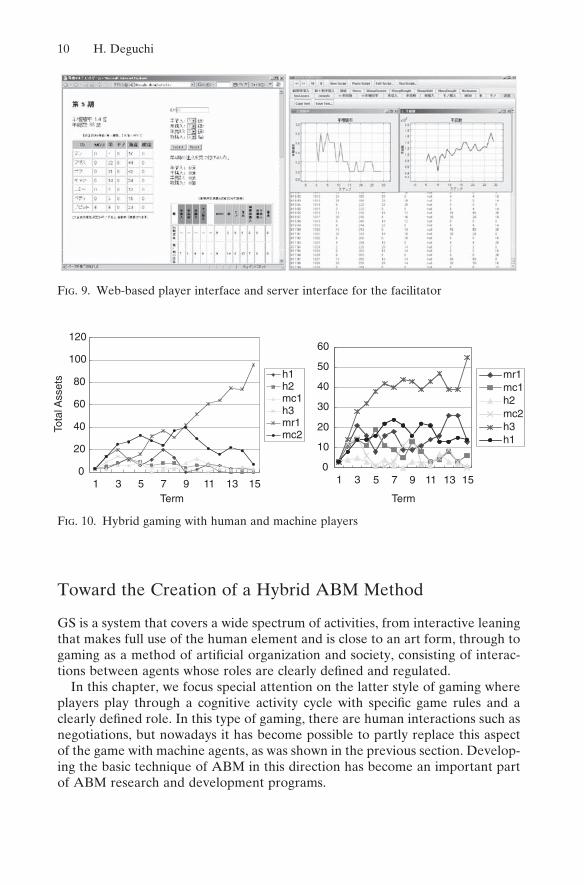
We can design a hybrid approach to environment management gaming by using SOARS (Spot Oriented Agent Role Simulator), a simulation platform for ABM and hybrid GS [15–17]. For this purpose we designed a web-based interface for human players and a graphical interface on the SOARS server for the facilitator as shown in Fig. 9.
Figure 10 shows two examples of hybrid gaming with three machine players (mc1, mc2, and mr1) and three human players (h1, h2, and h3). The figure shows the changing number of sheep owned by the players. In this hybrid gaming setup, human players do not know who the machine players are. In the first example the winner, the baron of the poor, is a machine player (mr1). In the second example, the winner is a human player (h3).
In this gaming situation, the winner is not so important. The most important fact here is that the machine players can play like human agents. In this classroom situation, the human players could not tell who the machine agents were. Some students insisted that the strongest players were machine agents, but others held the opposite opinion. In fact, we can design stronger or weaker machine players depending on the purpose. Of course, machine players will not have sufficientability to play like human players in more complex gaming scenarios. But in many strategic gaming situations we can design suitable machine agents by rein-forcement learning of strategies [18].
Fig. 7. Taxes and subsidies in operation
Fig. 8. Increasing reproduction rate of sheep
0
10
20
30
40
50
Tota
l Ass
ets 60
70
80
90
1 2 3 4 5 6 7 8 9 10 11 12 13
Term
PO
PP
PQ
PR
PS
PT
PU
PV
PW
0.8
Term
1
1.2
1.4
Rep
rodu
ctio
n R
ate
1.6
1.8
2
1 5 11 137 93
10 H. Deguchi
Toward the Creation of a Hybrid ABM Method
GS is a system that covers a wide spectrum of activities, from interactive leaning that makes full use of the human element and is close to an art form, through to gaming as a method of artificial organization and society, consisting of interac-tions between agents whose roles are clearly defined and regulated.
In this chapter, we focus special attention on the latter style of gaming where players play through a cognitive activity cycle with specific game rules and a clearly defined role. In this type of gaming, there are human interactions such as negotiations, but nowadays it has become possible to partly replace this aspect of the game with machine agents, as was shown in the previous section. Develop-ing the basic technique of ABM in this direction has become an important part of ABM research and development programs.
Fig. 9. Web-based player interface and server interface for the facilitator
Fig. 10. Hybrid gaming with human and machine players
0
20
40
60
Tota
l Ass
ets 80
100
120
1 3 5 7 9Term Term
11 13 15
h1h2mc1h3mr1mc2
0
10
20
30
40
50
60
31 5 7 9 11 13 15
mr1mc1h2mc2h3h1
Agent-Based Modeling Meets Gaming Simulation 11
This type of gaming is different from the classic artificial intelligence analysis of a board game in which players engage in forecasting as in the searching of a decision tree and in fixed activities that are proscribed by a set of rules. The players construct models by learning about the environment and themselves. Through their actions they learn strategies and how to evaluate these strategies; sometimes, however, they fail to learn these skills and even by overcompensating are unable to catch up with the changing situation. It is essential to create models using machine agents that can recreate the human decision-making process and also the different ways of failing that are often observed when humans as actors learn.
We now examine the new possibility of creating models of real organizational and social phenomena using a hybrid multiagent system consisting of both human and machine agents.
The significance of bringing ABM into GS can be summarized in two points. First, it is significant that by mixing machine agent players and human players it will be possible to create and design games with more complicated multiple artificial societies and organizations. There have been many attempts by using computers to construct more complicated systems of gaming so as to support the interaction between players and their environment. This trend is especially prom-inent in business games. Nowadays, situations have occasionally arisen in not only ABM but also in network games that in effect have passed the Turing test. In the case of the multi-user dungeon (MUD) game with a built-in artificial intelligent agent, some new players were deceived for a short time, and there is an example that occurred in the development process of Ultima Online when some system programmers mistook their own system’s nonplayer character (NPC), i.e., a machine agent, as a hacker. In the hybrid gaming scenarios mentioned previously, human players could not tell who the machine agents were.
In the GS model of large-scale artificial societies and economies, machine agents are indispensable for designing and analyzing the gaming scenario. When designing complex and large-scale GSs, it is extremely difficult to adjust the game balance and to maintain the interpretative validity of the model. Even though we can model a social structure as a well-balanced game, if the players’ activities exceed the designer’s expectations, the game balance often collapses. In this case, if machine players can confirm various possibilities of interactions on a large scale, the design of the game balance will be very straightforward. Machine players enable us to model and analyze various types of complicated societies and organizational structures without a large number of persevering human players.
In the case of environment management gaming it is difficult to determine tax and subsidy policies for fair competition without experiments with machine players. In more complex cases we can optimize some political parameters by using a genetic algorithm with machine agent-based experiments under a certain policy evaluation function. For the validity of modeling, hybrid gaming is also important and essential. Human players can understand what process is working in the model by playing from different points of view. Human players can attend
12 H. Deguchi
the gaming session as a policy maker or any other role they want to play to investigate the model and its real-world grounding. In this case machine players support gaming dynamics by carrying out the other players’ roles. Hybrid GS provides a personal, organizational, or social internal model for feedfoward man-agement of personal, organizational, or social decision making. GS provides a shared internal model for anticipation, evaluation, and decision making.
The second significant point is that by blending gaming with ABM, gaming can break away from the realms of technique or art and establish its position as a social science. Gaming in the past was a tool of policy science as well as an edu-cational technique. Today, research using gaming to express complex interna-tional relations is not always popular. To firmly establish gaming itself as a modeling method and not just a technique or art, it needs a methodology that understands human activity in systemic terms. It is essential for such a method to make use of bottom-up autonomous agents to understand such a system. For its development as a design science, GS must return once again to the main path of social science as a policy design science and move away from education as its core discipline. This direction will lead to an inevitable blend of gaming and ABM. As mentioned earlier in the complementary arguments of Seki and Axelrod, to comprehend a complex system including actors, it is essential to analyze the system with the aid of bottom-up agents.
At the moment there is considerable discussion about whether current ABM is an established social science. At the moment, ABM as a methodology of social science has many issues of concern such as the examination of the model’s valid-ity and reality and it has little in common with the functional approach. Unfor-tunately there is too much focus on the techniques and methods of ABM and from this viewpoint ABM and gaming share the same problems.
Using gaming with human agents is a significant and healthy step toward con-firming and examining the validity and reality of ABS. However, this does not mean the adoption of a narrow scientific view as is found in experimental eco-nomics, for example. We would like to create a decision-making model of machine agents based on human players’ experiences in gaming that includes flexiblelevels of learning. Human agents have a variety of internal models for anticipa-tion, evaluation, and decision making in general. An internal model is used for feedfoward control and management by an agent. The learning of the internal model gives a feedback mechanism on the feedfoward process. Internal models are constructed and used in different ways, such as personal models, organization-ally shared and socially shared models, or nonshared models. The strategy of the internal model for an agent activity can also be learned through reinforcement learning. Evaluation prior to making a decision is also achieved though landscape learning. The proposed model would not be a pure version or slight variation of a rational decision-making model. We have to extend the one-shot rational decision-making model toward not only a rational learning model but also an option-oriented, long-range decision-making model depending on suitable internal models and evaluation methods.
From the viewpoint of organization and cognitive science, this hypothesis could become the basis of a future scientific analysis of social systems. Within these
Agent-Based Modeling Meets Gaming Simulation 13
hypotheses we need to introduce a strategic agent into hybrid gaming where a machine agent that corresponds to a human strategy anticipates, evaluates, and executes decision making depending on an internal reference model; this model itself should be learned with related agents.
When ABM is used for analyzing organizations and societies, we need not only bottom-up modeling but also the functional systems viewpoint. This view is not currently emphasized among ABM researchers; however, it is essential in the design of organizational or social systems. The meeting of GS and ABM would be greatly enriched by the incorporation of such a functional modeling view.
References1. Arai K (1999) Gaming simulation (in Japanese). JUSE, Tokyo2. Deguchi H (1998) Agent-based approach for social complex systems. In: Ishida T (ed)
Community computing and support systems. Springer, Tokyo, pp 62–773. Takagi H, Kijima K, Deguchi H (1995) Humanity and society in the multimedia era
(in Japanese). JUSE, Tokyo4. U-Mart Project, http://www.u-mart.econ.kyoto-u.ac.jp/index-e.html5. Deguchi H (2004) Economics as an agent-based complex system: toward agent-based
social systems sciences. Springer-Verlag, Tokyo6. Duke RD (1974) Gaming: the future’s language. Wiley7. Greenblat C (1988) Designing games and simulations: an illustrated handbook.
Sage8. Epstein JM, Axtell RL (1996) Growing artificial societies: social science from the
bottom up. MIT Press9. Axtel R (2006) Firm sizes: facts, formulae and fantasies. http://www.brook.edu/es/
dynamics/default.htm10. Seki K (1997) Global simulation and gaming: toward global politics as a complex
system (in Japanese). Foundation for the Fusion of Science and Technology11. Axelrod R (1997) The complexity of cooperation: agent-based models of competition
and collaboration. Princeton University Press12. Gamson WA (1978) Simsoc: simulated society participants manual with selected read-
ings. Free Press13. Hardin GR (1968) The tragedy of the commons. Science 162:1243–124814. Schulz U, Albers W, Muller U (eds) (1994) Social dilemmas and cooperation.
Springer-Verlag15. Deguchi H, Tanuma H, Shimizu T (2004) SOARS: spot-oriented agent role simulator.
In: Proceedings of AESCS’04, Springer-Verlag, pp 49–5616. Ishiyama K, Tanuma H, Deguchi H (2005) A hybrid learning environment in the field
of social science. The Third International Conference on Creating, Connecting and Collaborating through Computing, Kyoto University, Kyoto
17. Kaneko H, Ishiyama K, Lee H, Koyama Y, Deguchi H (2005) Approaching the hybrid-ization of agent-based simulation and gaming simulation. ISAGA Conference
18. Lee H, Deguchi H (2003) Hybrid-gaming of firm strategy in a high-tech industry: human agents and AI agents intermingled in a simulation model. ISAGA 2003 Proceedings, pp 921–929
15
A Horizon of Simulation and Gaming: Difficulties and Expectations of Facilitating Science, Technology, and PracticeKiyoshi Arai1
What Lies Behind the Problems of Gaming Simulation?
Researchers and educators believe that gaming simulation is an effective educa-tional tool and that it has something to offer that is very different from the more traditional or passive educational methods found in classrooms and lecture halls throughout the world today. Gaming simulation can only continue to be increas-ingly useful in many different areas of research and education, but against this trend we must set a deep-rooted distrust of the successful educational effects of gaming, especially among those educators with little or no experience of gaming simulation. At the same time, there is little appreciation of the importance of gaming research. Putting aside the question of its educational effectiveness and focusing on the importance of research, it would seem that not only do research-ers outside the gaming research community harbor prejudices and misunder-standings, but the gaming researchers themselves have also failed to understand the strengths and weaknesses of gaming simulation.
The following is somewhat stereotypical, but I believe, essentially representa-tive of the thoughts that lie behind the distrust of gaming; thoughts that are such an obstacle to gaming research.
The limitations of natural science methodologyPower and authority in educationStructure and flow: the negative dynamics of decision making
How influential these factors are discussed below.
The Limitations of Natural Science Methodology
To conduct a real life experiment in an actual society for research purposes raises sensitive ethical issues and could be accompanied by danger to both society and the participants. Therefore, researchers use gaming as a “research method” to
1 Project Management, Faculty of Social Systems Science, Chiba Institute of Technology, 2-17-1 Tsudanuma, Narashino, Chiba 275-0016, Japan
16 K. Arai
conduct a simulation within a simulated society, collect the data, and make use of them for their research. In some cases, the simulation method may be used to examine an existing theory, or as a research method to construct a new or modi-fied theory. However, if gaming is positioned as a research method based on the classic research view of exploring “nature as it really exists throughout the uni-verse,” which is the basic philosophy of the natural sciences, the following weak points and problems of gaming require serious thought and consideration.
It is impossible to conduct controlled experiments.It cannot be used as a reliable means of collecting objective data.It is difficult to replicate an experiment.
At the present time, the idea of gaming as a means to aid research, common in the early stage of its history, is no longer taken seriously and it is a common perception among gaming researchers that gaming, although successful in educa-tion, does not work well in the area of research. However, the very idea of making use of gaming simulation as a natural science research tool is essentially mis-guided. This raises two questions.
Firstly, in physics there is the basic hypothesis that the natural laws of the cosmos and the ones within a laboratory are the same and this premise generally works well. There is also the belief that basic laws do not change even though parameters may change temporally and because of this belief physics does not experience any contradictions between the world of the laboratory and the physi-cal universe. There is a concept of a universal application of law. When measuring social phenomenon, however, this premise of universal applicability cannot apply. It is unreasonable to think that what happened in a gaming simulation model society will actually happen in a real society in the same way as it occurred in the game. Even though you may construct a society as accurately as possible within the micro-reality of a well-structured game, it is not the authentic or real world and even players themselves may behave in one way within the game, but in the real world behave in another. It is natural and to be expected that players will not always behave as anticipated by researchers.
Secondly, the existence of any universal law as thought of in the natural sci-ences raises questions. Natural science considers that mind and matter are sepa-rate and assume that the physical world exists independently; however, in social science it is unreasonable and unworkable to consider the symbolic world as independent and separated from human beings. It is certain that the reality of the symbolic world is a social construct and yet we spend our daily lives feeling that such a world is the genuine reality and it is possible to see the world of ideas, theoretically correct answers, and the symbolic world as an objective world, but as we all know they are very different from the physical world.
From the natural scientific standpoint, it is difficult to know how to understand and assimilate the events occurring in gaming into the body of natural scientificknowledge. In conclusion, it is fundamentally wrong to link the experimental constructs of gaming and the constructive experiments of physics together; rather, the role of gaming should be thought of as an innovative and dynamic method
Horizon of Simulation and Gaming 17
of exploring social possibilities. In other words, it is absolutely wrong to position gaming simulation along an extended line of social expressions defined by math-ematical formulization and an algorithm computer simulation, as found in deci-sion theory. Fortunately humans are far too complex, unique, and interesting to act or behave as the game designer wants or anticipates. Gaming should be regarded as collaboration between designer, facilitator, and player and they all learn through the medium of the game. From the designers’ or researchers’ view-points, it is not the results that confirm the original expectations or the reproduc-ibility of the experiment that need to be evaluated, but those moments and interactions that have transcended the designer’s expectations and yielded such a rich and unexpected diversity of behaviors and results.
Power and Authority in Education
From the viewpoint of natural science, research activity is conducted to only obtain “true knowledge” and the “research method” is only an experimental device or tool to fulfill that purpose. Authoritative education dictates “what should be learned” and “the procedure by which it should be learned.” This knowledge has been clarified by research and has often been categorized by society. The role of teachers and the “educational method” is to initiate students with the true knowledge by using the right procedures and methodology.
Authoritarianism creates many harmful and negative effects. It envisages a simplistic model that knowledge flows in one direction from researchers who learn from observing and interpreting phenomena, to educators who passively learn from the researchers, to students who are spoon fed predigested knowledge by educators and this means the people who are in the upper stream of knowl-edge are acknowledged as wiser and having more power and authority. Authori-tarianism gives rise to various evils such as research’s superiority over education, the rejection of the right to question existing knowledge, and to challenge the established standards. Gaming-based education is criticized from the authoritar-ian viewpoint for the following reasons.
Students do not always consciously understand what they are learning.Teachers cannot control the way in which the content is made use of by the
students.Teachers cannot easily evaluate the learning results.It is as if the students are only playing, not learning.
This assumption of the superiority of research that lies behind the authoritar-ian educational view can be a factor to alienate communication among gaming researchers. If the extreme research and educational views as outlined above are applied to gaming simulation, there will be almost no common ground between the two fields of research and education when considering “gaming as a method.” The researchers use gaming as a tool that is a part of the research method while the educators in turn use gaming as a tool that is a part of the educational method.
18 K. Arai
The universal scientific and ethical principles that underpin society are passed onto players (students) by the medium of research and educational methods in a one-way direction. In this case even though the research method and educa-tional method are the same, their functions are completely reversed. In research, researchers receive data from subjects, while in education educators send data to subjects. With the two groups at the opposite ends of the spectrum it is not sur-prising that researchers and educators are on different wavelengths.
In authoritarian education, knowledge, skills, and attitudes have been forced into “true knowledge,” “useful skills,” and “preferred attitudes,” respectively, and the underlying thought is that only “players with little knowledge” can learn or be guided through gaming. So long as education is based on such a view, only this “true knowledge” and understandable knowledge, in other words, knowledge that can be easily measured and is often acquired by repetitive drill or practice, is emphasized and any education and training situation with ambiguity at which gaming excels tends to be downgraded.
Whether gaming is viewed as an educational method or not, there are now many gaming researchers who are moving away from such a restrictive view and placing education at the cutting edge of change. Anybody who has truly experi-enced gaming would have to agree that as an educational tool gaming is highly successful. Unfortunately, however, at the present time, it is a belief based on individual experience and has not been fully demonstrated, a situation that has not changed very much since the 1970s.
Structure and Flow: The Negative Dynamics of Decision Making
As has been shown, authoritarianism can provide a negative structure that impedes the free flow of knowledge, but it is possible to harmonize the structure and flow to create an enlightened decision-making process.
If scientific rationality is pursued to its extreme, it is assumed that decision making is conducted to select “the most suitable choice” from solutions that have been found (or can be found) by the scientific method, and the purpose of the “decision-making method” is to help those who make a decision discover and choose the most appropriate course of action. However, real life is a little more complicated and whether such an ideal can ever be realized is open to debate. This brings us to the question: what kind of decision making is gaming best used for? For example, a democratically elected official such as a mayor or governor might choose to use gaming as a tool to provide information and insight into the correct course of action. A researcher offers advice to a decision maker based on a “scientific forecast” drawn from a gaming experiment. Because it is a gaming simulation, human players participate, but the basic idea is no different from a deterministic computer simulation. If a “preferred plan” has been discovered by using gaming as a research method, then gaming as an educational method trans-
Horizon of Simulation and Gaming 19
mutes to a “consensus-making method,” and by guiding and teaching players with little specialist knowledge, a consensus from players such as local residents involved in the plan may be obtained. Such an enlightened decision-making process may be described as a combination of natural scientific research and authoritarian education. A classroom, students, and an educator are simply replaced by a region, residents, and a decision maker (or a bureaucrat), respec-tively. The flow of knowledge is understood as a one-way street from an authority (or central bureaucrat) who understands social phenomenon to residents who are nonspecialist amateurs.
When gaming is used in the decision-making field, researchers of gaming simu-lation are forced to take a difficult position. If they are completely ignorant about the target system, they cannot design the game let alone play a role as a facilitator. Players also often seek the opinion of the facilitators and expect them to take on the role of a specialist. It is often difficult to make players, especially players who are not used to gaming, understand that the major point of gaming is dynamic discussion rather than definitive conclusion and the facilitator can be trapped into playing the role of a helpless specialist. With this point in mind, if players act as if they are specialists in the targeted field, the facilitator can then more easily carry out their role and encourage the flow of play and interaction between players. This criticism of the enlightened decision-making process could be resolved by a facilitator acknowledging their lack of expertise in the subject content and the players recognizing the facilitator as a master of the art of gaming.
In decision-making situations it is often difficult to clearly separate the process of “creating alternative plans” from the process of “choosing a plan” and increas-ingly there are many cases when the “creator” and the “chooser” are both unclear about this distinction. In addition, players will obviously have differing percep-tions of any situation. At the stage of gaming design, gaming is closely related to the implementation of a social system, but at the implementation and debriefingstages to reaffirm the system, interdependent collaboration becomes more impor-tant so as to reaffirm the integrity of the system.
Expectations for Gaming Simulation
Even though there are various problems and issues to be resolved, gaming researchers think that gaming is the best method in education, research and decision-making with a great hidden potential, this belief is born of their actual gaming experience and although it may not be fully documented, it would seem that many researchers who have experienced gaming also share these opinions.
Harmony Between Research and EducationAlthough the educational effects of gaming have not been fully proved in mea-surable terms, many gaming researchers can confirm its positive benefits. Espe-cially in the higher education institutions such as universities, it is possible for
20 K. Arai
students to deepen their understanding about theory from practical experience of games such as SIMSOC. Students can establish basic abstract principles by reading textbooks, but gaming is a form of training enabling students to recon-struct a theory for themselves through their own social experience and after debriefing with other players. The design and practice of gaming offers many productive opportunities to connect the fields of research and education.
Communication Among ResearchersAll mammals play to acquire life skills such as the ability to hunt and forage. Humans are the most playful of the mammals, so naturally the activities of gaming have their best effect when played in a playful, pleasant, and lighthearted atmosphere. Even in a stiff and formal academic conference where serious researchers gather, gaming generates a communication style, which is quite unique and distinctive. The basic attitude of many academics usually ranges from mutual criticism to open gladiatorial confrontation, but if such criticism is given in an environment where researchers can feel safe psychologically, this is a major improvement and encouragement. Especially in the areas of interdisciplinary discussion, communication among researchers is not just important but abso-lutely vital. Gaming can improve any structured communication environment. Once a participant joins a gaming activity, it is difficult for them to remain within the safe boundaries of their specialty. They are naturally drawn into the discus-sion and experience the “real” events that are happening within the game.
The Relation Between Researchers and Their SubjectsResearchers cannot continue to study a subject analytically if they are separated from the subject. They describe the research subject as a model in gaming and allocate roles to players. They must deal with the players’ responses and behavior, not a static construct. At the designing stage, they look at the subject from an objective position as an observer, but at the implementation stage of gaming they have no choice but to join the players, learn with them, and examine the system from within. Researchers are thus always forced to confront, examine, and review the reality and integrity of their model’s system.
Collaboration with Agent-Based Modeling: A Breakthrough?
The original idea of gaming simulation was not to see a social system as a simple mechanical system, but as a system of interdependent collaboration where par-ticipants choose, decide, and interact, with mutual reference of others’ inner models. As seen, the idea of gaming actually involves more than recognizing a social system as just an interdependent collaboration system, but as a means whereby players can actually play. Gaming provides a structured communication
Horizon of Simulation and Gaming 21
environment where players can learn through interaction from inside the system. Through debriefing, players exchange their experiences and differing viewpoints with each other, crystallizing their total game experience into an objective view-point, and naturally deepening their intellectual understanding of the system and subject. The facilitator (and the designer of the gaming) are given the unique opportunity to reexamine the system model that formed the foundation of the gaming design through exchanging opinions with the players (particularly, in the case where players are specialists) in the game subject. At the present time, gaming is heading in two directions: one is the dissemination of new scientificknowledge (especially method) and the other is the reexamination of past scien-tific knowledge.
It can only be of the greatest benefit to the gaming community to encourage communication between participants with very different views, and, by findingcommon ground together, it is my hope the horizon of the social sciences will be broadened by the new experimentation with such projects as the combining of gaming with agent-based Modeling, a form of nondeterministic computer simula-tion. Although only a small number of such projects have been initiated, they have yielded rich and unexpected results and generated new theories. This is the dawn of a new era of academic collaboration and although it cannot be predicted how far it will develop (perhaps we should develop a game to help us simulate and predict just where it might lead us), and even though gaming simulation and agent-based modeling have only recently met, I know many of us share the same great expectations for their mutual development in the future.
23
The U-Mart Project: New Research and Education Program for Market MechanismHiroyuki Matsui, Kazuhisa Taniguchi, Yasuhiro Nakajima, Isao Ono, Hiroshi Sato, Naoki Mori, Hajime Kita, Takao Terano, Hiroshi Deguchi, and Yoshinori Shiozawa
Graduate School of Economics/Faculty of Economics Kyoto University, Yoshida-hommachi, Sakyo-ku, Kyoto 606-8501, Japan
Introduction
Complex movements in the market economy, typically observed in the financialmarket, have not been fully explained by conventional economic theories. A new approach to this issue is the use of an artificial market in which computers create a virtual market by agent-based simulation. Studies of artificial markets have achieved a variety of interesting results and have also clarified difficulties that are peculiar to agent-based simulation approaches [1,2], such as:
1. Researchers from different fields need to cooperate due to the interdiscipli-nary nature of the approach,
2. It is very difficult to design a model that combines the complexity to imitate real markets and the simplicity to allow computational experiments to be conducted, and
3. Researchers need to share common understanding on experimental configura-tion and results that are much more complicated than those of conventional theoretical models.
U-Mart [3,4] is a research program that provides a method for the study of artificial markets. The program builds an artificial market simulation system as a test bed for economists and computer scientists to conduct studies through shared understanding. The system is exposed to members of the public, and participants are solicited in the hope of promoting various studies on the market. A salient feature of the U-Mart project is that it interrelates three activity areas, namely, research, events such as open experiments, and education, in order to understand the market and to establish a control methodology. Accordingly, human experi-ments in college education are not only expected to produce educational effects but also to occupy an important position in the U-Mart project. We are therefore eager to collect expertise in performing the experiment and to develop it as
24 H. Matsui et al.
courseware. This chapter reports the basic idea and principles of the U-mart project along with some experiments and a case study of education.
What Is the U-Mart Project?
U-Mart is the collective name of an artificial futures market system, where the stock price index J30 is used as the underlying asset, and human agents and machine agents can simultaneously participate in trading via a local area net-work (LAN), the Internet, and its related tools, and conduct activities using them. Socioeconomic systems such as financial markets are typically complex and designing the artificial system is a difficult yet urgent challenge. It is necessary to evaluate information provision methods in various classes and the influences of trading rules so as to develop the method for indirect control of the market.
When designing the financial market system, it is necessary to consider the issue of “cross reference,” where individuals and organizations with different skills, abilities, and experience participate in the market and influence each other while they learn and create. To tackle this complicated challenge, it is critical that researchers from various fields, including engineering, economics, and psychology, take part and approach the problem from the disciplines of artificial intelligence, artificial markets, cognitive science, and learning theory, in addition to conven-tional market study.
To promote such interdisciplinary study, common ground shared by research-ers from various fields is needed. Therefore, we think that it is important to share not only the subject of the study, namely, designing the financial market, but also the test bed for the approach, i.e., the equipment necessary for the study. The U-Mart project was organized to provide a common test bed that could be shared by researchers interested in the behavior of the financial market and other socioeconomic systems, as well as the behavior of economic bodies that operate within.
The artificial futures market developed for research purposes is also used in college education as courseware for programming exercises and market analysis. It also provides opportunities to collect many experimental data and investment programs as well as opportunities for discussion by researchers from various fields. The U-Mart system is the collective name of the simulation environment in which futures of Mainichi Shimbun J30, an actual stock index, are traded on a virtual market, so that it can reflect the complexity of the actual market and at the same time form a unique price (Fig. 1).
The U-Mart system is a server–client system that uses a dedicated protocol built on TCP/IP to exchange trading information on the Internet. The server that simulates the stock exchange accepts orders from clients, executes pricing and trading, and manages the asset account. Each client obtains information such as price movements from the server and places orders based on their own decision. The form of the client is not a problem as long as the client behaves according to the trading protocol. Therefore, in designing the system, consideration is given
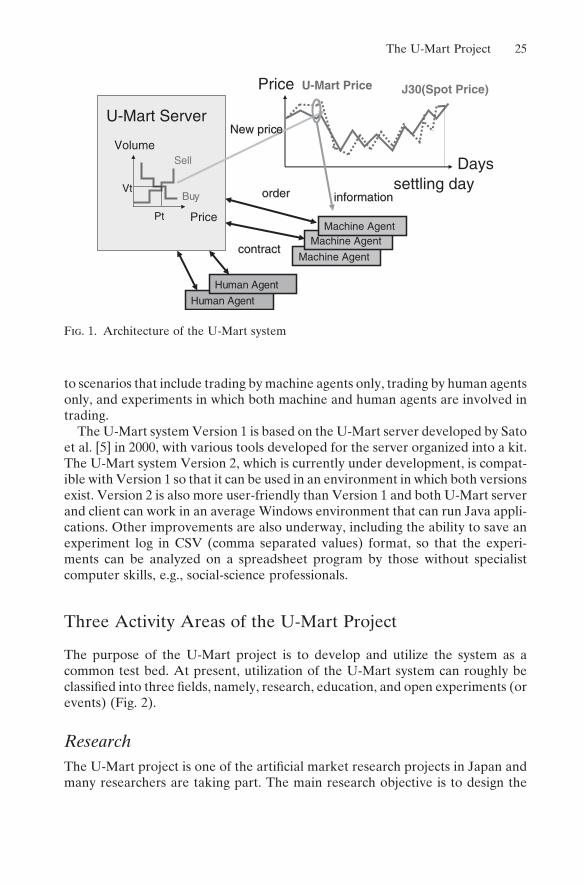
The U-Mart Project 25
to scenarios that include trading by machine agents only, trading by human agents only, and experiments in which both machine and human agents are involved in trading.
The U-Mart system Version 1 is based on the U-Mart server developed by Sato et al. [5] in 2000, with various tools developed for the server organized into a kit. The U-Mart system Version 2, which is currently under development, is compat-ible with Version 1 so that it can be used in an environment in which both versions exist. Version 2 is also more user-friendly than Version 1 and both U-Mart server and client can work in an average Windows environment that can run Java appli-cations. Other improvements are also underway, including the ability to save an experiment log in CSV (comma separated values) format, so that the experi-ments can be analyzed on a spreadsheet program by those without specialist computer skills, e.g., social-science professionals.
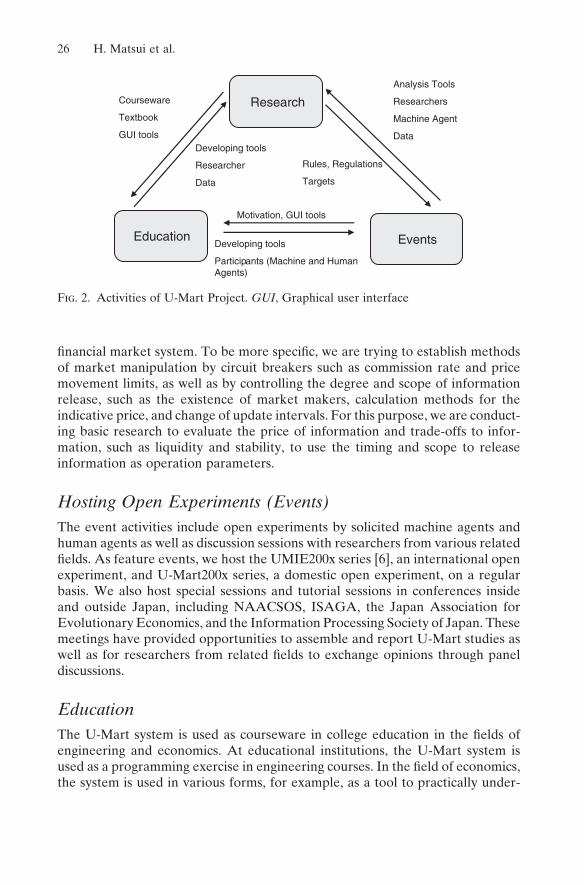
Three Activity Areas of the U-Mart Project
The purpose of the U-Mart project is to develop and utilize the system as a common test bed. At present, utilization of the U-Mart system can roughly be classified into three fields, namely, research, education, and open experiments (or events) (Fig. 2).
ResearchThe U-Mart project is one of the artificial market research projects in Japan and many researchers are taking part. The main research objective is to design the
U-Mart Server
Price
Volume
Pt
Vt
Sell
Buy
Human Agent
Human Agent
Machine Agent
Machine AgentMachine Agent
orderorder
contractcontract
Days
Price J30(Spot Price)U-Mart Price
settling day
New priceNew price
informationinformation
Fig. 1. Architecture of the U-Mart system
26 H. Matsui et al.
financial market system. To be more specific, we are trying to establish methods of market manipulation by circuit breakers such as commission rate and price movement limits, as well as by controlling the degree and scope of information release, such as the existence of market makers, calculation methods for the indicative price, and change of update intervals. For this purpose, we are conduct-ing basic research to evaluate the price of information and trade-offs to infor-mation, such as liquidity and stability, to use the timing and scope to release information as operation parameters.
Hosting Open Experiments (Events)The event activities include open experiments by solicited machine agents and human agents as well as discussion sessions with researchers from various related fields. As feature events, we host the UMIE200x series [6], an international open experiment, and U-Mart200x series, a domestic open experiment, on a regular basis. We also host special sessions and tutorial sessions in conferences inside and outside Japan, including NAACSOS, ISAGA, the Japan Association for Evolutionary Economics, and the Information Processing Society of Japan. These meetings have provided opportunities to assemble and report U-Mart studies as well as for researchers from related fields to exchange opinions through panel discussions.
EducationThe U-Mart system is used as courseware in college education in the fields of engineering and economics. At educational institutions, the U-Mart system is used as a programming exercise in engineering courses. In the field of economics, the system is used in various forms, for example, as a tool to practically under-
Education Events
Analysis Tools
Researchers
Machine Agent
Data
Rules, Regulations
Targets
Developing tools
Participants (Machine and Human Agents)
Motivation, GUI tools
Developing tools
Researcher
Data
Courseware
Textbook
GUI tools
Research
Fig. 2. Activities of U-Mart Project. GUI, Graphical user interface
The U-Mart Project 27
stand the futures market as well as a teaching resource for data mining using spreadsheet software.
InterrelationshipThe three types of U-Mart applications are strongly related to each other. Machine agents collected in open experiments are necessary to broaden the variety of agent sets used in research, while tools developed for educational purposes are also used in research and events. Furthermore, these educational activities have produced many machine agents, which have the effect of increas-ing the number of applicants to open experiments and enriching agent sets. Economics education increases the number of students who participate in the U-Mart project as human agents, which provides experiment opportunities and contributes to the development of tools for events, for example, providing pro-posals for improvements to graphical-user interfaces (GUIs). Accumulation of open experiments not only contributes to log analysis but also identifies problems that can be solved by artificial markets. Furthermore, with progress in research, the purpose of open experiments becomes clearer and rules and systems have been changed accordingly.
Use of the U-Mart in Education
The U-Mart project aims to improve the overall level of the research field by balancing the three activity areas of research, events, and education. This means that use in educational activities is regarded as valuable. To use the system in actual education, it is important to develop the system as course-ware, which includes teaching material. We have numerous examples of use of the U-Mart system in university-level and graduate-school-level education, open lectures, and sample classes for high school students and working people. Courseware development is also in progress based on these experiences.
In the field of engineering, exercises and computer experiments are performed by requiring students to create a software agent that performs trading on the U-Mart system. On the other hand, in education in the field of social science, mainly economics, the system is mostly used for gaming simulation where students themselves participate in trading as traders.
Use in gaming simulation can be classified into two types; one is network use, where a server machine is prepared on the network and multiple human agents participate in trading using client software on multiple personal computers (PCs) connected to the network; the other is standalone use, where a machine agent built in the market simulator on one PC and a human agent compete with each other. In the current U-Mart system Version 2, the server itself has a GUI so that users can smoothly switch between standalone use and network use. This reduces
28 H. Matsui et al.
the cost and learning load and allows selection of the mode that is better suited to each situation.
Characteristics of Education Using the U-Mart SystemEducation that lets students participate in trading using the U-Mart system has more potential benefits than traditional lectures and exercises. For example, there are many Web sites that allow the investing public to experience virtual stock trading using actual stock prices, and sometimes such sites are used in education. However, virtual investment using actual stock price settles the account only once per day using the day’s closing price. Therefore, the use of short-term strategies based on technical analysis is impossible and the use of such systems in the limited time frame of actual classes is difficult, because the actual time sequence is important. Furthermore, although participants can analyze their own investment results, information on overall trading is unavailable and total analysis of investment behavior of all participants is impossible.
In particular, the fact that the trading of participants will not be reflected in the price is fatal to understanding the market mechanism. On the other hand, participants in the U-Mart system can refer to trading results immediately and trading strategy greatly depends on their own skills. The realism of the U-Mart system was highly appreciated in a questionnaire survey.
From the teaching point of view, the U-Mart system can suspend the exchange server or adjust trading intervals. Then we can make students confirm individual orders on a real-time basis and experience the process where accumulated orders change as level data (list of supply and demand). By doing so, we can adjust actual trading according to the speed of student understanding. This means that we can expect high educational effects, for example, making students compare difficult calculations of marking to the market with actual trading situations for better understanding. Furthermore, it is possible to fully trace a human agent’s behav-ior from the log data recorded in the U-Mart system. We can also explore the gap in educational effects by comparing subjective evaluation based on the ques-tionnaire survey and objective trading records.
Education using the U-Mart system produced not only educational effects but also various results and research issues. For example, we can artificially create spot data for an experiment, and price-series data and trading information from experiments are very valuable research materials. In addition, participants in educational applications have begun to serve as participants in events and studies. This demonstrates that the U-Mart system continuously grows as a system that can serve as a test bed for education and research.
Example of Use of the U-Mart System for Educational PurposeThe Taniguchi Laboratory at Osaka Sangyo University conducted an experiment using the U-Mart system in an exercise in the Faculty of Economics in the 2001
The U-Mart Project 29
academic year. Based on the results, a full-scale experiment was conducted in the first half (April to July) of the 2002 academic year to explore how the avail-ability of level data affects human agent behavior [7].
According to Taniguchi’s analysis, the availability of level data did not produce any statistically significant difference in execution rate. However, the results of a questionnaire survey revealed that agents generally focused on price move-ments of futures (charts), but when level data was released, the importance of charts decreased as they referred to the level data. Accordingly, it is possible that as human agents become more skilled, they use level data more actively and trading results are affected. Econophysical analysis did not confirm the random walk assumption in price fluctuation obtained from the experiment, and a far-flung distribution called “high peak, fat tail” was observed. Especially interesting is the emergence of potent traders from ranks of complete novices in actual securities trading, let alone futures trading, although it was in the limited market. They took advantage of level data, enjoyed high execution rates, and constantly achieved high realized profit. They are so-called stockjobbers. It proves that human agents are not homogeneous, but clearly have individual characteristics and differences.
Conclusions
In this chapter, we have described the basic principles and activity of the U-Mart project. The U-Mart project is producing various results through three activity types, namely, education, research, and events. With regard to educational func-tion, due to improvements from numerous experiments in the past, the system is very easy to use and is valuable as educational courseware. In particular, this system is very handy as a platform for gaming simulation with scalability and usage in various experiments. In addition, the U-Mart system continuously grows as a system that can serve as a test bed for education and research. The more detailed information of the U-Mart Project can be obtained from the web site [8]. It is hoped that many people will take an interest and take part in the U-Mart project and the system will be used even more actively.
Acknowledgments. The preparation of this chapter would have been impossible without the assistance of other participants in the U-Mart project. This study was supported by a Grant-in-Aid for Scientific Research, Designated Field (2) “Information Study” (16016274). The authors express their gratitude for this assistance.
References1. Axelrod R (1997) The complexity of cooperation: agent-based models of competition
and collaboration. Princeton University Press, Princeton2. Axtell R (2000) Why agents? On the varied motivation for agent computing in the
social sciences. Center on social and economic dynamics working paper no. 17,
30 H. Matsui et al.
Brookings Institution, http://www.brookings.edu/es/dynamics/papers/agents/agents.htm, cited 1 Apr 2005
3. Sato H, Matsui H, Ono I, et al. (2001) U-Mart project: learning economic principles from the bottom by both human and software agents. In: Terano T, Nishida T, Namatame A et al. (eds) New frontiers in artificial intelligence. Springer, Berlin Heidelberg New York, pp 121–131
4. Terano T, Shiozawa Y, Deguchi H, et al. (2003) U-Mart: an artificial market testbed for economics and multiagent systems. In: Terano T, Deguchi H, Takadama K (eds) Meeting the challenge of social problems via agent-based simulation. Springer, Berlin Heidel-berg New York Tokyo, pp 53–65
5. Sato H, Koyama Y, Kurumatani K, et al. (2001) U-Mart: a test bed for interdisciplinary research in agent based artificial market. In: Aruka Y (ed) Evolutionary controversies in economics: a new transdisciplinary approach. Springer, Berlin Heidelberg New York, pp 179–190
6. Sato H, Matsui H, Ono I, et al. (2002) Case report on U-Mart experimental system: competition of software agent and gaming simulation with human agents. In: Terano T, Deguchi H, Takadama K (eds) Meeting the challenge of social problems via agent-based simulation. IOS, (Amsterdam) pp 167–178
7. Taniguchi K, Nakajima Y, Hashimoto F (2004) A report of U-Mart experiments by human agents. In: Shiratori R, Arai K, Kato F (eds) Gaming, simulations, and society research scope and perspective. Springer, Berlin Heidelberg New York Tokyo, pp 49–57
8. U-Mart Project (2005) U-Mart Project. http://www.u-mart.org/, cited 1 Apr 2005

31
The Gaming of Firm Strategy in High-Tech Industry: Human Agents and Artifi cial Intelligence Agents Intermingled in a Simulation ModelHao Lee1 and Hiroshi Deguchi2
1 Graduate School of Economics, Kyoto University; [email protected] Interdisciplinary Graduate School of Science and Engineering, Tokyo Institute of Tech-nology; [email protected]
Introduction
Research and development (R&D) activity is vitally important to modern indus-try and any fi rm that leads the research fi eld in new technology will naturally increase its chances of fi nancial success in the marketplace. Failure in research and development can be potentially fatal for any fi rm competing in high-tech industries such as computer software or pharmaceuticals. The development of cutting-edge products requires considerable resources combined with the ability to pursue innovation; a balance needs to be struck between investment and pro-duction. Overinvestment in research and development at the expense of produc-tion facilities can result in low profi ts and a struggle to survive. The allocation of resources between R&D investment and production capital investment is essen-tial for any fi rm competing in the high-tech products market.
Many economists now use computer simulation methods to research the details and effects of innovation. Nelson and Winter [1] carried out a simulation study to analyze the Schumpeter hypothesis. In the Nelson–Winter model, two kinds of techniques for technological improvement were defi ned: innovation and imita-tion. This simulation analysis strongly supported Schumpeter’s hypothesis [1]. In the research of Arthur [2] concerning increasing returns and technical competi-tion, network externality was emphasized and showed that superior technology does not by any means guarantee domination of the market. A historical path exists for the progress of any technological innovation and only a small distur-bance can lead to a large difference in results [2].
Gaming simulation is an important method of analyzing such problems. Hybrid-gaming simulation is a new simulation method that allows computer simulation and gaming simulation with both artifi cial intelligence (AI) agents and human players coexisting in the model. Human players in gaming simulation are smarter than AI agents and are better able to fi nd solutions.
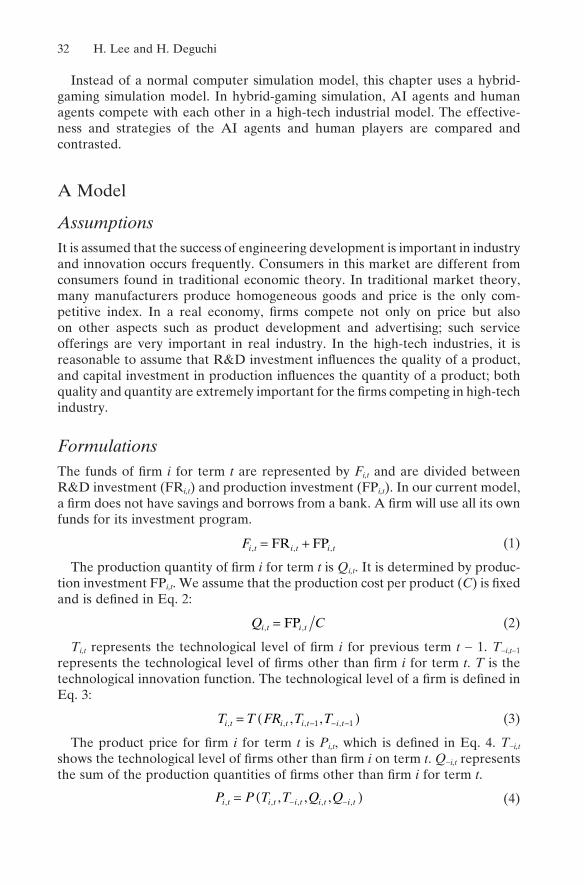
32 H. Lee and H. Deguchi
Instead of a normal computer simulation model, this chapter uses a hybrid-gaming simulation model. In hybrid-gaming simulation, AI agents and human agents compete with each other in a high-tech industrial model. The effective-ness and strategies of the AI agents and human players are compared and contrasted.
A Model
AssumptionsIt is assumed that the success of engineering development is important in industry and innovation occurs frequently. Consumers in this market are different from consumers found in traditional economic theory. In traditional market theory, many manufacturers produce homogeneous goods and price is the only com-petitive index. In a real economy, fi rms compete not only on price but also on other aspects such as product development and advertising; such service offerings are very important in real industry. In the high-tech industries, it is reasonable to assume that R&D investment infl uences the quality of a product, and capital investment in production infl uences the quantity of a product; both quality and quantity are extremely important for the fi rms competing in high-tech industry.
FormulationsThe funds of fi rm i for term t are represented by Fi,t and are divided between R&D investment (FRi,t) and production investment (FPi,t). In our current model, a fi rm does not have savings and borrows from a bank. A fi rm will use all its own funds for its investment program.
Fi t i t i t, , ,= +FR FP (1)
The production quantity of fi rm i for term t is Qi,t. It is determined by produc-tion investment FPi,t. We assume that the production cost per product (C) is fi xed and is defi ned in Eq. 2:
Q Ci t i t, ,= FP (2)
Ti,t represents the technological level of fi rm i for previous term t − 1. T−i,t−1 represents the technological level of fi rms other than fi rm i for term t. T is the technological innovation function. The technological level of a fi rm is defi ned in Eq. 3:
T T FR T Ti t i t i t i t, , , ,, ,= ( )− − −1 1 (3)
The product price for fi rm i for term t is Pi,t, which is defi ned in Eq. 4. T−i,t shows the technological level of fi rms other than fi rm i on term t. Q−i,t represents the sum of the production quantities of fi rms other than fi rm i for term t.
P P T T Q Qi t i t i t i t i t, , , , ,, , ,= ( )− − (4)
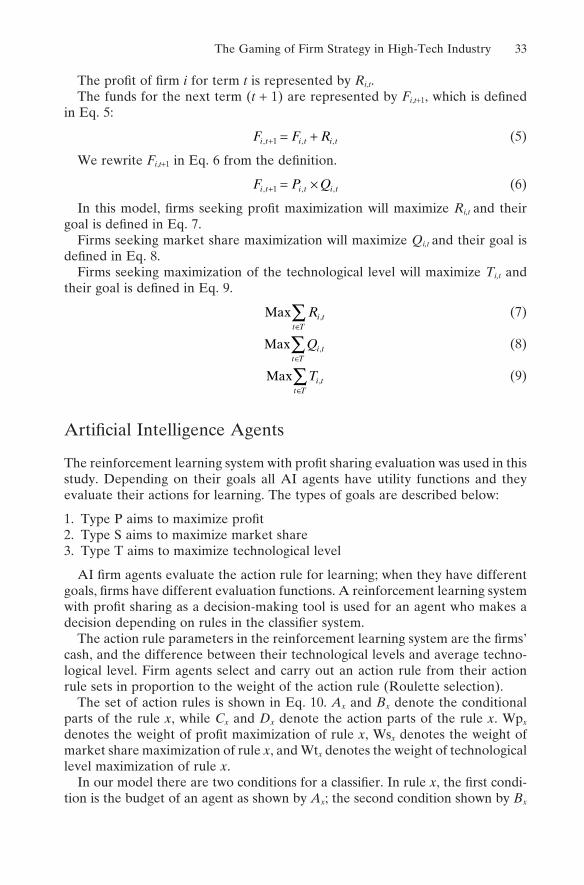
The Gaming of Firm Strategy in High-Tech Industry 33
The profi t of fi rm i for term t is represented by Ri,t.The funds for the next term (t + 1) are represented by Fi,t+1, which is defi ned
in Eq. 5:
F F Ri t i t i t, , ,+ = +1 (5)
We rewrite Fi,t+1 in Eq. 6 from the defi nition.
F P Qi t i t i t, , ,+ = ×1 (6)
In this model, fi rms seeking profi t maximization will maximize Ri,t and their goal is defi ned in Eq. 7.
Firms seeking market share maximization will maximize Qi,t and their goal is defi ned in Eq. 8.
Firms seeking maximization of the technological level will maximize Ti,t and their goal is defi ned in Eq. 9.
Max ,Ri tt T∈∑ (7)
Max ,Qi tt T∈∑ (8)
Max ,Ti tt T∈∑ (9)
Artifi cial Intelligence Agents
The reinforcement learning system with profi t sharing evaluation was used in this study. Depending on their goals all AI agents have utility functions and they evaluate their actions for learning. The types of goals are described below:
1. Type P aims to maximize profi t2. Type S aims to maximize market share3. Type T aims to maximize technological level
AI fi rm agents evaluate the action rule for learning; when they have different goals, fi rms have different evaluation functions. A reinforcement learning system with profi t sharing as a decision-making tool is used for an agent who makes a decision depending on rules in the classifi er system.
The action rule parameters in the reinforcement learning system are the fi rms’ cash, and the difference between their technological levels and average techno-logical level. Firm agents select and carry out an action rule from their action rule sets in proportion to the weight of the action rule (Roulette selection).
The set of action rules is shown in Eq. 10. Ax and Bx denote the conditional parts of the rule x, while Cx and Dx denote the action parts of the rule x. Wpx denotes the weight of profi t maximization of rule x, Wsx denotes the weight of market share maximization of rule x, and Wtx denotes the weight of technological level maximization of rule x.
In our model there are two conditions for a classifi er. In rule x, the fi rst condi-tion is the budget of an agent as shown by Ax; the second condition shown by Bx
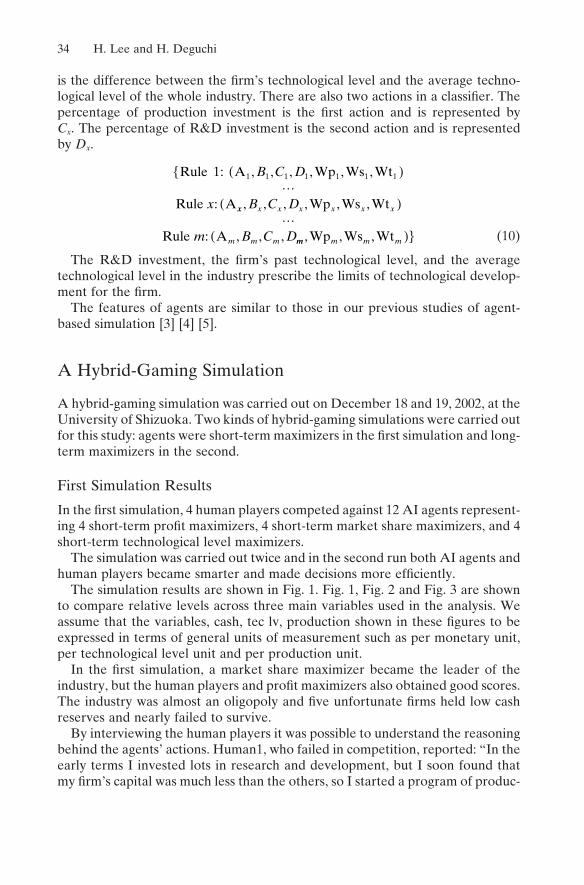
34 H. Lee and H. Deguchi
is the difference between the fi rm’s technological level and the average techno-logical level of the whole industry. There are also two actions in a classifi er. The percentage of production investment is the fi rst action and is represented by Cx. The percentage of R&D investment is the second action and is represented by Dx.
Rule 1: A Wp Ws Wt
Rule A
1 1 1{ ( ), , , , , ,
:
B C D
x
1 1 1 1
�xx x x x x x x
m m m
B C D
m B C D
, , , , , ,
: , , ,
Wp Ws Wt
Rule A
( )�
mm m m m, , ,Wp Ws Wt( )} (10)
The R&D investment, the fi rm’s past technological level, and the average technological level in the industry prescribe the limits of technological develop-ment for the fi rm.
The features of agents are similar to those in our previous studies of agent-based simulation [3] [4] [5].
A Hybrid-Gaming Simulation
A hybrid-gaming simulation was carried out on December 18 and 19, 2002, at the University of Shizuoka. Two kinds of hybrid-gaming simulations were carried out for this study: agents were short-term maximizers in the fi rst simulation and long-term maximizers in the second.
First Simulation Results
In the fi rst simulation, 4 human players competed against 12 AI agents represent-ing 4 short-term profi t maximizers, 4 short-term market share maximizers, and 4 short-term technological level maximizers.
The simulation was carried out twice and in the second run both AI agents and human players became smarter and made decisions more effi ciently.
The simulation results are shown in Fig. 1. Fig. 1, Fig. 2 and Fig. 3 are shown to compare relative levels across three main variables used in the analysis. We assume that the variables, cash, tec lv, production shown in these fi gures to be expressed in terms of general units of measurement such as per monetary unit, per technological level unit and per production unit.
In the fi rst simulation, a market share maximizer became the leader of the industry, but the human players and profi t maximizers also obtained good scores. The industry was almost an oligopoly and fi ve unfortunate fi rms held low cash reserves and nearly failed to survive.
By interviewing the human players it was possible to understand the reasoning behind the agents’ actions. Human1, who failed in competition, reported: “In the early terms I invested lots in research and development, but I soon found that my fi rm’s capital was much less than the others, so I started a program of produc-
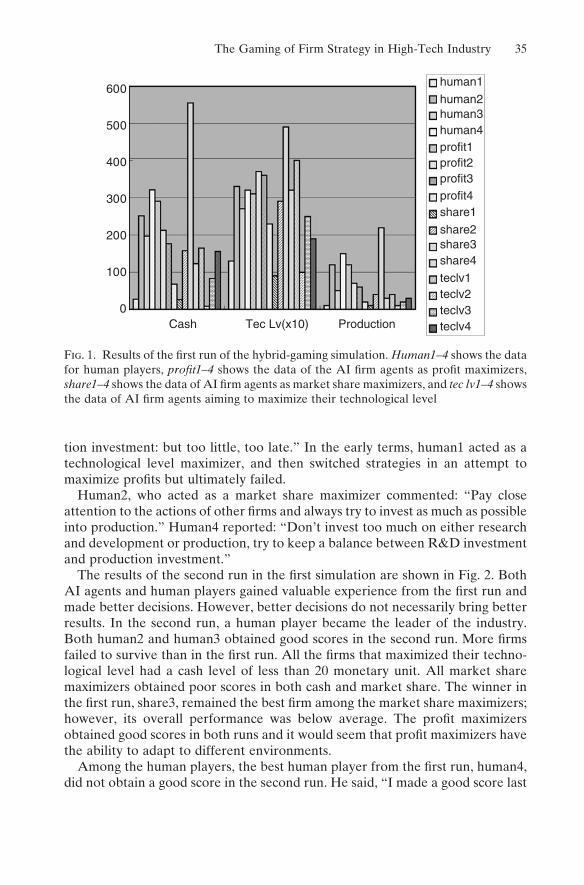
The Gaming of Firm Strategy in High-Tech Industry 35
0
100
200
300
400
500
600
Cash Tec Lv(x10) Production
human1
human2human3human4profit1profit2profit3profit4share1
share2share3share4
teclv1teclv2teclv3teclv4
Fig. 1. Results of the fi rst run of the hybrid-gaming simulation. Human1–4 shows the data for human players, profit1–4 shows the data of the AI fi rm agents as profi t maximizers, share1–4 shows the data of AI fi rm agents as market share maximizers, and tec lv1–4 shows the data of AI fi rm agents aiming to maximize their technological level
tion investment: but too little, too late.” In the early terms, human1 acted as a technological level maximizer, and then switched strategies in an attempt to maximize profi ts but ultimately failed.
Human2, who acted as a market share maximizer commented: “Pay close attention to the actions of other fi rms and always try to invest as much as possible into production.” Human4 reported: “Don’t invest too much on either research and development or production, try to keep a balance between R&D investment and production investment.”
The results of the second run in the fi rst simulation are shown in Fig. 2. Both AI agents and human players gained valuable experience from the fi rst run and made better decisions. However, better decisions do not necessarily bring better results. In the second run, a human player became the leader of the industry. Both human2 and human3 obtained good scores in the second run. More fi rms failed to survive than in the fi rst run. All the fi rms that maximized their techno-logical level had a cash level of less than 20 monetary unit. All market share maximizers obtained poor scores in both cash and market share. The winner in the fi rst run, share3, remained the best fi rm among the market share maximizers; however, its overall performance was below average. The profi t maximizers obtained good scores in both runs and it would seem that profi t maximizers have the ability to adapt to different environments.
Among the human players, the best human player from the fi rst run, human4, did not obtain a good score in the second run. He said, “I made a good score last
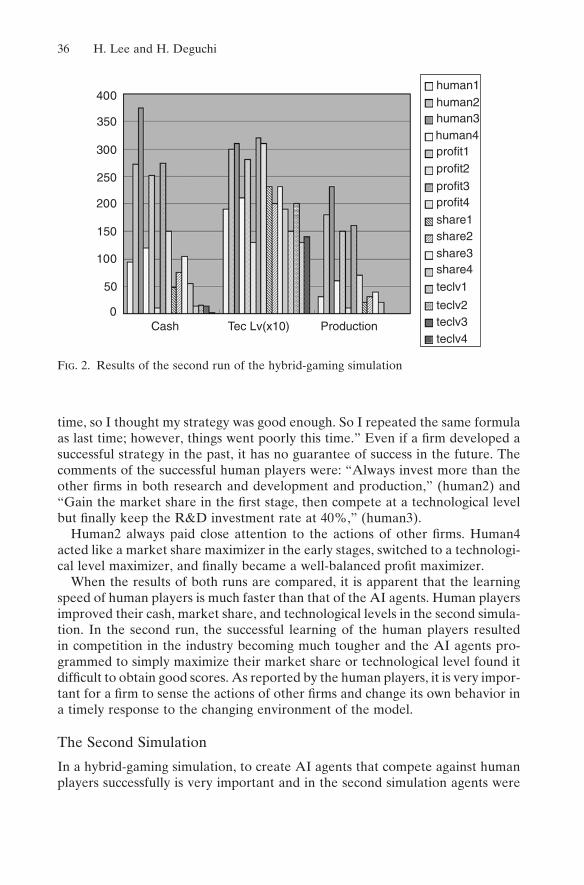
36 H. Lee and H. Deguchi
time, so I thought my strategy was good enough. So I repeated the same formula as last time; however, things went poorly this time.” Even if a fi rm developed a successful strategy in the past, it has no guarantee of success in the future. The comments of the successful human players were: “Always invest more than the other fi rms in both research and development and production,” (human2) and “Gain the market share in the fi rst stage, then compete at a technological level but fi nally keep the R&D investment rate at 40%,” (human3).
Human2 always paid close attention to the actions of other fi rms. Human4 acted like a market share maximizer in the early stages, switched to a technologi-cal level maximizer, and fi nally became a well-balanced profi t maximizer.
When the results of both runs are compared, it is apparent that the learning speed of human players is much faster than that of the AI agents. Human players improved their cash, market share, and technological levels in the second simula-tion. In the second run, the successful learning of the human players resulted in competition in the industry becoming much tougher and the AI agents pro-grammed to simply maximize their market share or technological level found it diffi cult to obtain good scores. As reported by the human players, it is very impor-tant for a fi rm to sense the actions of other fi rms and change its own behavior in a timely response to the changing environment of the model.
The Second Simulation
In a hybrid-gaming simulation, to create AI agents that compete against human players successfully is very important and in the second simulation agents were
50
150
250
350
0
100
200
300
400
Cash Tec Lv(x10) Production
human1human2human3human4profit1profit2
profit3profit4
share1share2share3share4
teclv1
teclv2teclv3teclv4
Fig. 2. Results of the second run of the hybrid-gaming simulation
The Gaming of Firm Strategy in High-Tech Industry 37
tuned in an attempt to improve their performance. The AI agents were not designed for hybrid-gaming simulations but for computer simulations and this could be why AI agents were not able to previously compete effectively against human players.
In a computer simulation, AI agents are designed for a game of 100 terms. However, in hybrid gaming, human players cannot make a decision as fast as an AI agent. In response, the AI agents were adapted to play a game of 25 terms and all AI agents were changed to become long-term maximizers instead of short-term maximizers.
In this simulation the number of human players was increased to 6 and the number of AI agents remained at 12: 4 long-term profi t maximizers, 4 long-term market share maximizers, and 4 long-term technological level maximizers.
The results of the second simulation are shown in Fig. 3.In the fi rst simulation, learned human players defeated AI agents easily.
However, when their opponents were tuned AI agents, learned human players were unable to obtain good scores. The tuned AI agents were able to make deci-sions as effectively as the human players.
In the second simulation, the techniques required for creating AI agents to compete with human players were developed. First, it is important to ascertain the number of terms of a hybrid game and to adjust the specifi cations of the AI agents accordingly. Second, in this case, a long-term maximization strategy pro-duces better results than short-term maximization.
0
200
400
600
800
1000
1200
1400
1600
1800
Cash Tec Lv (x10) Production
human1human2human3human4human5human6profit1profit2profit3profit4share1share2share3share4tecLv1tecLv2tecLv3tecLv4
Fig. 3. Results of the second simulation
38 H. Lee and H. Deguchi
Summary
In this study, a hybrid-gaming simulation model was used instead of a normal computer simulation model. In the hybrid-gaming simulation, autonomous AI agents and human players competed against each other in a high-tech industrial model. Firm agents (both AI agents and human players) determined the levels of R&D investment and production investment.
The efficiencies of AI agents were compared with those of their human coun-terparts and the varying strategies of both AI agents and human players were assessed and verified. It was found that the learning speed of human players was much faster than AI agents and that the AI agents were validated and competed successfully against the human players.
Long-term maximization agents playing against human players performed well, but short-term maximization agents failed. This confirmed the importance of agent tuning when playing a hybrid-gaming simulation.
In future work, we will formulate our current model in an extensive game form and analyze the model more thoroughly. By carrying out more hybrid-gaming simulations with a dynamic model, it will be possible to analyze the model and create a robust theoretical formula. We will also analyze the relation between economic theory and the real economy by using both gaming simulation and hybrid-gaming simulation.
References1. Nelson RR, Winter S (1982) An evolutionary theory of economic change. Belknap Press
of Harvard University Press, Cambridge, MA2. Arthur WB (1989) Competing technologies, increasing returns, and lock-in by historical
events. Economic Journal 99:116–131
Takagi H, Kijima K, Deguchi H (1995) People and society in the multimedia century (in Japanese). Nikkagekiren
Kijima K, Deguchi H (1997) Inquiry of system knowledge (in Japanese). NikkagekirenDeguchi H (2000) Economy as a complex system (in Japanese). NikkagekirenLee H, Deguchi H (2000) Technological innovation of high-tech industry (in Japanese).
JASMIN2000 SpringLee H, Deguchi H (2000) Technological innovation of high-tech industry—agent based
simulation with double loop learning. KSS’2000 JAIST, pp 224–229Lee H, Deguchi H (2001) Technological innovation of high-tech industry—agent based
simulation with double loop learning. 4th Pacific Rim International Workshop on Multi-Agents, PRIMA2001, Taipei, Taiwan
39
Simulation Analysis Using the Garbage Can Model for Designing a Citizen Participation System for Comprehensive Municipal PlanningToshiyuki Kaneda and Yasuhisa Hattori
Omohi College, Graduate School of Engineering, Nagoya Institute of Technology, Gokiso, Showa-ku, Nagoya 466-8555, Japan. e-mail: [email protected] Nagoya City Office
Introduction
During the 1990s, ordinary Japanese people learned to enjoy and use their leisure time for improving the “true” quality of life by engaging in a variety of pursuits, among them being voluntary community activities. At the same time, many Japanese municipalities also opened the door to citizen participation in urban planning; this has given rise to some confusion and misunderstanding between citizens and administrators. Most of the citizens who are involved in these activities are motivated to volunteer out of a sense of civic duty, but naturally they are restricted by their work and private life. Sometimes they are absent from meetings and, although nobody feels there is a conflict, the situation is not ideal for the municipal officers responsible for executing projects. This is a classic example of “organized anarchy” as described by March [1], which sometimes means that despite the citizens’ best efforts results are not achieved efficiently. Clearly there is a need for a different style of management to effectively manage such situations.
We shall outline the typical planning procedure found in many Japanese municipalities. The city administration makes preparations for citizen participa-tion and typically many specialized committees run at the same time, allowing many kinds of citizen (not only stakeholders in the narrow sense, but also other civic-minded citizens) to be involved. Through this process many policy matters are collected and may be dealt with. This situation is quite similar to the so called garbage can model.
In this chapter, we revive the garbage can model (GCM) with the aid of colored Petri nets (CPN) Software. Initially we explain the garbage can metaphor as an organizational model using a colored Petri nets description, and later, by intro-ducing the colored-energy concept, the garbage can simulator is modified to allow the study of hypothetical participation procedure structures. Several structures
40 T. Kaneda and Y. Hattori
are evaluated through simulation runs with several different case settings focus-ing mainly on the access structures found among committees.
Design Problems of a Citizen Participation System
In this section, Cohen’s garbage can model is considered [2]. The garbage can model can deal with the micromoves of agents, problems, and choice opportuni-ties (committees), but in the traditional literature of organization studies, algo-rithmic aspects of this model have rarely been mentioned in Japan. The original garbage can model was designed to model the problems addressed to the com-mission administration in the university environment [1].
Here, in our research context, the garbage can model is used to explore the inefficiency of organizational decision making in the Japanese citizen participa-tion procedure, with a special focus on the three characteristics described below.
Design of a Decision Chain. Especially when comprehensive planning with citizen participation, planning administrators face an enormous amount of policy items, for example, a city of two million has about 700 policy items, a prefecture of eight million will have about 2000 items, most of which the citizens will present to the planning committees. These items must be arranged, summarized, and prepared for planning; in comprehensive planning, the role system is designed as a set of committees, and, through parallel discussions, a package of decision making is gradually established. This is a typical procedure for organizational decision making and is known as a decision chain and will contain a variety of activities such as participatory planning.
Decision Premise. This relates to the design of the decision chain. When we design an organization model, even if the organization does not need to take a conflict into consideration between the subgoals of the composition agents, we have to hypothesize that there is no rational agent in the organization because of mainly local information. It means that it cannot but get conscious of the deci-sion premise as raised by Simon [3].
Highly Irregular Nature of Voluntary Citizen Participation. Voluntary organiza-tions differ from any commercial enterprise because the participants can only offer their free time and cannot guarantee their attendance at committee meet-ings. This problem is addressed by Cohen et al. [2] in their garbage can model. The participant model does not require such individual rationality as utility and the participant is not modeled as an individual rational person, because it is their sense of civic duty and altruism that motivates them. Looked at from a macro level, such motivation leads to irregular participation patterns and makes man-agement and forecasting very difficult, often resulting in inefficient organizational decision making. Nowadays, individualism is more common in Japan and in the near future such inefficiencies will only become more common.
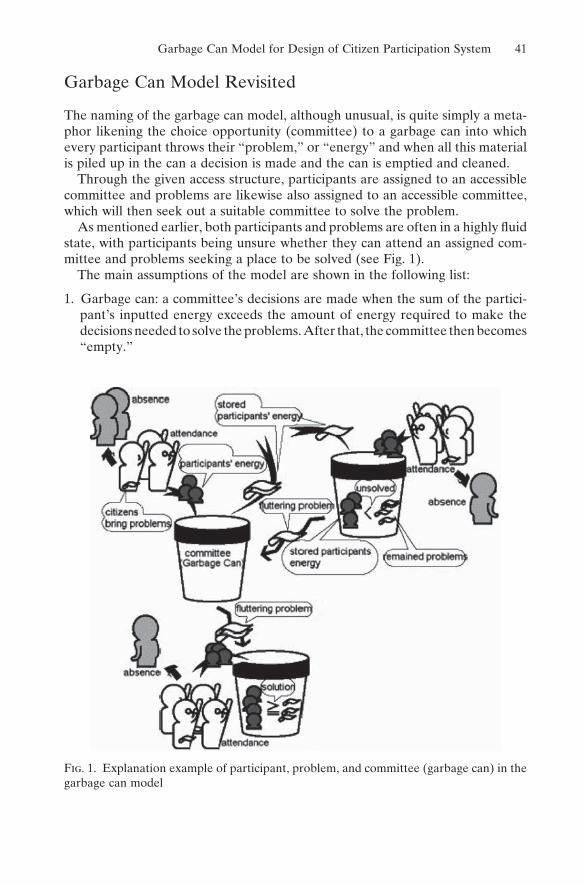
Garbage Can Model for Design of Citizen Participation System 41
Garbage Can Model Revisited
The naming of the garbage can model, although unusual, is quite simply a meta-phor likening the choice opportunity (committee) to a garbage can into which every participant throws their “problem,” or “energy” and when all this material is piled up in the can a decision is made and the can is emptied and cleaned.
Through the given access structure, participants are assigned to an accessible committee and problems are likewise also assigned to an accessible committee, which will then seek out a suitable committee to solve the problem.
As mentioned earlier, both participants and problems are often in a highly fluidstate, with participants being unsure whether they can attend an assigned com-mittee and problems seeking a place to be solved (see Fig. 1).
The main assumptions of the model are shown in the following list:
1. Garbage can: a committee’s decisions are made when the sum of the partici-pant’s inputted energy exceeds the amount of energy required to make the decisions needed to solve the problems. After that, the committee then becomes “empty.”
Fig. 1. Explanation example of participant, problem, and committee (garbage can) in the garbage can model
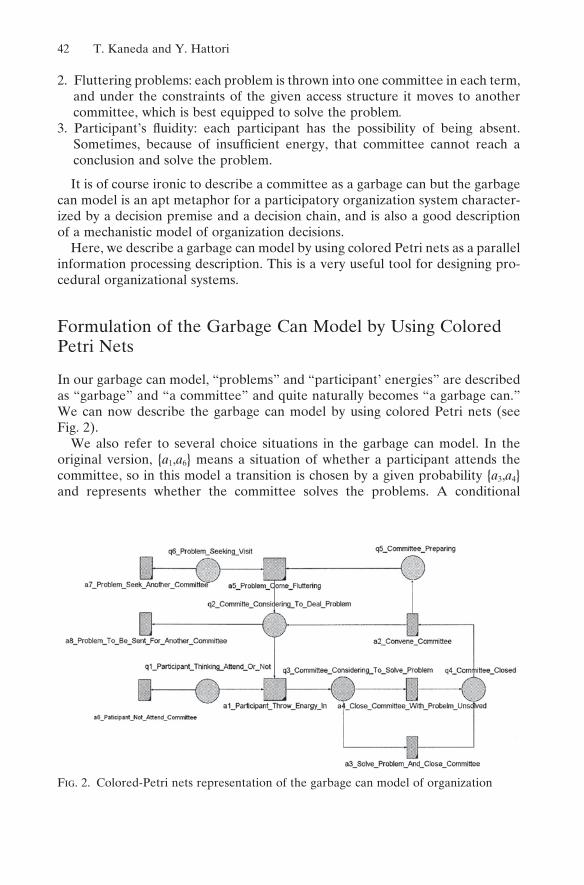
42 T. Kaneda and Y. Hattori
2. Fluttering problems: each problem is thrown into one committee in each term, and under the constraints of the given access structure it moves to another committee, which is best equipped to solve the problem.
3. Participant’s fluidity: each participant has the possibility of being absent. Sometimes, because of insufficient energy, that committee cannot reach a conclusion and solve the problem.
It is of course ironic to describe a committee as a garbage can but the garbage can model is an apt metaphor for a participatory organization system character-ized by a decision premise and a decision chain, and is also a good description of a mechanistic model of organization decisions.
Here, we describe a garbage can model by using colored Petri nets as a parallel information processing description. This is a very useful tool for designing pro-cedural organizational systems.
Formulation of the Garbage Can Model by Using Colored Petri Nets
In our garbage can model, “problems” and “participant’ energies” are described as “garbage” and “a committee” and quite naturally becomes “a garbage can.” We can now describe the garbage can model by using colored Petri nets (see Fig. 2).
We also refer to several choice situations in the garbage can model. In the original version, {a1,a6} means a situation of whether a participant attends the committee, so in this model a transition is chosen by a given probability {a3,a4}and represents whether the committee solves the problems. A conditional
Fig. 2. Colored-Petri nets representation of the garbage can model of organization
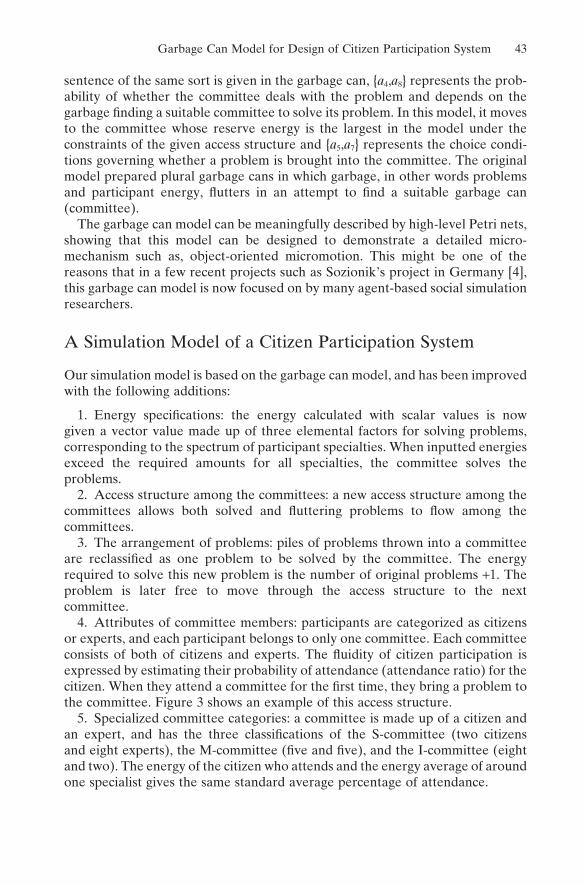
Garbage Can Model for Design of Citizen Participation System 43
sentence of the same sort is given in the garbage can, {a4,a8} represents the prob-ability of whether the committee deals with the problem and depends on the garbage finding a suitable committee to solve its problem. In this model, it moves to the committee whose reserve energy is the largest in the model under the constraints of the given access structure and {a5,a7} represents the choice condi-tions governing whether a problem is brought into the committee. The original model prepared plural garbage cans in which garbage, in other words problems and participant energy, flutters in an attempt to find a suitable garbage can (committee).
The garbage can model can be meaningfully described by high-level Petri nets, showing that this model can be designed to demonstrate a detailed micro-mechanism such as, object-oriented micromotion. This might be one of the reasons that in a few recent projects such as Sozionik’s project in Germany [4], this garbage can model is now focused on by many agent-based social simulation researchers.
A Simulation Model of a Citizen Participation System
Our simulation model is based on the garbage can model, and has been improved with the following additions:
1. Energy specifications: the energy calculated with scalar values is now given a vector value made up of three elemental factors for solving problems, corresponding to the spectrum of participant specialties. When inputted energies exceed the required amounts for all specialties, the committee solves the problems.
2. Access structure among the committees: a new access structure among the committees allows both solved and fluttering problems to flow among the committees.
3. The arrangement of problems: piles of problems thrown into a committee are reclassified as one problem to be solved by the committee. The energy required to solve this new problem is the number of original problems +1. The problem is later free to move through the access structure to the next committee.
4. Attributes of committee members: participants are categorized as citizens or experts, and each participant belongs to only one committee. Each committee consists of both of citizens and experts. The fluidity of citizen participation is expressed by estimating their probability of attendance (attendance ratio) for the citizen. When they attend a committee for the first time, they bring a problem to the committee. Figure 3 shows an example of this access structure.
5. Specialized committee categories: a committee is made up of a citizen and an expert, and has the three classifications of the S-committee (two citizens and eight experts), the M-committee (five and five), and the I-committee (eight and two). The energy of the citizen who attends and the energy average of around one specialist gives the same standard average percentage of attendance.
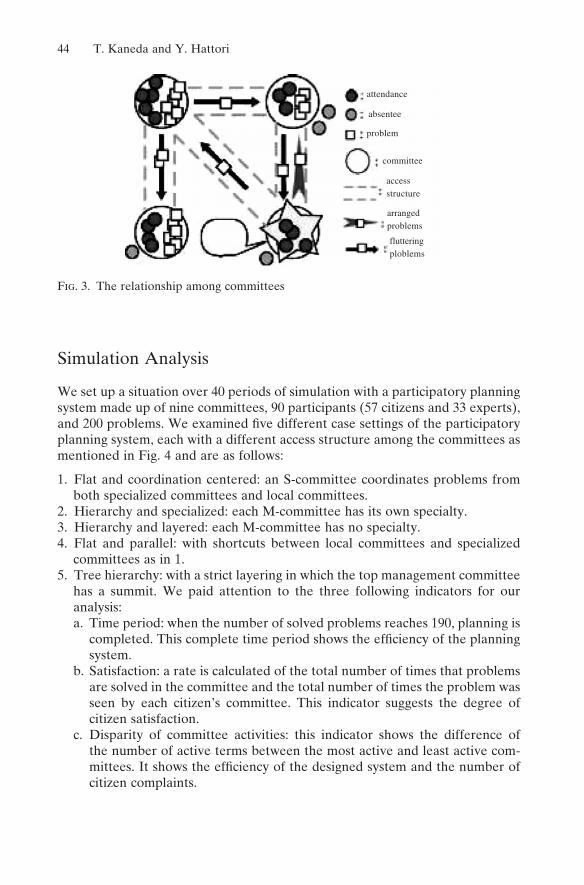
44 T. Kaneda and Y. Hattori
Simulation Analysis
We set up a situation over 40 periods of simulation with a participatory planning system made up of nine committees, 90 participants (57 citizens and 33 experts), and 200 problems. We examined five different case settings of the participatory planning system, each with a different access structure among the committees as mentioned in Fig. 4 and are as follows:
1. Flat and coordination centered: an S-committee coordinates problems from both specialized committees and local committees.
2. Hierarchy and specialized: each M-committee has its own specialty.3. Hierarchy and layered: each M-committee has no specialty.4. Flat and parallel: with shortcuts between local committees and specialized
committees as in 1.5. Tree hierarchy: with a strict layering in which the top management committee
has a summit. We paid attention to the three following indicators for our analysis:a. Time period: when the number of solved problems reaches 190, planning is
completed. This complete time period shows the efficiency of the planning system.
b. Satisfaction: a rate is calculated of the total number of times that problems are solved in the committee and the total number of times the problem was seen by each citizen’s committee. This indicator suggests the degree of citizen satisfaction.
c. Disparity of committee activities: this indicator shows the difference of the number of active terms between the most active and least active com-mittees. It shows the efficiency of the designed system and the number of citizen complaints.
attendance
absentee
problem
committee
accessstructure
arrangedproblems
flutteringploblems
Fig. 3. The relationship among committees
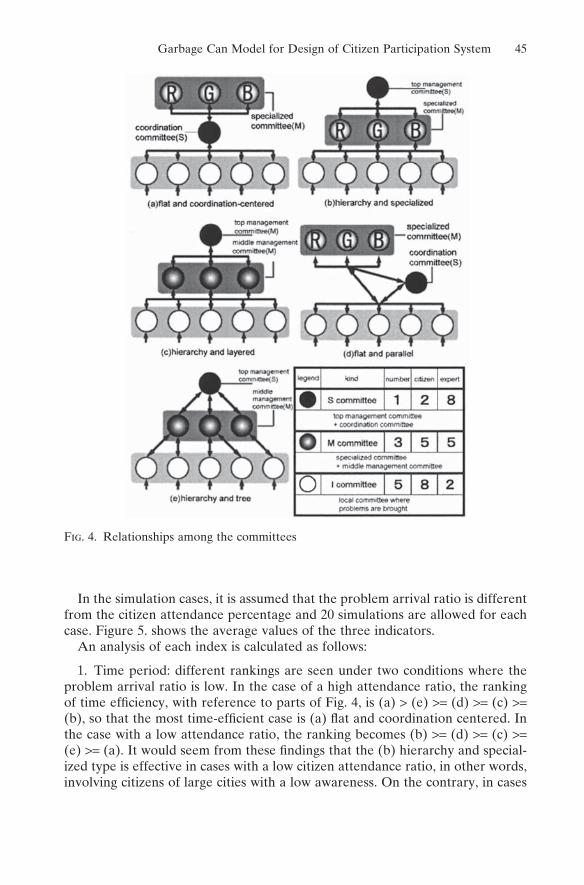
Garbage Can Model for Design of Citizen Participation System 45
In the simulation cases, it is assumed that the problem arrival ratio is different from the citizen attendance percentage and 20 simulations are allowed for each case. Figure 5. shows the average values of the three indicators.
An analysis of each index is calculated as follows:
1. Time period: different rankings are seen under two conditions where the problem arrival ratio is low. In the case of a high attendance ratio, the ranking of time efficiency, with reference to parts of Fig. 4, is (a) > (e) >= (d) >= (c) >=(b), so that the most time-efficient case is (a) flat and coordination centered. In the case with a low attendance ratio, the ranking becomes (b) >= (d) >= (c) >=(e) >= (a). It would seem from these findings that the (b) hierarchy and special-ized type is effective in cases with a low citizen attendance ratio, in other words, involving citizens of large cities with a low awareness. On the contrary, in cases
Fig. 4. Relationships among the committees
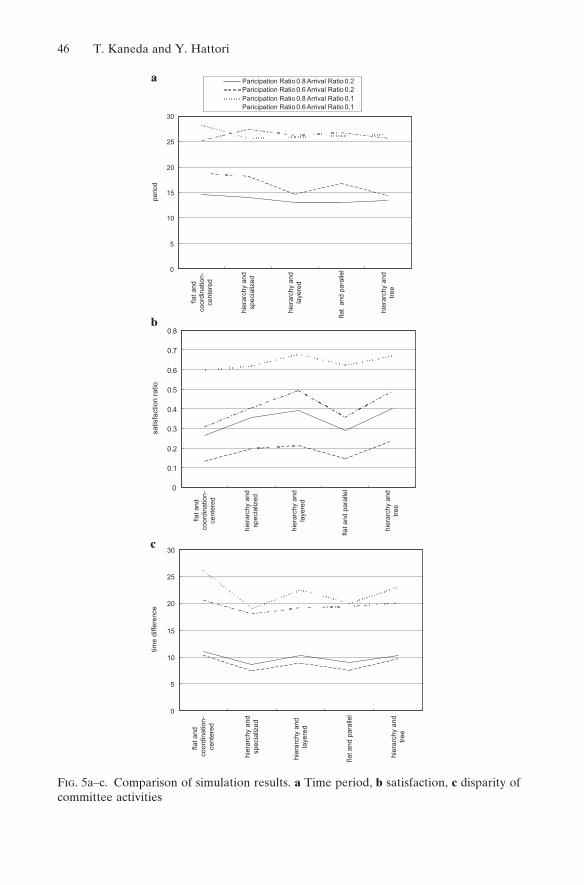
46 T. Kaneda and Y. Hattori
0
5
10
15
20
25
30
a
b
c
flat a
ndco
ordi
natio
n-ce
nter
ed
hier
arch
y an
dsp
ecia
lized
hier
arch
y an
dla
yere
d
flat
and
para
llel
hier
arch
y an
dtr
ee
perio
d
Paricipation Ratio 0.8 Arrival Ratio 0.2Paricipation Ratio 0.6 Arrival Ratio 0.2Paricipation Ratio 0.8 Arrival Ratio 0.1Paricipation Ratio 0.6 Arrival Ratio 0.1
0
5
10
15
20
25
30
flat a
ndco
ordi
natio
n-ce
nter
ed
hier
arch
y an
dsp
ecia
lized
hier
arch
y an
dla
yere
d
flat a
nd p
aral
lel
hier
arch
y an
dtr
ee
time
diffe
renc
e
0
0.1
0.2
0.3
0.4
0.5
0.6
0.7
0.8
flat a
ndco
ordi
natio
n-ce
nter
ed
hier
arch
y an
dsp
ecia
lized
hier
arch
y an
dla
yere
d
flat a
nd p
aral
lel
hier
arch
y an
dtr
ee
satis
fact
ion
ratio
Fig. 5a–c. Comparison of simulation results. a Time period, b satisfaction, c disparity of committee activities
Garbage Can Model for Design of Citizen Participation System 47
with a high attendance ratio, involving citizens with high awareness, in small cities, type (e) flat and coordination centered is the most effective.
2. Satisfaction: in cases with a high problem arrival ratio, the rankings are (e) > (c) > (b) > (d) > (a), with the (a) tree hierarchy giving the highest probability that citizens will see a solution in the committee. With a low case problem arrival ratio, we find (c) > (e) > (b) > (d) > (a) and the (c) laered hierarchy giving the highest value of satisfaction indicator. Overall, there is a tendency for situations with few problems arriving to give high satisfaction ratings, as is also seen where citizens bring their own problems to the committee. Note that the (a) flat and coordination centered type gives the lowest satisfaction, but contrasts with the high time-efficiency found with high citizen attendance rates.
3. Disparity of committee activities: with a ranking of (a) > (e) � (c) � (d) >(b), and in all cases, the (b) specialized hierarchy is the least unequal of the com-mittee activities, in other words, it has the highest equity of all the activities. On the contrary, type (a) flat and coordination centered has the largest inequality of the committee activities.
Concluding Remarks
The flat and parallel type has the least constraints on access structure, and we had confidently expected it to show an effective performance; however, the simu-lation results surprisingly showed that over the five case settings it attained only a middle ranking.
It would seem that simulation performance depends on the fitness between the access structure and the given flow pattern conditions, such as problem arrivals and citizen participation, so the flat and parallel type, with shortcuts between local committees and specialized committees giving greater flexibility to cope with differing kinds of flow conditions, will not necessarily be highlighted under a variety of specific conditions and simulation settings.
References1. March J, James G, Olsen JP (1976) Ambiguity and choice in organizations. Universitets-
forlaget, Bergen2. Cohen MD, March JG, Olsen JP (1972) A garbage can model of organizational choice.
Administrative Science Quarterly 17:1–253. Simon HA (1947) Administrative behavior. Free4. Heitsch S, Hinck D, Martens M (2000) A new look into garbage cans—Petri nets and
organisational choice. In: Proceedings of AISB
49
Exploring Business Gaming Strategies by Learning AgentsMasato Kobayashi and Takao Terano
Graduate School of Systems Management, University of Tsukuba, 3-29-1 Otsuka, Bunkyo-ku, Tokyo 112-0012, Japan. e-mail: [email protected]; [email protected]
Introduction
Traditionally, the role of computers for business games has been only to support users by letting them use spreadsheet programs to make decisions during gaming rounds. However, recent progress in computer and network technology has enabled users to play games in a much more sophisticated manner. For example, there are many conventional gaming simulators in the literature that may be used to attain specific goals [1–4]. Moreover, gaming simulators such as “Internet forum” have been developed into computer-based games to act as decision-making tools for business on the Internet [5]. In this chapter, we advance the use of computers in such applications. Our new aproach is characterized by both human participation and software participation in the gaming environment.
Our school, the Graduate School of Systems Management (GSSM), University of Tsukuba, is a good place to apply the new approach. The students are all business people from various industries, with different expertise, and different backgrounds. Therefore, although the academic levels of the students are quite diverged, they will not be satisfied by playing-only simulators. The students want to know how to make good management decisions by developing business models, decision support tools, and business information systems.
To meet the requirements and based on our previous experience, we set the following goals to design the business simulator course:
1. The game is simple for business people from various backgrounds, and for those who have little accounting knowledge, in order that they can understand the basic process of business simulation.
2. The game is sufficiently complex for those who have real and practical business experience to play the simulation games to understand the advanced concepts of decision making and business processes and procedures.
50 M. Kobayashi and T. Terano
3. Using the simulators, the students will be highly motivated to further study advanced courses at GSSM including operations research, information systems, decision theory, accounting, marketing, computer programming, artificial intelli-gence, agent technologies, and/or computer networks.
4. From 1 up to 12 students can execute the simulators at the same time and different places. Therefore, adding to human players, multiple software agents are able to participate in the games as substations of players. The simulator should also run on a computer network or on the World Wide Web (WWW).
5. To let the students easily develop their own business models, a new business model description language (BMDL) and business model development system (BMDS) should be designed and implemented. The BMDL should be sufficientlysimple so that students with few skills in computer programming can understand it and write their own models. Also, software agents are easily implemented by inexperienced users.
6. To guide the students, a typical business model and simulator should be developed. The simulator is both executable as an introductory tool for the course and readable for students to understand how the model is built, and how the simulation is executed. The simulator should be used as an example in the introductory course.
To carry out practical simulation study, many students and a computer-rich environment are required. Generally, it is very difficult, even for experienced experts, to develop a suitable simulator. To overcome the difficulties, the introduc-tion of multiple software agents is critical. Human-agent participation has the following six roles: (1) to substitute human players with software agents, (2) to understand the decision-making procedure by implementing agent functionality, (3) to speed up the game development by fine tuning the game parameters, (4) to control the game balances by agent participation during the game executions, (5) to evaluate the game processes by only-software-agent play modes, and (6) to explore desirable business processes by machine learning agents.
Based on the above, the course we are conducting consists of (1) a sample gaming experiment among multiple students and software agents using Alexan-der Islands, a tiny business simulator on the WWW, (2) lectures to let students understand the core concepts of systems management through the simulation, and (3) home-made simulation model development by the students themselves using BMDL, agent rules, and BMDS.
This chapter investigates the roles of software agents with machine learning capability in the gaming simulator development cycle. First, students learn busi-ness principles via existing games, then develop their own games by, for, and of themselves, and finally, the games should be accumulated for future use. For the investigation, we employ machine learning agents in the following steps: (1) add the machine agent functionality to our conventional business simulation environ-ment, (2) let one single agent learn the strategy for a specific business game in order to explore the better decisions, (3) execute business simulations with learn-
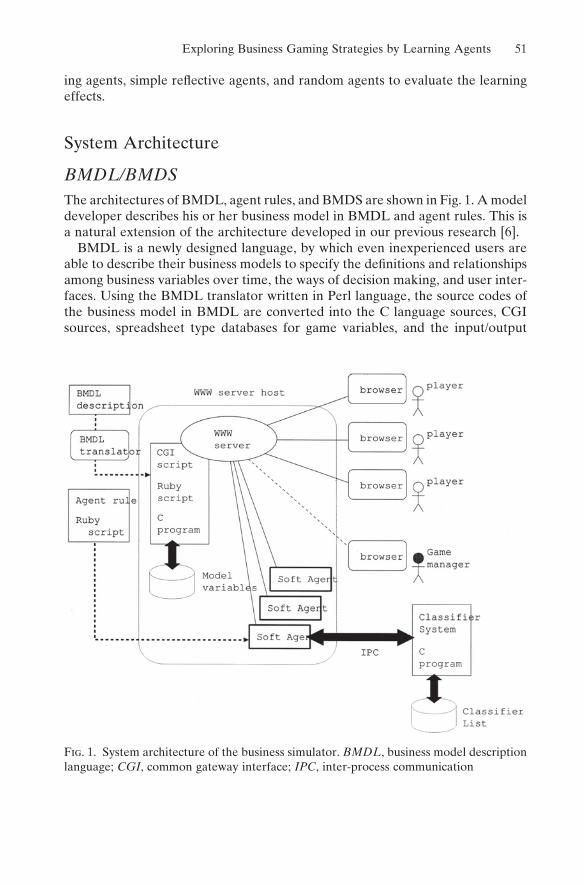
Exploring Business Gaming Strategies by Learning Agents 51
ing agents, simple reflective agents, and random agents to evaluate the learning effects.
System Architecture
BMDL/BMDSThe architectures of BMDL, agent rules, and BMDS are shown in Fig. 1. A model developer describes his or her business model in BMDL and agent rules. This is a natural extension of the architecture developed in our previous research [6].
BMDL is a newly designed language, by which even inexperienced users are able to describe their business models to specify the definitions and relationships among business variables over time, the ways of decision making, and user inter-faces. Using the BMDL translator written in Perl language, the source codes of the business model in BMDL are converted into the C language sources, CGI sources, spreadsheet type databases for game variables, and the input/output
Fig. 1. System architecture of the business simulator. BMDL, business model description language; CGI, common gateway interface; IPC, inter-process communication
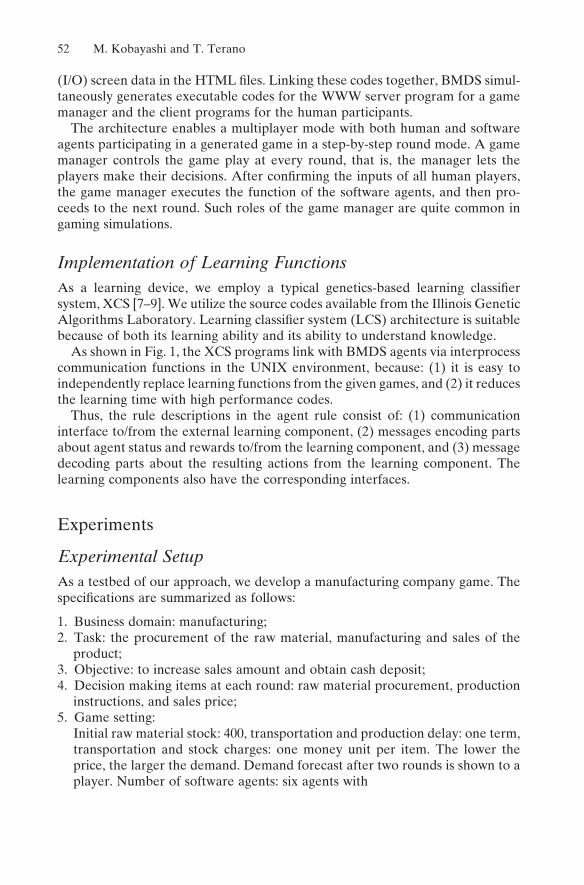
52 M. Kobayashi and T. Terano
(I/O) screen data in the HTML files. Linking these codes together, BMDS simul-taneously generates executable codes for the WWW server program for a game manager and the client programs for the human participants.
The architecture enables a multiplayer mode with both human and software agents participating in a generated game in a step-by-step round mode. A game manager controls the game play at every round, that is, the manager lets the players make their decisions. After confirming the inputs of all human players, the game manager executes the function of the software agents, and then pro-ceeds to the next round. Such roles of the game manager are quite common in gaming simulations.
Implementation of Learning FunctionsAs a learning device, we employ a typical genetics-based learning classifiersystem, XCS [7–9]. We utilize the source codes available from the Illinois Genetic Algorithms Laboratory. Learning classifier system (LCS) architecture is suitable because of both its learning ability and its ability to understand knowledge.
As shown in Fig. 1, the XCS programs link with BMDS agents via interprocess communication functions in the UNIX environment, because: (1) it is easy to independently replace learning functions from the given games, and (2) it reduces the learning time with high performance codes.
Thus, the rule descriptions in the agent rule consist of: (1) communication interface to/from the external learning component, (2) messages encoding parts about agent status and rewards to/from the learning component, and (3) message decoding parts about the resulting actions from the learning component. The learning components also have the corresponding interfaces.
Experiments
Experimental SetupAs a testbed of our approach, we develop a manufacturing company game. The specifications are summarized as follows:
1. Business domain: manufacturing;2. Task: the procurement of the raw material, manufacturing and sales of the
product;3. Objective: to increase sales amount and obtain cash deposit;4. Decision making items at each round: raw material procurement, production
instructions, and sales price;5. Game setting:
Initial raw material stock: 400, transportation and production delay: one term, transportation and stock charges: one money unit per item. The lower the price, the larger the demand. Demand forecast after two rounds is shown to a player. Number of software agents: six agents with
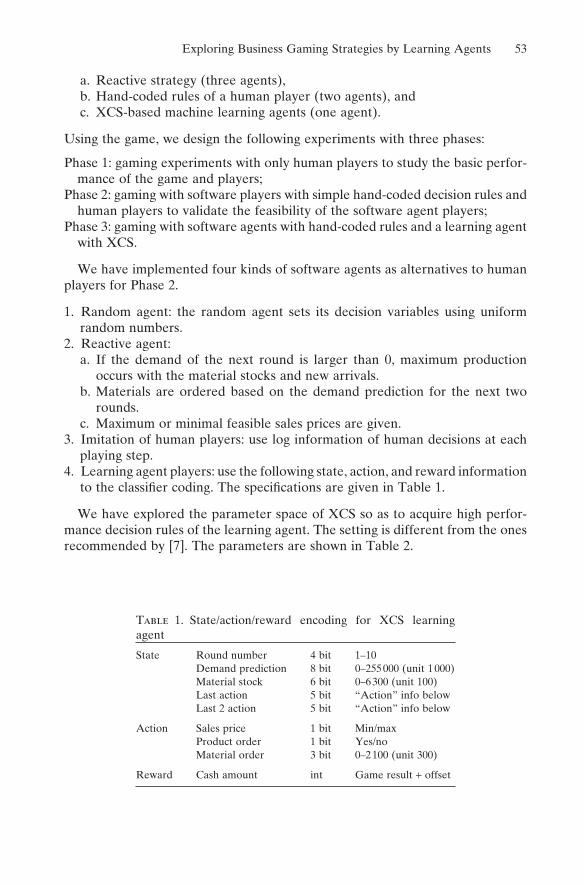
Exploring Business Gaming Strategies by Learning Agents 53
a. Reactive strategy (three agents),b. Hand-coded rules of a human player (two agents), andc. XCS-based machine learning agents (one agent).
Using the game, we design the following experiments with three phases:
Phase 1: gaming experiments with only human players to study the basic perfor-mance of the game and players;
Phase 2: gaming with software players with simple hand-coded decision rules and human players to validate the feasibility of the software agent players;
Phase 3: gaming with software agents with hand-coded rules and a learning agent with XCS.
We have implemented four kinds of software agents as alternatives to human players for Phase 2.
1. Random agent: the random agent sets its decision variables using uniform random numbers.
2. Reactive agent:a. If the demand of the next round is larger than 0, maximum production
occurs with the material stocks and new arrivals.b. Materials are ordered based on the demand prediction for the next two
rounds.c. Maximum or minimal feasible sales prices are given.
3. Imitation of human players: use log information of human decisions at each playing step.
4. Learning agent players: use the following state, action, and reward information to the classifier coding. The specifications are given in Table 1.
We have explored the parameter space of XCS so as to acquire high perfor-mance decision rules of the learning agent. The setting is different from the ones recommended by [7]. The parameters are shown in Table 2.
Table 1. State/action/reward encoding for XCS learning agent
State Round number 4 bit 1–10Demand prediction 8 bit 0–255 000 (unit 1 000)Material stock 6 bit 0–6 300 (unit 100)Last action 5 bit “Action” info belowLast 2 action 5 bit “Action” info below
Action Sales price 1 bit Min/maxProduct order 1 bit Yes/noMaterial order 3 bit 0–2 100 (unit 300)
Reward Cash amount int Game result + offset
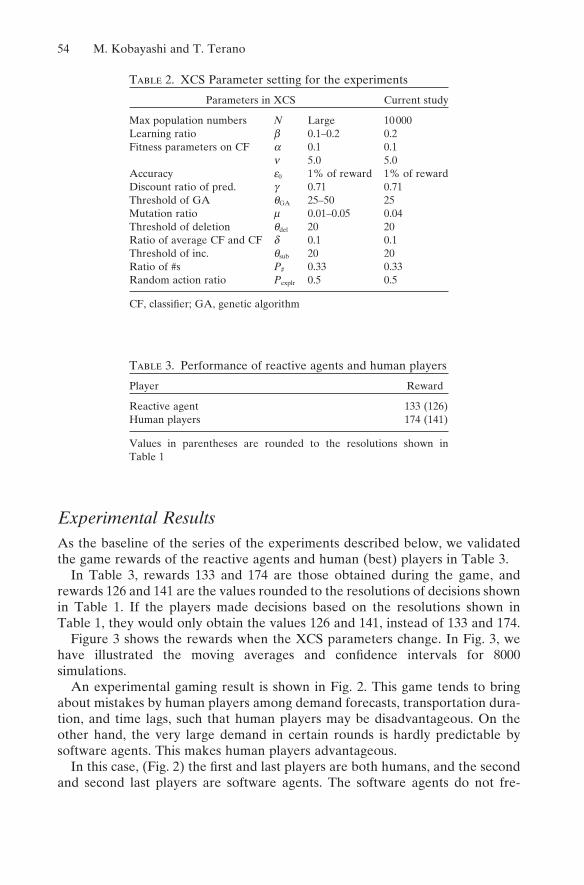
54 M. Kobayashi and T. Terano
Experimental ResultsAs the baseline of the series of the experiments described below, we validated the game rewards of the reactive agents and human (best) players in Table 3.
In Table 3, rewards 133 and 174 are those obtained during the game, and rewards 126 and 141 are the values rounded to the resolutions of decisions shown in Table 1. If the players made decisions based on the resolutions shown in Table 1, they would only obtain the values 126 and 141, instead of 133 and 174.
Figure 3 shows the rewards when the XCS parameters change. In Fig. 3, we have illustrated the moving averages and confidence intervals for 8000 simulations.
An experimental gaming result is shown in Fig. 2. This game tends to bring about mistakes by human players among demand forecasts, transportation dura-tion, and time lags, such that human players may be disadvantageous. On the other hand, the very large demand in certain rounds is hardly predictable by software agents. This makes human players advantageous.
In this case, (Fig. 2) the first and last players are both humans, and the second and second last players are software agents. The software agents do not fre-
Table 2. XCS Parameter setting for the experiments
Parameters in XCS Current study
Max population numbers N Large 10 000Learning ratio b 0.1–0.2 0.2Fitness parameters on CF a 0.1 0.1
n 5.0 5.0Accuracy e0 1% of reward 1% of rewardDiscount ratio of pred. g 0.71 0.71Threshold of GA qGA 25–50 25Mutation ratio m 0.01–0.05 0.04Threshold of deletion qdel 20 20Ratio of average CF and CF d 0.1 0.1Threshold of inc. qsub 20 20Ratio of #s P# 0.33 0.33Random action ratio Pexplr 0.5 0.5
CF, classifier; GA, genetic algorithm
Table 3. Performance of reactive agents and human players
Player Reward
Reactive agent 133 (126)Human players 174 (141)
Values in parentheses are rounded to the resolutions shown in Table 1
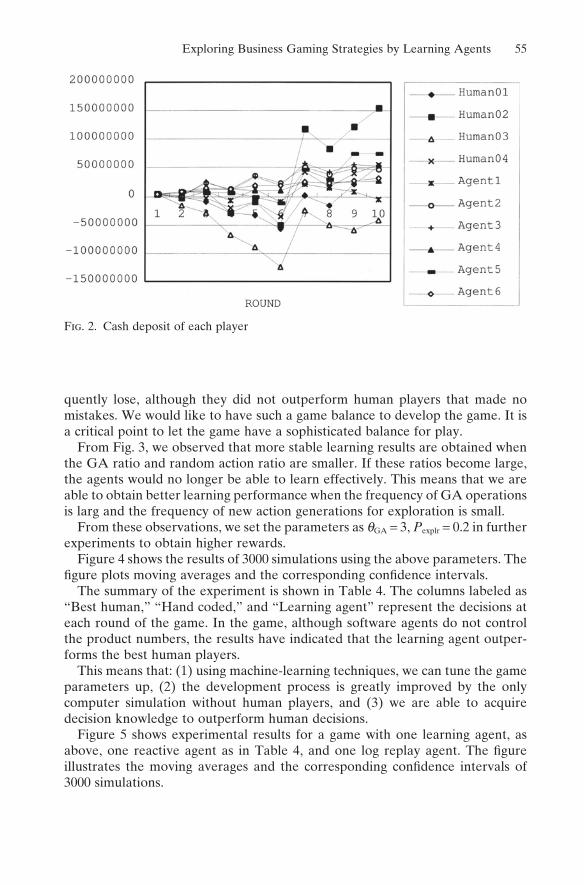
Exploring Business Gaming Strategies by Learning Agents 55
Fig. 2. Cash deposit of each player
quently lose, although they did not outperform human players that made no mistakes. We would like to have such a game balance to develop the game. It is a critical point to let the game have a sophisticated balance for play.
From Fig. 3, we observed that more stable learning results are obtained when the GA ratio and random action ratio are smaller. If these ratios become large, the agents would no longer be able to learn effectively. This means that we are able to obtain better learning performance when the frequency of GA operations is larg and the frequency of new action generations for exploration is small.
From these observations, we set the parameters as qGA = 3, Pexplr = 0.2 in further experiments to obtain higher rewards.
Figure 4 shows the results of 3000 simulations using the above parameters. The figure plots moving averages and the corresponding confidence intervals.
The summary of the experiment is shown in Table 4. The columns labeled as “Best human,” “Hand coded,” and “Learning agent” represent the decisions at each round of the game. In the game, although software agents do not control the product numbers, the results have indicated that the learning agent outper-forms the best human players.
This means that: (1) using machine-learning techniques, we can tune the game parameters up, (2) the development process is greatly improved by the only computer simulation without human players, and (3) we are able to acquire decision knowledge to outperform human decisions.
Figure 5 shows experimental results for a game with one learning agent, as above, one reactive agent as in Table 4, and one log replay agent. The figureillustrates the moving averages and the corresponding confidence intervals of 3000 simulations.
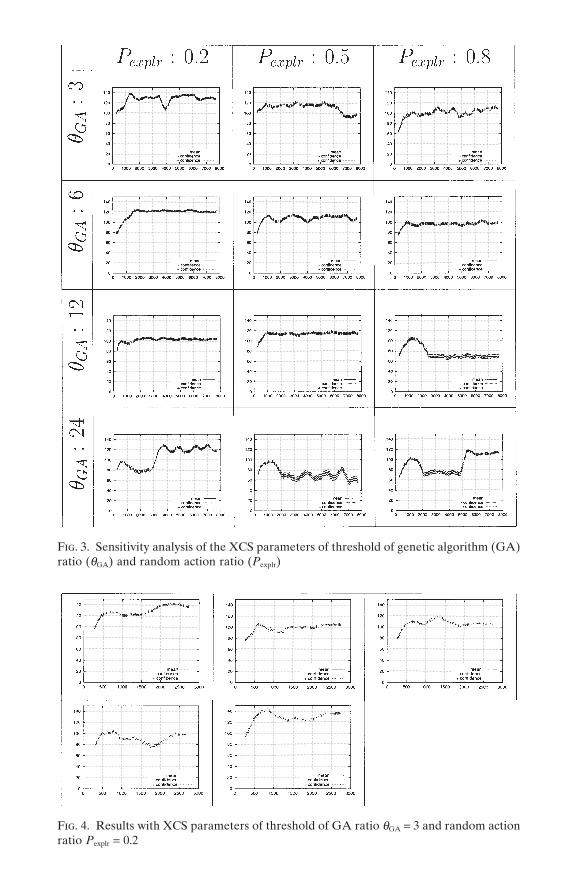
Fig. 4. Results with XCS parameters of threshold of GA ratio qGA = 3 and random action ratio Pexplr = 0.2
Fig. 3. Sensitivity analysis of the XCS parameters of threshold of genetic algorithm (GA) ratio (qGA) and random action ratio (Pexplr)
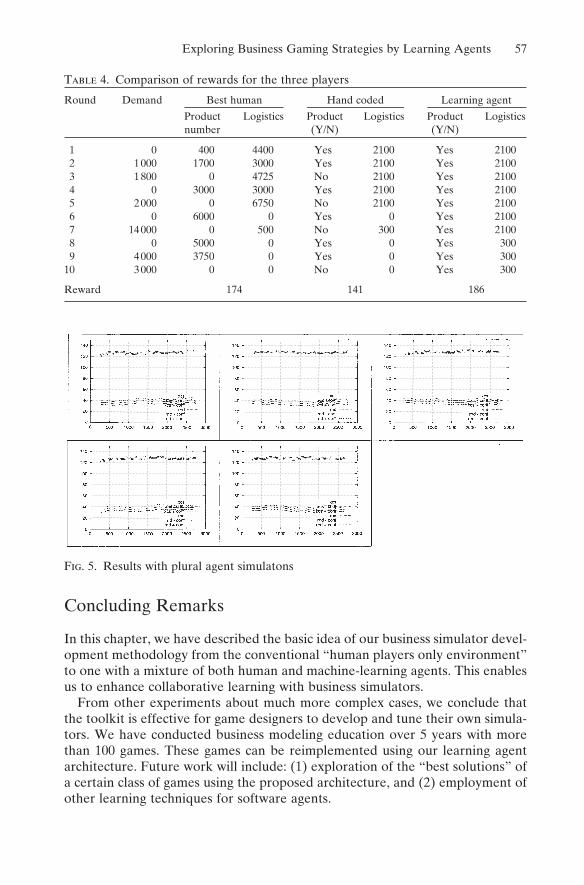
Concluding Remarks
In this chapter, we have described the basic idea of our business simulator devel-opment methodology from the conventional “human players only environment” to one with a mixture of both human and machine-learning agents. This enables us to enhance collaborative learning with business simulators.
From other experiments about much more complex cases, we conclude that the toolkit is effective for game designers to develop and tune their own simula-tors. We have conducted business modeling education over 5 years with more than 100 games. These games can be reimplemented using our learning agent architecture. Future work will include: (1) exploration of the “best solutions” of a certain class of games using the proposed architecture, and (2) employment of other learning techniques for software agents.
Fig. 5. Results with plural agent simulatons
Table 4. Comparison of rewards for the three players
Round Demand Best human Hand coded Learning agent
Product Logistics Product Logistics Product Logisticsnumber (Y/N) (Y/N)
1 0 400 4400 Yes 2100 Yes 21002 1 000 1700 3000 Yes 2100 Yes 21003 1 800 0 4725 No 2100 Yes 21004 0 3000 3000 Yes 2100 Yes 21005 2 000 0 6750 No 2100 Yes 21006 0 6000 0 Yes 0 Yes 21007 14 000 0 500 No 300 Yes 21008 0 5000 0 Yes 0 Yes 3009 4 000 3750 0 Yes 0 Yes 300
10 3 000 0 0 No 0 Yes 300
Reward 174 141 186
Exploring Business Gaming Strategies by Learning Agents 57
58 M. Kobayashi and T. Terano
References1. Knotts US (1998) Teaching strategic management with a business game. Simulation and
Gaming 28:377–3942. Wolfe J, Frutzsche DJ (1998) Teaching business ethics with management and marketing
games. Simulation and Gaming 29:44–593. Barreteau O, Bousquet F, Attonaty JM (2001) Role-playing games for opening the black
box of multiagent systems: method and lessons of Senegal River Valley irrigated systems. Journal of Artificial Societies and Social Simulation 4
4. Elgood C (1993) Handbook of management games. Gower, Aldershot Hampshire5. Hare M, Gilbert N, Medugno D, et al (2001) The development of an Internet forum
for long-term participatory group learning about problems and solutions to sustainable urban water supply management. Online Mediation Workshop 2001, ETH, Zurich
6. Terano T, Suzuki H, Kuno Y, et al (1999) Understanding your business through home-made simulator development. Proceedings of Developments in Business Simulation and Experiential Learning (Proc ABSEL’99) 26:65–71
7. Butz MV (2000) XCS-C1.1.tar.Z. ftp://ftpilligal.ge.uiuc.edu/pub/src/XCS/XCS-C1.1.tar.Z. Cited 29 Jun 2003
8. Butz MV, Wilson SW (2000) An algorithmic description of XCS. ftp://ftpilligal.ge.uiuc.edu/pub/papers/IlliGALs/2000017.ps.Z. Cited 29 Jun 2003
9. Butz MV, Kovacs T, Lanzi PL, et al (2002) Theory of generalization and learning in XCS. ftp://ftpilligal.ge.uiuc.edu/pub/papers/IlliGALs/2002011.ps.Z. Cited 29 Jun 2003
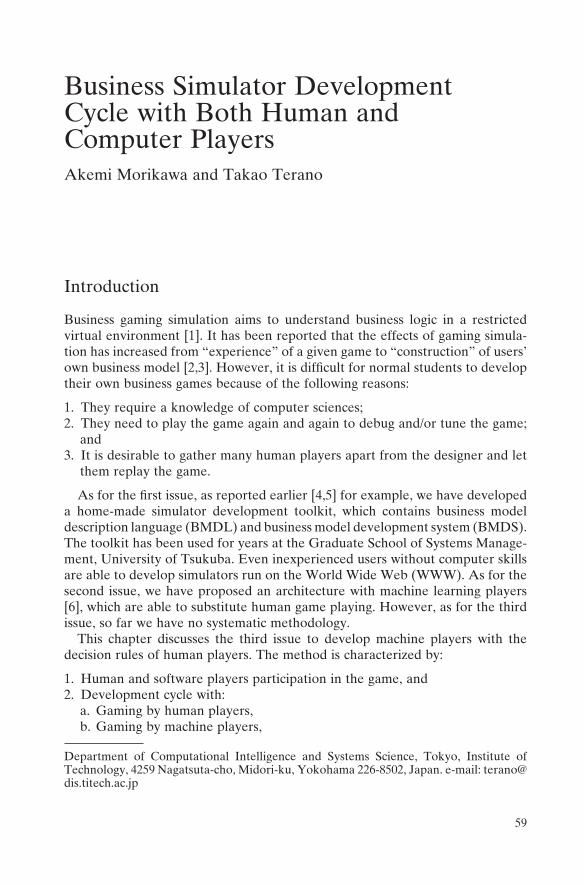
59
Business Simulator Development Cycle with Both Human and Computer PlayersAkemi Morikawa and Takao Terano
Department of Computational Intelligence and Systems Science, Tokyo, Institute of Technology, 4259 Nagatsuta-cho, Midori-ku, Yokohama 226-8502, Japan. e-mail: [email protected]
Introduction
Business gaming simulation aims to understand business logic in a restricted virtual environment [1]. It has been reported that the effects of gaming simula-tion has increased from “experience” of a given game to “construction” of users’ own business model [2,3]. However, it is difficult for normal students to develop their own business games because of the following reasons:
1. They require a knowledge of computer sciences;2. They need to play the game again and again to debug and/or tune the game;
and3. It is desirable to gather many human players apart from the designer and let
them replay the game.
As for the first issue, as reported earlier [4,5] for example, we have developed a home-made simulator development toolkit, which contains business model description language (BMDL) and business model development system (BMDS). The toolkit has been used for years at the Graduate School of Systems Manage-ment, University of Tsukuba. Even inexperienced users without computer skills are able to develop simulators run on the World Wide Web (WWW). As for the second issue, we have proposed an architecture with machine learning players [6], which are able to substitute human game playing. However, as for the third issue, so far we have no systematic methodology.
This chapter discusses the third issue to develop machine players with the decision rules of human players. The method is characterized by:
1. Human and software players participation in the game, and2. Development cycle with:
a. Gaming by human players,b. Gaming by machine players,
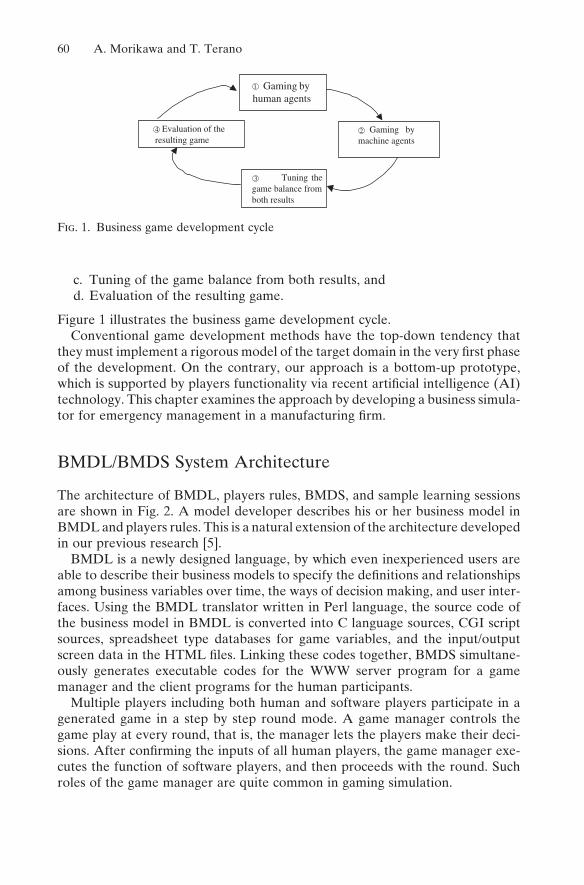
60 A. Morikawa and T. Terano
c. Tuning of the game balance from both results, andd. Evaluation of the resulting game.
Figure 1 illustrates the business game development cycle.Conventional game development methods have the top-down tendency that
they must implement a rigorous model of the target domain in the very first phase of the development. On the contrary, our approach is a bottom-up prototype, which is supported by players functionality via recent artificial intelligence (AI) technology. This chapter examines the approach by developing a business simula-tor for emergency management in a manufacturing firm.
BMDL/BMDS System Architecture
The architecture of BMDL, players rules, BMDS, and sample learning sessions are shown in Fig. 2. A model developer describes his or her business model in BMDL and players rules. This is a natural extension of the architecture developed in our previous research [5].
BMDL is a newly designed language, by which even inexperienced users are able to describe their business models to specify the definitions and relationships among business variables over time, the ways of decision making, and user inter-faces. Using the BMDL translator written in Perl language, the source code of the business model in BMDL is converted into C language sources, CGI script sources, spreadsheet type databases for game variables, and the input/output screen data in the HTML files. Linking these codes together, BMDS simultane-ously generates executable codes for the WWW server program for a game manager and the client programs for the human participants.
Multiple players including both human and software players participate in a generated game in a step by step round mode. A game manager controls the game play at every round, that is, the manager lets the players make their deci-sions. After confirming the inputs of all human players, the game manager exe-cutes the function of software players, and then proceeds with the round. Such roles of the game manager are quite common in gaming simulation.
Gaming byhuman agents
Gaming bymachine agents
Tuning thegame balance fromboth results
Evaluation of the resulting game
1
2
3
4
Fig. 1. Business game development cycle
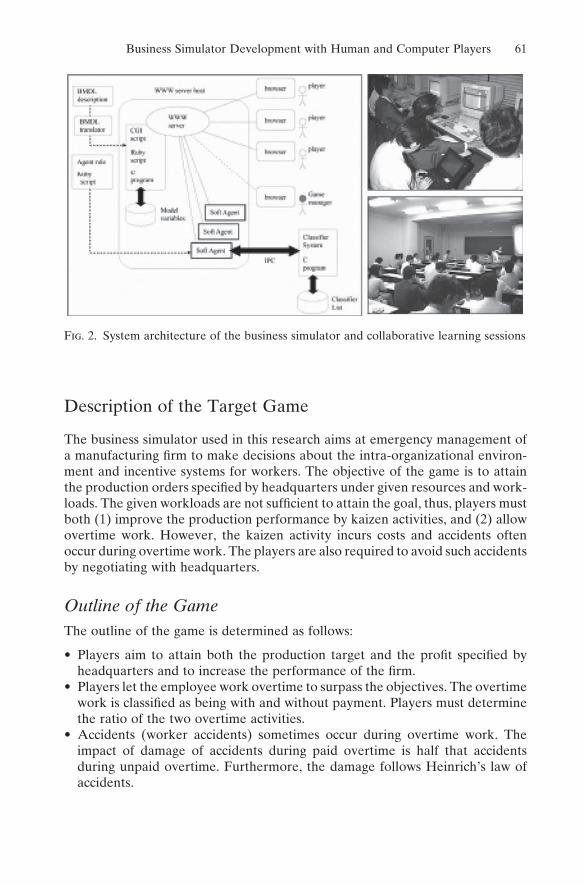
Business Simulator Development with Human and Computer Players 61
Description of the Target Game
The business simulator used in this research aims at emergency management of a manufacturing firm to make decisions about the intra-organizational environ-ment and incentive systems for workers. The objective of the game is to attain the production orders specified by headquarters under given resources and work-loads. The given workloads are not sufficient to attain the goal, thus, players must both (1) improve the production performance by kaizen activities, and (2) allow overtime work. However, the kaizen activity incurs costs and accidents often occur during overtime work. The players are also required to avoid such accidents by negotiating with headquarters.
Outline of the GameThe outline of the game is determined as follows:
• Players aim to attain both the production target and the profit specified by headquarters and to increase the performance of the firm.
• Players let the employee work overtime to surpass the objectives. The overtime work is classified as being with and without payment. Players must determine the ratio of the two overtime activities.
• Accidents (worker accidents) sometimes occur during overtime work. The impact of damage of accidents during paid overtime is half that accidents during unpaid overtime. Furthermore, the damage follows Heinrich’s law of accidents.
Fig. 2. System architecture of the business simulator and collaborative learning sessions
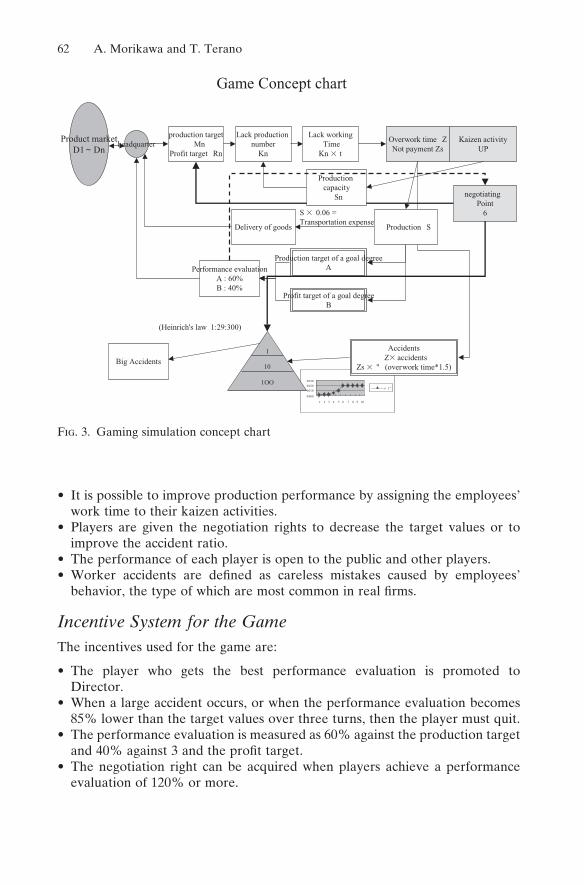
62 A. Morikawa and T. Terano
• It is possible to improve production performance by assigning the employees’ work time to their kaizen activities.
• Players are given the negotiation rights to decrease the target values or to improve the accident ratio.
• The performance of each player is open to the public and other players.• Worker accidents are defined as careless mistakes caused by employees’
behavior, the type of which are most common in real firms.
Incentive System for the GameThe incentives used for the game are:
• The player who gets the best performance evaluation is promoted to Director.
• When a large accident occurs, or when the performance evaluation becomes 85% lower than the target values over three turns, then the player must quit.
• The performance evaluation is measured as 60% against the production target and 40% against 3 and the profit target.
• The negotiation right can be acquired when players achieve a performance evaluation of 120% or more.
0.000
0.010
0.020
0.030
1 2 3 4 5 6 7 8 9 10
n "1
Game Concept chart
Product marketD1 ~ Dn
headquarterproduction target
MnProfit target Rn
Lack production number
Kn
Lack workingTime
Kn � t
Overwork time ZNot payment Zs
Kaizen activityUP
Delivery of goods
S � 0.06 = Transportation expense
Production target of a goal degreeA
Profit target of a goal degreeB
Performance evaluationA : 60%B : 40%
AccidentsZ� accidents
Zs � " (overwork time*1.5)
(Heinrich's law 1:29:300)
1
10
1OO
Big Accidents
Production S
negotiatingPoint
6
Production capacity
Sn
Fig. 3. Gaming simulation concept chart
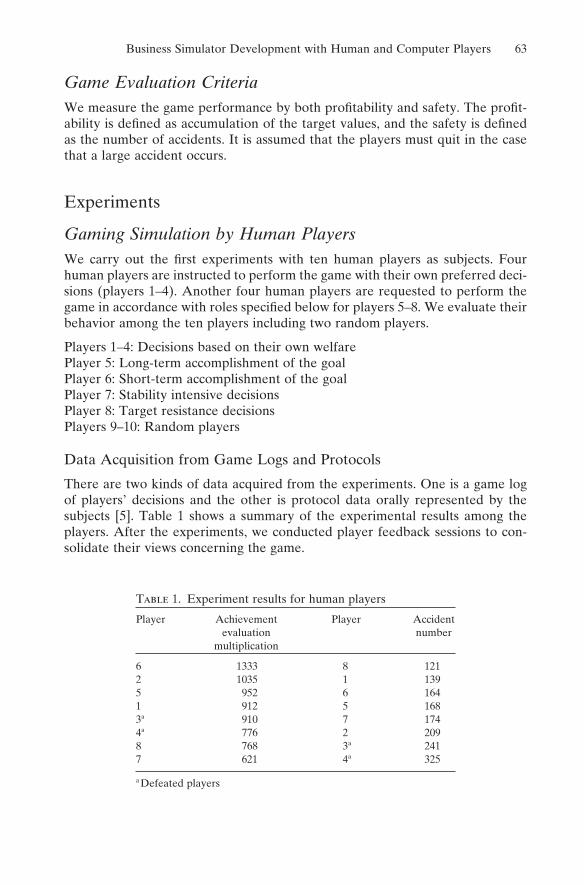
Business Simulator Development with Human and Computer Players 63
Game Evaluation CriteriaWe measure the game performance by both profitability and safety. The profit-ability is defined as accumulation of the target values, and the safety is definedas the number of accidents. It is assumed that the players must quit in the case that a large accident occurs.
Experiments
Gaming Simulation by Human PlayersWe carry out the first experiments with ten human players as subjects. Four human players are instructed to perform the game with their own preferred deci-sions (players 1–4). Another four human players are requested to perform the game in accordance with roles specified below for players 5–8. We evaluate their behavior among the ten players including two random players.
Players 1–4: Decisions based on their own welfarePlayer 5: Long-term accomplishment of the goalPlayer 6: Short-term accomplishment of the goalPlayer 7: Stability intensive decisionsPlayer 8: Target resistance decisionsPlayers 9–10: Random players
Data Acquisition from Game Logs and Protocols
There are two kinds of data acquired from the experiments. One is a game log of players’ decisions and the other is protocol data orally represented by the subjects [5]. Table 1 shows a summary of the experimental results among the players. After the experiments, we conducted player feedback sessions to con-solidate their views concerning the game.
Table 1. Experiment results for human players
Player Achievement Player Accidentevaluation number
multiplication
6 1333 8 1212 1035 1 1395 952 6 1641 912 5 1683a 910 7 1744a 776 2 2098 768 3a 2417 621 4a 325
a Defeated players
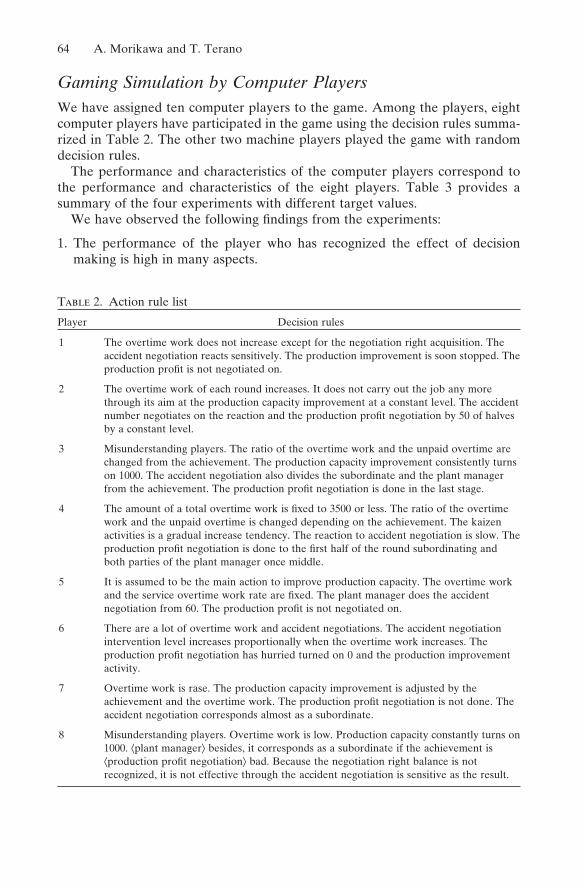
64 A. Morikawa and T. Terano
Gaming Simulation by Computer PlayersWe have assigned ten computer players to the game. Among the players, eight computer players have participated in the game using the decision rules summa-rized in Table 2. The other two machine players played the game with random decision rules.
The performance and characteristics of the computer players correspond to the performance and characteristics of the eight players. Table 3 provides a summary of the four experiments with different target values.
We have observed the following findings from the experiments:
1. The performance of the player who has recognized the effect of decision making is high in many aspects.
Table 2. Action rule list
Player Decision rules
1 The overtime work does not increase except for the negotiation right acquisition. The accident negotiation reacts sensitively. The production improvement is soon stopped. The production profit is not negotiated on.
2 The overtime work of each round increases. It does not carry out the job any more through its aim at the production capacity improvement at a constant level. The accident number negotiates on the reaction and the production profit negotiation by 50 of halves by a constant level.
3 Misunderstanding players. The ratio of the overtime work and the unpaid overtime are changed from the achievement. The production capacity improvement consistently turns on 1000. The accident negotiation also divides the subordinate and the plant manager from the achievement. The production profit negotiation is done in the last stage.
4 The amount of a total overtime work is fixed to 3500 or less. The ratio of the overtime work and the unpaid overtime is changed depending on the achievement. The kaizen activities is a gradual increase tendency. The reaction to accident negotiation is slow. The production profit negotiation is done to the first half of the round subordinating and both parties of the plant manager once middle.
5 It is assumed to be the main action to improve production capacity. The overtime work and the service overtime work rate are fixed. The plant manager does the accident negotiation from 60. The production profit is not negotiated on.
6 There are a lot of overtime work and accident negotiations. The accident negotiation intervention level increases proportionally when the overtime work increases. The production profit negotiation has hurried turned on 0 and the production improvement activity.
7 Overtime work is rase. The production capacity improvement is adjusted by the achievement and the overtime work. The production profit negotiation is not done. The accident negotiation corresponds almost as a subordinate.
8 Misunderstanding players. Overtime work is low. Production capacity constantly turns on 1000. ⟨plant manager⟩ besides, it corresponds as a subordinate if the achievement is ⟨production profit negotiation⟩ bad. Because the negotiation right balance is not recognized, it is not effective through the accident negotiation is sensitive as the result.
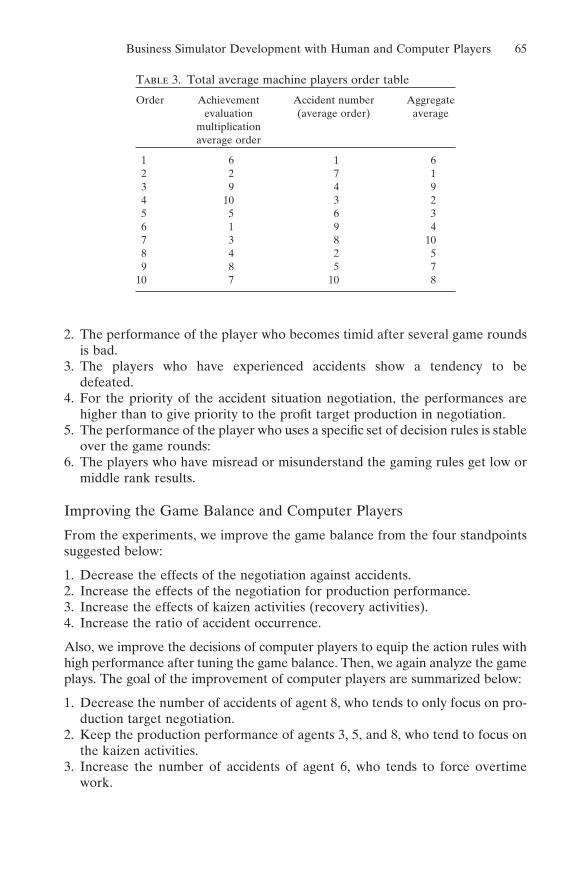
Business Simulator Development with Human and Computer Players 65
2. The performance of the player who becomes timid after several game rounds is bad.
3. The players who have experienced accidents show a tendency to be defeated.
4. For the priority of the accident situation negotiation, the performances are higher than to give priority to the profit target production in negotiation.
5. The performance of the player who uses a specific set of decision rules is stable over the game rounds:
6. The players who have misread or misunderstand the gaming rules get low or middle rank results.
Improving the Game Balance and Computer Players
From the experiments, we improve the game balance from the four standpoints suggested below:
1. Decrease the effects of the negotiation against accidents.2. Increase the effects of the negotiation for production performance.3. Increase the effects of kaizen activities (recovery activities).4. Increase the ratio of accident occurrence.
Also, we improve the decisions of computer players to equip the action rules with high performance after tuning the game balance. Then, we again analyze the game plays. The goal of the improvement of computer players are summarized below:
1. Decrease the number of accidents of agent 8, who tends to only focus on pro-duction target negotiation.
2. Keep the production performance of agents 3, 5, and 8, who tend to focus on the kaizen activities.
3. Increase the number of accidents of agent 6, who tends to force overtime work.
Table 3. Total average machine players order table
Order Achievement Accident number Aggregateevaluation (average order) average
multiplicationaverage order
1 6 1 62 2 7 13 9 4 94 10 3 25 5 6 36 1 9 47 3 8 108 4 2 59 8 5 7
10 7 10 8
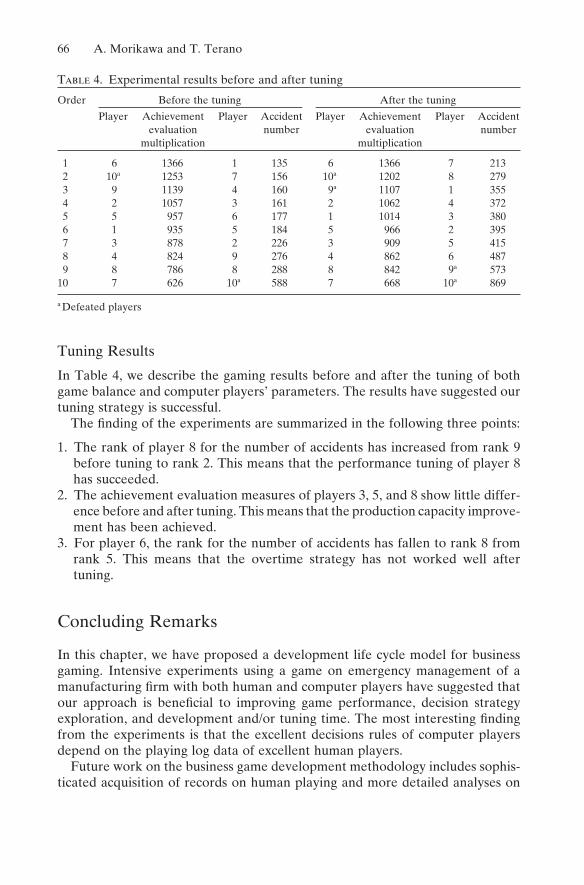
66 A. Morikawa and T. Terano
Tuning Results
In Table 4, we describe the gaming results before and after the tuning of both game balance and computer players’ parameters. The results have suggested our tuning strategy is successful.
The finding of the experiments are summarized in the following three points:
1. The rank of player 8 for the number of accidents has increased from rank 9 before tuning to rank 2. This means that the performance tuning of player 8 has succeeded.
2. The achievement evaluation measures of players 3, 5, and 8 show little differ-ence before and after tuning. This means that the production capacity improve-ment has been achieved.
3. For player 6, the rank for the number of accidents has fallen to rank 8 from rank 5. This means that the overtime strategy has not worked well after tuning.
Concluding Remarks
In this chapter, we have proposed a development life cycle model for business gaming. Intensive experiments using a game on emergency management of a manufacturing firm with both human and computer players have suggested that our approach is beneficial to improving game performance, decision strategy exploration, and development and/or tuning time. The most interesting findingfrom the experiments is that the excellent decisions rules of computer players depend on the playing log data of excellent human players.
Future work on the business game development methodology includes sophis-ticated acquisition of records on human playing and more detailed analyses on
Table 4. Experimental results before and after tuning
Order Before the tuning After the tuning
Player Achievement Player Accident Player Achievement Player Accidentevaluation number evaluation number
multiplication multiplication
1 6 1366 1 135 6 1366 7 2132 10a 1253 7 156 10a 1202 8 2793 9 1139 4 160 9a 1107 1 3554 2 1057 3 161 2 1062 4 3725 5 957 6 177 1 1014 3 3806 1 935 5 184 5 966 2 3957 3 878 2 226 3 909 5 4158 4 824 9 276 4 862 6 4879 8 786 8 288 8 842 9a 573
10 7 626 10a 588 7 668 10a 869
a Defeated players
Business Simulator Development with Human and Computer Players 67
the protocol and log data. We must develop more intelligent computer players with learning functionality [5].
References1. Wolfe J, Frutzsche DJ (1998) Teaching business ethics with management and marketing
games. Simulation and Gaming 29:44–59.2. Barreteau O, Bousquet F, Attonaty J-M (2001) Role-playing games for opening the
black box of multi-agent systems: method and lessons of Senegal River Valley irrigated systems. Journal of Artificial Societies and Social Simulation, 4:2 (http://jasss.soc.surrey.ac.uk/4/2/5.html)
3. Elgood C (1993) Handbook of management games. Gower Press4. Shirai H, Tanabu M, Terano T, et al. (2003) Game development toolkit for business
people in Japan. Simulation and Gaming 34:437–4465. Terano T, et al. (1999) Understanding your business through home-made simulator
development. Developments in Business Simulation and Experiential Learning (Proc. ABSEL’99) 26:65–71.
6. Kobayashi M, Terano T (2003) Learning agents in a business simulator. Proceedings of 2003 IEEE International Symposium on Computational Intelligence in Robotics and Automation, July 16–20 2003, pp 1323–1327.
7. Terano T, Deguchi H, Takadama K (2003) Meeting the challenge of social problems viaagent-based simulation. Springer, Berlin Heidelberg New York.
69
Analyzing Barnga Gaming Simulation Using an Agent-Based ModelYutaka I. Leon Suematsu1,2, Keiki Takadama1,3,Katsunori Shimohara1,2, Osamu Katai2, and Kiyoshi Arai4
1 ATR International—Network Informatics Labs. 2-2-2 Hikari-dai, Seika-cho, Soraku-gun, Kyoto 619-0288, Japan. e-mail: {yutaka, keiki, katsu}@atr.co.jp2 Graduate School of Informatics, Kyoto University, Yoshida-honmachi, Sakyo-ku, Kyoto 606-8501, Japan. e-mail: [email protected] Interdisciplinary Graduate School of Science and Engineering, Department of Compu-tational Intelligence and Systems Science, Tokyo Institute of Technology, 4259 Nagatsuta-cho, Midori-ku, Yokohama, Kanagawa 226-8502, Japan4 School of Project Management, Chiba Institute of Technology, 2-17-1 Tsudanuma Narashino, Chiba 275-8691, Japan. e-mail: [email protected]
Introduction
Gaming simulation (GS) [1] has become an increasingly important method sup-porting learning, training, and decision-making processes among humans through role-playing games. These games provide a powerful tool in educating people through evaluations of different assumptions and implications of various decision-making processes. In general, the more interactions the players experience, the better they are able to master the game. However, there are some difficulties in game design due to the lack of clear ideas on how players learn in the game and how to impose time limitations on the participants. Another difficulty of GS and other social science simulations, such as experimental economics, is the limitations in “what-if” analysis, which requires performing the same experiments with slight changes in the conditions to evaluate their influencein the simulation. In many games, this analysis requires a massive number of participants because, in order to validate the results, once a person has experienced the game, this same person cannot be used in the same game.
In order to overcome these difficulties, agent-based modeling (ABM) can provide a new tool to support analysis of GS. ABM is considered as a prominent paradigm of computer simulation techniques [2–4]. To analyze the validity of this support, this study focuses on: (1) analysis of the effectiveness of ABM as a support for the analysis of GS by verification of the ability of ABM to reproduce behaviors observed in GS, and (2) analysis of the implications and findings of the game through ABM.
70 Y.I.L. Suematsu et al.
The well-known card game called Barnga, created for experimenting cultural differences, was used as a test bed. Barnga was selected because it is an elegant game that, despite being simple, allows the study of human behavior in adapta-tion to complex and changing situations. Another important reason is that com-munication is restricted, which allows the study to focus on the behavior and learning patterns rather than on natural language issues related to human communication.
Barnga
Barnga is a card game that was developed in the field of GS and was created for participants to experience difficulties due to cultural differences [5]. Players are grouped in tables in which the initial rules for each table are slightly different to represent cross-cultural diversity. It should be noted that players are not allowed to speak to one another, restricting communication to a minimum. When players change tables they have to learn and overcome the difficulties raised by the cul-tural differences in order to effectively work in cross-cultural groups.
When players are initially assigned to tables, they receive the instructions and rules of the game and practice for a short time to understand and become familiar with the game. After practice, the instructions provided are removed and the simulation game starts.
Players play for a certain number of rounds. Then, a migration process takes place. The player who wins the most games and the one who loses the most games at each table are moved clockwise and counter-clockwise to neighboring tables, respectively. This process is repeated for a certain number of migrations. When the game is restarted, players experience difficulties because the players from different tables play according to different rules. However, after a certain number of games or migrations, some players are able to recognize the differences and will try to adapt to the rules played by the others or to negotiate with others to define common rules for the table. It should be noted that players are not allowed to speak, limiting communication and simulating natural language barriers so that they must adapt using intuition, reasoning, and insight. Furthermore, negotiations are carried out by body language or facial expressions.
The game is performed as follows: for each game, the player that has won the most games in the previous game or who has been chosen by “paper-rock-scissors” when there is no winner, is designated as the dealer. The dealer shufflesthe cards and deals them one at a time. Each player receives five to seven cards. The first player of a trick plays any card.1 The other players then follow in the same way by playing a card of the same suit. For the case in which there are no cards from the original suit, a card from any suit can be played. The winner
1 In this study, a trick represents a turn where all players of the table play a card, while a game refers to when all the tricks or cards are played.
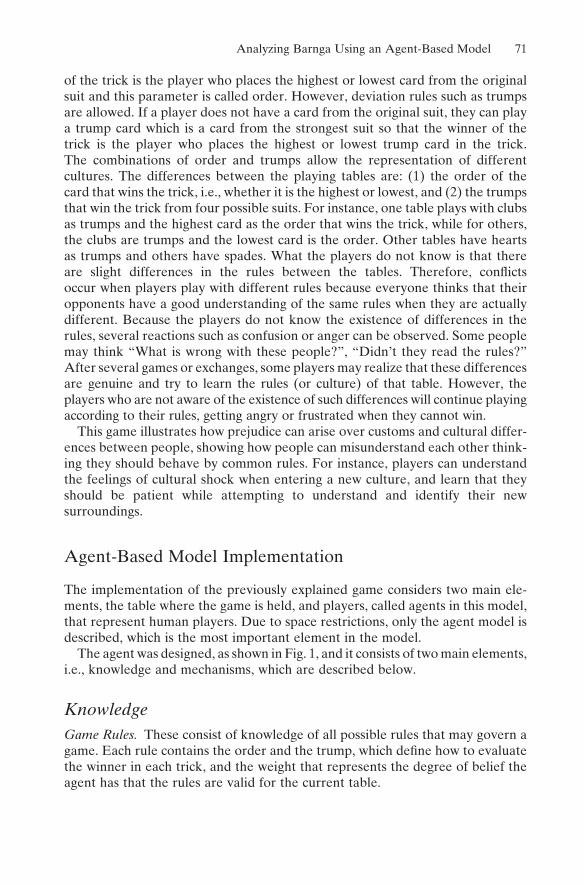
Analyzing Barnga Using an Agent-Based Model 71
of the trick is the player who places the highest or lowest card from the original suit and this parameter is called order. However, deviation rules such as trumps are allowed. If a player does not have a card from the original suit, they can play a trump card which is a card from the strongest suit so that the winner of the trick is the player who places the highest or lowest trump card in the trick. The combinations of order and trumps allow the representation of different cultures. The differences between the playing tables are: (1) the order of the card that wins the trick, i.e., whether it is the highest or lowest, and (2) the trumps that win the trick from four possible suits. For instance, one table plays with clubs as trumps and the highest card as the order that wins the trick, while for others, the clubs are trumps and the lowest card is the order. Other tables have hearts as trumps and others have spades. What the players do not know is that there are slight differences in the rules between the tables. Therefore, conflictsoccur when players play with different rules because everyone thinks that their opponents have a good understanding of the same rules when they are actually different. Because the players do not know the existence of differences in the rules, several reactions such as confusion or anger can be observed. Some people may think “What is wrong with these people?”, “Didn’t they read the rules?” After several games or exchanges, some players may realize that these differences are genuine and try to learn the rules (or culture) of that table. However, the players who are not aware of the existence of such differences will continue playing according to their rules, getting angry or frustrated when they cannot win.
This game illustrates how prejudice can arise over customs and cultural differ-ences between people, showing how people can misunderstand each other think-ing they should behave by common rules. For instance, players can understand the feelings of cultural shock when entering a new culture, and learn that they should be patient while attempting to understand and identify their new surroundings.
Agent-Based Model Implementation
The implementation of the previously explained game considers two main ele-ments, the table where the game is held, and players, called agents in this model, that represent human players. Due to space restrictions, only the agent model is described, which is the most important element in the model.
The agent was designed, as shown in Fig. 1, and it consists of two main elements, i.e., knowledge and mechanisms, which are described below.
KnowledgeGame Rules. These consist of knowledge of all possible rules that may govern a game. Each rule contains the order and the trump, which define how to evaluate the winner in each trick, and the weight that represents the degree of belief the agent has that the rules are valid for the current table.
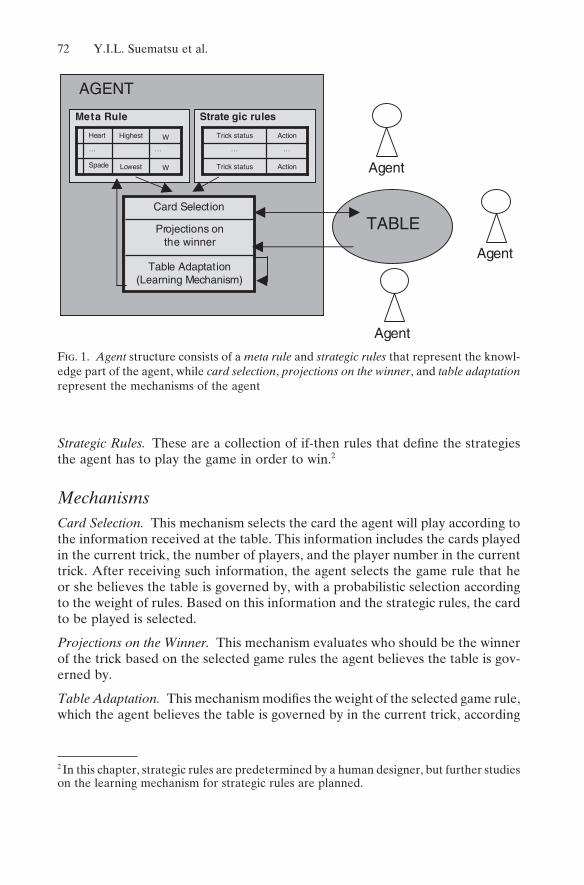
72 Y.I.L. Suematsu et al.
Strategic Rules. These are a collection of if-then rules that define the strategies the agent has to play the game in order to win.2
MechanismsCard Selection. This mechanism selects the card the agent will play according to the information received at the table. This information includes the cards played in the current trick, the number of players, and the player number in the current trick. After receiving such information, the agent selects the game rule that he or she believes the table is governed by, with a probabilistic selection according to the weight of rules. Based on this information and the strategic rules, the card to be played is selected.
Projections on the Winner. This mechanism evaluates who should be the winner of the trick based on the selected game rules the agent believes the table is gov-erned by.
Table Adaptation. This mechanism modifies the weight of the selected game rule, which the agent believes the table is governed by in the current trick, according
AGENT
TABLE
Table Adaptation (Learning Mechanism)
Projections on the winner
Card Selection
Meta Rule
Spade
… …
Heart
Lowest
Highest
W
W
Strate gic rules
ActionTrick status
ActionTrick status
Agent
Agent
Agent
… …
Fig. 1. Agent structure consists of a meta rule and strategic rules that represent the knowl-edge part of the agent, while card selection, projections on the winner, and table adaptationrepresent the mechanisms of the agent
2 In this chapter, strategic rules are predetermined by a human designer, but further studies on the learning mechanism for strategic rules are planned.
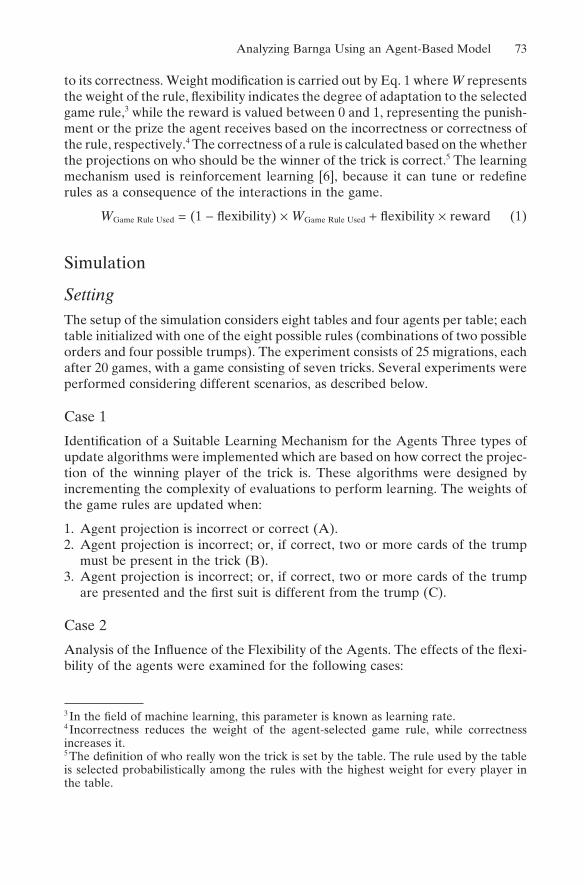
Analyzing Barnga Using an Agent-Based Model 73
to its correctness. Weight modification is carried out by Eq. 1 where W representsthe weight of the rule, flexibility indicates the degree of adaptation to the selected game rule,3 while the reward is valued between 0 and 1, representing the punish-ment or the prize the agent receives based on the incorrectness or correctness of the rule, respectively.4 The correctness of a rule is calculated based on the whether the projections on who should be the winner of the trick is correct.5 The learning mechanism used is reinforcement learning [6], because it can tune or redefinerules as a consequence of the interactions in the game.
WGame Rule Used = (1 − flexibility) × WGame Rule Used + flexibility × reward (1)
Simulation
SettingThe setup of the simulation considers eight tables and four agents per table; each table initialized with one of the eight possible rules (combinations of two possible orders and four possible trumps). The experiment consists of 25 migrations, each after 20 games, with a game consisting of seven tricks. Several experiments were performed considering different scenarios, as described below.
Case 1
Identification of a Suitable Learning Mechanism for the Agents Three types of update algorithms were implemented which are based on how correct the projec-tion of the winning player of the trick is. These algorithms were designed by incrementing the complexity of evaluations to perform learning. The weights of the game rules are updated when:
1. Agent projection is incorrect or correct (A).2. Agent projection is incorrect; or, if correct, two or more cards of the trump
must be present in the trick (B).3. Agent projection is incorrect; or, if correct, two or more cards of the trump
are presented and the first suit is different from the trump (C).
Case 2
Analysis of the Influence of the Flexibility of the Agents. The effects of the flexi-bility of the agents were examined for the following cases:
3 In the field of machine learning, this parameter is known as learning rate.4 Incorrectness reduces the weight of the agent-selected game rule, while correctness increases it.5 The definition of who really won the trick is set by the table. The rule used by the table is selected probabilistically among the rules with the highest weight for every player in the table.
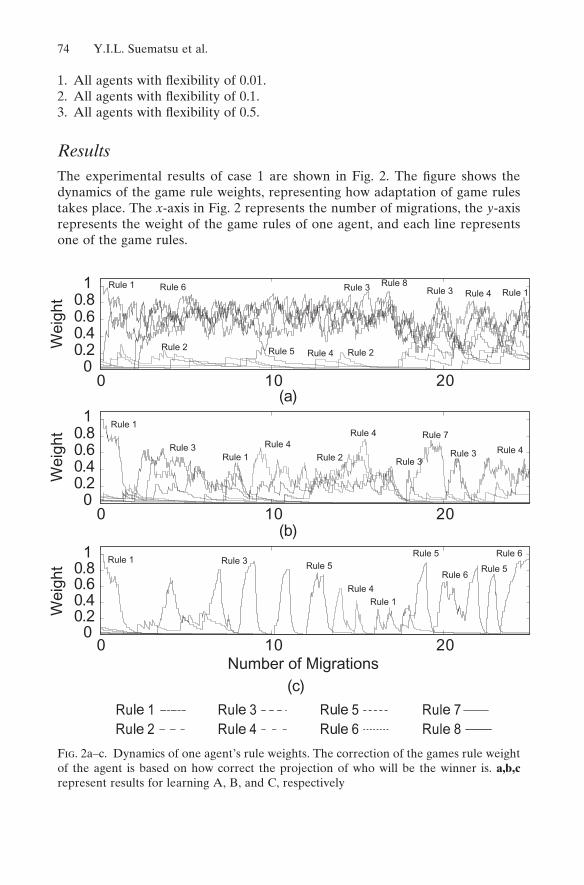
74 Y.I.L. Suematsu et al.
1. All agents with flexibility of 0.01.2. All agents with flexibility of 0.1.3. All agents with flexibility of 0.5.
ResultsThe experimental results of case 1 are shown in Fig. 2. The figure shows the dynamics of the game rule weights, representing how adaptation of game rules takes place. The x-axis in Fig. 2 represents the number of migrations, the y-axisrepresents the weight of the game rules of one agent, and each line represents one of the game rules.
00.20.40.0.8
1
0 10 20(a)
00.20.40.60.8
1
0
Wei
ght
Wei
ght
Wei
ght
10 20(b)
00.20.40.60.8
1
0 10 20Number of Migrations
(c)
Rule 1Rule 2
Rule 3Rule 4
Rule 5Rule 6
Rule 7Rule 8
6
Rule 1
Rule 1
Rule 1
Rule 2
Rule 3
Rule 4
Rule 4
Rule 2
Rule 2
Rule 5
Rule 3
Rule 5
Rule 6
Rule 6
Rule 1
Rule 5Rule 6
Rule 5
Rule 3Rule 1
Rule 4Rule 3
Rule 7
Rule 4
Rule 3 Rule 1Rule 4
Rule 4
Rule 8Rule 3
Fig. 2a–c. Dynamics of one agent’s rule weights. The correction of the games rule weight of the agent is based on how correct the projection of who will be the winner is. a,b,crepresent results for learning A, B, and C, respectively
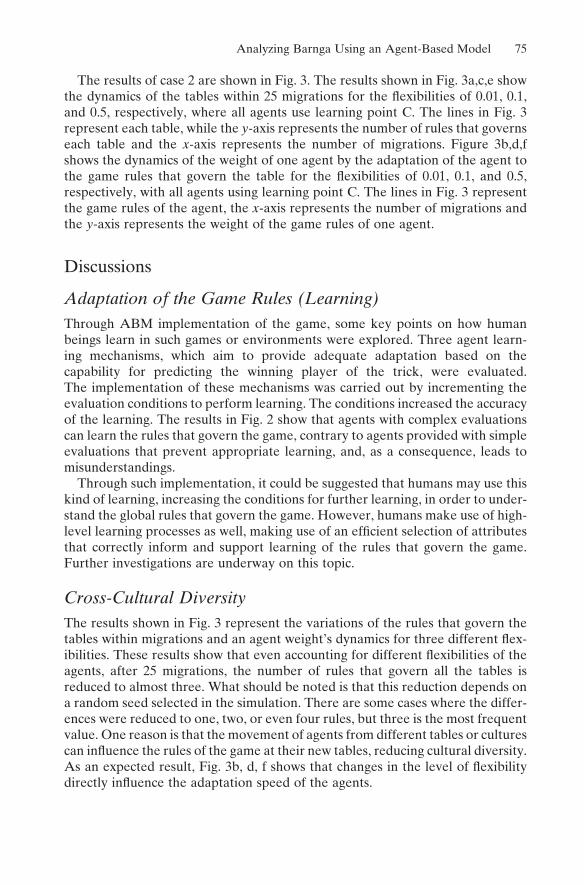
Analyzing Barnga Using an Agent-Based Model 75
The results of case 2 are shown in Fig. 3. The results shown in Fig. 3a,c,e show the dynamics of the tables within 25 migrations for the flexibilities of 0.01, 0.1, and 0.5, respectively, where all agents use learning point C. The lines in Fig. 3 represent each table, while the y-axis represents the number of rules that governs each table and the x-axis represents the number of migrations. Figure 3b,d,f shows the dynamics of the weight of one agent by the adaptation of the agent to the game rules that govern the table for the flexibilities of 0.01, 0.1, and 0.5, respectively, with all agents using learning point C. The lines in Fig. 3 represent the game rules of the agent, the x-axis represents the number of migrations and the y-axis represents the weight of the game rules of one agent.
Discussions
Adaptation of the Game Rules (Learning)Through ABM implementation of the game, some key points on how human beings learn in such games or environments were explored. Three agent learn-ing mechanisms, which aim to provide adequate adaptation based on the capability for predicting the winning player of the trick, were evaluated. The implementation of these mechanisms was carried out by incrementing the evaluation conditions to perform learning. The conditions increased the accuracy of the learning. The results in Fig. 2 show that agents with complex evaluations can learn the rules that govern the game, contrary to agents provided with simple evaluations that prevent appropriate learning, and, as a consequence, leads to misunderstandings.
Through such implementation, it could be suggested that humans may use this kind of learning, increasing the conditions for further learning, in order to under-stand the global rules that govern the game. However, humans make use of high-level learning processes as well, making use of an efficient selection of attributes that correctly inform and support learning of the rules that govern the game. Further investigations are underway on this topic.
Cross-Cultural DiversityThe results shown in Fig. 3 represent the variations of the rules that govern the tables within migrations and an agent weight’s dynamics for three different flex-ibilities. These results show that even accounting for different flexibilities of the agents, after 25 migrations, the number of rules that govern all the tables is reduced to almost three. What should be noted is that this reduction depends on a random seed selected in the simulation. There are some cases where the differ-ences were reduced to one, two, or even four rules, but three is the most frequent value. One reason is that the movement of agents from different tables or cultures can influence the rules of the game at their new tables, reducing cultural diversity. As an expected result, Fig. 3b, d, f shows that changes in the level of flexibilitydirectly influence the adaptation speed of the agents.
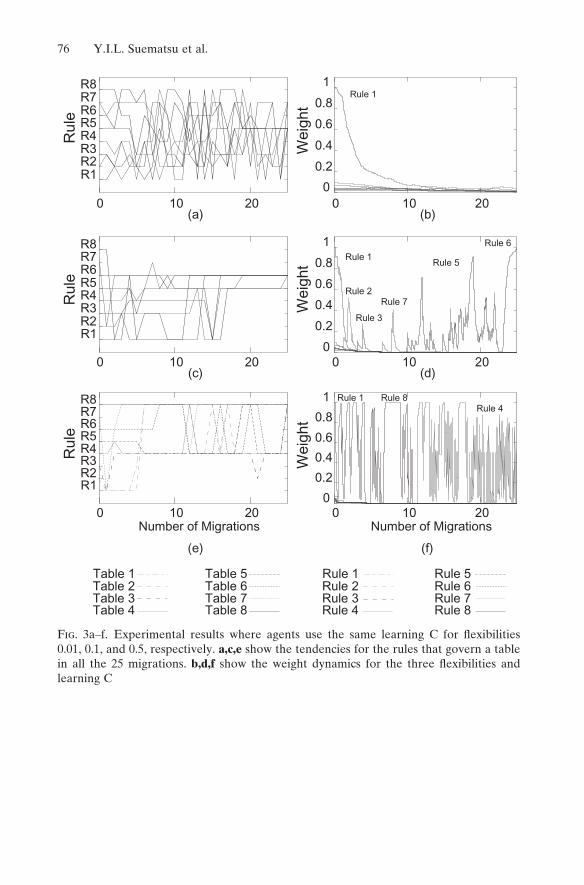
76 Y.I.L. Suematsu et al.
R1R2R3R4R5R6R7R8
0 10 20(a)
0
0.2
0.4
0.6
0.8
1
0 10 20(b)
R1R2R3R4R5R6R7R8
0 10 20(c)
0
0.2
0.4
0.6
0.8
1
0 10 20(d)
R1R2R3R4R5R6R7R8
0 10 20Number of Migrations
(e)
Table 1Table 2Table 3Table 4
Table 5Table 6Table 7Table 8
0
0.2
0.4
0.6
0.8
1
0 10 20Number of Migrations
(f)
Rule 1Rule 2Rule 3Rule 4
Rule 5Rule 6Rule 7Rule 8
Rule 1
Rule 1
Rule 1Rule 4
Rule 8
Rule 2
Rule 3
Rule 7
Rule 5
Rule 6
Adobe Sy stems
Rul
e
Wei
ght
Wei
ght
Wei
ght
Rul
eR
ule
Fig. 3a–f. Experimental results where agents use the same learning C for flexibilities0.01, 0.1, and 0.5, respectively. a,c,e show the tendencies for the rules that govern a table in all the 25 migrations. b,d,f show the weight dynamics for the three flexibilities and learning C
Analyzing Barnga Using an Agent-Based Model 77
Conclusions
Through a model simulation of the card game Barnga, it was shown that ABM can complement GS. ABM provides a new tool for expanding analysis of GS from different angles and viewpoints, and overcoming the difficulties of GS for what-if analysis. Through ABM implementation of the game, key points on how humans learn could be explored. Implementation of an agent’s learning process is based on the capability to correctly predict who the winner of the trick will be based on the game rules the agent believes that the table is governed by. It was observed that the use of simple evaluations to perform adaptation prevents appropriate learning, and induces misunderstandings within a cross-cultural group. Through the implementation of ABM, it was suggested that humans may increment the conditions for evaluations to perform learning. Also, humans were able to make use of an efficient selection of attributes that correctly informs and supports the learning of the rules that govern a game. Another major finding is that cultural diversity is reduced over time, even if players have different levels of flexibility.
Future research will consider: (1) investigations on the effectiveness and appli-cability of ABM in several gaming simulations, (2) further exploration of the Barnga model for the study of cross-cultural differences, and (3) searches for new techniques that can help in the study of behavioral science.
Acknowledgments. This research was conducted as part of the “Research on Human Communication” with funding from the Telecommunications Advance-ment Organization of Japan. Financial support from the Japan International Cooperation Agency (JICA) was also awarded to the first author. This research also was supported in part by the Foundation for the Fusion of Science and Technology (FOST). We express our thanks for all of the above support.
References1. Greenblat CS (1987) Designing games and simulations: an illustrated handbook. Saga,
Newbury Park2. Axelrod RM (1997) The complexity of cooperation: agent-based models of competition
and collaboration. Princeton University Press, New Jersey3. Axelrod RM, Cohen MD (2000) Harnessing complexity: organizational implications of
a scientific frontier. Free, New York4. Moss S, Davidsson P (2001) Multi-agent-based simulation. Lecture notes in artificial
intelligence, vol. 1979. Springer, Berlin Heidelberg New York5. Thiagarajan S, Steinwachs B (1990) Barnga: a simulation game on cultural clashes.
Intercultural, Yarmounth6. Sutton RS, Barto AG (1998) Reinforcement learning: an introduction. MIT,
Massachusetts
79
User Type Identification in Virtual WorldsRuck Thawonmas, Ji-Young Ho, and Yoshitaka Matsumoto
Intelligent Computer Entertainment Laboratory, Department of Human and Com-puter Science, Ritsumeikan University, Kusatsu, Shiga 525-8577, Japan. e-mail: [email protected]
Introduction
In this chapter, we discuss an approach for identification of user types in virtual worlds. A popular form of the virtual world is a massively multiplayer online game (MMOG). MMOGs provide fast-growing online communities [1], and managing a large-scale virtual community implies many challenges, such as iden-tification of user types, social structures, and virtual economic mechanisms [2]. In this chapter, we address the challenge on identification of user types. It is very important to grasp users’ needs and to satisfy them through furnishing appropri-ate contents for each user or each specific group of users.
In virtual worlds, four user types are typically identified by their characteristics, namely, “killer,” “achiever,” “explorer,” and “socializer” [3]. Killer-type users just want to kill other users and monsters with the tools provided. Achiever-type users set their main goal to gather points or to raise levels while an explorer-type user wants to find out interesting things about the virtual world and then to expose them. Socializer-type users are interested in relationships among users. Following this categorization, a typical use of user-type identification results can be depicted as in Fig. 1. In this figure, users are categorized into predefinedtypes based on appropriate selected features from the logs, and are provided contents according to their favorites. Thereby, the users should enjoy the virtual world more and hence stay longer. As a first step toward use of real user data, we demonstrate our approach using a PC cluster-based MMOG simulator.
The work presented in this chapter is divided into two phases, namely, model-ing and identification. In the modeling phase, many types of user agents with different characteristics are modeled using the above MMOG simulator. By user agents, we mean agents that imitate user characters in real MMOGs. The user
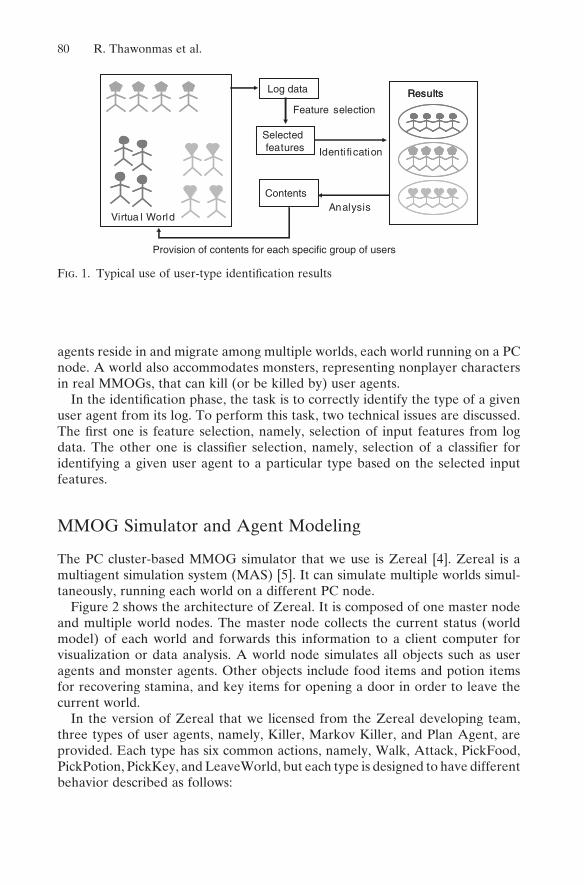
80 R. Thawonmas et al.
agents reside in and migrate among multiple worlds, each world running on a PC node. A world also accommodates monsters, representing nonplayer characters in real MMOGs, that can kill (or be killed by) user agents.
In the identification phase, the task is to correctly identify the type of a given user agent from its log. To perform this task, two technical issues are discussed. The first one is feature selection, namely, selection of input features from log data. The other one is classifier selection, namely, selection of a classifier for identifying a given user agent to a particular type based on the selected input features.
MMOG Simulator and Agent Modeling
The PC cluster-based MMOG simulator that we use is Zereal [4]. Zereal is a multiagent simulation system (MAS) [5]. It can simulate multiple worlds simul-taneously, running each world on a different PC node.
Figure 2 shows the architecture of Zereal. It is composed of one master node and multiple world nodes. The master node collects the current status (world model) of each world and forwards this information to a client computer for visualization or data analysis. A world node simulates all objects such as user agents and monster agents. Other objects include food items and potion items for recovering stamina, and key items for opening a door in order to leave the current world.
In the version of Zereal that we licensed from the Zereal developing team, three types of user agents, namely, Killer, Markov Killer, and Plan Agent, are provided. Each type has six common actions, namely, Walk, Attack, PickFood, PickPotion, PickKey, and LeaveWorld, but each type is designed to have different behavior described as follows:
Analysis
Log data
Selected features
Feature selection
ResultsResults
Contents
Identi fi cation
Provision of contents for each specific group of users
Virtua l World
Fig. 1. Typical use of user-type identification results
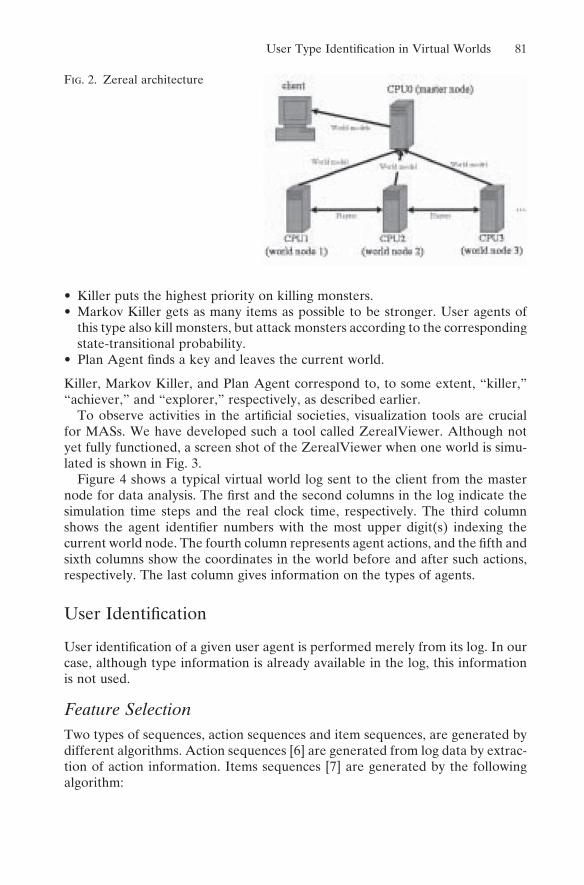
User Type Identification in Virtual Worlds 81
• Killer puts the highest priority on killing monsters.• Markov Killer gets as many items as possible to be stronger. User agents of
this type also kill monsters, but attack monsters according to the corresponding state-transitional probability.
• Plan Agent finds a key and leaves the current world.
Killer, Markov Killer, and Plan Agent correspond to, to some extent, “killer,” “achiever,” and “explorer,” respectively, as described earlier.
To observe activities in the artificial societies, visualization tools are crucial for MASs. We have developed such a tool called ZerealViewer. Although not yet fully functioned, a screen shot of the ZerealViewer when one world is simu-lated is shown in Fig. 3.
Figure 4 shows a typical virtual world log sent to the client from the master node for data analysis. The first and the second columns in the log indicate the simulation time steps and the real clock time, respectively. The third column shows the agent identifier numbers with the most upper digit(s) indexing the current world node. The fourth column represents agent actions, and the fifth and sixth columns show the coordinates in the world before and after such actions, respectively. The last column gives information on the types of agents.
User Identification
User identification of a given user agent is performed merely from its log. In our case, although type information is already available in the log, this information is not used.
Feature SelectionTwo types of sequences, action sequences and item sequences, are generated by different algorithms. Action sequences [6] are generated from log data by extrac-tion of action information. Items sequences [7] are generated by the following algorithm:
Fig. 2. Zereal architecture
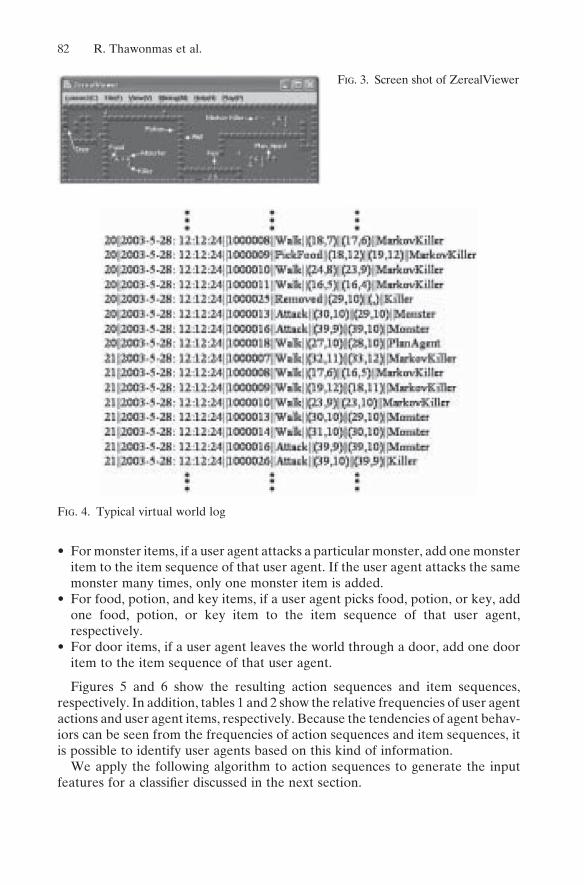
82 R. Thawonmas et al.
• For monster items, if a user agent attacks a particular monster, add one monster item to the item sequence of that user agent. If the user agent attacks the same monster many times, only one monster item is added.
• For food, potion, and key items, if a user agent picks food, potion, or key, add one food, potion, or key item to the item sequence of that user agent, respectively.
• For door items, if a user agent leaves the world through a door, add one door item to the item sequence of that user agent.
Figures 5 and 6 show the resulting action sequences and item sequences, respectively. In addition, tables 1 and 2 show the relative frequencies of user agent actions and user agent items, respectively. Because the tendencies of agent behav-iors can be seen from the frequencies of action sequences and item sequences, it is possible to identify user agents based on this kind of information.
We apply the following algorithm to action sequences to generate the input features for a classifier discussed in the next section.
Fig. 3. Screen shot of ZerealViewer
Fig. 4. Typical virtual world log
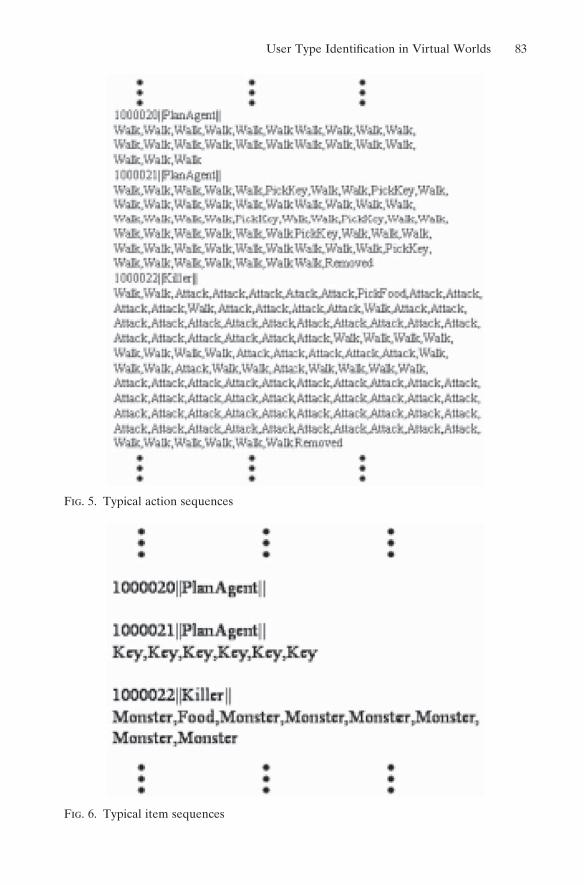
User Type Identification in Virtual Worlds 83
Fig. 5. Typical action sequences
Fig. 6. Typical item sequences
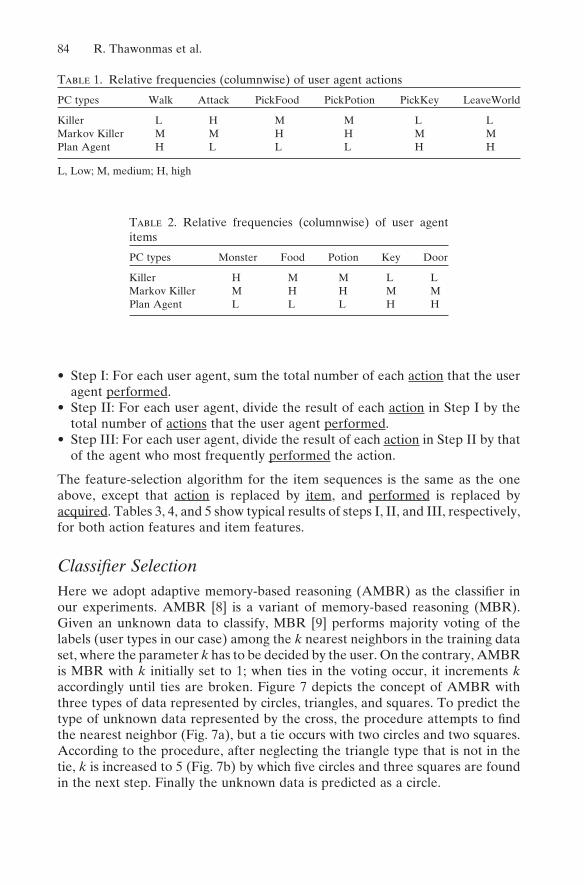
84 R. Thawonmas et al.
• Step I: For each user agent, sum the total number of each action that the user agent performed.
• Step II: For each user agent, divide the result of each action in Step I by the total number of actions that the user agent performed.
• Step III: For each user agent, divide the result of each action in Step II by that of the agent who most frequently performed the action.
The feature-selection algorithm for the item sequences is the same as the one above, except that action is replaced by item, and performed is replaced by acquired. Tables 3, 4, and 5 show typical results of steps I, II, and III, respectively, for both action features and item features.
Classifier SelectionHere we adopt adaptive memory-based reasoning (AMBR) as the classifier in our experiments. AMBR [8] is a variant of memory-based reasoning (MBR). Given an unknown data to classify, MBR [9] performs majority voting of the labels (user types in our case) among the k nearest neighbors in the training data set, where the parameter k has to be decided by the user. On the contrary, AMBR is MBR with k initially set to 1; when ties in the voting occur, it increments kaccordingly until ties are broken. Figure 7 depicts the concept of AMBR with three types of data represented by circles, triangles, and squares. To predict the type of unknown data represented by the cross, the procedure attempts to findthe nearest neighbor (Fig. 7a), but a tie occurs with two circles and two squares. According to the procedure, after neglecting the triangle type that is not in the tie, k is increased to 5 (Fig. 7b) by which five circles and three squares are found in the next step. Finally the unknown data is predicted as a circle.
Table 1. Relative frequencies (columnwise) of user agent actions
PC types Walk Attack PickFood PickPotion PickKey LeaveWorld
Killer L H M M L LMarkov Killer M M H H M MPlan Agent H L L L H H
L, Low; M, medium; H, high
Table 2. Relative frequencies (columnwise) of user agent items
PC types Monster Food Potion Key Door
Killer H M M L LMarkov Killer M H H M MPlan Agent L L L H H
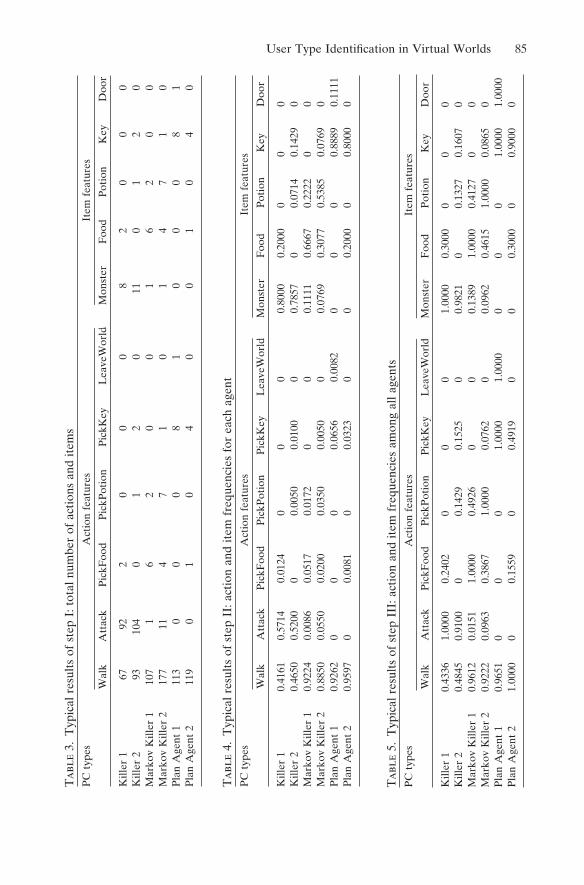
User Type Identification in Virtual Worlds 85
Tab
le4.
Typ
ical
res
ults
of
step
II:
act
ion
and
item
fre
quen
cies
for
eac
h ag
ent
PC
typ
es
Act
ion
feat
ures
It
em f
eatu
res
Wal
k A
ttac
k P
ickF
ood
Pic
kPot
ion
Pic
kKey
L
eave
Wor
ld
Mon
ster
F
ood
Pot
ion
Key
D
oor
Kill
er 1
0.
4161
0.
5714
0.
0124
0
00
0.80
00
0.20
00
0 0
0K
iller
2
0.46
50
0.52
00
0 0.
0050
0.
0100
0
0.78
57
0 0.
0714
0.
1429
0
Mar
kov
Kill
er 1
0.
9224
0.
0086
0.
0517
0.
0172
0
00.
1111
0.
6667
0.
2222
0
0M
arko
v K
iller
2
0.88
50
0.05
50
0.02
00
0.03
50
0.00
50
0 0.
0769
0.
3077
0.
5385
0.
0769
0
Pla
n A
gent
1
0.92
62
0 0
00.
0656
0.
0082
0
0 0
0.88
89
0.11
11P
lan
Age
nt 2
0.
9597
0
0.00
81
00.
0323
0
0 0.
2000
0
0.80
00
0
Tab
le3.
Typ
ical
res
ults
of
step
I: t
otal
num
ber
of a
ctio
ns a
nd it
ems
PC
typ
es
Act
ion
feat
ures
It
em f
eatu
res
Wal
k A
ttac
k P
ickF
ood
Pic
kPot
ion
Pic
kKey
L
eave
Wor
ld
Mon
ster
F
ood
Pot
ion
Key
D
oor
Kill
er 1
6
7 9
2 2
00
0 8
2
0 0
0K
iller
2
93
104
0 1
20
11
0 1
2 0
Mar
kov
Kill
er 1
10
7
1 6
20
0 1
6
2 0
0M
arko
v K
iller
2
177
11
4 7
10
1
4 7
1 0
Pla
n A
gent
1
113
0
0 0
81
0
0 0
8 1
Pla
n A
gent
2
119
0
1 0
40
0
1 0
4 0
Tab
le5.
Typ
ical
res
ults
of
step
III
: act
ion
and
item
fre
quen
cies
am
ong
all a
gent
sP
C t
ypes
A
ctio
n fe
atur
es
Item
fea
ture
s
Wal
k A
ttac
k P
ickF
ood
Pic
kPot
ion
Pic
kKey
L
eave
Wor
ld
Mon
ster
F
ood
Pot
ion
Key
D
oor
Kill
er 1
0.
4336
1.
0000
0.
2402
0
00
1.00
00
0.30
00
0 0
0K
iller
2
0.48
45
0.91
00
0 0.
1429
0.
1525
0
0.98
21
0 0.
1327
0.
1607
0
Mar
kov
Kill
er 1
0.
9612
0.
0151
1.
0000
0.
4926
0
00.
1389
1.
0000
0.
4127
0
0M
arko
v K
iller
2
0.92
22
0.09
63
0.38
67
1.00
00
0.07
62
0 0.
0962
0.
4615
1.
0000
0.
0865
0
Pla
n A
gent
1
0.96
51
0 0
01.
0000
1.
0000
0
0 0
1.00
00
1.00
00P
lan
Age
nt 2
1.
0000
0
0.15
59
00.
4919
0
0 0.
3000
0
0.90
00
0
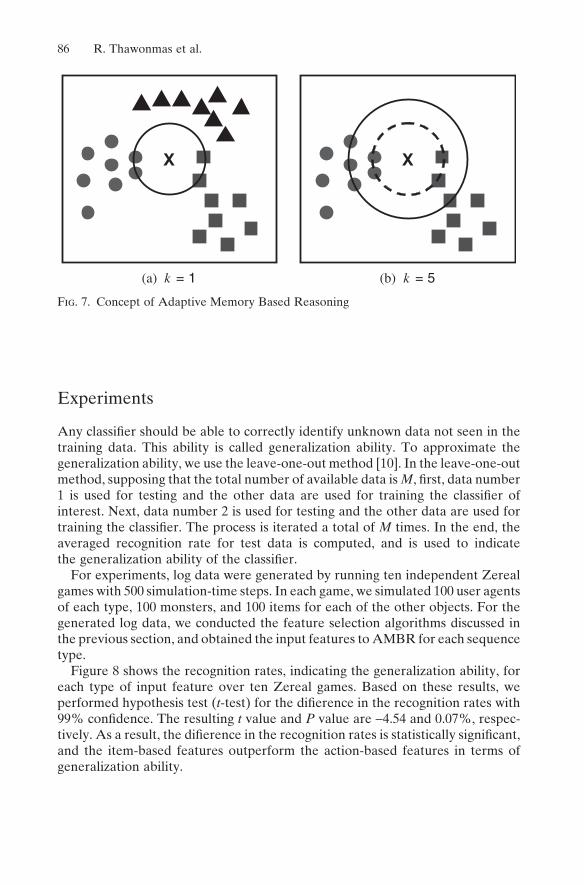
86 R. Thawonmas et al.
Experiments
Any classifier should be able to correctly identify unknown data not seen in the training data. This ability is called generalization ability. To approximate the generalization ability, we use the leave-one-out method [10]. In the leave-one-out method, supposing that the total number of available data is M, first, data number 1 is used for testing and the other data are used for training the classifier of interest. Next, data number 2 is used for testing and the other data are used for training the classifier. The process is iterated a total of M times. In the end, the averaged recognition rate for test data is computed, and is used to indicate the generalization ability of the classifier.
For experiments, log data were generated by running ten independent Zereal games with 500 simulation-time steps. In each game, we simulated 100 user agents of each type, 100 monsters, and 100 items for each of the other objects. For the generated log data, we conducted the feature selection algorithms discussed in the previous section, and obtained the input features to AMBR for each sequence type.
Figure 8 shows the recognition rates, indicating the generalization ability, for each type of input feature over ten Zereal games. Based on these results, we performed hypothesis test (t-test) for the difierence in the recognition rates with 99% confidence. The resulting t value and P value are −4.54 and 0.07%, respec-tively. As a result, the difierence in the recognition rates is statistically significant,and the item-based features outperform the action-based features in terms of generalization ability.
X
(a) k = 1
X
(b) k = 5
Fig. 7. Concept of Adaptive Memory Based Reasoning
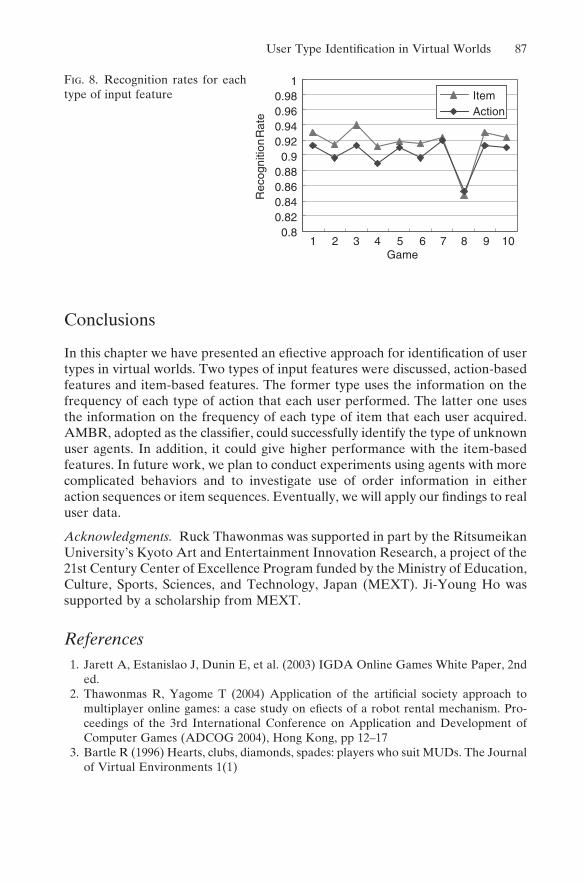
User Type Identification in Virtual Worlds 87
Conclusions
In this chapter we have presented an efiective approach for identification of user types in virtual worlds. Two types of input features were discussed, action-based features and item-based features. The former type uses the information on the frequency of each type of action that each user performed. The latter one uses the information on the frequency of each type of item that each user acquired. AMBR, adopted as the classifier, could successfully identify the type of unknown user agents. In addition, it could give higher performance with the item-based features. In future work, we plan to conduct experiments using agents with more complicated behaviors and to investigate use of order information in either action sequences or item sequences. Eventually, we will apply our findings to real user data.
Acknowledgments. Ruck Thawonmas was supported in part by the Ritsumeikan University’s Kyoto Art and Entertainment Innovation Research, a project of the 21st Century Center of Excellence Program funded by the Ministry of Education, Culture, Sports, Sciences, and Technology, Japan (MEXT). Ji-Young Ho was supported by a scholarship from MEXT.
References1. Jarett A, Estanislao J, Dunin E, et al. (2003) IGDA Online Games White Paper, 2nd
ed.2. Thawonmas R, Yagome T (2004) Application of the artificial society approach to
multiplayer online games: a case study on efiects of a robot rental mechanism. Pro-ceedings of the 3rd International Conference on Application and Development of Computer Games (ADCOG 2004), Hong Kong, pp 12–17
3. Bartle R (1996) Hearts, clubs, diamonds, spades: players who suit MUDs. The Journal of Virtual Environments 1(1)
10.8
0.820.840.860.88
0.90.920.940.960.98
1
Rec
ogni
tion
Rat
e
2 3 4 5 6 7 8 9 10
Action
Game
ItemFig. 8. Recognition rates for each type of input feature
88 R. Thawonmas et al.
4. Tveit A, Rein O, Jorgen VI, et al. (2003) Scalable agent-based simulation of players in massively multiplayer online games. Proceedings of the 8th Scandinavian Conference on Artificial Intelligence (SCAI 2003), Bergen, Norway
5. Epstein J, Axtell R (1996) Growing artificial societies: social science from the bottom up. MIT, Brookings, MA
6. Thawonmas R, Ho JY, Matsumoto Y (2003) Identification of player types in massively multiplayer online games. Proceedings of the 34th Annual Conference of International Simulation and Gaming Association (ISAGA 2003), Chiba, Japan, pp 893–900
7. Ho JY, Matsumoto Y, Thawonmas R (2003) MMOG player identification: a step toward CRM of MMOGs. Proceedings of the 6th Pacific Rim International Workshop on Multi-Agents(PRIMA2003), Seoul, Korea, pp 81–92
8. Ho JY, Thawonmas R (2004) Episode detection with vector space model in agent behavior sequences of MMOGs. Proceedings of Future Business Technology Confer-ence 2004 (FUBUTEC’2004), Fontainebleau, France, pp 47–54
9. Berry M, Linofi G (1997) Data mining techniques—for marketing, sales, and customer support. Wiley, New York
10. Weiss S, Kulikowski C (1991) Computer systems that learn. Morgan Kaufmann, San Mateo, CA
89
A Model for Collusive Tendering Based on a Multiagent ApproachJun Tanimoto1 and Haruyuki Fujii2
1 Interdisciplinary Graduate School of Engineering Sciences, Kyushu University, 6-1 Kasugakoen, Kasuga, Fukuoka 816-8580, Japan. e-mail: [email protected] Graduate School of Science and Engineering, Tokyo Institute of Technology, 2-12-1 Ookayama, Meguro-ku, Tokyo 152-8552, Japan
Introduction
By considering a social background, we have built a model for collusive tendering (CT) to better understand its structure and to prevent it from occurring [1]. In this chapter, we report the details of a multiagent simulation model that we have developed.
For the CT dealt with in this chapter, the following situation is assumed. There are several construction fi rms that are defi ned as agents in the model. The most important premise is that the objective of every fi rm is to maximize its own profi t. A fi rm can profi t only by obtaining a job in a bidding process that takes place in a time series. In the bidding, the fi rm that offers the lowest bid is always successful. As such, in a healthy competitive world, every fi rm tries to bid lower, which leads to reasonable construction costs from a social viewpoint. However, if the fi rms participate in corrosive cooperation, the system can allow CT to emerge. In fact, if all fi rms but one offer groundlessly high costs, and the one bids marginally lower than the others, and if the fi rms agree to alternate the roles played in this process, they can share increasingly larger profi ts among them.
Concerning the bidding process, previous works regarding auctioning are important [2,3]. In terms of cartel and monopoly, abundant amounts of infor-mation have been amassed in the fi eld of economics [4,5]. In general, once evil cooperation has been established in the agent community, all of them are tempted into betraying others by ignoring the CT rule by bidding slightly lower than a scheduled winner. This is the so-called dilemma that Axelrod has noted [6–8].
90 J. Tanimoto and H. Fujii
Model
There are N agents expressing a community of fi rms in the construction industry. Suppose an iterative process exists and consists of bidding, election of a winner, and decision making regarding the next bidding process.
The Bidding ProcessEach agent is characterized by their own profi t balance expressed by /Benefi/. An agent determines bidding cost by selecting one of (/Istr/ − 1) discrete costs ranging from the lowest minimum, i.e., the construction cost “/Cost/” plus the most humble profi t “1”, to the highest, expressed as [/Cost/ + 1, /Cost/ + 1 + R ⋅ /Cost/]. R is one of the model parameters. If an agent decides upon the k-th lowest cost as the next bid, this bidding cost /BP/i(k) is depicted as follows.
/BP/ /Cost//Cost/
/Istr/wheri k k
R( ) = + + −( ) ⋅−
1 11
ee, 1 /k/ /Istr/≤ ≤ (1)
The probability that the agent selects /BP/i(k) is defi ned as pi(k), which is determined through a roulette selection process based on a set of outputs ok (1 ≤ k ≤ /Istr/) from a neural network expressed as:
o
w sk
jk jj
=+ − ⋅⎛
⎝⎜⎞⎠⎟=
∑1
11
exp/N_sense/ (2)
This neural network has only two layers, an input and an output layer, where /N _sense/ is the number of input sensors for each agent (dimension of input units), sj (1 ≤ j ≤ /N_sense/) is the input to sensor j, and wjk is the weighting factor binding between input sensor j and output k. In addition, the number of outputs is consistent with /Istr/.
Improving wjk, we adopt one of two alternatives, a mechanical learning approach by the generalized delta law or the genetic algorithm (GA), which is dependent on the learning mode explained later.
Winner in the Bidding and the Profi tIn the bidding process, the agent that offers the lowest bid is always recognized as the winner, which is the down-for-grabs principle. Only the winner can earn a profi t, which is defi ned as the difference between the bidding price and construc-tion costs. The winner can then improve the profi t balance on the time step L to L + 1, expressed as follows:
/Benef/ /Benef/ /BP/ /Cost/i L i L i+ − = −1 (3)
This means that a winner always puts all the earnings into the profi t balance. There are no digressions such as reinvestment in equipment or the fi nancial market, although these may be plausible in normal enterprise activities.
A Model for Collusive Tendering 91
Horse-Training Mode (HT Mode)This is one of three learning modes, and it seems to be the most fundamental. In horse-training mode, agents are trained to perform CT under sure convictions.
Input Signals
Assume /N_sense/ = 2. As an input signal of the first channel, we give “−1” to one of the agents, randomly elected, and “1” to the rest of the agents. This arrangement implies that the agent given −1 is expected to go ahead to win the next bid, and those given 1 are expected to sacrifice winning the bid. In a sense, this set of signals is likened to a divine revelation whispering, “let’s carry out CT efficiently.”
As an input signal of the second channel, −1 is equivalently given to all the agents. This means the second signal is a bias.
Learning Process
In this case, we can define correct solutions according to the input signals. When an agent is told, “go ahead” by getting −1, the second highest bidding /BP/i(/Istr/− 1) is expected as a correct solution. In contrast, the highest bidding /BP/i(/Istr/)is regarded as the correct solution when the agent is asked to lose the bid. A set of correct solutions consists of a so-called teaching vector. We can draw an error vector that is defined as the difference between a teaching vector and an actual output. Then, wjk would be improved by back-propagating the error vector. The above is a procedure based on the generalized delta law.
Divine Revelation Mode (DR Mode)In this mode, a question is asked as to whether CT can emerge with input infor-mation obviously implying CT.
Input Signals
Assume /N_sense/ = 1. As an input signal, we assign −1 to one of the agents, randomly elected, and 1 to the rest of the agents.
Learning Process by GA
GA is used for the learning process in this mode. The reason why we cannot apply the back-propagation or the generalized delta law is that it is impossible to definea teaching vector in this case.
A gene is expressed as a real number vector that has /Istr/ × /N_sense/ ele-ments. Each element expresses wjk. In a gene pool, there are np genes initially defined as random numbers [−5,5]. The GA process applied is as follows:
92 J. Tanimoto and H. Fujii
Step 1: Every agent randomly picks up one of the genes in the pool. Based on the wjk coming from the selected gene, the agent makes a time series of bids, bidding “/Nest/” times. The genes used by the group of N agents is N. These used genes are removed from the pool. Needless to say, the agents share the gene pool.
Step 2: The procedure defi ned in Step 1 is conducted np/N times, and the bidding takes place np/N × /Nest/ times. At this moment, all the genes in the pool have been consumed, which means that one generation is complete. We then measure the fi tness later defi ned for this generation.
Step 3: We select two genes through a roulette selection process based on fi tness. Two genetic operations, crossover and mutation, are performed over these two parents genes in order to obtain two new children genes that are used in the next generation. The probabilities of crossover and mutation are 0.25 and 0.01, respectively. This procedure is repeated until the number of newly produced genes reaches np.
Fitness Function
Concerning the fi tness function /ft/, we preassume two different ideas, both of which are based on the concept that the fi tness is defi ned by the difference in profi ts between the present and the /Nest/ times previous step. To maximize individual profi t (ego-oriented idea):
/ft/ /Benef/ /Benef/ego /now/ /Nest_ego/j j j, ≡ − (4)
Each agent only sees their own profi t balance, which is regarded as an ego-oriented strategy.
To enlarge the profi t of the whole society and diminish the distance between rich and poor (cooperation-oriented idea):
/ft/ /Bnft/ /Bnft/co /now/ /Nest_ego/j i ii
, ≡ −[ ]== ∈∑ − −[{
1
N
i Ni
i
Max /Bnft/
/Bnft/
agents/now/
/Neest_ego/agents
/now/Min /Bnft/ /Bnft/− −∈i N
i i //Nest_ego/[ ]} (5)
The fi rst term of Eq. 5 attempts to enlarge the social holistic profi t. However, this enlargement occurs even when one is extremely rich and the rest of the society is poor, which may be a consequence of agents having ego-oriented ideas competing continuously. The second term is therefore added to diminish the dis-tance between rich and poor as a drag force against the fi rst term.
It seems plausible that the ego-oriented idea is related to the free-economy concept, whereas the cooperation-oriented idea is more closely related to com-munism. The former differs from agent to agent, while the latter is uniformly equal throughout the society.
Incidentally, it is a simple principle that if an obvious and nonfl exible fi tness function is assumed in a model, what we can observe through a simulation is not an emergent thing but a matter of course. We therefore eventually adopt a
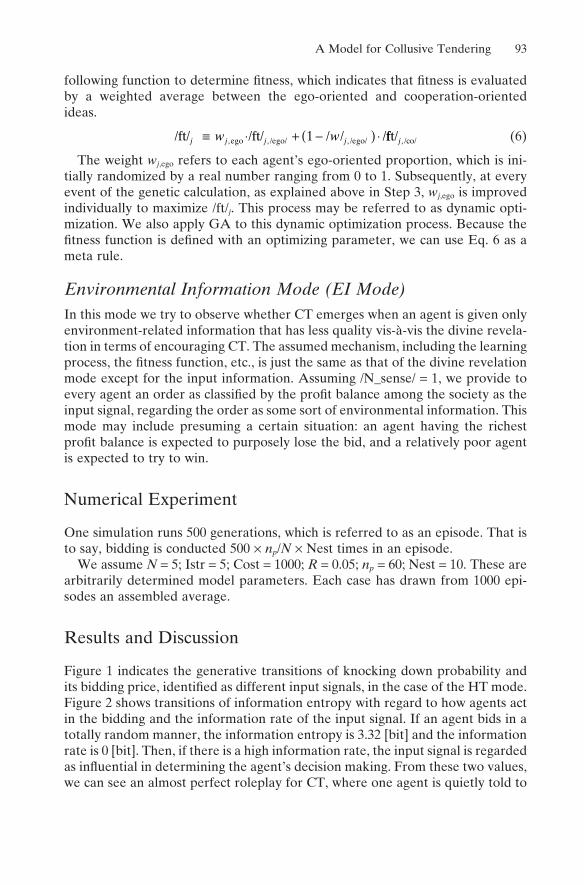
A Model for Collusive Tendering 93
following function to determine fi tness, which indicates that fi tness is evaluated by a weighted average between the ego-oriented and cooperation-oriented ideas.
/ft/ /ft/ / / /ego /ego/ /ego/j j j jw w, , ,≡ ⋅ + −( ) ⋅1 fft/ /co/j , (6)
The weight wj,ego refers to each agent’s ego-oriented proportion, which is ini-tially randomized by a real number ranging from 0 to 1. Subsequently, at every event of the genetic calculation, as explained above in Step 3, wj,ego is improved individually to maximize /ft/j. This process may be referred to as dynamic opti-mization. We also apply GA to this dynamic optimization process. Because the fi tness function is defi ned with an optimizing parameter, we can use Eq. 6 as a meta rule.
Environmental Information Mode (EI Mode)In this mode we try to observe whether CT emerges when an agent is given only environment-related information that has less quality vis-à-vis the divine revela-tion in terms of encouraging CT. The assumed mechanism, including the learning process, the fi tness function, etc., is just the same as that of the divine revelation mode except for the input information. Assuming /N_sense/ = 1, we provide to every agent an order as classifi ed by the profi t balance among the society as the input signal, regarding the order as some sort of environmental information. This mode may include presuming a certain situation: an agent having the richest profi t balance is expected to purposely lose the bid, and a relatively poor agent is expected to try to win.
Numerical Experiment
One simulation runs 500 generations, which is referred to as an episode. That is to say, bidding is conducted 500 × np/N × Nest times in an episode.
We assume N = 5; Istr = 5; Cost = 1000; R = 0.05; np = 60; Nest = 10. These are arbitrarily determined model parameters. Each case has drawn from 1000 epi-sodes an assembled average.
Results and Discussion
Figure 1 indicates the generative transitions of knocking down probability and its bidding price, identifi ed as different input signals, in the case of the HT mode. Figure 2 shows transitions of information entropy with regard to how agents act in the bidding and the information rate of the input signal. If an agent bids in a totally random manner, the information entropy is 3.32 [bit] and the information rate is 0 [bit]. Then, if there is a high information rate, the input signal is regarded as infl uential in determining the agent’s decision making. From these two values, we can see an almost perfect roleplay for CT, where one agent is quietly told to
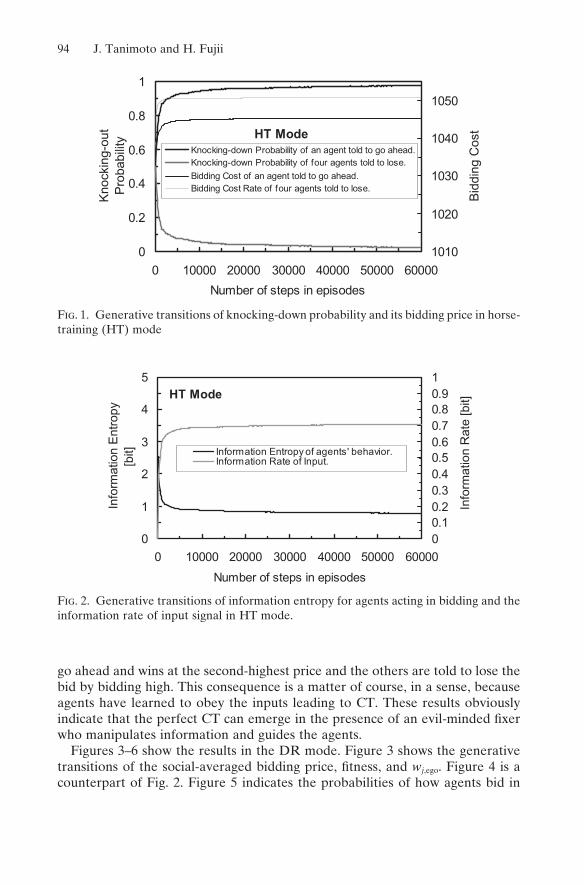
94 J. Tanimoto and H. Fujii
go ahead and wins at the second-highest price and the others are told to lose the bid by bidding high. This consequence is a matter of course, in a sense, because agents have learned to obey the inputs leading to CT. These results obviously indicate that the perfect CT can emerge in the presence of an evil-minded fi xer who manipulates information and guides the agents.
Figures 3–6 show the results in the DR mode. Figure 3 shows the generative transitions of the social-averaged bidding price, fi tness, and wj,ego. Figure 4 is a counterpart of Fig. 2. Figure 5 indicates the probabilities of how agents bid in
HT Mode
0
0.2
0.4
0.6
0.8
1
0 10000 20000 30000 40000 50000 60000
Number of steps in episodes
Kno
ckin
g-ou
tP
roba
bilit
y
1010
1020
1030
1040
1050
Bid
ding
Cos
t
Knocking-down Probability of an agent told to go ahead.Knocking-down Probability of four agents told to lose.
Bidding Cost of an agent told to go ahead.Bidding Cost Rate of four agents told to lose.
Fig. 1. Generative transitions of knocking-down probability and its bidding price in horse-training (HT) mode
HT Mode
0
1
2
3
4
5
0 10000 20000 30000 40000 50000 60000
Number of steps in episodes
Info
rmat
ion
Ent
ropy
[bit]
00.10.20.30.40.50.60.70.80.91
Info
rmat
ion
Rat
e [b
it]Information Entropy of agents' behavior.Information Rate of Input.
Fig. 2. Generative transitions of information entropy for agents acting in bidding and the information rate of input signal in HT mode.
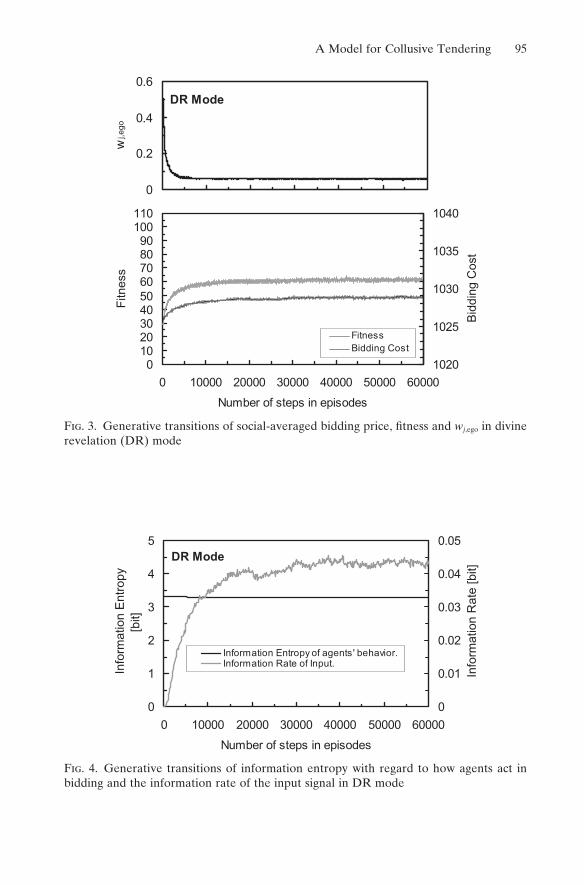
A Model for Collusive Tendering 95
DR Mode
0
0.2
0.4
0.6
wj,e
go
0102030405060708090
100110
0 10000 20000 30000 40000 50000 60000
Number of steps in episodes
Fitn
ess
1020
1025
1030
1035
1040
Bid
ding
Cos
t
FitnessBidding Cost
DR Mode
0
1
2
3
4
5
0 10000 20000 30000 40000 50000 60000
Number of steps in episodes
Info
rmat
ion
Ent
ropy
[bit]
0
0.01
0.02
0.03
0.04
0.05
Info
rmat
ion
Rat
e [b
it]
Information Entropy of agents' behavior.Information Rate of Input.
Fig. 3. Generative transitions of social-averaged bidding price, fi tness and wj,ego in divine revelation (DR) mode
Fig. 4. Generative transitions of information entropy with regard to how agents act in bidding and the information rate of the input signal in DR mode
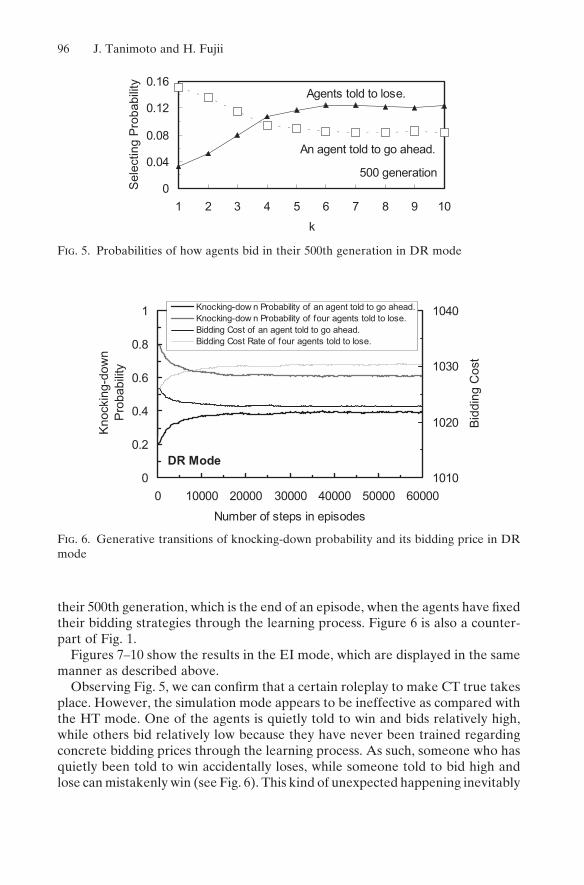
96 J. Tanimoto and H. Fujii
their 500th generation, which is the end of an episode, when the agents have fi xed their bidding strategies through the learning process. Figure 6 is also a counter-part of Fig. 1.
Figures 7–10 show the results in the EI mode, which are displayed in the same manner as described above.
Observing Fig. 5, we can confi rm that a certain roleplay to make CT true takes place. However, the simulation mode appears to be ineffective as compared with the HT mode. One of the agents is quietly told to win and bids relatively high, while others bid relatively low because they have never been trained regarding concrete bidding prices through the learning process. As such, someone who has quietly been told to win accidentally loses, while someone told to bid high and lose can mistakenly win (see Fig. 6). This kind of unexpected happening inevitably
0
0.04
0.08
0.12
0.16
1 2 3 4 5 6 7 8 9 10
k
Sel
ectin
g P
roba
bilit
y
500 generation
An agent told to go ahead.
Agents told to lose.
Fig. 5. Probabilities of how agents bid in their 500th generation in DR mode
DR Mode0
0.2
0.4
0.6
0.8
1
0 10000 20000 30000 40000 50000 60000
Number of steps in episodes
Kno
ckin
g-do
wn
Pro
babi
lity
1010
1020
1030
1040
Bid
ding
Cos
t
Knocking-dow n Probability of an agent told to go ahead.Knocking-dow n Probability of four agents told to lose.Bidding Cost of an agent told to go ahead.Bidding Cost Rate of four agents told to lose.
Fig. 6. Generative transitions of knocking-down probability and its bidding price in DR mode
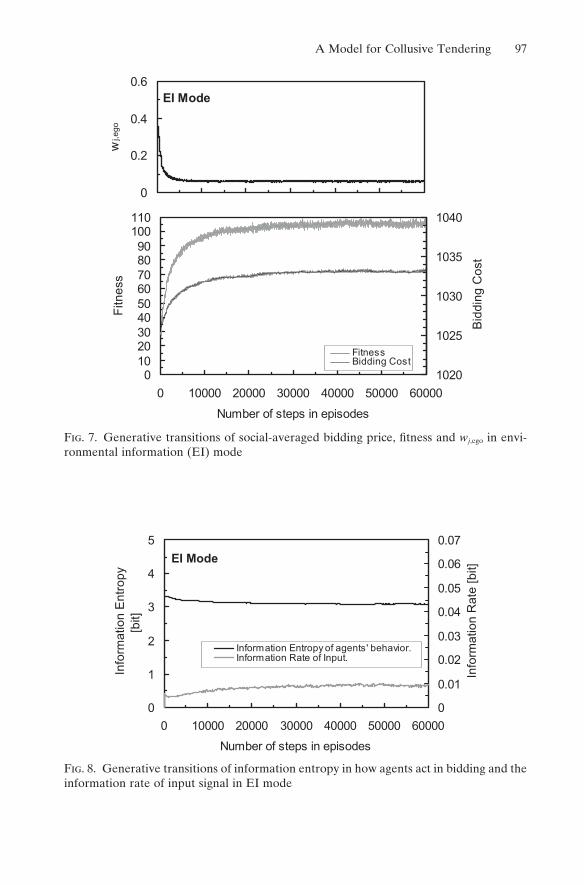
A Model for Collusive Tendering 97
EI Mode
0
0.2
0.4
0.6
wj,e
go
0102030405060708090
100110
0 10000 20000 30000 40000 50000 60000
Number of steps in episodes
Fitn
ess
1020
1025
1030
1035
1040
Bid
ding
Cos
t
FitnessBidding Cost
EI Mode
0
1
2
3
4
5
0 10000 20000 30000 40000 50000 60000
Number of steps in episodes
Info
rmat
ion
Ent
ropy
[bit]
0
0.01
0.02
0.03
0.04
0.05
0.06
0.07
Info
rmat
ion
Rat
e [b
it]
Information Entropy of agents' behavior.Information Rate of Input.
Fig. 7. Generative transitions of social-averaged bidding price, fi tness and wj,ego in envi-ronmental information (EI) mode
Fig. 8. Generative transitions of information entropy in how agents act in bidding and the information rate of input signal in EI mode
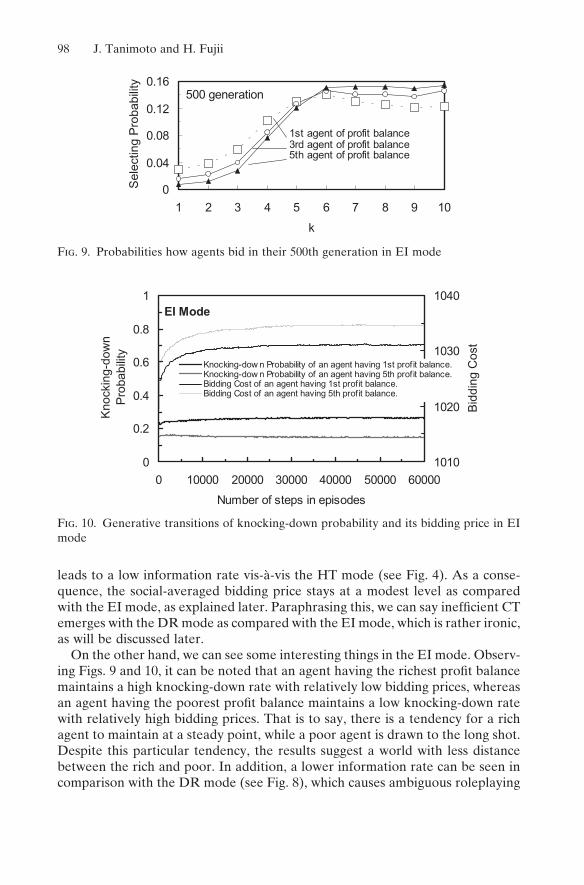
98 J. Tanimoto and H. Fujii
0
0.04
0.08
0.12
0.16
1 2 3 4 5 6 7 8 9 10
k
Sel
ectin
g P
roba
bilit
y
500 generation
1st agent of profit balance3rd agent of profit balance5th agent of profit balance
EI Mode
0
0.2
0.4
0.6
0.8
1
0 10000 20000 30000 40000 50000 60000
Number of steps in episodes
Kno
ckin
g-do
wn
Pro
babi
lity
1010
1020
1030
1040
Bid
ding
Cos
t
Knocking-dow n Probability of an agent having 1st profit balance.Knocking-dow n Probability of an agent having 5th profit balance.Bidding Cost of an agent having 1st profit balance.Bidding Cost of an agent having 5th profit balance.
Fig. 9. Probabilities how agents bid in their 500th generation in EI mode
Fig. 10. Generative transitions of knocking-down probability and its bidding price in EI mode
leads to a low information rate vis-à-vis the HT mode (see Fig. 4). As a conse-quence, the social-averaged bidding price stays at a modest level as compared with the EI mode, as explained later. Paraphrasing this, we can say ineffi cient CT emerges with the DR mode as compared with the EI mode, which is rather ironic, as will be discussed later.
On the other hand, we can see some interesting things in the EI mode. Observ-ing Figs. 9 and 10, it can be noted that an agent having the richest profi t balance maintains a high knocking-down rate with relatively low bidding prices, whereas an agent having the poorest profi t balance maintains a low knocking-down rate with relatively high bidding prices. That is to say, there is a tendency for a rich agent to maintain at a steady point, while a poor agent is drawn to the long shot. Despite this particular tendency, the results suggest a world with less distance between the rich and poor. In addition, a lower information rate can be seen in comparison with the DR mode (see Fig. 8), which causes ambiguous roleplaying
A Model for Collusive Tendering 99
among the society (see Fig. 9). Even such being the case, agents generally bid higher than in the DR mode, which implies that they realize effi cient CT vis-à-vis the DR mode, which is quite ironic.
One hypothesis can be offered regarding this phenomenon. If a cooperation-oriented idea is shared within a society as a principle (Figs. 3 and 7 indicate that an ego-oriented idea is expelled in the early stage of an episode), agents consider it primarily important to magnify not an individual’s profi t but that of society as a whole. This is encouraged due to the driving force being regulated by the fi tness function. In this context, it is the nearest way that every agent bids higher, anyway, and waits until the die giving to distribute his share based on the fi eld’s random-ness. In a nutshell, randomness rules this world. An agent makes excessive profi ts based on random occasions coming up. It is therefore secondary whether the roleplay emerges or not.
At this moment we may be reminded of Hauser’s “intentional cheating” and “functional cheating” [9]. In a sense, the CT backed by fi rm roleplay, in the case of the DR mode, can be regarded as “intentional” CT, whereas the incidental CT in the case of the EI mode, because a cooperation-oriented idea is commonly shared, should be referred to as “functional” CT.
Implications
It is possible to draw some conclusion that may be useful in creating a healthier social system from these simulation results. If a roleplay distinguishing a real bidder and its supporters works well, CT can be performed perfectly. To achieve this scenario, the system requires a fi xer who manipulates information to be provided to all involved.
If the community members share an idea that competition should be avoided, simultaneously aiming for holistic profi ts and a unanimous society, there is some possibility of a functional CT developing, regardless of whether any of the members has evil intention. To prevent development of this type of CT, a new paradigm promoting “proper competition” instead of a “chum principle” is encouraged, although this shift may be ineffectual unless everyone accepts the new paradigm. It may actually be more effective to introduce a competitive fi rm into the circle who will not yield to the principles of the CT.
Conclusions
We established a multiagent simulation model related to CT that can reproduce an emergent process within a bidding community consisting of several fi rms. A series of numerical experiments shows that CT does develop, but indicates that there may be different content depending upon the input information provided. In particular, we should recognize the difference between functional CT and intensive CT.
100 J. Tanimoto and H. Fujii
This study was carried out due to the authors’ anxiety regarding the health of the Japanese construction industry and the creation of a better society for the future. Several effective strategies are presented for breaking CT in the real world.
Acknowledgments. This research was partially funded by Grants-in-Aid for Scientifi c Research JSPS, classifi ed as Exploratory Research, which was awarded to Dr. Tanimoto (#14658122), and the Priority Areas Research A, which was awarded to Prof. Kawamura at Kobe University (#14205087). The authors express their special thanks for this funding.
References1. Tanimoto J, Fujii H (2003) A mathematical model for the collusive tendering—studies
on the human-environment-society system based on the complexity theory (in Japanese). J Archit Plann Environ Eng 565:379–386
2. Mcmillan J (1992) Games, strategies and managers. Oxford University Press3. Layton-Brown K, Shoham Y, Tennenholtz M (2000) Bidding clubs: institutionalized
collusion in auction. Proceedings of ACM Conference on Electronic Commerce (EC’00) 253–259
4. Hosoe M, Sato H, Imaizumi H, et al. (1997) Economics of public policy (in Japanese). Yuhikaku
5. Onozaki T, Yanagita T (2002) Monopoly, oligopoly and the invisible hand. Discussion Paper Series No. 32. Institute of Economic Research, Chuo University
6. Axelrod R (2000) The evolution of cooperation (in Japanese). Minerva7. Matsubara N (2000) Quantitative method of social sciences (in Japanese). University of
Tokyo Press, Tokyo8. Shimazaki T (1996) Analysis of “Dangou” by game theory (in Japanese). Proceedings
of Construction Management Research 4:21–289. Hauser MD (1996) The evolution of communication. MIT
101
An Agent-Based Simulation Model of Disruptive TechnologiesChristian Buchta1, David Meyer2, Andreas Mild3, Alexander Pfi ster4, and Alfred Taudes3
1 Institute of Tourism and Leisure Studies, Vienna University of Economics and Business Administration, Augasse 2–6, A-1090 Vienna, Austria2 Department of Information Systems, Vienna University of Economics and Business Administration, Augasse 2–6, A-1090 Vienna, Austria3 Department of Production Management, Vienna University of Economics and Business Administration, Nordbergstrasse 15, A-1090 Vienna, Austria, e-mail: [email protected] Department of Economics, Vienna University of Economics and Business Administra-tion, Augasse 2–6, A-1090 Vienna, Austria
Introduction
Based on extensive long-term studies of the disk drive and other industries, Christensen introduced the concept of “disruptive technology” [1]. According to Christensen, when such a technology is initially employed in a novel market segment, and is judged according to the features most relevant to the incumbents’ current customers, it is inferior to the technology used by the incumbents in the established market segment. Nevertheless, over time the fi rms using the disrup-tive technology are able to successfully invade the established market segment from the lower end of the market and industry leadership changes. Christensen’s fi nding provides empirical support to the resource-based and organizational learning perspective of the theory of the fi rm, whereas other approaches in general predict advantages for incumbents due to learning from experience, economies of scale and scope, network economies of scale, etc. [2–4].
Table 1 provides an example of a disruptive technology: 5.25-inch disk drives were used in desktop computers in the early 1980s and, initially, were inferior to the 8-inch drives used in minicomputers in terms of capacity, access time, and cost, which are the features most relevant to a minicomputer user. However, by 1986 industry leadership changed from CDC, the leading 8-inch vendor, to the new entrant Seagate, and most of the fi rms that were producing 8-inch drives vanished [5]. Christensen also demonstrated that it is the incumbents who lead in “sustaining technologies,” i.e., innovations that follow the current trajectory of technological improvement, and try to fi nd new technical solutions to tackle the
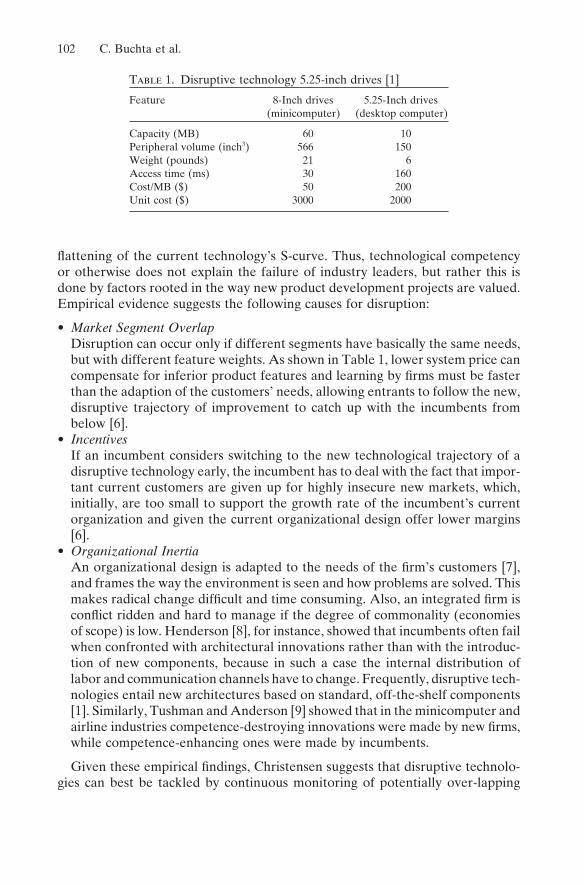
102 C. Buchta et al.
fl attening of the current technology’s S-curve. Thus, technological competency or otherwise does not explain the failure of industry leaders, but rather this is done by factors rooted in the way new product development projects are valued. Empirical evidence suggests the following causes for disruption:
• Market Segment OverlapDisruption can occur only if different segments have basically the same needs, but with different feature weights. As shown in Table 1, lower system price can compensate for inferior product features and learning by fi rms must be faster than the adaption of the customers’ needs, allowing entrants to follow the new, disruptive trajectory of improvement to catch up with the incumbents from below [6].
• IncentivesIf an incumbent considers switching to the new technological trajectory of a disruptive technology early, the incumbent has to deal with the fact that impor-tant current customers are given up for highly insecure new markets, which, initially, are too small to support the growth rate of the incumbent’s current organization and given the current organizational design offer lower margins [6].
• Organizational InertiaAn organizational design is adapted to the needs of the fi rm’s customers [7], and frames the way the environment is seen and how problems are solved. This makes radical change diffi cult and time consuming. Also, an integrated fi rm is confl ict ridden and hard to manage if the degree of commonality (economies of scope) is low. Henderson [8], for instance, showed that incumbents often fail when confronted with architectural innovations rather than with the introduc-tion of new components, because in such a case the internal distribution of labor and communication channels have to change. Frequently, disruptive tech-nologies entail new architectures based on standard, off-the-shelf components [1]. Similarly, Tushman and Anderson [9] showed that in the minicomputer and airline industries competence-destroying innovations were made by new fi rms, while competence-enhancing ones were made by incumbents.
Given these empirical fi ndings, Christensen suggests that disruptive technolo-gies can best be tackled by continuous monitoring of potentially over-lapping
Table 1. Disruptive technology 5.25-inch drives [1]
Feature 8-Inch drives 5.25-Inch drives (minicomputer) (desktop computer)
Capacity (MB) 60 10Peripheral volume (inch3) 566 150Weight (pounds) 21 6Access time (ms) 30 160Cost/MB ($) 50 200Unit cost ($) 3000 2000
Agent-Based Simulation Model of Disruptive Technologies 103
market segments, long-term projections of technological trajectories, and, to provide the appropriate learning environment, the setup of a completely sepa-rated, independent new organization in the market segment from where disrup-tion is expected.
Several authors have developed formal models to study disruption: Adner [10] formulated a market-driven model to analyze market conditions under which disruption occurs. Adner introduced the concepts of preference symmetry and preference overlap to characterize the relationship between preferences of dif-ferent market segments. Using an agent-based computer simulation with myopic fi rms, he identifi ed different competitive regimes: convergence, isolation, and disruption. Focusing on the market conditions under which these regimes arise, Adner used a simplifi ed technological model: fi rms can move freely to reach any position within a certain distance, i.e., there are no specifi ed technological trajec-tories in his model (for a similar “history-friendly” model of the computer indus-try, see Malerba et al. [11]).
Nault and Vandenbosch [12] identifi ed conditions under which an entrant is able to outperform an incumbent in a rational, game-theoretic setting. They viewed disruptive technologies as technologies leading to a next-generation product with a greater market response and, therefore, higher cash fl ows. They defi ned capability advantages as lower launching costs for the next-generation product. Under the condition that the entrant has a capability advantage in a disruptive technology, the entrant is able to outperform the incumbent even though both technologies are available to both fi rms at the same time and both players are perfectly rational.
This chapter endeavors to add another important aspect to the explanation of the emergence of competition: using rational, myopically optimizing fi rms, we study the infl uence of organizational inertia and technological effi ciency on the emergence of competition between an incumbent and an entrant using a new technology. This new technology is characterized by its effi ciency and is also available to the incumbent. While technological effi ciency determines the speed of improvement offered by a technology per se, organizational inertia determines the speed at which an organization can be adapted so as to actually reach a desired product position. We thus endogenize the cost differences exogenous to the Nault and Vandenbosch model and characterize each technology via a simpli-fi ed S-curve model. Using an agent-based simulation, we study the effect of technological effi ciency under various market conditions and organizational structures and identify four competitive scenarios: entrant failure, diverse and duopolistic competition, and disruption. These competitive scenarios show robust-ness for all parameter combinations other than technological effi ciency and orga-nizational inertia.
The remainder of this chapter is organized as follows: in the next section, we present our model of technologies, describe the market structure and consumer behavior, and defi ne the fi rms’ decision-making process (agent design). On this basis, the third section presents the structure of the agent-based simulation and the experimental design. In the results section, we look at the outcome of our
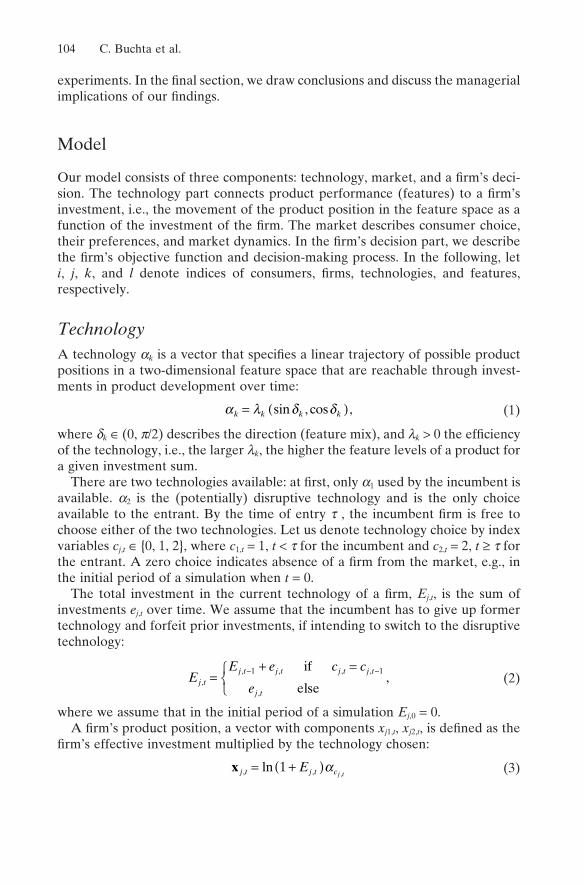
104 C. Buchta et al.
experiments. In the fi nal section, we draw conclusions and discuss the managerial implications of our fi ndings.
Model
Our model consists of three components: technology, market, and a fi rm’s deci-sion. The technology part connects product performance (features) to a fi rm’s investment, i.e., the movement of the product position in the feature space as a function of the investment of the fi rm. The market describes consumer choice, their preferences, and market dynamics. In the fi rm’s decision part, we describe the fi rm’s objective function and decision-making process. In the following, let i, j, k, and l denote indices of consumers, fi rms, technologies, and features, respectively.
TechnologyA technology ak is a vector that specifi es a linear trajectory of possible product positions in a two-dimensional feature space that are reachable through invest-ments in product development over time:
α λ δ δk k k k= ( )sin cos, , (1)
where dk ∈ (0, p/2) describes the direction (feature mix), and lk > 0 the effi ciency of the technology, i.e., the larger lk, the higher the feature levels of a product for a given investment sum.
There are two technologies available: at fi rst, only a1 used by the incumbent is available. a2 is the (potentially) disruptive technology and is the only choice available to the entrant. By the time of entry t , the incumbent fi rm is free to choose either of the two technologies. Let us denote technology choice by index variables cj,t ∈ {0, 1, 2}, where c1,t = 1, t < t for the incumbent and c2,t = 2, t ≥ t for the entrant. A zero choice indicates absence of a fi rm from the market, e.g., in the initial period of a simulation when t = 0.
The total investment in the current technology of a fi rm, Ej,t, is the sum of investments ej,t over time. We assume that the incumbent has to give up former technology and forfeit prior investments, if intending to switch to the disruptive technology:
E
E e c c
ej t
j t j t j t j t
j t,
, , , ,
,
if
else,=
+ =⎧⎨⎩
− −1 1
(2)
where we assume that in the initial period of a simulation Ej,0 = 0.A fi rm’s product position, a vector with components xj1,t, xj2,t, is defi ned as the
fi rm’s effective investment multiplied by the technology chosen:
x j t j t cEj t, , ,
= +( )ln 1 α (3)
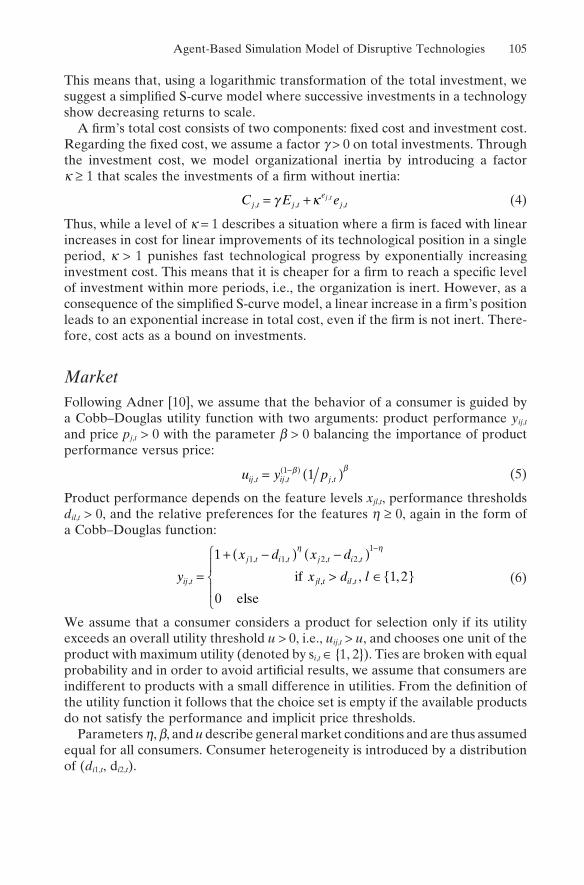
Agent-Based Simulation Model of Disruptive Technologies 105
This means that, using a logarithmic transformation of the total investment, we suggest a simplifi ed S-curve model where successive investments in a technology show decreasing returns to scale.
A fi rm’s total cost consists of two components: fi xed cost and investment cost. Regarding the fi xed cost, we assume a factor g > 0 on total investments. Through the investment cost, we model organizational inertia by introducing a factor k ≥ 1 that scales the investments of a fi rm without inertia:
C E ej t j te
j tj t
, , ,,= +γ κ (4)
Thus, while a level of k = 1 describes a situation where a fi rm is faced with linear increases in cost for linear improvements of its technological position in a single period, k > 1 punishes fast technological progress by exponentially increasing investment cost. This means that it is cheaper for a fi rm to reach a specifi c level of investment within more periods, i.e., the organization is inert. However, as a consequence of the simplifi ed S-curve model, a linear increase in a fi rm’s position leads to an exponential increase in total cost, even if the fi rm is not inert. There-fore, cost acts as a bound on investments.
MarketFollowing Adner [10], we assume that the behavior of a consumer is guided by a Cobb–Douglas utility function with two arguments: product performance yij,t and price pj,t > 0 with the parameter b > 0 balancing the importance of product performance versus price:
u y pij t ij t j t, , ,= ( )−( )1 1β β (5)
Product performance depends on the feature levels xjl,t, performance thresholds dil,t > 0, and the relative preferences for the features h ≥ 0, again in the form of a Cobb–Douglas function:
y
x d x d
xij t
j t i t j t i t
jl,
, , , ,
if=
+ −( ) −( ) −1 1 1 2 2
1η η
,, , ,
elset il td l> ∈{ }
⎧
⎨⎪
⎩⎪
1 2
0
,
(6)
We assume that a consumer considers a product for selection only if its utility exceeds an overall utility threshold u > 0, i.e., uij,t > u, and chooses one unit of the product with maximum utility (denoted by si,t ∈ {1, 2}). Ties are broken with equal probability and in order to avoid artifi cial results, we assume that consumers are indifferent to products with a small difference in utilities. From the defi nition of the utility function it follows that the choice set is empty if the available products do not satisfy the performance and implicit price thresholds.
Parameters h, b, and u describe general market conditions and are thus assumed equal for all consumers. Consumer heterogeneity is introduced by a distribution of (di1,t, di2,t).

106 C. Buchta et al.
We study both time-constant and adaptive consumer thresholds. Using time-invariant preferences, consumers are not infl uenced in their preferences by tech-nological progress, i.e., di,t = di,0. In the case of adaptive consumer behavior, which we indicate by the switch variable z ∈ {0, 1}, the minimal performance thresholds are adapted according to the direction and rate of improvement of the product purchased:
d d
x
xx
il t il t
c l t
c l tc l
i t
i t
i t, ,
,
,,
,
,
,if ,
+ −= ⋅1 1
ζ tt− >⎧⎨⎪
⎩⎪
1 0
1 else
(7)
This means that if the features of a product increase by 10%, the buyers of this product also increase their minimal performance requirements by the same per-centage. In case the product was just launched, consumers do not change their requirements as there was no improvement. Note that this type of adaptation process preserves the initial orthogonal distance of a preference position to the trajectory of a technology, which prevents the threshold distributions from becoming too singular over time.
Firm’s DecisionBesides technology choice, in each period of time a fi rm has to decide on a proper level of investment and price. We assume the fi rms to be well-informed, i.e., they know the consumers’ utility functions and their competitors’ past actions, to be rational, i.e., they make optimal best response decisions; and to be myopic, i.e., to have a one-period forecast horizon.
The equations from the preceding paragraphs can be reformulated so as to express a consumer’s reservation price for a product as a function of a fi rm’s investment and price, given the consumer’s current preference and the utility of the competitor’s product. By reservation price we mean the maximum price a consumer is willing to pay for a product, which is all we need to know in order to defi ne a demand function. Note that this price can be zero for some consumers and that we assume that the degree of price differentiation utilized by a fi rm is smaller than the consumer’s threshold of indifference. This results in random choices among similar products and reasonable market outcomes. For ease of presentation, let D̂cj,t,t
denote the demand forecast of fi rm j using technology cj,t in period t, based on the information about the market up to period t − 1. Then we can summarize the profi t maximization problem of a fi rm as follows:
ˆ ˆ max,
π j t j t c t j tc e p
p D Cj t
j t j t j t, , , ,
,,, , ,
su
= − →
bbject to if ,if ,if
,
,
,
c tc tc t
t
t
t
1
2
2
102
= <= <= ≥
ττττ ,
, ,e Fj t j t≤ (8)
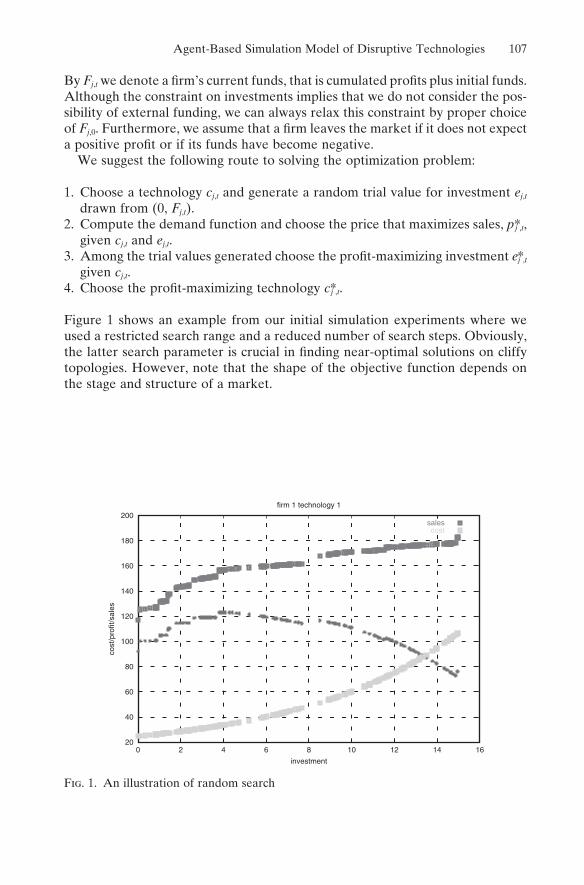
Agent-Based Simulation Model of Disruptive Technologies 107
By Fj,t we denote a fi rm’s current funds, that is cumulated profi ts plus initial funds. Although the constraint on investments implies that we do not consider the pos-sibility of external funding, we can always relax this constraint by proper choice of Fj,0. Furthermore, we assume that a fi rm leaves the market if it does not expect a positive profi t or if its funds have become negative.
We suggest the following route to solving the optimization problem:
1. Choose a technology cj,t and generate a random trial value for investment ej,t drawn from (0, Fj,t).
2. Compute the demand function and choose the price that maximizes sales, pj*,t, given cj,t and ej,t.
3. Among the trial values generated choose the profi t-maximizing investment ej*,t given cj,t.
4. Choose the profi t-maximizing technology cj*,t.
Figure 1 shows an example from our initial simulation experiments where we used a restricted search range and a reduced number of search steps. Obviously, the latter search parameter is crucial in fi nding near-optimal solutions on cliffy topologies. However, note that the shape of the objective function depends on the stage and structure of a market.
20
40
60
80
100
120
140
160
180
200
0 2 4 6 8 10 12 14 16
cost
/pro
fit/s
ales
investment
firm 1 technology 1
salescost
Fig. 1. An illustration of random search
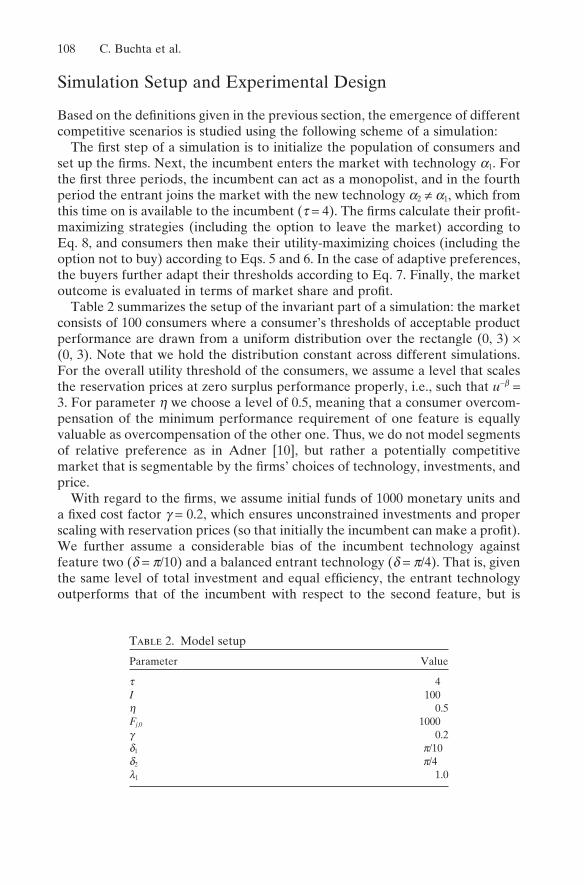
108 C. Buchta et al.
Simulation Setup and Experimental Design
Based on the defi nitions given in the previous section, the emergence of different competitive scenarios is studied using the following scheme of a simulation:
The fi rst step of a simulation is to initialize the population of consumers and set up the fi rms. Next, the incumbent enters the market with technology a1. For the fi rst three periods, the incumbent can act as a monopolist, and in the fourth period the entrant joins the market with the new technology a2 ≠ a1, which from this time on is available to the incumbent (t = 4). The fi rms calculate their profi t-maximizing strategies (including the option to leave the market) according to Eq. 8, and consumers then make their utility-maximizing choices (including the option not to buy) according to Eqs. 5 and 6. In the case of adaptive preferences, the buyers further adapt their thresholds according to Eq. 7. Finally, the market outcome is evaluated in terms of market share and profi t.
Table 2 summarizes the setup of the invariant part of a simulation: the market consists of 100 consumers where a consumer’s thresholds of acceptable product performance are drawn from a uniform distribution over the rectangle (0, 3) × (0, 3). Note that we hold the distribution constant across different simulations. For the overall utility threshold of the consumers, we assume a level that scales the reservation prices at zero surplus performance properly, i.e., such that u−b = 3. For parameter h we choose a level of 0.5, meaning that a consumer overcom-pensation of the minimum performance requirement of one feature is equally valuable as overcompensation of the other one. Thus, we do not model segments of relative preference as in Adner [10], but rather a potentially competitive market that is segmentable by the fi rms’ choices of technology, investments, and price.
With regard to the fi rms, we assume initial funds of 1000 monetary units and a fi xed cost factor g = 0.2, which ensures unconstrained investments and proper scaling with reservation prices (so that initially the incumbent can make a profi t). We further assume a considerable bias of the incumbent technology against feature two (d = p/10) and a balanced entrant technology (d = p/4). That is, given the same level of total investment and equal effi ciency, the entrant technology outperforms that of the incumbent with respect to the second feature, but is
Table 2. Model setup
Parameter Value
t 4I 100h 0.5Fj,0 1000g 0.2d1 p/10d2 p/4l1 1.0
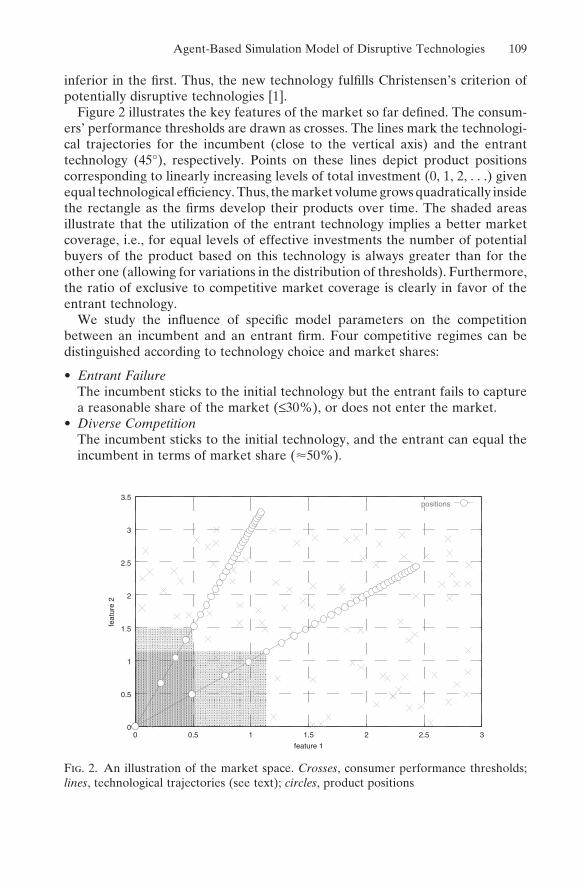
Agent-Based Simulation Model of Disruptive Technologies 109
inferior in the fi rst. Thus, the new technology fulfi lls Christensen’s criterion of potentially disruptive technologies [1].
Figure 2 illustrates the key features of the market so far defi ned. The consum-ers’ performance thresholds are drawn as crosses. The lines mark the technologi-cal trajectories for the incumbent (close to the vertical axis) and the entrant technology (45°), respectively. Points on these lines depict product positions corresponding to linearly increasing levels of total investment (0, 1, 2, . . .) given equal technological effi ciency. Thus, the market volume grows quadratically inside the rectangle as the fi rms develop their products over time. The shaded areas illustrate that the utilization of the entrant technology implies a better market coverage, i.e., for equal levels of effective investments the number of potential buyers of the product based on this technology is always greater than for the other one (allowing for variations in the distribution of thresholds). Furthermore, the ratio of exclusive to competitive market coverage is clearly in favor of the entrant technology.
We study the infl uence of specifi c model parameters on the competition between an incumbent and an entrant fi rm. Four competitive regimes can be distinguished according to technology choice and market shares:
• Entrant FailureThe incumbent sticks to the initial technology but the entrant fails to capture a reasonable share of the market (≤30%), or does not enter the market.
• Diverse CompetitionThe incumbent sticks to the initial technology, and the entrant can equal the incumbent in terms of market share (�50%).
0
0.5
1
1.5
2
2.5
3
3.5
0 0.5 1 1.5 2 2.5 3
feat
ure
2
feature 1
positions
Fig. 2. An illustration of the market space. Crosses, consumer performance thresholds; lines, technological trajectories (see text); circles, product positions
110 C. Buchta et al.
• DisruptionThe incumbent sticks to the initial technology but the entrant is able to outperform the incumbent, i.e., the entrant gains a considerable share of the market (≥70%), or even may force the incumbent out of the market.
• Duopolistic CompetitionThe incumbent switches to the entrant technology and thus competes with the entrant on a similar product. Therefore, we expect the market shares to be similar (�50%).
Table 3 shows a full factorial design of the model parameters we consider relevant for market outcome. Because we conjectured that relative technological effi ciency and organizational inertia are key determinants of the market outcome, we decided to search these parameters with a reasonably high resolution while economizing on the levels of price sensitivity. Thus, with l1 = 1, the range of l2 includes entrant technologies that are inferior, equal, and superior in terms of the incumbent’s technological effi ciency. In particular, we expect a considerable infl uence on the decision to switch, and, thus, on the market outcome. With respect to organizational inertia k, we analyze levels between 1.0 (no inertia) and 1.3 (high inertia). Note that in the present setting, differentials in inertia are meaningless for the incumbent’s technology choice at t = t, because information on the entrant product is not available by that time. By variation of b, we study the effect of high (0.5) and low (0.7) price elasticity, modeling the market’s receptiveness to innovation. In addition, we compare markets where consumers adapt their performance thresholds (z = 1) to markets with static consumers (z = 0). We expect adaptation to act in favor of the incumbent, because initially, as a monopolist, the incumbent is able to thin out the low end of the market and thus could block out the entrant.
Results
The model was implemented in the mathematical language Octave,1 and the results were analyzed using the statistics software R.2 The source code of the implementation is available upon request from the authors. A total simulation time of 20 periods proved suffi cient to get a clear picture of the market outcome.
Table 3. Design factors
Factor Levels
l2 0.4, 0.6, . . . , 1.8k 1.0, 1.1, . . . , 1.3b 0.5, 0.7z 0, 1
1 www.octave.org2 www.r-project.org
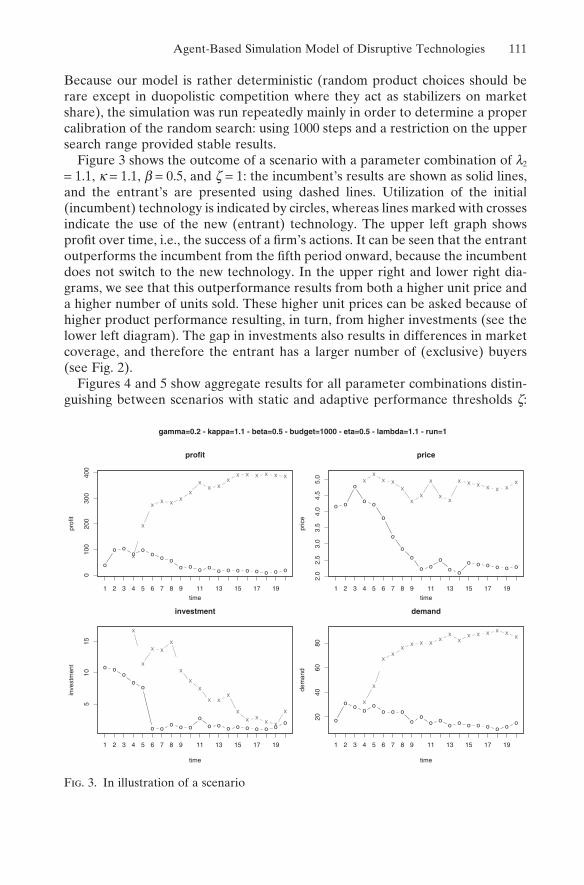
Agent-Based Simulation Model of Disruptive Technologies 111
Because our model is rather deterministic (random product choices should be rare except in duopolistic competition where they act as stabilizers on market share), the simulation was run repeatedly mainly in order to determine a proper calibration of the random search: using 1000 steps and a restriction on the upper search range provided stable results.
Figure 3 shows the outcome of a scenario with a parameter combination of l2 = 1.1, k = 1.1, b = 0.5, and z = 1: the incumbent’s results are shown as solid lines, and the entrant’s are presented using dashed lines. Utilization of the initial (incumbent) technology is indicated by circles, whereas lines marked with crosses indicate the use of the new (entrant) technology. The upper left graph shows profi t over time, i.e., the success of a fi rm’s actions. It can be seen that the entrant outperforms the incumbent from the fi fth period onward, because the incumbent does not switch to the new technology. In the upper right and lower right dia-grams, we see that this outperformance results from both a higher unit price and a higher number of units sold. These higher unit prices can be asked because of higher product performance resulting, in turn, from higher investments (see the lower left diagram). The gap in investments also results in differences in market coverage, and therefore the entrant has a larger number of (exclusive) buyers (see Fig. 2).
Figures 4 and 5 show aggregate results for all parameter combinations distin-guishing between scenarios with static and adaptive performance thresholds z:
o
o oo
oo o o
o o o o o o o o o o o o
010
020
030
040
0
profit
time
prof
it
x
x
xx x
xx
xx x
xx x x x x x
1 2 3 4 5 6 7 8 9 11 13 15 17 19
gamma=0.2 - kappa=1.1 - beta=0.5 - budget=1000 - eta=0.5 - lambda=1.1 - run=1
o o
o
o o
o
o
oo
o oo
o o
o o o o o o
2.0
2.5
3.0
3.5
4.0
4.5
5.0
price
time
pric
e
xx
x xx
xx
x
xx
x x x x x xx
1 2 3 4 5 6 7 8 9 11 13 15 17 19
o oo
oo
o oo o o
oo o o o o o o o
o
510
15
investment
time
inve
stm
ent
x
x
x xx
x
xx
x xx
xx x
x x
x
1 2 3 4 5 6 7 8 9 11 13 15 17 19
o
o o oo
o o o
oo
o oo o o o o o o o
2040
6080
demand
time
dem
and
x
x
xx
x x x x xx
xx x x x x x
1 2 3 4 5 6 7 8 9 11 13 15 17 19
Fig. 3. In illustration of a scenario
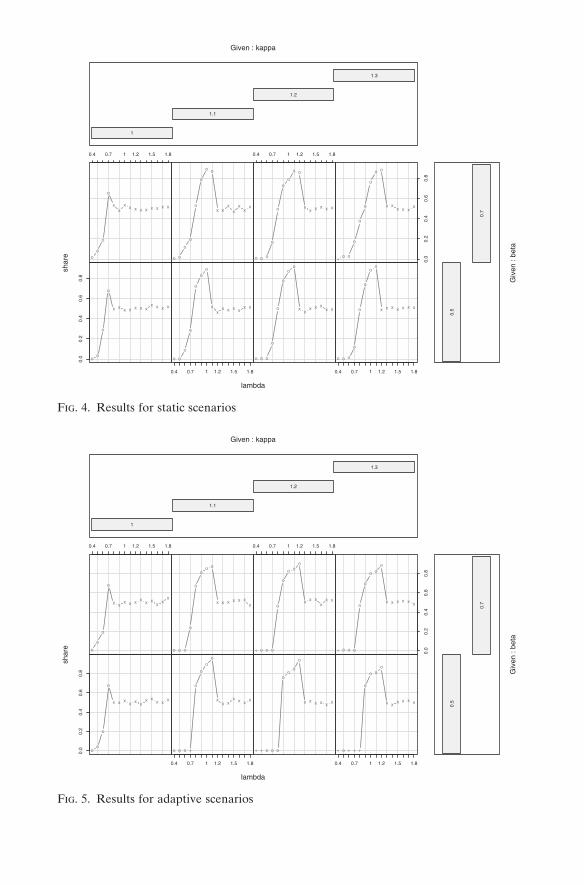
oo
o
o
x x x x x x xx x x x
0.0
0.2
0.4
0.6
0.8
o o
o
o
o
oo
xx
x x x xx x
0.4 0.7 1 1.2 1.5 1.8
o o o
o
o
o
oo
xx
x x xx x
o o o
o
o
o
oo
x x x x x x x
0.4 0.7 1 1.2 1.5 1.8
oo
o
o
xx
x x x x x x x x x
0.4 0.7 1 1.2 1.5 1.8
o o
o
o
o
o
o o
x xx
xx
xx
o o o
o
o
oo
o o
xx x x x x
0.4 0.7 1 1.2 1.5 1.8
+ o o
o
o
o
o
o o
x xx x x
x
0.0
0.2
0.4
0.6
0.8
lambda
shar
e
1
1.1
1.2
1.3
Given : kappa
0.5
0.7
Giv
en :
beta
oo
o
o
x x xx x x
x xx x x
0.0
0.2
0.4
0.6
0.8
o o o +
o
oo
o
xx x
x x x x
0.4 0.7 1 1.2 1.5 1.8
+ + o o o
oo
o
o
x x x x x x
+ o + + +
o
o oo
x x x x x x
0.4 0.7 1 1.2 1.5 1.8
o
o
o
o
x xx x x x
x xx x
x
0.4 0.7 1 1.2 1.5 1.8
o o o
o
o
oo o
x x x x x xx
+ o o o
o
o
o oo
x x xx
x x
0.4 0.7 1 1.2 1.5 1.8
+ o o o
o
o
o oo
x x x x x x
0.0
0.2
0.4
0.6
0.8
lambda
shar
e
1
1.1
1.2
1.3
Given : kappa
0.5
0.7
Giv
en :
beta
Fig. 4. Results for static scenarios
Fig. 5. Results for adaptive scenarios
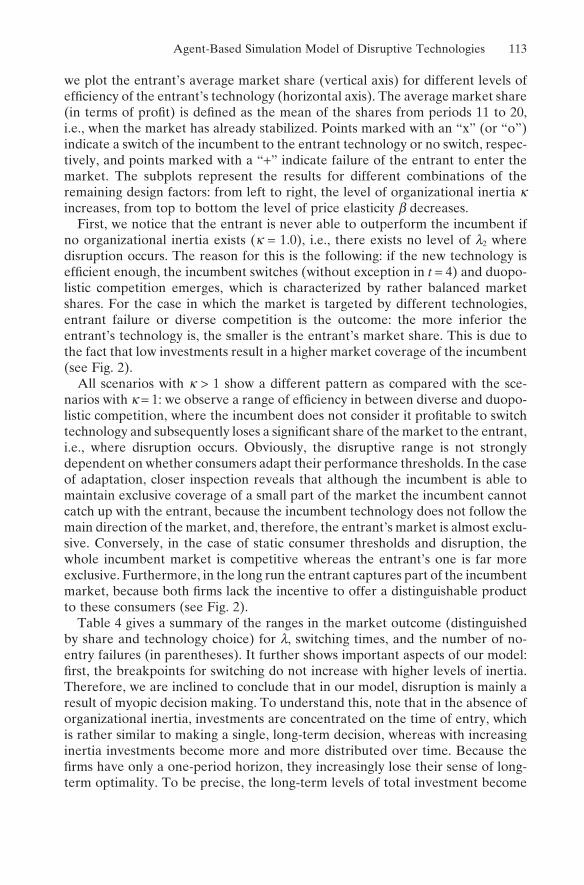
Agent-Based Simulation Model of Disruptive Technologies 113
we plot the entrant’s average market share (vertical axis) for different levels of effi ciency of the entrant’s technology (horizontal axis). The average market share (in terms of profi t) is defi ned as the mean of the shares from periods 11 to 20, i.e., when the market has already stabilized. Points marked with an “x” (or “o”) indicate a switch of the incumbent to the entrant technology or no switch, respec-tively, and points marked with a “+” indicate failure of the entrant to enter the market. The subplots represent the results for different combinations of the remaining design factors: from left to right, the level of organizational inertia k increases, from top to bottom the level of price elasticity b decreases.
First, we notice that the entrant is never able to outperform the incumbent if no organizational inertia exists (k = 1.0), i.e., there exists no level of l2 where disruption occurs. The reason for this is the following: if the new technology is effi cient enough, the incumbent switches (without exception in t = 4) and duopo-listic competition emerges, which is characterized by rather balanced market shares. For the case in which the market is targeted by different technologies, entrant failure or diverse competition is the outcome: the more inferior the entrant’s technology is, the smaller is the entrant’s market share. This is due to the fact that low investments result in a higher market coverage of the incumbent (see Fig. 2).
All scenarios with k > 1 show a different pattern as compared with the sce-narios with k = 1: we observe a range of effi ciency in between diverse and duopo-listic competition, where the incumbent does not consider it profi table to switch technology and subsequently loses a signifi cant share of the market to the entrant, i.e., where disruption occurs. Obviously, the disruptive range is not strongly dependent on whether consumers adapt their performance thresholds. In the case of adaptation, closer inspection reveals that although the incumbent is able to maintain exclusive coverage of a small part of the market the incumbent cannot catch up with the entrant, because the incumbent technology does not follow the main direction of the market, and, therefore, the entrant’s market is almost exclu-sive. Conversely, in the case of static consumer thresholds and disruption, the whole incumbent market is competitive whereas the entrant’s one is far more exclusive. Furthermore, in the long run the entrant captures part of the incumbent market, because both fi rms lack the incentive to offer a distinguishable product to these consumers (see Fig. 2).
Table 4 gives a summary of the ranges in the market outcome (distinguished by share and technology choice) for l, switching times, and the number of no-entry failures (in parentheses). It further shows important aspects of our model: fi rst, the breakpoints for switching do not increase with higher levels of inertia. Therefore, we are inclined to conclude that in our model, disruption is mainly a result of myopic decision making. To understand this, note that in the absence of organizational inertia, investments are concentrated on the time of entry, which is rather similar to making a single, long-term decision, whereas with increasing inertia investments become more and more distributed over time. Because the fi rms have only a one-period horizon, they increasingly lose their sense of long-term optimality. To be precise, the long-term levels of total investment become
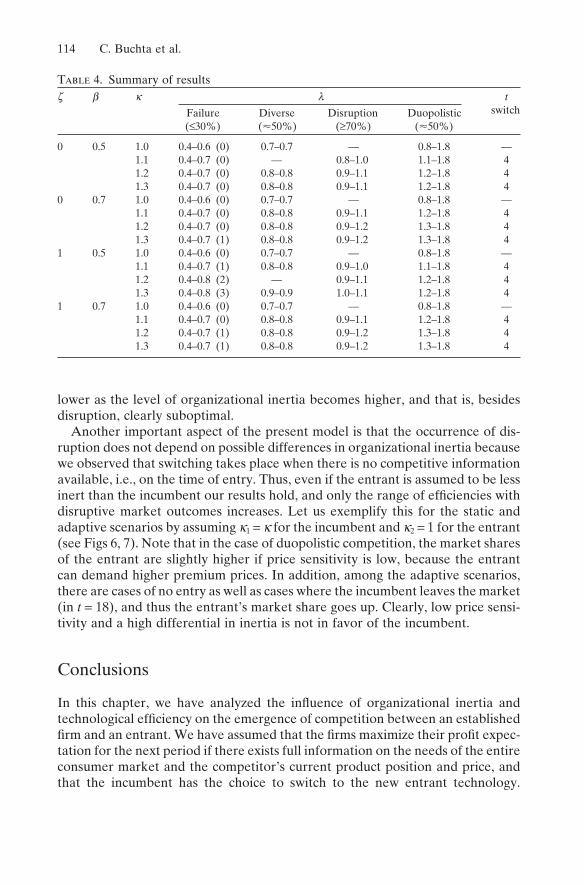
114 C. Buchta et al.
Table 4. Summary of resultsz b k l t
Failure Diverse Disruption Duopolistic switch
(≤30%) (�50%) (≥70%) (�50%)
0 0.5 1.0 0.4–0.6 (0) 0.7–0.7 — 0.8–1.8 — 1.1 0.4–0.7 (0) — 0.8–1.0 1.1–1.8 4 1.2 0.4–0.7 (0) 0.8–0.8 0.9–1.1 1.2–1.8 4 1.3 0.4–0.7 (0) 0.8–0.8 0.9–1.1 1.2–1.8 40 0.7 1.0 0.4–0.6 (0) 0.7–0.7 — 0.8–1.8 — 1.1 0.4–0.7 (0) 0.8–0.8 0.9–1.1 1.2–1.8 4 1.2 0.4–0.7 (0) 0.8–0.8 0.9–1.2 1.3–1.8 4 1.3 0.4–0.7 (1) 0.8–0.8 0.9–1.2 1.3–1.8 41 0.5 1.0 0.4–0.6 (0) 0.7–0.7 — 0.8–1.8 — 1.1 0.4–0.7 (1) 0.8–0.8 0.9–1.0 1.1–1.8 4 1.2 0.4–0.8 (2) — 0.9–1.1 1.2–1.8 4 1.3 0.4–0.8 (3) 0.9–0.9 1.0–1.1 1.2–1.8 41 0.7 1.0 0.4–0.6 (0) 0.7–0.7 — 0.8–1.8 — 1.1 0.4–0.7 (0) 0.8–0.8 0.9–1.1 1.2–1.8 4 1.2 0.4–0.7 (1) 0.8–0.8 0.9–1.2 1.3–1.8 4 1.3 0.4–0.7 (1) 0.8–0.8 0.9–1.2 1.3–1.8 4
lower as the level of organizational inertia becomes higher, and that is, besides disruption, clearly suboptimal.
Another important aspect of the present model is that the occurrence of dis-ruption does not depend on possible differences in organizational inertia because we observed that switching takes place when there is no competitive information available, i.e., on the time of entry. Thus, even if the entrant is assumed to be less inert than the incumbent our results hold, and only the range of effi ciencies with disruptive market outcomes increases. Let us exemplify this for the static and adaptive scenarios by assuming k1 = k for the incumbent and k2 = 1 for the entrant (see Figs 6, 7). Note that in the case of duopolistic competition, the market shares of the entrant are slightly higher if price sensitivity is low, because the entrant can demand higher premium prices. In addition, among the adaptive scenarios, there are cases of no entry as well as cases where the incumbent leaves the market (in t = 18), and thus the entrant’s market share goes up. Clearly, low price sensi-tivity and a high differential in inertia is not in favor of the incumbent.
Conclusions
In this chapter, we have analyzed the infl uence of organizational inertia and technological effi ciency on the emergence of competition between an established fi rm and an entrant. We have assumed that the fi rms maximize their profi t expec-tation for the next period if there exists full information on the needs of the entire consumer market and the competitor’s current product position and price, and that the incumbent has the choice to switch to the new entrant technology.
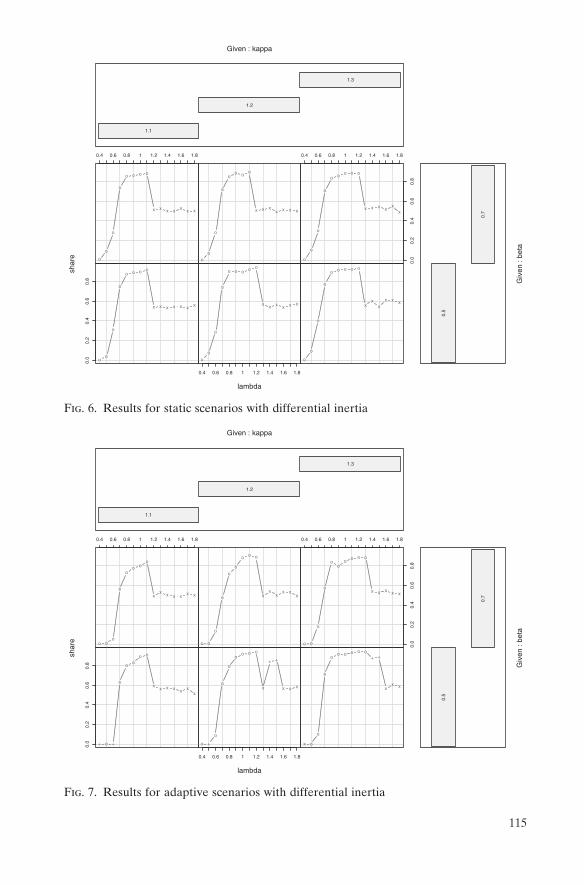
oo
o
o
o o o o
x x x x x x x
0.0
0.2
0.4
0.6
0.8
oo
o
o
o o o o o
x x x x x x
0.4 0.6 0.8 1 1.2 1.4 1.6 1.8
o
o
o
o
o o o o o
xx
xx x x
o
o
o
o
o o o o
x x x x x x x
0.4 0.6 0.8 1 1.2 1.4 1.6 1.8
oo
o
o
oo o
o
x x xx x x x
o
o
o
o
o o o o o
x x x xx
x
0.4 0.6 0.8 1 1.2 1.4 1.6 1.8
0.0
0.2
0.4
0.6
0.8
lambda
shar
e
1.1
1.2
1.3
Given : kappa
0.5
0.7
Giv
en :
beta
Fig. 6. Results for static scenarios with differential inertia
+ o +
o
oo
o o
xx x x x x
x
0.0
0.2
0.4
0.6
0.8
o +
o
o
o
oo o o
x
+ +
x x x
0.4 0.6 0.8 1 1.2 1.4 1.6 1.8
x o
o
o
oo o o o o
+ +
xx x
o oo
o
oo o
o
xx x x x x x
0.4 0.6 0.8 1 1.2 1.4 1.6 1.8
o o
o
o
oo
o o o
xx
xx x
x
o o
o
o
oo
oo o o
x x x x x
0.4 0.6 0.8 1 1.2 1.4 1.6 1.8
0.0
0.2
0.4
0.6
0.8
lambda
shar
e
1.1
1.2
1.3
Given : kappa0.
5
0.7
Giv
en :
beta
Fig. 7. Results for adaptive scenarios with differential inertia
115
116 C. Buchta et al.
Technologies are modeled as linear trajectories of possible product positions in a two-dimensional feature space. A simplifi ed S-curve model describes the rela-tionship between a fi rm’s investments and its technological progress, which comes with increasing fi xed cost and investment cost. The fi rms are faced with a highly competitive market of compensatory, utility-maximizing consumers with differ-ent minimum performance requirements. We have studied the infl uence of dif-ferentials in technological effi ciency on the entrants’ success under different market conditions and levels of organizational inertia.
Using an agent-based computer simulation, we have shown that the entrant is never able to outperform the incumbent if organizational inertia does not exist. This is an interesting fi nding as we expect organizational inertia to be higher for larger companies and/or complex industries. Reducing an organization’s com-plexity is, therefore, advisable for large companies that are faced with potential entrants. This is consistent with Christensen’s suggestion that fi rms should not pursue the development of potentially disruptive technologies within their exist-ing organization but ought to outsource this task to a new company.
Furthermore, we have found that outperformance of the incumbent fi rm depends on a specifi c range of the entrant’s (relative) technological effi ciency. If the new (disruptive) technology’s effi ciency is too low, the entrant is not able to reach a satisfactory product performance and thus is unable to capture a signifi -cant share of the market. On the other hand, if the effi ciency is very high, it is more attractive to the incumbent to switch to the new technology than to con-tinue using the initial technology. The result is a duopolistic market where price competition between similar products prevails. Finally, we have found that dif-ferentials in organizational inertia expose the incumbent to an increased risk of disruption.
Both results regarding technological effi ciency and organizational inertia are rather independent of the demand structure. In contrast to Adner [10], we there-fore conclude that the phenomenon of disruption does not necessarily occur as a result of changes in consumer preferences, but that technological and organi-zational aspects seem to be more important. We expect that fully rational, long-term optimizing fi rms are better able to defend their market position even if organizational inertia exists. For this reason, it would be interesting to see further research in the direction of models where fi rms base their decisions on long-term forecasts of their competitors’ technological moves. In particular, this should involve determining the proper planning horizon and suitable forecasting instruments.
Acknowledgment. All tables and fi gures except Table 1 are taken from previous work [13].
References 1. Christensen CM (1997) The innovator’s dilemma. Harvard School Press,
Boston, MA

Agent-Based Simulation Model of Disruptive Technologies 117
2. Klepper S, Simons KL (1997) Technological extinctions of industrial fi rms: an inquiry into their nature and causes. Oxford University Press, Oxford
3. Rumelt RP (1981) Towards a strategic theory of the fi rm. In: Boyden Lamb R (ed) Competitive strategic advantage. Prentice Hall, Englewood Cliffs, pp. 556–570
4. Mas-Colell A, Whinston M, Green JR (1995) Microeconomic theory. Oxford Univer-sity Press, New York
5. Christensen CM (1993) The rigid disk drive industry: history of commercial and tech-nological turbulence. Business History Review 67:531–588
6. Christensen CM, Bower JL (1996) Customer power, strategic investment, and the failure of leading fi rms. Strategic Management Journal 17:197–218
7. Hauser JR, Clausing D (1988) The house of quality. Harvard Business Review, May–June 1988, pp 63–73
8. Henderson R (1993) Underinvestment and incompetence as responses to radical innovation: evidence from the photolithographic alignment equipment industry. RAND Journal of Economics 24:248–270
9. Tushman ML, Anderson P (1986) Technological discontinuities and organizational environments. Administrative Science Quarterly 31:439–465
10. Adner R, Levinthal D (2001) Demand heterogeneity and technology evolution: impli-cations for product and process innovation. Management Science 47:611–628
11. Malerba F, Nelson R, Orsenigo L, et al. (1999) History-friendly models of industry evolution: the computer industry. Industrial and Corporate Change 8:3–40
12. Nault, BR, Vandenbosch MB (2000) Research report: disruptive technologies—explaining entry in next generation information technology markets. Information Systems Research 11:304–319
13. Buchta C, Meyer D, Mild A, et al. (2004) Technological effi ciency and organizational inertia: a model of the emergence of disruption. Computational and Mathematical Organization Theory 9:127–146
119
Agent-Based Simulation on the Diffusion of Research and Development for Environmentally Conscious ProductsKeiko Zaima
Introduction
The 1990s saw a marked increase in public concern for corporate social respon-sibility concerning environmental conservation. In that time, industry has begun to expend serious efforts to tackle environmental issues. The number of environ-mental reports published by enterprises is increasing, while on a smaller scale, everyday citizens have also sought to lessen environmental impacts in daily life.
Many manufacturing companies have carried out research and development for environmentally conscious products, so-called green products. However, the diffusion of green products into society depends on the interaction between the environmental research and development of firms and the environmental prefer-ences of consumers. Although the category of green products has gradually increased in recent years, products that are upgraded in environmental perfor-mance are still limited in variety and have not yet spread into daily consumption. It is important to clarify the mechanism of the diffusion of green products into common use.
This chapter is intended as a computational study on the diffusion processes of company research and development for environmentally conscious products and consumer selection of green products. It is said that there are several factors responsible for pushing corporate greening forward. We mention the following three factors related to the analyses in this chapter:
Continuous improvement as prescribed in ISO14001. ISO14001, one of the international standards established by the International Organization for Standardization, is a set of procedural standard requirements to introduce an environmental management system into an organization. ISO14001 requires organizations to continuously improve environmental performances.
The forthcoming intensification of the European Union (EU) regulations related to harmful chemical materials. The regulations, labeled as RoHS and REACH,
Senshu University, Higashimita, Tama-ku, Kawasaki, 214-8580, Japan. e-mail: [email protected]
120 K. Zaima
stipulate severe standards concerning the amount of harmful substances con-tained in products. Manufacturers must upgrade the environmental quality of products themselves, in addition to reducing environmental burdens in produc-tion processes. In the spring of 2002, Sony Corporation recalled PlayStation 1 voluntarily from the entire EU market, because the amount of cadmium in the product exceeded the standard of the Netherlands. In the Netherlands, the severe regulations have been enforced in advance of the strengthening of regu-lations in the EU. This event had significant impacts on the manufacturing industry. Many companies have been preparing for the intensification of EU regulations.
Voluntary participation to aid in the diffusion of environmentally conscious behavior is also important and we enumerate some facts. First, leading envi-ronmental companies, for example, Shimadzu Corporation, began to support their business acquaintances by providing environmental knowledge and tech-nologies they acquired. Second, Greenpeace, a global nongovernmental orga-nization committed to environmental conservation, influenced Matsushita Electric Industrial Co. Ltd. to speed up the adoption of nonfluorocarbon refrig-erants. Third, many firms have provided information related to environmental issues besides those that concern their own business, and green consumer groups have also provided useful information in green consumer guides related to the purchase of environmentally conscious goods.
The purpose of this chapter is to investigate the effects of the three factors mentioned above on the diffusion of environmental research and development, using agent-based models. We discuss the conditions for the diffusion of environ-mentally conscious behavior in society and consider a gaming simulation related to this process.
The Basic Model
SocietyWe consider a society consisting of two classes of autonomous agents. One is the consumer class and the population is fixed to n. The other is the manufacturer or firm class and the population is fixed to m, including entry and exit. The numbers of n and m are natural numbers and are sufficiently large. In this chapter, sub-scripts “ci” and “fj” represent the i-th consumer and the j-th firm, respectively.
MarketIn the above-mentioned society, there exists a market of one kind of products. The products can be differentiated only on environmental aspects. The environ-mental quality of products is called the “environmental quality level” or just “quality level” in this model. The environmental quality level of a product is represented by q. The value of q is zero or a positive integer not exceeding q*,that is, 0 ≤ q ≤ q*.
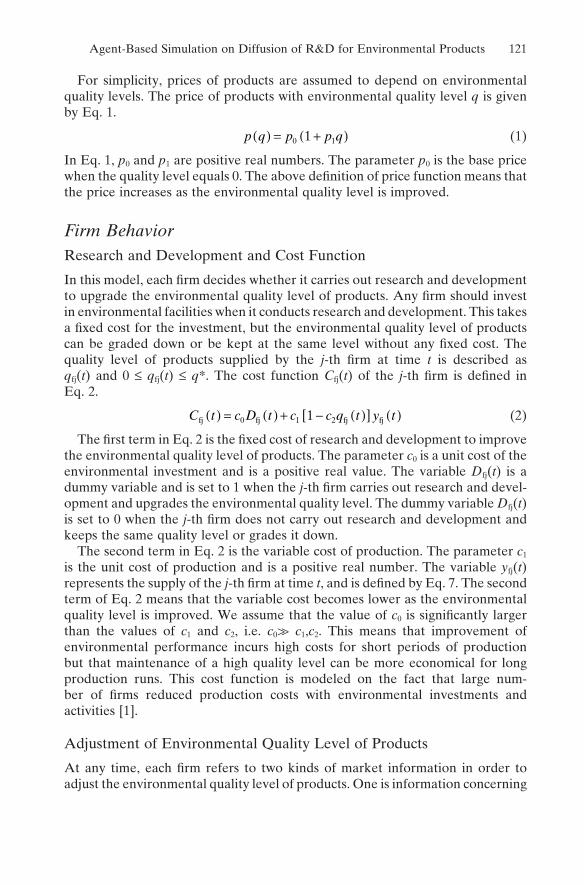
Agent-Based Simulation on Diffusion of R&D for Environmental Products 121
For simplicity, prices of products are assumed to depend on environmental quality levels. The price of products with environmental quality level q is given by Eq. 1.
p q p p q( ) = +( )0 11 (1)
In Eq. 1, p0 and p1 are positive real numbers. The parameter p0 is the base price when the quality level equals 0. The above definition of price function means that the price increases as the environmental quality level is improved.
Firm BehaviorResearch and Development and Cost Function
In this model, each firm decides whether it carries out research and development to upgrade the environmental quality level of products. Any firm should invest in environmental facilities when it conducts research and development. This takes a fixed cost for the investment, but the environmental quality level of products can be graded down or be kept at the same level without any fixed cost. The quality level of products supplied by the j-th firm at time t is described as qfj(t) and 0 ≤ qfj(t) ≤ q*. The cost function Cfj(t) of the j-th firm is defined in Eq. 2.
C t c D t c c q t y tfj fj fj fj( ) = ( ) + − ( )[ ] ( )0 1 21 (2)
The first term in Eq. 2 is the fixed cost of research and development to improve the environmental quality level of products. The parameter c0 is a unit cost of the environmental investment and is a positive real value. The variable Dfj(t) is a dummy variable and is set to 1 when the j-th firm carries out research and devel-opment and upgrades the environmental quality level. The dummy variable Dfj(t)is set to 0 when the j-th firm does not carry out research and development and keeps the same quality level or grades it down.
The second term in Eq. 2 is the variable cost of production. The parameter c1
is the unit cost of production and is a positive real number. The variable yfj(t)represents the supply of the j-th firm at time t, and is defined by Eq. 7. The second term of Eq. 2 means that the variable cost becomes lower as the environmental quality level is improved. We assume that the value of c0 is significantly larger than the values of c1 and c2, i.e. c0>> c1,c2. This means that improvement of environmental performance incurs high costs for short periods of production but that maintenance of a high quality level can be more economical for long production runs. This cost function is modeled on the fact that large num-ber of firms reduced production costs with environmental investments and activities [1].
Adjustment of Environmental Quality Level of Products
At any time, each firm refers to two kinds of market information in order to adjust the environmental quality level of products. One is information concerning
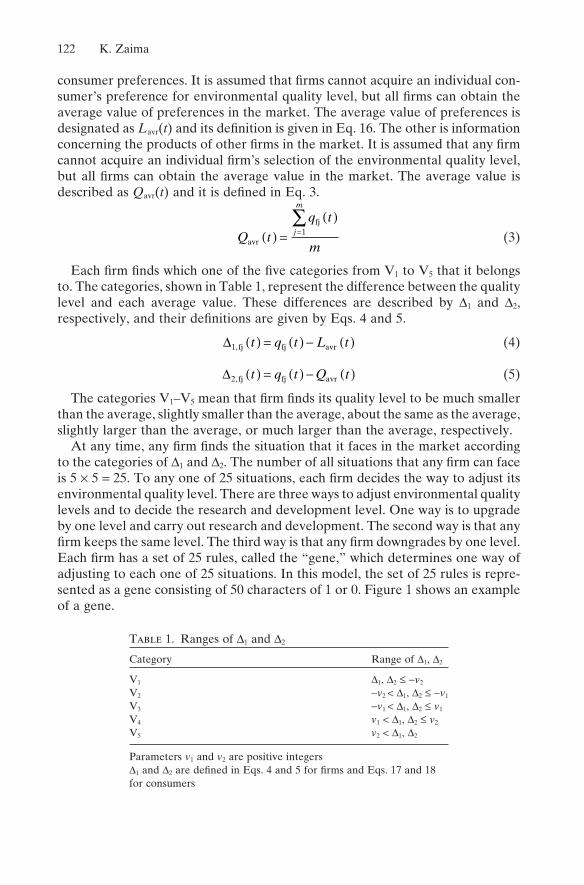
122 K. Zaima
consumer preferences. It is assumed that firms cannot acquire an individual con-sumer’s preference for environmental quality level, but all firms can obtain the average value of preferences in the market. The average value of preferences is designated as Lavr(t) and its definition is given in Eq. 16. The other is information concerning the products of other firms in the market. It is assumed that any firmcannot acquire an individual firm’s selection of the environmental quality level, but all firms can obtain the average value in the market. The average value is described as Qavr(t) and it is defined in Eq. 3.
Q t
q t
mj
m
avr
fj=( ) =
( )∑1 (3)
Each firm finds which one of the five categories from V1 to V5 that it belongs to. The categories, shown in Table 1, represent the difference between the quality level and each average value. These differences are described by ∆1 and ∆2,respectively, and their definitions are given by Eqs. 4 and 5.
∆1,fj fj avrt q t L t( ) = ( ) − ( ) (4)
∆2,fj fj avrt q t Q t( ) = ( ) − ( ) (5)
The categories V1–V5 mean that firm finds its quality level to be much smaller than the average, slightly smaller than the average, about the same as the average, slightly larger than the average, or much larger than the average, respectively.
At any time, any firm finds the situation that it faces in the market according to the categories of ∆1 and ∆2. The number of all situations that any firm can face is 5 × 5 = 25. To any one of 25 situations, each firm decides the way to adjust its environmental quality level. There are three ways to adjust environmental quality levels and to decide the research and development level. One way is to upgrade by one level and carry out research and development. The second way is that any firm keeps the same level. The third way is that any firm downgrades by one level. Each firm has a set of 25 rules, called the “gene,” which determines one way of adjusting to each one of 25 situations. In this model, the set of 25 rules is repre-sented as a gene consisting of 50 characters of 1 or 0. Figure 1 shows an example of a gene.
Table 1. Ranges of ∆1 and ∆2
Category Range of ∆1, ∆2
V1 ∆1, ∆2 ≤ −v2
V2 −v2 < ∆1, ∆2 ≤ −v1
V3 −v1 < ∆1, ∆2 ≤ v1
V4 v1 < ∆1, ∆2 ≤ v2
V5 v2 < ∆1, ∆2
Parameters v1 and v2 are positive integers∆1 and ∆2 are defined in Eqs. 4 and 5 for firms and Eqs. 17 and 18 for consumers
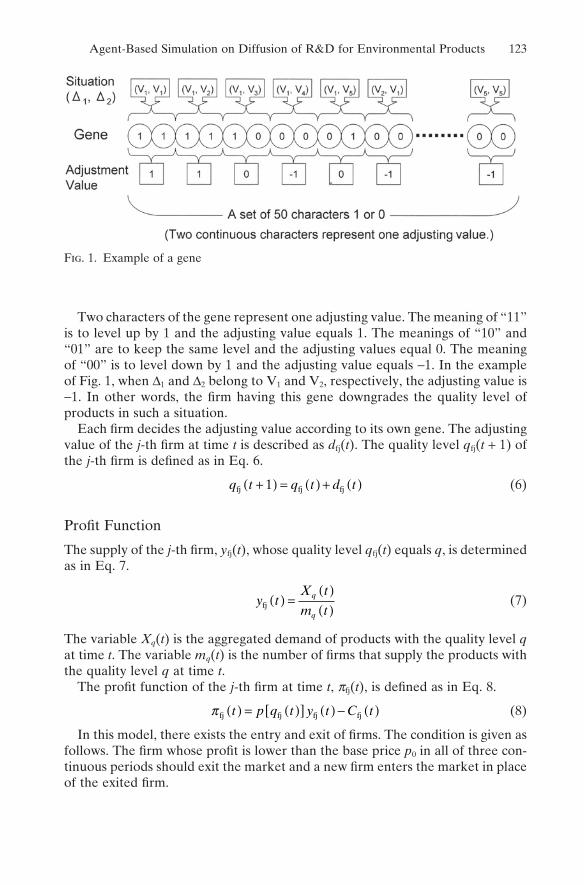
Agent-Based Simulation on Diffusion of R&D for Environmental Products 123
Two characters of the gene represent one adjusting value. The meaning of “11” is to level up by 1 and the adjusting value equals 1. The meanings of “10” and “01” are to keep the same level and the adjusting values equal 0. The meaning of “00” is to level down by 1 and the adjusting value equals −1. In the example of Fig. 1, when ∆1 and ∆2 belong to V1 and V2, respectively, the adjusting value is −1. In other words, the firm having this gene downgrades the quality level of products in such a situation.
Each firm decides the adjusting value according to its own gene. The adjusting value of the j-th firm at time t is described as dfj(t). The quality level qfj(t + 1) of the j-th firm is defined as in Eq. 6.
q t q t d tfj fj fj+( ) = ( ) + ( )1 (6)
Profit Function
The supply of the j-th firm, yfj(t), whose quality level qfj(t) equals q, is determined as in Eq. 7.
y tX t
m tq
qfj ( ) =
( )( )
(7)
The variable Xq(t) is the aggregated demand of products with the quality level qat time t. The variable mq(t) is the number of firms that supply the products with the quality level q at time t.
The profit function of the j-th firm at time t, pfj(t), is defined as in Eq. 8.
π fj fj fj fjt p q t y t C t( ) = ( )[ ] ( ) − ( ) (8)
In this model, there exists the entry and exit of firms. The condition is given as follows. The firm whose profit is lower than the base price p0 in all of three con-tinuous periods should exit the market and a new firm enters the market in place of the exited firm.
Fig. 1. Example of a gene
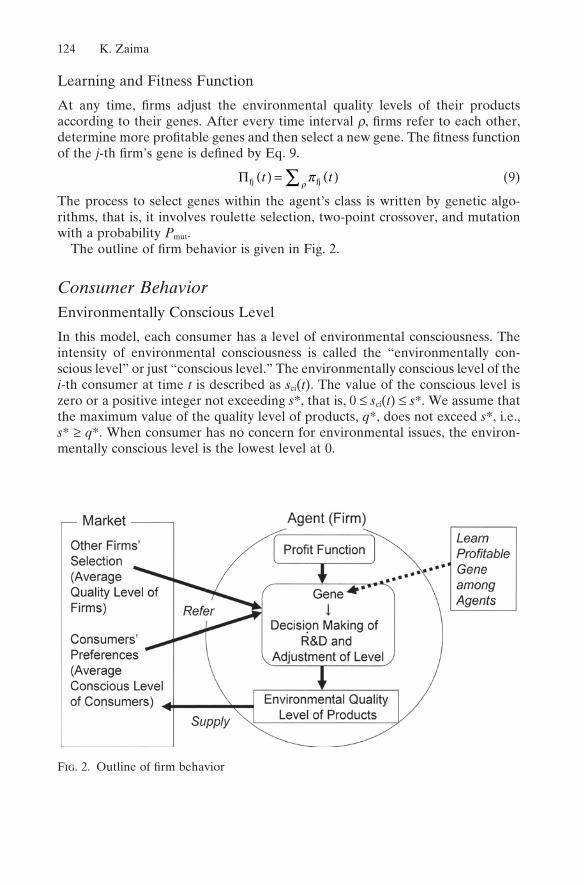
124 K. Zaima
Learning and Fitness Function
At any time, firms adjust the environmental quality levels of their products according to their genes. After every time interval r, firms refer to each other, determine more profitable genes and then select a new gene. The fitness function of the j-th firm’s gene is defined by Eq. 9.
Πfj fjt t( ) = ( )∑ πρ
(9)
The process to select genes within the agent’s class is written by genetic algo-rithms, that is, it involves roulette selection, two-point crossover, and mutation with a probability Pmut.
The outline of firm behavior is given in Fig. 2.
Consumer BehaviorEnvironmentally Conscious Level
In this model, each consumer has a level of environmental consciousness. The intensity of environmental consciousness is called the “environmentally con-scious level” or just “conscious level.” The environmentally conscious level of the i-th consumer at time t is described as sci(t). The value of the conscious level is zero or a positive integer not exceeding s*, that is, 0 ≤ sci(t) ≤ s*. We assume that the maximum value of the quality level of products, q*, does not exceed s*, i.e., s* ≥ q*. When consumer has no concern for environmental issues, the environ-mentally conscious level is the lowest level at 0.
Fig. 2. Outline of firm behavior
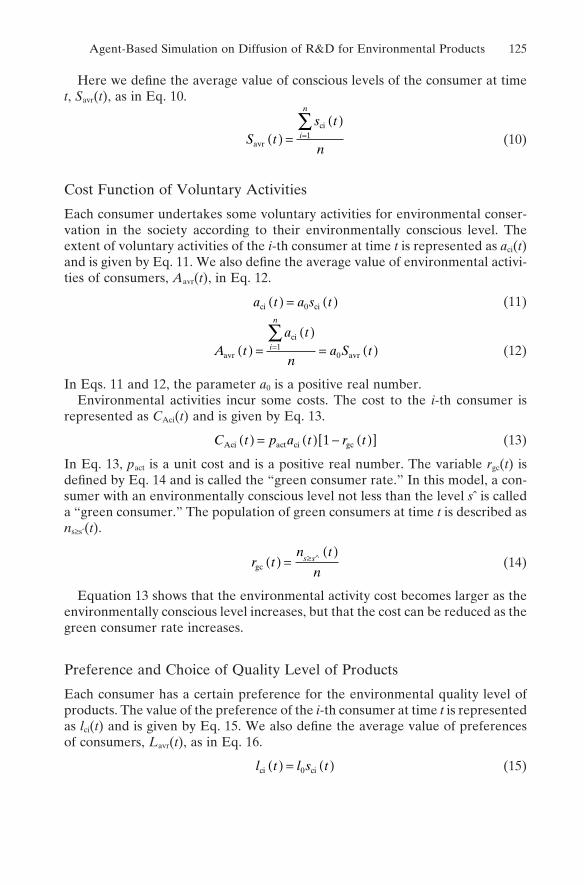
Agent-Based Simulation on Diffusion of R&D for Environmental Products 125
Here we define the average value of conscious levels of the consumer at time t, Savr(t), as in Eq. 10.
S ts t
ni
n
avr
ci
( ) =( )
=∑
1 (10)
Cost Function of Voluntary Activities
Each consumer undertakes some voluntary activities for environmental conser-vation in the society according to their environmentally conscious level. The extent of voluntary activities of the i-th consumer at time t is represented as aci(t)and is given by Eq. 11. We also define the average value of environmental activi-ties of consumers, Aavr(t), in Eq. 12.
a t a s tci ci( ) = ( )0 (11)
A ta t
na S ti
n
avr
ci
avr( ) =( )
= ( )=∑
10 (12)
In Eqs. 11 and 12, the parameter a0 is a positive real number.Environmental activities incur some costs. The cost to the i-th consumer is
represented as CAci(t) and is given by Eq. 13.
C t p a t r tAci act ci gc( ) = ( ) − ( )[ ]1 (13)
In Eq. 13, pact is a unit cost and is a positive real number. The variable rgc(t) is defined by Eq. 14 and is called the “green consumer rate.” In this model, a con-sumer with an environmentally conscious level not less than the level sˆ is called a “green consumer.” The population of green consumers at time t is described as ns≥sˆ(t).
r tn t
ns s
gc ( ) =( )≥ ∧
(14)
Equation 13 shows that the environmental activity cost becomes larger as the environmentally conscious level increases, but that the cost can be reduced as the green consumer rate increases.
Preference and Choice of Quality Level of Products
Each consumer has a certain preference for the environmental quality level of products. The value of the preference of the i-th consumer at time t is represented as lci(t) and is given by Eq. 15. We also define the average value of preferences of consumers, Lavr(t), as in Eq. 16.
l t l s tci ci( ) = ( )0 (15)
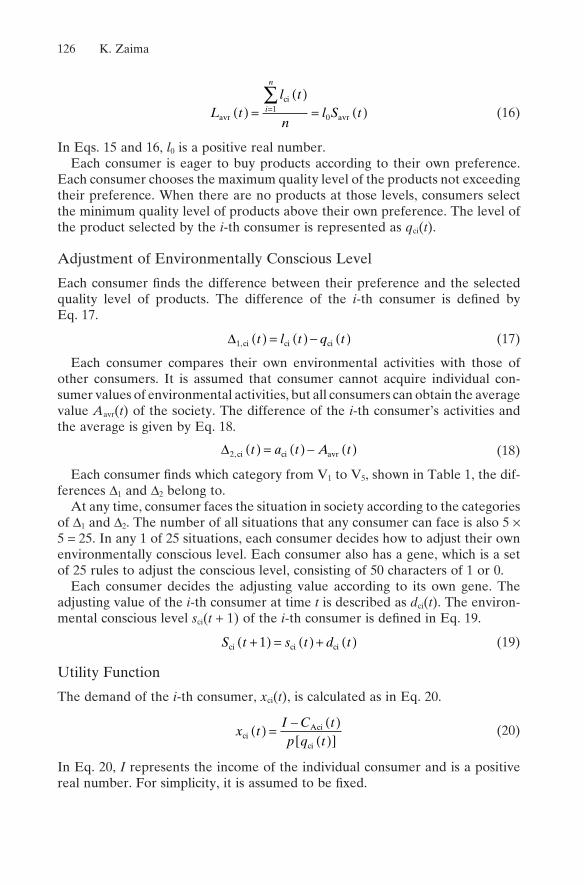
126 K. Zaima
L tl t
nl S ti
n
avr
ci
avr( ) =( )
= ( )=∑
10 (16)
In Eqs. 15 and 16, l0 is a positive real number.Each consumer is eager to buy products according to their own preference.
Each consumer chooses the maximum quality level of the products not exceeding their preference. When there are no products at those levels, consumers select the minimum quality level of products above their own preference. The level of the product selected by the i-th consumer is represented as qci(t).
Adjustment of Environmentally Conscious Level
Each consumer finds the difference between their preference and the selected quality level of products. The difference of the i-th consumer is defined by Eq. 17.
∆1,ci ci cit l t q t( ) = ( ) − ( ) (17)
Each consumer compares their own environmental activities with those of other consumers. It is assumed that consumer cannot acquire individual con-sumer values of environmental activities, but all consumers can obtain the average value Aavr(t) of the society. The difference of the i-th consumer’s activities and the average is given by Eq. 18.
∆2,ci ci avrt a t A t( ) = ( ) − ( ) (18)
Each consumer finds which category from V1 to V5, shown in Table 1, the dif-ferences ∆1 and ∆2 belong to.
At any time, consumer faces the situation in society according to the categories of ∆1 and ∆2. The number of all situations that any consumer can face is also 5 ×5 = 25. In any 1 of 25 situations, each consumer decides how to adjust their own environmentally conscious level. Each consumer also has a gene, which is a set of 25 rules to adjust the conscious level, consisting of 50 characters of 1 or 0.
Each consumer decides the adjusting value according to its own gene. The adjusting value of the i-th consumer at time t is described as dci(t). The environ-mental conscious level sci(t + 1) of the i-th consumer is defined in Eq. 19.
S t s t d tci ci ci+( ) = ( ) + ( )1 (19)
Utility Function
The demand of the i-th consumer, xci(t), is calculated as in Eq. 20.
x tI C tp q tci
Aci
ci
( ) = − ( )( )[ ]
(20)
In Eq. 20, I represents the income of the individual consumer and is a positive real number. For simplicity, it is assumed to be fixed.
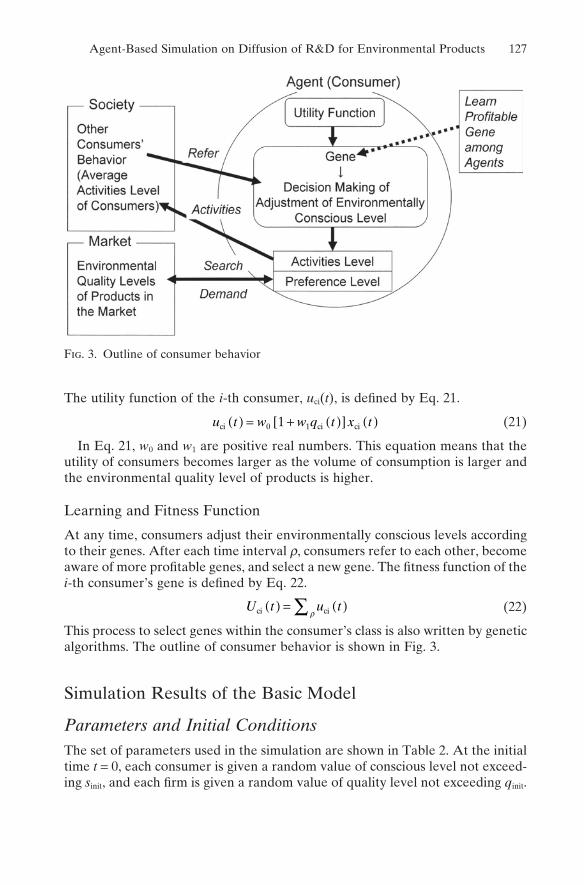
Agent-Based Simulation on Diffusion of R&D for Environmental Products 127
The utility function of the i-th consumer, uci(t), is defined by Eq. 21.
u t w w q t x tci ci ci( ) = + ( )[ ] ( )0 11 (21)
In Eq. 21, w0 and w1 are positive real numbers. This equation means that the utility of consumers becomes larger as the volume of consumption is larger and the environmental quality level of products is higher.
Learning and Fitness Function
At any time, consumers adjust their environmentally conscious levels according to their genes. After each time interval r, consumers refer to each other, become aware of more profitable genes, and select a new gene. The fitness function of the i-th consumer’s gene is defined by Eq. 22.
U t u tci ci( ) = ( )∑ ρ (22)
This process to select genes within the consumer’s class is also written by genetic algorithms. The outline of consumer behavior is shown in Fig. 3.
Simulation Results of the Basic Model
Parameters and Initial ConditionsThe set of parameters used in the simulation are shown in Table 2. At the initial time t = 0, each consumer is given a random value of conscious level not exceed-ing sinit, and each firm is given a random value of quality level not exceeding qinit.
Fig. 3. Outline of consumer behavior
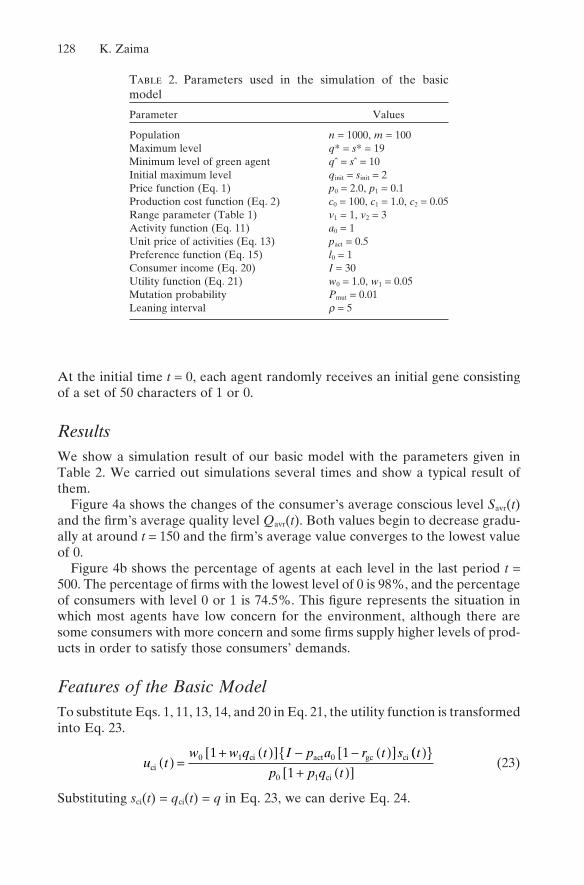
128 K. Zaima
At the initial time t = 0, each agent randomly receives an initial gene consisting of a set of 50 characters of 1 or 0.
ResultsWe show a simulation result of our basic model with the parameters given in Table 2. We carried out simulations several times and show a typical result of them.
Figure 4a shows the changes of the consumer’s average conscious level Savr(t)and the firm’s average quality level Qavr(t). Both values begin to decrease gradu-ally at around t = 150 and the firm’s average value converges to the lowest value of 0.
Figure 4b shows the percentage of agents at each level in the last period t =500. The percentage of firms with the lowest level of 0 is 98%, and the percentage of consumers with level 0 or 1 is 74.5%. This figure represents the situation in which most agents have low concern for the environment, although there are some consumers with more concern and some firms supply higher levels of prod-ucts in order to satisfy those consumers’ demands.
Features of the Basic ModelTo substitute Eqs. 1, 11, 13, 14, and 20 in Eq. 21, the utility function is transformed into Eq. 23.
u tw w q t I p a r t s t
cici act gc ci( ) =
+ ( )[ ] − − ( )[ ]0 1 01 1 (( ){ }+ ( )[ ]p p q t0 11 ci
(23)
Substituting sci(t) = qci(t) = q in Eq. 23, we can derive Eq. 24.
Table 2. Parameters used in the simulation of the basic model
Parameter Values
Population n = 1000, m = 100Maximum level q* = s* = 19Minimum level of green agent qˆ = sˆ = 10Initial maximum level qinit = sinit = 2Price function (Eq. 1) p0 = 2.0, p1 = 0.1Production cost function (Eq. 2) c0 = 100, c1 = 1.0, c2 = 0.05Range parameter (Table 1) v1 = 1, v2 = 3Activity function (Eq. 11) a0 = 1Unit price of activities (Eq. 13) pact = 0.5Preference function (Eq. 15) l0 = 1Consumer income (Eq. 20) I = 30Utility function (Eq. 21) w0 = 1.0, w1 = 0.05Mutation probability Pmut = 0.01Leaning interval r = 5
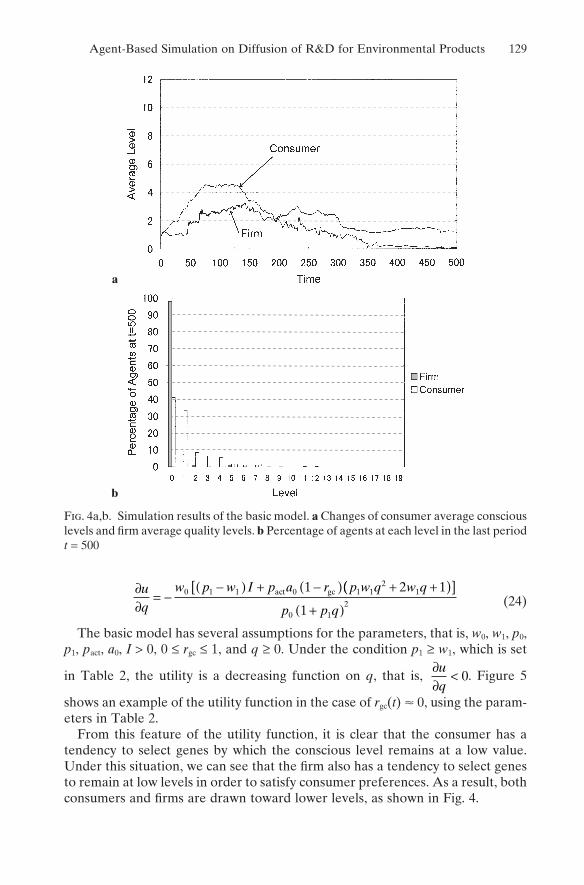
Agent-Based Simulation on Diffusion of R&D for Environmental Products 129
∂∂
= −−( ) + −( ) + +u
q
w p w I p a r p w q w q0 1 1 0 1 12
11 2 1act gc (( )[ ]+( )p p q0 1
21
(24)
The basic model has several assumptions for the parameters, that is, w0, w1, p0,p1, pact, a0, I > 0, 0 ≤ rgc ≤ 1, and q ≥ 0. Under the condition p1 ≥ w1, which is set
in Table 2, the utility is a decreasing function on q, that is, ∂∂
<uq
0. Figure 5
shows an example of the utility function in the case of rgc(t) � 0, using the param-eters in Table 2.
From this feature of the utility function, it is clear that the consumer has a tendency to select genes by which the conscious level remains at a low value. Under this situation, we can see that the firm also has a tendency to select genes to remain at low levels in order to satisfy consumer preferences. As a result, both consumers and firms are drawn toward lower levels, as shown in Fig. 4.
Fig. 4a,b. Simulation results of the basic model. a Changes of consumer average conscious levels and firm average quality levels. b Percentage of agents at each level in the last period t = 500
a
b
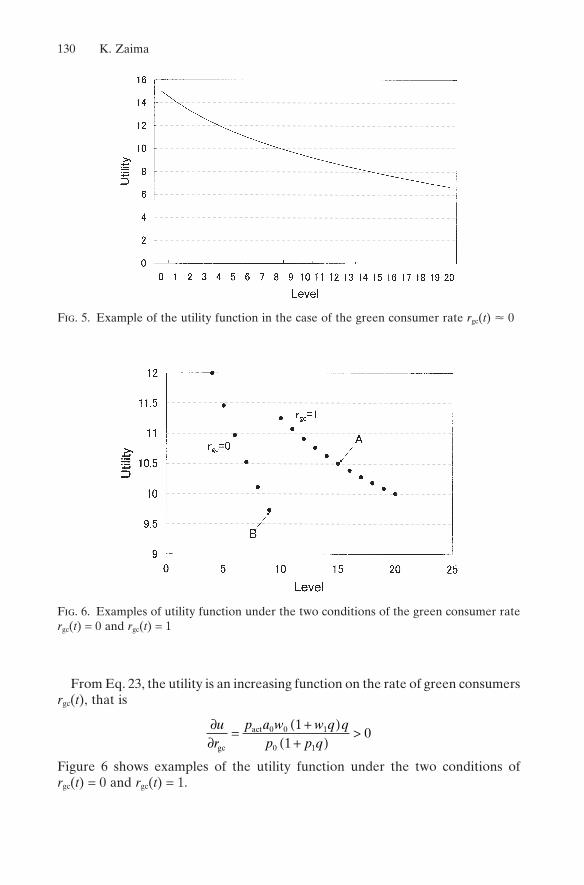
130 K. Zaima
From Eq. 23, the utility is an increasing function on the rate of green consumers rgc(t), that is
∂∂
= +( )+( )
>ur
p a w w q qp p qgc
act 0 0 1
0 1
11
0
Figure 6 shows examples of the utility function under the two conditions of rgc(t) = 0 and rgc(t) = 1.
Fig. 5. Example of the utility function in the case of the green consumer rate rgc(t) � 0
Fig. 6. Examples of utility function under the two conditions of the green consumer rate rgc(t) = 0 and rgc(t) = 1
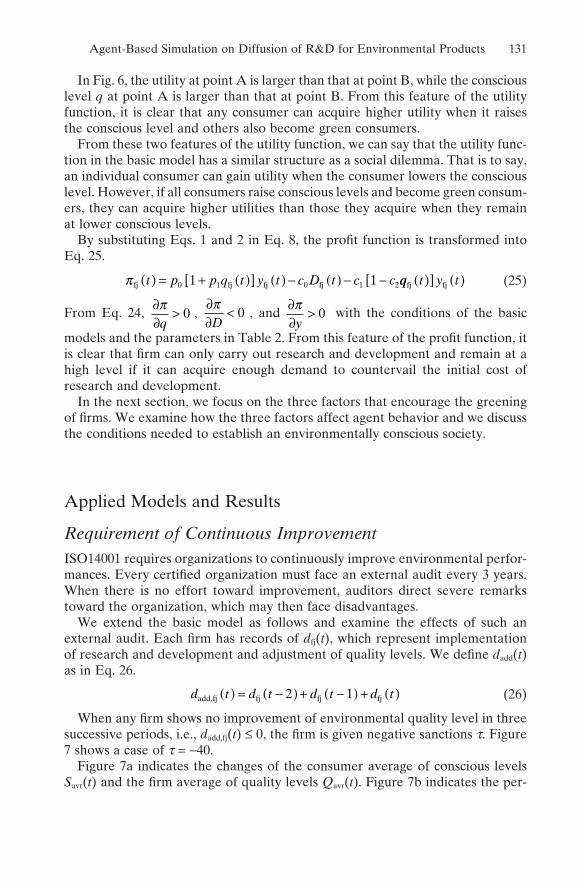
Agent-Based Simulation on Diffusion of R&D for Environmental Products 131
In Fig. 6, the utility at point A is larger than that at point B, while the conscious level q at point A is larger than that at point B. From this feature of the utility function, it is clear that any consumer can acquire higher utility when it raises the conscious level and others also become green consumers.
From these two features of the utility function, we can say that the utility func-tion in the basic model has a similar structure as a social dilemma. That is to say, an individual consumer can gain utility when the consumer lowers the conscious level. However, if all consumers raise conscious levels and become green consum-ers, they can acquire higher utilities than those they acquire when they remain at lower conscious levels.
By substituting Eqs. 1 and 2 in Eq. 8, the profit function is transformed into Eq. 25.
π fj fj fj fjt p p q t y t c D t c c( ) = + ( )[ ] ( ) − ( ) − −0 1 0 1 21 1 qq t y tfj fj( )[ ] ( ) (25)
From Eq. 24, ∂∂
>πq
0 ,∂∂
<πD
0 , and ∂∂
>πy
0 with the conditions of the basic
models and the parameters in Table 2. From this feature of the profit function, it is clear that firm can only carry out research and development and remain at a high level if it can acquire enough demand to countervail the initial cost of research and development.
In the next section, we focus on the three factors that encourage the greening of firms. We examine how the three factors affect agent behavior and we discuss the conditions needed to establish an environmentally conscious society.
Applied Models and Results
Requirement of Continuous ImprovementISO14001 requires organizations to continuously improve environmental perfor-mances. Every certified organization must face an external audit every 3 years. When there is no effort toward improvement, auditors direct severe remarks toward the organization, which may then face disadvantages.
We extend the basic model as follows and examine the effects of such an external audit. Each firm has records of dfj(t), which represent implementation of research and development and adjustment of quality levels. We define dadd(t)as in Eq. 26.
d t d t d t d tadd,fj fj fj fj( ) = −( ) + −( ) + ( )2 1 (26)
When any firm shows no improvement of environmental quality level in three successive periods, i.e., dadd,fj(t) ≤ 0, the firm is given negative sanctions t. Figure 7 shows a case of t = −40.
Figure 7a indicates the changes of the consumer average of conscious levels Savr(t) and the firm average of quality levels Qavr(t). Figure 7b indicates the per-

132 K. Zaima
centage of agents of each level at t = 500. The firm average Qavr(t) increases gradually and remains at around level 4. The consumer average Savr(t) declines gradually but levels out around 4 from the time of t = 300. The percentage of firms at the highest level at t = 500 is larger when compared with the data of Fig. 4b. Figure 7b explains that there exist some firms that improve their environ-mental qualities in order to avoid negative sanctions. However, most consumers stay at the lowest level and therefore many firms remain at the lowest level and acquire enough profits in spite of negative sanctions.
We see that the requirement for continuous improvement has a certain effect on the progress of research and development for environmentally upgraded products, but that the effect is limited because consumer behavior is not affected by the requirement.
Fig. 7a,b. Simulation results of requirement for continuous improvement. a Changes of consumer average conscious levels and firm average quality levels. b Percentage of agents at each level in the last period t = 500
a
b
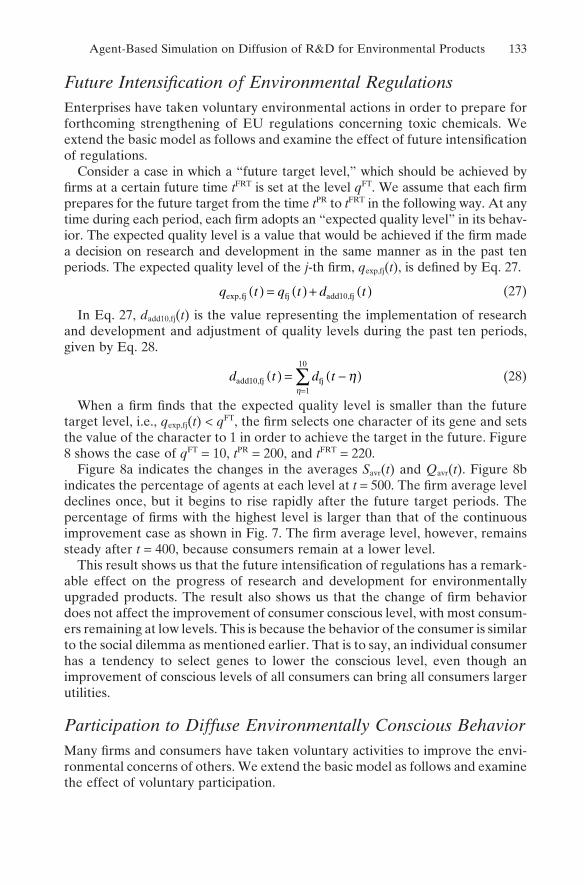
Agent-Based Simulation on Diffusion of R&D for Environmental Products 133
Future Intensification of Environmental RegulationsEnterprises have taken voluntary environmental actions in order to prepare for forthcoming strengthening of EU regulations concerning toxic chemicals. We extend the basic model as follows and examine the effect of future intensificationof regulations.
Consider a case in which a “future target level,” which should be achieved by firms at a certain future time tFRT is set at the level qFT. We assume that each firm prepares for the future target from the time tPR to tFRT in the following way. At any time during each period, each firm adopts an “expected quality level” in its behav-ior. The expected quality level is a value that would be achieved if the firm made a decision on research and development in the same manner as in the past ten periods. The expected quality level of the j-th firm, qexp,fj(t), is defined by Eq. 27.
q t q t d texp,fj fj add10,fj( ) = ( ) + ( ) (27)
In Eq. 27, dadd10,fj(t) is the value representing the implementation of research and development and adjustment of quality levels during the past ten periods, given by Eq. 28.
d t d tadd10,fj fj( ) = −( )=
∑ ηη 1
10
(28)
When a firm finds that the expected quality level is smaller than the future target level, i.e., qexp,fj(t) < qFT, the firm selects one character of its gene and sets the value of the character to 1 in order to achieve the target in the future. Figure 8 shows the case of qFT = 10, tPR = 200, and tFRT = 220.
Figure 8a indicates the changes in the averages Savr(t) and Qavr(t). Figure 8b indicates the percentage of agents at each level at t = 500. The firm average level declines once, but it begins to rise rapidly after the future target periods. The percentage of firms with the highest level is larger than that of the continuous improvement case as shown in Fig. 7. The firm average level, however, remains steady after t = 400, because consumers remain at a lower level.
This result shows us that the future intensification of regulations has a remark-able effect on the progress of research and development for environmentally upgraded products. The result also shows us that the change of firm behavior does not affect the improvement of consumer conscious level, with most consum-ers remaining at low levels. This is because the behavior of the consumer is similar to the social dilemma as mentioned earlier. That is to say, an individual consumer has a tendency to select genes to lower the conscious level, even though an improvement of conscious levels of all consumers can bring all consumers larger utilities.
Participation to Diffuse Environmentally Conscious BehaviorMany firms and consumers have taken voluntary activities to improve the envi-ronmental concerns of others. We extend the basic model as follows and examine the effect of voluntary participation.
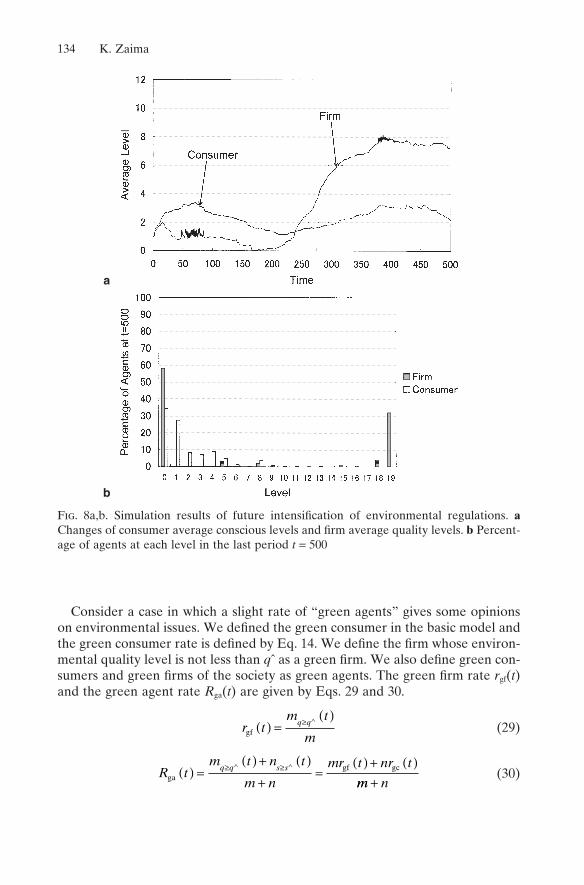
134 K. Zaima
Consider a case in which a slight rate of “green agents” gives some opinions on environmental issues. We defined the green consumer in the basic model and the green consumer rate is defined by Eq. 14. We define the firm whose environ-mental quality level is not less than qˆ as a green firm. We also define green con-sumers and green firms of the society as green agents. The green firm rate rgf(t)and the green agent rate Rga(t) are given by Eqs. 29 and 30.
r tm t
mq q
gf ( ) =( )≥ ∧
(29)
R tm t n t
m n
mr t nr tq q s sga
gf gc( ) =( ) + ( )
+=
( ) + ( )≥ ≥∧ ∧
mm n+(30)
Fig. 8a,b. Simulation results of future intensification of environmental regulations. aChanges of consumer average conscious levels and firm average quality levels. b Percent-age of agents at each level in the last period t = 500
a
b
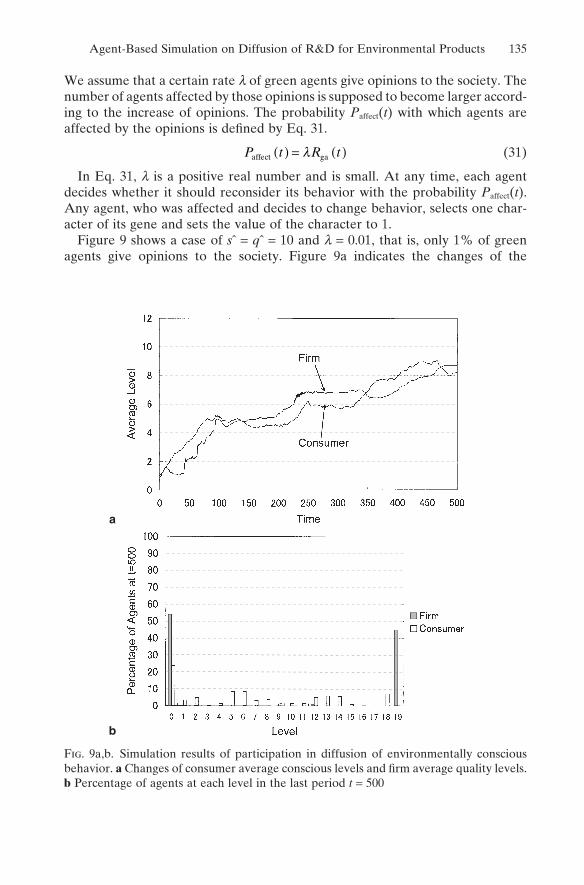
Agent-Based Simulation on Diffusion of R&D for Environmental Products 135
We assume that a certain rate l of green agents give opinions to the society. The number of agents affected by those opinions is supposed to become larger accord-ing to the increase of opinions. The probability Paffect(t) with which agents are affected by the opinions is defined by Eq. 31.
P t R taffect ga( ) = ( )λ (31)
In Eq. 31, l is a positive real number and is small. At any time, each agent decides whether it should reconsider its behavior with the probability Paffect(t).Any agent, who was affected and decides to change behavior, selects one char-acter of its gene and sets the value of the character to 1.
Figure 9 shows a case of sˆ = qˆ = 10 and l = 0.01, that is, only 1% of green agents give opinions to the society. Figure 9a indicates the changes of the
Fig. 9a,b. Simulation results of participation in diffusion of environmentally conscious behavior. a Changes of consumer average conscious levels and firm average quality levels. b Percentage of agents at each level in the last period t = 500
a
b
136 K. Zaima
averages Savr(t) and Qavr(t). Figure 9b indicates the percentage of agents at each level at t = 500.
In Fig. 9a, both consumers and firms change levels gradually and the average levels of both agents reach the higher levels, compared with the other two cases shown in Figs. 7a and 8a. This result shows us that the voluntary participation of agents has a significant effect on the diffusion of environmentally conscious behavior. Compared with the result of the future target case, in this participation case, the opinions of others affect the behaviors of not only firms but also con-sumers. The result of this analysis shows that it is important to affect consumer behavior having properties of social dilemma. From this point of view, we can reason that pressure to affect all types of agents in the society is significant in establishing an environmentally conscious society.
Conceptual Model for Gaming Simulation
We suggest a conceptual model of gaming simulation as the real world grounding of our agent-based models. From some properties of the simulation results of our agent-based models, we can suggest the following gaming simulation.
Consider a society consisting of two groups, called “group A” and “group B.” There are two kinds of action that each agent can select. One is an action of environmental conservation, called “green.” The other action is to do nothing for the environment and is called “normal.” The profit function of each agent in group A has properties of social dilemma. The profit function of each agent in group B depends on the agents’ choices of group A.
We suggest that experiments be performed to impose negative sanctions on normal agents or positive sanctions on green agents. The tests of sanctions should be carried out independently on group A and group B, and on both groups together. We will examine which case induces the greening of both groups’ agents.
We also suggest that experiments be conducted concerning voluntary partici-pation to change the behavior of others. A few agents who persuade others to participate in either green or normal activities are introduced in the society. Each agent should be permitted to decide whether the agent participates in the activity. Tests can be carried out in several cases with the conditions of groups and actions. We can examine what conditions bring about the changes of agents’ behavior. We design and develop the gaming simulation under this conceptual model in another study.
Conclusion
In this chapter, we investigated the effects of three factors to push corporate greening forward. We developed agent-based models and acquire the following three results.
Agent-Based Simulation on Diffusion of R&D for Environmental Products 137
First, the requirement for continuous improvement of ISO14001 has an effect on the progress of research and development of firms for environmentally upgraded products, but the effect is limited because consumer behavior is not affected by the requirement.
Secondly, the future intensification of regulations has a remarkable effect on firm behavior, but does not affect consumer behavior.
Thirdly, the voluntary participation of agents has a significant effect on the progress of research and development and the diffusion of environmentally con-scious behavior, because it affects not only firm behavior but also consumer behavior.
The main reason for these results is that consumer behavior has the properties of social dilemma. That is to say, an individual consumer chooses a certain behav-ior to lower the consciousness in order to gain utility, although all consumers can acquire larger utility according to the improvement of overall consciousness for the environment.
It is said that environmental problems have aspects of social dilemma. From the results of this study, we can conclude that a pressure that affects all agents in the society is significant in countervailing the properties of social dilemma and establishing an environmentally conscious society.
The roles of information policies, such as environmental labeling, on environ-mentally conscious behavior were investigated by Zaima [2] who showed that information policies alone were not enough to heighten agent concern in society. The study insisted that agent participation to diffuse environmental information had an important role. We can say that the results of this chapter support the previous results of Zaima [2].
In this chapter, we also suggested a conceptual model of gaming simulation as the real-world grounding of our agent-based models. The concept model involves two groups. The profit function of one group has a social dilemma structure and affects the profits of agents in the other group. We can investigate the conditions to change the behavior of both groups.
Topics of further research include the design and construction of a gaming simulation, as suggested in this chapter, and the extension of our model in order to clearly describe social dilemma problems. One way of achieving the extension is to introduce a macro index to represent the quality level of the environment of the society. We can also introduce a macroeconomic index of the society. In an extended model, agents take both macro indexes into account in adjusting their action. We can examine what conditions improve both the environment and the economy.
A third topic of further research is the extension of our model in order to clearly describe transactions between firms and consumers. In the model described in this chapter, the price function is given and depends on the environmental quality of products. One way of achieving the extension is to introduce auctions between firms and consumers.
Acknowledgment. The author thanks Prof. Hiroshi Deguchi for helpful com-ments on an earlier draft of this chapter.

138 K. Zaima
References1. Steger U (1993) Umweltmanagement—Erfahrungen und Instrumente einer umwelto-
rientierten Unternehmensstrategie. Frankfuter Allgemeine Zeitung GmbH2. Zaima K (2000) A poly-agent system analysis on the evolution of environmentally
sound behavior; the role of information provision and the spillover effect of knowledge. Proceedings of Collaboration and Creativity for the 21st Century in the Asia-Pacific,Asia-Pacific Region of Decision Science Institute, Paper No. P-171

139
Evaluation of the Dealings Form in an Artificial Fruit and Vegetable Market IISuguru Tsujioka1 and Kohji Yamamoto2
Introduction
In recent years, development of information technology including the Internet, has meant that dealing forms in markets of various industries have changed sig-nificantly. This is also the case in fruit and vegetable markets, which are the topic of this research.
Dealing in fruit and vegetable markets, in the traditional auction form has been decreasing, and one to one trade has been increasing. In this research, we con-structed an artificial fruit and vegetable market, and evaluated the influence of dealings in forming a market price composition process.
Predicting the future of a market requires analysis of each feature of the auction process and one to one trade, and their intermingled dealing. The artificialmarket model constructed in this research can be used as a useful tool for solving these subjects.
Fruit and Vegetable Market
Circulation and forms of dealing in the fruit and vegetable markets in Japan are changing quickly. Therefore, analysis of the price formation mechanism of the current market and prediction of change in future market mechanisms are desirable. However, the market has two dealing styles and these dealings exist at different rates every day. Moreover, the interval of dealings is irregular in the market. There-fore, it is hard to see correlation of the amount of production and shipment.
They are reasons why the analysis of a price formation mechanism is very dif-ficult. From the viewpoint of modeling of market structure and prediction, fruit and vegetable markets have not attracted as much attention as the financialmarket, the money order market, and so on.
1Shikoku University, 123-1 Furukawa Ojin-cho, Tokushima 771-1192, Japan. e-mail: [email protected] University, 123-1 Furukawa Ojin-cho, Tokushima 771-1192, Japan. e-mail: [email protected]
140 S. Tsujioka and K. Yamamoto
As one proposal to solve the above difficulties, we constructed an artificialmarket model constituted by agents who anticipate a market price from factors such as amount of production by using the fundamental data of temperature and precipitation. This succeeded in prediction of the market trend for a fruit and vegetable market [1].
Dealing Forms
In a fruit and vegetable market, there are three types of dealing. These are:
Auction: The method of selling by a wholesaler to many purchase participants. The purchase participant who presents the highest value can buy the items. Usually, the purchase price is below an own price of hope. (It is called a firstprice auction).
Direct dealing: The method that determines the market price individually between a wholesaler and a purchase participant. This dealing form is usually conducted before an auction, so determination of the market price is difficult. However, it is an only dealings form which the wholesaler can affect to a sale price. Moreover, a wholesaler can have many sale opportunities, if the sale price is low enough.
Early dealing: The method that conducts the dealing contract before auction time. Generally, the selling price is equal to the maximum price of an auction on the day. A purchase participant can buy the produce, although, it includes the dif-ficulty that the purchase price becomes higher.
Features of the Presentation Model
The artificial fruit and vegetable market in our model consists of 100 selling agents corresponding to wholesalers in the real world, and 100 buyer agents cor-responding to purchase participants in the real world.
The selling agent only sells and the buyer agent only buys. These agents perform a strategy determination step, an early step, a direct dealings step, an auction step, and a study step in order in every processing period corresponding to 1 day in the real world (Fig. 1).
We describe the processing of each step later in this chapter.
Strategy Determination Step
Each agent has a ranked importance of trading conditions, such as a market trend and particular restrictions or conditions. A dealing strategy is determined based on these conditions. They are listed as:
Total Amount of Supply
The buyer agent knows the total amount of items dealt with in each period. The information is defined as Ms(t).
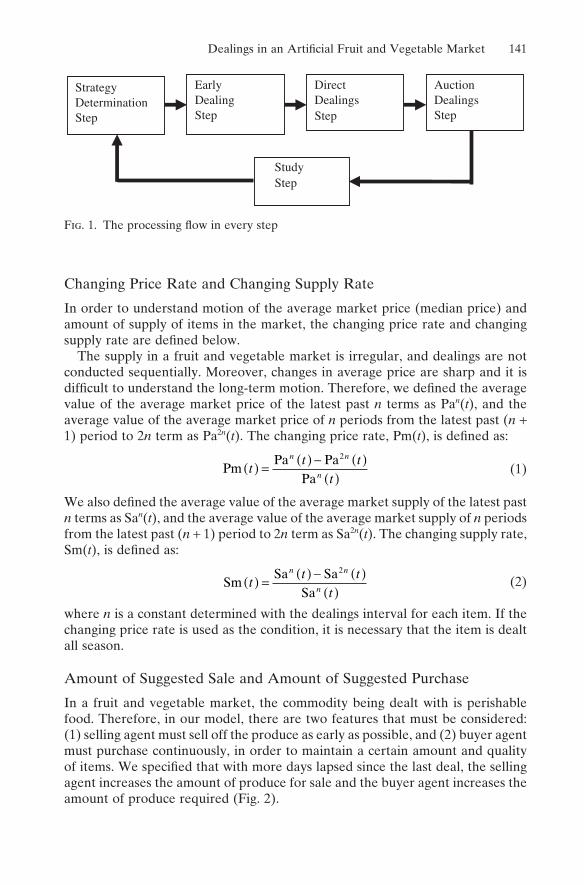
Dealings in an Artificial Fruit and Vegetable Market 141
Changing Price Rate and Changing Supply Rate
In order to understand motion of the average market price (median price) and amount of supply of items in the market, the changing price rate and changing supply rate are defined below.
The supply in a fruit and vegetable market is irregular, and dealings are not conducted sequentially. Moreover, changes in average price are sharp and it is difficult to understand the long-term motion. Therefore, we defined the average value of the average market price of the latest past n terms as Pan(t), and the average value of the average market price of n periods from the latest past (n +1) period to 2n term as Pa2n(t). The changing price rate, Pm(t), is defined as:
PmPa Pa
Pat
t tt
n n
n( ) =
( ) − ( )( )
2
(1)
We also defined the average value of the average market supply of the latest past n terms as San(t), and the average value of the average market supply of n periodsfrom the latest past (n + 1) period to 2n term as Sa2n(t). The changing supply rate, Sm(t), is defined as:
SmSa Sa
Sat
t tt
n n
n( ) =
( ) − ( )( )
2
(2)
where n is a constant determined with the dealings interval for each item. If the changing price rate is used as the condition, it is necessary that the item is dealt all season.
Amount of Suggested Sale and Amount of Suggested Purchase
In a fruit and vegetable market, the commodity being dealt with is perishable food. Therefore, in our model, there are two features that must be considered: (1) selling agent must sell off the produce as early as possible, and (2) buyer agent must purchase continuously, in order to maintain a certain amount and quality of items. We specified that with more days lapsed since the last deal, the selling agent increases the amount of produce for sale and the buyer agent increases the amount of produce required (Fig. 2).
StudyStep
StrategyDeterminationStep
EarlyDealingStep
DirectDealingsStep
AuctionDealingsStep
Fig. 1. The processing flow in every step
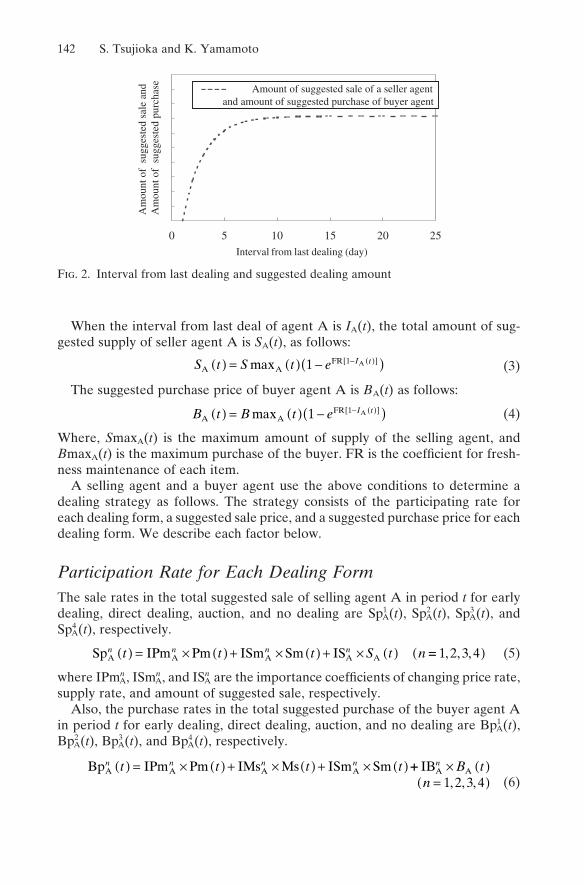
142 S. Tsujioka and K. Yamamoto
When the interval from last deal of agent A is IA(t), the total amount of sug-gested supply of seller agent A is SA(t), as follows:
S t S t e I tA A
FR A( ) = ( ) −( )− ( )[ ]max 1 1 (3)
The suggested purchase price of buyer agent A is BA(t) as follows:
B t B t e I tA A
FR A( ) = ( ) −( )− ( )[ ]max 1 1 (4)
Where, SmaxA(t) is the maximum amount of supply of the selling agent, and BmaxA(t) is the maximum purchase of the buyer. FR is the coefficient for fresh-ness maintenance of each item.
A selling agent and a buyer agent use the above conditions to determine a dealing strategy as follows. The strategy consists of the participating rate for each dealing form, a suggested sale price, and a suggested purchase price for each dealing form. We describe each factor below.
Participation Rate for Each Dealing FormThe sale rates in the total suggested sale of selling agent A in period t for early dealing, direct dealing, auction, and no dealing are Sp1
A(t), Sp2A(t), Sp3
A(t), and Sp4
A(t), respectively.
Sp IPm Pm ISm Sm ISA A A A An n n nt t t S t n( ) = × ( ) + × ( ) + × ( ) ==( )1 2 3 4, , , (5)
where IPmnA, ISmn
A, and ISnA are the importance coefficients of changing price rate,
supply rate, and amount of suggested sale, respectively.Also, the purchase rates in the total suggested purchase of the buyer agent A
in period t for early dealing, direct dealing, auction, and no dealing are Bp1A(t),
Bp2A(t), Bp3
A(t), and Bp4A(t), respectively.
Bp IPm Pm IMs Ms ISm SmA A A An n n nt t t t( ) = × ( ) + × ( ) + × ( ) ++ × ( )
=( )IBA A
n B tn 1 2 3 4, , , (6)
0 5 10 15 20 25
Interval from last dealing (day)
Am
ount
of
sug
gest
ed s
ale
and
Am
ount
of
sug
gest
ed p
urch
ase
Amount of suggested sale of a seller agentand amount of suggested purchase of buyer agent
Fig. 2. Interval from last dealing and suggested dealing amount

Dealings in an Artificial Fruit and Vegetable Market 143
where, IBnA, IMsn
A are the importance coefficient of amount of suggested purchase, and total amount of supply, respectively.
The amounts of suggested sales of selling agent A in period t for early dealing, direct dealing, and auction are Sv1
A(t), Sv3A(t), and Sv3
A(t), respectively.
SvSp
SpA
A
A
An
n
i
i
tt
tS t n( ) =
( )
( )× ( ) = ( )
=∑
1
41 2 3, , (7)
The amounts of suggested purchases of buyer agent A in period t for early dealing, direct dealing, and auction are Bv1
A(t), Bv2A(t), and Bv3
A(t), respectively.
BvBp
BpA
A
A
An
n
i
i
tt
t
B t n( ) =( )
( )× ( ) = ( )
=∑
1
41 2 3, , (8)
Suggested Dealing PriceThe suggested prices of sales of selling agent A in period t for early dealing, direct dealing, and auction are Sy1
A(t), Sy2A(t), and Sy3
A(t), respectively.
Sy IPm Pm ISm Sm ISA A A A An n n nt t t S t( ) = × ( ) + × ( ) + × ( ) + IISv Sv PBA A
n n tn
× ( )[ ] ×=( )1 2 3, , (9)
where, ISvnA is the importance of the suggested amount of sale. PB is the base
price for each item.The suggested prices of purchases of buyer agent A in period t for early dealing,
direct dealing, and auction are By1A(t), By2
A(t), and By3A(t), respectively.
By IPm Pm IMs Ms ISm SmA A A An n n nt t t t( ) = × ( ) + × ( ) + × ( ) ++ ×[
+ × ( )]× =( )IS
IBv Bv PBA A
A A
n
n n
S tt n
( ), ,1 2 3 (10)
where IBvnA, is the importance of the suggested amount of purchase.
Early Dealing Step
The procedures in the early dealing step are described below. Hereinafter, the suggested amount and suggestion price are expressed in only each dealing form.
1. Each selling agent shows their suggested amount of sale. A meeting occurs with a randomized buyer agent and they deal. The amount of the deal is the lesser of the suggested price of sale and the suggested price of purchase.
2. The selling agents who have not completed the suggested amount of sale, and the buyer agents group who have not filled the suggested amount of purchase repeat step 1.

144 S. Tsujioka and K. Yamamoto
3. When either all selling agents or all buyer agents fill the suggested amount of dealings, the early dealings step is ended. The dealings price is the highest value of the auction dealings step in the same period.
Direct Dealing Step
The procedures in the direct dealing step are described below.
1. Each agent shows their suggested dealing price.2. The selling agent who shows the cheapest suggested sale price and the buyer
agent who shows the highest suggested purchase price deal. The dealing price is the suggested price of the selling agent. The amount of the deal is the lesser of the suggested price of sale and the suggested price of purchase.
3. The agents who have not filled the suggested amount of dealing repeat step 2.4. A dealing step is ended when the cheapest suggested sale price exceeds the
highest suggested purchase price.
Auction Dealings Step
As described above, the auction in fruit and vegetable markets is a first price auction. Therefore, the buyer agent can deal only when its suggested purchase price is the highest in the current deal. The procedures in the step are described below.
1. A selling agent shows the suggested sale price.2. Candidate dealing price is increment of ¥1.3. Step 2 is repeated until there is only one buyer agent who has a suggested
purchase price higher than the sale candidate price.4. The buyer agent chosen in step 3 deals with a candidate sale price. The amount
of the deal is the suggested amount of sale by the selling agent.5. Steps 1–4 are repeated until all selling agents fill their suggested amounts of
sale or all buyer agents filled their suggested amounts of purchase.
Study Step
At the end of each period, each agent studies its dealing strategy (Eqs. 5, 6, 9, 10). This study method is evolutionary. The detail is described below.
SelectionFirst, some indexes as follows are defined for calculating the degree of adaptation from the current dealing result.
The rate of filled suggested sale of selling agent A is SsA(t) as follows:
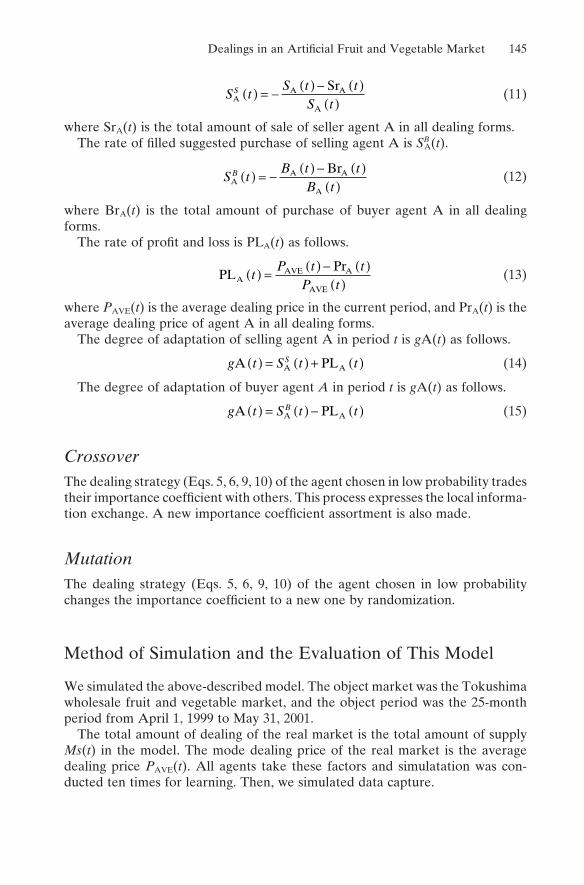
Dealings in an Artificial Fruit and Vegetable Market 145
S tS t t
S tSA
A A
A
Sr( ) = −( ) − ( )
( )(11)
where SrA(t) is the total amount of sale of seller agent A in all dealing forms.The rate of filled suggested purchase of selling agent A is SB
A(t).
S tB t t
B tBA
A A
A
Br( ) = −( ) − ( )
( )(12)
where BrA(t) is the total amount of purchase of buyer agent A in all dealing forms.
The rate of profit and loss is PLA(t) as follows.
PLAAVE A
AVE
tP t t
P t( ) =
( ) − ( )( )Pr
(13)
where PAVE(t) is the average dealing price in the current period, and PrA(t) is the average dealing price of agent A in all dealing forms.
The degree of adaptation of selling agent A in period t is gA(t) as follows.
g t S t tSA PLA A( ) = ( ) + ( ) (14)
The degree of adaptation of buyer agent A in period t is gA(t) as follows.
g t S t tBA PLA A( ) = ( ) − ( ) (15)
CrossoverThe dealing strategy (Eqs. 5, 6, 9, 10) of the agent chosen in low probability trades their importance coefficient with others. This process expresses the local informa-tion exchange. A new importance coefficient assortment is also made.
MutationThe dealing strategy (Eqs. 5, 6, 9, 10) of the agent chosen in low probability changes the importance coefficient to a new one by randomization.
Method of Simulation and the Evaluation of This Model
We simulated the above-described model. The object market was the Tokushima wholesale fruit and vegetable market, and the object period was the 25-month period from April 1, 1999 to May 31, 2001.
The total amount of dealing of the real market is the total amount of supply Ms(t) in the model. The mode dealing price of the real market is the average dealing price PAVE(t). All agents take these factors and simulatation was con-ducted ten times for learning. Then, we simulated data capture.
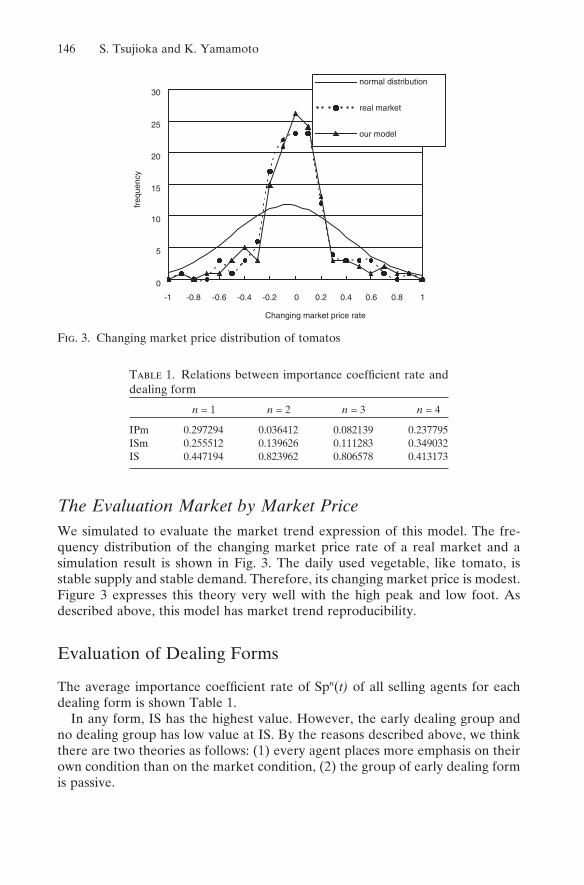
146 S. Tsujioka and K. Yamamoto
The Evaluation Market by Market PriceWe simulated to evaluate the market trend expression of this model. The fre-quency distribution of the changing market price rate of a real market and a simulation result is shown in Fig. 3. The daily used vegetable, like tomato, is stable supply and stable demand. Therefore, its changing market price is modest. Figure 3 expresses this theory very well with the high peak and low foot. As described above, this model has market trend reproducibility.
Evaluation of Dealing Forms
The average importance coefficient rate of Spn(t) of all selling agents for each dealing form is shown Table 1.
In any form, IS has the highest value. However, the early dealing group and no dealing group has low value at IS. By the reasons described above, we think there are two theories as follows: (1) every agent places more emphasis on their own condition than on the market condition, (2) the group of early dealing form is passive.
0
5
10
15
20
25
30
-1 -0.8 -0.6 -0.4 -0.2 0 0.2 0.4 0.6 0.8 1
Changing market price rate
freq
uenc
y
normal distribution
real market
our model
Fig. 3. Changing market price distribution of tomatos
Table 1. Relations between importance coefficient rate and dealing form
n = 1 n = 2 n = 3 n = 4
IPm 0.297294 0.036412 0.082139 0.237795ISm 0.255512 0.139626 0.111283 0.349032IS 0.447194 0.823962 0.806578 0.413173
Dealings in an Artificial Fruit and Vegetable Market 147
Theory (1) is why that own condition is change small and it is reliable. And, theory (2) is why that the group of early dealing form is not only play down own condition but also emphasis on market condition.
Conclusions
In this chapter, we constructed an artificial market for a fruit and vegetable market having multiple dealing forms. We have shown the influence of the dealing forms on the market price composition process. It is expected that our model is useful for forecasting market processes.
Reference1. Tsujioka S, Yamamoto K (2002) Construction and evaluation artificial market for
vegetables and fruits by fundamentalist agent. JASAG, Kyoto, pp 32–37
149
Index
CGI 51, 60Chiba Institute of Technology 27Christensen 101, 102cognitive science 24Cohen 40Cold War 2collusive tendering (CT) 89, 91, 93, 94,
96, 98–100colored Petri nets (CPN) 39, 42complex system 2corporate social responsibility 119
ee-learning 4environment management gaming 4, 9,
11Europe 2European Union (EU) 119, 120,
133
ffinancial market 23, 24, 26fruit and vegetable market 139–141, 145,
147functional cheating 99
ggaming simulation (GS) 1–8, 10–13,
15–21, 27, 29, 31, 38, 52, 59, 60, 69, 70, 77, 120, 136, 137
Gamson, William 3garbage can model (GCM) 39–43garbage can simulator 39genetic algorithm (GA) 55, 90, 91, 93,
127
aadaptive memory-based reasoning
(AMBR) 84, 86, 87Adner 103, 116agent-based modeling (ABM) 1–4, 9–13,
21, 69, 75, 77agent-based simulation (ABS) 1, 2, 6–8,
23, 103agent-based social simulation 43Alexander Islands 50Anderson 102artificial fruit and vegetable market 139,
140artificial futures market 24artificial intelligence (AI) 11, 24, 31–38, 50artificial markets 23–25Authoritarianism 17, 18Axelrod 89Axelrod, R. 2
bBarnga 70, 77beer game 3Brookings Institution 2business administration 3business and social gaming 4business game 3, 11, 49, 66business gaming simulation 59business model description language
(BMDL) 50, 51, 59, 60business model development system
(BMDS) 50–52, 59, 60business simulation 49, 50
cC language 51, 60CDC 101
150 Index
graphical-user interfaces (GUIs) 27Greenpeace 120
hHardin, Garrett 4Hauser 99Heinrich’s law 61Henderson 102HTML 52, 60hybrid gaming 11hybrid-gaming simulation 31, 32, 34,
36–38Hybrid GS 9, 12hybrid multiagent systems 3
iIllinois Genetic Algorithms Laboratory
52Information Processing Society of Japan
26intentional cheating 99international relations 2, 12Internet 24, 139ISAGA 4, 26ISO14001 119, 131, 137
jJ30 24Japan Association for Evolutionary
Economics 26Java 25
kkaizen 61, 62, 65KISS principle 2Klabbers, H. G. 4
llocal area network (LAN) 24
mMainichi Shimbun J30 24March 39market economy 23massively multiplayer online game
(MMOG) 79, 80Matsushita Electric Industrial Co.
Ltd. 120
memory-based reasoning (MBR) 84multiagent simulation 89
nNAACSOS 26natural science 15–17Nault 103Nelson–Winter model 31Netherlands 120
oorganization and cognitive science 12organized anarchy 39Osaka Sangyo University 27, 28
pPerl language 51, 60PlayStation 120policy science 2, 3, 12
rRand Corporation 2research and development (R&D) 31, 32,
34–36, 38, 119, 121, 131–133, 137risk communication 2, 3Ritsumeikan University 2, 3RoHS 119role-playing games 69Roulette selection 33
sSchumpeter hypothesis 31Seagate 101Seki 2, 12Shimadzu Corporation 120Simon 40Simsoc 3, 20simulation games 49SOARS 9social dilemma 5, 131, 136, 137social science 16, 25, 27socioeconomic systems 1, 24Sony Corporation 120Sozionik’s project 43
ttragedy of the commons 4Tsukuba University 59Tushman 102

Index 151
uUltima Online 11U-Mart 23–29UMIE 26University of Shizuoka 34University of Tsukuba 49UNIX 52USA 2
vVandenbosch 103
wWEEE 119Windows 25World Wide Web (WWW) 50, 52,
59, 60
xXCS 52–54
zZaima 137Zereal 80, 86