The ties that do not bind: party affiliations and the delivery of devolved health services in the...
19
This article was downloaded by: [T&F Internal Users], [Mr Susan Cullen] On: 24 May 2012, At: 11:47 Publisher: Routledge Informa Ltd Registered in England and Wales Registered Number: 1072954 Registered office: Mortimer House, 37-41 Mortimer Street, London W1T 3JH, UK Philippine Political Science Journal Publication details, including instructions for authors and subscription information: http://www.tandfonline.com/loi/rpsj20 The ties that do not bind: party affiliations and the delivery of devolved health services in the Philippines Joseph J. Capuno a & Marian Panganiban a a University of the Philippines, School of Economics, Diliman, Quezon City, Philippines Available online: 24 May 2012 To cite this article: Joseph J. Capuno & Marian Panganiban (2012): The ties that do not bind: party affiliations and the delivery of devolved health services in the Philippines, Philippine Political Science Journal, 33:1, 63-80 To link to this article: http://dx.doi.org/10.1080/01154451.2012.684517 PLEASE SCROLL DOWN FOR ARTICLE Full terms and conditions of use: http://www.tandfonline.com/page/terms-and-conditions This article may be used for research, teaching, and private study purposes. Any substantial or systematic reproduction, redistribution, reselling, loan, sub-licensing, systematic supply, or distribution in any form to anyone is expressly forbidden. The publisher does not give any warranty express or implied or make any representation that the contents will be complete or accurate or up to date. The accuracy of any instructions, formulae, and drug doses should be independently verified with primary sources. The publisher shall not be liable for any loss, actions, claims, proceedings, demand, or costs or damages whatsoever or howsoever caused arising directly or indirectly in connection with or arising out of the use of this material.
-
Upload
independent -
Category
Documents
-
view
1 -
download
0
Transcript of The ties that do not bind: party affiliations and the delivery of devolved health services in the...
This article was downloaded by: [T&F Internal Users], [Mr Susan Cullen]On: 24 May 2012, At: 11:47Publisher: RoutledgeInforma Ltd Registered in England and Wales Registered Number: 1072954 Registeredoffice: Mortimer House, 37-41 Mortimer Street, London W1T 3JH, UK
Philippine Political Science JournalPublication details, including instructions for authors andsubscription information:http://www.tandfonline.com/loi/rpsj20
The ties that do not bind: partyaffiliations and the delivery of devolvedhealth services in the PhilippinesJoseph J. Capuno a & Marian Panganiban aa University of the Philippines, School of Economics, Diliman,Quezon City, Philippines
Available online: 24 May 2012
To cite this article: Joseph J. Capuno & Marian Panganiban (2012): The ties that do not bind: partyaffiliations and the delivery of devolved health services in the Philippines, Philippine PoliticalScience Journal, 33:1, 63-80
To link to this article: http://dx.doi.org/10.1080/01154451.2012.684517
PLEASE SCROLL DOWN FOR ARTICLE
Full terms and conditions of use: http://www.tandfonline.com/page/terms-and-conditions
This article may be used for research, teaching, and private study purposes. Anysubstantial or systematic reproduction, redistribution, reselling, loan, sub-licensing,systematic supply, or distribution in any form to anyone is expressly forbidden.
The publisher does not give any warranty express or implied or make any representationthat the contents will be complete or accurate or up to date. The accuracy of anyinstructions, formulae, and drug doses should be independently verified with primarysources. The publisher shall not be liable for any loss, actions, claims, proceedings,demand, or costs or damages whatsoever or howsoever caused arising directly orindirectly in connection with or arising out of the use of this material.
The ties that do not bind: party affiliations and the delivery of devolvedhealth services in the Philippines
Joseph J. Capuno* and Marian Panganiban
University of the Philippines, School of Economics, Diliman, Quezon City, Philippines
Using a panel of province-level data, we investigate the effects of political partyaffiliations of local chief executives on the financing and delivery of devolved healthservices, where arguably the opportunities for and potential gains from inter-localgovernmental unit (LGU) cooperation abound. Despite these potential gains, theproportion of mayors that belong to the same party as the governor are found not tohave any direct, independent and statistically significant effects on the local chiefexecutives’ ability to secure additional resources from the national government andother external sources, mobilize greater spending on local health services or improveselect health service outputs. However, the re-election status of mayors and governorsis found to have a direct, independent and positive impact on some of these indicators.These results support the view that narrow electoral objectives more than partyplatforms remain the dominant influence in local fiscal decisions underdecentralization.
Keywords: party affiliations; local chief executives; local services; Philippines
Introduction
This article aims to contribute to the empirics of party politics at the local level in the
Philippines. Specifically, it investigates whether the party affiliations of municipal and city
mayors and provincial governors have effects on the financing, provision and delivery of
devolved health services. From the policy standpoint, the research is relevant since health
services constituted the bulk of national government functions devolved to local
governments in 1991 (World Bank 1993) and health care access and outcomes since then
have improved, but only marginally and unevenly across regions (Asian Development
Bank [ADB] 2005; Kraft et al. 2011). Further, more potent policies are needed as the
government gives itself modest chances of attaining some health targets as part of its
Millennium Development Goals by 2015 (National Economic and Development Authority
[NEDA] 2010). Finally, the issue bears on the continuing debate regarding the importance
to the realization of the promises of decentralization of accountability measures, including
political and electoral institutions, in making local governments more responsive (Bardhan
2002; Bardhan and Mookherjee 2006).
Instead of political parties, however, more recent studies resonate with that of Lande
(1965) in that factions, clans and classes still dominate the local political economy in the
Philippines (e.g., Gutierrez, Torrente, and Narca 1992; Lacaba 1995; Rivera 1999; Sidel
1999; De Dios 2007; Solon, Fabella, and Capuno 2009). While providing important
ISSN 0115-4451 print/ISSN 2165-025X online
q 2012 Philippine Political Science Association (PPSA)
http://dx.doi.org/10.1080/01154451.2012.684517
http://www.tandfonline.com
*Corresponding author. Email: [email protected]
Philippine Political Science Journal
Vol. 33, No. 1, June 2012, 63–80
Dow
nloa
ded
by [
T&
F In
tern
al U
sers
], [
Mr
Susa
n C
ulle
n] a
t 11:
47 2
4 M
ay 2
012
insights, most of these studies use an inductive approach based on selected cases.
Generalizing from these case studies is difficult since members of local factions or
political clans also join political parties in the country.1 The effects of clan membership or
party affiliation on, say, local fiscal decisions can be easily mistaken for the other since
political parties and clans often espouse populist programs. Also, some younger members
of political clans have shown development orientation while in office, perhaps as much as
can be expected from dedicated members of progressive political parties. Therefore, a
more statistical analysis of party affiliations may add the needed grist to the mill.
It is also widely accepted that political parties in the Philippines are weak and unlike
those found in developed countries (e.g., Banlaoi and Carlos 1996; Montinola 1999;
Teehankee 2002; Hutchcroft and Rocamora 2003; Co and Tigno 2005). Providing more
objective evidence, Kasuya (2009) further finds that party switching remains a regular
feature of elections in the country and more intensely so since 1987. While previous
analyses have focused more on the shifts in party alignments of candidates for national
positions (e.g., presidents and members of congress), some have noted as well that
candidates for local positions align themselves with the parties of presidential candidates
(or presidentiables).2 Without loyalty, members are made to toe the party line more
through the use of carrots (e.g., promises of pork barrels or campaign finances) than sticks
(e.g., expulsion or censure). Unfortunately, the party leader, usually the incumbent
president, can only distribute pork barrel funds while in office. Worse, even before his or
her term expires, the promise of pork barrel funds by presidentiables is often more
attractive to potential turncoats. Notwithstanding the weaknesses of the country’s party
system, it may be asked what elected party mates do in between elections and whether it is
easier for them to collaborate to address a common concern.
In the next two sections, we present a priori reasons for cooperation in the provision of
devolved health services among local government units (LGUs). Briefly, with the
fragmentation of local health systems, much of the gain from economies of scale, control
of epidemics or health information sharing is lost and can only be recovered with inter-
LGU cooperation. While most local health personnel are competent and dedicated civil
servants, and are continually guided and trained by the Department of Health, they are
unlikely to solve health problems without their local chief executives’ support. Where
devolved health services are improved, there is usually a supportive mayor or governor
and innovative health staff working together (Pineda 1998; Quimpo 1996). This is because
mayors and governors, like the Philippine President, have the power of the purse. He or she
can determine the timing or amounts of cash allocations to all departments including the
local health office, which does not generate its own budget or keep whatever revenues it
can raise. Moreover, the local chief executives (LCEs) have powers to hire, fire and deploy
personnel. According to the Civil Service Commission (2005), LGUs in 2004 had a total of
370,227 employees, of which 268,740 were career officials and 101,487 were non-career
officials. Of the latter, 20,514 were elective officials, 8085 were occupying positions
coterminous with those of the appointing officials and 6448 were contractual workers.
These figures do not yet include personnel on job-order status (i.e., on short-term
engagements) who are paid using the LGUs’ budget for maintenance, operating and other
expenses (MOOE).3
In the fourth section, we discuss the dataset and the econometric model used to tease
out the effects of party affiliations. The dataset consists of a panel of province-level
factoids for 2003 and 2008. We chose these non-election years to avoid confounding the
effects of party affiliations with extraneous, election-related factors. While it is true that
most incumbents are always preparing for their next term or office, we assume that party
J.J. Capuno and M. Panganiban64
Dow
nloa
ded
by [
T&
F In
tern
al U
sers
], [
Mr
Susa
n C
ulle
n] a
t 11:
47 2
4 M
ay 2
012
mates are less concerned about campaigning in between election years and therefore may
coordinate their provisions of devolved health services. We present and discuss the
empirical results concerning the effects of party affiliations in the fifth section. The final
section concludes the article.
Legal and economic framework
This section reviews the legal and economic frameworks for inter-LGUcooperationmediated
through party affiliations or by some other means. The legal framework effectively reduces
some of the possible legal or administrative impediments to cooperation, while the economic
framework identifies the potential gains from the coordinated or consolidated provision of
some local public services. The point to be made is that local governments can collaborate if
they want to and could realize benefits if they do so.
Providing the legal framework is the Local Government Code of 1991 (Republic Act
7160, 10 October 1991), specifically its Section 33:
Section 33. Cooperative Undertakings among Local Government Units. Local governmentunits may, through appropriate ordinances, group themselves, consolidate, or coordinate theirefforts, services, and resources for purposes commonly beneficial to them. In support of suchundertakings, the local government units involved may, upon approval by the sanggunianconcerned after a public hearing conducted for the purpose, contribute funds, real estate,equipment, and other kinds of property and appoint or assign personnel under such terms andconditions as may be agreed upon by the participating local units through Memoranda ofAgreement.
Consistent with this provision, some LGUs banded together to address their common
problems or pursue shared goals, such as in industry (e.g., Metro Iloilo-Guimaras
Development Council), urbanization (e.g., Metro Cebu Development Council) and health
(Inter-Local Health Zones). These inter-LGU collaborations range from simple
coordination in the planning and delivery of public services to formal cooperation
involving the joint use and financing of public goods, and to de jure consolidation of
devolved services under the administration or supervision of the province or a single
authority created for the purpose.
Besides political parties, there are in practice other formal and informal structures and
procedures that can facilitate, if not enforce, collaborations among local governments.
Some of the existing administrative structures would be the regional development
councils, the provincial development councils, and even the provincial chapters of the
League of Municipalities or League of Cities. The informal structures would include
political families or clans whose members occupy several local or national positions,
elective or otherwise. Arguably, both formal and informal linkages can foster
communication, knowledge sharing or peer-to-peer mentoring among local chief
executives and other officials. Some of these cooperative arrangements can even
effectively enforce joint decisions through peer pressure, moral suasion or some form of
threat or promise from national government officials.
While the Code reduces the transaction costs, where do the potential benefits of inter-
LGU cooperation come from? Here, an economic analysis of the country’s decentralized
fiscal set-up could help identify the sources. Under devolution, many of the assigned
functions (especially in health) do not match the political jurisdiction, fiscal capacity or
institutional competence of the recipient LGUs (Manasan 2004; Lieberman, Capuno, and
Minh 2005). The inefficiencies arising from these mismatches can be improved by
amending the Local Government Code to reassign the devolved functions or through inter-
LGU cooperation.
Philippine Political Science Journal 65
Dow
nloa
ded
by [
T&
F In
tern
al U
sers
], [
Mr
Susa
n C
ulle
n] a
t 11:
47 2
4 M
ay 2
012
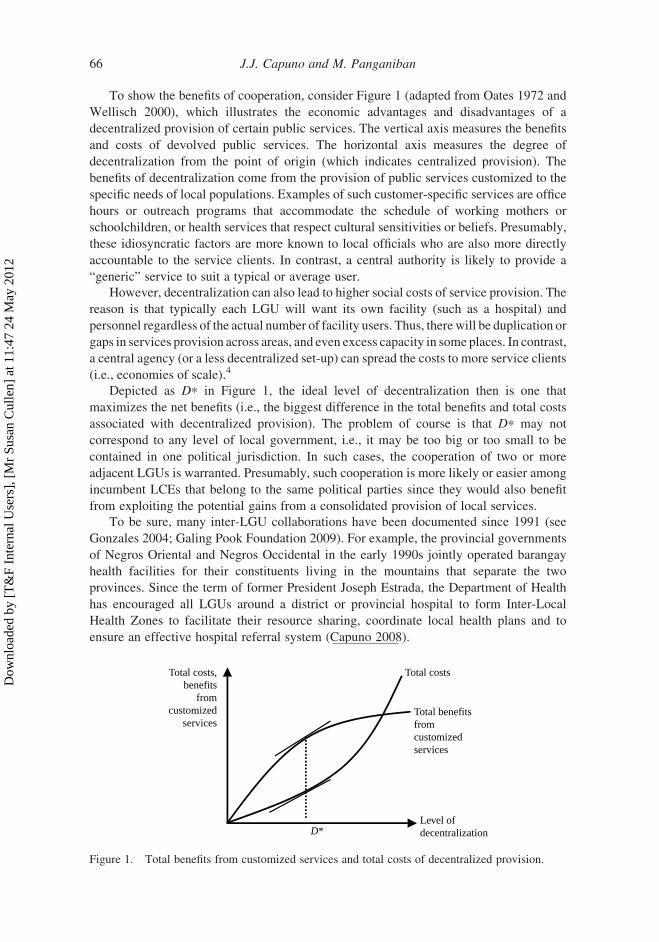
To show the benefits of cooperation, consider Figure 1 (adapted from Oates 1972 and
Wellisch 2000), which illustrates the economic advantages and disadvantages of a
decentralized provision of certain public services. The vertical axis measures the benefits
and costs of devolved public services. The horizontal axis measures the degree of
decentralization from the point of origin (which indicates centralized provision). The
benefits of decentralization come from the provision of public services customized to the
specific needs of local populations. Examples of such customer-specific services are office
hours or outreach programs that accommodate the schedule of working mothers or
schoolchildren, or health services that respect cultural sensitivities or beliefs. Presumably,
these idiosyncratic factors are more known to local officials who are also more directly
accountable to the service clients. In contrast, a central authority is likely to provide a
“generic” service to suit a typical or average user.
However, decentralization can also lead to higher social costs of service provision. The
reason is that typically each LGU will want its own facility (such as a hospital) and
personnel regardless of the actual number of facility users. Thus, therewill be duplication or
gaps in services provision across areas, and even excess capacity in some places. In contrast,
a central agency (or a less decentralized set-up) can spread the costs to more service clients
(i.e., economies of scale).4
Depicted as D* in Figure 1, the ideal level of decentralization then is one that
maximizes the net benefits (i.e., the biggest difference in the total benefits and total costs
associated with decentralized provision). The problem of course is that D* may not
correspond to any level of local government, i.e., it may be too big or too small to be
contained in one political jurisdiction. In such cases, the cooperation of two or more
adjacent LGUs is warranted. Presumably, such cooperation is more likely or easier among
incumbent LCEs that belong to the same political parties since they would also benefit
from exploiting the potential gains from a consolidated provision of local services.
To be sure, many inter-LGU collaborations have been documented since 1991 (see
Gonzales 2004; Galing Pook Foundation 2009). For example, the provincial governments
of Negros Oriental and Negros Occidental in the early 1990s jointly operated barangay
health facilities for their constituents living in the mountains that separate the two
provinces. Since the term of former President Joseph Estrada, the Department of Health
has encouraged all LGUs around a district or provincial hospital to form Inter-Local
Health Zones to facilitate their resource sharing, coordinate local health plans and to
ensure an effective hospital referral system (Capuno 2008).
Total costsTotal costs,benefits
fromcustomized
servicesTotal benefitsfromcustomizedservices
Level ofdecentralizationD*
Figure 1. Total benefits from customized services and total costs of decentralized provision.
J.J. Capuno and M. Panganiban66
Dow
nloa
ded
by [
T&
F In
tern
al U
sers
], [
Mr
Susa
n C
ulle
n] a
t 11:
47 2
4 M
ay 2
012
The case for LGU collaboration in health
This section further discusses some features of local health systems in the Philippines that
motivate, if not demand, LGU collaboration. These health features provide the
opportunities or justifications for cooperating local governments, or LCEs who belong to
the same party, to improve their health financing, service provision or outputs. However,
they would require a greater level of LGU cooperation than their usual compliance to
existing procedures, such as the LCE participation in provincial development councils or
their submission of their local government’s annual investment plans to the provincial
government.
If there is strength in numbers, then a coalition of LGUs may receive more attention or
support from the central authority. In health, the national government support would
include co-sponsoring the social health insurance coverage of indigent families and
extraordinary grants or transfers (both cash and in kind). These grants or transfers are
special and not part of the LGUs’ internal revenue allotments (IRA), which constitute their
regular, mandated share in the national internal revenues.
Under the National Health Insurance Act of 1995, LGUs are mandated to identify and
enroll the indigent families among their constituents with the Philippine Health Insurance
Corporation (PhilHealth) that runs the country’s social health insurance program. The
sponsoring LGU shares with the national government the premium contribution for each
indigent family based on the LGU’s income class and years of participation in the
program. To boost the coverage of poor families under PhilHealth’s Sponsored Program,
the national government in 1994 aimed to enroll about five million families under the so-
called Plan 5 million (Plan 5M). This was continued as OPlan 2.5 million (OPlan 2.5M) in
the following years, but with only half the original target of indigent families for coverage.
Under these initiatives, the national government paid for the entire annual premium
contribution (amounting to 1200 pesos per beneficiary family) while the local officials
identified the eligible families and delivered to them their PhilHealth membership cards.
Besides the national government, provincial governments can also share with their
component cities or municipalities in the premium payments.5 Given the variations in
PhilHealth coverage of the poor across provinces, it may be asked if those with higher
enrolments are also those with a high proportion of LCEs who are party mates.
Besides securing greater external support, cooperating LGUs can also align their
health spending by integrating their health plans, jointly procuring drugs or medical
supplies, or resource sharing. An integrated health plan would be ideal to control
epidemics, hazardous wastes or the spread of communicable diseases across municipal
boundaries. Bulk purchasing can also lead to lower unit costs since participating LGUs
would be able to bargain harder and the winning supplier can afford to give discounts due
to savings on delivery or transaction costs. Cooperating LGUs can also share ambulances,
expensive medical equipment and even critical health personnel. Thus, to the extent that
LCEs who are party mates also collaborate, then party affiliation will have an impact on
local health spending.
Further improvements in certain health service outputs are only possible with LGU
collaboration. For example, the control of epidemics would require the coordinated
monitoring of cases among LGUs. To this extent, the health statistics that local health
personnel regularly collect are most useful when shared with other LGUs. When
reinforced by all LGUs, health education, information dissemination and advocacy
activities also become more effective. To contain the spread of pathogens or disease
vectors, immunization campaigns must be undertaken by LGUs at the same time. The
Philippine Political Science Journal 67
Dow
nloa
ded
by [
T&
F In
tern
al U
sers
], [
Mr
Susa
n C
ulle
n] a
t 11:
47 2
4 M
ay 2
012
efficient use of hospital services calls for a referral system where simple cases are handled
at the lowest facility levels (usually rural health units) and only the more complicated
cases are referred to district or provincial hospitals. This will require LGU cooperation
since the rural health units are devolved to municipalities, while the hospitals are devolved
to provinces. Without a functioning referral system, higher-level facilities will be
overcrowded, while lower-level facilities will be under-utilized. The variations in health
service outputs again provide the opportunity to tease out the possible effects of party
affiliations.
While the efficient level of decentralization (or consolidation of devolved services),
depicted as D* in Figure 1, may correspond to a configuration of LGUs smaller than a
typical province but bigger than a typical municipality or city, we use the province in our
empirical analysis for two reasons. Firstly, the province in many places is the highest level
of local government and has administrative jurisdiction over most lower-level LGUs.
Hence, the province as a political-administrative unit provides a natural or default
grouping of local political leaders.
Secondly, the province as a geographical unit is often large enough to exploit whatever
possible economies of scale or synergy can be had from inter-LGU cooperation and yet
still close enough and directly accountable to the service clients to provide for their
specific needs. In addition, the assignment of some fiscal functions builds on the
hierarchical structure of LGUs. In health, for example, the lowest level of facilities that
provide primary care services are devolved to municipalities and cities. The provision of
secondary or tertiary health care services is assigned to provinces. However, the three
levels of health care are complementary and must be administered as integral parts of a
functioning provincial health system. Arguably, provincial health systems work better
where the governors and mayors work closely together.
Data and methodology
Data
To tease out the effects of party affiliations, we assembled a province-level dataset
obtained from the Bureau of Local Government Finance, the Department of Health, the
Commission on Elections, the Department of the Interior and Local Government,
PhilHealth and the National Statistical Coordination Board. Specifically, our dataset
constitutes a panel of 73 provinces for the years 2003 and 2008. The list of provinces
excludes those in the Autonomous Region of Muslim Mindanao because of the region’s
unique administrative structure, and three provinces with missing data for 2003 (Batanes,
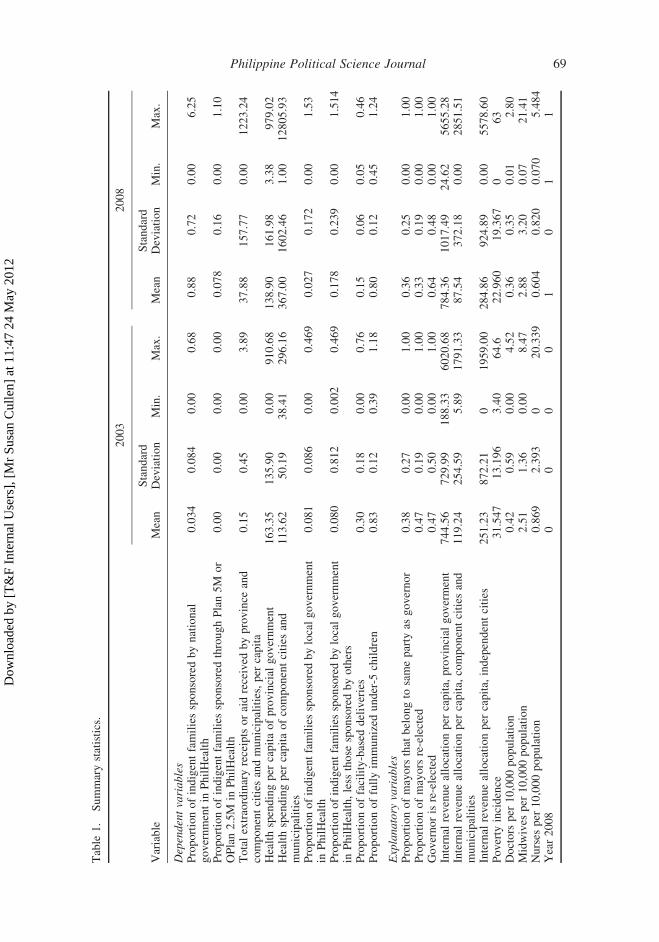
Zamboanga Sibugay and Dinagat Islands). Table 1 shows the descriptive statistics of the
regression variables used.
The key variable of interest is the proportion of incumbent mayors that belong to the
same political party as the incumbent governor. Party affiliation is constructed from the
reported local political parties of the elected governors and mayors in the 2001 and 2007
local elections. In cases where the elected candidate listed his or her membership in a local
political and a national political party, we used the local party to construct the party
affiliation variable. In cases when a governor is listed as independent, the variable party
affiliation is assigned a value of zero. Around 38% and 36% of the elected mayors in 2003
and 2008, respectively, had the same party affiliation as the elected governors.
The effect of party affiliation on the devolved health services is measured using several
dependent variables. As proxy measures of national support (other than the IRA), we use
the proportions of indigent families sponsored by the national government in PhilHealth’s
J.J. Capuno and M. Panganiban68
Dow
nloa
ded
by [
T&
F In
tern
al U
sers
], [
Mr
Susa
n C
ulle
n] a
t 11:
47 2
4 M
ay 2
012
Table
1.
Summarystatistics.
2003
2008
Variable
Mean
Standard
Deviation
Min.
Max.
Mean
Standard
Deviation
Min.
Max.
Dependentvariables
Proportionofindigentfamiliessponsoredbynational
governmentin
PhilHealth
0.034
0.084
0.00
0.68
0.88
0.72
0.00
6.25
ProportionofindigentfamiliessponsoredthroughPlan5M
or
OPlan2.5M
inPhilHealth
0.00
0.00
0.00
0.00
0.078
0.16
0.00
1.10
Totalextraordinaryreceiptsoraidreceived
byprovince
and
componentcities
andmunicipalities,per
capita
0.15
0.45
0.00
3.89
37.88
157.77
0.00
1223.24
Healthspendingper
capitaofprovincial
government
163.35
135.90
0.00
910.68
138.90
161.98
3.38
979.02
Healthspendingper
capitaofcomponentcities
and
municipalities
113.62
50.19
38.41
296.16
367.00
1602.46
1.00
12805.93
Proportionofindigentfamiliessponsoredbylocalgovernment
inPhilHealth
0.081
0.086
0.00
0.469
0.027
0.172
0.00
1.53
Proportionofindigentfamiliessponsoredbylocalgovernment
inPhilHealth,less
those
sponsoredbyothers
0.080
0.812
0.002
0.469
0.178
0.239
0.00
1.514
Proportionoffacility-based
deliveries
0.30
0.18
0.00
0.76
0.15
0.06
0.05
0.46
Proportionoffullyim
munized
under-5
children
0.83
0.12
0.39
1.18
0.80
0.12
0.45
1.24
Explanatory
variables
Proportionofmayors
that
belongto
sameparty
asgovernor
0.38
0.27
0.00
1.00
0.36
0.25
0.00
1.00
Proportionofmayors
re-elected
0.47
0.19
0.00
1.00
0.33
0.19
0.00
1.00
Governorisre-elected
0.47
0.50
0.00
1.00
0.64
0.48
0.00
1.00
Internal
revenueallocationper
capita,
provincial
goverment
744.56
729.99
188.33
6020.68
784.36
1017.49
24.62
5655.28
Internal
revenueallocationper
capita,
componentcities
and
municipalities
119.24
254.59
5.89
1791.33
87.54
372.18
0.00
2851.51
Internal
revenueallocationper
capita,
independentcities
251.23
872.21
01959.00
284.86
924.89
0.00
5578.60
Poverty
incidence
31.547
13.196
3.40
64.6
22.960
19.367
063
Doctors
per
10,000population
0.42
0.59
0.00
4.52
0.36
0.35
0.01
2.80
Midwives
per
10,000population
2.51
1.36
0.00
8.47
2.88
3.20
0.07
21.41
Nurses
per
10,000population
0.869
2.393
020.339
0.604
0.820
0.070
5.484
Year2008
00
00
10
11
Philippine Political Science Journal 69
Dow
nloa
ded
by [
T&
F In
tern
al U
sers
], [
Mr
Susa
n C
ulle
n] a
t 11:
47 2
4 M
ay 2
012
Sponsored Program, or through its Plan 5M/OPlan 2.5M, and the total extraordinary
receipts or aids (i.e., not the internal revenue allocation) received by the province and its
component cities and municipalities from the national government. In 2003 and 2008, the
national government on average enrolled 3.4% and 8.8% of the indigent population in each
province. In 2008, Plan 5M/OPlan 2.5M on average enrolled around 7.8% of the indigent
families per province. The value for this variable is zero in 2003 since these initiatives
were started only in 2004. The average extraordinary receipts amounted to around 38
pesos per capita in 2008, up by a significant amount from less than a peso in 2003.
To measure the coalition’s ability to coordinate their fiscal spending, we use the health
spending per capita (in 2000 prices) of the provincial government and of the component
cities and municipalities of the province. In 2008, the mean provincial health spending per
capita was around 139 pesos, down by about 23 pesos from 2003. In contrast, health
spending per capita of the component LGUs was 367 pesos in 2008, about three times
more than they were spending on average in 2003. Since the provincial government on the
one hand and the component cities and municipalities on the other hand are supposed to
provide complementary health services, their health spending should not have negative
effects on the other, more so when local political leaders coordinate their fiscal decisions.
Finally, we assess the party’s impact against several health service delivery outputs.
The first set of output indicators pertains to the proportion of indigent families that the
province and its component municipalities and cities themselves enrolled in PhilHealth’s
Sponsored Program. The corresponding mean proportions are around 8% and 2.7% in
2003 and 2008. The lower proportion in 2008 is due to the increased sponsorship by the
national government under Plan 5M/OPlan 2.5M. However, when we net out these
national government-enrolled indigent families, the average proportions of LGU-
sponsored indigent families are now 8% in 2003 and 17.8% in 2008.
The other set of output variable includes the proportion of facility-based deliveries and
the proportion of children aged below 5 years old who are fully immunized. In 2003 and
2008, the average proportions of maternal deliveries that were performed in public or
private hospitals and clinics are 30% and 15%, respectively. The average proportion of
under-5 children who have completed immunization against polio, diphtheria, tetanus and
other childhood diseases was about 80% in both 2003 and 2008. Like the other sets of
indicators mentioned above, these maternal and child health indicators are presumably
higher in places where the LCEs are united and can thus share resources or personnel,
other things being constant.
We also included other variables to account for the political incentives for the
incumbent LCEs to perform, and other province-level indicators of service needs and of
fiscal or service delivery capacity. To account for electoral incentives, we used the
proportion of mayors that were re-elected in 2003 (47%) and 2007 (33%) and the
re-election status of governors in the same years. About 47% and 64% in 2003 and 2008,
respectively, were re-elected governors. Presumably, the re-elected LCEs already have
some experience running their local governments and some may still look forward to
another term.
The local population’s need for local services is captured with poverty incidence,
which on average was 31.54% in 2003 and 22.96% in 2008. Fiscal capacity is indicated by
the IRA per capita of the province and of the component cities and municipalities. For the
provincial government, the average IRA per capita (in 2000 prices) was 745 pesos in 2003
and 784 in 2008. For the component cities and municipalities, the corresponding figures
were about 119 pesos and 88 pesos. To account for possible spending spillovers from
J.J. Capuno and M. Panganiban70
Dow
nloa
ded
by [
T&
F In
tern
al U
sers
], [
Mr
Susa
n C
ulle
n] a
t 11:
47 2
4 M
ay 2
012
independent cities within some provinces, we also include the IRA per capita (also in 2000
prices) of these cities, which amounted to about 251 pesos in 2003 and 285 pesos in 2008.
Finally, the numbers of doctors, nurses and midwives per 10,000 population are
included as measures of service delivery capacity. In both 2003 and 2008, on average there
was less than one doctor, one nurse and around two midwives per 10,000 population.
Estimating equation
Using the province-level dataset, we estimated the following model using the panel-data
estimation technique (see Greene 2008, 183). We assume that the dependent variable Y,
which indicates a specific health impact (financing, spending, output) is linked to party
affiliation and a host of other possible explanatory variables as follows:
Yit ¼ ai þ bPit þ dXit þ uTt þ 1it; ð1Þ
where the subscripts i and t refer to the ith province and year t, respectively, P is an
indicator of party affiliation, X is a vector of province-level characteristics, T is the dummy
variable for year, e is the error term, a is a constant term, and u, b and the vector d are
regression coefficients. An estimate of bwould capture the marginal (or own independent)
effect of party affiliation on Y, holding other factors constant.
Using stata’s xtreg module, Equation (1) is estimated as a panel data model with
province-level fixed effects. Specifically, the term ai in Equation (1) captures the effects of
the omitted or unobserved, province-specific characteristics such as topography, culture
and physical capital or infrastructures. The coefficient ai also captures the possible effects
of political clans, which is found to be a critical factor in previous studies but is not
included in our list of explanatory variables because of data unavailability. While our
specification allows us to tease out the independent effects of party affiliations, it is not
possible to tease out the effects of political clans from those other unobserved factors
captured by ai.
Further, the model allows for year fixed effects or those shared characteristics of the
provinces in a given year but which change through time, such as the prevailing national
political situation, macroeconomic or global economic conditions.
Analysis of results
Effects on securing national government support
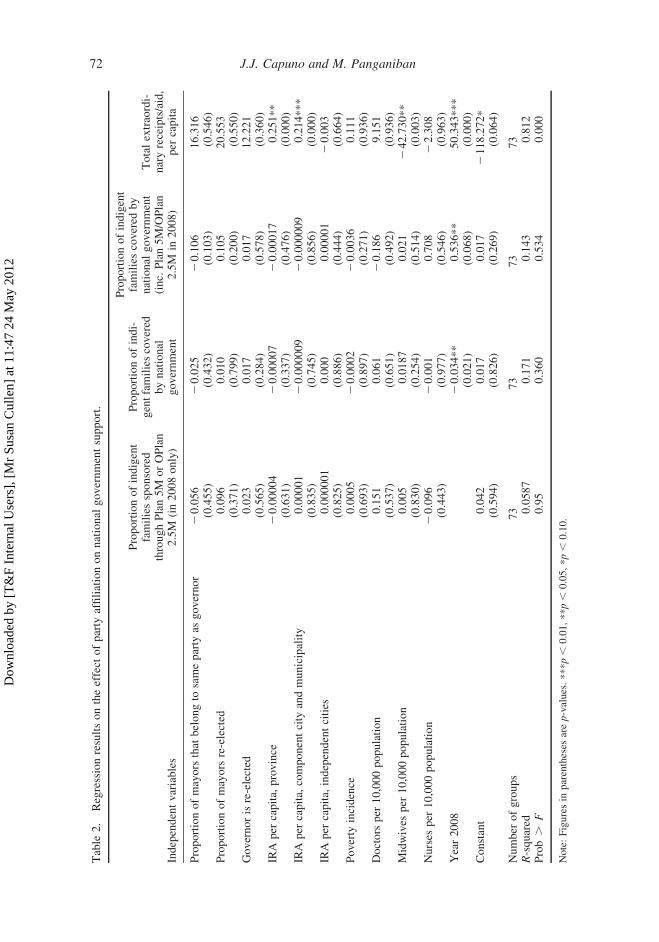
Table 2 presents the estimated effects of party affiliation on securing some national
government support for health. The regression results show that the proportion of mayors
that belong to the same party as the governor has no statistically significant effect in terms
of securing a higher proportion of their poor constituents extended insurance coverage by
the national government or through the Plan 5M/OPlan 2.5M programs (in 2008 only).
It also does not appear to help generate additional funds or aid from the national
government and other external sources.
Likewise, the proportion of re-elected mayors or re-elected governors does not show
any statistically significant effects. This means that re-elected LCEs are not necessarily
favored over first-term LCEs.
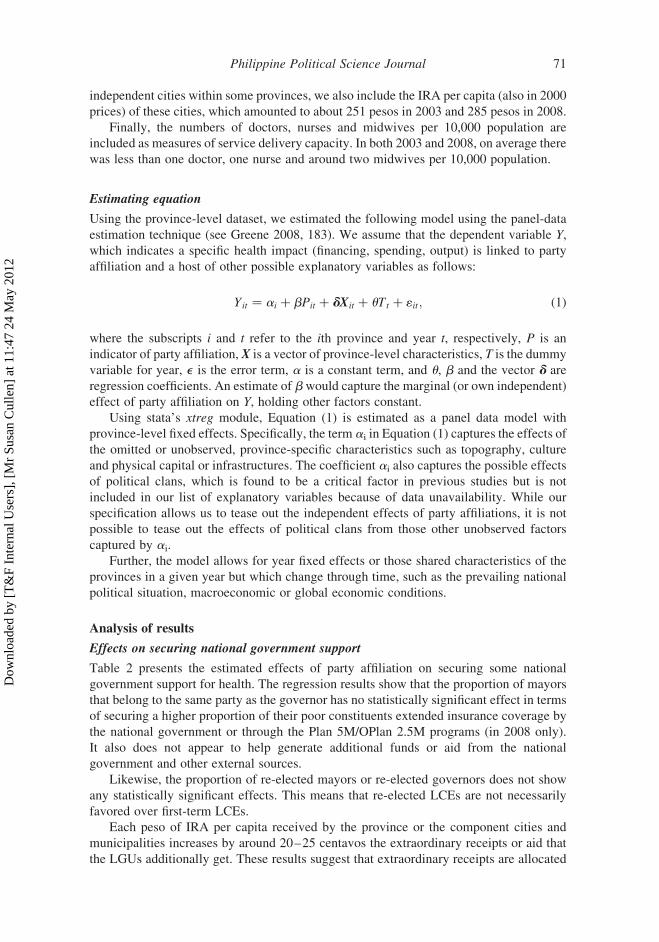
Each peso of IRA per capita received by the province or the component cities and
municipalities increases by around 20–25 centavos the extraordinary receipts or aid that
the LGUs additionally get. These results suggest that extraordinary receipts are allocated
Philippine Political Science Journal 71
Dow
nloa
ded
by [
T&
F In
tern
al U
sers
], [
Mr
Susa
n C
ulle
n] a
t 11:
47 2
4 M
ay 2
012
Table
2.
Regressionresultsontheeffect
ofparty
affiliationonnational
governmentsupport.
Independentvariables
Proportionofindigent
familiessponsored
throughPlan5M
orOPlan
2.5M
(in2008only)
Proportionofindi-
gentfamiliescovered
bynational
government
Proportionofindigent
familiescovered
by
national
government
(inc.Plan5M/OPlan
2.5M
in2008)
Totalextraordi-
naryreceipts/aid,
per
capita
Proportionofmayors
that
belongto
sameparty
asgovernor
20.056
20.025
20.106
16.316
(0.455)
(0.432)
(0.103)
(0.546)
Proportionofmayors
re-elected
0.096
0.010
0.105
20.553
(0.371)
(0.799)
(0.200)
(0.550)
Governorisre-elected
0.023
0.017
0.017
12.221
(0.565)
(0.284)
(0.578)
(0.360)
IRA
per
capita,province
20.00004
20.00007
20.00017
0.251**
(0.631)
(0.337)
(0.476)
(0.000)
IRA
per
capita,componentcity
andmunicipality
0.00001
20.000009
20.000009
0.214***
(0.835)
(0.745)
(0.856)
(0.000)
IRA
per
capita,independentcities
0.000001
0.000
0.00001
20.003
(0.825)
(0.886)
(0.444)
(0.664)
Poverty
incidence
0.0005
20.0002
20.0036
0.111
(0.693)
(0.897)
(0.271)
(0.936)
Doctors
per
10,000population
0.151
0.061
20.186
9.151
(0.537)
(0.651)
(0.492)
(0.936)
Midwives
per
10,000population
0.005
0.0187
0.021
242.730**
(0.830)
(0.254)
(0.514)
(0.003)
Nurses
per
10,000population
20.096
20.001
0.708
22.308
(0.443)
(0.977)
(0.546)
(0.963)
Year2008
20.034**
0.536**
50.343***
(0.021)
(0.068)
(0.000)
Constant
0.042
0.017
0.017
2118.272*
(0.594)
(0.826)
(0.269)
(0.064)
Number
ofgroups
73
73
73
73
R-squared
0.0587
0.171
0.143
0.812
Prob.
F0.95
0.360
0.534
0.000
Note:Figuresin
parentheses
arep-values.***p,
0.01,**p,
0.05,*p,
0.10.
J.J. Capuno and M. Panganiban72
Dow
nloa
ded
by [
T&
F In
tern
al U
sers
], [
Mr
Susa
n C
ulle
n] a
t 11:
47 2
4 M
ay 2
012
based on population density or equity consideration (as are used in the IRA formula), or
transferred as matching grants tied to the uses of the IRA funds.
The other statistically significant factors are the ratio of midwives to 10,000 population
and the year dummyvariable for 2008. Thefirst of these factors shows that it is associatedwith
lower extraordinary receipts or aids (247.73 pesos), which implies that this external
assistance goes more to LGUs with low existing health human resource capacity. Finally,
national government insurance coverage of the indigent population, coverage under Plan
5M/OPlan 2.5M and the amount of extraordinary receipts are all higher in 2008 than in 2003.
The model is able to explain 5% of the variation across provinces in the proportion of
indigent families sponsored through Plan 5M/OPlan 2.5M (in 2008 only); 17% of the
variation in the proportion of indigent families sponsored by the national government;
14% of the variation in the proportion of indigent families enrolled by the national
government and under Plan 5M/OPlan 2.5M; and 81.2% of the variation in total receipts
and aids received by the province and component LGUs per capita. The F-test for the
regression on proportion of indigent families sponsored through Plan 5M/OPlan 2.5M and
total extraordinary receipts or aid per capita tells us that we can reject the null hypothesis
that all coefficients of independent variables are equal to zero at the 10% level. However,
we are unable to reject this hypothesis for the regression on the proportion of indigent
families sponsored by the national government (including or not Plan 5M/OPlan 2.5M),
which means that the econometric model as a whole does not very well explain the
patterns in these dependent variables.
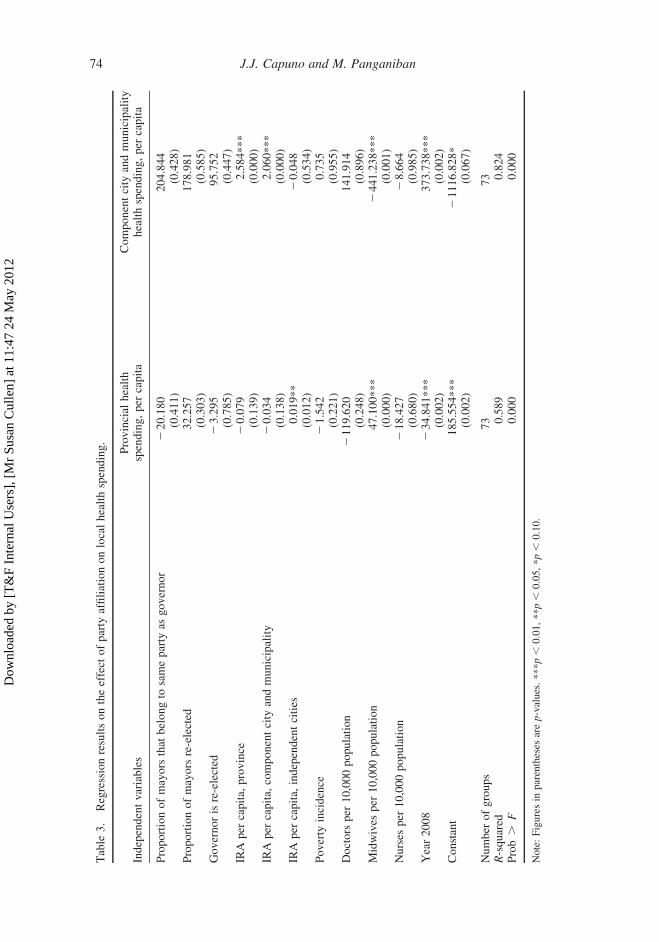
Effects on local spending
If LCEs that are affiliated to one party are unable to obtain additional support from the
national government, are they at least able to coordinate and increase their health
spending? The regression results in Table 3 show that this is not the case. The proportion
of mayors that belong to the same party as the governor has no statistically significant
effect on the level of health spending of either the provincial government or the component
cities and municipalities. Moreover, the re-elected mayors and governors also do not
appear to be associated with a higher level of health spending.
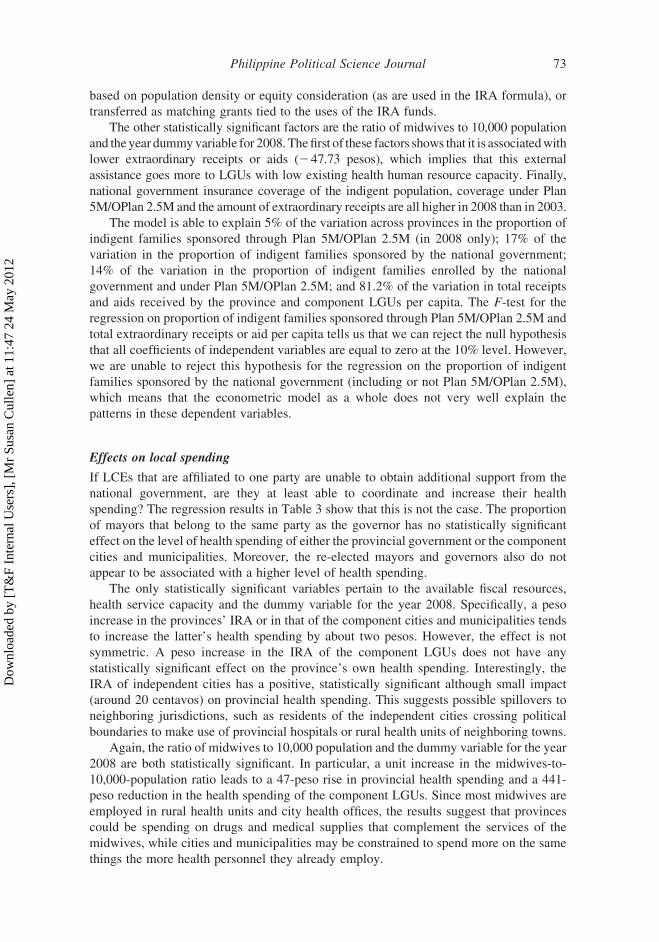
The only statistically significant variables pertain to the available fiscal resources,
health service capacity and the dummy variable for the year 2008. Specifically, a peso
increase in the provinces’ IRA or in that of the component cities and municipalities tends
to increase the latter’s health spending by about two pesos. However, the effect is not
symmetric. A peso increase in the IRA of the component LGUs does not have any
statistically significant effect on the province’s own health spending. Interestingly, the
IRA of independent cities has a positive, statistically significant although small impact
(around 20 centavos) on provincial health spending. This suggests possible spillovers to
neighboring jurisdictions, such as residents of the independent cities crossing political
boundaries to make use of provincial hospitals or rural health units of neighboring towns.
Again, the ratio of midwives to 10,000 population and the dummy variable for the year
2008 are both statistically significant. In particular, a unit increase in the midwives-to-
10,000-population ratio leads to a 47-peso rise in provincial health spending and a 441-
peso reduction in the health spending of the component LGUs. Since most midwives are
employed in rural health units and city health offices, the results suggest that provinces
could be spending on drugs and medical supplies that complement the services of the
midwives, while cities and municipalities may be constrained to spend more on the same
things the more health personnel they already employ.
Philippine Political Science Journal 73
Dow
nloa
ded
by [
T&
F In
tern
al U
sers
], [
Mr
Susa
n C
ulle
n] a
t 11:
47 2
4 M
ay 2
012
Table
3.
Regressionresultsontheeffect
ofparty
affiliationonlocalhealthspending.
Independentvariables
Provincial
health
spending,per
capita
Componentcity
andmunicipality
healthspending,per
capita
Proportionofmayors
that
belongto
sameparty
asgovernor
220.180
204.844
(0.411)
(0.428)
Proportionofmayors
re-elected
32.257
178.981
(0.303)
(0.585)
Governorisre-elected
23.295
95.752
(0.785)
(0.447)
IRA
per
capita,
province
20.079
2.584***
(0.139)
(0.000)
IRA
per
capita,
componentcity
andmunicipality
20.034
2.060***
(0.138)
(0.000)
IRA
per
capita,
independentcities
0.019**
20.048
(0.012)
(0.534)
Poverty
incidence
21.542
0.735
(0.221)
(0.955)
Doctors
per
10,000population
2119.620
141.914
(0.248)
(0.896)
Midwives
per
10,000population
47.100***
2441.238***
(0.000)
(0.001)
Nurses
per
10,000population
218.427
28.664
(0.680)
(0.985)
Year2008
234.841***
373.738***
(0.002)
(0.002)
Constant
185.554***
21116.828*
(0.002)
(0.067)
Number
ofgroups
73
73
R-squared
0.589
0.824
Prob.
F0.000
0.000
Note:Figuresin
parentheses
arep-values.***p,
0.01,**p,
0.05,*p,
0.10.
J.J. Capuno and M. Panganiban74
Dow
nloa
ded
by [
T&
F In
tern
al U
sers
], [
Mr
Susa
n C
ulle
n] a
t 11:
47 2
4 M
ay 2
012
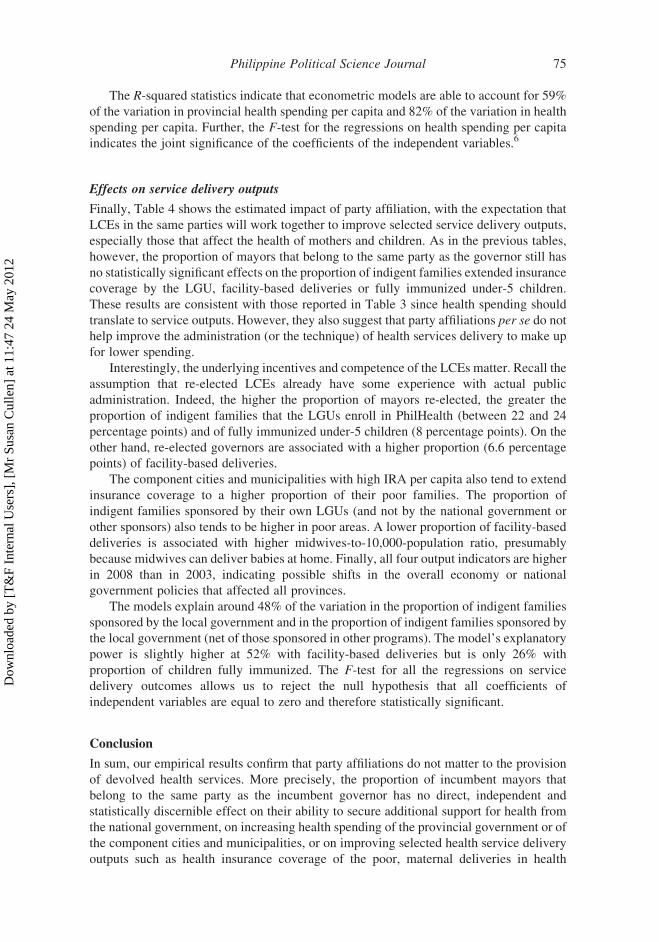
The R-squared statistics indicate that econometric models are able to account for 59%
of the variation in provincial health spending per capita and 82% of the variation in health
spending per capita. Further, the F-test for the regressions on health spending per capita
indicates the joint significance of the coefficients of the independent variables.6
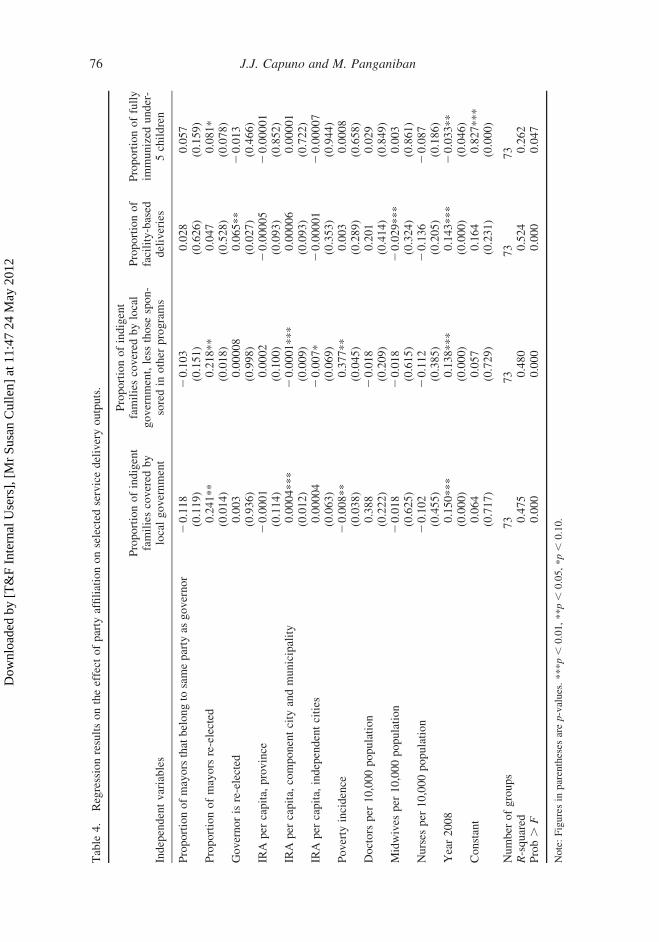
Effects on service delivery outputs
Finally, Table 4 shows the estimated impact of party affiliation, with the expectation that
LCEs in the same parties will work together to improve selected service delivery outputs,
especially those that affect the health of mothers and children. As in the previous tables,
however, the proportion of mayors that belong to the same party as the governor still has
no statistically significant effects on the proportion of indigent families extended insurance
coverage by the LGU, facility-based deliveries or fully immunized under-5 children.
These results are consistent with those reported in Table 3 since health spending should
translate to service outputs. However, they also suggest that party affiliations per se do not
help improve the administration (or the technique) of health services delivery to make up
for lower spending.
Interestingly, the underlying incentives and competence of the LCEs matter. Recall the
assumption that re-elected LCEs already have some experience with actual public
administration. Indeed, the higher the proportion of mayors re-elected, the greater the
proportion of indigent families that the LGUs enroll in PhilHealth (between 22 and 24
percentage points) and of fully immunized under-5 children (8 percentage points). On the
other hand, re-elected governors are associated with a higher proportion (6.6 percentage
points) of facility-based deliveries.
The component cities and municipalities with high IRA per capita also tend to extend
insurance coverage to a higher proportion of their poor families. The proportion of
indigent families sponsored by their own LGUs (and not by the national government or
other sponsors) also tends to be higher in poor areas. A lower proportion of facility-based
deliveries is associated with higher midwives-to-10,000-population ratio, presumably
because midwives can deliver babies at home. Finally, all four output indicators are higher
in 2008 than in 2003, indicating possible shifts in the overall economy or national
government policies that affected all provinces.
The models explain around 48% of the variation in the proportion of indigent families
sponsored by the local government and in the proportion of indigent families sponsored by
the local government (net of those sponsored in other programs). The model’s explanatory
power is slightly higher at 52% with facility-based deliveries but is only 26% with
proportion of children fully immunized. The F-test for all the regressions on service
delivery outcomes allows us to reject the null hypothesis that all coefficients of
independent variables are equal to zero and therefore statistically significant.
Conclusion
In sum, our empirical results confirm that party affiliations do not matter to the provision
of devolved health services. More precisely, the proportion of incumbent mayors that
belong to the same party as the incumbent governor has no direct, independent and
statistically discernible effect on their ability to secure additional support for health from
the national government, on increasing health spending of the provincial government or of
the component cities and municipalities, or on improving selected health service delivery
outputs such as health insurance coverage of the poor, maternal deliveries in health
Philippine Political Science Journal 75
Dow
nloa
ded
by [
T&
F In
tern
al U
sers
], [
Mr
Susa
n C
ulle
n] a
t 11:
47 2
4 M
ay 2
012
Table
4.
Regressionresultsontheeffect
ofparty
affiliationonselected
servicedeliveryoutputs.
Independentvariables
Proportionofindigent
familiescovered
by
localgovernment
Proportionofindigent
familiescovered
bylocal
government,less
those
spon-
soredin
other
programs
Proportionof
facility-based
deliveries
Proportionoffully
immunized
under-
5children
Proportionofmayorsthatbelongto
sameparty
asgovernor
20.118
20.103
0.028
0.057
(0.119)
(0.151)
(0.626)
(0.159)
Proportionofmayors
re-elected
0.241**
0.218**
0.047
0.081*
(0.014)
(0.018)
(0.528)
(0.078)
Governorisre-elected
0.003
0.00008
0.065**
20.013
(0.936)
(0.998)
(0.027)
(0.466)
IRA
per
capita,
province
20.0001
0.0002
20.00005
20.00001
(0.114)
(0.100)
(0.093)
(0.852)
IRA
per
capita,
componentcity
andmunicipality
0.0004***
20.0001***
0.00006
0.00001
(0.012)
(0.009)
(0.093)
(0.722)
IRA
per
capita,
independentcities
0.00004
20.007*
20.00001
20.00007
(0.063)
(0.069)
(0.353)
(0.944)
Poverty
incidence
20.008**
0.377**
0.003
0.0008
(0.038)
(0.045)
(0.289)
(0.658)
Doctors
per
10,000population
0.388
20.018
0.201
0.029
(0.222)
(0.209)
(0.414)
(0.849)
Midwives
per
10,000population
20.018
20.018
20.029***
0.003
(0.625)
(0.615)
(0.324)
(0.861)
Nurses
per
10,000population
20.102
20.112
20.136
20.087
(0.455)
(0.385)
(0.205)
(0.186)
Year2008
0.150***
0.138***
0.143***
20.033**
(0.000)
(0.000)
(0.000)
(0.046)
Constant
0.064
0.057
0.164
0.827***
(0.717)
(0.729)
(0.231)
(0.000)
Number
ofgroups
73
73
73
73
R-squared
0.475
0.480
0.524
0.262
Prob.
F0.000
0.000
0.000
0.047
Note:Figuresin
parentheses
arep-values.***p,
0.01,**p,
0.05,*p,
0.10.
J.J. Capuno and M. Panganiban76
Dow
nloa
ded
by [
T&
F In
tern
al U
sers
], [
Mr
Susa
n C
ulle
n] a
t 11:
47 2
4 M
ay 2
012
facilities and basic immunization of infants and toddlers. Given that we specifically chose
the devolved health services where the potential gains from inter-LGU collaboration are
clear and realizable, the results only confirm (objectively so in this case) that party
affiliations in the Philippines count for less than they should.
In contrast, there is some evidence that the re-election status of mayors and governors
has a direct, independent and positive impact on the same health service delivery outputs.
Perhaps the re-election status reflects the incumbent LCEs’ prior experience in local
administration and their desire to perform well to secure another. The two results suggest
that unless political parties are strengthened to make them responsive and accountable to
voters, candidates will continue to change alliances to win elections and their decisions
once elected will be motivated more by narrow electoral objectives than party platforms.
Reform advocates contend that through a strong party system, successful candidates will
espouse more long-term, strategic objectives (e.g., Montinola 1999).
The internal revenue allocations per capita, midwives-to-10,000-population ratio and,
in some cases, poverty incidence are the factors that consistently show some effects. These
suggest fiscal resources, existing health personnel and the health needs of the local
population are stronger determinants than party affiliations. Moreover, external assistance,
local health spending and service outputs are also better in 2008 than in 2003, which
perhaps reflects more favorable government policy or macroeconomy in the latter year.
It is important to note, however, that while party affiliations do not have an effect on
the devolved health service, the results do not mean that party affiliations may not have an
impact on the financing or delivery of other public services. It is possible as well that party
affiliations matter more for local governments in the same congressional district. If elected,
representatives align themselves to the incumbent president or to presidentiables to secure
pork barrel allocations. They can then use their allocations to secure the political support
of the mayors within their districts. This topic and the following ones can be pursued in
future studies toward a more comprehensive assessment of political parties in the context
of decentralization.
Aside from helping each other during elections, party affiliates who are elected may
also work together to secure other forms of national government support, such as the
establishment of special economic zones or free port zones or the construction of airports
or seaports in their jurisdictions. In addition, they could be pursuing sub-provincial goals
involving only a few of their party mates so that the gains from cooperation are greater and
the enforcement costs are lower. This could explain, for example, why Metro Naga
Development Council and the Banate Bay Coastal Resource Management Council, Inc.
appear to be successful. A province-wide voluntary collaboration of LGUs runs into a
collective action problem, i.e., some will inevitably free-ride on the efforts of others,
which then eventually discourages cooperation.
However, where party affiliations seem to work, they do so perhaps only because most
members belong to the same political clans or dynasties. Hence, it is important to
disentangle the effect of party membership (which is presumably more ideology or
platform driven) from that of clan membership (which caters more to narrow or special
interests) by having these two indicators in one regression model. While we effectively
controlled for clan presence here using a fixed-effects model, we cannot tease out its own
effects from other unobserved factors to compare it with that of party affiliation. It would
also be worthwhile to investigate where party members draw the line between their party’s
positions in regard to their clan interests, and why political clans persist despite
opportunities to build or strengthen existing political parties (see De Dios 2007 and
Querubin 2010 for some interesting insights). To push the analysis further, future research
Philippine Political Science Journal 77
Dow
nloa
ded
by [
T&
F In
tern
al U
sers
], [
Mr
Susa
n C
ulle
n] a
t 11:
47 2
4 M
ay 2
012
may compare the effectiveness of the de jure or de facto rules for candidate selection,
division of the “spoils,” and the enforcement of discipline among members of political
parties and clans.
Acknowledgements
The authors gratefully acknowledge the two anonymous referees for comments and suggestions onan earlier version of the article, the participants in the 11th National Convention on Statistics held on4–5 October 2010 at the EDSA Shangri-La Hotel, Ortigas Center, Mandaluyong City, and those inthe 12th International Conference of the East Asian Economic Association held on 2–3 October2011 at Ewha Women’s University Seoul, Korea. This study is a spin off from another report by theauthors submitted to the UPecon-Health Policy Development Program. The contents of this studyhowever are the sole responsibility of the authors and do not necessarily reflect the views of USAID,the United States Government or UPecon Foundation, Inc.
Notes
1. Gutierrez, Torrente, and Narca (1992) observe that “political parties in the Philippines arecoalitions of political clans.” Coronel et al. (2007) list party and family alignments in the 12thHouse (2001–2004) which include the Dys in Isabela, the Floirendos in Davao del Norte, andthe Zubiris in Bukidnon for Lakas; the Cojuangcos and Teodoros in Negros Occidental,Pangasinan and Tarlac for the National People’s Coalition; the Angaras in Aurora, the Remullasin Cavite, and Lobregats and Zamboanga for the Laban ng Demokratikong Pilipino; and theAbads in Batanes for the Liberal Party.
2. After the 2010 elections, 24 congressmen left Lakas-Kampi-CMD, the party of the previouspresident, Gloria Macapagal-Arroyo, and were sworn into the Liberal Party, the party ofBenigno Aquino III who was to be inaugurated a few days later. More representatives and localchief executives would follow. One of those who joined the Liberal Party said that they would be“supporting the present administration but it does not mean all the way in time for the 2013elections” (see Diaz and Padua 2010; Managbanag 2011).
3. Charging against the MOOE allows the LGUs to get around the cap on expenditures onpersonnel services specified in the Local Government Code.
4. Surgeons in health facilities are an example of trade-offs between customized service provisionunder a fragmented set-up and exploiting economies of scale in a more centralizedconfiguration. There are no regular surgeons serving in barangay health stations because theircapacities are under-utilized in this facility. Visits from patients who need medical attentionfrom a surgeon are not very common. The services of surgeons are most needed in districthospitals where they can serve a broader group of patients who require their attention. However,having surgeons serve in district hospitals or other higher-level facilities implies a loss in servicespecificity for patients who go to barangay health stations who may immediately need theservices of a surgeon. Such instances may be rare, but the unavailability of the kind of service atthe specific time and place needed by a patient constitutes a loss.
5. See Lavado (2010) for a lengthier discussion on this.6. A similar analysis of the shares of health in total spending (not shown) yields F-test statistics that
do not allow us to reject the null hypothesis that the coefficients are simultaneously equal tozero. However, we maintain that the levels are adequate for the purposes of the study.
Notes on contributors
Joseph J. Capuno is an Associate Professor of Economics in the University of the Philippines Schoolof Economics, where he is also developing a graduate-level course on local public economics. Hisoriginal research interest in the devolution of health services in the Philippines has led him to furtherwork in the economics and politics of decentralization. He has published articles in both economicsand political science journals and edited books on local fiscal decisions and political clans,innovations in local services, governance and local development, and local government performanceratings and civic participation. He earned his PhD from the School of Economics of the University ofthe Philippines.
J.J. Capuno and M. Panganiban78
Dow
nloa
ded
by [
T&
F In
tern
al U
sers
], [
Mr
Susa
n C
ulle
n] a
t 11:
47 2
4 M
ay 2
012
Marian Panganiban is a BS and MA graduate of the University of the Philippines School ofEconomics. Her recent work on health policy has been featured in The Lancet, the Global HealthResearch Forum’s Young Voices in Research for Health, and in Asian Politics and Policy.
References
Asian Development Bank. 2005. Poverty in the Philippines: Income, assets and access. Manila:Asian Development Bank.
Banlaoi, R.C., and C. Carlos. 1996. Political parties in the Philippines: From 1900 to present.Makati City, Philippines: Konrad Adenauer Foundation.
Bardhan, P. 2002. Decentralization of governance and development. Journal of EconomicPerspectives 16, no. 4: 185–205.
Bardhan, P., and D. Mookherjee. 2006. Decentralization and local governance in developingcountries: A comparative perspective. Cambridge, MA: The MIT Press.
Capuno, J. 2008. A case study of the decentralization of health and education services in thePhilippines. Report submitted to the Philippine Human Development Network. UP Campus,Diliman, Quezon City.
Civil Service Commission. 2005. 2004 inventory of government personnel. http://excell.csc.gov.ph/cscweb/2004IGP_stat.pdf (accessed February 15, 2012).
Co, E., and J. Tigno. 2005. Philippine democracy assessment: Free and fair elections and thedemocratic role of political parties. Quezon City: Ateneo de Manila University.
Coronel, S., Y. Chua, L. Rimban, and B. Cruz. 2007. The rulemakers: How the wealthy and the well-born dominate congress. Quezon City: Philippine Center for Investigative Journalism.
De Dios, E. 2007. Local politics and local economy. In The dynamics of regional development: ThePhilippines in East Asia, ed. A.M. Balisacan and H. Hill, 157–203. Quezon City: Ateneo deManila University Press.
Diaz, J., and R. Padua. 2010. 24 Housemembers join Noy’s Liberal Party. The Philippine Star, June 26.Galing Pook Foundation. 2009. Kalusugan muna! Policy forum on health. http://www.galingpook.
org/main/images/stories/news/HealthForumMay09Documentation.pdf (accessed September 12,2010).
Gonzales, G. 2004. Metro Cebu: A metropolitan area in need of coordinative body. PIDS DiscussionPaper 2004–49, Philippine Institute of Development Studies, Makati, Philippines.
Greene, W.H. 2008. Econometric analysis. 6th ed. Upper Saddle River, NJ: Pearson Prentice Hall.Gutierrez, E., I.C. Torrente, and N.G. Narca. 1992. All in the family: A study of elites and power
relations in the Philippines. Quezon City: Institute of the Popular Democracy.Hutchcroft, P., and J. Rocamora. 2003. Strong demands and weak institutions: The origins and
evolution of the democratic deficit in the Philippines. Journal of East Asian Studies 3: 259–92.Kasuya, Y. 2009. Presidential bandwagon: Parties and party systems in the Philippines. Pasig City:
Anvil Publishing.Kraft, A., P. Mariano, S. Kault, E. Jimenez-Soto, and K.-H. Nguyen. 2011. Philippines equity report:
Investment case for financing equitable progress towards MDGs 4 and 5 in the Asia-Pacificregion. UP School of Economics Discussion Paper 2011–15, University of the PhilippinesSchool of Economics, Diliman, Quezon City, Philippines.
Lacaba, J.F., ed. 1995. Boss: 5 case studies of local politics in the Philippines. Pasig, Metro Manila:Philippine Center for Investigative Journalism.
Lande, C. 1965. Leaders, factions and parties: The structure of Philippine politics. Monograph Series6, Yale University Southeast Asia Program, New Haven.
Lavado, R. 2010. Is PhilHealth’s sponsored program reaching the poorest of the poor? The FilipinoChild Policy Brief 2, UNICEF-PIDS, Philippines. http://www.unicef.org/philippines/brief02_fnl.pdf.
Lieberman, S.S., J.J. Capuno, and H.V. Minh. 2005. Decentralizing health: Lessons from Indonesia,the Philippines and Vietnam. In East Asia decentralizes: Making local government work, ed.R. White and P. Smoke, 155–78. Washington, DC: The World Bank.
Managbanag, N. 2011. Misamis Oriental execs join Aquino’s party. Sun Star Cagayan de Oro,September 6.
Manasan, R. 2004. Local public finance in the Philippines: In search of autonomy withaccountability. PIDS Discussion Paper Series 2004–42, Philippine Institute for DevelopmentStudies, Makati City, Philippines.
Philippine Political Science Journal 79
Dow
nloa
ded
by [
T&
F In
tern
al U
sers
], [
Mr
Susa
n C
ulle
n] a
t 11:
47 2
4 M
ay 2
012
Montinola, G. 1999. Parties and accountability in the Philippines. Journal of Democracy 10, no. 1:126–140.
National Economic and Development Authority. 2010. Philippines progress report on themillennium development goals 2010. Pasig City, Philippines: National Economic andDevelopment Authority.
Oates, W. 1972. Fiscal federalism. New York: Harcourt Brace Jovanovich.Pineda, V.S. 1998. Health management: Strategies from selected cities. PIDS Discussion Paper
98-36, Philippine Institute for Development Studies, Makati City, Philippines.Querubin, P. 2010. Family and politics: Dynastic persistence in the Philippines. Mimeo, Massachusetts
Institute of Technology. http://econ-www.mit.edu/files/6365 (accessed September 20, 2011).Quimpo, B.A. 1996. Devolution matters: A documentation of post-devolution experiences in the
delivery of health services. Manila: Department of Health, Local Government Assistance andMonitoring Service, Manila.
Rivera, T. 1999. How fare the clans? Poverty and elite reproduction in the Philippines. Paperpresented at the annual conference of the Philippine Political Science Association, July 23–24,in UP Campus, Diliman, Quezon City.
Sidel, J. 1999. Capital, coercion and crime: Bossism in the Philippines. Stanford, CA: StanfordUniversity Press.
Solon, O.J., R.V. Fabella, and J.J. Capuno. 2009. Is local development good politics? Localdevelopment expenditures and the re-election of governors in the Philippines in the 1990s. AsianJournal of Political Science 17, no. 3: 265–84.
Teehankee, J. 2002. Electoral politics in the Philippines. In Electoral politics in Southeast and EastAsia, ed. A. Croissant, G. Bruns, and M. John, 149–202. Singapore: Friedrich-Ebert-Stiftung,Office for Regional Co-operation in Southeast Asia.
Wellisch, D. 2000. Theory of public finance in a federal state. Cambridge, UK: CambridgeUniversity Press.
World Bank. 1993. Philippines devolution and health services: Managing risks and opportunities.Population and Human Resource Operation Division, East Asia and Pacific Region Office.Report No. 12343-PH. Washington, DC: The World Bank.
J.J. Capuno and M. Panganiban80
Dow
nloa
ded
by [
T&
F In
tern
al U
sers
], [
Mr
Susa
n C
ulle
n] a
t 11:
47 2
4 M
ay 2
012