The Theory of Planned Behavior Within the Stages of the Transtheoretical Model: Latent Structural...
22
STRUCTURAL EQUATION MODELING, 14(4), 649–670 Copyright © 2007, Lawrence Erlbaum Associates, Inc. The Theory of Planned Behavior Within the Stages of the Transtheoretical Model: Latent Structural Modeling of Stage-Specific Prediction Patterns in Physical Activity Sonia Lippke Department of Health Psychology, Freie Universitaet Berlin Claudio R. Nigg and Jay E. Maddock Department of Public Health Sciences, John A. Burns School of Medicine, University of Hawaii at Manoa This is the first study to test whether the stages of change of the transtheoretical model are qualitatively different through exploring discontinuity patterns in theory of planned behavior (TPB) variables using latent multigroup structural equation modeling (MSEM) with AMOS. Discontinuity patterns in terms of latent means and prediction patterns for the different stage groups were examined. Adults (n D 3,462) were assessed on their physical activity stages of change and TPB vari- ables. The TPB was separately examined within the five stage groups. The TPB measurement model fit was acceptable. Latent mean analyses with post-hoc con- trast and MSEM indicated discontinuity patterns. Results underscore the qualitative differences between the stages that may guide further research and the design of interventions integrating the approaches. Structural equation modeling (SEM) has been emphasized as a preferred sta- tistical technique because it combines multiple regression and factor analysis Correspondence should be addressed to Sonia Lippke, Freie Universitaet Berlin, Health Psychol- ogy, Habelschwerdter Allee 45 (PF 10), 14195 Berlin, Germany. E-mail: [email protected] 649
Transcript of The Theory of Planned Behavior Within the Stages of the Transtheoretical Model: Latent Structural...
STRUCTURAL EQUATION MODELING, 14(4), 649–670
Copyright © 2007, Lawrence Erlbaum Associates, Inc.
The Theory of Planned Behavior Withinthe Stages of the Transtheoretical
Model: Latent Structural Modelingof Stage-Specific Prediction Patterns
in Physical Activity
Sonia LippkeDepartment of Health Psychology, Freie Universitaet Berlin
Claudio R. Nigg and Jay E. MaddockDepartment of Public Health Sciences,
John A. Burns School of Medicine, University of Hawaii at Manoa
This is the first study to test whether the stages of change of the transtheoretical
model are qualitatively different through exploring discontinuity patterns in theory
of planned behavior (TPB) variables using latent multigroup structural equation
modeling (MSEM) with AMOS. Discontinuity patterns in terms of latent means
and prediction patterns for the different stage groups were examined. Adults (n D
3,462) were assessed on their physical activity stages of change and TPB vari-
ables. The TPB was separately examined within the five stage groups. The TPB
measurement model fit was acceptable. Latent mean analyses with post-hoc con-
trast and MSEM indicated discontinuity patterns. Results underscore the qualitative
differences between the stages that may guide further research and the design of
interventions integrating the approaches.
Structural equation modeling (SEM) has been emphasized as a preferred sta-
tistical technique because it combines multiple regression and factor analysis
Correspondence should be addressed to Sonia Lippke, Freie Universitaet Berlin, Health Psychol-
ogy, Habelschwerdter Allee 45 (PF 10), 14195 Berlin, Germany. E-mail: [email protected]
649

650 LIPPKE, NIGG, MADDOCK
procedures. With this approach it is possible to test measurement issues and
theoretically based structures of variables with a large number of independent,
mediator, and dependent variables (Burkholder & Harlow, 2003). SEM is ideal
for testing theoretical models with complex variable relations (Hankins, French,
& Horne, 2000) and modeling effects over time (Burkholder & Harlow, 2003).
One further advantage of SEM is testing for multigroup invariance within the
measurement and interrelations of the independent, moderating, and dependent
variables (Byrne, 2004). In this study, multigroup structural equation modeling
(MSEM) was used to test the combination of two theories of health behavior
change to assess the advantages of this along with possible measurement issues,
and to help direct more effective, theory-based interventions.
Two different kinds of health behavior theories have been chosen with the
study aim of integrating continuous and stage models.
CONTINUOUS MODELS OF HEALTH BEHAVIOR AND
THE THEORY OF PLANNED BEHAVIOR
In continuous models, individuals are placed along a continuum that reflects the
likelihood of action. Influential predictor variables are identified and combined
in one equation. The assumption is that one prediction equation meets all needs
(one-size-fits-all; Kreuter, Strecher, & Glasman, 1999). The goal of an inter-
vention based on this theoretically or empirically derived equation is to move
the individual along this continuum toward action. Thereby, quantitative differ-
ences between persons are recognized but qualitative changes in the progress
are not identified (Weinstein, 1993). One assumption is, for example, that the
higher an intention the more likely the corresponding health behavior. One such
continuous model is the theory of planned behavior (TPB; Ajzen, 1991).
The TPB proposes that one’s intention to perform a behavior determines
that behavior. Intention is influenced by three social-cognitive variables: atti-
tude, subjective norm, and perceived behavioral control. Attitude is the positive
or negative evaluation of the behavior. Subjective norm is the social pressure
that individuals may perceive to perform the behavior. Perceived behavioral
control (PBC) is the individual’s perception of his or her ability and control-
lability to perform a behavior. The TPB hypothesizes that PBC might have
direct effects on intention and behavior, and that intention mediates the impact
of attitude, subjective norm, and PBC to behavior. According to the TPB, the
higher the intention, attitude, subjective norm, and PBC, the more likely is the
behavior.
Several meta-analyses and narrative reviews have demonstrated the TPB to be
useful in general, and for the prediction of health behaviors in particular (for an
overview see Conner & Sparks, 2005). The meta-analysis on physical activity
by Hagger, Chatzisarantis, and Biddle (2002), found medium to large effect

PREDICTION PATTERNS 651
sizes for the intention-behavior, attitude-intention and PBC-intention relations,
and a smaller effect for the subjective norm-intention relation. Two ideas led to
the inclusion of a stage model into the investigation of the TPB: In the meta-
analysis by Hagger et al. (2002) the included moderator groups (e.g., age) lacked
homogeneity, and the question was whether stages would be moderators. The
relations between the variables of the TPB in the different stage groups should
be different and stage specific. The second idea is the precondition for more
effective interventions that are tailored to an individual’s stage. Using the TPB,
an intervention might be targeted to the TPB constructs important for different
subgroups consisting of people in the same stage (Nigg, 2003).
STAGE THEORIES AND THETRANSTHEORETICAL MODEL
The main purpose of stage theories is to understand the mechanisms of behavior
change. Stage models of health behavior change describe how individuals move
through discrete stages while undergoing behavior change. According to such
models, persons at different stages think and behave in different ways (Wein-
stein, Rothman, & Sutton, 1998). Stages are categories into which people can be
classified according to presumptions of the stage theory. This approach attempts
to explain several distinct steps along the way to action (Weinstein et al., 1998).
With the stage construct, the dynamic nature of health behavior change is em-
phasized and made measurable. By identifying influences and factors that induce
movement from one category to the next, the process of behavior change might
be supported more effectively (Adams & White, 2003; Kreuter et al., 1999).
Weinstein (1993) argued that different variables and processes could be im-
portant at different stages; therefore, various predicting rules are essential. Em-
pirical findings support that one size does not fit all and that not one big bullet
would predict all changes (Kreuter et al., 1999). In other words, there should be
stage-specific effects of social-cognitive variables on behavior change. There-
fore, a combination of continuous and stage assumptions may be adequate to
model these stage-specific prediction patterns.
The Transtheoretical Model (TTM; Prochaska & DiClemente, 1983) proposes
five stages of change. The first stage is the precontemplation stage (PC) in which
individuals do not consider any behavior change. In the contemplation stage (C),
individuals consider performing the health behavior in question but have not yet
decided to change. In the preparation stage (P), individuals prepare and plan
the actual behavior change. In the action stage (A), a new goal behavior is
initiated. When the behavior is performed and consolidated for a longer time,
the maintenance stage (M) is reached (Prochaska & DiClemente, 1983).
According to stage models, changes in a health behavior consist of move-
ments through stages. As individuals move through these stages, social-cognitive
652 LIPPKE, NIGG, MADDOCK
variables change their impact for progression and certain stage-specific bar-
riers emerge. Individuals in the same stage show relatively small differences
and relatively large differences with people in other stages (Weinstein et al.,
1998).
Several meta-analyses exist testing the TTM cross-sectionally by compar-
ing the means of the stage groups. Rosen (2000) reanalyzed the processes of
change and found for exercise that people in action and maintenance use all
processes more than individuals in inactive stages. A meta-analysis on the TTM
for physical activity by Marshall and Biddle (2001) also investigated processes
of change as well as self-efficacy, pros and cons. The authors found that self-
efficacy and pros significantly increased and cons decreased across the stages.
However, only stage differences between PC and P as well as those between P
and A were significant (Marshall & Biddle, 2001). Overall, both meta-analyses
raise doubt that the stages are rather pseudo-stages of an underlying continuum.
In general, critiques of stage models have questioned the existence of stages
or whether stages are not just arbitrary divisions of an underlying continuum
(Sutton, 2005; Weinstein et al., 1998).
A stage model actually exists if, in different variables, discontinuity patterns
are observable (Sutton, 2005). This would mean that there is a discontinuity in
the degree to which variables act on different stages. Individuals at a particular
stage should have different characteristics in comparison to those individuals
in other stages. These discontinuity patterns may consist of mean differences
in some stages and no mean differences in other stages, or an increase from
one stage to the next and a decrease to the one thereafter (Weinstein et al.,
1998). Nonlinear trends in cognitions at different stages would indicate such a
discontinuity pattern, as found by Armitage, Povey, and Arden (2003) as well as
Lippke and Plotnikoff (2006). Consequently for behavior change, the influence
of certain variables is dependent on the stage in which a person is. As this has
yet to be examined in longitudinal studies, this study has been performed to
achieve that goal.
DISCONTINUITY OF PREDICTION BETWEEN STAGES
Depending on the stage, different social-cognitive variables may be more or less
influential. These different influences should be detected in discontinuity patterns
(i.e., nonlinear trends across stages; Sutton, 2005; Weinstein et al., 1998). In
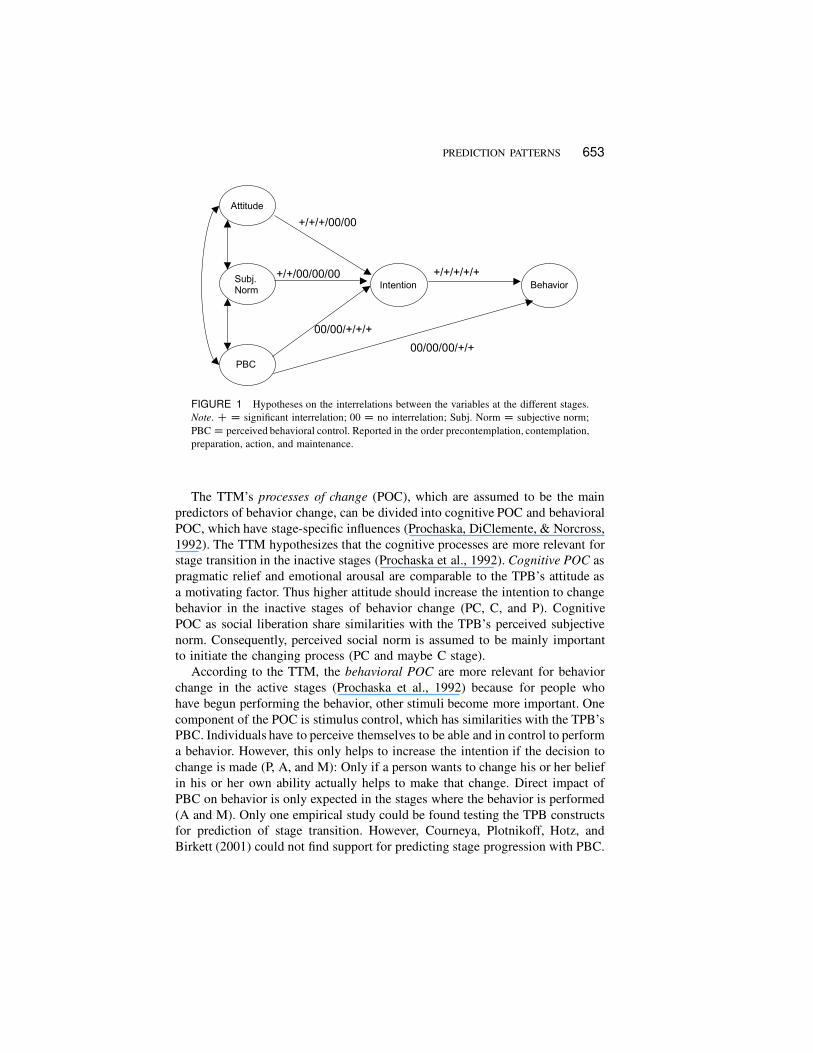
particular, the assumptions of the TPB for each TTM stage are displayed in
Figure 1 and are described in what follows.
According to the TPB, intention mediates the influences of social-cognitive
variables on behavior in all stages. Which social-cognitive variables have an
impact depends on the stage in which a person is.
PREDICTION PATTERNS 653
FIGURE 1 Hypotheses on the interrelations between the variables at the different stages.
Note. C D significant interrelation; 00 D no interrelation; Subj. Norm D subjective norm;
PBC D perceived behavioral control. Reported in the order precontemplation, contemplation,
preparation, action, and maintenance.
The TTM’s processes of change (POC), which are assumed to be the main
predictors of behavior change, can be divided into cognitive POC and behavioral
POC, which have stage-specific influences (Prochaska, DiClemente, & Norcross,
1992). The TTM hypothesizes that the cognitive processes are more relevant for
stage transition in the inactive stages (Prochaska et al., 1992). Cognitive POC as
pragmatic relief and emotional arousal are comparable to the TPB’s attitude as
a motivating factor. Thus higher attitude should increase the intention to change
behavior in the inactive stages of behavior change (PC, C, and P). Cognitive
POC as social liberation share similarities with the TPB’s perceived subjective
norm. Consequently, perceived social norm is assumed to be mainly important
to initiate the changing process (PC and maybe C stage).
According to the TTM, the behavioral POC are more relevant for behavior
change in the active stages (Prochaska et al., 1992) because for people who
have begun performing the behavior, other stimuli become more important. One
component of the POC is stimulus control, which has similarities with the TPB’s
PBC. Individuals have to perceive themselves to be able and in control to perform
a behavior. However, this only helps to increase the intention if the decision to
change is made (P, A, and M): Only if a person wants to change his or her belief
in his or her own ability actually helps to make that change. Direct impact of
PBC on behavior is only expected in the stages where the behavior is performed
(A and M). Only one empirical study could be found testing the TPB constructs
for prediction of stage transition. However, Courneya, Plotnikoff, Hotz, and
Birkett (2001) could not find support for predicting stage progression with PBC.
654 LIPPKE, NIGG, MADDOCK
Findings on attitude and intention revealed that both were predictive for most
stage movements, with attitude being most reliably predictive in the PC stage and
intention in the A and M stage. Subjective norm predicted forward movement
out of the PC stage only (Courneya et al., 2001). No other study testing TPB’s
variables for stage-specific prediction pattern could be found. Thus, this study
aims to fill the gap, testing not only stage predictions, but linear patterns with
stages as a moderator.
PURPOSE AND HYPOTHESES
In general, discontinuity patterns should be indicated by significant differences in
means and relations of the variables as described previously. No study was found
testing the architecture of the TPB within the stages of TTM and, therefore, the
study focuses on this issue. Furthermore, it attempts to elaborate the discontinuity
patterns in latent means and to examine the hypothesized relations of constructs
of the TPB variables within the stages of change of the TTM.
At first, the invariant factorial structure of the psychometric instruments is
tested. The first hypothesis is that the items comprising a particular instru-
ment operate equivalently (are invariant) across the different stage groups, for
(a) factor loadings and (b) covariances.
Second, hypotheses on the discontinuity patterns in latent means are the
following: (a) PBC, subjective norm, attitude, intention, and physical activity
behavior will be lowest in the PC stage and highest in the M stage. The following
discontinuity patterns are expected: (b) No significant differences in attitude,
PBC, and behavior between individuals in PC and C; (c) the C stage and the
P stage will be similar in terms of behavior; (d) the P stage and the A stage are
hypothesized to be different in terms of intention, attitude, and PBC, as well
as similar in subjective norms; and (e) the A stage and the M stage should be
similar in subjective norms, attitudes, and intentions.
Third, the stages should moderate the influence of the social-cognitive vari-
ables on intention and the translation of intention into behavior. This shall be
indicated by unique (not invariant) regression paths in the specified causal struc-
ture of the TPB across the TTM stage groups over time. In particular, we spec-
ified 25 interrelations (standardized regression weights) to be positive or zero
as follows: (a) in the PC stage and (b) in the C stage, intention is correlated
with former attitude and subjective norm, and not to former PBC. In (c) the
P stage intention is associated with PBC and attitude, and not with subjective
norm. In (d) the A stage and (e) the M stage, intention is related to PBC, and
PBC is correlated with physical activity. (f) In all stages intention and physical
activity are associated. Overall, it should be demonstrated that stages are not
just arbitrary distinctions of an underlying continuum.
PREDICTION PATTERNS 655
METHOD
Participants and Procedure
A longitudinal survey using random digit dialing of Hawaii’s noninstitutionalized
adult population was conducted from February to April 2002 (Waksberg, 1978).
Trained interviewers, assisted by a computer-aided telephone interview system,
conducted a 20-min survey. The person aged 18 or older who had the last
birthday was asked to complete the interview to provide randomization within the
household. The University of Hawaii Committee on Human Subjects approved
the procedures and informed consent was obtained over the telephone. Skip
patterns and out-of-range responses were automatically controlled by the system.
A total of 62,436 Hawaiian telephone numbers were called for the interviews.
Of these 9,129 were nonresidential numbers and 34,039 had no answer, were
disconnected, or relocated. Further 12,605 refused to participate in the study
and 2,931 individuals were ineligible (under 18, language barrier, did not plan
to be in Hawaii for 2 years). An additional 270 persons were excluded because
of missing data.
The final data set consisted of N D 3,462 individuals. These persons were
contacted again after a 6-month period (Time 2). Of those, 2,390 took part at
Time 2 (69%). All Time 1 individuals were contacted for a 12-month assessment
(Time 3, independent of whether they took part at Time 2). At Time 3, 1,957
(57%) individuals provided data. Overall, 1,831 (53%) individuals provided data
at all measurement points (61% female; age M D 46.43, SD D 16.32).
Measurements
Participants were asked a series of demographic questions, including age, sex,
height, weight, education attained, income level, marital status, ethnic identifica-
tion, language spoken at home, and perceived health. Measurements were taken
on physical activity, fruit and vegetable consumption, and tobacco usage. Only
the physical activity-related measures are described in this study.
Stage of change for physical activity. Participants were classified into
one of five stages: (a) Precontemplation-Do not engage in regular physical ac-
tivity and no intentions to do so in the next 6 months; (b) Contemplation—Do not
engage in regular physical activity but intend to do so in the next 6 months;
(c) Preparation—Do not engage in regular physical activity but intend to in the
next month; (d) Action—Currently engaging in regular physical activity, but
for less than 6 months; and (e) Maintenance—Currently engaging in regular
physical activity for 6 months or more (Nigg, 2002).

656 LIPPKE, NIGG, MADDOCK
Attitude was measured using a 7-point bipolar adjective scale suggested by
Ajzen and Fishbein (1980). The statement that preceded the adjectives was
“I think regular physical activity is: : : : ” Two items addressing the instrumental
aspect of attitude (bad-good, foolish-wise) were combined to one scale. The
two-item scale had good internal consistency (.759–.911), as reported for each
stage group in Table 1.
Subjective norm was measured by two items such as “Most people who are
important to me think I should be physically active on a regular basis : : : ”
and scored on a 5-point scale that ranged from 1 (disagree a lot) to 5 (agree
a lot; Courneya, Nigg, & Estabrooks, 1998). Internal consistency was acceptable
(.694–.795).
PBC was measured by two questions such as “I have a lot of control over
the number of times I am physically active” and scored on a 5-point scale that
ranged from 1 (disagree a lot) to 5 (agree a lot; Courneya et al., 1998) and
the intercorrelations of the two items are reported in Table 1. Although the
reliability is only based on two items and seemed rather small (.440–.641), it is
comparable to other studies (Rhodes, Matheson, & Blanchard, 2006).
Intention was assessed using a scale adapted from Courneya et al. (1998). An
example item is “I intend to be physically active at least four times a week : : : ”
with responses on a 5-point scale that ranged from 1 (disagree a lot) to 5 (agree
a lot). Internal consistency was moderately acceptable (.616–.776), as reported
in Table 1.
Physical activity behavior was assessed by two items from the International
Physical Activity Questionnaire (IPAQ) short form and addressed time spent
engaging in moderate and vigorous activity per week. High reliability and good
validity of the IPAQ short form have been demonstrated in 12 countries in
validating the subject measure with object data such as accelerometers (Craig
et al., 2003). The low reliability coefficients found in this study (.238–.460, as
TABLE 1
Reliability Coefficients (Interitem Correlation) for the Scales in the Five Subsamples
Sample
Attitude
(Time 1)
Subjective Norm
(Time 1)
PBC
(Time 1)
Intention
(Time 2)
Physical Activity
(Time 3)
PC .893 .780 .641 .776 .238
C .911 .795 .572 .675 .388
P .860 .694 .440 .709 .285
A .759 .707 .554 .674 .460
M .801 .756 .601 .616 .351
Note. PBC D perceived behavior control; PC D precontemplation; C D contemplation; P D
preparation; A D action; M D maintenance. Time 2 was 6 months after Time 1. Time 3 was
12 months after Time 1.

PREDICTION PATTERNS 657
shown in Table 1) are not ideal, although they are comparable to those from
other studies (Craig et al., 2003). The small interrelations between the two
items apparently indicated that the two behaviors capture different aspects of
behaviors, which are both relevant for describing physical activity. Although
low reliabilities are comparable to other studies, they could have influenced the
results. Using only one item could have caused different results. However, using
two or more items had the advantage of latent analyses, and therefore this study
remained using the two items.
Data Analysis
SEM with latent variables was employed to investigate the pattern of relations
within the overall data set for several reasons. First, the underlying theoretical
order among the factors and relations among predictors can be tested, and SEM
has been suggested to be a good method to test the TPB (Hankins et al., 2000).
Second, a multisample structural equation model analyzes invariances across the
subsamples. Invariances may be analyzed in the measurement of the theoretical
constructs, in the relations among theoretical constructs, in the regression paths
in a specified causal structure, and in the latent means of constructs in a model.
Third, if the independent variables in a regression analysis are moderately to
highly interrelated, there may be multicollinearity problems. Finally, modeling
with latent variables tests the relations among factors with reduced measurement
error (Tabachnick & Fidell, 2006). This is especially important if scale reliabil-
ities are moderate (Bentler, 1990). The AMOS Graphics was selected because
this is a very advantageous method that is rarely used (Byrne, 2004).
Multigroup structural equation modeling. A sequence of nested models
ranged from an unconstrained multisample model with the parameters freely
estimated across subsamples, to more parsimoniously nested models that include
different levels of equality constraints (Kenny, 2002). The following models
were estimated in this study: (a) Model 1: noninvariant, unconstrained model
(unrestricted model); (b) Model 2: equal factor loading across the subsamples
(measurement equivalent model); (c) Model 3: Model 2 constraints plus equal
factor variance and covariances; (d) Model 4: Model 3 constraints plus equal
regression paths; and (e) Model 5: Model 4 constraints plus equal factor residuals
(fully constrained).
The equality of variances and covariances is subsequently specific to Model 2
because the other constraints rely on assumptions of invariant measurements.
Models 4 and 5 refer to the latent construct level. This level deals with more
substantive hypotheses about how the subsamples may differ and are similar,
respectively, in their perception of variable relations. Therefore, the most par-
simonious model does not vary significantly from the unrestricted model when

658 LIPPKE, NIGG, MADDOCK
examined in comparing the regression paths and the latent means (Byrne, 2001,
2004).
Model fit. Structural equation models (see Figure 1) were analyzed with
AMOS using maximum likelihood estimates for each subsample (Byrne, 2001).
The overall fit of the resultant models was assessed using a number of goodness-
of-fit indexes representing absolute, comparative, and residual aspects of fit,
specifically ¦2=df , Tucker-Lewis Index (TLI), comparative fit index (CFI), and
root mean squared error of approximation (RMSEA). When the theory under-
lying the model indicates that a moderating relation among predictors may vary
by specific population subgroups, as the stage groups, MSEM is preferable. A
single ¦2 goodness-of-fit statistic evaluates a set of complex models, one for
each group. To validate the usual assumptions that groups are equivalent, sub-
samples can be required to have identical estimates for all parameters (a fully
constrained model). Differences among the groups can be evaluated for their
appropriateness by freeing special parameters (allowing the groups to vary).
The theoretical model is separately applied to each subgroup and then the
invariance analyses can be set up. Before the invariance models are estimated,
it must be established that the model without any invariances (i.e., a model
that is different in each group) is reasonable. This model can be used as a
basis of assessment of more constrained models. The constraints are placed in
a sequence of nested models. To compare the models, the ¦2 difference test
and the TLI can be used to test the equality constraints (Byrne, 2001; Kenny,
2002). If the difference between the ¦2s is not statistically significant, then the
statistical evidence points to no cross-group differences between the constrained
parameters. The differences in the TLI up to .05 are considered trivial in practical
terms. If the ¦2 difference is statistically significant and the TLI is .05 or larger,
then the evidence of cross-group inequality exists (Byrne, 2001). For the test
of significant regression paths and significant differences across the subgroups,
one-tailed tests with p � .05 were used, because directed hypotheses were stated
(Figure 1). SEM was performed using AMOS 5. Reliability and dropout analyses
were performed using SPSS 12.0.1.
RESULTS
Distribution of Study Participants Across the Stages
Participants who provided data at Time 1 (N D 3,462) had the following stage
distribution: PC, n D 730 (20.7%); C, n D 157 (4.5%); P, n D 556 (15.8%);
A, n D 240 (6.8%); and M, n D 1,779 (50.6%; see Table 2). The sample of
participants with data at measurement points Time 1 and Time 3 and no missing
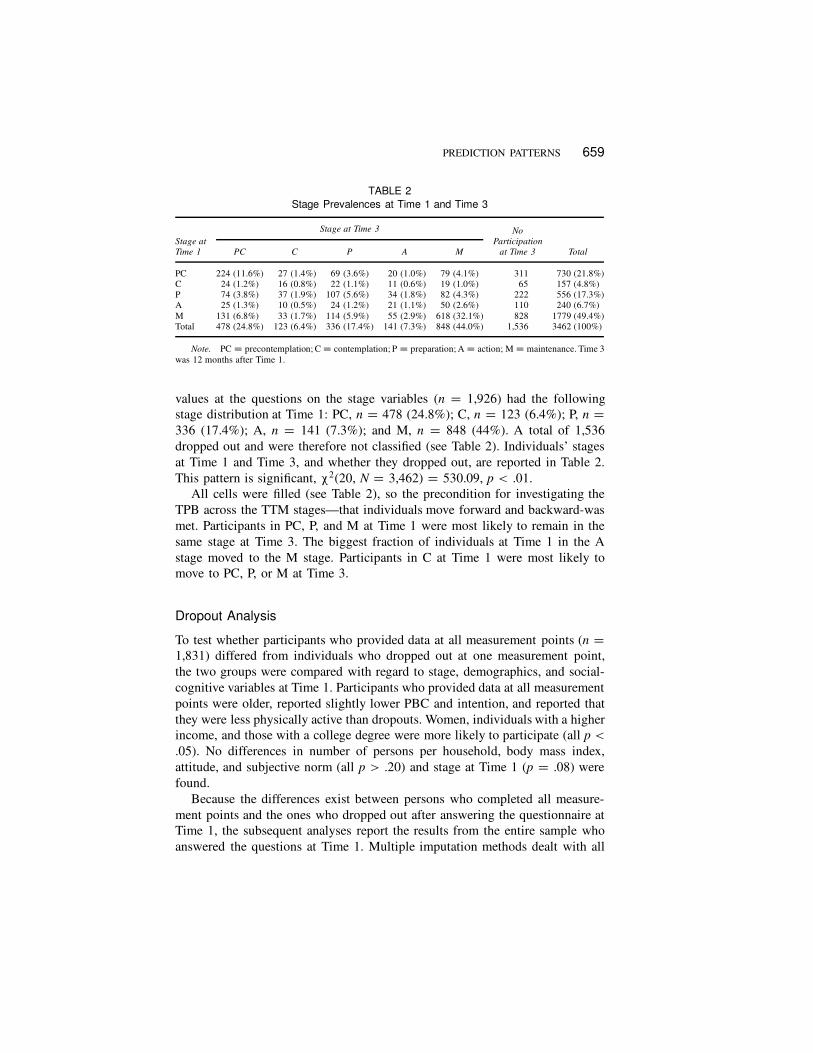
PREDICTION PATTERNS 659
TABLE 2
Stage Prevalences at Time 1 and Time 3
Stage at Time 3
Stage at
Time 1 PC C P A M
No
Participation
at Time 3 Total
PC 224 (11.6%) 27 (1.4%) 69 (3.6%) 20 (1.0%) 79 (4.1%) 311 730 (21.8%)
C 24 (1.2%) 16 (0.8%) 22 (1.1%) 11 (0.6%) 19 (1.0%) 65 157 (4.8%)
P 74 (3.8%) 37 (1.9%) 107 (5.6%) 34 (1.8%) 82 (4.3%) 222 556 (17.3%)
A 25 (1.3%) 10 (0.5%) 24 (1.2%) 21 (1.1%) 50 (2.6%) 110 240 (6.7%)
M 131 (6.8%) 33 (1.7%) 114 (5.9%) 55 (2.9%) 618 (32.1%) 828 1779 (49.4%)
Total 478 (24.8%) 123 (6.4%) 336 (17.4%) 141 (7.3%) 848 (44.0%) 1,536 3462 (100%)
Note. PC D precontemplation; C D contemplation; P D preparation; A D action; M D maintenance. Time 3
was 12 months after Time 1.
values at the questions on the stage variables (n D 1,926) had the following
stage distribution at Time 1: PC, n D 478 (24.8%); C, n D 123 (6.4%); P, n D
336 (17.4%); A, n D 141 (7.3%); and M, n D 848 (44%). A total of 1,536
dropped out and were therefore not classified (see Table 2). Individuals’ stages
at Time 1 and Time 3, and whether they dropped out, are reported in Table 2.
This pattern is significant, ¦2(20, N D 3,462) D 530.09, p < .01.
All cells were filled (see Table 2), so the precondition for investigating the
TPB across the TTM stages—that individuals move forward and backward-was
met. Participants in PC, P, and M at Time 1 were most likely to remain in the
same stage at Time 3. The biggest fraction of individuals at Time 1 in the A
stage moved to the M stage. Participants in C at Time 1 were most likely to
move to PC, P, or M at Time 3.
Dropout Analysis
To test whether participants who provided data at all measurement points (n D
1,831) differed from individuals who dropped out at one measurement point,
the two groups were compared with regard to stage, demographics, and social-
cognitive variables at Time 1. Participants who provided data at all measurement
points were older, reported slightly lower PBC and intention, and reported that
they were less physically active than dropouts. Women, individuals with a higher
income, and those with a college degree were more likely to participate (all p <
.05). No differences in number of persons per household, body mass index,
attitude, and subjective norm (all p > .20) and stage at Time 1 (p D .08) were
found.
Because the differences exist between persons who completed all measure-
ment points and the ones who dropped out after answering the questionnaire at
Time 1, the subsequent analyses report the results from the entire sample who
answered the questions at Time 1. Multiple imputation methods dealt with all

660 LIPPKE, NIGG, MADDOCK
missing values to prevent results from a selected sample. The full information
maximum likelihood (FIML) estimation is such a theoretically based approach
and therefore has several advantages over other missing treatment procedures
(e.g., listwise or pairwise deletion) and imputation methods (e.g., listwise or
pairwise estimates). The FIML estimation is based on computing the likelihood
for the observed portion of all individuals’ data, and with that accumulating
and maximizing it, which is provided by AMOS (cf. Byrne, 2001). All analyses
were additionally run with only participants who had answered all measurement
points. In the case where substantial differences emerged they are reported.
MSEM
To examine whether the single sample models were adequate, the structural
model was separately tested in each group. Only if the hypothesized model is
adequate in all subsamples can the model work well in the multisample analyses.
Therefore, the hypothesized model shown in Figure 1 was tested in each sample.
Goodness-of-fit indexes for the five subsamples are shown in Table 3.
In practical terms, the hypothesized model represented the data well. Al-
though the ¦2 was statistically significant in three groups, the other fit indexes
showed good or moderate model fit with ¦2/df smaller than 2.5, TLI and CFI of
.98 or greater, and RMSEA smaller than .08. Post-hoc analyses and subsequent
TABLE 3
Goodness-of-Fit Indexes for the Five Stage Subsamples for the Whole Sample
and the Subgroup of Individuals Who Participated at All Measurement Points
(Time 1, Time 2, and Time 3)
Sample n �2 df �2/df p TLI CFI RMSEA
PC 730 39.466 27 1.462 .057 .998 .999 .025
393 29.011 27 1.074 .360 .998 .999 .014
C 157 52.432 27 1.942 .002 .917 .959 .078
86 51.985 27 1.925 .003 .970 .936 .104
P 556 44.860 27 1.661 .017 .997 .989 .035
312 50.742 27 1.879 .004 .953 .977 .053
A 240 65.281 27 2.418 <.001 .883 .943 .077
121 72.380 27 2.681 <.001 .777 .891 .118
M 1,779 27.841 27 1.031 .419 .999 .999 .004
878 35.065 27 1.299 .137 .994 .997 .018
Note. The first row of data for each stage are from all individuals answering at Time 1 (FIML
procedure for missing data). The second row of data for each stage are from individuals with no
missing data. PC D precontemplation; C D contemplation; P D preparation; A D action; M D
maintenance (at Time 1); TLI D Tucker-Lewis Index; CFI D comparative fit index; RMSEA D
root mean squared rrror of approximation.

PREDICTION PATTERNS 661
fitting procedures were not done because the modification indexes indicated dif-
ferent modifications in the three groups. The aim was to keep a model that was
most generalizable.
With the subsample of only the individuals who completed all measurement
points, the fit indexes revealed slightly poorer but acceptable fit, and the ¦2 was
less likely to become significant (see Table 3). This was probably related to
the smaller sample sizes. Consequently, the hypothesized multisample structural
equation model was employed and tested in the following with the imputed
sample.
Testing the Measurements
Model 2 was tenable, with practical fit indexes showing good model fit. Although
the ¦2 difference was statistically significant (p D .003) the TLI indicated a
negligible change in fit (delta TLI < .001; see Table 4).
This confirms that Model 2 also accounts for the sample’s variance-covariance
as Model 1. Compared to Models 1 and 2, Models 3, 4, and 5 had poorer
fit, suggesting that variances-covariances, regressions, and factor residuals were
mostly sample specific.
Latent Means
With the finding that factor loadings appeared reasonably invariant across the
five stage groups, the assumption for the latent mean analysis (with invariant
factor loadings; i.e., Model 2) was met. At this point it was analyzed whether
TABLE 4
Multisample Nested Models and ¦2 Differences With Increased Constraints
Model �2 df p
�2/
df TLI CFI RMSEA
Model 1
Delta
�2
Model 1
Delta
p
Model 1
Delta
TLI
1 230.307 135 <.01 1.706 .982 .991 .014 — — —
2 271.858 155 <.01 1.754 .981 .989 .015 41.551 .003 <.001
3 878.304 179 <.01 4.907 .902 .936 .034 647.997 <.001 .080
4 901.771 199 <.01 4.532 .912 .936 .032 671.464 <.001 .071
5 2199.906 247 <.01 8.907 .802 .822 .048 1969.599 <.001 .180
Note. Model 1: noninvariant, unconstrained model (unrestricted model); Model 2: equal factor
loading across the subsamples (measurement equivalent model); Model 3: Model 2 constraints plus
equal factor variance and covariances; Model 4: Model 3 constraints plus equal regression paths;
Model 5: Model 4 constraints plus equal factor residuals (fully constrained); TLI D Tucker-Lewis
Index; CFI D comparative fit index; RMSEA D root mean squared error of approximation.

662 LIPPKE, NIGG, MADDOCK
TABLE 5
Latent Mean Analysis: Means and Standard Deviations of Attitude, Subjective Norm,
PBC, Intention, and Physical Activity
PC
Significantly
Different
From C
C
Significantly
Different
From P
A
Significantly
Different
From P
M
Significantly
Different
From A
M SD M SD P M SD M SD
Attitude
(Time 1)
�0.511 0.135 �0.498 0.207� 0 0.441 0.154� 1.075 0.098�
Subj. norm
(Time 1)
�1.173 0.129� �0.410 0.203� 0 0.063 0.150 0.267 0.092�
PBC
(Time 1)
�1.209 0.226 �1.149 0.279� 0 0.128 0.271 1.528 0.176�
Intention
(Time 2)
�1.222 0.211� �0.365 0.322 0 0.987 0.233� 1.271 0.163�
Behavior
(Time 3)
�0.447 14.937 �15.208 15.375 0 24.977 18.748 119.592 15.958�
Note. PBC D perceived behavior control; PC D precontemplation; C D contemplation; P D preparation;
A D action; M D maintenance (all at Time 1); Subj. norm D subjective norm. Time 2 was 6 months after Time 1.
Time 3 was 12 months after Time 1.�p < :05 (critical ratio > 1.9); see Figure 2 for interpretation of mean differences.
the latent means of the constructs in the model were different across the stage
groups. By restricting the means in one group, this group operated as a reference
group against which the latent means of the other groups were compared (see
Table 5). Differences in adjacent stages were tested (i.e., PC to C, C to P, P to A,
and A to M).
Individuals in PC had significantly lower means of subjective norm and in-
tention than participants in C. The group of individuals in C differed from the
ones in P in terms of lower attitude, subjective norm, and PBC.
The P stage was selected as the reference group as it is the pivotal point
between no change and an actual change in behavior; thus all groups were
compared to P (see Figure 2).
Individuals in A had significantly higher attitude and intention than persons
in P. Finally, the A stage and the M stage groups differed significantly in all
variables, with a more positive profile of individuals in the M stage (Table 5;
Figure 2).
The Structure of the TPB Variables Within Each Stage
of the TTM
To test the hypothesis that the regression paths implied by the TPB in the spec-
ified causal structure were unique (not invariant) across the stages, multigroup

PREDICTION PATTERNS 663
FIGURE 2 Latent mean of the stages. Attitude, subjective norm, and PBC at baseline,
intention at Time 2. The precontemplation stage was the comparison group (means were
standardized to zero). Note. PC D precontemplation; C D contemplation; P D preparation;
A D action; M D maintenance; Subj. norm D subjective norm; PBC D perceived behavioral
control. Physical activity is not included in this figure due to a different scale format.
models were specified. From a statistical and a practical point of view, it could
be maintained that constraints of Model 2 were the best one of the constrained
ones (¦2/df D 1.754, RMSEA D .015). The ¦2 difference test and the TLI
indicated that this model did not differ significantly from the unconstrained
model (Delta TLI < .001). Subsequently, the regression paths were allowed
to vary across the five stages, whereas the factor loadings were constrained to
be equal across the stages. With that the regression paths were estimated (see
Figure 3).
Figure 3 shows the relations among the factors in the five subsamples in
Model 2. Attitude, subjective norm, and PBC were interrelated significantly in
all stages, except for the correlation of attitude and subjective norm in C. At-
titude and intention were highly associated in all stages. Subjective norm and
intention were significantly positively interrelated only for individuals in the
PC stage. In all other stage groups the interrelation of subjective norm and
intention was not significant. The same was true for the interrelation of PBC
with intention and behavior except for the M stage. If individuals who per-
formed physical activity over a longer period of time perceived more control,
they also had a higher intention and performed more behavior. In all other stage

664 LIPPKE, NIGG, MADDOCK
FIGURE 3 Standardized coefficients, covariances, and explained variances for the mea-
surement equivalence model across the five stage subsamples. Note. Path coefficients are
reported for the stages precontemplation (PC), contemplation (C), preparation (P), action
(A), and maintenance (M). Significant path coefficients are in bold type; and significant dif-
ferences (critical ratio < 1.9) between the path coefficients are indicated by the superscript
letters (e.g., PC-C means PC and C groups differ significantly). PBC D perceived behavior
control; Subj. norm D subjective norm. Intention measured at Time 2, behavior measured at
Time 3.
groups, PBC was not correlated with subsequent intention and behavior. As pre-
dicted, PBC was interrelated with physical activity only in the M stage. Inten-
tion and physical activity were correlated in PC and M and not significant in C,
P, and A.
In general, of the 25 predicted interrelations depicted in Figure 1, 18 were
correct (72%). The probability of finding this pattern by chance is smaller than
5%. Attitude was not significantly interrelated with intention in the different
stages. All interrelations of all variables were tested whether they were different
for all other stages. The uniqueness of the interrelations of the variables of the
TPB revealed significant differences in 13 path coefficients (see Figure 3).
Finally, the explained variances (in Model 2) were different across the five
stage groups. In PC, about 8% of the variance of intention was explained and
10% of behavior. In C, 14% of the intention’s variance and 4% of behavior’s
variance was explained. In P, 6% of the variance of intention, and 17% of
behavior’s variance was explained. The explained variance in A of intention
was 11% and of behavior was 23%. In M the explained variance of intention
was 10% and of behavior was 7%. With the data set of individuals who answered
all three measurement points, the only difference was that in A the explained
variance of intention was higher (20%). Differences could be due in part to the
different sample sizes.
PREDICTION PATTERNS 665
DISCUSSION
This study investigated discontinuity patterns across five stages of the TTM
(Prochaska & DiClemente, 1983) within the architecture of the TPB (Ajzen,
1991). A total of 3,462 adults were assessed three times over a 12-month period,
of which 1,831 provided data at all three measurement points. Attrition analyses
indicated selected differences between individuals who dropped out and those
who remained in the study. To test whether these differences would affect the
results, the analyses were computed with imputed data for study dropouts as
well as with the sample of people who took part at all measurement points.
Only minor differences between the results with the imputed data set and the
data set from individuals who participated at all measurement points were found,
resulting in the conclusion that the imputed data set should be used to test the
hypotheses to control for selected dropout.
Fit of the TPB to the TTM Stages
Multiple hypotheses were generated according to the assumptions of the two
investigated theories to test for different indicators of discontinuity patterns.
The TPB was applied to all five stage subsamples separately and demonstrated
an adequate fit. The model fit was best in the M and PC stages, and inferior in
the C and A stages. Because sample sizes were smaller in the C and A stages,
the poorer fit might also be attributed to the dependency of fit indicators to
sample size. Overall it was concluded that the TPB fit acceptably well across
most stage groups.
Measurement Equivalence
The invariant factorial structure of the psychometric instruments was assessed.
The hypothesis that the items to measure the constructs operate equivalently
across the different stage groups was partially confirmed: (a) The factor load-
ings were invariant (Model 2), whereas (b) the covariances were unique for the
different stages (Model 3). Thus, all study participants understood the constructs
similarly, but how the constructs interrelated was different across the different
stage groups.
Testing Latent Means
The findings revealed hypotheses on the discontinuity patterns in latent means in
terms of (a) PBC, subjective norm, attitude, intention, and behavior were lowest
in the PC stage and highest in the M stage. As expected (b), individuals in the

666 LIPPKE, NIGG, MADDOCK
PC and C stages were not significantly different in terms of attitude, PBC, and
behavior. Matching the hypothesis, intention differentiated the PC and C stages
at which stage transition the actual intention formation takes place (Prochaska
& DiClemente, 1983). (c) Individuals in the C and P stages have similar inten-
tion and behavior means. Practically speaking, individuals in the C stage and the
P stage differ in terms of the time until when they intend to start the behavior (as
defined by the staging algorithm), but not in terms of the amount of intention.
(d) As predicted, the P and A stages are different in intention, thus the actual
behavior change goes along with changes in the proximal predictor of the be-
havior. Partially confirming hypotheses, differences between the P and A stages
were also found in attitude (hypothesis confirmed) and not in subjective norms
(hypothesis confirmed) and PBC (hypothesis not confirmed). All variables were
significantly different comparing the A and M stages. Thus, the finding on sub-
jective norm and intention was not as expected. Overall, it was demonstrated as
expected that the means were not increasing or decreasing means in a continu-
ous manner. The mean comparisons were done cross-sectionally, not capturing
who actually changed his or her behavior (which is the typical procedure; cf.
Armitage, Povey, & Arden, 2003; Lippke & Plotnikoff, 2006; Marcus, Eaton,
Rossi, & Harlow, 1994; Marshall & Biddle, 2001; Rosen, 2000). However, in
the analyses of the architecture of the social-cognitive variables, the prediction
of behavior and the mediation by intention was modeled longitudinally.
Testing the Architecture of the TPB
Hypotheses on 25 correlations specified to be positive or zero were tested. In
general, 72% of the predictions were correct, with such a finding being highly
significant in statistical terms. As expected, in (a) the PC and (b) C stages, a
higher subsequent intention was associated with earlier higher attitude, but not
to PBC. Also as hypothesized, the more individuals in the PC stage perceived
subjective norm, the higher their later intention.
Contrary to our hypotheses, people in the contemplation stage achieved no
higher intention when they perceived greater social norm. Rather it seemed these
individuals had lower intention later on if they felt socially pressured. A simi-
lar pattern was found by Courneya and McAuley (1995) analyzing (non-stage-
specific) correlations: Intention and subjective norm were negatively interrelated
with r D �.10. However, the correlation was not significant (what has to be
seen in relation to the sample size of 62 people). In this study, the regression
weights in all stages except the one in the PC stage were also nonsignificant.
Further, this finding is coherent with the results by Courneya et al. (2001) who
tested the TPB variables in predicting stage transitions. Subjective norm was
only predictive of forward stage movement of individuals in the PC stage. That
is, those perceiving more social norm were more likely to move. In no other

PREDICTION PATTERNS 667
stage did social norm predict whether individuals remained or moved to another
stage (Courneya et al., 2001). Individuals not considering behavior change might
be highly affected by others (i.e., what they perceive as subjective norm or social
pressure). This helps individuals contemplate a behavior change (i.e., to move
to the C stage). However, as soon as people contemplate it is more important to
make their own decision. It is assumed that external pressure can be negative in
terms of producing resistance to change.
Matching the hypothesis (c), for individuals in the P stage, a higher attitude
was related to a higher intention and intention was not associated with subjective
norm. Also PBC was not significantly interrelated to later intention, which was
against our expectation. The same result was revealed by Courneya et al. (2001)
for stage-specific predictions with PBC. Individuals in the P stage probably have
no experience with their skills, which is a crucial part of PBC: Higher or lower
PBC cannot predict behavior or intention in any other stage but the M stage.
In (d) the A and (e) M stages, higher PBC was related to higher intention
and more physical activity; however, this was not significant in the A stage.
The latter finding might be related to the small sample size of the A stage
and a very high association of attitude and intention as well as intention and
behavior. Consistent with the predictions (f), in all stages a higher intention
was connected to more physical activity performed a half-year later. Although
the direction was as expected and obviously different from zero, the correlation
within the contemplation stage was not of significant magnitude.
Although the proportions of explained variance were rather small, this might
also be an indicator of discontinuity patterns across the stages. It has to be kept
in mind that the stage measure and intention share much variance (Marcus et al.,
1994), and dividing the total sample into stage subgroups limits the range of
available variance. Taken as a whole, it was shown that explained variances and
correlations for the different stages are unequal and not increasing or decreasing
in a continuous manner.
Further Directions
From these findings it might be concluded that the identification of the stages
contributes substantially to the differential prediction of behavior change. The
idea of one-size-fits-all and one big bullet should, therefore, be abandoned
(Kreuter et al., 1999). Knowing the stage-specific meanings allows for inter-
ventions to be targeted using the most appropriate determination. For example,
individuals in the PC stage might benefit from subjective norms more than in-
dividuals in other stages. If fragmented predictions within the stage groups are
chosen, different proportions in variance might be explained in these subgroups
because these predictions fit better than they do in the entire sample. Another
aim could be to explain more variance. However, this is difficult to demonstrate

668 LIPPKE, NIGG, MADDOCK
because the subgroups are more homogeneous, and reduced variance remains to
be explained.
This study is not without limitations. First, all data were self-reported and
only two indicators per latent variable were used (which also leads to less
reliability of the measures). Second, self-selection and selective dropout may
have occurred. Individuals appeared more likely to drop out of the study if they
were younger, perceived greater behavioral control, had greater intention, and
were more physically active. Although the problem of attrition was dealt with
by missing imputation strategies, the generalizability of the findings is not clear.
Finally, in further studies, larger sample sizes should replicate the results on the
stage groups of small and different sizes to ensure reliable discontinuity patterns,
and the predictions should also be validated in experimental studies.
CONCLUSION
To sum up, this was the first study that elaborated the discontinuity patterns in
latent means and interrelations longitudinally to examine the hypothesized rela-
tions of constructs of the TPB variables within the TTM stages. Discontinuity
patterns were found in terms of (a) latent means, (b) interrelations of the social-
cognitive variables, and (c) amount of explained variance when comparing the
stages of change. This provided support for the usefulness of stage models and
for the stage-specific prediction of behavior change. Invariant factorial struc-
tures of the psychometric scales were confirmed because factor loadings were
approximately the same across different stage groups. These findings are im-
portant in three ways. First, implications may be given for theory building and,
second, conclusions for physical activity promotion may be drawn. Third, in
testing the models, the method of latent SEM was shown to be useful to include
stage assumptions into linear predictions, and stage-specific predictions can be
rigorously assessed using MSEM.
ACKNOWLEDGMENTS
This study was funded in part by the Hawaii Tobacco Settlement Special Fund
through a contract with the Hawaii Department of Health. We would like to
thank Tricia Prodaniuk for her editorial assistance on this article.
REFERENCES
Adams, J., & White, M. (2003). Are activity promotion interventions based on the transtheoretical
model effective? A critical review. British Journal of Sports Medicine, 37, 106–114.

PREDICTION PATTERNS 669
Ajzen, I. (1991). The theory of planned behavior. Organizational Behavior and Human Decision
Processes, 50, 179–211.
Ajzen, I., & Fishbein, M. (1980). Understanding attitudes and predicting social behavior. Englewood
Cliffs, NJ: Prentice-Hall.
Armitage, J. C., Povey, R., & Arden, M. A. (2003). Evidence for discontinuity patterns across the
stages of change: A role for attitudinal ambivalence. Psychology & Health, 18, 373–386.
Bentler, P. M. (1990). Comparative fit indices in structural models. Psychological Bulletin, 107,
238–246.
Burkholder, G. J., & Harlow, L. L. (2003). An illustration of a longitudinal cross-lagged design for
larger structural equation models. Structural Equation Modeling, 10, 465–486.
Byrne, B. M. (2001). Structural equation modeling with Amos: Basic concepts, applications, and
programming. Mahwah, NJ: Lawrence Erlbaum Associates, Inc.
Byrne, B. M. (2004). Testing for multigroup invariance using AMOS graphics: A road less traveled.
Structural Equation Modeling, 11, 272–300.
Conner, M., & Sparks, P. (2005). Theory of planned behaviour and health behaviour. In M. Conner
& P. Norman (Eds.), Predicting health behaviour (pp. 170–222). London: Open University Press.
Courneya, K. S., & McAuley, E. (1995). Cognitive mediators of the social influence—Exercise
adherence relationship: A test of the theory of planned behavior. Journal of Behavioral Medicine,
18, 499–515.
Courneya, K. S., Nigg, C. R., & Estabrooks, P. A. (1998). Relationships among the theory of
planned behavior, stages of change, and exercise behavior in older persons over a three year
period. Psychology & Health, 13, 355–367.
Courneya, K., Plotnikoff, R., Hotz, S., & Birkett, N. (2001). Predicting exercise stage transitions over
two consecutive 6-month periods: A test of the theory of planned behaviour in a population-based
sample. British Journal of Health Psychology, 6, 135–150.
Craig, C. L., Marshall, A. L., Sjostrom, M., Bauman, A. E., Booth, M. L., Ainsworth, B. E., et al.
(2003). International physical activity questionnaire: 12-country reliability and validity. Medicine
and Science in Sports and Exercise, 35, 1381–1395.
Hagger, M. S., Chatzisarantis, N., & Biddle, S. J. H. (2002). A meta-analytic review of the theories of
reasoned action and planned behavior in physical activity: Predictive validity and the contribution
of additional variables. Journal of Sport and Exercise Psychology, 24, 3–32.
Hankins, M., French, D., & Horne, R. (2000). Statistical guidelines for studies of the theory of
reasoned action and the theory of planned behaviour. Psychology & Health, 15, 151–161.
Kenny, D. A. (2002). Multiple group models. Retrieved December 20, 2002, from http://users.rcn.
com/dakenny/mgroups.htm
Kreuter, M. W., Strecher, V. J., & Glasman, B. (1999). One size does not fit all. Annals of Behavioral
Medicine, 21, 276–283.
Lippke, S., & Plotnikoff, R. C. (2006). Stages of change in physical exercise: A test of stage
discrimination and non-linearity. American Journal of Health Behavior, 30, 290–301.
Marcus, B. H., Eaton, C. A., Rossi, J. S., & Harlow, L. L. (1994). Self-efficacy, decision-making,
and stages of change: An integrative model of physical exercise. Journal of Applied Social
Psychology, 24, 489–508.
Marshall, S. J., & Biddle, S. J. H. (2001). The transtheoretical model of behavior change: A meta-
analysis of applications to physical activity and exercise. Annals of Behavioral Medicine, 23,
229–246.
Nigg, C. R. (2002). Physical activity assessment issues in population based interventions: A stage
approach. In G. J. Welk (Ed.), Physical activity assessments for health-related research (pp.
227–239). Champaign, IL: Human Kinetics.
Nigg, C. R. (2003). Technology’s influence on physical activity and exercise science: The present
and the future. Psychology of Sport and Exercise, 4, 57–65.

670 LIPPKE, NIGG, MADDOCK
Prochaska, J. O., & DiClemente, C. C. (1983). Stages and processes of self-change of smoking:
Toward an integrative model of change. Journal of Consulting and Clinical Psychology, 51,
390–395.
Prochaska, J. O., DiClemente, C. C., & Norcross, J. C. (1992). In search of how people change:
Applications to addictive behaviors. American Psychologist, 47, 1102–1114.
Rhodes, R. E., Matheson, D. H., & Blanchard, C. M. (2006). Beyond scale correspondence: A
comparison of continuous open scaling and fixed graded scaling when using social cognitive
constructs in the exercise domain. Measurement in Physical Education and Exercise Science, 10,
13–39.
Rosen, C. S. (2000). Is the sequencing of change processes by stage consistent across health prob-
lems? A meta-analysis. Health Psychology, 19, 593–604.
Sutton, S. (2005). Stage theories of health behaviour. In M. Conner & P. Norman (Eds.), Predicting
health behaviour: Research and practice with social cognition models (2nd ed.) (pp. 223–275).
Buckingham, UK: Open University Press.
Tabachnick, B. G., & Fidell, L. S. (2006). Using multivariate statistics (5th ed.) Boston: Allyn &
Bacon.
Waksberg, J. (1978). Sampling methods for random digit dialing. Journal of the American Statistical
Association, 73, 40–46.
Weinstein, N. D. (1993). Testing four competing theories of health-protective behavior. Health
Psychology, 12, 324–333.
Weinstein, N. D., Rothman, A. J., & Sutton, S. R. (1998). Stage theories of health behavior:
Conceptual and methodological issues. Health Psychology, 17, 290–299.