
The television of abundance arrives: cable choices and interest maximization
29
The television of abundance arrives: cable choices and interest maximization q Kimberly Neuendorf 1 , Leo W. Jeres 2 , David Atkin * Department of Communication, Cleveland State University, Cleveland, OH 44115, USA Abstract Utility theory oers some suggestions for how people react as the so-called ‘‘television of abundance’’ reaches the point where audiences can maximize their interests. Contrasting the interest maximization outlook with the media substitution hypothesis, this study explores cable channel repertoire patterns. A random survey of 319 cable subscribers in a major me- tropolitan area measured exposure to several dozen channel categories. Utilizing factor analysis, pattern repertoires were developed, comparing social category groupings. Overall, the findings support an interest maximization perspective, with individual category pattern repertoires providing insight into the use of abundant cable oerings to serve specialized needs. Ó 2000 Elsevier Science Ltd. All rights reserved. 1. Interest maximization In the early years of American cable television, an expansion in the number of channels led largely to increased redundancy rather than program variety. Cable systems merely imported the signals of distant stations whose programming closely paralleled that of local independents (Agostino, 1974). The larger number of chan- nels did expand one’s choices at any given point in time, but there still was limited opportunity for optimizing content preferences. www.elsevier.com/locate/tele Telematics and Informatics 17 (2000) 169–197 q Revised version of a paper presented to the Communication and Technology Division for presentation at the annual conference of the International Communication Association, San Francisco, May, 1999. * Corresponding author. Tel.: +1-216-687-4637. E-mail address: [email protected] (K. Neuendorf). 1 Tel.: +1-216-687-3994. 2 Tel.: +1-216-687-5088. 0736-5853/00/$ - see front matter Ó 2000 Elsevier Science Ltd. All rights reserved. PII:S0736-5853(00)00007-1
Transcript of The television of abundance arrives: cable choices and interest maximization
The television of abundance arrives: cable choicesand interest maximization q
Kimberly Neuendorf 1, Leo W. Je�res 2, David Atkin *
Department of Communication, Cleveland State University, Cleveland, OH 44115, USA
Abstract
Utility theory o�ers some suggestions for how people react as the so-called ``television of
abundance'' reaches the point where audiences can maximize their interests. Contrasting the
interest maximization outlook with the media substitution hypothesis, this study explores
cable channel repertoire patterns. A random survey of 319 cable subscribers in a major me-
tropolitan area measured exposure to several dozen channel categories. Utilizing factor
analysis, pattern repertoires were developed, comparing social category groupings. Overall,
the ®ndings support an interest maximization perspective, with individual category pattern
repertoires providing insight into the use of abundant cable o�erings to serve specialized
needs. Ó 2000 Elsevier Science Ltd. All rights reserved.
1. Interest maximization
In the early years of American cable television, an expansion in the number ofchannels led largely to increased redundancy rather than program variety. Cablesystems merely imported the signals of distant stations whose programming closelyparalleled that of local independents (Agostino, 1974). The larger number of chan-nels did expand one's choices at any given point in time, but there still was limitedopportunity for optimizing content preferences.
www.elsevier.com/locate/tele
Telematics and Informatics 17 (2000) 169±197
q Revised version of a paper presented to the Communication and Technology Division for presentation
at the annual conference of the International Communication Association, San Francisco, May, 1999.* Corresponding author. Tel.: +1-216-687-4637.
E-mail address: [email protected] (K. Neuendorf).1 Tel.: +1-216-687-3994.2 Tel.: +1-216-687-5088.
0736-5853/00/$ - see front matter Ó 2000 Elsevier Science Ltd. All rights reserved.
PII: S0 73 6 -5 85 3 (0 0) 00 0 07 -1
Television content can be viewed on many dimensions, but it is the traditionalnotion of ``formats'' that best describes the variety available in the eyes of viewers,who have de®nite preferences for soap operas, sitcoms, game shows, police-detectiveshows, and so forth. Utility theory o�ers some suggestions for how people react asthe so-called ``television of abundance'' reaches the point where audiences canmaximize their interests. The theory assumes that a person faced with a set of objectsis able to evaluate and rank order them. Given the opportunity to select one of theelements, the individual will maximize his/her perceived utility by choosing the ele-ment most highly evaluated (Miller, 1972).
Je�res (1978) o�ers the concept of ``interest maximization'' to describe how au-diences, given expanded choices by subscribing to cable TV, may select programs/formats that maximize their interests. As the TV menu grows, each individual'sviewing pattern might become more ``homogeneous'' as she/he avoids those formatsdisliked and selects those preferred. When Je�res ®rst o�ered this notion, cabletelevision was just beginning to penetrate the nation and the limited range ofchannels available provided a poor test of the concept. However, with an expansionof cable o�erings and the inclusion of networks specializing in speci®c formats, it isnow possible to revisit the concept in a more meaningful way.
Although it is possible that someone could devote almost all of their TV viewingtime to a few formats, at some point we might expect diminishing returns to set in asthe individual becomes saturated with sitcoms or game shows, for example. Theindividual would have ful®lled his or her interests in those particular forms and thepercentage of viewing time spent with the desired content would reach asymptote.
Another view is o�ered by Donohew and Tipton (1973), who hold that the in-dividual operates between the boundaries of variety and redundancy, at one timetuning out monotonous information in favor of something new, and at another timetuning out ``new'' information if it reaches a certain threat level. The individual isseen as oscillating between the need for a predictable environment and the need forarousal and stimulation. Similarly, researchers working in experimental psychology(e.g., Berlyne, 1970; 1971) have found that the hedonic value of a stimulus is max-imized at a moderate level of novelty.
Both the tendency to concentrate viewing in valued categories and variety-re-dundancy oscillation may be applicable to TV viewing. TodayÕs cable systems of-fering scores of channels ± typically about 72 ± provide an improved environment fortesting these notions.
We might expect that people who watch a great deal of TV (in terms of number ofhours) to alternate between redundancy and variety more than individuals whowatch relatively little TV. Individual characteristics also may be factors. People wholead relatively busy lives, with many interpersonal contacts and a variety of dailyactivities, would need less stimulation from mass media. We might expect such in-dividuals to seek a few satisfying TV content types, while people who have fewoutside contacts or activities alternate between redundancy and variety as a means ofachieving stimulation in their lives.
170 K. Neuendorf et al. / Telematics and Informatics 17 (2000) 169±197

2. The substitution hypothesis
A broadly tested perspective that provides a di�erent outlook on audience se-lectivity is that of the substitution hypothesis, positing a model of functional dis-placement (Henke and Donohue, 1989). To wit, audience members may substitutethe use of one functionally similar medium for another. A commonly cited illus-tration of this dynamic involves the displacement of radio by television as the mostwidely adopted mass entertainment medium (Lasswell, 1948). Contemporary sub-stitution models characterize pay-per-view or movie purchases on video as re-placements for movie-going activity (e.g., Childers and Krugman, 1987; Henke andDonohue, 1989; LaRose and Atkin, 1991; Lin, 1993), as these new video modalitiesprovide better audience control over the household budget and leisure-time alloca-tions.
Alternately, uses of certain media could be complementary or orthogonal, evenwhen those channels provide similar content. For instance, audience use of cableservices was found to have little e�ect on their patronage of TV, newspapers andother traditional news sources (Grotta and Newson, 1983; Reagan, 1987). Morerecent work (Je�res and Atkin, 1996; Kang and Atkin, 1999; Lin and Je�res, 1998)failed to ®nd any signi®cant correlations between interest in using online services andother mass media, although other studies report a slight reduction of TV viewingtime among online users (e.g., Atkin et al., 1998b; Berniker, 1995; Crispell, 1997;James et al., 1995).
Media usage variables were also included in early studies of cable adoption and,similarly, the results have been inconsistent. For instance, Reagan (1987) found TVand magazine exposure to be positively related to cable subscribership but not radiolistenership. Paradoxically, Collins et al. (1983) found that TV viewership wasnegatively related to cable adoption. Other studies have found the opposite to betrue (Becker et al., 1983; Sparkes, 1983; Sparkes and Kang, 1986; LaRose and Atkin,1988a,b; Lin, 1994).
By contrast, a complementary relation obtains when the uses of two media mu-tually reinforce one another. For instance, the VCR can complement televisionviewing by allowing for time-shifting of program viewing (e.g., Lin, 1993). As Lin(1994) maintains, the onset of a complementing or displacement/substitutionmechanism should depend on whether ``new media'' can e�ectively compete with``old media'' for cost-e�ciency, perceived communication utilities and grati®cationexpectations. It is this potential complementarity mechanism that is highly consistentwith interest maximization.
The literature has focused on complementing or substituting relationships amongmedia, with scant attention paid to multiple content types (e.g., specialized cablechannels) as potential individual sources. In the age of media abundance, we areunable to treat cable TV as a monolithic, homogenous source. Complementing orsubstituting mechanisms may accrue within a system of cable viewership; comple-mentarity or substitution may occur between cable channels rather than between
K. Neuendorf et al. / Telematics and Informatics 17 (2000) 169±197 171

media delivery systems. Bearing this in mind, we examine whether a pattern ofcomplementarity exists for cable channels, and whether this pattern demonstrates aconsistency with the notion of interest maximization ± i.e., are similarly programmedchannels positively related in their patterns of exposure? And, are there importantvariations in such patterns, according to audience interests?
3. Modelling channel repertoire
Heeter (1985) integrated the multichannel media environment into her ad hocchoice process model. In formulating a predictive model, Webster and Lichty(1991) o�ered a model of audience behavior that incorporates audience and mediafactors as determinants of viewing. They found that media factors are moststrongly in¯uenced by programming options. To wit, Ferguson and Melkote (1997,p. 190) de®ne channel repertoire (CR) as ``the number of channels that a viewerchooses to watch, without much regard to the total number of channels available''.They uncovered a relatively modest in¯uence of demographic variables in deter-mining number of cable channels included in oneÕs repertoire, as people who spendthe most time with TV are more likely to include cable channels in their viewingrepertoire.
Researchers (Lin, 1994; Perse et al., 1994; Lin, 1999) developed models that linkthe richer new media (e.g., cable) repertoires with a more active audience. Theyfound some support for their contention that cable-channel repertoire will be higheramong groups who spend more time watching television.
Ferguson and Melkote found that cable CR di�ered between low TV/low otherleisure and high TV/high other leisure groups. They posited that people who aremore active in general have larger (or ``more active'') CRs. Moreover, since elderlyand less educated viewers spend more time with TV (Robinson, 1981), they are likelyto indicate larger CRs; Ferguson and Melkote (1997) found that both education andage were predictive of cable CR.
Focusing on gender, Nathanson et al. (1997) found some support for their sup-position that males had an instrumental viewing style-with goal-directed reasons forwatching and intentional, concentrated and selective use of television. Females, onthe other hand, had a relationship-oriented approach to TV that augured in favor ofa smaller CR.
In fashioning an integrated model of channel selection in a rapidly changingmedia environment, we have begun to extend the concept of CR to accommodate thechanging media environment. We do this in several ways. The traditional CRmeasures, reliant upon simple summative indicators of number of channels accessedin a given time period, are enhanced by such elements as: (1) the use of weightingsre¯ecting frequency of use, (2) the development of both primary repertoires (thosesets of channels used regularly and frequently) and specialized repertoires (those setsof channels accessed by particular audience segments on a regular but non-daily
172 K. Neuendorf et al. / Telematics and Informatics 17 (2000) 169±197
basis), (3) the examination and use of factor analytic patterns of cable channel use(pattern repertoires), (4) the comparison of such repertoires across achievement andascriptive social categories (e.g., educational level or racial groups).
Elsewhere (Neuendorf et al., 1998), we have reported results relevant to points (1)and (2) above, using both straight additive measures and indicators weighted byexposure frequency. While the traditional simple summative measure of repertoirewas undi�erentiated by any of the social locator variables, the frequency-weightedmeasure of overall repertoire was di�erentiated by race (with Black respondentsreporting a larger repertoire than do White respondents), with near-signi®cant dif-ferences for the two genders (males exhibiting a greater repertoire) and for groupsde®ned by educational level (those with low education reporting a larger frequency-weighted repertoire).
The construction of specialized repertoires has further enhanced our under-standing of selectivity relevant to the plethora of channel options available today.We (Neuendorf et al., 1998) have de®ned three levels of specialized repertoires ±primary repertoire (number of channel categories viewed at least daily), secondaryrepertoire (number of channel categories viewed at least weekly), and tertiary rep-ertoire (number of channel categories viewed weekly or less, but at least occasion-ally). We found support for the notion that CR is positively associated with greaterviewing overall, except in the case of Tertiary Repertoire. In a set of social locatorcomparisons, we discovered a signi®cant education e�ect. Those of low educationhad a signi®cantly higher primary repertoire, and a signi®cantly lower tertiary rep-ertoire.
Given that total repertoire did not di�er between the groups, we concluded thatthose of lower educational achievement have a higher motivation for channel sur-veillance ± they reexamine their repertoire on a much more frequent basis (Neuen-dorf et al., 1998). While this certainly corresponds to a higher level of TV exposurefor those of lower education, it is important to note that the more highly educatedgroup reported just as many channel categories in their total repertoire. And, ®nd-ings reported elsewhere (Atkin et al., 1998a) provide initial evidence of patternrepertoires with high levels of complementarity, as judged by a standard of facevalidity. For example, heavy viewers of the Family Network were also heavierconsumers of the USA Network, the Lifetime Network, and Superstations (TNT,etc.). This factor seems to encompass content relevant to those who are highlypeople-oriented ± those with families, and/or with strong interests in issues of rela-tionships among family and friends.
4. The utility of a combined approach
Utilizing these extended approaches to the measurement of CR, facilitatedthrough data reduction, allows a renewed scrutiny of the possibility of interestmaximization. In this initial, basic test application of a factor analytic approach to
K. Neuendorf et al. / Telematics and Informatics 17 (2000) 169±197 173
CR as applied to interest maximization, we compare patterns of viewership amonggroups delimited by social categories. Five social category variables are considered,three ascriptive and two achievement: Race, age, and gender, and marital status andeducation level, respectively.
The questions posed earlier may ®nd speci®c application with factor-analytically-derived pattern repertoires for cable viewership. Past work (e.g., Ferguson andMelcote, 1997) o�ers some evidence that ascriptive factors like education encouragelarger repertoires, providing support for a guiding hypothesis that social factorsin¯uence repertoires. However, these social categories have yet to be investigated inthe light of common underlying themes that help de®ne CRs, prompting us to posethe following research questions:
RQ1: Do pattern repertoires display complementarity consistent with the notionof interest maximization?RQ2: Do pattern repertoires di�er among social categories?/Do any emergent dif-ferences support an interest maximization perspective (i.e., showing a concentra-tion of attention in areas attractive to that social grouping)?
5. Methods
Study data were collected from the Communication Research Center at ClevelandState University, utilizing a survey of cable subscribers in an ethnically diversemetropolitan area of the Midwestern US.
The survey, conducted during November of 1997, was administered in conjunc-tion with the City O�ce of Cable TV to assess subscribersÕ satisfaction with theircable system, the pattern of their viewing, and their experience with local origination.Cable TV subscribers were interviewed using a computer-aided telephone inter-viewing (CATI) system at Cleveland State. Telephone numbers were randomlygenerated to insure selection of residents with both listed and unlisted telephonenumbers, generating 319 complete responses. Respondents were told the purpose ofthe survey with the following introduction:
Hello, my name is (FIRST NAME ONLY), and IÕm calling from ClevelandState University, where we're conducting a brief survey about cable TV andother topics for the city of Cleveland Cablevision's franchise agreement withthe city will be up for renewal soon. We're not selling anything, and we'd likeyour views about the current cable system, as well as other topics, which we'llbe summarizing in a report to the city.
Potential respondents were then asked if they were at least 18 years of age, lived inthe city and received cable TV in their house. Those who responded positively werethen asked about their gender so that interviewers could ®lter respondents in a waythat ensured gender balance in the survey.
174 K. Neuendorf et al. / Telematics and Informatics 17 (2000) 169±197
The substantive sections of the survey were presented in the following order: (1)frequency of viewing for di�erent cable channels (34 items, utilizing a 0±5 scale where0� never watch and 5�watch several times a day); (2) public access experience(PEG ± so-called public/educational/government access programming (Atkin et al.,1998a), 3 items, plus probes); (3) problems with their cable reception or hardware (6items); (4) overall evaluation of the cable system (5 items); (5) TV and other mediause (8 items); (6) a general section seeking public opinion and perceptions (15 items);and (7) social categories (ethnicity, age, etc.). See the authors for a copy of the in-terview schedule.
From the cable viewing measures, we constructed ®ve repertoire indicators:
1. Repertoire: The total number of 37 channel sets ever viewed (corresponding withthe measurement of repertoire in past research).
2. Frequency-weighted repertoire: The sum of all frequency of viewing measures (0±5scale), after each was standardized.
3. Primary repertoire: The number of channel sets viewed at least daily.4. Secondary repertoire: The number of channel sets viewed at least weekly.5. Tertiary repertoire: The number of channel sets viewed weekly or less, but at least
occasionally.
6. Description of sample
Our sample of 319 respondents consisted of 42% males and 58% females. Some40% were married, while 13% were divorced or separated, 13% were widowed and34% had never been married. While 8.3% were ages 18 or 19, 19.5% were 20±29,21.7% 30±39, 16.9% 40±49, 12.8% 50±59, 9.3% 60±69 and 11.5% 70 or older. Sixtypercent were Caucasian, 32% Black, 5% Hispanic, and 4% other. While 6% hadadvanced college degrees, 14% were college graduates, a third had some college, athird were high school graduates and 14% had less formal education than that. Afourth of the sample reported household incomes of $20,000 or less, while 18.5%reported incomes $20,001±$30,000, 21% $30,001±$40,000, 18.2% $40,001±$50,000and 17% a higher income.
7. Results
Table 1 lists all the cable channel categories presented to respondents for possibleendorsement, with corresponding percentages of viewership and mean frequencies ofviewership. The most-frequently viewed channel set is that of broadcast networka�liates (99.4% reporting at least occasional viewership); however, a wide variety ofchannel categories show very broad reach, with three-quarters or more of respon-dents reporting at least occasional viewership-public TV, independent broadcast
K. Neuendorf et al. / Telematics and Informatics 17 (2000) 169±197 175

Tab
le1
Ov
era
llch
an
nel
vie
wer
ship
pa
tter
na
Ch
an
nel
(s)
%W
ho
ever
watc
h
Mea
n
freq
uen
cy
of
vie
w
Fre
qu
ency
of
Vie
win
gC
om
pari
son
s
Sig
ni®
can
t
di�
eren
ce
for
race
Sig
ni®
can
t
di�
eren
ce
for
age
Sig
ni®
can
t
di�
eren
ce
for
gen
der
Sig
ni®
can
t
di�
eren
ce
for
mari
tal
statu
s
Sig
ni®
can
t
di�
eren
ce
for
edu
cati
on
1.
Net
wo
rks
(AB
C,
CB
S,
NB
C,
Fo
x)
99.4
4.1
2.
Pu
bli
cT
V74.2
2.2
Hi>
Lo
3.
Ind
epen
den
ts(C
hs.
X&
X)
89.9
2.8
4.
Pre
miu
mm
ovie
chan
nel
s(H
BO
,et
c.)
62.9
2.2
Bl>
Wh
Y>
OL
o>
Hi
5.
Mu
sic
Ch
an
nel
s(M
TV
,V
H-1
,et
c.)
57.4
1.7
Y>
OU
nm
>M
Lo
>H
i
6.
New
sC
ha
nn
els
(CN
N,
CN
BC
,et
c.)
87.4
3.0
O>
Y
7.
SC
OL
A(i
nte
rna
tio
na
ln
ews)
25.8
0.7
O>
Y
8.
Rel
igio
us
Ch
an
nel
s30.7
0.8
Bl>
Wh
O>
YF
>M
9.
Sh
op
pin
gN
etw
ork
Ch
an
nel
s29.7
0.7
10
.S
po
rts
Ch
an
nel
s(E
SP
N,
etc.
)75.3
2.3
M>
F
11
.O
ldm
ov
ies
cha
nn
el(A
MC
)75.0
2.1
O>
YM
>U
nm
12
.D
isn
eyC
ha
nn
el4
1.8
1.2
Bl>
Wh
Y>
OF
>M
13
.D
isco
ver
yC
ha
nn
el78.9
2.3
M>
FM
>U
nm
14
.E
!E
nte
rta
inm
ent
Net
wo
rk43.6
1.2
M>
FU
nm
>M
15
.C
om
edy
Net
wo
rk54.9
1.5
Y>
OM
>F
16
.T
NN
,th
eN
ash
vil
leN
etw
ork
44.6
1.1
O>
Y
17
.U
SA
Net
wo
rk79.7
2.3
18
.F
am
ily
Net
wo
rk6
7.9
1.8
Lo
>H
i
19
.L
ifet
ime
Net
wo
rk73.2
2.0
F>
M
20.
A&
E,
Art
s&E
nte
rtain
men
t68.8
1.9
O>
YM
>F
21
.B
rav
o36.9
0.9
O>
Y
22
.H
isto
ryC
ha
nn
el53.3
1.4
O>
YM
>F
M>
Un
m
23
.S
ci-F
i(S
cien
ceF
icti
on
)N
etw
ork
52.2
1.4
24
.S
up
erst
ati
on
s(T
NT
,W
GN
,et
c.)
84.7
2.5
M>
FL
o>
Hi
25
.F
oo
dC
ha
nn
el24.8
0.6
F>
M
176 K. Neuendorf et al. / Telematics and Informatics 17 (2000) 169±197

26.
HG
TV
,H
om
e&
Gard
enC
han
nel
29.6
0.7
F>
M
27
.H
ealt
hN
etw
ork
31.3
0.7
28
.P
ay
-per
-vie
wo
�er
ing
s(P
PV
)3
6.7
0.5
Bl>
Wh
Y>
O
29
.W
eath
erC
ha
nn
el79.6
2.7
30
.B
ET
,B
lack
En
tert
ain
men
tT
V4
4.2
1.4
Bl>
Wh
Y>
O
31.
Tel
emu
nd
oan
dU
niv
isio
n(S
pan
ish
)15.8
0.4
32
.C
ou
rtT
V35.6
0.8
33
.C
art
oo
nN
etw
ork
42.9
1.4
Bl>
Wh
Y>
O
34.
Lea
rnin
gC
han
nel
54.1
1.5
Y>
O
35
.P
EG
Ch
an
nel
s(p
ub
lic
acc
ess)
36.7
±B
l>W
h
36
.S
po
rts
even
tso
nP
EG
12.9
±M
>F
37
.G
ov
ern
men
tp
rog
ram
min
go
nP
EG
13.8
±
aN
ote
:``
Mea
nfr
equ
ency
of
vie
win
g''
re¯
ects
a0±5
scale
for
each
chan
nel
or
chan
nel
set.
KE
Y:
Bl�
Bla
ck,
Wh�
Wh
ite,
Y�
yo
un
ger
(un
der
40
yr.
),
O�
old
er(4
0y
r.a
nd
old
er),
F�
fem
ale
,M�
male
,U
nm�
un
marr
ied
,M�
marr
ied
,H
i�h
igh
ered
uca
tio
n(a
bo
ve
med
ian
),L
o�
low
ered
uca
tio
n
(bel
ow
med
ian
).
K. Neuendorf et al. / Telematics and Informatics 17 (2000) 169±197 177
stations, News Channels, Sports Channels, American Movie Classics, DiscoveryChannel, USA Network, Lifetime Network, Superstations (e.g., TNT, WGN), andthe Weather Channel. As background for the subsequent factor analyses, the tablealso reports all signi®cant di�erences in frequency of viewership for the ®ve socialcategories of interest here.
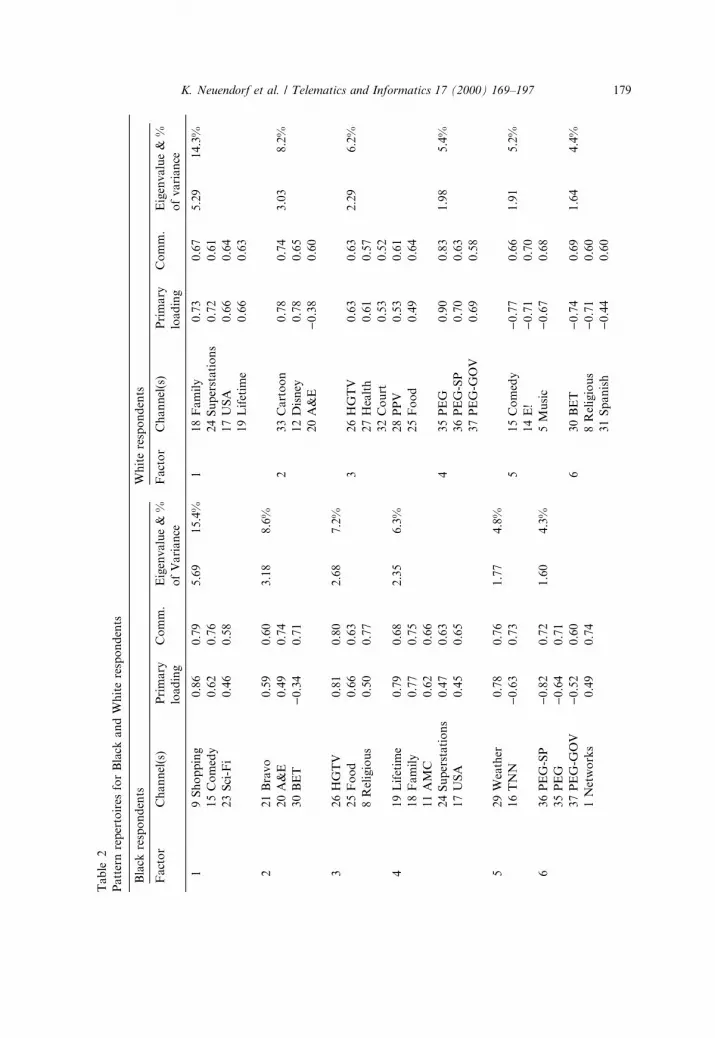
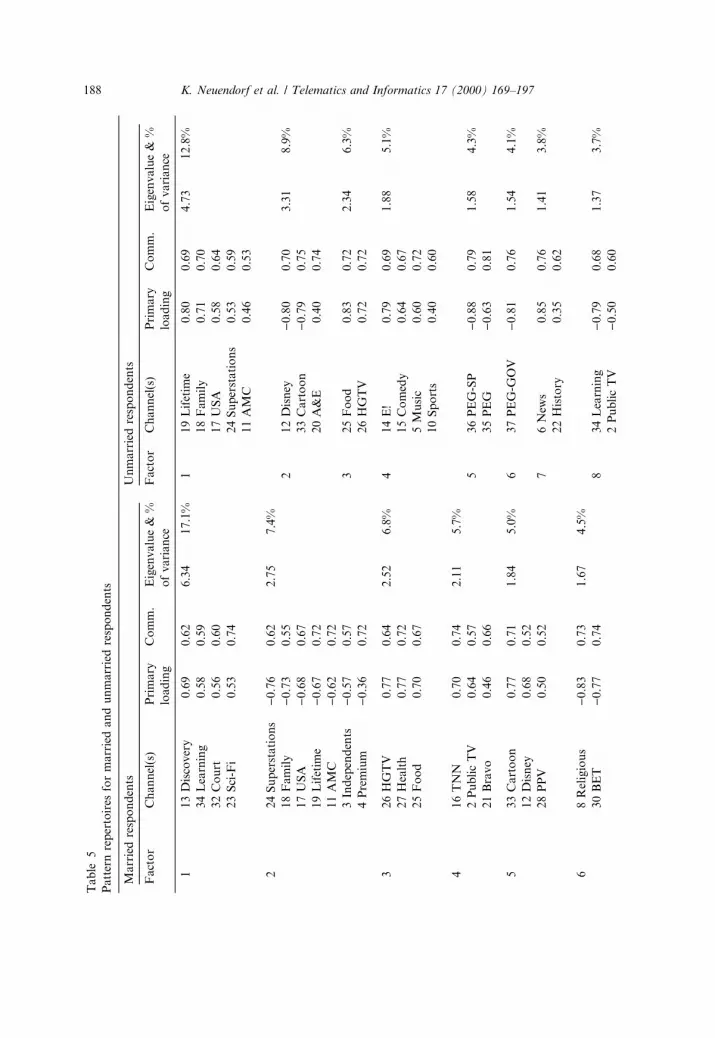
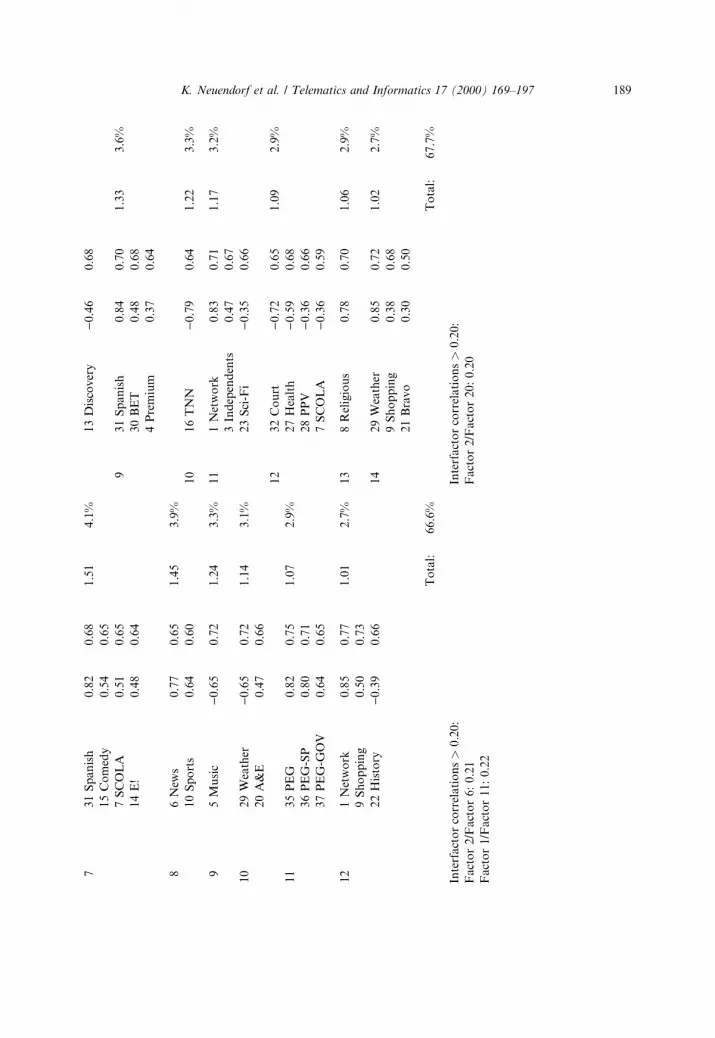
Tables 2±5 present pattern repertoires derived from oblique factor analyses usingthe latent root criterion, and utilizing frequency-weighted measures of viewership.For the sake of brevity, only primary loadings are displayed in each table. Inter-factor correlations of 0.20 or greater are reported near the bottom of each table.Also, at the end of each table, we have included the mean values for our ®ve rep-ertoire indicators by social categories, with signi®cant di�erences noted (Neuendorfet al., 1998).
It is important to note that the patterns displayed in the factor analysis tables arenot in order of frequency of viewership, but rather in order of strength of internalrelationships among exposure items. Thus, interpretations in this section will focusheavily on selected primary factors for each analysis.
Table 2 displays the pattern repertoires for Black and White respondents. Thenumber-one factor for Black viewers is one including Shopping Networks, theComedy Network, and the Sci-Fi Network; notice that none of these channelsare more heavily viewed by Blacks, or for that matter, Whites (see Table 1).However, the pattern of viewership ± the likelihood that a Black viewer who is afan of Shopping Networks will also more regularly watch the Comedy Networkand the Sci-Fi Network ± is quite strong, the strongest apparent pattern forBlack viewers. In contrast, this pattern is non-existent for White viewers ± i.e.,each of the three items is in a separate factor. The second factor for Blackviewers is one that might be interpreted as high culture-viewing Bravo and A&E,and not viewing BET (heavily programmed at present with music videos). Again,viewing of these channels is not strongly related for White respondents. The ®rstfactor for Whites is the basic, earlier-discussed people-oriented repertoire, which,with the addition of AMC, also constitutes a lesser pattern (Factor 4) for Blackrespondents.
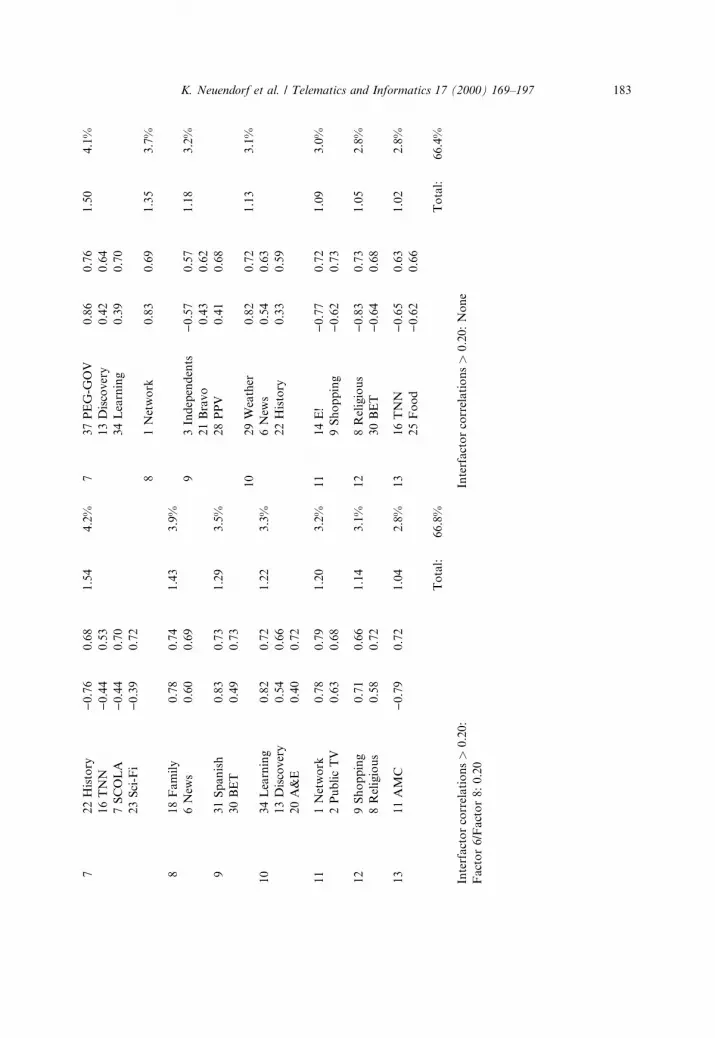
Table 3 contains a comparison of younger (under age 40) and older (age 40 andolder) respondents. Among younger viewers, a sort of civic-oriented pattern that isapparent in the ®rst factor ± viewership of all types of public access programming ± islinked with viewership of Court TV. While an earlier analysis (Atkin et al., 1998a)established that age was negatively related to public access sports viewing in par-ticular (e.g., high school football, baseball), the inclusion of Court TV as a minorloader raises the possibility of a broader orientation toward public access channels.The ®rst factor for older respondents is a full version of the previously de®ned``people-oriented'' repertoire; this factor is not at all intact for younger respondents,a ®nding unique among all factor analyses presented here. For younger respondents,the Lifetime Channel is grouped with pay channels, watching USA is related towatching independent channels, and Superstation viewing is correlated with the
178 K. Neuendorf et al. / Telematics and Informatics 17 (2000) 169±197
Tab
le2
Patt
ern
rep
erto
ires
for
Bla
ckan
dW
hit
ere
spo
nd
ents
Bla
ckre
spo
nd
ents
Wh
ite
resp
on
den
ts
Fact
or
Ch
an
nel
(s)
Pri
ma
ry
loa
din
g
Co
mm
.E
igen
valu
e&
%
of
Vari
an
ce
Fact
or
Ch
an
nel
(s)
Pri
mary
load
ing
Co
mm
.E
igen
valu
e&
%
of
vari
an
ce
19
Sh
op
pin
g0
.86
0.7
95.6
915.4
%1
18
Fam
ily
0.7
30
.67
5.2
914.3
%
15
Co
med
y0
.62
0.7
624
Su
per
stati
on
s0.7
20.6
1
23
Sci
-Fi
0.4
60.5
817
US
A0.6
60
.64
19
Lif
etim
e0.6
60.6
3
22
1B
rav
o0
.59
0.6
03.1
88.6
%
20
A&
E0
.49
0.7
42
33
Cart
oo
n0.7
80
.74
3.0
38.2
%
30
BE
T)
0.3
40.7
112
Dis
ney
0.7
80.6
5
20
A&
E)
0.3
80.6
0
32
6H
GT
V0
.81
0.8
02.6
87.2
%
25
Fo
od
0.6
60.6
33
26
HG
TV
0.6
30.6
32.2
96.2
%
8R
elig
iou
s0.5
00.7
727
Hea
lth
0.6
10.5
7
32
Co
urt
0.5
30.5
2
41
9L
ifet
ime
0.7
90.6
82.3
56.3
%28
PP
V0.5
30
.61
18
Fa
mil
y0
.77
0.7
525
Fo
od
0.4
90
.64
11
AM
C0
.62
0.6
6
24
Su
per
sta
tio
ns
0.4
70.6
34
35
PE
G0.9
00.8
31.9
85.4
%
17
US
A0
.45
0.6
536
PE
G-S
P0.7
00
.63
37
PE
G-G
OV
0.6
90
.58
52
9W
eath
er0
.78
0.7
61.7
74.8
%
16
TN
N)
0.6
30.7
35
15
Co
med
y)
0.7
70.6
61.9
15.2
%
14
E!
)0.7
10.7
0
63
6P
EG
-SP
)0
.82
0.7
21.6
04.3
%5
Mu
sic
)0.6
70
.68
35
PE
G)
0.6
40.7
1
37
PE
G-G
OV
)0
.52
0.6
06
30
BE
T)
0.7
40.6
91.6
44.4
%
1N
etw
ork
s0.4
90.7
48
Rel
igio
us
)0.7
10
.60
31
Sp
an
ish
)0.4
40
.60
K. Neuendorf et al. / Telematics and Informatics 17 (2000) 169±197 179

Ta
ble
2(C
on
tin
ued
)
Bla
ckre
spo
nd
ents
Wh
ite
resp
on
den
ts
Fa
cto
rC
ha
nn
el(s
)P
rim
ary
loa
din
g
Co
mm
.E
igen
valu
e&
%
of
Vari
an
ce
Fact
or
Ch
an
nel
(s)
Pri
mary
load
ing
Co
mm
.E
igen
valu
e&
%
of
vari
an
ce
72
Pu
bli
cT
V)
0.8
20.6
91.5
34.1
%
76
New
s)
0.6
20.5
11.5
34.1
%
81
3D
isco
ver
y0
.75
0.6
71.4
33.9
%22
His
tory
)0.6
10.6
4
14
E!
0.5
60.7
910
Sp
ort
s)
0.4
60.6
3
32
Co
urt
0.5
30.6
013
Dis
cover
y)
0.3
20.5
7
92
7H
ealt
h0
.77
0.7
81.3
73.7
%8
9S
ho
pp
ing
0.8
30.7
71.4
03.8
%
12
Dis
ney
0.6
00.6
71
Net
wo
rks
0.4
20.6
7
10
3In
dep
end
ents
0.7
30.7
31.2
43.3
%9
29
Wea
ther
0.7
60.6
51.2
63.4
%
31
Sp
an
ish
)0.4
90.6
434
Lea
rnin
g0.7
10.7
3
34
Lea
rnin
g)
0.3
90.7
721
Bra
vo
0.4
60.5
4
11
5M
usi
c0
.86
0.8
11.1
83.2
%10
2P
ub
lic
TV
0.7
30.6
31.2
13.3
%
3In
dep
end
ents
0.5
20.6
2
12
28
PP
V0
.69
0.6
71.0
82.9
%7
SC
OL
A0.5
00.5
6
4P
rem
ium
0.6
70.6
8
33
Ca
rto
on
0.5
30.7
411
23
Sci
-Fi
)0.7
10.7
01.1
93.2
%
4P
rem
ium
)0.6
50.7
3
13
6N
ews
0.8
00.7
31.0
22.8
%
7S
CO
LA
0.7
80.8
012
16
TN
N0.8
50.7
71.0
82.9
%
10
Sp
ort
s0
.55
0.6
811
AM
C0.5
20.6
5
22
His
tory
0.3
70.6
7
To
tal:
70.6
%T
ota
l:64.3
%
Inte
rfact
or
corr
elati
on
s>
0:2
0:
Inte
rfact
or
corr
elati
on
s>
0:2
0:
No
ne
Fa
cto
r11
/Fa
cto
r1
2:0
.21
180 K. Neuendorf et al. / Telematics and Informatics 17 (2000) 169±197

Bla
ckre
spo
nd
ents
Wh
ite
resp
on
den
ts
Co
mp
ari
son
of
mea
ns
Rep
erto
ire
20.2
18.7
Fre
qu
ency
-wei
gh
ted
rep
erto
ire
2.9
)1.6��
Pri
ma
ryre
per
toir
e6.9
6.1
Sec
on
dary
rep
erto
ire
16.4
14.7��
Ter
tia
ryre
per
toir
e7.7
7.8
**
Mea
ns
sig
ni®
can
td
i�er
ence
at
P<
0:0
1:
K. Neuendorf et al. / Telematics and Informatics 17 (2000) 169±197 181

Ta
ble
3
Pa
tter
nre
per
toir
esfo
ry
ou
ng
era
nd
old
erre
spo
nd
ents
Yo
un
ger
resp
on
den
tO
lder
resp
on
den
ts
Fa
cto
rC
ha
nn
el(s
)P
rim
ary
loa
din
g
Co
mm
.E
igen
valu
e&
%
of
Vari
an
ce
Fact
or
Ch
an
nel
(s)
Pri
mary
load
ing
Co
mm
.E
igen
valu
e&
%
of
Vari
an
ce
13
5P
EG
0.8
10.7
55.2
014.0
%1
19
Lif
etim
e0.7
90.6
95.8
615.8
%
36
PE
G-S
P0
.76
0.6
917
US
A0.7
70.7
0
37
PE
G-G
OV
0.5
80
.58
11
AM
C0.7
20.6
7
32
Co
urt
0.5
60.5
624
Su
per
stati
on
s0.6
90.6
7
18
Fam
ily
0.6
70.6
3
22
6H
GT
V0
.79
0.7
63.0
38.3
%20
A&
E0.5
80.6
3
25
Fo
od
0.7
60.6
9
27
Hea
lth
0.6
50.7
32
31
Sp
an
ish
0.7
30.6
22.8
77.8
%
29
Wea
ther
)0
.34
0.4
87
SC
OL
A0.6
80.6
0
23
Sci
-Fi
0.5
50.6
8
33
3C
art
oo
n0
.83
0.7
72.5
06.8
%15
Co
med
y0.4
10.5
9
12
Dis
ney
0.4
70.4
8
21
Bra
vo
)0
.40
0.5
43
33
Cart
oo
n0.7
80.7
82.1
45.8
%
10
Sp
ort
s0.3
40.6
612
Dis
ney
0.7
70.6
5
4P
rem
ium
0.4
10.6
6
44
Pre
miu
m0
.75
0.7
51.9
05.1
%
19
Lif
etim
e0
.71
0.7
24
36
PE
G-S
P)
0.8
40.7
22.0
05.4
%
28
PP
V0
.36
0.6
035
PE
G)
0.6
30.8
4
53
Ind
s.0
.77
0.6
61.5
84.5
%5
10
Sp
ort
s)
0.8
20.7
21.7
34.7
%
17
US
A0
.39
0.6
35
Mu
sic
0.5
50.6
2
61
5C
om
edy
0.7
60.6
41.5
64.2
%6
27
Hea
lth
0.7
10.6
51.6
54.5
%
14
E!
0.7
00.6
326
HG
TV
0.6
30.5
9
5M
usi
c0
.62
0.6
132
Co
urt
0.6
10.5
2
24
Su
per
sta
tio
ns
0.4
20.6
32
Pu
bli
cT
V0.4
40.6
0
182 K. Neuendorf et al. / Telematics and Informatics 17 (2000) 169±197
72
2H
isto
ry)
0.7
60
.68
1.5
44.2
%7
37
PE
G-G
OV
0.8
60.7
61.5
04.1
%
16
TN
N)
0.4
40
.53
13
Dis
cover
y0.4
20.6
4
7S
CO
LA
)0
.44
0.7
034
Lea
rnin
g0.3
90.7
0
23
Sci
-Fi
)0
.39
0.7
2
81
Net
wo
rk0.8
30.6
91.3
53.7
%
81
8F
am
ily
0.7
80
.74
1.4
33.9
%
6N
ews
0.6
00.6
99
3In
dep
end
ents
)0.5
70.5
71.1
83.2
%
21
Bra
vo
0.4
30.6
2
93
1S
pa
nis
h0
.83
0.7
31.2
93.5
%28
PP
V0.4
10.6
8
30
BE
T0
.49
0.7
3
10
29
Wea
ther
0.8
20.7
21.1
33.1
%
10
34
Lea
rnin
g0.8
20.7
21.2
23.3
%6
New
s0.5
40.6
3
13
Dis
cover
y0.5
40.6
622
His
tory
0.3
30.5
9
20
A&
E0
.40
0.7
2
11
1N
etw
ork
0.7
80.7
91.2
03.2
%11
14
E!
)0.7
70.7
21.0
93.0
%
2P
ub
lic
TV
0.6
30.6
89
Sh
op
pin
g)
0.6
20.7
3
12
9S
ho
pp
ing
0.7
10.6
61.1
43.1
%12
8R
elig
iou
s)
0.8
30.7
31.0
52.8
%
8R
elig
iou
s0.5
80.7
230
BE
T)
0.6
40.6
8
13
11
AM
C)
0.7
90
.72
1.0
42.8
%13
16
TN
N)
0.6
50.6
31.0
22.8
%
25
Fo
od
)0.6
20.6
6
To
tal:
66.8
%T
ota
l:66.4
%
Inte
rfa
cto
rco
rrel
ati
on
s>
0:2
0:
Inte
rfact
or
corr
elati
on
s>
0:2
0:
No
ne
Fact
or
6/F
act
or
8:
0.2
0
K. Neuendorf et al. / Telematics and Informatics 17 (2000) 169±197 183

Ta
ble
3(C
on
tin
ued
)
Yo
un
ger
resp
on
den
tsO
lder
resp
on
den
ts
Co
mp
ari
son
of
mea
ns
Rep
erto
ire
19.5
19.2
Fre
qu
ency
-wei
gh
ted
rep
erto
ire
0.1
0.1
Pri
mary
rep
erto
ire
6.4
6.4
Sec
on
dary
rep
erto
ire
15.6
15.4
Ter
tia
ryre
per
toir
e8.0
7.4
184 K. Neuendorf et al. / Telematics and Informatics 17 (2000) 169±197

Tab
le4
Pa
tter
nre
per
toir
esfo
rm
ale
an
dfe
ma
lere
spo
nd
ents
Ma
lere
spo
nd
ents
Fem
ale
resp
on
den
ts
Fact
or
Ch
an
nel
(s)
Pri
ma
ry
loa
din
g
Co
mm
.E
igen
valu
e&
%
of
vari
an
ce
Fact
or
Ch
an
nel
(s)
Pri
mary
load
ing
Co
mm
.E
igen
valu
ean
d
%o
fvari
an
ce
11
9L
ifet
ime
0.6
90.7
26.0
116.2
%1
19
Lif
etim
e0.8
20.7
34.9
813.5
%
18
Fam
ily
0.6
70.5
911
AM
C0.6
80.6
5
24
Su
per
sta
tio
ns
0.6
60.6
018
Fam
ily
0.6
30.5
4
11
AM
C0
.59
0.6
117
US
A0.6
00.6
3
17
US
A0
.53
0.6
020
A&
E0.5
60.6
9
24
Su
per
stati
on
s0.5
40.6
7
21
5C
om
edy
0.7
60.6
93.4
19.2
%3
Ind
s.0.3
00.4
5
14
E!
0.6
90.7
2
5M
usi
c0
.65
0.6
02
25
Fo
od
0.7
80.7
02.5
87.2
%
26
HG
TV
0.7
10.7
1
33
5P
EG
)0
.87
0.8
12.1
25.7
%
37
PE
G-G
OV
)0
.77
0.6
93
12
Dis
ney
)0.7
90.6
32.4
86.7
%
36
PE
G-S
P)
0.7
30.6
833
Cart
oo
n)
0.6
60.6
8
10
Sp
ort
s)
0.5
10.6
2
42
7H
ealt
h0
.81
0.7
02.0
15.4
%
26
HG
TV
0.7
80.6
64
6N
ews
)0.7
60.6
51.8
65.0
%
25
Fo
od
0.7
00.6
316
TN
N)
0.4
90.5
8
53
Ind
epen
den
ts0
.78
0.6
71.7
84.9
%5
2P
ub
lic
TV
)0.7
30.6
11.7
44.7
%
16
TN
N0
.32
0.4
59
Sh
op
pin
g0.4
90.5
7
14
E!
0.3
50.5
7
63
0B
ET
0.6
60.6
41.7
24.6
%
8R
elig
iou
s0.6
10.6
56
5M
usi
c)
0.6
50.5
81.5
84.3
%
13
Dis
cov
ery
)0
.51
0.5
834
Lea
rnin
g)
0.6
40.6
4
15
Co
med
y)
0.5
10.6
7
K. Neuendorf et al. / Telematics and Informatics 17 (2000) 169±197 185

Ta
ble
4(C
on
tin
ued
)
Ma
lere
spo
nd
ents
Fem
ale
resp
on
den
ts
Fa
cto
rC
ha
nn
el(s
)P
rim
ary
loa
din
g
Co
mm
.E
igen
valu
e&
%
of
vari
an
ce
Fact
or
Ch
an
nel
(s)
Pri
mary
load
ing
Co
mm
.E
igen
valu
ean
d
%o
fvari
an
ce
73
1S
pa
nis
h0
.70
0.6
81.5
34.1
%
21
Bra
vo
0.5
80.6
17
37
PE
G-G
OV
0.8
50.7
31.4
03.8
%
20
A&
E0
.57
0.6
735
PE
G0.6
40.7
8
22
His
tory
0.5
50.6
6
81
Net
wo
rk0.7
40.6
01.3
53.7
%
81
Net
wo
rk0
.76
0.7
21.3
13.5
%22
His
tory
)0.5
20.6
3
9S
ho
pp
ing
0.5
40.6
523
Sci
-Fi
)0.4
10.6
3
29
Wea
ther
0.4
70.4
113
Dis
cover
y)
0.4
10.5
7
2P
ub
lic
TV
0.4
60.6
2
931
Sp
an
ish
)0.7
90.6
91.3
13.5
%
93
4L
earn
ing
)0
.71
0.6
41.2
63.4
%28
PP
V)
0.5
70.5
7
23
Sci
-Fi
)0
.71
0.6
34
Pre
miu
m)
0.4
70.6
7
10
33
Ca
rto
on
0.6
80.7
11.1
63.1
%10
29
Wea
ther
0.7
50.6
51.2
43.4
%
12
Dis
ney
0.6
70.5
821
Bra
vo
0.4
50.5
5
28
PP
V0
.62
0.6
7
4P
rem
ium
0.5
50.5
911
32
Co
urt
)0.7
00.5
31.1
13.0
%
7S
CO
LA
)0.6
10.6
6
11
7S
CO
LA
0.5
50.6
31.1
23.0
%27
Hea
lth
)0.5
40.6
6
6N
ews
0.5
20.6
0
10
Sp
ort
s0
.51
0.5
512
36
PE
G-S
P)
0.9
00.8
21.0
72.9
%
32
Co
urt
0.3
80.5
2
13
8R
elig
iou
s0.9
00.8
11.0
42.8
%
30
BE
T0.5
00.7
1
To
tal:
63.3
%T
ota
l:64.5
%
Inte
rfact
or
corr
elati
on
s>
0:2
0:
Inte
rfact
or
corr
elati
on
s>
0:2
0:
Fa
cto
r1/F
act
or
9:)
0.2
1N
on
e.
Fa
cto
r4/F
act
or
9:)
0.2
1
Fa
cto
r7/F
act
or
9:)
0.2
1
186 K. Neuendorf et al. / Telematics and Informatics 17 (2000) 169±197

Male
resp
on
den
tsF
emale
resp
on
den
ts
Co
mp
ari
son
of
mea
ns
Rep
erto
ire
19.7
19.0
Fre
qu
ency
-wei
gh
ted
rep
erto
ire
1.6
)1.2
Pri
mary
rep
erto
ire
7.0
5.9��
Sec
on
da
ryre
per
toir
e15.8
15.1
Ter
tia
ryre
per
toir
e7.3
8.0
**
Mea
ns
sig
ni®
can
td
i�er
ence
at
P<
0:0
1:
K. Neuendorf et al. / Telematics and Informatics 17 (2000) 169±197 187
Ta
ble
5
Pa
tter
nre
per
toir
esfo
rm
arr
ied
an
du
nm
arr
ied
resp
on
den
ts
Ma
rrie
dre
spo
nd
ents
Un
marr
ied
resp
on
den
ts
Fa
cto
rC
ha
nn
el(s
)P
rim
ary
loa
din
g
Co
mm
.E
igen
valu
e&
%
of
vari
an
ce
Fact
or
Ch
an
nel
(s)
Pri
mary
load
ing
Co
mm
.E
igen
valu
e&
%
of
vari
an
ce
11
3D
isco
ver
y0.6
90.6
26.3
417.1
%1
19
Lif
etim
e0.8
00.6
94.7
312.8
%
34
Lea
rnin
g0
.58
0.5
918
Fam
ily
0.7
10.7
0
32
Co
urt
0.5
60.6
017
US
A0.5
80.6
4
23
Sci
-Fi
0.5
30.7
424
Su
per
stati
on
s0.5
30.5
9
11
AM
C0.4
60.5
3
22
4S
up
erst
ati
on
s)
0.7
60.6
22.7
57.4
%
18
Fa
mil
y)
0.7
30.5
52
12
Dis
ney
)0.8
00.7
03.3
18.9
%
17
US
A)
0.6
80.6
733
Cart
oo
n)
0.7
90.7
5
19
Lif
etim
e)
0.6
70.7
220
A&
E0.4
00.7
4
11
AM
C)
0.6
20.7
2
3In
dep
end
ents
)0
.57
0.5
73
25
Fo
od
0.8
30.7
22.3
46.3
%
4P
rem
ium
)0
.36
0.7
226
HG
TV
0.7
20.7
2
32
6H
GT
V0
.77
0.6
42.5
26.8
%4
14
E!
0.7
90.6
91.8
85.1
%
27
Hea
lth
0.7
70.7
215
Co
med
y0.6
40.6
7
25
Fo
od
0.7
00.6
75
Mu
sic
0.6
00.7
2
10
Sp
ort
s0.4
00.6
0
41
6T
NN
0.7
00.7
42.1
15.7
%
2P
ub
lic
TV
0.6
40.5
75
36
PE
G-S
P)
0.8
80.7
91.5
84.3
%
21
Bra
vo
0.4
60.6
635
PE
G)
0.6
30.8
1
53
3C
art
oo
n0
.77
0.7
11.8
45.0
%6
37
PE
G-G
OV
)0.8
10.7
61.5
44.1
%
12
Dis
ney
0.6
80.5
2
28
PP
V0
.50
0.5
27
6N
ews
0.8
50.7
61.4
13.8
%
22
His
tory
0.3
50.6
2
68
Rel
igio
us
)0
.83
0.7
31.6
74.5
%
30
BE
T)
0.7
70.7
48
34
Lea
rnin
g)
0.7
90.6
81.3
73.7
%
2P
ub
lic
TV
)0.5
00.6
0
188 K. Neuendorf et al. / Telematics and Informatics 17 (2000) 169±197
73
1S
pa
nis
h0
.82
0.6
81.5
14.1
%13
Dis
cover
y)
0.4
60.6
8
15
Co
med
y0
.54
0.6
5
7S
CO
LA
0.5
10.6
59
31
Sp
an
ish
0.8
40.7
01.3
33.6
%
14
E!
0.4
80.6
430
BE
T0.4
80.6
8
4P
rem
ium
0.3
70.6
4
86
New
s0
.77
0.6
51.4
53.9
%
10
Sp
ort
s0
.64
0.6
010
16
TN
N)
0.7
90.6
41.2
23.3
%
95
Mu
sic
)0
.65
0.7
21.2
43.3
%11
1N
etw
ork
0.8
30.7
11.1
73.2
%
3In
dep
end
ents
0.4
70.6
7
10
29
Wea
ther
)0
.65
0.7
21.1
43.1
%23
Sci
-Fi
)0.3
50.6
6
20
A&
E0
.47
0.6
6
12
32
Co
urt
)0.7
20.6
51.0
92.9
%
11
35
PE
G0
.82
0.7
51.0
72.9
%27
Hea
lth
)0.5
90.6
8
36
PE
G-S
P0
.80
0.7
128
PP
V)
0.3
60.6
6
37
PE
G-G
OV
0.6
40.6
57
SC
OL
A)
0.3
60.5
9
12
1N
etw
ork
0.8
50.7
71.0
12.7
%13
8R
elig
iou
s0.7
80.7
01.0
62.9
%
9S
ho
pp
ing
0.5
00.7
3
22
His
tory
)0
.39
0.6
614
29
Wea
ther
0.8
50.7
21.0
22.7
%
9S
ho
pp
ing
0.3
80.6
8
21
Bra
vo
0.3
00.5
0
To
tal:
66.6
%T
ota
l:67.7
%
Inte
rfa
cto
rco
rrel
ati
on
s>
0:2
0:
Inte
rfact
or
corr
elati
on
s>
0:2
0:
Fact
or
2/F
act
or
6:
0.2
1F
act
or
2/F
act
or
20:
0.2
0
Fact
or
1/F
act
or
11
:0
.22
K. Neuendorf et al. / Telematics and Informatics 17 (2000) 169±197 189

Ta
ble
5(C
on
tin
ued
)
Marr
ied
resp
on
den
tsU
nm
arr
ied
resp
on
den
ts
Co
mp
ari
son
of
mea
ns
Rep
erto
ire
19.4
19.2
Fre
qu
ency
-wei
gh
ted
rep
erto
ire
0.6
)0.4
Pri
mary
rep
erto
ire
6.7
6.1
Sec
on
da
ryre
per
toir
e15.7
15.1
Ter
tia
ryre
per
toir
e7.4
7.9
190 K. Neuendorf et al. / Telematics and Informatics 17 (2000) 169±197

Tab
le6
Patt
ern
rep
erto
ires
for
low
eran
dh
igh
ered
uca
ted
resp
on
den
ts
Lo
wer
edu
cati
on
resp
on
den
tsH
igh
ered
uca
tio
nre
spo
nd
ents
Fact
or
Ch
an
nel
(s)
Pri
ma
ry
loa
din
g
Co
mm
.E
igen
valu
e&
%
of
vari
an
ce
Fact
or
Ch
an
nel
(s)
Pri
mary
load
ing
Co
mm
.E
igen
valu
e&
%
of
vari
an
ce
13
2C
ou
rt0
.66
0.5
84.9
513.4
%1
19
Lif
etim
e0.7
90.7
05.9
16.0
%
27
Hea
lth
0.6
10.7
318
Fam
ily
0.6
70.5
8
21
Bra
vo
0.4
70.5
117
US
A0.6
30.6
2
7S
CO
LA
0.3
90.6
124
Su
per
stati
on
s0.6
00.6
4
11
AM
C0.4
40.5
9
23
3C
art
oo
n)
0.7
70.7
13.0
08.1
%4
Pre
miu
m0.3
70.5
8
12
Dis
ney
)0
.69
0.6
4
28
PP
V)
0.5
00.6
22
33
Cart
oo
n)
0.7
60.7
52.3
87.8
%
12
Dis
ney
)0.7
60.5
8
31
9L
ifet
ime
)0
.78
0.7
72.5
67.2
%20
A&
E0.3
70.6
5
18
Fa
mil
y)
0.7
30.6
3
24
Su
per
sta
tio
ns
)0
.66
0.6
73
26
HG
TV
0.8
20.7
32.4
46.6
%
17
US
A)
0.6
00.7
325
Fo
od
0.7
30.6
5
11
AM
C)
0.5
00.6
127
Hea
lth
0.6
90.6
4
20
A&
E)
0.4
20.5
910
Sp
ort
s)
0.3
30.6
1
41
4E
!)
0.7
90.6
81.8
55.0
%4
35
PE
G0.8
30.7
61.9
65.3
%
5M
usi
c)
0.6
40.7
137
PE
G-G
OV
0.7
50.6
5
15
Co
med
y)
0.6
00.6
536
PE
G-S
P0.7
10.6
4
52
5F
oo
d0.8
00.7
51.8
34.9
%5
8R
elig
iou
s0.6
90.7
21.7
54.7
%
26
HG
TV
0.5
70.6
513
Dis
cover
y)
0.3
50.5
7
68
Rel
igio
us
)0.7
50.7
11.6
74.5
%6
34
Lea
rnin
g0.7
60.7
21.7
14.6
%
30
BE
T)
0.7
00.6
723
Sci
-Fi
0.5
80.6
4
31
Sp
an
ish
)0
.31
0.5
82
Pu
bli
cT
V0.4
20.7
0
72
3S
ci-F
i)
0.7
30.6
81.5
44.2
%7
7S
CO
LA
0.7
50.6
81.4
43.9
%
4P
rem
ium
)0
.51
0.6
86
New
s0.5
10.6
9
1N
etw
ork
)0
.51
0.6
828
PP
V0.4
90.7
0
22
His
tory
)0
.41
0.6
332
Co
urt
0.4
50.5
2
K. Neuendorf et al. / Telematics and Informatics 17 (2000) 169±197 191

Ta
ble
6(C
on
tin
ued
)
Lo
wer
edu
cati
on
resp
on
den
tsH
igh
ered
uca
tio
nre
spo
nd
ents
Fa
cto
rC
ha
nn
el(s
)P
rim
ary
loa
din
g
Co
mm
.E
igen
valu
e&
%
of
vari
an
ce
Fact
or
Ch
an
nel
(s)
Pri
mary
load
ing
Co
mm
.E
igen
valu
e&
%
of
vari
an
ce
82
Pu
bli
cT
V0
.75
0.6
41.3
43.6
%8
1N
etw
ork
0.8
40.7
51.3
33.6
%
9S
ho
pp
ing
0.4
20.6
9
91
3D
isco
ver
y0.8
00.7
41.2
33.3
%3
Ind
epen
den
ts0.3
70.5
5
34
Lea
rnin
g0
.54
0.5
8
914
E!
0.7
20.6
71.2
63.4
%
10
6N
ews
0.7
90.6
81.1
83.2
%15
Co
med
y0.7
20.6
8
29
Wea
ther
0.5
80.5
85
Mu
sic
0.3
60.6
2
11
9S
ho
pp
ing
0.8
90.8
31.1
73.2
%10
31
Sp
an
ish
0.7
80.7
01.2
43.3
%
16
TN
N0
.46
0.6
030
BE
T0.4
20.7
1
12
3In
dep
end
ents
)0
.83
0.7
21.1
03.0
%11
29
Wea
ther
)0.8
20.6
71.1
03.0
%
21
Bra
vo
)0.5
20.5
8
13
35
PE
G0
.75
0.7
71.0
12.7
%
36
PE
G-S
P0
.68
0.7
212
16
TN
N0.7
00.6
01.0
72.9
%
37
PE
G-G
OV
0.5
90.6
922
His
tory
0.5
20.5
9
10
Sp
ort
s0
.57
0.5
0
To
tal:
66.3
%T
ota
l:65.2
%
Inte
rfa
cto
rco
rrel
ati
on
s>
0.2
0:
Inte
rfact
or
corr
elati
on
s>
0.2
0:
No
ne.
Fact
or
1/F
act
or
9:
0.2
1
Lo
wer
edu
cati
on
resp
on
den
tsH
igh
ered
uca
tio
nre
spo
nd
ents
Co
mp
ari
son
of
mea
ns
Rep
erto
ire
19.3
19.3
Fre
qu
ency
-wei
gh
ted
rep
erto
ire
1.2
)1.1
Pri
mary
rep
erto
ire
7.1
5.7��
Sec
on
da
ryre
per
toir
e15.7
15.1
Ter
tia
ryre
per
toir
e7.1
8.2��
**
Mea
ns
sig
ni®
can
tly
di�
eren
ta
tP<
0:0
1:
192 K. Neuendorf et al. / Telematics and Informatics 17 (2000) 169±197
viewing of a range of entertainment fare ± Comedy, E!, and Music Channels.Viewing of the Family Channel is linked with News Channel viewing.
The second factor for older respondents is mystifying. While the co-presence ofSpanish language channels and SCOLA indicates a multicultural outlook, the minorloadings of the Sci-Fi Network and the Comedy Channel do not have apparent facevalidity.
In Table 4, we see the results of comparative factor analyses for male and femalerespondents. The ®rst factors for the two groups are similar ± both are variations onthe people-oriented repertoire. However, females seem to have a larger people-ori-ented repertoire (consistent with the Nathanson et al. (1997) ®ndings). The role ofSports Channels is divergent between the male and female groups. For males, SportsChannels are part of a minor factor, in a repertoire with news-oriented program-ming. For females, sports ®t with the Disney and Cartoon Channels ± more of a ``funand games'' framing.
Table 5 displays a comparison of married and unmarried (i.e., divorced, widowed,never married) respondents. The people-oriented repertoire is important for bothgroups, with a slightly larger repertoire for married respondents. Each group alsohas a food/home/garden factor that is prominent. In terms of di�erences, a uniquetype of apparently informational repertoire is represented by the ®rst factor formarried respondents ± Discovery Channel, Learning Channel, Court TV, and (un-expectedly) the Sci-Fi Network constitute the most important viewing pattern forthis group.
A comparison of lower education and higher education respondents (via a mediansplit) is shown in Table 6. The ubiquitous people-oriented repertoire is present as animportant viewing pattern for both educational groups, but is more important forthe higher educated group. The ®rst factor for lower educated respondents is anintriguing mix of seemingly informational/cultural sources ± Court TV, HealthChannel, Bravo, and SCOLA.
8. Discussion
This study has demonstrated the utility of combining a factor analytic approachto examining CRs with an investigation of interest maximization. We see support forthe notion that audiences can be meaningfully segmented across di�erent socialcategories with characteristic tastes. In particular, with regard to Research Question1, the data provide clear evidence of interest maximization manifested in comple-mentary viewing of certain functionally similar channels. That is, at least some setsof functionally similar channels seem to provide reinforcement or complementarity,rather than replacement for every group examined in the analyses. Fans of onechannel do generally tend to seek redundant programming in particular patternsidenti®ed in this investigation. Certain pattern repertoires appear robust across so-cial groupings.
K. Neuendorf et al. / Telematics and Informatics 17 (2000) 169±197 193

For example, the people-oriented repertoire of the Family Channel, Supersta-tions, USA Network, and Lifetime, sometimes joined by other channels such as A&Eor AMC, is present in nearly every factor solution. The clustering of Home andGarden TV (HGTV), the Health Channel, and the Food Channel is also fairly ro-bust. And, of course, the repertoire of the three measures of public access viewing ±PEG in general, PEG sports, and PEG government ± holds together across socialcategories.
In the context of utility theory, these ®ndings support the notion of an audienceseeking redundancy rather than variety (Donohew and Tipton, 1973), with thehomogenous viewing patterns predicted by interest maximization (Je�res, 1978).Most factor groupings possess high face validity for a complementarity dynamic.However, the exceptions (e.g., Sci-Fi Network grouped with Discovery Channel,Learning Channel, and Court TV for married respondents) introduce a hint ofDonohew and TiptonÕs (1973) variety/redundancy oscillation dynamic, withredundancy winning out over variety in general in this set of aggregate analyses.And, we did anticipate other complementary repertoires that did not emerge. Forexample, we expected to ®nd groupings of similar public-a�airs channels (e.g., PublicTV, PEG), but the clusters observed are rather broader than anticipated (Reaganet al., 1995).
In response to RQ2, we do see some clear di�erences in pattern repertoires be-tween social groupings. Some individual channels apparently are likely to servedi�erent functions for di�erent individuals, and we do see systematic selective clus-tering of channels between di�erent social category groupings. Examples of thistendency for channel ``splitting'' are too numerous to inventory, but some of themore intriguing include:
· The role of E! Entertainment Network varies ± as entertainment grouped withcomedy and music for younger respondents, while grouped with shopping for old-er respondents. Also, E! is grouped with surveillance sources for Black respon-dents (with Discovery, Court TV).
· Sports Channel viewing is related to news viewing for males, while it is related toviewing of adolescent fare (Disney, Cartoon Network) among females.
· The role of BET varies for Black and White respondents ± it is negatively relatedto Bravo and A&E viewing for Blacks, while for Whites it is correlated with view-ing of religious and Spanish-language Channels, in a sort of cultural-exchangerepertoire.
· Viewing of Bravo is all over the place ± sometimes linked with A&E, sometimeswith pay-per-view, at other times with Spanish-language Channels, the HistoryChannel, or even the Weather Channel.
· The Cartoon Network and the Disney Channel most often go together, but as apair are combined variously with other channels ± with Sports Channels foryounger respondents and for females, with premium channels for older respon-dents, with pay-per-view channels for married respondents, for males, and for
194 K. Neuendorf et al. / Telematics and Informatics 17 (2000) 169±197
those of lower education, and with not viewing A&E for White respondents, forunmarried respondents, and for those of higher education.
We also see some unique repertoires for certain social category groupings: Forexample, the unique informational repertoire of married respondents (Factor 1), andthe Spanish/SCOLA/Sci-Fi/Comedy repertoire of older respondents (Factor 2).Unfortunately, since this study did not examine audience perceptions of channels,nor their goals and motivations for viewing, our interpretations can only be inferredfrom viewership patterns (see e.g., Swanson, 1987). For some repertoires, the in-terpretation is readily apparent. For others, including those just mentioned, a sat-isfying interpretation is not readily at hand.
Thus, for the second part of RQ2, inquiring whether repertoire di�erences supportan interest maximization perspective, the evidence is not clear. Only in isolated in-stances can we point de®nitively to a pattern repertoire that prima facie meets theneeds of a certain social grouping. For example, the grouping of sports with news formales only supports a hegemonic view of a male-dominated sports industry. Thisdynamic could explain why gatekeepers in that group made dysfunctional miscal-culations, such as ABCÕs overbid (and ®nancial loss) for Monday Night Football;male executives failed to anticipate its unpopularity with the audience at large. 3
Limitations of using factor analysis for any purpose ought to be noted. Largeanalyses such as those reported here typically include some relatively low commu-nalities and low loadings (with substantial secondary loadings), and this study is noexception. And, the variance explained by the factor solutions in this study rangesfrom 63.3% to 70.6% for an 11- to 14-factor solution. Thus, up to a third of the totalvariance is left unexplained. Still, the factor analyses present a new and useful way ofexamining CR.
Future research needs to extend this approach beyond the single market studiedhere and employ more social category comparisons over time. Exigencies of theparticular client-oriented data collection reported here prevented the inclusion ofdetailed measures of viewing motives, uses and grati®cations. Studies to followshould include such measures, in order to develop de®nitive links between grati®-cations sought and pattern repertoires accessed. And while the aggregate analysespresented here provide a baseline template for studying the concept of patternrepertoire, an individual-di�erences approach should prove more fruitful in detailingthe relationship between interests and the accessing of content that can maximizethose interests. Later work should also employ structural or regression models to test
3 It could be argued that ABC was willing to overpay for football because, according to a larger
accounting scheme, the prestige of carrying professional football brings with it less tangible bene®ts such
as prestige and a�liate loyalty. Similar dynamics prompted Rupert Murdoch to bid a new record high for
its Sunday NFL franchise, thereby enhancing FoxÕs standing as a ``major'' network and depriving a
competitor (CBS) of quality sports programming.
K. Neuendorf et al. / Telematics and Informatics 17 (2000) 169±197 195
the applicability of the factors uncovered here. Finally, it would be useful to extendthis analysis to other media such as the Internet as they continue to reshape themedia environment.
In conclusion, the evidence presented here gives us enough support of the exis-tence of interest maximization in the aggregate to allow us to move forward todocument this process at the individual level. The present study supports observa-tions that the age of media abundance is here, but it is not precisely a television ofabundance. The content menu at the turn of the millennium is ®rst of all a cableenvironment of abundance, and for many it is a hyper-world of abundance, repletewith Internet, cable, videotape and videodisc options. We have only begun to tap thisinformation environmentÕs complexity, and the manner in which users organize,access, and make sense of their information world.
References
Agostino, D.E., 1974. A comparison of television consumer behavior between broadcast and cableviewers.
Ph.D. dissertation, Ohio University, Athens, OH.
Atkin, D.J., Neuendorf, K.A., Je�res, L.W., 1998a. Reassessing public support for public access
cablevision: a faded passion? Telematics and Informatics 15, 67±84.
Atkin, D.J., Neuendorf, K.A., Je�res, L.W., 1998b. Understanding internet adoption as telecommuni-
cations behavior. Journal of Broadcasting & Electronic Media 42, 475±490.
Becker, L.B., Dunwoody, S., Rafaeli, S., 1983. CableÕs impact on use of other media. Journal of
Broadcasting 27, 127±140.
Berlyne, D.E., 1970. Novelty, complexity, and hedonic value. Perception and Psychophysics 8, 279±286.
Berlyne, D.E., 1971. Aesthetics and Psychobiology. Appleton-Century-Crofts, New York.
Berniker, H., 1995. Internet begins to cut into TV viewing. Broadcasting & Cable, 6 November, 113.
Childers, T., Krugman, D., 1987. The competitive environment of pay-per-view. Journal of Broadcasting
& Electronic Media 31, 335±342.
Collins, J., Reagan, J., Abel, J.D., 1983. Predicting cable subscribership: local factors. Journal of
Broadcasting 27 (2), 177±183.
Crispell, D., 1997. The Internet of TV. American Demographics, May, 14±15.
Donohew, L., Tipton, L., 1973. A conceptual model of information seeking, avoiding, and processing. In:
Clarke, P. (Ed.), New Models for Mass Communication Research. Sage, Beverly Hills, pp. 243±268.
Ferguson, D.A., Melkote, S.R., 1997. Leisure time and channel repertoire in a multichannel environment.
Communication Research Reports 14, 194±198.
Grotta, G., Newsom, D., 1983. How does cable television relate to other media use patterns? Journalism
Quarterly Winter, 588±591.
Heeter, C., 1985. Program selection with abundance of choice: a process model. Human Communication
Research 12, 126±152.
Henke, L., Donohue, T.R., 1989. Functional displacement of traditional TV viewing by VCR owners.
Journal of Advertising Research April/May, 18±23.
James, M.L., Wotring, C.E., Forrest, E.J., 1995. An exploratory study of the perceived bene®ts of
electronic bulletin board use and their impact on other communication activities. Journal of
Broadcasting & Electronic Media 39, 30±50.
Je�res, L.W., 1978. Cable TV and interest maximization. Journalism Quarterly 55 (1), 149±154.
Je�res, L.W., Atkin, D., 1996. Predicting use of technologies for consumer and communication needs.
Journal of Broadcasting & Electronic Media 40, 318±330.
196 K. Neuendorf et al. / Telematics and Informatics 17 (2000) 169±197

Kang, M.E., Atkin, D., 1999. Exploring the role of media uses and grati®cations in multimedia cable
adoption. Telematics and Informatics 16, 1±16.
LaRose, R., Atkin, D., 1988a. Satisfaction, demographic and media environment predictors of cable
subscription. Journal of Broadcasting & Electronic Media 32, 403±413.
LaRose, R., Atkin, D., 1988b. An analysis of cable subscription as telecommunication behavior.
Telematics and Informatics 5 (4), 388±401.
LaRose, R., Atkin, D., 1991. Attributes of movie distribution channels and consumer choice. Journal of
Media Economics 4, 3±17.
Lasswell, H., 1948. The structure and function of communication in society. In: Bryson, L. (Ed.), The
Communication of Ideas. Harper, New York, pp. 37±51.
Lin, C.A., 1993. Exploring the role of VCR use in the emerging home entertainment culture. Journalism
Quarterly 70, 833±842.
Lin, C.A., 1994. Audience fragmentation in a competitive video marketplace. Journal of Advertising
Research 34 (6), 1±17.
Lin, C.A., 1999. Online-service adoption likelihood. Journal of Advertising Research 39, 79±89.
Lin, C.A., Je�res, L., 1998. Factors in¯uencing the adoption of multimedia cable technology. Journalism
& Mass Communication Quarterly 75, 341±352.
Miller, M.M., 1972. Task orientation and salience as determinants of source utility. Journalism Quarterly
49, 669±673.
Nathanson, A.I., Perse, E.M., Ferguson, D.A., 1997. Gender di�erences in television use: an exploration
of the instrumental-expressive dichotomy. Communication Reports 14, 176±188.
Neuendorf, K.A., Atkin, D.J., Je�res, L., 1998. Reconceptualizing channel repertoire in the urban cable
environment. Paper presented at the annual conference of the Midwest Association for Public Opinion
Research, Chicago, IL.
Perse, E.M., Ferguson, D.A., McLeod, D.M., 1994. Cultivation in the newer media environment.
Communication Research 21, 79±104.
Reagan, J., 1987. Classifying adopters and nonadopters for technologies using political activity, media use
and demographic variables. Telematics and Informatics 4, 3±16.
Reagan, J., Pinkleton, B., Chen, C., Aaronson, D., 1995. How do technologies relate to the repertoire of
information sources? Telematics and Informatics 12, 21±27.
Robinson, J.P., 1981. Television and leisure time: a new scenario. Journal of Communication 31 (1), 120±
130.
Sparkes, V., 1983. Public perception of and reaction to multi-channel cable television service. Journal of
Broadcasting 27, 163±175.
Sparkes, V., Kang, N., 1986. Public reactions to cable television: time in the di�usion process. Journal of
Broadcasting 30, 213±222.
Swanson, D.L., 1987. Grati®cation seeking, media exposure, and audience interpretations: some directions
for research. Journal of Broadcasting & Electronic Media 31, 237±254.
Webster, J.G., Lichty, L.W., 1991. Ratings Analysis: Theory and Practice. Erlbaum, Hillsdale, NJ.
K. Neuendorf et al. / Telematics and Informatics 17 (2000) 169±197 197