Characterization of Atypical Aeromonas salmonicida Different Methods
Upload
khangminh22Category
view
1download
0
The structure and function of attention in typical and atypical
development
Kate Breckenridge
University College London
Thesis submitted for the degree of
Doctor of Philosophy, October 2007

UMI Number: U591859
All rights reserved
INFORMATION TO ALL USERS The quality of this reproduction is dependent upon the quality of the copy submitted.
In the unlikely event that the author did not send a complete manuscript and there are missing pages, these will be noted. Also, if material had to be removed,
a note will indicate the deletion.
Dissertation Publishing
UMI U591859Published by ProQuest LLC 2013. Copyright in the Dissertation held by the Author.
Microform Edition © ProQuest LLC.All rights reserved. This work is protected against
unauthorized copying under Title 17, United States Code.
ProQuest LLC 789 East Eisenhower Parkway
P.O. Box 1346 Ann Arbor, Ml 48106-1346

Declaration
I, Kate Breckenridge, confirm that the work presented in this thesis is my own. Where
information has been derived from other sources, I confirm that this has been indicated in the
thesis.
Signed
Date: 22nd October 2007
2

ABSTRACT
The attention test batteries currently available for developmental assessment are mostly too
challenging for children younger than 6 years, and are often unsuitable for children with
developmental delay or attention deficits. With younger children, the process of assessing
complex functions of attention is challenging. However, the emergence of attention mechanisms
is a key developmental issue, which would benefit from more suitable tools for the assessment of
attention in early childhood. This thesis describes the development of a battery designed to test
multiple components of attention in children with a mental age between 3 and 6 years, including
children with developmental disorders as well as typically-developing children. A considerable
literature devoted to the nature and organisation of attention functions has suggested separable
components of selective attention, sustained attention and attentional control (e.g. Posner &
Petersen, 1990; Mirsky et al, 1991; Manly et al, 2001; Fan et al, 2002). However, most of this
work has used adult or school-age participants. This study used the new battery to explore
whether this model provides an accurate description of attention in early childhood. Factor
analysis provided support for the hypothesised model, but suggested that changes in the structure
of attention occur over the preschool age range. The battery was also used to examine how
attention is affected in two developmental disorders where attention problems are common:
Williams syndrome and Down’s syndrome. By using a range of tests to assess different aspects
of attention, it is possible to establish whether observed attention problems are global or specific
to particular components. Both groups showed patterns of impairment that varied across
subtests, with some deficits common to both groups, and others present only in one group.
These results are considered in relation to what is known about the structure of attention in
adults and older children, its neuroanatomy and the atypical development of attention in
childhood disorders. This thesis highlights the need for a more developmental perspective that
takes into account changes in the structure and function of attention over the lifespan.
3

ACKNOWLEDGEMENTS
I would like to thank and acknowledge the members of the Visual Development Unit for their
help and support, especially Shirley Anker, Dee Birtles, Stephanie Riak-Akuei and Marko
Nardini; as well as the combined experience, leadership and supervision of Janette Atkinson,
Oliver Braddick and John Wattam-Bell. I appreciate being able to work as part of such an
established and respected team. I am also grateful to Margaret Woodhouse for her enthusiastic
support of the work described in chapter 6, and to Chris McManus for helpful advice on the
statistical analysis. I would also like to thank all of the children, parents, schools and teachers
involved in the studies described in this thesis, without whom none of the work would have been
possible. Particular thanks to Gateway primary school, Marylebone; St. Paul’s primary school,
Winchmore Hill; and Yerbury primary school, Tufnell Park for continued and enthusiastic
assistance. Thanks also to my family, especially my parents, who have supported my academic
efforts despite fears of eternal student-hood. This work was supported by a BBSRC studentship,
with additional financial and practical support from the Williams Syndrome Foundation UK, for
which I am also very grateful.
4

CONTENTS
Page
Abstract 3
Acknowledgements 4
Contents 5
Index of Figures and Tables 7
Chapter 1 Introduction 9
1.1 Definitions of attention 10
1.2 Measuring attention in children 14
1.3 Examining attention models in adults 19
1.4 Developmental studies of attention models 24
1.5 Neuroanatomy of attention components 32
1.6 Attention in developmental disorders 36
Chapter 2 The current study 43
2.1 Rationale 44
2.2 Research questions 44
Chapter 3 Development of the preschool attention battery 46
3.1 Inspiration for the battery 47
3.2 Key considerations in test development 49
3.3 Test development process 50
3.4 Selective attention measures 52
3.5 Sustained attention measures 60
3.6 Attentional control measures 67
3.7 The final test battery 78
Chapter 4 Normalisation of the preschool attention battery 84
4.1 Method 86
4.2 Results 89
Age and sex effects 89
Analysing the structure of attention 92
4.3 Discussion 106
Chapter 5 Validity and reliability of the preschool attention battery 115
5.1 Relationship of the battery with parent / teacher reports of attention 117
Method 118
Results 120
Discussion 123
5

5.2 Relationship of the battery with later TEA-Ch performance 126
Method 127
Results 129
Discussion 133
5.3 Applying measures from the battery to a younger age range 135
Method 135
Results 136
Discussion 139
5.4 Reliability of the new preschool attention battery 141
Method 142
Results and Discussion 143
Chapter 6 Attention in Williams syndrome and Down’s syndrome 145
6.1 Introduction 146
6.2 Assessing attention in WS using the TEA-Ch 155
Method 155
Results 158
Discussion 161
6.3 Assessing attention in WS & DS using the preschool attention battery 166
Method 167
Results 171
Discussion 177
Chapter 7 General Discussion 184
7.1 Summary of findings 185
7.2 Developing an attention battery for preschoolers: measurement issues 186
7.3 Attention in typical development 191
7.4 Attention in atypical development 196
7.5 The structure and function of attention: a developmental perspective 206
Appendices 208
Appendix 1: Examples of test stimuli 208
Appendix 2: Scaled score conversion tables 215
Appendix 3: Modified Vanderbilt scale 218
References 219
6

List of tables and figures Page
Figure 1: pilot visual search, Pig-dog stimuli, chapter 3 55
Figure 2: pilot visual search, apples stimuli, chapter 3 56
Figure 3: pilot flanker task, chapter 3 59
Figure 4: pilot auditory sustained attention task (blocks), chapter 3 61
Figure 5: pilot auditory sustained attention task (continuous), chapter 3 63
Figure 6: pilot visual sustained attention task, chapter 3 65
Figure 7: pilot dual task, chapter 3 67
Figure 8: pilot verbal opposites task (cards), chapter 3 69
Figure 9: pilot verbal opposites task (computerised), chapter 3 70
Figure 10: pilot counterpointing task, chapter 3 74
Figure 11: pilot balloon sorting task, chapter 3 78
Figure 12: normalisation study (chapter 4), results, age effects 91
Figure 13: normalisation study (chapter 4), hypothesised 3-factor model 100
Figure 14: normalisation study (chapter 4), path diagram, overall CFA 102
Figure 15: normalisation study (chapter 4), path diagram, younger group CFA 104
Figure 16: normalisation study (chapter 4), path diagram, older group CFA 105
Figure 17: rating scale study (chapter 5.1), results, scatterplot 121
Figure 18: TEA-Ch follow-up study (chapter 5.2), results, scatterplot 131
Figure 19: 21/2-3 year normalisation (chapter 5.3), histograms and mean scores 138
Figure 20: WS study (chapter 6.1), age-scaled scores 160
Figure 21: WS study (chapter 6.1), raw scores 161
Figure 22: WS and DS study (chapter 6.2), mean scaled scores 173
Figure 23: WS and DS study (chapter 6.2), individual scaled scores 174
Figure 24: WS and DS study (chapter 6.2), raw scores 175
Figure 25: discussion (chapter 7), summary of WS and DS studies 205
7

Page
Table 1: normalisation study (chapter 4), participants 87
Table 2: normalisation study (chapter 4), raw scores 90
Table 3: normalisation study (chapter 4), correlation matrix 96
Table 4: normalisation study (chapter 4), factor loadings, overall EFA 97
Table 5: normalisation study (chapter 4), factor loadings, younger group EFA 98
Table 6: normalisation study (chapter 4), factor loadings, older group EFA 99
Table 7: rating scale study (chapter 5.1), mean scores 121
Table 8: rating scale study (chapter 5.1), participants, good and poor attention groups 122
Table 9: rating scale study (chapter 5.1), group differences 123
Table 10: TEA-Ch follow-up study (chapter 5.2), mean scores 130
Table 11: TEA-Ch follow-up study (chapter 5.2), total score correlations 132
Table 12: TEA-Ch follow-up study (chapter 5.2), subtest correlations 132
Table 13: 21/2-3 year norms (chapter 5.3), success rates and mean scores 137
Table 14: reliability study (chapter 5.4), reliability coefficients 144
Table 15: WS study (chapter 6.1), mean scores 15 9
Table 16: WS and DS study (chapter 6.2), participants, age and mental age 168
Table 17: WS and DS study (chapter 6.2), raw and scaled scores 172
8

Chapter 1
Introduction

1. INTRODUCTION
Most types of cognitive and behavioural functioning will depend to some extent on the ability to
attend. That a deficit in attention will place limits on an individual’s academic and general
achievement is well recognized in clinical and educational settings. The importance of these
processes is similarly acknowledged in a research context, where attention has become one of
the most intensely studied topics in psychology and its related fields. Attention in adulthood, as
the product of development, is increasingly well understood, although advances in methods and
approaches ensure that ever-more precise explanation of certain concepts continues. The
developmental course for attention processes, especially in early childhood, remains relatively
less clear. This lack of clarity appears related to the difficulty of conceptualizing and measuring
attention in early childhood, where maturation is rapid and instruments that allow comparisons
with later developmental stages are lacking. This thesis describes the development of new
attention measures for early childhood, and their application to the study of attention structure
and function in typical and atypical populations.
1.1 Definitions of attention
Despite generating a considerable volume of research, there remains no unified operational
definition of attention. Over a hundred years ago, William James (1890) declared “everyone
knows what attention is. It is the taking possession by the mind, in clear and vivid form, of one
out of what seem several simultaneously possible objects or trains of thought...it implies
withdrawal from some things in order to deal effectively with others”. What James was
essentially describing is that ‘attention’ refers to a process of selection for information
processing. At any one time, countless stimuli present as potential inputs for cognitive
processing. Attention serves to select appropriate stimuli from those currently available, thereby
10

supporting effective cognitive functioning by ensuring that the limits on cognitive processing
capacity are not exceeded.
James’ own early taxonomy of attention noted various important features of the construct,
acknowledging the distinction between sensory/perceptual and intellectual attention,
immediate/direct and derived/cued attention, and passive/reflexive and active/voluntary
attention. Our modem understanding of the concept of attention, however, comes largely from
more recent investigations and reviews. A number of theoretical models have been developed,
which overwhelmingly follow the view that attention is a multi-dimensional construct,
comprising a number of related but distinct processes. Indeed, this notion is so well recognized
that even in a lay context multiple components of attention are acknowledged. Parents or
teachers, for example, might discuss a child’s attention deficits in terms of distractibility, short
attention span or hyperactivity, concepts that all relate to different attention components
identified in the scientific literature.
Within the information-processing tradition, attention is often divided into two main subtypes:
selective attention and sustained attention (Halperin, 1991). Selective attention is the ability to
select from the environment only those stimuli that are relevant for further processing, whilst
sustained attention refers to the ability to continue focusing over a long period of time, whether
the information load is high (i.e. concentration) or events are infrequent (i.e. vigilance).
Selective attention is sometimes further divided into focused attention (where attention is
directed to a single stimulus while ignoring other stimuli) or divided attention (where attention is
directed to multiple stimuli simultaneously). Considerable debate in the attention literature has
focused on the related notion of capacity, or how much information can be processed
simultaneously, with some investigators arguing that simultaneous attention to more than one
source is not possible at all. Likewise, some researchers have argued against a distinction
11

between selective and sustained attention, suggesting that sustained attention is just ongoing
selective attention (Cooley & Morris, 1990).
Other processes often presented as fundamental to attention include arousal and orienting.
Arousal represents a physiological readiness to process and respond to environmental stimuli,
too much or too little of which will affect the capacity for attention. Orienting refers to the
physical or behavioural changes that occur to bring relevant stimuli to the focus of attention.
Orienting, whether voluntary or involuntary, is a necessary precursor for selective attention and
further information processing, although selective attention in its entirety is a more complex
process also involving the subsequent inhibition of orienting to irrelevant stimuli.
Cognitive neuropsychologists have constructed models of attention functions, including those
described above, in relation to underlying brain structures. Posner and Petersen (1990) argued
for three fundamental assumptions regarding attention: (1) the existence of an attention system
anatomically separate from the perceptual and processing systems; (2) the division of this
attention system into specific sub-systems or functions; and (3) the association of these various
functions with specific regions and networks in the brain. A model was proposed following
these assumptions and comprising three major functions, including ‘orienting to sensory events’
(spatial direction / redirection of attention), ‘detecting signals for focal processing’ (top-down
control of attentional selection), and ‘maintaining a vigilant or alert state’ (sustaining an
attentional set).
Similarly, Mirsky and colleagues (Mirsky, 1987; Mirsky, Anthony, Duncan, Aheam & Kellam,
1991) have suggested an attention system comprised of four components, supported by different
anatomical systems in the brain. Their first component (Focus/Execute) refers to the capacity
for selective attention; the second component (Sustain) refers to vigilance or the ability to
12

maintain attention over time; the third component (Shift) refers to the movement of attentional
focus; and the fourth component (Encode) reflects the mnemonic processes involved in mental
manipulation of information. A number of other investigators have also specified models very
similar in structure to that of Mirsky et al (1991), characterized by key components of selective
attention, sustained attention and attentional control (e.g. Parasuraman, 1998; Robertson et al,
1996; Manly etal, 2001).
Defining and describing attention is further complicated by its association with executive
function. Executive function (EF) refers to the ‘higher level’ processes involved in the control
and regulation of ‘lower level’ cognition and of goal-directed behaviour (Lyon & Krasnegor,
1996; Pennington, 1991), for which prefrontal brain regions seem to be specialized (Goldman-
Rakic, 1987). EF is thus a very broad term, encompassing various control processes, including
working memory, cognitive flexibility, planning, problem solving, set-shifting and inhibition.
There is clearly considerable overlap between executive functioning and attention. Indeed,
attention itself can be thought of as an executive function, though it is often not described in this
way. However, whilst certain aspects of EF (e.g. shifting, inhibition) appear frequently in
accounts of attention, other aspects (e.g. working memory, planning) are more distinct from the
attention system. There is a case, then, for treating attention and executive function as separate
concepts, while acknowledging that elements of EF have a sizeable role to play in any model of
attention. Indeed, this is the view most commonly followed in the literature.
This brief review illustrates some of the complexities associated with defining and
operationalising the concept of attention. Several disciplines contribute to the literature, each
using its own language, approaches and measures to describe and investigate attention processes.
This thesis largely adopts the neuropsychological model, considering processes of attention in
relation to brain anatomy and atypical functioning, with a central hypothesis which specifies
13

distinct components of selective attention, sustained attention and attentional (or executive)
control. The literature reviewed in this chapter is presented in three main sections, reflecting the
main aims of this thesis. Presented first is a brief review of the methods currently available for
assessing attention in child samples, next a review of research related to the hypothesized
models of attention described above, and finally an exploration of attentional impairment in
developmental disorders.
1.2 Measuring attention in children
Given that one of the aims of this thesis is the development of new attention measures, a brief
review of those currently available for assessing attention in children will be presented here. It
is possible to assess attention even in infancy by examining looking behaviour, and studies using
these methods have suggested various stages of development (Ruff and Rothbart, 1996;
Atkinson, 2000). Newborn infants’ attention tends to be subject to bottom-up control, being
captured by salient stimuli rather than deployed at will. From 2-3 months, infants become more
selective in their attending, with development in the ability to shift and disengage attention
(Johnson, Posner & Rothbart, 1991), thought to reflect a move from subcortical to cortical
control (Atkinson, 1984). Ruff & Saltarelli (1993) have observed developments in the ability to
sustain this attention over the first year of life, and Ruff and Rothbart (1996) have argued for the
emergence of a second attention system at around 18-24 months, with children gaining
increasing control over their attention and responses. The kind of measures used to assess
attention in later childhood and adulthood are more relevant to the aims of this thesis, however.
There are two main classes of measure used in the assessment of attention in older children:
performance tasks administered in a laboratory or clinical setting, and rating scales that are
generally completed by parents or teachers. Performance tasks have been developed for the
assessment of different attention functions, including selective, sustained and divided attention,
14

plus various aspects of executive function. Some of the most commonly used measures of
selective attention in children include visual orienting tasks (Brodeur & Enns, 1997), flanker
tasks (Enns & Akhtar, 1989; Brodeur & Pond, 2001; McDermott et al, 2007) and visual search
tasks (Trick & Enns, 1998; Gerhardstein & Rovee-Collier, 2002), which variously emphasise
stimulus detection, resistance to distractors, and the disengagement/re-engagement of attention.
Sustained attention is typically assessed using some variation on a continuous performance task
(CPT; Rosvold, Mirsky, Sarason, Bransome, & Beck, 1956). In a CPT the child is required to
monitor over time some visual or auditory stimuli for the presence of a predetermined target,
with a number of possible measures, including the number of correctly identified targets,
commission and omission errors, and measures of perceptual sensitivity and readiness to respond
(e.g. Conners et al, 2003; Borgaro et al, 2003; Denney, Rapport & Chung, 2004). Other
commonly used sustained attention measures include cancellation tasks, where the child is
required to work through a series of symbols / pictures cancelling out targets, and other tasks
based on a similar premise (i.e. the completion of some relatively simple task over an extended
period of time).
Various measures have been applied to the assessment of executive function or attentional
control. Some of the measures commonly used to assess executive function in adults have been
adapted for use with children, including the Wisconsin Card Sorting Task (WCST; Heaton et al,
1993), Stroop task (Stroop, 1935), Trail Making test (Reitan & Davidson, 1974) and Tower of
Hanoi / London (Shallice, 1982). Other measures designed specifically for children include the
detour reaching box (Hughes & Russell, 1993); the day-night task (Gerstadt et al, 1994); the
hand game, and tapping task (Hughes, 1998; Diamond & Taylor, 1996), both adapted from Luria
(e.g. Luria, 1959); various delayed reward tasks (Kochanska et al, 1996, 2000); the dimension
change card sorting (DCCS) task (Frye et al, 1995); and various go-no go tasks (Casey et al,
1997) and response conflict tasks (e.g. Gerardi-Caulton, 2000)
15

A number of test batteries that assess attention have also been developed for use with children.
Several neuropsychological batteries (e.g. NEPSY, CANTAB) for children assess a range of
cognitive functions, including attention / executive function. The NEPSY (Korkman, Kirk &
Kemp, 1998), for example, includes visual search, cancellation, continuous performance,
planning and inhibition tasks, though most of these are only suitable for children over 5 years of
age. The CANTAB (Luciana, 2003; Luciana & Nelson, 1998) includes tests of visual attention,
planning and set-shifting that have been used with children as young as 4 years of age. These
attention measures are just one component of the NEPSY and CANTAB assessments, but some
batteries focus solely on attention functions. The Test of Everyday Attention for Children
(TEA-Ch; Manly et al, 2001) includes nine subtests designed to test the functions of selective
attention, sustained attention and attentional control in children aged between 6 and 16 years.
Wilding and colleagues (see Wilding, Munir & Comish, 2001) have devised a computerized
battery of attention measures (the WATT) for use with school-age children, which includes
selective and divided attention search tasks, a vigilance task and a sorting task to assess
executive function. Fan et al (2002) have developed the Attention Networks Test (ANT), a
computerized task that combines different cuing conditions to examine three components or
networks of attention (alerting, orienting and executive attention) in a single task. The ANT has
been adapted for use with children aged between 6 and 9 years of age.
This represents only a brief review of the many performance tasks that have been applied to the
assessment of attention in children (many of these tests will be described more fully in relation
to the development of the new attention battery in chapter 3). What is noteworthy is the relative
lack of measures available for young children. By around two years of age, children have
sufficient verbal and motor skills to allow for performance tasks that more closely resemble
adult assessments. However, these skills are obviously more limited at this early stage of
16

development, and as a consequence, fewer attention measures have been developed for the age
range from about 2-6 years. The development of new attention measures for this age range is
one of the main aims of this thesis.
Clearly, performance measures are fundamental to the study of attention, but they are associated
with a number of limitations. Attention can only be measured relative to some other activity,
prompting concerns about task purity and the effects of confounding processes. Virtually all
attention tasks will involve other perceptual, behavioural and cognitive systems that have the
potential to affect performance, making it difficult to separate the effects of attention and non-
attentional processes. Similarly, it can be difficult to establish which aspect of attention might
be driving performance on a particular task, since there is likely to be considerable overlap of
attention functions throughout development. The extent to which these performance tasks
reflect everyday attentional processes is also sometimes unclear. There may be cases where
performance in a controlled laboratory setting, on tasks with somewhat abstract requirements, is
not representative of attention in the home or classroom, for example. Parent or teacher rating
scales offer an alternative method of attention assessment that might better reflect everyday
attention.
These scales evaluate a child’s behavioural symptoms of attention deficit (e.g. distractibility,
inattention, hyperactivity, impulsivity), often alongside other aspects of developmental
psychopathology (e.g. anxiety, depression, conduct disorder). Some of the most widely used
rating scales that include attention are the Conners rating scales (Conners, 1970,1997), the Child
Behaviour Checklist (Achenbach, 1991), the SNAP rating scales (Swanson, 1995), the Behavior
Rating Inventory of Executive Function (BRIEF; Gioia et al, 2000) and the NICHQ Vanderbilt
rating scale (Wolraich et al, 1998). Scales such as these are the most commonly used approach
17

in the diagnosis of children with attentional deficits (e.g. ADHD), and the subsequent assessment
of their progress.
Like performance measures, however, there are limitations associated with the use of
behavioural rating scales. Inter-rater reliabilities are often low, and tend to vary with the age of
the child and type of behaviour assessed, with better reliability for older children and for overt
behaviours (e.g. hyperactivity) than for covert behaviours (e.g. inattention) (Reynolds &
Kamphaus, 1992). Differences in the rater’s individual tolerance of attention problems or
experience with a particular age group are likely to affect their assessment of a child, and scoring
might be affected by whether the rater has an overall positive or negative view of the child.
Also, rating scales are less useful outside of the clinical domain. Ratings are generally made
relative to age-matched peers, thus essentially removing the variance accounted for by age, and
limiting information about the development of attention. However, ratings do have the
advantage of ecological validity, drawing as they do on observations of a child’s behaviour in
everyday life, over a longer period than is ever possible in a laboratory testing session.
Given the limitations associated with both types of measure, the assessment of attention in
children warrants the use of performance tasks as well as behaviour ratings. Indeed, for research
activities of the kind reported in this thesis, performance measures provide the kind of data
necessary for exploring particular functions of attention, their developmental trajectories, and
patterns of impairment. Chapter 3 describes the development of a new preschool attention
battery that has been used to address some of the questions that are reviewed in the following
sections of this introduction.
18

1.3 Examining attention models in adults
The vast literature associated with particular issues in the study of attention (for example,
cognitive capacity, early vs. late selection, attentional load) is beyond the scope of this review.
This is not to disregard the influence of these debates on the issues at the centre of this thesis.
However, this review will focus on research more directly associated with neuropsychological
models of attention. In particular, a number of studies have examined models of attention by
looking at patterns of performance across a range of attention tasks in a single sample. Factor
analysis methods allow models of latent constructs to be derived or tested, using patterns of
correlation or covariance between measures. Indeed, there are two main approaches to factor
analysis: exploratory factor analysis (EFA), where a structure of latent constructs is derived
from the available data, and confirmatory factor analysis (CFA), where data are assessed
according to how well they fit a pre-specified model of latent constructs. Tasks that load together
in a factor analysis are assumed to reflect the operation of some common underlying process.
These approaches provide one of the most direct means of assessing whether attention can be
divided into separate constructs, and examining the relative independence of these constructs.
Mirsky et al (1991) set out to examine a three-factor model of attention (comprising focus,
sustain and shift functions) in a group of 203 adult neuropsychiatric patients and normal
controls. Principal components analysis (PCA), a type of EFA, actually yielded a four-factor
solution on scores from a range of common neuropsychological attention tests. The first factor,
sustain, comprised scores from the Continuous Performance Test (CPT), a widely-used measure
of vigilance in which participants are required to monitor a stream of visual or auditory
information for the occurrence of a pre-specified target. The second factor, switch, comprised
scores from the Wisconsin Card Sorting Task (WCST), where participants must sort cards and
switch flexibly between sorting dimensions. The third factor, focus-execute, comprised the
19

Digit-Symbol Substitution subtest from the WAIS-R (requiring the subject to substitute the
digits 1 to 9 for designated symbols in a grid), the colour-word Stroop Test (requiring the subject
to focus on ink colour rather than word identity), the Talland Cancellation Test (requiring the
subject to cross out target items), and the Trail Making Test (requiring the subject to draw paths
alternating between numbers and letters).
The fourth factor, labelled encode, comprised the Digit Span and Arithmetic Subtests from the
WAIS-R. These were originally included as tests of focusing, but their common loading was
instead taken to reflect a latent construct involving memory and mental manipulation of
information. Whether a task whose loading is explained primarily in terms of another cognitive
function (i.e. memory) should be retained in a model of attention is questionable. Memory,
especially working memory, is likely to interact with attention, but including it as a component
of attention is somewhat confusing. As an attention model, Mirsky’s structure might better be
thought of as comprising three components (focus, sustain and shift) as originally proposed.
In their paper, Mirsky et al (1991) refer to a number of other studies that have provided support
for the proposed attention model. Steinhauer et al (1991) studied schizophrenic patients, their
brothers and matched controls, and confirmed three of the four factors (focus-execute, sustain
and shift), whilst Kremen et al (1992) studied patients with various psychotic disorders, and
found essentially the same structure as Mirsky et al (1991). Subsequent replication of this model
by Kelly (2000) produced the same four factors, with the only difference being that CPT reaction
time loaded with focus-execute rather than sustain, however, this measure does reflect the
execution component of the task.
A study by Strauss, Thompson, Adams, Redline and Burant (2000), however, does cast some
doubt on the Mirsky model. In this study a group of 160 adults (comprising patients with sleep
20

apnoea and normal controls) completed a battery of neuropsychological tests designed to tap
Mirsky’s four elements, and CFA procedures were applied to the resulting data. Strauss et al
(2000) also performed CFA on the adult data published by Mirsky et al (1991). Neither
correlated nor uncorrelated formulations of the Mirsky model provided an adequate fit to either
data set. Though still poor, the fit was better for the correlated models, and modification indices
provided by the program indicated that substantial changes could be made to model constraints
to improve the fit. Both results suggest against the hypothesis of separable components of
attention.
Such a result based on the Strauss et al data alone might be attributed to sample or measurement
differences, although a failure to generalise to other populations would also be problematic for
the Mirsky model. However, given that the model also failed to fit the data from the original
Mirsky et al sample, it seems that the source of the inconsistency is the type of factor analysis
used. Strauss et al note that EFA methods are without the goodness-of-fit measures that provide
a formal indication of the model’s fit, with decisions about factor extraction depending on
convention, theoretical considerations and judgement. CFA allows for substantiation of the
results of EFA, and provides a range of other measures that allow for statistical assessment of
model fit. In this case, confirmatory analysis does not appear to support the proposed model,
prompting questions about the conclusions drawn from previous studies that have used only
exploratory techniques.
With the Test of Everyday Attention (TEA), Robertson, Ward, Ridgeway and Nimmo-Smith
(1996) developed a battery of novel attention tasks for adults, designed to reflect the attentional
operations required in everyday life (tasks included searching a map and monitoring a news
broadcast, for example). The TEA comprised eight subtests designed to examine components of
selective attention, sustained attention and attentional switching. Factor analysis of TEA
21

subtests, plus a number of established attention tests (Stroop, WCST, Trail Making, Digit Span,
and the Paced Auditory Serial Addition Test; PASAT), actually extracted four factors rather than
the hypothesised three.
The first, visual selective attention/speed, included two visual search tasks from the TEA, plus a
cancellation task, the Stroop Test and the Trail Making Test. The second factor, attentional
switching, included the Visual Elevator test, requiring participants to monitor the position of an
imaginary elevator by counting up or down according to visual cues, and the WCST. The third
factor, sustained attention, comprised an auditory monitoring task, a tone counting task and dual
task (tone counting plus visual search). The final factor, labelled auditory-verbal working
memory, included two versions of the Auditory Elevator task, plus the Backward Digit Span test
and the PASAT. These tasks were assumed to reflect the manipulation and sequencing of
auditory-verbal information in working memory. Whether a factor that primarily reflects
memory has a place in a model of attention has been considered in relation to Mirsky’s encode
factor above, and a similar criticism might apply here.
Robertson et al’s factor analysis supported the notion of separable components in the attention
domain, with the factor structure reflecting some of the dissociations predicted. However, the
nature of the factor loadings calls into question the extent to which these factors reflect primarily
attentional constructs. For instance, the Visual Elevator and Auditory Elevator subtests have the
same attentional demands yet load on different factors, indicating that presentation modality is
more important than attentional demand in determining their factor loading. It is clear that each
test has a number of different requirements that may be important to successful performance,
and some may rely on more than one aspect of attention. However, in order to conclude that a
factor represents some attentional construct, it is vital to consider alternative explanations for the
loadings, and ideally rule these out. It is not clear that this has been done with the TEA results.
22

Posner and colleagues (e.g. Fan, McCandliss, Sommer, Raz & Posner, 2002; Rueda et al, 2004;
Konrad et al, 2005; Fan, McCandliss, Fossella, Flombaum & Posner, 2005; Posner, Rothbart &
Sheese, 2007) have used the Attention Network Test (ANT) to study extensively the
independence, development, neuroanatomy and genetics of three attention networks: orienting,
alerting and executive attention (essentially the functions previously labelled selective attention,
sustained attention and attentional control). The ANT was developed from the flanker task
(Eriksen & Eriksen, 1974) and requires participants to determine whether a target arrow points
left or right. The arrow appears either above or below fixation and may or may not be
accompanied by flankers. The proposed ‘orienting’ network is assessed by comparing spatial
cues (indicating the upcoming position of the target arrow) with central cues (providing no
spatial information). The ‘alerting’ network is assessed by comparing a double cue (providing
alerting information but no spatial information) with no cue. Finally, the ‘executive’ network is
assessed by comparing flankers that point the same way as the target (non-conflict) and flanker
that point the opposite way (conflict).
In a group of 40 normal adults, Fan et al (2002) found no correlation between any of the
networks on the ANT, supporting the suggestion that they are independent constructs. However,
an ANOVA revealed a significant interaction between cue type and flanker type, whereby a
particular cue type influenced the level of flanker interference. This result suggests that the
networks may not operate independently in all situations. Subsequent studies have investigated
the neuroanatomy (Fan et al, 2005; Konrad et al, 2005) and genetics (Posner et al, 2007)
associated with the proposed attentional networks, supporting distinct patterns in each for the
different components.
23

Evidence from multi-dimensional studies of adult attention provides mixed support for the
notion of separable components, and the proposed structure comprising selective, sustained and
attentional control functions. There have been several demonstrations of the differentiation of
neuropsychological components of attention in adults using factor analysis. However,
alternative explanations for observed factor loadings have not always been ruled out. In some
cases, multiple indicators of a latent construct have come from the same test, confounding
method and trait variance. Further, when factors are represented by a single task, it is difficult to
establish which aspect of the task is important to performance. For example, Mirsky’s shift
component reflects only scores from the WCST, which involves various demands besides
shifting. In other studies, tasks that have essentially the same attentional demands have loaded
on different factors, questioning the extent to which factors reflect attentional constructs. These
problems are largely avoided in the approach used by Posner, Fan and colleagues (Fan et al,
2002) in the Attention Networks Test, which supports the proposed attention model. The
development and assessment of attention models based on neuropsychological tests remains
important, but might benefit from more careful selection of subtests and interpretation of results.
These issues will be explored in more detail in later sections, but first similar data from studies
of attention in children are presented.
1.4 Developmental studies of attention models
Factor analysis studies
Numerous studies with school-age children have documented development of individual
elements of attention throughout childhood, including age-related improvements in selective
attention (e.g. Trick & Enns, 1998; Scerif et al, 2004), sustained attention (e.g. Levy, 1980;
Aylward, Brager & Harper, 2002; Berwid et al, 2005; Lin, Hsiao & Chen, 1999), and in the
ability to switch attention flexibly between rules and inhibit prepotent responses (Gerstadt, Hong
24

& Diamond, 1994; Kirkham, Guess & Diamond, 2003; Diamond & Taylor, 1996; Backen-
Jones, Rothbart & Posner, 1998; Jacques & Zelazo, 2001). Whilst these studies provide vital
insights into the type and level of attentional functioning seen during childhood, they will not be
exhaustively reviewed here. Again, this review will focus on studies that examine multiple
components of attention in the same sample, to more directly assess the questions of attention
structure and development during childhood. As with the adult studies, factor analysis methods
have been used to examine how attention is organised earlier in development.
Mirsky et al (1991) investigated the validity of their attention model in a group of 435 normal
school children, with a mean age of nearly eight years. A subset of the adult tests suitable for
use with children were selected and administered to the sample, and a PCA of the resulting data
yielded a four-factor solution with the same components as the adult analysis. Focus-execute
comprised scores from a cancellation task and the Coding subtest of the WISC; shift comprised
WCST scores; sustain comprised CPT scores; and encode comprised scores from the WISC
Arithmetic and Digit Span subtests. Using the same set of tests Kelly (2000) found a three-
factor solution in which the focus-execute and encode components combined. This remains
consistent with Mirsky et al’s original conceptualisation, in which the Arithmetic and Digit Span
(encode) tests were included as measures of focusing. Kelly (2000) also conducted a second
analysis with an extended set of measures. Additional tests included Trail Making and the
Stroop, plus a measure of errors on a search task and the cancellation task. As expected, Trails
and Stroop loaded with the focus/execute factor, whilst the error measures formed a fourth
factor, labelled impulsivity. Thus, whilst supporting the general notion of attentional separability
and Mirsky’s, model specifically, Kelly’s data suggest that there are elements of attention that are
not accounted for within the original model.
25

In developing the Test of Everyday Attention for Children (TEA-Ch), Manly, Nimmo-Smith,
Watson, Anderson, Turner and Robertson (2001) provided a means by which Robertson et al’s
adult findings could be tested in children aged 6 to 16. Using CFA a model derived a priori
from the adult data was assessed for its fit to the observed variance among the 9 TEA-Ch
measures. In a group of 293 typically-developing children, a model assuming a single latent
variable (considering attention as a unitary construct) was examined, but showed a poor fit to the
data. In contrast, a model assuming three latent factors (selective attention, sustained attention
and attentional control) was highly consistent with the observed variances. When the group was
split in two around the median age, the model fit was no different for the two age groups,
indicating essentially the same attention structure across the age range, although it is unclear if
further division by age would have yielded different results.
Subtests included in the selective attention factor were two visual search tasks (Sky Search and
Map Mission). The attentional control factor was also comprised of two subtests - Creature
Counting, requiring switching between upwards and downwards counting, and Opposite Worlds,
requiring a reversal of the prepotent response of saying ‘one’ when presented with the digit 1
and ‘two’ when presented with the digit 2. Five subtests were included in the sustained attention
factor - these were Score, a tone-counting task; Code Transmission, an auditory number
monitoring task; Walk Don’t Walk, requiring the withholding of a regular motor response to a
tone; Score Dual Task, in which the Score subtest was combined with monitoring of an auditory
news broadcast; and Sky Search Dual Task, in which the search task was combined with a tone
counting task.
Again, the results support a multidimensional view of attention, with separable selective,
sustained and control components. However, several questions regarding Manly et al’s CFA
ought to be considered at this point. Firstly, the factor labelled selective attention is represented
26

by just two tasks, with essentially very similar demands (visual search for specified targets in a
complex array). Likewise, the tasks comprising the sustained attention factor all involve at least
an element of auditory monitoring. It is possible, then, that the selective attention factor actually
reflects something more limited (i.e. visual selective attention or even visual search) whilst the
sustained attention factor reflects something rather more general (e.g. auditory sustained
attention or even just auditory processing). Once again, there is a need for multiple independent
indicators of each construct that ideally vary in their surface demands. Measures in different
modalities or measures with different fundamental task demands that still load together would
make a more convincing case for separable components. Factor analysis methods are limited by
the fact that you will only ever get out what you put in, and including a completely
comprehensive selection of tests in a factor analysis may be difficult, if not impossible.
However, it is important when interpreting latent variables not to assume underlying constructs
where other, perhaps more simple, commonalities might explain the associations among
measures.
Another potential limitation of factor analytic approaches, though one that can be relatively
easily overcome with modem CFA methods, is that other unexamined models may fit the data
just as well. For equally well-fitting models, the more parsimonious model should generally be
preferred. Manly et al did examine a single factor model, which proved a poor fit to the
observed variances. However, the possibility that a two-factor model, or even a three-factor
model with a different arrangement of the measures, might explain the data just as well as the
accepted model was not assessed. In a study of three components of executive function
(updating, shifting and inhibition), Miyake et al (2000) presented a rather more thorough
examination of the components’ separability by comparing the hypothesised three-related-
factors model with one-factor, two-factor and three-independent-factors models. The three-
related-factors model did indeed provide a significantly better fit than any of these other models.
27

The authors here further supported this conclusion by presenting an EFA that yielded essentially
the same structure. Likewise, in their examination of the constructs underpinning multitasking,
Burgess, Veitch, Costello and Shallice (2000) assess the fit of their data to single-factor, two-
factor and ‘independence’ (i.e. uncorrelated) models before accepting their proposed three-factor
model as the best fitting.
This isn’t to overlook the fact that the a priori specification of the model in a CFA lends the
approach considerable strength, since it follows a more scientific hypothesis-testing procedure.
Indeed, it would be inadvisable to over-examine possible models. However, the assessment of
other plausible models (especially any that are more parsimonious) would make for somewhat
stronger conclusions.
In a similar study, Wilding, Munir and Comish (2001) gave 100 boys tests from the TEA-Ch
along with tests from their own battery, the WATT, designed to assess four aspects of attentional
processing. Selective attention was assessed using the Map Mission and Sky Search TEA-Ch
tests, plus a single target visual search (VISEARCH 1) from the WATT. Divided attention was
assessed using a dual (alternating) target search (VISEARCH 2). Sustained attention was
assessed using a visual monitoring task (VIGILAN), and executive attention was assessed using
the Walk Don’t Walk and Opposite Worlds from the TEA-Ch, plus a modified version of the
WCST (the Wilding Monster Sorting Task; WMST). EFA did not support the proposed
separability of attention in any clear cut way, with only two factors apparent in the data. The
second factor comprised Map Mission, Sky Search and VIGILAN, and was taken to reflect
primarily the speed of visual search, though this would not account for the VIGILAN loading.
Factor 1 comprised VISEARCH 1 and VISEARCH 2 strategy measures, errors on the
VIGILAN, the WMST and Walk Don’t Walk, and was taken to reflect aspects of organizational
28

or control functions (including efficiency of visual search, speed and efficiency of vigilance,
shifting and inhibition).
So, despite using largely equivalent measures to those studies reviewed above, Wilding et al
(2001) have failed to replicate the proposed division of attention into primarily selective,
sustained and control components. Differences in sample composition may contribute to this
discrepancy. Wilding et al’s sample comprised 50 ‘normal’ children with good attention (as
rated by teachers) and 50 ‘normal’ children with poor attention. However, one might expect
tasks that are truly measuring some common underlying function to load together even in a
clinical sample, and whilst Wilding et al’ s findings do not support a unitary notion of attention,
nor do they fully support the hypothesised model. Again, differences might be associated with
the use of different factor analysis procedures, as we have seen in the adult data (Strauss et al,
2000), though in this case it is the CFA study that supports the model whilst the EFA study does
not.
Using a child version of the Attention Networks Test, however, Rueda et al (2004) were able to
support the division of attention into orienting, alerting and executive networks. As in the adult
sample (Fan et al, 2002), correlations between networks were not significant. Further, there
were no interactions between cue type, used to evaluate alerting and orienting, and flanker type,
used to evaluate executive attention. Consistent with the notion that the different scores on this
test reflect the operation of distinct functions, the networks also appear to develop according to
different trajectories. Executive network scores showed significant improvement from 6 to 7
years, whilst alerting and orienting scores showed no change over the 6-9 year age range.
Further, only alerting scores showed an improvement between 12 years and adulthood.
29

Developmental trajectories
A number of other studies have also demonstrated different developmental trajectories for the
various components of attention. McKay, Halperin, Schwartz and Sharma (1994) gave children
aged 7 to 11 years and adults tests of sustained attention, selective attention and response
(executive) organisation, in which the attention demands could be manipulated across
conditions. They found age x condition interactions for the sustained attention and response
organisation tests, indicating development of these abilities across the 7-11 year age range. The
developmental trajectories of these two abilities were further delineated by the observation of
major improvements in response organisation at around 7 years, compared with major
improvements in sustained attention after 11 years. This is consistent with the trajectories
reported by Rueda et al (2004) for the executive and alerting networks respectively.
Rebok et al (1997) report developmental trajectories for children tested using the NIMH battery
of attention tests employed by Mirsky et al (1991). In this study, a subset of the children
participating in the Mirsky et al (1991) study at age 8 were assessed again at age 10 and/or age
13. Significant improvements on different versions of the Continuous Performance Task were
observed between the ages of 8 and 13 years. The Digit Span measure of encoding showed more
marked improvement between 8 and 10 years than between 10 and 13 years, with similar
developmental gains between the ages of 8 and 10 years on measures of shifting (WCST) and
focusing (Digit Cancellation). Unfortunately, these measures were not included in the
assessment conducted at age 13. The authors do, however, refer to several other studies which
suggest tha t,WCST performance also develops little beyond age 10 (Chelune & Baer, 1986;
Streissguth, Brookstein, Sampson & Barr, 1995), but that Digit Cancellation continues to
develop into early adolescence (Lifshitz et al, 1985).
30

These findings are largely supported by Kelly’s (2000) study of the Mirsky et al (1991) model,
where the focus / encode element showed a steep and steady trajectory of development across
the age range, whilst shift and impulsivity showed more rapid improvement from 7 to 11 years
than from 9 to 13 years. The developmental trajectory for the sustain element was intermediate
to these, showing some slowing in rate of development in the older children, but a less marked
slowing than for shift and impulsivity. Unfortunately, statistical analysis of these developmental
trajectories is not reported. Klimkeit, Mattingley, Sheppard, Farrow and Bradshaw (2004) also
report major gains across attentional functions (selectivity, response inhibition, vigilance,
impulsivity and set-shifting) between the ages of 8 and 10, with a relative plateau in performance
between ages 10 and 13. This study used a single selective reaching task with various
manipulations to assess the different aspects of attention, and found improvements beyond age
10 only in terms of motor planning (i.e. RT to initiate movement).
Together, the data present a somewhat inconsistent picture. Kelly (2000) and Rebok et al (1997)
suggest similar development across different attention functions (namely a peak in development
between 7 and 10 years, followed by a relative plateau), with the exception of selective / focused
attention, which appears to show continued development beyond age 10. McKay et al (1994)
and Rueda et al (2004), however, suggest that selective attention is relatively well developed by
age 6 or 7, whilst executive attention shows considerable development at around 7 years, and
sustained attention continues to develop into adolescence. These differences might relate to
subtle differences between the methods and measures used in these studies.
One key difference in the selective attention tasks is that simple motor / reaction time is factored
out in the Rueda et al (2004) and McKay et al (1994) studies via the comparison of conditions
that differ only in terms of the selective requirement (and not the motor requirement). This is
not the case for the Rebok et al (1997) and Kelly (2000) focus-execute measures. Given
31

Klimkeit et al’s (2004) finding that motor time develops into adolescence, it is possible that it is
the motor or RT component of these measures that accounts for their continued developmental
trajectory. Although Rebok et al (1997) and Kelly (2000) stress a tendency toward greater
development in the 8-10 year age range for sustained attention (whilst Rueda et al (2004) and
McKay et al’s (1994) suggest continued development into adolescence), development beyond 10
years is apparent in the data. Further, neither Rebok et al nor Kelly compared child and adult
performance, leaving open the possibility of major improvements in sustained attention between
early adolescence and adulthood (as reported by Rueda et al and McKay et al). The findings
regarding attentional control are more consistent across studies, with a general consensus that
major developments occur between ages 7 and 11, although more complex EF tasks are unlikely
to have reached adult levels by this age (e.g. Luciana & Nelson, 1998). Indeed, a number of
studies have suggested that it may be necessary to delineate different developmental trajectories
for different components of executive / attentional control (e.g. Welsh, Pennington & Groisser,
1991; Levin et al, 1991; Huizinga, Dolan & van der Molen, 2006). Closer correspondence
between the measures used, and examination of performance across a fuller trajectory, will be
necessary to establish whether there are reliable differences in how components of attention
develop, but existing research indicates that this is a question worthy of further investigation.
1.5 Neuroanatomy of attention components
The argument for separable components of attention is supported by a vast literature that has
specified distinct neural systems associated with different attention functions. This evidence has
been examined in relation to some of the attention models described above. Posner and Petersen
(1990), for example, reviewed evidence from animal, lesion and cerebral blood flow studies to
suggest distinct networks for the attentional functions in their model. Their orienting function
was associated with a posterior attention system within which the disengaging of attention from
a currently-attended stimulus was attributed to the parietal lobe, whilst spatial shifting was
32

linked with the superior colliculus, and engaging attention to a new stimulus and filtering out
irrelevant information was attributed to the pulvinar nucleus of the thalamus. Top-down control
of attentional selection was associated with an anterior attention system involving lateral and
medial regions of frontal cortex and the anterior cingulate, and the alerting function was less
clearly localised although a greater role for right hemisphere regions was implied.
Mirsky et al (1991) likewise suggested brain areas associated with each of their components.
Their sustain element was linked with rostral midbrain structures, including the reticular
formation and midline and reticular thalamic nuclei; the shift element was linked with the
preffontal cortex (PFC), with some suggestion of medial frontal cortex and anterior cingulate
involvement; the focus-execute element was associated with the superior temporal and inferior
parietal cortices plus the corpus striatum; and the encode element was linked with the
hippocampus and amygdala. Fan et al (2005) have used fMRI to study the attention functions
delineated using the Attention Networks Test (ANT). From existing imaging data, they
predicted increased activation in the superior parietal region, temporal-parietal junction, and
frontal eye fields for the orienting network; in thalamic, frontal and parietal areas for the alerting
network; and in the anterior cingulate and PFC for the executive network. Fan et al (2005) did
note some regions of overlap between the functions, but on the whole data were in line with
these expectations, supporting distinct anatomical as well as functional networks for the different
conditions of the ANT.
In recent years, methods for examining the localization of attention functions have advanced
considerably, Especially in relation to functional imaging of the human brain. Overall evidence
presents a picture that is largely consistent with networks described above (see, for example,
Cabeza & Nyberg, 2000). Sustained attention has been primarily linked with a right fronto
parietal network in both imaging studies (e.g. Coull et al, 1996; Pardo et al, 1991; Cohen et al,
33

1992) and lesion studies (e.g. Robertson et al, 1997), with evidence for an interaction with a
basal forebrain cholinergic system (see Sarter et al, 2001). Selective attention and orienting are
consistently linked with parietal regions, plus preffontal areas and the anterior cingulate (e.g.
Corbetta et al, 1995; Ashbridge, Walsh & Cowey, 1997; Pugh et al, 1996; Shaywitz et al, 2001;
Donner et al, 2002; Nobre et al, 2003). Finally, the preffontal cortex (PFC) has become well-
recognised as the site of executive processes (see, for example, Miller & Cohen, 2001).
It is well known that patients with PFC damage exhibit a ‘dysexecutive’ syndrome (Wilson et al,
1998), showing difficulties on tasks requiring processes such as planning, problem solving,
cognitive flexibility, and response inhibition. Numerous imaging studies have also linked
increased activation of the PFC with tasks requiring these executive functions (e.g. Berman,
Ostrem & Randolph, 1995; Owen, Roberts, Polkey, Sahakian, & Robbins, 1991; MacLeod,
1991; Shaywitz et al, 2001). More recent studies have begun to investigate the possibility of
distinct neuroanatomy for different aspects of executive function. Duncan and Owen (2000)
reviewed evidence from functional imaging studies, and argued for a ffontal network specific to
mid-dorsolateral and mid-ventrolateral portions of PFC that is involved across a diverse range of
executive control tasks. However, Aron, Robbins and Poldrack (2004) have suggested a
particular role for the right inferior ffontal cortex (IFC) in attentional switching and response
inhibition. Sylvester et al (2003), however, have identified regions specifically involved in each
of these functions (Brodmann’s areas 7 and 18 for switching and areas 6 and 10 for motor
inhibition) in addition to the common involvement of parietal cortex, dorsolateral PFC, premotor
cortex and medial ffontal cortex. A full account of the finer localization of EFs is beyond the
scope of this review, but these studies serve to illustrate some of the emerging complexities and
possibilities in this area.
34

Of particular interest are a number of recent studies looking at developmental aspects of
attentional neuroanatomy. A number of developmental fMRI studies have looked at aspects of
executive control, comparing performance and brain activation in children and adults (e.g. Casey
et al, 1997; Bunge et al, 2002; Durston et al, 2002). These studies have generally supported the
idea that ffonto-striatal regions are recruited in executive tasks by children, as they are by adults,
though sometimes less efficiently, or with the additional involvement of other areas. A small
number of studies have begun to investigate the localisation of different attention functions in
children. Booth et al (2004) have compared selective attention on a visual search task and
response inhibition on a go-no go task in 9-12 year-olds, finding the former to be associated with
superior parietal regions and lateral premotor cortex, and the latter with PFC and the basal
ganglia. Interestingly, better performance on the selective attention task was linked with less
activation in the associated brain regions, taken to represent relative maturity of the brain
network for selective attention. Booth et al speculate that mature brain networks may show
negative correlations with accuracy because better performers are more automatic and efficient
at utilizing their resources.
Konrad et al (2005) have used a modified version of the ANT to investigate the localisation of
the three associated attentional functions (alerting, orienting and executive control). Comparing
performance in adults and children aged 8-12 years, they found that whilst the areas activated in
adults corresponded well to the networks observed in previous work (i.e. right ffontal-midbrain
regions for alerting, right tempero-parietal junction for orienting, and dorsolateral PFC for
executive control), these areas were activated less strongly in children. In addition, the children
recruited significantly more brain regions outside these regions-of-interest. They conclude that
there is a transition from a functional yet immature system supporting attention functions in
children to the more definitive networks observed in adults that is not yet complete by 12 years.
35

Whilst the evidence for distinct neural bases for different attention components is persuasive, the
available data from neuropsychological, imaging and animal studies does suggest considerable
overlap in the circuits mediating different aspects of attention (Cabeza & Nyberg, 2000; Alvarez
& Emory, 2006). In a laboratory situation, it is of course useful to isolate individual components
of attention and examine the associated patterns of neural activation. However, it is unlikely that
attention functions will operate in this way in everyday life. Everyday attention tasks are likely
to require contributions from several aspects of attention, and a similar combined involvement of
neural attention networks. Nevertheless, these neuroanatomical distinctions promote the
hypothesised division of attention components, and provide clues as to how the biases of
processing in attention are achieved. It is also useful to know which aspects of neuroanatomy
make particular contributions to task performance in regard to the disruption of attention
processes in developmental or acquired disorders, some examples of which are reviewed in the
following section.
1.6 Attention in developmental disorders
Attention is one of the most commonly impaired functions in clinical populations. Problems
with attention have been observed in a wide range of developmental disorders, including
attention deficit hyperactivity disorder (ADHD), traumatic brain injury (TBI), premature birth,
Williams syndrome (WS), Down’s syndrome (DS), Fragile X syndrome (FXS), Tourette
syndrome, and autism, and numerous studies have investigated components of attention in these
disorders (see, for example, Tannock, 1998; Anderson et al, 1998; Ewing-Cobbs et al, 1998;
Catroppa & Anderson, 2003; Taylor et al, 1998; Semel & Rosner, 2003; Atkinson et al, 2003;
Stores et al, 1998; Munir et al, 2000; Landry & Bryson, 2004; Pennington & Ozonoff, 1996).
Understanding how attention is affected in various developmental disorders has significant
implications for a child’s educational and general progress. The nature and degree of
impairments will affect how interventions and educational strategies are structured, and how
36

other aspects of the cognitive profile are understood. Research in atypical populations can also
contribute to our understanding of the structure and function of attention in typical populations.
Given that evidence in typically-developing populations appears to support a multi-dimensional
view of attention, it is necessary to take a similar view when investigating developmental
disorders. It is possible that the different components of attention, presumed to depend on
distinct brain networks, will show different degrees of impairment in children with
developmental disorders. Indeed, dissociations between impaired and intact functions in clinical
populations have often been used to demonstrate separable systems or functions in cognition.
Developmental disorders are very often characterized by patterns of strengths and weaknesses in
cognition. However, these strengths and weaknesses are often specified in terms of fairly broad
domains (e.g. language, visuo-spatial cognition, social cognition, attention), but the profile of
impairments in any disorder is likely to require a more detailed level of description (i.e. the
component functions of a domain).
Studies have begun to look at attention in developmental disorders from this multi-component
perspective. In ADHD, numerous studies have looked at aspects of attention function (e.g.
Pliszka et al, 1997; Schachar, Tannock, Marriot & Logan, 1995; Rubia et al, 2001; Shallice et al,
2002; Geurts et al, 2004; Mahone et al, 2005; Epstein et al, 2003; Stins et al, 2005 Forbes, 1998;
Oades, 2000; Shalev & Tsai, 2003; Brodeur & Pond, 2001), and much research has investigated
the question of a central impairment in ADHD (e.g. in response inhibition, Barkley, 1997, 1999;
or in delay aversion, Sonuga-Barke, 1994). However, a growing number of studies have
compared performance across tasks designed to assess the different components of attention
discussed above. This avoids some of the difficulties associated with attempting to derive
attention profiles from studies using individual tasks, such as differences in sample selection and
composition, medication, task parameters and context.
37

Mirsky et al (1999) compared ADHD children and controls on tests of their 4 components of
attention: focus-execute, sustain, shift and encode. The ADHD group showed impaired
performance on the shift measure (WCST), the sustain measure (CPT) and on 3 out of 4 focus-
execute measures, suggesting fairly widespread attention impairments in ADHD. However, in
three studies using the TEA-Ch, ADHD children have shown impairments on measures of
sustained attention and attentional control, but not selective attention (Heaton et al, 2001; Manly
et al, 2001; Hood, Baird, Rankin & Isaacs, 2005). Robertson (2003) has gone so far as to claim
that ‘children with ADHD have specific problems with vigilant attention’. Whilst studies of this
kind describe the profile of attention in ADHD, the results must be considered in light of other
studies that have observed impairments on selective attention measures (e.g. Brodeur & Pond,
2001; Shalev & Tsai, 2003 as well as Mirsky et al, 1991). Wilding (2005) has highlighted the
need to differentiate even within selective attention, between tasks that require speed or
accuracy, as these might be differentially affected in ADHD (see also Band and Scheres, 2005).
Whilst these multi-dimensional studies are important in specifying the attention profile in
developmental disorders, it is also necessary to think about how specific these profiles of
attention function might be to a particular disorder. A number of studies have compared across
two or more developmental disorders in an attempt to map out distinct profiles for different
groups of children. Nyden, Gillberg, Hjelmquist and Heiman (1999) investigated attention in
boys with Asperger syndrome, ADHD and reading/writing disorders, using Mirsky’s four-factor
model of attention processes. In comparison with typically-developing controls, all three groups
showed deficits involving the ‘sustain’, ‘focus-execute’ and ‘encode’ components, and the
ADHD group also showed deficits on the ‘shift’ component. The authors concluded that
‘disorder specific’ patterns of attentional weaknesses were not apparent in these groups.
38

However, several studies have looked at different aspects of executive function in similar
groups. Ozonoff and Jensen (1999), for example, found distinct patterns of impairment for
different developmental disorders, with deficits in attentional flexibility and planning in children
with Autism Spectrum Disorders (ASD) and deficits in inhibition of a prepotent response in
ADHD. Geurts, Verte, Oosterlaan, Roeyers and Sergeant (2004) found that ADHD was
associated with deficits in inhibition and verbal fluency, whilst children with ASD showed
deficits in all EF domains except interference control and working memory. They concluded
that EF deficits are more generalized and profound in ASD than ADHD. Happe, Booth,
Charlton and Hughes (2006), however, found somewhat less severe EF deficits in ASD
compared with ADHD. Both groups showed poorer performance than controls across a range of
EF tasks, though the ADHD children showed greater impairment on a Go-No go task
(inhibition), and ASD group were worse on a cognitive estimates task (response
selection/monitoring).
Happe et al (2006) also looked at differences between older and younger participants in each
group, finding that older ASD children outperformed younger ASD children on several EF tasks
(as did the typically-developing controls), but ADHD children showed no age-related change in
performance. The groups therefore seemed to show different developmental trajectories for
executive functions, as well as different EF profiles. Examining performance across the
developmental trajectory in these disorders is one of the key issues emphasized by the
neuroconstructivist approach (see, for example, Karmiloff-Smith, 1998; Paterson et al, 1999,
Scerif & Karmiloff-Smith, 2005). This approach has been proposed as an alternative to a strict
nativist or empiricist position, and argues against the traditional approach of identifying
‘impaired’ and ‘intact’ modules in developmental disorders. Instead, this view acknowledges
that mature outcomes in cognition are the result of a dynamic developmental process, involving
39

interactions between genes (which potentially have quite widespread influences across the brain)
and the environment.
Taking this perspective, it is necessary to recognize a number of key issues in the study of
developmental disorders. For example, even if scores are in the normal range, performance
might be achieved through a different cognitive process in children with developmental
disorders. Related to this is the need to recognise that performance in developmental disorders is
typically investigated in relation to a matched control group, meaning that the clinical group are
generally much older than the controls. Therefore, even functions that are in line with the
performance of typically-developing controls are substantially delayed. In both cases,
describing a function as ‘intact’ presents something of an inaccurate picture.
Also, patterns of performance at one stage of development might not reflect the cognitive profile
at an earlier or later stage. For example, a child might show normal levels of performance in a
particular domain in infancy, but a delay in the same function later in development. This
highlights the need to trace full developmental trajectories for these disorders, starting as early in
childhood or infancy as possible. This kind of data will clarify whether patterns in
developmental disorders represent simple delay or a more complex deviation from the typical
trajectory. Further, cognitive domains will need to be broken down and assessed according to
their component parts in order to map profiles of functioning for particular groups. These
profiles and trajectories should be subject to cross-syndrome comparisons, in order to assess the
specificity of a profile. Indeed, it might even be necessary to think of developmental disorders
as lying on some kind of continuum, rather than as distinct and specific disorders. Such an
approach might better account for the range of phenotypic outcomes that can be seen within a
‘single’ disorder.
40

This section illustrates some of the complexities associated with the assessment of attention in
developmental disorders. It is clear that studies of cognitive functions in these special
populations will benefit from a more developmental perspective that takes into account these
issues, an approach that has begun to be applied in the studies of ADHD and ASD described
above. This thesis explores the attentional impairment in two further developmental disorders:
Williams syndrome (WS) and Down’s syndrome (DS). In both cases, attention impairments are
commonly reported, yet relatively few studies have explored this aspect of the cognitive profile
in detail. A full review of attention research in WS and DS is reported in chapter 6, which also
presents two studies looking at attention performance in these groups.
Summary & Conclusions
Neuropsychological models of attention posit dissociable but interacting components, a notion
that is largely supported by this review. Neuroanatomical evidence suggests distinct networks
for different components of attention, and these functions have also been differentiated in studies
using factor analysis of performance on a variety of neuropsychological and cognitive tests.
Developmental studies of attention structure have also indicated possible variations in the
developmental trajectories for these functions. Although different models have varied in their
description of attention functions and how these are labelled, certain components are common
across models in one form or another. Following the literature reviewed in this chapter, the
current study investigates a model of attention that comprises distinct components of selective
attention, sustained attention and attentional (or executive) control.
Specifically, this thesis explores the structure and function of attention in preschool-age children,
and children with developmental disorders. Studies have not yet investigated whether the
hypothesised attention model applies in early childhood, although important changes in
cognition are known to occur over this period. Measures designed specifically for this age range
41

were also used to study attention profiles in developmental disorders, where developmental
delay makes existing measures unsuitable. Extending the known developmental trajectory for
typical children down to preschool-age also enables these disorders to be understood in terms of
a more developmental perspective. The full aims of this thesis are described in the following
chapter.
42

Chapter 2
The Current Study

2. THE CURRENT STUDY
2.1 Rationale
Processes of attention have stimulated considerable research in recent decades, as reviewed in
the previous chapter. Although an impressive body of knowledge now exists about the structure
and function of attention, plus its underlying neuroanatomy, relatively little research has
addressed these issues in early childhood (i.e. below 6 years). Assessing cognitive functions in
young children poses specific problems and challenges, and there are relatively few measures
available for assessing attention in this age range. Certain research questions have therefore
gone largely unanswered at this stage of development. Firstly, does the structure of attention in
preschool-age children reflect the attention model derived from adult literature? Secondly, what
do developmental trajectories for attention functions look like at this stage of development?
Thirdly, do certain strengths and weaknesses characterise attention in developmental disorders
such as Williams syndrome and Down’s syndrome? By developing a battery of attention tests
designed specifically for children with a mental age between 3 and 6 years, this present study
addressed the structure and function of attention in typical and atypical development in a
younger age range than has previously been possible.
2.2 Aims and research questions
1. The first aim of this project was to produce a battery of tests that allow for a
comprehensive assessment of attention in preschool-age children. The demands of the
battery had to be achievable for children in the target age range, and scores needed to
represent the constructs that we call attention, and be relatively free from the effects of
other non-attentional abilities. The tests should also be sensitive to any development
44

across this age range, and suitable for use with children with developmental delays and
problems of attention.
2. Normalisation data from this new battery provided a means for addressing the question
of attention structure in this age range. Is attention in preschool-age children comprised
of separable components? If so, does the organisation of components reflect models of
attention supported in adults and older children? Finally, does the structure of attention
change over the course of this age range?
3. The battery was also used to investigate how attention is affected in developmental
disorders (Williams syndrome and Down’s syndrome). Are the attention problems seen
in these children global or more specific to certain components, and is the attention
profile different for WS and DS?
The first of these aims is addressed in the next chapter, which describes the process of test
development. This process is described in detail to acknowledge the particular challenges of
devising tools that enable (i) the measurement of complex functions like attention, and (ii) the
assessment of these functions in young children. Normalisation of the resulting battery, and an
examination of the structure of attention in children aged 3-6 years, is presented in chapter 4.
Accompanying studies of test validity and reliability are presented in chapter 5. Finally,
attention profiles in WS and DS are explored in chapter 6.
45

Chapter 3
Development of the Preschool Attention Battery
46

3. DEVELOPMENT OF THE PRESCHOOL ATTENTION BATTERY
Chapter 1 describes the evidence that exists to support and challenge the notion of attentional
separability, and the claims of particular models of attention. However, in all of these areas, data
from preschool-age groups is scarce relative to data from adults, adolescents and older children.
Adult participants are, of course, easier to obtain and easier to test, by virtue of their improved
ability to comprehend instructions and perform tasks. Younger participants possess fewer
behavioural, cognitive and response capabilities that might be reliably used to indicate processes
of attention.
Studies have begun to examine the development of attention abilities through the preschool
years, but generally using single tests to isolate a particular aspect of attention. These studies
have reported development of various attention skills between the ages of 3 and 6, and
demonstrated the feasibility of assessing attention in this age range. However, the investigation
of attention structure requires the administration a range of tests designed to tap the various
hypothesised components. As yet, no complete test battery exists to provide the range of tests
necessary to examine the hypothesised models of attention described in chapter one.
Beyond research applications, attention tests form an important component of developmental
assessment in clinical settings. Attention problems are among the symptoms most commonly
reported in children presenting for clinical assessment, occurring across a range of acquired,
genetic and medical disorders. Tests suitable for this purpose need to address a range of
attention skills, in a way that can be related to real-life functioning, using methods and materials
that can be conveniently administered in clinical or educational environments. The preschool
attention battery described here was developed with the aim of providing an instrument suitable
for investigating theoretical claims about attention structure and assessing attention in clinical
populations.
47

3.1 Inspiration for the battery
Initial test conception was inspired by an existing battery for the assessment of attention in
children aged between 6 and 16 years. The Test of Everyday Attention for Children (TEA-Ch;
Manly et al, 2001) comprises 9 subtests designed to tap the 3 hypothesised components of
attention (selective attention, sustained attention and attentional control). This battery has been
applied in both clinical and research studies, as reviewed in chapter one. To recap, selective
attention is assessed using two visual search tasks (Sky Search and Map Mission); attentional
control is assessed by a task switching measure (Creature Counting) and a verbal inhibition task
(Opposite Worlds); and sustained attention is measured using a tone-counting task (Score), an
auditory monitoring task (Code Transmission), a motor response withholding task (Walk Don’t
Walk), and two dual tasks (Score Dual Task and Sky Search Dual Task). Some issues relating to
the interpretation of constructs in the TEA-Ch factor analysis study have been discussed in the
previous chapter, but nonetheless its basic premise (i.e. a battery dedicated to assessing the three
hypothesised functions of attention) and the grounds for test selection provided a good model for
the new preschool battery.
However, the TEA-Ch alone could not provide an adequate model for the entire preschool
battery, particularly in relation to certain subtests where test validity or specificity was
questionable, or where test demands could not be readily modified. Other attention tests used
with older children or adults in research studies or clinical batteries were therefore also
considered and adapted for inclusion in the current battery. In addition, developmental
neuropsychologists have increasingly been constructing measures designed from a
developmental perspective rather than from adaptation of adult tasks. These kinds of tasks also
influenced the selection and development of measures in the preschool attention battery.
48

3.2 Key considerations in test development
To provide an effective instrument for the assessment of attention in typical and atypical
populations, the battery needed to meet a number of key requirements. Firstly, the investigation
of attention models required that the battery included multiple indicators for each component,
ideally varying in modality and response demands. If, in a factor analysis, tests with ostensibly
different surface demands load on the same factor, one can assume that some common
underlying process is responsible for that relationship. Conclusions about underlying processes
are undermined somewhat when tasks have similar surface demands.
A second key requirement was that the content, task demands and response requirements of
these tests were appropriate for children of preschool age. Tests needed to avoid content that
was unfamiliar to preschoolers, including numbers and letters, and limit words and items to
those understood by 3-6 year-olds. Certain operations, including reading and counting, are not
reliably performed by preschoolers, so were also avoided. Likewise, preschoolers are more
limited and variable in their response capabilities, so response requirements were simplified as
far as possible. Tests then needed to be easily explainable, in simple language, so that
preschool-age participants could fully comprehend what was required of them in each task.
The third consideration was that the impact of non-attentional demands should be minimised.
Because attention is not directly observable, tasks will involve various other perceptual,
cognitive, and behavioural systems. It is possible in some cases to select operations and
responses that involve minimal demand, so are unlikely to impact upon test performance.
However, where these systems might affect test scores, their impact can be minimised, most
commonly by comparing across conditions where non-attentional demands remain the same, but

attentional demands differ. Both methods have been used to increase the validity and specificity
of measures in the new preschool battery.
Another major consideration was that the tests in the new battery should be simple to administer,
without the need for specialist knowledge or equipment. Whilst early applications of the battery
would be limited to the studies described in this thesis, the demand for such measures from other
research labs and clinical establishments was clear from the outset. For ease of administration,
and with these potential wider uses in mind, tests were designed in paper-and-pencil or simple
computer-based formats. Specialist equipment, programs, or user knowledge was avoided, and
consideration was given to portability, durability and flexibility. The resulting test materials
were limited to 5 laminated visual search sheets, a laptop or other computer for administration of
the remaining 7 tests, a stopwatch, a dry marker, and three small toy characters.
Finally, it was important that the battery meet the necessary standards of validity and reliability.
To create items that were valid as measures of attention, it was necessary to consider
appropriateness with regard to (i) the construct targeted by the tests, and (ii) the target
population. The appropriateness of selected measures as tests of attention generally, and
components of attention specifically, was endorsed by existing research, but was further
supported by the validity evidence presented in chapter 5. The reliability of these measures is
also considered in chapter 5.
3.3 The test development process
This section will describe the process of test development in general, with following sections
presenting the process specific to each test. This process is reviewed in detail here, as it
represents a considerable contribution to the work in this thesis, and provides a valuable insight
into the complexities of test development. The first stage in the process, test selection, was
50

informed by existing attention literature, tests and batteries. It was necessary to select at least
two, preferably three, tests designed to tap each of the three hypothesised components. The
TEA-Ch was an early point of reference here, but other measures were incorporated to fill the
gaps where the TEA-Ch lacked specificity or could not be readily adapted.
Once a number of measures had been selected, pilot studies with children aged between 2 and 6
years were run to establish the appropriateness of each test for the target age range. Whilst the
complete test battery has only been normalised for children aged between 3 and 6 years, piloting
included younger children in the hope that at least some subtests might eventually be suitable for
normalisation with 2-year-olds (discussed further in chapter 5). In total, 140 typically-
developing children (65 females, 75 males) participated in pilot sessions conducted at the Visual
Development Unit or in London primary schools. Between sessions various changes were made
to the battery on the basis of the children’s performance, including the removal of entire tests
from the battery, the inclusion of additional measures, or the modification of existing tests.
For each task, the first important requirement was an absence of floor or ceiling effects - tasks
should not be too difficult for the youngest children or too easy for the oldest. The number of
children refusing to perform or complete a particular test was taken into account here, since
young children especially will refuse to attempt a task that they perceive to be too difficult or fail
to understand (Mantynen et al, 2001). Given the degree of development over the preschool
years, it sometimes proved challenging to develop measures that were suitable across the age
range. Although it would be possible to devise a test battery with varying degrees of task
difficulty to account for development, a single set of measures that could be applied across the
age range was desirable, so tests were modified to produce single tasks free from floor or ceiling
effects.
51

It was also important that tests were sensitive to any changes in attention with age. It is possible
that development of particular attention skills might occur principally at a certain point within
the age range, without any significant development at other points. However, we would
anticipate some development of all attention skills between 2 and 6 years, and tests were
expected to have the sensitivity to reveal such changes. A final priority was that test
performance should reflect the intended constructs and not some other confounding variable/s.
Whilst tests were initially selected and designed with this in mind, the impact of other variables
sometimes only became apparent during testing itself. Therefore, it was important to note
potential confounds observed during the pilot stages, and make amendments where necessary.
So, for tests to be included in the battery they needed to act as one of several indicators of a
specific attention component, supported by existing research; to include age-appropriate content,
task requirements and response requirements; to show an absence of floor or ceiling effects; to
be sensitive to development across the age range; and to depend on no obvious confounding
variable. Even following extensive piloting and adjustment, the 8 tests included in the final
battery might still benefit from some revision. Certain issues regarding the current battery only
became apparent when large-scale data for normalisation were collected. Whilst these are
relatively minor issues that do not seriously threaten the value of this attention battery, they
serve to highlight how complex the process of test development can be, and will be considered
in more detail in chapter 4. The following subsections describe the process of test development
specific to each measure.
3.4 Selective attention measures
VISUAL SEARCH
Visual search tasks have been employed as measures of selective attention in both clinical and
research settings for many years. Visual search involves an active scan of some array for
52

particular target items, with distractors increasing the demand for focused attention. Indeed, the
way in which targets are distinguished from distractors determines the requirement for attention
in visual search. If a target is defined by a unique feature, then search will be fast, efficient and
non-attention-demanding - the target will appear to ‘pop out’ of the display. In contrast, if a
target is defined by a conjunction of features, some of which are shared with distractors, then
search will be slower, attention-demanding and affected by array size (Treisman, 1988;
Treisman & Gelade, 1980). To encourage serial (i.e. attentive) search, the task therefore
required targets and distractors that shared features but were distinguished by their particular
arrangement of features.
For the new battery, a search task was developed as an adaptation of the Sky Search subtest from
the TEA-Ch, which requires the child to find pairs of matching spaceships located randomly
among non-matching pairs. To make the content more suitable for this age range, animals (cats
and dogs) were substituted for spaceships, but the features of the task were otherwise like that of
the Sky Search. In this original version, however, the concept of a matching pair proved
confusing for the youngest children, whilst a subsequent adaptation in which single targets (cats)
were located among single distractors (dogs) proved too easy.
In a following modification, targets were complete pigs and dogs located among creatures
formed from merging dog heads with pig bodies and vice versa. Targets shared features with
distractors, and the stimuli were familiar to preschoolers, but task instructions remained simple
(“find the real pigs and dogs”). The first version of this task had 10 targets and 54 distractors,
and children marked the targets themselves on laminated sheets, finding as many as they could
with no time limit. However, whilst children understood the central task requirements (i.e.
finding the pigs and dogs), many of the younger children struggled to understand that they were
required to stop only when they thought they had found all of the targets. Some would stop after
53

finding one or two targets, whilst others would continue to search long after they had stopped
finding any. The possibility that this would unfairly inflate time-per-target measures for the
younger children prompted the introduction of a one-minute time limit for the visual search task.
The task was also modified so that targets were marked by the examiner, since the ability to use
a pen varied enormously especially in the early part of the age range. Finally, the number of
distractors was increased to 98 to increase task difficulty, since a significant proportion of the
older children had been performing near ceiling on the original version.
This modified version of the visual search task (an example of which can be found in Appendix
la) was piloted with a larger group of children (N=65) between the ages of 2.5 and 6 years.
Only two children refused to complete the test, both of whom refused to cooperate throughout.
A good range of scores was obtained, with no floor or ceiling effects (i.e. no-one scored above 9
or below 1; see figure 1). Some rudimentary statistics were performed on these pilot data to
examine the test’s sensitivity to development with age. A significant correlation supported
improved performance with age (Pearson’s r = .52, p<.01), and with the children divided into
four age groups (2-, 3-, 4- and 5-year-olds; see figure 1) there was a significant difference
between these groups on a one-way ANOVA (F (3, 62) = 7.91, p<.01). However, pairwise
comparisons showed no differences between the 2- and 3-year-olds or between the 4- and 5-
year-olds. This could, of course, represent the true developmental trajectory for performance on
this test, but could likewise indicate a lack of sensitivity in the measure. A second concern
emerging from this pilot study was that the pigs appeared to be more easily identified than the
dogs, suggesting a tendency for them to pop out of the array. Some final modifications were
therefore made to the visual search task.
54

(I) (ii)
10
• • • •
• • • • •
• H • •
Age (years)
CD
1 4
.
I::
.
u
ppl
r
2 years 3 years 4 years 5 years
Age group
Figure 1: (i) performance on the pig-dog version of the visual search (number correct) as a
function of age (years); (ii) performance on the pig-dog version of the visual search (mean
number correct) by age group (error bars represent standard errors).
These modifications coincided with a move to use items from a set of standardised pictures
(Snodgrass & Vanderwart, 1980) consistently across the battery. Only those items known by at
least 80% of children aged 30 months (mean proportion 96.2%) were included as stimuli in the
battery (e.g. Cycowicz, Freidman, Rothstein & Snodgrass, 1997; Morrison, Chappell & Ellis,
1997). For the new visual search, stimuli were an apple and a strawberry, with red apples as
targets located among white apples and red strawberries. These stimuli adhere more closely to
the traditional feature conjunctions employed in serial visual search (Treisman, 1988; Treisman
& Gelade, 1980), reducing the likelihood of ‘pop-out’, yet remain child-friendly with easily
comprehensible task instructions. The number of targets was increased to 18 to create a greater
range of possible scores, in an effort to improve sensitivity to age-related development, though
with 162 distractors the proportion of targets remained the same (10%). See appendix lb for
sample test materials. Children were still given one minute to find as many targets as possible,
with correct hits marked by the examiner on the laminated search sheets. Basic statistics showed
a somewhat stronger correlation of performance with age (Pearson = .78, p<.001; see figure 2), a
significant difference by age group (2-, 3-, 4- and 5-years) on a one-way ANOVA (F (3, 36) =
55

13.1, p<.001) with a somewhat clearer discrimination between individual age groups (see figure
2). This version of the test was retained in the final battery, which is described in full at the end
of this chapter.
(') (•')
2 years 3 years 4 years 5 years
Age (years) Age group
Figure 2: (i) performance on the apples version of the visual search (number correct) as a
function of age (years); (ii) performance on the apples version of the visual search (mean
number correct) by age group (error bars represent standard errors).
FLANKER TASK
As mentioned previously, the TEA-Ch contains only visual search tasks as measures of selective
attention. The problems associated with investigating attention structure in tasks with similar
surface demands have been discussed, and an alternative selective attention measure was
therefore sought for the new battery. In the flanker paradigm, developed by Eriksen and Eriksen
(1974), participants are asked to make a judgement about a central target and to ignore other
stimuli that flank the target. Despite instructions to ignore the flankers, response times are
generally slower for flankers that conflict with the target (i.e. are associated with a different
response). Differences in response time between trials with non-conflict flankers and trials with
conflicting flankers give an index of the ability to attend selectively to the target. Of course, this
kind of task may also involve an element of cognitive or response control, however, it has
56

historically been used to examine the degree of processing afforded to non-relevant stimuli
during the selection process.
The flanker task in the new preschool battery was adapted from the child version of the ANT
(Rueda et al, 2004) in which children are asked to indicate which way a central fish is facing,
ignoring distracting flanker fish. The basic principle of this task was adopted, but with a number
of modifications to make the task suitable for preschoolers. Firstly, the different cue conditions
of the ANT were removed, and performance was simply compared across conditions with
conflict and non-conflict flankers. Secondly, the flanker animals were changed from fish to
mice, so that they retained a reasonable level of physical similarity with the targets, but made
explanation of the task simpler. Preliminary pilot work showed that young preschoolers had
difficulty with the instruction to respond only to the central fish. Differentiating targets and
distractors on the basis of identity rather than spatial location ensured better comprehension in
this age group.
Thirdly, instead of the target always appearing centrally, its position varied across trials. This
modification was implemented in an effort to increase the selective demand of the task by
adding an element of spatial selection. In this task, the child must select out the target from the
three stimuli presented on each trial. If their ability to select out the target is good, then
distractors should be readily rejected and have little impact on responding. However, if the child
struggles to select the target, then distractors will have a greater impact. In this case, when the
response triggered by distractors is consistent with that required by the target, there should be
less interference than when target and distractor responses are inconsistent.
Finally, children were required to respond by touching a spot on one side of the screen or the
other to indicate which way the fish was ‘looking’, rather than pressing a button corresponding
57

to left or right, since this was not a concept reliably understood by preschoolers. Using this
method, responses are not timed individually (which would require a button-press and therefore
a more complex administration program) but rather timed across a whole block of like trials.
This may also have the advantage of increasing the selective demand in this task, as Casey et al
(2000) have shown that conflict trials preceded by other conflict trials demand greater selective
attention, whilst conflict trials preceded by non-conflict trials require greater response inhibition.
In the first version of this test (see appendix lc for sample slides), children completed a block of
24 trials with non-conflict flankers, followed by a block of 24 trials with conflicting flankers.
Total time to complete each block was recorded, and the difference between conditions as a
percentage of the control (i.e. non-conflict) time (to reduce the influence of basic speed) was
taken as a measure of selective attention. The child was only allowed to move on to the next
trial when they had given a correct response, so the time measure took into account any slowing
from deliberation or errors.
Twenty-four children aged between 2.5 and 6 years participated in the piloting of this measure.
Only one child (aged 2 years 9 months) refused to complete this test, and all other children
handled the test instructions and response requirements well. Performance across the age range
in this sample, based on the time difference between conditions as a percentage of that
individual’s control time, is shown in figure 3. There was indeed a trend for improved
performance with age, reflected in lower percentage time differences (Pearson’s r = -.54, p<.01),
and a significant main effect of age on an ANOVA comparing across the four age groups (2, 3,4
and 5 years; F (3 ,18) = 3.23, p<.05). However, pairwise comparisons failed to reveal differences
between individual age groups. The small sample size must be taken into account here, but
figure X does appear to suggest limited development on this measure, at least through the early
part of this age range. Again this might represent the true trajectory of development, but further
58

modifications were necessary on methodological grounds that also improved the test’s
sensitivity to age.
(i) (ii)
4 0 ° 2 years 3 years 4 years 5 yearsAge (years) Age group
Figure 3: (i) performance on the flanker task (time difference between conditions as a
percentage of time for the control task) as a function of age; (ii) mean performance on the
flanker task by age group.
The main concern with this version of the test was the possibility of order effects. Observations
during pilot sessions suggested that the first condition might be affected by a lack of practice.
Children were given just four practice trials during explanation of the task, not presented
continuously as in the test trials. The youngest children particularly appeared slow to get started
on this task. This kind of practice effect would serve to disproportionately reduce the apparent
difference between conditions towards the younger end of the age range. Practice runs for both
condition types were therefore introduced, and 4 blocks were presented instead of two, in the
following order: control, conflict, conflict, control. This final version of this test is described in
more detail at the end of this chapter.
59

3.5 Sustained attention measures
AUDITORY SUSTAINED ATTENTION
The TEA-Ch includes several measures of auditory sustained attention. The Walk Don’t Walk
task is likely to require response inhibition in addition to sustained attention, so was not adapted
for inclusion as a sustained attention task in an attempt to keep task demands as clear as possible.
The remaining tasks, Score! (requiring tone counting) and Code Transmission (requiring
continuous auditory monitoring), informed the development of the auditory sustained attention
task in the new battery.
Tone counting is not an operation that preschool-age children can reliably perform, so in an early
adaptation of the Score! task, children were asked to simply deposit a token into a box each time
a target sound (a dog bark) was heard. However, this task proved far too easy, with the sound
often alerting children whose attention had clearly wandered. Instead, each trial in the following
version consisted of a list of words, and the child was asked to listen to the words and report any
targets (animal names) heard at the end of each trial. Each trial consisted of between 10 and 30
words, with either one or two targets (to ensure that the child could not simply ‘switch off after
hearing the first target).
This version of the task was piloted with 18 children aged between 2.5 and 6 years. Although all
18 children attempted the task, four of the youngest children (mean age 2 years 11 months)
refused to complete all 10 trials, suggesting that this task was too challenging for children at the
lower end of the age range. Aside from this problem, scores did not appear to be showing floor
or ceiling effects, and showed a strong trend for improvement with age (see figure 4; Pearson
correlation = .74, p<.001). The sample size and distribution in this case was not sufficient for
any meaningful examination of performance by age group, and observations during piloting had
anyhow necessitated a major change in task format.
60

16
14
12
fc 108
80)SiE 613Z 4
2 ■ • •
0 1------- .------ .----- 1------- .2 3 4 5 6 7
Age (years)
Figure 4: performance on the auditory sustained attention task (blocks version) as a function of
age.
Observing children on this task, it was often clear that they had noticed a target during
presentation, but were unable to recall it at the end of the trial. The test was therefore
functioning as much as a test of memory as of sustained attention, threatening its validity and
specificity. The task was therefore modified to entail continuous presentation of items over a
single block, with immediate report of targets. Indeed, tasks of this nature, known as continuous
performance tasks (CPTs), have long been used to assess sustained attention in both adults and
children. In a traditional CPT, a continuous stream of stimuli (often numbers or letters) is
presented, and the individual is asked to press a button each time they see (or hear) a specified
target. This target might be a single item (e.g. the letter A), known as a simultaneous task, or a
combination of successive items (e.g. A followed by X), known as a successive task. Measures
typically include response latency, errors of omission (missed targets) or commission (erroneous
responses to non-targets), and sometimes the signal detection parameters of d' (reflecting
perceptual sensitivity to targets) and /? (reflecting response bias).
Numerous studies have focused on the CPT’s ability to detect a decline in sustained attention
over time (known as vigilance decrement), usually observed after 20 minutes or more ‘on task’.
61

Parasuraman and Davies (1977) devised a ‘vigilance taxonomy’ to describe the type of task most
likely to elicit a vigilance decrement, claiming that successive discriminations and a high event
rate (at least 30 stimuli per minute) were more likely to produce a decrement. From a meta
analysis of 42 studies, See et al (1995) added to this that vigilance decrements were less likely in
perceptual tasks (involving changes in the physical characteristics of the stimuli as signals) than
in cognitive tasks (involving symbolic or alphanumeric stimuli as signals). They failed to find
any effects for a number of other test variables, including total test duration, sensory modality,
stimulus duration, target probability or event regularity. However, these factors have been found
to affect the ability of the CPT to discriminate between children with attention deficits and their
typically-developing peers. Corkum and Siegel (1993) conducted a review of 13 studies, and
concluded that the tasks best differentiating children with ADHD and normal controls tended to
use a short stimulus duration (less than 200 ms), a relatively short interstimulus interval (less
than 2 seconds) and a high target frequency (the range reviewed was 10-25%). All of this
information informed the development of the sustained attention tasks in the new battery.
For the new auditory sustained attention task, children were presented with a continuous list of
words, and asked to report each animal word that they heard. Fifteen animal words served as
targets, each presented twice over a 6-minute session. Target frequency was 15%, target
duration was on average 760 ms, and the interstimulus interval (ISI) was 1000ms. This version
of the test was piloted with 16 children aged between 2.5 and 5 years. Four of these children
refused to complete the task, and one other had difficulty naming all 15 animals. A simpler
version of the task was therefore devised, in which just 5 animals acted as targets (cat, dog, pig,
horse and fish), and only words with a single syllable were used to facilitate naming (pictures of
the items used as targets and non-targets can be found in appendix Id). Target frequency was
increased to 20%, with 30 targets occurring among 150 items over a 5-minute session. Mean
word length was 650 ms with an ISI of 1350, giving an average stimulus onset asynchrony
62

(SOA) of 2000 ms. Correct responses and errors of commission were recorded, with children
receiving a prompt to maintain attention if they missed four consecutive targets. Any prompts
were also recorded, and an overall score was calculated from the number correct minus any
errors of commission and prompts.
This version of the test was piloted using 26 children aged between 2.5 and 6 years. Only one
child refused to complete the test and comprehension and task-competence was otherwise good.
A good range of scores was obtained, with an absence of floor or ceiling effects. Preliminary
statistics supported a strong trend for improved performance with age (see figure 5; Pearson
correlation = .60, p<.01), with a significant main effect of age on an ANOVA comparing across
the four age groups (2, 3, 4 and 5 years; F (3, 21) = 5.36, p<.01). Pairwise comparisons revealed
differences between the oldest group and each of the two youngest groups (see figure 5), even
with relatively small group sizes. This version of the test was retained in the final battery.
(i) (ii)
30
25
§<D 20
o£ 15
0) 10
8CO 5
0
Age (years)
<D 20
15 -
2 years 3 years 4 years 5 years
Age group
Figure 5: (i) performance on the auditory sustained attention task (continuous version) as a
function of age; (ii) performance on the auditory sustained attention task (continuous) by age
group.
63

VISUAL SUSTAINED ATTENTION
For each component of attention, an effort was made to include tests that varied in terms of their
surface or modality demands, so a visual equivalent of the continuous auditory sustained task
was developed. In this task, children were asked to watch a continuous stream of pictures and
report the occurrence of specified targets (the 15 different animals used in the initial continuous
auditory task). In the first pilot version, targets were presented for 1000 ms with no interval
between pictures. Targets occurred with a frequency of 10% over a session lasting 5 minutes.
This test proved to be extremely easy so long as the children understood the task requirements.
Of the 26 children on whom this test was piloted, the majority of those aged over 3 years scored
at least 25 out of 30. There were several children, however, who struggled with the naming of
targets. Therefore, a number of changes were made to this test to make its comprehension
simpler, but its execution more difficult and these changes also served to make the visual task
more equivalent with the modified auditory task.
First, the test was altered to use the same targets and distractors as the final auditory version, to
reduce potential difficulties with naming (see appendix Id). Stimulus duration was then
decreased to just 200 ms to increase task difficulty. Items now flashed very briefly on the
screen, so that any lapses in sustained attention were more likely to be reflected in the number of
missed targets. The ISI was also increased to 1800 ms, so that SOA was equivalent to the mean
SOA of the auditory task (2000ms) and total task duration was the same. The long ISI also
increased the demand for sustained attention by requiring that attention be maintained
endogenously during the intervals between items. As with the auditory task, children were
prompted if they missed four consecutive targets, and scores represented the total number correct
minus any errors of commission and prompts.
64

Of the 28 children aged 2.5 to 6 years involved in piloting this measure, only 1 refused to
complete the test. A good range of scores was obtained, with no evidence of floor effects.
These children did, however, appear to reach ceiling level on this task by the age of around 5'A
years (see figure 6). Shorter stimulus duration times or longer total task duration may be
necessary to challenge sustained attention at this age. This version of the test was retained in the
battery, and the issue of ceiling effects on this test are addressed more fully in chapter 4.
Beyond this, there was a very strong trend for improved performance with age on this test
(Pearson correlation = .86, p<.001), plus a main effect of age on an ANOVA comparing across
groups (2, 3, 4 and 5 years; F (3, 23) = 18.02, p<.001). Pairwise comparisons revealed
significant differences between each of the two youngest groups and each of the two oldest
groups (p<.05 in all cases).
(i) (ii)
2 years 3 years 4 years 5 years
Age (years) Age group
Figure 6: (i) performance on the visual sustained attention task as a function of age; (ii)
performance on the visual sustained attention task by age group.
DUAL TASK
The TEA-Ch includes two dual tasks under its sustained attention component, suggesting that
the ability to attend simultaneously to two tasks or streams of information might depend more on
one’s ability to sustain attention than a separate function of divided attention. Some models
65

include divided attention as a separate component, or as part of an attentional control
component. For the purposes of test development, however, the TEA-Ch model was followed
and a dual task was included as one of the measures designed to tap sustained attention. The
single tasks selected for simultaneous performance were the visual and auditory sustained
attention tasks described above. Over a period of 2XA minutes, visual and auditory items were
presented simultaneously and the child was required to report targets occurring in both
modalities. Fifteen targets were presented in total, equivalent to the number presented in IVi
minutes of each single task.
This task was piloted using 14 children aged between 3 and 6 years. All of these children
successfully understood and performed the test, giving a good range of scores with no evidence
of floor or ceiling effects (see figure 7). An initial analysis showed a positive, but non
significant, correlation between age and performance on the dual task. However, with the
removal of one obvious outlier (a child aged 5 years 9 months who performed particularly badly
on this test), there was a strong and significant trend for improved performance with age
(Pearson correlation = .82, p<.01). A significant main effect of age was also observed on an
ANOVA comparing across age groups (3,4 and 5 years; F(2, 10)=19.10, p<.01), with significant
pairwise comparisons between all groups except the two oldest.
66

(i) (H)
14
£ 12
0 10
O0 8
o 60
84
</> 2
3.0 3.5 4.0 4.5 5.0 5.5 6.0
Age (years)
0 10
4 years 5 years
Age group
Figure 7: (i) performance on the dual task as a function of age; (ii) performance on the dual task
by age group.
3.6 Attentional control measures
VERBAL OPPOSITES
The ability to control and inhibit automatic responses is a key feature of attentional or executive
control. In routine situations, it is sufficient for the responses most strongly triggered by
external stimuli to be expressed, with relatively little demand on attention. However, in non
routine situations the most common or automatic responses may not be appropriate, and
attention is required to select and monitor alternative responses. The inhibition of prepotent
verbal responses has been studied for many decades using the well-known Stroop colour-word
task (Stroop, 1935), in which participants must read colour words printed in a different colour
ink, and report the ink colour rather than the word. This requires inhibition of the normal
tendency when reading to attend to the words. This task has been adapted for use with young
children in the Day-Night task (Gerstadt et al, 1994), where children are instructed to say ‘day’
when presented with a picture of the stars and moon, and ‘night’ when presented with a picture
of the sun. Using a group of 240 3/2-7 year-olds, Gerstadt et al (1994) found that children under
67
the age of 5 years had considerable difficulty on this task, with fewer correct responses and
longer response latencies. They were considerably quicker and more accurate on a control task
where ‘day’ and ‘night’ responses were given to abstract designs, suggesting that they were
experiencing a problem of inhibition rather than memory on the experimental task. This was
supported in a study by Diamond et al (2002), where memory interventions failed to improve
performance but reducing the inhibitory demand did. Research therefore strongly supports the
role of inhibitory control mechanisms in this kind of verbal opposites task.
The TEA-Ch employs a similar test, Opposite Worlds, in which children are shown paths
constructed from the numbers 1 and 2, and asked to say ‘one’ every time they reach a 2 and vice
versa. However, children of preschool age are often unfamiliar with number, making the
Opposite Worlds stimuli unsuitable. The Day-Night task also uses stimuli that are not
necessarily familiar to children in this age range, and a lack of familiarity will have two
disadvantages on this kind of task. Firstly, the child may struggle with producing and/or
understanding the words that they are required to use, which would limit the number of children
capable of completing the test. Indeed, Gerstadt et al (1994) excluded a group of 3-year-olds
from their study because they were largely unable to complete the test. Secondly, a lack of
familiarity will mean that a stimulus is not associated with a strong automatic naming response,
which is necessary if the task is to measure the ability to inhibit this response. Instead, animals
were chosen as stimuli due to their familiarity and appeal for preschoolers.
Children were therefore shown a series of cat and dog pictures, and first asked simply to name
each animal as quickly as they could. In the second block of trials, children were asked to
reverse the prepotent response and say ‘cat’ when presented with the dog, and ‘dog’ when
presented with the cat. The pictures appeared in the centre of the screen, and were
approximately 10cm x 7 cm in size. The time difference between the normal-naming and
68

opposite-naming blocks was used as a measure of verbal inhibitory control (greater differences
reflect poorer control). In the first version of this task, pictures were presented on individual
cards, with 20 pictures per block. This test was piloted with 30 children aged between 2V4 and 6
years, three of whom refused to complete the task (all aged below 3 years). The task might
therefore be too difficult for the very youngest children, but those aged over 3 years all
understood and performed the task successfully. An absolute ceiling effect on this task would
essentially mean zero time difference between conditions. This is clearly not the case here,
though the mean difference does appear to plateau for the oldest groups (see figure 8), which
might reflect a relative ceiling effect. It is possible, though, that further development occurs
sometime after preschool age. In any case, the test did appear to be sensitive to developments
across the age range, with a significant trend for improved performance with age (Pearson’s r = -
.67, p<.001), and a significant main effect of age on an ANOVA comparing across age groups
(2, 3 ,4 and 5 years; F (3,22) = 26.06, p<.001).
(i) (ii)
cn70
§| 60
8 50
a>0c 20 2 3
Ifc 10TJ1 o
Age (years)
608c2?j>I 40
|I 20
2 years 3 years 4 years
Age group5 years
Figure 8
function
group.
(i) performance on the verbal opposites task (time difference between conditions) as a
of age; (ii) performance on the verbal opposites task (mean time difference) by age
Although the test was functioning reasonably well, it was subsequently modified for computer-
based administration, with stimuli presented individually on the screen instead of cards to allow
69

for more consistent presentation. Additionally, due to variations in each child’s normal-naming
speed, the time difference between conditions was calculated as a percentage of each
individual’s control time to derive the critical measure. This version was piloted with 18
children aged between 3 and 6 years, all of whom successfully completed the task. Floor or
ceiling effects were not apparent, with somewhat less of a plateau at the top of the age range (see
figure 9). There was again a significant trend for improved performance with age (Pearson’s r =
-.60, p<.01), supported by a significant main effect on an ANOVA comparing across groups (3,
4 and 5 years; F (2, 15) = 5.78, p<.05).
0) (ii)
70
60
O 50 (0ijj 40 I tTJ<0 30|
20 s'10
0
• •
3.0 3.5 4.0 4.5 5.0
Age (years)5.5 6.0
60
50
40
30
20
10
03 years 4 years 5 years
Age group
Figure 9: (i) performance on the computerised verbal opposites task (time difference between
conditions as a percentage of the control time) as a function of age; (ii) performance on the
computerised verbal opposites task by age group.
In a final modification, designed to reduce potential order effects, four blocks were presented
instead of two in the following order: normal, opposite, opposite, normal, and two practice runs
were given prior to these test blocks. This final version is described in lull at the end of the
chapter.
70

MOTOR INHIBITION
Another group of common attentional control tests assess the inhibition and control of motor
responses. In a typical go/no-go task, for example, subjects are asked to press a button in
response to one stimulus (e.g. a green light) but not to respond to a second stimulus (e.g. a red
light). Go stimuli generally occur more frequently, establishing a prepotent response that must
be inhibited when the no-go stimuli are presented. Such tasks have been extensively used to
investigate motor inhibition in adults and have also been adapted for use with children (e.g.
Rubia et al, 2001). Adaptations for preschoolers have also been devised, generally taking a more
game-like format such as the children’s game ‘Simon Says’, in which the child must perform an
action requested by the examiner, but only if the request is preceded with ‘Simon says... ’
The TEA-Ch includes one subtest that also follows the go-no-go formula: Walk, Don’t Walk. In
this test the child is required to mark a block in a pathway for each go sound and withhold the
response for the no-go sound, which occurs following a number (between 3 and 12) of go
sounds. Somewhat controversially, this subtest is included under the sustained attention
component. However, given that measures such as this are almost universally regarded as
attentional control tasks, an adaptation was included in the new battery under this component.
In this task, children were asked to mark a sheet of paper whenever they heard a cat sound, but
not when they heard a dog sound. There were 10 trials in total, each with between 3 and 9 go
sounds followed by a single no-go sound. However, this test proved largely unsuccessful. Of 21
children aged between 2Vi and 5 years, only 8 were able to complete the task successfully. The
other children struggled to keep up with the go sounds, most commonly falling behind because
they were unable to either (i) understand that they should make a mark on the paper for each
sound, (ii) make their motor responses quickly enough, or (iii) overcome the temptation to mark
the page randomly rather than in response to the sounds. It therefore proved very difficult to
71

establish a ‘go’ response in this age range, making it impossible to accurately assess inhibition to
the no-go stimulus.
An alternative approach to examining motor inhibition in preschoolers uses a motor opposites
paradigm similar to the verbal opposites task described above. These include tasks based on
Luria’s (1966) ‘fist and finger’ test, where the child must make a fist whenever the examiner
points his finger and vice versa (Hughes, 1998), and Luria’s tapping test, where the child must
tap once when the examiner taps twice (Diamond & Taylor, 1996). Here children must
remember the rule and inhibit the tendency to simply copy the action of the examiner. Children
show development of these abilities between the age of 3 and 6 years (Diamond & Taylor,
1996), and the errors that they commonly show at younger ages (such as always making one
type of response, mimicking the examiner’s action, or tapping many times) have also been
observed in frontal patients (Luria, 1966).
For the new battery, the ‘fist and finger’ version was piloted as an alternative motor inhibition
measure. Children were first asked to copy two hand gestures (making a fist and pointing a
finger) modelled by the examiner until they could confidently produce both gestures. The child
was then asked to watch what shape the examiner made with their hand, and then make the other
shape with their own. Thirty trials were given, and the number of correct responses recorded.
This task was piloted with 19 children aged between 2Vi and 6 years. Six of these children were
aged between 2Vi and 4‘/2 years, and all failed to complete the test. These younger children had
great difficulty understanding what they were required to do in this test, even when more simple
actions were employed (e.g. hand palm-up or palm-down), and an alternative measure was
sought.
72

A task successfully used with young children in our lab that requires inhibition of a motor
response is the counterpointing task (e.g. Atkinson et al, 2003). In this task, the child first
completes the pointing condition, where they are asked to point at a target appearing on one side
of the screen or the other. In the following counterpointing condition, the child is asked to point
to the opposite side of the screen from the target, requiring that they overcome a natural
tendency to point towards a target that has been strengthened in the preceding pointing
condition. Response latencies are recorded and compared across conditions, with the time cost
associated with counterpointing giving a measure of inhibitory control. For the new battery, the
target was a dog (approximately 9cm x 6.5cm), and the child was asked to complete two blocks
of 20 trials (pointing then counterpointing). Overall time per block was recorded and the
difference between blocks taken as the critical measure. This task was piloted with 15 children
aged between 3 and 6 years, all of whom successfully completed the task. The question of
ceiling effects applies on this task - by the age of 5 years, our pilot children appeared to be
showing little time difference between conditions, suggesting that this task might be too easy at
the upper end of the age range. However, there was considerable improvement between the ages
of 4 and 5 years, so the task seemed useful for distinguishing between ages within this range.
Indeed, there was a significant trend for improved performance with age (Pearson correlation = -
.59, p<.05), and a marginally significant main effect of age on an ANOVA comparing across age
groups (3,4 and 5 years; F (2, 12) = 3.79, p=.053). Considerable variability was observed in the
younger groups, and a more reliable picture of ability on this task across the age range might be
gained from a larger sample. As the best measure of motor inhibition piloted during this
process, the counterpointing task was retained in the final battery.
73

(i) (ii)
co 18i 16T3c 14
c 12 <DI 10
£ 88 6I 4
* 2 "O z<DE 0
P 3.0 3.5 4.0 4.5 5.0
Age (years)5.5 6.0
14
12CDo0 10
I?1 8CD
E 6
CD 4 CD IS ii
3 years 4 years 5 years
Age group
Figure 10: (i) performance on the Counterpointing task (time difference between Pointing and
Counterpointing conditions) as a function of age; (ii) performance on the Counterpointing task
by age group.
CARD SORTING
The ability to switch attention flexibly between stimuli or tasks is another key element of
attentional control. The TEA-Ch includes an attentional switching subtest called Creature
Counting. Here the task is to count the number of creatures arranged along a path, with shifts
between upwards to downwards counting signalled by arrows. This task has a number of
features that make it unsuitable for preschool-age children. Firstly, counting is not something
that can be reliably performed by young children. Secondly, children of this age struggle to
understand the kind of contingency-related instructions involved in this task (i.e. if the arrow
points up then they should count upwards, but if it points down they should count downwards).
The requirement to switch tasks or responses on the basis of some pre-specified cue (and an
associated if-then rule) is unlikely to be useful with children of this age.
An alternative approach for assessing attentional switching requires the subject to shift the focus
of their attention from one aspect of a stimulus to another (rather than from one task to another).
Sorting tasks such as the Wisconsin Card Sorting Task (WCST; Heaton, 1981) require the
74

subject to sort items first on the basis of one dimension (e.g. colour) then switch to sorting by a
different dimension (e.g. number or shape). The WCST has been widely used in clinical and
research settings to assess frontal lobe function, with standardised versions available for ages 6 V2
to 89 years. The advantage of this task over the Creature Counting subtest is that children do not
need to hold in mind any rule for responding - they simply need to use feedback to inform their
responses. Card sorting tasks for preschoolers have indeed been successfully developed. In
Zelazo’s card sorting task (Zelazo et al, 1996), for example, children are first asked to sort cards
according to their colour and then asked to sort by shape. Compared with 4-year-olds, 3-year-
olds perform badly on this task, continuing to sort by the first dimension even after being
instructed to switch (Zelazo et al, 1996; Kirkham et al, 2003). Using several manipulations of
the basic task, Kirkham et al (2003) suggested that this failure results from an ‘attentional
inertia’, or inability to shift attention once engaged on a particular feature.
Although it accesses shifts of attention, this task is easy beyond the age of about 4 years. A
more complicated task where children are not told which dimensions to sort by, in line with the
traditional WCST, has been developed by Hughes (1998). In this task, the instructions are made
‘child-friendly’ by asking the child to determine which cards are teddy’s favourites. For
example, on an initial set of cards, teddy’s favourite might be based on colour (e.g. he likes all
the green ones). If the child successfully determines this rule, they are asked to work out which
cards another teddy likes, with favourites now based on shape (e.g. he likes all the circles). The
items used pre-switch and post-switch are different to prevent perseveration on any specific
colour or shape - the child simply needs to make a shift of dimension. Feedback is given after
each trial, and the child must use this to establish the criteria for accurate sorting.
This task was piloted with 12 children aged between 3 and 6 years. Six consecutive correct
responses were required to pass each stage, and virtually all of the children passed both stages.
75

Moreover, they required relatively few trials in order to do this, and the total number of trials
varied little across the age range. This task was therefore too easy to distinguish well between
different ages within the range, and a more challenging alternative was sought. The same basic
method was retained (i.e. the ‘teddy’s favourites’ technique) but the stimuli were altered and
extra stages were added, in line with a subtest from the CANTAB battery (e.g. Luciana &
Nelson, 1998). The Intradimensional / Extradimensional (ID/ED) Shift task involves a series of
8 stages where line drawings must be sorted according to different dimensions. Shifts between
stages include a number of reversals (where the previously correct feature becomes incorrect), an
intradimensional shift (where the relevant dimension remains the same, but must be applied to
new items), and an extradimensional shift (where the relevant dimension changes). For the new
battery, animal- and food-related line drawings were substituted for the abstract line drawings
used in the CANTAB battery, and the number of stages was reduced to four (see appendix le for
example stimuli).
In the first stage, the child was presented with two frames each containing a food picture, and
they had to work out, based on feedback, which was teddy’s favourite {simple discrimination).
In the second stage, a picture of an animal was included in each frame along with the food item,
but the child needed to continue sorting according to the food items {compound discrimination).
In the third stage, novel exemplars of each category were introduced, and the child needed to
sort according to the new food items {intradimensional shift). In the final stage, the frames again
contained novel exemplars of each category, but the child now needed to sort by the previously-
irrelevant animal items {extradimensional shift). A total of 24 possible trials were given for each
stage, with 6 consecutive correct responses required to pass a stage. Although this task offered
advantages in terms of greater complexity for the older children, its length was a disadvantage.
In a pilot with 16 children aged between 2Vi and 6 years, only one child refused to complete the
test, but many of the younger children lost motivation towards the end. In addition, the
76

compound stimuli seemed to cause considerable confusion, and some children were not clear
that they should base their judgement on just one class of stimuli. The test also proved to be
poor at discriminating between different ages, with no trend for improved performance with age
and no difference between age groups on an ANOVA.
The final version of the sorting task was therefore a compromise between the original teddy’s
favourites version and the CANTAB-inspired version. The task used balloons varying in shape
and colour as stimuli, so that the two dimensions were again compounded within a single item.
However, an extra stage was added so that completion of all three stages involved one
intradimensional shift and one extradimensional shift (see appendix If for example stimuli). In
the first stage, the child had to determine which type of balloon was teddy’s favourite based on
colour. In the second stage, they saw new balloons and a new teddy, but still needed to
determine preference based on colour. In the final stage, they were again shown new balloons
and a new teddy, but had to determine preference on the basis of shape. A total of 20 possible
trials was given for each stage, with six consecutive correct again required for a pass.
This version was piloted with 19 children aged between 3 and 6 years, all of whom understood
and completed the task. The task did not appear to be affected by floor or ceiling effects (i.e. all
children passed at least one stage, but the oldest children did not appear to be finding the task too
easy). There was a significant trend for improved performance with age in terms of the total
number of trials required (Pearson’s r = -.49, p<.05), but no significant main effect of age on an
ANOVA comparing across age groups (3, 4 and 5 years). It is possible that the small group
sizes prevented statistical significance here, as it does seem that there is some difference in total
trials across age groups (see figure 11).
77

0) (")
60
50
</) 40
■*= 30JSo1- 20
10
03.0 3.5 4.0 4.5 5.0
Age (years)5.5 6.0
3 years 4 years 5 years
Age group
Figure 11: (i) performance on the Balloon Sorting task (total number of trials) as a function of
age; (ii) performance on the Balloon Sorting task by age group.
3.7 The final test battery
This chapter gives some idea of the complex and time-consuming process of developing a test
battery for preschoolers. The usual concerns of developing a reliable instrument were
compounded by the inherent cognitive limitations of a preschool-age sample. However,
extensive piloting served to produce a battery that was practical for the target age range, seemed
to be free from the effects of non-attentional abilities as far as possible, and was sensitive to
development across the age range. The final version of the new preschool attention battery
included the following 8 measures.
Selective attention subtests
(1) Visual Search
In this task, children were required to identify targets (red apples) among distractors (white
apples and red strawberries) on a laminated search sheet, with 18 targets located among 162
distractors. The child was first shown the three items on a familiarisation sheet and completed
78

two small practice sheets, then had one minute to find as many targets as possible on the test
sheet. They responded by touching a target, which was marked by the examiner, who recorded
the number of targets identified and the number of errors (including errors to distractors and
repeats on previously found targets). It is also possible to derive a time-per-target measure from
this task (by dividing 60 seconds by the number of targets identified), which could be compared
against a time-per-target for a control sheet in which the targets (red apples) were distributed
among white apples only. The version essentially removes the selective attention demand, and
allows for an examination of differences attributable to motor speed, which may be useful
particularly with clinical samples. The studies reported in this thesis use the total number of
targets found as the critical measure.
(2) Flanker Task
On each trial, children were presented with a grey fish (target) and two grey mice (non-targets),
arranged horizontally across the screen, with the position of the target varying randomly across
trials. Two stars were located one on either side of the screen, and the child was asked to touch
the star that the fish was looking at on each trial. On control trials, the distractor mice faced the
same way as the fish; on test (conflict) trials, the mice faced the opposite way. The child first
completed two practice blocks, then four test blocks (12 trials each) in the following order:
control, test, test, control. The examiner only advanced to the next trial once a correct response
had been given, turning errors into a time penalty. If the child failed to self-correct an error, they
were prompted to ‘touch the star that the fish is looking at’. Total time to complete each block
was recorded, along with the number of errors per block. A response counted as an error if the
child actually touched the incorrect star. The critical score was the total test (conflict) time as a
proportion of the total control time (i.e. test time divided by control time), which takes into
account each child’s general speed when the selective demand is minimal. A lower score
indicates less difference between conditions, and better performance.
79

Sustained attention subtests
(1) Visual sustained attention task
In this task, the child was asked to watch a continuous stream of pictures presented on a
computer screen, and report the occurrence of five target animals (cat, dog, pig, horse and fish).
Non-targets were everyday items familiar to preschoolers (e.g. car, bike, tree, sock). Each item
appeared on the screen for 200 ms, with an ISI of 1800ms, giving an SOA of 2 seconds. Thirty
targets and 120 non-targets (20% target frequency) were presented over a 5-minute session, and
the number of correct responses was recorded. Responses qualified as correct if the appropriate
animal name was given before the onset of the next item. Delayed responses counted as missed
targets. Also recorded were the number of commission errors (i.e. responses to non-targets), and
the number of prompts (a child received a prompt to pay attention if they missed four
consecutive targets). The critical score was the number of correct responses minus any errors
and prompts. The test phase was preceded by a familiarisation trial in which the examiner
established that the child knew the name of each animal, and a practice run featuring each of the
targets once.
(2) Auditory sustained attention
In this task, the child was presented with a continuous stream of words and asked to report the
target animal words. Target and non-target items were the same as those featured in the visual
sustained task. Words had an average length of 650ms and the ISI was 1350ms, giving a mean
SOA of 2 seconds and a total task duration of five minutes. The examiner again recorded the
number of correct responses, commission errors and prompts, and derived an overall score by
subtracting errors and prompts from the number correct. This task was also preceded by a
familiarisation trial and two practice trials, during which each of the targets featured once.
80

(3) Dual task
In this task, children were asked to perform both the visual and auditory sustained attention tasks
simultaneously. Visual and auditory items were presented simultaneously, with one picture and
one word presented every two seconds. The pictures and words did not match, and the child was
required to report any targets occurring in either modality. A total of 15 targets were presented
over 2 V2 minutes. Again, children were prompted if they missed four consecutive targets, and an
overall score was derived from the total number of correct responses minus the number of errors
and prompts. This task was also preceded by a practice run featuring four targets.
Attentional control subtests
(1) Verbal Opposites
In this test, children were presented with a series of slides each showing either a cat or dog
picture. In the control condition, they were asked to simply name each animal as it appeared on
the screen. In both conditions, speed and accuracy were emphasised. In the test condition, they
were asked to say “cat” when the dog picture appeared, and “dog” when the cat picture
appeared, inhibiting the prepotent naming response. Following practice in each condition, four
blocks of 12 trials were run in the following order: control, opposite, opposite, control. The
examiner only advanced to the next trial once a correct response had been given, thus turning
errors into a time penalty. If the child failed to self-correct an error, they were prompted with
the appropriate instructions for the given condition. Time taken to complete each block was
recorded, with a note made of the number of errors per block (a response counted as an error if
they child completely expressed the incorrect word). The critical score was the total test
(opposite) time as a proportion of total control time, with lower scores reflecting better
performance. This gives a measure that takes into account each child’s general speed when the
inhibitory demand is absent.
81

(2) Counterpointing
In this task, the child was shown a series of slides, each with a picture of a dog appearing
pseudo-randomly on either the left or the right of the screen. In the control condition (pointing),
the child was simply required to touch the dog each time it appeared. In the test condition
(counterpointing), the child was asked to touch the screen on the opposite side to where the dog
appeared. Two blocks of 20 trials each were run (pointing then counterpointing), and the total
time and errors per block were recorded (a response counted as an error in the child actually
touched the incorrect side of the screen). The examiner only moved on to the next trial when a
correct response had been given, and the child was prompted with the appropriate instructions
for the condition if they failed to self-correct an error. Again, the critical score was the total test
(counterpointing) time as a proportion of the total control (pointing) time, with lower scores
reflecting better performance. This provides a measure that takes into account a child’s general
speed when the inhibitory demand is absent.
(3) Balloon Sorting
Children were presented with a series of slides, each showing two balloons that varied in colour
and shape (e.g. a red circle and a green star, or a green circle and a red star). They were also
shown a small teddy, and told that some of the balloons that they would see were teddy’s
favourites, and that other balloons he didn’t like at all. Children were instructed to try and work
out which type of balloons were teddy’s favourites, and that at first they might have to guess.
For each trial, the child was asked to point to the balloon in each pair that they thought was
teddy’s favourite, and the examiner gave feedback on whether their choice was correct. In the
first stage, teddy’s favourite was always determined by colour (e.g. he likes all the blue ones).
In the second stage, a new teddy and a new set of balloons were introduced, but teddy’s
favourite was still determined by colour (e.g. he likes all the yellow ones) - the intradimensional
shift. In the third stage, another new teddy and set of balloons were introduced, and now the
82

favourites were determined on the basis of shape (e.g. he likes all the circles) - the
extradimensional shift. Children were given a maximum of 20 trials per stage, and six
consecutive correct responses were required to pass a stage. Once a stage had been passed, the
child was allowed to move on to the next stage. If the child failed a stage, the test was
terminated and no further stages were attempted. Measures included the number of stages
successfully completed, and the total number of trials required for the three stages. If a child
failed to complete a stage, or failed to attempt a stage because they had failed the previous stage,
then they were automatically awarded a maximum score of 20 trials for that stage. Therefore,
the minimum trials score for this test would be 18 (if all three stages were passed in just six
trials) and the maximum would be 60 (if the first stage were failed and no further stages
attempted). After each successful sort, the child was also asked to explain ‘what kind of
balloons does teddy like’, and a record was made of their responses
83

Chapter 4
Normalisation of the preschool attention battery
84

4. NORMALISATION OF THE PRESCHOOL ATTENTION BATTERY
The test development process described in the previous chapter produced a battery of 8 tests that
appeared to meet the necessary criteria. They were reliably understood by children in the target
age range, showed sensitivity to development across the age range, showed few floor or ceiling
effects, and seemed free from the influence of non-attentional processes as far as possible. This
chapter reports results from a normalisation study, in which the entire battery was administered
to a large sample of typically-developing children, according to a standardised protocol. Data
from this study enabled a more thorough examination of the appropriateness and sensitivity of
the battery, according to the criteria set out in the previous chapter.
Data from this study were also used to investigate the hypothesised model of attention functions
in this age range. The research reviewed in chapter 1 presents a convincing argument in favour
of separable selective, sustained and attentional control components. However, not all studies
have supported this model of attention functions, and the model has not been examined in
children younger than 6 years. Attention and other cognitive functions show considerable
development over the preschool and early school-age years, and an understanding of this period
is vital in constructing a theory of how the structure of attention develops.
In this study, tasks were expected to show measurable improvements in performance across the
age range, with possible differences in the trajectory of development for the various components.
Further, it was predicted that factor analysis would support differentiation of attention into
distinct components, and these were expected to reflect the components observed in previous
studies, at least towards the upper end of the age range. Predictions therefore allowed for the
possibility that attention structure might vary over this age range.
85

4.1 Method
Participants
A total of 147 children between the ages of 3 and 6 years were recruited from London state
primary schools and the Visual Development Unit volunteer database. This sample comprised
children from three one-year age bands: 49 children aged 3-4 years, 51 children aged 4-5 years
and 47 children aged 5-6 years. The sex and age distribution of the sample is presented in Table
1. All children included in the normative sample had no evidence or history of developmental
delay, sensory loss, head injury or neurological illness or deficit, and visual acuity was also
normal or corrected to normal for all children.
No formal measure of socioeconomic status (SES) was taken, although attempts were made to
ensure that the schools selected provided a good representation of the range of SES in the
general population. Around 30 children (20.4%) had English as an additional language, which is
a little above the level observed in the general population (approximately 12.5%; Department for
Education and Skills, 2006). Children were only included in the sample if they had sufficient
English to understand task instructions and make the necessary responses. All children
completed the short form of the British Picture Vocabulary Scale (BPVS; Dunn et al, 1982),
which gives a measure of receptive vocabulary that could be used to further assess verbal
competency. This test also provided a measure of developmental level on a standardised test
that could be used to ensure that this sample performed at a level appropriate for their age. The
mean standard BPVS scores for each age band are presented in Table 1. The BPVS is
standardised to a mean of 100 and a standard deviation of 15. Neither of the two older groups in
this sample showed a mean score significantly different from 100, suggesting that their
vocabulary level was in line with expectations for their age. The youngest age band had a mean
BPVS score of 104.2, which showed a marginally significant difference from the standardised
86

mean (t=2.03, p= 048). The youngest group, therefore, showed slightly better receptive
vocabulary than might be expected for their age, though this difference was relatively small.
Table 1: Distribution of males and females, mean age in years and mean BPVS score by age
band for the normative sample.
Age Band
(years)
N Males Females Mean Age,
years (SD)
Mean BPVS
score (SD)
3-4 49 22 27 3.51 (.27) 104.18(14.42)
4-5 51 29 22 4.46 (.27) 101.73 (16.25)
5-6 47 22 25 5.44 (.31) 102.43 (17.25)
Total 147 73 74 4.45 (.83) 102.77(15.93)
Measures
Each child completed the eight subtests of the new preschool attention battery described in full
at the end of chapter 3. The tests were: Visual Search and Flanker task (measures of selective
attention), Visual Sustained, Auditory Sustained, and Dual Task (measures of sustained
attention), and Verbal Opposites task, Counterpointing and Balloon Sorting (measures of
attentional control).
Procedure
Each child completed all eight subtests in the following fixed order: Visual Search, Visual
Sustained, Flanker Task, Auditory Sustained, Verbal Opposites, Dual Task, Counterpointing,
and Balloon Sorting. Most children were tested in a single session, but a small number
completed the tests in two shorter sessions in the same day. In some cases this was necessitated
by the organisation of the school day; in other cases the child was given a break because they
appeared unable to cope with the complete battery in a single session (more common at the
younger end of the age range). The total duration of testing was approximately 45 minutes,

depending on the amount of explanation and practice required. Children were tested in an
environment where distractions were minimised as far as possible. All subtests with the
exception of the Visual Search were administered via a Dell laptop computer (screen size
28.7cm x 21.7cm), with a viewing distance of around 30-40cm. Auditory items were played
through speakers attached to the laptop, with the volume set to a level that could be comfortably
heard given the particular environment.
Data treatment
In order to produce standardised measures for clinical assessment, and to create scores suitable
for factor analysis (i.e. free from age effects), raw scores were transformed to age-scaled scores.
These scores were scaled to a mean of 10 and a standard deviation of 3, following the
convention of existing standardised tests (e.g. Wechsler measures, the TEA-Ch). This was done
by preparing a histogram of raw scores for each age group on each subtest, and then normalising
the distribution of these scores by applying an appropriate power transform. The Box Cox
procedure in R (a statistical computing package) was applied to establish the appropriate power
transform for normalisation, and the resulting distributions were assessed for normality using the
Shapiro-Wilk test and inspection of histograms and Q-Q plots. According to these measures,
normality was improved for each subtest. Z scores were computed from these normalised raw
scores, and then transformed to a scale with a mean of 10 and a standard deviation of 3. For
each age group, we then determined the raw scores corresponding to each scaled score (see
tables in Appendix 2). From these tables, each child’s raw scores were used to derive whole
scaled scores for each subtest.

4.2 Results
Age and sex effects
Age and sex effects were analysed using a two-way ANOVA (with age group, three levels, and
sex, two levels) for each subtest, including a linear trend analysis for the age effect. This stage
of the analysis used raw scores, which are summarised in table 2. Scaled scores were not
appropriate for this stage of the analysis, since they effectively remove the influence of age.
There was a significant main effect of age with a significant linear trend for each measure, with
the exception of the Balloon Sorting subtest (Visual Search: F(2, 144)=45.8, p<.001; Visual
Sustained: F(2, 144)=39.1, p<.001; Flanker Task: F(2, 144)=9.22, p<.001; Auditory Sustained:
F(2, 144)=19.5, p<.001; Verbal Opposites: F(2, 144)=20.2, p<.00; Dual Task: F(2, 144)=17.7,
p<.001; Counterpointing: F(2, 144)= 13.1, p<.001; Balloon Sorting: F(2, 144)=2.41, p=.09).
There was no main effect of sex on any of the measures except Dual Task, where girls
performed significantly better than boys (boys’ mean score=9.54, girls’ mean score=10.73; F(l,
141)=5.97, p<.05), and there were no significant age x sex interactions. To consider differences
between boys and girls at different ages, scaled scores were also compared using individual t-
tests for each age band separately. For the youngest group (3-4 years), there were no significant
sex differences on any of the measures. For the middle group (4-5 years), girls performed
significantly better than boys on the Visual Search (boys’ mean score=9.24, girls’ mean
score=11.18; t(49)=-2.34, p<.05) and the Dual Task (boys’ mean score=9.21, girls’ mean
score=l 1.1,8; t(49)=-2.56, p<.05). For the oldest group, girls performed marginally better than
boys on the Verbal Opposites task (boys’ mean score=9.00, girls’ mean score=10.76; t(45)=-
2.05, p=.046).
Pairwise comparisons from the ANOVA were used to assess differences in performance between
individual age groups. Significant differences (Bonferroni corrected) are indicated in figure 12.
89

These comparisons give some idea of developmental trajectories for these abilities across this
age range. Four of the tests show significant improvements in performance between each age
band. These are the Visual, Auditory and Dual sustained attention tasks, consistent with
suggestions that sustained attention has a gradual developmental course throughout childhood,
plus the Visual Search task. Both tasks designed to tap inhibitory control processes (Verbal
Opposites and Counterpointing) showed greatest improvement between the two youngest
groups, whilst the Flanker Task showed greatest improvement between the two oldest age
groups. These results provide an indication of where in this age range the major gains in
performance take place.
Table 2: mean raw scores for each subtest by age group.
AGE BAND
(YEARS)
3-4 4-5 5-6
3 II <0 n = 51 3 IIMean (SD) Mean (SD) Mean (SD)
VISUAL SEARCH (NUMBER CORRECT) 8.22 (2.59) 10.31 (2.72) 13.19(2.30)
VISUAL SUSTAINED (SCORE) 17.24 (5.87) 22.22 (6.01) 27.19(4 .45)
FLANKER TASK (TIME FUNCTION) 1.14 (.08) 1.12 (.07) 1.08 (.06)
AUDITORY SUSTAINED (SCORE) 15.12(4.81) 18.71 (5.04) 21.68 (5.62)
VERBAL OPPOSITES (TIME FUNCTION) 1.43 (.23) 1.28 (.16) 1.20 (.10)
DUAL TASK (SCORE) 7.39 (2.89) 8.96 (2.97) 11.02 (3.12)
COUNTERPOINTING (TIME FUNCTION) 1.19 (.12) 1.13 (.09) 1.09 (.08)
BALLOON SORTING (TRIALS TO CRITERION) 36.94 (12.42) 36.71 (14.71) 31 .83(10.99)
Note: higher scores reflect better performance on Visual Search (maximum possible score 18),
Visual Sustained and Auditory Sustained (maximum score 30), and Dual Task (maximum score
15). A lower score represents better performance on Balloon Sorting (minimum possible score
18). Scores for the three remaining tests represent conflict time / non-conflict time, and lower
values are better.
90

VISUAL SEARCH FLANKER TASK VISUAL SUSTAINED AUDITORY SUSTAINED
.
3 year-olds 4 year-olds 5 year-olds
Age group
DUAL TASK
3 year-olds 4 year-olds 5 year-olds
Age Group
.18
.16
.14
12
.10
.08
.06
.04
.02
.003 year-olds 4 year-olds 5 year-olds
Age group
VERBAL OPPOSITES
3 year-olds 4 year-olds 5 year-olds
Age group
COUNTERPOINTING
1.5
1.4
1.3
1.2
1.1
1.03 year-olds 4 year-olds 5 year-olds
20
l l l l3 year-olds 4 year-olds 5 year-olds
Age group
BALLOON SORTING
1.25
2 1.20 §^ 1.15 o5=| 1-10(0E 1.05 F
1.003 year-olds 4 year-olds 5 year-olds
60
V)ro'!= 40ro
3 year-olds 4 year-olds 5 year-olds
Age group Age group Age band
Figure 12: Mean raw scores on each subtest by age group (error bars show standard errors). Asterisks indicate significant pairwise comparisons between
groups (Bonferroni corrected p <.05 in all cases).
91

The new battery was designed to be suitable across the age range of 3-6 years. The aim of
avoiding floor effects in the youngest group was achieved across the subtests. No child achieved
a zero score on any of the item-based measures (Visual Search, Visual Sustained, Auditory
Sustained and Dual Task). The time-based measures are somewhat harder to assess for floor
effects, but they were completed by all children in the youngest group, with no scores higher
than 2 (i.e. no child took more than twice the time to complete conflict blocks compared with
non-conflict blocks). Ceiling levels of performance in the oldest group were also largely
avoided, although they were apparent to a certain degree on the Visual Sustained attention task.
Of the 5-6 year-olds, 45% scored at ceiling on this task. Ceiling levels of performance were
observed far less frequently on the other item-based measures (11% for Dual Task, 4% for
Visual Search, and 0% for Auditory Sustained). Again, ceiling performance is harder to judge
on the time-based measures, however, very few children in the oldest age group showed no time
difference for conflict versus control blocks (9% of children on the Counterpointing task, 6% on
the Flanker task, and 0% on Verbal Opposites).
Analysing the structure of attention
Rationale
The main aim of this analysis was to examine whether the hypothesised attention model
provided a good explanation of the data obtained from the normalisation sample. An additional
question was whether there might be any changes in the structure of attention (i.e. how well this
model fits the data) at different stages of development. Data from the current study, and from
previous studies, suggests considerable development of attentional abilities over this preschool
age range, and it is plausible that differentiation of attention components also varies during this
period. In addition to the overall analysis, factor analyses were therefore conducted for the
younger (3-414 years) and older (4‘/2-5 years) children separately.
92

Both exploratory and confirmatory factor analysis methods have been used in previous studies to
examine the structure of attention. EFA derives a factor structure from the data based on the
correlations between variables, and allows all variables to load on all factors. In contrast, CFA
works by testing the data set against a model specified a priori. Certain relationships are set to
be fixed within the model, whilst others are allow to vary freely, and the fit of data to model can
be assessed by significance testing and various fit indices. Each of these techniques has its
advantages and disadvantages. EFA is flexible and acts to ‘explain’ the data, which is
particularly useful when the author has no precise hypothesis about its structure. However, the
interpretation of factor structure in EFA is somewhat subjective, whereas the factor structure in
CFA is grounded a priori in theory. CFA also has the advantage of allowing the significance of
model fit to be examined, and the relative fit of different models to be compared. In CFA
programs, it is also possible to obtain modification indices to show how the model might be
improved to better fit the data. These factors have all contributed to a growing preference for
confirmatory methods in the literature (Streiner, 2006).
However, there are limitations to CFA in certain situations. While it is, of course, advantageous
to be able to test the significance of model fit, the power of the chi-square tests used to do this
can be affected by various factors, including sample size. In CFA, the chi-square test assesses
the degree of difference between the specified model and the observed data. The aim, therefore,
is a non-significant chi-square statistic, indicating little or no difference between the model and
the data. With very large samples, the chi-square statistic is often significant even with only
minor misspecifications in the model. Conversely, even poorly-fitting models may be accepted
if sample size is small. These limitations have prompted the development and use of various
alternative fit indices, which show model fit on a more continuous scale, as alternative methods
for assessing model fit. There are, however, a number of limitations associated with fit indices
93

also. Very many indices have been developed, and there is no real consensus about which
provide the best test of model fit. Also, the distribution of most indices is not well known,
making it difficult to establish confidence intervals for the precision of fit estimates (Tomarken
& Waller, 2003). Recent studies have also shown less sensitivity in some of the most common
indices than one would like, and some confusion over the criteria for a well-fitting model (Hu &
Bentler, 1998). A review of the extensive debate around the assessment of model fit is beyond
the scope of this thesis (see Tomarken & Waller (2003), Hu & Bentler (1998), and Fan,
Thompson & Wang (1998) for more thorough reviews), but these issues must be taken into
consideration when performing an analysis of this kind.
Various guidelines for minimum sample size exist in the CFA literature. According to Stevens
(1996), a good rule of thumb is at least 15 cases per predictor variable (the current model, with 8
predictors, would therefore require 120 cases). Loehlin (1992) suggests that a model with two to
four factors will require at least 100 cases, but preferably closer to 200 (similar
recommendations come from Hoyle (1995) and Kline (1998)). With data from 147 children, the
normalisation sample met these minimum criteria. However, dividing the sample to perform
separate analyses for the older and younger children created somewhat smaller groups than
would be ideal for this type of analysis. Generally, authors advise against samples smaller than
100 for CFA, but the older and younger groups in the current study comprised samples of 73 and
74 children respectively. The separate CFA results for the two age groups should therefore be
interpreted with some caution, and considered in light of other analyses (e.g. EFA) that will be
performed on the same data.
The analysis of attention structure in the normalisation data therefore used both CFA and EFA.
In this context, where data were obtained using a novel battery with younger subjects than
previously studied, there was judged to be considerable value in including a more exploratory
94

method. Also, EFA was deemed somewhat less vulnerable to the effects of small sample size in
the separate younger and older groups, so had particular value in those analyses. Finally, the
modification indices (Mis) suggested by the CFA program were considered, and new models
incorporating these modifications were examined. Mis provide an estimate of how much the
chi-square value would change if alterations were made to certain parameters in the model,
giving an idea of how model fit might be improved. There is always a danger of over
modification when using Mis, so each model was only altered if the suggested modification
made strong theoretical sense. Analysis of the normalisation data therefore included an overall
EFA and CFA for the whole sample, plus individual exploratory and confirmatory analyses for
the older and younger groups separately, and consideration of the Mis suggested by CFA.
Data
Age-scaled scores were used for this part of the analysis, since they reflect performance relative
to each child’s own age group, and thus effectively remove the influence of age. To recap, these
scaled scores have a mean of 10 and a standard deviation of 3, with larger scores representing
better performance for all subtests. Raw scores were not appropriate for this stage of the
analysis, as they invariably yield a one-factor solution, representing the effect of age-related
development. The correlation matrix for age-scaled scores on the eight subtests of the new
preschool attention battery is shown in table 3.
95
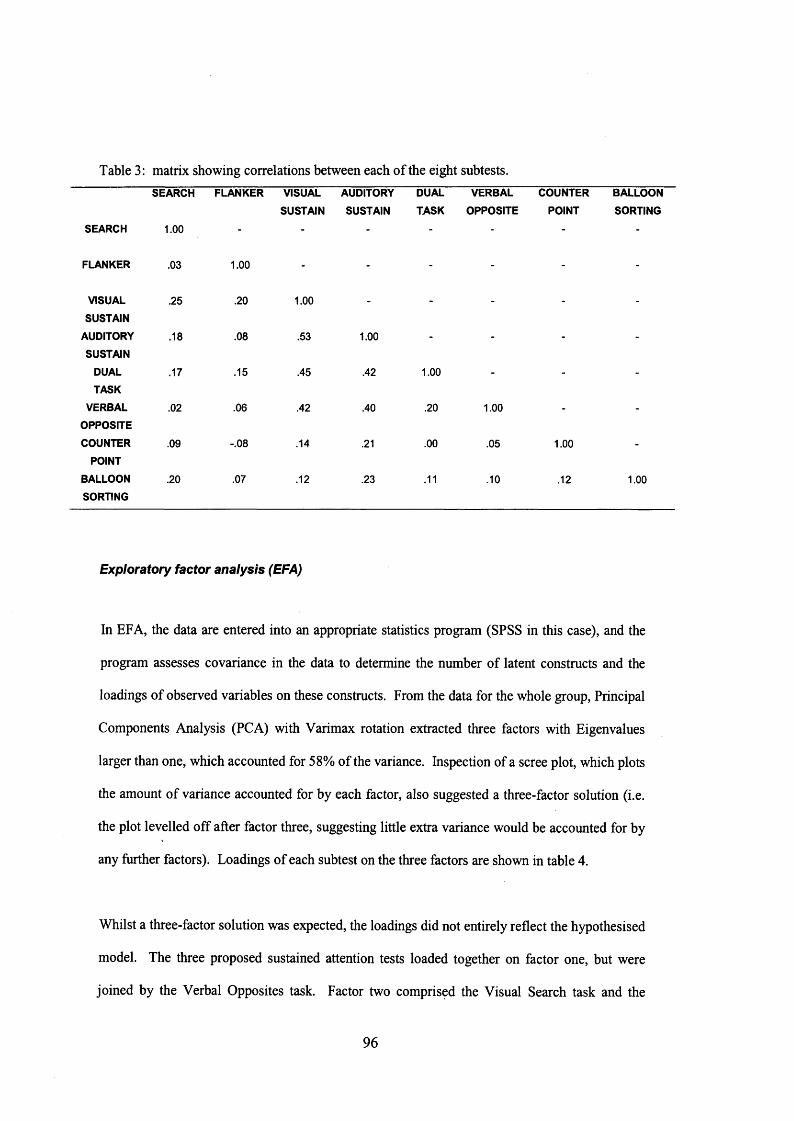
Table 3: matrix showing correlations between each of the eight subtests.SEARCH FLANKER VISUAL
SUSTAINAUDITORYSUSTAIN
DUALTASK
VERBALOPPOSITE
COUNTERPOINT
BALLOONSORTING
SEARCH 1.00 - - - - - - -
FLANKER .03 1.00 - - - - - -
VISUAL .25 .20 1.00 - - - - .
SUSTAINAUDITORY .18 .08 .53 1.00 - - - -SUSTAIN
DUAL .17 .15 .45 .42 1.00 - - -TASK
VERBAL .02 .06 .42 .40 .20 1.00 - -OPPOSITECOUNTER .09 -.08 .14 .21 .00 .05 1.00 -
POINTBALLOON .20 .07 .12 .23 .11 .10 .12 1.00SORTING
Exploratory factor analysis (EFA)
In EFA, the data are entered into an appropriate statistics program (SPSS in this case), and the
program assesses covariance in the data to determine the number of latent constructs and the
loadings of observed variables on these constructs. From the data for the whole group, Principal
Components Analysis (PCA) with Varimax rotation extracted three factors with Eigenvalues
larger than one, which accounted for 58% of the variance. Inspection of a scree plot, which plots
the amount of variance accounted for by each factor, also suggested a three-factor solution (i.e.
the plot levelled off after factor three, suggesting little extra variance would be accounted for by
any further factors). Loadings of each subtest on the three factors are shown in table 4.
Whilst a three-factor solution was expected, the loadings did not entirely reflect the hypothesised
model. The three proposed sustained attention tests loaded together on factor one, but were
joined by the Verbal Opposites task. Factor two comprised the Visual Search task and the
96

Balloon Sorting task, and factor three comprised the Flanker task and the Counterpointing task.
Whilst these loadings deviate somewhat from the predicted model, sensible links between the
subtests are conceivable. If factor one is taken as a sustained attention component, we would
have to conclude that sustained attention is more important in the Verbal Opposites task than
inhibition (or that sustained attention is a necessary precursor for complex inhibitory processes).
Factor 2 might still reasonably be taken as some construct of selective attention, since the ability
to select out the correct dimension is likely to contribute to Balloon Sorting performance.
Table 4: Factor loadings for each subtests on the three factors extracted by PCA. Factor
loadings above .4 are considered to represent at least moderate loadings (Hair, Anderson,
Tatham & Black, 1998), and these are shown in bold type. In fact, all loadings that met this
criteria were above .6, so represented strong loadings.
FACTOR
1
FACTOR
2
FACTOR
3
VISUAL SEARCH .08 .76 .07
FLANKER .17 .17 .72
VISUAL SUSTAINED .80 .19 .11
AUDITORY SUSTAINED .78 .22 -.13
DUAL TASK .61 .20 .29
VERBAL OPPOSITES .74 -.19 -.11
COUNTERPOINTING .18 .29 -.69
BALLOON SORTING .10 .69 -.09
Factor 3 could be interpreted in a number of ways. It could reflect a construct relating to
inhibition, since both tasks (Flanker and Counterpointing) require the child to stop themselves
responding in one way, in favour of a more considered response. Alternatively, the association
between these measures might reflect something more basic, like the requirement for a motor
response. However, the Counterpointing task actually has a negative loading on this factor,
suggesting that better performance on the Flanker task is associated with poorer performance on
97

the Counterpointing task. This factor might therefore reflect speed of response. If for example,
a child has overall fast processes of ‘selection for action’, they may be good at the Flanker task
(if, as expected, the selective element is key here) but poor at the Counterpointing task (where
executive control needs to intervene in the selection-for-action process and reverse the prepotent
response). Again, though, this interpretation is speculative.
As mentioned, the children were also divided into two groups by age (3-414 years and 414-6
years), and data were analysed by EFA for the younger and older children separately. PCA of
the data for the younger group yielded a two-factor solution, accounting for 48% of the variance,
shown in table 5.
Table 5: Factor loadings for the two-factor solution derived from data from the younger children
(3-4!4 years) only.FACTOR
1
FACTOR2
SEARCH .09 .60
FLANKER .35 -.63
VISUAL SUSTAINED .83 .24
AUDITORY SUSTAINED .68 .38
DUAL TASK .77 -.03
VERBAL OPPOSITES .62 -.05
COUNTERPOINTING .10 .60
BALLOON SORTING .25 .43
In the younger group, factor one reflects the same subtests as the whole-group PCA, whilst all
the other subtests load together on a single factor. This result suggests less differentiation of
attention functions in this group than in the sample as a whole. Factor one still reflects processes
of sustained attention, whilst factor two appears to reflect various aspects of attentional control
and selection. In addition to the strong loadings shown in table X, two subtests had small-
98

moderate loadings on the other factor. The Auditory Sustained subtest had a loading of .38 on
factor two, and the Flanker subtest had a loading of .35 on factor one, suggesting that these tasks
are influenced by more than one component ability.
PCA of the data for the older group yielded a three-factor solution much more similar to the
hypothesised model, accounting for 60% of the variance. The solution for the older group is
shown in table 6. Again, factor one represents a sustained attention component, with strong
loadings from the three sustained tasks and the Verbal Opposites task. Factor two appears to
reflect a selective attention component, with loadings from the two hypothesised selective tasks
(Flanker and Visual Search) plus the Balloon Sorting task, whose selective demands have been
discussed above. Finally, factor three seems to reflect an attentional control component, with
loadings from two of the hypothesised control tasks (Counterpointing task and Balloon Sorting),
plus the Dual Task, where dividing attention may well require control processes.
Table 6: Factor loadings for the three-factor solution derived from data from the older children
(AVi-6 years). Moderate-to-strong factor loadings (above .4) are shown in bold type.
FACTOR FACTOR FACTOR
1 2 3
SEARCH .10 .71 -.09
FLANKER .15 .58 -.01
VISUAL SUSTAINED .78 .19 -.13
AUDITORY SUSTAINED .77 .33 .12
DUAL TASK .47 .39
CM
VERBAL OPPOSITES .79 -.14 .23
COUNTERPOINTING .14 .03 .81
BALLOON SORTING -.03 .64 .46
99
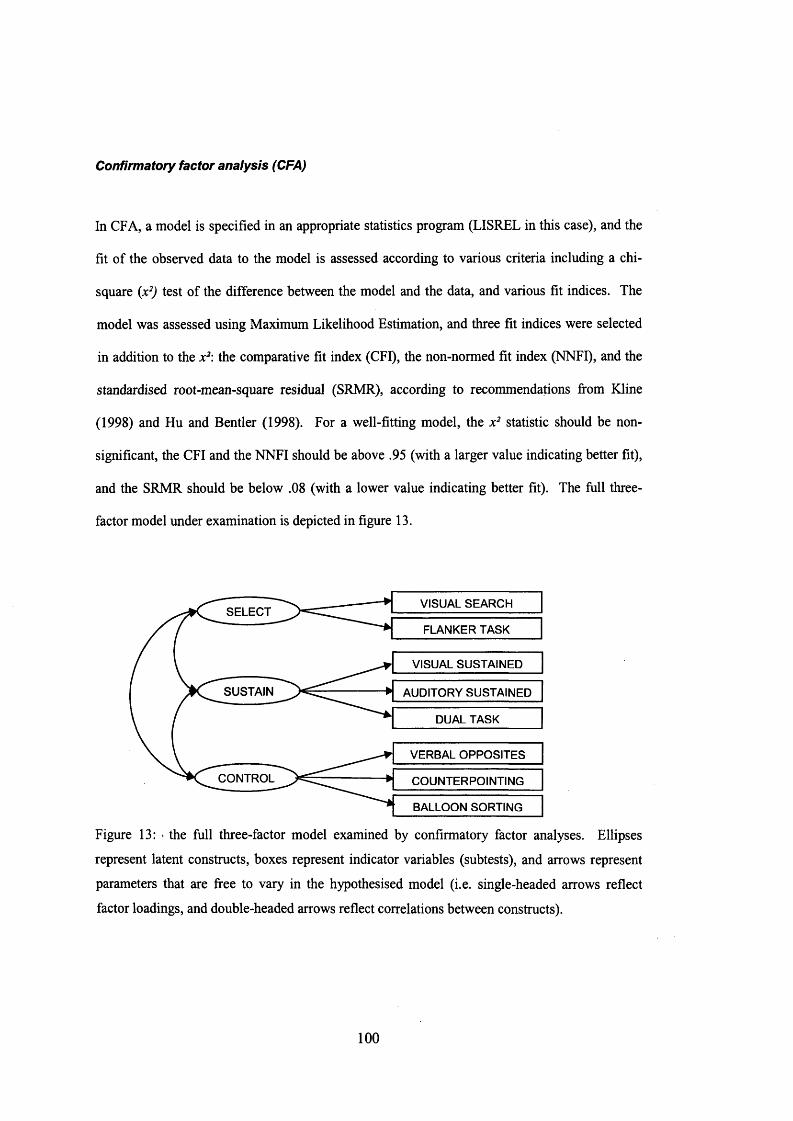
Confirmatory factor analysis (CFA)
In CFA, a model is specified in an appropriate statistics program (LISREL in this case), and the
fit of the observed data to the model is assessed according to various criteria including a chi-
square (x2) test of the difference between the model and the data, and various fit indices. The
model was assessed using Maximum Likelihood Estimation, and three fit indices were selected
in addition to the x2: the comparative fit index (CFI), the non-normed fit index (NNFI), and the
standardised root-mean-square residual (SRMR), according to recommendations from Kline
(1998) and Hu and Bentler (1998). For a well-fitting model, the x2 statistic should be non
significant, the CFI and the NNFI should be above .95 (with a larger value indicating better fit),
and the SRMR should be below .08 (with a lower value indicating better fit). The full three-
factor model under examination is depicted in figure 13.
VISUAL SEARCHSELECT
FLANKER TASK
VISUAL SUSTAINED
> AUDITORY SUSTAINEDSUSTAIN
DUAL TASK
VERBAL OPPOSITES
CONTROL COUNTERPOINTING
BALLOON SORTING
Figure 13: • the full three-factor model examined by confirmatory factor analyses. Ellipses
represent latent constructs, boxes represent indicator variables (subtests), and arrows represent
parameters that are free to vary in the hypothesised model (i.e. single-headed arrows reflect
factor loadings, and double-headed arrows reflect correlations between constructs).
100

All data
Using data from the whole group, CFA supported the data as a close fit to the model, as
indicated by a non-significant x2 statistic (x2 (17) = 21.83, p=0.19) and good fit index scores
(CFI=0.97, NNFI=0.95, SRMR=0.05). However, results from the analysis of a single-factor
model also demonstrated good fit to the data {x2 (20) = 23.68, p=0.28; CFI=0.98, NNFI=0.97,
SRMR=0.05). Since the models are nested (i.e. the one-factor model is a restricted version of
the three-factor model), the x2 difference between these models can be calculated to determine
whether the three-factor model produces a significantly better fit than the one-factor model (e.g.
Bender, 1990). The x2 difference in this case is 1.85, which, on three degrees of freedom, is not
significant. The fit indices would also suggest that the one-factor model provides just as good an
explanation of the data as the three-factor model, and should thus be preferred on the grounds of
parsimony. From the path diagram shown in figure 14, it also seems that a model with three
distinct factors may not be the best explanation of the data, since there are very large correlations
between the latent variables. When LISREL estimates latent variable correlations greater than
one, it suggests that too many factors are being extracted. A model with three independent
factors was also tested, but this failed to converge on a solution, indicating extremely poor fit.
101

VISUAL SEARCH.22SELECT
.16FLANKER TASK
1.33 VISUAL SUSTAINED.78
.71 H.
.55 _
SUSTAIN AUDITORY SUSTAINED.75
DUAL TASK1.07
VERBAL OPPOSITES.49
CONTROL •18 COUNTERPOINTING
.19BALLOON SORTING
Figure 14: the estimated three-factor model for data from the whole sample (3-6 years). Single
headed arrows show standardised factor loadings; curved double-headed arrows show
correlation coefficients between latent variables.
Modification indices from these analyses were also examined to establish whether there might
be ways in which the original model could be significantly improved. From the first analysis, of
the three-factor model, the largest modification index was for the path to the Balloon Sorting
subtest from the sustain factor (MI=5.08). Modification indices were only to be explored if the
suggested relationships could be justified theoretically. This relationship was potentially
theoretically plausible, given that this task is relatively long, so the modification was
investigated. With this path added to the original three-factor model, there was once again a
non-significant x2 statistic (x2 (16) = 17.35, p=0.36) and good fit index values (CFI=0.99,
NNFI=0.99> SRMR=0.04). The x2 difference between this modified model and the original
three-factor model was 4.48, which was significant on one degree of freedom (the critical value
at p<.05 is 3.84). Therefore, the modified structure appears to offer a significant improvement
on the original model. The x2 difference between the modified version and the one-factor model
is 6.33, which, judged according to the critical value for four degrees of freedom, is still not
102

significant. However, consideration should also be given to the fit indices, which are
consistently better for the modified model than for the one-factor model. Whilst the one-factor
model should be preferred over the original three-factor structure, the evidence suggests that the
modified three-factor version may be better than the unitary explanation.
Young data
Using data from only the younger half of the sample (3-4^2 years), the CFA for the hypothesised
three-factor model failed to converge, indicating a highly inadequate fit (see discussion for
details on nonconvergence). The one-factor model, on the other hand, was a good fit to the data,
as indicated by a non-significant x2 statistic (x2 (20) = 20.62, p=0.42) and good fit index values
(CFI=0.99, NNFI=0.99, SRMR=0.074). To see what aspect of the model might be preventing
convergence for the three-factor structure, paths linking latent variables in the model were
individually fixed. Essentially, three different two-factor models were examined by keeping one
of the paths between latent variables fixed to 1.00 in each case and allowing the other two to
vary freely. In both cases, the analysis failed to converge when the path between control and
each of the other components was fixed. Only fixing the path from select to sustain created a
model that converged on a solution. This model also showed good fit to the data, with a non
significant x2 statistic {x2 (18) = 19.07, p=0.39) and good fit index values (CFI=0.99,
NNFI=0.99, SRMR=0.076). However, this model does not represent a better fit than the one-
factor model (scores on all fit indices are similar, and, where different, are better for the unitary
model), suggesting that the latter should be preferred in this group.
103

1.00 SUSTAN
CONTROL
VISUAL SEARCH
FLANKER TASK
VISUAL SUSTAINED
AUDITORY SUSTAINED
DUAL TASK
VERBAL OPPOSITES
COUNTERPOINTING
BALLOON SORTING
Figure 15: the estimated one-factor model for the younger group. Note that in this model,
covariances between latent variables were set to 1.00 to create, in essence, a single latent
variable. Single-headed arrows show standardised factor loadings of observed variables on the
single latent variable.
Old data
Using data from only the older half of the sample (414 to 6 years), CFA again supported the
hypothesised three-factor model, as indicated by a non-significant x2 statistic (x2 (17) = 16.94,
p=0.46) and good fit index values (CFI=0.99, NNFI=0.99, SRMR=0.067). Again, though, the
one-factor model also proved a good fit to the data (x2 (20) = 19.15, p=0.51; CFI=1.00,
NNFI=1.01, SRMR=0.069). The fit indices were very similar, and the x2 difference between the
models (2.21) was not significant on three degrees of freedom. This would suggest that whilst
the hypothesised model represents a good fit to the data, this difference in fit does not warrant
preference over a more parsimonious unitary model. Again, the three-factor model shown in
figure 16 features a correlation of 1.00 between two of the factors {sustain and control),
indicating that the model had extracted more factors than were necessary to explain the data.
104

VISUAL SEARCH.46SELECT
.45FLANKER TASK
0.69 VISUAL SUSTAINED.64
SUSTAIN .84 - + AUDITORY SUSTAINED.50.47
DUAL TASK1.00
VERBAL OPPOSITES.54
CONTROL •14 COUNTERPOINTING
.22BALLOON SORTING
Figure 16: the estimated three-factor model for the older group. Single-headed arrows show
standardised factor loadings; curved double-headed arrows show correlation coefficients
between latent variables.
However, modification indices from the three-factor CFA suggested that changes in model fit
would be achieved by adding paths to the Balloon Sorting subtest from the select function and to
the Dual Task from the control function. Both changes were deemed theoretically plausible: the
Balloon Sorting test is likely to involve some process of selecting out the relevant dimension
(this possibility has already been discussed in relation to the exploratory analysis above), and the
Dual Task requires one to divide attention between simultaneous inputs, a function potentially
involving attentional control processes (also mentioned above in the EFA). With these paths
added to the original three-factor model, there was once again a non-significant x2 statistic (x2
(15) = 10.44, p=0.79) and good fit index values (CFM.00, NNFI=1.10, SRMR=0.052). The x2
difference between this modified model and the original three-factor model was 6.50, which was
significant on two degrees of freedom (the critical value at p<.05 is 5.99). Once again, however,
the x2 difference between this modified model and the one-factor model (8.71) did not reach
significance, although the fit indices were consistently better for the modified model. Again,
105

whilst there is evidence to support the one-factor model over the original full model, the
modified version of the three-factor structure appears to provide a better-fitting alternative.
4.3 Discussion
In an examination of age and sex effects, all of the subtests except Balloon Sorting were
sensitive to improvements in performance with age, providing useful indicators of development
over this age range. The absence of significant development in performance on the Balloon
Sorting task could have a number of explanations. There may be little development of the
abilities underlying performance on this task over the age range tested, with major improvements
occurring before 3 years of age or, more likely, after 6 years of age. Indeed, there was a trend
for somewhat improved performance in the 5 year-olds, which did not reach significance.
Performance on similar tasks (e.g. the WCST and the ID-ED shift task from the CANTAB)
certainly shows significant development between ages 4 and 10 years (Luciana & Nelson, 1998;
Welsh et al, 1991; Levin et al, 1991).
However, it is possible that there are changes in these abilities over this age range, but the task is
not sensitive enough to reveal them, or that the task is not tapping the intended processes.
Children might fail to understand what is required of them in this task, so that their responses
reflect random choices. Alternatively, they might solve the task using some unanticipated
strategy. For example, a child might base their choices on memory for specific items (e.g. the
red circle and the red star) rather than an understanding of ‘red’ as a dimension for sorting.
Children were asked to explain ‘what kind of balloons teddy likes’ after each successful sort, in
an attempt to establish whether they had understood the sorting criteria. However, the younger
children seemed to have difficulty verbally expressing a criterion, even when it was clear that
they were using it efficiently. In any case, the examiner always explained the sorting criterion
106

even if the child was unable to do so. It seems unlikely that these explanations account for the
performance of successful sorters, though it might still explain the performance of those children
who failed even the first stage.
However, the performance of children who failed at the first stage might still reflect poor
attentional flexibility if, for example, they had focused attention on a particular dimension or
feature and perseverated on this despite negative feedback. A different scoring system for this
test might be necessary, in order to gain the most information about how the child is performing
the task, and how successfully they are making the switches. Alternative scores for this test
were considered. These included (i) the number of stages passed and (ii) the number of trials
required over the second and third stages only (to restrict the critical measure to the stages where
a shift was required). Both of these measures produced a similar pattern across the age range
(i.e. similar performance for the two youngest age groups with something of an improvement in
the oldest age group). However, the total trials measure was retained, as it was judged to be the
most informative in terms of the different possible outcomes on this task. For example, ‘trials
for stages 2 and 3’ does not take into account performance on the first stage, and does not
therefore discriminate between children who failed to sort correctly at all, and those who were
able to pass the initial sort, but failed the intradimensional shift (in both cases the child would
get the maximum score of 40). The ‘number of stages passed’ takes into account performance at
all three stages, but provides no information about the number of trials required to reach
criterion, and therefore does not discriminate between children who solve a stage more or less
efficiently. In future studies using this task, it may be better to administer all three stages, even
if the child failed one of the first two stages. This would potentially allow a more sensitive
analysis the various stages of this task. However, the extent to which the second and third stages
reflect attentional shifts may be unclear if the correct criterion had not been used during the
previous stage.*
107

The fact that this test showed little development over the age range does not necessarily mean
that it is failing as a measure of attention. The Balloon Sorting task consistently loaded with
other attention measures in the factor analyses, which would suggest that performance on the
sorting task does rely on processes associated with the attention system, and can still be
employed as a useful measure in these studies. On the whole, then, the battery achieved the
requirement for sensitivity to development over the age range in the larger normalisation sample.
Further, there were no failures or refusals on any of the tests, and the entire battery was
successfully administered in every case. With the exception of the Balloon Sorting test, where
the possibility of a mnemonic strategy has been discussed, there were no obvious or observable
confounding influences on test performance. Data from this larger sample, using the complete
battery, largely support the new tests as sound measures of attention for this age range.
Age and sex effects in typical development
In the normalisation study, there was some evidence for differences in developmental
trajectories across the tasks. The sustained attention subtests all showed the same pattern, with
significant improvements in performance between each age band. This is consistent with reports
of a relatively protracted developmental course for sustained attention functions in older
childhood (e.g. McKay et al, 1994; Rueda et al, 2004). The two inhibitory attentional control
tasks (Verbal Opposites and Counterpointing) also showed a common developmental trajectory,
with greatest improvement between the first two age bands. This is consistent with previous
studies showing rapid advances in these skills at around 3-4 years (see, for example, Zelazo,
Carter, Reznick, & Frye, 1997)* Some studies have indicated later development for complex
executive functions, such as planning and set-shifting, which might explain the absence of a
significant developmental trend for the Balloon Sorting task over this age range.
108

The two selective attention tests showed slightly different patterns of development: the Visual
Search task showed significant improvements in performance between each age band, whilst the
Flanker Task showed most development between the two oldest bands. In existing literature,
some studies have shown protracted development into adolescence for selective attention, whilst
others have found larger changes at the earlier end of the age ranges tested. These results would
be consistent with later rather than earlier development of selective attention abilities, however it
is difficult to draw firm conclusions from this analysis, since the tasks employ different
measurement scales, and may show different levels of overall difficulty. Direct comparison with
existing studies is also difficult, since a much younger age range was tested here. However, the
data do suggest differences in the age at which major gains in performance are seen on these
tasks. In addition, developmental patterns showed good consistency within each attention
component relative to the consistency between components, supporting the notion that these
tests are tapping distinct functions.
This analysis found very few sex differences on these tasks. For the whole sample, only one
subtest showed sex differences; and there were none for the youngest age band, two for the
middle age band, and just one marginal difference for the oldest age band. Girls outperformed
boys in all cases, but on the whole males and females performed similarly. This reflects the
results of the TEA-Ch normalisation (Manly et al, 2001), where the vast majority of tests
showed no sex differences (the exceptions were Creature Counting, where boys outperformed
girls overall, and Sky Search, where girls outperformed boys in the 9-11 and 13-15 year age
bands).
The structure of attention in typical development
EFA of data from the whole sample produced a solution with three factors, broadly interpreted
as sustained attention, selective attention and executive control / speed o f responding. Although
109

three factors were extracted, the individual tests did not load on the three factors in quite the
hypothesised way. The sustained attention tests all loaded together, but were joined by the
Verbal Opposites task. The Visual Search and Balloon Sorting tasks loaded together on factor
two, and the Flanker and Counterpointing tasks loaded together on factor three. The associations
between tasks and the interpretation of factors were theoretically plausible, but somewhat
subjective in places. This analysis did, however, support a multi-component model rather than a
unitary explanation of attention.
Developmental differences in the structure of attention over this age range were predicted, and
separate EFAs for the younger and older children supported this possibility. The younger half of
the sample (3-4V4 years) showed a two-factor structure, where the sustained attention tasks and
Verbal Opposites loaded on factor one, and all other variables loaded together on factor two.
This result suggests less differentiation of attention functions in the younger group than in the
sample as a whole. The older half of the sample (4‘/2-6 years) showed a three-factor structure
much closer to the hypothesised model of attention. The sustained attention factor comprised
the same subtests as the whole-group analysis (Visual Sustained, Auditory Sustained, Dual Task
and Verbal Opposites); the selective attention factor comprised the two hypothesised selective
tasks (Visual Search and Flanker task) plus a loading from the Balloon Sorting task; and the
attentional control factor comprised two of the hypothesised control tasks (Counterpointing and
Balloon Sorting) plus a loading from the Dual Task.
One anomaly in relation to the original model is the loading of Verbal Opposites on the
sustained attention factor. However, the importance of sustained attention has previously been
highlighted in relation to tests that otherwise appear inhibitory (e.g. the Sustained Attention to
Response Task (SART), Robertson et al, 1997; Manly et al, 1999). Indeed, the TEA-Ch
includes a measure with a strong inhibitory component (Walk Don’t Walk) under its sustained
110

attention component. Two subtests have double loadings, but these are theoretically plausible.
The Balloon Sorting subtest loads on both the selective and control factors, but one can easily
see how this task might demand both attentional selection (of the relevant dimension) and
control (switching from one dimension to another). The Dual task loads on both sustained
attention, as predicted, and attentional control, which is also plausible in terms of the
requirement for divided attention, which may tap executive capacities.
CFA on data from the whole sample supported the hypothesised model, with a non-significant x2
statistic and good scores on the selected fit indices. However, a one-factor model, suggesting a
unitary attention structure, was also a good fit to the data. The three-factor model did not
produce a significantly better fit, suggesting that the one-factor model should be preferred.
However, modifying the original model by adding a path to the Balloon Sorting subtest from the
sustain factor led to a significant improvement in fit over the unmodified version. Although the
chi-square difference between the modified three-factor model and the one-factor model was not
quite significant, the fit index values did suggest a better fit for the former.
For the younger group, the one-factor model fit well in CFA, but the hypothesised three-factor
model simply failed to converge. Each possible two-factor model was examined to establish
where the three-factor model might be failing. Only a model with a fixed path from select to
sustain converged on a solution, which again suggested a good fit to the data, though not better
than the fit observed for the one-factor model. It seems that for the younger group, a one-factor
model provides an adequate explanation of the data. We should consider, however, what the
nonconvergence of the original model might signify.
There are a number of reasons why a CFA model might fail to converge. Boomsma and
Hoogland (2001) have suggested that nonconvergence is more likely when sample size is small,
111

when factor loadings are small, or when the ratio of indicators to factors is low. According to
recommendations by Marsh and colleagues (Marsh et al, 1998; Marsh & Hau, 1999) models
with three or four indicators per factor require a sample size of at least 100 (although 200 is
better), whilst models with just two indicators per factor require a sample size of at least 400 to
best avoid nonconvergence1. In the current study, there were two factors with three indicators,
and one factor with just two indicators. A combination of low indicator to factor ratio and small
sample size in this analysis of the younger group might explain the nonconvergence. However,
these factors also applied for analysis of data from the older group, where all models converged
on a solution, indicating that the problem for the younger children may be with the model itself.
Inspection of the available output from LISREL for the nonconverged main model, showed a
negative error variance for the Visual Search subtest. Again, there are a number of reasons why
such negative error variances (or Heywood cases) might occur, including small sample size, the
presence of outliers in the data, too few indicators per factor, and bad starting values. These
cases also commonly reflect major misspecifications in the model (Chou & Bentler, 1995;
Hendriks, 1999), and one option is simply to treat them as such and seek alternative models that
better explain the data. Other options include removing any outliers, none of which could be
identified in the current study, or removing the offending indicator. This was not a viable option
here, since the Visual Search subtest represented one of only two indicators for selective
attention. Again, small sample size and low indicator to factor ratio might be responsible, and
future research will need to ensure sufficient numbers in the sample to account for the relatively
low ratio, in order to minimise this problem. However, the possibility of misspecifications in the
1 Note that this differs somewhat from frequent advice in the literature. Often guidelines recommend multiplying the number of parameters to be estimated by a certain value to obtain a minimum sample size (e.g. N should be at least five times the number of parameters estimated; Bentler, 1995). According to these guidelines, models with fewer indicators (and thus fewer parameters) need smaller samples, which somewhat contradicts what Marsh and colleagues suggest.
112

model also seems likely, especially given that the one-factor model converged on a well-fitting
solution, and the EFA suggested against a three-factor model in the younger sample. Indeed,
Boomsma & Hoogland (2001) recommend regarding nonconvergence as a ‘first symptom of
model-data discrepancy’.
With the caveat that further research is needed to investigate this result with converging models,
it seems that the three-factor model is unsuitable for these younger children, and that a unitary
explanation is better. One possible explanation is that attention processes at this stage of
development operate as a single system, and are not differentiated until later in childhood. An
alternative possibility is that attention always comprises separable components, but that some
other cognitive function acts as the limiting factor on these tasks, influencing performance across
different attention components. Future studies will need to explore possible non-attentional
factors (e.g. general intelligence, memory, basic processing speed) that might have this effect.
For the older group, the results were similar to the overall analysis. The three-factor model
proved a good fit to the data, but not a significantly better fit than the one-factor model.
However, subsequent modification of the original model (with added paths from select to
Balloon Sorting and from control to Dual Task) produced a model with substantially better fit.
Note that these modifications are consistent with the cross-loadings observed in the EFA for the
older group. The chi-square difference between the modified model and the original model was
significant, indicating an improvement in fit. The chi-square difference from the one-factor
model again failed to reach significance, but the fit indices were consistently better for the
modified model. Given that the chi-square test should be interpreted with some caution in this
small sample, these results indicate that the modified version of the original model should be
preferred here.
113

In summary, there was evidence for increasing differentiation of attention components across
this age range. Whilst data from the younger children support a unitary explanation, the pattern
of attention in the older children closely corresponds with the hypothesised model. This
conclusion is drawn with the caveat that, according to CFA, a one-factor model continued to
provide a good explanation of the data even in the older group. It is of course possible that the
true structure of attention is unitary, at least in this age range, and that we are mistaken in
concluding otherwise. However, this seems unlikely given that there was support for the
hypothesised model from both EFA and CFA. Alternatively, it is possible that attention
functions are differentiated as predicted, but there is sufficient interdependence between
separable attention components to support a one-factor model if this is specified by the
investigator. This result could also reflect processes other than attention that influence
performance over this age range. For example, performance on all of these tasks might be
constrained by some cognitive skill, as mentioned above, which becomes less of a limiting factor
over the course of development but still exerts some influence at the older end of the age range.
A logical next step in this research would be to further investigate the observed transition from a
unitary to a non-unitary explanation of attention over this age range. This research will need to
consider factors outside of attention that might account for the unitary explanation. Techniques
such as structural equation modelling and path analysis, which examine the causal relationships
between latent variables, might help to resolve these questions. Additional studies would also
benefit from using larger samples, as discussed, in an effort to reduce problems of
nonconvergence in the statistical analysis. Through the use of novel measures, however, this
study has investigated existing models of attention earlier in development than has been done
previously, and provided interesting new insights into the emergence of a mature attention
system.
114

Chapter 5
Validity and reliability of the preschool attention battery
115

5. VALIDITY OF THE PRESCHOOL ATTENTION BATTERY
We have already seen that the new preschool attention battery is practical for use with children
aged between 3 and 6 years, according to a number of key criteria set out in chapter 3. We have
also seen that patterns of performance across subtests of the battery show support for a
hypothesised model of attention structure, although there is evidence for developmental changes
in the organisation of attention over this age range. If the new battery is to be taken as a valid
instrument for attention assessment in this age range, it is necessary to ensure that scores on the
battery reflect what we think of as attention in an everyday context. It is also important to
establish, as far as possible, that these measures reflect the measures used later in development,
especially since we are interested in how well a particular model of attention holds across
development.
This chapter addresses these issues by exploring the validity of the new battery in terms of (i)
how scores on the battery relate to parent and teacher reports of attention on an recognised rating
scale, and (ii) how scores on the new battery relate to later performance on the TEA-Ch, an
established test battery for assessing attention in school-age children. This chapter also
examines the feasibility of using some of the new tests with younger children (214-3 years),
which might contribute to future studies looking at the issues explored in this thesis with even
younger samples. Finally, this chapter also addresses the reliability of the new attention
measures, using split-half reliability estimates from a subset of the existing normalisation
sample.
116

5.1 Relationship o f the new preschool battery with parent / teacher reports o f
everyday attention
It is important to establish whether the new preschool attention battery actually measures
processes associated with attention in everyday life. Performing tasks in an assessment context
is clearly different from performing tasks in one’s everyday environment, but performance tasks
should nonetheless reflect the operation of processes relevant to everyday behaviour. Rating
scales and questionnaires are widely used as indices of various psychological functions,
including attention. These scales have the advantage of ecological validity, with scores based on
observations of a child’s actual behaviour over a long period of time. However, performance
tasks provide a more objective measure that does not depend on the judgement of any one
individual. Arguably, rating scales give a clearer idea of a child’s actual behaviour in an
everyday context, whilst performance tasks quantify what they are capable of. There are clearly
differences between these approaches, but given that they aim to access essentially the same
function, we would expect some correlation between them.
Scores from a subset of the normalisation sample were therefore compared against parent /
teacher ratings of attention. This was done using two approaches: (i) correlation of scores from
the two types of measure, and (ii) comparison of groups of children defined as having ‘average-
good’ or ‘poor’ attention based on the rating scale. Previous research has shown differences in
attention test performance for children classified as having ‘good attention’ or ‘poor attention’
according to teacher reports (Wilding et al, 2001), and this seemed like an interesting basis for
analysis in relation to the role that performance measures might have in diagnosis and
assessment of attention problems.
117

METHOD
Participants
Parent or teacher ratings of attention were obtained for 69 children from the normalisation
sample. The children ranged in age from 3 years to 5 years 11 months (39 three year-olds, 12
four year-olds, and 18 five year-olds), with a mean age of 4 years 2 months. This sample had a
mean BPVS score of 107.4, suggesting that their vocabulary level was slightly higher than
average (about half a standard deviation above the population mean). They had an average
scaled score of 10.03 on the new attention battery (with a range from 6 to 14, and a standard
deviation of 1.65), suggesting that this group was representative of the typical population in
terms of their attention performance. If the child had been tested at the Visual Development
Unit, ratings were obtained from a parent or guardian (most often the mother). If the child had
been tested in school, ratings were obtained from the child’s teacher. In total, 15 reports were
parent-rated and 54 reports were teacher-rated.
Materials
The new preschool attention battery has been described in chapters 3 and 4. Parent or teacher
reports of everyday attention were obtained using a modified version of the NICHQ Vanderbilt
Assessment Scale (Wolraich et al, 1998). This is a diagnostic ADHD scale that allows parents
or teachers to rate a child according to a range of everyday behaviours. In the first section, the
respondent is asked to rate how often the child shows various attentional problems, including
symptoms of inattentiveness (e.g. “Has difficulty sustaining attention to tasks or activities”) or
hyperactivity (e.g. “Fidgets with hands or feet or squirms in seat”), various behavioural or
conduct-related problems (e.g. “Is physically cruel to people”), and symptoms of anxiety or
depression (e.g. “Is fearful, anxious or worried'). The second section contains more general
questions about school performance, relationships with parents, siblings and peers, and
118

organisational skills. There are two versions of the Vanderbilt scale - one for parents and one
for teachers. These scales are comprised of essentially the same items, but differ slightly in the
phrasing of questions.
We selected certain questions from the Vanderbilt scale to derive a questionnaire focused on
attentional abilities (see Appendix 3). The second section of the Vanderbilt was included
without revision, but the first section was reduced to contain just 13 questions taken from the
‘inattentiveness’ and ‘hyperactivity’ portions of the original Vanderbilt. The questions on the
Vanderbilt relating to conduct problems and anxiety / depression are often quite extreme, and
whilst these might be useful in a diagnostic context, they were less useful here where the aim
was to obtain a measure of everyday attention in a typically-developing sample. Each of the
items in section one is rated according to the frequency with which particular behaviours are
shown {Never, Occasionally, Often or Very Often). Each of the performance items in section
two is rated according to the child’s general level (Excellent, Above Average, Average,
Somewhat o f a Problem, or Problematic). In both sections, lower scores are better.
Procedure
Children were tested using the new preschool attention battery as part of the normalisation
sample described in the previous chapter. Each child completed all 8 subtests, and was assigned
scaled scores according to their age band (3-4 years, 4-5 years or 5-6 years). The child’s parent
or teacher was asked to fill out the questionnaire to the best of their ability, rating the child in the
context of what would be appropriate for a child of their age.
119

RESULTS
Five main scores were derived from the questionnaire: an Inattentiveness score (the sum of five
items relating to problems of inattention), a Hyperactivity score (the sum of eight items relating
to problems of hyperactivity), an Overall Attention score (the sum of the Inattentiveness and
Hyperactivity scores), a Performance score (the sum of the general performance items in section
two of the scale), and a Total score (the sum of all items on the scale). In each case, a lower
score represents better attention or performance. These scores were compared against
performance on the new preschool attention battery, using age-scaled scores for each of the eight
subtests and a total score (derived from the mean of the eight subtests). Means and standard
deviations for these measures are shown in table 7.
First, rating scale scores and attention test scores were correlated to examine associations
between these measures. There was a significant correlation between Total score on the rating
scale and total score on the attention battery (Pearson’s r = -.301, p<.05). This data is plotted in
figure 17. Note that this correlation is negative because a lower score on the rating scale implies
better attention (i.e. fewer symptoms). Taking individual sub-scores from the rating scale, total
attention battery score correlated significantly with Inattentiveness (r = -.261, p<.05),
Hyperactivity (r = -.238, p<.05), and Overall attention (r = -.263, p<.05), but did not correlate
significantly with the Performance sub-score. Correlations between the total rating scale score
and the individual attention subtests did not reach significance, with the exception of the Dual
Task subtest (r = -.288, p<.05). The Total rating scale score was also correlated against BPVS
score; however there was no significant correlation between these measures, suggesting that the
observed relationship between total rating and attention test scores is not due to some association
with general ability.
120

Table 7: means and standard deviations for the sub-scores and total scores from the rating scale
and the new attention battery.
ATTENTION BATTERY MEAN (SD) RATING SCALE MEAN (SD)
VISUAL SEARCH 9.91 (2.95) INATTENTIVENESS 3.32 (2.92)
FLANKER TASK 9.93 (2.94) HYPERACTIVITY 4.19(4.47)
VISUAL SUSTAINED 10.36 (2.94) OVERALL ATTENTION 7.51 (6.93)
AUDITORY SUSTAINED 10.04 (2.87) PERFORMANCE 12.30 (3.96)
DUAL TASK 10.32 (2.56)
VERBAL OPPOSITES 9.97 (3.15)
COUNTERPOINTING 9.92 (2.88)
BALLOON SORTING 9.81 (3.35)
TOTAL TEST SCORE 10.03(1.65) TOTAL RATING SCORE 19.81 (8.81)
Note: Inattentiveness is the sum of five items with a scale of 0-3 (maximum score 15); Hyperactivity is the sum of eight items on this scale (maximum score 24); Overall Attention is the sum of Inattentiveness and Hyperactivity (maximum 39); Performance is the sum of five items with a scale of 1-5 (maximum score 25); and Total Rating is the sum of all items (maximum 64).
16 n
14 -
£ 12 -ooco<o<DI-
10 -
(0 -•—* o I- • •
20 300 10 40 50
Total Rating Score
Figure 17: plot of total rating scale scores against total attention battery scores (Note: lower
scores are better on the rating scale and higher scores are better on the attention battery).
121

Next, the children were divided into two groups based on their total rating scale scores. The
‘poor attention’ group comprised 11 children (6 males, 5 females) with a total rating scale score
of 28 or more2. The ‘good attention’ group comprised 11 children randomly selected from the
those with a total rating scale score of less than 28, matched individually to the ‘poor attention’
children as closely as possible for chronological age and verbal mental age (on the BPVS).
Group characteristics and scores and compared in table 8.
Table 8: group size, mean age, BPVS score, total rating scale score, and total attention battery
score for the ‘good attention’ and ‘poor attention’ groups.
GOOD ATTENTION
(n = 11)
Mean (SD)
POOR ATTENTION
(n = 11)
Mean (SD)
AGE 3.68 (.76) 3.77 (.82)
VERBAL MENTAL AGE (BPVS) 3.96(1.17) 3.78 (1.21)
MEAN RATING SCALE SCORE 19.09 (3.81) 34.36 (7.78)
MEAN ATTENTION BATTERY SCORE 10.40(1.01) 8.67(1.39)
2 In defining the poor attention group, we aimed to select the bottom 15% of this sample, which gave a cut-off score of 28. However, there were two children who both scored 28, so the poor attention group actually comprised the bottom 16% of the sample.
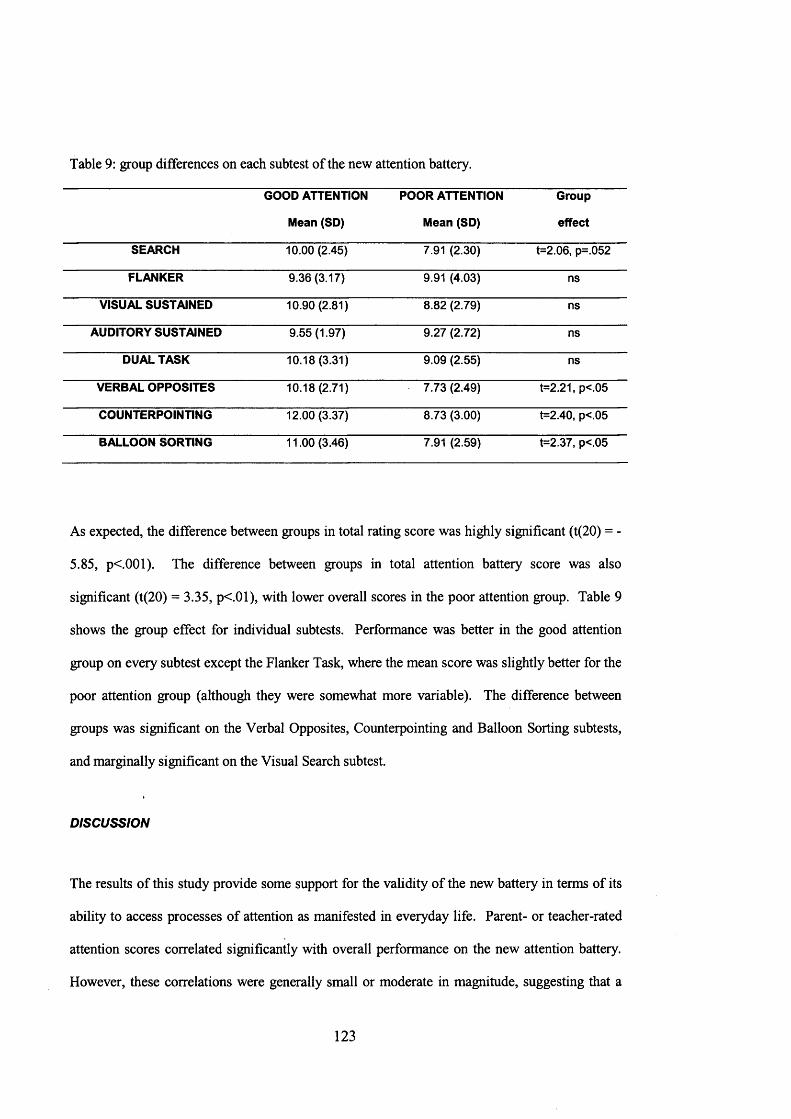
Table 9: group differences on each subtest of the new attention battery.
GOOD ATTENTION
Mean (SD)
POOR ATTENTION
Mean (SD)
Group
effect
SEARCH 10.00 (2.45) 7.91 (2.30) t=2.06, p=.052
FLANKER 9.36 (3.17) 9.91 (4.03) ns
VISUAL SUSTAINED 10.90(2.81) 8.82 (2.79) ns
AUDITORY SUSTAINED 9.55(1.97) 9.27 (2.72) ns
DUAL TASK 10.18(3.31) 9.09 (2.55) ns
VERBAL OPPOSITES 10.18(2.71) 7.73 (2.49) t=2.21, p<.05
COUNTERPOINTING 12.00 (3.37) 8.73 (3.00) t=2.40, p<.05
BALLOON SORTING 11.00 (3.46) 7.91 (2.59) t=2.37, p<.05
As expected, the difference between groups in total rating score was highly significant (t(20) = -
5.85, p<.001). The difference between groups in total attention battery score was also
significant (t(20) = 3.35, p<.01), with lower overall scores in the poor attention group. Table 9
shows the group effect for individual subtests. Performance was better in the good attention
group on every subtest except the Flanker Task, where the mean score was slightly better for the
poor attention group (although they were somewhat more variable). The difference between
groups was significant on the Verbal Opposites, Counterpointing and Balloon Sorting subtests,
and marginally significant on the Visual Search subtest.
DISCUSSION
The results of this study provide some support for the validity of the new battery in terms of its
ability to access processes of attention as manifested in everyday life. Parent- or teacher-rated
attention scores correlated significantly with overall performance on the new attention battery.
However, these correlations were generally small or moderate in magnitude, suggesting that a
123

reasonable proportion of variability in everyday attention was not captured by the battery.
Inconsistencies between performance tasks and rating scales have been observed in previous
studies (e.g. Anderson et al, 2002), and these different approaches would not necessarily be
expected to show complete consistency. Rating scales are designed to assess behavioural
‘symptoms’ of inattention and hyperactivity, along with various other conduct-related
behaviours and symptoms of psychopathology. The items on these scales are often quite
extreme (e.g. 'Does not seem to listen when spoken to directly’ or ‘Talks excessively *), and may
therefore be most useful in identifying children with attention outside of the normal range.
Indeed, this is what they are most commonly used for. In contrast, performance tasks like those
in the current battery access attention processes from a cognitive perspective, across the normal
and atypical range. Given these differences, there is an argument for including both approaches
in the assessment of childhood attention.
Looking at the data in figure 17, there appear to be a group of children who performed relatively
well according to the rating scale but relatively badly on the attention battery (i.e. had low scores
on both measures). These children seemed to have difficulty on the attention tests, but showed
normal attention at home or in the classroom. Of course, there will be differences in how
attention problems are manifested in these contexts. Children who are disruptive and hyperactive
are more likely to be noticed than children who are quietly inattentive, or who try hard despite
their difficulties. Indeed, studies looking at the reliability of attention rating scales have shown
greater inter-rater agreement for overt attention symptoms (e.g. hyperactivity, impulsiveness)
than for covert symptoms (e.g. inattentiveness; Reynolds & Kamphaus, 1992). These data
indicate that the battery may be able to identify attention problems even if these are not
noticeable to parents or teachers.
124

Of course, it is possible that the new attention battery is falsely identifying problems with
attention in these children. Low scores on these tests might be attributed to various factors that
are not attentional (e.g. tiredness, anxiety or shyness). However, these tests have been designed
to minimise the impact of any non-attentional processes. Any non-attentional functions, or
general effects such as tiredness, are unlikely to affect the experimental conditions of subtests
more than the control conditions, which is what they would need to do to account for these poor
scores. In future work it would be interesting to follow up the group of children who performed
poorly on the attention tests but received ratings in the normal range, to see whether these tests
are predictive of later attention and educational achievement.
When children were divided into two groups according to parent/teacher ratings (a poor attention
group and an average-good attention group), those with poor attention showed significantly
poorer performance on the new attention battery. Although this result was not apparent on all of
the subtests, it does suggest that the battery is able to discriminate children differentiated on the
basis of a rating scale, and that selective and executive attention tasks might be most useful in
this regard. Interestingly, this reflects a similar finding by Wilding et al (2001), who showed
that a factor comprised of attentional control tasks best discriminated groups of children with
poor and good attention. This result suggests that measures of this kind have potential as tools
in the clinical assessment of preschool-age children with noticeable everyday attention problems.
125
5.2 Relationship o f the new preschool battery with later TEA-Ch performance
Part of the motivation for developing the new preschool attention battery was to have an
instrument similar to the TEA-Ch that would be suitable for preschool-age children and children
with learning difficulties. We would expect some correlation between the two batteries if they
are successfully measuring similar processes at these different stages of development. The TEA-
Ch was published in 1999 and has since been used in a number of studies with typical and
atypical samples (Manly et al, 2001; Heaton et al, 2001; Hood et al, 2005; Munir et al, 2000),
and in the assessment of attention in clinical settings. Manly et al (2001) present extensive data
to support the reliability and validity of their battery as a measure of attention for school-age
children. They used test-retest methods to demonstrate the reliability of the TEA-Ch; examined
the relationship between the TEA-Ch and IQ and found that the TEA-Ch appeared to be tapping
something distinct from general intelligence; found some convergence between TEA-Ch
measures and existing tests of attention (though perhaps less than would be desirable); and
showed that the TEA-Ch was sensitive to attention deficits in boys with ADHD. Subsequent
studies have also shown poorer TEA-Ch performance in children with ADHD (Heaton et al,
2001), and sensitivity of the measure to improvements in attention associated with medication
(Hood et al, 2005).
Although some potential issues with the interpretation of the TEA-Ch constructs have been
raised in chapter 1, it does provide a useful tool for the assessment of attention in school-age
children, and the available data supports its sensitivity to attention processes in this age range. A
small group of children from the normalisation sample for the new battery were therefore
assessed again one year later using the TEA-Ch to examine whether the new battery provides a
valid early-equivalent of the TEA-Ch.
126

METHOD
Participants
Nineteen children (9 males, 10 females) from the original normalisation group participated in
this follow-up study. Fifteen of these children came from one of the volunteer schools, and were
tested at school. The remaining children came from one of the other volunteer schools. Since
this second school was unable to provide space for testing during the follow-up period,
recruitment letters were distributed to the relevant children, asking them to visit the Visual
Development Unit for testing. The sample was therefore a little smaller than desired, since only
four of these children made appointments. Children were seen between 7 and 15 months after
their initial assessment (mean time between assessments 13.4 months), once they reached an
appropriate age for administration of the TEA-Ch. The children ranged in age from 6 years 1
month to 7 years 1 month, with a mean age of 6 years 7 months. At the time of their initial
assessment, this subset of children had a mean BPVS score of 104.8, which is a little above
average but not significantly so.
Materials
Early attention measures came from the new preschool attention battery, described in the
previous chapter. Follow-up attention assessment used four subtests from the TEA-Ch, selected
to span the various components of attention identified in the battery.
SKY SEARCH (SELECTIVE ATTENTION)
In this task children were presented with a laminated A3 sheet showing rows of paired
spaceships, and asked to find as many target items (defined as identical pairs of spaceships) as
possible, emphasising speed and accuracy. Children were asked to circle each target found and
mark a box in the bottom comer of the sheet when they thought they had finished. Following
127

the test sheet, the children completed a motor control version of the task where all of the
distractors were removed. The task in this version was simply to circle all 20 targets as quickly
as possible. The time-per-target from the motor control version was subtracted from the time-
per-target on the test version to give an ‘attention score’, intended to remove the effects of
general motor speed. Therefore, a higher score on this test reflects poorer performance.
SCORE! (SUSTAINED ATTENTION)
In this task, children were asked to count the number of tones in each of 10 trials. Each trial
contained between 9 and 15 identical tones of 345 ms, separated by silent interstimulus intervals
of variable duration (between 500ms and 5000ms). Children were instructed to count the tones
silently, without using their fingers, and to report the total at the end of each trial. Prior to the
test trials, the child was asked to demonstrate that they were able to count to 15, and were
required to pass two practice trials with fewer tones. The total number of test trials correctly
counted was recorded as the score on this subtest.
WALK DONT WALK (SUSTAINED ATTENTION/ ATTENTIONAL CONTROL)
In this subtest, children were presented with an A4 sheet showing paths made up of 14 squares
each, running vertically down the page. They were asked to listen to a tape that played one
sound (the go sound) to indicate that they should move to the next square by dotting that square
with a pen, and another sound to indicate that they should not move on to the next square (the
no-go sound). Each trial comprised a series of between 2 and 12 go sounds, followed by a no-go
sound. Intervals between the sounds were constant within each trial but reduced gradually
across trials (from 1500ms for trial 1 to 500ms for trial 20). A trial was marked correct if the
child managed to inhibit the motor response to the no-go sound, and the total number of correct
trials was recorded as the measure on this subtest.
128

OPPOSITE WORLDS (ATTENTIONAL CONTROL)
In this task, children were shown a series of pathways constructed from the digits 1 and 2. In the
‘Sameworld’ condition, they were asked to simply read out the digits as quickly as possible,
whilst in the ‘Oppositeworld’ condition they were asked to say the opposite for each digit (i.e.
say “one” for the 2 and “two” for the 1) as quickly as possible. The examiner pointed to each
digit in turn, and only moved on to the next digit when a correct response had been given,
turning errors into a time penalty. Four test pages were run in the following order: Sameworld,
Oppositeworld, Oppositeworld, Sameworld, and the time taken to complete each condition was
recorded.
Procedure
The procedure for the initial assessment is described in the previous chapter. On the follow-up
assessment, each child completed the four subtests from the TEA-Ch in the following order: Sky
Search, Score!, Walk Don’t Walk, and Opposite Worlds. As far as possible, the testing
environment was protected from distracting noise and visual stimulation. Auditory materials
were presented on a tape recorder at an appropriate volume to be heard comfortably.
RESULTS
Mean age-scaled scores for this group on each of the eight subtests of the new battery and each
of the four subtests of the TEA-Ch are shown in table 10. For both batteries, an age-scaled score
of 10 represents average performance. The children in this sample show mean scores close to
the average on all of the subtests from the new battery and most of the subtests of the TEA-Ch.
The only anomaly would seem to be a particularly low mean (7.4) on the Walk Don’t Walk task
from the TEA-Ch. Aside from this, the group seem reasonably representative of the normal
population.
129

A total score was obtained for each battery from the mean of the subtest scores (mean total
scores are also shown in table 10). There was a highly significant correlation between total
scores on the new battery and the TEA-Ch battery (Pearson correlation = .765, pc.OOl; see
figure 18). Total score on the TEA-Ch was also correlated against the BP VS measure taken at
the initial assessment, but no correlation was found between these scores.
Table 10: mean age-scaled scores for the 8 subtests of the new battery and the four subtests of
the TEA-Ch. For both batteries, a scaled score of 10 represents average performance for a given
age. Overall scores for each battery represent the mean of the subtest scores for that battery.
INITIAL ASSESSMENT
NEW ATTENTION BATTERY
MEAN (SD) FOLLOW-UP
TEA-Ch BATTERY
MEAN (SD)
VISUAL SEARCH 10.2 (2.8) SKY SEARCH 10.2(1.9)
FLANKER TASK 9.8 (2.7) SCORE! 11.2 (3.3)
VISUAL SUSTAINED 9.7 (3.2) WALK DON’T WALK 7.4 (2.5)
AUDITORY SUSTAINED 9.5 (3.0) OPPOSITE WORLDS 10.5 (2.5)
DUAL TASK 9.5 (2.9)
VERBAL OPPOSITES 10.3 (3.8)
COUNTERPOINTING 9.1 (2.8)
BALLOON SORTING 9.3 (3.5)
TOTAL NEW BATTERY 9.7 (1.9) TOTAL TEA-Ch 9.8 (2.3)
Next, total scores for each battery were correlated against individual subtests from the other
battery. These, correlations are shown in table 11. Total score on the TEA-Ch is highly
correlated with earlier performance on all three sustained attention tests from the new battery.
There are also moderate correlations with all of the other subtests in the battery, although these
do not reach significance in this small sample. Total score on the new attention battery was
significantly correlated with all four subtests of the TEA-Ch.
130

14 -i
12
? o o52 10 (0£
6 8<:LU h-
6
4 H-----------------1---------------- 1---------------1--------------- 1----------------14 6 8 10 12 14
New preschool battery (Total Score)
Figure 18: correlation between total scores on the new battery and total scores on the TEA-Ch
approximately one year later.
Next, we looked for correlations between all of the subtests individually (shown in table 12).
Again, the sustained attention tasks showed the strongest correlation with later performance on
TEA-Ch tasks. The Visual and Dual tasks were significantly correlated with the Sky Search
subtest; all three sustained tasks were correlated with Score! and Walk Don’t Walk; and both of
the single sustained tasks were correlated with Opposite Worlds. The Opposite Worlds task also
correlated significantly with Balloon Sorting, and there were a number of other moderate
correlations that did not reach significance. However, there did not appear to be a clear pattern
whereby only the tasks hypothesised to tap certain components correlated with one another. The
sustained attention tasks correlated well with Score and Walk Don’t Walk, but the attentional
control tasks showed only moderate correlations with Opposite Worlds, and the selective
attention tasks showed very small correlations with Sky Search.
131

Table 11: correlations of the TEA-Ch total score with scores from each of the NEW subtests
(first two columns), and correlations of the NEW total score with each of the TEA-Ch subtests
(second two columns).Correlation of TEA-Ch total
score with:
Pearson’s r Correlation of NEW
total score with:
Pearson’s r
VISUAL SEARCH .42 SKY SEARCH .50*
FLANKER TASK .37 SCORE! .69** .
VISUAL SUSTAINED .68** WALK DON’T WALK .56*
AUDITORY SUSTAINED .64** OPPOSITE WORLDS .65**
DUAL TASK .63**
VERBAL OPPOSITES .33
COUNTERPOINTING .26
BALLOON SORTING .44
TOTAL NEW BATTERY .77** TOTAL TEA-Ch .77**
* significant at the p<.05 level ** significant at the p<.01 level
Table 12: correlations between individual subtests from the new battery and the TEA-Ch battery.
Shaded areas show the correlations between tests designed to tap the same component of
attention (e.g. Sky Search from the TEA-Ch and the new Visual Search both aim to measure
selective attention).
New su b tests SKY SEARCH SCORE! WALK DON’T
WALK
OPPOSITE
WORLDS
VISUAL SEARCH .13 .38 .30 .42
FLANKER TASK .29 .32 .32 .27
VISUAL SUSTAINED .48* .70** .46* .56*
AUDITORY SUSTAINED .39 .57* .48* .56*
DUAL TASK .47* .65** .64** .36
VERBAL OPPOSITES .35 .25 .28 .23
COUNTERPOINTING .02 .08 .22 .37
BALLOON SORTING .31 .43 .11 .46*
* significant at the p<.05 level ** significant at the p<.01 level
132

DISCUSSION
There was a highly significant correlation between overall performance on the new preschool
attention battery and overall performance on the TEA-Ch one year later (r = .77), suggesting that
children who show good attention at preschool age also show good attention later in childhood.
This supports the validity of the new battery as an early equivalent of the TEA-Ch, and indicates
that the two batteries are likely to be measuring similar things. Note that no correlation was
found between BPVS scores at the initial assessment and later TEA-Ch scores, suggesting
against the idea that general developmental level underlies this relationship. Overall
performance on the TEA-Ch was highly correlated with each of the new Sustained Attention
measures. Total TEA-Ch scores also showed smaller correlations with the other new measures,
particularly Visual Search (r = .422) and Balloon Sorting (r = .440), but these did not reach
significance in this small sample. The total score on the new battery was significantly correlated
with each of the TEA-Ch subtests, supporting the predictive validity of the battery as a whole.
The new preschool battery and the TEA-Ch were both developed along the notion that attention
is comprised of separable components of selective attention, sustained attention and attentional
control, and data from both batteries has provided support for this model (see preceding chapter
and Manly et al, 2001). If the subtests are actually measuring distinct attention components, we
would expect greater correlations between tests claiming to tap the same components. This was
only partly the case in this study. Score! and Walk Don’t Walk (classified as tests of sustained
attention) correlated significantly with the sustained tasks from the new battery. However, Sky
Search (a test of selective attention) showed only small correlations with the selective attention
tests from the new battery. Opposite Worlds, a test of attentional control, only correlated with
one of the new attentional control subtests (Balloon Sorting), and the correlation with its closest
133

equivalent (Verbal Opposites) was small and non-significant. Both Sky Search and Opposite
Worlds correlated more strongly with the new tests of sustained attention.
These results could suggest that tests from one or other of the batteries are failing to access the
intended processes. Of course, all of these subtests are likely to tap multiple attention
components, but the reasons for supposing dominance of one particular component are
supported by data and in most cases considerable background literature (see chapter 3).
Alternatively, these correlations could arise from differences in the types of test being used. The
TEA-Ch requires more complex processing in several of its subtests, potentially introducing
additional sources of variance that may not be matched by the new battery or that are better
predicted by the functions of sustained attention in early childhood. It’s also possible that
developmental changes in attention systems affect the relationships between these earlier and
later measures. A child’s early selective and executive attention abilities appear to tell us less
about how well they will do on later tests of these abilities than their early sustained attention
capacity. Perhaps one’s capacity for sustaining attention in early childhood serves to support the
development of other attention domains, such that this capacity has greater predictive power
across attention components. It is difficult to delineate these possibilities with the available data,
but they certainly present interesting questions for future research.
In any case, this follow-up study has shown good overall correspondence between the new
preschool attention battery and the TEA-Ch. Knowing how well a child has done overall on the
new battery, but especially on the sustained attention tasks, provides a good indication of their
attention one year later on the TEA-Ch. A relatively short amount of time had elapsed between
the initial and follow-up assessment, and it would be interesting to see how well the new battery
predicts performance in later childhood, but these data support the validity of the battery in a
short-term longitudinal context.
134

5.3 Applying measures from the new battery to a younger age range
This study aimed to investigate the possibility of extending the age range for the new preschool
attention battery to include slightly younger preschool-age children. Very few attention tests and
batteries are available for children in the 3-6 year age range, but even fewer are available
between infancy and 3 years. There is a distinct shift in approaches for cognitive assessment
between infancy and early childhood, with infant measures generally using preferential looking /
habituation methods. A shift to verbal or motor responding is only possible once the child
reaches an appropriate level of development. The main aim of this study was to investigate the
feasibility of using the new preschool attention tests with younger children. In addition data
from younger children are also useful for judging the age equivalence of children with
attentional deficits, whose performance often falls in this younger range. From the pilot stages
of this project, it was clear that only certain measures from the battery would be suitable for this
younger age range, but is was possible to select one subtest from each hypothesised attention
component (the Visual Search subtest for selective attention, the Visual Sustained subtest for
sustained attention, and the Counterpointing subtest for attentional control) for inclusion in this
study.
METHOD
Participants
Participants were 24 children (14 males, 10 females) aged between 2Vi and 3 years (mean age
2.72 years). These children were recruited from the Visual Development Unit’s volunteer
database, and parental consent was obtained for each child prior to testing. Children were
offered a free vision assessment in return for participation. Parents completed a short language
questionnaire for their child (the MacArthur Communicative Development Inventory, M-CDI),
135

which was used to give a measure of the child’s general developmental level. According to this
measure, the children were performing at a level appropriate for their chronological age.
Materials & Procedure
Children were tested using three subtests from the new preschool attention battery, selected to
span the components of attention assessed by the battery. These subtests were always
administered in the following order: Visual Search, Visual Sustained, and Counterpointing. A
description of these subtests and the procedure for administration is described in the previous
chapter.
RESULTS
To recap, on the Visual Search subtest the critical measure is the number of targets found in one
minute of search time. On the Visual Sustained subtest, the critical measure is a score derived
from the number of correctly identified targets minus the number of commission errors and the
number of prompts (given after four consecutive missed targets). On the Counterpointing task,
the critical measure is the total Counterpointing time as a proportion of the total Pointing time
(i.e. Counterpointing time / Pointing time). Two main features of the data were important in this
study: (1) the success rate with which each task could be administered in this age range, and (2)
establishing a level of typical performance for children aged 2xh to 3 years.
Table 13 shows the number of children who were unable or refused to complete each of the 3
subtests. The failures break down as follows. There were three children who only completed
one subtest, thus accounting for six of the failures. There were a further four children who only
completed two subtests, accounting for the remaining four failures. The one failure on the
Visual Search subtest was a refusal to complete the task, as were two of the failures on the
136

Visual Sustained subtest, and three of the failures on the Counterpointing subtest. The
remaining failures on the Visual Sustained and Counterpointing tests were cases of a failure to
understand task instructions (i.e. the children were cooperative, but unable to understand what
was required of them in the task).
Table 13: number of children in the 21/2-3 year-old group failing or refusing to complete each
subtest, also expressed as a percentage success rate, and the mean scores for this group on each
subtest.SUBTEST NUMBER OF CHILDREN
FAILING / REFUSING TO
COMPLETE THE TEST
SUCCESS RATE MEAN SCORE (SD)
VISUAL SEARCH 1 / 24 96% 5.95 (2.16)
VISUAL SUSTAINED 4 /2 4 83% 13.41 (4.06)
COUNTERPOINTING 5 /2 4 79% 1.40(0.19) .
Table 13 also shows mean scores for each of the three subtests for this younger preschool
sample. In figure 19 these are plotted alongside the existing normalisation data from 3-6 year-
olds, to show where this younger group falls on the developmental trajectory. On each subtest,
the 2 year-olds’ performance falls in line with the developmental trajectory. They performed
worse than the 3-4 year-olds on all subtests, but still scored within the appropriate range (see
histograms in figure 19). None of the children in this group showed floor levels of performance
on these tasks, showing that the tests were appropriate for this age group (i.e. not too difficult).
137

Num
ber
corr
ect
Freq
uenc
yVISUAL SEARCH VISUAL SUSTAINED COUNTERPOINTING
Number Correct7-8 9-10 11-12 13-14 15-16 17-18 19-20
Score1.1 1.2 1.3 1.4 1.5 1.6 1.7
Counterpoint time / Point time
2.5-3 3 4 4-5
Age band
i f
5-6
£| - 302Q.
2 20 a3
8.10(U8CO
2.5-3 3 4 4-5
Age band
5-6
20
•§ 1-8 Q.
1.6
. £ 1.4 oCL
£ 1.2 c
8 . i o -
01 08 <uE 0.6 i -
2.5-3 3 4 4-5
Age band
5-6
Figure 19: histograms of performance on each of the three subtests (top row), and mean scores for the 2 year-olds in this study plotted alongside data for
3-6 year-olds from the normalisation sample (bottom row; error bars show standard deviations).
138

DISCUSSION
In this study, three subtests from the new preschool attention battery were administered with
good success rates to children aged between 2XA and 3 years. The highest success rate was on
the Visual Search task, where 96% of the children completed the task. The lowest success rate
was on the Counterpointing task, where 79% of children completed the task. It would seem that
the Counterpointing task is somewhat less practical with this age range, though this success rate
is still good on a cognitive task for 2 year-olds. Some of the failures on the Counterpointing task
may be due to task order rather than the task itself, since it was always administered last, and
children tended to tire somewhat towards the end of the session. Overall, the tasks were suitable
for use with these young preschoolers, and could be administered successfully in the majority of
cases.
These data also provide a useful indication of the level of functioning achieved by children at
age 2V2-3 years. On all subtests, performance of this younger group was in line with
expectations from the normalisation data for 3-6 year-olds. The two year-olds performed worse
than the youngest children from the normalisation group on all subtests, but their levels of
performance on different subtests tended to be consistent with the patterns observed in the
previous chapter. For example, on the Counterpointing test, the developmental trajectory was
considerably steeper between 2Vi and 3 years than it was between 3 and 6 years. The 2 year-olds
took around 40% longer on the Counterpointing block compared with the Pointing block, with a
big drop to around 19% for the 3 year-olds and a much smaller drop over two years to around
9% for the 5 year-olds. The ability to inhibit a motor response in this task seems to show
greatest development towards the younger end of the age range. Indeed, in the normalisation
sample, the youngest group (3 years) was significantly worse on this task than the two older
groups (4 years and 5 years), who were not different from each other, supporting the early
development of Counterpointing ability. The other two tasks show steadier development across

the age range, which is also consistent with analysis of the normalisation data, where significant
differences in performance were found between each age band.
These data are also potentially useful in the assessment of children with learning difficulties,
developmental delay or attention problems. In these populations it is particularly useful to have
information about functioning at the lower end of the age range, in order to derive an accurate
idea of age equivalence. In addition to our norms for 3-6 year-olds, we are now able to compare
attention in these groups to that of slightly younger typically-developing children, at least on
three of the new subtests. The battery is therefore able to provide a useful indication of
attentional ability even in fairly low-functioning children.
140

5.4 Reliability o f the new preschool attention battery
Whilst the validity of a measure refers to the extent to which it represents the intended construct
(attention in this case), the reliability of a measure refers to its consistency. Methods for
assessing reliability fall into two main types, those requiring a single administration and those
requiring multiple administrations. A common multiple-administration method is test-retest
reliability, where the correlation between two separate administrations of the same instrument is
calculated. An alternative is the altemate-forms method, where reliability is estimated from the
correlation of two different forms of a measure, usually administered together. Single
administration methods include split-half reliability, where the two halves of a measure are
treated as alternate forms, which gives a measure of the internal consistency of a test.
Test-retest reliabilities are commonly employed to investigate the consistency of
neuropsychological tests over repeated administrations. However, there are limitations
associated with this method. Firstly, it requires two administrations of the measure, which may
not always be practical, especially with tests that take some time to administer. Secondly,
reliability estimates may be affected by the length of time between administrations. If the time
interval is short, people may be overly consistent because they remember some of the items or
questions, but if the interval is long, then the results are confounded by possible learning and
maturation effects. Test-retest reliabilities have not yet been collected for the new attention
battery, mainly due to time constraints. However, the split-half method has been used to
establish preliminary reliability estimates for a subset of the children from the normalisation
sample. Most measures in the battery could be easily split into halves for this analysis. The
Visual Search and Counterpointing tasks, however, could not be easily split in this way, so
additional or alternative administrations were used with a subset of the normalisation sample in
order to derive scores suitable for this analysis (see Method section below for more details).
141

METHOD
Participants
Participants were thirty-six children aged between 3 years and 5 years 5 months, who were
tested as part of the normalisation sample (see chapter 4). The group had a mean age of 3 years
9 months (so were towards the younger end of the age range overall), and a mean score on the
BPVS of 107 (indicating that they were a little above average in terms of verbal mental age).
Measures & Scoring
All children completed the eight tests from the new preschool attention battery, according to the
standard protocol described in chapter 4. To allow for split-halves reliability analysis, these
children also completed an additional Visual Search, identical to the original task in terms of
task requirements but with a different arrangement of targets and distractors. Scores for
reliability analysis were derived as follows:
Visual Search
As mentioned, an additional test search was administered to each of the children in this group,
and the number of targets correctly identified within the one-minute search time was compared
in the reliability analysis.
Visual Sustained, Auditory Sustained & Dual Task
In all of these tasks, scores for the two halves were derived by calculating the number of correct
responses on all of the even-numbered trials and the number of correct responses on all of the
odd-numbered trials. The ‘odd’ and ‘even’ scores were then compared in the reliability analysis.
Flanker task & Verbal Opposites task
In both of these tasks, the standard administration included two blocks each of control and
conflict trials. Therefore, it was possible to compare Control 1 against Control 2, and Conflict 1
against Conflict 2.
142

Counterpointing
In this task, unlike those above, the standard administration included only one block each of
Pointing (i.e. control) and Counterpointing (i.e. conflict) trials, with Pointing presented prior to
Counterpointing in order to reinforce the prepotent response. Presenting two blocks of each in a
counterbalanced order, as above, would potentially affect the degree of interference observed in
this task. In order to derive a measure that could be analysed for split-half reliability, a note was
made of the time taken to get to the halfway point (i.e. 10 trials) in each block. It was then
possible to compare the first and second halves of the Pointing block, and the first and second
halves of the Counterpointing block.
Balloon Sorting
For this task, there were three stages in total, but the number of trials for stage 1 was compared
against the number of trials for stage 2 for the reliability analysis. This seemed the most sensible
way of dividing the task since most children had at least attempted these stages. Although the
stages should, in theory, be testing slightly different things (an intra-dimensional shift is required
in the second stage but not in the first stage), we would still expect consistency within each
individual’s performance.
RESULTS & DISCUSS/ON
Table 14 shows the Pearson Product Moment correlation coefficients between the split halves
for each subtest individually, plus the reliability estimate derived from the Spearman-Brown
prediction formula. Longer tests will tend to produce more reliable results, and shortening a test
in a split-half reliability analysis therefore has the potential to reduce observed reliability. The
Spearman-Brown formula is applied to overcome this problem by adjusting the reliability
estimate to reflect the full length of the test.
143

Table 14: Pearson correlation coefficients and Spearman-Brown adjusted estimates of split-half
reliability for each subtest individually.
SUBTEST Pearson’s r Spearman-Brown
VISUAL SEARCH Number correct .68** .81
FLANKER TASK Control time .69** .82
Conflict time .67** .80
VISUAL SUSTAINED Number correct .79** .88
AUDITORY SUSTAINED Number correct .61** .76
DUAL TASK Number correct .58* .73
VERBAL OPPOSITES Control time .56** .72
Conflict time .56** .72
COUNTERPOINTING Control time .64** .78
Conflict time .30 .47
BALLOON SORTING Trials per stage .78** .89
** significant at p<.001
The values in table 14 suggest good internal consistency for the measures in the new attention
battery, with strong and highly significant correlations between forms. Only one measure,
conflict time from Counterpointing, showed a weak-moderate correlation between the halves. A
reliability estimate for the entire instrument was also calculated by entering the first half of each
subtest to create the first form, and the second half of each subtest to create the second form.
The Pearson correlation coefficient for this analysis was .75 (significant at p<.001), and the
Spearman-Brown estimate was .86, indicating good correspondence between the split-halves.
On the whole, these measures show good internal consistency according to split-halves analysis,
providing evidence to support their reliability. Reliability should be further investigated using
test-retest methods, but these data suggest that within each test, and within the battery as a
whole, performance is largely consistent.
144

Chapter 6
Attention in Williams syndrome & Down’s syndrome
145

6. ATTENTION IN WILLIAMS SYNDROME & DOWN’S SYNDROME
6.1 Introduction
Williams syndrome (WS) is a rare genetic disorder occurring in around 1 in 20,000 live births,
caused by a hemizygous sub-microscopic deletion on chromosome 7q.l 1.23, and associated with
a distinct facial morphology plus various physical abnormalities including cardiac defects.
Individuals with WS show varying degrees of mental retardation (ranging from mild to severe),
with a distinctive pattern of strengths and weaknesses. Whilst WS show relative proficiency in
aspects of language and face processing, there are severe impairments of visuo-spatial cognition
(e.g. Atkinson et al, 2001; Bellugi, Lichtenberger, Jones, Lai & St. George, 2001; Donnai &
Karmiloff-Smith, 2000; Mervis et al, 2000). In addition, individuals with WS tend to have a
very sociable personality, often supported by their relatively good language skills.
Down’s syndrome (DS) is much more common than WS, occurring in around 1 in 700-1000 live
births, and is caused in 95% of cases by an extra copy of chromosome 21. Individuals with DS
also have a characteristic facial appearance and various physical complications, including heart
disease. Compared with WS, individuals with DS show a similar level of overall cognitive
impairment (IQs are generally in the moderate to severely retarded range; Vicari, 2006), but a
different profile of strengths and weaknesses. Although individuals with DS have often been
considered to have a more global profile of impairment, there are relative peaks and troughs in
performance. In fact, the DS profile is in many ways the reverse of the WS profile, in that there
are substantial language difficulties, but relatively less impairment of visuo-spatial skills. Both
groups also show a high incidence of vision deficits, including reduced visual acuity, strabismus,
amblyopia, and poor accommodation (e.g. Atkinson et al, 2001; Woodhouse et al, 1993,1996).
146

Many anecdotal reports suggest that attention is also a problem area in both of these groups.
Children with WS or DS are frequently reported to be more inattentive, distractible and
hyperactive than typically-developing peers, according to parent or teacher reports (Bregman,
1996; Greer et al, 1997; Pagon et al, 1987; Semel & Rosner, 1991; Pueschel et al, 1991;
Cuskelly & Dadds, 1992; Stores et al, 1998). These problems seem to persist into adulthood,
though perhaps to a lesser extent (Udwin, 1990; Davies, Howlin & Udwin, 1997). Relative to
research on other aspects of the cognitive profile, however, there has been little empirical work
on attention in WS and DS.
Attention in Williams syndrome
Atkinson et al (2003) have reported data from a number of individual measures of attention in
children with WS. They identified problems with spatial shifting of visual attention in young
WS children, using a fixation shift paradigm, where a problem of disengagement underpins
deficits if two targets are competing for attention. Atkinson et al also reported impaired
performance in older WS children on a detour box reaching task (Hughes & Russell, 1993) and a
counterpointing task, both requiring inhibition and control of prepotent motor responses. WS
children were much less impaired on the Day-Night task (Gerstadt et al, 1994), a test of verbal
inhibition, provided they could learn the basic association between a picture and a response.
Atkinson et al conclude that WS children show greatest impairment on attentional and executive
tasks when they are combined with a visuo-spatial response, an area where WS individuals have
particular difficulty (Atkinson et al, 2003).
Scerif, Cornish, Wilding, Driver & Karmiloff-Smith (2004) have investigated selective attention
processes using a visual search task in toddlers with WS, and found that whilst they were not
slower than matched controls, they did make significantly more errors. Specifically, errors
tended to be erroneous responses to distractors, rather than repetitions on found targets,
suggesting a problem with selecting and responding only to targets. In contrast, children with
147

Fragile X syndrome made more perseveration errors on found targets, suggesting a problem with
inhibitory control.
Brown et al (2003) identified impaired performance on a double-step saccade task in WS
toddlers relative to DS children and healthy controls, which they interpret in terms of a possible
attention disengagement deficit in WS, as reported by Atkinson et al (2003). However, they
found no difference in observed duration and frequency of sustained attention phases for WS
toddlers and chronological- or mental-age-matched controls. Attention phases were observed as
the child interacted with toys during 45-second trials. This task may have been engaging enough
that it did not place sufficient demand on sustained attention to reveal attentional deficits,
however deficits relative to mental age (MA) matched controls were apparent in children with
DS.
As part of a study looking at hypersociability in WS and DS children and adults (age range 5-45
years), Porter et al (2007) administered the Shape School task, a test of verbal inhibition. Both
groups showed deficits relative to typical performance, leading the authors to conclude that
hypersociability in these conditions might emerge from a frontal inhibitory deficit, rather than a
problem of emotion recognition or social salience. In another recent study, Montfoort et al
(2007) identified impaired visual search in WS according to various indicators of search
efficiency (search time, fixation length, refixations on a target, and misfixations on a non-target).
However, it Was not entirely clear how well WS and control groups were matched in this study.
In summary, this evidence suggests deficits in selective aspects of attention (e.g. visual search,
disengagement, orienting) in children with WS. Problems with attentional control have also
been observed, though these may be greater on tasks requiring visuo-spatial processing. There is
little evidence relating to sustained attention in this group, although it did not appear to be a
problem in Brown et al’s (2003) study of WS toddlers. Studies of attention in WS have largely
148

employed single tasks, with little attempt as yet to map the profile of impairments across a range
of tasks in a single group.
Attention in Down’s syndrome
A greater number of studies have investigated across a range of attention or executive function
(EF) measures in DS. Pennington et al (2003) compared performance on preffontally-mediated
EF tasks and hippocampally-mediated long-term memory tasks. Children with DS were worse
then MA-matched controls on all of the hippocampal measures, but no worse on the measures of
prefrontal function (which included a planning task, fluency tasks and an inhibition task, in
addition to two working memory tasks). This study suggests that executive control is not a
particular weakness in DS, with performance in line with mental age. However, Nadel (2003)
reported that in subsequent work, impairments on EF tasks were observed, but only on tasks
using verbal materials and not on tasks using visuo-spatial materials. Information on these tasks
in the Nadel (2003) paper is not sufficient to determine how much of this effect might be due to
verbal deficits rather than attentional deficits. However, it may be the case that deficits in the
attentional domain emerge out of interactions with other areas of difficulty, as discussed by
Atkinson et al (2003) for spatial EF tasks in WS.
In a more recent study, Rowe et al (2006) also looked at performance across a variety of EF
measures, including a set-shifting task, a planning task, working memory tasks, an inhibition
task, and a cancellation task (designed to measure sustained attention). Relative to controls with
other learning difficulties (of unknown etiology), DS children were impaired on all tasks.
However, taking into account multiple comparisons, differences between groups were only
significant for the set-shifting and sustained attention tasks, suggesting that these might be areas
of particular difficulty in DS.
149

In another series of studies by Munir, Cornish and Wilding (2000; see also Cornish, Munir &
Cross, 2001 and Wilding, Cornish & Munir, 2002) DS children have been assessed across a
range of attention components. DS children were included in these studies as controls for a
group of children with Fragile X syndrome (FXS), so were not the main focus of the
investigation. However, these studies still provide useful information about DS performance on
standard tests of attention. Munir et al (2000) examined the performance of DS and FXS boys
on tests of selective, sustained and divided attention from the WATT (Wilding Attention Test for
Children) and tests of attentional control from the TEA-Ch (Opposite Worlds and Walk Don’t
Walk). Both groups were impaired on these tasks relative to control children, with FXS boys
showing greater impairment than DS boys on all subtests except Opposite Worlds, where DS
performance was significantly poorer. Performance was relatively less impaired on the test of
sustained attention, where there was no difference between the DS group and controls in terms
of the number of targets found, although DS boys were slower to find targets and made more
false alarms. Further examination of the errors made in the visual search task (Wilding et al,
2002) showed that both groups made qualitatively different errors from controls. Whereas the
errors made by control children tended to be shape confusions, FXS and DS boys tended to
make repetition errors (i.e. repeat touches to previously-found targets), suggesting a problem
with response inhibition and switching. Cornish et al (2001) conducted a similar study with
FXS and DS adults, using tests of selective and sustained attention from the TEA, and the
Wisconsin Card Sorting Task (WCST) as a measure of executive control. DS individuals
showed impairments relative to MA matched controls on all tasks, but were only worse than the
FXS group on the selective attention test.
Several other studies have looked at individual aspects of attention in DS. As mentioned, Porter
et al (2007) found impaired performance on a test of verbal inhibition in both DS and WS, whilst
Brown et al (2003) observed a deficit in sustained attention phases during play in DS but not
WS. In a recent study, Flanagan et al (2007) examined reflexive and voluntary orienting of
150

attention in DS and FXS, and found that whilst both groups were capable of normal reflexive
orienting, they were delayed in terms of voluntary shifts of attention.
In summary, in DS there is relatively consistent support for a selective attention deficit and
problems with shifting or switching attention (Munir et al, 2000; Cornish et al, 2002; Flanagan et
al, 2007). DS individuals also seem to be impaired on tasks requiring inhibition and response
control, though this deficit may be more apparent on tasks using verbal materials. Evidence for
a sustained attention deficit is less clear. Brown et al (2003) found a deficit in DS toddlers, and
Rowe et al (2006) found poorer performance on a cancellation task in DS children that they took
to reflect impairment of sustained attention. However, this task was essentially a visual search
with a relatively short duration, so may reflect selective attention more than sustained attention.
Further, Munir et al (2000) suggested relatively less impairment of sustained attention in their
study.
A developmental perspective on the study of attention in WS and DS
In a recent paper, Cornish, Scerif and Karmiloff-Smith (2007) have presented a collection of
previously-published and novel results, focusing on the development of aspects of attention in
children with WS, DS and FXS. In their first study, the authors compared orienting and
inhibition processes in infants and toddlers with FXS and WS, using a visual cuing paradigm.
Whilst the FXS children showed greatest difficulty in inhibiting saccades to a cue, the WS
children showed a pattern that seemed to reflect difficulty in disengaging attention, consistent
with previous findings. The second study extended the results of Scerif et al’s (2004) visual
search experiment to include children with DS. In fact, the children with DS showed no
difference in performance from MA-matched controls (the differences seen in WS and FXS have
already been described above).
151

The final study investigated attention performance in older children with DS and FXS, using the
Map Search and Walk Don’t Walk tasks from the TEA-Ch, and the sustained attention measure
from the WATT. On the sustained attention measure, neither group was different from matched
controls, but the DS group showed poorer performance on the selective attention measure, whilst
the FXS group performed worse on the executive control measure. The authors also compared
groups in terms of correlations of task performance with age, in order to investigate possible
differences in developmental trajectories. Whilst conclusions are somewhat limited by small
sample sizes, they did find evidence of differing developmental trajectories that were syndrome
specific. This paper is representative of an important shift in the study of developmental
disorders, towards a truly developmental perspective, which emphasises the investigation of
component functions of a domain, using cross-syndrome comparisons and tracing developmental
trajectories as fully as possible.
Neuroanatomy of WS and DS
In neuroanatomical studies of WS and DS, both groups have been found to show reduced overall
brain volume compared to controls (e.g. Jemigan et al, 1993), but with different patterns of
regional abnormalities. In DS, the brain often appears normal at birth but is invariably abnormal
by adulthood (Nadel, 1999), showing smaller overall brain volumes, with disproportionately
smaller cerebellar, brainstem, frontal lobe, and hippocampal volumes (Kesslak et al, 1994; Raz
et al, 1995; Aylward et al, 1997). Despite the prevalence of DS, very few studies have
investigated its neuroanatomy in childhood. Jemigan et al (1993) reported smaller overall brain
volumes in DS children, with disproportionately smaller volumes in frontal, temporal and
cerebellar regions, and Pinter et al (2003) have produced largely consistent findings. They noted
in addition relative preservation of parietal lobe grey matter, which they link with strengths in
visuo-spatial tasks relative to verbal performance in DS.
152

In WS adults, reduced grey matter volume and density have been observed in parieto-occipital
regions, particularly the superior parietal lobules (Reiss et al, 2004; Eckert et al, 2005), and
abnormal gyrification has been reported in parietal, occipital and frontal regions (Schmitt et al,
2002). A similar reduction of parieto-occipital grey matter volume has been observed in WS
children aged 5-15 years (Boddaert et al, 2006), and two very young WS children (2-3 years)
showed abnormalities in the cerebellum and in the white matter of dorsal ffonto-parietal regions
(Mercuri et al, 1997), indicating an early origin for these structural abnormalities. The location
of these abnormalities is consistent with the suggestion of a specific deficit in the dorsal visual
stream in WS (Atkinson, King, Braddick, Noakes, Anker & Braddick, 1997). The dorsal stream
represents one of two distinct, but interacting, processing streams in vision (Milner & Goodale,
1995; Mishkin, Ungerleider & Macko, 1983), and is responsible for processing spatial
relationships and providing visual information for the control of spatially-directed actions (i.e.
the ‘where’ and ‘how’ information in vision). In contrast, the ventral stream processes
information relating to the identity of objects and faces (i.e. the ‘what’ and ‘who’ information).
It has been suggested that WS is associated with a specific deficit in dorsal stream processing
(Atkinson et al, 1997). Evidence for this comes from a ‘mailbox’ task in which WS children
were able to visually match the orientation of a letter to a slot in the mailbox, but were unable to
match the orientation if required to post the letter themselves (i.e. if the task required spatially-
directed action), plus measures of global form and motion processing (Atkinson et al, 1997,
2003). Aspects of the general cognitive profile in WS (i.e. strengths in face processing alongside
weaknesses in visuo-spatial processing) are also consistent with a dorsal stream deficit. Dorsal
stream deficits have been identified in a number of other disorders in addition to WS, including
hemiplegia, autism, developmental dyslexia, and fragile X syndrome (FXS), leading to a
hypothesis of ‘dorsal stream vulnerability’ in developmental disorders (e.g. Braddick, Atkinson
& Wattam-Bell, 2003). Problems with dorsal stream processing have been suggested as a
possible mechanism for the attention problems observed in WS (see Atkinson et al, 2003).
153

The current study
Despite recent efforts to establish profiles of attention functions across the lifespan in WS and
DS (e.g. Cornish et al, 2007), considerable gaps in these trajectories remain, especially for WS
children. This chapter presents two studies of attention in school-age children with WS and DS.
In these studies, performance was compared against data on the age function of typical
development (spanning 3 to 16 years of age), in order to examine profiles of attention in WS and
DS in terms of equivalence to this typical development. These studies have clear practical
benefits in terms of intervention strategies for education and general development, especially
given the influence of attention processes on achievement in other domains. Results from these
studies also have potential implications for the debate about attentional separability. If different
aspects of attention vary in their vulnerability to impairment, some independence of these
systems would be implied.
154

6.2 Assessing attention in WS using the TEA-Ch
What is currently known about the prevalence and nature of attention problems in WS has been
discussed above. It remains that little is known about the specific nature of attention problems in
WS, particularly in terms of the different components of attention. Only a few studies have
directly tested attention in WS, and none has compared across the different hypothesised
components in a single sample. In an initial investigation of the pattern of attention deficits in
WS, this study used the Test of Everyday Attention for Children (TEA-Ch) to do just that. The
TEA-Ch is normalised for children aged 6 to 16 years, and has been used in the assessment of
various clinical groups, including ADHD (Hood et al, 2001; Sutcliffe, Bishop & Houghton,
2006), traumatic brain injury (Anderson et al, 1998), and reading and movement difficulty
(Cruddace & Riddell, 2006). Munir et al (2000) (see also Cornish et al, 2007) have used subtests
from the TEA-Ch to investigate attention in school-age children with DS and FXS, but did not
test children with WS. The WS individuals who participated in this study all had a
chronological age and approximate mental age between 6 and 16 years, so in theory the TEA-Ch
provided a suitable measure for assessment of attention in this group. Four subtests from the
TEA-Ch were selected spanning three components of attention, in order to explore a profile of
attention functions in WS.
Method
Participants
Seventeen individuals with WS between the ages of 8 and 15 (mean age 11.8 years, standard
deviation 2.0 years) participated in this study. These children were recruited through the UK
Williams Syndrome Foundation and were all positive on the FISH test for elastin deletion on
chromosome 7. Performance on the TEA-Ch was compared against published norms derived
155

from a sample of 293 children aged between 6 and 16 years (Manly et al, 1999). One additional
child was excluded from the analysis, because she had a verbal mental age (see below) of only 4
years, which is too young to allow for comparison with the TEA-Ch norms. All of the children
had either normal vision, or an appropriate spectacle correction.
Data for the WS group are plotted according to each child’s ‘age equivalence’ on the British
Picture Vocabulary Scale (BPVS; version 1, short form; Dunn, Whetton & Burley, 1997), taken
as a broad indicator of general intellectual development. This was not used as a basis for
matching to another group, but rather as a way to take into account some of the variability in
general developmental level within the WS group. This was done with the recognition that
vocabulary is an area where individuals with WS may show good performance relative to other
cognitive skills. However, this is useful in terms of establishing whether attention is an area of
relative weakness in WS. In general, BPVS scores were still low for chronological age, with all
but two children showing a delay on this test, with an average delay across the group of around 3
years 9 months. Verbal mental age on the BPVS ranged from 6.0 years to 11.5 years, with a
mean of 8.4 years (standard deviation 1.6).
Measures
Children w.ere tested on four subtests of the TEA-Ch battery, selected to span the various
components of attention identified in the battery. These have been described in detail in chapter
5.2 and are summarized below.
Sky Search (Selective attention)
In this task children were asked to find pairs of matching spaceships among non-matching pairs,
circling targets on a laminated search sheet, with no time limit. Children also completed a motor
156

control version of the task where all of the distractors were removed. The overall score was
derived from the time-per-target for the test condition minus the time-per-target for the motor
control condition. A higher score on this test reflects poorer performance.
Score! (Sustained attention)
In this task, children were asked to count the number of tones in each of 10 trials. Each trial
contained between 9 and 15 identical tones of 345 ms, separated by silent interstimulus intervals
of variable duration (between 500ms and 5000ms). Prior to the test trials, the child was asked to
demonstrate that they were able to count to 15, and were required to pass two practice trials with
fewer tones. The total number of test trials correctly counted was recorded as the score on this
subtest.
Walk Don't Walk (Sustained attention / attentional control)
In this subtest, children were asked to make a response (dotting the squares in a pathway running
vertically down the page) each time they heard the go sound, but to withhold the response when
they heard the no-go sound. Intervals between the sounds were constant within each trial but
reduced gradually across trials (from 1500ms for trial 1 to 500ms for trial 20). A trial was
marked correct if the child managed to inhibit the motor response to the no-go sound, and the
total number of correct trials was recorded as the measure on this subtest.
Opposite Worlds (Attentional control)
In the ‘Sameworld’ condition, children were asked to simply read out the digits 1 and 2 as
quickly as possible, whilst in the ‘Oppositeworld’ condition they were asked to say “one” for the
2 and “two” for the 1. The examiner pointed to each digit in turn and only moved on to the next
digit when a correct response had been given, turning errors into a time penalty. The time taken
to complete each condition was recorded, and the critical score was the total time taken to
complete the opposite worlds condition.
157
Procedure
Prior to testing, informed consent was obtained from children and parents. Each child completed
the four subtests from the TEA-Ch in the following order: Sky Search, Score!, Walk Don’t
Walk, and Opposite Worlds. Following this, the child completed the BPVS, and was given a
standard vision assessment. The total duration of testing was approximately IV2 hours,
depending on the amount of practice and instruction needed. As far as possible, the testing
environment was protected from distracting noise and visual stimulation. Auditory materials
were presented on a tape recorder at an appropriate volume to be heard comfortably.
Results
The TEA-Ch has been standardised using a sample of 293 individuals between the ages of 6 and
16 years (Manly et al, 1999). Norms, including raw scores, age-scaled scores and percentiles,
are published for each of six age bands (6-7 years, 7-9 years, 9-11 years, 11-13 years, 13-15
years and 15-16 years). For our WS group, scores on each subtest were compared against these
published norms for the relevant age band. This was done using verbal mental age on the BPVS.
Raw scores on the TEA-Ch are transformed to age-scaled scores with a mean of 10 and a
standard deviation of 3 (i.e. a score of 10 represents the average performance of typically
developing children). Mean age-scaled scores for the WS group on each of the four TEA-Ch
subtests are presented in table 15.
This data shows that the WS sample were severely impaired relative to norms for their verbal
mental age across the range of attention subtests. Indeed, one-sample t-tests comparing these
mean scaled scores against the typical population mean of 10 were highly significant for all tests
(p<.001 in all cases). Greatest impairment was evident on the Opposite Worlds subtest, with
158

least impairment on the Sky Search subtest, although this difference did not reach significance
on a repeated-measures ANOVA in this small sample.
Table 15: Mean age-scaled scores for the WS group on each of the four TEA-Ch subtests
(scaled by verbal mental age on the BPVS). A scaled score of 10 represents average
performance for a given age band; a scaled score of 5 represents performance at the 5th percentile
for a given age band.
SUBTEST Mean age-scaled score (SD)
SKY SEARCH 5.47 (3.95)
SCORE! 4.65 (2.85)
WALK, DON’T WALK 4.06 (2.19)
OPPOSITE WORLDS 3.53 (3.04)
Figure 20 shows scaled scores plotted individually, against indicators of the 50th, 15th and 5th
percentiles. This figure illustrates that the majority of children were performing extremely
poorly on these tasks, with performance below the 15th percentile, a level commonly regarded as
clinically significant. Even taking a very conservative criterion for poor performance (the 5th
percentile), a substantial proportion of the sample performed below this level on each subtest
(47.0% for Sky Search, 41.2% for Score!, and 64.7% for Walk Don’t Walk and Opposite
Worlds).
159

14
12 -
10 — 50th %ileLUa.:ooCOoLU
• •
15th %ile• •_ i
<oCO
5th %ile
• • •
• • • •
• • • • • • • • •
• • •
WALK DON'T WALK
OPPOSITEWORLDS
SKYSEARCH
SCORE!
SUBTEST
Figure 20: Individual age-scaled scores (scaled by developmental age on the BPVS) for each
subtest. Each dot represents an individual child’s performance. A scaled score of 10 represents
average performance, a score of 7 reflects performance at the 15th percentile, and a score of 5
reflects performance at the 5th percentile.
Figure 21 shows raw scores for each individual child, plotted against BPVS developmental age.
Also shown is a line representing the level of performance expected at different ages in
typically-developing children (taken from norms published by Manly et al, 1999). The WS
children in this sample appeared to show little improvement with increasing developmental age
on any of the measures. Indeed, there were no significant correlations with age (either
chronological or developmental) for raw scores on any of the tests, suggesting that performance
on these tasks did not vary substantially with age, at least not cross-sectionally within this
sample.
160

SKY SEARCH SCORE!
o oCOzO
20
15
5
06 8 10 12 14 16
AGE (developmental age, years)
WALK DON’T WALK
10 i
8
6
4
2
06 8 10 12 14
AGE (developmental age, years)16
OPPOSITE W ORLDS
AGE (developmental age, years)AGE (developmental age, years)
Figure 21: Raw scores for the WS group on each subtest plotted against the expected trajectory
for typical performance (plotted using published norms; Manly et al, 1999). Note that low
scores reflect better performance on the Sky Search and Opposite Worlds subtests. Each dot
represents an individual WS child.
Discussion
The data presented here support reports of substantial attention problems in Williams syndrome.
WS children in this study performed poorly across four subtests of the TEA-Ch, selected to span
selective, sustained and executive attention, with mean standard scores significantly below what
would be expected for their verbal mental age. The proportion of the sample falling below the
161

5th percentile ranged between 47 and 65% for different tests. Further, it seems that the whole
age range was similarly affected. There was little improvement with age (either chronological or
developmental), although these low cross-sectional correlations do not necessarily mean that
individual children would show no progress with age.
There is some indication that certain aspects of attention might be more affected than others.
According to these data, WS children performed worst on the Opposite Worlds subtest, a test of
verbal inhibition, and best on the Sky Search, a test of visual selective attention. Performance on
the Score! and Walk Don’t Walk subtests, both taken as measures of sustained attention, fell
somewhere in between. However, it is necessary to consider how certain aspects of the TEA-Ch
might distort the degree of impairment seen across different subtests.
There were a number of concerns about the extent to which the TEA-Ch measures attention in a
group like WS, where other non-attentional impairments may contribute to performance. All of
the subtests used in this study raised issues of this kind. On the Sky Search subtest, the WS
children did relatively well in terms of the total number of targets found, but were much poorer
in terms of their attention score, which is obtained by subtracting the motor control time from
the test time. This scoring method assumes equivalent motor difficulty in the search and control
tasks. However, the targets on the control sheet, unlike the test sheet, are surrounded by blank
space. The test sheet requires considerably more motor control, and the WS children often took
longer to circle each target on this sheet. This is consistent with the fact that difficulties with
writing are reported by 93% of parents of WS children (Semel and Rosner; 2003). It is likely
that WS children experience some, possibly considerable, attentional difficulty on this task.
Indeed, they rarely show an organised search strategy and are slow to locate targets. However,
the attention score may not accurately reflect the contribution of motor slowness to this task.
162

Around half the WS sample appeared to have considerable difficulty on the Score! subtest,
failing to give any correct answers, and this too is unlikely to have reflected a purely attentional
deficit. Problems with number skills in WS are widely documented (Udwin, Davies, & Howlin,
1996; Ansari, Donlan, Thomas, Ewing, Peen & Karmiloff-Smith, 2003; Paterson, Girelli,
Butterworth & Karmiloff-Smith, 2006). Paterson et al (2006) reported that whilst individuals
with WS were able to count to 20 by rote, they experienced considerable difficulty as soon as
they were required to perform any task greater than simply reciting the verbal string of numbers.
Likewise, Ansari et al (2003) found that understanding of the cardinality principle (that the last
tag in a count sequence represents the total number of items in the counted set) was extremely
delayed in children with WS. An understanding of what it means to count items, beyond the
ability to recite number words in the appropriate order, is essential to performance on the Score!
subtest, and deficits in this ability are likely to contribute to impaired performance in WS.
Indeed, all of the children in our sample were able to count to 15 in the pretest, but for many this
ability seemed to go little beyond reciting the numbers. Figures 20 and 21 show two distinct
groups of children on this subtest; one performing at floor level and the other performing much
closer to the normal range. Observations during testing suggested that counting ability divides
these groups rather than sustained attention. In other words, those children that failed
completely did so because they were unable to count reliably. If we exclude the children who
performed at floor on this task, the remaining children have a mean age scaled score of 6.7,
which is still low for their mental age, but somewhat better than the existing result.
The Walk, Don’t Walk subtest also incorporates requirements beyond those of attentional
control that might influence performance for WS children. This task requires that the child is
able to make spatially-accurate and increasingly-speeded motor responses. Two of the children
in our sample were simply unable motorically to perform this task, and others might have
performed more poorly on account of these visuo-motor demands. Towards the end of this test,
the tones are presented in quick succession, making it difficult for children with visuo-motor
163

problems to keep up. As with Sky Search, WS children might therefore perform poorly because
of motor slowness rather than an inability to inhibit.
The Opposite Worlds subtest is likely to provide a more accurate reflection of attentional control
in WS, since it relies on verbal responses, an area of relative strength in WS. However, the way
in which the Opposite Worlds subtest is scored may not selectively capture inhibition processes.
The total time taken to complete Same World blocks and Opposite World blocks is recorded, but
norms are presented for each condition separately, and it is total time on the Opposite World
condition that is recommended as the critical score. The critical score therefore does not take
into account speed on the control condition, and is unlikely to be free from effects of any general
slowness. As would be expected, the WS children performed slowly relative to age norms on
the Same World control condition as well as the Opposite World condition. A more specific
way to measure attentional control in this task might be to measure test performance against an
individual’s control performance. If each individual WS child is given an age equivalence on
the Same World condition, and this is used to provide an appropriate age band for judging
Opposite World performance, then the group has an average Opposite World scaled score of
7.22. This is in comparison to an average scaled score of 3.53 if performance is based on total
Opposite World time alone. It seems therefore, that much of the deficit in performance on this
task might be due to a general motor slowness that affects both conditions, rather than an
attentional control deficit that affects only the test condition.
Taking these issues into account, the profile of impairments looks somewhat different. Whilst
the original results suggested that Opposite Worlds was the most problematic subtest for this
group, adjusting the scores to control for general slowness suggests that it is the least
problematic. Excluding children who failed the task completely, performance on the Score!
Subtest also seems relatively better than the initial results would suggest. Now the selective
attention task and the motor inhibition task show the greatest deficits in this group, and although
164

concerns about the influence of motor speed remain, this is consistent with the results of
previous studies.
Using a visual search task, Scerif et al (2004) found that WS children made more errors than
controls matched on either chronological or mental age. Further, the type of errors made (errors
to non-targets) suggested a problem with selecting out targets from the array rather than a
problem with inhibition as seen in a comparison group with Fragile X syndrome. Atkinson et al
(2003) found greater deficits in WS on their test of motor inhibition (Counterpointing), than on
the test of verbal inhibition (the Day Night test). Tasks dependent on both kinds of inhibition
were somewhat impaired here, though a pattern of greater motor inhibition was replicated. A
study by Brown et al (2003), observed no differences in sustained attention in children with WS
and controls. Some impairment of sustained attention was apparent here, though this appears
relatively less affected provided children could perform the counting component of the task.
This study highlights the need to consider the appropriateness of a test in relation to the specific
profile of abilities observed in WS, and confirms that more suitable measures are needed for the
assessment of special populations like WS. In addition to providing measures for younger
children, the new attention battery was designed with the aim of enabling better assessment of
children who have developmental delay or other cognitive deficits that make existing attention
tests unsuitable. The next study in this chapter describes how the new preschool attention
battery has been applied to the assessment of attention in both Williams syndrome and Down’s
syndrome.
165

6.3 Assessing attention in WS and DS using the new preschool attention
battery
Children with Down’s syndrome, like children with Williams syndrome, are frequently reported
to have substantial problems in the attention domain, although direct assessment of attention in
both conditions has been relatively limited. As reviewed above, studies of WS children have
suggested problems of disengaging attention and selective attention (Atkinspn et al, 2003; Scerif
et al, 2004; Montfoort et al, 2007; Comish et al, 2007) as well as attentional control, especially
in tasks using visuo-spatial materials (Atkinson et al, 2003). Selective attention also seems to be
impaired in DS (Munir et al, 2000; Comish et al, 2001), but deficits in executive attention are
more likely to emerge on tasks using verbal materials (Pennington et al, 2003; Nadel, 2003;
Munir et al, 2000). Evidence for sustained attention deficits is limited in WS, although Brown et
al (2003) found no deficits in WS toddlers, and somewhat mixed in DS.
The study reported in the previous section supported the notion of attention impairments in WS,
but also highlighted the importance of considering the appropriateness of measures for groups
with developmental disorders. In the new preschool attention battery the requirement for
processes other than attention is minimised as far as possible, so that difficulties in non-
attentional domains should have little impact on test performance. The target age range for the
new battery also means that tasks have been designed to be as simple to understand as possible,
which is vital for many children with learning difficulties.
This study aimed to directly assess attention processes in WS and DS, across a range of different
tasks, addressing three main points: (1) the degree of impairment relative to norms for a child’s
mental age; (2) the relative degree of impairment across different subtests or components; and
(3) any differences in the profile of attention impairments between the groups. From reports of
attention difficulties in these groups, some impairment of attention processes, even relative to
166

mental age, was expected. However, certain attention functions were expected to show greater
impairment than others. From existing research, both groups were expected to show
impairments of selective attention and executive attention. However, executive attention deficits
were expected to be greater for tasks tapping areas of relative weakness for each group (i.e.
verbal tasks for the DS group, and visuo-spatial tasks for the WS group). Based on existing
evidence, sustained attention tasks were expected to be relatively less impaired than selective
and executive attention tasks.
Method
Participants
For this study, WS children were recruited with the help of the Williams Syndrome Foundation,
and from an exiting database of volunteer families held by the Visual Development Unit. DS
children were recruited from a similar database of volunteer families held by the Special
Assessment Eye Clinic at Cardiff University. In total, 17 children with WS (11 males) and 16
children with DS (10 males) were assessed using the new preschool attention battery. The
children ranged in age from 5 to 15 years, with a mean chronological age (CA) of 9 years for the
WS group and 10 years 11 months for the DS group. A measure of mental age (MA) was
derived from performance on standardised verbal and non-verbal tests (described in the method
section), and ranged from 2 years 2 months to 8 years 2 months, with a mean MA of 5 years 5
months in the WS group and 4 years 5 months in the DS group. Some of these children were
tested as part of a wider assessment of visual, motor and spatial memory skills, and thus
completed just some of the attention tests. Data from these children is used to examine the
usefulness of this battery for children with developmental disorders. Only data from the children
who completed all of the eight subtests is presented in the main analysis of attention deficits in
WS and DS.
167

Eleven children with WS and nine children with DS completed all 8 subtests, and these children
form the main sample for analysis of attention impairments. Details of chronological and mental
age according to performance on the BPVS (verbal mental age, VMA) and object assembly or
block construction tests (non-verbal mental age, NVMA) (see Measures section for details) can
be found in table 16.
Table 16: age and mental age data for the WS and DS groups (CA: chronological age; VMA:
verbal mental age; NVMA: non-verbal mental age; MA: mental age).
Williams syndrome
(N = 11)
Mean SD
Down’s syndrome
(N = 9)Mean SD
CA 9.09 2.01 11.35 2.76VMA 6.84 2.01 5.08 1.11
NVMA 4.70 1.12 5.19 0.89MA 5.78 1.26 5.14 0.82
Group differences in chronological age and each measure of mental age were examined by
independent-groups t-tests. In terms of chronological age, the DS group were older than the WS
group, and this difference was marginally significant (t(18) = -2.08, p=.052). As would be
expected, the WS group had a higher VMA, and this difference was also significant (t( 18) =
2.34, p<.05). The DS group had a somewhat higher NVMA, whilst the WS group had a slightly
higher overall MA. However, neither of these differences was significant. Therefore the groups
were well matched for overall MA (5.8 years in the WS group and 5.1 years in the DS group).
Measures
Preschool Attention Battery
The eight subtests of the preschool attention battery were administered in the usual order:
Visual Search, Visual Sustained, Flanker Task, Auditory Sustained, Verbal Opposites, Dual
168
Task, Counterpointing, and Balloon Sorting. The tasks were administered according to the
standard protocol (for full details see chapters 3 and 4).
Mental age measures
Given the differences in cognitive profiles in WS and DS, a measure of mental age in this study
was derived from a combination of verbal and non-verbal measures. Whilst this is not
equivalent to a mental age measure derived from comprehensive intelligence testing, it does take
into account both strengths and weaknesses, giving a more global picture of developmental level
than might be achieved with a single measure (e.g. BPVS). This is particularly pertinent when
comparing groups with different cognitive profiles.
Verbal MA
The British Picture Vocabulary Scale (BPVS; short form) was used to give a measure of
receptive vocabulary as an indicator of verbal mental age. In this task, the child is shown a
series of pages, each showing four pictures. The child is required to point to the picture that best
depicts a particular word. The trials get progressively more difficult, and the task is terminated
when a child has given four incorrect responses in the last six trials. The score is derived from
the number of trials attempted minus the number of errors, and an age-equivalence can be
derived from published normative data (Dunn et al, 1982). Each child’s age equivalence on the
BPVS provided a measure of verbal MA.
Non-verbal MA
One of two possible tasks was used to assess non-verbal MA. In the Block Construction task
(e.g. Atkinson et al, 2002; Stiles-Davis, 1988), the examiner builds a series of constructions (e.g.
a tower) from a set of blocks, and the child is required to copy the construction as accurately as
possible with their own set of blocks. The examiner’s construction remains visible to the child
throughout, so that the task is accessing visuo-spatial construction abilities rather than memory.
169

The constructions get progressively more difficult, and each construction receives a score based
on accuracy and, for the later constructions, time to completion. Normative data, and thus age
equivalences, are available from 18 months to 5 years. The alternative non-verbal MA task was
the Object Assembly subtest from the WPPSI (Wechsler Preschool and Primary Scale of
Intelligence) or the WISC (Wechsler Intelligence Scale for Children). In this task, the child is
asked to assemble a set of flat pieces into a picture of an object. The pieces for each assembly
puzzle are arranged before the child, who is then given 2 minutes to complete the puzzle. A
score is derived from the number of correct joins, with additional points awarded for faster time
to completion on perfect assemblies. Age equivalence data are available from 2 years 6 months
to 7 years on the WPPSI, and from 6 to 16 years on the WISC.
To assess non-verbal MA, the Object Assembly test from the WPPSI was always attempted first.
Non-verbal MA was taken from this measure if the child was able to complete the test to obtain
an age-equivalence from the available range. In cases where the WPPSI Object Assembly was
too difficult, the Block Construction subtest was used as an alternative measure of non-verbal
MA. In a limited number of cases, the child performed at ceiling on the WPPSI Object
Assembly, and the WISC Object Assembly was administered as an alternative. An overall MA
was derived from the mean of VMA and NVMA.
Data treatment
Data from the normalisation of the preschool attention battery (see Chapter 4) were used to
derive age-scaled scores for the WS and DS children. Age-scaled scores were based on each
child’s MA rather than CA, to give an idea of attentional abilities relative to the general level of
functioning in these groups. Since normative data were only available for the 3-6 year age
range, some children were assessed according to the closest available age band to their MA. For
example, a child with an MA of 7 years would have age-scaled scores taken from the 5-6 year
170
age band3. In these cases, scaled scores represent something of an over-estimate of ability, since
a certain raw score will achieve a higher scaled score in a younger age band than it would in a
higher age band. There were five cases in the WS group and one case in the DS group where
scaled scores were derived in this way. The possibility that scaled scores for the WS sample
somewhat underestimated the degree of impairment is explored further in the discussion.
Although this approach was not ideal, it had the benefit of allowing for statistical comparison
across subtests, since scores are all on the same scale, and was therefore preferred over
alternative approaches.4
Results
Group and task effects
Raw scores and age-scaled scores for both groups on each subtest are shown in table 17. First,
age-scaled scores were compared against the typical population mean of 10 to assess whether the
performance of our WS and DS children was significantly different from the average for their
mental age. For the WS group, scores were significantly below 10 according to one-sample t-
tests on the Visual Search (t (10) = -2.55, p<.05) and Counterpointing task (t( 10) = -6.09,
p<.001), and marginally below 10 on the Balloon Sorting task (t( 10) = -2.12, p=.06). None of
the other subtests differed significantly from the population mean. For the DS group, mean age-
scaled scores were significantly worse than 10 on the Flanker task (t(8) = -8.31, p<.001) and the
Balloon Sorting task (t(8) = -2.63, p<.05), and marginally worse on the Visual Search (t (8) = -
2.12, p = .067). On one of the tasks, the Auditory Sustained task, the DS group showed a mean
score that was significantly better than 10 (t(8) = 2.73, p<.05).
3 There were no cases where the reverse applied (i.e. children with an MA younger than 3 years having scaled scores taken from the 3-4 year age band).4 Alternative approaches to the analysis of this data were explored. These included (i) deriving an approximate age-equivalence for each WS or DS child’s raw score, using normative data; and (ii) comparing raw scores for the WS and DS groups against raw scores for an MA-matched control group selected at random from the normative sample. Both approaches gave the same overall pattern of results (i.e. the differences that were significant using the approach presented here were also significant using either of the alternative approaches).
171

Table 17: mean raw scores and age scaled scores (scaled by MA) for each of the 8 subtests.
W illiam s sy n d ro m e D ow n’s sy n d ro m e
(N = 11) (N = 9)
Raw S ca led Raw S ca led
VISUAL SEARCH 9.55 7.09 9.33 7.22
FLANKER TASK 1.10 9.36 1.29 4.44
VISUAL SUSTAINED 24.45 8.45 24.22 9.22
AUDITORY SUSTAINED 22.91 11.18 23.22 11.44
DUAL TASK 9.45 9.09 10.44 10.33
VERBAL OPPOSITES 1.24 9.36 1.37 8.00
COUNTERPOINTING 1.36 5.27 1.24 8.11
BALLOON SORTING 39.82 7.91 41.67 7.56
TOTAL SCORE - 8.47 - 8.29
Performance across tests can be compared using age-scaled scores, since these place all tests on
the same scale. Differences in performance across tests and groups were examined using a
mixed ANOVA with one within-subjects variable (Test, 8 levels) and one between subjects
variable (Group, 2 levels). There was a significant main effect of Test (F(7,126) = 5.92, p<.001)
and significant Group x Test interaction (F(7,126) = 3.04, p<.01). There was no overall effect of
Group on performance, suggesting that neither group was significantly better overall. Indeed,
there was very little difference in the groups’ mean scaled scores (see table 17). Figure 22 plots
mean age scaled scores for each group across the subtests, demonstrating the Group x Test
interaction.
Performance is similar across groups in the case of most of the 8 subtests. Substantial
differences between groups are seen, however, on the Flanker task, where the DS group perform
much worse than the WS group, and on the Counterpointing task, where the reverse pattern is
observed. Indeed, on individual t-tests examining the effect of group for each subtest, only
Flanker performance differed significantly between groups (t(18) = 4.63, p<.001). The
difference in performance on the Counterpointing test did not quite reach significance (t( 18) = -
172

1.86, p=.079). There were no significant differences between groups on any o f the other
subtests.
£o0 (/)"D0)TOO(/>10)O)TOcTO<1)
Subtest
oTO<DCO
<1)cTO "Ou
<
TOrsQ
TO ■*->c-Q o0) Q .> >_
£c13OO
Selective Sustained Control
Figure 22: Mean age-scaled scores for each group across each of the 8 subtests. Error bars
represent standard errors. Labels below the subtest names show the constructs hypothesised to
be involved in performance on these tasks.
Figure 23 plots individual scaled scores for each child on each subtest, against indicators of the
50th, 15th and 5th percentiles. From this data it is possible to determine the percentage of children
in each group falling below the 5th and 15th percentiles. Even taking the more conservative
criterion for poor performance (the 5th percentile), a considerable proportion of the WS group
perform below this level on the Counterpointing (54.5%), Visual Search (27.3%), Balloon
Sorting (27.3%), and Visual Sustained (18.2%) subtests; and a considerable proportion of the DS
group fall below this level on the Flanker Task (66.7%), Visual Search (44.4%), and the Visual
Sustained, Verbal Opposites, Counterpointing and Balloon Sorting tasks (all 22.2%).
173

LUq:0 o wQLU_ l<O(/)1LUo<
18
16
14 -
12 -
10 -
6 -
4 -
• WS* DS
•Mi 1
••• M ii A — A • •
M fiii A A A A A A A
— A A A A • • M ii
--------- »*-----------------------~ --------M i------- 50th PERCENTILE• A MM • A
•AA A MA M «AA
- • -------------------------aa-------- MAiA----------------------a--------15th PERCENTILE
— 5th PERCENTILE
X Q o * CO oo CO LU LU CO LU 2a: < Z z < P<LU
p o : £ £
p—1
coo
PZ
to LU CO CO < 0 . O—1 * 3 3 3 0 . 0L< z CO CO Q o cc3CO>
5LL
_J<3CO>
>-Xopo3
—1<COa :LU>
LUPz3oo
-SUBTEST
Figure 23: Individual age-scaled scores for each child plotted by subtest. Each blue dot
represents a WS child; each red triangle represents a DS child. Dashed lines show the 50th, 15th
and 5th percentiles.
174

VISUAL SEARCH
12
o 10
8
64
5 6 MA
FLANKER TASK
—J .6
■£1.5o
^1.4
VISUAL SUSTAINED AUDITORY SUSTAINED
ocoO
1.3
•1.2 <D:il.1
1.02 3 4 5 6 878
20
MA MA MA
DUAL TASK VERBAL OPPOSITES COUNTERPOINTING
10
8ow 6
MA
2.2 22
220
01.1
£ 1.6 £ 1.6
0 1 .4 0 1 .4
.2h- AA
1.08 2 3 5 6 7 84
MA MA
BALLOON SORTING60
50_w03
r 40TOOI-
30
20
MA
Figure 23: Raw scores on each subtest plotted against the expected trajectory for typical performance (from normalisation data for 3-6 year-olds, see
chapter 4). The typical trajectory for Visual Search, Visual Sustained and Counterpointing also shows data from typically-developing 2V1-3 year-olds
(see chapter 5.3). Note that low scores reflect better performance on Flanker, Verbal Opposites, Counterpointing and Balloon Sorting. Each blue dot
represents the performance of a WS child, and each red triangle represents the performance of a DS child.
175

Figure 23 shows raw scores for each individual child, plotted against developmental age.
Also shown is a line representing the trajectory of performance in typically-developing
children, taken from the normalisation data. In the WS group, only one subtest showed a
significant correlation with MA (Visual Search, r = .747, p<.01). Two other subtests
showed moderate correlations with MA, which did not reach significance in this small
sample (Flanker Task, r = -.468; Counterpointing, r = -.498) and one subtest showed a weak
correlation (Verbal Opposites, r = -.320). In the DS group, none of the correlations of raw
score with MA reached significance, although there were a number of weak-moderate
correlations (Visual Search, r = .469; Dual Task, r = -.382; Counterpointing, r = -.395;
Balloon Sorting, r = .421). Note that two of these correlations are not in the expected
direction (Dual Task and Balloon Sorting), suggesting poorer performance with increasing
MA.
Examining the success of the battery with WS and DS children
In the pilot stages of test development for the new battery (described in Chapter 3), tests
were partly judged according the success with which they could be administered to children
of the target age range. The usefulness of the battery for WS and DS children was examined
using data from all the children seen on these tests (described above in Participants). Test
success was judged by looking at the number of children who were able to understand and
attempt each subtest in each of the two groups. Note that not all tasks were attempted with
all children for practical reasons, so group numbers vary a little across tasks.
In the DS group, two of the subtests did not have any failures or refusals (i.e. all children
who attempted them were able to complete them successfully): these were Visual Search
and Visual Sustained (n=16 in both cases). Each of the remaining tests had just one failure
176

or refusal, broken down as follows: on the Flanker task (n=16) one child failed to
understand task requirements; on both Auditory Sustained (n=13) and Dual Task (n=l 1) one
child did not have adequate language competence to participate; on Verbal Opposites (n=15)
one child failed to understand task requirements; and on both Counterpointing (n=16) and
Balloon Sorting (n=12) one child refused to cooperate.
In the WS group, five of the subtests showed no failures or refusals: these were Visual
Search (n=17), and Flanker, Visual Sustained, Verbal Opposites and Balloon Sorting (n=15
in all cases). Each of the remaining tests had some failures or refusals, broken down as
follows: on the Auditory Sustained attention task (n=16) one child did not have adequate
language competence to complete the task; on the Dual Task (n=15) two children failed to
understand the task requirement and one had inadequate language competence; and on the
Counterpointing task (n=16) one child refused to cooperate. One additional child refused to
complete any tasks after the Visual Search and Visual Sustained, and several other WS
children were seen who were particularly low-functioning and therefore unable to attempt
any of the attention tests. The tests were also unsuitable for a couple of additional children,
who were particularly high-functioning, and performed at or near ceiling on these tests.
These children, and all others who failed to complete all eight subtests, were not included in
the analysis of attention profiles described above.
Discussion
Overall, administration of the new attention battery was successful, provided children were
functioning in the appropriate age range. A number of children were unable or unwilling to
complete particular subtests, but in the vast majority of cases tasks were administered
successfully. Problems with using the TEA-Ch to assess attention in WS were discussed in
177

section 6.2. Even when children in that study completed the tasks, it was often unclear
whether their performance reflected attention rather than non-attentional processes. The
contribution of non-attentional processes to performance in the current battery has been
minimised as far as possible, and indeed it was rare to observe instances during testing
where non-attentional processes (e.g. motor skills, memory, number skills) appeared to be
influencing performance. The new preschool attention battery provided a more suitable
assessment of attention in WS and DS, allowing more reliable conclusions to be drawn
about patterns of attention impairment in these groups.
Both WS and DS children showed some deficit in overall attention abilities relative to norms
for their mental age. The WS group had an average mean attention score of 8.47 and the DS
group a score of 8.29, relative to normal mean score of 10. However, performance was not
impaired across all attention subtests, but specifically affected in certain areas. For the DS
group, performance on the sustained attention tests was in line with mental age, but there
was some impairment on tests of attentional control, and relatively severe impairment on
tests of selective attention. Like the DS group, the WS group showed relatively good
sustained attention performance (although this was better on the Auditory task than on the
other sustained attention measures). The WS group also show relatively good performance
on the Verbal Opposites and Flanker tasks, with much poorer performance on the Balloon
Sorting, Visual Search and Counterpointing tasks.
Indeed, for the WS group performance was significantly worse than the level expected for
their MA on Visual Search and Counterpointing (and marginally worse on Balloon Sorting).
For the DS group, performance was significantly worse than the expected MA level for
Flanker and Balloon Sorting (and marginally worse for Visual Search). Patterns of
attentional impairment across these two groups were therefore very similar, but with two
178

interesting exceptions. The DS group performed much worse on the Flanker task, whilst the
WS performed much worse on the Counterpointing task.
In terms of relative strengths then, both groups performed well on the tests of sustained
attention. It would seem that the simple act of maintaining attention to a stimulus is less
affected in WS and DS than other aspects of attention. Indeed, it is well known that children
from both of these groups, but especially WS, are capable of attending eagerly to items of
particular interest. They often have obsessional interests and hobbies, and can be fascinated
by particular objects (e.g. washing machines). In a recent questionnaire study of 227 WS
children and adults, Anker, Atkinson and Braddick (personal communication) found that
over 75% showed some obsessional behaviour or had an obsessional interest. It would seem
that attention problems in everyday life in these groups are less likely to be caused by an
inability to maintain attentional focus, but rather by a problem with selecting the appropriate
stimuli to focus on and controlling inappropriate responses.
Previous studies have presented a somewhat mixed picture of sustained attention ability in
WS and DS. Brown et al (2003) found deficits in sustained attention phases during play for
DS toddlers, but not for WS toddlers. Sustained attention was the least affected attention
component in a study by Munir et al (2000), with no difference in the number of targets
found between DS children and controls, but Rowe et al (2006) did find impairments on
their sustained attention task. However, Rowe et al (2006) used a cancellation task as their
measure of sustained attention. This task is essentially a visual search, with trials lasting
between 30 and 60 seconds, so may be accessing processes of selective attention rather than,
or in addition to, sustained attention.
179

It is also interesting to note that the children in this study generally performed better on the
test of auditory sustained attention than they did on the test of visual sustained attention,
which is different to the pattern seen in typically-developing children. Age-scaled scores
were higher on the Auditory Sustained subtest for both groups, and although raw scores
were still somewhat higher overall on the Visual task, the difference between the two
subtests was much less than in the typical sample. This typical pattern of superior visual
sustained attention over auditory sustained attention has also been observed in other studies
(e.g. Aylward et al, 2002; Borgaro et al, 2003). This result would seem to suggest
something of a weakness for visual attention relative to auditory attention in WS and DS.
This is an interesting result, especially given that it applies to both groups despite
differences in their strengths and weaknesses in visual and verbal tasks, and would be worth
further investigation.
In terms of relative weaknesses, both groups performed badly on the Balloon Sorting test
and the Visual Search task. The Balloon Sorting result is consistent with previous reports of
problematic attentional switching in DS (Munir et al, 2000; Comish et al, 2002) and
attentional control in WS (Atkinson et al, 2003), whilst poor Visual Search performance
confirms previous findings of a selective attention deficit in both WS (Scerif et al, 2004;
Montfoort et al, 2007) and DS (Munir et al, 2000; Comish et al, 2002). A selective attention
deficit may also contribute to poor performance on the Balloon Sorting task. Analysis of
data from the normalisation sample (see chapter 4) suggested that both selective and
executive elements of attention are involved in performance on this task.
These results all suggest a similar attention profile in WS and DS. However, there were
differences on the Counterpointing and Flanker tasks, which might be representative of
fundamental differences in how attention is affected in these groups. WS children showed
180

poor motor inhibition on the Counterpointing task, but much better verbal inhibition on the
Verbal Opposites task, a similar pattern to that observed by Atkinson et al (2003). Previous
studies in both WS and DS have suggested that deficits in executive attention might emerge
predominantly on tasks that use materials or responses from domains that represent a
particular weakness in that disorder (i.e. the visuo-spatial domain in WS, and the language
domain in DS). This seems to hold for the WS children in this study, but not for the DS
children, who showed roughly equivalent performance on the verbal and motor inhibition
tasks. It has been suggested that attention impairments in WS are associated with deficits in
the dorsal stream, which is involved in visuo-spatial processing, particularly spatially-
directed action (e.g. Atkinson et al, 2003). The results of the current study, where
impairments in WS have been observed primarily on visuo-spatial tasks, are consistent with
this hypothesis.
The other dissociation between groups appears on the Flanker task, where DS children
perform particularly poorly. Whilst this might simply reflect a greater selective attention
deficit in DS, as emphasised by previous studies, it might also relate to the differences in
global versus local processing in WS and DS (Porter & Coltheart, 2006; Bihrle et al, 1989).
Individuals with DS tend to show a global processing bias (i.e. focus on the overall form of
an image at the expense of its constituent parts), whilst individuals with WS tend to show a
local processing bias (i.e. focus on constituent parts at the expense of the overall image). In
the Flanker task, it is necessary to focus attention on the individual elements rather than the
overall display, which could account for the WS advantage in this task. A global bias might
encourage responding in line with the dominant facing direction in each display, which on
incongruent trials would be the two animals facing the incorrect direction, whereas a more
local bias would encourage responding to individual target items.
181

Even on tasks where performance is impaired in both groups to a similar degree, it is
necessary to consider the possibility that there are different underlying processes responsible
for the impairment. For example, on Visual Search, the DS children might perform poorly
because they have difficulty selecting out the relevant information, whilst the WS children
might perform poorly because the task requires a selective visuo-spatial response. This
highlights the need for future work to investigate these processes at the cognitive level as
well as the behavioural level. However, this study is the first to compare broad profiles of
attention function in these two developmental disorders, and provides vital insights into the
fundamental problems of attention in these groups.
In particular, these findings have important implications for the education of children with
WS and DS. Understanding what causes their everyday attention problems will mean that
interventions can be better tailored to their strengths and weaknesses. When a child is
described as having problems ‘paying attention’, it might be assumed that they are simply
unable to stay on task for any length of time. However, this does not appear to be the case
for children with WS or DS, who sustained attention relatively well in this study. Granted,
their task in the sustained attention tests was relatively simple, and conducted in a controlled
examination environment, but the result demonstrates an ability to sustain attention that
exceeds their abilities in other attention tasks. The attention difficulties emerging in
everyday life seem more likely to stem from a tendency to direct attention to the wrong
aspects of a situation, to be easily distracted, and to respond impulsively.
There are a number of limitations to this study. For example, the groups of WS and DS
children are relatively small. The fact that WS is a rare condition means that sample sizes
are often small in studies of WS individuals. However, the validity and reliability of results
in this study would benefit from somewhat increased sample sizes, especially given that
182

both populations can be rather variable in their performance. Also, WS and DS children
were not individually matched to each other or to controls, a process that might benefit
statistical comparison across groups. A particular disadvantage of the current method was
that some scaled scores were derived from the closest available age band. Results might
therefore underestimate impairments, because performance is judged relative to younger
baseline, especially for the WS group where this was necessary in a greater number of cases.
However, raw scores are shown in table 2 and these seem to support the overall pattern of
results presented here. Indeed, data were also analysed by comparing raw scores with those
of a matched control group, selected from the existing normalisation data, and this approach
yielded exactly the same pattern of results as presented above. Nonetheless, a study is
currently underway using larger groups and controlling for these issues in order to further
investigate attention profiles in these children.
183

Chapter 7
General Discussion
184

7. General Discussion
The studies described in this thesis set out to examine the structure and function of attention
in typical and atypical development, in relation to a hypothesised model of attention
functions comprising distinct components of selective attention, sustained attention and
attentional control. Psychologists, cognitive neuroscientists and clinicians have long
acknowledged the separability of attention into component functions. Performance on
cognitive and neuropsychological tasks, in both adults and children, has been differentiated
according to underlying attention functions using factor analysis. The developmental course
for different aspects of attention also appears to vary. Finally, imaging studies have
suggested distinct brain networks for different components of attention, and some evidence
suggests differential impairment of functions in clinical populations. In comparison with
this extensive literature, very little research has investigated the structure and function of
attention in early childhood, despite considerable changes in cognitive functioning over this
period.
This thesis addressed three main objectives: (i) the development of a new battery of tests for
assessing multiple components of attention in preschool-age children, (ii) an examination of
the structure and development of attention components in typically-developing children
aged between 3 and 6 years, and (iii) an investigation of attention profiles in children with
Williams syndrome and Down’s syndrome in comparison to normal development.
7.1 Summary of findings
• An attention battery suitable for children aged 3-6 years was successfully developed
(chapters 3 and 4), with some measures suitable even for children as young as 2Vi years
185

of age (chapter 5.3). Performance on the new attention battery correlated moderately
with parent/teacher ratings (chapter 5.1), and strongly with later TEA-Ch performance
(chapter 5.2). Finally, individual subtests, and the battery as a whole, showed good
internal reliability (chapter 5.4).
• On the whole, subtests from the battery were sensitive to development with age, and
showed some evidence for different developmental trajectories across components
(chapter 4).
• EFA supported a three-factor solution overall (though different from the hypothesised
model), a two-factor solution for the younger children, and a three-factor solution for the
older children. CFA suggested that a one-factor solution was adequate to explain the
data for the group as a whole and for the younger half of the sample, but supported the
hypothesised 3-factor model for the older children (although modified to include two
additional paths) (chapter 4).
• Children with WS performed poorly across a range of tests from the TEA-Ch, although
their performance may have been limited by additional non-attentional factors (chapter
6.1). Both WS and DS children showed attention impairments on the new attention
battery, although these were specific to certain subtests and components (chapter 6.2).
The groups shared common relative strengths on tests of sustained attention, and
common relative weaknesses on tests of visual search and set-shifting. However,
inhibition of a visuo-spatial response was most severely impaired in WS, whilst
selective attention on a Flanker task was most severely impaired in DS.
7.2 Developing an attention battery for preschoolers: measurement issues
Chapter 3 illustrates some of the complexities associated with the test development process
and the issues that need to be considered in relation to (i) measuring complex functions like
186
attention, and (ii) assessing these functions in young children. Although issues of validity
and reliability were addressed via an extensive piloting process, a number of additional
measurement issues became apparent during these pilot stages and subsequent applications
of the complete battery.
Sensitivity and specificity
The measures in the new attention battery were expected to be sensitive to changes in
performance with development. All measures, with the exception of the Balloon Sorting
task, showed a significant trend for improvement with age. The fact that scores on the
Balloon Sorting task did not improve over this age range does not necessarily mean that this
test lacks sensitivity. This task was designed with the assumption that scores would reflect
the capacity for attentional shifting (i.e. moving the focus of attention from one dimension to
another and avoiding perseveration). Development of these abilities may actually be limited
over the age range tested, with major improvements occurring before 3 years or after 6 years
of age. Chapter 4 has considered in some detail the possibility that a lack of specificity
might account for the absence of age effects on this task, although this seems unlikely given
that the task consistently loaded with other attention measures in the factor analyses.
However, it may be necessary to consider a different scoring system that might increase the
sensitivity of this task to changes in over development.
The question of specificity (i.e. whether scores on a task exclusively, or at least
predominantly, reflect the intended function) applies across the battery. All of the tasks
involve certain perceptual, cognitive and behavioural processes in addition to any attentional
requirements. However, we can be reasonably confident that these non-attentional demands
will have a minimal effect on performance. Three of the tasks (Flanker, Verbal Opposites,
and Counterpointing) incorporate a control condition, which is identical to the test condition
187

in terms of the non-attentional demand. By considering the difference between these
conditions, the critical score should give a measure that reflects only the attentional
component of the task. The Visual Search task includes a control search, which requires
location of targets differentiated on the basis of a single feature rather than a conjunction of
features, removing much of the attentional demand. Although this was not incorporated into
the critical score for typically-developing children in the normalisation sample (where motor
skills were unlikely to be a limiting factor), it would be available as an extra measure for any
child who seemed to show particularly poor performance on this task. For example,
administering this control search to a child with major motor difficulties would give the
examiner some insight into how much their search performance might be affected by these
difficulties. Finally, the three sustained attention tests are already very simple tasks,
involving limited non-attentional demands. They are perceptually undemanding, with little
requirement for memory or other cognitive processing beyond the basic task instruction, and
the naming response is simple for children in this age range.
Less clear, however, is the extent to which performance on these tasks might be influenced
by attentional functions other than the one that they were designed to assess. It is likely that
all of the tasks in the new battery depend, at least to some extent, on more than one of the
hypothesised attention components. For example, the selective and sustained attention tasks
may require inhibition of responses to non-targets, and several, if not all, of the tests in the
battery are likely to require a degree of sustained attention in addition to other functions.
Although factor analysis can be used to provide information about the processes underlying
performance on particular tests, confirmatory techniques make the assumption that the tasks
selected tap the intended functions. The initial selection of tests as measures of particular
functions was therefore supported by existing literature, including neuroanatomical and
clinical approaches in addition to cognitive-behavioural data.
188

Even so, exploratory factor analysis of the data suggested certain cross-loadings for
particular functions, including roles for selective attention in the Balloon Sorting task, and
attentional control in the Dual Task. Only one measure, Verbal Opposites, consistently
loaded on an unpredicted factor in the EFA. This factor was still interpreted as a sustained
attention factor, with the assumption that sustaining attention was more important in the
Verbal Opposites task than response inhibition. This assumption was not made without
some support in the literature for the role of sustained attention in inhibitory tasks (e.g.
Manly et al’s Walk Don’t Walk task, which is described as a sustained attention), however it
deviated from hypothesised ideas about underlying functions in this task. Actually, these
loadings might provide us with a more complete picture of sustained attention, since the
tasks seem to reflect different aspects of the concept. Whilst CPTs, like the Visual and
Auditory Sustained tasks in the current battery, require vigilance (i.e. monitoring with a
relatively low information load), tasks like Verbal Opposites require concentration (i.e.
sustaining attention with a relatively high information load). However, it remains that this
result did not confirm the hypothesised loadings, and interpretations of performance on this
task will need to take this into account. It is worth noting, however, that a model specifying
this task as an attentional control measure nevertheless fitted well in CFA from the age of
414 years, suggesting that performance is not completely independent of the hypothesised
network. .
Construct validity
The validity of the battery as an indicator of attentional ability was further examined by (i)
comparing test scores against parent or teacher ratings of attention; and (ii) comparing
performance on the new battery with later performance on the Test of Everyday Attention
for Children (TEA-Ch). Overall performance on the new battery was significantly
189

correlated with overall scores on the parent/teacher rating scales. However, these
correlations were small to moderate in magnitude, and correlations with individual subtests
were largely non-significant. This is perhaps unsurprising given the differences between
these types of measure (discussed in detail in chapter 5). Given that these tasks appear to
access different sources of variability in attention, there is an argument for including both
approaches in the assessment of childhood attention.
Indeed, the new battery was able to discriminate between children defined as having good or
poor attention on the rating scale, which supports its utility in a clinical context. Further, it
seems that the selective and executive attention tasks might be most useful for identifying
children who show everyday attention problems. Another interesting feature of this data
was a group of children who performed relatively poorly on the attention test battery, but
received parent/teacher ratings in the normal range. It would be valuable to follow up these
children in order to establish whether the attention tests are {a) falsely identifying children
who actually have good attention, or (b) correctly identifying attention problems in children
who, for whatever reason, do not show observable difficulties at home or in the classroom.
The latter case would further support the value of performance tasks in the early
identification of attention difficulties, although, conversely, the former case would be a
warning against making long-term inferences from the results of preschool assessment, at
least when behaviour in other contexts is normal.
Scores on the new preschool battery were also strongly correlated with performance on the
TEA-Ch, administered around one year later. Whilst there was good overall correspondence
between the batteries, the sustained attention measures from the new battery were more
strongly predictive of later TEA-Ch than the selective or control measures. Various
explanations for this effect have been considered, including the possibility that early
190

sustained attention abilities act as a precursor for later attention abilities of different types.
It seems unlikely that this effect is explained simply by the nature of the tasks, since the
Visual Search and Verbal Opposites tasks closely correspond to measures in the TEA-Ch,
but show much weaker relationships. It might also be the case that performance on the early
sustained attention tasks is more reliable than performance on the other new attention tasks,
and shows stronger relationships with later attention performance for this reason. Tracing
the structure of attention across the lifespan will depend on an understanding of how the
measures used at different stages of development relate to each other, and these relationships
should be further explored.
On the whole, the available data supports the new battery as a reliable and valid tool for
assessing attention in early childhood. This supports its subsequent application in the study
of attention in typical and atypical development.
7.3 Attention in typical development
Developmental trajectories
Comparison across the age range showed improvements in the functioning of all attention
components with age. However, there were differences in terms of the age at which major
improvements were seen. The two tasks designed to test selective attention showed
different trajectories of development. For selective attention, the Visual Search task showed
significant improvements between each of the three age groups (i.e. five-year-olds were
better than four-year-olds, and four-year-olds were better than three-year-olds), whilst the
Flanker Task showed greater improvement between 4 and 5 years. For the three sustained
attention tasks, significant improvements in performance were apparent between each of the
three age groups, suggesting steadier development of these abilities over the age range.
Both Verbal Opposites and Counterpointing tasks, designed to test response inhibition,
191

showed significant development between 3 and 4 years, but less improvement between 4
and 5 years. This result suggests greater improvements in inhibitory skills during the early
part of this age range.
It will always be difficult to compare developmental trajectories with tasks of this kind,
since they use different measurement scales and are likely to show different levels of overall
difficulty, which will affect the levelling of performance at ceiling and floor. Comparisons
with existing studies, which again use different tasks across a different age range, are also
complicated. Often these studies have looked at the age at which adult levels of
performance are reached, trajectories for which might be quite different to changes over the
preschool age range. However, these data do support differences in developmental
trajectories for different tasks / components, and provide information on the developmental
course of attention functions at an earlier part of the age range.
Examining the hypothesised attention model
A model of attention including functions of selective attention, sustained attention and
attentional control has been hypothesised on the basis of evidence from existing studies of
adults and school-age children. Manly et al (2001) supported this model across their age
range of 6-16 years. They concluded that the hypothesised attention structure was in place
by 6 years of age, or at least by the 6-11 year stage, since their youngest group consisted of
this fairly broad range. However, these results from the current study suggest that important
changes in the organisation of attention take place over the preschool years, with the gradual
emergence of an attention system similar to that observed in adults. We know that there is
considerable development in early childhood of the brain regions that support adult attention
systems (see, for example, Anderson, 1998), and this period of development may represent a
critical stage in the emergence of a structurally mature attention system.
192

However, there are alternative explanations that ought to be considered. One possibility is
that this system is always in place, or emerges prior to three years, and that some other
cognitive function is the limiting factor for performance, accounting for the unitary
explanation in the 3-414 year-olds. Performance in these younger children may be limited
by a cognitive function that influences all of these tasks (for example, basic processing
speed or working memory). As cognitive capabilities develop, these factors might become
less limiting, allowing performance to be driven more specifically by individual attention
networks. In the current study, there was evidence to support a unitary explanation of
performance to a certain degree even in the older children. This might reflect the residual
influence of some non-attentional process that was dominant earlier in development, and
further research will be necessary to explore whether processes of this kind underlie these
differences across the age range.
Of course, this result could also reflect a unitary attentional explanation. Whilst there is
considerable evidence from existing studies to support an attention system comprised of
separable networks, some studies have sometimes failed to support this hypothesis. Strauss
et al (2000) used confirmatory factor analysis to re-analyse Mirsky et al’s (1991) adult data,
plus data from a new group of participants on the same measures, and failed to support the
hypothesised model in either case. Wilding et al (2001) also failed to support a three-factor
model of attention in their group of boys aged around 10 years, with data instead yielding a
two-factor solution that did not reflect the hypothesised divisions in any clear way. In some
cases, even the conclusions from studies that have supported the hypothesised attention
model also need to be interpreted with caution. In Mirsky et al’s (1991) study, for example,
multiple indicators for the sustain and shift components came from the same task (a CPT
and the WCST respectively), making it difficult to discriminate between method and trait
193

variance. The current study has attempted to avoid these issues as far as possible, by using
multiple indicators from different tasks, and considering different methods of analysis.
Although the possibility of a unitary explanation cannot be entirely ruled out, there is strong
evidence from both exploratory and confirmatory methods to suggest that, by the second
half of this age range, attention processes are differentiated in much the predicted way.
As research in this area develops, however, we may need to be more flexible about the idea
of attention structure. This thesis has followed a model set out in the literature,
distinguishing three particular functions of attention. However, this may turn out to be too
rigid a conceptualisation. For example, there are likely to be individual differences in the
organisation of attention, such that one person’s performance on task X is primarily driven
by function X, whilst another’s is driven by function Y. Posner and colleagues (e.g. Rueda
et al, 2005; Posner et al, 2007) have already begun to explore individual differences in
attention networks, using their Attention Networks Test (ANT), by investigating the genes
associated with variability in performance. It is possible that individual differences, as
observed in the efficiency of attention functions by Posner and colleagues, might extend to
the organisation of functions and the interactions between them. In this case, a single
attention model based on data from behavioural studies might not be sufficient to explain
attention and its development.
This research nonetheless represents an important advance on previous work. No existing
study had examined the hypothesised attention model in children as young as three years.
The current study provides novel data on changes in the organisation of attention over early
childhood, highlighting the importance of this period in the emergence of a mature attention
system.
194

Neural mechanisms for attention in typical development
Recent advances in brain imaging methods permit detailed but non-invasive assessment of
human brain structure in vivo, even in children. It is well established that brain development
and cognitive maturation occur concurrently during childhood and adolescence (e.g. Casey
et al, 2005). Cortical maturation follows a sequence in which the regions associated with
more basic sensori-motor functions mature first, followed by temporal and parietal areas
associated with basic language and attention skills, then areas such as preffontal cortex
(PFC) and lateral temporal cortices, responsible for higher-order control processes (e.g.
Gogtay et al, 2004; Sowell et al, 2003). Maturation of these areas involves changes in
structural architecture including synaptic pruning, which occurs primarily during early
childhood, and myelination, which peaks in early childhood but continues well into
adulthood (e.g. Carmody et al, 2004). The degree of change during early childhood marks
this period out as a significant point in the development of cognitive function, a possibility
that has been supported by behavioural data in the current study. These structural changes
have been found to correlate with behavioural performance measures in a number of areas,
including working memory (e.g. Sowell et al, 2001; Nagy, Westerberg & Klingberg, 2004)
and executive control (e.g. Casey et al, 1997), and they are likely to be associated with
development of attentional processes observed in the current study.
Studies reyiewed in the introduction have shown distinct neural networks for different
attention functions. To recap, selective attention has been linked with temporal and parietal
regions, sustained attention with a right fronto-parietal network, and executive attention with
the PFC and anterior cingulate. Similar areas are recruited to perform these functions in
children, though often less efficiently and with greater activation in other brain regions (e.g.
Casey et al, 1997; Bunge et al, 2002; Durston et al, 2002, Konrad et al, 2005). Given the
differences in maturation of brain regions described above, we might expect related
195

differences in the components of attention examined in this study. Some evidence for
differences in the development of these components was observed, however, this does not
entirely reflect the sequence for maturation of associated brain regions. For example, tasks
involving inhibition of a prepotent response, showed greatest development earlier in the age
range in the tests from the current battery, despite later maturation of prefrontal areas linked
with EFs such as inhibition. Inhibition, however, is considered to be a relatively simpler
function than other EFs such as planning and set-shifting. Somewhat later development for
these abilities might explain the absence of a significant age trend over this age range on the
Balloon Sorting task, which requires these higher-order functions.
In light of the current findings, research linking attention functions with neuroanatomy will
need to be extended to include attention structure and its neuroanatomy. Future research
will need to investigate whether these changes in the organisation of attention components
in early childhood are associated with particular patterns of brain maturation. The shift from
a one-component to a three-component attention system may be associated with increased
recruitment of the specific networks associated with particular attention functions. Studies
comparing neuroanatomy in adults and older children (e.g. Casey et al, 1997; Bunge et al,
2002; Konrad et al, 2005) now need to be extended to include this part of the age range,
where it seems that substantial changes are occurring in the attention system.
7.4 Attention in atypical development
The first study in this section suggested severe and widespread impairment of attention
functions in WS, according to performance on the TEA-Ch. However, the most important
conclusion drawn from this study was the need to consider whether measures are
appropriate for children with developmental disorders. This will require that the demand for
196

processes such as motor precision and number skills is minimised, as these can inflate the
degree of impairment if not adequately controlled. In the second study, measures from the
new battery proved to be much more suitable for the assessment of attention in children with
WS and DS. Results supported attention deficits in both groups, though performance was
not impaired across all attention subtests, but specifically affected in certain areas. Both
groups showed relatively better sustained attention performance, and relatively worse
performance on the selective and attentional control tasks. It is important to recognise that
for their chronological age, both groups of children showed substantial delays across all
subtests. However, some attention tasks are clearly problematic even relative to the degree
of general developmental delay.
The attention profile in WS and DS: relative strengths
Sustained attention represented a relative strength in both groups of children, especially the
DS group. In terms of maintaining attention to a stream of visual or auditory information, or
even both simultaneously in the case of the Dual Task, children performed largely in line
with typically-developing children of equivalent mental age. Although parent and teacher
reports for these groups suggest that they are ‘inattentive’, it would seem that the simple act
of maintaining attention is less problematic for these children than other aspects of attention.
Both groups also performed relatively well on the Verbal Opposites task, designed to assess
inhibition of a prepotent verbal response, suggesting that this ability is also a relative
strength in WS and DS. Interestingly, however, this task loaded with the three sustained
attention tasks in the normalisation EFA, and interpretation of that data considered the
possibility of attributing performance on this task to sustained attention abilities. If so, this
task might reflect a slightly different form of sustained attention (i.e. concentration with a
high information load rather than vigilance with a low information load), and represent
another indicator of good sustained attention abilities in WS and DS. Although researchers
197

are often interested in establishing impaired functions in developmental disorders,
understanding relative strengths is also vital, especially in relation to possible intervention
strategies.
The attention profile in WS and DS: relative weaknesses
In addition to strengths common to both groups, there are also a number of common
weaknesses. Both groups showed relatively poor performance on the Visual Search and
Balloon Sorting tasks. The former was designed to assess selective attention, and the latter
was designed to assess shifts of attentional focus, although the role of selective attention in
the sorting task has also been established in the normalisation study of these measures.
These results confirm previous findings of impaired visual search performance in children
from bo,th groups (e.g. Scerif et al, 2004; Munir et al, 2000), and deficits in WCST
performance in DS adults (Comish et al, 2001).
Particularly interesting, though, are the areas where these two groups show different
weaknesses. WS children performed most poorly on the Counterpointing task, whilst the
DS children performed most poorly on the Flanker task. These differences might be
characteristic of a disparity in the fundamental attention impairment in each group. In this
study, all of the tasks that were problematic for children with DS included some requirement
for selective attention, suggesting that this represents a particular difficulty for these
children. In contrast, the tasks on which there were impairments in the WS group seem to
reflect more varied attentional demands (i.e. selective attention, motor inhibition,
switching), at least if the hypothesised functions are responsible for performance. Previous
research has considered the possibility that impairments in WS are determined by an
interaction with weaknesses in visuo-spatial processing, and the results from the current
study would seem to support this possibility. Further, this is likely to reflect an interaction
198

of attentional and visuo-spatial processes rather than a simple visuo-spatial effect, since
these tasks incorporated control elements which should discount a purely non-attentional
account of performance.
It is important to think about the processes underlying performance even in areas where
groups show similar performance. In the current study, both groups showed impairments on
the Visual Search task, but this might not reflect a common underlying deficit. For example,
the DS group might fail this task because of a problem at the input stage (i.e. selecting out
relevant information), whilst the WS group might fail because of a problem at the response
stage (i.e. executing a selective visuo-spatial response). This is speculative, but a possibility
that should be investigated, perhaps by examining performance on a search task that did not
require a visuo-motor response. Even when scores are in the normal range in developmental
disorders, performance may not be achieved via the same process as in typical development.
Indeed, there is evidence for this from studies of both language and face processing in WS
(Deruelle et al, 1999; Karmiloff-Smith, 1998). There is an argument, therefore, for
examining the method by which a score is reached, even if performance looks normal.
Though much of this discussion has focussed on the possibility that the primary deficit
differs between groups, it is possible that the same process accounts for performance across
groups, even when the profile looks completely different. For the Flanker task, we have
considered the possibility that the relatively good WS scores and the relatively poor DS
scores are the result of local and global processing biases respectively. Here, a common
process might account for performance in both cases, with different outcomes due to
differences in the direction of the bias. Although the idea of distinct profiles of cognitive
functions for different developmental disorders is appealing, an accurate picture of these
disorders is likely to require a more flexible approach in which researchers acknowledge
199

similarities between groups as well as differences. To account for the considerable
variability in phenotypes for developmental disorders, it may even be necessary to take a
continuum-based view rather than attempting to fit all of these children into discrete
categories.
Neural basis for attention profiles in WS and DS
Does abnormal brain development in WS and DS explain the profiles of attention
impairment observed in these groups? In the current study, children with WS and DS were
most impaired on tasks that depend on parietal and frontal attention networks. Selective
attention tasks, including visual search and flanker tasks, have been consistently associated
with a parietal network in typical development (e.g. Donner et al, 2002; Nobre et al, 2003;
Booth et al, 2004; Casey et al, 2000), whilst motor inhibition and set-shifting have been
linked with an anterior attention network involving the PFC and anterior cingulate (e.g.
Cabeza & Nyberg, 2000, Owen et al, 1991).
In neuroanatomical studies of WS and DS, both groups have been found to show reduced
overall brain volume, plus different patterns of regional abnormalities. In DS, smaller
overall brain volumes are accompanied by disproportionately smaller cerebellar, brainstem,
frontal lobe, and hippocampal volumes (Kesslak et al, 1994; Raz et al, 1995; Aylward et al,
1997). Similar volume reductions have been reported in studies of DS children (e.g.
Jemigan et al, 1993; Pinter et al, 2003), with additional evidence for relative preservation of
parietal lobe grey matter. This finding has been associated with strengths in visuo-spatial
tasks in DS, but would seem somewhat anomalous with the selective attention deficits
observed in the current study. However, these tasks may require contributions from a more
anterior system, which is likely to be affected by reductions in frontal lobe volume.
200

In WS, reductions in grey matter and abnormal gyrification have been observed in parietal,
occipital and frontal regions in adults (Reiss et al, 2004; Eckert et al, 2005; Schmitt et al,
2002), with similar abnormalities of parieto-occipital regions observed in WS children
(Mercuri et al, 1997; Boddaert et al, 2006). The location of these abnormalities is consistent
with the suggestion of a dorsal stream in WS (Atkinson, King, Braddick, Noakes, Anker &
Braddick, 1997). It has been suggested that WS is associated with a specific deficit in dorsal
stream processing, supported by uneven performance on global form and motion tasks
(Atkinson et al, 1997, 2003) and the perceptual and visuo-motor conditions of the ‘post box’
task (Atkinson et al, 1997), plus severe deficits on all visuo-spatial tasks. Dorsal stream
deficits of this kind have also been identified in a number of other disorders, including
hemiplegia, autism, developmental dyslexia, and fragile X syndrome (FXS), leading to a
hypothesis of ‘dorsal stream vulnerability’ (e.g. Braddick, Atkinson & Wattam-Bell, 2003)
in many developmental disorders with distinct aetiologies.
We have considered the possibility that the attention profile of WS children in the current
study arises out of interactions with weak visuo-spatial processing. A dorsal stream deficit
in WS might therefore underlie some of the attentional difficulties experienced by this
group. However, taking a cross-syndrome perspective, this explanation may be too simple.
Groups of children who show similar dorsal stream deficits do not necessarily show the
same profile of attentional functions. For example, when tested on the same task, children
with WS have shown greater problems of selective attention compared with FXS children,
who show greater inhibitory problems (e.g. Scerif et al, 2004; Comish et al, 2007), despite
claims in both disorders of a fundamental dorsal stream problem that might underlie
attention difficulties (e.g. Atkinson et al, 2003; Kogan et al, 2004). Although there is still
some way to go in uncovering the relationships between the neural and behavioural level in
developmental disorders, studies are beginning to make considerable progress towards this
201

end. It is vital that more detailed mapping of cognitive profiles in these disorders is
accompanied by attempts to elucidate the neural processes involved, as well as the
interacting genetic and environmental factors that might influence outcomes at both levels.
Tracing developmental trajectories in developmental disorders
Developmental trajectories were examined in each of the studies reported here by looking at
correlations of task performance with mental age. In the TEA-Ch study, performance for
the WS children did not correlate with age (either CA or MA) on any of the measures,
suggesting limited development in comparison with typically-developing children, who
show significant developmental change over this age range (according to published norms).
On the new tasks, performance for both groups correlated with MA on a number of tasks.
The only strong correlation was for Visual Search performance in the WS group (r = .747),
indicating a level of developmental improvement similar to that seen in typically-developing
children. The WS children also showed moderate correlations with MA on the Flanker,
Counterpointing and Verbal Opposites tasks. The DS group showed improvement with MA
on the Visual Search task, although this correlation was smaller (.469) than in the WS group.
Performance on three other tasks (Counterpointing, Dual Task and Balloon Sorting) also
correlated moderately with age, though only the Counterpointing correlation indicated
improved performance with age. Correlations for the other two tasks suggested poorer
scores with increasing MA.
Whilst these data are somewhat limited by the small sample sizes involved in this study,
they do indicate that developmental trajectories for performance in these groups differ from
the trajectories seen in normal development. Children with these developmental disorders
do not appear to show a simple delay, but rather a more complex deviation from the typical
trajectory. However, this deviation seems to differ across tasks, with some tasks showing
202

development closer to the typical trajectory. Further, it seems that the two groups show
differences not only in the function of different attention components, but also in their
developmental course. These results also suggest that variability in performance in these
groups in largely unaccounted for by mental age. Future studies will need to examine
possible alternative sources of variance, a good account of which is likely to consider the
interplay between genetic and environmental factors.
Developmental trajectories can be further examined by comparing across studies conducted
at different stages in development. Figure 25 presents a summary of studies that have
looked at attention in WS and DS, including data from the studies presented in this thesis.
This summary highlights the importance of considering profiles of cognitive functions at
different stages of development. Looking at the data from studies of WS and DS infants and
toddlers, there would seem to be something of a double dissociation in that WS children
show impairments on selective aspects of attention (e.g. orienting, disengagement, visual
search) but not on sustained attention, whilst the reverse is true for children with DS.
However, the pattern is different later in childhood, where both groups appear to show a
relatively worse selective attention deficit, and less sustained attention impairment.
Although this is based on relatively limited data at the earlier stage of development, it would
suggest significant changes in the profile of attention between infancy and childhood.
In contrast, the profile from early childhood to later childhood and adolescence is somewhat
more consistent. Selective attention remains relatively more affected than sustained
attention in both groups. There is also evidence for deficits in attentional control at this age,
with some indication that visuo-spatial control is more problematic in WS, whilst verbal
control is more affected in DS. Attentional control has not yet been investigated in detail at
the infancy-toddlerhood stage. This and other gaps in the developmental trajectory (e.g.
203

attention in adults with WS) will need to be filled in future studies. Comparing studies in
this way begins to provide a better picture of attention in these disorders across the lifespan.
Combining the different approaches to developmental trajectories described here (i.e.
trajectories on a single task over a more limited age range and trajectories on different tasks
across the lifespan) will help us to understand the changes in these profiles over
development.
204

FUNCTION TASK WSImpaired
relative to TD controls?
DSImpaired
relative to TD controls?
INFANCY / TODDLERHOOD SELECTIVE orienting / disengagement refs 1-3 V X
visual search refs 2, 4 V X
SUSTAINED during play re f 3 X VCONTROL - --
EARLYCHILDHOOD SELECTIVE visual search refs 5, e V V
flanker task ref 5 X V
SUSTAINED CPT (visual, auditory, dual) re f 5 X X
CONTROL visuo-spatial inhibition refs 1, 5 V X
verbal inhibition refs 1, 5, 7 X ?
switching refs 5, 8 V VLATE CHILDHOOD 1 ADOLESCENCE SELECTIVE visual search re fs 9- n V V
SUSTAINED Score! (TEA-Ch) re f 9 ? - -
Vigilan (WATT) refs 10-11 -- X
CONTROL visuo-spatial inhibition refs 9-11 V X
verbal inhibition refs 9 ,1 0 X VADULTHOOD SELECTIVE map search (TEA) ref 12 -- V
SUSTAINED Elevator Counting (TEA) ref 12— V
CONTROL WCST re f 12 V
Figure 25: a summary of results from studies looking at attention in WS and DS. Ticks
represent impairment, and crosses represent no impairment, relative to MA-matched
typically-developing (TD) controls.
References:
1 Atkinson et al (2003) 5
2 Scerifetal (2004) 6
3 Brown et al (2003) 7
4 Cornish et al (2007) 8
Current study (6.2) 9
Montfoort et al (2007) 10
Nadel (2003) 11
Rowe et al (2006) 12
Current study (6.1)
Munir et al (2000)
Cornish et al (2007)
Cornish et al (2001)
205

7.5 The structure and function o f attention: a developm ental perspective
A central theme emerging from the work described in this thesis is the need to take a more
developmental perspective in the study of attention, in both typical and atypical populations.
It is clear that a complex and dynamic developmental process accounts for outcomes in the
organisation and efficiency of attention processes. As expected, the functioning of attention
processes improves over the early childhood years, but this thesis has provided evidence for
changes in the organisation of those processes also. Performance seems to be driven by
more distinct cognitive functions later in development than it is in the early preschool years.
Assuming equivalence to adult end-states is clearly not an appropriate approach to
understanding cognition in children, but even within childhood the possibility of
fundamental changes at different stages of development must be investigated fully. Future
research in this area will need to investigate this process in more detail, addressing questions
such as (i) what factors/ functions account for the apparent unitary performance in the earlier
part of this preschool age range, (ii) when attention performance shifts to become the
function of several distinct processes, and (iii) what other maturational changes might be
associated with this development of the attention system, particularly neuroanatomical
changes.
This developmental perspective is also vital in the study of developmental disorders. It is
not sufficient simply to state that individuals with a particular disorder are ‘impaired’ in
terms of function X and ‘normal’ in terms of function Y. These strengths and weaknesses
need to be qualified in terms of the developmental stage at which they apply. These
accounts also need to recognise that even ‘intact’ functions might follow an entirely
different course from normal development, and that common behavioural impairments
across groups might have different cognitive origins. Future research in this area will need
206

to explore the attention profiles identified in the current study in more detail, considering
how non-attentional processes are associated with developmental outcomes for attention.
Future work
Currently, an extension to the atypical attention research described in this thesis is
underway. This project will map attention profiles in a similar age range, using much larger
groups of WS and DS children. More extensive measures of non-attentional functions will
be taken in order to explore potential relationships with attention outcomes. In particular,
measures of dorsal and ventral stream functioning will be used to examine the hypothesised
relationship between dorsal stream deficits and attention processes. A further aim of this
research is to link findings from the study of typical attention structure with development in
WS and DS. This research will investigate whether WS and DS children show changes in
the organisation of attention with development similar to those observed in typically-
developing children in the current study.
207

APPENDICES
Appendix 1: Examples of test stimuli (chapter 3).
Appendix la: an example section taken from the pig-dog visual search task, which used real
pigs and dogs as targets, and merged pig/dogs as distractors. Items are to scale, but the real
search stimulus was larger, with 10 targets and 54 distractors in the first version, and 98
distractors in the second version.
208

Appendix lb: an example section taken from the visual search task using red apples as
targets, and white apples and red strawberries as distractors. Items are to scale, but the real
search stimulus was larger, with 18 targets and 162 distractors, presented on a laminated A3

Appendix lc: example of a non-conflict trial (top) and conflict trial (bottom) from the
Flanker task. Items are not to scale - in the real test they were presented on the computer
screen, and each item was approximately 7cm in width and 3.5cm in height.
Non-conflict trial
Conflict trial
210

Appendix Id: examples of stimuli used in the Visual Sustained attention task, in which five
different animals served as targets, and a selection o f everyday items familiar to children
served as non-targets. Items appeared one at a time in the centre of the screen
Targets
Non-targets
211

Appendix le: examples of stimuli from the four stages of the CANTAB-inspired version of
the sorting task.
Simple Discrimination
Compound discrimination
212

lntra-dimensional shift
Extra-dimensional shift
213

Appendix If: examples of stimuli from the three stages of the Balloon Sorting task.
Stage 1 - blue and orange hearts and rectangles
Stage 2 - pink and yellow diamond and bean-shaped
Stage 3 - red and green stars and circles
214

Appendix 2: raw-to-scaled score conversion tables for each of the three age groups (chapter 4). The raw scores from each subtest can be used to
derive an age-scaled score (on a scale with a mean of 10 and a standard deviation of 3).
Conversion table for ages 3 years 0 months to 3 years 11 months.
PERCENTILE SCALEDSCORE
SEARCH VISUALSUSTAINED
FLANKER AUDITORYSUSTAINED
VERBALOPPOSITES
DUALTASK
COUNTERPOINTING
BALLOONSORTING
19 - - - - - - - -
18 15 or more - - - - - - -
99 17 14 29 or more .95 or less 26 or more 1.01 or less 15 .98 or less -
16 13 28 .96 to .99 24 to 25 1.02 to 1.06 14 .99 to 1.00 21 or less
95 15 - 26 to 27 1.00 to 1.02 22 to 23 1.07 to 1.11 12 to 13 1.01 to 1.03 22 to 23
14 12 25 1.03 to 1.04 21 1.12 to 1.15 11 1.04 to 1.06 24
13 11 23 to 24 1.05 to 1.06 20 1.16 to 1.22 10 1.07 to 1.09 25 to 26
75 12 10 21 to 22 1.07 to 1.10 18 to 19 1.23 to 1.29 9 1.10 to 1.12 27 to 29
11 9 19 to 20 1.11 to 1.12 16 to 17 1.30 to 1.36 8 1.13 to 1.15 30 to 32
50 10 8 17 to 18 1.13 to 1.15 15 1.37 to 1.43 7 1.16 to 1.19 33 to 35
9 7 15 to 16 1.16 to 1.18 13 to 14 1.44 to 1.50 6 1.20 to 1.23 36 to 39
25 8 - 13 to 14 1.19 to 1.20 12 1.51 to 1.58 5 1.24 to 1.28 40 to 43
7 6 11 to 12 1.21 to 1.23 10 to 11 1.59 to 1.70 - 1.29 to 1.33 44 to 51
6 5 9 to 10 1.24 to 1.26 8 to 9 1.71 to 1.82 4 1.34 to 1.39 52 to 57
5 5 4 7 to 8 1.27 to 1.28 7 1.83 to 1.92 3 1.40 to 1.46 58 to 60
4 3 5 to 6 1.29 to 1.31 5 to 6 1.93 to 2.02 2 1.47 to 1.54 -
1 3 2 or less 4 or less 1.32 or more 4 or less 2.03 or more 1 or less 1.55 to 1.63 -
2 - - - - - - 1.64 or more -
1 - - - - - - - -
215
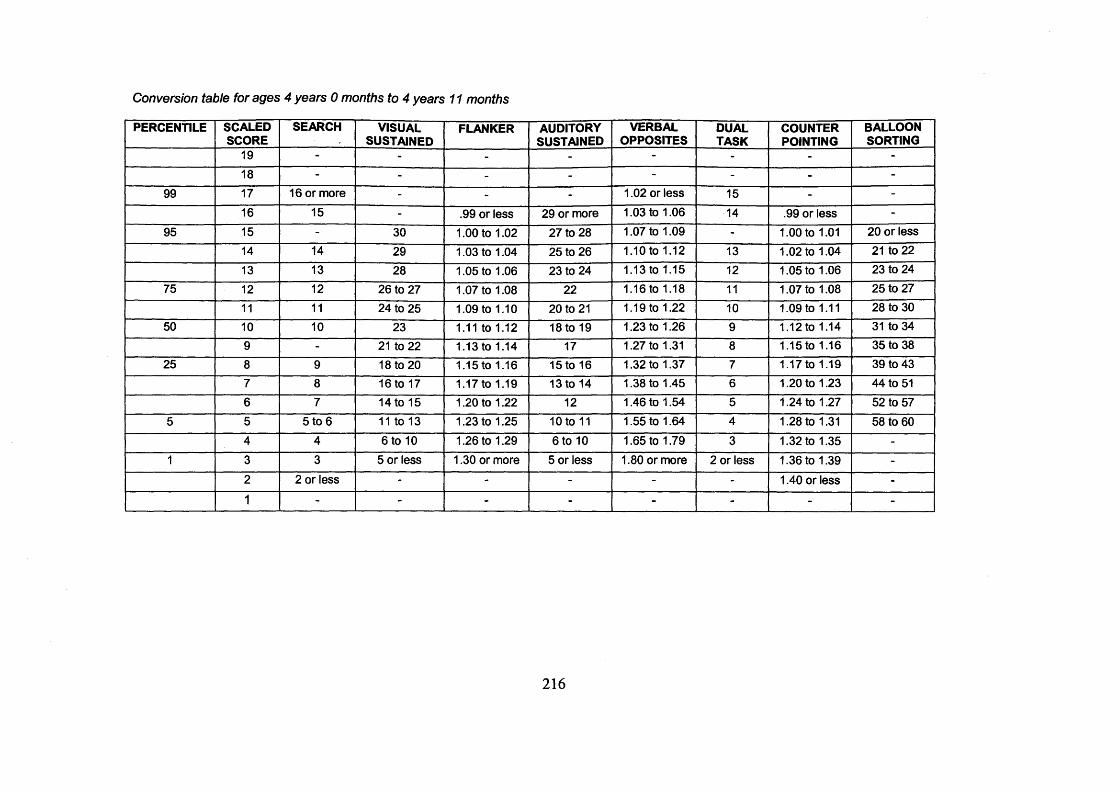
Conversion table for ages 4 years 0 months to 4 years 11 months
PERCENTILE SCALEDSCORE
SEARCH VISUALSUSTAINED
FLANKER AUDITORYSUSTAINED
VERBALOPPOSITES
DUALTASK
COUNTERPOINTING
BALLOONSORTING
19 - - - - - - - -
18 - - - - - - - -
99 17 16 or more - - - 1.02 or less 15 - -
16 15 - .99 or less 29 or more 1.03 to 1.06 14 .99 or less -
95 15 - 30 1.00 to 1.02 27 to 28 1.07 to 1.09 - 1.00 to 1.01 20 or less
14 14 29 1.03 to 1.04 25 to 26 1.10 to 1.12 13 1.02 to 1.04 21 to 22
13 13 28 1.05 to 1.06 23 to 24 1.13 to 1.15 12 1.05 to 1.06 23 to 24
75 12 12 26 to 27 1.07 to 1.08 22 1.16 to 1.18 11 1.07 to 1.08 25 to 27
11 11 24 to 25 1.09 to 1.10 20 to 21 1.19 to 1.22 10 1.09 to 1.11 28 to 30
50 10 10 23 1.11 to 1.12 18 to 19 1.23 to 1.26 9 1.12 to 1.14 31 to 34
9 - 21 to 22 1.13 to 1.14 17 1.27 to 1.31 8 1.15 to 1.16 35 to 38
25 8 9 18 to 20 1.15 to 1.16 15 to 16 1.32 to 1.37 7 1.17 to 1.19 39 to 43
7 8 16 to 17 1.17 to 1.19 13 to 14 1.38 to 1.45 6 1.20 to 1.23 44 to 51
6 7 14 to 15 1.20 to 1.22 12 1.46 to 1.54 5 1.24 to 1.27 52 to 57
5 5 5 to 6 11 to 13 1.23 to 1.25 10 to 11 1.55 to 1.64 4 1.28 to 1.31 58 to 60
4 4 6 to 10 1.26 to 1.29 6 to 10 1.65 to 1.79 3 1.32 to 1.35 -1 3 3 5 or less 1.30 or more 5 or less 1.80 or more 2 or less 1.36 to 1.39 -
2 2 or less - - - - - 1.40 or less -
1 - - - - - - - -
216

Conversion table for ages 5 years 0 months to 5 years 11 months
PERCENTILE SCALEDSCORE
SEARCH VISUALSUSTAINED
FLANKER AUDITORYSUSTAINED
VERBALOPPOSITES
DUALTASK
COUNTERPOINTING
BALLOONSORTING
19 - - - - - - - -
18 - - - - - - - -
99 17 - - - - - - - -
16 18 - .98 or less 30 1.04 or less - - 20 or less
95 15 17 - .99 to 1.00 29 1.05 to 1.07 15 .98 or less 21
14 16 - 1.01 28 1.08 to 1.09 - .99 to 1.00 22
13 - 30 1.02 to 1.03 27 1.10 to 1.12 14 1.01 to 1.02 23 to 24
75 12 15 - 1.04 25 to 26 1.13 to 1.14 13 1.03 to 1.04 25
11 14 29 1.05 to 1.06 24 1.15 to 1.17 12 1.05 to 1.06 26
50 10 13 28 1.07 to 1.08 22 to 23 1.18 to 1.19 11 1.07 to 1.08 27 to 29
9 12 27 1.09 to 1.10 21 1.20 to 1.23 10 1.09 to 1.11 30 to 32
25 8 - 26 1.11 to 1.12 19 to 20 1.24 to 1.27 9 1.12 to 1.14 33 to 36
7 11 25 1.13 to 1.14 17 to 18 1.28 to 1.31 8 1.15 to 1.17 37 to 39
6 10 23 to 24 1.15 to 1.17 13 to 16 1.32 to 1.36 7 1.18 to 1.21 40 to 47
5 5 - 20 to 22 1.18 to 1.20 9 to 12 1.37 to 1.43 5 to 6 1.22 to 1.27 48 to 55
4 9 10 to 19 1.21 to 1.24 8 or less 1.44 to 1.51 3 to 4 1.28 to 1.35 56 to 60
1 3 8 or less 9 or less 1.25 or more - 1.52 to 1.59 2 or less 1.36 or more -
2 - - - - 1.60 or more - - -1 - - - - - - - -
217

Appendix 3: the modified Vanderbilt scale used to obtain parent or teacher ratings of children’s
attention (chapter 5.1).
ITEMNEVER OCCASIONALLY OFTEN VERY
OFTEN
1. Fails to pay attention to details or makes careless mistakes in schoolwork
0 1 2 3
2. Has difficulty sustaining attention to tasks or activities
0 1 2 3
3. Does not seem to listen when spoken to directly
0 1 2 3
4. Is reluctant to engage in tasks that require sustained mental effort
0 1 2 3
5. Is easily distracted by extraneous stimuli 0 1 2 3
6. Fidgets with hands or feet, or squirms in seat
0 1 2 3
7. Leaves seat in situations when remaining seated is expected
0 1 2 3
8. Has difficulty playing or engaging in activities quietly
0 1 2 3
9. Is ‘on the go’ or acts as if ‘driven by a motor’ 0 1 2 3
10. Talks excessively 0 1 2 3
11. Blurts out answers before questions have been completed
0 1 2 3
12. Has difficulty waiting in line 0 1 2 3
13. Interrupts or intrudes on others (e.g. butts into conversations / games)
0 1 2 3
ACADEMIC PERFORMANCE EXCELLENT ABOVEAVERAGE
AVERAGE SOMEWHAT OF A
PROBLEM
PROBLEMATIC
Reading 1 2 3 4 5
Mathematics 1 2 3 4 5
Written expression 1 2 3 4 5
CLASSROOM PERFORMANCE
Relationship with peers 1 2 3 4 5
Following directions 1 2 3 4 5
Disrupting class 1 2 3 4 5
Completing tasks 1 2 3 4 5
Organisational skills 1 2 3 4 5
218

REFERENCES
Achenbach, T. M. (1991). Integrative guide to the 1991 CBCL, YSR, and TRF Profiles.
Burlington: University of Vermont, Department of Psychiatry.
Alvarez, J. A. & Emory, E. (2006). Executive function and the frontal lobes: A meta-
analytic review. Neuropsychology Review, 16, 17-42.
Anderson, V. (1998). Assessing executive functions in children: Biological,
psychological, and developmental considerations. Neuropsychological Rehabilitation, 8, 319-
349.
Anderson, V. A., Anderson, P., Northam, E., Jacobs, R., & Mikiewicz, O. (2002).
Relationships between cognitive and behavioral measures of executive function in children with
brain disease. Child Neuropsychology, 8, 231-240.
Anderson, V., Fenwick, T., Manly, T., & Roberston, I. (1998). Attentional skills
following traumatic brain injury in childhood: A componential analysis. Brain Injury, 12, 937-
949.
Ansari, D., Donlan, C., Thomas, M. S. C., Ewing, S. A., Peen, T., & Karmiloff-Smith,
A. (2003). What makes counting count? Verbal and visuo-spatial contributions to typical and
atypical number development. Journal o f Experimental Child Psychology, 85, 50-62.
Aron, A. R., Robbins, T. W., & Poldrack, R. A. (2004). Inhibition and the right inferior
frontal cortex. Trends in Cognitive Sciences, 8, 170-177.
Ashbridge, E., Walsh, V., & Cowey, A. (1997). Temporal aspects of visual search
studies by transcranial magnetic stimulation. Neuropsychologia, 35, 1121-1131.
Atkinson, J. (1984). Human visual development over the first six months of life: A
review and a hypothesis. Human Neurobiology, 3, 61-74.
Atkinson, J. (2000). The Developing Visual Brain. Oxford: Oxford University Press.
Atkinson, J., Anker, S., Braddick, O., Nokes, L., Mason, A., & Braddick, F. (2001).
Visual and visuo-spatial development in young children with Williams syndrome.
Developmental Medicine and Child Neurology, 43, 330-337.
219

Atkinson, J., Anker, S., Rae, S., Hughes, C., & Braddick, O. (2002). A test battery of
child development for examining functional vision (ABCDEFV). Strabismus, 10, 245-269.
Atkinson, J., Braddick, O., Anker, S., Curran, W., Andrew, R., Wattam-Bell, J. et al.
(2003). Neurobiological models of visuospatial cognition in children with Williams Syndrome:
Measures of dorsal-stream and frontal function. Developmental Neuropsychology, 23, 139-172.
Atkinson, J., King, J., Braddick, O., Nokes, L., Anker, S., & Braddick, F. (1997). A
specific deficit of dorsal stream function in Williams' syndrome. Neuroreport, 8, 1919-1922.
Aylward, G. P., Brager, P., & Harper, D. C. (2002). Relations between visual and
auditory continuous performance tests in a clinical population: a descriptive study.
Developmental Neuropsychology, 21, 285-303.
Aylward, E. H., Habbak, R., Warren, A. C., Pulsifer, M. B., Barta, P. E., Jerram, M. et
al. (1997). Cerebellar volume in adults with Down syndrome. Archives o f Neurology, 54, 209-
212.
Backen Jones, L., Rothbart, M. K., & Posner, M. I. (2003). Development of executive
attention in preschool children. Developmental Science, 6, 498-504.
Band, G. P. H. & Scheres, A. (2005). Commentary - Is inhibition impaired in ADHD?
British Journal o f Developmental Psychology, 23, 517-521.
Barkley, R. A. (1997). Behavioral inhibition, sustained attention, and executive
functions: constructing a unifying theory of ADHD. Psychological Bulletin, 121, 65-94.
Barkley, R. A. (1999). Response inhibition in attention-deficit hyperactivity disorder.
Mental Retardation and Developmental Disabilities, 5, 177-184.
Bellugi, U., Lichtenberger, L., Jones, W., Lai, Z., & St George, M. (2001). The
neurocognitive profile of Williams syndrome: A complex pattern of strengths and weaknesses.
In U.Bellugi & M. St George (Eds.), Journey from cognition to brain to gene: Perspectives from
Williams syndrome (pp. 1-41). Cambridge, MA: MIT Press.
Bentler, P. M. (1990). Comparative Fit Indexes in Structural Models. Psychological
Bulletin, 107, 238-246.
220

Berman, K. F., Ostrem, J. L., & Randolph, C. (1995). Physiological activation of a
cortical network during performance on the Wisconsin Card Sorting Test: a positron emission
tomography study. Neuropsychologia, 33, 1027-1046.
Berwid, O. G., Kera, E. A. C., Marks, D. J., Santra, A., Bender, H. A., & Halperin, J. M.
(2005). Sustained attention and response inhibition in young children at risk for Attention
Deficit/Hyperactivity Disorder. Journal o f Child Psychology and Psychiatry, 46, 1219-1229.
Bihrle, A. M., Bellugi, U., Delis, D., & Marks, S. (1989). Seeing Either the Forest Or the
Trees - Dissociation in Visuospatial Processing. Brain and Cognition, 11, 37-49.
Boddaert, N., Mochel, F., Meresse, I., Seidenwurm, D., Cachia, A., Brunelle, F. et al.
(2006). Parieto-occipital grey matter abnormalities in children with Williams syndrome.
Neuroimage, 30, 721-725.
Boomsma, A. & Hoogland, J. J. (2001). The robustness of LISREL modeling revisited.
In R.Cudeck, S. Du Toit, & D. Sorbom (Eds.), Structural equation modeling: Present and future
( Chicago: Scientific Software International.
Booth, J. R., Burman, D. D., Meyer, J. R., Trommer, B. L., Davenport, N. D., Parrish, T.
B. et al. (2004). Brain-behavior correlation in children depends on the neurocognitive network.
Human Brain Mapping, 23, 99-108.
Borgaro, S., Pogge, D. L., DeLuca, V. A., Bilginer, L., Stokes, J., & Harvey, P. D.
(2003). Convergence of different versions of the continuous performance test: Clinical and
scientific implications. Journal o f Clinical and Experimental Neuropsychology, 25, 283-292.
Braddick, O., Atkinson, J., & Wattam-Bell, J. (2003). Normal and anomalous
development of visual motion processing: motion coherence and 'dorsal-stream vulnerability'.
Neuropsychologia, 41, 1769-1784.
Brodeur, D. A. & Enns, J. T. (1997). Covert visual orienting across the lifespan.
Canadian Journal o f Experimental Psychology-Revue Canadienne de Psychologie
Experimentale, 51, 20-35.
Brodeur, D. A. & Pond, M. (2001). The development of selective attention in children
with Attention Deficit Hyperactivity Disorder. Journal o f Abnormal Child Psychology, 29, 229-
239.
221

Brown, J. H., Johnson, M. H., Paterson, S. J., Gilmore, R., Longhi, E., & Karmiloff-
Smith, A. (2003). Spatial representation and attention in toddlers with Williams syndrome and
Down syndrome. Neuropsychologia, 41, 1037-1046.
Bunge, S. A., Dudukovic, N. M., Thomason, M. E., Vaidya, C. J., & Gabrieli, J. D. E.
(2002). Immature frontal lobe contributions to cognitive control in children: Evidence from
fMRI. Neuron, 33, 301-311.
Burgess, P., Veitch, E., de Lacy Costello, A., & Shallice, T. (2000). The cognitive and
neuroanatomical correlates of multitasking. Neuropsychologia, 38, 848-863.
Cabeza, R. & Nyberg, L. (2000). Imaging cognition II: An empirical review of 275 PET
and fMRI studies. Journal o f Cognitive Neuroscience, 12, 1-47.
Carmody, D. P., Dunn, S. M., Boddie-Willis, A. S., DeMarco, J. K., & Lewis, M.
(2004). A quantitative measure of myelination development in infants, using MR images.
Neuroradiology, 46, 781-786.
Casey, B. J., Thomas, K. M., Welsh, T. F., Badgaiyan, R. D., Eccard, C. H., Jennings, J.
R. et al. (2000). Dissociation of response conflict, attentional selection, and expectancy with
functional magnetic resonance imaging. Proceedings o f the National Academy o f Sciences o f the
United States o f America, 97, 8728-8733.
Casey, B. J., Tottenham, N., Liston, C., & Durston, S. (2005). Imaging the developing
brain: what have we learned about cognitive development? Trends in Cognitive Sciences, 9, 104-
110.
Casey, B. J., Trainor, R., Giedd, J., Vauss, Y., Vaituzis, C. K., Hamburger, S. et al.
(1997). The role of the anterior cingulate in automatic and controlled processes: a developmental
neuroanatomical study. Developmental Psychobiology, 30, 61-69.
Catroppa, C. & Anderson, V. (2003). Children's attentional skills 2 years post-traumatic
brain injury. Developmental Neuropsychology, 23, 359-373.
Cattell, R. B. (1966). The scree test for the number of factors. Multivariate Behavioral
Research, 1, 245-276.
222

Chan, M. W. C., Yip, J. T. H., & Lee, T. M. C. (2004). Differential impairment on
measures of attention in patients with paranoid and nonparanoid schizophrenia. Journal o f
Psychiatric Research, 38, 145-152.
Chelune, G. J. & Baer, R. A. (1986). Developmental norms for the Wisconsin Card
Sorting Test. Journal o f Clinical and Experimental Neuropsychology, 8, 219-228.
Chou, C. P. & Bentler, P. M. (1995). Estimation and tests in structural equation
modeling. In R.H.Hoyle (Ed.), Structural equation modeling: Concepts, issues, and applications
(pp. 37-55). Thousand Oaks, CA: Sage.
Cohen, R. M , Semple, W. E., Gross, M , King, A. C., & Nordahl, T. E. (1992).
Metabolic Brain Pattern of Sustained Auditory-Discrimination. Experimental Brain Research,
92, 165-172.
Conners, C. K. (1997). Conners' Rating Scales Revised: Technical Manual. North
Tonawanda, NY: Multi-Health Systems.
Conners, C. K., Epstein, J. N., Angold, A., & Klaric, J. (2003). Continuous performance
test performance in a normative epidemiological sample. Journal o f Abnormal Child
Psychology, 31, 555-562.
Cooley, E. L. & Morris, R. D. (1990). Attention in children: A neuropsychologically
based model for assessment. Developmental Neuropsychology, 6, 239-274.
Corbetta, M., Shulman, G. L., Miezin, F. M., & Petersen, S. E. (1995). Superior Parietal
Cortex Activation During Spatial Attention Shifts and Visual Feature Conjunction. Science, 270,
802-805.
Corkum, P. V. & Siegel, L. S. (1993). Is the continuous performance task a valuable
research tool for use with children with Attention-Deficit-Hyperactivity Disorder? Journal o f
Child Psychology and Psychiatry, 34, 1217-1239.
Comish, K., Munir, F., & Wilding, J. (2001). A neuropsychological and behavioural
profile of attention deficits in fragile X syndrome. Revista de Neurologia, 33, S24-S29.
Comish, K., Scerif, G., & Karmiloff-Smith, A. (2007). Tracing syndrome-specific
trajectories of attention across the lifespan. Cortex, 43, 672-685.
223

Coull, J. T., Frith, C. D., Frackowiak, R. S., & Grasby, P. M. (1996). A ffonto-parietal
network for rapid visual information processing: a PET study of sustained attention and working
memory. Neuropsychologia, 34, 1085-1095.
Cruddace, S. A. & Riddell, P. M. (2006). Attention processes in children with movement
difficulties, reading difficulties or both. Journal o f Abnormal Child Psychology, 34, 675-683.
Cuskelly, M. & Dadds, M. (1992). Behavioral-Problems in Children with Downs-
Syndrome and Their Siblings. Journal o f Child Psychology and Psychiatry and Allied
Disciplines, 33, 749-761.
Cycowicz, Y. M., Friedman, D., Rothstein, M., & Snodgrass, J. G. (1997). Picture
naming in young children: norms for name agreement, familiarity and visual complexity.
Journal o f Experimental Child Psychology, 65, 171-237.
Davies, M., Howlin, P., & Udwin, O. (1997). Independence and adaptive behavior in
adults with Williams syndrome. American Journal o f Medical Genetics, 70, 188-195.
Denney, C. B., Rapport, M. D., & Chung, K. (2004). Interactions of task and subject
variables among continuous perfromance tests. Journal o f Child Psychology and Psychiatry, 46,
420-435.
Deruelle, C., Mancini, J., Livet, M. O., Casse-Perrot, C., & de Schonen, S. (1999).
Configural and Local Processing of Faces in Children with Williams Syndrome. Brain and
Cognition, 41, 276-298.
Diamond, A., Kirkham, N. Z., & Amso, D. (2002). Conditions under which young
children can hold two rules in mind and inhibit a prepotent response. Developmental
Psychology, 38, 352-362.
Diamond, A. & Taylor, C. (1996). Development of an aspect of executive control:
development of the abilities to remember what I said and to "do as I say, not as I do".
Developmental Psychobiology, 29, 315-334.
Donnai, D. & Karmiloff-Smith, A. (2000). Williams Syndrome: from genotype though
to the cognitive phenotype. American Journal o f Medical Genetics: Seminars in Medical
Genetics, 97, 164-171.
224

Donner, T. H., Kettermann, A., Diesch, E., Ostendorf, F., Villringer, A., & Brandt, S. A.
(2002). Visual feature and conjunction searches of equal difficulty engage only partially
overlapping frontoparietal networks. Neuroimage, 15, 16-25.
Duncan, J. & Owen, A. M. (2000). Common regions of the human frontal lobe recruited
by diverse cognitive demand. Trends in Neurosciences, 23, 475-483.
Dunn, L. M., Dunn, L. M., Whetton, C., & Pintilie, D. (1982). British picture
vocabulary scale. Windsor: NFER.
Durston, S., Thomas, K. M., Yang, Y. H., Ulug, A. M., Zimmerman, R. D., & Casey, B.
J. (2002). A neural basis for the development of inhibitory control. Developmental Science, 5,
F9-F16.
Eckert, M. A., Hu, D., Eliez, S., Bellugi, U., Galaburda, A., Korenberg, J. et al. (2005).
Evidence for superior parietal impairment in Williams syndrome. Neurology, 64, 152-153.
Enns, J. T. & Akhtar, N. (1989). A Developmental-Study of Filtering in Visual-
Attention. Child Development, 60, 1188-1199.
Epstein, J. N., Erkanli, A., Conners, C. K., Klaric, J., Costello, J. E., & Angold, A.
(2003). Relations between continuous performance test performance measures and ADHD
behaviors. Journal o f Abnormal Child Psychology, 31, 543-554.
Eriksen, B. A. & Eriksen, C. W. (1974). Effects of noise letter upon the identification of
a target letter in a nonsearch task. Perception and Psychophysics, 16, 143-149.
Ewing-Cobbs, L., Prasad, M., Fletcher, J. M., Levin, H. S., Miner, M. E., & Eisenberg,
H. M. (1998). Attention after pediatric traumatic brain injury: A multidimensional assessment.
Child Neuropsychology, 4, 35-48.
Fan, J., McCandliss, B. D., Sommer, T., Raz, A., & Posner, M. I. (2002). Testing the
efficiency and independence of attentional networks. Journal o f Cognitive Neuroscience, 14,
340-347.
Fan, J., McCandliss, B. D., Fossella, J., Flombaum, J. I., & Posner, M. I. (2005). The
activation of attentional networks. Neuroimage, 26, 471-479.
225

Fan, X., Thompson, B., & Wang, L. (2007). Effects of sample size, estimation methods,
and model specification on structural equation modeling fit indices. Structural Equation
Modeling, 6, 56-83.
Flanagan, T., Enns, J. T., Murphy, M. M., Russo, N., Abbeduto, L., Randolph, B. et al.
(2007). Differences in visual orienting between persons with Down or fragile X syndrome. Brain
and Cognition, 65, 128-134.
Forbes, G. B. (1998). Clinical utility of the Test of Variables of Attention (TOVA) in the
diagnosis of Attention-Deficit/Hyperactivity Disorder. Journal o f Clinical Psychology, 54, 461-
476.
Gerardi-Caulton, G. (2000). Sensitivity to spatial conflict and the development of self
regulation in children 24-36 months of age. Developmental Science, 3, 397-404.
Gerhardstein, P. & Rovee-Collier, C. (2002). The development of visual search in
infants and very young children. Journal o f Experimental Child Psychology, 81, 194-215.
Gerstadt, C. L., Hong, Y. J., & Diamond, A. (1994). The relationship between cognition
and action: performance of children 31/2-7 years old on a Stroop-like day-night test. Cognition,
53, 129-153.
Geurts, H. M., Verte, S., Oosterlaan, J., Roeyers, H., & Sergeant, J. A. (2004). How
specific are executive functioning deficits in attention deficit hyperactivity disorder and autism?
Journal o f Child Psychology and Psychiatry, 45, 836-854.
Gioia, G. A., Isquith, P. K., Kenworthy, L., & Barton, R. M. (2002). Profiles of
everyday executive function in acquired and developmental disorders. Child Neuropsychology,
8 , 121-137.
Gogtay, N., Giedd, J., Lusk, L., Hayashi, K. M., Greenstein, D., Vaituzis, C. K. et al.
(2004). Dynamic mapping of human cortical development during childhood and through early
adulthood. Proceedings o f the National Academy o f Sciences USA, 101, 8174-8179.
Goldman-Rakic, P. S. (1996). The prefrontal landscape: implications of functional
architecture for understanding human mentation and the central executive. Philosophical
Transactions o f the Royal Society o f London B, 351, 1445-1453.
226

Greer, M. K., Brown, F. R., Pai, G. S., Choudry, S. H., & Klein, A. J. (1997). Cognitive,
adaptive, and behavioral characteristics of Williams syndrome. American Journal o f Medical
Genetics, 74, 521-525.
Halperin, J. M. (1991). The Clinical-Assessment of Attention. International Journal o f
Neuroscience, 58, 171-182.
Happe, F., Booth, R., Charlton, R., & Hughes, C. (2006). Executive function deficits in
autism spectrum disorders and attention-deficit/hyperactivity disorder: Examining profiles across
domains and ages. Brain and Cognition, 61, 25-39.
Heaton, R. (1981). The Wisconsin Card Sorting Test manual. Odessa, FL: Psychological
Assessment Resources.
Heaton, S. C., Reader, S. K., Preston, A. S., Fennell, E. B., Puyana, O. E., Gill, N. et al.
(2001). The Test of Everyday Attention for Children (TEA-Ch): Patterns of performance in
children with ADHD and clinical controls. Child Neuropsychology, 7, 251-264.
Hood, J., Baird, G., Rankin, P., & Isaacs, E. (2005). Immediate effects of
methylphenidate on cognitive attention skills of children with attention-deficit-hyperactivity
disorder. Developmental Medicine and Child Neurology, 47, 408-414.
Hoyle, R. H. (1995). Structural equation modeling: Concepts, issues, and applications.
Thousand Oaks, CA: Sage Publications Inc.
Hu, L. T. & Bentler, P. M. (1998). Fit indices in covariance structure modeling :
Sensitivity to underparameterized model misspecification. Psychological Methods, 3, 424-453.
Huang-Pollock, C. L., Nigg, J. T., & Carr, T. H. (2005). Deficient attention is hard to
find: applying the perceptual load model of selective attention to attention deficit hyperactivity
disorder subtypes. Journal o f Child Psychology and Psychiatry, 46, 1211-1218.
Hughes, C. (1998). Executive function in preschoolers: links with theory of mind and
verbal ability. British Journal o f Developmental Psychology, 16, 233-253.
Hughes, C. & Russell, J. (1993). Autistic Children’s Difficulty with Mental
Disengagement from An Object - Its Implications for Theories of Autism. Developmental
Psychology, 29, 498-510.
227

Huizinga, M., Dolan, C. V., & van der Molen, M. W. (2006). Age-related change in
executive function: Developmental trends and a latent variable analysis. Neuropsychologia, 44,
2017-2036.
Jacques, S. & Zelazo, P. D. (2001). The Flexible Item Selection Task (FIST): A measure
of executive function in preschoolers. Developmental Neuropsychology, 20, 573-591.
James, W. (1890). The Principles o f Psychology. New York: Dover.
Jemigan, T. L., Bellugi, U., Sowell, E., Doherty, S., & Hesselink, J. R. (1993). Cerebral
Morphologic Distinctions Between Williams and Down Syndromes. Archives o f Neurology, 50,
186-191.
Johnson, M. H., Posner, M. I., & Rothbart, M. K. (1991). Components of visual
orienting in early infancy: contingency learning, anticipatory looking, and disengaging. Journal
o f Cognitive Neuroscience, 3, 336-344.
Karmiloff-Smith, A. (1998). Development itself is the key to understanding
developmental disorders. Trends in Cognitive Sciences, 2, 389-398.
Kelly, T. P. (2000). The clinical neuropsychology of attention in school-aged children.
Child Neuropsychology, 6, 24-36.
Kesslak, J. P., Nagata, S. F., Lott, I., & Nalcioglu, O. (1994). Magnetic-Resonance-
Imaging Analysis of Age-Related-Changes in the Brains of Individuals with Downs-Syndrome.
Neurology, 44, 1039-1045.
Kingma, A., La Heij, W., Fasotti, L., & Eling, P. (1996). Stroop interference and
disorders of selective attention. Neuropsychologia, 34, 273-281.
Kirkham, N. Z., Cruess, L., & Diamond, A. (2003). Helping children apply their
knowledge to their behavior on a dimension-switching task. Developmental Science, 6, 449-476.
Klimkeit, E. I., Mattingley, J. B., Sheppard, D. M., Farrow, M., & Bradshaw, J. L.
(2004). Examining the development of attention and executive functions in children with a novel
paradigm- Child Neuropsychology, 10, 201-211.
Kline, R. B. (1998). Principles and practice o f structural equation modeling. New York:
The Guilford Press.
228

Kochanska, G., Murray, K., Jacques, T. Y., Koenig, A. L., & Vandegeest, K. A. (1996).
Inhibitory control in young children and its role in emerging internalization. Child Development,
67, 490-507.
Kochanska, G., Murray, K. T., & Harlan, E. T. (2000). Effortful control in early
childhood: Continuity and change, antecedents, and implications for social development.
Developmental Psychology, 36, 220-232.
Konrad, K., Neufang, S., Thiel, C. M., Specht, K., Hanisch, C., Fan, J. et al. (2005).
Development of attentional networks: An fMRI study with children and adults. Neuroimage, 28,
429-439.
Korkman, M., Kirk, U., & Kemp, S. (1998). MEPSY: A developmental
neuropsychological assessment. San Antonio: TX: The Psychological Corporation.
Kremen, W. S., Seidman, L. J., Faraone, S. V., Pepple, J. R., & Tsuang, M. T. (1992).
Attention/information-processing factors in psychotic disorders: replication and extension of
recent neuropsychological findings. Journal o f Nervous and Mental Disease, 180, 89-93.
Landry, R. & Bryson, S. E. (2004). Impaired disengagement of attention in young
children with autism. Journal o f Child Psychology and Psychiatry, 45, 1115-1122.
Levin, H. S., Culhane, K. A., Hartmann, J., Evankovich, K., Mattson, A. J., Harward, H.
et al. (1991). Developmental changes in performance on tests of purported frontal lobe
functioning. Developmental Neuropsychology, 7, 377-395.
Levy, F. (1980). The development of sustained attention (vigilance) and inhibition in
children: some normative data. Journal o f Child Psychology and Psychiatry, 21, 77-84.
Lifshitz, M., Kugelmass, S., & Karov, M. (1985). Perceptual-motor and memory
performance of high-risk children. Schizophrenia Bulletin, 11, 74-84.
Lin, C. C. H., Hsiao, C. K., & Chen, W. J. (1999). Development of sustained attention
assessed using the Continuous Performance Test among children 6-15 years of age. Journal o f
Abnormal Child Psychology, 27, 403-412.
Loehlin, J. C. (1992). Latent variable models: An introduction to factor, path, and
structural analysis (2nd ed\ Hillsdale, NJ: Lawrence Erlbaum Associates.
229

Luciana, M. (2003). Practitioner review: computerized assessment of
neuropsychological function in children: clinical and research applications of the Cambridge
Neuropsychological Testing Automated Battery (CANTAB). Journal o f Child Psychology and
Psychiatry, 44, 649-663.
Luciana, M. & Nelson, C. A. (1998). The functional emergence of preffontally-guided
working memory systems in four- to eight-year-old children. Neuropsychologia, 36, 273-293.
Luria, A. R. (1966). Higher cortical functions in man. New York: Basic.
Lyon, G. R. & Krasnegor, N. A. (1996). Attention, memory and, executive function.
Baltimore, MD: Paul H. Brookes.
MacLeod, C. M. (1991). Half a century of research on the Stroop effect: an integrative
review. Psychological Bulletin, 109, 163-203.
Mahone, E. M., Pillion, J. P., Hoffman, J., Hiemenz, J. R., & Denckla, M. B. (2005).
Construct validity of the auditory continuous performance test for preschoolers. Developmental
Neuropsychology, 27, 11-33.
Manly, T., Roberston, I. H., Anderson, V., & Nimmo-Smith, I. (1999). The test o f
everyday attention for children: TEA-Ch. Bury St Edmunds: Thames Valley Test Company.
Manly, T., Roberston, I. H., Galloway, M., & Hawkins, K. (1999). The absent mind:
further investigations of sustained attention to response. Neurpsychologia, 37, 661-670.
Manly, T., Nimmo-Smith, I., Watson, P., Anderson, V., Turner, A., & Roberston, I. H.
(2001). The Differential Assessment of Children's Attention: The Test of Everyday Attention for
Children (TEA-Ch), Normative Sample and ADHD Performance. Journal o f Child Psychology
and Psychiatry, 42, 1065-1081.
Mantynen, H., Poikkeus, A., Ahonen, T., Aro, T., & Korkman, M. (2001). Clinical
significance of test refusal among young children. Child Neuropsychology, 7, 241-250.
Marsh, H. W., Hau, K. T., Balia, J. R., & Grayson, D. (1998). Is more ever too much?
The number of indicators per factor in confirmatory factor analysis. Multivariate Behavioral
Research, 33, 181-220.
230

Marsh, H. W. & Hail, K. T. (1999). Confirmatory factor analysis: Strategies for small
sample sizes. In R.H.Hoyle (Ed.), Statistical strategies for small sample sizes (pp. 251-306).
Thousand Oaks, CA: Sage.
Mason, D. J., Humphreys, G. W., & Kent, L. S. (2003). Exploring selective attention in
ADHD: visual search through space and time. Journal o f Child Psychology and Psychiatry and
Allied Disciplines, 44, 1158-1176.
McDermott, J. M., Perez-Edgar, K., & Fox, N. A. (2007). Variations of the flanker
paradigm: Assessing selective attention in young children. Behavior Research Methods, 39, 62-
70.
McKay, K. E., Halperin, J. M., Schwartz, S. T., & Sharma, V. (1994). Developmental
analysis of three aspects of information processing: Sustained attention, selective attention, and
response organization. Developmental Neuropsychology, 10, 121-132.
Mercuri, E., Atkinson, J., Braddick, O., Rutherford, M., Cowan, F. M., Counsell, S. A.
et al. (1997). Chiari I malformation in asymptomatic young children with Williams syndrome:
clinical and MRI study. European journal o f paediatric neurology, 1, 177-181.
Mervis, C. B., Robinson, B. F., Bertrand, J., Morris, C. A., Klein-Tasman, B. P., &
Armstrong, S. C. (2000). The Williams syndrome cognitive profile. Brain and Cognition, 44,
604-628.
Miller, E. K. & Cohen, J. D. (2001). An integrative theory of prefrontal cortex function.
Annual Review o f Neuroscience, 24, 167-202.
Milner, A. D. & Goodale, M. A. (1995). The Visual Brain in Action. Oxford, UK:
Oxford University Press.
Mirsky, A. F. (1987). Behavioral and psychophysiological markers of disordered
attention. Environmental Health Perspectives, 74, 191-199.
Mirsky, A. F., Anthony, B. J., Duncan, C. C., Aheam, M. B., & Kellam, S. G. (1991).
Analysis of the elements of attention: a neuropsychological approach. Neuropsychology Review,
2, 109-145.
Mishkin, M., Ungerleider, L. G., & Macko, K. A. (1983). Object vision and spatial
vision: Two cortical pathways. Trends in Neurosciences, 6, 414-417.
231

Miyake, A., Friedman, N. P., Emerson, M. J., Witzki, A. H., Howerter, A., & Wager, T.
D. (2000). The unity and diversity of executive functions and their contributions to complex
'frontal lobe' tasks: a latent variables analysis. Cognitive Psychology, 41, 49-100.
Montfoort, I., Frens, M. A., Hooge, I. T. C., Lagers-van Haselen, G. C., & van der
Geest, J. N. (2007). Visual search deficits in Williams-Beuren syndrome. Neuropsychologia, 45,
931-938.
Morrison, C. M., Chappell, T. D., & Ellis, A. W. (1997). Age of acquisition norms for a
large set of object names and their relation to adult estimates and other variables. Quarterly
Journal o f Experimental Psychology Section A-Human Experimental Psychology, 50, 528-559.
Munir, F., Comish, K. M., & Wilding, J. (2000). A neuropsychological profile of
attention deficits in young males with fragile X syndrome. Neuropsychologia, 38, 1261-1270.
Nadel, L. (1999). Down syndrome in cognitive neuroscience perspective. In H.Tager-
Flusberg (Ed.), Neurodevelopmental Disorders (pp. 197-221). Cambridge, MA: MIT Press.
Nadel, L. (2003). Down's syndrome: a genetic disorder in biobehavioral perspective.
Genes Brain and Behavior, 2, 156-166.
Nagy, Z., Westerberg, H., & Klingberg, T. (2004). Maturation of White Matter is
Associated with the Development of Cognitive Functions during Childhood. The Journal o f
Cognitive Neuroscience, 16, 1227-1233.
Nieuwenstein, M. R., Aleman, A., & de Haan, E. H. F. (2001). Relationship between
symptom dimensions and neurocognitive functioning in schizophrenia: a meta-analysis of
WCST and CPT studies. Journal o f Psychiatric Research, 35, 119-125.
Nobre, A. C., Coull, J. T., Walsh, V., & Frith, C. D. (2003). Brain activations during
visual search: Contributions of search efficiency versus feature binding. Neuroimage, 18, 91-
103.
Nyden, A., Gillberg, C., Hjelmquist, E., & Heiman, M. (1999). Executive Function /
Attention Deficits in Boys with Asperger Syndrome, Attention Disorder and Reading/Writing
Disorder. Autism, 3, 213-228.
232

Oades, R. D. (2000). Differential measures of 'sustained attention' in children with
attention-deficit/hyperactivity or tic disorders: relations to monoamine metabolism. Psychiatry
Research, 93, 165-178.
Owen, A. M., Roberts, A. C., Polkey, C. E., Sahakian, B. J., & Robbins, T. W. (1991).
Extra-dimensional versus intra-dimensional set shifting performance following frontal lobe
excision, temporal lobe excision or amygdalo-hippocampectomy in man. Neuropsychologia, 29,
993-1006.
Ozonoff, S. & Jensen, J. (1999). Brief report: Specific executive function profiles in
three neurodevelopmental disorders. Journal o f Autism and Developmental Disorders, 29, 171-
177.
Pagon, R. A., Bennett, F. C., Laveck, B., Stewart, K. B., & Johnson, J. (1987). Williams
Syndrome - Features in Late Childhood and Adolescence. Pediatrics, 80, 85-91.
Parasuraman, R. & Davies, D. R. (1977). A taxonomic analysis of vigilance
performance. In R.R.Mackie (Ed.), Vigilance: Theory, operational performance and
physiological correlates (pp. 559-574). New York: Plenum.
Parasuraman, R. (1998). The attentive brain. Cambridge, MA: MIT Press.
Pardo, J. V., Fox, P. T., & Raichle, M. E. (1991). Localization of A Human System for
Sustained Attention by Positron Emission Tomography. Nature, 349, 61-64.
Paterson, S. J., Brown, J. H., Gsodi, M. K., Johnson, M. H., & Karmiloff-Smith, A.
(1999). Cognitive modularity and genetic disorders. Science, 286, 2355-2358.
Paterson, S. J., Girelli, L., Butterworth, B., & Karmiloff-Smith, A. (2006). Are
numerical impairments syndrome specific? Evidence from Williams syndrome and Down's
syndrome. Journal o f Child Psychology and Psychiatry, 47, 190-204.
Pennington, B. F. & Ozonoff, S. (1996). Executive functions and developmental
psychopathology. Journal o f Child Psychology and Psychiatry, 37, 51-87.
Pennington, B. F., Moon, J., Edgin, J., Stedron, J., & Nadel, L. (2003). The
neuropsychology of Down syndrome: Evidence for hippocampal dysfunction. Child
Development, 74, 75-93.
233

Perry, R. J., Watson, P., & Hodges, J. R. (2000). The nature and staging of attention
dysfunction in early (minimal and mild) Alzheimer's disease: Relationship to episodic and
semantic memory impairment. Neuropsychologia, 38, 252-271.
Pinter, J. D., Eliez, S., Schmitt, J. E., Capone, G. T., & Reiss, A. L. (2001).
Neuroanatomy of Down's syndrome: A high-resolution MRI study. American Journal o f
Psychiatry, 158, 1659-1665.
Pliszka, S. R., Borcherding, S. H., Spratley, K., Leon, S., & Irick, S. (1997). Measuring
inhibitory control in children. Journal o f Developmental and Behavioral Pediatrics, 18, 254-
259.
Porter, M. A. & Coltheart, M. (2006). Global and local processing in Williams
syndrome, autism, and Down syndrome: Perception, attention, and construction. Developmental
Neuropsychology, 30, 771-789.
Porter, M. A., Coltheart, M., & Langdon, R. (2007). The neuropsychological basis of
hypersociability in Williams and Down syndrome. Neuropsychologia, 45, 2839-2849.
Posner, M. I. & Petersen, S. E. (1990). The attention system of the human brain. Annual
Review o f Neuroscience, 13, 25-42.
Posner, M. I., Rothbart, M. K., & Sheese, B. E. (2007). Attention genes. Developmental
Science, 10, 24-29.
Pueschel, S. M. (1990). Clinical Aspects of Down-Syndrome from Infancy to
Adulthood. American Journal o f Medical Genetics, 52-56.
Pugh, K. R., Shaywitz, B. A., Shaywitz, S. E., Fulbright, R. K., Byrd, D., Skudlarski, P.
et al. (1996). Auditory selective attention: an fMRI investigation. Neuroimage, 4, 159-173.
Raz, N., Torres, I. J., Briggs, S. D., Spencer, W. D., Thornton, A. E., Loken, W. J. et al.
(1995). Selective Neuroanatomicai Abnormalities in Downs-Syndrome and Their Cognitive
Correlates - Evidence from MRI Morphometry. Neurology, 45, 356-366.
Rebok, G. W., Smith, C. B., Pascualvaca, D. M., Mirsky, A. F., Anthony, B. J., &
Kellam, S. G. (1997). Developmental changes in attentional performance in urban children from
eight to thirteen years. Child Neuropsychology, 3, 28-46.
234

Reiss, A. L., Eliez, S., Schmitt, J. E., Straus, E., Lai, Z., Jones, W. et al. (2000).
Neuroanatomy of Williams syndrome: A high-resolution MRI study. Journal o f Cognitive
Neuroscience, 12, 65-73.
Reiss, A. L., Eckert, M. A., Rose, F. E., Karchemskiy, A., Kesler, S., Chang, M. et al.
(2004). An experiment of nature: Brain anatomy parallels cognition and behavior in Williams
syndrome. The Journal o f Neuroscience, 24, 5009-5015.
Reitan, R. M. & Davidson, L. A. (1974). Clinical neuropsychology: current status and
applications. New York: Hemisphere.
Reynolds, C. R. & Kamphaus, R. W. (1992). Behavior Assessment Scale for Children.
Circle Pines: MN: American Guidance Service.
Roberston, I. H., Ward, T., Ridgeway, V., & Nimmo-Smith, I. (1996). The structure of
normal human attention: The Test of Everyday Attention. Journal o f the International
Neuropsychological Society, 2, 525-534.
Roberston, I. H., Manly, T., Andrade, J., Baddeley, B. T., & Yiend, J. (1997). ’Oops!':
Performance correlates of everyday attentional failures in traumatic brain injured and normal
subjects. Neuropsychologia, 35, 747-758.
Robertson, I. H. (2003). The absent mind - Attention and error. Psychologist, 16, 476-
479.
Rosvold, H. E., Mirsky, A. F., Sarason, I., Bransome, E. D. J., & Beck, L. H. (1956). A
continuous performance test of brain damage. Journal o f Consulting Psychology, 20, 343-350.
Rowe, J., Lavender, A., & Turk, V. (2006). Cognitive executive function in Down's
syndrome. British Journal o f Clinical Psychology, 45, 5-17.
Rubia, K., Taylor, E., Smith, A. B., Oksannen, H., Overmeyer, S., & Newman, S.
(2001). Neuropsychological analyses of impulsiveness in childhood hyperactivity. British
Journal o f Psychiatry, 179, 138-143.
Rueda, M. R., Fan, J., McCandliss, B. D., Halparin, J. D., Gruber, D. B., Lercari, L. P. et
al. (2004). Development of attentional networks in childhood. Neuropsychologia, 42, 1029-
1040.
235

Rueda, M. R., Rothbart, M. K., McCandliss, B. D., Saccomanno, L., & Posner, M. I.
(2005). Training, maturation, and genetic influences on the development of executive attention.
Proceedings o f the National Academy o f Sciences o f the United States o f America, 102, 14931-
14936.
Ruff, H. A. & Rothbart, M. K. (1996). Attention in Early Development: Themes and
Variations. London: Oxford University Press.
Ruff, H. A. & Salterelli, L. M. (1993). Exploratory play with objects: Basic cognitive
processes and individual differences. In M.H.Bomstein & A. W. O'Reilly (Eds.), New Directions
for Child Development: Vol 59. The Role o f Play in Development o f Thought (pp. 5-15). San
Francisco, CA: Jossey-Bass.
Sarter, M., Givens, B., & Bruno, J. P. (2001). The cognitive neuroscience of sustained
attention: where top-down meets bottom-up. Brain Research Reviews, 35, 146-160.
Scerif, G., Comish, K., Wilding, J., Driver, J., & Karmiloff-Smith, A. (2004). Visual
search in typically developing toddlers and toddlers with Fragile X or Williams Syndrome.
Developmental Science, 7, 116-130.
Scerif, G. & Karmiloff-Smith, A. (2005). The dawn of cognitive genetics? Crucial
developmental caveats. Trends in Cognitive Sciences, 9, 126-135.
Schachar, R., Tannock, R., Marriott, M., & Logan, G. (1995). Deficient inhibitory
control in Attention Deficit Hyperactivity Disorder. Journal o f Abnormal Child Psychology, 23,
411-437.
Schmitt, J. E., Watts, K., Eliez, S., Bellugi, U., Galaburda, A., & Reiss, A. L. (2002).
Increased gyrification in Williams syndrome: Evidence using 3D MRI methods. Developmental
Medicine and Child Neurology, 44, 292-295.
See, J. E., Howe, S. R., Warm, J. S., & Dember, W. N. (1995). A meta-analysis of the
sensitivity decrement in vigilance. Psychological Bulletin, 117, 230-249.
Semel, E. & Rosner, S. R. (2003). Understanding Williams Syndrome: Behavioral
Patterns and Interventions. New Jersey: Lawrence Erlbaum Associates.
Shalev, L. & Tsai, Y. (2003). The wide attentional window: A major deficit of children
with attention difficulties. Journal o f Learning Disabilities, 36, 517-527.
236

Shallice, T. (1982). Specific impairments of planning. Philosophical Transactions o f the
Royal Society o f London B, 298, 199-209.
Shallice, T., Marzocchi, G. M., Coser, S., Del Savio, M., Meuter, R. F., & Rumiati, R. I.
(2002). Executive function profile of children with Attention Deficit Hyperactivity Disorder.
Developmental Neuropsychology, 21, 43-71.
Shaywitz, B. A., Shaywitz, S. E., Pugh, K. R , Fulbright, R. K., Skudlarski, P., Mencl,
W. E. et al. (2001). The functional neural architecture of components of attention in language-
processing tasks. Neuroimage, 13, 601-612.
Sonuga-Barke, E. J. S. (1994). Annotation - on dysfunction and function in
psychological theories of childhood disorder. Journal o f Child Psychology and Psychiatry and
Allied Disciplines, 35, 801-815.
Sowell, E. R., Delis, D., Stiles, J., & Jemigan, T. L. (2001). Improved memory
functioning and frontal lobe maturation between childhood and adolescence: A structural MRI
study. Journal o f the International Neuropsychological Society, 7, 312-322.
Sowell, E. R., Peterson, B. S., Thompson, P. M., Welcome, S. E., Henkenius, A. L., &
Toga, A. W. (2003). Mapping cortical change across the human life span. Nature Neuroscience,
6, 309-315.
Steinhauer, S. R., Zubin, J., Condray, R , Shaw, D. B., Peters, J. L., & Van Kammen, D.
P. (1991). Electrophysiological and behavioral signs of attentional disturbance in schizophrenics
and their siblings. In C.A.Tamminga & S. C. Schultz (Eds.), Advances in Neuropsychiatry and
Psychopharmacology Volume I: Schizophrenia Research (pp. 169-178). New York: Raven.
Stevens, J. (1996). Applied multivariate statistics for the social sciences (3rd edition).
Mahwah, NJ: Lawrence Erlbaum Associates.
Stiles-Davis, J. (1988). Developmental change in young children's spatial grouping
activity. Developmental Psychology, 24, 522.
Stins, J. F., Tollenaar, M. S., Slaats-Willemse, D. I. E., Buitelaar, J. K., Swaab-
Bameveld, H., Verhulst, F. C. et al. (2005). Sustained attention and executive functioning
performance in attention-deficit/hyperactivity disorder. Child Neuropsychology, 11, 285-294.
237

Stores, R., Stores, G., Fellows, B., & Buckley, S. (1998). Daytime behaviour problems
and maternal stress in children with Down's syndrome, their siblings, and non-intellectually
disabled and other intellectually disabled peers. Journal o f Intellectual Disability Research, 42,
228-237.
Strauss, M. E., Thompson, P. M., Adams, N. L., Redline, S., & Burant, C. (2000).
Evaluation of a model of attention with confirmatory factor analysis. Neuropsychology, 14, 201-
208.
Streiner, D. L. (2006). Building a better model: An introduction to Structural Equation
Modelling. Canadian Journal o f Psychiatry, 515, 317-324.
Streissguth, A. P., Bookstein, F. L., Sampson, P. D., & Barr, H. M. (1995). Attention:
Prenatal alcohol and continuities of vigilance and attentional problems from 4 through 14 years.
Development and Psychopathology, 7, 419-446.
Stroop, J. R. (1935). Studies of interference in serial verbal reactions. Journal o f
Experimental Psychology, 18, 643-662.
Sutcliffe, P. A., Bishop, D. V. M., Houghton, S., & Taylor, M. (2006). Effect of
attentional state on frequency discrimination: A comparison of children with ADHD on and off
medication. Journal o f Speech Language and Hearing Research, 49, 1072-1084.
Swanson, J. M. (1995). SNAP-IV Scale. UC Irvine: Child Development Center.
Sylvester, C. C., Wager, T. D., Lacey, S. C., Hernandez, L., Nichols, T. E., Smith, E. E.
et al. (2003). Switching attention and resolving interference: fMRI measures of executive
functions. Neuropsychologia, 41, 357-370.
Tannock, R. (1998). Attention deficit hyperactivity disorder: advances in cognitive,
neurobiological, and genetic research. Journal o f Child Psychology and Psychiatry, 39, 65-99.
Taylor, H. G., Hack, M., & Klein, N. K. (1998). Attention deficits in children with <750
gm birth weight. Child Neuropsychology, 4, 21-34.
Tomarken, A. J. & Waller, N. G. (2003). Potential problems with "well fitting" models.
Journal o f Abnormal Psychology, 112, 578-598.
238

Treisman, A. (1988). Features and Objects - the 14th Bartlett Memorial Lecture.
Quarterly Journal o f Experimental Psychology Section A-Human Experimental Psychology, 40,
201-237.
Treisman, A. M. & Gelade, G. (1980). Feature-integration theory of attention. Cognitive
Psychology, 12, 97-136.
Trick, L. M. & Enns, J. T. (1998). Lifespan changes in attention: the visual search task.
Cognitive Development, 13, 369-386.
Udwin, O. (1990). A survey of adults with Williams syndrome and idiopathic infantile
hypercalcemia. Developmental Medicine and Child Neurology, 32, 129-141.
Udwin, O., Davies, M., & Howlin, P. (1996). A longitudinal study of cognitive abilities
and educational attainment in Williams syndrome. Developmental Medicine and Child
Neurology, 38, 1020-1029.
Vicari, S. (2006). Motor development and neuropsychological patterns in persons with
Down syndrome. Behavior Genetics, 36, 355-364.
Welsh, M. C., Pennington, B. F., & Groisser, D. B. (1991). A normative-developmental
study of executive function: a window on prefrontal function in children. Developmental
Neuropsychology, 7, 131-149.
Wilding, J., Munir, F., & Comish, K. (2001). The nature of attentional differences
between groups of children differentiated by teacher ratings of attention and hyperactivity.
British Journal o f Psychology, 92, 357-371.
Wilding, J., Comish, K., & Munir, F. (2002). Further delineation of the executive deficit
in males with ffagile-X syndrome. Neuropsychologia, 40, 1343-1349.
Wilding, J. (2003). Attentional difficulties in children: Weakness in executive function
or problems coping with difficult tasks? British Journal o f Psychology, 94, 427-436.
Wilding, J. (2005). Is attention impaired in ADHD? British Journal o f Developmental
Psychology, 23, 487-505.
Wilding, J. & Burke, K. (2006). Attentional differences between groups of preschool
children differentiated by teacher ratings of attention and hyperactivity. British Journal o f
Developmental Psychology, 24, 283-291.
239

Wolraich, M. L., Feurer, I. D., Hannah, J. N., Baumgaertel, A., & Pinnock, T. Y. (1998).
Obtaining systematic teacher reports of disruptive behavior disorders utilizing DSM-IV. Journal
o f Abnormal Child Psychology, 26, 141-152.
Woodhouse, J. M., Meades, J. S., Leat, S. J., & Saunders, K. J. (1993). Reduced
Accommodation in Children with Down-Syndrome. Investigative Ophthalmology & Visual
Science, 34, 2382-2387.
Woodhouse, J. M., Pakeman, V. H., Saunders, K. J., Parker, M., Fraser, W. I., Lobo, S.
et al. (1996). Visual acuity and accommodation in infants and young children with Down's
syndrome. Journal o f Intellectual Disability Research, 40, 49-55.
Zelazo, P. D., Carter, A., Reznick, J. S., & Frye, D. (1997). Early development of
executive function: A problem-solving framework. Review o f General Psychology, 1, 198-226.
Zelazo, P. D., Frye, D., & Rapus, T. (1996). An age-related dissociation between
knowing rules and using them. Cognitive Development, 11, 37-63.
Zelazo, P. D., Muller, U., Frye, D., & Marcovitch, S. (2003). The development of
executive function. Monographs o f the Society for Research in Child Development, 68, 28-47.
Copyright © 2022 FDOKUMEN