Development of T-tubular vacuoles in eccentrically damaged mouse muscle fibres
Upload
independentCategory
view
0download
0
The SPI-2 type III secretion system restricts motility ofSalmonella-containing vacuolesOnlineOpen: This article is available free online at www.blackwell-synergy.com
Amy E. Ramsden,1 Luís J. Mota,1 Sylvia Münter,2†
Spencer L. Shorte2 and David W. Holden1*1Centre for Molecular Microbiology and Infection,Imperial College London, Armstrong Road, LondonSW7 2AZ, UK.2Plate-Forme d’Imagerie Dynamique (PFID),Département de Biologie, Cellulaire et Infection, InstitutPasteur; 25, Rue du Docteur Roux, 75724 Paris Cedex15, France.
Summary
Intracellular replication of Salmonella entericaoccurs in membrane-bound compartments, calledSalmonella-containing vacuoles (SCVs). Followinginvasion of epithelial cells, most SCVs migrate to aperinuclear region and replicate in close associationwith the Golgi network. The association of SCVswith the Golgi is dependent on the Salmonella-pathogenicity island-2 (SPI-2) type III secretion system(T3SS) effectors SseG, SseF and SifA. However, little isknown about the dynamics of SCV movement. Here,we show that in epithelial cells, 2 h were required formigration of the majority of SCVs to within 5 mm fromthe microtubule organizing centre (MTOC), which islocated in the same subcellular region as the Golginetwork. This initial SCV migration was saltatory, bidi-rectional and microtubule-dependent. An intact Golgi,SseG and SPI-2 T3SS were dispensable for SCV migra-tion to the MTOC, but were essential for maintenanceof SCVs in that region. Live-cell imaging between 4 and8 h post invasion revealed that the majority of wild-type SCVs displaced less than 2 mm in 20 min fromtheir initial starting positions. In contrast, between 6and 8 h post invasion the majority of vacuoles contain-ing sseG, sseF or ssaV mutant bacteria displacedmore than 2 mm in 20 min from their initial startingpositions, with some undergoing large and dramaticmovements. Further analysis of the movement of
SCVs revealed that large displacements were a resultof increased SCV speed rather than a change in theirdirectionality, and that SseG influences SCV motilityby restricting vacuole speed within the MTOC/Golgiregion. SseG might function by tethering SCVs toGolgi-associated molecules, or by controlling micro-tubule motors, for example by inhibiting kinesinrecruitment or promoting dynein recruitment.
Introduction
Salmonella enterica serovar Typhimurium (S. Typhimu-rium) is a facultative intracellular pathogen that causes aself-limiting gastroenteritis in humans and a typhoid-likeillness in susceptible mouse strains. Intracellular replica-tion of this bacterium occurs in a specialized membrane-bound compartment known as the Salmonella-containingvacuole (SCV). The pathogenesis of S. Typhimuriuminvolves two type III secretion systems (T3SSs), whichdeliver effector proteins across host cell membranes. TheSalmonella-pathogenicity island 1 (SPI-1)-encoded T3SSis expressed by extracellular bacteria and its effector pro-teins, which are delivered through the plasma membrane,trigger bacterial invasion and influence the early steps ofSCV biogenesis (Schlumberger and Hardt, 2005). TheSPI-2-encoded T3SS is activated by intracellular bacteriaand is required for systemic virulence in the murine modelof salmonellosis (Shea et al., 1996; Cirillo et al., 1998).Effectors translocated by the SPI-2 T3SS into and acrossthe SCV membrane facilitate intracellular multiplication ofS. Typhimurium in different cells types, including macroph-ages and epithelial cells (Abrahams and Hensel, 2006).
SseG, SseF and SifA are SPI-2 T3SS effectors that arenecessary for the formation in epithelial cells of tightlyclustered bacterial microcolonies in close proximity to theGolgi apparatus (Salcedo and Holden, 2003; Boucrotet al., 2005; Abrahams et al., 2006; Deiwick et al., 2006).In uninfected epithelial cells, the Golgi apparatus is acompact structure, composed of dozens of connectedstacks of cisternae that are localized close to the micro-tubule organizing centre (MTOC) and the nuclear mem-brane (Farquhar and Palade, 1981). However, in infectedcells the morphology of the Golgi network is often dis-torted by the S. Typhimurium microcolony (Salcedo andHolden, 2003). Different lines of evidence suggest that thespatial localization of SCVs and S. Typhimurium – Golgi
Received 29 March, 2006; revised 3 May, 2007; accepted 11 May,2007. *For correspondence. E-mail [email protected]; Tel.(+44) 20 7594 3073; Fax (+44) 20 7594 3076. †Present address:Department of Parasitology, Heidelberg University School of Medi-cine, Im Neuenheimer Feld 324, 69120 Heidelberg, Germany.Re-use of this article is permitted in accordance with the CreativeCommons Deed, Attribution 2.5, which does not permit commercialexploitation.
Cellular Microbiology (2007) 9(10), 2517–2529 doi:10.1111/j.1462-5822.2007.00977.xFirst published online 7 June 2007
© 2007 The AuthorsJournal compilation © 2007 Blackwell Publishing Ltd

interactions are important for bacterial replication. First,SseG and SseF are both required for intracellular multi-plication in macrophages and epithelial cells (Henselet al., 1998; Salcedo and Holden, 2003; Abrahams et al.,2006; Deiwick et al., 2006). Second, in epithelial cells,more bacterial replication occurs if SCVs are in the vicinityof the Golgi network (Salcedo and Holden, 2003). Third,dissolution of the Golgi apparatus with brefeldin A (BFA)inhibits the intracellular growth of S. Typhimurium(Salcedo and Holden, 2003). Furthermore, in infectedcells, exocytic transport vesicles transiting from the Golgito the plasma membrane are redirected and accumulatenear SCVs in an SseG- and SseF-dependent manner(Kuhle et al., 2006). However, no direct fusion betweenexocytic vesicles and SCVs has been observed andthe physiological significance of the physical proximitybetween S. Typhimurium microcolonies and the Golginetwork remains unclear.
Most studies addressing the spatial localization ofSCVs have relied on the analysis of chemically fixedinfected cells by immunofluorescence microscopy.However, SCV positioning is determined by the propertiesof vacuole movement, which can only be analysed bylive-cell microscopy. In this work, we undertook a detailedstudy of SCV positioning (in fixed cells) and movement(in living cells) at different times after invasion of epithelialcells. We investigated the contribution of microtubules,the Golgi network and the SPI-2 T3SS. Our results indi-cate that that SseG and SseF control SCV positioning byrestricting their microtubule-dependent motility. The actionof SseG appears to be localized to the Golgi region andSCV positioning is also dependent on an intact Golginetwork, suggesting that an SseG/SseF complex couldfunction by tethering SCVs to Golgi-related molecules.
Results
Effect of nocodazole and BFA on the migration of SCVsto the MTOC/Golgi region within host cells
In previous work it was shown that by 8 h post invasion(p.i.) in epithelial cells, the majority of vacuoles enclosingwild-type (wt) S. Typhimurium were in close proximity to theGolgi apparatus (Salcedo and Holden, 2003). Within epi-thelial cells, the MTOC and the Golgi apparatus are posi-tioned close to each other on one side of the nucleus(Tassin et al., 1985; Kronebusch and Singer, 1987). Toexamine the relationship between centripetal migration ofSCVs and the Golgi apparatus and the MTOC in moredetail, HeLa cells were either untreated or exposed tonocodazole or BFA and fixed at 0.25 h, 0.5 h, 2 h and 4 hafter invasion by wt bacteria. Cells were then labelled forthe MTOC (anti-g-tubulin antibody), the Golgi apparatus(anti-giantin antibody) and S. Typhimurium (anti-
Salmonella antibody). At 0.25 h and 0.5 h p.i. of untreatedcells, approximately 30% of SCVs were found within 5 mmof the MTOC; however, at 2 h and 4 h p.i. approximately70% of SCVs were present in this region of the cell (Fig. 1).
At 0.25 h and 0.5 h after invasion of nocodazole-treatedcells, the percentage of SCVs within 5 mm of the MTOCwas similar to that in untreated cells (Fig. 1B). However,nocodazole treatment caused a dramatic reduction in thepercentage of SCVs within 5 mm of the MTOC at 2 h and4 h p.i. (Fig. 1). Disruption of microtubules by nocodazolecauses Golgi stacks to disconnect from each other, redis-tributing from their normal perinuclear location to endo-plasmic reticulum exit sites (Fig. 1A) (Cole et al., 1996).To examine the influence of the Golgi apparatus in thecentripetal migration of SCVs, infected cells were treatedwith BFA at 15 min p.i. and fixed 1 h 45 min later. BFAtreatment results in fragmentation of the Golgi and redis-tribution of its components into the endoplasmic reticulum(Lippincott-Schwartz et al., 1989). BFA treatment causedan increase in the proportion of SCVs within 5 mm of theMTOC (Fig. 1B). Indeed, in BFA-treated but not untreatedcells, bacteria were occasionally observed to colocalizewith g-tubulin (Fig. 1A). These results indicate that micro-tubules are required for centripetal migration of SCVs,and that the Golgi network might obstruct migration ofSCVs towards the minus ends of microtubules.
Analysis of SCV motility at early stages of infection
To further characterize the migration of SCVs towards theMTOC-Golgi region, we analysed the movement of indi-vidual SCVs by time-lapse fluorescence microscopy. As amarker for the Golgi network HeLa cells were transfectedwith a plasmid encoding a chimeric protein comprisingmurine Mannosidase II (MannII) fused at its C-terminus toenhanced green fluorescent protein (EGFP). MannII is aGolgi-resident protein, mainly localized at the medialportion of the stack (Novikoff et al., 1983). HeLa cellstransfected for approximately 20 h with the MannII-EGFPvector were infected with wt S. Typhimurium 12023 har-bouring the pDsRed plasmid. We then analysed themovement of 10 different SCVs by acquiring images over50–60 min periods at 1 min intervals between 20 min and120 min p.i. To determine SCV migration relative to theGolgi region, the positions of the centroids correspondingto DsRed and MannII-EGFP fluorescence were calculatedin each image of every time-lapse sequence. The move-ment of six representative SCVs in relation to the MannII-EGFP centroid are shown graphically in Fig. 2A, and atypical example of SCV migration is shown in the time-lapse panels of Fig. 2B, and in Supplementary Movie S1.SCV movements were saltatory, and characterized byfrequent changes in direction relative to the MannII-EGFPcentroid. Analysis of the initial and final distance of the 10
2518 A. E. Ramsden et al.
© 2007 The AuthorsJournal compilation © 2007 Blackwell Publishing Ltd, Cellular Microbiology, 9, 2517–2529
SCVs showed that in 1 h they displaced on average3.5 � 0.9 mm towards the MannII-EGFP centroid.
Salmonella-containing vacuole migration towards theGolgi could be explained by a greater number of centri-petal relative to centrifugal displacements, differentspeeds depending on direction, or a combination of thetwo. Therefore, we determined the directionality andspeed of SCVs between 20 min and 120 min p.i. Forthese experiments we analysed time-lapse sequencesover 5 min periods at 5 s intervals. A total of 52 randomlyselected SCVs were imaged, corresponding to 3118 dis-tinct 5 s displacements. There were large differencesin SCV speed, not only between distinct SCVs, butalso between the different displacements of a singleSCV (Fig. 2C). The mean speed per SCV was0.024 � 0.002 mm s-1, with a maximum of 0.064 mm s-1
and a minimum of 0.007 mm s-1. To analyse the direction-ality of SCV trajectories, each 5 min trajectory and itscomponent 5 s displacements were classified as cen-tripetal if it brought the SCV closer to the MannII-EGFP centroid, or centrifugal, if it moved further away.While there was no significant difference (P = 0.13)between the average speeds of SCVs moving centrip-etally (0.026 � 0.002 mm s-1, n = 27) and centrifugally(0.022 � 0.002 mm s-1, n = 25), the average number ofcentripetal displacements per SCV (30.8 � 0.6) was sig-
nificantly higher (P = 0.035) than that of centrifugal dis-placements per SCV (29.1 � 0.9). These results indicatethat SCV movement towards the Golgi is caused mainlyby a greater number of centripetal relative to centrifugaldisplacements, rather than greater speed of SCVs movingin a centripetal direction.
Requirement of the SPI-2 T3S to retain SCVs at theMTOC/Golgi region
Previous work has shown that the S. Typhimurium SPI-2T3SS and the effector SseG are required for bacterialassociation with the Golgi apparatus between 6 and 8 hp.i. (Salcedo and Holden, 2003). To examine the dis-tances between vacuoles containing SPI-2 mutant bacte-ria and the MTOC at these and earlier time-points, HeLacells were infected with wt bacteria or strains carryingmutations in either ssaV [which encodes an essentialcomponent of the SPI-2 T3SS machinery (Deiwick et al.,1998)] or sseG. Infected cells were fixed at 2 h intervalsfrom 2 h to 8 h and examined by confocal microscopy.
At 2 h and 4 h after infection, only minor differenceswere observed in the number of bacteria within 5 mm ofthe MTOC between cells infected with wt, ssaV or sseGmutant bacteria (Fig. 3). However, at 6 h and 8 h afterinfection, lower numbers of vacuoles containing ssaV or
Fig. 1. Migration of SCVs to the MTOC/Golgi region of HeLa cells.A. Representative images of HeLa cells infected with wt S. Typhimurium for 2 h, in the presence or absence of nocodazole or BFA. Cells werefixed in ice-cold methanol and coimmunolabelled for giantin (blue in merged images), g-tubulin (red in merged images) and S. Typhimurium(green in merged images). Images were acquired by confocal microscopy and represent combined projections of multiple Z-sections. Highermagnification of cells in boxed region. Scale bars, 5 mm.B. Percentage of SCVs within 5 mm of the MTOC in BFA-, nocodazole-treated or untreated HeLa cells. P-values are indicated above bars andwere obtained by comparing nocodazole- or BFA-treated cells to untreated cells at the same time point.
SPI-2 restricts SCV motility 2519
© 2007 The AuthorsJournal compilation © 2007 Blackwell Publishing Ltd, Cellular Microbiology, 9, 2517–2529

sseG mutant bacteria in comparison to vacuoles contain-ing wt bacteria were observed at distances within 5 mmfrom the MTOC (Fig. 3). At 8 h p.i. more than 50% of ssaVor sseG mutant bacteria were at a distance greater than5 mm from the MTOC. This indicates that SPI-2 encodedT3SS and SseG are not involved in SCV migration to theMTOC but are required for continued association of SCVswith this region of the cell.
Requirement of an intact Golgi apparatus for SCVassociation with the MTOC
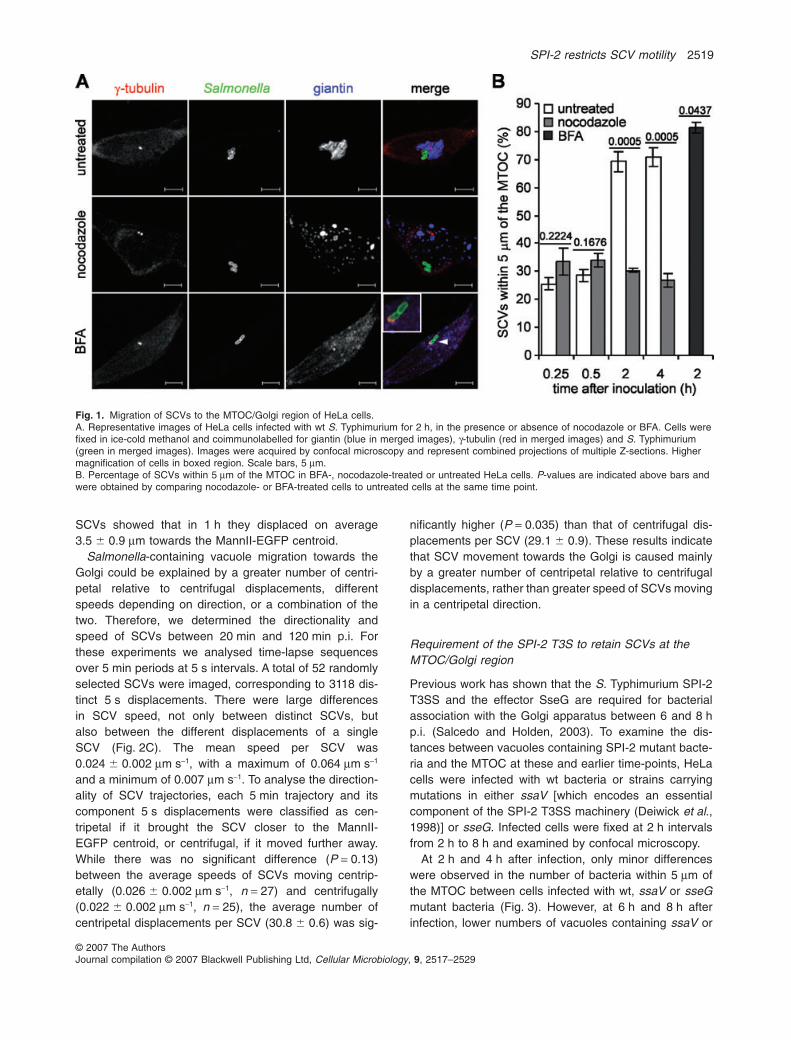
We have previously shown that when expressed ectopi-cally, SseG localizes to the Golgi apparatus and canrescue the Golgi association defect of an sseG mutantstrain (Salcedo and Holden, 2003). We therefore exam-ined the requirement for an intact Golgi apparatus for theassociation between SCVs and the MTOC. To this endHeLa cells infected with wt S. Typhimurium were treatedwith BFA at 15 min p.i and then fixed at 4 h, 6 h and 8 hp.i. At 4 h p.i. the percentage of SCVs within 5 mm of theMTOC was slightly lower (60 � 3%) than in untreatedcells (71 � 3%), and there was a significant reduction inthe numbers of SCVs within 5 mm of the MTOC in BFA-treated cells at both 6 h and 8 h p.i. (Fig. 4). However,BFA treatment had no noticeable effect on the distributionof vacuoles containing sseG mutant bacteria at 8 h p.i.(data not shown). This indicates that although not requiredfor migration of SCVs to the MTOC, the Golgi seems tohave an important role in the retention of SCVs in thisregion of the cell.
Requirement of an intact microtubule network for theredistribution of sseG mutant S. Typhimurium away fromthe MTOC/Golgi region
To determine whether microtubules are required for theredistribution of vacuoles containing sseG mutant bacte-
Fig. 2. Time-lapse video microscopy analysis of the movement ofSCVs towards the Golgi in HeLa cells. To allow visualization of theGolgi, HeLa cells were transiently transfected with a vectorencoding MannII-EGFP. Transfected cells were infected with wtS. Typhimurium expressing the red fluorescent protein (DsRed).A. Graphical representation of the distance between redfluorescence centroid (Salmonella) and green fluorescence centroid(Golgi) in every frame of six time-lapse sequences; images weretaken at 1 min intervals. Each colour represents a single SCV.B. In the upper left panel an SCV trajectory (corresponding to theblue curve in Fig. 2A), is superimposed on the fluorescent and DICimage of the infected HeLa cell. The boxed region is magnified insubsequent panels, which show merged fluorescent images at30 min intervals (see Supplementary Movie S1). Scale bar, 5 mm.C. Change of speed over time is shown for two distinct SCVs. Dataare from time-lapse sequences where images were acquired at 5 sintervals. One SCV (blue line), had an average speed of0.045 � 0.004 mm; the other (red line) had an average speed of0.017 � 0.001 mm s-1.
2520 A. E. Ramsden et al.
© 2007 The AuthorsJournal compilation © 2007 Blackwell Publishing Ltd, Cellular Microbiology, 9, 2517–2529

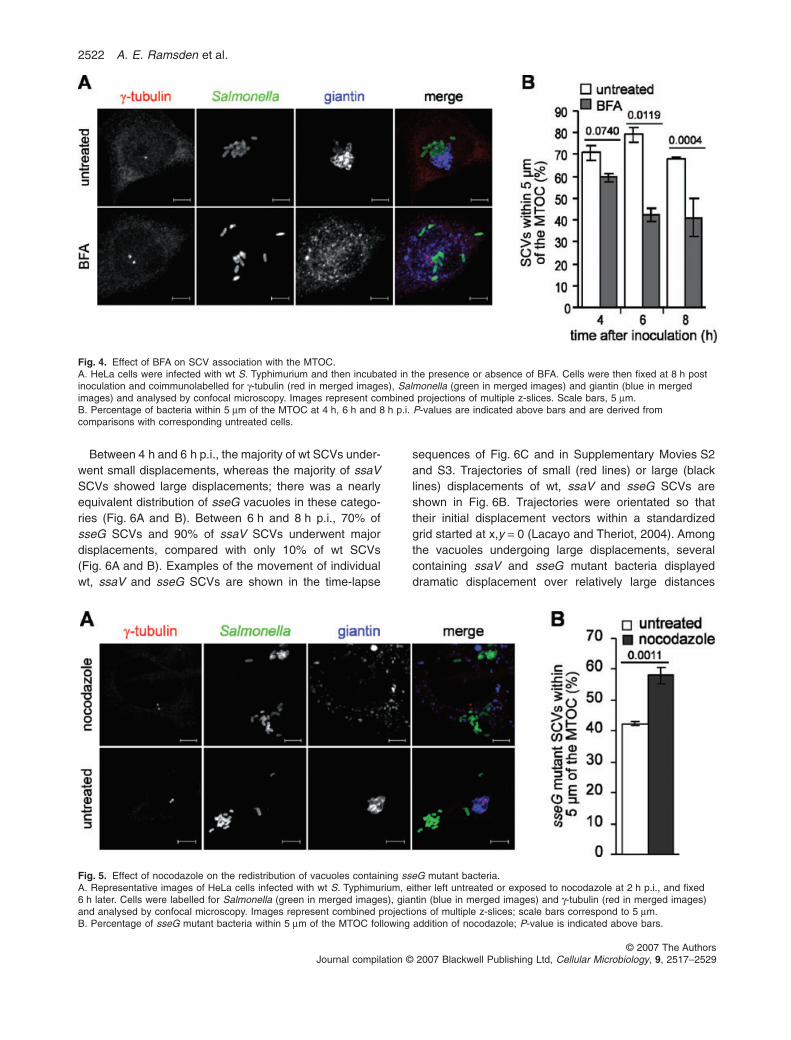
ria following their initial migration to the MTOC/Golgiregion, HeLa cells infected with the sseG mutant weretreated with nocodazole at 2 h p.i. to depolymerize micro-tubules and fixed 6 h later for microscopy analysis. Inuntreated cells, 42 � 3% of sseG bacteria were within5 mm of the MTOC (Fig. 5), similar to that observed pre-viously (Fig. 3B). In nocodazole-treated cells the percent-age of mutant bacteria observed within 5 mm of the MTOCwas significantly higher and similar to that observed forsseG mutant SCVs in untreated cells at 2 h p.i. (Fig. 3B).This suggests that the centrifugal redistribution of SCVsby 8 h p.i. involves movement on microtubules.
Analysis of SCV motility at late stages of infection
To characterize the dynamics of SCVs containing wt,ssaV or sseG mutant bacteria following their migration to
the MTOC/Golgi region, we examined their motility in rela-tion to the Golgi network by time-lapse fluorescencemicroscopy between 4 h and 8 h p.i. Preliminary experi-ments suggested that while the motility of wt SCVs waslimited, many vacuoles containing ssaV and sseG mutantbacteria were capable of rapid and apparently erraticmovement in infected cells. To quantify this phenotype,the positions of centroids of SCVs were determined intime-lapse sequences where images were acquired everymin over a 20 min time-course. SCVs were analysed intwo time periods: between 4 h and 6 h p.i. (20 wt SCVs,21 ssaV SCVs and 29 sseG SCVs), and between 6 h and8 h p.i. (30 wt SCVs, 22 ssaV SCVs and 23 sseG SCVs).SCVs were then classified as undergoing large or smalldisplacements depending on whether their maximum dis-placement from their initial position exceeded, or was lessthan 2 mm, over the 20 min time-course.
Fig. 3. Requirement of the SPI-2 T3SS andeffector SseG for SCV association with theMTOC.A. Representative images of HeLa cellsinfected for 2 h and 8 h with sseG mutant S.Typhimurium. Infected cells were fixed inice-cold methanol and triple labelled forSalmonella (green in merged images), giantin(blue in merged images) and g-tubulin(red in merged images). Cells were analysedby confocal microscopy and images representcombined projections of multiple z-sections.Scale bars, 5 mm.B. Percentage of ssaV mutant, sseG mutantand wt S. Typhimurium bacteria within 5 mmfrom the MTOC over an 8 h time-course.Error bars not apparent if less than 0.1;P-values are indicated above bars, comparedwith corresponding wt values.
SPI-2 restricts SCV motility 2521
© 2007 The AuthorsJournal compilation © 2007 Blackwell Publishing Ltd, Cellular Microbiology, 9, 2517–2529
Between 4 h and 6 h p.i., the majority of wt SCVs under-went small displacements, whereas the majority of ssaVSCVs showed large displacements; there was a nearlyequivalent distribution of sseG vacuoles in these catego-ries (Fig. 6A and B). Between 6 h and 8 h p.i., 70% ofsseG SCVs and 90% of ssaV SCVs underwent majordisplacements, compared with only 10% of wt SCVs(Fig. 6A and B). Examples of the movement of individualwt, ssaV and sseG SCVs are shown in the time-lapse
sequences of Fig. 6C and in Supplementary Movies S2and S3. Trajectories of small (red lines) or large (blacklines) displacements of wt, ssaV and sseG SCVs areshown in Fig. 6B. Trajectories were orientated so thattheir initial displacement vectors within a standardizedgrid started at x,y = 0 (Lacayo and Theriot, 2004). Amongthe vacuoles undergoing large displacements, severalcontaining ssaV and sseG mutant bacteria displayeddramatic displacement over relatively large distances
Fig. 4. Effect of BFA on SCV association with the MTOC.A. HeLa cells were infected with wt S. Typhimurium and then incubated in the presence or absence of BFA. Cells were then fixed at 8 h postinoculation and coimmunolabelled for g-tubulin (red in merged images), Salmonella (green in merged images) and giantin (blue in mergedimages) and analysed by confocal microscopy. Images represent combined projections of multiple z-slices. Scale bars, 5 mm.B. Percentage of bacteria within 5 mm of the MTOC at 4 h, 6 h and 8 h p.i. P-values are indicated above bars and are derived fromcomparisons with corresponding untreated cells.
Fig. 5. Effect of nocodazole on the redistribution of vacuoles containing sseG mutant bacteria.A. Representative images of HeLa cells infected with wt S. Typhimurium, either left untreated or exposed to nocodazole at 2 h p.i., and fixed6 h later. Cells were labelled for Salmonella (green in merged images), giantin (blue in merged images) and g-tubulin (red in merged images)and analysed by confocal microscopy. Images represent combined projections of multiple z-slices; scale bars correspond to 5 mm.B. Percentage of sseG mutant bacteria within 5 mm of the MTOC following addition of nocodazole; P-value is indicated above bars.
2522 A. E. Ramsden et al.
© 2007 The AuthorsJournal compilation © 2007 Blackwell Publishing Ltd, Cellular Microbiology, 9, 2517–2529

(Fig. 6B): between 6 and 8 h the maximum displace-ment observed for an sseG vacuole was 13.6 mm and10 SCVs displaced further than 5 mm (meandisplacement = 4.24 � 0.76 mm, n = 23). Similar re-
sults were observed for ssaV SCVs where the maxi-mum displacement observed was 10.3 mm with10 SCVs displacing further than 5 mm (meandisplacement = 4.97 � 0.56 mm, n = 22). By contrast the
Fig. 6. Live imaging analysis of wt, ssaV andsseG mutant SCVs.A. Percentages of small (less than 2 mm) andlarge (greater than 2 mm) displacing wt, ssaVand sseG mutant SCVs between 4 h and 6 hp.i., and between 6 h and 8 h p.i. The numberof SCVs for each category is indicated abovethe bar, as is the P-value from comparingsseG and ssaV mutant SCVs with wt SCVswithin the same time period.B. Trajectories of all vacuoles sampled,containing wt, ssaV and sseG mutantbacteria. SCV trajectories were reoriented tostart at x,y = 0 in a standardized grid; smalldisplacing SCVs are in red and largedisplacing SCVs are in black.C. Images from Supplementary materialMovies S2–4. ManII-EGFP-expressing HeLacells, infected with wt (upper panel), sseGmutant (middle panel) or ssaV mutant (lowerpanel) DsRed-expressing S. Typhimurium.The first image shows full SCV trajectoriessuperimposed on the merged image at 0 min;the consecutive images are 5 min apart.Scale bar, 5 mm. Images were acquired everymin for 20 min.
SPI-2 restricts SCV motility 2523
© 2007 The AuthorsJournal compilation © 2007 Blackwell Publishing Ltd, Cellular Microbiology, 9, 2517–2529

maximum displacement observed for a wt vacuole was4.85 mm (mean displacement = 1.49 � 0.15 mm, n = 30).
Vacuoles containing sseF or sseFG double mutant bac-teria that were imaged between 4 and 8 h p.i. showed analmost indistinguishable phenotype to that observed withsseG (Supplementary Fig. S1). The greater number ofssaV, sseG, sseF and sseFG SCVs showing large dis-placements relative to wt SCVs could be due to differ-ences in directionality, speed, or a combination of both. Todetermine SCV directionality and speed, wt, sseG andssaV vacuoles were imaged every 5 s over 5 min periodsbetween 6 h and 8 h p.i. SCVs were then grouped asshowing large or small displacements. Because we wereinterested in analysing the speed and directionality of theless frequently observed wt SCVs undergoing large dis-placements and ssaV and sseG SCVs showing small
displacements, infected cells were intentionally sampledto obtain a representative number of these more uncom-mon events.
As for the experiments shown in Fig. 6, the direction ofSCV movement was first examined by tracing trajectoriesof SCVs having large or small displacements, after theyhad been reorientated so that their initial displacementvectors within a normalized grid started at x,y = 0, positivefor x and y in the first vector. Visual inspection of trajec-tories revealed that irrespective of genotype, SCVs under-going large displacements moved within a 15 mm radius(Fig. 7A). Furthermore, regardless of the extent of dis-placement or bacterial genotype, movement occurred inall quadrants of the grid (Fig. 7A). This indicates that therewas no significant impact of SCV directionality on theirmotility. To analyse this further, we quantified the direc-
Fig. 7. Analysis of wt, ssaV and sseG vacuole directionality and speed between 6 h and 8 h p.i. SCVs were imaged every 5 s for 5 min.A. Trajectories of small and large displacing vacuoles containing wt, ssaV and sseG mutant bacteria. Trajectories were reoriented to start atx,y = 0 with the first displacement vector pointing in the same direction (+x, +y) in a standardized grid. The number of SCVs examined and theaverage cosine are indicated for each category.B. Mean speeds of small and large displacing vacuoles containing wt, ssaV and sseG bacteria.C. Scatter plot in which the speeds of individual 5 s movements of vacuoles containing wt, sseG and ssaV bacteria undergoing largedisplacements were plotted against the distance of the vacuole from the Golgi centroid at the end of its 5 s movement. Spearman correlationR-value and P-values are indicated.
2524 A. E. Ramsden et al.
© 2007 The AuthorsJournal compilation © 2007 Blackwell Publishing Ltd, Cellular Microbiology, 9, 2517–2529

tionality of SCV motility by calculating the cosine of theinternal angle between each pair of consecutive displace-ment vectors. Regardless of the bacterial genotype, thedifferences between the mean cosine values of SCVshaving large or small displacements were minimal(Fig. 7A). Furthermore, the mean cosine values wereclose to zero, which confirms that the SCVs moved ran-domly regardless of genotype and motility.
Analysis of SCV speeds revealed that, irrespective ofbacterial genotype, SCVs undergoing large displacementsmoved faster than those undergoing small displacements,and that the small number of wt SCVs classified as havinglarge displacements travelled at similar speeds to sseGSCVs in the same category (Fig. 7B). Vacuoles containingssaV mutant bacteria that showed large displacementsmoved on average at faster speeds (Fig. 7B). Therefore,SCVs that showed large displacements did so becausethey moved faster, rather than exhibiting altered direction-ality. This implies that the SPI-2 T3SS system and SseGinfluence SCV motility by restricting vacuole speed.
We next investigated SCV speed in relation to the Golginetwork. Each 5 s SCV displacement was classifiedaccording to whether it brought the vacuole closer to theMannII-EGFP centroid or further away. As for the earlystage of infection, there were no significant differencesbetween the speeds of vacuoles containing wt, sseG orssaV mutant bacteria moving in centripetal and centrifugaldirections (data not shown). A scatter plot was madebetween the speed of each SCV and the distance fromthe Golgi centroid at the end of each 5 s imaging period.No relationship between speed and distance fromthe Golgi was observed for SCVs undergoing small dis-placements (data not shown). However, a correlation(R = 0.596) was obtained with wt SCVs displaying largedisplacements (Fig. 7C). This indicates that motility of wtSCVs is restricted when they are within close proximity tothe Golgi, but not when they are further away. If SseG onlyfunctions close to the Golgi network, distance from theGolgi should have no effect on the speed of sseG mutantSCVs and indeed this is what was observed (Fig. 7C).This result indicates that SseG acts by restricting themotility of SCVs that are within the proximity of the Golgi,but that it does not limit the motility of SCVs that arefurther away.
Discussion
During the first h following invasion of epithelial cells by S.Typhimurium, the majority of SCVs mature into a compart-ment that has some characteristics of late endosomes butwhich does not interact with lysosomes (Meresse et al.,1999a). During this period, SCVs migrate centripetallyfrom the cell periphery to a perinuclear location. Peri-nuclear migration involves the recruitment of active Rab7,
its effector RILP, the dynein motor (with which RILP isknown to interact) and an intact microtubule network(Meresse et al., 1999b; Guignot et al., 2004; Harrisonet al., 2004; Marsman et al., 2004). This suggests that likechlamydial inclusions (Grieshaber et al., 2003), nascentSCVs engage the dynein motor and undergo minus-enddirected movement towards the MTOC. In the presentstudy we have used live microscopy of infected cells toshow that movement of these early SCVs is saltatory, andthat they undergo frequent changes in direction. Net cen-tripetal migration is caused by a greater number of cen-tripetal to centrifugal movements, rather than increasedspeed of SCVs when moving in a centripetal direction.Such bidirectional movements are typical of manyorganelles (Vale et al., 1992) and probably reflect an alter-nating cycle of recruitment or activation of plus-enddirected kinesin, and minus-end directed dynein motorson the SCV. Hence, net centripetal migration of SCVs tothe MTOC/Golgi region would occur if the overall balanceof active motors on the SCV favours dynein. It is alsopossible that dynamic instability of microtubules mightcontribute to SCV movement, as in the case of phago-some movement in macrophages (Blocker et al., 1998).Relatively little is known about the intracellular motility ofbacterial pathogens that are enclosed by a vacuolarmembrane. Chlamydia trachomatis migrates to the MTOCat a speed of approximately 0.1 mm s-1 (Grieshaber et al.,2003). SCVs are considerably larger than Chlamydiainclusions, and the average speeds during this stageof infection are considerably lower (approximately0.02 mm s-1).
Previous work from our laboratory showed that by 8 hp.i., the majority of SCVs form a microcolony that isclosely associated with the Golgi apparatus. In HeLa cellsthe Golgi comprises a compact array of stacks positionedclose to the MTOC on one side of the nucleus. In this workwe observed that exposure of cells to BFA shortly afterinfection resulted in a greater number of vacuoles con-taining wt bacteria within 5 mm of the MTOC. This is con-sistent with the observation that in infected HeLa cells, themorphology of the Golgi apparatus is frequently distorted(Salcedo and Holden, 2003). Both observations suggestthat SCVs and Golgi membranes compete for a positionclose to the MTOC and that replicating bacteria physicallyocclude Golgi membranes from occupying their normalposition in the cell. The Golgi is a highly dynamicorganelle which undergoes continuous growth (throughanterograde transport) and reconsumption (through retro-grade transport) by the ER. Anterograde transport pro-ceeds from ER exit sites to the pericentrosomal region bydynein-mediated transport of Golgi membranes on micro-tubules (Cole et al., 1996; Presley et al., 1997). It is pos-sible that SCVs migrating from the cell periphery towardsthe MTOC are blocked by the Golgi apparatus, and that
SPI-2 restricts SCV motility 2525
© 2007 The AuthorsJournal compilation © 2007 Blackwell Publishing Ltd, Cellular Microbiology, 9, 2517–2529

over time bacterial cell division leads to the formation of amicrocolony that in turn gradually blocks anterogradetraffic of Golgi membranes, giving rise to the frequentlyobserved crescent- and doughnut-shaped Golgi ininfected cells (Salcedo and Holden, 2003).
The SPI-2 T3SS and its effector SseG have an importantrole in the SCV–Golgi association phenotype, becausevacuoles containing corresponding mutant strains aremainly scattered throughout the cell at this time-point(Salcedo and Holden, 2003). This raised the questionwhether vacuoles containing SPI-2 mutant bacteria fail toundergo centripetal migration following invasion, or if thisoccurs normally, but is followed by centrifugal movements,resulting in their scattered distribution in the cell. We foundthat vacuoles containing mutant bacteria localized to theMTOC/Golgi region with similar kinetics to those containingwt bacteria, but, if the bacteria lacked SseG, the SPI-2T3SS, or an intact Golgi apparatus, vacuoles subsequentlyrelocalized throughout the cell, resulting in a scatteredphenotype. These observations are in agreement withprevious results indicating that SPI-2 T3SS is required forSCV maintenance in a perinuclear location (Salcedo andHolden, 2003; Abrahams et al., 2006).
Live microscopy of infected epithelial cells revealed thatthe motility of SCVs changes during the course ofinfection. Following their initial slow saltatory migrationtowards the MTOC, the majority of vacuoles containing wtbacteria in the MTOC/Golgi region became relativelyimmobile. In contrast, between 6 and 8 h p.i. the majorityof vacuoles containing SPI-2 mutant bacteria and a smallproportion of wt SCVs were much more motile (displacingas much as 10 mm in 20 min), and moved erratically athigher speeds in a MT-dependent manner throughout thecell. Evidently, the lack of SseG or a functional SPI-2T3SS results in an imbalance of motor activity on SCVs,causing their erratic and rapid movement in the cell. Thespeeds of these SCVs (0.06–0.09 mm s-1) is neverthelessmuch slower than those of bacterial pathogens whichescape their vacuoles and polymerize actin at one pole oftheir cell surfaces to move within the cytoplasm. Actin-based motility of Listeria, Shigella, Rickettsia, Burkhold-eria and Mycobacterium generates speeds of up to1.45 mm s-1 depending on pathogen and cell type, andsubcellular location of the bacterium (Lacayo and Theriot,2004; Stevens et al., 2006).
Interestingly, the speed of motile vacuoles containing wtbut not mutant bacteria was correlated with their proximityto the Golgi, moving at higher speeds when they werefurther away from this organelle. This provides evidencethat SseG acts to restrict the speed of SCVs that arelocated close to the Golgi, and suggests a tethering func-tion for SseG in this region of the cell. Because we alsoshow that Golgi disruption with BFA affects SCV position-ing with similar kinetics to that of a SPI-2 mutant, it is
possible that SseG might tether SCVs directly to Golgimembranes or associated molecules. Alternatively, SseGmight be directly involved in microtubule motor recruit-ment, and persistent localization of SCVs in this region ofthe cell could be achieved through continuous dynein-based activity (Abrahams et al., 2006).
The localization of vacuoles containing wt bacteria tothe Golgi or MTOC region clearly requires factors otherthan SseG. One of these is another SPI-2 T3SS effector,SseF (a membrane spanning protein with 30% amino acididentity to SseG). sseF mutants have an identical pheno-type to sseG mutants (Abrahams et al., 2006; Deiwicket al., 2006) and both genetic and biochemical evidenceexists for a functional interaction between these proteins(Deiwick et al., 2006). Both proteins localize mainly to theSCV membrane and cytoplasmic domains have beenidentified that are necessary for Golgi localization of SCVs(Salcedo and Holden, 2003; Abrahams et al., 2006).These proteins are likely to form a complex that interactswith host molecules to mediate tethering directly or indi-rectly through the control of microtubule motors. However,because the molecular mechanism of these two proteinsremains unknown, whether or not SseG and SseF play adirect role in preventing movement remains to beelucidated. Although SseG and SseF exert a strong influ-ence on SCV motility, the impact of the absence of theseproteins is neither cumulative nor as pronounced as thatobserved with the SPI-2 null mutant. This indicates thatother bacterial effectors also contribute to the control ofSCV motility in an SseG/SseF-independent manner.
Another major question that remains to be answeredconcerns the physiological significance of the localizationof SCVs in the MTOC/Golgi region. C. trachomatis, Bru-cella abortus and Legionella pneumophila all interceptmembrane traffic at different stages of the secretorypathway (Hackstadt et al., 1996; Kagan and Roy, 2002;Carabeo et al., 2003; Celli et al., 2005), and one possibilityis that fusion between SCVs and Golgi vesicular trafficmight provide a source of nutrients for bacterial replication.However, although SCVs are often found in close apposi-tion to Golgi membranes, and bacteria require an intactGolgi for replication, no evidence currently exists for theinterception of vesicular traffic from the Golgi to SCVs(Salcedo and Holden, 2003; Kuhle et al., 2006).
Experimental procedures
Bacterial strains and growth conditions
Salmonella enterica serovar Typhimurium wt strain NCTC 12023(Wray and Sojka, 1978) and its isogenic mutant derivativesssaV::aphT (ssaV); (Deiwick et al., 1998) sseG::aphT (sseG);sseF::aphT (sseF) (Hensel et al., 1998) and sseFG::aphT(sseFG) (Deiwick et al., 2006) were used in this study. The sseGand sseF mutants have been shown before to be non-polar
2526 A. E. Ramsden et al.
© 2007 The AuthorsJournal compilation © 2007 Blackwell Publishing Ltd, Cellular Microbiology, 9, 2517–2529

(Hensel et al., 1998). Bacteria were grown in Luria–Bertanimedium supplemented with ampicillin (50 mg ml-1) or kanamycin(50 mg ml-1) where appropriate.
Cell culture and bacterial infection
HeLa (clone HtTA1) cell line was obtained from the EuropeanCollection of Cell Cultures (ECACC). Cells were maintainedin Dulbecco’s modified Eagle’s medium (DMEM) containingglutamax (Invitrogen) and supplemented with 10% foetal calfserum (FCS; Sigma) at 37°C in a humidified atmosphere of 5%CO2 in air.
For bacterial infection, HeLa cells were seeded at a density ofapproximately 5 ¥ 104 cells per well in 24-well microtiter plates16–20 h before infection. The cells were infected with S. Typh-imurium strains grown to late-logarithmic phase, as described(Beuzon et al., 2000). In order to follow a synchronized popula-tion of bacteria, host cells were washed after 15 min of exposureto S. Typhimurium and subsequently incubated for 1 h in DMEMwith 10% (v/v) FCS containing gentamicin (100 mg ml-1), to killextracellular bacteria. The concentration of gentamicin in themedium was kept at 16 mg ml-1 for the rest of the experiment.
Antibodies and reagents
The goat polyclonal anti-Salmonella antibody CSA-1 was pur-chased from Kirkegaard and Perry Laboratories (Gaithesburg,MD) and was used at a dilution of 1:1000. The rabbit anti-giantinantibody (Berkeley Antibody Company) was used at a dilution of1:1000. Mouse monoclonal anti-g-tubulin antibody (Sigma; cloneGTU-88), was used at a dilution of 1:800. The rat anti-a-tubulinantibody (clone YL1/2 MCAP77G) was purchased from Serotec(Oxford, UK) and was used at a dilution of 1:200. Bound anti-bodies were detected using Cyanine 2 (Cy2)-, Cyanine 5 (Cy5-)and rhodamine red-X (RRX)-conjugated donkey anti-mouse,anti-rabbit and anti-goat antibodies (Jackson ImmunoresearchLaboratories) and used at a dilution of 1:200.
Brefeldin A and nocodazole were obtained from Sigma. Stocksolutions were made in dimethyl sulphoxide (DMSO) and kept at-20°C. Drugs were added directly to the culture medium.Working concentrations were 5 mg ml-1 for both BFA andnocodazole. To enable microtubule depolymerization cells wereincubated for 20 min at 4°C to depolymerize microtubules, andthen returned to 37°C in the presence of nocodazole (Cole et al.,1996). Under these conditions microtubules were depolymerizedwithin 30 min, as detected with an anti-a-tubulin antibody (datanot shown). Preliminary experiments confirmed that nocodazoletreatment does not affect S. Typhimurium invasion (data notshown). To determine whether microtubules are involved in themigration of SCVs to the Golgi region, cells were incubated withnocodazole for 1 h prior to infection. For determination ofmicrotubule-dependent movement after initial migration of SCVs,cells were treated with nocodazole at 2 h p.i. BFA was added tocell cultures 15 min after addition of bacteria.
Immunofluorescence microscopy
For immunofluorescence microscopy, cell monolayers were fixedin methanol at -20°C for 5 min. Cells were then washed threetimes with phosphate-buffered saline, and labelled for immuno-
fluorescence microscopy as previously described (Beuzon et al.,2000). Cell preparations were examined by confocal laser scan-ning microscopy (LSM510, Zeiss). Determination of distances ofSCVs from the MTOC (g-tubulin labelling) was achieved by scan-ning individual cells from apical to basal surface, identifying thelocation of the MTOC and then determining the distance of eachSCV from the g-tubulin labelling in the x/y plane as being eitherwithin or greater than 5 mm from the MTOC. Labelling of theMTOC using the anti-g-tubulin antibody required methanol fixa-tion; this leads to the collapse of apical membranes, resulting inflattened cell preparations and some loss of three-dimensionalstructure. Consequently, determination of bacterial distance fromthe MTOC could only be achieved in the x/y plane. Each infectionwas performed in triplicate and more than 50 infected cells wereanalysed for each experiment.
Live-cell imaging
HeLa cells transfected with a vector encoding MannosidaseII-pEGFP-N1 (pMannII-EGFP) were infected with wt sseG, sseF,sseFG or ssaV mutant strains of S. Typhimurium carrying thepDsRed plasmid. This plasmid expresses a fluorescent-optmizedDsRed protein under the control of the arabinose-inducible PBAD
promoter (Sorensen et al., 2003); MannII is a Golgi residentprotein, mainly localized at the medial portion of the stack(Novikoff et al., 1983). Labelling of MannII-EGFP-expressingHeLa cells with anti-g-tubulin and anti-giantin antibodies con-firmed the close proximity of these markers (data not shown).
For live-cell imaging experiments, HeLa cells were seeded at adensity of approximately 8 ¥ 104 cells per dish onto 35 mm glass-bottom culture dishes (MatTek, Ashland, MA), 16–20 h beforetransfection. The cells were then transfected for 20 h withpMannII-EGFP by using the jetPEI reagent (Qbiogene, USA),following manufacturer’s instructions. Cells were infected with S.Typhimurium strains as described above. Before imaging, cellswere washed and then incubated in imaging medium (DMEMwithout phenol red, containing 10% FCS, 110 mg ml-1 sodiumpyruvate, 25 mM HEPES, 10 mM glutamine, 0.2% arabinose and20 mg ml-1 gentamicin). Culture dishes were then sealed withparafilm (Pechiney, Menasha, WI, USA) and transferred to thestage of a Zeiss Axiovert 200 M microscope (Carl Zeiss, AG,Germany) located in a XL-2 temperature controlled incubator at37°C. Samples were illuminated through a neutral density filter(Chroma Technology) and imaged with an ¥63 oil objective.Images were captured sequentially with an ORCA AG DigitalCCD Camera (Hamamatsu Photonics) using external filterwheels to switch between excitation/emission combinations of480/525 for GFP and 565/620 for DsRed (Chroma Technology).Volocity software (Improvision) was used for both recording andimage processing.
Analysis of SCV motility
For qualitative analysis of SCV motility, an imaging frequency ofone frame per min for 20–60 min was used. For quantitativeanalysis of SCV movement, an imaging frequency of 12 framesper min for up to 5 min was used. In each frame of the time-lapsesequences the x/y positions of the SCV and Golgi were estimatedby identifying the centroid of the DsRed and MannII-EGFP fluo-rescence using Volocity software (Improvision).
SPI-2 restricts SCV motility 2527
© 2007 The AuthorsJournal compilation © 2007 Blackwell Publishing Ltd, Cellular Microbiology, 9, 2517–2529

To classify SCVs as undergoing large or small displacements,the difference between the maximum SCV displacement from theinitial starting position was determined for each SCV trajectory.Values greater than 2 mm were classified as large displacements,while those with a value less than 2 mm were considered to besmall displacements. SCV speeds for a single trajectory werecalculated by dividing the total distance that the SCV travelleddivided by the time of analysis. The directionality of SCV move-ment was evaluated essentially as described by Lacayo andTheriot (2004). Briefly, we evaluated directionality by plotting thexy co-ordinates of each SCV with all trajectories reorientated tostart at x,y = 0 and the first displacement vector pointing in thesame direction (+x, +y). To quantify the directionality of SCVmovement, the cosine of the internal angle between displace-ment vectors was calculated and the values were averaged foreach group of SCVs.
Statistical analysis
All bar-graphs show the mean � the standard error of the meanfor three independent experiments. A two-tailed unpaired stu-dent’s t-test was used to analyse all of the data sets apart fromthe live-imaging analysis of the displacement of SCVs over20 min (Fig. 6) and the live imaging analysis of SCV speedverses distance from the Golgi. In these cases, a Fishers exacttest and the Spearman correlation test were used respectively.Probabilities (p) values of 0.05 or less were consideredsignificant. All statistical analysis was performed using Prism 4software (GraphPad Software, San Diego, CA).
Acknowledgements
We are very grateful to Michael Way and Jennifer Lippincott-Schwartz for helpful discussions. We thank Antonella de Matthiasand Dirk Bumann for providing plasmids. This work was sup-ported by grants from the Medical Research Council (UK) andWellcome Trust to D.W.H. A.E.R. is supported by a WellcomeTrust studentship and Universities UK Overseas ResearchAward. L.J.M. was supported by fellowships from the EuropeanMolecular Biology Organization (ALTF-39-2005) and the Euro-pean Commission (MEIF-CT-2006-023707).
References
Abrahams, G.L., and Hensel, M. (2006) Manipulating cellulartransport and immune responses: dynamic interactionsbetween intracellular Salmonella enterica and its host cells.Cell Microbiol 8: 728–737.
Abrahams, G.L., Muller, P., and Hensel, M. (2006) Functionaldissection of SseF, a type III effector protein involved inpositioning the salmonella-containing vacuole. Traffic 7:950–965.
Beuzon, C.R., Meresse, S., Unsworth, K.E., Ruiz-Albert, J.,Garvis, S., Waterman, S.R., et al. (2000) Salmonella main-tains the integrity of its intracellular vacuole through theaction of SifA. EMBO J 19: 3235–3249.
Blocker, A., Griffiths, G., Olivo, J.C., Hyman, A.A., andSeverin, F.F. (1998) A role for microtubule dynamics inphagosome movement. J Cell Sci 111: 303–312.
Boucrot, E., Henry, T., Borg, J.P., Gorvel, J.P., and Meresse,
S. (2005) The intracellular fate of Salmonella depends onthe recruitment of kinesin. Science 308: 1174–1178.
Carabeo, R.A., Mead, D.J., and Hackstadt, T. (2003) Golgi-dependent transport of cholesterol to the Chlamydia tra-chomatis inclusion. Proc Natl Acad Sci USA 100: 6771–6776.
Celli, J., Salcedo, S.P., and Gorvel, J.P. (2005) Brucellacoopts the small GTPase Sar1 for intracellular replication.Proc Natl Acad Sci USA 102: 1673–1678.
Cirillo, D.M., Valdivia, R.H., Monack, D.M., and Falkow, S.(1998) Macrophage-dependent induction of the Salmonellapathogenicity island 2 type III secretion system and its rolein intracellular survival. Mol Microbiol 30: 175–188.
Cole, N.B., Sciaky, N., Marotta, A., Song, J., and Lippincott-Schwartz, J. (1996) Golgi dispersal during microtubuledisruption: regeneration of Golgi stacks at peripheral endo-plasmic reticulum exit sites. Mol Biol Cell 7: 631–650.
Deiwick, J., Nikolaus, T., Shea, J.E., Gleeson, C., Holden,D.W., and Hensel, M. (1998) Mutations in Salmonellapathogenicity island 2 (SPI2) genes affecting transcriptionof SPI1 genes and resistance to antimicrobial agents.J Bacteriol 180: 4775–4780.
Deiwick, J., Salcedo, S.P., Boucrot, E., Gilliland, S.M., Henry,T., Petermann, N., et al. (2006) The translocated Salmo-nella effector proteins SseF and SseG interact and arerequired to establish an intracellular replication niche.Infect Immun 74: 6965–6972.
Farquhar, M.G., and Palade, G.E. (1981) The Golgi appara-tus (complex)-(1954–81) – from artifact to center stage.J Cell Biol 91: 77s–103s.
Grieshaber, S.S., Grieshaber, N.A., and Hackstadt, T. (2003)Chlamydia trachomatis uses host cell dynein to traffic tothe microtubule-organizing center in a p50 dynamitin-independent process. J Cell Sci 116: 3793–3802.
Guignot, J., Caron, E., Beuzon, C., Bucci, C., Kagan, J., Roy,C., and Holden, D.W. (2004) Microtubule motors controlmembrane dynamics of Salmonella-containing vacuoles.J Cell Sci 117: 1033–1045.
Hackstadt, T., Rockey, D.D., Heinzen, R.A., and Scidmore,M.A. (1996) Chlamydia trachomatis interrupts an exocyticpathway to acquire endogenously synthesized sphingomy-elin in transit from the Golgi apparatus to the plasmamembrane. EMBO J 15: 964–977.
Harrison, R.E., Brumell, J.H., Khandani, A., Bucci, C., Scott,C.C., Jiang, X., et al. (2004) Salmonella impairs RILPrecruitment to Rab7 during maturation of invasionvacuoles. Mol Biol Cell 15: 3146–3154.
Hensel, M., Shea, J.E., Waterman, S.R., Mundy, R.,Nikolaus, T., Banks, G., et al. (1998) Genes encoding puta-tive effector proteins of the type III secretion system ofSalmonella pathogenicity island 2 are required for bacterialvirulence and proliferation in macrophages. Mol Microbiol30: 163–174.
Kagan, J.C., and Roy, C.R. (2002) Legionella phagosomesintercept vesicular traffic from endoplasmic reticulum exitsites. Nat Cell Biol 4: 945–954.
Kronebusch, P.J., and Singer, S.J. (1987) The microtubule-organizing complex and the Golgi apparatus areco-localized around the entire nuclear envelope of inter-phase cardiac myocytes. J Cell Sci 88: 25–34.
Kuhle, V., Abrahams, G.L., and Hensel, M. (2006) Intracellu-
2528 A. E. Ramsden et al.
© 2007 The AuthorsJournal compilation © 2007 Blackwell Publishing Ltd, Cellular Microbiology, 9, 2517–2529

lar Salmonella enterica redirect exocytic transport pro-cesses in a Salmonella pathogenicity island 2-dependentmanner. Traffic 7: 716–730.
Lacayo, C.I., and Theriot, J.A. (2004) Listeria monocytoge-nes actin-based motility varies depending on subcellularlocation: a kinematic probe for cytoarchitecture. Mol BiolCell 15: 2164–2175.
Lippincott-Schwartz, J., Yuan, L.C., Bonifacino, J.S., andKlausner, R.D. (1989) Rapid redistribution of Golgi proteinsinto the ER in cells treated with brefeldin A: evidence formembrane cycling from Golgi to ER. Cell 56: 801–813.
Marsman, M., Jordens, I., Kuijl, C., Janssen, L., and Neefjes,J. (2004) Dynein-mediated vesicle transport controls intra-cellular Salmonella replication. Mol Biol Cell 15: 2954–2964.
Meresse, S., Steele-Mortimer, O., Moreno, E., Desjardins,M., Finlay, B., and Gorvel, J.P. (1999a) Controlling thematuration of pathogen-containing vacuoles: a matter oflife and death. Nat Cell Biol 1: 183–188.
Meresse, S., Steele-Mortimer, O., Finlay, B.B., and Gorvel,J.P. (1999b) The rab7 GTPase controls the maturation ofSalmonella typhimurium-containing vacuoles in HeLa cells.EMBO J 18: 4394–4403.
Novikoff, P.M., Tulsiani, D.R., Touster, O., Yam, A., andNovikoff, A.B. (1983) Immunocytochemical localization ofalpha-D-mannosidase II in the Golgi apparatus of rat liver.Proc Natl Acad Sci USA 80: 4364–4368.
Presley, J.F., Cole, N.B., Schroer, T.A., Hirschberg, K., Zaal,K.J., and Lippincott-Schwartz, J. (1997) ER-to-Golgi trans-port visualized in living cells. Nature 389: 81–85.
Salcedo, S.P., and Holden, D.W. (2003) SseG, a virulenceprotein that targets Salmonella to the Golgi network. EMBOJ 22: 5003–5014.
Schlumberger, M.C., and Hardt, W.D. (2005) Triggeredphagocytosis by Salmonella: bacterial molecular mimicryof RhoGTPase activation/deactivation. Curr Top MicrobiolImmunol 291: 29–42.
Shea, J.E., Hensel, M., Gleeson, C., and Holden, D.W.(1996) Identification of a virulence locus encoding asecond type III secretion system in Salmonellatyphimurium. Proc Natl Acad Sci USA 93: 2593–2597.
Sorensen, M., Lippuner, C., Kaiser, T., Misslitz, A., Aebi-scher, T., and Bumann, D. (2003) Rapidly maturing redfluorescent protein variants with strongly enhanced bright-ness in bacteria. FEBS Lett 552: 110–114.
Stevens, J.M., Galyov, E.E., and Stevens, M.P. (2006) Actin-dependent movement of bacterial pathogens. Nat RevMicrobiol 4: 91–101.
Tassin, A.M., Paintrand, M., Berger, E.G., and Bornens, M.(1985) The Golgi apparatus remains associated withmicrotubule organizing centers during myogenesis. J CellBiol 101: 630–638.
Vale, R.D., Malik, F., and Brown, D. (1992) Directional insta-bility of microtubule transport in the presence of kinesin
and dynein, two opposite polarity motor proteins. J Cell Biol119: 1589–1596.
Wray, C., and Sojka, W.J. (1978) Experimental Salmonellatyphimurium infection in calves. Res Vet Sci 25: 139–143.
Supplementary material
The following supplementary material is available for this articleonline:Fig. S1. Live cell imaging analysis of sseF and sseFG mutantSCVs. Percentage of small (less than 2 mm) and large (greaterthan 2 mm) displacing sseF and sseFG SCVs between 4 h and 6h p.i., and between 6 h and 8 h p.i.; number of SCVs in eachcategory is indicated above the bar, as is the P-value from com-paring the sseF and sseFG mutant SCVs with wt SCVs within thesame time period. Images were acquired every min for 20 min.Movie S1. Live cell imaging of DsRed wt S. Typhimurium andMannII-EGFP. Supplement to Fig. 2B. HeLa cells expressingMannII-EGFP were infected with DsRed expressing wt S. Typh-imurium and imaged every min for 1 h. Two bacteria move slowlytowards the MannII-EGFP marker. Movie is 300 times acceler-ated relative to real time.Movie S2. Live cell imaging of DsRed wt S. Typhimurium andMannII-EGFP at 6 h 14 min. Supplement to Fig. 6C. HeLa cellsexpressing MannII-EGFP were infected with DsRed expressingwt S. Typhimurium and imaged every min for 20 min. Movie is180 times accelerated relative to real time. Wt SCVs are seen inclose proximity to the ManII-EGFP label and show restrictedmovement.Movie S3. Live cell imaging of DsRed sseG mutant S. Typhimu-rium and MannII-EGFP at 7 h 27 min. Supplement to Fig. 6C.HeLa cells expressing MannII-EGFP were infected with DsRedexpressing sseG S. Typhimurium and imaged every min for20 min. Movie is 180 times accelerated relative to real time.Some SCVs are observed in close proximity to the ManII-EGFPmarker and show little movement, and several SCVs move dra-matically in and out of the focal plane.Movie S4. Live cell imaging of DsRed ssaV mutant S. Typhimu-rium and MannII-EGFP at 7 h 32 min. Supplement to Fig. 6C.HeLa cells expressing MannII-EGFP were infected with DsRedexpressing ssaV S. Typhimurium and imaged every min for20 min. Movie is 180 times accelerated relative to real time. Themajority of ssaV SCVs are observed to move erratically aroundthe cell; no ssaV SCVs are in close proximity to the ManII-EGFPmarker over the entire imaging time.
This material is available as part of the online article from:http://www.blackwell-synergy.com/doi/abs/10.1111/j.1462-5822.2007.00977.x
Please note: Blackwell Publishing is not responsible for thecontent or functionality of any supplementary materials suppliedby the authors. Any queries (other than missing material) shouldbe directed to the corresponding author for the article.
SPI-2 restricts SCV motility 2529
© 2007 The AuthorsJournal compilation © 2007 Blackwell Publishing Ltd, Cellular Microbiology, 9, 2517–2529
Copyright © 2022 FDOKUMEN