The Special Role of Rimes in the Description, Use ... - CiteSeerX
30
Journal of Experimental Psychology: General 1995, Vol. 124, No. 2, 107-136 Copyright 1995 by the American Psychological Association, Inc. 0096-3445/95/$3.00 The Special Role of Rimes in the Description, Use, and Acquisition of English Orthography Rebecca Treiman and John Mullennix Wayne State University Ranka Bijeljac-Babic University of Poitiers E. Daylene Richmpnd-Welty Wayne State University The links between spellings and sounds in a large set of English words with consonant- vowel-consonant phonological structure were examined. Orthographic rimes, or units con- sisting of a vowel grapheme and a final consonant grapheme, had more stable pronunciations than either individual vowels or initial consonant-plus-vowel units. In 2 large-scale studies of word pronunciation, the consistency of pronunciation of the orthographic rime accounted for variance in latencies and errors beyond that contributed by the consistency of pronunciation of the individual graphemes and by other factors. In 3 experiments, as well, children and adults made more errors on words with less consistently pronounced orthographic rimes than on words with more consistently pronounced orthographic rimes. Relations between spellings and sounds in the simple monomorphemic words of English are more predictable when the level of onsets and rimes is taken into account than when only graphemes and phonemes are considered. How are the spellings of English words related to their sounds? How do people use these spelling-sound relations when reading words? These questions have been the subject of much research over the last 30 years. It has been assumed that, at least for words that contain a single morpheme (or unit of meaning), the English writing system is basically Rebecca Treiman, John Mullennix, and E. Daylene Richmond- Welly, Department of Psychology, Wayne State University; Ranka Bijeljac-Babic, Department of Psychology, University of Poitiers, Poitiers, France. This research was supported by National Science Foundation Grant SBR-9020956, National Institutes of Health (NIH) Research Career Development Award HD 00769, NIH Grant HD 18387, and a Gershenson Faculty Fellowship from Wayne State University. John Mullennix was supported by NIH Grant DC 01667. The analyses were carried out, in part, while Rebecca Treiman was on sabbatical at the Medical Research Council Applied Psychology Unit, Cambridge, England; she expresses thanks for the use of their facilities. We are deeply grateful to Mark Seidenberg and Gloria Waters for sharing the McGill naming data with us. We also thank Joel Ager, Sally Andrews, Linda Bartoll, Renee Dudzinski, Ian Nimmo-Smith, Dennis Norris, Karalyn Patterson, David Pisoni, Eamon Strain, Pam Wilson, and Lin Zong for their contri- butions at various stages of the research. Sally Andrews, Judith Bowey, Brett Kessler, Sandy Pollatsek, and Mark Seidenberg made useful comments on a previous draft of the article. Some of these data were presented at the meeting of the Psychonomic Society in Washington, DC, November, 1993. For an ASCII file of the data from the naming studies of Part 2, together with the values for each word on the consistency variables and other measures, send a high-density formatted IBM diskette to Rebecca Treiman at the following address. Correspondence concerning this article should be addressed to Rebecca Treiman, Department of Psychology, Wayne State Uni- versity, 71 W. Warren Avenue, Detroit, Michigan 48202. Elec- tronic mail may be sent via Internet to [email protected]. alphabetic. That is, spelling-sound relations are best de- scribed in terms of links between individual graphemes and individual phonemes, where a grapheme is a letter or group of letters that corresponds to a single phoneme (e.g., Ven- ezky, 1970). For example, the single-letter grapheme b usually corresponds to the phoneme /b/, and the two-letter grapheme ea usually corresponds to the phoneme /i/. 1 Ac- cording to standard dual-route models of reading, skilled readers use links between graphemes and phonemes when pronouncing words (e.g., M. Coltheart, 1978; M. Coltheart, Curtis, Atkins, & Haller, 1993). Similarly, the acquisition of links between graphemes and phonemes is thought to be an important part of learning to read. However, just because the English writing system can be described, used, and learned as an alphabet, it does not necessarily follow that it must be described, used, and learned only at the level of graphemes and phonemes (Treiman, 1992). We argue here that a consideration of orthographic and phonological units that are larger than single graphemes and single phonemes can shed new light on the nature, use, and acquisition of the English writing system. Specifically, we claim that letter groups that corre- spond to the rimes of spoken syllables, or units that include the vowel and any following consonants, play an important role in adults' and children's pronunciation of printed words. The present hypothesis was suggested by evidence that the phonemes in spoken syllables are grouped into onset and rime units. Such evidence has been adduced by both lin- guists and psycholinguists and includes constraints on the distributions of phonemes in syllables, errors in the produc- 1 Key to notation: /i/ as in bead, lei bed, /e/ bade, /as/ bad, A/ bid, lot bone, /u/ boon, /// ship. 107
-
Upload
khangminh22 -
Category
Documents
-
view
3 -
download
0
Transcript of The Special Role of Rimes in the Description, Use ... - CiteSeerX
Journal of Experimental Psychology: General1995, Vol. 124, No. 2, 107-136
Copyright 1995 by the American Psychological Association, Inc.0096-3445/95/$3.00
The Special Role of Rimes in the Description, Use, and Acquisition ofEnglish Orthography
Rebecca Treiman and John MullennixWayne State University
Ranka Bijeljac-BabicUniversity of Poitiers
E. Daylene Richmpnd-WeltyWayne State University
The links between spellings and sounds in a large set of English words with consonant-vowel-consonant phonological structure were examined. Orthographic rimes, or units con-sisting of a vowel grapheme and a final consonant grapheme, had more stable pronunciationsthan either individual vowels or initial consonant-plus-vowel units. In 2 large-scale studies ofword pronunciation, the consistency of pronunciation of the orthographic rime accounted forvariance in latencies and errors beyond that contributed by the consistency of pronunciationof the individual graphemes and by other factors. In 3 experiments, as well, children andadults made more errors on words with less consistently pronounced orthographic rimes thanon words with more consistently pronounced orthographic rimes. Relations between spellingsand sounds in the simple monomorphemic words of English are more predictable when thelevel of onsets and rimes is taken into account than when only graphemes and phonemes areconsidered.
How are the spellings of English words related to theirsounds? How do people use these spelling-sound relationswhen reading words? These questions have been the subjectof much research over the last 30 years. It has been assumedthat, at least for words that contain a single morpheme (orunit of meaning), the English writing system is basically
Rebecca Treiman, John Mullennix, and E. Daylene Richmond-Welly, Department of Psychology, Wayne State University; RankaBijeljac-Babic, Department of Psychology, University of Poitiers,Poitiers, France.
This research was supported by National Science FoundationGrant SBR-9020956, National Institutes of Health (NIH) ResearchCareer Development Award HD 00769, NIH Grant HD 18387, anda Gershenson Faculty Fellowship from Wayne State University.John Mullennix was supported by NIH Grant DC 01667. Theanalyses were carried out, in part, while Rebecca Treiman was onsabbatical at the Medical Research Council Applied PsychologyUnit, Cambridge, England; she expresses thanks for the use oftheir facilities. We are deeply grateful to Mark Seidenberg andGloria Waters for sharing the McGill naming data with us. We alsothank Joel Ager, Sally Andrews, Linda Bartoll, Renee Dudzinski,Ian Nimmo-Smith, Dennis Norris, Karalyn Patterson, DavidPisoni, Eamon Strain, Pam Wilson, and Lin Zong for their contri-butions at various stages of the research. Sally Andrews, JudithBowey, Brett Kessler, Sandy Pollatsek, and Mark Seidenbergmade useful comments on a previous draft of the article. Some ofthese data were presented at the meeting of the PsychonomicSociety in Washington, DC, November, 1993.
For an ASCII file of the data from the naming studies of Part 2,together with the values for each word on the consistency variablesand other measures, send a high-density formatted IBM diskette toRebecca Treiman at the following address.
Correspondence concerning this article should be addressed toRebecca Treiman, Department of Psychology, Wayne State Uni-versity, 71 W. Warren Avenue, Detroit, Michigan 48202. Elec-tronic mail may be sent via Internet to [email protected].
alphabetic. That is, spelling-sound relations are best de-scribed in terms of links between individual graphemes andindividual phonemes, where a grapheme is a letter or groupof letters that corresponds to a single phoneme (e.g., Ven-ezky, 1970). For example, the single-letter grapheme busually corresponds to the phoneme /b/, and the two-lettergrapheme ea usually corresponds to the phoneme /i/.1 Ac-cording to standard dual-route models of reading, skilledreaders use links between graphemes and phonemes whenpronouncing words (e.g., M. Coltheart, 1978; M. Coltheart,Curtis, Atkins, & Haller, 1993). Similarly, the acquisition oflinks between graphemes and phonemes is thought to be animportant part of learning to read.
However, just because the English writing system can bedescribed, used, and learned as an alphabet, it does notnecessarily follow that it must be described, used, andlearned only at the level of graphemes and phonemes(Treiman, 1992). We argue here that a consideration oforthographic and phonological units that are larger thansingle graphemes and single phonemes can shed new lighton the nature, use, and acquisition of the English writingsystem. Specifically, we claim that letter groups that corre-spond to the rimes of spoken syllables, or units that includethe vowel and any following consonants, play an importantrole in adults' and children's pronunciation of printedwords.
The present hypothesis was suggested by evidence thatthe phonemes in spoken syllables are grouped into onset andrime units. Such evidence has been adduced by both lin-guists and psycholinguists and includes constraints on thedistributions of phonemes in syllables, errors in the produc-
1 Key to notation: /i/ as in bead, lei bed, /e/ bade, /as/ bad, A/ bid,lot bone, /u/ boon, /// ship.
107
108 TREIMAN, MULLENNIX, BIJELJAC-BABIC, RICHMOND-WELTY
tion of speech, and people's ability to learn word games thatbreak syllables at various points (see Fowler, Treiman, &Gross, 1993; Treiman, 1989; Treiman, Fowler, Gross,Berch, & Weatherston, 1995). The evidence suggests thatthe phonemes in a spoken syllable do not form a linearstring, each phoneme equally tied to the phoneme thatprecedes it and the phoneme that follows it. In a spokenCVC (consonant-vowel-consonant) syllable, the vowel hasa close bond with the following consonant, these two pho-nemes forming the rime of the syllable. The initial conso-nant or onset is less closely linked to the vowel.
This article has four parts. The topic of Part 1 is thedescription of English spelling-sound relations. Is Englishbest described as an alphabet or are orthographic unitscorresponding to onsets and rimes also important? To ad-dress this question, we present two analyses of the relationsbetween spellings and sounds in English words with CVCphonological structure. When we examine spelling-soundrelations at the level of single graphemes and single pho-nemes, we find, as other researchers have reported, thatvowel graphemes often have more than one possible pro-nunciation. For example, the grapheme ea is pronounced aslil in bead but as Is/ in head. In this and other cases,however, the consonant that follows the vowel helps tospecify the vowel's pronunciation. The grapheme ea issometimes pronounced as lei before /d/ but virtually neverhas the /el pronunciation before /p/. This special depen-dency between vowels and final consonants has not beensystematically documented in past research. Thus, eventhough English spelling is not all that regular at the level ofindividual graphemes and individual phonemes, it becomesmore regular when VC2 (vowel + final consonant) letterclusters are taken into account. The orthographic VC2 unitcorresponds, of course, to the rime of the spoken syllable.
In the next three parts of our study, we provide evidencethat adults and children take advantage of the relativelystable pronunciations of VC2 units when reading wordsaloud. The topic of Part 2 is the use of English spelling-sound relations by fluent adult readers. The data come fromtwo studies in which adults pronounced large numbers ofprinted words with CVC phonological structures. The la-tency and error data were pooled over subjects for eachword, and regression methods were used to study the lin-guistic factors associated with performance.
In Parts 3 and 4, we turn to more traditional small-scaleexperiments. In these experiments, the pronunciation con-sistency of the VC2 and QV (initial consonant + vowel)units in printed words with CVC phonological structureswere factorially manipulated. The two experiments reportedin Part 3 involved college students. In Part 4, we report howwe presented the same words used in one of the experimentswith adults to children in the first, second, third, and fifthgrades.
As mentioned earlier, the English writing system is typ-ically considered an alphabet, or a system in which spellingis linked to sound at the level of phonemes. We argue thatthis characterization of the system is incomplete. In English,the pronunciations of vowel graphemes are sometimes af-fected by the identity of the following consonants. As a
result, there is more stability in the pronunciations of or-thographic VC2 clusters than in the pronunciations of vowelgraphemes or the pronunciations of CjV clusters. From anearly age, readers take advantage of the relatively consistentpronunciations of orthographic rimes. Groups of letters thatcorrespond to rimes, therefore, play a special role in thedescription, learning, and use of the English writing system.
In addition to making an important theoretical point aboutthe nature of the English writing system and the way inwhich it is used by readers, we also seek to make twomethodological points through this research. First, an un-derstanding of the statistical characteristics of a to-be-learned system—in this case, the writing system of En-glish—is essential to an understanding of how the system islearned and used. Second, large-scale studies that are ana-lyzed using regression methods, like the naming studiespresented here, are an important complement to traditionalfactorial experiments.
Part 1: The Description of English Spelling-SoundRelations
Since the seminal work of Venezky (1970), the relationsbetween spellings and sounds in the monomorphemic wordsof English have generally been described at the level ofsingle graphemes and single phonemes. For example, thegrapheme ea is linked to the phoneme /i/; it has this pro-nunciation in numerous words such as bead and seamstress.The /e/ pronunciation of ea in head is atypical; it must belisted as an exception to a general rule. But is the /e/pronunciation of ea in head all that unusual? A look atVenezky's (1970) list of words with /e/ pronunciations ofeareveals a number of words with final d, including bread,dread, tread, and head. The /ed/ pronunciation of ead isactually not that uncommon. In contrast, ea is rarely pro-nounced as /el when it is followed by p. In this and othercases, the following consonant grapheme appears to affectthe pronunciation of a vowel grapheme.
Although the word lists compiled by Venezky (1970)suggest a role for VC2 units in the translation from spellingto sound, Venezky did not systematically examine the ex-tent to which the final consonant affects the pronunciationof the vowel, except for a few cases such as that of postvo-calic r. Other investigators (Stanback, 1992; Wylie &Durrell, 1970) have observed that a number of English VC2shave relatively stable pronunciations (although the results ofAronoff & Koch, 1993, suggest that only a few VC2s havevery highly consistent pronunciations in which the vowel ispronounced differently than it is in other contexts). Previousresearchers have not systematically compared the regularityof spelling-sound relations for VC2s to the regularity ofspelling—sound relations for CjVs, which is our goal in thecurrent study.
We designed the two analyses reported in Part 1 toexamine the links between spellings and sounds for a vari-ety of orthographic units, including individual consonantand vowel graphemes, VC2s, and CjVs. The primary ques-tion in both analyses was whether spelling-to-sound rela-tions are more regular for VC2 units than for C:V units.
SPECIAL ROLE OF RIMES 109
Analysis AMethod
The units of this analysis were the words of English whosespoken forms have a single initial consonant, a medial vowel, anda single final consonant, henceforth called CVC words. We fo-ciised on CVC words for several reasons. First, the CVC is thesimplest structure for which one can compare the stability ofpronunciation of the orthographic unit that contains a vowel and afollowing consonant to the stability of pronunciation of the ortho-graphic unit that contains a vowel and a preceding consonant. YetCVC spoken words are common in the English language. Some ofthe earliest words that young readers learn, such as cat and Mom,have a CVC structure in their spoken form. Also, because weplanned to use the CVC words of Analysis A in a naming studywith adults (Part 2), we wanted to restrict ourselves to a manage-able number of words. To select the CVC words for the analysis,we used a computerized version of the Merriam-Webster PocketDictionary (Nusbaum, Pisoni, & Davis, 1984). This dictionarycontained 19,750 entries. The pronunciation of each word wascoded in terms of 27 consonant phonemes and 18 vowel pho-nemes. We extracted from the dictionary those 1,329 words thathad a CVC pronunciation and that were likely to be known bycollege students.2 Although these words were similar in theirphonological structure, they varied in their orthographic structure.In particular, they were not always spelled as CVCs. Words suchas cat, home, and guise were included in our study. Two-mor-pheme words such as bees and vied were not included because theyare not listed as separate entries in the dictionary.
We examined the orthographic neighbors of each of the 1,329CVC words. A neighbor was defined in our study as a word thatshared one or more graphemes in the same position with the targetword. Our first analyses were restricted to neighbors that werethemselves monosyllabic. All monosyllabic words in the dictio-nary were included in these analyses, not just the CVC words.Several types of neighbors were examined: those that shared asingle grapheme with the target word—either the initial consonant(Ct), the vowel (V), or the final consonant (C2)—and those thatshared two adjacent graphemes with the target word—either theinitial consonant and the vowel (CjV) or the vowel and the finalconsonant (VC2). For each type of neighbor, we derived twomeasures to reflect how often the orthographic unit in the neighborwas pronounced in the same way as it was in the target word.These measures, which are discussed in more detail below, aremeasures of neighborhood consistency.
The first measure of neighborhood consistency, the type mea-sure, weighted each neighbor equally. It was simply the proportionof words in the neighborhood in which the pronunciation of theorthographic unit in the neighbor was the same as the pronuncia-tion of the orthographic unit in the target word. The type measurewas the number of friends relative to the total number of friendsplus enemies, where a friend is a word with the same orthographicunit and the same pronunciation and an enemy is a word with thesame orthographic unit and a different pronunciation. The secondmeasure of neighborhood consistency, the token measure,weighted each word in the neighborhood by its frequency ofoccurrence. Specifically, it was the summed frequency of thefriends relative to the total summed frequency of friends andenemies. Common words thus had a greater impact on the tokenmeasure than did rare words.
As an example, consider the Cx neighbors of heap. Cr neighborswere words that began with the same consonant letter or group ofconsonant letters as the target. (For words such as guise, u wascounted as a consonant letter because its presence ensures that the
word will be pronounced with initial /g/.) Thus, the Ct monosyl-labic neighbors of heap were all 118 single-syllable words in thedictionary that began with h, including hand, he, hour, and so on.The size of the monosyllabic Q neighborhood of heap is 118. In114 of these Q neighbors, h is pronounced as /h/, as it is in heap.The type measure of consistency was thus 114 out of 118, or .97.For the token measure, each neighbor was weighted by its fre-quency of occurrence. The Cj consistency of heap by tokens was.99. Hence, the great majority of words that share the h of heapalso share the /h/ pronunciation.
V neighbors were words that shared the vowel letter or letters ofthe target. The monosyllabic V neighbors of heap thus includedseam, bleat, dead, and breath. Because ea is pronounced differ-ently in a number of these words than it is in heap, the Vconsistency of heap was fairly low. By types, the V consistencyvalue was .62. By tokens, the value was even lower, .42. The valuewas lower by tokens than by types because words in which ea ispronounced with a vowel other than /i/ tend to be rather frequentin English. In calculating V neighborhoods, we considered final ea part of the vowel. The V neighbors of cake thus included baseand flame but not bat.
C2 neighbors were words that had the same final consonantletter or group of consonant letters as the target. For example, themonosyllabic C2 neighbors of heap were all of the single-syllablewords in the dictionary that ended with p. The consistency of theC2 of heap was very high, .99 by types and 1.00 by tokens.
Next we turn to neighbors that shared larger orthographic unitswith the target word. CjV monosyllabic neighbors were all single-syllable words in the dictionary that matched the target word inboth the initial consonant and the vowel. The C:V neighbors ofheap included heal, health, and head. Because hea is pronounceddifferently in a number of these words than it is in heap, the QVconsistency of heap was low, .33 by types and only .08 by tokens.
Finally, VC2 neighbors shared the vowel and final consonantletters of the target, as with leap and cheap for heap. The VC2
consistency of heap was 1.00 by types and by tokens. That is, allof the monosyllabic words in the neighborhood had the /ip/ pro-nunciation of eap, the same pronunciation as in heap. In calculat-ing VC2 neighborhoods, as in calculating V neighbors, we con-sidered final e part of the vowel.
We also calculated neighborhood consistency measures basedon all neighbors in the dictionary, not just the monosyllabic ones.In the calculations based on the full lexicon, the Cj neighbors ofheap included words of more than one syllable such as hammer aswell as single-syllable words such as hand. Cx neighbors were allwords that began with the same consonant grapheme as the target,and C2 neighbors were all words that ended with the same conso-nant grapheme as the target. V neighbors were calculated in twoways. Vj neighbors were those whose first vowel graphemematched that of the target word, and V2 neighbors were thosewhose last vowel grapheme matched that of the target word. Forexample, the Vx neighbors of heap include seam and meaty (butnot anneal), and the V2 neighbors of heap include seam and anneal(but not meaty). C1Vl neighbors were words whose first consonantand vowel were the same as those of the target, and V2C2 neigh-
2 Specifically, we used words that had a familiarity rating ofgreater than 4.0 on a 7-point scale in the study by Nusbaum,Pisoni, and Davis (1984). A total of 179 words were eliminatedfrom the analysis because they had familiarity ratings lower than4.0. These included words such as chon, rife, and pone. Themeanings of these words were unknown to the Indiana Universitystudents who participated in the rating study of Nusbaum et al. andare probably unknown to Wayne State University students as well.
110 TREIMAN, MULLENNIX, BIJELJAC-BABIC, RICHMOND-WELTY
bors were words whose last vowel and consonant were the same asthose of the target.
Results and Discussion
The top part of Table 1 shows the results of the consis-tency analysis based on monosyllabic neighbors only.3 Con-sider, first, the results for neighbors that shared a singlegrapheme with the target. Q neighbors were highly consis-tent by both types and tokens. About 95% of the words thatshared the Cj grapheme with the target had the same pro-nunciation of the G! unit. C2 neighbors were somewhatlower in consistency than Ct neighbors. Still, C2 neighborswere over 90% consistent. Neighbors that shared a vowelwith the target word were substantially lower in consistencythan neighbors that shared a consonant. The difference inconsistency between consonants and vowels was at least 30percentage points. This difference meshes with previousreports that the irregularity of English spelling-to-soundcorrespondence lies largely in the vowels (Berndt, Reggia,& Mitchum, 1987; Venezky, 1970).
Vowel consistency was substantially lower by tokens thanby types when monosyllabic neighbors were considered.This difference arose because CVC words with unusualvowel pronunciations tend to be common in the Englishlanguage, as witnessed by a small but significant negativecorrelation between vowel consistency and word frequencyfor the words of this study (median r across the variousmeasures of vowel consistency = —.10). When frequentmonosyllabic neighbors receive more weight than infre-quent neighbors, as in the token measure, the consistency ofvowel neighbors is thus especially low.
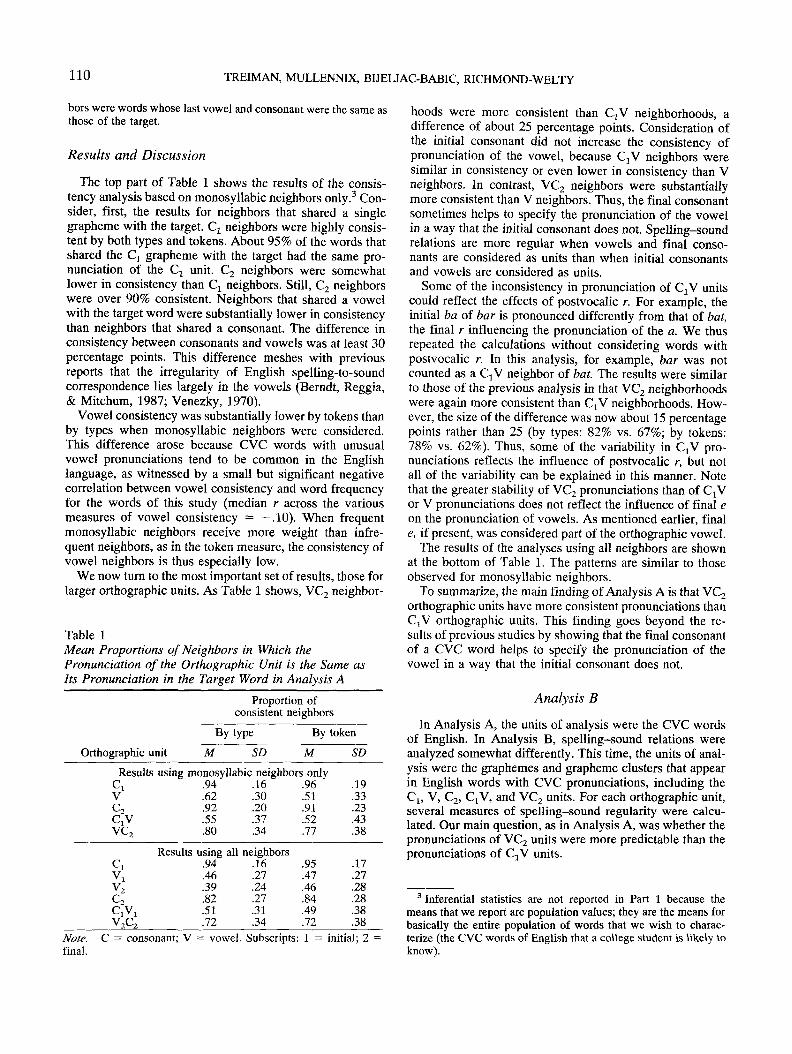
We now turn to the most important set of results, those forlarger orthographic units. As Table 1 shows, VC2 neighbor-
Table 1Mean Proportions of Neighbors in Which thePronunciation of the Orthographic Unit is the Same asIts Pronunciation in the Target Word in Analysis A
Proportion ofconsistent neighbors
By
Orthographic unit M
ResultsCtVC2c,vVC2
c,ViV2C2c,vtV2C2
type
SD
By
M
using monosyllabic neighbors only.94 .16 .96.62 .30 .51.92 .20 .91.55 .37 .52.80 .34 .77
Results using all neighbors.94 .16 .95.46 .27 .47.39 .24 .46.82 .27 .84.51 .31 .49.72 .34 .72
token
SD
.19
.33
.23
.43
.38
.17
.27
.28
.28
.38
.38
hoods were more consistent than CjV neighborhoods, adifference of about 25 percentage points. Consideration ofthe initial consonant did not increase the consistency ofpronunciation of the vowel, because CjV neighbors weresimilar in consistency or even lower in consistency than Vneighbors. In contrast, VC2 neighbors were substantiallymore consistent than V neighbors. Thus, the final consonantsometimes helps to specify the pronunciation of the vowelin a way that the initial consonant does not. Spelling-soundrelations are more regular when vowels and final conso-nants are considered as units than when initial consonantsand vowels are considered as units.
Some of the inconsistency in pronunciation of CtV unitscould reflect the effects of postvocalic r. For example, theinitial ba of bar is pronounced differently from that of bat,the final r influencing the pronunciation of the a. We thusrepeated the calculations without considering words withpostvocalic r. In this analysis, for example, bar was notcounted as a QV neighbor of bat. The results were similarto those of the previous analysis in that VC2 neighborhoodswere again more consistent than CjV neighborhoods. How-ever, the size of the difference was now about 15 percentagepoints rather than 25 (by types: 82% vs. 67%; by tokens:78% vs. 62%). Thus, some of the variability in CtV pro-nunciations reflects the influence of postvocalic r, but notall of the variability can be explained in this manner. Notethat the greater stability of VC2 pronunciations than of QVor V pronunciations does not reflect the influence of final eon the pronunciation of vowels. As mentioned earlier, finale, if present, was considered part of the orthographic vowel.
The results of the analyses using all neighbors are shownat the bottom of Table 1. The patterns are similar to thoseobserved for monosyllabic neighbors.
To summarize, the main finding of Analysis A is that VC2
orthographic units have more consistent pronunciations thanC,V orthographic units. This finding goes beyond the re-sults of previous studies by showing that the final consonantof a CVC word helps to specify the pronunciation of thevowel in a way that the initial consonant does not.
Analysis B
In Analysis A, the units of analysis were the CVC wordsof English. In Analysis B, spelling-sound relations wereanalyzed somewhat differently. This time, the units of anal-ysis were the graphemes and grapheme clusters that appearin English words with CVC pronunciations, including theC1? V, C2, CjV, and VC2 units. For each orthographic unit,several measures of spelling—sound regularity were calcu-lated. Our main question, as in Analysis A, was whether thepronunciations of VC2 units were more predictable than thepronunciations of CaV units.
Note. C = consonant; V = vowel. Subscripts: 1 = initial; 2final.
3 Inferential statistics are not reported in Part 1 because themeans that we report are population values; they are the means forbasically the entire population of words that we wish to charac-terize (the CVC words of English that a college student is likeVy toknow).
SPECIAL ROLE OF RIMES 111
Method
Analysis B was based on the same CVC words that were usedin Analysis A. We listed each of the C,s, Vs, and C2s that occurredin these words, as well as each of the C,V and VC2 units. Forexample, the C,s include h and sh, the Vs include ea and afollowed by final e, and the C2s include p and //. Sample QV unitsare hea and sha, and sample VC2 units are ape and all.
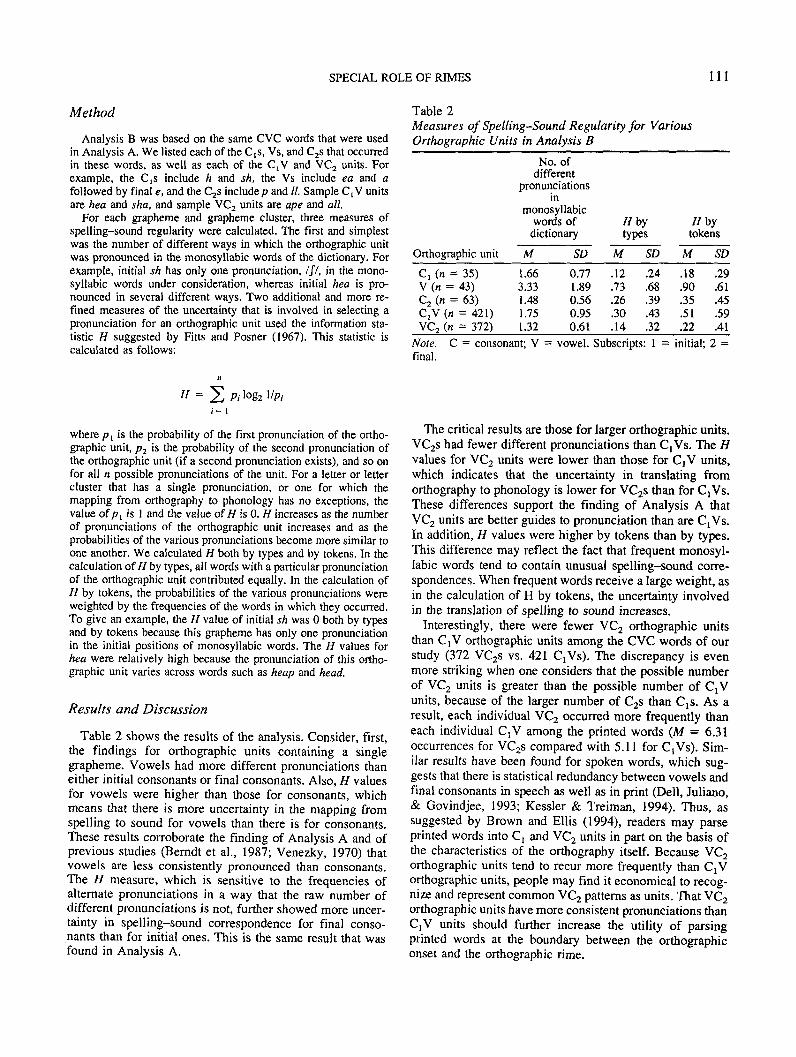
For each grapheme and grapheme cluster, three measures ofspelling-sound regularity were calculated. The first and simplestwas the number of different ways in which the orthographic unitwas pronounced in the monosyllabic words of the dictionary. Forexample, initial sh has only one pronunciation, ///, in the mono-syllabic words under consideration, whereas initial hea is pro-nounced in several different ways. Two additional and more re-fined measures of the uncertainty that is involved in selecting apronunciation for an orthographic unit used the information sta-tistic H suggested by Fitts and Posner (1967). This statistic iscalculated as follows:
Table 2Measures of Spelling-Sound Regularity for VariousOrthographic Units in Analysis B
No. ofdifferent
pronunciationsin
monosyllabicwords of
dictionaryHbytypes
tf bytokens
Orthographic unit M
C, (n = 35) 1.66V (n = 43) 3.33C2 (n = 63) 1.48CjV (n = 421) 1.75VC2 (n = 372) 1.32
SD M SD M SD
0.77 .12 .24 .18 .291.89 .73 .68 .90 .610.56 .26 .39 .35 .450.95 .30 .43 .51 .590.61 .14 .32 .22 .41
Note. C = consonant; V = vowel. Subscripts: 1 = initial; 2 =final.
ft = I/ft
where pl is the probability of the first pronunciation of the ortho-graphic unit, p2 is the probability of the second pronunciation ofthe orthographic unit (if a second pronunciation exists), and so onfor all n possible pronunciations of the unit. For a letter or lettercluster that has a single pronunciation, or one for which themapping from orthography to phonology has no exceptions, thevalue of P! is 1 and the value of H is 0. H increases as the numberof pronunciations of the orthographic unit increases and as theprobabilities of the various pronunciations become more similar toone another. We calculated H both by types and by tokens. In thecalculation of H by types, all words with a particular pronunciationof the orthographic unit contributed equally. In the calculation ofH by tokens, the probabilities of the various pronunciations wereweighted by the frequencies of the words in which they occurred.To give an example, the H value of initial sh was 0 both by typesand by tokens because this grapheme has only one pronunciationin the initial positions of monosyllabic words. The H values forhea were relatively high because the pronunciation of this ortho-graphic unit varies across words such as heap and head.
Results and Discussion
Table 2 shows the results of the analysis. Consider, first,the findings for orthographic units containing a singlegrapheme. Vowels had more different pronunciations thaneither initial consonants or final consonants. Also, H valuesfor vowels were higher than those for consonants, whichmeans that there is more uncertainty in the mapping fromspelling to sound for vowels than there is for consonants.These results corroborate the finding of Analysis A and ofprevious studies (Bemdt et al., 1987; Venezky, 1970) thatvowels are less consistently pronounced than consonants.The H measure, which is sensitive to the frequencies ofalternate pronunciations in a way that the raw number ofdifferent pronunciations is not, further showed more uncer-tainty in spelling-sound correspondence for final conso-nants than for initial ones. This is the same result that wasfound in Analysis A.
The critical results are those for larger orthographic units.VC2s had fewer different pronunciations than CjVs. The Hvalues for VC2 units were lower than those for CjV units,which indicates that the uncertainty in translating fromorthography to phonology is lower for VC2s than for C,Vs.These differences support the finding of Analysis A thatVC2 units are better guides to pronunciation than are QVs.In addition, H values were higher by tokens than by types.This difference may reflect the fact that frequent monosyl-labic words tend to contain unusual spelling—sound corre-spondences. When frequent words receive a large weight, asin the calculation of H by tokens, the uncertainty involvedin the translation of spelling to sound increases.
Interestingly, there were fewer VC2 orthographic unitsthan C]V orthographic units among the CVC words of ourstudy (372 VC2s vs. 421 QVs). The discrepancy is evenmore striking when one considers that the possible numberof VC2 units is greater than the possible number of C tVunits, because of the larger number of C2s than C,s. As aresult, each individual VC2 occurred more frequently thaneach individual QV among the printed words (M — 6.31occurrences for VC2s compared with 5.11 for QVs). Sim-ilar results have been found for spoken words, which sug-gests that there is statistical redundancy between vowels andfinal consonants in speech as well as in print (Dell, Juliano,& Govindjee, 1993; Kessler & Treiman, 1994). Thus, assuggested by Brown and Ellis (1994), readers may parseprinted words into C, and VC2 units in part on the basis ofthe characteristics of the orthography itself. Because VC2
orthographic units tend to recur more frequently than CjVorthographic units, people may find it economical to recog-nize and represent common VC2 patterns as units. That VC2
orthographic units have more consistent pronunciations thanC,V units should further increase the utility of parsingprinted words at the boundary between the orthographiconset and the orthographic rime.
112 TREIMAN, MULLENNIX, BIJELJAC-BABIC, RICHMOND-WELTY
Overall Discussion of Analyses A and B
The results for individual graphemes paint a rather bleakpicture of the English writing system. If we consider themonomorphemic words of English to be spelled in an al-phabetic fashion and describe the relations between spell-ings and sounds only at the level of single graphemes andsingle phonemes, English is not very regular. For vowels,especially, a single grapheme often maps onto several pho-nemes (see also Berndt et al., 1987; Venezky, 1970). If weincorporate larger orthographic and phonological units intoour description of the English writing system, however, thepicture becomes more encouraging. The pronunciations oforthographic units that contain a vowel grapheme and afinal consonant grapheme are more consistent than thepronunciations of single vowel graphemes. For example,although the grapheme ea may be pronounced as /if or /el,among other possibilities, its pronunciation is virtually al-ways lit when it is followed by p. As this example shows,one can sometimes rationalize the relations between spell-ings and sounds in English by viewing CVCs as made up ofan initial C and a final VC2. CaV units are not as useful asVC2s as guides to pronunciation.
Thus, English is not purely an alphabetic writing system.In its spelling of words that contain more than one mor-pheme (words that, for the most part, are not included in thepresent study), English has some of the characteristics of alogography, or a system in which morphemes have consis-tent spellings. For example, the spelling heal is retained inhealth and the spelling courage is retained in courageous(Chomsky, 1970). Even in its spelling of monomorphemicwords, English is not purely an alphabet. It has a tendencyto spell rimes in a consistent fashion.
Several investigators have observed that a number of VC2
letter clusters in English have relatively stable pronuncia-tions (Stanback, 1992; Venezky, 1970; Wylie & Durrell,1970). To our knowledge, however, the present study is thefirst to provide quantitative evidence that VC2 units arebetter guides to pronunciation than CjVs or vowels alone.Because the present study is based on monosyllabic words,problems related to syllabification do not arise, as in theearlier studies of Stanback (1992) and Aronoff and Koch(1993). Venezky (1970) pointed out a few cases in whichthe initial consonant systematically conditions the pronun-ciation of the following vowel (e.g., the case of wa, as inwasp vs. last). However, our results suggest that these casesare the exception to the general pattern.
The lexical statistics suggest that there is a potential wayfor readers to deal with the vowel irregularity that plaguesthe English writing system. By considering the consonantthat follows the vowel, readers could improve their chanceof pronouncing the vowel correctly. The statistical patternsthat we have documented suggest that this approach willsometimes succeed. But do readers actually use it? Do theytake advantage of orthographic units larger than singlegraphemes and do they use VC2 units to a greater extentthan CjV units? We addressed these questions in the re-maining parts of this study, looking in Parts 2 and 3 at adultreaders and in Part 4 at children learning to read.
Part 2: The Use of English Spelling-SoundRelations by Fluent Readers: Evidence From
Mega-Studies of Word Pronunciation
The results of Part 1 suggest that English orthography ismore than an alphabet. In addition to relations betweenindividual graphemes and individual phonemes, there arealso links between VC2 orthographic units and phonologicalrimes. Do fluent adult readers take advantage of these largerunits in pronouncing monomorphemic words or do they useonly alphabetic information? We address this question inPart 2 by analyzing the results from two large-scale studiesof word pronunciation. In these studies, college studentswere shown one word at a time on a computer screen andread each word out loud. The time to initiate the pronunci-ation of each word was measured; any pronunciation errorswere also noted. The times and errors for each word werepooled over all of the subjects. We then used multipleregression analyses to predict response times and error ratesfor each word from a number of linguistic variables. Datafrom two separate naming studies were analyzed. One studywas carried out by us with students from Wayne StateUniversity. The second study was carried out by Seidenbergand Waters (1989) with students from McGill University.To the extent that analyses of two independent sets of datagive similar results, we can gain confidence in the reliabilityof the findings.
Our primary question was whether the consistency mea-sures calculated for each of the CVC words in Analysis A ofPart 1 helped to predict performance in the naming task. Toaddress this question, we included in the regression analysesmeasures of the consistency of pronunciation of the indi-vidual graphemes in the word (C1; V, and C2) as well asmeasures of the consistency of the multiple-grapheme units(Cj V and VC2). If readers rely on correspondences betweenindividual graphemes and individual phonemes, as in stan-dard dual-route models of reading (e.g., M. Coltheart, 1978;M. Coltheart et al., 1993), then consistency measures forindividual graphemes should be associated with perfor-mance. If this is the only level at which spelling and soundare related, the consistency of larger units would not beexpected to have additional effects. However, if readers useVC2 units in pronouncing words, the consistency of the VC2
should make a significant additional contribution to theregression once the consistency of the individual graphemeshas been taken into account. Words with consistent VC2
units, such as heap, should be relatively easy to pronounceeven if their vowel graphemes, ea in this case, are not veryconsistent. Words with inconsistent VC2 units, such as said,should take longer to pronounce than anticipated based onother factors. If readers use VC2 units to a larger extent thanCjV units, the consistency of the VC2 should have a greatereffect than the consistency of the CaV.
In the present study, the spelling-sound consistency ofeach orthographic unit was considered a continuous vari-able. Consistency values ranged from 1, meaning that allneighbors have the same pronunciation of the orthographicunit, to 0, meaning that no neighbors share the pronuncia-
SPECIAL ROLE OF RIMES 113
tion. Most previous researchers have considered consis-tency to be a dichotomous rather than a continuous variable.They have grouped words into categories such as regularconsistent, regular inconsistent, and exception and havelooked for differences among these categories. The classi-fication of words as consistent or inconsistent, which stemsfrom the seminal work of Glushko (1979), is based on theword's VC2 unit. A regular consistent word, such as haze, isone in which the VC2 is pronounced in the same way as itis in all of the neighbors. In our terms, the consistency of theVC2 is 1. Regular inconsistent words are those in which theV grapheme is pronounced in the typical manner in thetarget word but in which the VC2 is pronounced differentlythan it is in at least some of the neighbors. In our terms, theconsistency of the V is high, whereas the consistency of theVC2 is lower. An example is wave, where a plus final e isusually pronounced as /e/ but ave is pronounced as /aev/ inthe frequent word have. Finally, exception words are thosein which at least one of the orthographic units is pronouncedin an atypical manner. For example, have is an exceptionword because the consistency of the vowel is low; mostneighbors have the /e/ pronunciation rather than the /as/pronunciation. Given the nature of English spelling, theunusual aspect of most exception words is the vowel, as inthis example. The orthographic units containing the vowelgenerally have low consistency values in exception words,too. However, there are some exception words with incon-sistently pronounced consonants, such as chef. Our use ofcontinuous variables to represent the consistency of pronun-ciation of GU V, C2, CjV, and VC2 units allows us toexamine regularity and consistency effects in a more fine-grained manner than in previous research.
Pronunciation latencies tend to be longer for exceptionwords than for regular words (Baron & Strawson, 1976;Glushko, 1979; Gough & Cosky, 1977; Stanovich & Bauer,1978). People sometimes make errors on exception words aswell, often regularization errors. For example, readers maypronounce have as /hev/. The regularity effect appears to bemodulated by word frequency. Whereas low-frequencywords typically yield significant regularity effects, high-frequency words show no regularity effects or only smallregularity effects (Andrews, 1982; Content, 1991; Jared &Seidenberg, 1990; Rosson, 1985; Seidenberg, 1985; Seiden-berg, Waters, Barnes, & Tanenhaus, 1984; Taraban &McClelland, 1987; Waters & Seidenberg, 1985; Waters,Seidenberg, & Bruck, 1984).
Studies comparing regular consistent and regular incon-sistent words have yielded somewhat variable results. Al-though Glushko (1979) and Andrews (1982) reported con-sistency effects in word naming, other researchers have notfound such effects when subjects had no prior experimentalexposure to words with alternative pronunciations of theorthographic rime (Stanhope & Parkin, 1987; Taraban &McClelland, 1987). The discrepancy may reflect, in part, thefrequency of the target word. Seidenberg et al. (1984) foundsignificant differences between regular consistent wordsand regular inconsistent words only in the lower range ofword frequency. However, the interaction between wordfrequency and consistency was not significant in other stud-
ies (Andrews, 1982; Balota & Ferraro, 1993; Taraban &McClelland, 1987). More important may be the number orfrequency of words whose pronunciations agree with that ofthe target relative to those whose pronunciations disagree.For low-frequency words, the penalty for inconsistency isrelatively large if the word has many frequent enemies andfew friends. The penalty is small if the word has fewenemies and many friends (Kay & Bishop, 1987; Jared,McRae, & Seidenberg, 1990). These latter results, togetherwith those of Brown and Watson (1994), suggest that VC2
consistency is properly considered a continuous variablereflecting the number or frequency of friends relative to thetotal number or frequency of friends and enemies. Weadopted a continuous rather than a dichotomous view ofconsistency in the present study.
The previous results led us to expect that VC2 consistencywould be associated with word naming performance aboveand beyond the association with grapheme-phoneme levelconsistency. This suggestion is bolstered by evidence fromother tasks, including lexical decision and priming, for theimportance of orthographic VC2 units (Bowey, 1990, 1993;Treiman, 1994; Treiman & Chafetz, 1987). However, theprior findings offer little insight into the possible effects ofCjV consistency. Because researchers have defined consis-tency in terms of the VC2 unit, they have not usuallyconsidered whether the consistency of the QV might alsoinfluence performance. In the present study, we addressedthis issue by including consistency measures for the CjV aswell as for the VC2.
Although no studies of word naming have systematicallycompared the effects of QV and VC2 consistency, severalstudies of nonword pronunciation have examined the effectsof initial and final consonants on vowel pronunciation.Adults' pronunciations of vowels in nonwords are affectedby the identity of the following consonant (D. Johnson &Venezky, 1976; Ryder & Pearson, 1980; Taft, 1992; Tara-ban & McClelland, 1987; Treiman & Zukowski, 1988). Insome studies (D. Johnson & Venezky, 1976; Kay, 1985,1987; Ryder & Pearson, 1980; Taraban & McClelland,1987), but not all (Taft, 1992; Treiman & Zukowski, 1988),the initial consonant also affected the pronunciation of thevowel. However, Jared et al. (1990) suggested that thesalience of VC2 units relative to other units is greater in thepronunciation of real words than in the pronunciation ofnonwords. Thus, findings with nonwords may not general-ize to real words.
In addition to examining main effects of consistency onword naming, we also looked for interactions between con-sistency and word frequency. As discussed earlier, previousresults suggest that effects of regularity and consistencymay be larger for low-frequency words than for high-fre-quency words. To address this issue, we included interac-tion terms for each of the consistency measures with wordfrequency.
Another important question is whether consistency effectsare governed by the numbers of friends and enemies or bythe relative frequencies of friends and enemies. Withinlinguistics, it has generally been assumed that the number ofwords in which a linguistic pattern appears (type frequency)
114 TREIMAN, MULLENNIX, BIJELJAC-BABIC, RICHMOND-WELTY
is critical. The frequency of usage of the words (tokenfrequency) is thought to be less important. Jared et al. (1990,Experiment 3) attempted to disentangle the roles of typefrequency and token frequency in the consistency effect forwords. The latency results suggest that it is token frequencythat matters, although the error results cloud the picturesomewhat. According to Jared et al., the effect of tokenfrequency is compatible with the Seidenberg and McClel-land (1989) model. Within this model, the frequencies of aword's neighbors affect processing of the word. However,Kay's findings (cited in Kay & Marcel, 1981) suggest thatthe number of words that contain a given correspondence ismore important than the total frequency of lexical entriesembodying the correspondence. To investigate this issue,we carried out regression analyses using both token-basedand type-based measures of consistency.
We also asked whether neighborhood size (the number orthe summed frequency of the words that share a particularorthographic unit with the target) has effects above andbeyond those of neighborhood consistency (the proportionof those words in which the orthographic unit is pronouncedin the same way as it is in the target word). The mostcommon measure of neighborhood size is N (M. Coltheart,Davelaar, Jonasson, & Besner, 1977). According to the Nmeasure, a word counts as a neighbor if it shares all but oneletter in any position with the target word. For example,gruel and cruet are both neighbors of cruel. N is a typemeasure rather than a token measure in that all of theneighbors are weighted equally.
Several studies have examined the effects of N on adults'naming of words. Andrews (1989) found that words withlarge values of N were named faster than words with smallvalues of N. Although the interaction between neighbor-hood size and word frequency was not significant, largeneighborhoods appeared to be more beneficial for low-frequency words than for high-frequency words. A laterstudy (Andrews, 1992) yielded similar results. Lewellen,Goldinger, Pisoni, and Greene (1993), using a slightly dif-ferent type-based measure of neighborhood size, found thatwords from large neighborhoods were named more rapidlythan words from small neighborhoods. The effect of neigh-borhood size did not interact with word frequency in thisstudy.
Grainger (1990) examined the effect of the frequency ofa word's neighbors on word naming in Dutch. His stimuliwere matched in N but differed in whether they had zero,one, or more than one higher frequency neighbor. Althoughthere was no significant main effect of neighborhood fre-quency, increasing the number of higher frequency neigh-bors tended to facilitate the pronunciation of low-frequencywords. Grainger's results suggest that, at least for low-frequency words, the frequency of neighbors has an impactabove and beyond the number of neighbors.
The results just reviewed suggest that large neighbor-hoods are beneficial in word naming. This may be espe-cially true for low-frequency words. To examine these is-sues, we included N and the interaction of N and wordfrequency in some of our analyses.
The N metric is surely not an optimal measure of lexical
similarity (see Andrews, 1992; Frauenfelder, Baayen, Hell-wig, & Schreuder, 1993). One potential problem is that theN measure weights all neighbors equally, regardless of theirfrequency. Another possible drawback is that neighborsderived from letter substitutions at each position receiveequal weight. However, neighbors that share the ortho-graphic rime unit with a monosyllabic stimulus may bemore important than neighbors that share other units. Fornonwords, there is evidence consistent with this claim.Treiman, Goswami, and Bruck (1990) found that first grad-ers, third graders, and adults did better at pronouncingnonwords that shared their orthographic VC2 unit withmany real words (e.g., tain, goach) than nonwords thatshared their VC2 unit with fewer real words (e.g., taich,goan). The frequency of the VC2 unit (whether measured asthe number of words that shared this unit or the summedfrequency of those words) accounted for a significant per-centage of variance in nonword reading performance. Thefrequency of the CtV unit did not contribute to the regres-sion. For monosyllabic nonwords, then, VC2 neighbors maybe more influential than CtV neighbors.
In an attempt to circumvent the above-mentioned limita-tions of the N measure, we developed separate measures ofneighborhood size for C1; V, C2, QV, and VC2 neighbors.For the type measures, we simply counted the number ofwords that shared the orthographic unit with the target andin which the orthographic unit was in the same position asit was in the target word. For the token measures, wecalculated the summed frequency of the words that sharedeach orthographic unit. In some of the regression analyses,we used these detailed measures of neighborhood size in-stead of the N measure. We compared type and tokenmeasures to determine whether one type of measure didbetter than the other. Thus, the present study represents themost comprehensive attempt so far to look at the micro-structure of neighborhoods beyond the N metric.
In addition to measures of neighborhood consistency andneighborhood size, the regression analyses included mea-sures of the frequency of the target word in printed text(Kucera & Francis, 1967), subjective familiarity (Nusbaum,Pisoni, & Davis, 1984), bigram frequency (Solso & Juel,1981), initial phoneme, number of letters, and homophony.Details of these measures are provided below.
Method
Wayne State Study
Participants. The participants were 27 volunteers from upper-level undergraduate psychology courses at Wayne State Univer-sity. The students received course credit in exchange for partici-pation. All were native speakers of English. None had a history ofspeech or hearing disorders, and none had uncorrected visualproblems.
Stimuli. The stimuli were 1,327 of the 1,329 CVC monosylla-bles of Part 1. Two words were mistakenly omitted from the listsof stimuli. The words were randomly divided into three lists, twolists of 443 words and one list of 442 words. One word wasinadvertently presented on two different lists; the results for thisword were pooled across the two presentations. The order of
SPECIAL ROLE OF RIMES 115
presentation of the three lists was counterbalanced across subjectsusing a Latin square. The order of stimuli within a list wasrandomized for each participant.
Procedure. People were told to say each word into the micro-phone as quickly as possible after the word appeared on the screen.They were advised not to make any extraneous sounds such ascoughs that could trigger the microphone. Students were asked tokeep their lips about 4 inches from the microphone and to try tomaintain this distance throughout the experiment.
Each student participated in three sessions, doing one list persession. The three sessions were always completed within a1-week period. At the beginning of each session, 10 practice trialswere presented. The practice stimuli were first names (names ofrock stars from the 1960s and 1970s) in order to minimize theirsimilarity to the test items.
On each trial, a prompt that read GET READY appeared for 2 sin the center of the screen. The prompt then went off and the screenwent blank for 1 s. The stimulus word was then presented inuppercase letters. It remained on the screen until the voice keypicked up the person's response. After the voice key triggered andthe computer recorded the reaction time (RT), the word disap-peared. There was a 1-s blank interval before the next warningmessage. After each 100 trials, the participant received a 1-minbreak.
Response latencies were timed from the onset of the word on thescreen. When the voice key was triggered, a signal was sent to thecomputer to record the reaction time and begin the next trialsequence. Control and timing of the experiment were accom-plished with the MEL software package (W. Schneider, 1988) ona 386 PC computer with Super VGA graphics. An Electro-voiceRE 16 cardioid microphone was used together with a voice keybutton box supplied by MEL.
The experimenter sat in a sound-attenuated testing room with theparticipant during the experiment and manually recorded anypronunciation errors. Pronunciation errors fell into two categories:mispronunciation of the word and failure of the participant's voiceto be loud enough to trigger the voice key. Trials on which thevoice key did not trigger were eliminated from the data analyses.Mispronunciations were counted as true errors and entered intoerror data analyses. RTs were analyzed for correct trials only.Trials on which RTs were under 100 ms or over 2,000 ms wereeliminated from the data analyses. Trials eliminated because ofsoft voice or extremely short or extremely long RTs constituted0.5% of all trials.
McGill Study
The McGill study was reported by Seidenberg and Waters(1989). The participants were 30 students from McGill University.The stimuli were 2,897 monosyllabic words, 1,153 of which werepronounced as CVCs and the rest of which had other phonologicalstructures. The students were tested in their residence halls overthe course of several sessions. In the analyses reported here, weconsidered only the data for the CVC words of the McGill study.Some of the CVC words in the Wayne State study were not usedin the McGill study. These included words with relatively lowfamiliarity ratings such as bode and gnash but also some veryfamiliar words such as doze and fudge.
Independent Variables
The measures of neighborhood consistency that were calculatedin Analysis A of Part 1 were used in the regression analyses. The
Method section of Analysis A gives information about these mea-sures and how they were calculated.
In addition, measures of neighborhood size especially developedfor the present study were used in the regressions. For the analysesbased on monosyllabic neighbors, the type measure of Cj neigh-borhood size was the number of monosyllabic words in the com-puterized dictionary that shared the initial consonant letter orletters of the target. The token measure was the summed frequencyof those words. Type and token measures of neighborhood sizewere calculated similarly for V, C2, QV, and VC2 monosyllabicneighbors.
In other analyses, we used neighborhood size measures based onthe full lexicon. Specifically, we calculated type and token mea-sures of neighborhood size for Cj neighbors (all words in thecomputerized dictionary that began with the same consonantgrapheme as the target), Vj neighbors (words whose first vowelgrapheme was the same as that of the target), V2 neighbors (wordswhose last vowel grapheme was the same as that of the target), C2
neighbors (words that ended with the same consonant letter orletters as the target), C1V1 neighbors (words whose first consonantand vowel graphemes matched those of the target), and V2C2
neighbors (words whose last vowel and consonant graphemesmatched those of the target).
The N measure of neighborhood size (M. Coltheart et al., 1977)was used in other analyses. N was calculated by counting thenumber of words in the computerized dictionary, multisyllabic aswell as monosyllabic, that could be created from the target word bychanging one of the letters in the string to another letter, preservingletter position.
Word frequency was the number of times that the printed wordoccurred in a sample of approximately 1 million words of text(Kucera & Francis, 1967). The Ku6era and Francis norms werechosen because they are widely used in studies of word recognitionand reading. Familiarity ratings were taken from the study byNusbaum et al. (1984) in which Indiana University students ratedthe familiarity of printed words on a 7-point scale. The scaleranged from 1, meaning that the word was unknown, through 4,meaning that the stimulus was recognized as a word but itsmeaning was unknown, to 7, meaning that the word was familiarand its meaning was well-known. Bigram frequency was the meanpositional bigram frequency according to the norms of Solso andJuel (1981). Number of letters in the Ct, V, and C2 graphemes wasalso coded. A word was counted as a homophone if it had the samepronunciation as some other word or words in the set of 1,329monosyllabic CVCs. It was coded as a nonhomophone if no otherword in the set shared its pronunciation.
The initial phoneme of each target word was coded in terms of10 binary variables. There was one variable for voiced versusvoiceless. Voiced initial phonemes were coded as 1, and voicelessinitial phonemes were coded as 0. There were four dummy vari-ables for manner of articulation (nasal versus other, fricativeversus other, liquid or semivowel versus other, and affricate versusother) and five dummy variables for place of articulation (bilabialversus other, labiodental versus other, palataoalveolar and palatalversus other, velar versus other, and glottal versus other).
Results
Preliminary Analyses
For each study, RTs and errors were pooled over subjectsfor each word. Following the recommendations of Tabach-nick and Fidell (1989), we examined the distributions of the
116 TREIMAN, MULLENNIX, BIJELJAC-BABIC, RICHMOND-WELTY
variables and applied transformations as necessary to reduceskew and kurtosis and improve normality. Word frequencywas log transformed and familiarity was reflected, log trans-formed, and reflected again so that high numbers wouldindicate high familiarity. Mean bigram frequency wassquare root transformed, as were all of the measures involv-ing summed frequency of neighbors. The transformed vari-ables were used in the correlation and regression analysesthat follow. The dependent variables, RT and error rate inthe Wayne State study and RT and error rate in the McGillstudy, were positively skewed. Log transforms of thesevariables were used in the correlation and regression anal-yses. Following the suggestion of Aitken and West (1991),we centered all of the continuous predictor variables beforeperforming the regressions. Centering of variables aids inthe interpretation of interactions.
For the 1,327 monosyllabic words for which naming datawere available from the Wayne State study, the mean RTwas 616 ms (SD = 88) and the mean error rate was 1.5%(SD = 4.1). For 1,151 of these words, naming data werealso available from the McGill study. Response times forthese words were significantly lower in the McGill studythan in the Wayne State study, 560 ms versus 607 ms,;(150) = 22.10, p < .001. There was a speed-accuracytrade-off, the error rate being higher in the McGill studythan in the Wayne State study, 6.3% as compared to 1.2%,f(150) = 26.06, p < .001. RTs correlated .41 across the twostudies (p < .001). Error rates correlated less highly, r = .17(p < .001). In the Wayne State study, words that had longerRTs also tended to give rise to more errors, r = .43,p < .001. The correlation between RTs and errors waslower for the CVCs of the McGill study, r = .18, p < .001.
The regression analyses that follow use standard or si-multaneous multiple regression. All of the independent vari-ables enter the regression equation at once; each indepen-dent variable is evaluated in terms of what it adds to theprediction that is different from the predictability affordedby all of the other variables.
Regression Analyses Using Detailed Measures ofNeighborhood Size
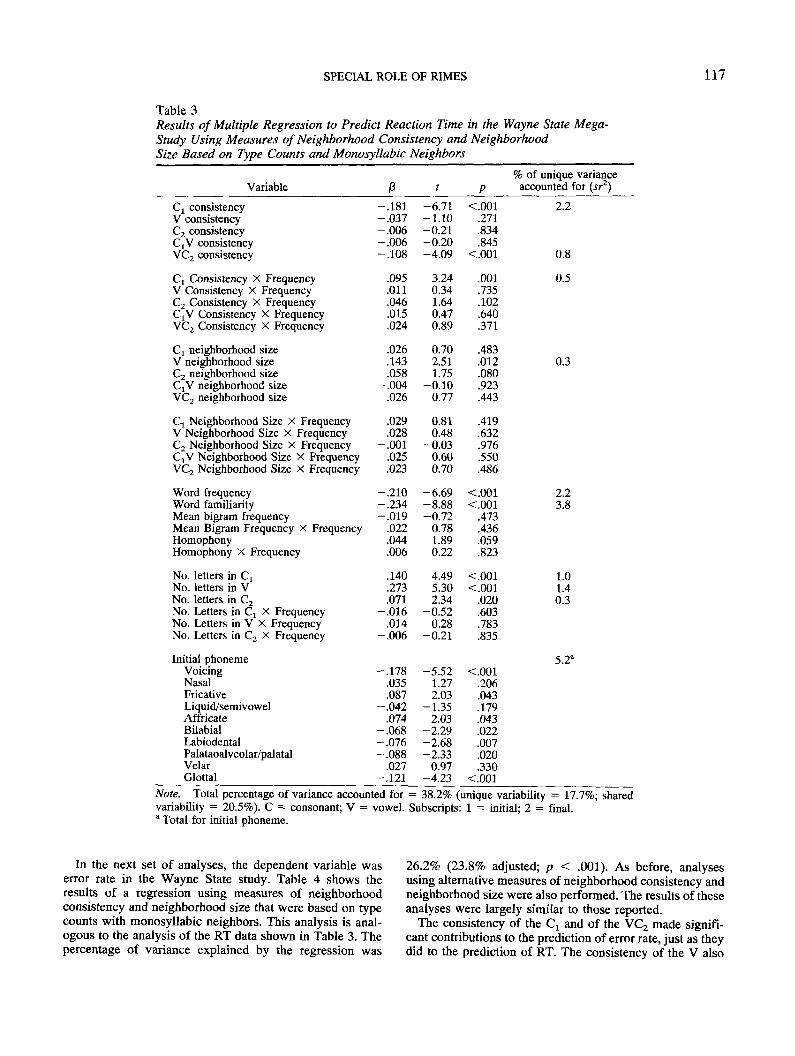
In the first regression analysis, we attempted to predictRT in the Wayne State study from the variables shownin Table 3. The measures of neighborhood consistencyand neighborhood size in this analysis were based ontype counts with monosyllabic neighbors. The measuresof neighborhood size included measures of C1; V, and Qneighborhood size as well as measures of CjV and VC2
neighborhoods. For each independent variable, the tableshows the value of beta, or the standardized regressioncoefficient, t, and p. For variables that had significant inde-pendent effects (p < .05), the percentage of variance thatwas uniquely accounted for by the variable (sr2) is alsoshown. Word frequency and word familiarity were onlymoderately correlated, r = .48 (p < .001). Thus, it waspossible to use both variables in the same analysis.
As Table 3 shows, the percentage of variance explained
by the regression was 38.2% (36.1% adjusted; p < .001).The only two consistency variables that made significantcontributions were the consistency of the Cx and the con-sistency of the VC2. As the consistency of these unitsincreased, RTs decreased. In addition, there was a reliableinteraction between Cx consistency and word frequency.The effect of Q consistency was stronger for low-frequencywords than for high-frequency words. None of the otherconsistency measures made significant contributions to theregression. In particular, the consistency of the CtV unitwas not reliably associated with RT.
The only neighborhood size variable to have a significanteffect was the number of words that shared the vowel withthe target. Surprisingly, words with common vowel graph-emes were responded to more slowly than words with lesscommon vowel graphemes. A similar trend was observedfor C2 neighborhood size, but it was not significant. Noneof the neighborhood size variables interacted with wordfrequency.
Word frequency was also associated with RT. Peopleresponded more quickly to frequent words than to infre-quent words. Familiarity showed a similar relation to RT,familiar words being responded to more quickly than unfa-miliar words. The effect of subjective familiarity was stron-ger than the effect of frequency. There were no significanteffects of bigram frequency or homophony, although therewas a nonsignificant trend for response times to be slower tohomophones than nonhomophones.
The length of the word was also associated with time toinitiate its pronunciation. Response times increased as thenumber of letters in the C1; V, and C2 graphemes increased.The effect was largest for the vowel grapheme, perhapsbecause vowel graphemes vary more than consonant graph-emes in the number of letters that they contain.
Finally, the initial phoneme was associated with RT.Voiced initial phonemes triggered the voice key faster thanunvoiced phonemes. Fricatives and affricates tended to beslower than phonemes with other manners of articulation.Bilabial, labiodental, palatal and palatoalveolar, and glottalphonemes tended to yield faster responses than phonemeswith other places of articulation.
In the analyses just reported, the measures of neighbor-hood consistency and neighborhood size were based on typecounts with monosyllabic neighbors. We carried out a sim-ilar analysis using token counts with monosyllabic neigh-bors. We also carried out four analyses using the full lexi-con, the measures of neighborhood consistency andneighborhood size being based on either types or tokens andon either the first vowel or the last vowel in the case ofvowel measures. The results of these analyses were similarto the results just reported. However, two effects that missedsignificance in the preceding analysis were significant in allof the other analyses. One of these was the effect of ho-mophony. Homophones were responded to more slowlythan nonhomophones in all of the other analyses. Also, theeffect of C2 neighborhood size was significant in the otheranalyses. Words with common C2 graphemes were re-sponded to more slowly than words with less common C2
graphemes.
SPECIAL ROLE OF RIMES 117
Table 3Results of Multiple Regression to Predict Reaction Time in the Wayne State Mega-Study Using Measures of Neighborhood Consistency and NeighborhoodSize Based on Type Counts and Monosyllabic Neighbors
% of unique varianceVariable /3 t p accounted for (sr2)
Cj consistencyV consistencyC2 consistencyQV consistencyVC2 consistency
G! Consistency X FrequencyV Consistency X FrequencyC2 Consistency X FrequencyCXV Consistency X FrequencyVC2 Consistency X Frequency
Cj neighborhood sizeV neighborhood sizeC2 neighborhood sizeCjV neighborhood sizeVC2 neighborhood size
Cj Neighborhood Size X FrequencyV Neighborhood Size X FrequencyC2 Neighborhood Size X FrequencyCjV Neighborhood Size X FrequencyVC2 Neighborhood Size X Frequency
Word frequencyWord familiarityMean bigram frequencyMean Bigram Frequency X FrequencyHomophonyHomophony X Frequency
No. letters in CjNo. letters in VNo. letters in C2No. Letters in CT X FrequencyNo. Letters in V X FrequencyNo. Letters in C2 X Frequency
Initial phonemeVoicingNasalFricativeLiquid/semivowelAffricateBilabialLabiodentalPalataoalveolar/palatalVelarGlottal
-.181-.037-.006-.006-.108
.095
.011
.046
.015
.024
.026
.143
.058-.004
.026
.029
.028-.001
.025
.023
-.210-.234-.019
.022
.044
.006
.140
.273
.071-.016
.014-.006
-.178.035.087
-.042.074
-.068-.076-.088
.027-.121
-6.71-1.10-0.21-0.20-4.09
3.240.341.640.470.89
0.702.511.75
-0.100.77
0.810.48
-0.030.600.70
-6.69-8.88-0.72
0.781.890.22
4.495.302.34
-0.520.28
-0.21
-5.521.272.03
-1.352.03
-2.29-2.68-2.33
0.97-4.23
<.001.271.834.845
<.001
.001
.735
.102
.640
.371
.483
.012
.080
.923
.443
.419
.632
.976
.550
.486
<.001<.001
.473
.436
.059
.823
<.001<.001
.020
.603
.783
.835
<.001.206.043.179.043.022.007.020.330
<.001
2.2
0.8
0.5
0.3
2.23.8
1.01.40.3
5.2"
Note. Total percentage of variance accounted for = 38.2% (unique variability = 17.7%; sharedvariability = 20.5%). C = consonant; V = vowel. Subscripts: 1 = initial; 2 = final." Total for initial phoneme.
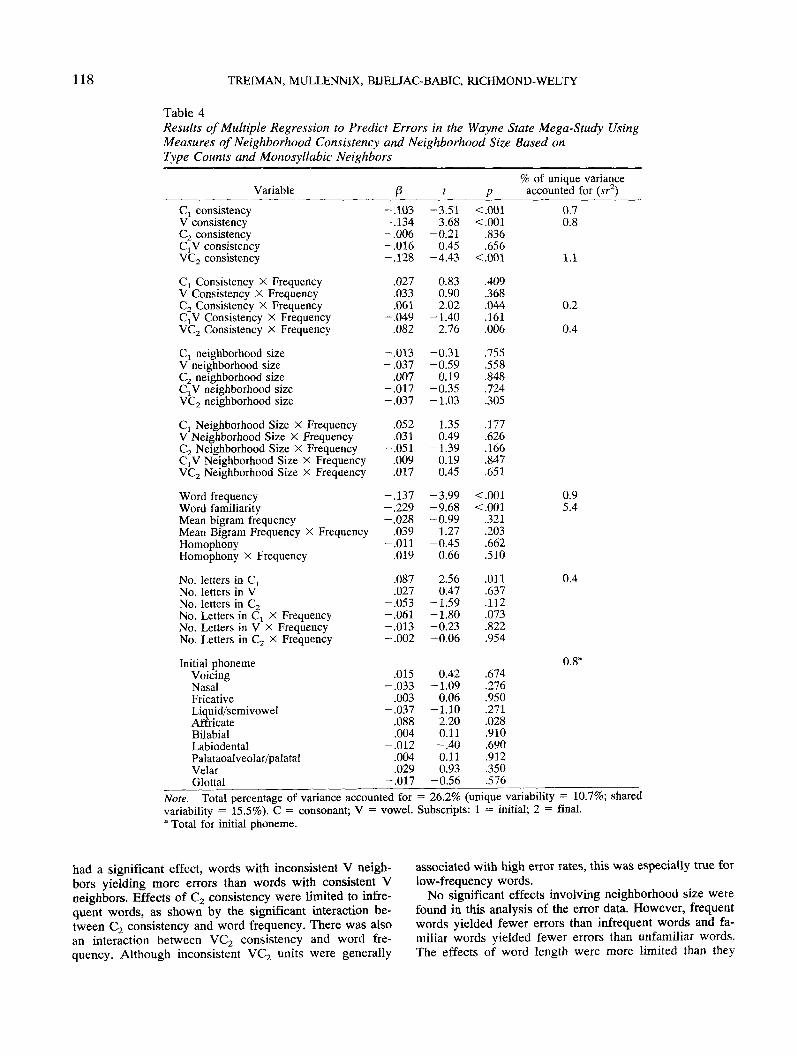
In the next set of analyses, the dependent variable waserror rate in the Wayne State study. Table 4 shows theresults of a regression using measures of neighborhoodconsistency and neighborhood size that were based on typecounts with monosyllabic neighbors. This analysis is anal-ogous to the analysis of the RT data shown in Table 3. Thepercentage of variance explained by the regression was
26.2% (23.8% adjusted; p < .001). As before, analysesusing alternative measures of neighborhood consistency andneighborhood size were also performed. The results of theseanalyses were largely similar to those reported.
The consistency of the Q and of the VC2 made signifi-cant contributions to the prediction of error rate, just as theydid to the prediction of RT. The consistency of the V also
118 TREIMAN, MULLENNIX, BUELJAC-BABIC, RICHMOND-WELTY
Table 4Results of Multiple Regression to Predict Errors in the Wayne State Mega-Study UsingMeasures of Neighborhood Consistency and Neighborhood Size Based onType Counts and Monosyllabic Neighbors
Variable
Cj consistencyV consistencyC2 consistencyC,V consistencyVC2 consistency
C, Consistency X FrequencyV Consistency X FrequencyC2 Consistency X FrequencyCjV Consistency X FrequencyVC2 Consistency X Frequency
Cj neighborhood sizeV neighborhood sizeC2 neighborhood sizeCjV neighborhood sizeVC2 neighborhood size
G! Neighborhood Size X FrequencyV Neighborhood Size X FrequencyC2 Neighborhood Size X FrequencyCjV Neighborhood Size X FrequencyVC2 Neighborhood Size X Frequency
Word frequencyWord familiarityMean bigram frequencyMean Bigram Frequency X FrequencyHomophonyHomophony X Frequency
No. letters in C,No. letters in VNo. letters in C2No. Letters in Q X FrequencyNo. Letters in V X FrequencyNo. Letters in C2 X Frequency
Initial phonemeVoicingNasalFricativeLiquid/semivowelAffricateBilabialLabiodentalPalataoalveolar/palatalVelarGlottal
/3-.103-.134-.006-.016-.128
.027
.033
.061-.049
.082
-.013-.037
.007-.017-.037
.052
.031-.051
.009
.017
-.137-.229-.028
.039-.011
.019
.087
.027-.053-.061-.013-.002
.015-.033
.003-.037
.088
.004-.012
.004
.029-.017
t
-3.51-3.68-0.21
0.45-4.43
0.830.902.02
-1.402.76
-0.31-0.59
0.19-0.35-1.03
1.350.49
-1.390.190.45
-3.99-9.68-0.99
1.27-0.45
0.66
2.560.47
-1.59-1.80-0.23-0.06
0.42-1.09
0.06-1.10
2.200.11-.400.110.93
-0.56
% of unique variancep accounted for (sr2)
<.001<.001
.836
.656<.001
.409
.368
.044
.161
.006
.755
.558
.848
.724
.305
.177
.626
.166
.847
.651
<.001<.001
.321
.203
.662
.510
.011
.637
.112
.073
.822
.954
.674
.276
.950
.271
.028
.910
.690
.912
.350
.576
0.70.8
1.1
0.2
0.4
0.95.4
0.4
0.8a
Note. Total percentage of variance accounted for = 26.2% (unique variability = 10.7%; sharedvariability = 15.5%). C = consonant; V = vowel. Subscripts: 1 = initial; 2 = final.a Total for initial phoneme.
had a significant effect, words with inconsistent V neigh-bors yielding more errors than words with consistent Vneighbors. Effects of C2 consistency were limited to infre-quent words, as shown by the significant interaction be-tween C2 consistency and word frequency. There was alsoan interaction between VC2 consistency and word fre-quency. Although inconsistent VC2 units were generally
associated with high error rates, this was especially true forlow-frequency words.
No significant effects involving neighborhood size werefound in this analysis of the error data. However, frequentwords yielded fewer errors than infrequent words and fa-miliar words yielded fewer errors than unfamiliar words.The effects of word length were more limited than they
SPECIAL ROLE OF RIMES 119
were for RTs. Only the length of the Ca grapheme wassignificantly associated with error rate. There was a trend,not significant in the analysis that used neighborhood mea-sures based on type counts with monosyllabic neighbors butsignificant in the analyses that used alternate measures, forthe effects of C1 length to be stronger for low-frequencywords than for high-frequency words.
Initial phoneme had less impact on errors than on RTs.The only significant effect was that words with initial af-fricates yielded fewer errors than words whose initial pho-nemes had other manners of articulation.
In the next set of analyses, we sought to determinewhether the findings generalized to an independent set ofdata, namely the data for CVCs from the McGill namingstudy. Table 5 shows the results for RT in the McGill data.This analysis used measures of neighborhood consistencyand neighborhood size that were based on type measuresand monosyllabic neighbors. The set of variables explained49.5% of the variance in RT in the McGill data (47.6%adjusted, p < .001), this being higher than the 38.2%observed for the Wayne State data.
The effects of neighborhood consistency were similar tothose in the Wayne State data. Words with consistent Cx
graphemes were responded to more rapidly than words withless consistent Q graphemes. Also, words with consistentVC2 units were responded to more rapidly than words withinconsistent VC2s. There were no significant interactionsinvolving consistency and word frequency.
None of the neighborhood size variables had reliablemain effects. However, there was a significant interactionbetween V neighborhood size and word frequency. Low-frequency words with many V neighbors tended to yieldlong RTs, whereas high-frequency words with many Vneighbors tended to yield short RTs. The size of the VC2
neighborhood also interacted with word frequency. Low-frequency words from dense VC2 neighborhoods tended tobe responded to more quickly than low-frequency wordsfrom sparse VC2 neighborhoods. For high-frequency words,the size of the VC2 neighborhood was not influential.
As in the Wayne State study, response times to frequentwords tended to be faster than those to infrequent words,and response times to familiar words tended to be fasterthan those to unfamiliar words. Homophones yielded longerRTs than nonhomophones. Response times increased as thenumber of letters in a word's graphemes increased. Theseeffects were most pronounced for the vowel grapheme, asobserved for RTs in the Wayne State study. The number ofletters in the Q and V graphemes also interacted with wordfrequency such that multiple-letter graphemes were moredetrimental for low-frequency words than for high-fre-quency words.
The initial phoneme had a much larger effect in theMcGill study, where it explained 22.8% of the uniquevariance in RT, than in the Wayne State study, where itaccounted for 5.2% of the unique variance. This differencemay reflect the fact that the McGill students respondedmore quickly than the Wayne State students or were morelikely to begin vocalizing the word before they had fullyprocessed it. The details of the initial phoneme effect were
somewhat different in the two studies, perhaps becausedifferent voice keys were used. The voicing of the initialphoneme was not significantly associated with RT in theMcGill study as it was in the Wayne State study. Fricativesand affricates tended to yield slow response times; nasals,liquids, and semivowels tended to produce fast times. Bila-bials, labiodentals, and glottals tended to yield faster re-sponses than phonemes with other places of articulation.
Finally, Table 6 shows the analysis of errors in the McGillstudy using measures of neighborhood consistency andneighborhood size that were based on type measures andmonosyllabic neighbors. The percentage of variance ex-plained by the regression was much lower than in thepreceding analyses, only 6.9% (3.4% adjusted, p < .001).The only variables to have significant effects were Cx
consistency, VC2 consistency, word familiarity, and initialphoneme.
Regression Analyses Using N Measure ofNeighborhood Size
In the analyses presented so far, we included separatemeasures of neighborhood size for the Cj, V, and C2 graph-emes and for the CjV and VC^ units. In the next set ofanalyses, we replaced these five separate measures with asingle measure, TV. Recall that TV is a global measure ofneighborhood size—the number of words (whether mono-syllabic or more than one syllable) that share all but oneletter with the target. Of particular interest is whether wordswith many neighbors have an advantage relative to wordswith few neighbors, especially if they are of low frequency.
For RT in the Wayne State study, the interaction of TV andword frequency was significant in all but one of the sixanalyses (two analyses based on monosyllabic neighborsand four analyses based on all neighbors). Low-frequencywords from dense neighborhoods tended to be responded tomore quickly than low-frequency words from sparse neigh-borhoods. For high-frequency words, the pattern of resultswas the opposite. A similar trend was observed in theanalyses of error data from the Wayne State study, but theinteraction between N and word frequency was significantin only one of the six analyses.
In the McGill study, the interaction of N and word fre-quency was not significant in any of the analyses of RT orerrors. In one analysis there was a main effect of N such thatwords from dense neighborhoods were responded to morequickly than words from sparse neighborhoods.
Regression Analyses Including Age ofAcquisition Ratings
Of the variables studied by Brown and Watson (1987),rated age of acquisition (AOA) was the best predictor ofnaming latency, better than subjective familiarity and betterthan the frequency of the word in printed or spoken lan-guage. Given this finding, we included a measure of AOAfrom the Medical Research Council Psycholinguistic Data-
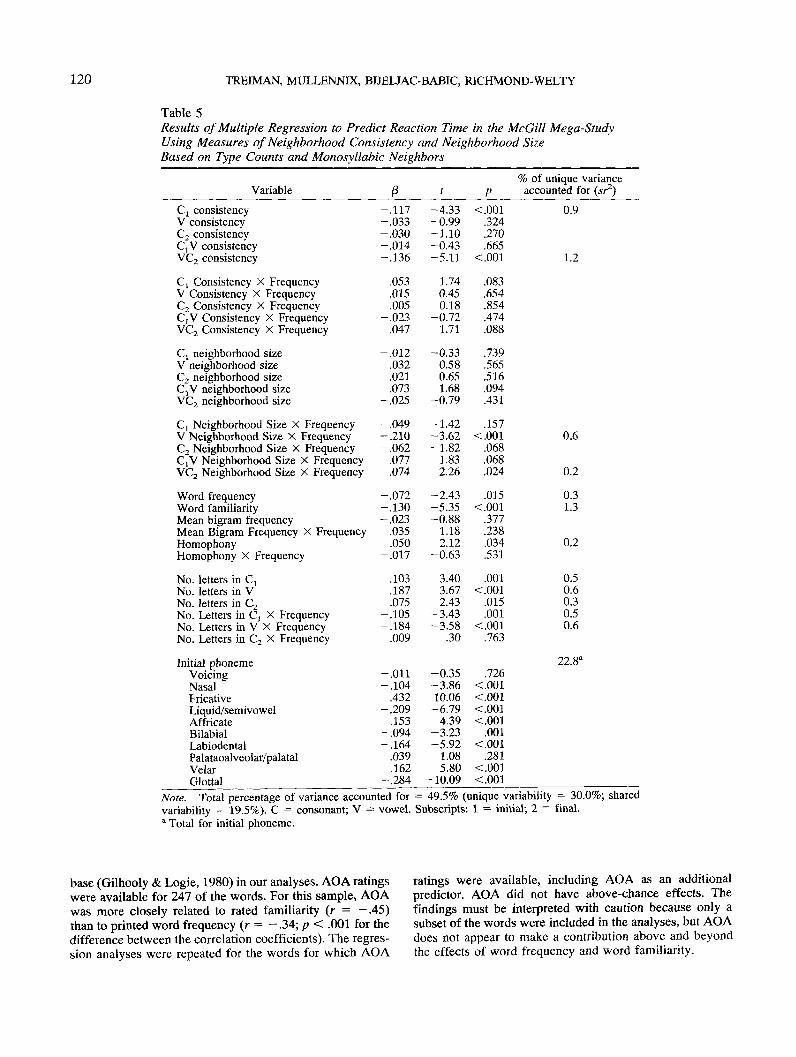
120 TREIMAN, MULLENNIX, BIJELJAC-BABIC, RICHMOND-WELTY
Table 5Results of Multiple Regression to Predict Reaction Time in the McGill Mega-StudyUsing Measures of Neighborhood Consistency and Neighborhood SizeBased on Type Counts and Monosyllabic Neighbors
Variable
GI consistencyV consistencyC2 consistencyCjV consistencyVC2 consistency
Cj Consistency X FrequencyV Consistency X FrequencyC2 Consistency X FrequencyC,V Consistency X FrequencyVC2 Consistency X Frequency
G! neighborhood sizeV neighborhood sizeC2 neighborhood sizeCaV neighborhood sizeVC2 neighborhood size
C] Neighborhood Size X FrequencyV Neighborhood Size X FrequencyC2 Neighborhood Size X FrequencyCtV Neighborhood Size X FrequencyVC2 Neighborhood Size X Frequency
Word frequencyWord familiarityMean bigram frequencyMean Bigram Frequency X FrequencyHomophonyHomophony X Frequency
No. letters in C,No. letters in VNo. letters in C2No. Letters in Ci X FrequencyNo. Letters in V X FrequencyNo. Letters in C2 X Frequency
Initial phonemeVoicingNasalFricativeLiquid/semivowelAffricateBilabialLabiodentalPalataoalveolar/palatalVelarGlottal
0-.117-.033-.030-.014-.136
.053
.015
.005-.023
.047
-.012.032.021.073
-.025
-.049-.210-.062
.077
.074
-.072-.130-.023
.035
.050-.017
.103
.187
.075-.105-.184
.009
-.011-.104
.432-.209
.153-.094-.164
.039
.162-.284
t
-4.33-0.99-1.10-0.43-5.11
1.740.450.18
-0.721.71
-0.330.580.651.68
-0.79
-1.42-3.62-1.82
1.832.26
-2.43-5.35-0.88
1.182.12
-0.63
3.403.672.43
-3.43-3.58
.30
-0.35-3.8610.06
-6.794.39
-3.23-5.92
1.085.80
-10.09
% of unique variancep accounted for (sr2)
<.001.324.270.665
<.001
.083
.654
.854
.474
.088
.739
.565
.516
.094
.431
.157<.001
.068
.068
.024
.015<.001
.377
.238
.034
.531
.001<.001
.015
.001<.001
.763
.726<.001<.001<.001<.001
.001<.001
.281<.001<.001
0.9
1.2
0.6
0.2
0.31.3
0.2
0.50.60.30.50.6
22.8a
Note. Total percentage of variance accounted for = 49.5% (unique variability = 30.0%; sharedvariability = 19.5%). C = consonant; V = vowel. Subscripts: 1 = initial; 2 = final.a Total for initial phoneme.
base (Gilhooly & Logie, 1980) in our analyses. AOA ratingswere available for 247 of the words. For this sample, AOAwas more closely related to rated familiarity (r = -.45)than to printed word frequency (r = - .34; p < .001 for thedifference between the correlation coefficients). The regres-sion analyses were repeated for the words for which AOA
ratings were available, including AOA as an additionalpredictor. AOA did not have above-chance effects. Thefindings must be interpreted with caution because only asubset of the words were included in the analyses, but AOAdoes not appear to make a contribution above and beyondthe effects of word frequency and word familiarity.
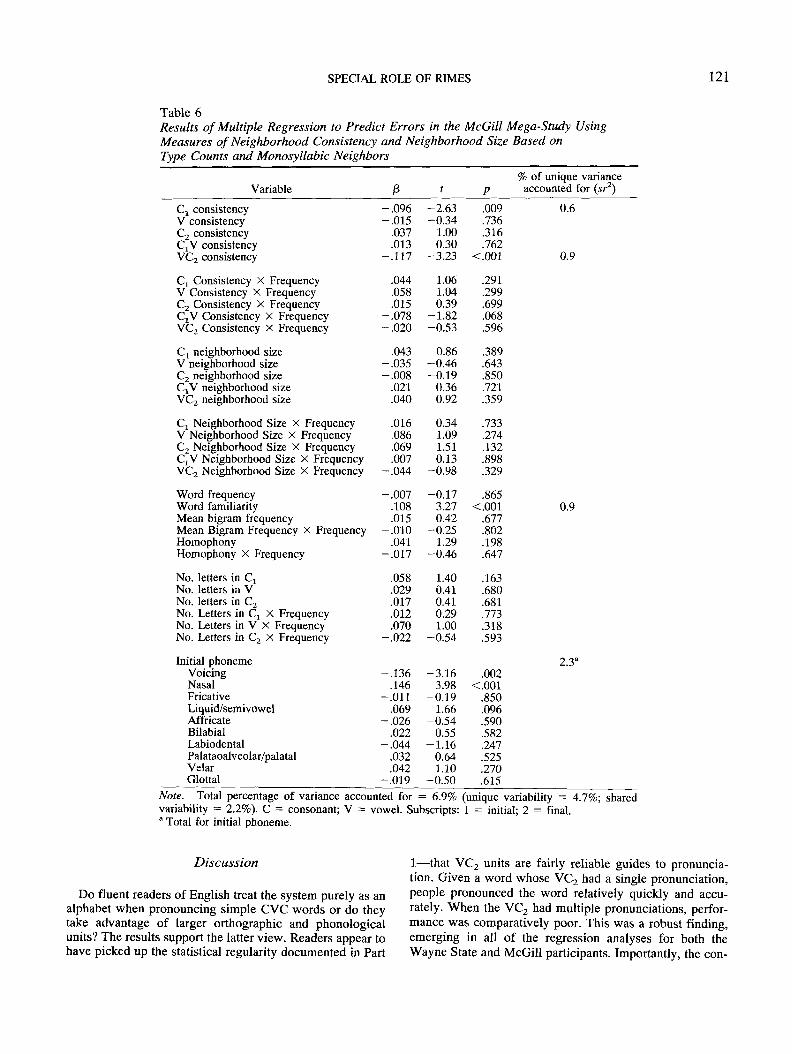
SPECIAL ROLE OF RIMES 121
Table 6Results of Multiple Regression to Predict Errors in the McGill Mega-Study UsingMeasures of Neighborhood Consistency and Neighborhood Size Based onType Counts and Monosyllabic Neighbors
Variable% of unique variance
accounted for (si2)
Cj consistencyV consistencyC2 consistencyCjV consistencyVC2 consistency
Cj Consistency X FrequencyV Consistency X FrequencyC2 Consistency X FrequencyCjV Consistency X FrequencyVC2 Consistency X Frequency
C: neighborhood sizeV neighborhood sizeC2 neighborhood sizeCjV neighborhood sizeVC2 neighborhood size
Cj Neighborhood Size X FrequencyV Neighborhood Size X FrequencyC2 Neighborhood Size X FrequencyCjV Neighborhood Size X FrequencyVC2 Neighborhood Size X Frequency
Word frequencyWord familiarityMean bigram frequencyMean Bigram Frequency X FrequencyHomophonyHomophony X Frequency
No. letters in CtNo. letters in VNo. letters in C2No. Letters in Cx X FrequencyNo. Letters in V X FrequencyNo. Letters in C2 X Frequency
Initial phonemeVoicingNasalFricativeLiquid/semivowelAffricateBilabialLabiodentalPalataoalveolar/palatalVelarGlottal
-.096-.015
.037
.013-.117
.044
.058
.015-.078-.020
.043-.035-.008
.021
.040
.016
.086
.069
.007-.044
-.007.108.015
-.010.041
-.017
.058
.029
.017
.012
.070-.022
-.136.146
-.011.069
-.026.022
-.044.032.042
-.019
-2.63-0.34
1.000.30
-3.23
1.061.040.39
-1.82-0.53
0.86-0.46-0.19
0.360.92
0.341.091.510.13
-0.98
-0.173.270.42
-0.251.29
-0.46
1.400.410.410.291.00
-0.54
-3.163.98
-0.191.66
-0.540.55
-1.160.641.10
-0.50
.009
.736
.316
.762<.001
.291
.299
.699
.068
.596
.389
.643
.850
.721
.359
.733
.274
.132
.898
.329
.865<.001
.677
.802
.198
.647
.163
.680
.681
.773
.318
.593
.002<.001
.850
.096
.590
.582
.247
.525
.270
.615
0.6
0.9
0.9
2.3a
Note. Total percentage of variance accounted for = 6.9% (unique variability = 4.7%; sharedvariability = 2.2%). C = consonant; V = vowel. Subscripts: 1 = initial; 2 = final.a Total for initial phoneme.
Discussion
Do fluent readers of English treat the system purely as analphabet when pronouncing simple CVC words or do theytake advantage of larger orthographic and phonologicalunits? The results support the latter view. Readers appear tohave picked up the statistical regularity documented in Part
1—that VQ units are fairly reliable guides to pronuncia-tion. Given a word whose VC2 had a single pronunciation,people pronounced the word relatively quickly and accu-rately. When the VC2 had multiple pronunciations, perfor-mance was comparatively poor. This was a robust finding,emerging in all of the regression analyses for both theWayne State and McGill participants. Importantly, the con-
122 TREIMAN, MULLENNIX, BIJELJAC-BABIC, RICHMOND-WELTY
sistency of the QV unit had no comparable effect. In noneof our analyses were words with consistent QV units re-sponded to more quickly or more accurately than wordswith less consistent CjV units. Thus, even though QV unitsvary in their consistency across the monosyllabic words ofEnglish, readers seemed not to be influenced by thisvariation.
Another robust finding was that words whose C1 graph-emes were consistently pronounced were responded to morequickly and accurately than words with less consistent Ct
graphemes. Although relatively few English CVCs haveinconsistently pronounced CjS, such variability hurt perfor-mance when it occurred. Together with the effect of VC2
consistency, this finding suggests that, at least in thespeeded naming task, printed words are processed to a largeextent in terms of orthographic units that correspond toonsets (Cj units) and orthographic units that correspond torimes (VC2 units). Adult readers do not rely only on analphabetic strategy; they do not process words only in termsof individual graphemes and phonemes.
Although readers rely heavily on letter clusters that cor-respond to the intrasyllabic units of onsets and rimes, theymay use an alphabetic strategy to some extent. At least inthe Wayne State study, there were also some significanteffects of V consistency and C2 consistency, the latter justfor low-frequency words. The Wayne State students appar-ently used links between spelling and sound for the indi-vidual graphemes of the rime as well as for the rime itself.The McGill students did not show this pattern. Possiblereasons for this and other differences between the twogroups of participants are discussed below.
For the Wayne State students, the detrimental effects ofinconsistency tended to be greater for low-frequency wordsthan for high-frequency words. This finding concurs withresults reviewed earlier that differences between exceptionwords and regular words and differences between regularconsistent words and regular inconsistent words tend to belarger when the words are less frequent than when the wordsare more frequent. In most of the previous studies, theinteraction between word frequency and irregularity was notexamined in terms of the location of the irregular spelling-to-sound correspondence within the word. We found inter-actions between frequency and consistency for Cj units inthe RT data from the Wayne State study and for VC2 and C2
units in the error data from the Wayne State study. TheMcGill students, however, did not show interactions be-tween consistency and word frequency.
Content (1991; Content & Peereman, 1992) providedsome evidence that, in the reading of French, irregularitiesat the beginning of a word are more detrimental than irreg-ularities at the end of a word. When single grapheme-phoneme correspondences are considered, the present re-sults support this claim. Exceptional grapheme-phonemecorrespondences in the Cj position hurt performance; ex-ceptions in the V and C2 positions were less harmful. Whencorrespondences between groups of graphemes and groupsof phonemes are considered, however, irregularities at theends of words (i.e., irregularities in the pronunciations ofVC2 units) were more detrimental than irregularities at the
beginnings of words (i.e., irregularities in the pronuncia-tions of CjV units). For short English words, then, earlyirregularities are not always more harmful than late irregu-larities. If longer words were considered, as in the studies ofFrench, the position of the exceptional spelling-sound cor-respondence might have a stronger effect.
Turning to the effects of neighborhood size, we find aninteraction between N and word frequency in the RT datafrom the Wayne State study. Words from dense neighbor-hoods were responded to more quickly than words fromsparse neighborhoods if the words were of low frequency.For high-frequency words, the pattern of results was theopposite. This interaction is similar to that reported byAndrews (1989,1992). The interaction between N and wordfrequency was not significant in the RT data from theMcGill study. In those RT data, however, number of neigh-bors as defined by shared VC2 units did interact with wordfrequency in the manner expected given Andrews's results.Specifically, low-frequency words from dense VC2 neigh-borhoods tended to be responded to more quickly thanlow-frequency words from sparse VC2 neighborhoods. Forhigh-frequency words, the size of the VC2 neighborhood didnot appear to be influential. The result for low-frequencywords in the McGill data is similar to the trend reported fornonwords by Treiman et al. (1990). Thus, for neighborsdefined in terms of shared multiple-grapheme units, anincrease in the number of neighbors was associated withimproved performance on low-frequency words when it hadany effect at all.
For neighbors as defined in terms of single shared graph-emes, any effects of neighborhood size were generally in theopposite direction. Specifically, increases in the number orfrequency of words that shared a grapheme with the targetwere sometimes associated with poor performance, at leastfor low-frequency words. Such findings have not been re-ported before, to our knowledge. However, the variability ofthe neighborhood size results across the two sets of datamakes interpretation difficult.
In general, words with high-frequency counts in printedtext led to faster and more accurate responses than wordswith low-frequency counts. Similar results have been foundin many studies of word naming (e.g., Balota & Chumbley,1984, 1985; Butler & Hains, 1979; Cosky, 1976; Forster &Chambers, 1973; Frederiksen & Kroll, 1976; McRae, Jared,& Seidenberg, 1990). The effect of subjective word famil-iarity was significant in all of the analyses. Words that wererated as familiar were responded to more quickly and moreaccurately than words that were rated as less familiar. Pre-vious studies, too, have found strong effects of familiarity(Connine, Mullennix, Shernoff, & Yelen, 1990; Gerns-bacher, 1984; Kreuz, 1987). When the effects of objectiveword frequency were compared with those of subjectiveword familiarity, familiarity was the better predictor ofperformance. This was true for both RTs and errors in bothsets of data. Brown and Watson's (1987) findings alsosuggest that familiarity is a better predictor of word naminglatency than is written or spoken frequency. The reasons forthis difference remain to be explored. Rated familiarity maybe a "grab bag" variable that reflects the contribution of
SPECIAL ROLE OF RIMES 123
semantic factors and the ease or difficulty of accessing aword's pronunciation as well as objective frequency.
In none of the analyses did bigram frequency contributesignificantly to the prediction of performance. Brown andWatson (1987) and Andrews (1992) also failed to findeffects of bigram frequency on word naming. For wordnaming, as for tachistoscopic identification (McClelland &Johnston, 1977), there is thus no evidence for an indepen-dent main effect of bigram frequency. One might expectbigram frequency and word frequency to interact such thatlow bigram frequency is detrimental for low-frequencywords but not for high-frequency words. Such an outcomewould mesh with the finding that orthographically unusualwords (sometimes called strange words) are difficult toprocess only if they are uncommon (Balota & Ferraro, 1993;Seidenberg et al., 1984; Waters & Seidenberg, 1985). Theinteraction between bigram frequency and word frequencywas not significant in the analyses displayed in Tables 2through 5, although the trends were generally in the pre-dicted direction.
Homophones were named more slowly than nonhomo-phones. Although homophones have been reported to causedifficulty in sentence acceptability judgments (e.g., V. Colt-heart, Avons, Masterson, & Laxon, 1991; Treiman, Freyd,& Baron, 1983), semantic categorization (e.g., Van Orden,1987) and lexical decision (Rubenstein, Lewis, & Ruben-stein, 1971; but see Clark, 1973; M. Coltheart et al., 1977),a detrimental effect of homophony on word naming has notbeen reported before, to our knowledge. The negative effectof homophony on word pronunciation may occur as peoplecompare their planned output to the printed stimulus, averification process similar to the kind envisaged in severalmodels of word identification (e.g., Becker, 1976; Paap,Newsome, McDonald, & Schvaneveldt, 1982). Given been,the response /bin/ could correspond to bin as well as to thestimulus that was actually presented. As a result, peoplemay be delayed in saying /bin/.
Effects of word length also emerged in our analyses.Longer words tended to be responded to more slowly andless accurately than shorter words. Because all of the wordsin our analyses had three phonemes and one syllable, theeffect of word length does not reflect the length of thephonological string to which the printed word corresponds.It must reflect, instead, the length of the printed word. Otherresearchers have also found effects of word length on nam-ing latency (Butler & Hains, 1979; Cosky, 1976; Eriksen,Pollack, & Montague, 1970; Forster & Chambers, 1973;Frederiksen & Kroll, 1976; Richardson, 1976). In the pre-vious studies, however, phonological length and ortho-graphic length have been confounded. Words that areequated for number of syllables but that differ in number ofletters, as with the stimuli used by Frederiksen and Kroll,tend to differ in number of phonemes as well. Our results gobeyond previous findings by suggesting that the number ofletters in a printed word has an effect on naming latencyabove and beyond any effects of the number of phonemes orthe number of syllables in the spoken word.
In some of our analyses, the effects of word length (inparticular, the lengths of the Cj and V graphemes) inter-
acted with word frequency. Increases in word length weremore detrimental for low-frequency words than for high-frequency words. In the only previous study that we knowof to have examined the interaction between word lengthand word frequency, Jared and Seidenberg (1990) reporteda similar result.
In general, then, our results suggest that the effects ofstructural factors are modulated by word frequency. Un-usual relations between spellings and sounds and increasesin word length may have less impact on common, wordsthan on rare words. Common words may be processed sorapidly and automatically and in such a holistic manner thatirregular spelling-sound relations and variations in wordlength (at least within the relatively small range of wordlength examined here) have little impact on performance.This idea is consistent with other evidence that commonwords are processed as units (e.g., N. Johnson, 1975; V.Schneider, Healy, & Gesi, 1991).
Finally, the initial phoneme had a strong effect on RT.This was especially true for the McGill students, whoseresponse times were faster than those of the Wayne Statestudents. Initial phoneme had less effect on error rates thanon RTs.
In both data sets, the regression analyses using typemeasures of neighborhood consistency and neighborhoodsize and the regression analyses using token measures ac-counted for similar percentages of variance. Although thetype-based analyses did slightly better in the prediction ofRTs, the reverse tended to be true for errors. Thus, ourresults do not clarify the issue of whether type frequency ortoken frequency is a better predictor of performance (Jaredet al., 1990; Kay, cited in Kay & Marcel, 1981). Nor werethere any clear differences in percentage of explained vari-ance between the analyses based on monosyllabic neighborsand the analyses based on all neighbors. The similarity isnot surprising given the relatively high correlations amongthe alternate measures of neighborhood consistency andneighborhood size (median rs = .70 for type and tokenmeasures of neighborhood consistency; .58 for type andtoken measures of neighborhood size; .73 for neighborhoodconsistency measures based on monosyllabic neighbors andneighborhood consistency measures based on all neighbors;.92 for neighborhood size measures based on monosyllabicneighbors and neighborhood size measures based on allneighbors).
The percentage of variance that we were able to explainranged from a low of 6.9% for errors in the McGill study(Table 6) to a high of 49.5% for RT in the McGill study(Table 5). How good is this? Some of the unexplainedvariance is surely error variance, but some of it may reflectfactors that were not included in our analyses. To get an ideaof how much of the unexplained variance may be due tofactors that we have not considered, we examined the re-siduals. If some factor that was not included in our analysesaffected the results of the Wayne State students and theMcGill students in the same way, the residuals from the twostudies should correlate highly. If the variance that is notexplained by our regressions is primarily error variance, theresiduals from the two studies should not correlate. The
124 TREIMAN, MULLENNIX, BIJELJAC-BABIC, RICHMOND-WELTY
correlations between the residuals were low (r = .17 forRTs and r = .12 for errors for the analyses depicted inTables 2 through 5), though significant (p < .001 for both).These results suggest that we have explained most of thenonerror variance in the data, although we have not ex-plained all of it.
Some of the variance that we have not explained mayreflect semantic factors. Although Brown and Watson(1987) did not find significant effects of imageability, con-creteness, or ambiguity in regression analyses that exam-ined the factors associated with word naming latencies,Strain, Patterson, and Seidenberg (in press) reported thatimageability was influential at least for low-frequency ex-ception words. Also, it has been reported that words withmore than one meaning are processed more rapidly thanwords with a single meaning in a lexical decision task(Jastrzembski, 1981; Kellas, Ferraro, & Simpson, 1988).Jastrzembski (1981) suggested that this variable may beimportant in word naming as well. Because published se-mantic ratings were not available for many of the words inour corpus, we were not able to examine the effects of thesevariables.
In general, the results for the Wayne State Universitystudents were similar to the results for the McGill Univer-sity students. However, there were some differences. TheWayne State students pronounced the words more slowlythan the McGill students but made fewer errors. Thesedifferences may reflect differences in subject populations.McGill University is more selective than Wayne State Uni-versity, and so McGill students may be, on the average,better readers. Differences in the testing situations couldalso have some effect. Wayne State students were tested ina laboratory, whereas McGill students were tested in themore informal setting of their residence halls. This couldhave contributed to differences between the two groups inthe relative emphasis on speech versus accuracy. Whateverthe reasons for the differences, the fast responses of theMcGill students may have caused the word-initial phonemeto have an especially large impact on RT. In addition,because the McGill students responded so quickly, theirerrors may have been less influenced by linguistic factorsthan the errors of the Wayne State students.
Another difference between the studies lies in the effectsof V consistency and C2 consistency. The Wayne Statestudents showed some effects of the consistency of theseintra-rime units, whereas the McGill students did not. Thedifferent results may reflect differences between the groupsin reading speed. The faster McGill readers may have reliedlargely on Cl and VC2 units, whereas the slower WayneState readers may have used individual graphemes withinthe rime as well. In this view, higher levels of reading skilland speed are marked by increased use of larger units.
The Wayne State students showed some significant inter-actions between word frequency and consistency of thekinds previously reported in the literature. The McGill stu-dents did not show these interactions, even though some ofthe previous experiments finding larger regularity effectsfor low-frequency words than for high-frequency wordswere carried out at McGill (Seidenberg, 1985; Seidenberg et
al., 1984; Waters & Seidenberg, 1985; Waters et al., 1984).Seidenberg (1985) reported that faster participants tended toshow less difference between the size of the regularity effectfor low-frequency words and the size of the regularity effectfor high-frequency words than slower participants did. Thequick responses of the McGill students in the present studymay have prevented us from seeing the interaction betweenword frequency and consistency that emerged in the slowerWayne State readers.
The results of Part 2 may be briefly summarized asfollows. When reading simple CVC words aloud, collegestudents do not rely solely on an alphabetic strategy involv-ing links between individual graphemes and individual pho-nemes. In addition, readers use larger orthographic andphonological units. The primary such units are the ortho-graphic VC2 and the phonological rime. Readers do notappear to use CjV units. Thus, fluent readers appear to haveinternalized the statistical regularities of English; they im-plicitly know that VC2 units are better guides to pronunci-ation than C,V units. These conclusions are supported bythe results of two independent studies in which collegestudents pronounced a large number of words over thecourse of several sessions.
In Part 3, we turned to more traditional experimentsinvolving factorial manipulations of CXV and VC2 consis-tency. We asked whether such experiments point to conclu-sions similar to those of the mega-studies. This is an im-portant question given that the percentage of varianceaccounted for by VC2 consistency in the regression analyseswas small. Although significant effects were found in anal-yses of both RTs and errors in both the Wayne State and theMcGill data, stronger conclusions could be drawn if effectsof VC2 consistency also emerged in traditional factorialexperiments.
Part 3: The Use of English Spelling-SoundRelations by Fluent Readers: Evidence From Small-
Scale Factorial Studies of Word Pronunciation
The regression approach of Part 2 has not been widelyused. In Part 3, we ask whether more traditional small-scaleexperiments also yield evidence for the use of VC2 units byfluent readers. Two word naming studies with Wayne StateUniversity students are reported. The stimuli were printedwords that were pronounced as CVCs. Two variables weremanipulated—the consistency of pronunciation of the CjVunit and the consistency of pronunciation of the VC2 unit.Thus, there were four types of words: those with highlyconsistent CjVs and highly consistent VC2s (high C1V/highVC2), those with highly consistent CjVs and less consistentVC2s (high QV/low VC2), those with low consistent CjVsand high consistent VC2s (low CjV/high QV), and thosefor which both the QV and the VC2 were low in consis-tency (low CjV/low VC2). We attempted to equate thewords in the four conditions for other variables that, basedon the results of Part 2 and prior studies, influence RT anderror rate.
As discussed earlier, authors of previous studies of word
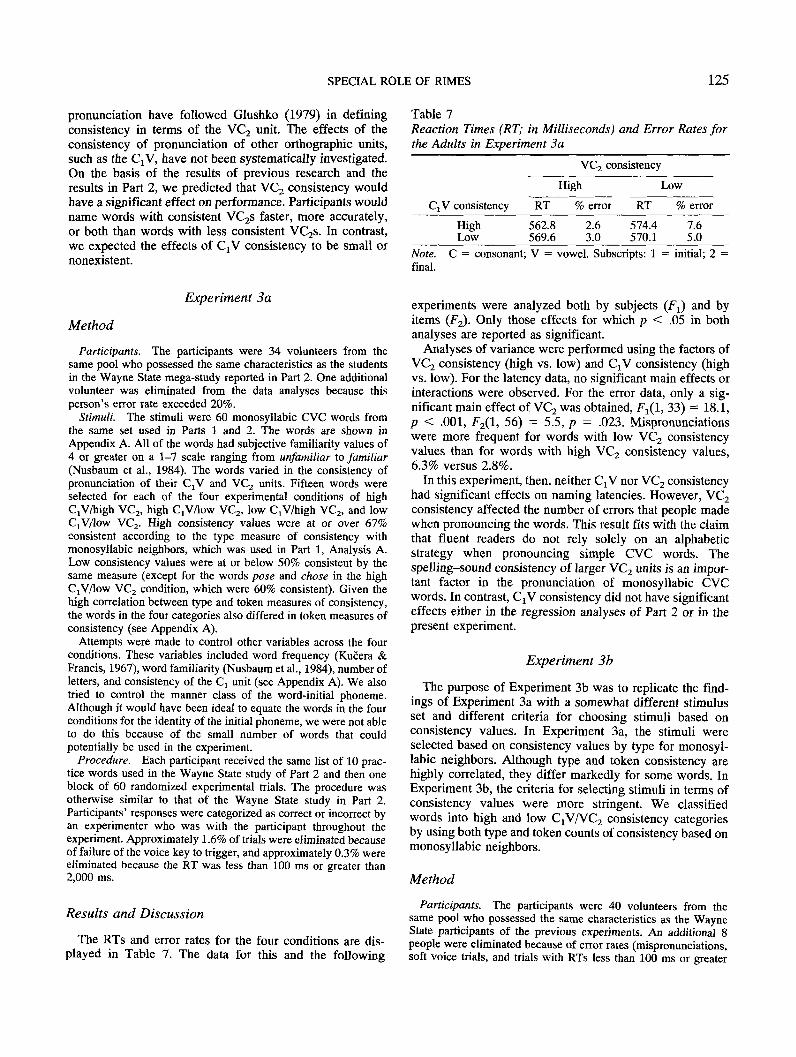
SPECIAL ROLE OF RIMES 125
pronunciation have followed Glushko (1979) in definingconsistency in terms of the VC2 unit. The effects of theconsistency of pronunciation of other orthographic units,such as the CjV, have not been systematically investigated.On the basis of the results of previous research and theresults in Part 2, we predicted that VC2 consistency wouldhave a significant effect on performance. Participants wouldname words with consistent VC2s faster, more accurately,or both than words with less consistent VC2s. In contrast,we expected the effects of CjV consistency to be small ornonexistent.
Table 7Reaction Times (RT; in Milliseconds) and Error Rates forthe Adults in Experiment 3a
VC2 consistency
High
CjV consistency
HighLow
RT
562.8569.6
% error
2.63.0
Low
RT
574.4570.1
% error
7.65.0
Note. C — consonant; V = vowel. Subscripts: 1 = initial; 2final.
Experiment 3a
Method
Participants. The participants were 34 volunteers from thesame pool who possessed the same characteristics as the studentsin the Wayne State mega-study reported in Part 2. One additionalvolunteer was eliminated from the data analyses because thisperson's error rate exceeded 20%.
Stimuli. The stimuli were 60 monosyllabic CVC words fromthe same set used in Parts 1 and 2. The words are shown inAppendix A. All of the words had subjective familiarity values of4 or greater on a 1-7 scale ranging from unfamiliar to familiar(Nusbaum et al., 1984). The words varied in the consistency ofpronunciation of their CjV and VC2 units. Fifteen words wereselected for each of the four experimental conditions of highCjV/high VC2, high QV/low VC2, low CjV/high VC2, and lowCjV/low VC2. High consistency values were at or over 67%consistent according to the type measure of consistency withmonosyllabic neighbors, which was used in Part 1, Analysis A.Low consistency values were at or below 50% consistent by thesame measure (except for the words pose and chose in the highQV/low VC2 condition, which were 60% consistent). Given thehigh correlation between type and token measures of consistency,the words in the four categories also differed in token measures ofconsistency (see Appendix A).
Attempts were made to control other variables across the fourconditions. These variables included word frequency (Kucera &Francis, 1967), word familiarity (Nusbaum et al., 1984), number ofletters, and consistency of the Q unit (see Appendix A). We alsotried to control the manner class of the word-initial phoneme.Although it would have been ideal to equate the words in the fourconditions for the identity of the initial phoneme, we were not ableto do this because of the small number of words that couldpotentially be used in the experiment.
Procedure. Each participant received the same list of 10 prac-tice words used in the Wayne State study of Part 2 and then oneblock of 60 randomized experimental trials. The procedure wasotherwise similar to that of the Wayne State study in Part 2.Participants' responses were categorized as correct or incorrect byan experimenter who was with the participant throughout theexperiment. Approximately 1.6% of trials were eliminated becauseof failure of the voice key to trigger, and approximately 0.3% wereeliminated because the RT was less than 100 ms or greater than2,000 ms.
Results and Discussion
The RTs and error rates for the four conditions are dis-played in Table 7. The data for this and the following
experiments were analyzed both by subjects (Fj) and byitems (F2). Only those effects for which p < .05 in bothanalyses are reported as significant.
Analyses of variance were performed using the factors ofVC2 consistency (high vs. low) and CtV consistency (highvs. low). For the latency data, no significant main effects orinteractions were observed. For the error data, only a sig-nificant main effect of VC2 was obtained, Fj(l, 33) = 18.1,p < .001, F2(l, 56) = 5.5, p = .023. Mispronunciationswere more frequent for words with low VC2 consistencyvalues than for words with high VC2 consistency values,6.3% versus 2.8%.
In this experiment, then, neither CXV nor VC2 consistencyhad significant effects on naming latencies. However, VC2consistency affected the number of errors that people madewhen pronouncing the words. This result fits with the claimthat fluent readers do not rely solely on an alphabeticstrategy when pronouncing simple CVC words. Thespelling-sound consistency of larger VC2 units is an impor-tant factor in the pronunciation of monosyllabic CVCwords. In contrast, CjV consistency did not have significanteffects either in the regression analyses of Part 2 or in thepresent experiment.
Experiment 3b
The purpose of Experiment 3b was to replicate the find-ings of Experiment 3a with a somewhat different stimulusset and different criteria for choosing stimuli based onconsistency values. In Experiment 3a, the stimuli wereselected based on consistency values by type for monosyl-labic neighbors. Although type and token consistency arehighly correlated, they differ markedly for some words. InExperiment 3b, the criteria for selecting stimuli in terms ofconsistency values were more stringent. We classifiedwords into high and low QV/VCj consistency categoriesby using both type and token counts of consistency based onmonosyllabic neighbors.
Method
Participants. The participants were 40 volunteers from thesame pool who possessed the same characteristics as the WayneState participants of the previous experiments. An additional 8people were eliminated because of error rates (mispronunciations,soft voice trials, and trials with RTs less than 100 ms or greater
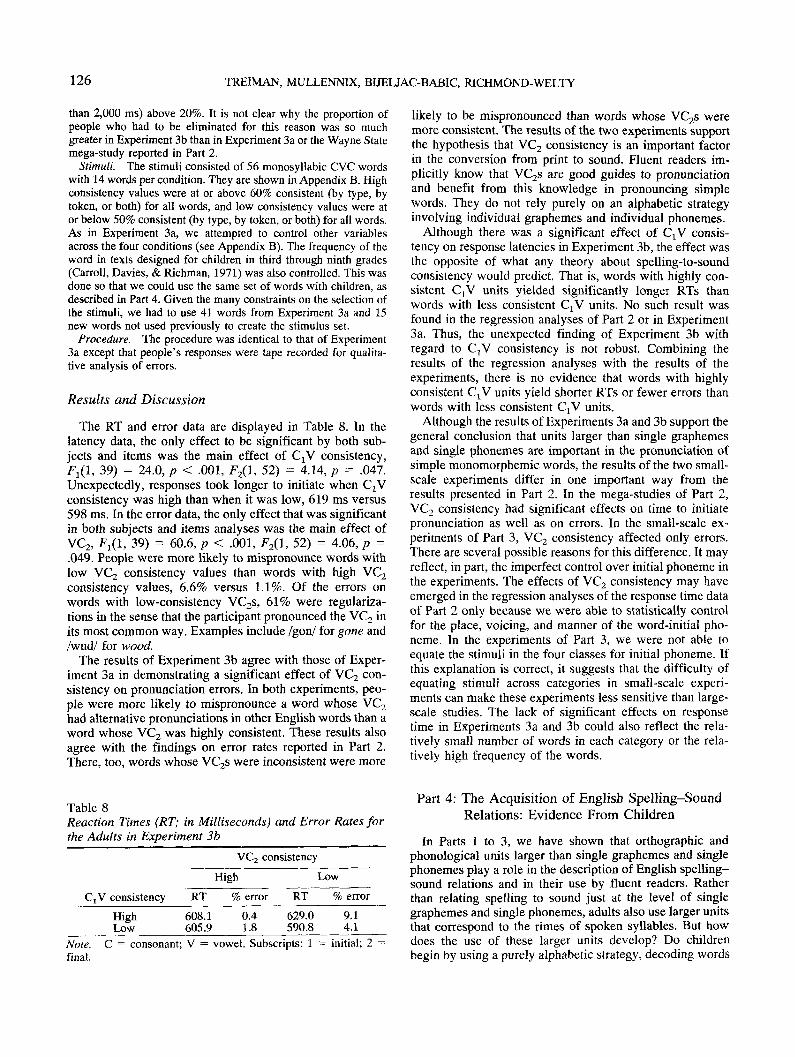
126 TREIMAN, MULLENNIX, BIJELJAC-BABIC, RICHMOND-WELTY
than 2,000 ms) above 20%. It is not clear why the proportion ofpeople who had to be eliminated for this reason was so muchgreater in Experiment 3b than in Experiment 3a or the Wayne Statemega-study reported in Part 2.
Stimuli. The stimuli consisted of 56 monosyllabic CVC wordswith 14 words per condition. They are shown in Appendix B. Highconsistency values were at or above 60% consistent (by type, bytoken, or both) for all words, and low consistency values were ator below 50% consistent (by type, by token, or both) for all words.As in Experiment 3a, we attempted to control other variablesacross the four conditions (see Appendix B). The frequency of theword in texts designed for children in third through ninth grades(Carroll, Davies, & Richman, 1971) was also controlled. This wasdone so that we could use the same set of words with children, asdescribed in Part 4. Given the many constraints on the selection ofthe stimuli, we had to use 41 words from Experiment 3a and 15new words not used previously to create the stimulus set.
Procedure. The procedure was identical to that of Experiment3a except that people's responses were tape recorded for qualita-tive analysis of errors.
Results and Discussion
The RT and error data are displayed in Table 8. In thelatency data, the only effect to be significant by both sub-jects and items was the main effect of CjV consistency,7^(1, 39) = 24.0, p < .001, F2(l, 52) = 4.14, p = .047.Unexpectedly, responses took longer to initiate when CjVconsistency was high than when it was low, 619 ms versus598 ms. In the error data, the only effect that was significantin both subjects and items analyses was the main effect ofVC2, Fj(l, 39) = 60.6, p < .001, F2(l, 52) = 4.06, p =.049. People were more likely to mispronounce words withlow VC2 consistency values than words with high VC2
consistency values, 6.6% versus 1.1%. Of the errors onwords with low-consistency VC2s, 61% were regulariza-tions in the sense that the participant pronounced the VC2 inits most common way. Examples include /gon/ for gone and/wud/ for wood.
The results of Experiment 3b agree with those of Exper-iment 3a in demonstrating a significant effect of VC2 con-sistency on pronunciation errors. In both experiments, peo-ple were more likely to mispronounce a word whose VC2
had alternative pronunciations in other English words than aword whose VC2 was highly consistent. These results alsoagree with the findings on error rates reported in Part 2.There, too, words whose VC2s were inconsistent were more
likely to be mispronounced than words whose VC2s weremore consistent. The results of the two experiments supportthe hypothesis that VC2 consistency is an important factorin the conversion from print to sound. Fluent readers im-plicitly know that VC2s are good guides to pronunciationand benefit from this knowledge in pronouncing simplewords. They do not rely purely on an alphabetic strategyinvolving individual graphemes and individual phonemes.
Although there was a significant effect of CjV consis-tency on response latencies in Experiment 3b, the effect wasthe opposite of what any theory about spelling-to-soundconsistency would predict. That is, words with highly con-sistent CjV units yielded significantly longer RTs thanwords with less consistent CjV units. No such result wasfound in the regression analyses of Part 2 or in Experiment3a. Thus, the unexpected finding of Experiment 3b withregard to CjV consistency is not robust. Combining theresults of the regression analyses with the results of theexperiments, there is no evidence that words with highlyconsistent QV units yield shorter RTs or fewer errors thanwords with less consistent CXV units.
Although the results of Experiments 3a and 3b support thegeneral conclusion that units larger than single graphemesand single phonemes are important in the pronunciation ofsimple monomorphemic words, the results of the two small-scale experiments differ in one important way from theresults presented in Part 2. In the mega-studies of Part 2,VC2 consistency had significant effects on time to initiatepronunciation as well as on errors. In the small-scale ex-periments of Part 3, VC2 consistency affected only errors.There are several possible reasons for this difference. It mayreflect, in part, the imperfect control over initial phoneme inthe experiments. The effects of VC2 consistency may haveemerged in the regression analyses of the response time dataof Part 2 only because we were able to statistically controlfor the place, voicing, and manner of the word-initial pho-neme. In the experiments of Part 3, we were not able toequate the stimuli in the four classes for initial phoneme. Ifthis explanation is correct, it suggests that the difficulty ofequating stimuli across categories in small-scale experi-ments can make these experiments less sensitive than large-scale studies. The lack of significant effects on responsetime in Experiments 3a and 3b could also reflect the rela-tively small number of words in each category or the rela-tively high frequency of the words.
Table 8Reaction Times (RT; in Milliseconds) and Error Rates forthe Adults in Experiment 3b
c,v consistency
HighLow
VC2
High
consistency
Low
RT % error RT % error
608.1 0.4605.9 1.8
629.0 9.1590.8 4.1
Note. C = consonant; V = vowel. Subscripts: 1 = initial; 2final.
Part 4: The Acquisition of English Spelling-SoundRelations: Evidence From Children
In Parts 1 to 3, we have shown that orthographic andphonological units larger than single graphemes and singlephonemes play a role in the description of English spelling-sound relations and in their use by fluent readers. Ratherthan relating spelling to sound just at the level of singlegraphemes and single phonemes, adults also use larger unitsthat correspond to the rimes of spoken syllables. But howdoes the use of these larger units develop? Do childrenbegin by using a purely alphabetic strategy, decoding words
SPECIAL ROLE OF RIMES 127
one grapheme at a time in a left-to-right manner? Alterna-tively, do children use VC2 units from the very beginning ofreading acquisition?
To address this question, we presented children in Exper-iment 4 with the same words that were used with adults inExperiment 3b. Children were asked to read the words aloudand their pronunciation errors were noted. RT data were notcollected because such data are extremely variable foryoung readers. We tested first graders at two points in theschool year as well as second graders, third graders, andfifth graders. Our primary question was whether children,like adults, do better on words with consistent VC2s than onwords with inconsistent VC2s. If so, when does a superiorityfor words with consistent VC2s emerge?
If people use VC2 orthographic units in reading aloudbecause they have noticed that these letter groups tend tohave consistent pronunciations, we would expect use ofVC2 units to increase with age and reading ability. Begin-ning readers may not use VC2 units because they have notyet had enough experience to know that these units recurfrequently and are good guides to pronunciation. They mayprefer to decode words one grapheme at a time, assigningeach grapheme to a phoneme regardless of the grapheme'scontext. This conception of early reading as sequentialdecoding has been put forward by Marsh, Friedman, Welch,and Desberg (1981). In this view, use of larger orthographicand phonological units should emerge gradually with in-creases in reading skill.
Alternatively, children may use VC^ units from the be-ginning but may not use CXV units. This preference mayreflect the phonological knowledge that children bring withthem to the reading process. Research reviewed by Adams(1990), Goswami and Bryant (1990), and Treiman (1992)shows that even prereaders divide spoken syllables intoonset and rime units. Treiman and Zukowski (1991), forexample, found that many preschoolers and kindergartenerscould judge whether two words shared an onset or shared arime. They had difficulty performing the analogous taskwith phonemes. As another example, the prereaders studiedby Kirtley, Bryant, Maclean, and Bradley (1989) could pickthe odd word out in a series such as man, mint, pick, andmug: that is, the word that did not share its onset with theother words. If children apply their knowledge of the struc-ture of spoken syllables to the new task of reading, they maytreat printed words in terms of letters or letter groups thatcorrespond to phonological onsets and letters or lettergroups that correspond to phonological rimes. Hence, evenbeginning readers should rely more heavily on VC2 ortho-graphic units than on CtV units.
Studies comparing children's ability to read words withconsistent and inconsistent VC2s show that children are hurtby VC2 inconsistency by second grade and perhaps earlier.Backman, Bruck, Hebert, and Seidenberg (1984) found thatsecond and third graders with above average reading skillsmade more errors on words whose VC2 units had more thanone pronunciation (e.g., paid, clown) than on words whoseVC2 units had only a single pronunciation (e.g., safe).Zinna, Liberman, and Shankweiler (1986) reported similarresults for third and fifth graders. The first graders studied
by Zinna et al., who were tested in the spring of the schoolyear, did not perform better on words with consistent VC2sthan on words with inconsistent VC2s, however. Laxon,Masterson, and Moran (1994) found, similarly, that 9-year-olds showed significant consistency effects whereas 7-year-olds did not. V. Coltheart and Leahy (1992) reported effectsof VC^ consistency for second graders. In this study, 6-7-year-olds tested in the middle and at the end of first gradealso showed significant effects of VC2 consistency. Theeffects were smaller for first graders than they were forolder children, which led V. Coltheart and Leahy to suggestthat first graders are less able to use rime-level units thanchildren a year or two older.
Further evidence that children use VC2 units as early asfirst grade comes from studies of children's ability to pro-nounce nonwords that vary in the frequency of their VC2
units. Treiman et al. (1990) compared nonwords such astain and goach, which contained common VC2 units, withnonwords such as taich and goan, which contained lesscommon VC2s. The two types of nonwords could be de-coded using the same grapheme-phoneme correspondences,so any superiority for the ton-type nonwords must reflectthe greater frequency of the ain unit. First graders testedduring the last month of the school year and good and poorthird-grade readers were better at pronouncing the non-words with more common VC2 units than the nonwordswith less common VC2 units. Bowey and Hansen (1994)replicated this result with above-average first-grade readerstested near the end of the school year, as well as withaverage second-grade readers and average and poor fourth-grade readers. However, below-average first grade readersdid not show a significant superiority for nonwords such astain and goach over nonwords such as taich and goan.
Other evidence for the importance of VC2 units in earlyreading comes from studies that examined patterns of trans-fer. Goswami (1986, 1988, 1990, 1991, 1993; Goswami &Mead, 1992) showed that, given a "clue" word such as beakand told its pronunciation, 6- and 7-year-old children coulduse this information to help decode words such as peak andnonwords such as neak, which share the vowel and finalconsonant letters with the clue. In two of these studies(Goswami, 1986,1988), even children who did not yet scoreon a standardized reading test could occasionally figure outhow to pronounce the target word or nonword given theclue. This finding suggests that children treat printed wordsin terms of units that correspond to onsets and rimes fromthe very beginning. However, Ehri and Robbins (1992)suggested that children do not use orthographic onsets andrimes as early as Goswami claimed. In the study of Ehri andRobbins, only children with some decoding ability showedsignificantly more transfer based on shared rimes than onshared graphemes. Children who were not yet able to de-code nonwords did not show such a difference.
The studies just reviewed indicate that children take ad-vantage of VC2 units when pronouncing words and non-words, although there are questions about how early thisstrategy emerges. Do VC2 units have a special status forchildren or are children equally likely to use any letter groupthat contains more than one grapheme? Some evidence that
128 TREIMAN, MULLENNIX, BIJELJAC-BABIC, RICHMOND-WELTY
VC2 units are special comes from the study by Treiman etal. (1990). The frequency of a nonword's VC2 unit was asignificant predictor of performance in a pronunciation task,but the frequency of the CaV unit was not. In the study byZinna et al. (1986), third graders' pronunciations of voweldiagraphs in nonwords were sometimes affected by theword-initial consonant as well as by the word-final conso-nant. However, Zinna and her colleagues did not systemat-ically compare the magnitudes of the VQ and CjV effects.
Several studies have examined the importance of variousorthographic units by comparing children's performance onwords that were visually segmented at different points.Wise, Olson, and Treiman (1990) taught first graders wordsthat were divided at the onset/rime boundary (e.g., cl ap,d ish) and words that were divided after the vowel (e.g., crib, ri ch). Onset/rime segmentation was more helpful thanpostvowel segmentation in short-term learning of the words,although the difference was reduced when children weretested half an hour after the end of training. In a study bySanta (1976-77), second graders, fifth graders, and adultsjudged whether a picture illustrated a word. The word wassometimes intact, as in blast; other times a space wasinserted at various points, as in bl ast and bla st. Fifthgraders and adults responded equally quickly in all condi-tions. Second graders did better when the orthographic onsetand rime were intact, as with bl ast, than when spaces wereinserted at other points.
Studies examining patterns of transfer in reading havealso compared orthographic units that contain a vowel andfinal consonant (or consonant cluster) and orthographicunits that contain an initial consonant (or cluster) and vowel(Bruck & Treiman, 1992; Goswami, 1986, 1988, 1991,1993; Goswami & Mead, 1992). In most of these studies,words that shared the orthographic rime of a target word ornonword (e.g., beak as a clue for peak or neak) were morehelpful than words that shared the onset and vowel of thetarget (e.g., beak as a clue for bean or beat) in allowing 6-and 7-year-old children to pronounce the target. However,rime analogies do not necessarily yield best retention of thetarget words (Bruck & Treiman, 1992).
Thus, children seem to prefer orthographic units thatcorrespond to onsets and rimes over orthographic units thatcorrespond to other groups of phonemes. Questions remainabout when this priority emerges. In Experiment 4, weaddressed this question by testing first graders at two pointsin the school year and also second graders, third graders,and fifth graders.
Experiment 4
Method
Participants. All of the children were native speakers of En-glish. They attended schools located in middle-class neighbor-hoods in the Detroit area. These schools included phonics trainingas part of reading instruction. Twenty first graders were tested attwo points during the school year. At the time of the first test,which took place in October, the children had a mean age of 6years 4 months (range = 5 years 11 months to 6 years 11 months)
and a mean grade equivalent on the reading subtest of the WideRange Achievement Test—Revised (WRAT-R; Jastak & Wilkin-son, 1984) of beginning first grade. The second test took place 5months later, in the middle of March. The children's reading levelat this time corresponded to mid second grade. The second graders,third graders, and fifth graders, 20 at each level, were tested onetime only. The second graders were tested in late March and Aprilwhen their mean age was 8 years 11 months (range = 8 years 4months to 9 years 7 months) and their mean score on the readingsubtest of the WRAT-R was at an end third-grade level. The thirdgraders, who were tested in February and March, had a mean ageof 9 years 11 months (range = 9 years 4 months to 10 years 11months) and a mean reading level of end fourth grade. The fifthgraders were also tested in February and March. They had a meanage of 11 years 10 months (range = 11 years 5 months to 12 years11 months) and a mean reading level of end seventh grade.
Stimuli. The words were the same as those used in Experiment3b (see Appendix B). There were 56 words varying in VC2
consistency (high vs. low) and CtV consistency (high vs. low).Each word was printed on a 3 in. by 5 in. card in ModernSchoolbook font.
Procedure. The order of the cards was randomized for eachchild. The experimenter turned over the cards one at a time andinstructed the child to read each word aloud. If the word wasdifficult, the child was encouraged to guess. Responses weretranscribed phonetically. If no attempt was made within 10 s, thenext word was presented. The experimenter provided generalencouragement but did not tell the child whether his or her pro-nunciations were correct. The child's responses were tape recordedfor later verification of scoring. The reading subtest of theWRAT-R was given in another session that took place within 1week of the experimental reading test.
Results
Figure 1 shows the mean percentage of errors for eachgroup of children on each type of word. The first graders didvery poorly when tested in October. Although a few chil-dren were able to read a fair number of words, the modalnumber of correct responses for each category was either 0or 1 (of 14 possible) and the mean error rates were over 80%for each word type. Thus, the data from the first test of firstgrade were not included in the main statistical analyses. Bythe second test, however, all of the first graders were able toread at least 3 words in each category and the scores weremore normally distributed.
The data from the second-semester first graders wereincluded together with the data from the second, third, andfifth graders in analyses of variance using the factors ofgrade, VQ consistency (high vs. low) and CjV consistency(high vs. low). A main effect of grade was found in both theanalysis by subjects and the analysis by items: F^S, 76) =21.99, F2(3,156) = 73.19, p < .001 for both. As expected,performance improved across grades. Also found were amain effect of VC2 consistency, F^l, 76) = 94.21, p <.001, F2(l, 52) = 8.00, p = .007, and an interaction betweengrade and VC2 consistency, F^S, 76) = 9.71, F2(3, 156) =5.77, p < .001 for both.
Given the interaction between grade and VC2 consis-tency, the data for each grade were analyzed separately. Thefirst-semester first graders showed no significant effects.
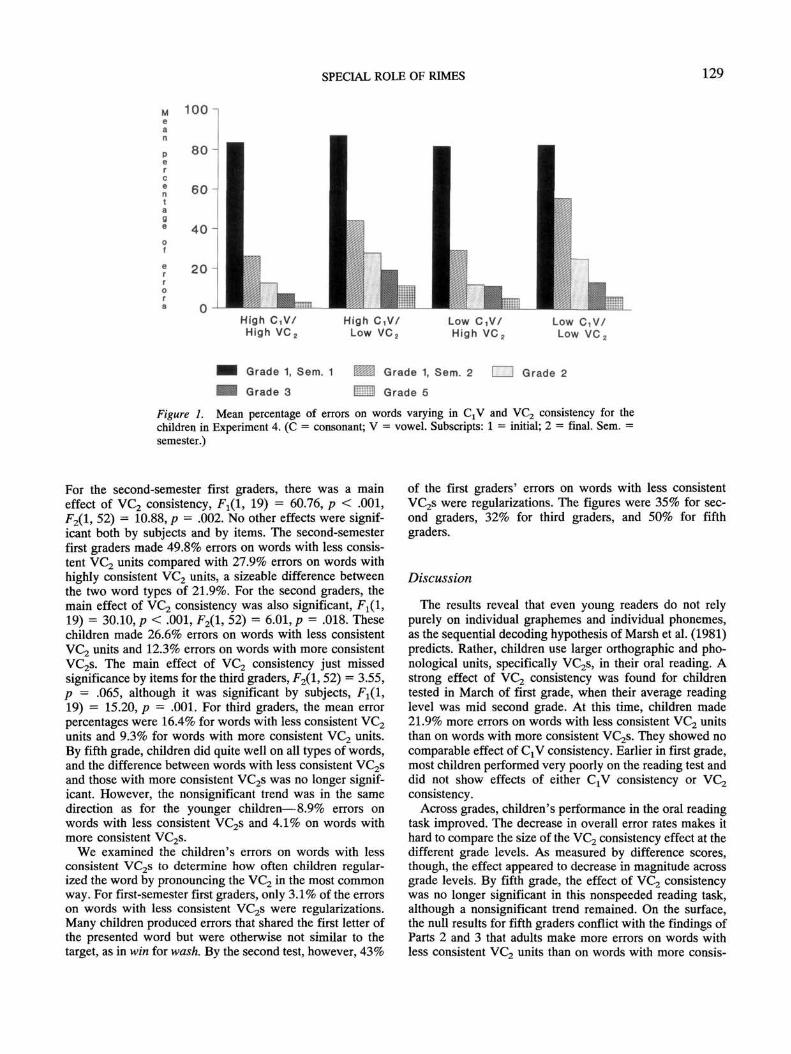
SPECIAL ROLE OF RIMES 129
M 100-
High C,V/High VC2
High C,V/Low VC2
Low C,V/High VC2
Low C,V/Low VC 2
Grade 1, Sem. 1
Grade 3
Grade 1, Sem. 2
Grade 5
Grade 2
Figure 1. Mean percentage of errors on words varying in C:V and VC2 consistency for thechildren in Experiment 4. (C = consonant; V = vowel. Subscripts: 1 = initial; 2 = final. Sem. =semester.)
For the second-semester first graders, there was a maineffect of VC2 consistency, F^l, 19) = 60.76, p < .001,F2(l, 52) = 10.88, p = .002. No other effects were signif-icant both by subjects and by items. The second-semesterfirst graders made 49.8% errors on words with less consis-tent VC2 units compared with 27.9% errors on words withhighly consistent VC2 units, a sizeable difference betweenthe two word types of 21.9%. For the second graders, themain effect of VC2 consistency was also significant, Fj(l,19) = 30.10, p < .001, F2(l, 52) = 6.01, p = .018. Thesechildren made 26.6% errors on words with less consistentVC2 units and 12.3% errors on words with more consistentVC2s. The main effect of VC2 consistency just missedsignificance by items for the third graders, F2(l, 52) = 3.55,p = .065, although it was significant by subjects, Fx(l,19) = 15.20, p = .001. For third graders, the mean errorpercentages were 16.4% for words with less consistent VC2
units and 9.3% for words with more consistent VC2 units.By fifth grade, children did quite well on all types of words,and the difference between words with less consistent VC2sand those with more consistent VC2s was no longer signif-icant. However, the nonsignificant trend was in the samedirection as for the younger children—8.9% errors onwords with less consistent VC2s and 4.1% on words withmore consistent VC2s.
We examined the children's errors on words with lessconsistent VC2s to determine how often children regular-ized the word by pronouncing the VC2 in the most commonway. For first-semester first graders, only 3.1% of the errorson words with less consistent VC2s were regularizations.Many children produced errors that shared the first letter ofthe presented word but were otherwise not similar to thetarget, as in win for wash. By the second test, however, 43%
of the first graders' errors on words with less consistentVC2s were regularizations. The figures were 35% for sec-ond graders, 32% for third graders, and 50% for fifthgraders.
Discussion
The results reveal that even young readers do not relypurely on individual graphemes and individual phonemes,as the sequential decoding hypothesis of Marsh et al. (1981)predicts. Rather, children use larger orthographic and pho-nological units, specifically VC2s, in their oral reading. Astrong effect of VC2 consistency was found for childrentested in March of first grade, when their average readinglevel was mid second grade. At this time, children made21.9% more errors on words with less consistent VC2 unitsthan on words with more consistent VC2s. They showed nocomparable effect of CtV consistency. Earlier in first grade,most children performed very poorly on the reading test anddid not show effects of either QV consistency or VC^consistency.
Across grades, children's performance in the oral readingtask improved. The decrease in overall error rates makes ithard to compare the size of the VC2 consistency effect at thedifferent grade levels. As measured by difference scores,though, the effect appeared to decrease in magnitude acrossgrade levels. By fifth grade, the effect of VC2 consistencywas no longer significant in this nonspeeded reading task,although a nonsignificant trend remained. On the surface,the null results for fifth graders conflict with the findings ofParts 2 and 3 that adults make more errors on words withless consistent VC2 units than on words with more consis-
130 TREIMAN, MULLENNIX, BIJELJAC-BABIC, RICHMOND-WELTY
tent VC2 units. The apparent discrepancy probably reflectsthe lack of time pressure in this study compared with thetime pressure that was present in the studies of Parts 2 and3. When words are presented on a computer screen andpeople are asked to pronounce them as quickly as possible,even adults have some difficulty on words with inconsistentVC2s.
The results of this study support previous suggestions thatchildren are sensitive to the spelling-sound consistency ofVC2 clusters from an early age (Backman et al., 1984; V.Coltheart & Leahy, 1992; Laxon et al., 1994; Zinna et al.,1986). The results thus speak against the view that childrenin the early grades are limited to a sequential decodingstrategy in which the pronunciation of a grapheme is unin-fluenced by its context (Marsh et ah, 1981). Our findings gobeyond those of previous studies by showing that childrendo not have the same sensitivity to CjV units that they do toVC2 units. That is, children do not use all possible multiple-grapheme units to the same degree. They prefer VC2s overQVs.
Earlier, we suggested two possible reasons why childrenmay rely on orthographic VC2 units. Children may use theseunits because they correspond to the phonological units ofspoken syllables. In this view, even the earliest beginnersshould treat printed words in terms of letter groups thatmirror the phonological units of onsets and rimes. Alterna-tively, children may come to use VC2 clusters because theyobserve that these letter groups tend to recur frequently andto have stable pronunciations. In this view, the youngestreaders should not show a special sensitivity to VC2 units.Such a sensitivity should emerge gradually as childrenobserve how words are spelled and how the spellings ofwords are related to their sounds.
The current results do not allow us to conclusively dis-tinguish between the two possibilities just outlined. Effectsof VC2 consistency appeared early in the development ofreading ability (second semester of first grade) but not at thevery beginning (first semester of first grade). This resultcould be taken to suggest that children develop a sensitivityto VC2 units based on their experience with the orthographyand its relation to the phonology. If so, children must graspthe statistical regularities of the language quite quickly.After only 6 or 7 months of formal reading instruction, thefirst graders in our study already had an implicit knowledgethat VC2 orthographic units have more consistent pronun-ciations than CjV units. Alternatively, children may besensitive to VC2 clusters from the beginning. In this view,the task of pronouncing a large number of unfamiliar wordswas simply too difficult for the first-semester first graders.The children reverted to guessing based on the initial lettersof the words. Even very young readers may possess aphonologically based strategy involving VC2 units, but thisstrategy may emerge only when the children are given moretime and experience with words.
We suspect that both phonological knowledge and expo-sure to print play a role in children's early sensitivity to VC2
units. Children's phonological knowledge prepares them todivide short printed words into units that correspond to theonset and rime units of spoken words. This tendency is
strengthened by the observations that orthographic rimeunits often have stable pronunciations and that these unitsrecur frequently. Together, these factors may help explainwhy children show a sensitivity to VC2 consistency from anearly age but no comparable sensitivity to QV consistency.
General Discussion
We designed this study to investigate the correspondencesbetween spellings and sounds that are embodied in the CVCwords of English and to examine the learning and use ofthese correspondences. The study was motivated by thehypothesis that, although the English writing system istraditionally described as an alphabet in its treatment ofmonomorphemic words, this description of the system maybe incomplete. Larger orthographic and phonological unitsmay also be important. Likewise, adults may not be limitedto an alphabetic strategy in translating from spelling tosound. They may use links between multiple-graphemeorthographic units and multiple-phoneme phonologicalunits. The learning of such links may play an important partin learning to read words.
In Part 1, we studied the correlations between spellingsand sounds in a subset of the English language—monosyl-labic words that are pronounced as CVCs. In line withprevious findings, we showed that vowels have a widervariety of pronunciations than do consonants. An importantnew finding was that the uncertainty in the pronunciation ofa vowel is reduced if the following consonant is taken intoaccount. In contrast, the initial consonant does not generallyhelp to specify the pronunciation of the vowel. Thus, therecognition of VC2 units helps to regularize the links be-tween spelling and sound in the English writing system.
The lexical statistics suggest a potential way for readers todeal with the vagaries of the English writing system. Spe-cifically, readers could use links between a word's voweland final consonant letters and the word's phonologicalrime in addition to links between individual graphemes andindividual phonemes. The studies described in Parts 2 and 3show that adult readers use such rime-level correspondencesand are not tied to a simple alphabetic strategy. Other thingsbeing equal, words in which the orthographic rime has asingle pronunciation yield better performance in pronunci-ation tasks than do words in which the orthographic rimehas several alternative pronunciations. Variability in thepronunciation of the initial consonant + vowel unit has nocomparable effect.
In Part 4, we asked how the sensitivity to orthographicrimes develops. Even children with only 6 or 7 months offormal reading instruction did better on words with consis-tent VC2 units than on words with less consistent VQ units.There was no sign that children used QV units, becauseperformance was no better on words with consistent CjVsthan on words with less consistent CjVs. Thus, an adultlikepattern of performance emerges at an early age. Even youngchildren do not decode words on a simple grapheme-by-grapheme basis, pronouncing each grapheme independentlyof the others. The phonological knowledge that children
SPECIAL ROLE OF RIMES 131
bring to the reading task may prepare them to treat printedwords in terms of units that correspond to the phonologicalunits of onsets and rimes. This tendency may be strength-ened as children observe that VC2 units tend to have stablepronunciations and tend to recur frequently in print.
The ability to pronounce printed words is an importantskill in itself, especially for children learning to read. Pho-nological mediation also appears to play an important rolein silent word recognition and reading (e.g., V. Coltheart etal., 1991; Lukatela & Turvey, 1994; Perfetti & Bell, 1991;Perfetti, Bell, & Delaney, 1988; Pollatsek, Lesch, Morris, &Rayner, 1992; Treiman et al., 1983; Van Orden, 1987).Thus, there has been a good deal of discussion of howpeople convert printed words into phonological forms. Ac-cording to dual-route models (e.g., M. Coltheart, 1978; M.Coltheart et al., 1993), readers have available two proce-dures for converting print to speech. The first, or lexical,route involves accessing the word's lexical entry from itsprinted form and retrieving the word's pronunciation fromthat entry. This route may be referred to as addressedphonology; the phonological form of the word is looked upin the mental lexicon. The second, or nonlexical, routeinvolves assembled phonology. Readers have available asystem of rules for constructing the pronunciations of letterstrings; these rules can be used for unfamiliar words as wellas for familiar words. For exception words such as pint,however, the rules give the wrong pronunciation.
Within a dual-route model, it is important to specify thenature of the nonlexical routine. According to M. Coltheartand his colleagues (M. Coltheart, 1978; M. Coltheart et al.,1993), this route is restricted to the level of individualgraphemes and individual phonemes. Other investigatorsproposed that the translation between spelling and soundcan involve larger units as well (Patterson & Morton, 1985;Shallice, Warrington, & McCarthy, 1983). Shallice and hiscolleagues suggested that initial consonant and vowel letterscan function as units, as can vowel plus final consonantletters. Patterson and Morton were more restrictive. Theyproposed that spelling-to-sound translation takes place attwo levels. The first is the level of graphemes and pho-nemes, as in M. Coltheart's model. The second is the levelof orthographic VC2 units, which Patterson and Mortoncalled bodies, and phonological rimes.
That the consistency of the Cj grapheme and the consis-tency of the VC2 unit are both associated with performancein the word pronunciation task is consistent with modifieddual-route models, like that of Patterson and Morton (1985),that grant a role for VC2 orthographic units. The lack of aneffect for CjV consistency does not support the suggestionof Shallice et al. (1983) that readers use QV units as wellas VC2 units. Our results suggest that readers rely on somemultiple-grapheme units to a greater degree than others.
Although our results are compatible with a dual-routemodel in which translation between spelling and sound canoccur at the level of orthographic rimes and phonologicalrimes, they are more difficult to reconcile with a model inwhich the translation is restricted to the single graphemesand single phonemes. One could attempt to interpret ourresults in such a framework by postulating context-sensitive
rules whereby a vowel's pronunciation is sometimes af-fected by the identity of the following consonant. The modelof M. Coltheart et al. (1993) includes some such rules;detailed study would be needed to compare the model'soutput with the present data. In a model that is based ongrapheme-phoneme rules, however, the regularity of thevowel grapheme and the final consonant grapheme wouldbe expected to have some impact on performance. This wasnot true for the McGill students in Part 2, who showedconsistency effects only for the initial consonant and theVC2 unit. Also, there is no principled reason within themodel of M. Coltheart et al. why contextual effects onvowel pronunciation should involve the following conso-nant to a greater degree than the preceding consonant.
Our findings may also be viewed within the framework ofconnectionist models such as that of Seidenberg and Mc-Clelland (1989). According to Seidenberg and McClelland,there is a single procedure for translating orthographic rep-resentations to phonological representations that applies toboth words and nonwords. The model is implemented as athree-layer network consisting of orthographic input units,hidden units, and phonological output units. The network istrained by presenting it with printed words and their pho-nological forms; the output pattern produced by the model iscompared with the correct pattern, and the weights on theconnections are adjusted accordingly.
Seidenberg and McClelland (1989)'s model, like humanreaders, picks up the importance of VC2 orthographic units.This happens not because these units are explicitly repre-sented in the model but because of the statistical propertiesof written English. Our results show that English indeed hasthe properties that Seidenberg and McClelland assumed it tohave. However, the model might be expected to pick up anyregularities in the lexical input, including those (relativelyrare, according to our results) that involve initial consonantsand vowels as well as those that involve vowels and finalconsonants (Seidenberg & McClelland, 1989, p. 544). Thus,the model might be expected to perform better on words thathave consistently pronounced CjV units than on words thathave inconsistently pronounced CjV units. Our participantsshowed no such pattern. Although this result is at first sightincompatible with Seidenberg and McClelland's model, themodel may be able to account for our data. The greatercovariation between vowels and final consonants in Englishmay swamp the effects of initial consonant + vowel co-variation. It would be necessary to test the model's perfor-mance with the present stimuli to determine whether it canexplain our results.
Thus, our results may be compatible both with models inwhich units larger than single graphemes and single pho-nemes are explicitly represented, as in the dual-route modelof Patterson and Morton (1985), and with models in whichstructural effects emerge from the statistical properties ofthe set of words on which the model is trained, such as themodel of Seidenberg and McClelland (1989). Here, as inother domains (Dell et al., 1993), it is difficult to distinguishbetween theories that include explicit linguistic rules andstructures and theories in which structural effects emergefrom the learning and storage of individual linguistic items.
132 TREIMAN, MULLENNIX, BIJELJAC-BABIC, RICHMOND-WELTY
Developmental studies may prove helpful in distinguishingbetween the two kinds of theories. In the area of reading, itwill be necessary to examine the statistical properties of thewords to which particular children are exposed and todetermine when these children begin to use VC2 units intheir pronunciation of printed words. Does the preferencefor VC2s emerge only as the statistical evidence for theseunits accumulates or does it show up even before then,reflecting the knowledge of spoken language that childrenbring with them to the reading task?
A deeper question is why the English writing system hasthe statistical properties it does. Is it an accident that word-final consonants are more important than word-initial con-sonants in helping to specify the pronunciations of vowels,or is this fact related to the structure of words in spokenEnglish? We suspect that the similarity is not accidental.When sound change occurs in spoken language, it may bemore likely to involve vowels and following consonantsthan vowels and preceding consonants. If the spellings ofwords remain the same, as they typically do, certain VC2
spellings would end up with "irregular" pronunciations thatwere nevertheless consistent for words sharing the samespelling. Thus, we suspect that the phonological structure ofthe language plays an important role in the development ofspelling—sound correspondences in the language as well asin the development of literacy within the individual.
In addition to their theoretical implications, our resultshave implications for methodological issues in psycholin-guistics. Many properties of words influence performancein reading and other tasks. These properties include wordfrequency, neighborhood characteristics, and length. Someof these properties are correlated with one another. Forexample, frequent words tend to have more neighbors thaninfrequent words (Frauenfelder et al., 1993; Landauer &Streeter, 1973). These weak but ever-present correlationsmake it hard to choose stimuli for factorial experiments.Often, one cannot find large numbers of words that differ inthe variable or variables of interest but that are matched forall of the other variables that are known to influence per-formance. The words that one does find may not be repre-sentative of those that occur in the language because of theneed to match words across cells on a wide range of vari-ables. We faced these problems ourselves in selecting thestimuli for the experiments in Parts 3 and 4. There was asmall pool of potential stimuli from which to choose, and itwas not possible to equate the words in the four classes forat least one important variable, that of initial phoneme.
In response to these problems, one could throw up one'shands and question whether it is possible to do psycholin-guistics at all (Cutler, 1981). But despair is not the onlypossible response. One can adopt the approach taken hereand supplement traditional experiments with large-scalestudies that are analyzed using regression methods. In suchlarge-scale studies, there is no attempt to choose stimuli thatdiffer on only the variable(s) of interest and that arematched on "nuisance" variables. Rather, the characteristicsof the stimuli are allowed to vary as they will. Statisticaltechniques are used to examine the contribution of each
variable above and beyond the contribution of all of theother variables.
Ideally, the results of the regression analyses will agreewith the results of traditional small-scale experiments. Suchagreement was found here for VC2 consistency. The regres-sion analyses of Part 2 and the results of the factorialexperiments of Parts 3 and 4 all point to an influence of VC2
consistency on word naming. When the two types of ap-proaches agree in this way, we gain confidence in thereliability of the findings. In some cases, however, the twoapproaches may not yield the same results. For example,significant interactions between consistency and word fre-quency did not appear in the data of the McGill studentsanalyzed in Part 2, whereas small-scale factorial experi-ments with this population have found such interactions(Seidenberg, 1985; Seidenberg et al., 1984; Waters & Sei-denberg, 1985; Waters et al., 1984). There are severalreasons why the experiments may be more sensitive than theregression methods in this case. Factorial experiments useextreme groups of stimuli: for example, words with veryhigh consistency values and words with very low consis-tency values, rather than words that vary over the wholerange. The data from a large-scale study may be more noisythan the data from a small-scale study because of fluctua-tions in participants' performance over several lengthy ses-sions and uncontrolled trial-to-trial priming. Such primingcan be avoided in a shorter experiment if words with sharedorthographic units are excluded.
Although well-designed experiments with well-matchedstimuli that are representative of the language as a wholecan be very sensitive, such experiments can be quite diffi-cult to achieve. We therefore urge researchers to supplementtraditional factorial experiments with studies that make useof regression techniques. In addition to alleviating the dif-ficulties involved in selecting stimuli, such studies allowone to compare the effects of a large number of differentvariables. Regression methods are especially useful nowthat statistical methods for examining interactions arewidely available (Aitken & West, 1991).
Behavioral studies must also be supplemented by detailedanalyses of the structure of language itself. We attempted todo this here in the case of English spelling-to-sound rela-tions. Such analyses can help us understand the statisticalcharacteristics of words and the naturally occurring associ-ations among their various properties. Lexical statistics be-come particularly important in light of models in which theprocessing of a particular linguistic item is influenced by theentire set of items that the participant knows, as in currentconnectionist models of reading (e.g., Seidenberg & Mc-Clelland, 1989) and other aspects of language processing(Dell et al., 1993; Rumelhart & McClelland, 1986). If suchmodels have a grain of truth, it is vital to understand thestatistical characteristics of the input that is available to thelearner.
References
Adams, M. J. (1990). Beginning to read: Thinking and learningabout print. Cambridge, MA: MIT Press.
SPECIAL ROLE OF RIMES 133
Aitken, L. S., & West, S. G. (1991). Multiple regression: Testingand interpreting interactions. Newbury Park, CA: Sage.
Andrews, S. (1982). Phonological receding: Is the regularity effectconsistent? Memory & Cognition, 10, 565—575.
Andrews, S. (1989). Frequency and neighborhood effects on lex-ical access: Activation or search? Journal of Experimental Psy-chology: Learning, Memory, and Cognition, 15, 802-814.
Andrews, S. (1992). Frequency and neighborhood effects on lex-ical access: Lexical similarity or orthographic redundancy?Journal of Experimental Psychology: Learning, Memory, andCognition, 18, 234-254.
Aronoff, M., & Koch, E. (1993). Context-sensitive linguistic reg-ularities in English spelling. Unpublished manuscript, State Uni-versity of New York at Stony Brook.
Backman, J., Bruck, M., Hebert, M., & Seidenberg, M. S. (1984).Acquisition and use of spelling-sound correspondences in read-ing. Journal of Experimental Child Psychology, 38, 114-133.
Balota, D. A., & Chumbley, J. I. (1984). Are lexical decisions agood measure of lexical access? The role of word-frequency inthe neglected decision stage. Journal of Experimental Psychol-ogy: Human Perception and Performance, 10, 340-357.
Balota, D. A., & Chumbley, J. I. (1985). The locus of word-frequency effects in the pronunciation task: Lexical accessand/or production? Journal of Memory and Language, 24, 89-106.
Balota, D. A., & Ferraro, F. R. (1993). A dissociation of frequencyand regularity effects in pronunciation performance acrossyoung adults, older adults, and individuals with senile dementiaof the Alzheimer type. Journal of Memory and Language, 32,573-592.
Baron, J., & Strawson, C. (1976). Use of orthographic and word-specific knowledge in reading words aloud. Journal of Experi-mental Psychology: Human Perception and Performance, 2,386-393.
Becker, C. A. (1976). Allocation of attention during visual wordrecognition. Journal of Experimental Psychology: Human Per-ception and Performance, 2, 556-566.
Berndt, R. S., Reggia, J. S., & Mitchum, C. C. (1987). Empiricallyderived probabilities for grapheme-to-phoneme correspondencesin English. Behavior Research Methods, Instruments, and Com-puters, 19, 1-9.
Bowey, J. A. (1990). Orthographic onsets and rimes as functionalunits of reading. Memory & Cognition, 18, 419-427.
Bowey, J. A. (1993). Orthographic rime priming. Quarterly Jour-nal of Experimental Psychology, 46A, 247-271.
Bowey, J. A., & Hansen, J. (1994). The development of ortho-graphic rimes as units of word recognition. Journal of Experi-mental Child Psychology, 58, 465-488.
Brown, G. D. A., & Ellis, N. C. (1994). Issues in spelling research:An overview. In G. D. A. Brown & N. C. Ellis (Eds.), Handbookof spelling: Theory, process and intervention (pp. 3-25). Chi-cester, England: Wiley.
Brown, G. D. A., & Watson, F. L. (1987). First in, first out: Wordlearning age and spoken word frequency as predictors of wordfamiliarity and word naming latency. Memory & Cognition, 15,208-216.
Brown, G. D. A., & Watson, F. L. (1994). Spelling-to-sound ef-fects in single-word reading. British Journal of Psychology, 85,181-202.
Bruck, M., & Treiman, R. (1992). Learning to pronounce words:The limitations of analogies. Reading Research Quarterly, 27,374-388.
Butler, B., & Mains, S. (1979). Individual differences in wordrecognition latency. Memory & Cognition, 7, 68-76.
Carroll, J. B., Davies, P., & Richman, B. (1971). Word frequencybook. Boston: Houghton Mifflin.
Chomsky, N. (1970). Phonology and reading. In H. Levin & J. P.Williams (Eds.), Basic studies on reading (pp. 3-18). NewYork: Basic Books.
Clark, H. H. (1973). The language-as-fixed-effect fallacy: A cri-tique of language statistics in psychological research. Journal ofVerbal Learning and Verbal Behavior, 12, 627-635.
Coltheart, M. (1978). Lexical access in simple reading tasks. In G.Underwood (Ed.), Strategies of information processing (pp.151-216). London: Academic Press.
Coltheart, M., Curtis, B., Atkins, P., & Haller, M. (1993). Modelsof reading aloud: Dual-route and parallel-distributed-processingapproaches. Psychological Review, 100, 589-608.
Coltheart, M., Davelaar, E., Jonasson, J. T., & Besner, D. (1977).Access to the internal lexicon. In S. Dornic (Ed.), Attention andperformance VI (pp. 535-555). Hillsdale, NJ: Erlbaum.
Coltheart, V., Avons, S. E., Masterson, J., & Laxon, V. (1991).The role of assembled phonology in reading comprehension.Memory & Cognition, 19, 387-400.
Coltheart, V., & Leahy, J. (1992). Children's and adults' readingof nonwords: Effects of regularity and consistency. Journal ofExperimental Psychology: Learning, Memory, and Cognition,18, 718-729.
Connine, C. M., Mullennix, J. W., Shernoff, E., & Yelen, J.(1990). Word familiarity and frequency in visual and auditoryword recognition. Journal of Experimental Psychology: Learn-ing, Memory, and Cognition, 16, 1084-1096.
Content, A. (1991). The effect of spelling-to-sound regularity onnaming in French. Psychological Research, 53, 3-12.
Content, A., & Peereman, R. (1992). Single and multiple processmodels of print to speech conversion. In J. Alegria, D. Holender,J. Morais, & M. Radeau (Eds.), Analytic approaches to humancognition (pp. 213-236). Amsterdam: Elsevier.
Cosky, M. J. (1976). The role of letter recognition in word recog-nition. Memory & Cognition, 4, 207—214.
Cutler, A. (1981). Making up materials is a confounded nuisance,or: Will we be able to run any psycholinguistic experiments atall in 1990? Cognition, 10, 65-70.
Dell, G. S., Juliano, C., & Govindjee, A. (1993). Structure andcontent in language production: A theory of frame constraints inphonological speech errors. Cognitive Science, 17, 149-179.
Ehri, L. C., & Robbins, C. (1992). Beginners need some decodingskill to read words by analogy. Reading Research Quarterly, 27,13-26.
Eriksen, C. W., Pollack, M. D., & Montague, W. E. (1970). Im-plicit speech: Mechanism in perceptual encoding. Journal ofExperimental Psychology, 84, 502-507.
Fitts, P. M., & Posner, M. I. (1967). Human performance. Bel-mont, CA: Brooks/Cole.
Forster, K. I., & Chambers, I. M. (1973). Lexical access and nam-ing time. Journal of Verbal Learning and Verbal Behavior, 12,627-635.
Fowler, C. A., Treiman, R., & Gross, J. (1993). The structure ofEnglish syllables and polysyllables. Journal of Memory andLanguage, 32, 115-140.
Frauenfelder, U. H., Baayen, R. H., Hellwig, F. M., & Schreuder,R. (1993). Neighborhood density and frequency across lan-guages and modalities. Journal of Memory and Language, 32,781-804.
Frederiksen, J. R., & Kroll, J. F. (1976). Spelling and sound:Approaches to the internal lexicon. Journal of ExperimentalPsychology: Human Perception and Performance, 2, 361-379.
Gernsbacher, M. A. (1984). Resolving 20 years of inconsistent
134 TREIMAN, MULLENNIX, BIJELJAC-BABIC, RICHMOND-WELTY
interactions between lexical familiarity and orthography, con-creteness and polysemy. Journal of Experimental Psychology:General, 113, 256-281.
Gilhooly, K. J., & Logic, R. H. (1980). Word age-of-acquisition,imagery, concreteness, familiarity, and ambiguity measures for1944 words. Behavior Research Methods and Instrumentation,12, 395-427.
Glushko, R. J. (1979). The organization and synthesis of ortho-graphic knowledge in reading aloud. Journal of ExperimentalPsychology: Human Perception and Performance, 5, 674-691.
Goswami, U. (1986). Children's use of analogy in learning to read:A developmental study. Journal of Experimental Child Psychol-ogy, 42, 73-83.
Goswami, U. (1988). Orthographic analogies and reading devel-opment. Quarterly Journal of Experimental Psychology, 40A,239-268.
Goswami, U. (1990). Phonological priming and orthographic anal-ogies in reading. Journal of Experimental Child Psychology, 49,323-340.
Goswami, U. (1991). Learning about spelling sequences in read-ing: The role of onsets and rimes. Child Development, 62,1110-1123.
Goswami, U. (1993). Towards an interactive analogy model ofreading development: Decoding vowel graphemes in beginningreading. Journal of Experimental Child Psychology, 56, 443-475.
Goswami, U., & Bryant, P. E. (1990). Phonological skills andlearning to read. London: Erlbaum.
Goswami, U., & Mead, F. (1992). Onset and rime awareness andanalogies in reading. Reading Research Quarterly, 27, 152-162.
Gough, P. B., & Cosky, M. J. (1977). One second of reading again.In N. J. Castellan, D. B. Pisoni, & G. R. Potts (Eds.), Cognitivetheory (Vol. 2, pp. 271-288). Hillsdale, NJ: Erlbaum.
Grainger, J. (1990). Word frequency and neighborhood frequencyeffects in lexical decision and naming. Journal of Memory andLanguage, 29, 228-244.
Jared, D., McRae, K., & Seidenberg, M. S. (1990). The basis ofconsistency effects in word naming. Journal of Memory andLanguage, 29, 687-715.
Jared, D., & Seidenberg, M. S. (1990). Naming multisyllabicwords. Journal of Experimental Psychology: Human Perceptionand Performance, 16, 92-105.
Jastak, S., & Wilkinson, G. (1984). The Wide Range AchievementTest—Revised. Wilmington, DE: Jastak Associates.
Jastrzembski, J. E. (1981). Multiple meanings, number of relatedmeanings, frequency of occurrence, and the lexicon. CognitivePsychology, 13, 278-305.
Johnson, D. D., & Venezky, R. L. (1976). Models for predictinghow adults pronounce vowel digraph spellings in unfamiliarwords. Visible Language, 10, 257-268.
Johnson, N. F. (1975). On the function of letters in word identifi-cation: Some data and a preliminary model. Journal of VerbalLearning and Verbal Behavior, 14, 17-29.
Kay, J. (1985). Mechanisms of oral reading: A critical appraisal ofcognitive models. In A. W. Ellis (Ed.), Progress in the psychol-ogy of language (Vol. 2, pp. 73-105). Hillsdale, NJ: Erlbaum.
Kay, J. (1987). Phonological codes in reading: Assignment ofsub-word phonology. In A. Allport, D. G. MacKay, W. Prinz, &E. Scheerer (Eds.), Language perception and production: Rela-tionships between listening, speaking, reading, and writing (pp.181-196). London: Academic Press.
Kay, J., & Bishop, D. (1987). Anatomical differences betweennose, palm, and foot, or, the body in question: Further dissectionof the processes of sub-lexical spelling-sound translation. In M.
Coltheart (Ed.), Attention and performance XII (pp. 449-469).Hillsdale, NJ: Erlbaum.
Kay, J., & Marcel, A. (1981). One process, not two, in readingaloud: Lexical analogies do the work of non-lexical rules. Quar-terly Journal of Experimental Psychology, 33A, 397-413.
Kellas, G., Ferraro, F. R., & Simpson, G. B. (1988). Lexical am-biguity and the timecourse of attentional allocation in wordrecognition. Journal of Experimental Psychology: Human Per-ception and Performance, 14, 601-609.
Kessler, B., & Treiman, R. (1994, November). Distributions ofphonemes in English CVC words and implications for languageprocessing. Paper presented at the meeting of the PsychonomicSociety, St. Louis, MO.
Kirtley, C., Bryant, P., Maclean, M., & Bradley, L. (1989). Rhyme,rime, and the onset of reading. Journal of Experimental ChildPsychology, 48, 224-245.
Kreuz, R. J. (1987). The subjective familiarity of English homo-phones. Memory & Cognition, 15, 154-168.
Kucera, H., & Francis, W. N. (1967). Computational analysis ofpresent-day American English. Providence, RI: Brown Univer-sity Press.
Landauer, T. K., & Streeter, L. A. (1973). Structural differencesbetween common and rare words: Failure of equivalence as-sumptions for theories of word recognition. Journal of VerbalLearning and Verbal Behavior, 12, 119-131.
Laxon, V., Masterson, J., & Moran, R. (1994). Are children'srepresentations of words distributed? Effects of orthographicneighbourhood size, consistency, and regularity of naming. Lan-guage and Cognitive Processes, 9, 1-27.
Lewellen, M. J., Goldinger, S. D., Pisoni, D. B., & Greene, B. G.(1993). Lexical familiarity and processing efficiency: Individualdifferences in naming, lexical decision, and semantic categori-zation. Journal of Experimental Psychology: General, 122,316-330.
Lukatela, G., & Turvey, M. T. (1994). Visual lexical access isinitially phonological: 1. Evidence from associative priming bywords, homophones, and pseudohomophones. Journal of Exper-imental Psychology: General, 123, 107-128.
Marsh, G., Friedman, M., Welch, V., & Desberg, P. (1981). Acognitive-developmental theory of reading acquisition. In G. E.MacKinnon & T. G. Waller (Eds.), Reading research: Advancesin theory and practice (Vol. 3, pp. 199-221). San Diego, CA:Academic Press.
McClelland, J. L., & Johnston, J. C. (1977). The role of familiarunits in perception of words and nonwords. Perception & Psy-chophysics, 22, 249-261.
McRae, K., Jared, D., & Seidenberg, M. S. (1990). On the roles offrequency and lexical access in word naming. Journal of Mem-ory and Language, 29, 43-65.
Nusbaum, H. C., Pisoni, D. B., & Davis, C. K. (1984). Sizing upthe Hoosier mental lexicon: Measuring the familiarity of 20,000words. Research on Speech Perception Progress Report No. 10.Bloomington: Indiana University.
Paap, K. R., Newsome, S. L., McDonald, J. E., & Schvaneveldt,R. W. (1982). An activation-verification model for letter andword recognition. Psychological Review, 89, 573-594.
Patterson, K. E., & Morton, J. C. (1985). From orthography tophonology: An attempt at an old interpretation. In K. E. Patter-son, J. C. Marshall, & M. Coltheart (Eds.), Surface dyslexia:Neuropsychological and cognitive studies of phonological read-ing (pp. 335-359). Hillsdale, NJ: Erlbaum.
Perfetti, C. A., & Bell, L. (1991). Phonemic activation during thefirst 40 ms of word identification: Evidence from backward
SPECIAL ROLE OF RIMES 135
masking and priming. Journal of Memory and Language, 30,473-485.
Perfetti, C. A., Bell, L., & Delaney, S. (1988). Automatic phoneticactivation in silent word reading: Evidence from backwardmasking. Journal of Memory and Language, 27, 59-70.
Pollatsek, A., Lesch, M., Morris, R. K., & Rayner, K. (1992).Phonological codes are used in integrating information acrosssaccades in word identification and reading. Journal of Exper-imental Psychology: Human Perception and Performance, 18,148-162.
Richardson, J. T. E. (1976). The effects of stimulus attributes uponlatency of word recognition. British Journal of Psychology, 67,315-325.
Rosson, M. B. (1985). The interaction of pronunciation rules andlexical representations in reading aloud. Memory & Cognition,13, 90-99.
Rubenstein, H. R., Lewis, S. S., & Rubenstein, M. A. (1971).Evidence for phonemic receding in visual word recognition.Journal of Verbal Learning and Verbal Behavior, 10, 645-657.
Rumelhart, D. E., & McClelland, J. L. (1986). On learning the pasttenses of English verbs. In J. L. McClelland & D. E. Rumelhart(Eds.), Parallel distributed processing: Explorations in the mi-crostructure of cognition (Vol. 2, pp. 216-271). Cambridge,MA: MIT Press.
Ryder, R. J., & Pearson, P. D. (1980). Influence of type-tokenfrequencies and final consonants on adults' internalization ofvowel digraphs. Journal of Educational Psychology, 72, 618—624.
Santa, C. M. (1976-77). Spelling patterns and the development offlexible word recognition strategies. Reading Research Quar-terly, 12, 125-144.
Schneider, V. L, Healy, A. F., & Gesi, A. T. (1991). The role ofphonetic processes in letter detection: A reevaluation. Journal ofMemory and Language, 30, 294-318.
Schneider, W. (1988). Micro Experimental Laboratory: An inte-grated system for IBM PC compatibles. Behavior ResearchMethods, Instruments, and Computers, 20, 206-217.
Seidenberg, M. S. (1985). The time course of phonological codeactivation in two writing systems. Cognition, 19, 1-30.
Seidenberg, M.S., & McClelland, J. L. (1989). A distributed,developmental model of word recognition and naming. Psycho-logical Review, 96, 523-568.
Seidenberg, M. S., & Waters, G. S. (1989, November). Namingwords aloud: A mega-study. Paper presented at the meeting ofthe Psychonomic Society, Atlanta, GA.
Seidenberg, M. S., Waters, G. S., Barnes, M. A., & Tanenhaus,M. K. (1984). When does irregular spelling or pronunciationinfluence word recognition? Journal of Verbal Learning andVerbal Behavior, 23, 383-404.
Shallice, T., Warrington, E. K., & McCarthy, R. (1983). Readingwithout semantics. Quarterly Journal of Experimental Psychol-ogy, 35A, 111-138.
Solso, R. L., & Juel, C. L. (1981). Position frequency and versa-tility of bigrams for two- through nine-letter English words.Behavior Research Methods and Instrumentation, 12, 297-343.
Stanback, M. L. (1992). Syllable and rime patterns for teachingreading: Analysis of a frequency-based vocabulary of 17,602words. Annals of Dyslexia, 42, 196-221.
Stanhope, N., & Parkin, A. J. (1987). Further explorations of theconsistency effect in word and nonword pronunciation. Memory& Cognition, 15, 169-179.
Stanovich, K. E., & Bauer, D. W. (1978). Experiments on thespelling-to-sound regularity effect in word recognition. Memory
(Appendixes follow
& Cognition, 6, 410-415.Strain, E., Patterson, K. E., & Seidenberg, M. S. (in press). Se-
mantic effects in single word naming. Journal of ExperimentalPsychology: Learning, Memory, and Cognition.
Tabachnick, B. G., & Fidell, L. S. (1989). Using multivariatestatistics (2nd ed.). New York: Harper & Row.
Taft, M. (1992). The body of the BOSS: Subsyllabic units in thelexical processing of polysyllabic words. Journal of Experimen-tal Psychology: Human Perception and Performance, 18, 1004-1014.
Taraban, R., & McClelland, J. L. (1987). Conspiracy effects inword pronunciation. Journal of Memory and Language, 26,608-631.
Treiman, R. (1989). The internal structure of the syllable. In G.Carlson & M. Tanenhaus (Eds.), Linguistic structure in lan-guage processing (pp. 27-52). Dordrecht, The Netherlands:Kluwer.
Treiman, R. (1992). The role of intrasyllabic units in learning toread and spell. In P. B. Gough, L. Ehri, & R. Treiman (Eds.),Reading acquisition (pp. 65-106). Hillsdale, NJ: Erlbaum.
Treiman, R. (1994). To what extent do orthographic units in printmirror phonological units in speech? Journal of PsycholinguisticResearch, 23, 91-110.
Treiman, R., & Chafetz, J. (1987). Are there onset- and rime-likeunits in written words? In M. Coltheart (Ed.), Attention andperformance XII: The psychology of reading (pp. 281—298).Hillsdale, NJ: Erlbaum.
Treiman, R., Fowler, C. A., Gross, J., Berch, D., & Weatherston,S. (1995). Syllable structure or word structure: Evidence foronset and rime units with disyllabic and trisyllabic stimuli.Journal of Memory and Language, 34, 132-155.
Treiman, R., Freyd, J., & Baron, J. (1983). Phonological recedingand use of spelling-sound rules in reading of sentences. Journalof Verbal Learning and Verbal Behavior, 22, 682-700.
Treiman, R., Goswami, U., & Bruck, M. (1990). Not all nonwordsare alike: Implications for reading development and theory.Memory & Cognition, 18, 559-567.
Treiman, R., & Zukowski, A. (1988). Units in reading and spell-ing. Journal of Memory and Language, 27, 466—477.
Treiman, R., & Zukowski, A. (1991). Levels of phonologicalawareness. In S. A. Brady & D. P. Shankweiler (Eds.), Phono-logical processes in literacy (pp. 67-83). Hillsdale, NJ:Erlbaum.
Van Orden, G. C. (1987). A ROWS is a ROSE: Spelling, sound,and reading. Memory and Cognition, 15, 181-198.
Venezky, R. L. (1970). The structure of English orthography. TheHague: Mouton.
Waters, G. S., & Seidenberg, M. S. (1985). Spelling-sound effectsin reading: Time course and decision criteria. Memory & Cog-nition, 13, 557-572.
Waters, G. S., Seidenberg, M. S., & Bruck, M. (1984). Children'sand adults' use of spelling-sound information in three readingtasks. Memory & Cognition, 12, 293-305.
Wise, B. W., Olson, R. K., & Treiman, R. (1990). Subsyllabicunits in computerized reading instruction: Onset-rime versuspostvowel segmentation. Journal of Experimental Child Psy-chology, 49, 1-19.
Wylie, R. E., & Durrell, D. D. (1970). Teaching vowels throughphonograms. Elementary English, 47, 787-791.
Zinna, D. R., Liberman, I. Y., & Shankweiler, D. (1986). Chil-dren's sensitivity to factors influencing vowel reading. ReadingResearch Quarterly, 21, 465-480.
on next page)
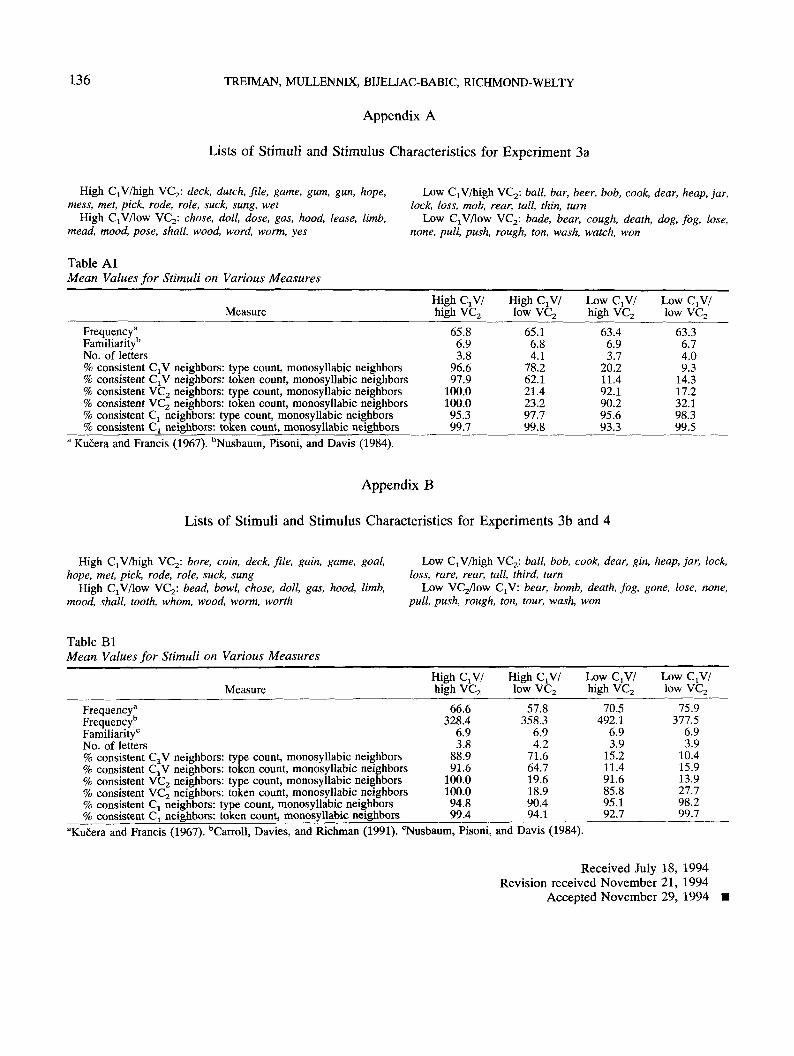
136 TREIMAN, MULLENNIX, BIJELJAC-BABIC, RICHMOND-WELTY
Appendix A
Lists of Stimuli and Stimulus Characteristics for Experiment 3a
High QV/high VC2: deck, dutch, file, game, gum, gun, hope,mess, met, pick, rode, role, suck, sung, wet
High CjV/low VC2: chose, doll, dose, gas, hood, lease, limb,mead, mood, pose, shall, wood, word, worm, yes
Table AlMean Values for Stimuli on Various Measures
Low CjV/high VC2: ball, bar, beer, bob, cook, dear, heap, jar,lock, loss, mob, rear, tall, thin, turn
Low CjV/low VC2: bade, bear, cough, death, dog, fog, lose,none, pull, push, rough, ton, wash, watch, won
Measure
Frequency"Familiarity11
No. of letters% consistent C^V neighbors: type count, monosyllabic neighbors% consistent C:V neighbors: token count, monosyllabic neighbors% consistent VC2 neighbors: type count, monosyllabic neighbors% consistent VC2 neighbors: token count, monosyllabic neighbors% consistent d neighbors: type count, monosyllabic neighbors% consistent d neighbors: token count, monosyllabic neighbors
High dV/high VC2
65.86.93.8
96.697.9
100.0100.095.399.7
High dV/low VC2
65.16.84.1
78.262.121.423.297.799.8
Low CjVfhigh VC2
63.46.93.7
20.211.492.190.295.693.3
Low dV/low VC2
63.36.74.09.3
14.317.232.198.399.5
' Kucera and Francis (1967). "Nusbaum, Pisoni, and Davis (1984).
Appendix B
Lists of Stimuli and Stimulus Characteristics for Experiments 3b and 4
High CjV/high VC2: bore, coin, deck, file, gain, game, goal,hope, met, pick, rode, role, suck, sung
High CjV/low VC2: bead, bowl, chose, doll, gas, hood, limb,mood, shall, tooth, whom, wood, worm, worth
Low CjV/high VC2: ball, bob, cook, dear, gin, heap, jar, lock,loss, rare, rear, tall, third, turn
Low VC2/low CjV: bear, bomb, death, fog, gone, lose, none,pull, push, rough, ton, tour, wash, won
Table BlMean Values for Stimuli on Various Measures
Measure
Frequencya
Frequency15
Familiarity0
No. of letters% consistent CjV neighbors: type count, monosyllabic neighbors% consistent QV neighbors: token count, monosyllabic neighbors% consistent VC2 neighbors: type count, monosyllabic neighbors% consistent VC2 neighbors: token count, monosyllabic neighbors% consistent C, neighbors: type count, monosyllabic neighbors% consistent d neighbors: token count, monosyllabic neighbors
High dV/high VC2
66.6328.4
6.93.8
88.991.6
100.0100.094.899.4
High CjV/low VC2
57.8358.3
6.94.2
71.664.719.618.990.494.1
Low dV/high VC2
70.5492.1
6.93.9
15.211.491.685.895.192.7
Low dV/low VC2
75.9377.5
6.93.9
10.415.913.927.798.299.7
"Kucera and Francis (1967). bCarroll, Davies, and Richman (1991). cNusbaum, Pisoni, and Davis (1984).
Received July 18, 1994Revision received November 21, 1994
Accepted November 29, 1994