Female Students Housing Student Housing Guide Housing Department
Upload
khangminh22Category
view
3download
0
Centre for Urban StudiesWorking Paper SeriesAugust 2018urbanstudies.uva.nl/workingpapers
The spatial polarization of housing markets and wealth accumulation
Rowan Arundel & Cody Hochstenbach
CUS Working Paper No.32©Rowan Arundel & Cody Hochstenbach

The CUS Working Paper Series is published electronically by the Centre for Urban Studies of the University of Amsterdam. Working papers are in draft form and copyright is held by the author or authors of each working paper. Papers may not be reproduced without permission of the copyright holder. Upon publication this version will be removed from our website and replaced by a direct link to the official publication. Editorial Committee CUS Working Paper Series Prof. Luca Bertolini Prof. Richard Ronald Prof. Justus Uitermark Dr. Wouter van Gent Dr. Rivke Jaffe Dr. Virginie Mamadouh Dr. Olga Sezneva Dr. Tuna Tasan Kok Dr. Floris Vermeulen Dr. Darshan Vigneswaran Centre for Urban Studies University of Amsterdam Nieuwe Achtergracht 166 1018 WV Amsterdam The Netherlands Website: urbanstudies.uva.nl Email: [email protected] The Centre for Urban Studies (CUS) houses the Urban Studies Research Priority Area of the Faculty of Social and Behavioural Sciences. It brings together urban scholars in sociology, geography, planning, political science, economics, development studies and other disciplines. The Centre supports existing urban research programs and stimulates interdisciplinary collaborative projects. With about 50 academic staff and over 50 PhD students, it is among the largest programmes of its kind in the world. The Centre works closely with both academic and non-academic partners and has developed a variety of institutional relations with other leading institutions. CUS is part of the AISSR, the Amsterdam Institute of Social Sciences Research, in the Faculty of Social and Behavioral Sciences at the University of Amsterdam.
CUS Working Paper Series – WPS-No. 32 Centre for Urban Studies, University of Amsterdam
1
The spatial polarization of housing markets and wealth accumulation
Rowan Arundel & Cody Hochstenbach
Abstract
Access to homeownership has always been uneven, but recent developments point to increasing inequalities. Labour markets
show divergence in terms of income and contract security, with a growing share of precarious outsiders. Intergenerational
inequalities are on the rise, amplifying the importance of parental resources in assisting adult children in entering homeownership.
Added to this, is a crucial spatial dimension to housing market polarization with divergence between ‘hotspot’ high-gain areas
versus low-gain ‘coldspots.’ The paper tackles the question of how where one buys has gained crucial importance in structuring
future housing-wealth accumulation with highly uneven access to high-gain areas. The research turns to the salient case of the
Netherlands, drawing on full-population register data. First, spatial analyses expose increasing spatial polarization in house-
value development. Second, household-level analyses demonstrate divided housing market access, revealing the combined impact
of income, employment status and different forms of parental wealth in shaping spatially variegated access. Taken together,
these dynamics in spatial polarization, labour market inequality and intergenerational support may determine opportunities
for housing wealth accumulation fundamentally exacerbating societal inequalities.
Key words: homeownership, housing wealth, spatial inequality, uneven development, dualization, intergenerational support
1. Introduction Housing matters. Housing is fundamental to shaping individual life course trajectories, being crucial
to the attainment of independence and starting a family (Clark & Dieleman 1996). It is also central
– and increasingly so – towards household economic security and wealth strategies (Doling &
Ronald 2010; Ansell 2014; Aalbers & Christophers 2014). On a societal level, housing is further
key in producing and reproducing various dimensions of inequality (Desmond 2016). Particularly,
differentiated access to homeownership and the potential to accumulate property assets appear
central to shaping societal inequalities.
Across many countries, housing assets currently represent the largest financial holding for most
households (Rowlingson & McKay 2012; Arundel 2017). Housing and property wealth also reflect
other entrenched societal divisions. While housing policy may act to attenuate social divisions, for
example through non-market housing provision and housing subsidies, over the past several
decades and especially since the Global Financial Crisis (GFC), developments have pointed
towards starkly increasing housing inequalities (Forrest & Hirayama 2015). In turn, the role of
housing itself in amplifying other dimensions of inequality has intensified (Allegré & Timbeau,

CUS Working Paper Series – WPS-No. 32 Centre for Urban Studies, University of Amsterdam
2
2015; Arundel, 2017; Dorling, 2014). The gradual and uneven erosion of welfare-state safety nets
(Brenner et al. 2010) alongside labour market restructuring (Bell & Blanchflower 2011;
Stockhammer 2013) have fundamentally increased the role of housing assets towards household
economic security.
It is thus crucial to understand how uneven housing market access shapes inequalities. In
addressing the question of who is able to buy, recent scholarly work has singled out emerging
generational divides (McKee 2012; Forrest & Hirayama 2015). For numerous reasons, younger
generations struggle to buy, particularly when they can’t rely on parental financial support.
However, as we argue in the paper, it is not just a matter of who is able to buy. In a context of
spatial polarization, where booming and struggling property markets coexist, where you buy may
profoundly affect asset accumulation.
Extending previous work on the topic, this paper therefore sets out to unravel the factors that
structure young-adult households’ likelihood to buy property in ‘high-gain’ locations – that is, areas
where the potential for housing asset accumulation is higher. To do so, the paper employs an
integrated perspective tackling three interrelated dynamics that structure unequal housing access:
spatial inequality in house-value developments, labour market divides, and the role of parental
resources in shaping young adults’ housing access. In doing so, we argue for an essential spatial
understanding of housing’s role in inequality trends. Spatial uneven development interacts with
various socio-economic household dimensions in shaping housing wealth inequalities. The
research empirically investigates these processes through an analysis of housing market
polarization in the Netherlands between 2006 and 2016 and current dynamics of inequality in
access.
The Dutch case is particularly salient, as it is characterized by relatively modest income inequality,
but strong wealth inequality (Reuten 2018). The highly financialized housing market serves as a
key explanation for wealth disparities (Van Bavel & Salverda 2014; Fernandez & Aalbers 2016).
Around 60% of the Dutch housing stock is owner occupied and 30% social rent. Traditionally,
social rent accommodated large population segments, but the tenure is declining in size and access
increasingly restricted to low-income populations (Musterd 2014).
The paper begins by outlining contemporary developments that have exacerbated uneven housing
dynamics. The sections that follow introduce two further key dimensions: labour market divides,
and the growing role of parental resources in housing market entry. The empirical approach
examines the interconnection between these three dynamics – spatial polarization in housing

CUS Working Paper Series – WPS-No. 32 Centre for Urban Studies, University of Amsterdam
3
markets, labour market inequalities, and parental support – within the case of the Netherlands.
The research focuses on two primary components: (a) an examination of nation-wide trends of
increasing spatial polarization in neighbourhood-level housing value1 developments, and (b)
modeling how labour market position alongside parental resources structure entry into divergent
asset-accumulation neighbourhoods. To do so, it draws on longitudinal and individual-level
register data from Statistics Netherlands. The discussion of the results brings attention to the way
in which these interacting dynamics may contribute to fundamental divides in wealth accumulation.
2. Theory
Housing market context A variety of forces over the past several decades have, by and large, increased housing’s role in
deepening societal inequalities (Forrest & Hirayama 2015). Across countries, housing
transformations have triggered growing divides in property values. Two key factors are increased
but uneven flows of capital into housing and mortgage system changes. These dynamics are linked
to the marketization and ‘financialisation’ of housing (Aalbers, 2016; Aalbers & Christophers 2014;
Arundel 2017). Financialisation has promoted increased investment in property alongside
expanded mortgage credit that has allowed greater leverage for housing purchase and an
embedding of real estate into global circuits of capital (Aalbers 2008; Schwartz & Seabrooke 2008;
Aalbers & Christophers 2014).
On a macro-level, financialization and expanded access to (cheap) credit essentially inflated the
values of collateral assets pushing up property values (Stiglitz 2012). Property markets became
increasingly an absorber of a global glut of capital, or ‘wall of money’ in pursuit of investment
opportunities (Fernandez & Aalbers 2016). Lower returns on bonds, bank deposits and pension
annuities, increased the appeal of real estate for those with capital (Green & Bentley 2014). As
Aalbers (2016:139) argues, “house prices did not skyrocket because demand increased faster than
supply (although this can be a contributing factor) but because the supply of money directed
towards housing went up.” Such house-value inflation was fundamental to growing divides over
the long-term, where growing wealth for market insiders contrasts with rising affordability barriers
for many others (Allegre & Timbeau 2015).
The spatial inequality of housing market developments Location plays an essential role in housing asset accumulation. While this may be a self-evident
real estate trope, spatial divisions in housing markets are seemingly on the rise. Financialization
1 The terms ‘housing values,’ ‘house values’ and ‘property values’ are used interchangeably in the paper.

CUS Working Paper Series – WPS-No. 32 Centre for Urban Studies, University of Amsterdam
4
has arguably intensified the capitalist logic of uneven development (Smith 1984). Increasing spatial
polarization plays out on various scales, for example between regions, between cities but also at
the very local level of neighbourhoods. At higher spatial scales trends point towards the channeling
of capital into first and second-tier global cities (Sassen 1991; 2014), which are considered the loci
of future economic growth. Property markets in such cities are targeted for both asset returns and
a relatively secure store of capital (Fernandez et al., 2016). Conversely, peripheral (shrinking)
regions are confronted with disinvestment and capital shifting away (Martinez-Fernandez et al.
2012).
The changing geography of capital flows, has gone hand in hand with state restructuring. Many
states have shifted from a form of “spatial Keynesianism” – with policies dampening spatial
inequalities by providing a counterweight to market forces – towards market-enabling
entrepreneurial policies that privilege winner areas (Brenner 2004). National policies increasingly
focus on successful city regions, under the presumption that this will boost national economic
growth. This is evidenced in contexts such as the Netherlands where more centralized power
facilitated national policy towards central-city growth (Terhorst & Van de Ven 1995). In addition,
local governments develop policies to outcompete other cities in capturing capital flows (Harvey
1989). The privileging of already strong and burgeoning locales, and direction of private and state
resources to such areas, may aggravate spatial polarization on different scales (Etherington & Jones
2009).
This does not only pertain to inter-regional differentiation, but also to divides at smaller scales
such as the neighbourhood. Selective residential mobility and social mobility tend to reproduce
concentrated affluence and disadvantage, as reflected by persistent patterns of socio-economic and
ethnic segregation (Sampson & Sharkey 2008; Sampson 2012). Recent studies point to an increase
in socio-spatial polarization, with income segregation on the rise in cities across Europe and the
United States (Bischoff & Reardon 2014; Tammaru et al. 2016). Such studies focus on population
distributions but similar patterns likely apply to neighbourhood housing market divisions as
measured, for example, by changing property values.
Existing research has pointed to associations between higher social class and increased housing
capital gains (Hamnett 1999) alongside recognition that such patterns can be geographic in nature
(Hamnett 1992; Arundel & Ronald forthcoming). However, direct research into spatial disparities
in housing wealth accumulation has been limited. A recent Swedish study concludes that higher-
income individuals were able to achieve greater capital gains, with residential trajectories in terms
of where they live over their life course serving as an important explanation (Wind & Hedman

CUS Working Paper Series – WPS-No. 32 Centre for Urban Studies, University of Amsterdam
5
2017). Similarly, a US study shows that low-income and migrant groups in poor neighbourhoods
suffered the worst capital losses after the real-estate bubble burst in 2008 (Newman & Holupka
2016).
Uneven developments exacerbate socio-spatial inequalities and house-value polarization, making
it more important to buy into the ‘right’ location. While the persistence of neighbourhood
inequality is important, neighbourhood change, notably gentrification, may also exacerbate
housing wealth divides. Especially more affluent population groups are able to capitalize on rent
gaps (Smith 1979), using their capital and access to mortgage credit to close such gaps (Wyly &
Hammel 1999; Aalbers 2007; Hochstenbach & Boterman 2017). Higher-income newcomers may
thus be able to buy into the most profitable niches. While long-term homeowners may also benefit
from rising house values, low-income tenants may struggle to stay put (Newman & Wyly 2006).
Labour market context Understanding housing inequality cannot be separated from the underlying factors that structure
unequal access to the housing market. Clearly, labour market position fundamentally shapes both
the ability to access homeownership and the type of local submarket households are able to invest
in. Of course, housing preferences and decisions are also influenced by a host of related social and
cultural factors (Ley 1996; Bourdieu 2005). Nevertheless, a sufficiently high income and degree of
economic security appear necessary to enter homeownership in the first place, while a particularly
strong economic position is needed to enter high-demand submarkets.
Contemporary labour market developments point towards increasing income and wealth
disparities across countries over the course of recent decades (Arundel & Doling, 2017; Saez and
Zucman 2016; Piketty 2014; Nolan et al. 2014). Economic restructuring has undermined greater
economic certainty that existed under previous Fordist conditions (Beck 1992; Giddens 1999), as
evidenced by the rise of contract precarity and underemployment (Standing 2011; Buchman and
Kriesi 2011; Nolan et al. 2014). While unemployment rates fluctuate over time, new positions have
been less likely to be full-time or stable, with steady long-term increases in the shares of involuntary
part-time and temporary contracts (Arundel & Doling 2017; OECD 2016). These trends
contribute to a hollowing out of the traditional middle classes across advanced economies
(Milanovic 2016).
Various interrelated dynamics have driven labour market restructuring. Developments in
mechanisation have led to employment displacement especially among lower and middle incomes.
Globalization and neoliberal reforms have increased the mobility of capital and work, undermining
union bargaining power (Brown et al., 2011; OECD, 2011). Labour reforms have tended to further

CUS Working Paper Series – WPS-No. 32 Centre for Urban Studies, University of Amsterdam
6
reduce workers’ protection while privileging shareholders and short-term profit interests. The
consequences are a concentration of economic returns among holders of capital, with declining
labour income shares (Stockhammer 2013; Piketty 2014; Wood, 2017). Finally, the turn towards a
service-oriented economy across many countries is associated with stronger labour and socio-
economic polarization (Sassen 1991; Oesch 2006).
These drivers promote a growing ‘dualization’ between insiders and outsiders on the labour
markets (Davidsson & Naczyk 2009; Emmenegger, 2012). Dualization emphasizes that rather than
universal labour flexibilisation, reforms have tended to (relatively) spare a core group of ‘insiders’
thereby widening the gap with ‘outsiders’ facing the brunt share of worsening labour market
conditions (Biegert, 2014). Broadly-speaking, those already in more vulnerable circumstances
appear worst hit (Hills et al. 2013).
Taken together, labour market trends have had very differentiated outcomes across groups and
across time, with significant evidence of rising intergenerational inequality. Older cohorts – albeit
by no means a uniform group – were more likely to benefit from favourable past labour conditions
and be more shielded from market reforms (Hausermann and Schwander 2012; Biegert, 2014).
These advantages intersected in many contexts with easier homeownership access and subsequent
house-value increases, resulting in significant shares of older cohorts with (substantial)
accumulated property wealth (Forrest & Hirayama 2015). On the other hand, younger cohorts
have faced labour market deterioration alongside growing housing unaffordability and, post-crisis,
more restricted access to credit. Data from the US and Europe have shown long-term decreases
in relative incomes for young adults (Bell & Blanchflower 2011; Arundel & Doling 2017), while
crisis outcomes have most impacted younger generations (Hills et al. 2013; Clapham et al. 2014;
McKee 2012).
Intergenerational family support Labour and housing restructuring have particular generational consequences on the housing
market. Homeownership rates among young adults are in decline across many countries (Lennartz
et al., 2016), with young adults more often staying in, or returning to the parental home (Arundel
& Ronald, 2016; Stone et al. 2014). They also have to rely to a greater extent on private rental and
insecure housing options (Clapham et al., 2014; Lennartz et al., 2016; Hochstenbach & Boterman
2015). The concentration of housing wealth among older generations ostensibly enhances the role
of intergenerational support in young adult housing trajectories, especially with regards to
purchasing a home (Forrest & Hirayama, 2015). Intergenerational transfers may take many forms:
from direct financial assistance, acting as guarantors in enabling credit access, to in-kind support

CUS Working Paper Series – WPS-No. 32 Centre for Urban Studies, University of Amsterdam
7
through childcare or co-residence that may allow increased savings towards home purchase
(Helderman and Mulder, 2007; Forrest and Hirayama, 2015; Öst 2012). Beyond financial
assistance, parents may lend other support, such as resourceful social networks and specific
housing knowledge (Hochstenbach & Boterman 2017). Finally, the intergenerational transmission
of homeownership is more broadly related to general social-class reproduction (Friedman et al.
2015), socialization (Gurney & Rowlands 2000), and normative (classed) expectations of
transitions to adulthood (Druta & Ronald, 2017).
Beyond simply access to homeownership, support from parents can also be fundamental in
structuring what housing is purchased. Parental resources may allow young adults to enter more
expensive housing segments (Spilerman & Wolff 2012). This also influences where young adults are
able to buy. Previous work shows how parental background plays an important role in the
residential location of young adults (Van Ham et al. 2014; Hochstenbach & Boterman 2017;
Coulter 2017), for example forging residential segregation based on parental resources
(Hochstenbach 2018).
Many young adults have an urban orientation, and increasingly so (Ley 1996; Boterman 2012).
Education institutions, facilities and labour market opportunities concentrate in larger cities.
Within these cities, middle-class young adults typically prefer centrally-located gentrifying
neighbourhoods. These areas are also commonly housing submarkets of higher capital gains. In
addition to intergenerational solidarity, parental assistance in buying into gentrifying
neighbourhoods can therefore also represent a strategic financial investment. Parental financial
support does not just flow randomly into the housing market, but is channeled into specific urban
neighbourhoods (Hochstenbach & Boterman 2017). Such support further drives up
neighbourhood house prices, contributing to the exclusion or displacement of lower-income
groups and stronger spatial polarization.
Taken together, dynamics of spatial inequality, divides in labour market position, and differentiated
access to family resources may structure both entry to homeownership and access to more or less
profitable submarkets. Given the spatial fixity of real estate markets, such dynamics may intensify
existing segregation and forge new spatial divides of uneven housing capital accumulation.
3. Data and analytical strategy The empirical research address two primary foci: (a) spatial polarization in housing values across
the Netherlands, and (b) modeling how labour market position alongside parental resources
structure entry into different asset-accumulation neighbourhoods. In other words, the paper

CUS Working Paper Series – WPS-No. 32 Centre for Urban Studies, University of Amsterdam
8
investigates polarization between ‘hot’ and ‘cold’ property markets as well as how new home buyers
sort into these different submarkets.
This paper draws on data from the System of Social-statistical Datasets (SSD) of Statistics
Netherlands, which allows users to combine different register datasets. It contains data on the full
population registered in the Netherlands, as well as dwelling-level information for the total housing
stock. All data are geocoded and longitudinal, making it possible to follow people over space and
time.
Spatial analysis of housing value dynamics In order to assess spatial housing market polarization, it is necessary to measure house-value
developments at low spatial scales. We draw on dwelling-level registry data to determine property
values for each year in the 2006-2016 period. Information on dwelling size is not available, so we
rely on total values. Only those dwellings that have real estate information available for all years
are included in our analyses. We exclude demolished and newly-built dwellings, as well as those
with missing data in any of the years. This leaves a ‘stable’ housing stock, which we use to
determine average neighbourhood-level property values. Property values (Dutch: Waardering
Onroerende Zaken [WOZ]) are based on building characteristics, official valuations, and recent selling
prices of nearby properties (Rijskoverheid, 2018). There is a strong correlation between house
values and house prices, but differences exist: rental units also get a value assigned, and a time lag
exists as changing sale prices take one or two years to translate into changes in assessed values.
We follow the 2016 Statistics Netherlands country-wide neighbourhood classification (Dutch:
buurten), typically delineated by natural boundaries, waterways and major infrastructure.
Neighbourhood boundaries are stable over time. To comply with SSD privacy requirements, we
exclude all neighbourhoods where less than ten (stable) dwellings had property values assigned.
We exclude a total of 1,621 neighbourhoods, mostly scarcely populated rural, industrial, or newly
developed areas, and a very small number due to missing data.2 This leaves a total of 11,202
neighbourhoods with 5,949,451 stable dwellings in our analyses.
We measure (inflation corrected) house-value development at the neighbourhood level in
percentage change over different periods, including 2006-2016 (the full data range) and 2014-2016
(early post-crisis ‘recovery’). GIS analysis is used to spatially map uneven developments in detail.
The resulting maps are presented as cartograms with neighbourhoods distorted proportional to
2 i.e. land-registry data is missing for the municipality of Steenbergen (10,006 dwellings distributed over 18 neighbourhoods in 2016). Due to the municipality’s small size this omission does not influence our findings.

CUS Working Paper Series – WPS-No. 32 Centre for Urban Studies, University of Amsterdam
9
dwelling numbers using the Gastner-Newman diffusion algorithm (Gastner & Newman 2004), as
this graphically indicates the relative size of property markets.
Subsequently, we analyze trends in housing market polarization by comparing low-value
neighbourhoods with high-value ones. We calculate house-value ratios, comparing the most
expensive neighbourhoods (i.e. top 10%) with the least expensive (i.e. bottom 10%). Increasing
ratios over time indicate a stronger house-value polarization. A Gini coefficient for average
neighbourhood values over the years is further measured to capture spatial inequality trends. The
Gini is a common measure to capture inequality, ranging from 0 (full equality) to 100 (complete
inequality).
Regression modelling The second empirical part of this paper looks into the question of where – in which
neighbourhood property markets – young adult households buy a home. The key question is to
what extent young adults of different socio-economic and parental backgrounds sort into hotter
or colder property markets with varied asset accumulation potential.
We first answer this question through descriptive analyses, focusing on the characteristics of young
adults moving into the different neighbourhoods. We do so by constructing neighbourhood decile
groups based on the 2014-2016 house-value development. To account for differences in
neighbourhood size, decile breaks are weighted by number of dwellings. The top decile thus
includes the 10% dwellings with the strongest neighbourhood house-value developments: the
‘hottest’ property markets nationally. Subsequently, we estimate regression models with the 2014-
2016 neioghbourhood-level percentage change in property values as dependent variable. Key
predictor variables concern labour market position and parental wealth background, as described
below.
Research population Our analyses focus on young-adult households that we classify as ‘new’ entrants having entered
homeownership at any point in 2015. All analyses are at the household level, because this is where
economic resources are bundled and translate into housing market purchasing power. We only
include households with one or two adult members, where the oldest household member is aged
between 16 and 39. Only households where all members moved residence are included to ensure
we are dealing with a new purchase, rather than people moving in together. Our selection only
includes young adults who were previously tenants or living in the parental but who are owner-
occupiers after moving. In most cases these young adults will be first-time buyers, although we
cannot rule out that this includes returns into owner occupancy. As we are interested in the role

CUS Working Paper Series – WPS-No. 32 Centre for Urban Studies, University of Amsterdam
10
of parental resources, only households where the wealth position of at least one parent is known
are included. After narrowing down our population, and excluding cases with missing data, our
population consists of 87,014 households (see Table 1 for descriptive statistics).
Table 1: Descriptive data. Household population in the multivariate analysis N=87,014. Data source: SSD, Statistics Netherlands, own calculations. % Mean
Gross household income (in Euros) 57,861 Source of income (main earner)
Employment - temporary contract 53.6 Employment - permanent contract 28.7 Employment - unknown/not applicable 1.0 Self employment 5.2 Benefits 2.1 Student bursary 9.2 Other 0.2
Age (oldest household member) 28.5 Household type
Single person 40.7 Couple without children 39.5 Couple with children 17.2 Single parent 1.6 Other 1.0
Ethnicity (main earner) Native Dutch 94.0 Non-western non-native 3.8 Western non-native 2.2
Gender (main earner) Female 33.0 Male 67.0
Highest followed education level (main earner) Unknown 5.0 Low 2.5 Mid 35.3 High 57.2
Parental housing wealth (in Euros) 171,347 Parental other wealth (in Euros) 274,418 Number of siblings 2.68
Parents together 54.99 Average neighbourhood house value in 2014 (in Euros) 211,066 Neighbourhood house value change 2014-2016 (in %) -0.85

CUS Working Paper Series – WPS-No. 32 Centre for Urban Studies, University of Amsterdam
11
Labour market indicators We include various labour-market indicators in our analyses, considering both gross household
income and employment situation in 2015. Employment situation is assigned for the household’s
main earner and is derived from tax registers. We distinguish five employment situations, based
on highest source of income over the year: employed, self-employed, receiving benefits, receiving
student bursaries, and a small other/unknown category. We subsequently draw on insurance
registers to determine whether employed main earners are on a permanent or temporary contract.3
In a small number of cases, employment status is categorized unknown, or not applicable (i.e. for
of major shareholders, or company directors).
It should be acknowledged that our analyses focus on a relatively well-off group of home buyers.
Those in rent or in the parental home – skewing lower on socio-economic status – are not part
of the research scope.
Parental resources Our analyses also focus on parental resources. Although we don’t have data available on actual
intergenerational financial transfers, we are able to include parental wealth positions. We
distinguish between net parental housing wealth and net other non-housing forms of parental
wealth. These net wealth measures subtract all outstanding debts, including mortgages. We
distinguish between the types of wealth because non-housing wealth such as savings may be more
easily transferable than (illiquid) housing wealth.
Parental wealth is summed for all parents of a household to account for the fact that couples with
affluent parents on both sides may receive more support than couples with affluent parents only
on one side. In other words, we measure the total wealth (minus debts) of all parents of all adult
household members.4 In cases where parents are separated, parental wealth is summed for both
parents. When wealth is missing for a parent (i.e. due to death or a parent living abroad), only the
assets of the other parent are used.
Young-adult households’ own wealth position may also play a role, but unfortunately our data only
allows us to include household wealth post-moving. At this point first-time buyers may have eaten
up their savings to buy and maximized their mortgage capacity. Including pre-moving wealth is
3 Very minor discrepancies between the tax and insurance datasets exist, though they are unlikely to skew results. 4 In the multivariate analyses we control for the total number of siblings as this may influence how much financial support one child may receive.

CUS Working Paper Series – WPS-No. 32 Centre for Urban Studies, University of Amsterdam
12
not possible, as we cannot distinguish personal wealth from parental wealth for young adults that
were living in the parental home.
4. Results
Spatial polarization of housing wealth The spatial analysis examines the uneven development of housing values across the Netherlands over the 2006-2016 period. This period includes rising average values until about 2010 with a subsequent stagnation then decline in the aftermath of the GFC. Only after 2015, average house values start increasing again (see Table 2). However, this national trend masks strong spatial variations in property value dynamics.
GIS analyses reveal stark spatial inequality in house-value development (Figure 1, see Appendix 1 for additional maps). National trends over the 2006-2016 period show a decline in house values to a point just below their 2006 values, but this pattern is strongly differentiated across the country (Figure 1a). Most areas show stronger declines while a few specific property markets have, on the contrary, displayed significant property value appreciation. Rising property values – i.e. hot markets – are mostly concentrated in a limited number of larger cities, namely Amsterdam, Utrecht, and Groningen.
The 2014-2016 period (Figure 1b) shows a striking pattern of divergent ‘recovery.’ Despite national indications of property value increases, a spatial understanding of these developments reveals instead a story of broad stagnation nationally. The glaring exception here is Amsterdam, where substantial property value gains dominate. Notwithstanding differences in absolute property values, the spatial analysis uncovers the stark geographic heterogeneity in real estate developments, and suggests a growing differentiation in potential asset accumulation among homeowners depending on where households buy property.
Composite indicators measuring inequality in housing values, broadly confirm increasing house-value polarization between neighbourhoods across the country (Table 2). A pattern of hot spots becoming hotter and cool spots cooler emerges. The 90:10 ratio shows that neighbourhoods in the 90th percentile had housing values that were 2.79 times higher than those in the 10th percentile in 2006. By 2016, this ratio had gone up to 3.04 – indicating increasing spatial inequality. Annual figures show a clear and consistent trend upwards, excluding a dip between 2013 and 2014. A very similar story is apparent looking at the 80:20 ratio (where values of the 80th percentile are divided by those of the 20th percentile), although the multiples are lower and the slope is more gradual as would be expected. Looking at the weighted 90:10 neighbourhood decile breaks (where divisions between deciles account for the number of dwellings), we see a longer and more gradual reversal as an effect of the crisis but a similar pattern of overall increase and especially in recent years. The weighted 80:20 ratio, while showing the same trend is much more stable.

13
Figure 1: Change in property values per neighbourhood across the Netherlands
Cartogram distortion based on Gastner-Newman diffusion algorithm.
Data source: SSD, Statistics Netherlands, own calculations. Values adjusted for inflation using the Consumer Price Index, Statistics Netherlands.
Tilburg
Amsterdam
The Hague
Almere
Utrecht
Rotterdam
Groningen
Eindhoven
Rotterdam
Almere
Tilburg
Amsterdam
Utrecht
Groningen
The Hague
Eindhoven
0 50 km
Cartogram proportional to number of dwellingsa) 2006-2016
> 40%30% to 40%20% to 30%10% to 20%2% to 10%-2% to 2%-10% to -2%-20% to -10%-30% to -20%- 40% to -30%< -40% Excluded (<10 dwellings)Eight largest municipalities
b) 2014-2016Cartogram proportional to number of dwellings
$
Eight largest municipalities

CUS Working Paper Series – WPS-No. 32 Centre for Urban Studies, University of Amsterdam
14
Table 2: Inequality measures between neighbourhoods based on average property values.
Note: analyses based on a stable housing stock over time. Data source: SSD, Statistics
Netherlands, own calculations.
2006 2007 2008 2009 2010 2011 2012 2013 2014 2015 2016
unweighted 90:10 2.79 2.80 2.83 2.87 2.91 2.92 2.94 2.98 2.94 2.96 3.04
unweighted 80:20 2.01 2.02 2.02 2.04 2.07 2.08 2.09 2.12 2.08 2.08 2.14
weighted 90:10a 2.25 2.24 2.26 2.29 2.32 2.30 2.30 2.29 2.28 2.31 2.35
weighted 80:20a 1.70 1.70 1.70 1.72 1.73 1.71 1.71 1.71 1.72 1.72 1.73
GINI 22.89 22.95 23.13 23.42 23.68 23.67 23.81 24.06 23.76 23.87 24.49
Mean neighbourhood property valuesb €297,907 €318,169 €331,340 €339,018 €337,296 €321,614 €307,688 €337,296 €268,340 €259,104 €265,485
Mean property valuesb €173,871 €190,215 €207,847 €217,309 €220,705 €219,914 €220,239 €216,983 €206,013 €201,492 €205,767
Number of neighbourhoods 11,202 11,202 11,202 11,202 11,202 11,202 11,202 11,202 11,202 11,202 11,202
Number of dwellings 5,949,451 5,949,451 5,949,451 5,949,451 5,949,451 5,949,451 5,949,451 5,949,451 5,949,451 5,949,451 5,949,451
a Weighted for number of dwellings per neighbourhood (percentile divisions based on dwelling counts). b Adjusted for inflation. Values in 2015 euros.
Finally, the Gini captures overall inequality in the distribution of average neighbourhood-level
housing values. Increasing Gini-coefficients (from 22.9 to 24.5) confirm a clear and substantial
pattern of spatial house-value polarization: nationwide, the distribution of housing values across
neighbourhoods has become more unequal. Between 2015 and 2016, the Gini shows a rapid
increase, suggesting accelerating polarization in the most recent years.
Given the time lag and more tempered nature of assessed property values in comparison with
actual sale prices, it is expected that the results would show even higher levels of inequality
measured by sales prices. Recent data on prices, only available for the largest municipalities, show
an intensified dominance of Amsterdam compared to the national average (Hochstenbach 2017).
This indicates that as the city captures an increasingly disproportionate share of property capital
flows, spatial polarization may accelerate.
Divided access We are subsequently interested in where young adults entering homeownership buy their home.
More specifically, we aim to unravel to what extent various socio-economic characteristics shape
access to high-gain versus low-gain submarkets for the 2014-2016 period, as already unraveled
above.
Descriptive findings Descriptive results (Table 3) reveal that, as may be expected, gross household income is positively
associated with the ability to buy in high-gain neighbourhoods. Households buying into the top

CUS Working Paper Series – WPS-No. 32 Centre for Urban Studies, University of Amsterdam
15
20% of neighbourhoods earn 2 to 6 percent more than the average young-adult household in our
population, while those moving into the lowest-gain neighbourhoods, earn 8 percent below
average. The relatively muted relationship can partly be explained by the fact only buyers are
included who would need a more substantial income to buy a home at all.
Table 3: Variation from mean for predictor variables across neighbourhood deciles
(mean=100). Data source: SSD, Statistics Netherlands, own calculations
<< lowest gain neighbourhoods highest-gain neighbourhoods >>
Deciles of neighbourhood house value change 2014-2016 1 2 3 4 5 6 7 8 9 10
Gross income 92 101 97 99 101 100 101 102 106 102
Parental (total) wealth 88 99 93 95 102 97 93 95 110 126
Parental housing wealth 90 105 94 97 101 95 94 96 108 116
Parental other wealth 82 96 89 94 103 97 92 95 115 141
Low education 128 115 108 116 112 100 98 101 74 63
Mid education 118 112 116 117 109 104 101 96 85 59
High education 88 91 89 88 93 98 99 103 111 129
Permanent contract 98 102 100 103 105 100 101 101 103 91
Temporary contract 104 102 101 100 97 100 101 101 94 101
Self employed 92 114 96 90 96 92 102 91 98 122
Unemployed 130 89 112 106 96 113 101 94 97 72
Student 99 79 98 87 84 105 95 96 104 140
Legend > 110 < 98 > 102 < 90
Looking at education reveals stronger differentiation. While overall, our population is a relatively
highly educated group,5 there are nonetheless clear divergences in neighbourhood outcomes.
Those with a low or middle education buy into low-gain areas relatively often, while those with a
high education concentrate in high-gain areas.
Employment status of principal household earner reveals some interesting findings. Both positions
of permanent and temporary contracts display relatively even distributions. Those on a permanent
contract do not buy into high-gain areas more often, neither does there appear to be a substantial
penalty for those on a temporary contract. Surprisingly, young adults buying into the highest-gain
5 This is partly because we focus on young adults and homebuyers – both groups with higher education levels than the total population.

CUS Working Paper Series – WPS-No. 32 Centre for Urban Studies, University of Amsterdam
16
areas are relatively often self-employed or students – a point we will elaborate upon in the
subsequent section.
Interestingly, parental wealth shows stronger divergences in neighbourhood outcomes than
household income. On average, the parents of young adult households moving into the highest-
gain neighbourhoods (top decile) hold 26% more wealth than average. Conversely, parental wealth
of young adults buying into the lowest-gain neighbourhoods is 12% below average. Distinguishing
between parental housing wealth and other non-housing parental wealth (i.e. savings), we find the
latter show an even stronger correlation with neighbourhood outcomes. This indicates that other
forms of wealth may be more liquid and easily transferable between generations than housing
wealth.
Multivariate analyses We estimated OLS regression models with the 2014-2016 neighbourhood property value change
as the dependent variable, to assess the isolated impact of labour market position and parental
wealth background (Table 4). We construct a two-step model, adding key parental variables in the
second step.
We first see a significant positive association between gross household income and buying into
higher-gain property markets. This is an important initial indication of an intensification of socio-
economic inequality through unequal asset accumulation potential. Education measures further
corroborate such reproduction of socio-economic divisions with highly educated households
being significantly more likely to move into high-gain neighbourhoods than their peers with a low
or middle education level.
Even after controlling for other factors, employment position measures reveal similarly
unexpected results as apparent in the descriptive findings. We find, surprisingly, that young adults
on a temporary contract, in self-employment, or in education are more likely to move into high-
gain areas than young adults on a permanent contract. One could argue that these groups have a
more urban orientation – where the strongest increases in housing values are also recorded. We
therefore estimated additional models (available upon request) focusing only on young adults that
bought in urban areas (models across the eight largest cities, the four largest cities, Amsterdam and
the Amsterdam metropolitan region). Even when narrowing our population, a similar effect for
those self-employed and temporarily employed is found. In other words, even within cities, these
young-adult households appear to sort into relatively higher gain areas. One explanation would be
that these represent ‘marginal gentrifiers’ – with lower economic but higher cultural capital (Rose
1984). They may lack the economic position to buy into established areas, seeking out niche
markets of incipient gentrification instead.

CUS Working Paper Series – WPS-No. 32 Centre for Urban Studies, University of Amsterdam
17
Table 4: Multivariate models (OLS regression). Dependent variable = percentage change
in house values 2014-2016 of the destination neighbourhood. Data source: SSD, Statistics
Netherlands, own calculations. Note: *p<0.05 **p<0.01 ***p<0.001.
Model 1 Model 2
Beta p Beta p Gross household income (in Euros) 0.083 *** 0.000 0.076 *** 0.000
Source of income (main earner)
Employment - temporary contract (ref) (ref) Employment - permanent contract 0.031 *** 0.000 0.030 *** 0.000 Employment - unknown/not applicable 0.016 *** 0.000 0.014 *** 0.000 Self employment 0.032 *** 0.000 0.031 *** 0.000 Benefits 0.007 * 0.039 0.006 0.087 Student bursary 0.058 *** 0.000 0.541 *** 0.000 Other 0.020 *** 0.000 0.019 *** 0.000
Age (oldest member) 0.023 *** 0.000 0.018 *** 0.000
Household type
Single person (ref) (ref) Couple without children -0.084 *** 0.000 -0.085 *** 0.000 Couple with children -0.094 *** 0.000 -0.092 *** 0.000 Single parent -0.017 *** 0.000 -0.016 *** 0.000 Other 0.016 *** 0.000 0.017 *** 0.000
Ethnicity (main earner)
Native Dutch (ref) (ref) Non-western non-native 0.014 *** 0.000 0.017 *** 0.000 Western non-native 0.029 *** 0.000 0.027 *** 0.000
Gender (main earner)
Female (ref) (ref) Male -0.038 *** 0.000 -0.036 *** 0.000
Highest followed education level (main earner)
Unknown 0.008 * 0.016 0.008 * 0.026 Low -0.002 0.522 -0.003 0.461 Mid (ref) (ref) High 0.124 *** 0.000 0.120 *** 0.000
Parental housing wealth 0.036 *** 0.000 Parental other wealth 0.042 *** 0.000
Number of siblings -0.030 *** 0.000 Parents together -0.036 *** 0.000
Average neighbourhood house value in 2014 0.091 *** 0.000 0.085 *** 0.000
Constant *** 0.000 *** 0.000 Number of cases 87,014 87,014 Adjusted R2 0.0478 0.0525

CUS Working Paper Series – WPS-No. 32 Centre for Urban Studies, University of Amsterdam
18
Looking at parental background variables, the subsequent model confirms a significant
independent ‘effect’ of parental housing and non-housing wealth on buying in higher-gain
neighbourhoods. These results clearly underscore the importance of intergenerational support in
accessing prime housing markets. Given that we are not able to look directly at financial transfers,
we acknowledge that parental wealth may also capture the broader social-class background of
young adults, although we do control for other key socio-economic indicators. Furthermore, the
‘number of siblings’ shows a significant negative effect indicating that potentially sharing parental
wealth with more siblings reduces the odds to move into high-gain areas. This reinforces the
likelihood of parental resources being important in direct support beyond broader class position
and associated preferences.
Among our control variables, the models return interesting results for ethnicity. We find that non-
western non-natives are significantly more likely to buy in higher-gain neighbourhoods compared
to their native Dutch counterparts. While this is initially an unexpected result, when we run a model
focusing only on the four largest cities or on Amsterdam, we instead find this group instead to be
significantly less likely to buy into high-gain areas. This therefore would seem to be explained by
their urban focus. In other words, non-western non-natives homebuyers tend to buy more often
in urban areas and especially within the largest cities where we also find many high-gain
neighbourhoods. Within these cities, however, they are more likely to buy into neighbourhoods
showing a relatively weak development in housing values.
It is furthermore important to keep in mind that we focus on a specific subset of homebuyers,
with non-western non-natives much more likely to depend on rental housing. Hence, urban house-
value increases may indeed benefit a small group of ethnic minorities – enabling those that bought
to accumulate substantial housing assets – but a larger share among these minority groups may in
fact find themselves on the losing end where house-value increases translate into declining rental
housing affordability.
Robustness checks Alongside the robustness checks for the subsample of larger cities and the Amsterdam region
discussed above, we carried out a series of additional models over different combinations of time
periods for property value change (including the full period 2006-2016, 2010-2016, 2011-2016, and
so forth). We also estimated regressions using larger borough districts (Dutch: wijken) as spatial
units. These robustness checks returned highly similar results across all variables, indicating that
our findings are not tied to a specific period or spatial scale.

CUS Working Paper Series – WPS-No. 32 Centre for Urban Studies, University of Amsterdam
19
5. Conclusion Through an analysis of detailed longitudinal register data for the Netherlands, we reveal patterns
of increasing spatial polarization in house values. Differences between ‘hot’ property markets –
where property values show the strongest increases – versus ‘cold’ markets are growing. Most
recent years indicate an acceleration in such spatial polarization. In other words, where one buys
has gained importance in securing future housing wealth accumulation. Investigating the flow of
young adults into the housing market, we further uncover sharply divided access to neighbourhood
property markets. Other than an orientation of self and temporary employed households towards
higher-gain gentrifying areas, the results revealed significant sorting of homebuyers into high or
low gain neighbourhoods across socio-economic lines. On top of household resources, the
findings expose how parental wealth structures access to high-gain areas, particularly where
parental non-housing wealth is concerned.
On the basis of these empirical findings we can make various broader, analytical contributions.
First, our paper demonstrates the importance of taking into account multiple dimensions of socio-
economic status in assessing divided housing access. Income and employment position remain
crucial, but socio-economic inequalities also depend on multiple interacting factors. Increasing
labour market precarity makes it more important to differentiate between temporary and
permanent contracts. Deepening generational divides amplify the importance of parental
resources. While we looked specifically at new buyers, such divisions among homeowners only
supplement further divides between homeowners and renters entirely excluded from property
wealth accumulation. These dynamics are often reinforced over time, as homeowners who
accumulate substantial assets are again more able to move into high-gain areas. Our findings thus
point to the existence of multiple, often overlapping and mutually-reinforcing, socio-economic
cleavages between housing insiders and outsiders.
Second, our spatial analyses speak to broader literatures on uneven development and growing
spatial divides. We find clear and consistent increases in spatial inequalities in terms of house
values, with capital gains increasingly concentrating in (certain) major cities. Uneven house-value
developments likely reflect but also reinforce broader spatial inequalities, for example with regard
to social segregation and regional divergences in economic performance. Current trends of spatial
polarization do not come out of nowhere, but are linked to decades of welfare-state restructuring
(Brenner 2004; Brenner et al. 2010), as well as the liberalization and financialization of housing
(Aalbers 2016).

CUS Working Paper Series – WPS-No. 32 Centre for Urban Studies, University of Amsterdam
20
Finally, our paper promotes a spatial understanding of wealth accumulation – one that may also
be relevant to interpret other societal inequalities. It is not just a question of owner occupiers
versus renters, as our findings point to notable segmentation between buyers. Buying in the right
place may enable some low-status households to make windfall gains, but polarization suggests
benefits mostly concentrated among already-privileged households, and increasingly so. Wealth
inequalities are not only mapped onto space, but space itself figures prominently in reproducing
and amplifying such inequalities. In other words, it matters where you buy: shaping both individual
life-courses as well as societal inequalities. This only becomes more critical as spatial inequalities
intensify.

CUS Working Paper Series – WPS-No. 32 Centre for Urban Studies, University of Amsterdam
21
References Aalbers, M.B. (2007). Geographies of housing finance: The mortgage market in Milan, Italy.
Growth and Change, 38(2), 174-199.
Aalbers, M.B. (2008). The Financialisation of Home and the Mortgage Market Crisis. Competition
& Change, 12(2), 148–166.
Aalbers, M.B. (2016). The Financialisation of Housing: A Political Economy Approach. New York:
Routledge.
Aalbers, M.B., & Christophers, B. (2014). Centring Housing in Political Economy. Housing, Theory
and Society, 31(4), 373–394.
Allegré, G., & Timbeau, X. (2015). Does housing wealth contribute to wealth inequality? A tale of two New
Yorks. Paris: Sciences Po.
Ansell, B. (2014). The political economy of ownership: Housing markets and the welfare state.
American Political Science Review, 108(2), 383-402.
Arundel, R., & Ronald, R. (2016). Parental co-residence, shared living and emerging adulthood in
Europe: semi-dependent housing across welfare regime and housing system contexts.
Journal of Youth Studies, 19(7), 885–905.
Arundel, R., & Ronald, R. (forthcoming). The false promise of homeownership. (HOUWEL
Working Paper Series). University of Amsterdam.
Arundel, R. (2017). Equity Inequity: Housing Wealth Inequality, Inter and Intra-generational
Divergences, and the Rise of Private Landlordism. Housing, Theory and Society, 34(2), 176–
200.
Arundel, R., & Doling, J. (2017). The end of mass homeownership? Changes in labour markets
and housing tenure opportunities across Europe. Journal of Housing and the Built
Environment, 1–24.
Beck, U. (1992). Risk society: Towards a new modernity (Vol. 17). London: Sage.
Bell, D.N.F., & Blanchflower, D. G. (2011). Young people and the Great Recession. Oxford
Review of Economic Policy, 27(2), 241–267.

CUS Working Paper Series – WPS-No. 32 Centre for Urban Studies, University of Amsterdam
22
Biegert, T. (2014). On the outside looking in? Transitions out of non-employment in the United
Kingdom and Germany. Journal of European Social Policy, 24(1), 3–18.
Bischoff, K., & Reardon, S.F. (2014). Residential segregation by income, 1970-2009. In: Diversity
and disparities: America enters a new century, Logan JR (ed) 208–33. New York, NY: Russell
Sage Foundation.
Boterman, W.R. (2012). Residential practices of middle classes in the field of parenthood. PhD thesis
University of Amsterdam.
Bourdieu, P. (2005). The social structures of the economy. Polity.
Brenner, N. (2004). New state spaces: Urban restructuring and state rescaling in Western Europe. Oxford:
Oxford University Press.
Brenner, N., Peck, J., & Theodore, N. (2010). Variegated neoliberalization: geographies,
modalities, pathways. Global networks, 10(2), 182-222.
Brown, P., Lauder, H., & Ashton, D. (2011). Digital Taylorism. In P. Brown, H. Lauder, & D.
Ashton (Eds.), The global auction: The broken promises of education, jobs and incomes. Oxford:
Oxford University Press.
Buchmann, M.C., & Kriesi, I. (2011). Transition to Adulthood in Europe. Annual Review of
Sociology, 37(1), 481–503.
Clapham, D., Mackie, P., Orford, S., Thomas, I., & Buckley, K. (2014). The Housing Pathways
of Young People in the UK. Environment and Planning A, 46(8), 2016–2031.
Clark, W. & Dieleman, F.M. (1996). Households and Housing: Choice and Out- comes in the Housing
Market. New Brunswick, NJ: Rutgers University.
Coulter, R. (2017). Local house prices, parental background and young adults’ homeownership in
England and Wales. Urban Studies, 54(14), 3360-3379.
Davidsson, J., & Naczyk, M. (2009). The Ins and Outs of Dualisation: A Literature Review (SSRN
Scholarly Paper No. ID 1489906). Rochester, NY: Social Science Research Network.
Desmond, M. (2016). Evicted: Poverty and Profit in the American City, New York: Broadway.
Doling, J., & Ronald, R. (2010). Home ownership and asset-based welfare. Journal of Housing and
the Built Environment, 25(2), 165–173.

CUS Working Paper Series – WPS-No. 32 Centre for Urban Studies, University of Amsterdam
23
Dorling, D. (2014). All That Is Solid: How the Great Housing Disaster Defines Our Times, and What We
Can Do About It. London: Penguin UK.
Druta, O., & Ronald, R. (2017). Young adults’ pathways into homeownership and the
negotiation of intra-family support: A home, the ideal gift. Sociology, 51(4), 783-799.
Emmeneger, P. (2012). The age of dualization: The changing face of inequality in deindustrializing societies.
Oxford: Oxford University Press.
Etherington, D., & Jones, M. (2009). City-regions: new geographies of uneven development and
inequality. Regional Studies, 43(2), 247-265.
Fernandez, R., & Aalbers, M. (2016). Financialization and Housing: Between Globalization and
Varieties of Capitalism. Competition & Change, 20(2).
Fernandez, R., Hofman, A., & Aalbers, M. B. (2016). London and New York as a safe deposit
box for the transnational wealth elite. Environment and Planning A,
Forrest, R., & Hirayama, Y. (2015). The financialisation of the social project: Embedded
liberalism, neoliberalism and home ownership. Urban Studies, 52(2), 233–244.
Friedman, S., Laurison, D., & Miles, A. (2015). Breaking the ‘class’ ceiling? Social mobility into
Britain's elite occupations. The Sociological Review, 63(2), 259-289.
Gastner, M. T., & Newman, M. E. J. (2004). Diffusion-based method for producing density-
equalizing maps. Proceedings of the National Academy of Sciences of the United States of America,
101(20), 7499–7504.
Giddens, A. (1999). Risk and Responsibility. The Modern Law Review, 62(1), 1–10.
Green, D. G., & Bentley, D. (2014). Finding Shelter: Overseas Investment in the UK Housing Market.
London: Civitas.
Hamnett, C. (1999). Winners and Losers: Home Ownership in Modern Britain. London: UCL.
Hamnett, C. (1992). The geography of housing wealth and inheritance in Britain. Geographical
Journal, 158(3), 307-321.
Harvey, D. (1989). From managerialism to entrepreneurialism. Geografiska Annaler B, 71, 3–18.

CUS Working Paper Series – WPS-No. 32 Centre for Urban Studies, University of Amsterdam
24
Häusermann, S., & Schwander, H. (2012). Varieties of dualization? Labor market segmentation
and insider outsider divides across regimes. In P. Emmeneger (Ed.), The age of dualization:
The changing face of inequality in deindustrializing societies (pp. 27–51). Oxford: OUP.
Helderman, A., & Mulder, C. (2007). Intergenerational Transmission of Homeownership: The
Roles of Gifts and Continuities in Housing Market Characteristics. Urban Studies, 44(2),
231–247.
Hills, J., Cunliffe, J., Gambaro, L., & Obolenskaya, P. (2013). Winners and losers in the crisis: the
changing anatomy of economic inequality in the UK 2007-2010 (Social Policy in a Cold Climate,
Research Report 2). London: Centre for Analysis of Social Exclusion, LSE.
Hochstenbach, C. (2017). Inequality in the gentrifying European city. PhD thesis University of
Amsterdam.
Hochstenbach, C. (2018). Spatializing the intergenerational transmission of inequalities: Parental
wealth, residential segregation, and urban inequality. Environment and Planning A: Economy
and Space, 50(3), 689-708.
Hochstenbach, C., & Boterman, W.R. (2015). Navigating the field of housing: Housing pathways
of young people in Amsterdam. Journal of Housing and the Built Environment, 30(2), 257-274.
Hochstenbach, C., & Boterman, W.R. (2017). Intergenerational support shaping residential
trajectories: Young people leaving home in a gentrifying city. Urban Studies, 54(2), 399-
420.
Lennartz, C., Arundel, R., & Ronald, R. (2016). Younger Adults and Homeownership in Europe
Through the Global Financial Crisis. Population, Space and Place, 22(8), 823–835.
Ley, D. (1996). The New Middle Class and the Remaking of the Central City. Oxford: Oxford
University Press.
Martinez-Fernandez, C., Audirac, I., Fol, S., & Cunningham-Sabot, E. (2012). Shrinking cities:
Urban challenges of globalization. International Journal of Urban and Regional Research, 36(2),
213-225.
McKee, K. (2012). Young People, Homeownership and Future Welfare. Housing Studies, 27(6),
853–862

CUS Working Paper Series – WPS-No. 32 Centre for Urban Studies, University of Amsterdam
25
Milanovic, B. (2016). Global inequality: A new approach for the age of globalization. Harvard University
Press.
Musterd, S. (2014). Public housing for whom? Experiences in an era of mature neo-liberalism:
The Netherlands and Amsterdam. Housing Studies, 29(4), 467-484.
Newman, S.J., & Holupka, C.S. (2016). Is timing everything? Race, homeownership and net
worth in the tumultuous 2000s. Real Estate Economics, 44(2), 307-354.
Newman, K., & Wyly, E.K. (2006). The right to stay put, revisited: gentrification and resistance
to displacement in New York City. Urban Studies, 43(1), 23-57.
Nolan, B., Salverda, W., Checchi, D., Marx, I., McKnight, A., & Tóth, I.G. (2014). Changing
Inequalities and Societal Impacts in Rich Countries: Thirty Countries’ Experiences.Oxford: OUP.
Organisation for Economic Cooperation and Development (OECD). (2016). Divided we stand:
Why inequality keeps rising (OECD Publications). Retrieved from
http://dx.doi.org/10.1787/9789264119536-en
Organisation for Economic Cooperation and Development (OECD). (2011). Employment
Database (OECD Publications). Retrieved from
http://www.oecd.org/employment/labour-stats
Oesch, D. (2006). Coming to Grips with a Changing Class Structure: An Analysis of
Employment Stratification in Britain, Germany, Sweden and Switzerland. International
Sociology, 21(2), 263–288.
Öst, C. E. (2012). Parental wealth and first-time homeownership: A cohort study of family
background and young adults’ housing situation in Sweden. Urban Studies, 49(10), 2137-
2152.
Piketty, T. (2014). Capital in the 21st Century. Cambridge: Harvard University Press.
Reuten, G. (2018). De Nederlandse vermogensverdeling in internationaal perspectief. Een
vergelijking met 26 andere OECD-landen. TPEdigitaal, 12(2), 1-8.
Rijskoverheid (2018). Hoe bepalen gemeenten de WOZ-waarde? Retrieved from
https://www.rijksoverheid.nl/onderwerpen/waardering-onroerende-zaken-woz/vraag-
en-antwoord/woz-waarde-bepalen

CUS Working Paper Series – WPS-No. 32 Centre for Urban Studies, University of Amsterdam
26
Rose, D. (1984). Rethinking gentrification: beyond the uneven development of Marxist urban
theory. Environment and planning D: Society and Space, 2(1), 47-74.
Rowlands, R., & Gurney, C. M. (2000). Young peoples? Perceptions of housing tenure: a case
study in the socialization of tenure prejudice. Housing, theory and society, 17(3), 121-130.
Rowlingson, K., & McKay, S. (2012). Wealth and the Wealthy: Exploring and Tackling Inequalities
Between Rich and Poor. Bristol: Policy Press.
Saez, E., & Zucman, G. (2016). Wealth inequality in the United States since 1913: Evidence from
capitalized income tax data. The Quarterly Journal of Economics, 131(2), 519-578.
Sampson, R.J., & Sharkey, P. (2008). Neighborhood selection and the social reproduction of
concentrated racial inequality. Demography, 45(1), 1-29.
Sampson, R. J. (2012). Great American city: Chicago and the Enduring Neighborhood Effect. Chicago:
University of Chicago Press.
Sassen, S. (1991). The Global City: New York, London, Tokyo. Princeton: Princeton University Press.
Sassen, S. (2014). Expulsions. Brutality and Complexity in the Global Economy. Cambridge/ London:
The Belknap Press of Harvard University Press.
Schwartz, H., & Seabrooke, L. (2008). Varieties of Residential Capitalism in the International
Political Economy: Old Welfare States and the New Politics of Housing - Springer.
Comparative European Politics, 6, 237–261.
Smith, N. (1979). Toward a theory of gentrification a back to the city movement by capital, not
people. Journal of the American Planning Association, 45(4), 538-548.
Smith, N. (1984). Uneven Development: Nature, Capital, and the Production of Space. Athens, Georgia:
University of Georgia Press.
Spilerman, S., & Wolff, F. C. (2012). Parental wealth and resource transfers: How they matter in
France for home ownership and living standards. Social Science Research, 41(2), 207-223.
Standing, G. (2011). The Precariat: The New Dangerous Class. London: Bloomsbury.
Stiglitz, J. (2012). The Price of Inequality. London: Penguin.

CUS Working Paper Series – WPS-No. 32 Centre for Urban Studies, University of Amsterdam
27
Stockhammer, E. (2013). Why have wage shares fallen? An analysis of the determinants of
functional income distribution. In Wage-led growth (pp. 40-70). Palgrave Macmillan,
London.
Stone, J., Berrington, A., & Falkingham, J. (2014). Gender, Turning Points, and Boomerangs:
Returning Home in Young Adulthood in Great Britain. Demography, 51(1), 257–276.
Tammaru, T, Marcińczak, S, Van Ham, M. (eds) (2016) Socio-economic Segregation in European Capital
Cities: East Meets West. New York/London: Routledge.
Terhorst, P., & Van de Ven, J. (1995). The national urban growth coalition in The
Netherlands. Political Geography, 14(4), 343-361.
Van Bavel, B. & Salverda, W. (2014). Vermogensongelijkheid in Nederland. Economisch Statistische
Berichten 99(4688): 392–395.
Van Ham, M., Hedman, L., Manley, D., Coulter, R., & Östh, J. (2014). Intergenerational
transmission of neighbourhood poverty: an analysis of neighbourhood histories of
individuals. Transactions of the Institute of British Geographers, 39(3), 402-417.
Wind, B., & Hedman, L. (2017). The uneven distribution of capital gains in times of socio-spatial
inequality: Evidence from Swedish housing pathways between 1995 and 2010. Urban
Studies, Online First. DOI:0042098017730520.
Wood, J.D.G. (2017). The effects of the distribution of mortgage credit on the wage share:
Varieties of residential capitalism compared. Comparative European Politics, 15(6), 819-847.
Wyly, E. K., & Hammel, D. J. (1999). Islands of decay in seas of renewal: Housing policy and the
resurgence of gentrification. Housing Policy Debate, 10(4), 711-771

CUS Working Paper Series – WPS-No. 32 Centre for Urban Studies, University of Amsterdam
28
Appendix 1 Change in property values per neighbourhood across the Netherlands over 2 year intervals.
1a) 2006-2008
Data source: SSD, Statistics Netherlands, own calculations. Values adjusted for inflation using the Consumer Price Index.Cartogram distortion based on Gastner-Newman diffusion.$ 0 40 KM
> 40%30% to 40%20% to 30%10% to 20%2% to 10%-2% to 2%-10% to -2%-20% to -10%-30% to -20%- 40% to -30%< -40%
Excluded (<10 dwellings)
Eight largest municipalities
Cartogram proportional to number of dwellings

CUS Working Paper Series – WPS-No. 32 Centre for Urban Studies, University of Amsterdam
29
Change in property values per neighbourhood across the Netherlands over 2 year intervals.
1b) 2008-2010
Data source: SSD, Statistics Netherlands, own calculations. Values adjusted for inflation using the Consumer Price Index.Cartogram distortion based on Gastner-Newman diffusion.$ 0 40 KM
> 40%30% to 40%20% to 30%10% to 20%2% to 10%-2% to 2%-10% to -2%-20% to -10%-30% to -20%- 40% to -30%< -40%
Excluded (<10 dwellings)
Eight largest municipalities
Cartogram proportional to number of dwellings

CUS Working Paper Series – WPS-No. 32 Centre for Urban Studies, University of Amsterdam
30
Change in property values per neighbourhood across the Netherlands over 2 year intervals.
1c) 2010-2012
Data source: SSD, Statistics Netherlands, own calculations. Values adjusted for inflation using the Consumer Price Index.Cartogram distortion based on Gastner-Newman diffusion.$ 0 40 KM
> 40%30% to 40%20% to 30%10% to 20%2% to 10%-2% to 2%-10% to -2%-20% to -10%-30% to -20%- 40% to -30%< -40%
Excluded (<10 dwellings)
Eight largest municipalities
Cartogram proportional to number of dwellings

CUS Working Paper Series – WPS-No. 32 Centre for Urban Studies, University of Amsterdam
31
Change in property values per neighbourhood across the Netherlands over 2 year intervals.
1d) 2012-2014
Data source: SSD, Statistics Netherlands, own calculations. Values adjusted for inflation using the Consumer Price Index.Cartogram distortion based on Gastner-Newman diffusion.$ 0 40 KM
> 40%30% to 40%20% to 30%10% to 20%2% to 10%-2% to 2%-10% to -2%-20% to -10%-30% to -20%- 40% to -30%< -40%
Excluded (<10 dwellings)
Eight largest municipalities
Cartogram proportional to number of dwellings
CUS Working Paper Series – WPS-No. 32 Centre for Urban Studies, University of Amsterdam
32
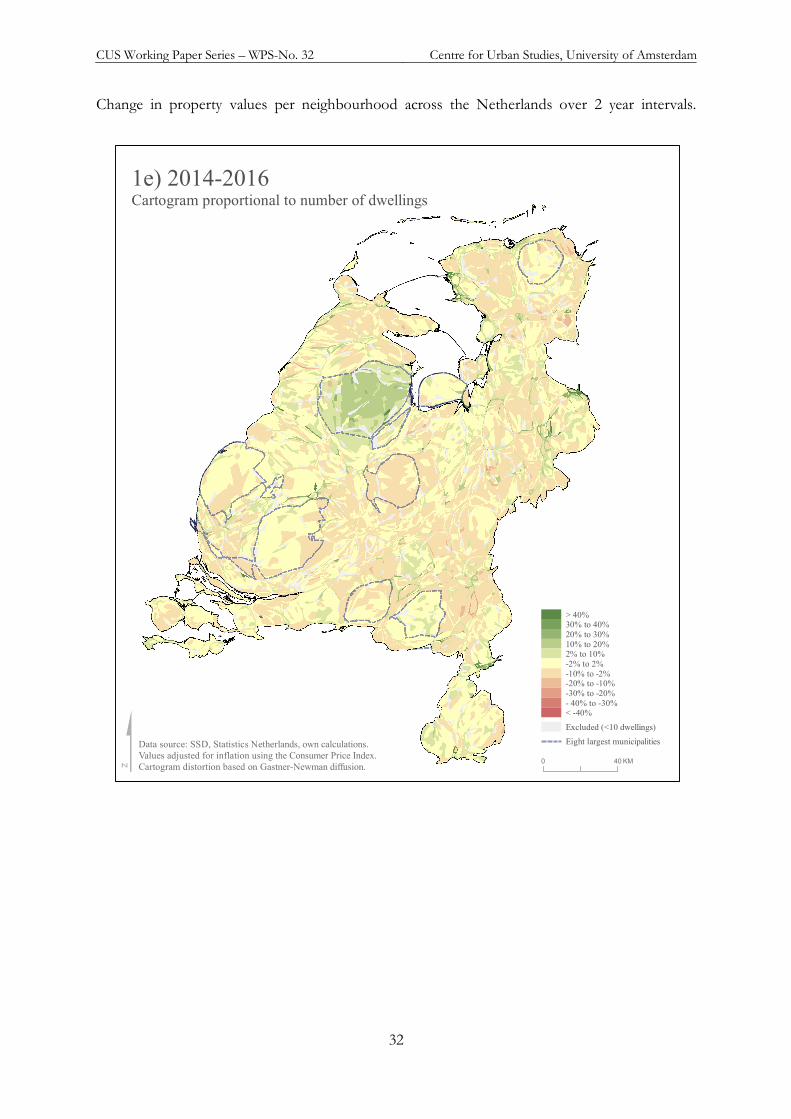
Change in property values per neighbourhood across the Netherlands over 2 year intervals.
1e) 2014-2016
Data source: SSD, Statistics Netherlands, own calculations. Values adjusted for inflation using the Consumer Price Index.Cartogram distortion based on Gastner-Newman diffusion.$ 0 40 KM
> 40%30% to 40%20% to 30%10% to 20%2% to 10%-2% to 2%-10% to -2%-20% to -10%-30% to -20%- 40% to -30%< -40%
Excluded (<10 dwellings)
Eight largest municipalities
Cartogram proportional to number of dwellings
Copyright © 2022 FDOKUMEN