The Social Situation in the European Union
224
The Social Situation in the European Union 2007 European Commission ISSN 1681-1658
-
Upload
khangminh22 -
Category
Documents
-
view
0 -
download
0
Transcript of The Social Situation in the European Union
The Social Situationin the European Union
2007
European Commission
ISSN 1681-1658

1
The Social Situation in the European Union 2007
Social Cohesion through Equal Opportunities
European Commission
Directorate-General for Employment, Social Affairs and Equal Opportunities – Unit E.1
Eurostat – Unit F.3
Manuscript completed in April 2008
2
Part 1 of this report is based on the work of the European Observatory on the Social Situation and Demography and notably its network on Social Inclusion and Income Distribution, coordinated by Applica sprl. The work of the Observatory can be found on:
http://ec.europa.eu/employment_social/spsi/reports_and_papers_en.htm
Neither the European Commission nor any person acting on behalf of the Commission may be held responsible for the use that may be made of the information contained in this publication.
A great deal of additional information on the European Union is available on the Internet. It can be accessed through the Europa server:
http://europa.eu
Europe Direct is a service to help you find answers
to your questions about the European Union
Freephone number (*): 00 800 6 7 8 9 10 11
(*) Certain mobile telephone operators do not allow access to 00 800 numbers or
these calls may be billed.
© European Communities, 2008 Reproduction is authorised provided the source is acknowledged. Cataloguing data can be found at the end of this publication. Luxembourg: Office for Official Publications of the European Communities, 2008 ISBN 978-92-79-08932-9 DOI 10.2767/8058 Printed in Belgium PRINTED ON WHITE CHLORINE-FREE PAPER
3
FOREWORD
The Social Situation Report – published annually since 2000 – aims to foster informed public debate on social policy by providing key data and prospective analysis. It is divided into two parts, the first being devoted to a special topic which is explored in depth, and the second consisting of statistical portraits covering the full range of social policy issues and a data annex. Together with other reports (in particular on employment, social protection and social inclusion, gender equality, industrial relations and demography), it meets the Commission's obligation, enshrined in the Article 143 of the Treaty, to report on a wide range of social policy areas.
2007 was European Year of Equal Opportunities and this Report focuses on certain related issues. In particular, it presents new data on the link between parents' education and occupation background and their children’s success. The – albeit highly preliminary – analysis contained in the first part of this Report strongly emphasises the case for promoting equal opportunities in the European Union. This could make a major contribution to greater social cohesion and economic performance by mobilising the untapped potential of disadvantaged groups. The scope for improvement can be gauged by the significant degree to which educational outcomes are still determined by parents’ level of education. Moreover, the Report shows that many children from a migration background are growing up in households with incomes below the poverty threshold.
This 2007 Social Situation Report also examines the issue of access to essential goods and services, notably for households at risk of poverty, i.e. those households that have incomes significantly below the national median income.
This information on poverty and social exclusion from a national perspective is complemented by an EU wide perspective using a common low-income threshold for all EU Member States. While social inclusion needs to be tackled primarily at national level, effective European cohesion policies have a key role to play in reducing the number of people who have to live on incomes far below the EU median. Monitoring the number of people on low incomes relative to a common EU-wide threshold will therefore allow to gauge the extent to which the EU is bringing real benefits to citizens across a Union still characterised by wide disparities.
The evidence presented in the 2007 Social Situation Report underlines the importance of pursuing the Lisbon Strategy, combined with determined efforts to strengthen opportunities, access and solidarity for all Europeans – the central concern of the Commission's Renewed Social Agenda for 21st century Europe.
Vladimír Špidla
Commissioner for Employment, Social Affairs and Equal Opportunities
Joaquín Almunia
Commissioner for Economic and Monetary Affairs

4
5
TABLE OF CONTENTS
Foreword........................................................................................................................................................... 3
PART 1 — SOCIAL COHESION THROUGH EQUAL OPPORTUNITIES..................................7
ENGLISH INTRODUCTION AND SUMMARY ................................................................................7
1. Assessing the Case for Equal Opportunities across the EU: An Overview........................................ 7
1.1. EU-SILC: The new tool for monitoring the social situation in the EU.................................................. 7 1.2. Income inequality and economic performance ................................................................................... 7 1.3. Low incomes — a European perspective........................................................................................... 8 1.4. Who are the poor: groups most at risk in the Member States ............................................................ 9 1.5. Low incomes and living standards in the EU.................................................................................... 10 1.6. Intergenerational transmission of disadvantages ............................................................................. 11 1.7. Children from a migration background and equal opportunities ....................................................... 12 1.8. Equal opportunities: the key to economic growth and social cohesion............................................. 12
DEUTSCHE EINFÜHRUNG UND ZUSAMMENFASSUNG .............................................................13
1. Die Bedeutung der Chancengleichheit in der EU: ein Überblick ....................................................... 13
1.1. EU-SILC: Das neue Instrument zur Beobachtung der sozialen Lage in der EU............................... 13 1.2. Einkommensungleichheit und Wirtschaftsleistung ........................................................................... 14 1.3. Niedrige Einkommen – eine europäische Perspektive ..................................................................... 15 1.4. Wer sind die Armen: die am stärksten gefährdeten Gruppen in den Mitgliedstaaten....................... 16 1.5. Niedrige Einkommen und Lebensstandards in der EU..................................................................... 17 1.6. Übertragung von Benachteiligungen zwischen Generationen.......................................................... 18 1.7. Kinder mit Migrationshintergrund und Chancengleichheit ................................................................ 19 1.8. Chancengleichheit: der Schlüssel zu Wirtschaftswachstum und sozialem Zusammenhalt .............. 20
INTRODUCTION ET RÉSUMÉ FRANÇAIS..................................................................................21
1. Évaluation du rôle de l’égalité des chances dans l’UE: vue d’ensemble.......................................... 21
1.1. EU-SILC: nouvel outil pour le suivi de la situation sociale dans l’UE ............................................... 21 1.2. Inégalités de revenus et performances économiques ...................................................................... 22 1.3. Faibles revenus – une perspective européenne............................................................................... 23 1.4. Qui sont les pauvres: les groupes les plus à risque dans les États membres.................................. 24 1.5. Faibles revenus et niveaux de vie dans l’UE.................................................................................... 25 1.6. Transmission intergénérationnelle des handicaps sociaux .............................................................. 26 1.7. Enfants issus de l’immigration et égalité des chances ..................................................................... 27 1.8. Égalité des chances: la clé de la croissance économique et de la cohésion sociale ....................... 27
MAIN REPORT .....................................................................................................................29
2. Income Distribution and Poverty Risks in the EU ............................................................................... 29
2.1. EU-SILC: The new tool for monitoring the social situation in the EU................................................ 29 2.2. Income inequality and economic performance ................................................................................. 32 2.3. Low incomes — a European perspective......................................................................................... 39 2.4. Who are the poor: groups most at risk in the Member States .......................................................... 46 2.5. Low incomes and living standards in the EU.................................................................................... 59
3. The Scope for More Equal Opportunities............................................................................................. 71
3.1. Intergenerational transmission of disadvantages ............................................................................. 71 3.2. Children from a migration background and equal opportunities ....................................................... 82
6
PART 2 — AREAS OF SOCIAL POLICY CONCERN: STATISTICAL PORTRAITS ...............103 1. Economic Situation ............................................................................................................................. 105
2. Demography, Households and Families............................................................................................ 110
3. Ageing of the Population .................................................................................................................... 112
4. International Migration and Asylum................................................................................................... 114
5. Education and its Outcomes .............................................................................................................. 117
6. Lifelong Learning ................................................................................................................................ 120
7. Employment ......................................................................................................................................... 125
8. Unemployment..................................................................................................................................... 129
9. Labour Market Policy Expenditure..................................................................................................... 132
10. Social Protection Expenditure and Receipts .................................................................................... 135
11. Social Benefits..................................................................................................................................... 139
12. Income Distribution............................................................................................................................. 143
13. Low-income Households .................................................................................................................... 146
14. Jobless Households and Low Wages................................................................................................ 151
15. Women and Men in Decision Making................................................................................................. 154
16. Earnings of Women and Men ............................................................................................................. 157
17. Life and Health Expectancies ............................................................................................................. 162
18. Accidents and Work-related Health Problems .................................................................................. 167
ANNEXES TO PART 2 .............................................................................................171 Annex 1.1 Key Indicators per Geopolitical Entity — Latest Year Available .......................................... 173
Annex 1.2 Key Indicators per Geopolitical Entity — Time Series .......................................................... 177
Annex 1.3 Other Statistical Tables per Geopolitical Entity ...................................................................... 197
Annex 2 Symbols, Country Codes and Country Groupings, other Abbreviations and Acronyms....... 215
7
PART 1 — SOCIAL COHESION THROUGH EQUAL OPPORTUNITIES
ENGLISH INTRODUCTION AND SUMMARY
1. ASSESSING THE CASE FOR EQUAL OPPORTUNITIES ACROSS THE EU: AN OVERVIEW
The 2007 Social Situation Report presents some key findings from the EU’s new tool for monitoring the social situation and, in the future, social trends, namely the EU-SILC (Statistics on Income and Living Conditions). It looks at income inequality and how this is related to economic performance and at how people on low incomes are distributed across the EU as a whole. Promoting equal opportunities in the European Union could make a major contribution to both greater social cohesion and economic performance by mobilising the unused potential of disadvantaged groups. Two sections in this report look notably at the transmission of social disadvantages from one generation to the next and at poverty risks among children from a migration background and ethnic minorities.
The report also tries to identify the largest groups at risk of poverty in the different Member States and the extent to which low incomes are linked to access to various essential goods and services. In view of the theme of the 2007 European Year, the Social Situation Report also has a special focus on equal opportunities. It only scratches the surface of the wealth of data produced by EU-SILC, and the Commission invites the research community to make extensive use of this data source.
The evidence presented in the Social Situation Report underlines once again the importance of investing in people, most recently stressed by the Commission in its contribution to the October Meeting of Heads of State and of Government on the theme Succeeding in the age of globalisation1. How the challenges of equal opportunities are to be tackled is also a major aspect of the public consultation on the ‘social reality’ of Europe2.
1.1. EU-SILC: The new tool for monitoring the social situation in the EU The European Union has a powerful new tool for monitoring the social situation and trends across all Member States and thus for supporting the development of better social policies through the Open Method of Coordination.
Internationally comparable data for monitoring the economic situation and trends have been collected for about half a century. By contrast, equivalent tools for monitoring social conditions are still in their infancy. Over the past decade, the European Union has made major progress in producing internationally comparable data for social monitoring. The European Community Household Panel survey (ECHP) was first carried out in 1994 and produced annual data on social conditions for a decade. It has now been replaced by a new instrument, EU-SILC (Statistics on Income and Living Conditions), with this year data for almost all Member States.
With EU-SILC the European Union has a much improved tool for monitoring the social situation and trends. It uses larger samples, allowing more detailed analysis of the characteristics of the most vulnerable households. The time lag between collection of data and publication — three years or more in the case of the ECHP — has been reduced by about one year; nevertheless the most recent data used for this report were collected in 2005 and refer to incomes in 20043. So the availability of social data will continue to lag considerably behind key economic indicators.
Without internationally comparable data on the social situation as produced by the ECHP and EU-SILC, key policy developments in the European Union would not have been possible. A major breakthrough in this regard has been the establishment of an Open Method of Coordination, in which Member States agreed on common objectives and indicators for monitoring progress towards these objectives in the field of social protection and social inclusion. Most of these indicators rely on the existence of internationally harmonised surveys on incomes and living conditions such as the ECHP and EU-SILC4.
1.2. Income inequality and economic performance Incomes are more evenly distributed within the EU than in the US, and in the EU a high level of economic performance often goes hand in hand with greater equality.
1 COM(2007) 581 final. 2 See http://ec.europa.eu/citizens_agenda/social_reality_stocktaking/index_en.htm. 3 The United Kingdom has income reference period 2005 and Ireland a moving income reference period 2004-05.
Household composition etc. reflect the survey period. Note also that the EU-SILC data used in the statistical portraits and their annexes was extracted later than those used for various figures and tables in this first part of the report. Therefore, there might be some inconsistencies between these two parts.
4 See http://ec.europa.eu/employment_social/social_inclusion/indicators_en.htm for the latest list of indicators.
THE SOCIAL SITUATION IN THE EUROPEAN UNION 2007
8
According to data published by the OECD (see section 2.1 of the Social Situation Report) income is much more equally distributed in most Member States than in the US. The most commonly used indicator for inequality is the Gini coefficient5, which varies between 0 (if everyone gets an equal share of total income) and 100 (if all income goes to one individual only). In 2000, the Gini coefficient in the US stood at 35.7. Using EU-SILC and taking the population of EU-25 as a whole, and adjusting for purchasing power differences across Member States, the Gini coefficient for EU-25 can be estimated at around 35.0. This is still significantly less than in the US, despite the large differences in GDP per head across Member States. The results from EU-SILC also show that only Portugal surpasses the US level (38.0), while Poland, Latvia and Lithuania have similar levels of inequality as the US.
The international comparison of Gini coefficients also suggests that there might not be a trade-off between equity and economic performance, as measured by GDP per capita, after all. Indeed, plotting the Gini coefficients of EU and applicant countries against their GDP per capita shows that the more developed countries also tend to be more egalitarian. While this does not imply that reducing inequalities raises economic performance, it does suggest that low inequality is also consistent with high GDP per capita.
Taxing the rich to redistribute income to the poor could, according to economic theory, reduce aggregate economic performance due to deadweight losses associated with taxation and incentive effects of income-related transfer payments. Economist Arthur Okun used the metaphor of a leaky bucket. However, a relatively equal distribution of incomes need not be the result of large-scale redistribution alone. It may be the result of a more narrow distribution of market incomes resulting from more equal opportunities for people to develop their full productive potential and contribute to the generation of income. This requires good chances for all to access high-quality education, health care and jobs.
Greater equality resulting from more equal opportunities does not entail the efficiency losses potentially associated with redistribution. On the contrary, promoting equal opportunities makes it possible to boost growth by mobilising resources that were previously blocked by discrimination and social exclusion. The Social Situation Report’s analysis of social mobility suggests that a sizeable proportion of the European population does not develop its full potential. This slows down Europe’s economic development and implies that too many people have to live in poor conditions.
The Report also discusses inequality trends since the 1970s. There is no common trend across all countries under review; in each of the sub-periods considered, there were countries with rising inequality and others with declining inequality. However, from the mid-1980s to the mid-1990s a clear majority of countries experienced rising inequality, a trend which now seems to have subsided somewhat. A recently completed study on the social impact of globalisation in the European Union6 concluded that there is no (or only weak) evidence that this rise in income inequalities is attributable to globalisation and suggested that it is more likely to be intimately associated with the emergence of the knowledge society resulting in an increase in the return on human capital and a widening gap between those with a high and a merely basic endowment of knowledge and skills.
1.3. Low incomes — a European perspective In 2004, around 100 million Europeans (22 % of the total population) had less than 60 % of the EU median income of around €8000 per year for a single person or €22 a day (amounts adjusted for purchasing power and household size; purchasing power standard PPS7 used below). Some 23.5 million had to get by on less than €10 a day. The concentration of people with low incomes relative to the EU median is highest in the poorer new Member States, but a large proportion of the low income population can be found in the richer EU-15 countries.
The Open Method of Coordination mainly uses a relative concept of poverty adopted by the European Council in 1975 which defined the poor as 'individuals and families whose resources are so small as to exclude them from the minimal acceptable way of life in the Member State in which they live'. This relative concept acknowledges that it is not enough to ensure access for all to a minimum subsistence level. The aim is also to ensure that all citizens can benefit from the general level of prosperity of their country and participate as full members of society. The main indicator used to reflect this concept is the at-risk-of-poverty rate, defined as the percentage of individuals whose equivalised disposable income is below 60 % of the national median income. The at-risk-of-poverty rate is published and analysed jointly with the at-risk-of-poverty thresholds in each Member State, which range, in purchasing power standards, from around 1500-2000 PPS (Romania, Bulgaria) to around 10000 PPS (UK, Germany, Denmark, Netherlands) per year.
The Social Situation Report complements this nationally centred perspective with a European perspective (section 2.3). One of the European Union’s main tasks is to raise the standard of living and quality of life of all
5 The Gini coefficient is defined as the relationship of cumulative shares of the population arranged according to the level
of income, to the cumulative share of the equivalised total net income received by them. 6 See http://ec.europa.eu/employment_social/social_situation/docs/simglobe_fin_rep.pdf 7 One PPS buys the same given volume of goods and services in all countries, whereas different amounts of national
currency units are needed to buy this same volume of goods and services in individual countries, depending on the price level. PPS are obtained by dividing their original value in national currency units by the respective purchasing power parity (PPP), see definition in section 2.3 and table 4.
PART 1 | SOCIAL COHESION THROUGH EQUAL OPPORTUNITIES
9
Europeans and to promote economic and social cohesion and solidarity among Member States. Progress towards these objectives is mainly assessed by looking at GDP per head. EU-SILC makes it possible to assess the challenge of social cohesion by looking also at the number of Europeans whose incomes fall short of the European average in purchasing power terms or a given absolute amount. Monitoring these numbers over time would make it possible to assess whether all Europeans are benefiting from the economic progress brought by European integration and helped by the European Union’s structural funds as well as appropriate national social policies. It would accordingly complement the monitoring of the process of economic convergence as measured by GDP per head relative to the EU average, but also the monitoring of social inclusion within a given Member State which focuses particularly on the number of people with incomes below a certain percentage of national median income8.
Various common thresholds, all expressed in PPS to adjust for differing price levels across the EU, were selected before estimating the absolute numbers and proportions of people with incomes below this threshold. This was possible only for 24 Member States (EU-27 excluding Malta, Bulgaria and Romania). 22 % of Europeans (just over 100 million) have an equivalised9 income below 60 % of the EU median income. 16 % (73.2 million) are below 50 % of the median income and 11 % (48.8 million) below 40 %. These levels of 60 %, 50 % and 40 % of the EU median income correspond to an annual disposable income of 8040 PPS, 6700 PPS and 5360 PPS respectively for a single person, or €22, €18 and just under €15 a day. The proportion of people whose income is below 60 % of their national median income — this is the at-risk-of-poverty rate as used in the Open Method of Coordination — is 16 %. EU-SILC can also be used to estimate what proportion of the European population have to get by on extremely low incomes of €10 a day: 5 % (23.5 million people), or even €5 a day: 2 % (6.9 million).
These figures are estimates and subject to various caveats (see section 2.1 of the Social Situation Report). People with low monetary incomes may be able to consume goods and services produced informally within the household or local community, which tends to be the case in economically less developed and more rural areas. Very low income may also be the result of trading losses reported by the self-employed. Monetary incomes thus provide only a very partial guide to living standards and the risk of social exclusion.
The highest concentrations of people below these various thresholds can obviously be observed in the poorest Member States. More than three quarters of the population in Estonia, Latvia, Lithuania, Hungary, Poland and Slovakia live on incomes below 60 % of the EU median; half or more of the population in these same countries (except Hungary where it is 40 %) have to get by on less than 40 % of the EU median income. The proportion of people who have to live on no more than €10 a day approaches 40 % in Latvia and Lithuania and exceeds one quarter in Estonia and Poland. In four Member States, more than five percent of the population have no more than €5 a day: Estonia (5 %), Latvia (9 %), Lithuania (10 %) and Poland (7 %).
While these extreme low-income situations are most prevalent in the least developed Member States, sizeable numbers of people with very low incomes are also to be found in the richer old Member States. 16 % of Europeans with an income below 60 % of the EU median live in Poland, 13 % in Germany, 11 % in Spain, 11 % in France, 12 % in Italy, but only 8 % in the UK. Looking at those with the lowest incomes (below €5 a day), we find that 44 % of them live in Poland, but almost 30 % of them live in seven old Member States: Italy (8 % of all Europeans with less than €5 a day), Spain (7 %), Portugal (4 %), Germany (4 %), UK (3 %), Greece (2 %) and France (2 %).
As the new Member States catch up in terms of economic performance, rising incomes, both in absolute terms and relative to the EU average, should result in a speedy reduction in the number of people with very low incomes. Such progress may, however, not be automatic if large population groups (e.g. pensioners or low-skilled workers) cannot benefit from better earnings opportunities and transfer incomes do not rise in line with earnings. A major preoccupation of the Open Method of Coordination is therefore whether economic growth translates into reduced social exclusion as measured against the national median income.
1.4. Who are the poor: groups most at risk in the Member States In a majority of Member States the largest segment of the population at risk of poverty consists of couples with one or two children where one of the partners is not working (at least throughout the year) — the ‘male breadwinner’ family type. Single parents, while being exposed to a high risk of poverty, represent a large share of the population at risk of poverty only in countries where this type of household is widespread. Policies to fight poverty and to promote social inclusion need to take into account which groups represent the largest share of the population at risk and which groups are most exposed to the risk of poverty so that the right mix of horizontal and targeted policies can be developed.
8 Data on these indicators are published by the Commission notably in the Joint Report on Social Protection and Social
Inclusion. http://ec.europa.eu/employment_social/spsi/joint_reports_en.htm 9 Household income is equivalised (adjusted) in order to reflect differences in household size and composition. In other
words, the total household income is divided by the number of household members weighted using the so-called 'modified OECD' equivalent scale. This equivalence scale gives a weight of 1.0 to the first adult, 0.5 to any other household member aged 14 and over and 0.3 to each child. The resulting figure is attributed to each member of the household, whether adult or child.
THE SOCIAL SITUATION IN THE EUROPEAN UNION 2007
10
The Social Situation Report (section 2.4) looks at the risk of poverty affecting different sections of the population and tries to identify the largest subgroups that make up the total population at risk of poverty in each Member State. For policy makers, it will be useful to look both at group-specific at-risk-of-poverty rates and at the total number of people at risk of poverty in various groups. The first gives an idea of weaknesses in poverty prevention policies; the second may be useful to determine where action needs to be taken to achieve the biggest reductions in at-risk-of-poverty rates.
The indicator which is used to measure the risk of poverty is the proportion of the population with equivalised disposable income below 60 % of the national median. This measure varies from 9 % in Sweden and 10 % in the Czech Republic to 21 % in Lithuania and Poland. The risk of poverty within Member States varies markedly between different sections of the population. At the same time, those with the highest risk also vary across countries.
Nevertheless, four groups stand out as having a high risk in nearly all countries. These are:
– people of working age, both employed and unemployed, living alone with a dependent child, who are, in the vast majority of cases, women;
– those living alone aged 65 and over who are no longer in paid employment and who again, in most cases, are women, many of whom may not have been working before reaching 65;
– those living alone of working age who are not in employment;
– families with children where only one of the parents is in employment.
These groups vary across countries not only in terms of the risk of poverty they face, but also in terms of their numbers and the share of total population they represent. In particular, lone parents are much more numerous in some countries than others. In countries where these groups represent a relatively small proportion of the population, they may also account for only a small proportion of the total population at risk of poverty, despite their having a high risk of poverty as such. Similarly, a section of the population with a much lower risk of poverty may, nevertheless, make up a relatively large share of the total at risk simply because there are a substantial number of them.
In 14 of the 24 Member States for which data were analysed, couples with one or two children where one of the partners is not working (at least throughout the year) made up the largest segment of the population at risk of poverty. All of the new Member States apart from Estonia and Cyprus are included in this group of 14. In another three countries they were the second largest group. In another two countries, Belgium and Ireland, couples with three or more children where one of the partners is not in work represent the largest group.
In other countries, people living alone represent the largest group among the population with income below the at-risk-of-poverty threshold. This is the case in Denmark, Finland, Sweden and Estonia, where those of working age living alone feature among the main subgroups of the population at risk of poverty, especially if they are not employed throughout the year. Lone parents also figure prominently among the main groups with income below the at-risk-of-poverty threshold in these four countries, as they do in Germany and the UK.
In addition, in Denmark, Estonia, Finland, Sweden, the UK and Cyprus, people of 65 and over feature among the main groups at risk of poverty, either as couples or as single women. This is also the case in Greece, Italy, Portugal and Slovenia.
This diversity across the EU emphasises the differences between Member States in how policy would need to be focused in order to achieve a large reduction in the number of people at risk of poverty.
1.5. Low incomes and living standards in the EU Low incomes result in reduced consumption possibilities and increased financial hardship, but not all households with incomes below the at-risk-of-poverty threshold have to forego essential goods and services or find it difficult to make ends meet. The high proportion of those reporting that they could not afford a decent meal every other day in the new Member States (above 15 % of the population in six Member States, which is more than three times higher than in EU-15) illustrates the major disparities which remain across the EU and underlines the need to complement poverty measures based on relative income with material deprivation indicators. However, in some EU-15 countries as well, the proportion of people with inadequate nutrition is also worrying, especially in the context of rising food prices. Particular attention must be paid to the longer term consequences of low incomes, notably with regard to life chances of children from deprived families and the increased risks of poor health and mortality affecting people with a lower socio-economic status.
Income is a means to an end: it is needed to obtain the goods and services needed to survive and, beyond that, to lead a life that allows people to feel part of their community. The Social Situation Report (section 2.5) examines how income is related to access to those necessities of life. EU-SILC covers such areas as housing, financial difficulties (e.g. with the payment of mortgages or rent or utility bills) and the ability to afford a range of goods and services.
Clearly, people below the at-risk-of-poverty threshold are significantly worse off than people above. Almost by definition, in all countries people below the threshold are more likely to find it difficult to make ends meet, but there are big differences across Member States. While in most of the EU-15 countries most of these people in
PART 1 | SOCIAL COHESION THROUGH EQUAL OPPORTUNITIES
11
low-income households do not report major difficulties with regard, for instance, to rent and mortgage payments and utility bills (possibly thanks to the availability of subsidised housing and energy) in the poorer new Member States, many people even above the at-risk-of-poverty threshold report that they cannot afford things which are taken for granted in the more prosperous Member States.
The EU-SILC data allow much more thorough analysis than is presented in the Social Situation Report. The fact that a low-income household reports no problem with poor housing or that it can afford a particular consumer good does not mean that it is not facing hardship in other areas. A more telling picture of material deprivation will have to be derived from an analysis of how many people face any one or more types of hardship measured by EU-SILC.
The time dimension of poverty risks also needs to be taken into consideration. Low-income situations may be transitory (e.g. for students, young people starting their professional life, or self-employed people facing temporary difficulties). EU-SILC includes a panel dimension which, after several survey waves, will allow an assessment of how persistent low-income situations are and how likely people are to leave such situations. There is also a longer time dimension, spanning generations: children growing up in households at risk of poverty may be more likely to live in such households themselves than are children of better-off families. This issue is examined in the report on the basis of a special EU-SILC module (see below).
Moreover, income and socio-economic status are strongly linked to health and life expectancy. There is evidence that people with a lower socio-economic status and lower incomes tend to die younger and suffer more health problems than people in higher socio-economic groups. This is linked to increased exposure to physical, psycho-social and behavioural risk factors during all phases of the life cycle. Currently, there are no comparable indicators available at EU level to monitor such health inequalities, but they do represent a major challenge with regard to public health and social exclusion. The development of indicators, notably life expectancy by socio-economic status, should therefore be a priority.
1.6. Intergenerational transmission of disadvantages Survey data show that the education and occupational background of one’s parents are major determinants of one’s own success, despite improved access to higher education for younger people. Such intergenerational transmission of disadvantages suggests that many young people are not able to develop their full potential and that Europe’s economy is being deprived of the kind of highly skilled employees who will be more and more in demand in the knowledge society and in the context of demographic ageing. There are important differences across Member States, suggesting that there is major potential for improvement in education systems and in skills acquisition.
The Social Situation Report presents a first analysis of results from a special module of the EU-SILC survey focusing on the intergenerational transmission of disadvantages (section 3.1). This module asked questions about the social status of the parents of respondents when the latter were aged 12 to 16 years. The report looks at correlations between educational achievements of parents and children as well as the main occupational groups.
In the knowledge society, a high level of economic performance and good living standards can only be achieved if an increasing share of the population attains a high level of education. Social origin should not be an obstacle in this regard. However, the data collected through the special EU-SILC module show that people whose fathers had attained tertiary level of education are far more likely to do so themselves than people whose fathers had only a low or medium level of education: a little more than twice as likely in Germany, Finland and the UK, and more than nine times as likely in Hungary, Poland and the Czech Republic. High educational attainment among female respondents tends to be more influenced by the education level of fathers than is the case for male respondents.
Clearly, coming from a low-education background is a major obstacle to achieving a high level of education, especially for girls. In a majority of Member States, this disadvantage seems to have diminished; indeed, for respondents aged 25-34 the education level of their fathers remains a strong determinant of their chances of attaining a high education level, but less so than for the cohorts aged 35-44 and 45-54. This improvement is less marked in some countries where a high education level of fathers appears to be a particularly strong determinant of their children’s educational attainment.
The results from the EU-SILC module also suggest that access to the highest occupational level (manager, professional or technician) is much easier for the children of fathers in these same professions than for the children of lower occupational categories. The category of managers, professionals and technicians represents between one quarter (Portugal, Spain) and just over half of the workforce (Netherlands, Germany) and can be regarded as crucial for economic performance in the knowledge society. Yet, the data suggest that family background can be an important barrier of access to this key occupational category: children whose fathers are from a lower level occupation are only half as likely on average across the EU to accede to this key occupational category as children of managers, professionals and technicians, and only a third as likely in Portugal.
The EU-SILC module on intergenerational transmission of disadvantages provides strong evidence that inequality of opportunities is a serious problem. It prevents people from disadvantaged families from developing their full potential and achieving a better living standard for themselves and their own children, and
THE SOCIAL SITUATION IN THE EUROPEAN UNION 2007
12
it deprives European labour markets of the highly skilled employees that will be more and more in demand in the knowledge society and in the context of demographic ageing.
1.7. Children from a migration background and equal opportunities Children from a migration background are at higher risk of poverty than children of parents born in the country of residence. This can be linked to lower labour force participation of foreign-born parents and lower wages that go with less skilled jobs. Schools fail to help children with migrant background to overcome disadvantages: the OECD’s PISA study shows significantly lower scores in mathematics performance for children of foreign-born parents, even though they are highly motivated. Fighting child poverty has become a high priority; success will depend on paying special attention to the situation of children with a migration or ethnic minority background.
Children from a migration background and ethnic minorities suffer from multiple disadvantages: a larger proportion of them grow up in less educated, low income households. Language and cultural differences constitute additional barriers to accessing the full range of opportunities in their host countries. Overcoming these obstacles is becoming a major challenge as the diversity of populations in the Member States increases, due to large immigration flows into several Member States. According to the 2000/2001 Census round, seven percent of the EU population were born outside their current country of residence, a figure that is likely to have increased significantly since then. The composition of the foreign-born population differs widely from one Member State to another, and in many Member States half or more of foreign-born residents come from just three or four countries.
The Social Situation Report takes a close look at children at risk of poverty (section 3.2) in migrant households, defined as households where both parents were born outside the EU. An estimated 5.5 % of children aged under 16 in the European Union, or over 4 million altogether, live in such households. 40 % of children from a non-EU migration background live in a household at risk of poverty (equivalised income below 60 % of the median), compared to 18 % of children of parents born in the country of residence. The proportion of children in households with income below the at-risk-of-poverty threshold exceeds 50 % in Belgium, Spain, Luxembourg and the Netherlands. This increased poverty risk is linked to employment: parents in migration households are less likely to be fully employed than parents born in the country of residence. Moreover, it is likely that a higher proportion of parents born outside the EU will be doing less qualified and less well-paid jobs.
The disadvantages of migrant children at home are also reflected in student performance. The OECD’s PISA study compared mathematics performance of native students (those with at least one parent born in the country) and first and second generation immigrant students (students born outside the country, and students born in the country with foreign-born parents)10. Although students from an immigrant background show high levels of motivation, their scores in most of the OECD countries participating in the survey are significantly lower than those of native students.
1.8. Equal opportunities: the key to economic growth and social cohesion The analysis presented in the 2007 Social Situation Report, albeit very preliminary, suggests that promoting equal opportunities in the European Union could make a major contribution to both greater social cohesion and economic performance. As long as a significant proportion of the population cannot develop their full potential, there is no trade-off between equality and efficiency. This report illustrates this by showing that educational outcomes are still strongly determined by the level of education of parents and by showing that particularly children from a migration background are growing up in difficult social circumstances. The Report only presents a very cursory analysis based on the new set of EU-SILC survey data that has become available, but it demonstrates that the European Union and its Member States now have powerful analytical tools at their disposal for identifying and monitoring major obstacles to achieving more equality of opportunity and hence better prospects for social cohesion and growth.
10 See Education at a Glance 2007, OECD.
13
DEUTSCHE EINFÜHRUNG UND ZUSAMMENFASSUNG
1. DIE BEDEUTUNG DER CHANCENGLEICHHEIT IN DER EU: EIN ÜBERBLICK
Im Bericht zur sozialen Lage 2007 werden eine Reihe der wesentlichen Ergebnisse der EU-SILC (Gemeinschaftsstatistik über Einkommen und Lebensbedingungen), des neuen Instruments der EU zur Beobachtung der sozialen Lage und, künftig auch, der sozialen Trends, vorgestellt. Der Bericht untersucht Einkommensungleichheiten, ihren Zusammenhang mit der Wirtschaftsleistung sowie die Frage, wie sich Menschen mit geringem Einkommen auf die EU als Ganzes verteilt sind. Die Förderung der Chancengleichheit in der Europäischen Union könnte dadurch, dass das brachliegende Potenzial benachteiligter Gruppen mobilisiert wird, erheblich zu mehr sozialem Zusammenhalt und einer besseren Wirtschaftsleistung beitragen. Zwei Abschnitte in diesem Bericht gehen insbesondere auf die Weitergabe sozialer Benachteiligung von einer Generation an die nächste und auf Armutsrisiken unter Kindern mit Migrationshintergrund und Kindern ethnischer Minderheiten ein.
Der Bericht versucht auch zu bestimmen, welches die größten von Armut bedrohten Gruppen in den verschiedenen Mitgliedstaaten sind, sowie aufzuzeigen, inwieweit ein Zusammenhang zwischen geringen Einkommen und dem Zugang zu verschiedenen wichtigen Gütern und Dienstleistungen besteht. Angesichts des Themas des Europäischen Jahres 2007 legt der Bericht zur sozialen Lage besonderes Augenmerk auf Chancengleichheit. Da der Bericht nur nur einen Bruchteil der Fülle an Daten nutzen kann, die innerhalb von EU-SILC gewonnen werden; lädt die Kommission die Forschungsgemeinschaft auf, von dieser Datenquelle umfassend Gebrauch zu machen.
Die in dem Bericht zur sozialen Lage präsentierten Ergebnisse unterstreichen ein weiteres Mal die Bedeutung von Investitionen in Menschen, wie noch vor kurzem von der Kommission in ihrem Beitrag zur Oktobertagung der Staats– und Regierungschefs zum Thema Erfolg im Zeitalter der Globalisierung hervorgehoben wurde11. Auch die Frage, wie die Herausforderungen der Chancengleichheit anzugehen sind, ist ein wichtiger Aspekt der öffentlichen Konsultation zur „sozialen Wirklichkeit“ Europas12.
1.1. EU-SILC: Das neue Instrument zur Beobachtung der sozialen Lage in der EU
Die Europäische Union verfügt über ein leistungsstarkes neues Instrument zur Beobachtung der sozialen Lage und der Trends in allen Mitgliedstaaten und somit zur Unterstützung der Entwicklung besserer Sozialpolitiken durch die Offene Methode der Koordinierung.
Seit etwa fünfzig Jahren werden international vergleichbare Daten zur Beobachtung der sozialen Lage und sozialer Trends gesammelt. Entsprechende Instrumente zur Beobachtung sozialer Bedingungen stecken indes noch in den Kinderschuhen. Im letzten Jahrzehnt hat die Europäische Union beachtliche Fortschritte bei der Erstellung international vergleichbarer Daten zur Beobachtung der sozialen Lage gemacht. Das Europäische Haushaltspanel (ECHP) wurde erstmals 1994 durchgeführt und hat ein Jahrzehnt lang jährlich Daten über die sozialen Bedingungen hervorgebracht. Es wurde nun durch ein neues Instrument, EU-SILC (Gemeinschaftsstatistik über Einkommen und Lebensbedingungen), ersetzt, das dieses Jahr Daten für fast alle Mitgliedstaaten liefert.
Mit EU-SILC verfügt die Europäische Union über ein sehr viel effizienteres Instrument zur Beobachtung der sozialen Lage und sozialer Trends. Diese Gemeinschaftsstatistik arbeitet mit größeren Stichproben, so dass die Merkmale der am stärksten gefährdeten Haushalte genauer analysiert werden können. Der zeitliche Abstand zwischen der Erhebung der Daten und der Veröffentlichung – drei Jahre oder mehr im Fall des ECHP – ist um etwa ein Jahr verkürzt worden; dennoch wurden die aktuellsten für diesen Bericht verwendeten Daten 2005 erhoben und beziehen sich auf Einkommen im Jahr 200413. Die Verfügbarkeit der Sozialdaten wird also weiterhin erheblich hinter der der wirtschaftlichen Schlüsselindikatoren zurückbleiben.
Ohne international vergleichbare Daten über die soziale Lage, wie sie vom ECHP und EU-SILC hervorgebracht werden, wären wichtige politische Entwicklungen in der Europäischen Union unmöglich gewesen. Ein entscheidender Durchbruch war diesbezüglich die Einführung einer Offenen Methode der Koordinierung, bei der sich die Mitgliedstaaten auf gemeinsame Ziele und Indikatoren zur Beobachtung der Fortschritte bei der Verwirklichung dieser Ziele im Bereich von Sozialschutz und sozialer Eingliederung
11 KOM(2007) 581endgültig. 12 Siehe http://ec.europa.eu/citizens_agenda/social_reality_stocktaking/index_de.htm 13 Der Einkommensreferenzzeitraum für das Vereinigte Königreich ist 2004, für Irland 2004-2005. Die Zusammensetzung
des Haushalts usw. bezieht sich auf den Referenzzeitraum. Ferner ist darauf hinzuweisen, dass die in den statistischen Bildern und ihren Anhängen verwendeten EU-SILC-Daten später erhoben wurden als die für die Analyse in diesem ersten Teil des Berichts. Daher sind gewisse Unstimmigkeiten zwischen diesen beiden Teilen möglich.
DIE SOZIALE LAGE IN DER EUROPÄISCHEN UNION 2007
14
geeinigt haben. Die meisten dieser Indikatoren sind abhängig von der Verfügbarkeit international harmonisierter Erhebungen über Einkommen und Lebensbedingungen wie etwa ECHP und EU-SILC14.
1.2. Einkommensungleichheit und Wirtschaftsleistung
Die Einkommen sind in der EU gleichmäßiger verteilt als in den USA, und in der EU geht ein hohes Niveau der Wirtschaftsleistung häufig Hand in Hand mit mehr Gleichheit.
Laut den von der OECD veröffentlichten Daten (siehe Abschnitt 2.1 des Berichts über die soziale Lage) ist das Einkommen in den meisten Mitgliedstaaten sehr viel gleichmäßiger verteilt als in den USA. Der am häufigsten benutzte Indikator für Ungleichheit ist der Gini-Koeffizient,15, der zwischen 0 (wenn jeder einen gleichen Anteil des Gesamteinkommens erhält) und 100 (wenn das gesamte Einkommen einer einzigen Person zufällt) schwankt. Im Jahr 2000 stand der Gini-Koeffizient in den Vereinigten Staaten bei 35.7. Wenn man auf Basis der EU-SILC die Bevölkerung der EU-25 als Ganzes nimmt und die Kaufkraftdifferenzen zwischen den Mitgliedstaaten bereinigt, liegt der Gini-Koeffizient für die EU-25 bei schätzungsweise rund 35.0. Dies ist noch immer erheblich weniger als in den USA, trotz der großen Unterschiede im Pro-Kopf-BIP der einzelnen Mitgliedstaaten. Die Ergebnisse der EU-SILC zeigen auch, dass nur Portugal das US-Niveau übersteigt (38.0), während Polen, Lettland und Litauen ein ähnliches Niveau an Ungleichheiten aufweisen wie die USA.
Der internationale Vergleich der Gini-Koeffizienten legt außerdem nahe, dass es letztlich möglicherweise keinen Gegensatz zwischen Gleichheit und Wirtschaftsleistung gibt, gemessen anhand des Pro-Kopf-BIP.. Tatsächlich zeigt der Vergleich zwischen den Gini-Koeffizienten der EU und der Bewerberländer und ihrem Pro-Kopf-BIP, dass in den weiter entwickelten Ländern in der Regel auch mehr Gleichheit herrscht. Auch wenn dies nicht bedeutet, dass der Abbau von Ungleichheiten zwangsläufig die Wirtschaftsleistung steigert, lässt es doch darauf schließen, dass geringe Ungleichheit auch mit einem hohen Pro-Kopf-BIP einhergeht.
Die Besteuerung der Reichen zwecks Umverteilung des Einkommens an die Armen könnte der Wirtschaftslehre zufolge aufgrund von Wohlfahrtsverlusten verbunden mit der Besteuerung und Anreizeffekten einkommensbezogener Transferzahlungen die aggregierte Wirtschaftsleistung reduzieren. Der Wirtschafswissenschaftler Arthur Okun verwendete dafür die Metapher eines lecken Eimers. Dennoch muss eine relativ gleichmäßige Verteilung nicht zwangsläufig nur das Ergebnis einer breiten Umverteilung sein. Sie kann das Ergebnis einer beschränkteren Umverteilung von Markteinkommen sein und daraus resultieren, dass den Menschen mehr Chancengleichheit geboten wird, um ihr volles Produktionspotenzial zu entfalten und zur Einkommenserzeugung beizutragen. Dies setzt voraus, dass alle Menschen gute Chancen auf Zugang zu hochwertiger Bildung, Gesundheitsversorgung und Arbeitsplätzen haben.
Mehr Gleichheit aufgrund von mehr Chancengleichheit hat nicht die Effizienzverluste zur Folge, die mit Umverteilung oftmals verbunden werden. Ganz im Gegenteil kann die Förderung der Chancengleichheit das Wachstum stärken, da sie Ressourcen mobilisiert, die zuvor durch Diskriminierung und soziale Ausgrenzung blockiert waren. Die im Bericht zur sozialen Lage enthaltene Analyse der sozialen Mobilität legt nahe, dass ein beträchtlicher Anteil der europäischen Bevölkerung nicht sein volles Potenzial entfaltet. Dies verlangsamt Europas Wirtschaftsentwicklung und impliziert, dass zu viele Menschen unter schlechten Bedingungen leben.
Der Bericht geht auch auf Trends der Ungleichheit seit den 70er Jahren ein. Es gibt keinen gemeinsamen Trend in allen in dem Bericht erfassten Ländern; in jedem der untersuchten Subzeiträume gab es Länder mit steigender Ungleichheit und andere mit abnehmender Ungleichheit. Die Ungleichheit ist jedoch von Mitte der 80er Jahre bis Mitte der 90er Jahre in einer deutlichen Mehrheit der Länder gestiegen, ein Trend, der nun offenbar ein wenig abgeflaut ist. Eine kürzlich vollendete Studie über die sozialen Auswirkungen der Globalisierung in der Europäischen Union16 gelangte zu dem Schluss, dass es keine (oder nur schwache) Beweise dafür gibt, dass dieser Anstieg der Einkommensungleichheiten auf die Globalisierung zurückzuführen ist, und deutete an, es sei wahrscheinlicher, dass er eng mit dem Aufkommen der Wissensgesellschaft zusammenhängt, das zu einer steigenden Rentabilität des Humankapitals führt und die Kluft zwischen Menschen mit einem hohen Wissens– und Kompetenzniveau und jenen, die nur über elementare Kenntnisse verfügen, verbreitert.
14 Siehe http://ec.europa.eu/employment_social/spsi/common_indicators_de.htm für die aktuelle Liste der Indikatoren. 15 Der Gini-Koeffizient wird definiert als das Verhältnis der kumulierten Anteile der Bevölkerung, sortiert nach dem
Einkommensniveau, zum kumulierten Anteil des von ihnen empfangenen gesamten Äquivalenznettoeinkommens. 16 Siehe http://ec.europa.eu/employment_social/social_situation/docs/simglobe_fin_rep.pdf
TEIL 1 | SOZIALER ZUSAMMENHALT DURCH CHANCENGLEICHHEIT
15
1.3. Niedrige Einkommen – eine europäische Perspektive
2004 hatten etwa 100 Millionen Europäer (22 % der Gesamtbevölkerung) weniger als 60 % des durchschnittlichen EU-Einkommens von rund €8000 pro Jahr für eine Person bzw. €22 pro Tag (Beträge bereinigt für Kaufkraft und Haushaltsgröße; Kaufkraftstandard KKS17 unten verwendet). Etwa 23,5 Millionen mussten mit weniger als €10 pro Tag auskommen. Am höchsten ist die Konzentration von Menschen mit geringem Einkommen im Vergleich zum EU-Durchschnitt in den ärmeren neuen Mitgliedstaaten, aber auch in den reicheren EU-15-Ländern lebt ein großer Anteil der Bevölkerung mit niedrigem Einkommen.
Die Offene Methode der Koordinierung arbeitet hauptsächlich mit einem relativen Armutskonzept, das 1975 vom Europäischen Rat angenommen wurde und Arme wie folgt definiert: „Einzelpersonen und Familien, die über so geringe Mittel verfügen, dass sie von der Lebensweise ausgeschlossen sind, die in dem Mitgliedstaat, in dem sie leben, als Minimum annehmbar ist“. Dieses relative Konzept anerkennt, dass es nicht reicht, für alle den Zugang zum Existenzminimum zu gewährleisten. Es geht auch darum, sicherzustellen, dass alle Bürger vom allgemeinen Wohlstandsniveau in ihrem Land profitieren und als vollwertige Mitglieder der Gesellschaft daran teilhaben. Der Hauptindikator, der zur Widerspiegelung dieses Konzepts angewendet wird, ist die Armutsgefährdungsrate, definiert als der Anteil an Personen, deren verfügbares Äquivalenzeinkommen weniger als 60 % des nationalen Durchschnittseinkommens beträgt. Die Armutsgefährdungsrate wird zusammen mit den Armutsgefährdungsschwellen in jedem Mitgliedstaat veröffentlicht und analysiert. Diese liegen, in Kaufkraftstandards ausgedrückt, zwischen rund 1500–2000 KKS (Rumänien, Bulgarien) und rund 10 000 KKS (Vereinigtes Königreich, Deutschland, Dänemark, Niederlande) pro Jahr.
Der Bericht zur sozialen Lage ergänzt diese einzelstaatlich ausgerichtete Perspektive durch eine europäische Perspektive (Abschnitt 2.3). Eine der Hauptaufgaben der Europäischen Union besteht darin, den Lebensstandard und die Lebensqualität aller Europäer anzuheben und den wirtschaftlichen und sozialen Zusammenhalt und die Solidarität zwischen den Mitgliedstaaten zu fördern. Die diesbezüglichen Fortschritte werden vor allem anhand des Pro-Kopf-BIP beurteilt. Dank EU-SILC ist es möglich, die Herausforderung des sozialen Zusammenhalts auch anhand der Zahl von Europäern zu bewerten, deren Einkommen im Sinne der Kaufkraft oder eines bestimmten absoluten Betrags unter dem europäischen Durchschnitt liegen. Die fortlaufende Beobachtung dieser Zahlen würde es ermöglichen, zu beurteilen, ob alle Europäer von dem wirtschaftlichen Fortschritt profitieren, den die europäische Integration gebracht hat und der von den Strukturfonds der EU sowie von geeigneten nationalen Sozialmaßnahmen unterstützt wird. Sie würde folglich sowohl die Beobachtung des Prozesses der wirtschaftlichen Konvergenz, gemessen anhand des Pro-Kopf-BIP gegenüber dem EU-Durchschnitt, ergänzen, als auch die Beobachtung der sozialen Eingliederung in einem bestimmten Mitgliedstaat, die sich insbesondere auf die Zahl von Menschen mit Einkommen unter einem bestimmten Prozentsatz des nationalen Durchschnittseinkommens konzentriert18.
Verschiedene gemeinsame Schwellenwerte, alle in KKS ausgedrückt, um die verschiedenen Preisniveaus in der EU zu bereinigen, wurden ausgewählt, bevor eine Schätzung der absoluten Zahlen und Anteile von Menschen mit Einkommen unter dieser Schwelle vorgenommen wurde. Dies war nur für 24 Mitgliedstaaten möglich (EU-27 mit Ausnahme von Malta, Bulgarien und Rumänien). 22 % der Europäer (knapp über 100 Millionen) haben ein Äquivalenzeinkommen19 unter 60 % des durchschnittlichen EU-Einkommens. 16 % (73,2 Millionen) liegen unter 50 % des Durchschnittseinkommens und 11 % (48,8 Millionen) unter 40 %. Diese Niveaus von 60 %, 50 % und 40 % des durchschnittlichen EU-Einkommens entsprechen einem verfügbaren Jahreseinkommen von 8040 KKS, 6700 KKS und 5360 KKS für eine Person bzw. €22, €18 und knapp unter €15 pro Tag. Der Anteil von Menschen, deren Einkommen weniger als 60 % des jeweiligen nationalen Durchschnittseinkommens beträgt – dies ist die in der Offenen Methode der Koordinierung angewandte Armutsgefährdungsrate – liegt bei 16 %. EU-SILC kann auch eingesetzt werden, um den Anteil der europäischen Bevölkerung, die mit dem extrem niedrigen Einkommen von €10 pro Tag (5 % bzw. 23,5 Millionen Menschen) oder sogar €5 pro Tag (2 % bzw. 6,9 Millionen) auskommen muss, zu schätzen.
17 Mit einem KKS kauft man in allen Ländern die gleiche bestimmte Menge an Gütern und Dienstleistungen, während
verschiedene Beträge nationaler Währungseinheiten erforderlich sind, um diese gleiche Menge an Gütern und Dienstleistungen in einzelnen Ländern zu kaufen, abhängig vom Preisniveau. KKS erhält man, indem man ihren ursprünglichen Wert in nationalen Währungseinheiten durch die jeweilige Kaufkraftparität (KKP) teilt, siehe Definition in Abschnitt 2.3 und Tabelle 4.
18 Daten zu diesen Indikatoren veröffentlicht die Kommission insbesondere im Gemeinsamen Bericht zu Sozialschutz und sozialer Eingliederung. http://ec.europa.eu/employment_social/spsi/joint_reports_de.htm
19 Das Haushaltseinkommen wird in ein Äquivalenzeinkommen umgewandelt (angepasst), um Unterschiede in Haushaltsgröße und -zusammensetzung widerzuspiegeln. Anders ausgedrückt wird das Haushaltsgesamteinkommen geteilt durch die Zahl der Haushaltsmitglieder, gewichtet mithilfe der so genannten „modifizierten“ OECD-Äquivalenzskala. Diese Äquivalenzskala gibt dem ersten Erwachsenen ein Gewicht von 1,0, jedem anderen Haushaltsmitglied ab 14 Jahren 0,5 und jedem Kind 0,3. Die daraus resultierende Zahl wird jedem Haushaltsmitglied zugeordnet, entweder Erwachsener oder Kind.
DIE SOZIALE LAGE IN DER EUROPÄISCHEN UNION 2007
16
Diese Zahlen sind geschätzt und gelten unter Vorbehalt (siehe Abschnitt 2.1 des Berichts zur sozialen Lage). Menschen mit geringem Geldeinkommen können in der Lage sein, informell im Haushalt oder der lokalen Gemeinschaft produzierte Güter und Dienstleistungen zu konsumieren, was in wirtschaftlich weniger entwickelten und eher ländlichen Gebieten häufig der Fall ist. Sehr niedriges Einkommen kann auch die Folge von Handelsverlusten sein, die von den Selbstständigen gemeldet werden. Das Geldeinkommen gibt folglich nur sehr beschränkt Aufschluss über den Lebensstandard und das Risiko der sozialen Ausgrenzung.
Die höchsten Konzentrationen von Menschen unter diesen verschiedenen Schwellen finden sich natürlich in den ärmsten Mitgliedstaaten. Über drei Viertel der Bevölkerung in Estland, Lettland, Litauen, Ungarn, Polen und der Slowakei leben mit Einkommen unter 60 % des EU-Durchschnitts; mindestens die Hälfte der Bevölkerung in diesen Ländern (ausgenommen Ungarn, wo es nur 40 % sind) müssen ihren Lebensunterhalt mit weniger als 40 % des EU-Durchschnittseinkommens bestreiten. Der Anteil von Menschen, die mit €10 pro Tag auskommen müssen, liegt in Lettland und Litauen bei fast 40 %, in Estland und Polen über einem Viertel. In vier Mitgliedstaaten verfügen mehr als fünf Prozent der Bevölkerung lediglich über €5 pro Tag: Estland (5 %), Lettland (9 %), Litauen (10 %) und Polen (7 %).
Diese prekären Einkommenssituationen sind zwar vor allem in den am wenigsten entwickelten Mitgliedstaaten zu verzeichnen, aber auch in den reicheren, älteren Mitgliedstaaten gibt es viele Menschen mit sehr niedrigem Einkommen. 16 % der Europäer mit einem Einkommen unter 60 % des EU-Durchschnitts leben in Polen, 13 % in Deutschland, 11 % in Spanien, 11 % in Frankreich, 12 % in Italien, aber nur 8 % im Vereinigten Königreich. Von den Menschen mit den niedrigsten Einkommen (unter €5 pro Tag) leben 44 % in Polen, aber fast 30 % von ihnen leben in sieben alten Mitgliedstaaten: Italien (8 % aller Europäer mit weniger als €5 pro Tag), Spanien (7 %), Portugal (4 %), Deutschland (4 %), Vereinigtes Königreich (3 %), Griechenland (2 %) und Frankreich (2 %).
Da die neuen Mitgliedstaaten im Hinblick auf die Wirtschaftsleistung aufholen, dürften die steigenden Einkommen – sowohl absolut als auch im Vergleich zum EU-Durchschnitt – zu einer raschen Verringerung der Zahl von Menschen mit sehr niedrigen Einkommen führen. Doch dieser Fortschritt wird möglicherweise nicht automatisch eintreten, wenn große Bevölkerungsgruppen (z.B. Rentner oder niedrig qualifizierte Arbeitnehmer) nicht von besseren Verdienstmöglichkeiten profitieren können und Transfereinkommen nicht den Verdiensten entsprechend steigen. Es ist daher ein wichtiges Anliegen der Offenen Methode der Koordinierung, herauszufinden, ob Wirtschaftswachstum zu geringerer sozialer Ausgrenzung, gemessen am nationalen Durchschnittseinkommen, führt.
1.4. Wer sind die Armen: die am stärksten gefährdeten Gruppen in den Mitgliedstaaten
In den meisten Mitgliedstaaten besteht das größte Segment der von Armut bedrohten Bevölkerung aus Paaren mit einem oder zwei Kindern, bei denen einer der Partner nicht erwerbstätig ist (zumindest nicht das ganze Jahr hindurch) – der Familientypus „männlicher Haupternährer“. Alleinerziehende Eltern stellen, auch wenn sie einem hohen Armutsrisiko ausgesetzt sind, nur in solchen Ländern einen großen Teil der von Armut bedrohten Bevölkerung dar, wo diese Art von Haushalt weit verbreitet ist. Politiken zur Armutsbekämpfung und zur Förderung der sozialen Eingliederung müssen berücksichtigen, welche Gruppen den größten Anteil an der gefährdeten Bevölkerung darstellen und welche Gruppen dem Armutsrisiko am stärksten ausgesetzt sind, damit die richtige Mischung aus horizontalen und gezielten politischen Maßnahmen entwickelt werden kann.
Der Bericht zur sozialen Lage (Abschnitt 2.4) geht auf das Armutsrisiko ein, dem verschiedene Teile der Bevölkerung ausgesetzt sind, und versucht, die größten Untergruppen zu bestimmen, aus denen sich die gesamte von Armut bedrohte Bevölkerung in den einzelnen Mitgliedstaaten zusammensetzt. Für politische Entscheidungsträger wird es nützlich sein, sowohl die gruppenspezifischen Armutsgefährdungsraten als auch die Gesamtzahl der von Armut bedrohten Menschen in den verschiedenen Gruppen zu betrachten. Während die gruppenspezifischen Raten Schwachstellen im Rahmen der Politik zur Vorbeugung von Armut andeuten, kann die Gesamtzahl nützlich sein, um festzustellen, wo Maßnahmen zur größtmöglichen Verringerung der Armutsgefährdungsraten zu ergreifen sind,
Der zur Messung des Armutsrisikos angewandte Indikator ist der Anteil der Bevölkerung mit einem verfügbaren Äquivalenzeinkommen von unter 60 % des nationalen Durchschnitts. Dieser Wert variiert von 9 % in Schweden und 10 % in der Tschechischen Republik bis zu 21 % in Litauen und Polen. Das Armutsrisiko in den Mitgliedstaaten variiert zwischen den verschiedenen Segmenten der Bevölkerung erheblich. Gleichzeitig variieren die Gruppen mit dem höchsten Risiko auch von einem Land zum anderen.
Dennoch zeichnen sich in praktisch allen Ländern vier Gruppen ab, die einem hohen Risiko ausgesetzt sind. Dabei handelt es sich um:
- Personen im erwerbsfähigen Alter, sowohl beschäftigt als auch arbeitslos, die allein mit einem unterhaltspflichtigen Kind leben und in der überwiegenden Mehrheit der Fälle Frauen sind;
TEIL 1 | SOZIALER ZUSAMMENHALT DURCH CHANCENGLEICHHEIT
17
- allein lebende Personen ab 65 Jahren, die keiner bezahlten Beschäftigung mehr nachgehen und wiederum mehrheitlich Frauen sind, von denen viele möglicherweise nicht erwerbstätig waren, bevor sie 65 wurden;
- allein lebende Personen im erwerbsfähigen Alter, die arbeitslos sind;
- Familien mit Kindern, bei denen nur ein Elternteil erwerbstätig ist.
Diese Gruppen variieren von Land zu Land, nicht nur im Hinblick auf ihr Armutsrisiko, sondern auch bezüglich ihrer Anzahl und ihres Anteils an der Gesamtbevölkerung. Vor allem allein stehende Eltern sind in manchen Ländern sehr viel zahlreicher verteten als in anderen. In Ländern, wo diese Gruppen einen relativ kleinen Anteil an der Bevölkerung ausmachen, stellen sie vielleicht auch nur einen kleinen Anteil an der von Armut bedrohten Gesamtbevölkerung dar, selbst wenn sie einem hohen Armutsrisiko als solchem ausgesetzt sind. Gleichermaßen kann ein Segment der Bevölkerung mit einem viel geringeren Armutsrisiko dennoch einen relativ großen Anteil an der gefährdeten Gesamtbevölkerung darstellen, einfach weil es so viele von ihnen gibt.
In 14 der 24 Mitgliedstaaten, für die Daten analysiert wurden, bildeten Paare mit ein oder zwei Kindern, bei denen einer der Partner nicht erwerbstätig ist (zumindest nicht das ganze Jahr hindurch), das größte Segment der von Armut bedrohten Bevölkerung. Mit Ausnahme von Estland und Zypern gehören alle neuen Mitgliedstaaten dieser Gruppe von 14 Mitgliedstaaten an. In weiteren drei Ländern waren sie die zweitgrößte Gruppe. In zwei weiteren Ländern, Belgien und Irland, stellten Paare mit drei oder mehr Kindern, bei denen einer der Partner nicht erwerbstätig ist, die größte Gruppe dar.
In anderen Ländern sind allein lebende Personen die größte Gruppe unter der Bevölkerung mit einem Einkommen unter der Armutsgefährdungsschwelle. Dies ist in Dänemark, Finnland, Schweden und Estland der Fall, wo allein stehende Personen im erwerbsfähigen Alter zu den größten Untergruppen der durch Armut bedrohten Bevölkerung zählen, vor allem, wenn sie nicht das ganze Jahr hindurch erwerbstätig sind. Auch allein stehende Eltern gehören in diesen vier Ländern, ebenso wie in Deutschland und dem Vereinigten Königreich, zu den Hauptgruppen mit Einkommen unter der Armutsgefährdungsschwelle.
In Dänemark, Estland, Finnland, Schweden, dem Vereinigten Königreich und Zypern zählen überdies Personen ab 65 Jahren zu den von Armut bedrohten Hauptgruppen, entweder als Paare oder als allein stehende Frauen. Dies ist auch in Griechenland, Italien, Portugal und Slowenien der Fall.
Diese Vielfalt in der EU macht deutlich, dass die Politik in den einzelnen Mitgliedstaaten unterschiedlich ausgerichtet werden muss, um eine erhebliche Verringerung der Zahl der von Armut bedrohten Menschen zu erreichen.
1.5. Niedrige Einkommen und Lebensstandards in der EU
Niedrige Einkommen führen zu reduzierten Konsummöglichkeiten und erhöhter finanzieller Not, aber nicht alle Haushalte mit Einkommen unter der Armutsgefährdungsschwelle müssen auf wesentliche Güter und Dienstleistungen verzichten oder haben Mühe, über die Runden zu kommen. Der hohe Anteil derjenigen, die in den neuen Mitgliedstaaten erklären, sich nicht einmal jeden zweiten Tag eine anständige Mahlzeit leisten zu können (rund 15 % der Bevölkerung in sechs Mitgliedstaaten, d. h. drei Mal soviel wie in der EU-15), veranschaulicht die beträchtlichen Disparitäten, die nach wie vor in der EU bestehen, und unterstreicht die Notwendigkeit, Armutsmessungen auf Basis des relativen Einkommens um Indikatoren zur materiellen Entbehrung zu ergänzen. Doch auch in manchen EU-15-Ländern ist der Anteil an Menschen, die sich unzureichend ernähren, beunruhigend hoch, vor allem vor dem Hintergrund steigender Lebensmittelpreise. Den langfristigeren Folgen niedriger Einkommen ist besondere Aufmerksamkeit zu widmen, insbesondere im Hinblick auf die Lebenschancen von Kindern aus bedürftigen Familien und die erhöhten Risiken in Bezug auf schlechte Gesundheit und Sterblichkeit, denen Menschen mit einem niedrigeren sozioökonomischen Status ausgesetzt sind.
Einkommen ist ein Mittel zum Zweck: Es wird gebraucht, um lebenswichtige Güter und Dienstleistungen zu erhalten und darüber hinaus ein Leben zu führen, das den Menschen erlaubt, sich als Teil ihrer Gemeinschaft zu fühlen. Der Bericht zur sozialen Lage (Abschnitt 2.5) untersucht den Zusammenhang zwischen Einkommen und Zugang zu diesen lebensnotwendigen Dingen. EU-SILC deckt Bereiche wie etwa Unterkunft, Finanzprobleme (z.B. Zahlung von Hypotheken bzw. Miete oder Gas–/Stromrechnungen) und die Fähigkeit ab, sich eine Reihe von Gütern und Dienstleistungen zu leisten.
Ohne jede Frage sind Menschen unter der Armutsgefährdungsschwelle schlechter dran als diejenigen, die darüber liegen. In allen Ländern haben es Menschen, die unter dieser Schwelle liegen, fast zwangsläufig schwerer, über die Runden zu kommen, doch es gibt erhebliche Unterschiede zwischen den Mitgliedstaaten. Während der Großteil der Menschen in Haushalten mit niedrigem Einkommen in den meisten EU-15-Ländern
DIE SOZIALE LAGE IN DER EUROPÄISCHEN UNION 2007
18
über keine größeren Probleme z.B. in Bezug auf die Zahlung von Miete/Hypothek oder Gas–/Stromrechnungen berichtet (möglicherweise dank der Verfügbarkeit von Wohn– und Energiebeihilfen),erklären in den ärmeren neuen Mitgliedstaaten viele Menschen, selbst wenn sie über der Armutsgefährdungsschwelle liegen, sich Dinge nicht leisten zu können, die in den wohlhabenderen Mitgliedstaaten als selbstverständlich gelten.
Die EU-SILC-Daten erlauben eine sehr viel gründlichere Analyse als die, welche im Bericht zur sozialen Lage präsentiert wird. Die Tatsache, dass ein Haushalt mit niedrigem Einkommen keine Probleme wegen schlechter Wohnbedingungen meldet oder sich ein bestimmtes Konsumgut leisten kann, bedeutet nicht, dass er sich nicht in anderen Bereichen in einer Notlage befindet. Um ein aufschlussreicheres Bild materieller Entbehrung zu erhalten, muss untersucht werden, wie viele Menschen mit einer oder mehreren Arten der von EU-SILC gemessenen Notlagen konfrontiert sind.
Auch die zeitliche Dimension des Armutsrisikos ist zu berücksichtigen. Niedrige Einkommenssituationen können zeitlich begrenzt sein (z. B. für Studenten, junge Leute zu Beginn ihres Berufslebens oder selbstständig Erwerbstätige, die mit vorübergehenden Problemen konfrontiert sind). Im Rahmen der EU-SILC wurde auch ein Panel eingerichtet, das nach mehreren Erhebungsrunden die Einschätzung ermöglichen wird, wie lange niedrige Einkommenssituationen fortbestehen und wie hoch die Wahrscheinlichkeit ist, dass die Betroffenen aus derartigen Situationen herausfinden. Es eröffnet auch eine längere Zeitdimension, die Generationen umspannt: Für Kinder, die in armutsgefährdeten Haushalten aufwachsen, ist die Wahrscheinlichkeit, als Erwachsene selbst in solchen Haushalten zu leben, höher als für Kinder aus besser gestellten Familien. Diese Frage wird in dem Bericht auf Basis eines speziellen EU-SILC-Moduls untersucht (siehe unten).
Hinzu kommt, dass Einkommen und sozioökonomischer Status eng mit Gesundheit und Lebenserwartung verknüpft sind. Es gibt Belege dafür, dass Menschen mit einem niedrigeren sozioökonomischen Status und geringerem Einkommen in der Regel jünger sterben und mehr Gesundheitsprobleme haben als Menschen aus höheren sozioökonomischen Gruppen. Dies hängt damit zusammen, dass erstere in allen Phasen des Lebenszyklus stärker physischen, psycho-sozialen und Verhaltensrisikofaktoren ausgesetzt sind. Gegenwärtig sind auf EU-Ebene keine vergleichbaren Indikatoren verfügbar, um solche Gesundheitsungleichheiten zu beobachten, aber sie stellen fraglos eine erhebliche Herausforderung im Hinblick auf Volksgesundheit und soziale Ausgrenzung dar. Daher sollte die Entwicklung von Indikatoren, insbesondere hinsichtlich der Lebenserwartung nach sozioökonomischem Status, als Priorität betrachtet werden.
1.6. Übertragung von Benachteiligungen zwischen Generationen
Erhebungsdaten zeigen, dass der Bildungs– und Berufshintergrund eines Elternteils maßgeblich über den Erfolg der Kinder entscheidet, auch wenn Jugendliche heute einen besseren Zugang zu Hochschulbildung haben. Solch eine Übertragung von Benachteiligungen zwischen Generationen legt nahe, dass viele junge Menschen ihr volles Potenzial nicht entfalten können und dass Europas Wirtschaft genau die Art von hoch qualifizierten Arbeitnehmern vorenthalten wird, die in der Wissensgesellschaft und im Kontext der alternden Bevölkerung immer dringender benötigt werden. Es gibt bedeutende Unterschiede zwischen den Mitgliedstaaten, was darauf schließen lässt, dass im Bereich von Bildungssystemen und dem Erwerb von Kompetenzen noch vieles verbessert werden kann.
Der Bericht zur sozialen Lage präsentiert eine erste Analyse der Ergebnisse aus einem speziellen Modul der EU-SILC-Erhebung, das die Übertragung von Benachteiligungen zwischen Generationen betrifft (Abschnitt 3.1). Dieses Modul fragte nach dem sozialen Status der Eltern der Befragten, als diese zwischen 12 und 16 Jahre alt waren. Der Bericht geht auf die Zusammenhänge zwischen dem Bildungsniveau von Eltern und Kindern sowie der wichtigsten Berufsgruppen ein.
In der Wissensgesellschaft lässt sich nur dann ein hoher Grad an Wirtschaftsleistung und gutem Lebensstandard erzielen, wenn ein zunehmender Anteil der Bevölkerung ein hohes Bildungsniveau erreicht. Die soziale Herkunft sollte diesbezüglich kein Hindernis darstellen. Die mithilfe des speziellen EU-SILC-Moduls erhobenen Daten zeigen indes, dass Personen, deren Väter das tertiäre Bildungsniveau erreicht hatten, viel bessere Chancen haben, es ihnen gleichzutun, als Personen, deren Väter nur ein niedriges oder mittleres Bildungsniveau hatten: In Deutschland, Finnland und dem Vereinigten Königreich ist die Wahrscheinlichkeit etwas mehr als zwei Mal so hoch, in Ungarn, Polen und der Tschechischen Republik mehr als neun Mal. Ein hohes Bildungsniveau unter weiblichen Befragten wird in der Regel stärker durch den Bildungsgrad des Vaters beeinflusst als bei männlichen Befragten.
Die Tatsache, einen niedrigen Bildungshintergrund zu haben, ist fraglos ein erhebliches Hindernis für die Erreichung eines hohen Bildungsniveaus, vor allem für Mädchen. In den meisten Mitgliedstaaten ist diese Benachteiligung offenbar zurückgegangen; tatsächlich hat der Bildungsgrad des Vaters für Befragte zwischen 25 und 34 nach wie vor entscheidenden Einfluss auf ihre Chancen, ein hohes Bildungsniveau zu erreichen, aber für die Gruppen zwischen 35–44 und 45–54 gilt dies in geringerem Maße. Weniger deutlich ist diese
TEIL 1 | SOZIALER ZUSAMMENHALT DURCH CHANCENGLEICHHEIT
19
Verbesserung in einigen Ländern, wo ein hoher Bildungsgrad der Väter offensichtlich besonders starken Einfluss auf das Bildungsniveau ihrer Kinder hat.
Die Ergebnisse aus dem EU-SILC-Modul lassen ferner darauf schließen, dass der Zugang zur höchsten Berufsstufe (Manager, Fachkraft, Techniker) für Kinder von Vätern, die den gleichen Beruf ausüben, sehr viel einfacher ist als für Kinder von Vätern in niedrigeren Berufskategorien. Die Kategorie der Manager, Fachkräfte und Techniker stellt zwischen einem Viertel (Portugal, Spanien) und knapp mehr als der Hälfte der Arbeitnehmer (Niederlande, Deutschland) dar; man kann sie als wesentlich für die Wirtschaftsleistung in der Wissensgesellschaft betrachten. Dennoch legen die Daten nahe, dass der familiäre Hintergrund ein großes Hindernis für den Zugang zu dieser wichtigen Berufskategorie sein kann: Kinder mit Vätern aus einer niedrigeren Berufskategorie haben im EU-Durchschnitt nur halb soviel Chancen, Zugang zu dieser wichtigen Berufskategorie zu finden, wie Kinder von Managern, Fachkräften und Technikern, und in Portugal liegen sie bei lediglich einem Drittel.
Das EU-SILC-Modul zur Übertragung von Benachteiligungen zwischen Generationen liefert starke Belege dafür, dass Chancenungleichheit ein ernstes Problem darstellt. Sie hindert Menschen aus benachteiligten Familien daran, ihr volles Potenzial zu entfalten und für sich und ihre Kinder einen besseren Lebensstandard zu erreichen, und sie hält Europas Wirtschaft genau die hoch qualifizierten Arbeitnehmer vor, die in der Wissensgesellschaft und im Kontext der alternden Bevölkerung immer dringender benötigt werden.
1.7. Kinder mit Migrationshintergrund und Chancengleichheit
Kinder mit Migrationshintergrund haben ein höheres Armutsrisiko als Kinder, deren Eltern in dem Land geboren wurden. Hier besteht ein Zusammenhang zwischen der geringeren Erwerbsbeteiligung von im Ausland geborenen Eltern und den niedrigeren Löhnen, die mit geringer qualifizierten Jobs verbunden sind. Die Schulen versäumen es, Kindern mit Migrationshintergrund bei der Bewältigung von Benachteiligungen zu helfen: Aus der PISA-Studie der OECD geht hervor, dass Kinder von im Ausland geborenen Eltern sehr viel schlechtere Noten in Mathematik haben, obwohl sie hoch motiviert sind. Der Bekämpfung der Kinderarmut wird heute hohe Priorität eingeräumt; sie kann nur dann erfolgreich sein, wenn der Situation von Kindern ethnischer Minderheiten oder mit Migrationshintergrund besondere Aufmerksamkeit gewidmet wird.
Kinder ethnischer Minderheiten oder mit Migrationshintergrund haben unter zahlreichen Benachteiligungen zu leiden: Ein höherer Anteil von ihnen wächst in weniger gebildeten Haushalten mit niedrigem Einkommen auf. Sprache und kulturelle Unterschiede behindern ebenfalls den Zugang zur gesamten Palette von Möglichkeiten in ihren Gastländern. Die Überwindung dieser Hindernisse entwickelt sich zu einer wichtigen Aufgabe, da die Bevölkerung in den Mitgliedstaaten aufgrund der starken Einwanderung in mehreren Mitgliedstaaten immer vielfältiger wird. Der Zensusrunde 2000/2001 zufolge wurden sieben Prozent der EU-Bevölkerung außerhalb ihres aktuellen Wohnlandes geboren, und diese Zahl dürfte seither beachtlich angestiegen sein. Die Zusammensetzung der im Ausland geborenen Bevölkerung unterscheidet sich von einem Mitgliedstaat zum anderen erheblich, und in vielen Mitgliedstaaten kommt die Hälfte oder mehr der im Ausland geborenen Einwohner aus nur drei oder vier Ländern.
Der Bericht zur sozialen Lage befasst sich näher mit von Armut bedrohten Kindern (Abschnitt 3.2) in Migrantenhaushalten, die als Haushalte definiert werden, in denen beide Eltern außerhalb der EU geboren wurden. Schätzungsweise leben in der Europäischen Union 5,5 % der Kinder unter 16 Jahren bzw. insgesamt über 4 Millionen in solchen Haushalten. 40 % der Kinder mit einem Nicht-EU-Migrationshintergrund leben in einem armutsgefährdeten Haushalt (Äquivalenzeinkommen unter 60 % des Durchschnitts), gegenüber 18 % der Kinder, deren Eltern im Wohnland geboren wurden. Der Anteil der Kinder in Haushalten mit Einkommen unter der Armutsgefährdungsschwelle liegt in Belgien, Spanien, Luxemburg und den Niederlanden über 50 %. Dieses erhöhte Armutsrisiko hängt mit der Beschäftigung zusammen: Die Wahrscheinlichkeit, dass Eltern in Migrantenhaushalten eine Vollzeitbeschäftigung haben, ist geringer als bei im Wohnland geborenen Eltern. Ferner kann man wohl davon ausgehen, dass ein höherer Anteil der außerhalb der EU geborenen Eltern geringer qualifizierte und schlechter bezahlte Jobs verrichtet.
Die Benachteiligungen von Migrantenkindern spiegeln sich auch in der Schülerleistung wider. Im Rahmen der PISA-Studie der OECD wurde die mathematische Leistung inländischer Schüler (mit mindestens einem im Land geborenen Elternteil) mit der von eingewanderten Schülern der ersten und zweiten Generation (außerhalb des Landes geborene Schüler sowie im Land geborene Schüler mit im Ausland geborenen Eltern) verglichen20. Obwohl Schüler mit Migrantenhintergrund hoch motiviert sind, bleiben ihre Noten in den meisten an der Erhebung mitwirkenden OECD-Ländern weit hinter denen der inländischen Schüler zurück.
20 Siehe Education at a glance 2007, OECD.
DIE SOZIALE LAGE IN DER EUROPÄISCHEN UNION 2007
20
1.8. Chancengleichheit: der Schlüssel zu Wirtschaftswachstum und sozialem Zusammenhalt
Die – wenn auch sehr vorläufige – Analyse, die im Bericht zur sozialen Lage 2007 vorgelegt wird, lässt darauf schlieβen, dass die Förderung der Chancengleichheit in der Europäischen Union erheblich zu einem stärkeren sozialen Zusammenhalt und einer besseren Wirtschaftsleistung beitragen könnte. Solange ein signifikanter Anteil der Bevölkerung sein Potenzial nicht voll entfalten kann, gibt es keinen Ausgleich zwischen Gleichheit und Effizienz. Der Bericht macht dies deutlich, indem er zeigt, dass Bildungsergebnisse nach wie vor entscheidend durch das Bildungsniveau der Eltern beeinflusst werden und dass vor allem Kinder mit Migrationshintergrund unter schwierigen sozialen Bedingungen aufwachsen. Der Bericht enthält nur eine sehr oberflächliche Analyse auf Basis der neuen EU-SILC-Erhebungsdaten, aber er zeigt, dass die Europäische Union und ihre Mitgliedstaaten nun über leistungsstarke analytische Instrumente verfügen, um größere Hindernisse für die Verwirklichung von mehr Chancengleichheit und damit für bessere Aussichten auf sozialen Zusammenhalt und Wachstum zu erkennen und zu beobachten.
21
INTRODUCTION ET RESUME FRANÇAIS
1. ÉVALUATION DU RÔLE DE L’ÉGALITÉ DES CHANCES DANS L’UE: VUE D’ENSEMBLE
Le Rapport sur la situation sociale 2007 présente des informations clés issues de l’EU-SILC (statistiques de l’Union européenne sur le revenu et les conditions de vie), le nouvel outil communautaire de suivi de la situation sociale et, à l’avenir, des tendances sociales. Le rapport examine la problématique des inégalités de revenus et leur lien avec les résultats économiques ainsi que la manière dont le segment des personnes disposant de faibles revenus se répartit dans l’ensemble de l’Union européenne. En mobilisant le potentiel inexploité des groupes défavorisés, la promotion de l’égalité des chances dans l’Union européenne pourrait sensiblement contribuer à améliorer tant la cohésion sociale que les performances économiques. Deux sections du présent rapport examinent notamment la transmission intergénérationnelle du handicap social ainsi que les risques de pauvreté des enfants issus de l'immigration et des minorités ethniques. Le rapport tente également d’identifier les principaux groupes à risque de pauvreté dans les différents États membres et de mettre en corrélation les faibles revenus et l’accès à divers biens et services de base. Le Rapport sur la situation sociale 2007 s’inscrit, par ailleurs, dans la thématique de l’Année européenne 2007, et s’intéresse ainsi de près à l’égalité des chances. Cependant, il n’utilise qu’une infime partie de la multitude de données produites par l’EU-SILC; la Commission invite donc la communauté des chercheurs à exploiter largement cette source de données.
Les données présentées dans le Rapport sur la situation sociale insistent une nouvelle fois sur la nécessité d’investir dans le capital humain. Cette nécessité a d’ailleurs récemment été mise en avant par la Commission européenne lors de sa participation à la réunion d’octobre des chefs d’État et de gouvernement sur le thème: Réussir le défi de la mondialisation21. La manière d'aborder les défis que présente l'égalité des chances est aussi un thème majeur de la consultation publique sur la « réalité sociale » de l’Europe22.
1.1. EU-SILC: nouvel outil pour le suivi de la situation sociale dans l’UE L’Union européenne s’est dotée d’un nouvel outil lui permettant de suivre efficacement la situation et les tendances sociales dans les États membres. Cet outil est ainsi au service de l'amélioration des politiques sociales, par le biais de la méthode ouverte de coordination.
Cela fait une cinquantaine d’années que des données comparables à l'échelon international sont recueillies afin de suivre la situation et les tendances économiques. En revanche, le développement de tels outil dans le domaine du suivi des conditions sociales n’en est encore qu’à ses balbutiements. Toutefois, au cours de ces dix dernières années, l’Union européenne a réalisé des avancées majeures dans la production de données comparables à l'échelon international pour le suivi social. Mené pour la première fois en 1994, le panel communautaire des ménages (PCM) a produit chaque année pendant une décennie des données sur les conditions sociales. Aujourd’hui, il est remplacé par l’EU-SILC (statistiques de l’Union européenne sur le revenu et les conditions de vie). Cette année, ce nouvel instrument fournit des données relatives à pratiquement tous les États membres. Désormais, l'Union européenne dispose grâce à l’EU-SILC d'un meilleur outil de suivi de la situation et des tendances sociales. Il utilise de plus grands échantillons, ce qui permet une analyse approfondie des caractéristiques des ménages les plus vulnérables. Le décalage entre la collecte de données et leur publication – trois ans, voire davantage dans le cas du PCM – a été réduit d’un an environ; toutefois, les données les plus récentes utilisées pour le présent rapport ont été recueillies en 2005 et se rapportent aux revenus de 200423. Ainsi, la disponibilité des données sociales continuera à accuser un retard considérable par rapport à la disponibilité des indicateurs économiques. Sans l'existence de données comparables à l’échelle internationale relatives à la situation sociale, comme celles issues du PCM et de l’EU-SILC, certaines avancées politiques majeures dans l’Union européenne n’auraient pu être possibles. Notons à cet égard le rôle clé de la méthode ouverte de coordination, un mécanisme reposant sur des objectifs et des indicateurs – fixés de commun accord par les États membres – pour le suivi des progrès dans le domaine de la protection sociale et de l’inclusion sociale. La plupart de ces indicateurs reposent sur l’existence d’enquêtes sur les revenus et sur les conditions de vie, harmonisées à l’échelon international, comme le PCM et l’EU-SILC24.
21 COM(2007) 581 final. 22 Voir http://ec.europa.eu/citizens_agenda/social_reality_stocktaking/index_fr.htm. 23 Pour le Royaume-Uni, la période de référence pour les revenus est 2005 tandis que pour l'Irlande, la période de
référence mobile des revenus s’étale sur 2004 et 2005. La composition des ménages, etc. reflète la période étudiée. Notons également que les données UE-SILC utilisées dans les portraits statistiques et leurs annexes ont été extraites plus tardivement que pour l’analyse de cette première partie du rapport. Il peut donc y avoir quelques incohérences entre ces deux parties.
24 Voir http://ec.europa.eu/employment_social/spsi/common_indicators_fr.htm pour la liste d’indicateurs la plus récente.
LA SITUATION SOCIALE DANS L’UNION EUROPEENNE EN 2007
22
1.2. Inégalités de revenus et performances économiques La répartition des revenus est plus égale au sein de l'UE qu'aux États-Unis. Dans le même temps, les bonnes performances économiques dans l’UE vont souvent de pair avec une plus grande égalité. Selon les données publiées par l’OCDE (voir section 2.1 du Rapport sur la situation sociale), les revenus sont répartis dans la plupart des États membres de manière bien plus égalitaire qu’aux États-Unis. Le degré d’inégalité de la répartition des revenus est mesuré le plus souvent à l’aide du coefficient de Gini25. Il est représenté par un nombre allant de 0 (égalité parfaite, tout le monde recevant une part égale du revenu total) à 100 (lorsque tous les revenus vont à un seul et unique individu). En 2000, les États-Unis affichaient un coefficient de Gini de 35.7. Sur la base des données de l’EU-SILC, et en intégrant l’ensemble de la population de l’UE-25, après des ajustements prenant en compte les différences de pouvoir d’achat entre les différents États membres, le coefficient de Gini pour l’UE-25 est estimé à environ 35.0. Ce coefficient est donc encore nettement inférieur à celui enregistré aux États-Unis, en dépit de différences importantes de PIB par habitant d’un État membre à l’autre. Les résultats de l’EU-SILC indiquent aussi que le Portugal est le seul pays de l’UE à afficher un coefficient de Gini supérieur à celui des États-Unis (38.0), alors qu’en Pologne, en Lettonie et en Lituanie, les niveaux d’inégalité sont semblables à celui des États-Unis. Une comparaison internationale des coefficients de Gini laisse également supposer qu’égalité et performance économique – mesurée sur la base du PIB par habitant – ne sont pas forcément incompatibles. De fait, si l’on met en parallèle les coefficients de Gini des pays de l’UE et des pays candidats d’un côté et leur PIB par habitant de l’autre, on remarque que les pays les plus développés sont généralement aussi les plus égalitaires. Même si ce constat ne signifie pas que la réduction des inégalités améliore les performances économiques, il montre bien qu’un faible coefficient d'inégalité peut également aller de pair avec un PIB élevé par habitant. Selon les théories économiques, taxer les riches en vue d'une redistribution des revenus aux pauvres pourrait réduire les performances économiques totales, en raison du poids mort que produit la taxation et de l’impact incitatif des transferts lié aux revenus. L’économiste Arthur Okun utilisait à ce sujet la métaphore du seau percé. Pour autant, une distribution relativement égale des revenus ne résulte pas nécessairement d'une seule redistribution à grande échelle. Elle peut être la conséquence d’une distribution plus restreinte des revenus du marché résultant d'une égalité des chances accrue qui permet aux citoyens de développer l’ensemble de leur potentiel productif et de générer ainsi des revenus. Mais pour cela, il faut que tout le monde ait des chances réelles d’accès à un enseignement, à des soins de santé et à des emplois de qualité. Une plus grande égalité de revenus résultant d’une l'amélioration dans l’égalité des chances n'entraîne pas les pertes d'efficacité parfois associées à la redistribution. Au contraire, la promotion de l’égalité des chances permet de stimuler la croissance en mobilisant des ressources jusqu'ici bloquées par la discrimination et l'exclusion sociale. L’analyse de la mobilité sociale proposée dans le Rapport sur la situation sociale laisse entendre qu'un pourcentage non négligeable de la population européenne ne développe pas tout son potentiel. Cette situation ralentit le développement économique de l’Europe et a pour conséquence le nombre trop élevé de personnes qui vivent en situation de pauvreté. Le rapport examine également l’évolution de l’inégalité depuis les années 1970. Aucune tendance commune ne peut être dégagée de l’ensemble des pays examinés; en effet, pour chaque sous-période de référence, certains pays ont vu les inégalités s'accentuer, tandis que pour d'autres ce phénomène s’estompait. Toutefois, du milieu des années 1980 jusqu’au milieu des années 1990, une nette majorité des pays a enregistré une hausse des inégalités, une tendance qui semble s’être quelque peu atténuée aujourd'hui. Une récente étude sur l'impact social de la mondialisation dans l'Union européenne26 a conclu à l’absence (quasi-totale) de lien de causalité entre le renforcement des inégalités de revenus et la mondialisation. Selon cette étude, ce phénomène serait plutôt directement lié à l'émergence de la société de la connaissance, qui entraînerait une augmentation du rendement du capital humain et creuserait davantage le fossé entre les personnes hautement qualifiées et compétentes, et celles qui ne disposent que de connaissances et de compétences de base.
25 Le coefficient de Gini se définit comme le rapport entre le pourcentage cumulatif de la population organisée selon le
niveau de revenus et le pourcentage cumulatif du revenu net total équivalent de la population. 26 Voir http://ec.europa.eu/employment_social/social_situation/docs/simglobe_fin_rep.pdf.
PARTIE 1 | L’ÉGALITÉ DES CHANCES AU SERVICE DE LA COHÉSION SOCIALE
23
1.3. Faibles revenus – une perspective européenne En 2004, environ 100 millions d’Européens (soit 22 % de la population totale) percevaient moins de 60 % du revenu médian européen, soit environ 8 000 euros par an pour une personne isolée ou 22 euros par jour (montants ajustés en tenant compte du pouvoir d’achat et de la taille du ménage; standard de pouvoir d’achat utilisé ci-dessous)27. D’autre part, environ 23,5 millions de personnes devaient se débrouiller avec moins de 10 euros par jour. Dans les nouveaux États membres, plus pauvres, la concentration de personnes à faibles revenus est plus élevée que la médiane européenne, cependant, une grande proportion des personnes disposants de faibles revenus se trouve également dans les pays plus riches de l’UE-15.
La méthode ouverte de coordination utilise essentiellement le concept de pauvreté relative, adopté par le Conseil européen en 1975, qui définit comme pauvres « les individus et les familles dont les ressources sont limitées au point de les exclure des conditions de vie minimales acceptables dans l’État membre dans lequel ils vivent ». Ce concept de pauvreté relative prend en compte le fait qu’il n’est pas suffisant de garantir à tous un accès à un niveau de subsistance minimal. L’objectif est également de faire en sorte que tous les citoyens puissent bénéficier, comme membre à part entière de la société, du niveau général de prospérité de leur pays. Le principal indicateur utilisé pour refléter ce concept est celui du taux de risque de pauvreté, défini comme étant le pourcentage d’individus dont le revenu disponible équivalent est inférieur à 60 % du revenu médian national. Le taux de risque de pauvreté est publié et analysé conjointement avec les seuils de risque de pauvreté dans chaque État membre qui, exprimés en standards de pouvoir d’achat, varient de 1 500–2 000 PPA environ (Roumanie, Bulgarie) à 10 000 PPA environ (Royaume-Uni, Allemagne, Danemark, Pays-Bas) par an. Le Rapport sur la situation sociale complète cette perspective nationale en y ajoutant une perspective européenne (section 2.3). Une des principales tâches de l’Union européenne est d’améliorer le niveau et la qualité de vie de tous les Européens et de promouvoir la cohésion économique et sociale ainsi que la solidarité entre les États membres. L’évaluation quant à la réalisation de ces objectifs se fait essentiellement sur la base du PIB par habitant. L’EU-SILC permet de mesurer le défi que représente la cohésion sociale, en portant son attention sur le nombre d’Européens dont les revenus sont inférieurs à la moyenne européenne, que ce soit en termes de pouvoir d’achat ou en valeur absolue. Le suivi de ces chiffres dans le temps permettrait de déterminer si tous les Européens bénéficient bien des progrès économiques induits par l’intégration européenne et favorisés par les fonds structurels européens ainsi que par des politiques sociales nationales appropriées. Par conséquent, ce suivi temporel compléterait celui du processus de convergence économique représenté par le PIB/habitant et comparé à la moyenne européenne, mais également le suivi de l’inclusion sociale au sein d’un État membre déterminé, concentré en particulier sur le nombre de personnes dont les revenus sont inférieurs à un certain pourcentage du revenu médian national28. Divers seuils communs, toujours exprimés en SPA afin de prendre en compte les différences de niveaux de prix au sein de l’UE, ont été sélectionnés avant d’évaluer les nombres absolus et les pourcentages de personnes dont les revenus sont inférieurs à ce seuil. Seuls vingt-quatre États membres ont pu être intégrés dans cette analyse (UE-27 à l’exception de Malte, de la Bulgarie et de la Roumanie). 22 % des Européens (un peu plus de 100 millions) ont un revenu équivalent29 inférieur à 60 % du revenu médian européen. 16 % (73,2 millions) perçoivent un revenu inférieur à la moitié du revenu médian et 11 % (48,8 millions) ont un revenu inférieur à 40 % de ce même revenu médian. Les niveaux de 60, 50 et 40 % du revenu médian européen correspondent à un revenu annuel disponible de 8 040 SPA, 6 700 SPA et 5 360 SPA pour une personne isolée, soit, de 22, 18 et un peu moins de 15 euros par jour. Le pourcentage de personnes dont le revenu n’atteint pas 60 % du revenu médian national – soit le taux de risque de pauvreté utilisé dans le cadre de la méthode ouverte de coordination – est de 16 %. L’EU-SILC peut également être utilisé dans l’estimation du pourcentage de la population européenne devant vivre avec un revenu extrêmement faible, de 10 euros par jour – soit 5 % (23,5 millions de personnes) – ou même de 5 euros par jour – soit 2 % (6,9 millions). Ces chiffres sont des estimations et sont donc à prendre avec circonspection (voir section 2.1 du Rapport sur la situation sociale). Les personnes dont les ressources financières sont limitées peuvent être en mesure de consommer des biens et des services produits de manière informelle au sein de leur ménage, ou de leur communauté locale, ce qui est généralement le cas dans les zones économiquement moins développées et plutôt rurales. Un niveau de revenus extrêmement faible peut être dû également résulter des pertes déclarées
27 Une unité de SPA permet d’acheter le même volume donné de biens et de services dans tous les pays, alors que des
montants différents en monnaie nationale sont nécessaires pour se procurer ce même volume de biens et de services, en fonction du niveau des prix. Les SPA sont obtenus en divisant leur valeur originale en unités de monnaie nationale par la parité de pouvoir d’achat respective (PPA), voir définition à la section 2.3 et au tableau 4.
28 Les données sur ces indicateurs sont publiées par la Commission, notamment dans le Rapport conjoint sur la protection sociale et l’inclusion sociale. http://ec.europa.eu/employment_social/spsi/joint_reports_fr.htm
29 Le revenu des ménages est ajusté (revenu équivalent) afin de traduire les différences de taille et de composition du ménage. En d’autres termes, le revenu total du ménage est divisé par le nombre de des membres du ménage, sur la base de l’échelle d’équivalence « OCDE modifiée ». Cette échelle attribue une pondération de 1,0 au premier adulte, de 0,5 à tout autre membre du ménage de 14 ans et plus et de 0,3 à chaque enfant. Le chiffre qui en résulte est attribué à chaque membre du ménage, adulte ou enfant.
LA SITUATION SOCIALE DANS L’UNION EUROPEENNE EN 2007
24
par les travailleurs indépendants. Les revenus financiers ne donnent ainsi qu’une idée très partielle des niveaux de vie et du risque d'exclusion sociale. Il va de soi que la plus haute concentration de personnes dont les revenus sont inférieurs à ces seuils peut être observée dans les États membres les plus pauvres. Plus des trois quarts de la population vivant en Estonie, en Lettonie, en Lituanie, en Hongrie, en Pologne et en Slovaquie ont un revenu inférieur à 60 % de la médiane européenne; la moitié, voire plus, des habitants de ces mêmes pays doit essayer de s’en sortir avec moins de 40 % du revenu médian européen (à l’exception de la Hongrie: 40 % ). Le pourcentage de personnes ne gagnant pas plus de 10 euros par jour avoisine les 40 % en Lettonie et en Lituanie et dépasse 25 % en Estonie et en Pologne. Dans quatre États membres, plus de cinq pour cent de la population ne touche pas plus de 5 euros par jour: l’Estonie (5 %), la Lettonie (9 %), la Lituanie (10 %) et la Pologne (7 %). Si ces revenus extrêmement faibles sont constatés en particulier dans les États membres les moins développés, un nombre sensible de personnes gagnant très mal leur vie vit également dans les anciens et plus riches États membres. 16 % des Européens dont le revenu est inférieur à 60 % de la médiane européenne vivent en Pologne, 13 % en Allemagne, 11 % en Espagne, 11 % en France, 12 % en Italie, mais seulement 8 % au Royaume-Uni. S'agissant des plus défavorisés (revenus inférieurs à 5 euros par jour), nous observons que 44 % d'entre eux vivent en Pologne, mais que près de 30 % vivent dans sept « anciens » États membres: l’Italie (8 % de tous les Européens percevant moins de 5 euros par jour), l’Espagne (7 %), le Portugal (4 %), l’Allemagne (4 %), le Royaume-Uni (3 %), la Grèce (2 %) et la France (2 %). À mesure que les nouveaux États membres rattrapent leur retard économique, la hausse des revenus, aussi bien en termes absolus que relativement à la moyenne de l'UE, devrait se traduire par une diminution rapide du nombre de personnes vivant avec de très faibles revenus. Si des groupes importants de population (les retraités ou les travailleurs peu qualifiés, par exemple) ne peuvent pas bénéficier de meilleures opportunités salariales et si les revenus de remplacement n’augmentent pas parallèlement aux salaires, ces progrès pourraient toutefois ne pas être automatiques. La méthode ouverte de coordination entend donc veiller à ce que la croissance économique se traduise par une diminution de l’exclusion sociale, mesurée par rapport au revenu médian national.
1.4. Qui sont les pauvres: les groupes les plus à risque dans les États membres Dans une majorité d’États membres, ce sont les couples avec un ou deux enfants où l’un des partenaires ne travaille pas (du moins pendant la majeure partie de l'année de référence) – le modèle du père subvenant aux besoins de la famille – qui constituent le principal segment de population à risque de pauvreté. Les parents isolés, s’ils sont exposés à un risque élevé de pauvreté, ne représentent un pourcentage important de la population à risque que dans les pays où ce type de ménage est répandu. Les politiques de lutte contre la pauvreté et pour la promotion de l’inclusion sociale doivent tenir compte à la fois des groupes qui représentent le plus important pourcentage de la population à risque et des groupes les plus exposés au risque de pauvreté, et ce de façon à associer au mieux politiques horizontales et politiques ciblées.
Le Rapport sur la situation sociale (section 2.4) examine ce risque de pauvreté pour diverses franges de la population et tente d’identifier dans chaque État membre les principaux sous-groupes constituant l’ensemble de cette population à risque. Pour les responsables politiques, il sera utile d’examiner à la fois les taux de risque de pauvreté spécifiques à un groupe, et le nombre total de personnes à risque de pauvreté au sein de ces différents groupes. Le premier chiffre indique les points faibles des stratégies de prévention de la pauvreté, tandis que le second est un bon moyen de déterminer à quel niveau des mesures doivent être prises afin de réduire au maximum les taux de risque de pauvreté.
La part de la population dont le revenu équivalent disponible est inférieur à 60 % de la médiane nationale est l’indicateur utilisé pour mesurer le risque de pauvreté. Cet indicateur est de 9 % pour la Suède, de 10 % pour la République tchèque et de 21 % pour la Lituanie et la Pologne. Le risque de pauvreté au sein des États membres varie considérablement d’une catégorie de la population à l’autre. Parallèlement à cela, le nombre de ceux qui sont exposés à un risque particulièrement élevé, varie également en fonction des pays.
Néanmoins, quatre groupes peuvent être identifiés dans pratiquement tous les pays, comme étant à risque élevé. Il s'agit des groupes suivants:
– les personnes en âge de travailler, qu’elles aient un emploi ou qu’elles soient au chômage, vivant seules avec un enfant dépendant et qui sont, dans la plus grande majorité des cas, des femmes;
– les personnes isolées de 65 ans et plus, n’exerçant plus d’emploi rémunéré et qui sont, dans la plupart des cas, là encore, des femmes, dont une partie importante n’a jamais travaillé avant ses 65 ans;
– les personnes en âge de travailler vivant seules et qui ne travaillent pas;
– les familles avec enfants dont un seul des deux parents travaille.
Ces groupes varient d’un pays à l'autre, non seulement en termes de risque de pauvreté, mais aussi en termes de nombres et de pourcentage de la population totale qu’elles représentent. Les parents isolés, plus particulièrement, sont bien plus nombreux dans certains pays que dans d’autres. Dans les pays où ces groupes constituent une proportion relativement faible de la population, ils ne représentent parfois qu’un pourcentage peu élevé de la population totale à risque de pauvreté, bien qu’ils soient confrontés, dans les
PARTIE 1 | L’ÉGALITÉ DES CHANCES AU SERVICE DE LA COHÉSION SOCIALE
25
faits, à un risque important de pauvreté. De la même façon, une frange de la population confrontée à un risque nettement plus faible de pauvreté pourra en revanche représenter un pourcentage relativement élevé du total, simplement en raison de son importance numérique. Dans 14 des 24 États membres dont les données ont été analysées, les couples avec un ou deux enfants et dont un des deux adultes ne travaille pas (du moins au cours de l'année de référence) représentent le principal segment à risque de pauvreté. Tous les nouveaux États membres, à l’exception de l’Estonie et de Chypre, font partie de ce groupe de 14 pays. Dans trois autres pays, ce type de ménage représente le deuxième groupe par ordre d’importance. Dans deux autres pays, la Belgique et l’Irlande, les couples avec trois enfants ou plus dont un des deux parents ne travaille pas constituent le premier groupe à risque de pauvreté. Dans les autres pays, les personnes vivant seules représentent le groupe de personnes le plus large dont les revenus sont inférieurs au seuil du risque de pauvreté. C’est le cas du Danemark, de la Finlande, de la Suède et de l’Estonie, où les personnes en âge de travailler vivant seules constituent l'un des principaux sous-groupes à risque de pauvreté, notamment si elles n’ont pas travaillé au cours de l'année de référence. Les parents isolés constituent, eux-aussi, l’un des principaux groupes de revenus inférieurs au seuil de pauvreté dans ces quatre pays, comme c'est le cas en Allemagne et au Royaume-Uni. En outre, au Danemark, en Estonie, en Finlande, en Suède, au Royaume-Uni et à Chypre, les personnes âgées de 65 ans et plus comptent parmi les principaux groupes à risque, qu'il s'agisse de couples ou de femmes isolées. C’est également le cas en Grèce, en Italie, au Portugal et en Slovénie. Cette diversité au sein de l’UE met en évidence les différences entre les États membres et la manière dont les politiques devraient être mises au point de façon à réduire le plus possible le nombre de personnes à risque de pauvreté.
1.5. Faibles revenus et niveaux de vie dans l’UE Les faibles revenus se traduisent par des possibilités de consommation réduites et des difficultés financières accrues. Toutefois, tous les ménages vivant sous le seuil du risque de pauvreté ne doivent pas se priver des biens et des services essentiels, et tous n’éprouvent pas de difficulté à joindre les deux bouts. Le pourcentage élevé de personnes indiquant ne pas avoir les moyens de prendre un repas convenable un jour sur deux dans les nouveaux États membres (plus de 15 % de la population de six États membres, soit trois fois plus que dans l’UE-15), illustre les disparités majeures qui subsistent dans l’UE. Cela souligne la nécessité de compléter les mesures de lutte contre la pauvreté fondée sur les revenus relatifs, par des indicateurs de privation matérielle. Néanmoins, même dans certains pays de l’UE-15, le pourcentage de personnes qui ne peuvent pas se nourrir correctement est préoccupant, plus particulièrement compte tenu de la hausse des prix des produits alimentaires. Une attention particulière doit être accordée aux conséquences à plus long terme des faibles revenus, notamment en ce qui concerne les chances de réussite des enfants issus de familles pauvres et les risques accrus de santé précaire et de mortalité observés chez les personnes à faible statut socio-économique. Les revenus sont un moyen de parvenir à ses fins: ils sont indispensables pour se procurer les biens et les services nécessaires pour subsister, mais également pour mener une vie qui donne le sentiment de faire partie intégrante de sa communauté. Le Rapport sur la situation sociale (section 2.5) examine le lien entre les revenus et l’accès à ces besoins essentiels. L’EU-SILC traite de domaines tels que le logement, les difficultés financières (le paiement des traites ou du loyer ou encore celui des factures d’eau, de gaz, d’électricité, par exemple) et la possibilité de s’offrir un éventail de biens et de services. Il est évident que les personnes vivant sous le seuil du risque de pauvreté sont, de manière significative, plus mal loties que celles dont les revenus dépassent ce même seuil. Dans tous les pays, les personnes à risque de pauvreté ont généralement plus de mal à joindre les deux bouts – par définition ou presque – mais il existe toutefois des différences importantes d'un État membre à l’autre. Tandis que dans la plupart des pays de l’UE-15, les personnes vivant dans des ménages à faibles revenus ne font pas état de difficultés majeures liées, par exemple, au remboursement des hypothèques, au paiement du loyer ou des factures des services d'intérêt général (sans doute grâce aux subventions disponibles relatives au loyer ou à l’énergie), dans les nouveaux États membres, de nombreuses personnes déclarent ne pas pouvoir se payer des choses considérées comme acquises dans les anciens États membres, même lorsqu’elles vivent au-dessus du seuil à risque. Les données EU-SILC permettent une analyse plus approfondie que celle présentée dans le Rapport sur la situation sociale. Le fait qu'un ménage à faibles revenus ne fasse pas état de problème de logement précaire ou qu'il puisse s’offrir un bien de consommation en particulier ne signifie nullement qu'il ne rencontre pas de problèmes dans d'autres domaines. Il convient de brosser un tableau plus complet de la privation matérielle, à partir d’une analyse montrant le nombre de personnes confrontées à une ou plusieurs difficultés financières mesurées par l'EU-SILC. La dimension temporelle du risque de pauvreté doit également être prise en compte. Une situation de faible revenu peut être passagère (c’est le cas, par exemple, de certains étudiants, jeunes adultes en début de vie professionnelle ou travailleurs indépendants confrontés à des difficultés temporaires). L’EU-SILC inclut une dimension de panel afin qu’il soit possible, au terme de plusieurs séries d’enquête, d’évaluer dans quelle
LA SITUATION SOCIALE DANS L’UNION EUROPEENNE EN 2007
26
mesure les situations de faible revenu persistent et de déterminer les chances de s’en sortir. Il existe aussi une dimension temporelle couvrant plusieurs générations: les enfants qui grandissent dans des ménages à risque de pauvreté sont plus susceptibles de vivre eux-mêmes dans ce type de foyer, une fois adulte, que ceux issus de familles plus aisées. Cette question est examinée dans le présent rapport sur la base d’un module EU-SILC spécial (voir ci-dessous). En outre, le niveau de revenus et le statut socio-économique sont étroitement liés à la santé et à l'espérance de vie. Selon des données existantes, les individus à faible statut économique et faibles revenus meurent généralement plus jeunes et souffrent davantage de problèmes de santé que les groupes socio-économiques plus favorisés. Ce phénomène s'explique par une exposition accrue à des facteurs de risque physique, psycho-social et comportemental durant toutes les phases du cycle de vie. À l'heure actuelle, nous ne disposons pas d’indicateurs comparables à l’échelon européen permettant de suivre ces inégalités dans le domaine de la santé, mais elles n'en représentent pas moins un défi majeur en matière de santé publique et d'exclusion sociale. Le développement d’indicateurs, notamment celui de l’espérance de vie en fonction du statut socio-économique, devrait donc être une priorité.
1.6. Transmission intergénérationnelle des handicaps sociaux Les données issues d’enquêtes montrent que le bagage éducatif et professionnel de nos parents est un déterminant majeur de notre propre réussite, malgré une amélioration de l’accès à l’enseignement supérieur pour les jeunes. Cette transmission intergénérationnelle des handicaps sociaux semble indiquer que de nombreux jeunes ne sont pas en mesure de développer leur potentiel. L’économie européenne est ainsi privée du type de travailleur hautement qualifié dont elle aura de plus en plus besoin dans notre société de la connaissance et dans le contexte du vieillissement démographique. Il existe d’importantes différences entre États membres, ce qui laisse supposer que les systèmes éducatifs et l'acquisition des connaissances peuvent encore être sensiblement améliorés. Le Rapport sur la situation sociale présente une première analyse des résultats issus d’un module spécial de l’enquête EU-SILC axé sur la transmission intergénérationnelle des handicaps sociaux (section 3.1). Dans le cadre de ce module, les individus ont été interrogés sur le statut social de leurs parents à l’époque où ils étaient âgés de 12 à 16 ans. Le rapport examine également les corrélations entre le niveau d'études des parents et des enfants, ainsi qu’au sein des principales catégories professionnelles. Dans notre société de la connaissance, un niveau élevé de performance économique et un niveau de vie satisfaisant ne peuvent être assurés que si un pourcentage croissant de la population a accès à l'enseignement supérieur. À cet égard, l’origine sociale ne devrait pas être un obstacle. Pourtant, les données collectées par le biais du module spécial de l’EU-SILC montrent que les personnes dont le père a atteint le niveau de l’enseignement supérieur ont bien plus de chances de suivre sa trace que celles dont le père ne dispose que d’un niveau d’études peu ou moyennement élevé: un peu plus de deux fois plus de chances en Allemagne, en Finlande et au Royaume-Uni et jusqu’à neuf fois plus de chances en Hongrie, en Pologne et en République tchèque. Par ailleurs, le niveau d’études des femmes semble être davantage influencé par le niveau d’études du père que celui des hommes. De toute évidence, le fait d’être issu d’un milieu peu instruit est un obstacle majeur à la poursuite d'études supérieures, en particulier pour les filles. Dans la majorité des États membres, ce handicap social semble avoir diminué; en effet, chez les personnes interrogées âgées de 25 à 34 ans, le niveau d’études du père détermine encore fortement leurs propres chances d’accéder à un certain niveau d’études, mais moins que pour les classes d’âge de 35–44 ans et de 45–54 ans. Cette amélioration est toutefois moins marquée dans certains pays où le niveau d’études du père s’avère être un facteur majeur du niveau de réussite scolaire des enfants. Les résultats issus du module EU-SILC semblent également indiquer que l’accès aux catégories professionnelles supérieures (cadres, professions libérales ou techniciens) est plus aisé pour les enfants dont le père exerce ce type de profession que pour les enfants issus de catégories professionnelles inférieures. La catégorie des directeurs, membres de professions libérales et techniciens représente entre un quart (Portugal, Espagne) et un peu plus de la moitié de la main-d’œuvre (Pays-Bas, Allemagne). Cette catégorie professionnelle joue un rôle déterminant pour ce qui est des performances économiques de notre société de la connaissance. Toutefois, les données laissent entendre que le milieu familial peut être un obstacle important à l’accès à ces catégories professionnelles clés: les enfants dont le père appartient à une catégorie professionnelle moins élevée, ont, en moyenne pour l'UE, deux fois moins de chances d'accéder à cette-même catégorie professionnelle clé que les enfants de directeurs, membres de professions libérales et techniciens, et seulement une chance sur trois au Portugal. Le module EU-SILC sur la transmission intergénérationnelle des handicaps sociaux fournit des preuves tangibles du fait que l’inégalité des chances est un problème majeur. Celle-ci empêche les personnes issues de familles défavorisées de développer leur potentiel et d'atteindre un niveau de vie plus élevé pour eux et pour leurs enfants. Elle prive les marchés du travail européen de travailleurs hautement qualifiés de plus en plus demandés dans notre société de la connaissance et dans le contexte du vieillissement démographique.

PARTIE 1 | L’ÉGALITÉ DES CHANCES AU SERVICE DE LA COHÉSION SOCIALE
27
1.7. Enfants issus de l’immigration et égalité des chances Les enfants issus de l’immigration courent un risque plus élevé de pauvreté que les enfants issus de parents nés dans le pays où ils résident. Cette situation peut s’expliquer par une plus faible participation à l’emploi des parents d’origine étrangère et par les faibles revenus qui vont de pair avec les emplois moins qualifiés. Les établissements scolaires ne réussissent pas à aider les enfants d’origine immigrée à surmonter ces handicaps sociaux: l’étude PISA de l’OCDE met en évidence les notes nettement moins bonnes des enfants d’origine étrangère en mathématiques, malgré leur forte motivation. La lutte contre la pauvreté des enfants est aujourd’hui une grande priorité: son succès dépendra de l’attention portée à la situation des enfants issus de l’immigration ou de minorités ethniques. Les enfants d’origine immigrée ou issus de minorités ethniques sont confrontés à de multiples handicaps sociaux: une grande proportion d’entre eux grandissent dans des ménages à faibles revenus et moins instruits. Les différences linguistiques et culturelles constituent des obstacles supplémentaires à l’accès à l’ensemble des opportunités offertes par le pays d’accueil. Surmonter ces obstacles devient un défi majeur, au moment où les États membres voient leur population se diversifier, suite aux flux migratoires importants vers plusieurs pays de l'UE. D’après le recensement de 2000/2001, sept pour cent des habitants de l’UE sont nés en dehors du pays où ils résident actuellement, un pourcentage qui devrait avoir sensiblement augmenté depuis. La composition de la population d’origine étrangère diffère beaucoup d’un État membre à l’autre, tandis que, dans de nombreux États membres, la moitié ou plus des résidents d’origine étrangère sont issus de trois ou quatre pays seulement.
Le Rapport sur la situation sociale examine en particulier les enfants à risque de pauvreté (section 3.2) dans les ménages immigrés, ces derniers étant définis comme des ménages où les deux parents sont nés en dehors de l’UE. Selon les estimations, 5,5 % des enfants de moins de 16 ans habitant dans l’Union européenne, soit plus de 4 millions d’enfants, vivent dans de telles familles. 40 % des enfants n’étant pas issus de l’immigration européenne vivent dans un ménage confronté à un risque de pauvreté (revenu équivalent inférieur à 60 % de la médiane), contre 18 % des enfants dont les parents sont nés dans le pays où ils résident. Le pourcentage d’enfants immigrés vivant dans des ménages en-dessous du seuil du risque de pauvreté dépasse 50 % en Belgique, en Espagne, au Luxembourg et aux Pays-Bas. Ce risque accru de pauvreté est lié à l’emploi: dans les ménages immigrés, les parents travaillent moins souvent à temps plein que les parents nés dans le pays de résidence. De plus, il est probable qu’un pourcentage plus élevé de parents nés en dehors de l’UE exerce des emplois moins qualifiés et moins bien rémunérés. Les handicaps sociaux vécus par les enfants immigrés dans leur famille se répercutent également sur leurs résultats scolaires. L’étude PISA de l’OCDE a comparé les résultats en mathématiques d’étudiants natifs (ayant au moins un parent né dans le pays) avec ceux d’étudiants immigrés de la première et de la seconde génération (étudiants nés en dehors du pays résidant, et ceux nés dans ce pays mais de parents étrangers)30
. Malgré leur forte motivation, les résultats des étudiants d’origine immigrée sont nettement inférieurs à ceux des étudiants natifs dans la plupart des pays de l’OCDE participant à l’étude.
1.8. Égalité des chances: la clé de la croissance économique et de la cohésion sociale L’analyse présentée dans le Rapport sur la situation sociale 2007, bien qu’encore très préliminaire, indique que la promotion de l’égalité des chances dans l’Union européenne pourrait contribuer de manière significative à l’amélioration de la cohésion sociale et des performances économiques. Aussi longtemps qu’un pourcentage important de la population ne sera pas en mesure de développer tout son potentiel, l’égalité et l’efficacité ne pourront aller de pair. Ce rapport illustre ce constat en montrant que les niveaux d’études sont encore déterminés par le niveau d’instruction des parents, et en démontrant que les enfants issus de l’immigration, en particulier, grandissent dans des conditions sociales difficiles. Le rapport ne présente qu’une analyse très superficielle basée sur une nouvelle série de données de l’EU-SILC disponible aujourd’hui, mais montre que l’Union européenne et ses États membres ont d’ores et déjà de précieux outils d’analyse à leur disposition pour identifier et suivre les obstacles majeurs à la réalisation de l’égalité des chances, et pour améliorer les perspectives de cohésion sociale et de croissance.
30 Voir Education at a glance 2007, OCDE.

PART 1 | SOCIAL COHESION THROUGH EQUAL OPPORTUNITIES
29
MAIN REPORT
2. INCOME DISTRIBUTION AND POVERTY RISKS IN THE EU This chapter presents some key findings from the EU’s new tool for monitoring the social situation and, in the future, social trends, namely the EU-SILC (Statistics on Income and Living Conditions). It looks at income inequality and how this is related to economic performance and at the distribution of people on low incomes across the EU as a whole. It also tries to identify the largest groups at risk of poverty in the different Member States and the extent to which low incomes are linked to access to various essential goods and services. The results presented here only scratch the surface of the wealth of data produced by EU-SILC, and the research community will be able to make extensive use of this data source.
2.1. EU-SILC: The new tool for monitoring the social situation in the EU Internationally comparable data for monitoring the economic situation and trends have been collected for about half a century. By contrast, equivalent tools for monitoring social conditions are still in their infancy. Over the past decade, the European Union has achieved major progress in terms of producing internationally comparable data for social monitoring. The European Community Household Panel survey (ECHP) was first carried out in 1994 and produced annual data on social conditions for a decade. The ECHP has now been replaced by a new instrument, EU-SILC (Statistics on Income and Living Conditions), from which this year data for almost all Member States have become available.
With EU-SILC, the European Union has a much improved tool for monitoring the social situation and trends. It uses larger samples, allowing more detailed analysis of the most vulnerable households. The time lag between the collection of data and their publication — three years or more in the case of the ECHP — has been reduced by about one year; nevertheless the most recent data used for this report were collected in 2005 and refer to incomes in 2004. So the availability of social data will continue to lag considerably behind that of key economic indicators.
Without internationally comparable data on the social situation as produced by the ECHP and EU-SILC, key policy developments in the European Union would not have been possible. A major breakthrough in this regard has been the Open Method of Coordination, in which Member States agreed on common objectives and indicators for monitoring progress towards these objectives in the field of social protection and social inclusion. Most of these indicators rely on the existence of internationally harmonised surveys on incomes and living conditions such as the ECHP and EU-SILC31.
EU-SILC was introduced in 2003 to replace the European Community Household Panel (ECHP) and now covers all EU Member States32, with the exception of Bulgaria and Romania (where it was implemented in 2006). As its name implies, it is the primary source of data across the EU on household income and living conditions. It was designed to overcome the limitations of the ECHP (See Box 2 for details) and to cover the new Member States. It was also intended to conform to internationally agreed definitions of income. At the same time, the general approach of surveying a representative sample of households each year and asking all members of the household aged 16 and over relatively detailed questions remained the same. However, because of some simplification in the questionnaire and in the procedures, the delay in the results of the survey becoming available has been reduced to less than two years.
To ensure compatibility between countries, the survey is based on a common framework with a common set of sampling variables, guidelines and procedures — as regards imputation in particular — as well as common concepts and definitions. In six Member States (the three Nordic countries plus Ireland, the Netherlands and Slovenia), data from administrative registers are used to supplement, or to replace, survey data for items, income especially, for which they are considered to be more reliable.
The EU-SILC provides both cross-sectional and longitudinal data from the same sample; a proportion of those surveyed remains the same for two, three or four consecutives waves. More specifically, a quarter of the households surveyed in 2004 are, therefore, followed up for four years (up to 2007), a quarter for three years and a quarter for two years, while the remaining quarter is surveyed only once. Those who drop out are replaced by others on a rotational basis. The fact that three-quarters of the sample are the same from one year to the next should ensure a relatively high degree of consistency over time in the data collected, while respondents dropping out will tend to be less of a problem.
The countries covered and data collected
The EU-SILC was launched on a trial basis in 2003 in six Member States (Belgium, Denmark, Ireland, Greece Luxembourg, and Austria) as well as Norway. In 2004, it was extended to seven more Member States
31 See http://ec.europa.eu/employment_social/social_inclusion/indicators_en.htm for the latest list of indicators. 32 In practice Malta is not covered either because of missing values.
THE SOCIAL SITUATION IN THE EUROPEAN UNION 2007
30
(Estonia, Spain, France, Italy, Portugal, Finland and Sweden) and, in 2005, to the rest of the EU-25 countries as well as Iceland. In 2006, surveys were conducted in Bulgaria and Romania as well as Turkey.
The data included in the EU-SILC are much the same as in the ECHP, though with some streamlining. In particular, there is less of an overlap with the EU Labour Force Survey than was the case with the ECHP. While much of the focus is on household income, other household, personal and non-monetary information is collected as well, reflecting the multidimensional nature of social exclusion. The areas covered include:
• housing conditions, the state of accommodation as well as the size and composition of the household, tenure status and the cost of rent or mortgage payments;
• material deprivation, in terms of ability to afford certain goods and services and to avoid financial strain;
• employment characteristics, in particular whether or not in work, the nature of the job held, hours of work and employment status each month over the past year, as well as the work intensity of the household (i.e. how many people are in work relative to the potential number);
• health status, the presence of any long-term diseases, and access to health care;
• education, in terms of the highest level of education attained and summary details of current participation in education (but no details of participation in continuing training, or lifelong learning)
• the use of childcare, in terms of the hours of care in particular facilities or in informal arrangements (this is the first time such questions have been included in a regular household survey).
The definition of income used in the survey follows recommended international standards (specifically those recommended by the Canberra Group of experts33), which makes it somewhat different from that adopted in the ECHP, but not radically so. The main differences are that it includes in income the imputed rent of owner-occupied housing, goods produced for own consumption, employer’s social insurance contributions and non-monetary benefits received by employees (see Box 1). In addition, mortgage interest payments are deducted from gross income (as a corollary of including imputed rent). The inclusion of these items, apart from non-monetary benefits received by employees, is being deferred until 2007, though.
Box 1: Definition of household income in the EU-SILC
The gross income of households is defined as the sum of: – cash or near-cash income of employees – non-cash income of employees (such as a company car or luncheon vouchers) – employer’s social insurance contributions (from 2007) – income or losses from self-employment – value of goods produced for own consumption (from 2007) – social benefits of various kinds, including family or child allowances and housing benefits – imputed rent (from 2007) – income from rents – cash transfers received from other households – interest and dividends received, plus profits from unincorporated businesses less – interest paid on mortgages (from 2007) – Household disposable income is defined as gross income minus: – employer’s social insurance contributions – regular taxes on wealth – regular cash transfers paid to other households – taxes on income and social insurance contributions
The sample size
A major advantage of the EU-SILC over the ECHP is the large sample of households — and individuals covered — which should enable more detailed analysis to be carried out. In most countries the sample is 2-3 times larger than for the ECHP. On the other hand, there are still major differences between countries in the number of households and individuals surveyed relative to total population (See Table 1). This does not just reflect the fact that the population surveyed in smaller countries needs to represent a larger share of the total population to guarantee sufficient sample sizes. The sample in the Czech Republic, for instance, is only just over half that in Hungary, which has a similar population; the sample for the UK is only a third the size of that in Italy. The reliability of some results may therefore differ somewhat across countries.
33 The 'Canberra Group' was organised following an initiative of the Australian Bureau of Statistics and owes its name to
the first meeting held in Canberra in 1996. This International Expert Group on Household Income Statistics works on developing statistics on household economic well-being and particularly on household income. Its primary objective was to enhance national household income statistics by developing standards on conceptual and practical issues related to the production of income distribution statistics. http://www.lisproject.org/links/canberra/canberragroup.htm
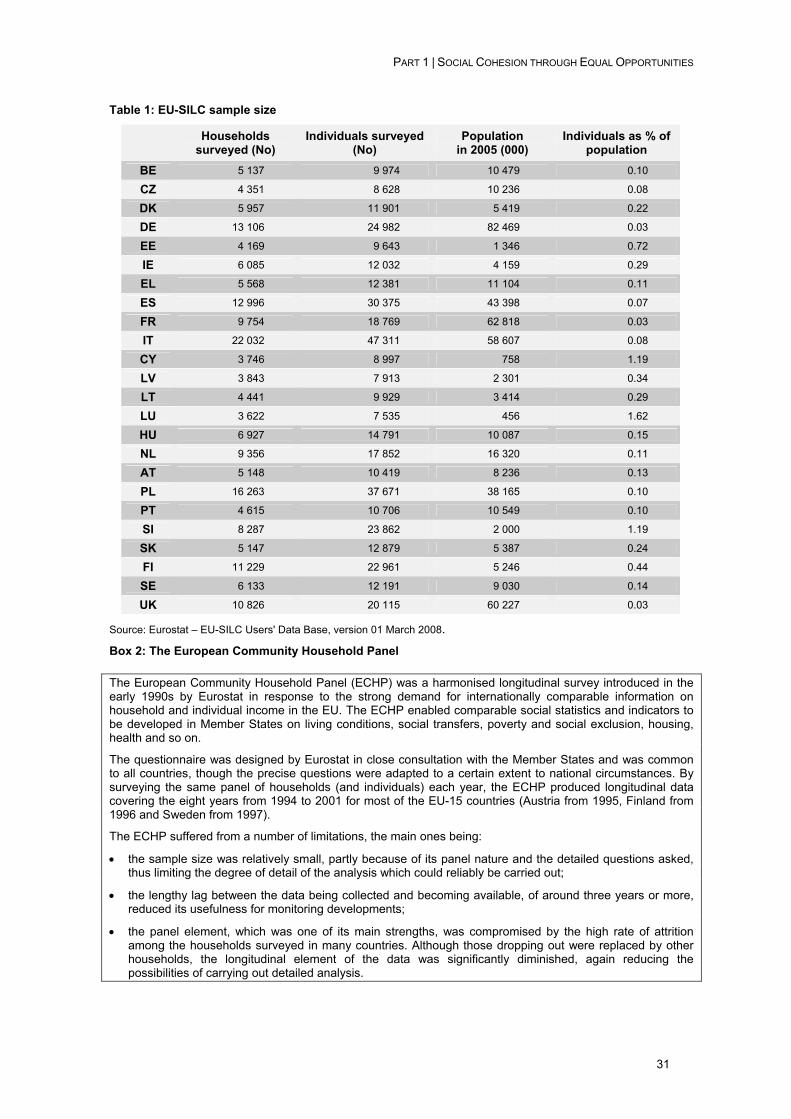
PART 1 | SOCIAL COHESION THROUGH EQUAL OPPORTUNITIES
31
Table 1: EU-SILC sample size
Households surveyed (No)
Individuals surveyed (No)
Population in 2005 (000)
Individuals as % of population
BE 5 137 9 974 10 479 0.10
CZ 4 351 8 628 10 236 0.08
DK 5 957 11 901 5 419 0.22
DE 13 106 24 982 82 469 0.03
EE 4 169 9 643 1 346 0.72
IE 6 085 12 032 4 159 0.29
EL 5 568 12 381 11 104 0.11
ES 12 996 30 375 43 398 0.07
FR 9 754 18 769 62 818 0.03
IT 22 032 47 311 58 607 0.08
CY 3 746 8 997 758 1.19
LV 3 843 7 913 2 301 0.34
LT 4 441 9 929 3 414 0.29
LU 3 622 7 535 456 1.62
HU 6 927 14 791 10 087 0.15
NL 9 356 17 852 16 320 0.11
AT 5 148 10 419 8 236 0.13
PL 16 263 37 671 38 165 0.10
PT 4 615 10 706 10 549 0.10
SI 8 287 23 862 2 000 1.19
SK 5 147 12 879 5 387 0.24
FI 11 229 22 961 5 246 0.44
SE 6 133 12 191 9 030 0.14
UK 10 826 20 115 60 227 0.03
Source: Eurostat – EU-SILC Users' Data Base, version 01 March 2008.
Box 2: The European Community Household Panel
The European Community Household Panel (ECHP) was a harmonised longitudinal survey introduced in the early 1990s by Eurostat in response to the strong demand for internationally comparable information on household and individual income in the EU. The ECHP enabled comparable social statistics and indicators to be developed in Member States on living conditions, social transfers, poverty and social exclusion, housing, health and so on.
The questionnaire was designed by Eurostat in close consultation with the Member States and was common to all countries, though the precise questions were adapted to a certain extent to national circumstances. By surveying the same panel of households (and individuals) each year, the ECHP produced longitudinal data covering the eight years from 1994 to 2001 for most of the EU-15 countries (Austria from 1995, Finland from 1996 and Sweden from 1997).
The ECHP suffered from a number of limitations, the main ones being:
• the sample size was relatively small, partly because of its panel nature and the detailed questions asked, thus limiting the degree of detail of the analysis which could reliably be carried out;
• the lengthy lag between the data being collected and becoming available, of around three years or more, reduced its usefulness for monitoring developments;
• the panel element, which was one of its main strengths, was compromised by the high rate of attrition among the households surveyed in many countries. Although those dropping out were replaced by other households, the longitudinal element of the data was significantly diminished, again reducing the possibilities of carrying out detailed analysis.
THE SOCIAL SITUATION IN THE EUROPEAN UNION 2007
32
2.2. Income inequality and economic performance There is an ongoing debate among economists about the nature of the relationship between inequality in income distribution and economic performance. While some point to the likelihood of a trade-off between economic growth and the pursuit of a more egalitarian society, largely because of the adverse effect on incentives of the taxes, benefits and other measures required to achieve a more equitable distribution of income, others highlight the potential gains for economic performance that a more cohesive society might bring.
The idea of a trade-off stems from the fact that taxing the rich to redistribute income to the poor could, according to economic theory, reduce aggregate economic performance due to deadweight losses associated with the taxation and incentive effects of income-related transfer payments. Economist Arthur Okun used the metaphor of a leaky bucket.
However, a relatively equal distribution of incomes need not be the result of large-scale redistribution alone. It may result from a more narrow distribution of market incomes as people have more equal opportunities to develop their full productive potential and contribute to the generation of income. This requires good chances for all to access high-quality education, health care and jobs. Greater equality resulting from more equal opportunities does not necessarily entail the efficiency losses potentially associated with redistribution if the corresponding policy is well-targeted and the associated financial burden is limited. On the contrary, promoting equal opportunities can make it possible to boost growth by mobilising resources that could not be deployed previously due to discrimination and social exclusion.
The nature of the relationship between inequality and economic performance in practice is of importance for policy across the EU, given that achieving a high level of social protection and securing greater social cohesion are major objectives of the European Union, along with attaining sustained economic growth by maintaining and strengthening competitiveness. If indeed there is trade-off between equity and efficiency, then the implication is that choices have to be made regarding the weight attached to each. If, on the other hand, a more equal distribution of income is not only compatible with improvements in economic performance but might even help to achieve them, then the pursuit of social objectives can play a dual role in both reducing inequalities and strengthening competitiveness.
The concern in this section is threefold. It is, first, to examine the distribution of income in EU Member States using data from the new EU-SILC (which for the first time enable a comparison to be made across all 25 countries on a consistent basis), and at the same time, to compare this with the distribution in the US. Secondly, it is to relate the distribution of income in Member States to GDP per head, which is commonly used as a measure of economic performance. Thirdly, it is to examine trends in income distribution over the long term, to see whether the distribution has tended to become more or less equal over time.
Income inequality in EU Member States in 2004
Data from the EU-SILC allow the distribution of income in all, or almost all, of the EU Member States to be assessed on a comparable basis for the first time34. The data, collected in 2005, relate to the income of households in 2004 and cover all the present EU Member States apart from Bulgaria and Romania.
34 For the 1990s, the European Community Household Panel provided a reasonably comparable basis for assessing
differences in income distribution across the EU, but this was confined to the EU-15 countries.
PART 1 | SOCIAL COHESION THROUGH EQUAL OPPORTUNITIES
33
Box 3 Technical issues
The measurement of equivalised income
Income is defined to exclude taxes and social contributions and to include social transfers, so as to measure disposable purchasing power, and is adjusted for differences in household size and composition. More specifically, to take account of economies in collective expenditure, a weight of one is assigned to the first adult in a household, 0.5 to the second and each subsequent adult and 0.3 to each child under 16, which corresponds to what is known as the modified OECD equivalence scale. The income thus adjusted or equivalised is then assumed to be divided equally between household members in order to measure the distribution of income between individuals in each country rather than between households.
Non-positive income values — which result from the way that the income of the self-employed is defined, i.e. essentially in terms of net trading profits — are excluded from the analysis. To adjust for the problem of ‘outliers’, or extreme levels of income reported at either end of the distribution, which involve a high degree of uncertainty but which can unduly affect the results of the analysis, income values at the bottom of the ranking of less than the 0.1 percentile were replaced by the value of the 0.1 percentile, while at the top of the ranking, values greater than the 99.95 percentile were replaced by the value of the latter.
Standard errors of estimates
To compare income distribution across countries on a meaningful basis, it is important to take account of the margin of error arising from data being compared on a sample of households rather than the whole population. This is done by calculating the standard error of the estimates and estimating confidence intervals around this in order to identify the range within which the value of the inequality indicator is likely to lie35. In other words, any comparison of income inequality between countries needs to be carried out in terms of these ranges instead of ‘point’ estimates. If the ranges for two countries overlap, then it is not possible to conclude with sufficient confidence that one country has a more unequal distribution of income than the other.
Three commonly employed indicators are used below to measure inequality. The first is the Gini coefficient or index (as used in Figure 1 below), which measures the extent to which the distribution of income diverges from a situation where everyone has the same level of income — the higher the value of the index, the more unequally is income distributed36.
The second is the S80/S20 index, which is the ratio of the share in total income of the 20 % of people with the highest incomes (the top quintile) to the share of the 20 % with the lowest incomes (the bottom quintile). Whereas the Gini index summarises the distribution of income across the whole range, the S80/S20 index focuses on the top and bottom of the ranges. A third indicator, the P90/P10 index, the ratio of the 90th percentile of the income distribution to the 10th, is similar in that it measures the median income of the top 20 % (i.e. the income of the person ranked at the midpoint of this group, with 10 % of the population having income higher than this and 90 % lower). The S80/S20 index will tend to be higher than the P90/P10 index, the larger the share of income going to the top 10 %, i.e. the richest people in the country, and the smaller the share going to the bottom 10 %.
According to the Gini index, Portugal has the highest degree of inequality of income distribution, with a value of 38 % (Figure 1, which also shows the 95 % confidence intervals around the estimate, implying that there is a 95 % probability that the true value of the index lies within this range — see Box 3). The new Member States of Lithuania, Latvia and Poland form a second group of countries with Gini coefficients of around 35-36 %, while a third group, with indices of between 30 % and 35 %, is composed of the other three Southern European countries of Spain, Greece and Italy, the UK and Ireland, and Estonia. These countries have Gini indices above 30 % but below 35 %. The four Southern European countries, the three Baltic States, Poland, Ireland and the UK, therefore, have the highest levels of inequality in the EU.
35 The ‘bootstrap’ simulation method is used here to estimate the standard error. 36 Formally, the Gini index is measured as (1/2n((n — 1))Σi=1,…,nΣj=1,…,n|yi – yj|, where yi are individual incomes, n is sample
size. The index varies between a value of zero, when everyone has the same level of income, and 1 when a single individual has all the income.
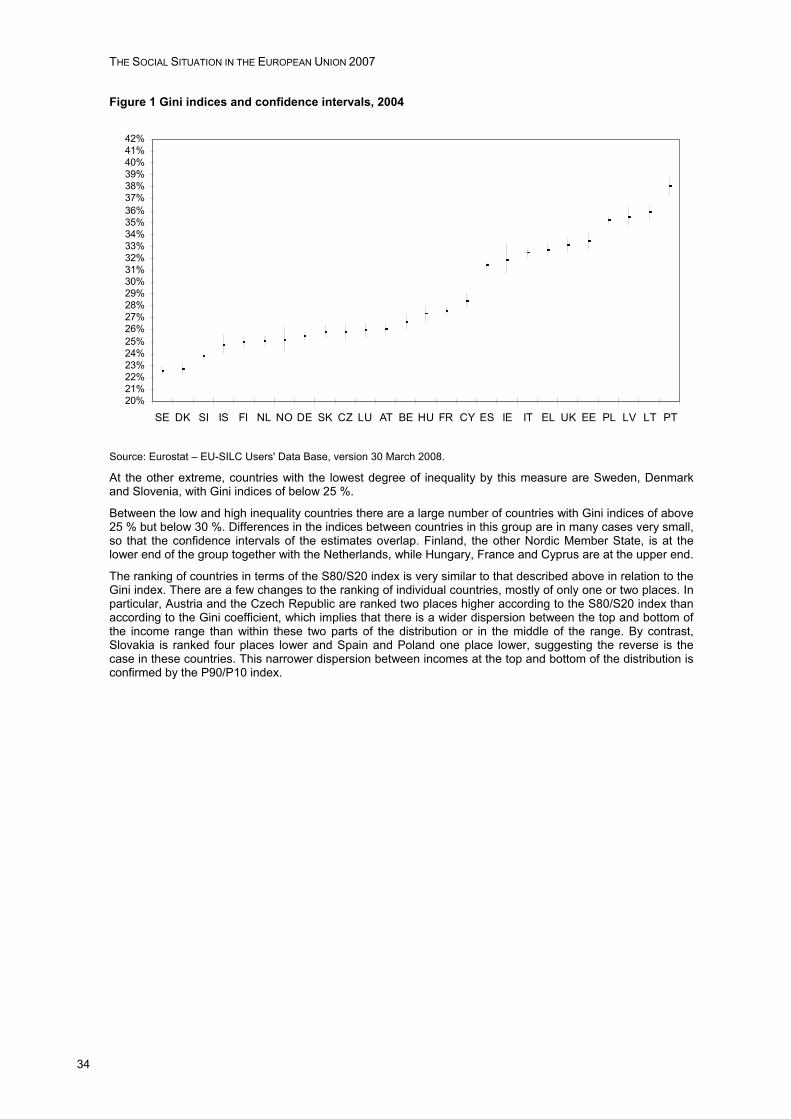
THE SOCIAL SITUATION IN THE EUROPEAN UNION 2007
34
Figure 1 Gini indices and confidence intervals, 2004
20%21%22%23%24%25%26%27%28%29%30%31%32%33%34%35%36%37%38%39%40%41%42%
SE DK SI IS FI NL NO DE SK CZ LU AT BE HU FR CY ES IE IT EL UK EE PL LV LT PT
Source: Eurostat – EU-SILC Users' Data Base, version 30 March 2008.
At the other extreme, countries with the lowest degree of inequality by this measure are Sweden, Denmark and Slovenia, with Gini indices of below 25 %.
Between the low and high inequality countries there are a large number of countries with Gini indices of above 25 % but below 30 %. Differences in the indices between countries in this group are in many cases very small, so that the confidence intervals of the estimates overlap. Finland, the other Nordic Member State, is at the lower end of the group together with the Netherlands, while Hungary, France and Cyprus are at the upper end.
The ranking of countries in terms of the S80/S20 index is very similar to that described above in relation to the Gini index. There are a few changes to the ranking of individual countries, mostly of only one or two places. In particular, Austria and the Czech Republic are ranked two places higher according to the S80/S20 index than according to the Gini coefficient, which implies that there is a wider dispersion between the top and bottom of the income range than within these two parts of the distribution or in the middle of the range. By contrast, Slovakia is ranked four places lower and Spain and Poland one place lower, suggesting the reverse is the case in these countries. This narrower dispersion between incomes at the top and bottom of the distribution is confirmed by the P90/P10 index.

PART 1 | SOCIAL COHESION THROUGH EQUAL OPPORTUNITIES
35
Table 2 Values of different inequality indices in 2004
Gini S80/S20 P90/P10 SE 22.5 3.2 2.6 DK 22.7 3.2 2.7 SI 23.7 3.4 3.0 FI 24.9 3.5 2.9 NL 25.1 3.6 2.9 DE 25.5 3.7 3.0 SK 25.8 3.8 3.1 CZ 26.0 3.6 3.0 LU 26.0 3.7 3.2 AT 26.0 3.7 3.1 BE 26.3 3.8 3.1 HU 27.3 4.0 3.2 FR 27.6 4.0 3.2 CY 28.4 4.3 3.6 ES 31.4 5.2 4.4 IE 31.8 4.9 3.9 IT 32.1 5.3 4.1 EL 32.6 5.4 4.4 EE 33.4 5.5 4.5 UK 34.0 5.7 4.4 PL 35.2 6.4 5.1 LV 35.5 6.2 4.7 LT 35.9 6.6 5.3 PT 38.0 6.9 5.5 EU 35.0 6.6 5.2 US 35.7 na 5.4
Source: Eurostat – EU-SILC Users' Data Base, version 30 March 2008.
Estimates for the EU are based on the sum of disposable income in each country measured in purchasing power parity terms. Estimates for US relate to 2000 and are taken from Michael Förster and Marco Mira d’Ercole, Income distribution and poverty in OECD countries in the second half of the 1990s, OECD, 2005
The main feature of the ranking based on the Gini index, however, is largely confirmed, in that there is a group of countries with the lowest ranking which have a significantly lower level of income inequality than other Member States and a group at the top which have a significantly higher level. At the same time, the countries included in these two groups are somewhat different.
In particular, according to both the S80/S20 and P90/P10 measures, Sweden and Denmark have a significantly lower level of inequality than other Member States, while Slovenia has a level which is similar to Finland and the Netherlands.
At the other end of the scale, the distinct difference in income inequality between the group of 10 countries with the highest value of the Gini index (i.e. those listed above where the index is over 30) and those with a lower value (i.e. of below 30) is confirmed by the S80/S20 index, though to a lesser extent by the P90/P10 index (which shows only a small difference between Ireland in the top group and Cyprus in the lower group).
Within the top group of countries, Poland, Latvia, Lithuania and Portugal stand out as having the most unequal distributions of income according to both the Gini and the S80/S20 indices, though again the difference is less marked according to the P90/P10 index (in this case between Latvia in the top group of four, and Estonia and Greece in the lower group of six). This implies that focusing on the very top and bottom of the income distribution (i.e. the top and bottom 10 % of income earners) can give a slightly different picture of income inequality than taking account of income dispersion over a wider range.
It is also possible to compare income distribution in the EU and in the US. The Gini index estimated for the US amounts to 35.7 (Table 2), which is higher than in any EU country apart from Lithuania and Portugal, signifying that income is slightly more unevenly distributed in the US than in EU Member States. The value of
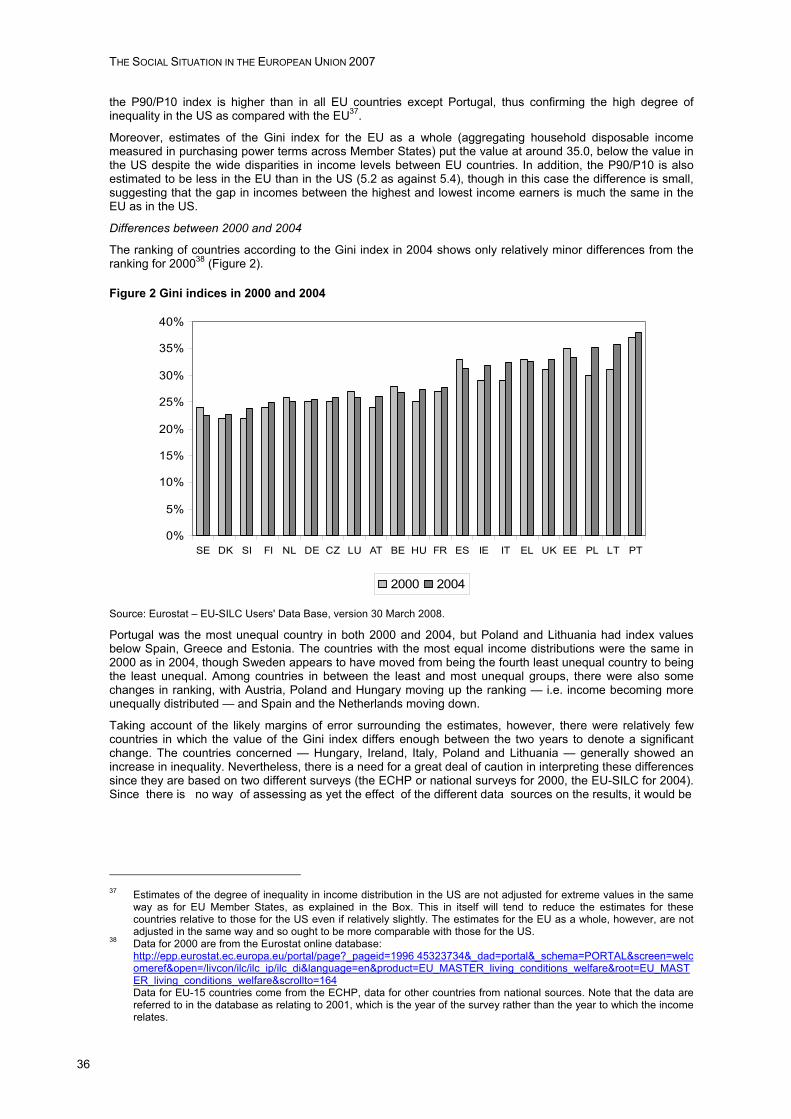
THE SOCIAL SITUATION IN THE EUROPEAN UNION 2007
36
the P90/P10 index is higher than in all EU countries except Portugal, thus confirming the high degree of inequality in the US as compared with the EU37.
Moreover, estimates of the Gini index for the EU as a whole (aggregating household disposable income measured in purchasing power terms across Member States) put the value at around 35.0, below the value in the US despite the wide disparities in income levels between EU countries. In addition, the P90/P10 is also estimated to be less in the EU than in the US (5.2 as against 5.4), though in this case the difference is small, suggesting that the gap in incomes between the highest and lowest income earners is much the same in the EU as in the US.
Differences between 2000 and 2004
The ranking of countries according to the Gini index in 2004 shows only relatively minor differences from the ranking for 200038 (Figure 2).
Figure 2 Gini indices in 2000 and 2004
0%
5%
10%
15%
20%
25%
30%
35%
40%
SE DK SI FI NL DE CZ LU AT BE HU FR ES IE IT EL UK EE PL LT PT
2000 2004
Source: Eurostat – EU-SILC Users' Data Base, version 30 March 2008.
Portugal was the most unequal country in both 2000 and 2004, but Poland and Lithuania had index values below Spain, Greece and Estonia. The countries with the most equal income distributions were the same in 2000 as in 2004, though Sweden appears to have moved from being the fourth least unequal country to being the least unequal. Among countries in between the least and most unequal groups, there were also some changes in ranking, with Austria, Poland and Hungary moving up the ranking — i.e. income becoming more unequally distributed — and Spain and the Netherlands moving down.
Taking account of the likely margins of error surrounding the estimates, however, there were relatively few countries in which the value of the Gini index differs enough between the two years to denote a significant change. The countries concerned — Hungary, Ireland, Italy, Poland and Lithuania — generally showed an increase in inequality. Nevertheless, there is a need for a great deal of caution in interpreting these differences since they are based on two different surveys (the ECHP or national surveys for 2000, the EU-SILC for 2004). Since there is no way of assessing as yet the effect of the different data sources on the results, it would be
37 Estimates of the degree of inequality in income distribution in the US are not adjusted for extreme values in the same
way as for EU Member States, as explained in the Box. This in itself will tend to reduce the estimates for these countries relative to those for the US even if relatively slightly. The estimates for the EU as a whole, however, are not adjusted in the same way and so ought to be more comparable with those for the US.
38 Data for 2000 are from the Eurostat online database: http://epp.eurostat.ec.europa.eu/portal/page?_pageid=1996 45323734&_dad=portal&_schema=PORTAL&screen=welcomeref&open=/livcon/ilc/ilc_ip/ilc_di&language=en&product=EU_MASTER_living_conditions_welfare&root=EU_MASTER_living_conditions_welfare&scrollto=164 Data for EU-15 countries come from the ECHP, data for other countries from national sources. Note that the data are referred to in the database as relating to 2001, which is the year of the survey rather than the year to which the income relates.
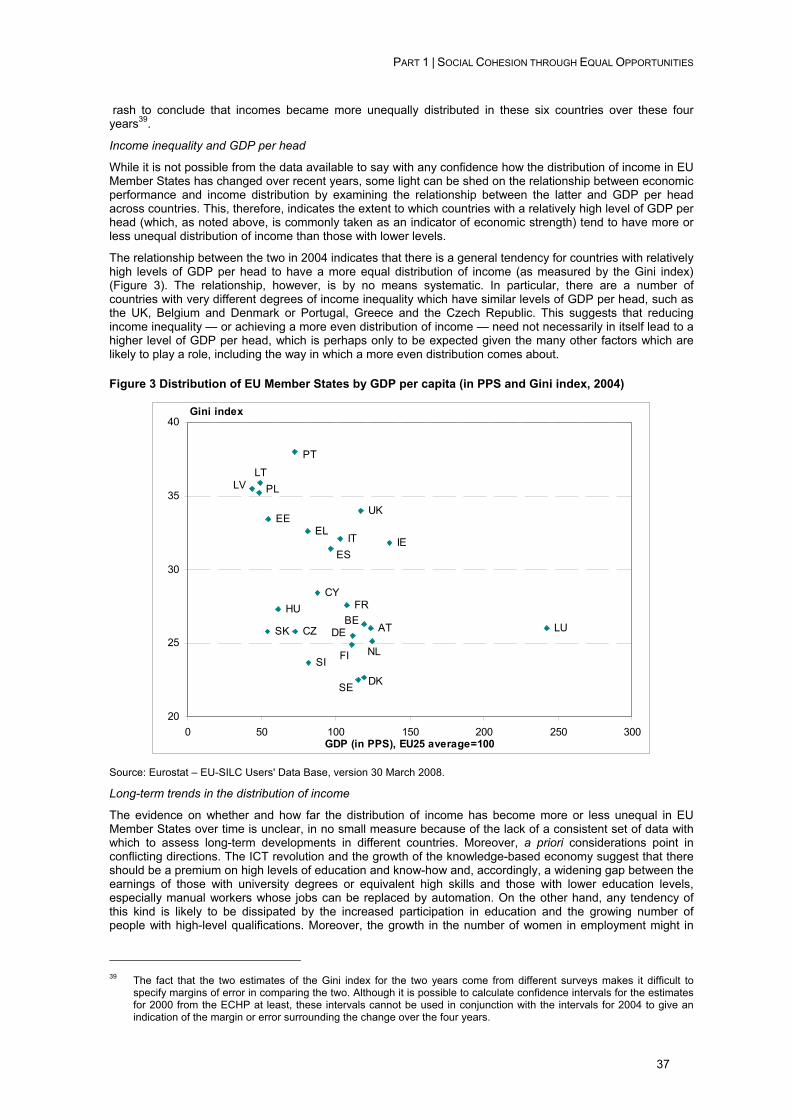
PART 1 | SOCIAL COHESION THROUGH EQUAL OPPORTUNITIES
37
rash to conclude that incomes became more unequally distributed in these six countries over these four years39.
Income inequality and GDP per head
While it is not possible from the data available to say with any confidence how the distribution of income in EU Member States has changed over recent years, some light can be shed on the relationship between economic performance and income distribution by examining the relationship between the latter and GDP per head across countries. This, therefore, indicates the extent to which countries with a relatively high level of GDP per head (which, as noted above, is commonly taken as an indicator of economic strength) tend to have more or less unequal distribution of income than those with lower levels.
The relationship between the two in 2004 indicates that there is a general tendency for countries with relatively high levels of GDP per head to have a more equal distribution of income (as measured by the Gini index) (Figure 3). The relationship, however, is by no means systematic. In particular, there are a number of countries with very different degrees of income inequality which have similar levels of GDP per head, such as the UK, Belgium and Denmark or Portugal, Greece and the Czech Republic. This suggests that reducing income inequality — or achieving a more even distribution of income — need not necessarily in itself lead to a higher level of GDP per head, which is perhaps only to be expected given the many other factors which are likely to play a role, including the way in which a more even distribution comes about.
Figure 3 Distribution of EU Member States by GDP per capita (in PPS and Gini index, 2004)
FR
IE
UK
ITES
ELEE
PL
PT
LTLV
ATDECZBE
NLFI
HUCY
LUSK
SI
SE DK
20
25
30
35
40
0 50 100 150 200 250 300GDP (in PPS), EU25 average=100
Gini index
Source: Eurostat – EU-SILC Users' Data Base, version 30 March 2008.
Long-term trends in the distribution of income
The evidence on whether and how far the distribution of income has become more or less unequal in EU Member States over time is unclear, in no small measure because of the lack of a consistent set of data with which to assess long-term developments in different countries. Moreover, a priori considerations point in conflicting directions. The ICT revolution and the growth of the knowledge-based economy suggest that there should be a premium on high levels of education and know-how and, accordingly, a widening gap between the earnings of those with university degrees or equivalent high skills and those with lower education levels, especially manual workers whose jobs can be replaced by automation. On the other hand, any tendency of this kind is likely to be dissipated by the increased participation in education and the growing number of people with high-level qualifications. Moreover, the growth in the number of women in employment might in
39 The fact that the two estimates of the Gini index for the two years come from different surveys makes it difficult to
specify margins of error in comparing the two. Although it is possible to calculate confidence intervals for the estimates for 2000 from the ECHP at least, these intervals cannot be used in conjunction with the intervals for 2004 to give an indication of the margin or error surrounding the change over the four years.
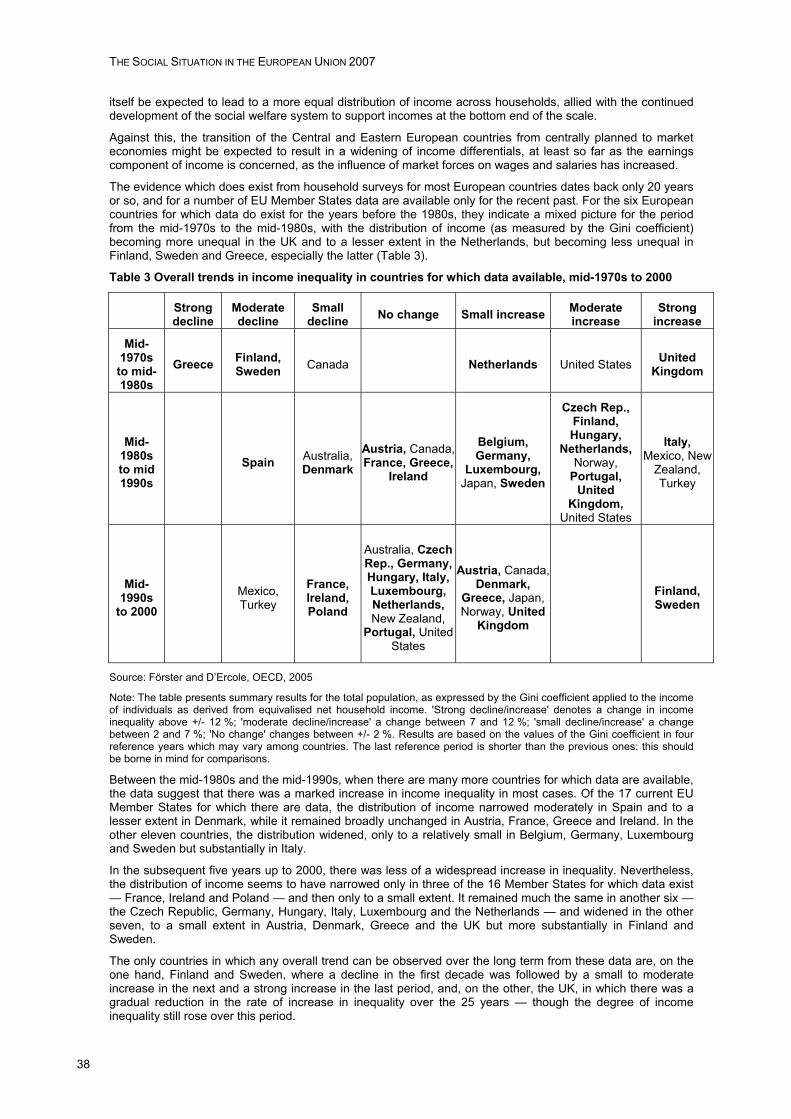
THE SOCIAL SITUATION IN THE EUROPEAN UNION 2007
38
itself be expected to lead to a more equal distribution of income across households, allied with the continued development of the social welfare system to support incomes at the bottom end of the scale.
Against this, the transition of the Central and Eastern European countries from centrally planned to market economies might be expected to result in a widening of income differentials, at least so far as the earnings component of income is concerned, as the influence of market forces on wages and salaries has increased.
The evidence which does exist from household surveys for most European countries dates back only 20 years or so, and for a number of EU Member States data are available only for the recent past. For the six European countries for which data do exist for the years before the 1980s, they indicate a mixed picture for the period from the mid-1970s to the mid-1980s, with the distribution of income (as measured by the Gini coefficient) becoming more unequal in the UK and to a lesser extent in the Netherlands, but becoming less unequal in Finland, Sweden and Greece, especially the latter (Table 3).
Table 3 Overall trends in income inequality in countries for which data available, mid-1970s to 2000
Strong decline
Moderate decline
Small decline No change Small increase Moderate
increase Strong
increase Mid-
1970s to mid-1980s
Greece Finland, Sweden Canada Netherlands United States United
Kingdom
Mid-1980s to mid 1990s
Spain Australia, Denmark
Austria, Canada, France, Greece,
Ireland
Belgium, Germany,
Luxembourg, Japan, Sweden
Czech Rep., Finland, Hungary,
Netherlands, Norway,
Portugal, United
Kingdom, United States
Italy, Mexico, New
Zealand, Turkey
Mid-1990s
to 2000 Mexico,
Turkey France, Ireland, Poland
Australia, Czech Rep., Germany, Hungary, Italy, Luxembourg, Netherlands, New Zealand,
Portugal, United States
Austria, Canada, Denmark,
Greece, Japan, Norway, United
Kingdom
Finland, Sweden
Source: Förster and D’Ercole, OECD, 2005
Note: The table presents summary results for the total population, as expressed by the Gini coefficient applied to the income of individuals as derived from equivalised net household income. 'Strong decline/increase' denotes a change in income inequality above +/- 12 %; 'moderate decline/increase' a change between 7 and 12 %; 'small decline/increase' a change between 2 and 7 %; 'No change' changes between +/- 2 %. Results are based on the values of the Gini coefficient in four reference years which may vary among countries. The last reference period is shorter than the previous ones: this should be borne in mind for comparisons.
Between the mid-1980s and the mid-1990s, when there are many more countries for which data are available, the data suggest that there was a marked increase in income inequality in most cases. Of the 17 current EU Member States for which there are data, the distribution of income narrowed moderately in Spain and to a lesser extent in Denmark, while it remained broadly unchanged in Austria, France, Greece and Ireland. In the other eleven countries, the distribution widened, only to a relatively small in Belgium, Germany, Luxembourg and Sweden but substantially in Italy.
In the subsequent five years up to 2000, there was less of a widespread increase in inequality. Nevertheless, the distribution of income seems to have narrowed only in three of the 16 Member States for which data exist — France, Ireland and Poland — and then only to a small extent. It remained much the same in another six — the Czech Republic, Germany, Hungary, Italy, Luxembourg and the Netherlands — and widened in the other seven, to a small extent in Austria, Denmark, Greece and the UK but more substantially in Finland and Sweden.
The only countries in which any overall trend can be observed over the long term from these data are, on the one hand, Finland and Sweden, where a decline in the first decade was followed by a small to moderate increase in the next and a strong increase in the last period, and, on the other, the UK, in which there was a gradual reduction in the rate of increase in inequality over the 25 years — though the degree of income inequality still rose over this period.
PART 1 | SOCIAL COHESION THROUGH EQUAL OPPORTUNITIES
39
2.3. Low incomes — a European perspective The share of people on low incomes in the EU is conventionally measured in relation to household income in the country in question. Specifically, the measure, which is the focus of the Open Method of Coordination in the field of social protection and social inclusion in this respect and one of the main indicators used in this context, is the proportion of the population with equivalised income of less than 60 % of the national median40, as analysed in the Joint Report on Social Protection and Social Inclusion41.
This measure is meaningful from a national perspective in that it identifies the people with the lowest levels of income in each Member State who are most likely to be deprived of access to the resources which other people in the community take for granted. The people so identified, however, can have very different levels of income in different Member States. To take the extreme case, people living in Luxembourg have a median level of equivalised income which is six times higher than in Lithuania even when income is measured in purchasing power parity terms to allow for differences in price levels between the two countries.
Such differences across countries are of obvious relevance for one of the main objectives of the EU, which is to raise the standard of living and quality of life for all its citizens and to promote economic and social cohesion throughout the Union. Progress towards reducing the differences is primarily assessed and monitored by reference to GDP per head, measured in purchasing power parity terms. This, however, is an indicator of the economic strength of the countries, or regions, concerned and of the output produced, rather than of income levels as such, and still less of the income received by households and the distribution of income between households.
To supplement GDP per head, there is therefore a case for examining household incomes from a European perspective and, accordingly, focusing on social as well as economic cohesion across all Member States of the EU. The need for an analysis of differences in living standards across the EU to complement nationally focused measures has been recognised almost ever since the latter were first developed in 200142. This section therefore looks at the relative number of people with disposable income below a particular level either in relation to median income across the EU as a whole — i.e. the income received by the average person, defined as the person at the mid-point of the income distribution, which amounted to around 1100 PPS a month in 2004 — or in absolute terms, income being measured, as in the case of GDP per head, in purchasing power parity terms to ensure comparability across countries (see below).
Such a measure is not new but has been suggested on a number of occasions in the recent past43. The EU-SILC makes this calculation possible and more meaningful than before by providing data on household income for all Member States on a reasonably consistent basis — with the exception, for the moment, of Bulgaria and Romania. It, accordingly, allows us to identify people whose income falls below a certain level and show in which countries they live, as well as their characteristics. It allows the relative income of such people to be monitored over time and how this is affected by economic growth as the countries concerned develop.
Measuring disposable income across the EU on a comparable basis, however, is not without problems. Applying purchasing power parity (PPP) estimates to data on equivalised income from the EU-SILC, in principle, makes it possible to compare disposable income in terms of what it is capable of purchasing. Such estimates suggest that the average level of prices is around twice as high in EU-15 countries than in the new Member States. Accordingly, in 2004, the year to which the income data used in the analysis below relate, a given sum of money expressed in euros was capable of buying almost three times as much in Poland than in Denmark (Table 4).
40 Equivalised income is the income of households adjusted for their size and composition. The income thus adjusted and
measured in disposable terms — i.e. net of taxes and social contributions paid by household members and gross of social transfers received — is assumed to be divided equally between household members.
41 http://ec.europa.eu/employment_social/spsi/joint_reports_en.htm 42 See the discussion and references in Atkinson, A.B., Cantillon, B., Marlier, E. and Nolan, B. Taking forward the EU
Social Inclusion Process, Aan independent report commissioned by the Luxembourg Presidency of the Council of the European Union, 2005.
43 Atkinson et al, op. cit.
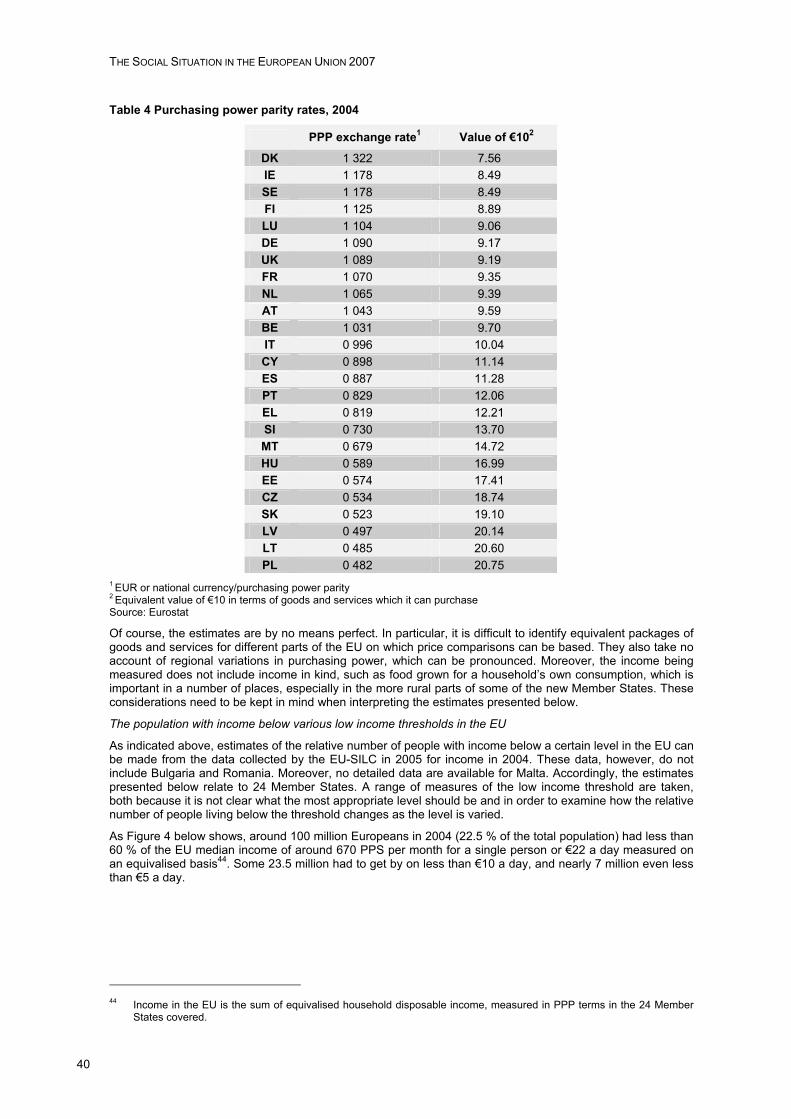
THE SOCIAL SITUATION IN THE EUROPEAN UNION 2007
40
Table 4 Purchasing power parity rates, 2004
PPP exchange rate1 Value of €102
DK 1 322 7.56 IE 1 178 8.49 SE 1 178 8.49 FI 1 125 8.89 LU 1 104 9.06 DE 1 090 9.17 UK 1 089 9.19 FR 1 070 9.35 NL 1 065 9.39 AT 1 043 9.59 BE 1 031 9.70 IT 0 996 10.04 CY 0 898 11.14 ES 0 887 11.28 PT 0 829 12.06 EL 0 819 12.21 SI 0 730 13.70 MT 0 679 14.72 HU 0 589 16.99 EE 0 574 17.41 CZ 0 534 18.74 SK 0 523 19.10 LV 0 497 20.14 LT 0 485 20.60 PL 0 482 20.75
1 EUR or national currency/purchasing power parity 2 Equivalent value of €10 in terms of goods and services which it can purchase Source: Eurostat
Of course, the estimates are by no means perfect. In particular, it is difficult to identify equivalent packages of goods and services for different parts of the EU on which price comparisons can be based. They also take no account of regional variations in purchasing power, which can be pronounced. Moreover, the income being measured does not include income in kind, such as food grown for a household’s own consumption, which is important in a number of places, especially in the more rural parts of some of the new Member States. These considerations need to be kept in mind when interpreting the estimates presented below.
The population with income below various low income thresholds in the EU
As indicated above, estimates of the relative number of people with income below a certain level in the EU can be made from the data collected by the EU-SILC in 2005 for income in 2004. These data, however, do not include Bulgaria and Romania. Moreover, no detailed data are available for Malta. Accordingly, the estimates presented below relate to 24 Member States. A range of measures of the low income threshold are taken, both because it is not clear what the most appropriate level should be and in order to examine how the relative number of people living below the threshold changes as the level is varied.
As Figure 4 below shows, around 100 million Europeans in 2004 (22.5 % of the total population) had less than 60 % of the EU median income of around 670 PPS per month for a single person or €22 a day measured on an equivalised basis44. Some 23.5 million had to get by on less than €10 a day, and nearly 7 million even less than €5 a day.
44 Income in the EU is the sum of equivalised household disposable income, measured in PPP terms in the 24 Member
States covered.
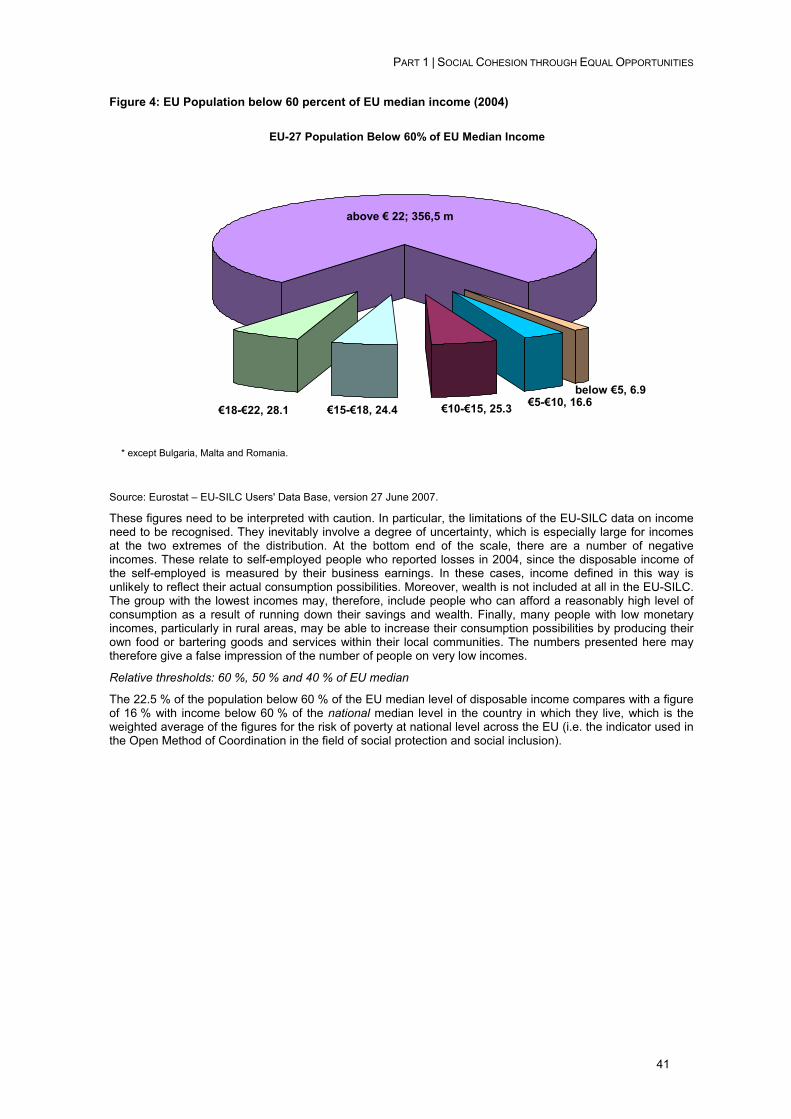
PART 1 | SOCIAL COHESION THROUGH EQUAL OPPORTUNITIES
41
Figure 4: EU Population below 60 percent of EU median income (2004)
EU-27 Population Below 60% of EU Median Income
above € 22; 356,5 m
€18-€22, 28.1 €15-€18, 24.4 €10-€15, 25.3 €5-€10, 16.6below €5, 6.9
* except Bulgaria, Malta and Romania.
Source: Eurostat – EU-SILC Users' Data Base, version 27 June 2007.
These figures need to be interpreted with caution. In particular, the limitations of the EU-SILC data on income need to be recognised. They inevitably involve a degree of uncertainty, which is especially large for incomes at the two extremes of the distribution. At the bottom end of the scale, there are a number of negative incomes. These relate to self-employed people who reported losses in 2004, since the disposable income of the self-employed is measured by their business earnings. In these cases, income defined in this way is unlikely to reflect their actual consumption possibilities. Moreover, wealth is not included at all in the EU-SILC. The group with the lowest incomes may, therefore, include people who can afford a reasonably high level of consumption as a result of running down their savings and wealth. Finally, many people with low monetary incomes, particularly in rural areas, may be able to increase their consumption possibilities by producing their own food or bartering goods and services within their local communities. The numbers presented here may therefore give a false impression of the number of people on very low incomes.
Relative thresholds: 60 %, 50 % and 40 % of EU median
The 22.5 % of the population below 60 % of the EU median level of disposable income compares with a figure of 16 % with income below 60 % of the national median level in the country in which they live, which is the weighted average of the figures for the risk of poverty at national level across the EU (i.e. the indicator used in the Open Method of Coordination in the field of social protection and social inclusion).
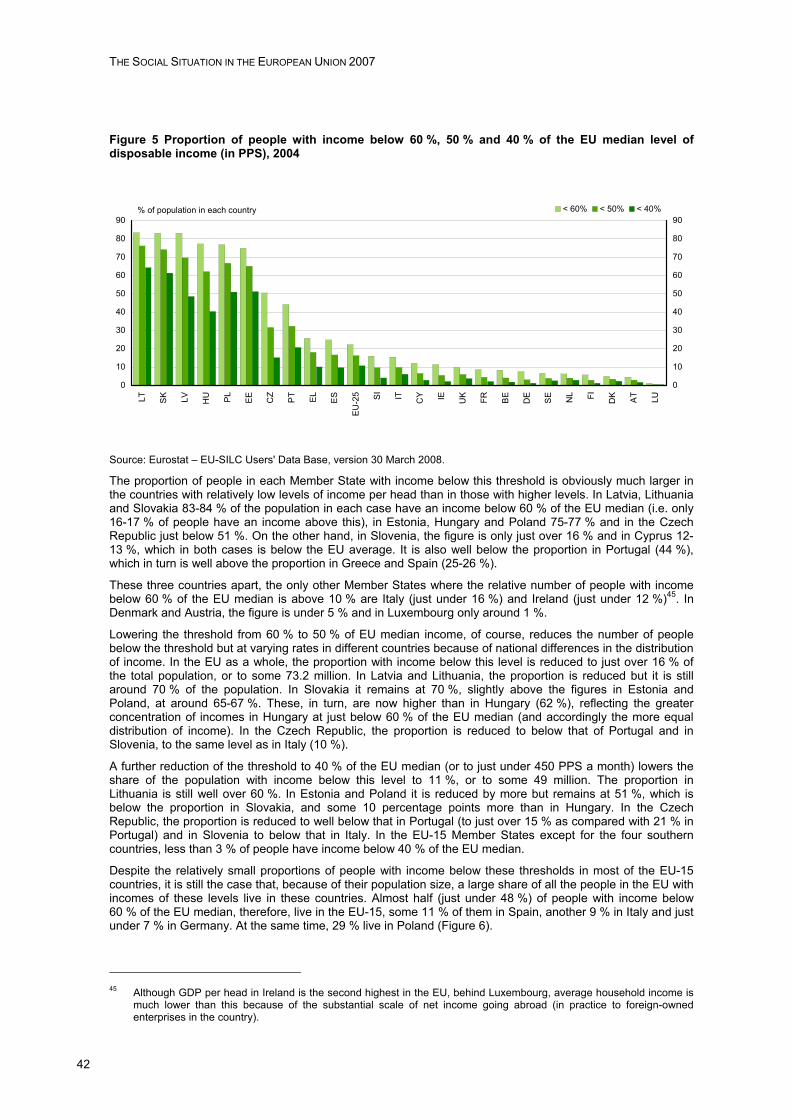
THE SOCIAL SITUATION IN THE EUROPEAN UNION 2007
42
Figure 5 Proportion of people with income below 60 %, 50 % and 40 % of the EU median level of disposable income (in PPS), 2004
0
10
20
30
40
50
60
70
80
90
LT SK LV HU PL
EE CZ
PT EL
ES
EU
-25 SI IT C
Y IE UK FR BE
DE
SE NL FI DK AT LU
0
10
20
30
40
50
60
70
80
90< 60% < 50% < 40%% of population in each country
Source: Eurostat – EU-SILC Users' Data Base, version 30 March 2008.
The proportion of people in each Member State with income below this threshold is obviously much larger in the countries with relatively low levels of income per head than in those with higher levels. In Latvia, Lithuania and Slovakia 83-84 % of the population in each case have an income below 60 % of the EU median (i.e. only 16-17 % of people have an income above this), in Estonia, Hungary and Poland 75-77 % and in the Czech Republic just below 51 %. On the other hand, in Slovenia, the figure is only just over 16 % and in Cyprus 12-13 %, which in both cases is below the EU average. It is also well below the proportion in Portugal (44 %), which in turn is well above the proportion in Greece and Spain (25-26 %).
These three countries apart, the only other Member States where the relative number of people with income below 60 % of the EU median is above 10 % are Italy (just under 16 %) and Ireland (just under 12 %)45. In Denmark and Austria, the figure is under 5 % and in Luxembourg only around 1 %.
Lowering the threshold from 60 % to 50 % of EU median income, of course, reduces the number of people below the threshold but at varying rates in different countries because of national differences in the distribution of income. In the EU as a whole, the proportion with income below this level is reduced to just over 16 % of the total population, or to some 73.2 million. In Latvia and Lithuania, the proportion is reduced but it is still around 70 % of the population. In Slovakia it remains at 70 %, slightly above the figures in Estonia and Poland, at around 65-67 %. These, in turn, are now higher than in Hungary (62 %), reflecting the greater concentration of incomes in Hungary at just below 60 % of the EU median (and accordingly the more equal distribution of income). In the Czech Republic, the proportion is reduced to below that of Portugal and in Slovenia, to the same level as in Italy (10 %).
A further reduction of the threshold to 40 % of the EU median (or to just under 450 PPS a month) lowers the share of the population with income below this level to 11 %, or to some 49 million. The proportion in Lithuania is still well over 60 %. In Estonia and Poland it is reduced by more but remains at 51 %, which is below the proportion in Slovakia, and some 10 percentage points more than in Hungary. In the Czech Republic, the proportion is reduced to well below that in Portugal (to just over 15 % as compared with 21 % in Portugal) and in Slovenia to below that in Italy. In the EU-15 Member States except for the four southern countries, less than 3 % of people have income below 40 % of the EU median.
Despite the relatively small proportions of people with income below these thresholds in most of the EU-15 countries, it is still the case that, because of their population size, a large share of all the people in the EU with incomes of these levels live in these countries. Almost half (just under 48 %) of people with income below 60 % of the EU median, therefore, live in the EU-15, some 11 % of them in Spain, another 9 % in Italy and just under 7 % in Germany. At the same time, 29 % live in Poland (Figure 6).
45 Although GDP per head in Ireland is the second highest in the EU, behind Luxembourg, average household income is
much lower than this because of the substantial scale of net income going abroad (in practice to foreign-owned enterprises in the country).
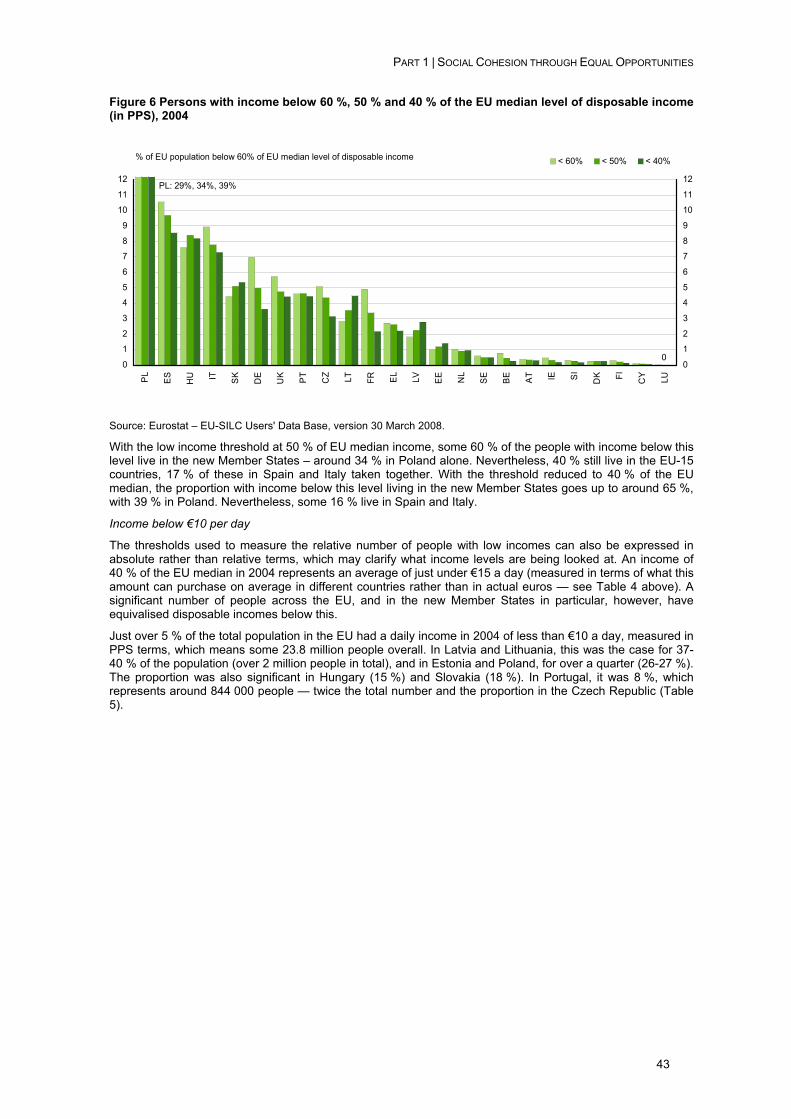
PART 1 | SOCIAL COHESION THROUGH EQUAL OPPORTUNITIES
43
Figure 6 Persons with income below 60 %, 50 % and 40 % of the EU median level of disposable income (in PPS), 2004
0
1
2
3
4
5
6
7
8
9
10
11
12
PL
ES
HU IT SK
DE
UK PT
CZ LT FR EL
LV EE NL
SE
BE AT IE SI
DK FI CY LU
0
1
2
3
4
5
6
7
8
9
10
11
12
< 60% < 50% < 40%% of EU population below 60% of EU median level of disposable income
0
PL: 29%, 34%, 39%
Source: Eurostat – EU-SILC Users' Data Base, version 30 March 2008.
With the low income threshold at 50 % of EU median income, some 60 % of the people with income below this level live in the new Member States – around 34 % in Poland alone. Nevertheless, 40 % still live in the EU-15 countries, 17 % of these in Spain and Italy taken together. With the threshold reduced to 40 % of the EU median, the proportion with income below this level living in the new Member States goes up to around 65 %, with 39 % in Poland. Nevertheless, some 16 % live in Spain and Italy.
Income below €10 per day
The thresholds used to measure the relative number of people with low incomes can also be expressed in absolute rather than relative terms, which may clarify what income levels are being looked at. An income of 40 % of the EU median in 2004 represents an average of just under €15 a day (measured in terms of what this amount can purchase on average in different countries rather than in actual euros — see Table 4 above). A significant number of people across the EU, and in the new Member States in particular, however, have equivalised disposable incomes below this.
Just over 5 % of the total population in the EU had a daily income in 2004 of less than €10 a day, measured in PPS terms, which means some 23.8 million people overall. In Latvia and Lithuania, this was the case for 37-40 % of the population (over 2 million people in total), and in Estonia and Poland, for over a quarter (26-27 %). The proportion was also significant in Hungary (15 %) and Slovakia (18 %). In Portugal, it was 8 %, which represents around 844 000 people — twice the total number and the proportion in the Czech Republic (Table 5).
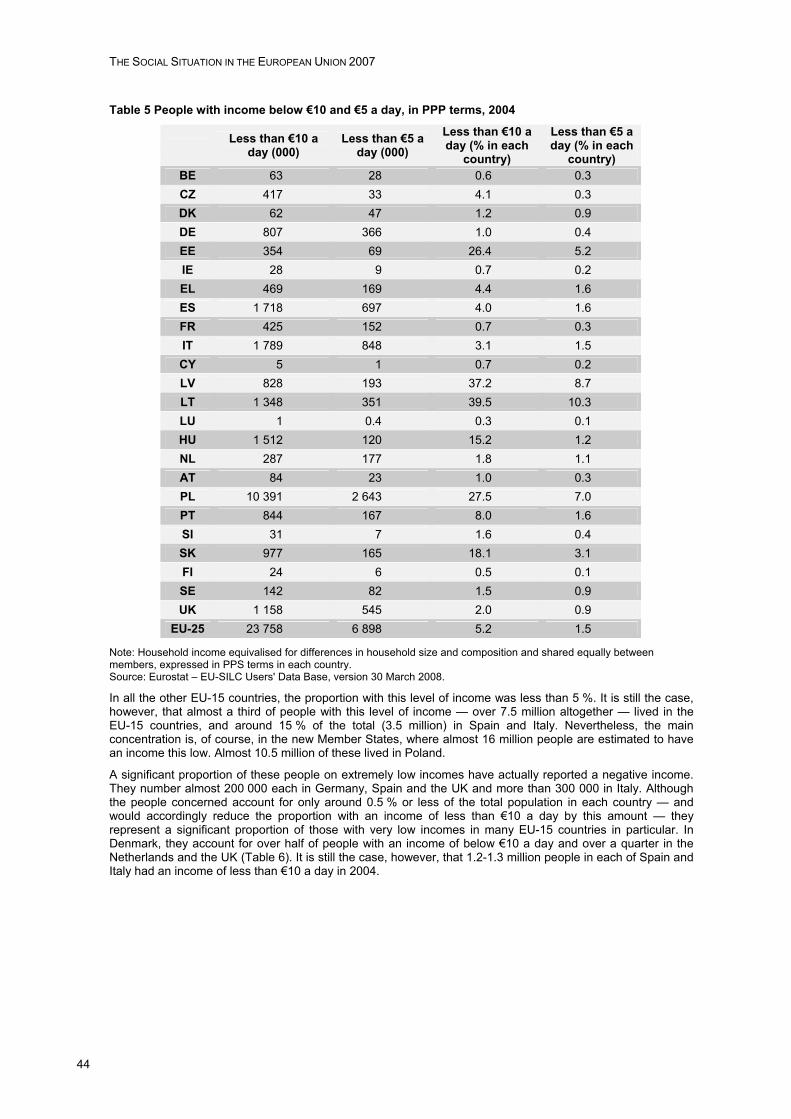
THE SOCIAL SITUATION IN THE EUROPEAN UNION 2007
44
Table 5 People with income below €10 and €5 a day, in PPP terms, 2004
Less than €10 a day (000)
Less than €5 a day (000)
Less than €10 a day (% in each
country)
Less than €5 a day (% in each
country) BE 63 28 0.6 0.3 CZ 417 33 4.1 0.3 DK 62 47 1.2 0.9 DE 807 366 1.0 0.4 EE 354 69 26.4 5.2 IE 28 9 0.7 0.2 EL 469 169 4.4 1.6 ES 1 718 697 4.0 1.6 FR 425 152 0.7 0.3 IT 1 789 848 3.1 1.5 CY 5 1 0.7 0.2 LV 828 193 37.2 8.7 LT 1 348 351 39.5 10.3 LU 1 0.4 0.3 0.1 HU 1 512 120 15.2 1.2 NL 287 177 1.8 1.1 AT 84 23 1.0 0.3 PL 10 391 2 643 27.5 7.0 PT 844 167 8.0 1.6 SI 31 7 1.6 0.4 SK 977 165 18.1 3.1 FI 24 6 0.5 0.1 SE 142 82 1.5 0.9 UK 1 158 545 2.0 0.9
EU-25 23 758 6 898 5.2 1.5
Note: Household income equivalised for differences in household size and composition and shared equally between members, expressed in PPS terms in each country. Source: Eurostat – EU-SILC Users' Data Base, version 30 March 2008.
In all the other EU-15 countries, the proportion with this level of income was less than 5 %. It is still the case, however, that almost a third of people with this level of income — over 7.5 million altogether — lived in the EU-15 countries, and around 15 % of the total (3.5 million) in Spain and Italy. Nevertheless, the main concentration is, of course, in the new Member States, where almost 16 million people are estimated to have an income this low. Almost 10.5 million of these lived in Poland.
A significant proportion of these people on extremely low incomes have actually reported a negative income. They number almost 200 000 each in Germany, Spain and the UK and more than 300 000 in Italy. Although the people concerned account for only around 0.5 % or less of the total population in each country — and would accordingly reduce the proportion with an income of less than €10 a day by this amount — they represent a significant proportion of those with very low incomes in many EU-15 countries in particular. In Denmark, they account for over half of people with an income of below €10 a day and over a quarter in the Netherlands and the UK (Table 6). It is still the case, however, that 1.2-1.3 million people in each of Spain and Italy had an income of less than €10 a day in 2004.
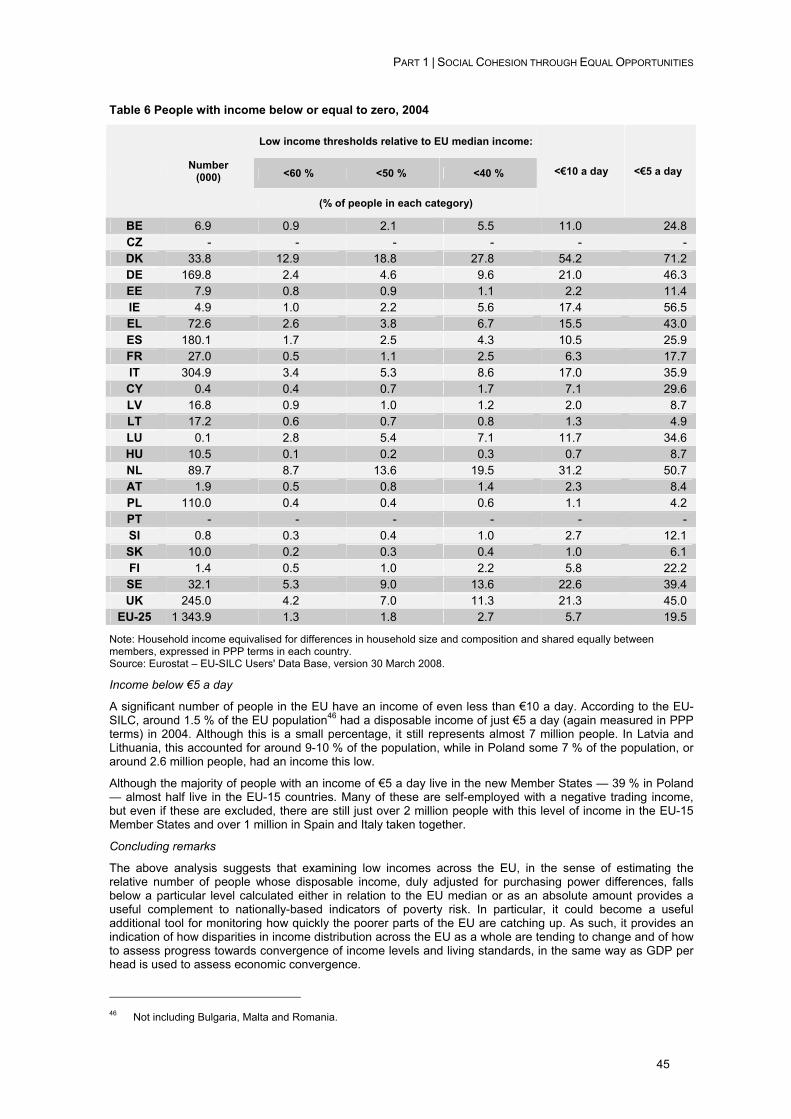
PART 1 | SOCIAL COHESION THROUGH EQUAL OPPORTUNITIES
45
Table 6 People with income below or equal to zero, 2004
Low income thresholds relative to EU median income:
<60 % <50 % <40 % Number (000)
(% of people in each category)
<€10 a day <€5 a day
BE 6.9 0.9 2.1 5.5 11.0 24.8 CZ - - - - - - DK 33.8 12.9 18.8 27.8 54.2 71.2 DE 169.8 2.4 4.6 9.6 21.0 46.3 EE 7.9 0.8 0.9 1.1 2.2 11.4 IE 4.9 1.0 2.2 5.6 17.4 56.5 EL 72.6 2.6 3.8 6.7 15.5 43.0 ES 180.1 1.7 2.5 4.3 10.5 25.9 FR 27.0 0.5 1.1 2.5 6.3 17.7 IT 304.9 3.4 5.3 8.6 17.0 35.9 CY 0.4 0.4 0.7 1.7 7.1 29.6 LV 16.8 0.9 1.0 1.2 2.0 8.7 LT 17.2 0.6 0.7 0.8 1.3 4.9 LU 0.1 2.8 5.4 7.1 11.7 34.6 HU 10.5 0.1 0.2 0.3 0.7 8.7 NL 89.7 8.7 13.6 19.5 31.2 50.7 AT 1.9 0.5 0.8 1.4 2.3 8.4 PL 110.0 0.4 0.4 0.6 1.1 4.2 PT - - - - - - SI 0.8 0.3 0.4 1.0 2.7 12.1 SK 10.0 0.2 0.3 0.4 1.0 6.1 FI 1.4 0.5 1.0 2.2 5.8 22.2 SE 32.1 5.3 9.0 13.6 22.6 39.4 UK 245.0 4.2 7.0 11.3 21.3 45.0
EU-25 1 343.9 1.3 1.8 2.7 5.7 19.5
Note: Household income equivalised for differences in household size and composition and shared equally between members, expressed in PPP terms in each country. Source: Eurostat – EU-SILC Users' Data Base, version 30 March 2008.
Income below €5 a day
A significant number of people in the EU have an income of even less than €10 a day. According to the EU-SILC, around 1.5 % of the EU population46 had a disposable income of just €5 a day (again measured in PPP terms) in 2004. Although this is a small percentage, it still represents almost 7 million people. In Latvia and Lithuania, this accounted for around 9-10 % of the population, while in Poland some 7 % of the population, or around 2.6 million people, had an income this low.
Although the majority of people with an income of €5 a day live in the new Member States — 39 % in Poland — almost half live in the EU-15 countries. Many of these are self-employed with a negative trading income, but even if these are excluded, there are still just over 2 million people with this level of income in the EU-15 Member States and over 1 million in Spain and Italy taken together.
Concluding remarks
The above analysis suggests that examining low incomes across the EU, in the sense of estimating the relative number of people whose disposable income, duly adjusted for purchasing power differences, falls below a particular level calculated either in relation to the EU median or as an absolute amount provides a useful complement to nationally-based indicators of poverty risk. In particular, it could become a useful additional tool for monitoring how quickly the poorer parts of the EU are catching up. As such, it provides an indication of how disparities in income distribution across the EU as a whole are tending to change and of how to assess progress towards convergence of income levels and living standards, in the same way as GDP per head is used to assess economic convergence.
46 Not including Bulgaria, Malta and Romania.
THE SOCIAL SITUATION IN THE EUROPEAN UNION 2007
46
The measure highlights the fact that, although the problem of low incomes is most serious in many of the new Member States, there are nevertheless significant numbers of people in the richer parts of the Union whose income is well below the median in the EU and who seem to have relatively little to live on. Further investigation is required to assess how far the income data in the EU-SILC accurately reflect their living conditions and the kinds of policy best suited to alleviating their situation.
There is a parallel need in the EU-15 countries, in particular, to examine in more detail the living standards of the self-employed and to see how the problem of negative or zero incomes arising from the way their income is currently measured can best be overcome.
2.4. Who are the poor: groups most at risk in the Member States The indicator which is used to measure the risk of poverty in EU Member States is the proportion of the population with equivalised disposable income below 60 % of the national median. This varies from 9 % in Sweden and 10 % in the Czech Republic to 21 % in Lithuania and Poland. The risk of poverty within Member States, however, varies markedly between different sections of the population. At the same time, those at the highest risk also vary across countries.
Nevertheless, four groups stand out as having a high risk in nearly all countries. These are:
– people of working age living alone with a dependent child, who are, in the vast majority of cases, women;
– people living alone aged 65 and over who are no longer in paid employment – and who again, in most cases, are women, many of whom may not have been working before reaching 65;
– people living alone of working age who are not in employment;
– families with children where only one of the parents is in employment.
These groups vary across countries not only in terms of the risk of poverty they face but also in terms of their numbers and the share of total population they represent. In particular, lone parents are much more numerous in some countries than others, as are those of working age living alone generally. In countries where these groups represent a relatively small proportion of the population, they may also account for only a small proportion of people with income below the at-risk-of-poverty threshold, despite having a high risk of poverty as such. Similarly, a section of the population with a much lower risk of poverty may, nevertheless, make up a relatively large share of the total at risk simply because there are a substantial number of them.
The risk of poverty within different groups, therefore, gives policymakers only partial guidance as to where measures to alleviate poverty should be targeted. A high risk of poverty among a particular group may signify gaps in policy or in its effectiveness, but it does not necessarily indicate the groups which policy needs to target if the concern is to reduce the overall risk. To achieve the latter objective, measures could be targeted at people who make up the largest number of those with income below the at-risk-of-poverty threshold, who may not necessarily be those with the highest risk.
The concern here is with the composition of the population with income below the threshold, with the groups who make up the largest shares, and with the extent to which these groups differ across Member States.
The risk of poverty
The analysis is based on data from the EU-SILC for 2005, which relate to income in 2004 and cover 24 EU Member States, the countries excluded being Bulgaria, Romania and Malta. Being at risk of poverty is defined as having equivalised annual disposable income of less than 60 % of the national median income level47. The focus is on people, including children, having income below this level and specifically on their age, sex and household circumstances in terms of the type of household in which they live and its work intensity — i.e. the number of people in the household in work relative to the total living there of working age, adjusted for months during the year when not in employment48.
These characteristics can be combined into a limited number of broad groups to assess the risk of poverty as follows:
– lone parents with dependent children living at home
– lone women of 65 and over
– lone men of 65 and over
– people living alone of less than 65 who are unemployed or were employed for only part of the year
47 Equivalised to adjust for differences in the size and composition of households. 48 Work intensity is 1 if all people of working age in the household are employment throughout the year. It is less than 1 if
this is not the case. In practice, in most cases where it is less than 1 either only one of a couple is employed throughout the year or no-one in the household is working.
PART 1 | SOCIAL COHESION THROUGH EQUAL OPPORTUNITIES
47
– people of less than 65 living alone and who were employed throughout the year
– couples aged 65 and over
– households with two people of working age and with one or two dependent children, with a work intensity of less than 1
– households with two people of working age and with one or two dependent children, with a work intensity of 1
– households with two people of working age and with three or more children, with a work intensity of less than 1
– households with two people of working age and with three or more children, with a work intensity of 1
– households with two people of working age without children, with a work intensity of less than 1
These groups are mutually exclusive but do not cover all households. In practice, most of them feature among the five groups who account for the largest shares of those at risk of poverty in at least one Member State and, as noted above, several feature in most countries. They do not include, it should be noted, households with two people working throughout the year and households with more than two adults both with and without children and with varying levels of work intensity. In all of these cases, the households concerned tend to have a relatively low risk of poverty and do not feature among the ‘top’ five groups with income below the at-risk-of-poverty threshold in any of the countries.
The risk of poverty among these groups in each of the 24 Member States is shown in Table 7, which indicates the wide differences across the EU in the risk faced by particular groups. For women living alone aged 65 and over, for example, the risk is over 50 % in Cyprus, Spain and Ireland but under 8 % in Luxembourg, the Netherlands and Poland. For lone parents, on the other hand, the risk does not exceed 50 % in any country, but is over 20 % in all Member States except Sweden.
The effect on income of unemployment, or only partial employment, among those of working age is very apparent. The risk of poverty is particularly high in nearly all countries for people of working age living alone who are not employed or employed for less than half the year. Nevertheless, it still ranges from 23 % in the Netherlands to over 70 % in Estonia, Latvia and Slovenia. The risk is particularly high in households with three or more children where not everyone — typically only one of a couple — or no-one is working. This risk exceeds 50 % in Spain, Latvia, Lithuania, Poland and Portugal, and is below 20 % only in Germany and Finland.
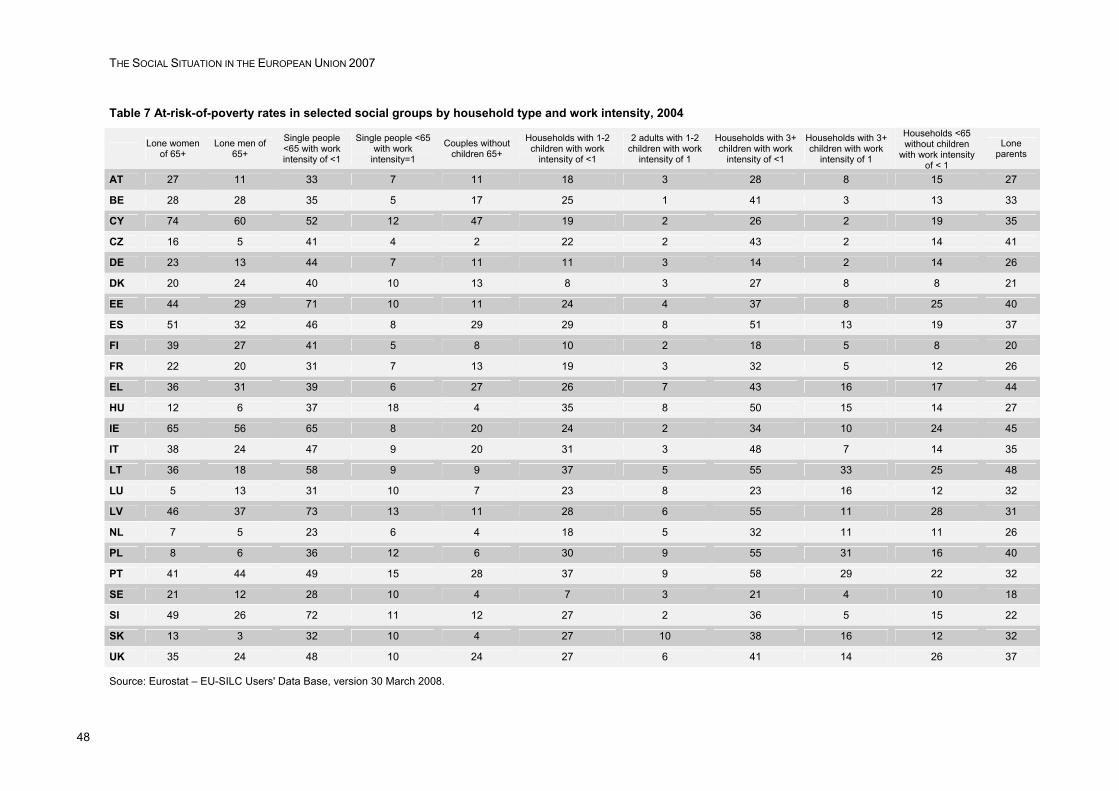
THE SOCIAL SITUATION IN THE EUROPEAN UNION 2007
48
Table 7 At-risk-of-poverty rates in selected social groups by household type and work intensity, 2004
Lone women of 65+
Lone men of 65+
Single people <65 with work intensity of <1
Single people <65 with work
intensity=1
Couples without children 65+
Households with 1-2 children with work
intensity of <1
2 adults with 1-2 children with work
intensity of 1
Households with 3+ children with work
intensity of <1
Households with 3+ children with work
intensity of 1
Households <65 without children
with work intensity of < 1
Lone parents
AT 27 11 33 7 11 18 3 28 8 15 27
BE 28 28 35 5 17 25 1 41 3 13 33
CY 74 60 52 12 47 19 2 26 2 19 35
CZ 16 5 41 4 2 22 2 43 2 14 41
DE 23 13 44 7 11 11 3 14 2 14 26
DK 20 24 40 10 13 8 3 27 8 8 21
EE 44 29 71 10 11 24 4 37 8 25 40
ES 51 32 46 8 29 29 8 51 13 19 37
FI 39 27 41 5 8 10 2 18 5 8 20
FR 22 20 31 7 13 19 3 32 5 12 26
EL 36 31 39 6 27 26 7 43 16 17 44
HU 12 6 37 18 4 35 8 50 15 14 27
IE 65 56 65 8 20 24 2 34 10 24 45
IT 38 24 47 9 20 31 3 48 7 14 35
LT 36 18 58 9 9 37 5 55 33 25 48
LU 5 13 31 10 7 23 8 23 16 12 32
LV 46 37 73 13 11 28 6 55 11 28 31
NL 7 5 23 6 4 18 5 32 11 11 26
PL 8 6 36 12 6 30 9 55 31 16 40
PT 41 44 49 15 28 37 9 58 29 22 32
SE 21 12 28 10 4 7 3 21 4 10 18
SI 49 26 72 11 12 27 2 36 5 15 22
SK 13 3 32 10 4 27 10 38 16 12 32
UK 35 24 48 10 24 27 6 41 14 26 37
Source: Eurostat – EU-SILC Users' Data Base, version 30 March 2008.
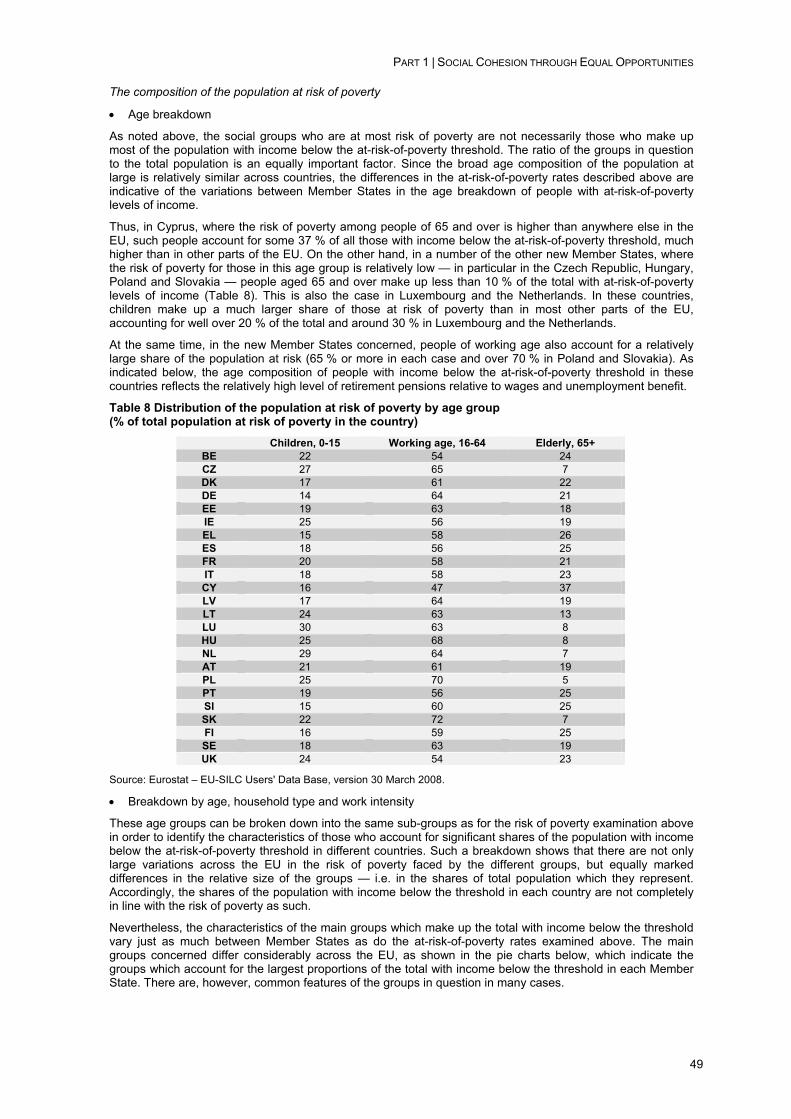
PART 1 | SOCIAL COHESION THROUGH EQUAL OPPORTUNITIES
49
The composition of the population at risk of poverty
• Age breakdown
As noted above, the social groups who are at most risk of poverty are not necessarily those who make up most of the population with income below the at-risk-of-poverty threshold. The ratio of the groups in question to the total population is an equally important factor. Since the broad age composition of the population at large is relatively similar across countries, the differences in the at-risk-of-poverty rates described above are indicative of the variations between Member States in the age breakdown of people with at-risk-of-poverty levels of income.
Thus, in Cyprus, where the risk of poverty among people of 65 and over is higher than anywhere else in the EU, such people account for some 37 % of all those with income below the at-risk-of-poverty threshold, much higher than in other parts of the EU. On the other hand, in a number of the other new Member States, where the risk of poverty for those in this age group is relatively low — in particular in the Czech Republic, Hungary, Poland and Slovakia — people aged 65 and over make up less than 10 % of the total with at-risk-of-poverty levels of income (Table 8). This is also the case in Luxembourg and the Netherlands. In these countries, children make up a much larger share of those at risk of poverty than in most other parts of the EU, accounting for well over 20 % of the total and around 30 % in Luxembourg and the Netherlands.
At the same time, in the new Member States concerned, people of working age also account for a relatively large share of the population at risk (65 % or more in each case and over 70 % in Poland and Slovakia). As indicated below, the age composition of people with income below the at-risk-of-poverty threshold in these countries reflects the relatively high level of retirement pensions relative to wages and unemployment benefit.
Table 8 Distribution of the population at risk of poverty by age group (% of total population at risk of poverty in the country)
Children, 0-15 Working age, 16-64 Elderly, 65+ BE 22 54 24 CZ 27 65 7 DK 17 61 22 DE 14 64 21 EE 19 63 18 IE 25 56 19 EL 15 58 26 ES 18 56 25 FR 20 58 21 IT 18 58 23 CY 16 47 37 LV 17 64 19 LT 24 63 13 LU 30 63 8 HU 25 68 8 NL 29 64 7 AT 21 61 19 PL 25 70 5 PT 19 56 25 SI 15 60 25 SK 22 72 7 FI 16 59 25 SE 18 63 19 UK 24 54 23
Source: Eurostat – EU-SILC Users' Data Base, version 30 March 2008.
• Breakdown by age, household type and work intensity
These age groups can be broken down into the same sub-groups as for the risk of poverty examination above in order to identify the characteristics of those who account for significant shares of the population with income below the at-risk-of-poverty threshold in different countries. Such a breakdown shows that there are not only large variations across the EU in the risk of poverty faced by the different groups, but equally marked differences in the relative size of the groups — i.e. in the shares of total population which they represent. Accordingly, the shares of the population with income below the threshold in each country are not completely in line with the risk of poverty as such.
Nevertheless, the characteristics of the main groups which make up the total with income below the threshold vary just as much between Member States as do the at-risk-of-poverty rates examined above. The main groups concerned differ considerably across the EU, as shown in the pie charts below, which indicate the groups which account for the largest proportions of the total with income below the threshold in each Member State. There are, however, common features of the groups in question in many cases.
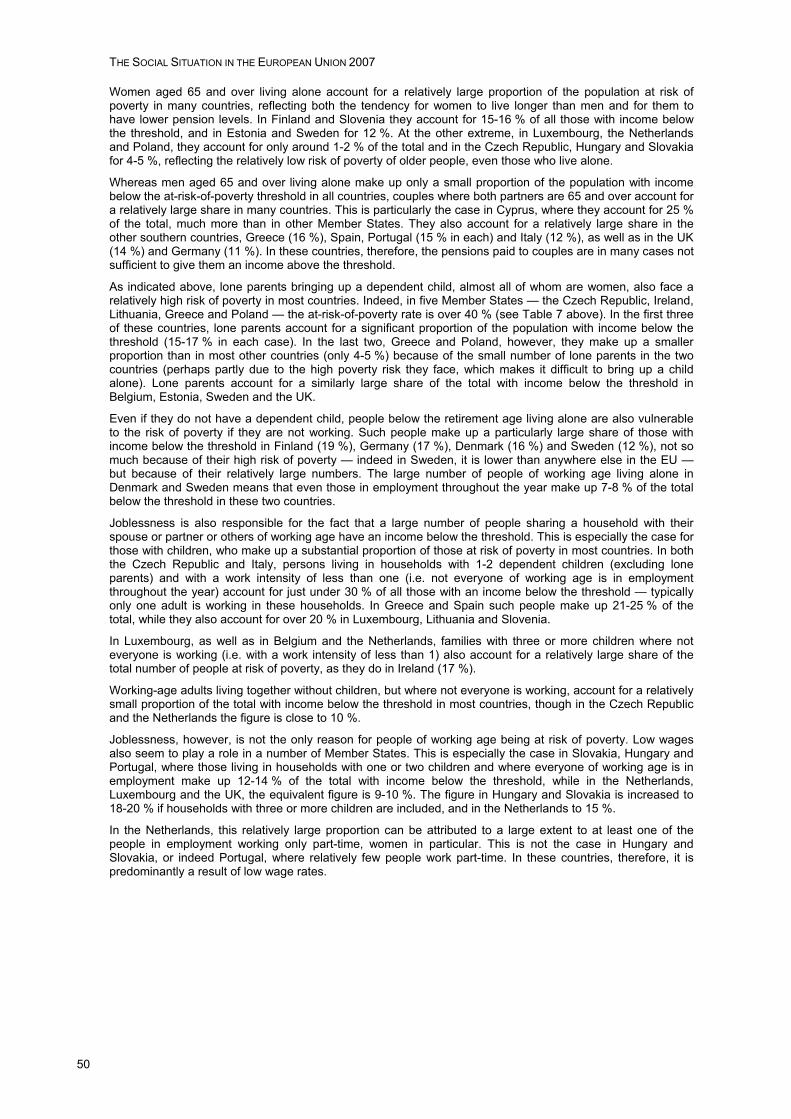
THE SOCIAL SITUATION IN THE EUROPEAN UNION 2007
50
Women aged 65 and over living alone account for a relatively large proportion of the population at risk of poverty in many countries, reflecting both the tendency for women to live longer than men and for them to have lower pension levels. In Finland and Slovenia they account for 15-16 % of all those with income below the threshold, and in Estonia and Sweden for 12 %. At the other extreme, in Luxembourg, the Netherlands and Poland, they account for only around 1-2 % of the total and in the Czech Republic, Hungary and Slovakia for 4-5 %, reflecting the relatively low risk of poverty of older people, even those who live alone.
Whereas men aged 65 and over living alone make up only a small proportion of the population with income below the at-risk-of-poverty threshold in all countries, couples where both partners are 65 and over account for a relatively large share in many countries. This is particularly the case in Cyprus, where they account for 25 % of the total, much more than in other Member States. They also account for a relatively large share in the other southern countries, Greece (16 %), Spain, Portugal (15 % in each) and Italy (12 %), as well as in the UK (14 %) and Germany (11 %). In these countries, therefore, the pensions paid to couples are in many cases not sufficient to give them an income above the threshold.
As indicated above, lone parents bringing up a dependent child, almost all of whom are women, also face a relatively high risk of poverty in most countries. Indeed, in five Member States — the Czech Republic, Ireland, Lithuania, Greece and Poland — the at-risk-of-poverty rate is over 40 % (see Table 7 above). In the first three of these countries, lone parents account for a significant proportion of the population with income below the threshold (15-17 % in each case). In the last two, Greece and Poland, however, they make up a smaller proportion than in most other countries (only 4-5 %) because of the small number of lone parents in the two countries (perhaps partly due to the high poverty risk they face, which makes it difficult to bring up a child alone). Lone parents account for a similarly large share of the total with income below the threshold in Belgium, Estonia, Sweden and the UK.
Even if they do not have a dependent child, people below the retirement age living alone are also vulnerable to the risk of poverty if they are not working. Such people make up a particularly large share of those with income below the threshold in Finland (19 %), Germany (17 %), Denmark (16 %) and Sweden (12 %), not so much because of their high risk of poverty — indeed in Sweden, it is lower than anywhere else in the EU — but because of their relatively large numbers. The large number of people of working age living alone in Denmark and Sweden means that even those in employment throughout the year make up 7-8 % of the total below the threshold in these two countries.
Joblessness is also responsible for the fact that a large number of people sharing a household with their spouse or partner or others of working age have an income below the threshold. This is especially the case for those with children, who make up a substantial proportion of those at risk of poverty in most countries. In both the Czech Republic and Italy, persons living in households with 1-2 dependent children (excluding lone parents) and with a work intensity of less than one (i.e. not everyone of working age is in employment throughout the year) account for just under 30 % of all those with an income below the threshold — typically only one adult is working in these households. In Greece and Spain such people make up 21-25 % of the total, while they also account for over 20 % in Luxembourg, Lithuania and Slovenia.
In Luxembourg, as well as in Belgium and the Netherlands, families with three or more children where not everyone is working (i.e. with a work intensity of less than 1) also account for a relatively large share of the total number of people at risk of poverty, as they do in Ireland (17 %).
Working-age adults living together without children, but where not everyone is working, account for a relatively small proportion of the total with income below the threshold in most countries, though in the Czech Republic and the Netherlands the figure is close to 10 %.
Joblessness, however, is not the only reason for people of working age being at risk of poverty. Low wages also seem to play a role in a number of Member States. This is especially the case in Slovakia, Hungary and Portugal, where those living in households with one or two children and where everyone of working age is in employment make up 12-14 % of the total with income below the threshold, while in the Netherlands, Luxembourg and the UK, the equivalent figure is 9-10 %. The figure in Hungary and Slovakia is increased to 18-20 % if households with three or more children are included, and in the Netherlands to 15 %.
In the Netherlands, this relatively large proportion can be attributed to a large extent to at least one of the people in employment working only part-time, women in particular. This is not the case in Hungary and Slovakia, or indeed Portugal, where relatively few people work part-time. In these countries, therefore, it is predominantly a result of low wage rates.
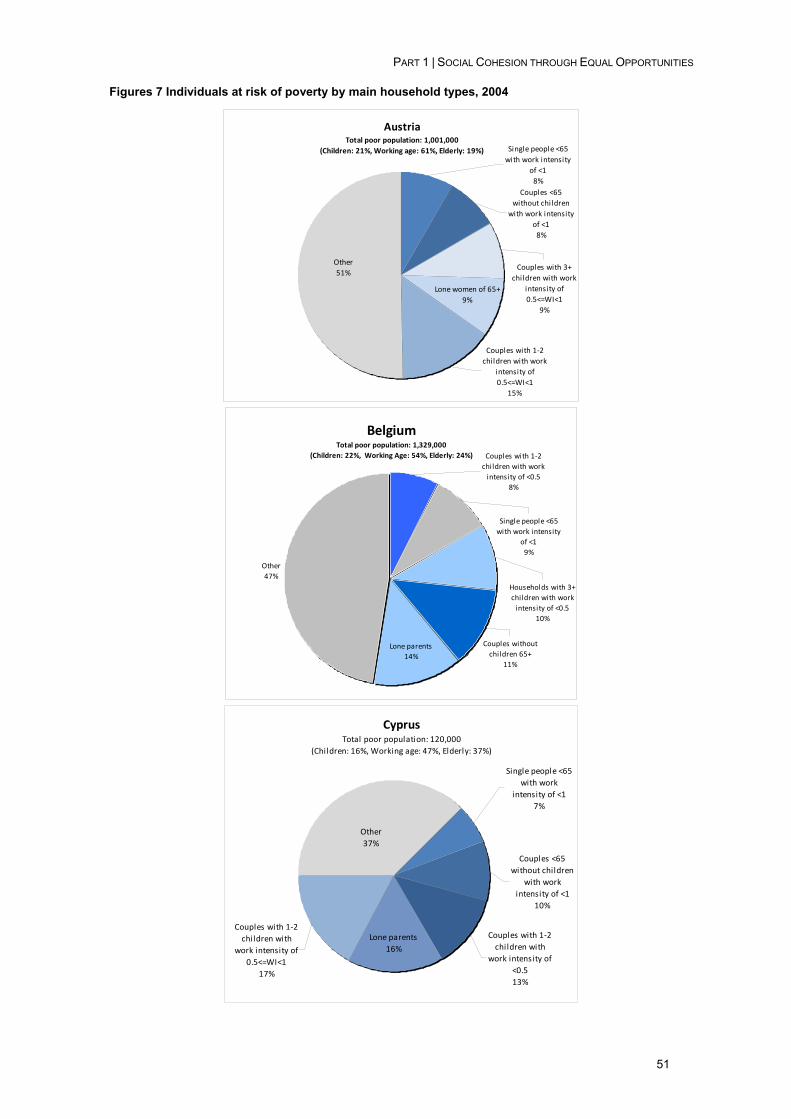
PART 1 | SOCIAL COHESION THROUGH EQUAL OPPORTUNITIES
51
Figures 7 Individuals at risk of poverty by main household types, 2004
Austria Total poor population: 1,001,000
(Children: 21%, Working age: 61%, Elderly: 19%)
Other51%
Couples with 1-2 children with work
intensity of 0.5<=WI<1
15%
Lone women of 65+9%
Single people <65 with work intensity
of <1 8%
Couples <65 without children
with work intensity of <1
8%
Couples with 3+ children with work
intensity of 0.5<=WI<1
9%
BelgiumTotal poor population: 1,329,000
(Children: 22%, Working Age: 54%, Elderly: 24%)
Other47%
Lone parents14%
Couples without children 65+
11%
Households with 3+ children with work
intensity of <0.510%
Single people <65 with work intensity
of <19%
Couples with 1-2 children with work
intensity of <0.58%
CyprusTotal poor population: 120,000
(Children: 16%, Working age: 47%, Elderly: 37%)
Other37%
Couples with 1-2 children with
work intensity of <0.513%
Couples <65 without children
with work intensity of <1
10%
Single people <65 with work
intensity of <1 7%
Couples with 1-2 children with
work intensity of 0.5<=WI<1
17%
Lone parents16%
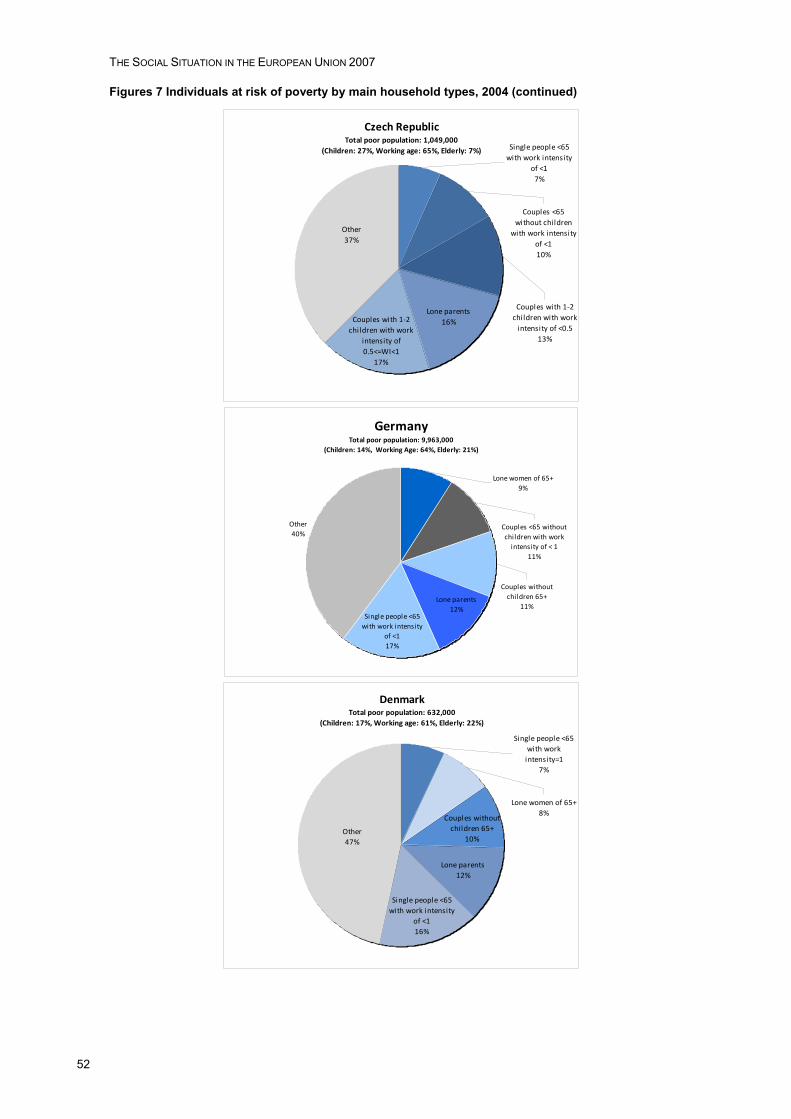
THE SOCIAL SITUATION IN THE EUROPEAN UNION 2007
52
Figures 7 Individuals at risk of poverty by main household types, 2004 (continued)
Czech Republic Total poor population: 1,049,000
(Children: 27%, Working age: 65%, Elderly: 7%)
Other37%
Lone parents16%Couples with 1-2
children with work intensity of 0.5<=WI<1
17%
Single people <65 with work intensity
of <1 7%
Couples <65 without children
with work intensity of <110%
Couples with 1-2 children with work
intensity of <0.513%
GermanyTotal poor population: 9,963,000
(Children: 14%, Working Age: 64%, Elderly: 21%)
Other40%
Lone parents12%
Single people <65 with work intensity
of <117%
Couples without children 65+
11%
Couples <65 without children with work
intensity of < 111%
Lone women of 65+9%
Denmark Total poor population: 632,000
(Children: 17%, Working age: 61%, Elderly: 22%)
Other47%
Single people <65 with work intensity
of <1 16%
Lone women of 65+8%
Lone parents12%
Couples without children 65+
10%
Single people <65 with work
intensity=17%
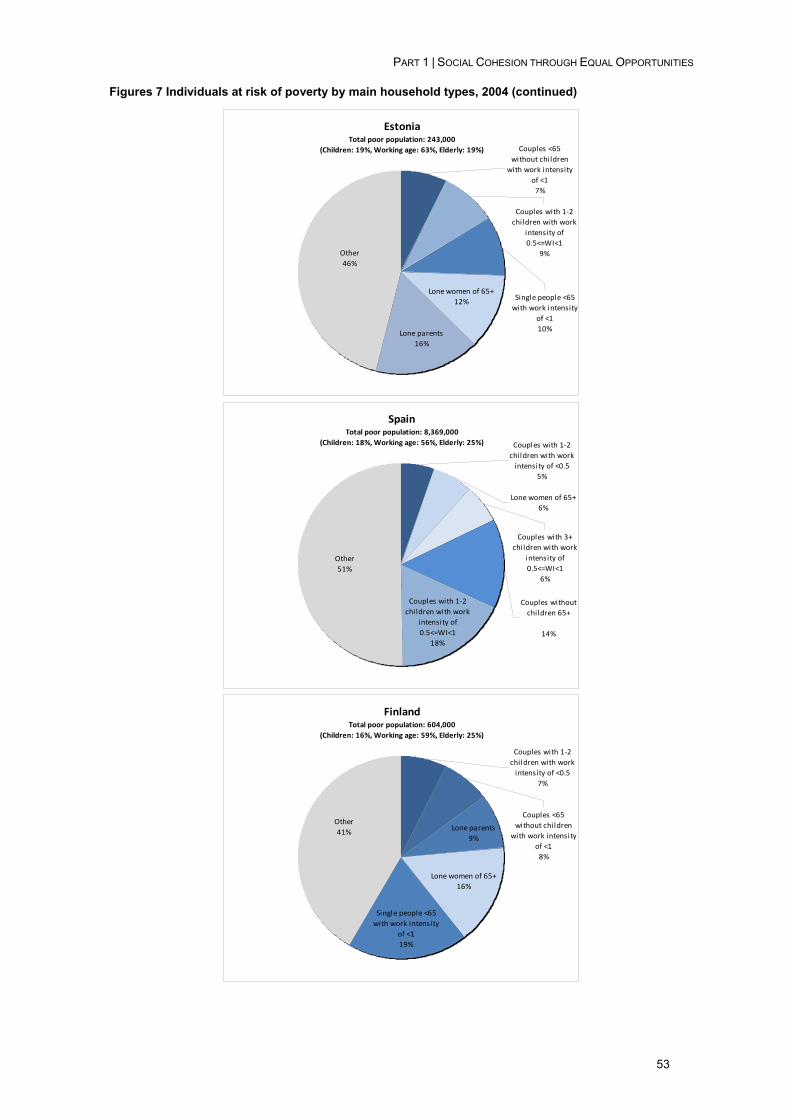
PART 1 | SOCIAL COHESION THROUGH EQUAL OPPORTUNITIES
53
Figures 7 Individuals at risk of poverty by main household types, 2004 (continued)
Estonia Total poor population: 243,000
(Children: 19%, Working age: 63%, Elderly: 19%)
Other46%
Lone parents16%
Lone women of 65+12%
Couples <65 without children
with work intensity of <1
7%
Couples with 1-2 children with work
intensity of 0.5<=WI<1
9%
Single people <65 with work intensity
of <1 10%
Spain Total poor population: 8,369,000
(Children: 18%, Working age: 56%, Elderly: 25%)
Other51%
Couples with 1-2 children with work
intensity of 0.5<=WI<1
18%
Couples without children 65+
14%
Couples with 1-2 children with work
intensity of <0.55%
Lone women of 65+6%
Couples with 3+ children with work
intensity of 0.5<=WI<1
6%
Finland Total poor population: 604,000
(Children: 16%, Working age: 59%, Elderly: 25%)
Other41%
Single people <65 with work intensity
of <1 19%
Lone parents9%
Lone women of 65+16%
Couples with 1-2 children with work
intensity of <0.57%
Couples <65 without children
with work intensity of <1
8%
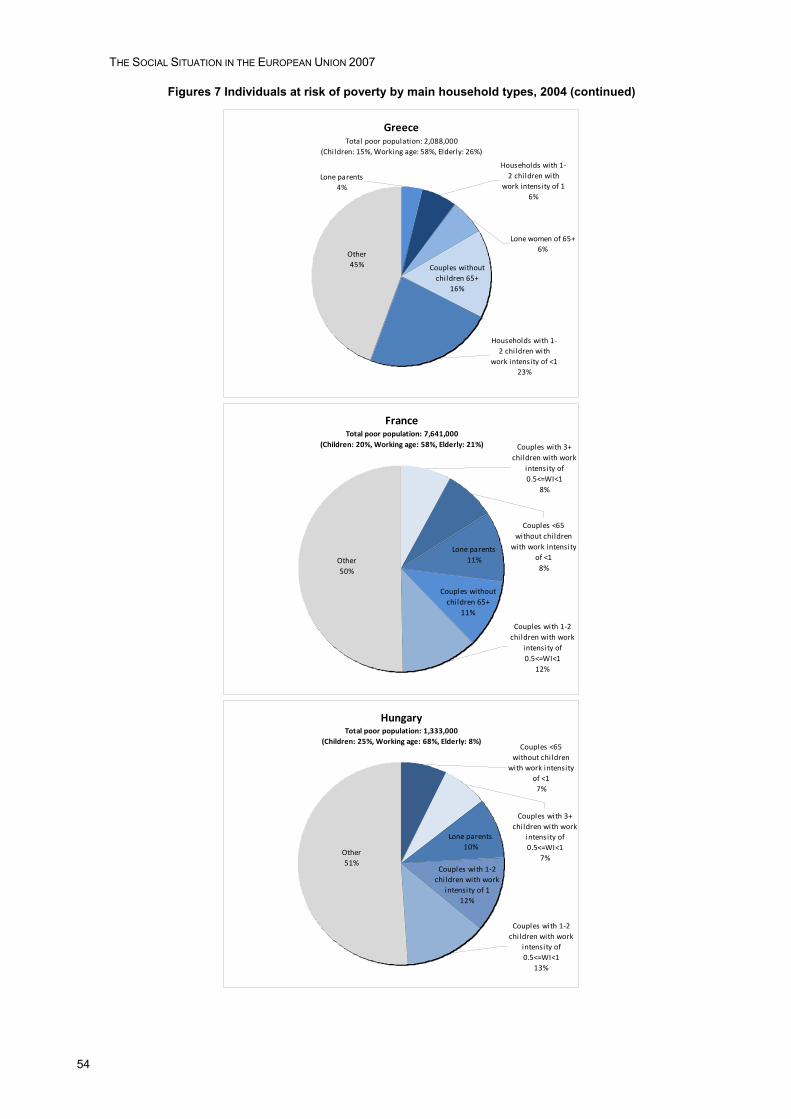
THE SOCIAL SITUATION IN THE EUROPEAN UNION 2007
54
Figures 7 Individuals at risk of poverty by main household types, 2004 (continued)
Greece Total poor population: 2,088,000
(Children: 15%, Working age: 58%, Elderly: 26%)
Lone women of 65+6%
Households with 1-2 children with
work intensity of 16%
Lone parents4%
Couples without children 65+
16%
Households with 1-2 children with
work intensity of <1 23%
Other45%
France Total poor population: 7,641,000
(Children: 20%, Working age: 58%, Elderly: 21%)
Other50%
Couples without children 65+
11%
Lone parents11%
Couples with 3+ children with work
intensity of 0.5<=WI<1
8%
Couples <65 without children
with work intensity of <1
8%
Couples with 1-2 children with work
intensity of 0.5<=WI<1
12%
Hungary Total poor population: 1,333,000
(Children: 25%, Working age: 68%, Elderly: 8%)
Couples with 1-2 children with work
intensity of 112%
Other51%
Couples with 1-2 children with work
intensity of 0.5<=WI<1
13%
Lone parents10%
Couples <65 without children
with work intensity of <1
7%
Couples with 3+ children with work
intensity of 0.5<=WI<1
7%
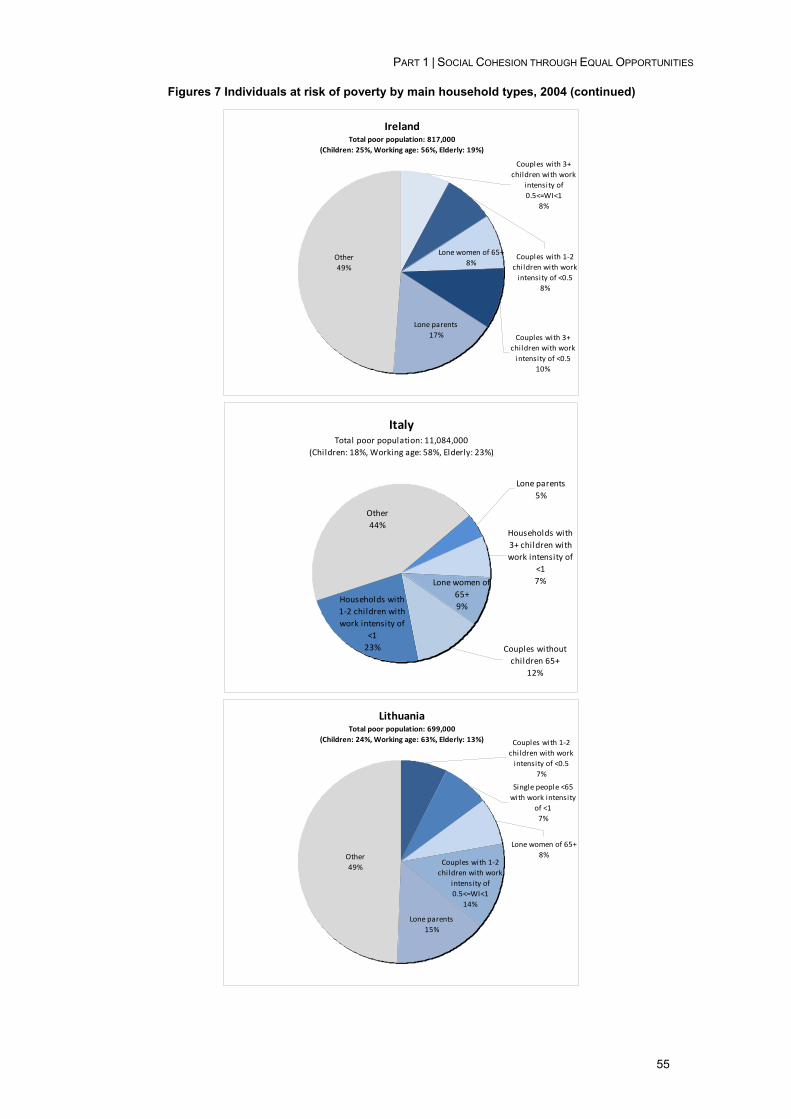
PART 1 | SOCIAL COHESION THROUGH EQUAL OPPORTUNITIES
55
Figures 7 Individuals at risk of poverty by main household types, 2004 (continued)
Ireland Total poor population: 817,000
(Children: 25%, Working age: 56%, Elderly: 19%)
Other49%
Lone parents17% Couples with 3+
children with work intensity of <0.5
10%
Lone women of 65+8%
Couples with 3+ children with work
intensity of 0.5<=WI<1
8%
Couples with 1-2 children with work
intensity of <0.58%
Italy Total poor population: 11,084,000
(Children: 18%, Working age: 58%, Elderly: 23%)
Lone parents5%
Households with 3+ children with work intensity of
<17%Lone women of
65+9%
Couples without children 65+
12%
Households with 1-2 children with work intensity of
<1 23%
Other44%
Lithuania Total poor population: 699,000
(Children: 24%, Working age: 63%, Elderly: 13%)
Lone parents15%
Other49%
Couples with 1-2 children with work
intensity of 0.5<=WI<1
14%
Couples with 1-2 children with work
intensity of <0.57%
Single people <65 with work intensity
of <1 7%
Lone women of 65+8%
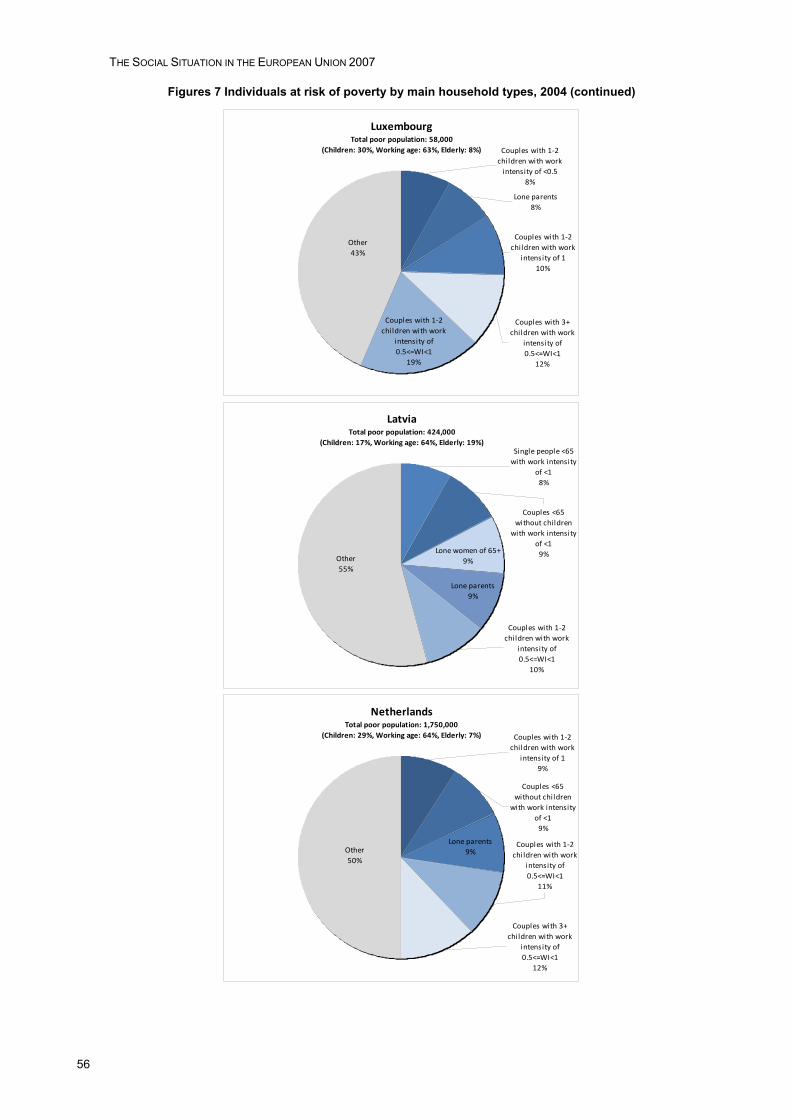
THE SOCIAL SITUATION IN THE EUROPEAN UNION 2007
56
Figures 7 Individuals at risk of poverty by main household types, 2004 (continued)
Luxembourg Total poor population: 58,000
(Children: 30%, Working age: 63%, Elderly: 8%)
Couples with 3+ children with work
intensity of 0.5<=WI<1
12%
Couples with 1-2 children with work
intensity of 0.5<=WI<1
19%
Other43%
Couples with 1-2 children with work
intensity of 110%
Lone parents8%
Couples with 1-2 children with work
intensity of <0.58%
Latvia Total poor population: 424,000
(Children: 17%, Working age: 64%, Elderly: 19%)
Other55%
Lone women of 65+9%
Lone parents9%
Couples with 1-2 children with work
intensity of 0.5<=WI<1
10%
Single people <65 with work intensity
of <1 8%
Couples <65 without children
with work intensity of <1
9%
Netherlands Total poor population: 1,750,000
(Children: 29%, Working age: 64%, Elderly: 7%)
Other50%
Couples with 3+ children with work
intensity of 0.5<=WI<1
12%
Couples with 1-2 children with work
intensity of 0.5<=WI<1
11%
Lone parents9%
Couples with 1-2 children with work
intensity of 19%
Couples <65 without children
with work intensity of <1
9%

PART 1 | SOCIAL COHESION THROUGH EQUAL OPPORTUNITIES
57
Figures 7 Individuals at risk of poverty by main household types, 2004 (continued)
Poland Total poor population: 7,595,000
(Children: 25%, Working age: 70%, Elderly: 5%)
Couples with 1-2 children with work
intensity of <0.59%
Couples with 3+ children with work
intensity of 0.5<=WI<1
7%
Couples with 3+ children with work
intensity of <0.55%
Couples with 1-2 children with work
intensity of 15%
Couples with 1-2 children with work
intensity of 0.5<=WI<1
11%
Other63%
PortugalTotal poor population: 2,041,000
(Children: 19%, Working Age: 56%, Elderly: 25%)
Other45%
Households <65 without chi ldren with work intensity of < 1
6%
Couples with 1-2 children with work
intensity 0.5<=WI<1 18%
Couples without chi ldren 65+
15%
Couples with 1-2 children with work
intensity of 1 10%
Lone women of 65+6%
Slovenia Total poor population: 238,000
(Children: 15%, Working age: 60%, Elderly: 25%)
Other46%
Couples with 1-2 children with work
intensity of <0.58%
Couples without children 65+
8%
Single people <65 with work intensity
of <1 9%
Couples with 1-2 children with work
intensity of 0.5<=WI<1
14%
Lone women of 65+15%
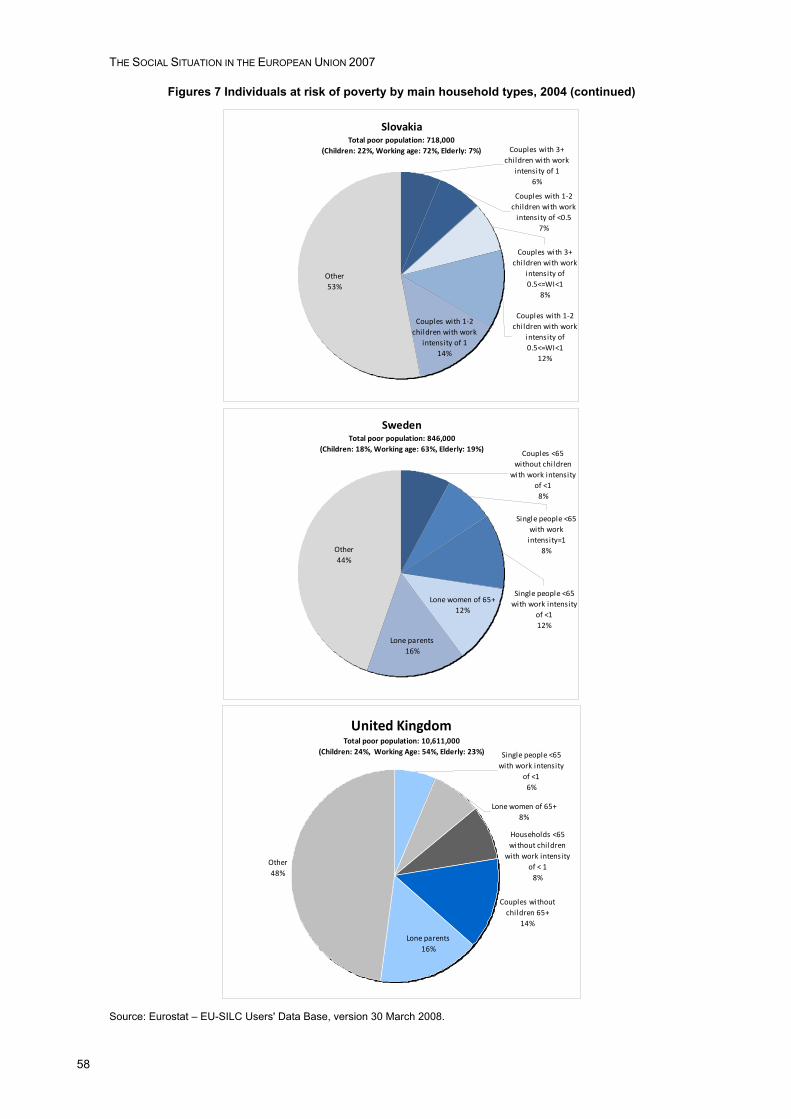
THE SOCIAL SITUATION IN THE EUROPEAN UNION 2007
58
Figures 7 Individuals at risk of poverty by main household types, 2004 (continued)
Slovakia Total poor population: 718,000
(Children: 22%, Working age: 72%, Elderly: 7%)
Other53%
Couples with 3+ children with work
intensity of 16%
Couples with 1-2 children with work
intensity of <0.57%
Couples with 3+ children with work
intensity of 0.5<=WI<1
8%
Couples with 1-2 children with work
intensity of 0.5<=WI<1
12%
Couples with 1-2 children with work
intensity of 114%
Sweden Total poor population: 846,000
(Children: 18%, Working age: 63%, Elderly: 19%)
Lone parents16%
Other44%
Couples <65 without children
with work intensity of <1
8%
Single people <65 with work intensity=1
8%
Single people <65 with work intensity
of <1 12%
Lone women of 65+12%
United KingdomTotal poor population: 10,611,000
(Children: 24%, Working Age: 54%, Elderly: 23%)
Other48%
Single people <65 with work intensity
of <1 6%
Lone women of 65+8%
Households <65 without children
with work intensity of < 1
8%
Couples without children 65+
14%
Lone parents16%
Source: Eurostat – EU-SILC Users' Data Base, version 30 March 2008.
PART 1 | SOCIAL COHESION THROUGH EQUAL OPPORTUNITIES
59
Concluding remarks
The above analysis indicates that there are differences between the social groups which have the highest risk of poverty, in the sense that the proportion of them with income below 60 % of the median in the country where they live is relatively large. These differences reflect the differing composition of households across the EU — and, in particular, the extent to which people live alone instead of sharing a house with a spouse, partner or other people — as well as differences in the level of pensions and social transfers, especially transfers to the unemployed. They also reflect, however, the level of wages in different countries and the ability of households to secure a level of income above the at-risk-of-poverty threshold without more than one person being in employment. This is especially the case for households where there are dependent children, which may point to a lack of affordable childcare preventing both partners from working.
In 14 of the 24 Member States, therefore, couples with one or two children where one of the partners is not working (at least throughout the year) are the largest group among those at risk of poverty, while in another three countries they are the second largest group. All of the new Member States apart from Estonia and Cyprus are included in this group of 14 countries. In another two countries, Belgium and Ireland, couples with three or more children where one of the partners is not in work represent the largest group, and these are the second or third largest group among those at risk of poverty in nine of the countries where those with one or two children are the largest.
In other countries, people living alone represent the largest group among the population with income below the threshold. This is the case in Denmark, Finland and Sweden as well as in Estonia, where people of working age living alone feature among the main subgroups of the population at risk of poverty, especially if they are not employed throughout the year, (though, in Denmark and Sweden, even if they are). Lone parents also figure prominently among the main groups with income below the threshold in these four countries — though to a lesser extent in Finland than in the other three — as they do in Germany and the UK.
In addition, in Denmark, Estonia, Finland, Sweden and the UK, as well as Cyprus, people of 65 and over feature among the main groups at risk of poverty, either as couples or women of this age living alone, or both. This is also the case in Greece, Italy, Portugal and Slovenia.
This diversity among the social groups which make up the bulk of those at risk of poverty across the EU emphasises the differences between Member States in the way that policy would need to be focused in order to achieve a major reduction in the number of people at risk of poverty.
2.5. Low incomes and living standards in the EU The main indicator of the risk of poverty across the EU is the proportion of people with disposable income below 60 % of the national median. However, this measure of relative income can only be regarded as a proxy for the ability of households to maintain a standard of living which enables the people concerned to feel part of their community. As this indicator is calculated relative to national median income, it also leaves open the question of how far people in different Member States have difficulty in affording consumer goods and other items which are taken for granted elsewhere in the Union.
The EU-SILC contains information which throws light on both these issues. In particular, it indicates whether or not people with different income levels are able to afford a range of consumer durables and an annual holiday as well as basic necessities, like a square meal at least once every other day or paying their utility bills. It also indicates their housing conditions and whether or not they have difficulty in making ends meet or in facing unexpected expenses.
It, accordingly, allows estimates to be made of the relative number of people in each Member State who cannot afford at least one of a range of items, thus possibly causing a sense of deprivation. It also makes it possible to assess the proportion of people who suffer from multiple deprivation in that they are unable to afford more than one of the items in question.
The analysis below examines, first, the various indicators of material deprivation and financial hardship and the proportion of the population in each EU country who report experiencing one or the other or both, distinguishing those with income above and below the at-risk-of-poverty threshold. Secondly, it considers people's housing conditions, focusing on problems like a leaking roof, damp walls, rotten floors or window-frames, and the link between having these kinds of problem and having both low income and financial difficulties. In each case, it also examines the link between the overall prevalence of deprivation and median disposable income per head (measured in equivalised and purchasing power parity terms) across countries.
As such, the results of the analysis are intended to complement the estimates of the risk of poverty, measured by the relative number of people with (equivalised) income below 60 % of the national median, which is one the main indicators for monitoring the social situation across the EU, and to provide an additional insight into the extent of deprivation in different Member States.
Ability to afford key consumer durables
Analysis of the information contained in the EU-SILC shows that in nearly all EU countries, very few people report being unable to afford either a telephone, a colour TV or a washing machine — or, more accurately, live in households which cannot afford at least one of these items (see Figure 8 — note that countries are ranked
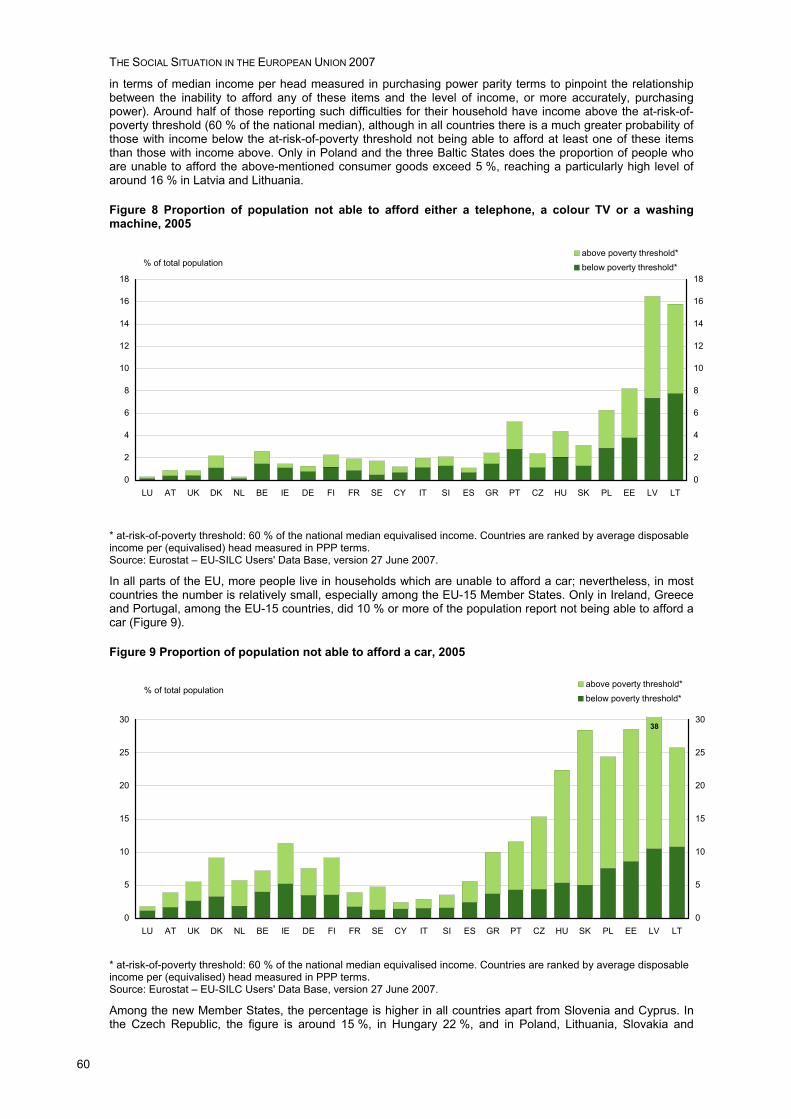
THE SOCIAL SITUATION IN THE EUROPEAN UNION 2007
60
in terms of median income per head measured in purchasing power parity terms to pinpoint the relationship between the inability to afford any of these items and the level of income, or more accurately, purchasing power). Around half of those reporting such difficulties for their household have income above the at-risk-of-poverty threshold (60 % of the national median), although in all countries there is a much greater probability of those with income below the at-risk-of-poverty threshold not being able to afford at least one of these items than those with income above. Only in Poland and the three Baltic States does the proportion of people who are unable to afford the above-mentioned consumer goods exceed 5 %, reaching a particularly high level of around 16 % in Latvia and Lithuania.
Figure 8 Proportion of population not able to afford either a telephone, a colour TV or a washing machine, 2005
0
2
4
6
8
10
12
14
16
18
LU AT UK DK NL BE IE DE FI FR SE CY IT SI ES GR PT CZ HU SK PL EE LV LT0
2
4
6
8
10
12
14
16
18
above poverty threshold*below poverty threshold*% of total population
* at-risk-of-poverty threshold: 60 % of the national median equivalised income. Countries are ranked by average disposable income per (equivalised) head measured in PPP terms. Source: Eurostat – EU-SILC Users' Data Base, version 27 June 2007.
In all parts of the EU, more people live in households which are unable to afford a car; nevertheless, in most countries the number is relatively small, especially among the EU-15 Member States. Only in Ireland, Greece and Portugal, among the EU-15 countries, did 10 % or more of the population report not being able to afford a car (Figure 9).
Figure 9 Proportion of population not able to afford a car, 2005
0
5
10
15
20
25
30
LU AT UK DK NL BE IE DE FI FR SE CY IT SI ES GR PT CZ HU SK PL EE LV LT0
5
10
15
20
25
30
above poverty threshold*below poverty threshold*
% of total population
38
* at-risk-of-poverty threshold: 60 % of the national median equivalised income. Countries are ranked by average disposable income per (equivalised) head measured in PPP terms. Source: Eurostat – EU-SILC Users' Data Base, version 27 June 2007.
Among the new Member States, the percentage is higher in all countries apart from Slovenia and Cyprus. In the Czech Republic, the figure is around 15 %, in Hungary 22 %, and in Poland, Lithuania, Slovakia and
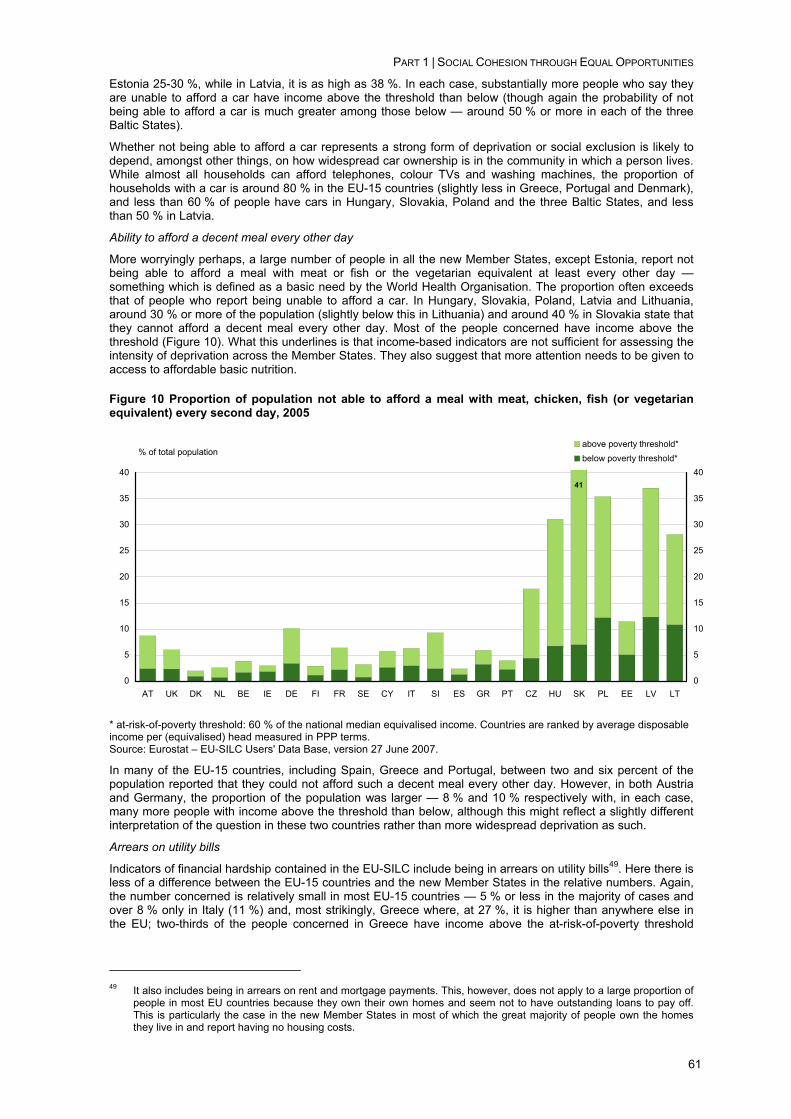
PART 1 | SOCIAL COHESION THROUGH EQUAL OPPORTUNITIES
61
Estonia 25-30 %, while in Latvia, it is as high as 38 %. In each case, substantially more people who say they are unable to afford a car have income above the threshold than below (though again the probability of not being able to afford a car is much greater among those below — around 50 % or more in each of the three Baltic States).
Whether not being able to afford a car represents a strong form of deprivation or social exclusion is likely to depend, amongst other things, on how widespread car ownership is in the community in which a person lives. While almost all households can afford telephones, colour TVs and washing machines, the proportion of households with a car is around 80 % in the EU-15 countries (slightly less in Greece, Portugal and Denmark), and less than 60 % of people have cars in Hungary, Slovakia, Poland and the three Baltic States, and less than 50 % in Latvia.
Ability to afford a decent meal every other day
More worryingly perhaps, a large number of people in all the new Member States, except Estonia, report not being able to afford a meal with meat or fish or the vegetarian equivalent at least every other day — something which is defined as a basic need by the World Health Organisation. The proportion often exceeds that of people who report being unable to afford a car. In Hungary, Slovakia, Poland, Latvia and Lithuania, around 30 % or more of the population (slightly below this in Lithuania) and around 40 % in Slovakia state that they cannot afford a decent meal every other day. Most of the people concerned have income above the threshold (Figure 10). What this underlines is that income-based indicators are not sufficient for assessing the intensity of deprivation across the Member States. They also suggest that more attention needs to be given to access to affordable basic nutrition.
Figure 10 Proportion of population not able to afford a meal with meat, chicken, fish (or vegetarian equivalent) every second day, 2005
0
5
10
15
20
25
30
35
40
AT UK DK NL BE IE DE FI FR SE CY IT SI ES GR PT CZ HU SK PL EE LV LT0
5
10
15
20
25
30
35
40
above poverty threshold*below poverty threshold*
% of total population
41
* at-risk-of-poverty threshold: 60 % of the national median equivalised income. Countries are ranked by average disposable income per (equivalised) head measured in PPP terms. Source: Eurostat – EU-SILC Users' Data Base, version 27 June 2007.
In many of the EU-15 countries, including Spain, Greece and Portugal, between two and six percent of the population reported that they could not afford such a decent meal every other day. However, in both Austria and Germany, the proportion of the population was larger — 8 % and 10 % respectively with, in each case, many more people with income above the threshold than below, although this might reflect a slightly different interpretation of the question in these two countries rather than more widespread deprivation as such.
Arrears on utility bills
Indicators of financial hardship contained in the EU-SILC include being in arrears on utility bills49. Here there is less of a difference between the EU-15 countries and the new Member States in the relative numbers. Again, the number concerned is relatively small in most EU-15 countries — 5 % or less in the majority of cases and over 8 % only in Italy (11 %) and, most strikingly, Greece where, at 27 %, it is higher than anywhere else in the EU; two-thirds of the people concerned in Greece have income above the at-risk-of-poverty threshold
49 It also includes being in arrears on rent and mortgage payments. This, however, does not apply to a large proportion of
people in most EU countries because they own their own homes and seem not to have outstanding loans to pay off. This is particularly the case in the new Member States in most of which the great majority of people own the homes they live in and report having no housing costs.
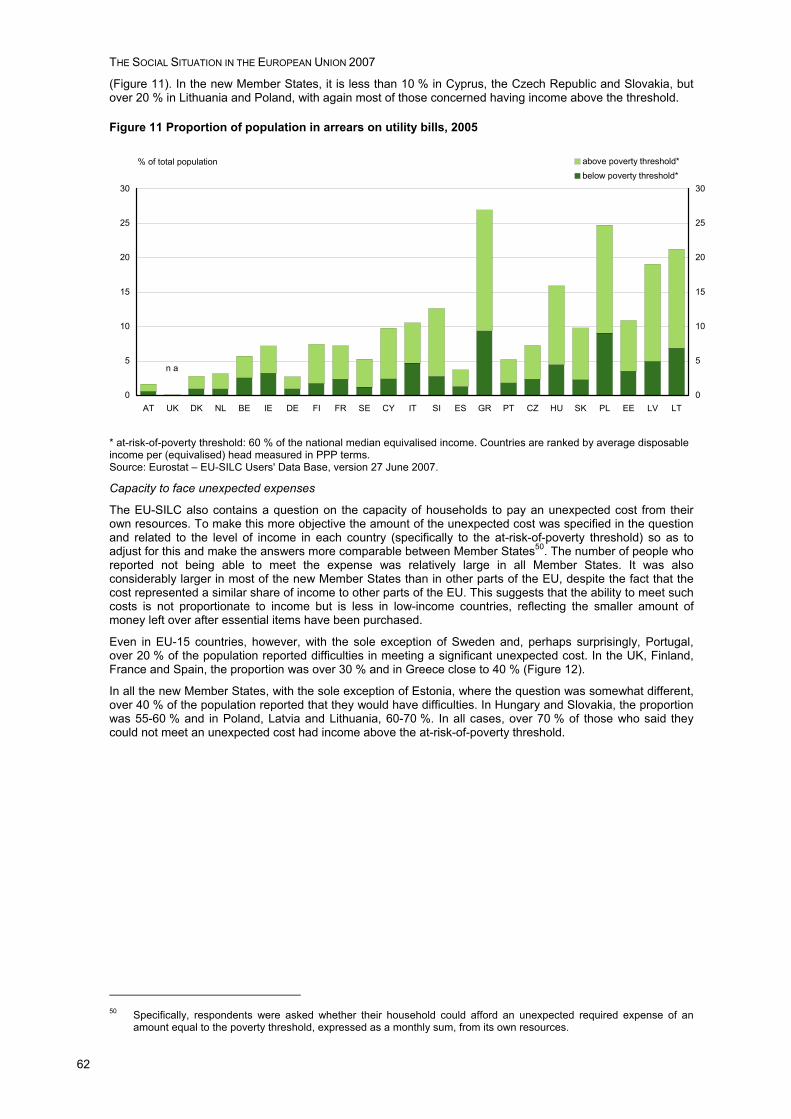
THE SOCIAL SITUATION IN THE EUROPEAN UNION 2007
62
(Figure 11). In the new Member States, it is less than 10 % in Cyprus, the Czech Republic and Slovakia, but over 20 % in Lithuania and Poland, with again most of those concerned having income above the threshold.
Figure 11 Proportion of population in arrears on utility bills, 2005
0
5
10
15
20
25
30
AT UK DK NL BE IE DE FI FR SE CY IT SI ES GR PT CZ HU SK PL EE LV LT0
5
10
15
20
25
30
above poverty threshold*below poverty threshold*
% of total population
n a
* at-risk-of-poverty threshold: 60 % of the national median equivalised income. Countries are ranked by average disposable income per (equivalised) head measured in PPP terms. Source: Eurostat – EU-SILC Users' Data Base, version 27 June 2007.
Capacity to face unexpected expenses
The EU-SILC also contains a question on the capacity of households to pay an unexpected cost from their own resources. To make this more objective the amount of the unexpected cost was specified in the question and related to the level of income in each country (specifically to the at-risk-of-poverty threshold) so as to adjust for this and make the answers more comparable between Member States50. The number of people who reported not being able to meet the expense was relatively large in all Member States. It was also considerably larger in most of the new Member States than in other parts of the EU, despite the fact that the cost represented a similar share of income to other parts of the EU. This suggests that the ability to meet such costs is not proportionate to income but is less in low-income countries, reflecting the smaller amount of money left over after essential items have been purchased.
Even in EU-15 countries, however, with the sole exception of Sweden and, perhaps surprisingly, Portugal, over 20 % of the population reported difficulties in meeting a significant unexpected cost. In the UK, Finland, France and Spain, the proportion was over 30 % and in Greece close to 40 % (Figure 12).
In all the new Member States, with the sole exception of Estonia, where the question was somewhat different, over 40 % of the population reported that they would have difficulties. In Hungary and Slovakia, the proportion was 55-60 % and in Poland, Latvia and Lithuania, 60-70 %. In all cases, over 70 % of those who said they could not meet an unexpected cost had income above the at-risk-of-poverty threshold.
50 Specifically, respondents were asked whether their household could afford an unexpected required expense of an
amount equal to the poverty threshold, expressed as a monthly sum, from its own resources.
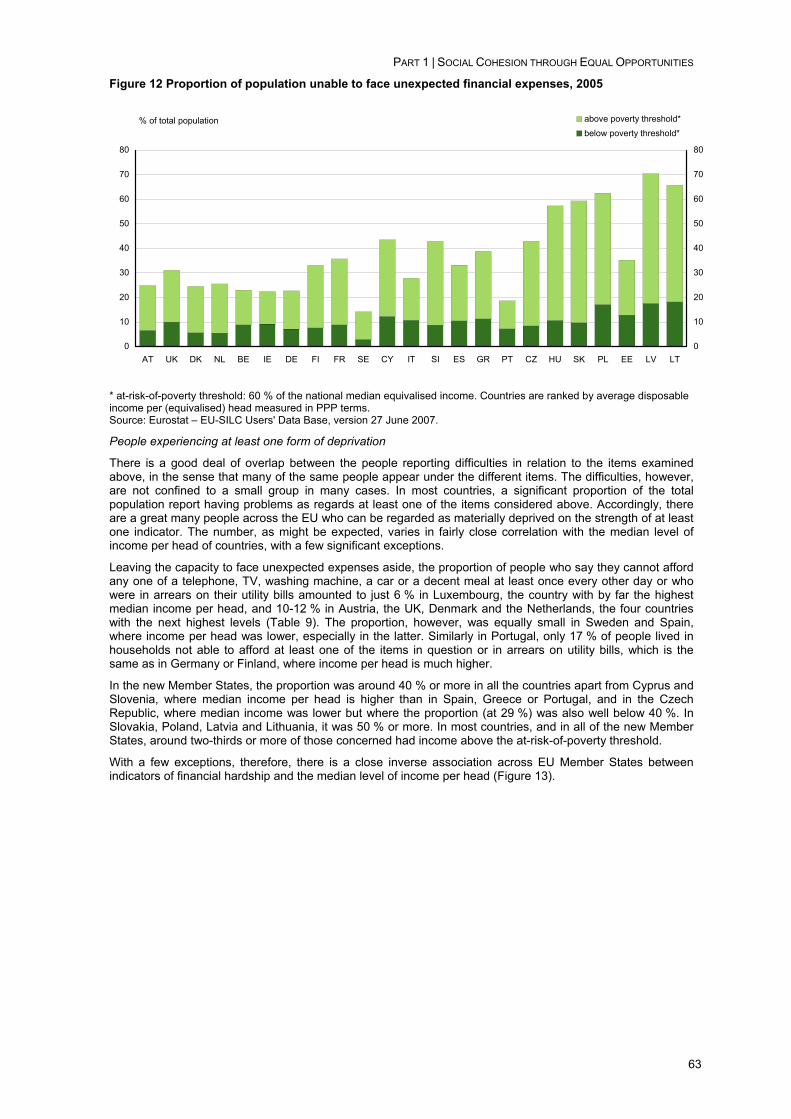
PART 1 | SOCIAL COHESION THROUGH EQUAL OPPORTUNITIES
63
Figure 12 Proportion of population unable to face unexpected financial expenses, 2005
0
10
20
30
40
50
60
70
80
AT UK DK NL BE IE DE FI FR SE CY IT SI ES GR PT CZ HU SK PL EE LV LT0
10
20
30
40
50
60
70
80
above poverty threshold*below poverty threshold*
% of total population
* at-risk-of-poverty threshold: 60 % of the national median equivalised income. Countries are ranked by average disposable income per (equivalised) head measured in PPP terms. Source: Eurostat – EU-SILC Users' Data Base, version 27 June 2007.
People experiencing at least one form of deprivation
There is a good deal of overlap between the people reporting difficulties in relation to the items examined above, in the sense that many of the same people appear under the different items. The difficulties, however, are not confined to a small group in many cases. In most countries, a significant proportion of the total population report having problems as regards at least one of the items considered above. Accordingly, there are a great many people across the EU who can be regarded as materially deprived on the strength of at least one indicator. The number, as might be expected, varies in fairly close correlation with the median level of income per head of countries, with a few significant exceptions.
Leaving the capacity to face unexpected expenses aside, the proportion of people who say they cannot afford any one of a telephone, TV, washing machine, a car or a decent meal at least once every other day or who were in arrears on their utility bills amounted to just 6 % in Luxembourg, the country with by far the highest median income per head, and 10-12 % in Austria, the UK, Denmark and the Netherlands, the four countries with the next highest levels (Table 9). The proportion, however, was equally small in Sweden and Spain, where income per head was lower, especially in the latter. Similarly in Portugal, only 17 % of people lived in households not able to afford at least one of the items in question or in arrears on utility bills, which is the same as in Germany or Finland, where income per head is much higher.
In the new Member States, the proportion was around 40 % or more in all the countries apart from Cyprus and Slovenia, where median income per head is higher than in Spain, Greece or Portugal, and in the Czech Republic, where median income was lower but where the proportion (at 29 %) was also well below 40 %. In Slovakia, Poland, Latvia and Lithuania, it was 50 % or more. In most countries, and in all of the new Member States, around two-thirds or more of those concerned had income above the at-risk-of-poverty threshold.
With a few exceptions, therefore, there is a close inverse association across EU Member States between indicators of financial hardship and the median level of income per head (Figure 13).
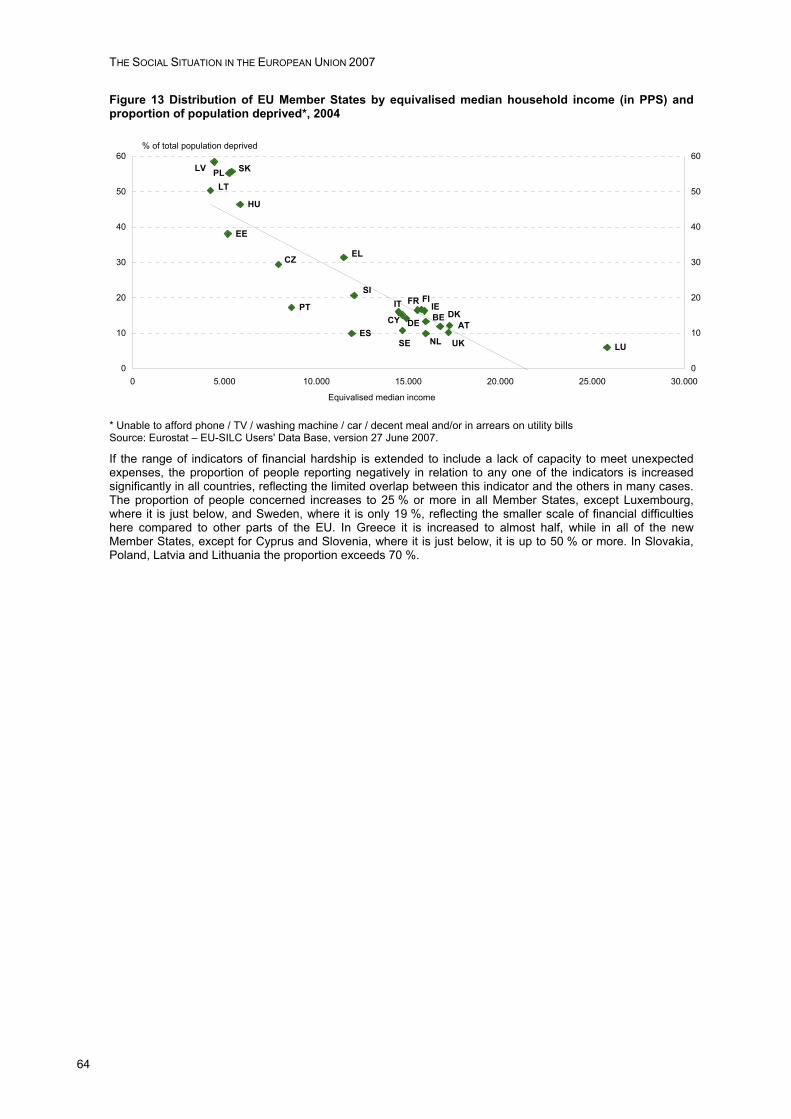
THE SOCIAL SITUATION IN THE EUROPEAN UNION 2007
64
Figure 13 Distribution of EU Member States by equivalised median household income (in PPS) and proportion of population deprived*, 2004
UKSE
FI
SK
SI
PT
PL
AT
NL
HU
LU
LT
LV
CY
IT FR
ES
EL
IE
EE
DEDK
CZ
BE
0
10
20
30
40
50
60
0 5.000 10.000 15.000 20.000 25.000 30.0000
10
20
30
40
50
60% of total population deprived
Equivalised median income
* Unable to afford phone / TV / washing machine / car / decent meal and/or in arrears on utility bills Source: Eurostat – EU-SILC Users' Data Base, version 27 June 2007.
If the range of indicators of financial hardship is extended to include a lack of capacity to meet unexpected expenses, the proportion of people reporting negatively in relation to any one of the indicators is increased significantly in all countries, reflecting the limited overlap between this indicator and the others in many cases. The proportion of people concerned increases to 25 % or more in all Member States, except Luxembourg, where it is just below, and Sweden, where it is only 19 %, reflecting the smaller scale of financial difficulties here compared to other parts of the EU. In Greece it is increased to almost half, while in all of the new Member States, except for Cyprus and Slovenia, where it is just below, it is up to 50 % or more. In Slovakia, Poland, Latvia and Lithuania the proportion exceeds 70 %.
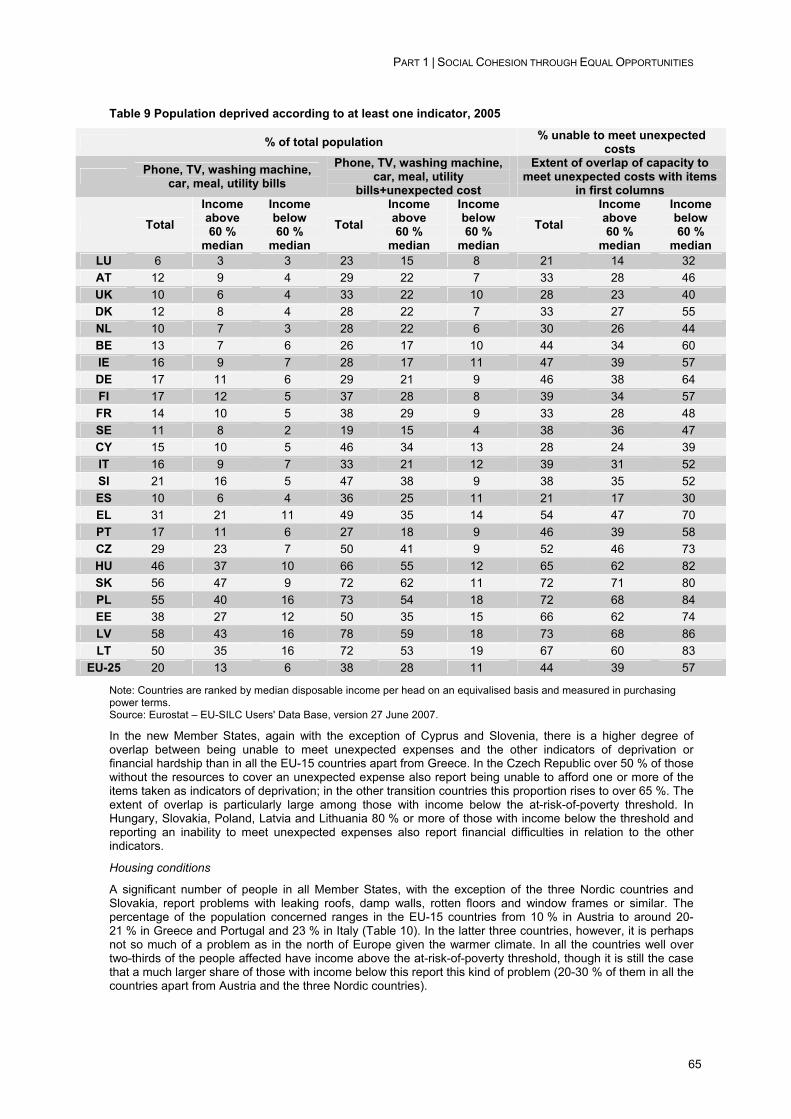
PART 1 | SOCIAL COHESION THROUGH EQUAL OPPORTUNITIES
65
Table 9 Population deprived according to at least one indicator, 2005
% of total population % unable to meet unexpected costs
Phone, TV, washing machine, car, meal, utility bills
Phone, TV, washing machine, car, meal, utility
bills+unexpected cost
Extent of overlap of capacity to meet unexpected costs with items
in first columns
Total Income above 60 %
median
Income below 60 %
median Total
Income above 60 %
median
Income below 60 %
median Total
Income above 60 %
median
Income below 60 %
median LU 6 3 3 23 15 8 21 14 32 AT 12 9 4 29 22 7 33 28 46 UK 10 6 4 33 22 10 28 23 40 DK 12 8 4 28 22 7 33 27 55 NL 10 7 3 28 22 6 30 26 44 BE 13 7 6 26 17 10 44 34 60 IE 16 9 7 28 17 11 47 39 57 DE 17 11 6 29 21 9 46 38 64 FI 17 12 5 37 28 8 39 34 57 FR 14 10 5 38 29 9 33 28 48 SE 11 8 2 19 15 4 38 36 47 CY 15 10 5 46 34 13 28 24 39 IT 16 9 7 33 21 12 39 31 52 SI 21 16 5 47 38 9 38 35 52 ES 10 6 4 36 25 11 21 17 30 EL 31 21 11 49 35 14 54 47 70 PT 17 11 6 27 18 9 46 39 58 CZ 29 23 7 50 41 9 52 46 73 HU 46 37 10 66 55 12 65 62 82 SK 56 47 9 72 62 11 72 71 80 PL 55 40 16 73 54 18 72 68 84 EE 38 27 12 50 35 15 66 62 74 LV 58 43 16 78 59 18 73 68 86 LT 50 35 16 72 53 19 67 60 83
EU-25 20 13 6 38 28 11 44 39 57
Note: Countries are ranked by median disposable income per head on an equivalised basis and measured in purchasing power terms. Source: Eurostat – EU-SILC Users' Data Base, version 27 June 2007.
In the new Member States, again with the exception of Cyprus and Slovenia, there is a higher degree of overlap between being unable to meet unexpected expenses and the other indicators of deprivation or financial hardship than in all the EU-15 countries apart from Greece. In the Czech Republic over 50 % of those without the resources to cover an unexpected expense also report being unable to afford one or more of the items taken as indicators of deprivation; in the other transition countries this proportion rises to over 65 %. The extent of overlap is particularly large among those with income below the at-risk-of-poverty threshold. In Hungary, Slovakia, Poland, Latvia and Lithuania 80 % or more of those with income below the threshold and reporting an inability to meet unexpected expenses also report financial difficulties in relation to the other indicators.
Housing conditions
A significant number of people in all Member States, with the exception of the three Nordic countries and Slovakia, report problems with leaking roofs, damp walls, rotten floors and window frames or similar. The percentage of the population concerned ranges in the EU-15 countries from 10 % in Austria to around 20-21 % in Greece and Portugal and 23 % in Italy (Table 10). In the latter three countries, however, it is perhaps not so much of a problem as in the north of Europe given the warmer climate. In all the countries well over two-thirds of the people affected have income above the at-risk-of-poverty threshold, though it is still the case that a much larger share of those with income below this report this kind of problem (20-30 % of them in all the countries apart from Austria and the three Nordic countries).
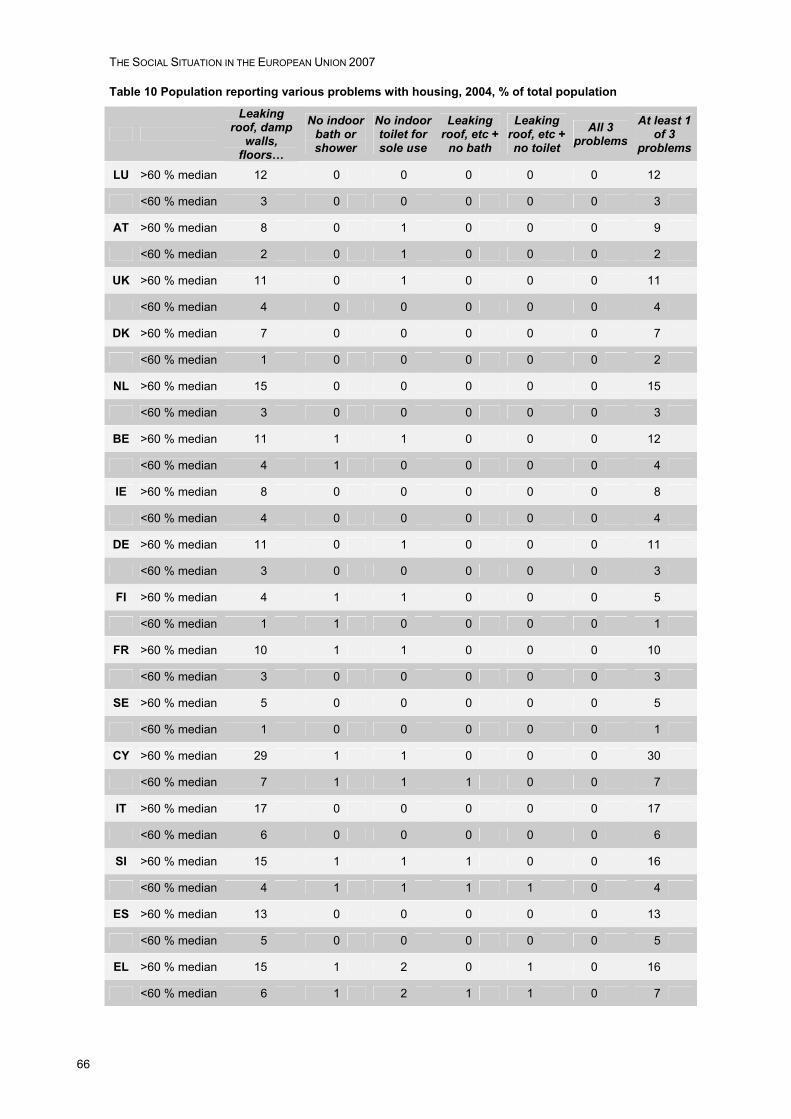
THE SOCIAL SITUATION IN THE EUROPEAN UNION 2007
66
Table 10 Population reporting various problems with housing, 2004, % of total population
Leaking
roof, damp walls,
floors…
No indoor bath or shower
No indoor toilet for sole use
Leaking roof, etc +
no bath
Leaking roof, etc + no toilet
All 3 problems
At least 1 of 3
problems
LU >60 % median 12 0 0 0 0 0 12
<60 % median 3 0 0 0 0 0 3
AT >60 % median 8 0 1 0 0 0 9
<60 % median 2 0 1 0 0 0 2
UK >60 % median 11 0 1 0 0 0 11
<60 % median 4 0 0 0 0 0 4
DK >60 % median 7 0 0 0 0 0 7
<60 % median 1 0 0 0 0 0 2
NL >60 % median 15 0 0 0 0 0 15
<60 % median 3 0 0 0 0 0 3
BE >60 % median 11 1 1 0 0 0 12
<60 % median 4 1 0 0 0 0 4
IE >60 % median 8 0 0 0 0 0 8
<60 % median 4 0 0 0 0 0 4
DE >60 % median 11 0 1 0 0 0 11
<60 % median 3 0 0 0 0 0 3
FI >60 % median 4 1 1 0 0 0 5
<60 % median 1 1 0 0 0 0 1
FR >60 % median 10 1 1 0 0 0 10
<60 % median 3 0 0 0 0 0 3
SE >60 % median 5 0 0 0 0 0 5
<60 % median 1 0 0 0 0 0 1
CY >60 % median 29 1 1 0 0 0 30
<60 % median 7 1 1 1 0 0 7
IT >60 % median 17 0 0 0 0 0 17
<60 % median 6 0 0 0 0 0 6
SI >60 % median 15 1 1 1 0 0 16
<60 % median 4 1 1 1 1 0 4
ES >60 % median 13 0 0 0 0 0 13
<60 % median 5 0 0 0 0 0 5
EL >60 % median 15 1 2 0 1 0 16
<60 % median 6 1 2 1 1 0 7
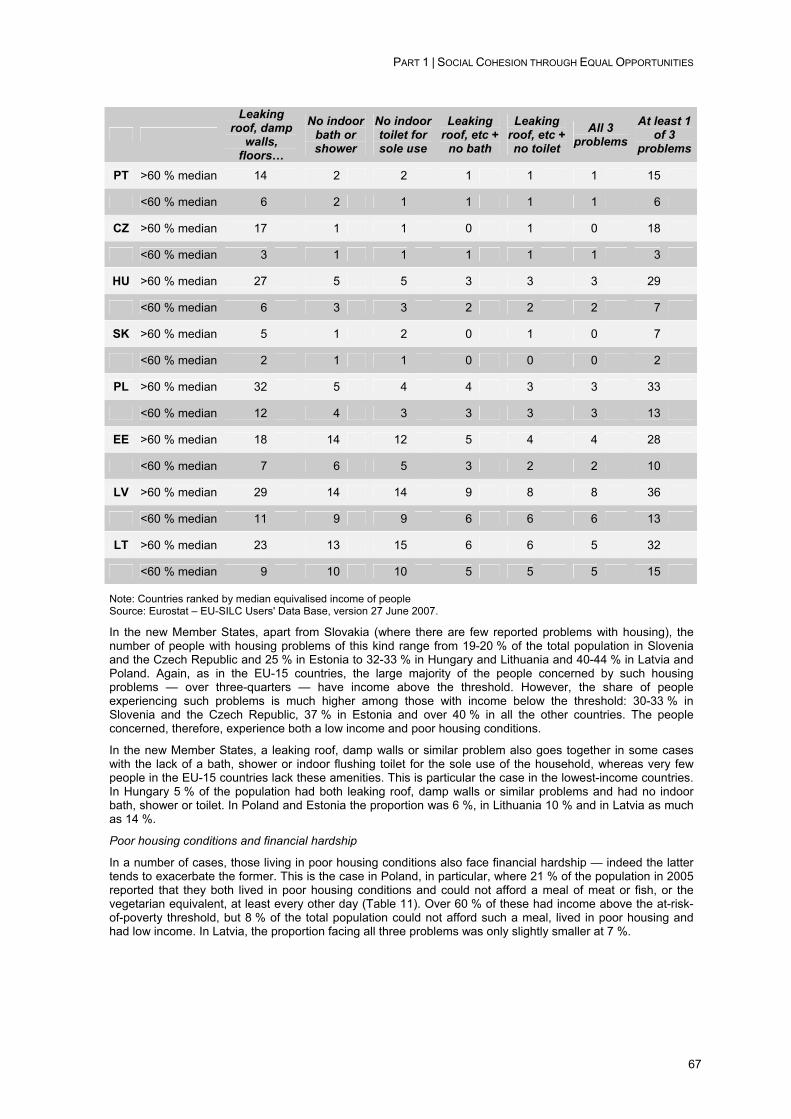
PART 1 | SOCIAL COHESION THROUGH EQUAL OPPORTUNITIES
67
Leaking
roof, damp walls,
floors…
No indoor bath or shower
No indoor toilet for sole use
Leaking roof, etc +
no bath
Leaking roof, etc + no toilet
All 3 problems
At least 1 of 3
problems
PT >60 % median 14 2 2 1 1 1 15
<60 % median 6 2 1 1 1 1 6
CZ >60 % median 17 1 1 0 1 0 18
<60 % median 3 1 1 1 1 1 3
HU >60 % median 27 5 5 3 3 3 29
<60 % median 6 3 3 2 2 2 7
SK >60 % median 5 1 2 0 1 0 7
<60 % median 2 1 1 0 0 0 2
PL >60 % median 32 5 4 4 3 3 33
<60 % median 12 4 3 3 3 3 13
EE >60 % median 18 14 12 5 4 4 28
<60 % median 7 6 5 3 2 2 10
LV >60 % median 29 14 14 9 8 8 36
<60 % median 11 9 9 6 6 6 13
LT >60 % median 23 13 15 6 6 5 32
<60 % median 9 10 10 5 5 5 15
Note: Countries ranked by median equivalised income of people Source: Eurostat – EU-SILC Users' Data Base, version 27 June 2007.
In the new Member States, apart from Slovakia (where there are few reported problems with housing), the number of people with housing problems of this kind range from 19-20 % of the total population in Slovenia and the Czech Republic and 25 % in Estonia to 32-33 % in Hungary and Lithuania and 40-44 % in Latvia and Poland. Again, as in the EU-15 countries, the large majority of the people concerned by such housing problems — over three-quarters — have income above the threshold. However, the share of people experiencing such problems is much higher among those with income below the threshold: 30-33 % in Slovenia and the Czech Republic, 37 % in Estonia and over 40 % in all the other countries. The people concerned, therefore, experience both a low income and poor housing conditions.
In the new Member States, a leaking roof, damp walls or similar problem also goes together in some cases with the lack of a bath, shower or indoor flushing toilet for the sole use of the household, whereas very few people in the EU-15 countries lack these amenities. This is particular the case in the lowest-income countries. In Hungary 5 % of the population had both leaking roof, damp walls or similar problems and had no indoor bath, shower or toilet. In Poland and Estonia the proportion was 6 %, in Lithuania 10 % and in Latvia as much as 14 %.
Poor housing conditions and financial hardship
In a number of cases, those living in poor housing conditions also face financial hardship — indeed the latter tends to exacerbate the former. This is the case in Poland, in particular, where 21 % of the population in 2005 reported that they both lived in poor housing conditions and could not afford a meal of meat or fish, or the vegetarian equivalent, at least every other day (Table 11). Over 60 % of these had income above the at-risk-of-poverty threshold, but 8 % of the total population could not afford such a meal, lived in poor housing and had low income. In Latvia, the proportion facing all three problems was only slightly smaller at 7 %.
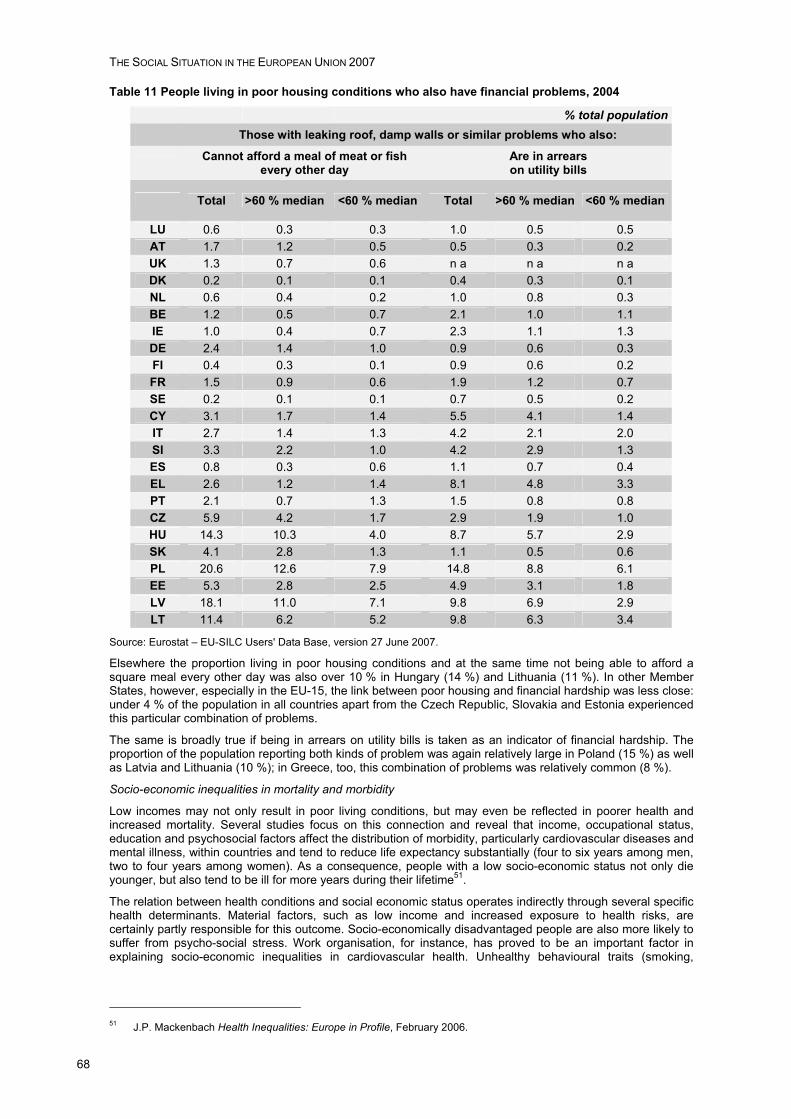
THE SOCIAL SITUATION IN THE EUROPEAN UNION 2007
68
Table 11 People living in poor housing conditions who also have financial problems, 2004
% total population Those with leaking roof, damp walls or similar problems who also:
Cannot afford a meal of meat or fish every other day
Are in arrears on utility bills
Total >60 % median <60 % median Total >60 % median <60 % median
LU 0.6 0.3 0.3 1.0 0.5 0.5 AT 1.7 1.2 0.5 0.5 0.3 0.2 UK 1.3 0.7 0.6 n a n a n a DK 0.2 0.1 0.1 0.4 0.3 0.1 NL 0.6 0.4 0.2 1.0 0.8 0.3 BE 1.2 0.5 0.7 2.1 1.0 1.1 IE 1.0 0.4 0.7 2.3 1.1 1.3 DE 2.4 1.4 1.0 0.9 0.6 0.3 FI 0.4 0.3 0.1 0.9 0.6 0.2 FR 1.5 0.9 0.6 1.9 1.2 0.7 SE 0.2 0.1 0.1 0.7 0.5 0.2 CY 3.1 1.7 1.4 5.5 4.1 1.4 IT 2.7 1.4 1.3 4.2 2.1 2.0 SI 3.3 2.2 1.0 4.2 2.9 1.3 ES 0.8 0.3 0.6 1.1 0.7 0.4 EL 2.6 1.2 1.4 8.1 4.8 3.3 PT 2.1 0.7 1.3 1.5 0.8 0.8 CZ 5.9 4.2 1.7 2.9 1.9 1.0 HU 14.3 10.3 4.0 8.7 5.7 2.9 SK 4.1 2.8 1.3 1.1 0.5 0.6 PL 20.6 12.6 7.9 14.8 8.8 6.1 EE 5.3 2.8 2.5 4.9 3.1 1.8 LV 18.1 11.0 7.1 9.8 6.9 2.9 LT 11.4 6.2 5.2 9.8 6.3 3.4
Source: Eurostat – EU-SILC Users' Data Base, version 27 June 2007.
Elsewhere the proportion living in poor housing conditions and at the same time not being able to afford a square meal every other day was also over 10 % in Hungary (14 %) and Lithuania (11 %). In other Member States, however, especially in the EU-15, the link between poor housing and financial hardship was less close: under 4 % of the population in all countries apart from the Czech Republic, Slovakia and Estonia experienced this particular combination of problems.
The same is broadly true if being in arrears on utility bills is taken as an indicator of financial hardship. The proportion of the population reporting both kinds of problem was again relatively large in Poland (15 %) as well as Latvia and Lithuania (10 %); in Greece, too, this combination of problems was relatively common (8 %).
Socio-economic inequalities in mortality and morbidity
Low incomes may not only result in poor living conditions, but may even be reflected in poorer health and increased mortality. Several studies focus on this connection and reveal that income, occupational status, education and psychosocial factors affect the distribution of morbidity, particularly cardiovascular diseases and mental illness, within countries and tend to reduce life expectancy substantially (four to six years among men, two to four years among women). As a consequence, people with a low socio-economic status not only die younger, but also tend to be ill for more years during their lifetime51.
The relation between health conditions and social economic status operates indirectly through several specific health determinants. Material factors, such as low income and increased exposure to health risks, are certainly partly responsible for this outcome. Socio-economically disadvantaged people are also more likely to suffer from psycho-social stress. Work organisation, for instance, has proved to be an important factor in explaining socio-economic inequalities in cardiovascular health. Unhealthy behavioural traits (smoking,
51 J.P. Mackenbach Health Inequalities: Europe in Profile, February 2006.
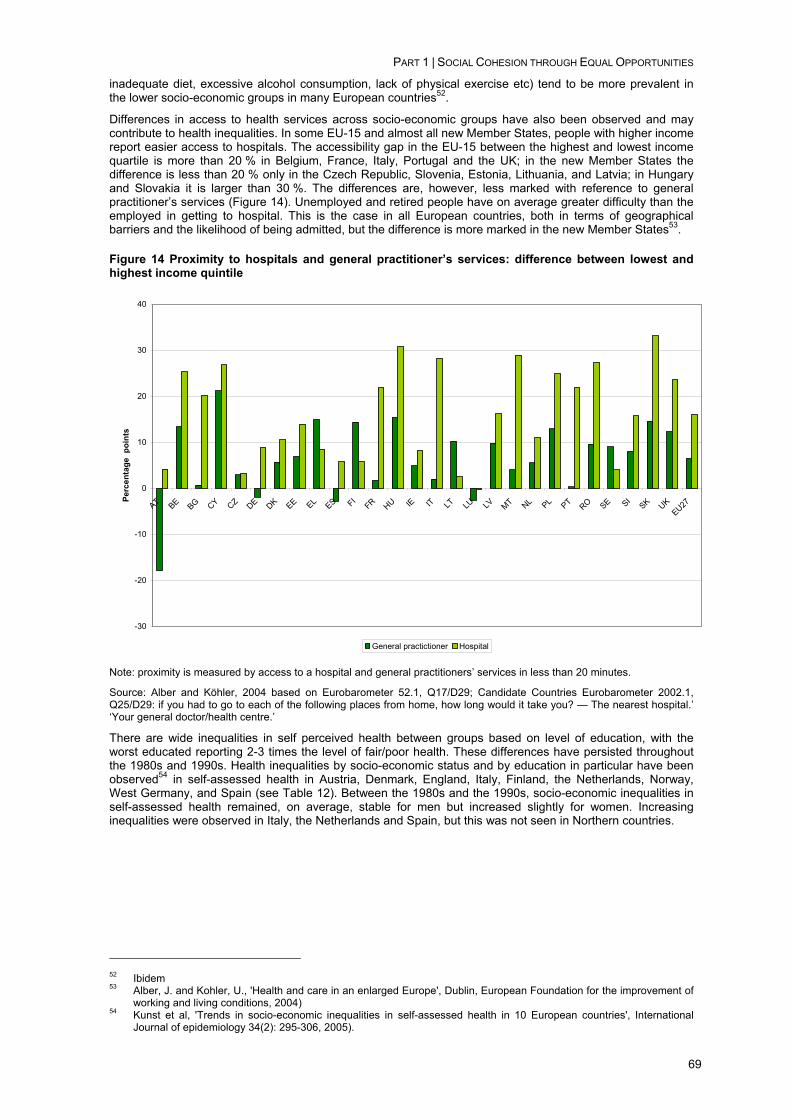
PART 1 | SOCIAL COHESION THROUGH EQUAL OPPORTUNITIES
69
inadequate diet, excessive alcohol consumption, lack of physical exercise etc) tend to be more prevalent in the lower socio-economic groups in many European countries52.
Differences in access to health services across socio-economic groups have also been observed and may contribute to health inequalities. In some EU-15 and almost all new Member States, people with higher income report easier access to hospitals. The accessibility gap in the EU-15 between the highest and lowest income quartile is more than 20 % in Belgium, France, Italy, Portugal and the UK; in the new Member States the difference is less than 20 % only in the Czech Republic, Slovenia, Estonia, Lithuania, and Latvia; in Hungary and Slovakia it is larger than 30 %. The differences are, however, less marked with reference to general practitioner’s services (Figure 14). Unemployed and retired people have on average greater difficulty than the employed in getting to hospital. This is the case in all European countries, both in terms of geographical barriers and the likelihood of being admitted, but the difference is more marked in the new Member States53.
Figure 14 Proximity to hospitals and general practitioner’s services: difference between lowest and highest income quintile
-30
-20
-10
0
10
20
30
40
AT BE BG CY CZ DE DK EE EL ES FIFR HU IE IT LT LU LV MT NL PL PT RO SE SI
SK UKEU27
Perc
enta
ge p
oint
s
General practictioner Hospital
Note: proximity is measured by access to a hospital and general practitioners’ services in less than 20 minutes.
Source: Alber and Köhler, 2004 based on Eurobarometer 52.1, Q17/D29; Candidate Countries Eurobarometer 2002.1, Q25/D29: if you had to go to each of the following places from home, how long would it take you? — The nearest hospital.’ ‘Your general doctor/health centre.’
There are wide inequalities in self perceived health between groups based on level of education, with the worst educated reporting 2-3 times the level of fair/poor health. These differences have persisted throughout the 1980s and 1990s. Health inequalities by socio-economic status and by education in particular have been observed54 in self-assessed health in Austria, Denmark, England, Italy, Finland, the Netherlands, Norway, West Germany, and Spain (see Table 12). Between the 1980s and the 1990s, socio-economic inequalities in self-assessed health remained, on average, stable for men but increased slightly for women. Increasing inequalities were observed in Italy, the Netherlands and Spain, but this was not seen in Northern countries.
52 Ibidem 53 Alber, J. and Kohler, U., 'Health and care in an enlarged Europe', Dublin, European Foundation for the improvement of
working and living conditions, 2004) 54 Kunst et al, 'Trends in socio-economic inequalities in self-assessed health in 10 European countries', International
Journal of epidemiology 34(2): 295-306, 2005).
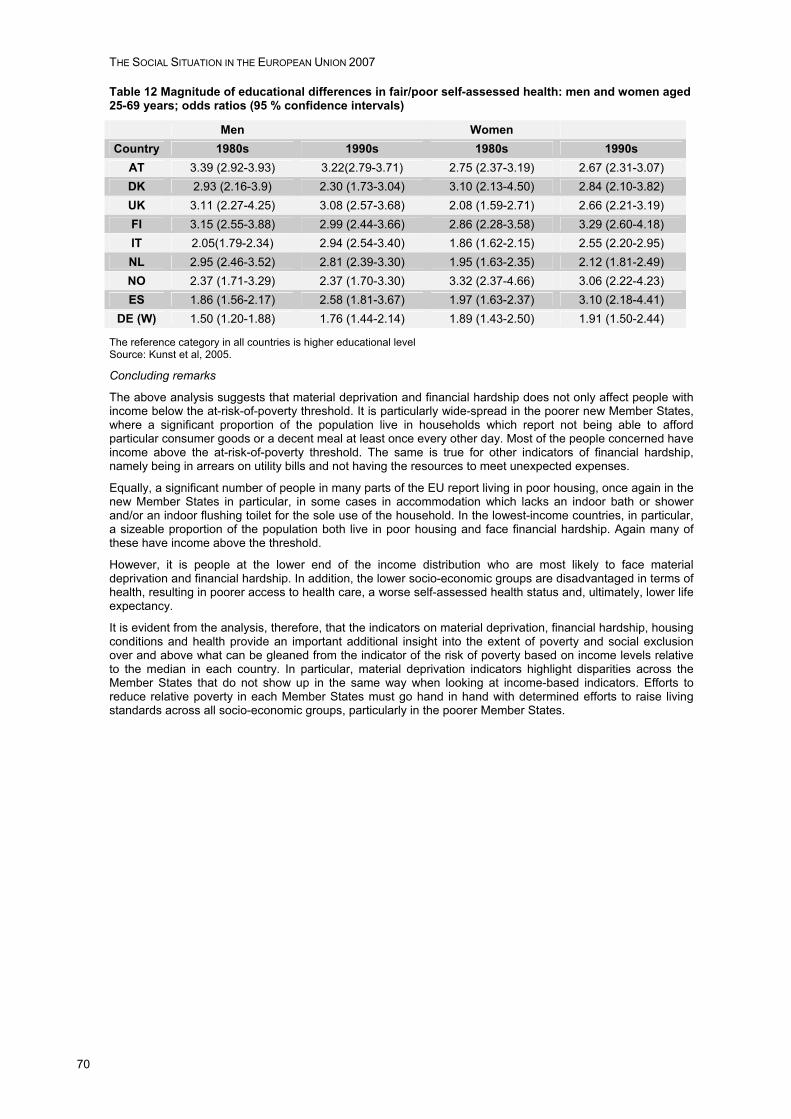
THE SOCIAL SITUATION IN THE EUROPEAN UNION 2007
70
Table 12 Magnitude of educational differences in fair/poor self-assessed health: men and women aged 25-69 years; odds ratios (95 % confidence intervals)
Men Women Country 1980s 1990s 1980s 1990s
AT 3.39 (2.92-3.93) 3.22(2.79-3.71) 2.75 (2.37-3.19) 2.67 (2.31-3.07) DK 2.93 (2.16-3.9) 2.30 (1.73-3.04) 3.10 (2.13-4.50) 2.84 (2.10-3.82) UK 3.11 (2.27-4.25) 3.08 (2.57-3.68) 2.08 (1.59-2.71) 2.66 (2.21-3.19) FI 3.15 (2.55-3.88) 2.99 (2.44-3.66) 2.86 (2.28-3.58) 3.29 (2.60-4.18) IT 2.05(1.79-2.34) 2.94 (2.54-3.40) 1.86 (1.62-2.15) 2.55 (2.20-2.95) NL 2.95 (2.46-3.52) 2.81 (2.39-3.30) 1.95 (1.63-2.35) 2.12 (1.81-2.49) NO 2.37 (1.71-3.29) 2.37 (1.70-3.30) 3.32 (2.37-4.66) 3.06 (2.22-4.23) ES 1.86 (1.56-2.17) 2.58 (1.81-3.67) 1.97 (1.63-2.37) 3.10 (2.18-4.41)
DE (W) 1.50 (1.20-1.88) 1.76 (1.44-2.14) 1.89 (1.43-2.50) 1.91 (1.50-2.44)
The reference category in all countries is higher educational level Source: Kunst et al, 2005.
Concluding remarks
The above analysis suggests that material deprivation and financial hardship does not only affect people with income below the at-risk-of-poverty threshold. It is particularly wide-spread in the poorer new Member States, where a significant proportion of the population live in households which report not being able to afford particular consumer goods or a decent meal at least once every other day. Most of the people concerned have income above the at-risk-of-poverty threshold. The same is true for other indicators of financial hardship, namely being in arrears on utility bills and not having the resources to meet unexpected expenses.
Equally, a significant number of people in many parts of the EU report living in poor housing, once again in the new Member States in particular, in some cases in accommodation which lacks an indoor bath or shower and/or an indoor flushing toilet for the sole use of the household. In the lowest-income countries, in particular, a sizeable proportion of the population both live in poor housing and face financial hardship. Again many of these have income above the threshold.
However, it is people at the lower end of the income distribution who are most likely to face material deprivation and financial hardship. In addition, the lower socio-economic groups are disadvantaged in terms of health, resulting in poorer access to health care, a worse self-assessed health status and, ultimately, lower life expectancy.
It is evident from the analysis, therefore, that the indicators on material deprivation, financial hardship, housing conditions and health provide an important additional insight into the extent of poverty and social exclusion over and above what can be gleaned from the indicator of the risk of poverty based on income levels relative to the median in each country. In particular, material deprivation indicators highlight disparities across the Member States that do not show up in the same way when looking at income-based indicators. Efforts to reduce relative poverty in each Member States must go hand in hand with determined efforts to raise living standards across all socio-economic groups, particularly in the poorer Member States.
PART 1 | SOCIAL COHESION THROUGH EQUAL OPPORTUNITIES
71
3. THE SCOPE FOR MORE EQUAL OPPORTUNITIES This part of the Social Situation Report examines the extent to which European societies fail to offer equal opportunities and hence to make full use of their human potential. It is based on a first analysis of the EU-SILC module on the intergenerational transmission of disadvantages (3.1) and on an analysis of the risk of poverty among children with migrant family background.
3.1. Intergenerational transmission of disadvantages The extent to which a person’s life chances are affected by their family background and how far it is possible for someone to escape from a less advantaged background provide a measure of social mobility across the EU.
The EU-SILC for 2005 included a special ad hoc module which addressed this issue. Specifically, each respondent aged 25-65 was asked a set of questions about the situation of their parents when the respondent was aged between 12 and 16. The analysis here examines the responses to these questions and what they reveal, first, about the educational attainment level of parents and their children and the closeness of the links between the two, and, secondly, about the same kind of links as regards the jobs held by parents and their children. The strength of these links are indicated below in terms of the ‘odds ratio’, which measures the increased probability of, for example, someone whose father or mother had a university degree or the equivalent (i.e. a tertiary level of education) him/herself having this level of qualification as compared with someone whose parents had a lower education level.
The results of the analysis are not only interesting in themselves but are important for the light they throw on the scale of obstacles to achieving true equality of opportunity for people throughout the EU, irrespective of their social origin, and ensuring that everyone is given the chance to realise their potential and contribute to the full to economic advancement and rising living standards. Such obstacles could be a major constraint to the pursuit of the Lisbon agenda and to securing its central aim of making the EU the most competitive and dynamic knowledge-based economy in the world, capable of sustainable economic growth with more and better jobs and greater social cohesion, as was stated in the Conclusions of the Lisbon European Council of March 2000.
The link between the education level of fathers and their children
Differences in education systems across the EU and in the relative number of people attaining different levels of education complicate any comparison of the influence of parents on the education level attained by their children. In particular, taking two extremes, the proportion of people aged 25-64 with no education beyond compulsory schooling (lower secondary education or below) varies from 74 % in Portugal to 10 % in the Czech Republic, while the proportion with upper secondary education, but not tertiary level, varies from under 14 % in the former to 77 % in the latter.
The probability of someone attaining an upper level of secondary education is, therefore, much lower in Portugal than in the Czech Republic, irrespective of the level of education of the father or mother. By the same token, in the Czech Republic, only around 12 % of people aged 25-64 have tertiary education as compared with 35 % in Finland, which implies that there is a much smaller chance of attaining this level of education in the former than the latter, again irrespective of the father’s or mother’s education.
These large differences should be kept in mind when interpreting the results presented below. The analysis focuses on the relative chances of men and women attaining tertiary education in relation to the education level of their parents, because there is more similarity in the proportion of those with tertiary education across the EU and, accordingly, the results are less subject to distortion, but also because tertiary education is becoming increasingly important to economic performance.
The probability of men and women aged 25-64 having tertiary level education is significantly higher in all EU Member States if their father had the same level of education than if he had a lower level.
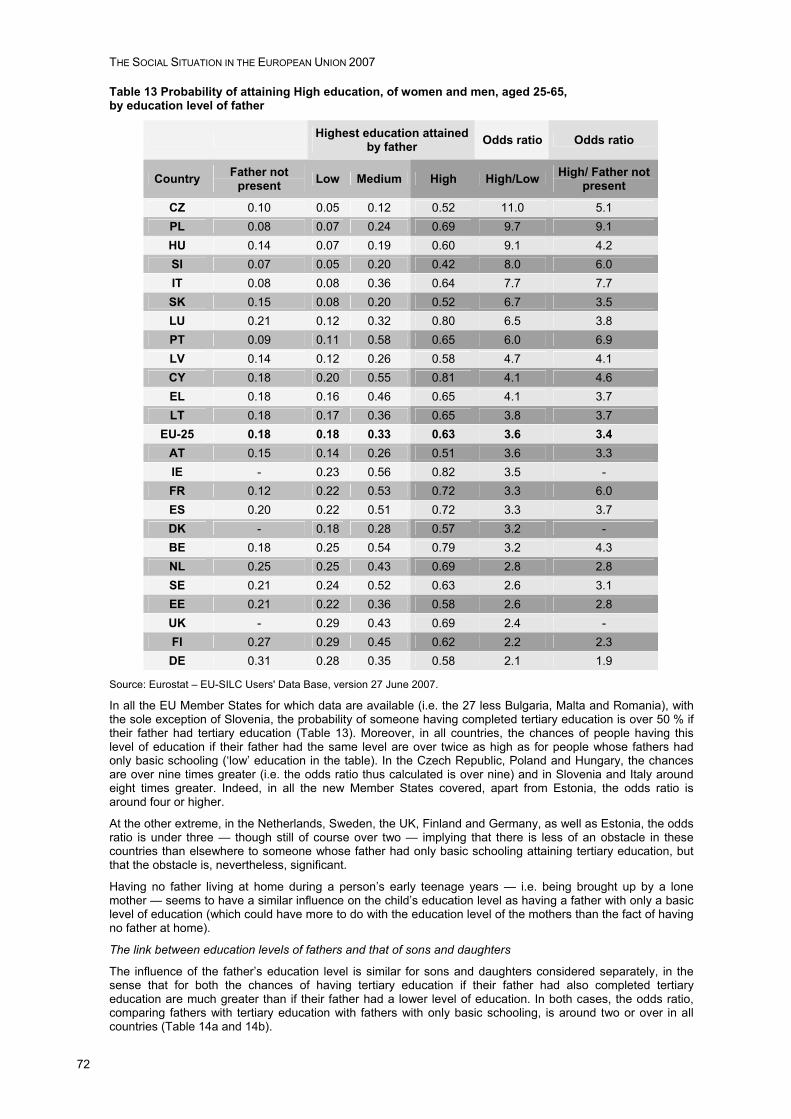
THE SOCIAL SITUATION IN THE EUROPEAN UNION 2007
72
Table 13 Probability of attaining High education, of women and men, aged 25-65, by education level of father
Highest education attained by father Odds ratio Odds ratio
Country Father not present Low Medium High High/Low High/ Father not
present
CZ 0.10 0.05 0.12 0.52 11.0 5.1 PL 0.08 0.07 0.24 0.69 9.7 9.1 HU 0.14 0.07 0.19 0.60 9.1 4.2 SI 0.07 0.05 0.20 0.42 8.0 6.0 IT 0.08 0.08 0.36 0.64 7.7 7.7 SK 0.15 0.08 0.20 0.52 6.7 3.5 LU 0.21 0.12 0.32 0.80 6.5 3.8 PT 0.09 0.11 0.58 0.65 6.0 6.9 LV 0.14 0.12 0.26 0.58 4.7 4.1 CY 0.18 0.20 0.55 0.81 4.1 4.6 EL 0.18 0.16 0.46 0.65 4.1 3.7 LT 0.18 0.17 0.36 0.65 3.8 3.7
EU-25 0.18 0.18 0.33 0.63 3.6 3.4 AT 0.15 0.14 0.26 0.51 3.6 3.3 IE - 0.23 0.56 0.82 3.5 - FR 0.12 0.22 0.53 0.72 3.3 6.0 ES 0.20 0.22 0.51 0.72 3.3 3.7 DK - 0.18 0.28 0.57 3.2 - BE 0.18 0.25 0.54 0.79 3.2 4.3 NL 0.25 0.25 0.43 0.69 2.8 2.8 SE 0.21 0.24 0.52 0.63 2.6 3.1 EE 0.21 0.22 0.36 0.58 2.6 2.8 UK - 0.29 0.43 0.69 2.4 - FI 0.27 0.29 0.45 0.62 2.2 2.3 DE 0.31 0.28 0.35 0.58 2.1 1.9
Source: Eurostat – EU-SILC Users' Data Base, version 27 June 2007.
In all the EU Member States for which data are available (i.e. the 27 less Bulgaria, Malta and Romania), with the sole exception of Slovenia, the probability of someone having completed tertiary education is over 50 % if their father had tertiary education (Table 13). Moreover, in all countries, the chances of people having this level of education if their father had the same level are over twice as high as for people whose fathers had only basic schooling (‘low’ education in the table). In the Czech Republic, Poland and Hungary, the chances are over nine times greater (i.e. the odds ratio thus calculated is over nine) and in Slovenia and Italy around eight times greater. Indeed, in all the new Member States covered, apart from Estonia, the odds ratio is around four or higher.
At the other extreme, in the Netherlands, Sweden, the UK, Finland and Germany, as well as Estonia, the odds ratio is under three — though still of course over two — implying that there is less of an obstacle in these countries than elsewhere to someone whose father had only basic schooling attaining tertiary education, but that the obstacle is, nevertheless, significant.
Having no father living at home during a person’s early teenage years — i.e. being brought up by a lone mother — seems to have a similar influence on the child’s education level as having a father with only a basic level of education (which could have more to do with the education level of the mothers than the fact of having no father at home).
The link between education levels of fathers and that of sons and daughters
The influence of the father’s education level is similar for sons and daughters considered separately, in the sense that for both the chances of having tertiary education if their father had also completed tertiary education are much greater than if their father had a lower level of education. In both cases, the odds ratio, comparing fathers with tertiary education with fathers with only basic schooling, is around two or over in all countries (Table 14a and 14b).
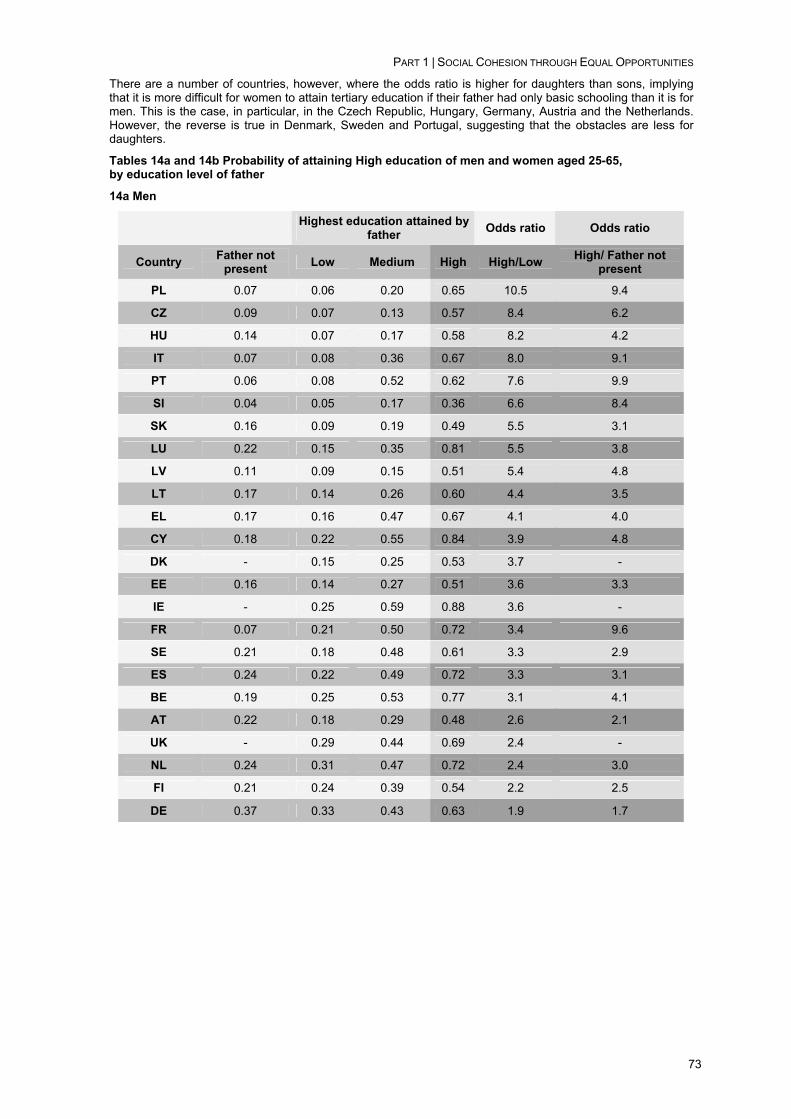
PART 1 | SOCIAL COHESION THROUGH EQUAL OPPORTUNITIES
73
There are a number of countries, however, where the odds ratio is higher for daughters than sons, implying that it is more difficult for women to attain tertiary education if their father had only basic schooling than it is for men. This is the case, in particular, in the Czech Republic, Hungary, Germany, Austria and the Netherlands. However, the reverse is true in Denmark, Sweden and Portugal, suggesting that the obstacles are less for daughters.
Tables 14a and 14b Probability of attaining High education of men and women aged 25-65, by education level of father
14a Men
Highest education attained by father Odds ratio Odds ratio
Country Father not present Low Medium High High/Low High/ Father not
present
PL 0.07 0.06 0.20 0.65 10.5 9.4
CZ 0.09 0.07 0.13 0.57 8.4 6.2
HU 0.14 0.07 0.17 0.58 8.2 4.2
IT 0.07 0.08 0.36 0.67 8.0 9.1
PT 0.06 0.08 0.52 0.62 7.6 9.9
SI 0.04 0.05 0.17 0.36 6.6 8.4
SK 0.16 0.09 0.19 0.49 5.5 3.1
LU 0.22 0.15 0.35 0.81 5.5 3.8
LV 0.11 0.09 0.15 0.51 5.4 4.8
LT 0.17 0.14 0.26 0.60 4.4 3.5
EL 0.17 0.16 0.47 0.67 4.1 4.0
CY 0.18 0.22 0.55 0.84 3.9 4.8
DK - 0.15 0.25 0.53 3.7 -
EE 0.16 0.14 0.27 0.51 3.6 3.3
IE - 0.25 0.59 0.88 3.6 -
FR 0.07 0.21 0.50 0.72 3.4 9.6
SE 0.21 0.18 0.48 0.61 3.3 2.9
ES 0.24 0.22 0.49 0.72 3.3 3.1
BE 0.19 0.25 0.53 0.77 3.1 4.1
AT 0.22 0.18 0.29 0.48 2.6 2.1
UK - 0.29 0.44 0.69 2.4 -
NL 0.24 0.31 0.47 0.72 2.4 3.0
FI 0.21 0.24 0.39 0.54 2.2 2.5
DE 0.37 0.33 0.43 0.63 1.9 1.7
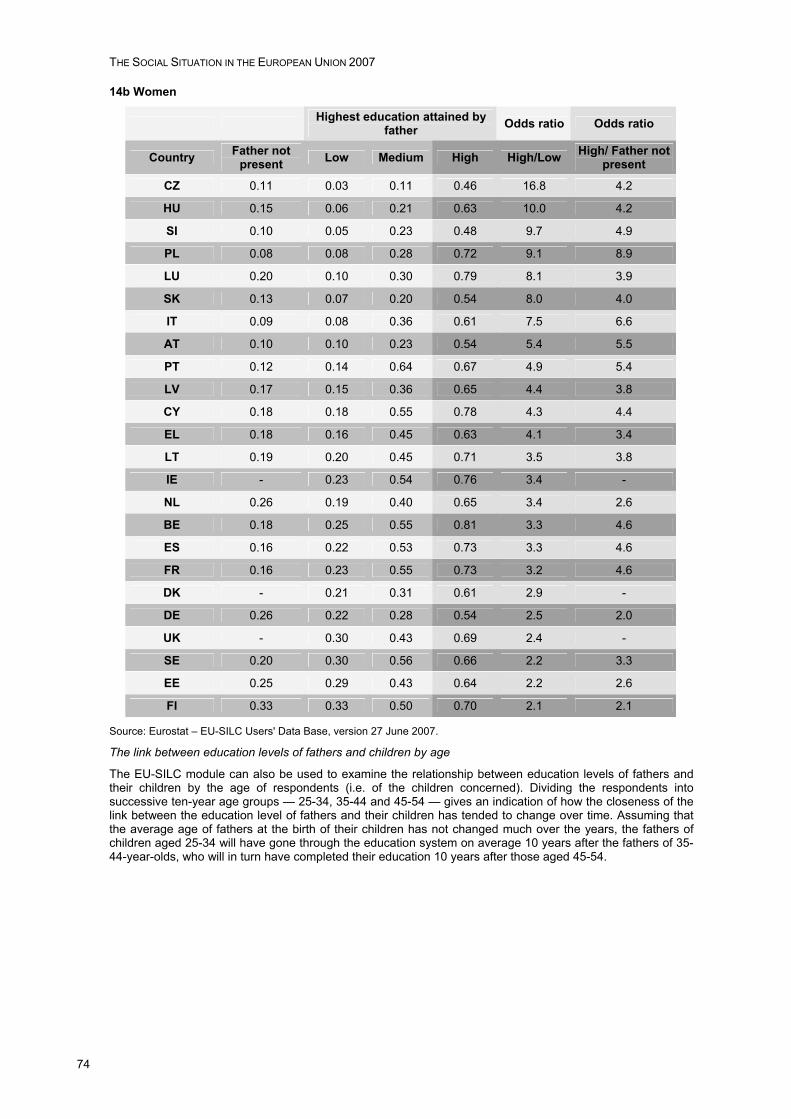
THE SOCIAL SITUATION IN THE EUROPEAN UNION 2007
74
14b Women
Highest education attained by father Odds ratio Odds ratio
Country Father not present Low Medium High High/Low High/ Father not
present
CZ 0.11 0.03 0.11 0.46 16.8 4.2
HU 0.15 0.06 0.21 0.63 10.0 4.2
SI 0.10 0.05 0.23 0.48 9.7 4.9
PL 0.08 0.08 0.28 0.72 9.1 8.9
LU 0.20 0.10 0.30 0.79 8.1 3.9
SK 0.13 0.07 0.20 0.54 8.0 4.0
IT 0.09 0.08 0.36 0.61 7.5 6.6
AT 0.10 0.10 0.23 0.54 5.4 5.5
PT 0.12 0.14 0.64 0.67 4.9 5.4
LV 0.17 0.15 0.36 0.65 4.4 3.8
CY 0.18 0.18 0.55 0.78 4.3 4.4
EL 0.18 0.16 0.45 0.63 4.1 3.4
LT 0.19 0.20 0.45 0.71 3.5 3.8
IE - 0.23 0.54 0.76 3.4 -
NL 0.26 0.19 0.40 0.65 3.4 2.6
BE 0.18 0.25 0.55 0.81 3.3 4.6
ES 0.16 0.22 0.53 0.73 3.3 4.6
FR 0.16 0.23 0.55 0.73 3.2 4.6
DK - 0.21 0.31 0.61 2.9 -
DE 0.26 0.22 0.28 0.54 2.5 2.0
UK - 0.30 0.43 0.69 2.4 -
SE 0.20 0.30 0.56 0.66 2.2 3.3
EE 0.25 0.29 0.43 0.64 2.2 2.6
FI 0.33 0.33 0.50 0.70 2.1 2.1
Source: Eurostat – EU-SILC Users' Data Base, version 27 June 2007.
The link between education levels of fathers and children by age
The EU-SILC module can also be used to examine the relationship between education levels of fathers and their children by the age of respondents (i.e. of the children concerned). Dividing the respondents into successive ten-year age groups — 25-34, 35-44 and 45-54 — gives an indication of how the closeness of the link between the education level of fathers and their children has tended to change over time. Assuming that the average age of fathers at the birth of their children has not changed much over the years, the fathers of children aged 25-34 will have gone through the education system on average 10 years after the fathers of 35-44-year-olds, who will in turn have completed their education 10 years after those aged 45-54.
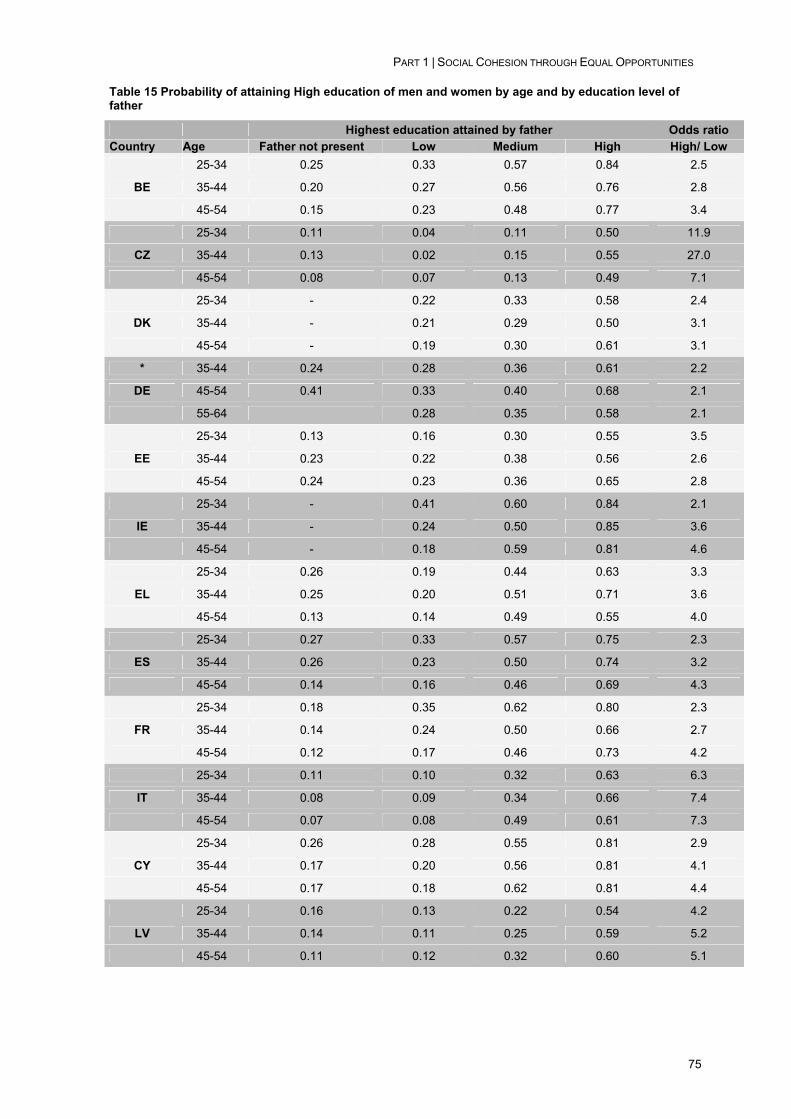
PART 1 | SOCIAL COHESION THROUGH EQUAL OPPORTUNITIES
75
Table 15 Probability of attaining High education of men and women by age and by education level of father
Highest education attained by father Odds ratio Country Age Father not present Low Medium High High/ Low
25-34 0.25 0.33 0.57 0.84 2.5
BE 35-44 0.20 0.27 0.56 0.76 2.8
45-54 0.15 0.23 0.48 0.77 3.4
25-34 0.11 0.04 0.11 0.50 11.9
CZ 35-44 0.13 0.02 0.15 0.55 27.0
45-54 0.08 0.07 0.13 0.49 7.1
25-34 - 0.22 0.33 0.58 2.4
DK 35-44 - 0.21 0.29 0.50 3.1
45-54 - 0.19 0.30 0.61 3.1
* 35-44 0.24 0.28 0.36 0.61 2.2
DE 45-54 0.41 0.33 0.40 0.68 2.1
55-64 0.28 0.35 0.58 2.1
25-34 0.13 0.16 0.30 0.55 3.5
EE 35-44 0.23 0.22 0.38 0.56 2.6
45-54 0.24 0.23 0.36 0.65 2.8
25-34 - 0.41 0.60 0.84 2.1
IE 35-44 - 0.24 0.50 0.85 3.6
45-54 - 0.18 0.59 0.81 4.6
25-34 0.26 0.19 0.44 0.63 3.3
EL 35-44 0.25 0.20 0.51 0.71 3.6
45-54 0.13 0.14 0.49 0.55 4.0
25-34 0.27 0.33 0.57 0.75 2.3
ES 35-44 0.26 0.23 0.50 0.74 3.2
45-54 0.14 0.16 0.46 0.69 4.3
25-34 0.18 0.35 0.62 0.80 2.3
FR 35-44 0.14 0.24 0.50 0.66 2.7
45-54 0.12 0.17 0.46 0.73 4.2
25-34 0.11 0.10 0.32 0.63 6.3
IT 35-44 0.08 0.09 0.34 0.66 7.4
45-54 0.07 0.08 0.49 0.61 7.3
25-34 0.26 0.28 0.55 0.81 2.9
CY 35-44 0.17 0.20 0.56 0.81 4.1
45-54 0.17 0.18 0.62 0.81 4.4
25-34 0.16 0.13 0.22 0.54 4.2
LV 35-44 0.14 0.11 0.25 0.59 5.2
45-54 0.11 0.12 0.32 0.60 5.1
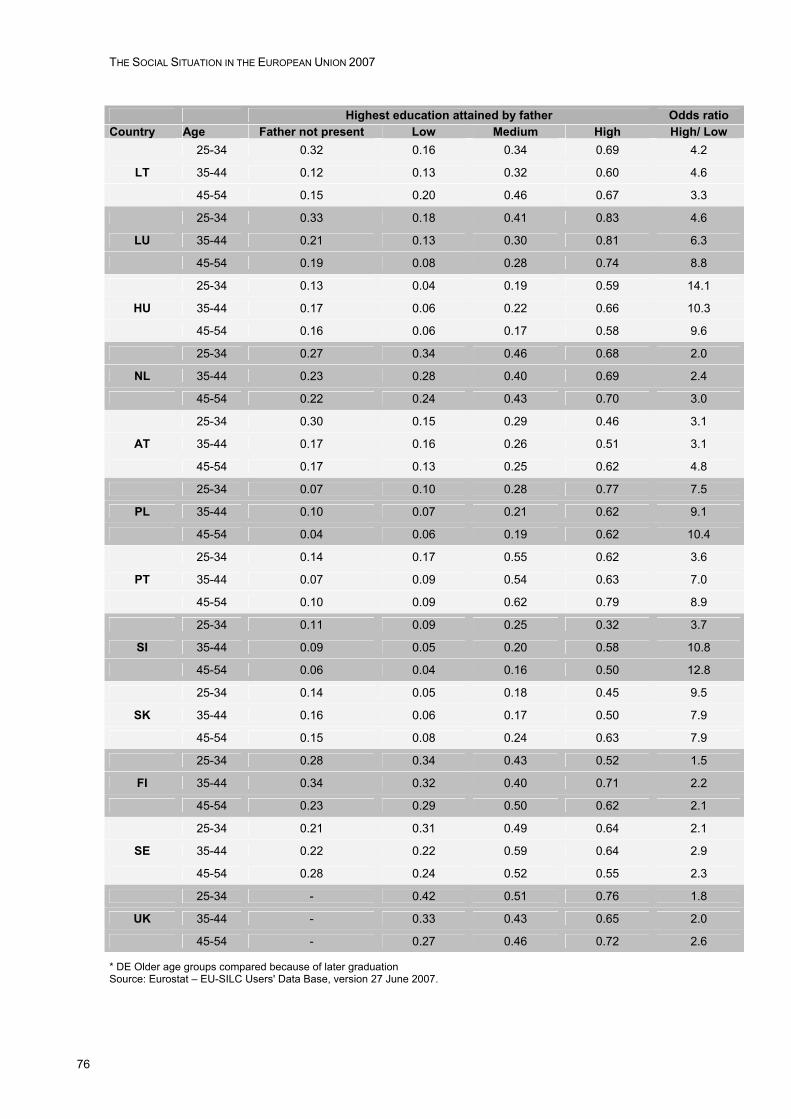
THE SOCIAL SITUATION IN THE EUROPEAN UNION 2007
76
Highest education attained by father Odds ratio Country Age Father not present Low Medium High High/ Low
25-34 0.32 0.16 0.34 0.69 4.2
LT 35-44 0.12 0.13 0.32 0.60 4.6
45-54 0.15 0.20 0.46 0.67 3.3
25-34 0.33 0.18 0.41 0.83 4.6
LU 35-44 0.21 0.13 0.30 0.81 6.3
45-54 0.19 0.08 0.28 0.74 8.8
25-34 0.13 0.04 0.19 0.59 14.1
HU 35-44 0.17 0.06 0.22 0.66 10.3
45-54 0.16 0.06 0.17 0.58 9.6
25-34 0.27 0.34 0.46 0.68 2.0
NL 35-44 0.23 0.28 0.40 0.69 2.4
45-54 0.22 0.24 0.43 0.70 3.0
25-34 0.30 0.15 0.29 0.46 3.1
AT 35-44 0.17 0.16 0.26 0.51 3.1
45-54 0.17 0.13 0.25 0.62 4.8
25-34 0.07 0.10 0.28 0.77 7.5
PL 35-44 0.10 0.07 0.21 0.62 9.1
45-54 0.04 0.06 0.19 0.62 10.4
25-34 0.14 0.17 0.55 0.62 3.6
PT 35-44 0.07 0.09 0.54 0.63 7.0
45-54 0.10 0.09 0.62 0.79 8.9
25-34 0.11 0.09 0.25 0.32 3.7
SI 35-44 0.09 0.05 0.20 0.58 10.8
45-54 0.06 0.04 0.16 0.50 12.8
25-34 0.14 0.05 0.18 0.45 9.5
SK 35-44 0.16 0.06 0.17 0.50 7.9
45-54 0.15 0.08 0.24 0.63 7.9
25-34 0.28 0.34 0.43 0.52 1.5
FI 35-44 0.34 0.32 0.40 0.71 2.2
45-54 0.23 0.29 0.50 0.62 2.1
25-34 0.21 0.31 0.49 0.64 2.1
SE 35-44 0.22 0.22 0.59 0.64 2.9
45-54 0.28 0.24 0.52 0.55 2.3
25-34 - 0.42 0.51 0.76 1.8
UK 35-44 - 0.33 0.43 0.65 2.0
45-54 - 0.27 0.46 0.72 2.6
* DE Older age groups compared because of later graduation Source: Eurostat – EU-SILC Users' Data Base, version 27 June 2007.
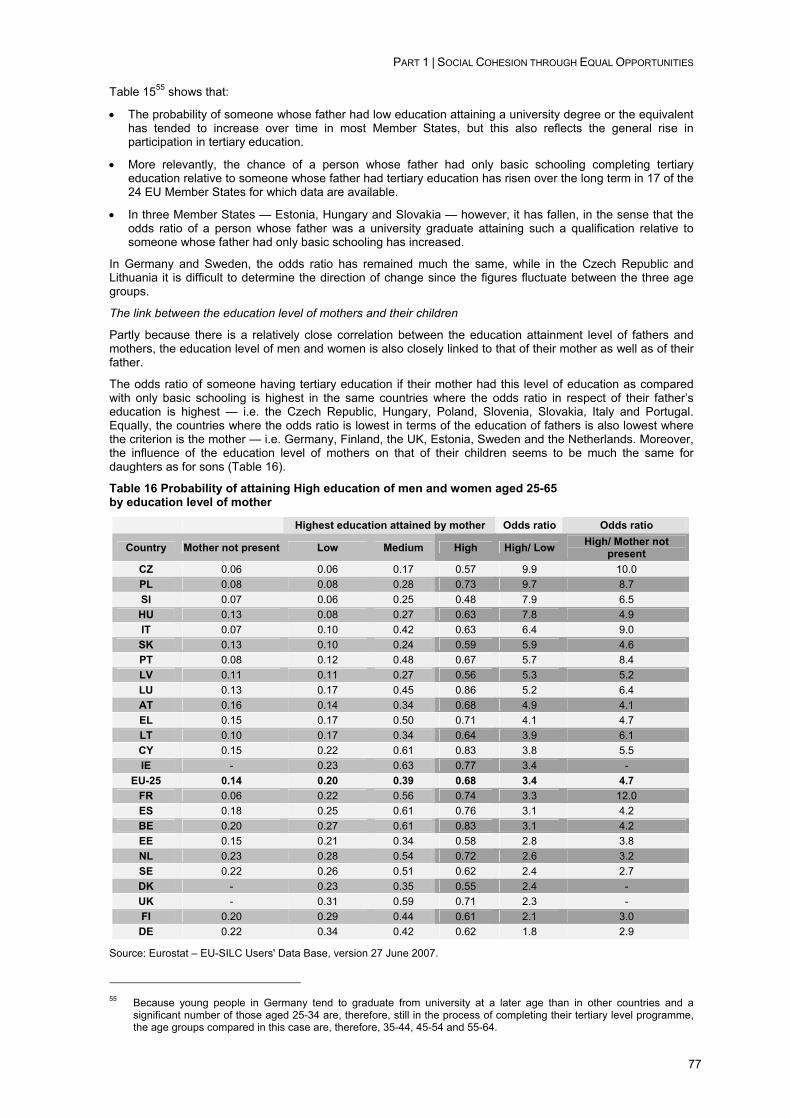
PART 1 | SOCIAL COHESION THROUGH EQUAL OPPORTUNITIES
77
Table 1555 shows that:
• The probability of someone whose father had low education attaining a university degree or the equivalent has tended to increase over time in most Member States, but this also reflects the general rise in participation in tertiary education.
• More relevantly, the chance of a person whose father had only basic schooling completing tertiary education relative to someone whose father had tertiary education has risen over the long term in 17 of the 24 EU Member States for which data are available.
• In three Member States — Estonia, Hungary and Slovakia — however, it has fallen, in the sense that the odds ratio of a person whose father was a university graduate attaining such a qualification relative to someone whose father had only basic schooling has increased.
In Germany and Sweden, the odds ratio has remained much the same, while in the Czech Republic and Lithuania it is difficult to determine the direction of change since the figures fluctuate between the three age groups.
The link between the education level of mothers and their children
Partly because there is a relatively close correlation between the education attainment level of fathers and mothers, the education level of men and women is also closely linked to that of their mother as well as of their father.
The odds ratio of someone having tertiary education if their mother had this level of education as compared with only basic schooling is highest in the same countries where the odds ratio in respect of their father’s education is highest — i.e. the Czech Republic, Hungary, Poland, Slovenia, Slovakia, Italy and Portugal. Equally, the countries where the odds ratio is lowest in terms of the education of fathers is also lowest where the criterion is the mother — i.e. Germany, Finland, the UK, Estonia, Sweden and the Netherlands. Moreover, the influence of the education level of mothers on that of their children seems to be much the same for daughters as for sons (Table 16).
Table 16 Probability of attaining High education of men and women aged 25-65 by education level of mother
Highest education attained by mother Odds ratio Odds ratio
Country Mother not present Low Medium High High/ Low High/ Mother not present
CZ 0.06 0.06 0.17 0.57 9.9 10.0 PL 0.08 0.08 0.28 0.73 9.7 8.7 SI 0.07 0.06 0.25 0.48 7.9 6.5 HU 0.13 0.08 0.27 0.63 7.8 4.9 IT 0.07 0.10 0.42 0.63 6.4 9.0 SK 0.13 0.10 0.24 0.59 5.9 4.6 PT 0.08 0.12 0.48 0.67 5.7 8.4 LV 0.11 0.11 0.27 0.56 5.3 5.2 LU 0.13 0.17 0.45 0.86 5.2 6.4 AT 0.16 0.14 0.34 0.68 4.9 4.1 EL 0.15 0.17 0.50 0.71 4.1 4.7 LT 0.10 0.17 0.34 0.64 3.9 6.1 CY 0.15 0.22 0.61 0.83 3.8 5.5 IE - 0.23 0.63 0.77 3.4 -
EU-25 0.14 0.20 0.39 0.68 3.4 4.7 FR 0.06 0.22 0.56 0.74 3.3 12.0 ES 0.18 0.25 0.61 0.76 3.1 4.2 BE 0.20 0.27 0.61 0.83 3.1 4.2 EE 0.15 0.21 0.34 0.58 2.8 3.8 NL 0.23 0.28 0.54 0.72 2.6 3.2 SE 0.22 0.26 0.51 0.62 2.4 2.7 DK - 0.23 0.35 0.55 2.4 - UK - 0.31 0.59 0.71 2.3 - FI 0.20 0.29 0.44 0.61 2.1 3.0 DE 0.22 0.34 0.42 0.62 1.8 2.9
Source: Eurostat – EU-SILC Users' Data Base, version 27 June 2007.
55 Because young people in Germany tend to graduate from university at a later age than in other countries and a
significant number of those aged 25-34 are, therefore, still in the process of completing their tertiary level programme, the age groups compared in this case are, therefore, 35-44, 45-54 and 55-64.
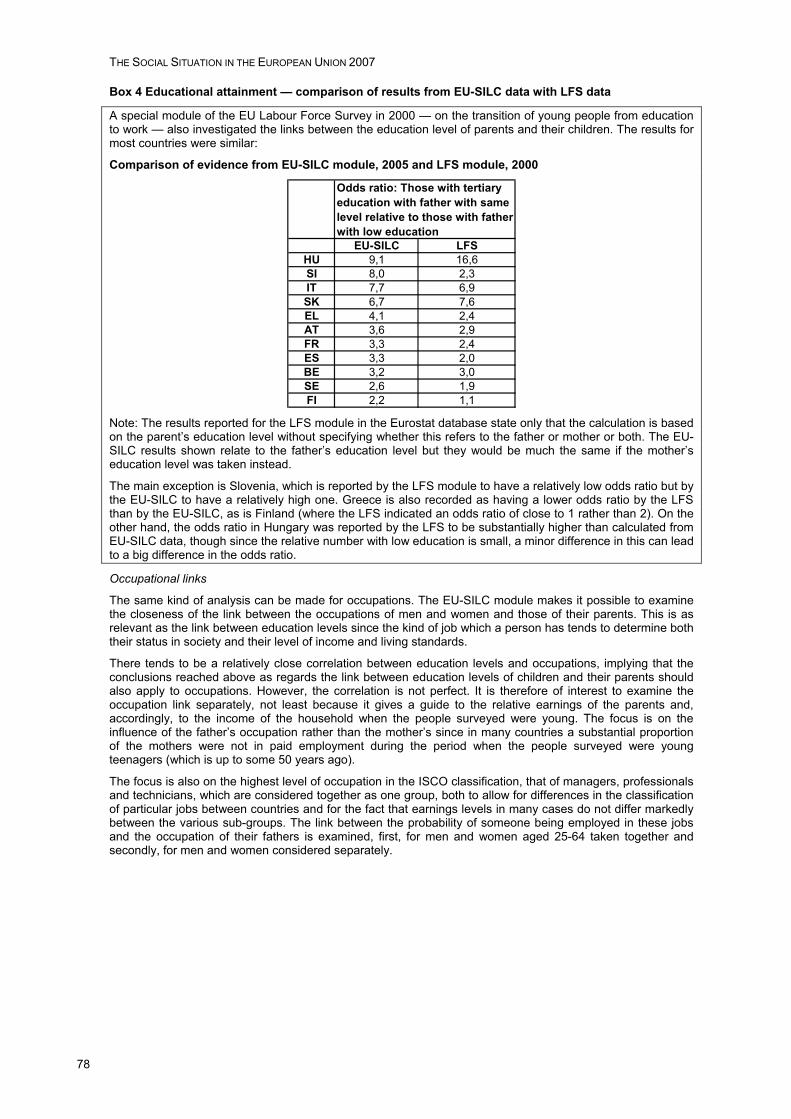
THE SOCIAL SITUATION IN THE EUROPEAN UNION 2007
78
Box 4 Educational attainment — comparison of results from EU-SILC data with LFS data
A special module of the EU Labour Force Survey in 2000 — on the transition of young people from education to work — also investigated the links between the education level of parents and their children. The results for most countries were similar:
Comparison of evidence from EU-SILC module, 2005 and LFS module, 2000
EU-SILC LFSHU 9,1 16,6SI 8,0 2,3IT 7,7 6,9SK 6,7 7,6EL 4,1 2,4AT 3,6 2,9FR 3,3 2,4ES 3,3 2,0BE 3,2 3,0SE 2,6 1,9FI 2,2 1,1
Odds ratio: Those with tertiary education with father with same level relative to those with father with low education
Note: The results reported for the LFS module in the Eurostat database state only that the calculation is based on the parent’s education level without specifying whether this refers to the father or mother or both. The EU-SILC results shown relate to the father’s education level but they would be much the same if the mother’s education level was taken instead.
The main exception is Slovenia, which is reported by the LFS module to have a relatively low odds ratio but by the EU-SILC to have a relatively high one. Greece is also recorded as having a lower odds ratio by the LFS than by the EU-SILC, as is Finland (where the LFS indicated an odds ratio of close to 1 rather than 2). On the other hand, the odds ratio in Hungary was reported by the LFS to be substantially higher than calculated from EU-SILC data, though since the relative number with low education is small, a minor difference in this can lead to a big difference in the odds ratio.
Occupational links
The same kind of analysis can be made for occupations. The EU-SILC module makes it possible to examine the closeness of the link between the occupations of men and women and those of their parents. This is as relevant as the link between education levels since the kind of job which a person has tends to determine both their status in society and their level of income and living standards.
There tends to be a relatively close correlation between education levels and occupations, implying that the conclusions reached above as regards the link between education levels of children and their parents should also apply to occupations. However, the correlation is not perfect. It is therefore of interest to examine the occupation link separately, not least because it gives a guide to the relative earnings of the parents and, accordingly, to the income of the household when the people surveyed were young. The focus is on the influence of the father’s occupation rather than the mother’s since in many countries a substantial proportion of the mothers were not in paid employment during the period when the people surveyed were young teenagers (which is up to some 50 years ago).
The focus is also on the highest level of occupation in the ISCO classification, that of managers, professionals and technicians, which are considered together as one group, both to allow for differences in the classification of particular jobs between countries and for the fact that earnings levels in many cases do not differ markedly between the various sub-groups. The link between the probability of someone being employed in these jobs and the occupation of their fathers is examined, first, for men and women aged 25-64 taken together and secondly, for men and women considered separately.
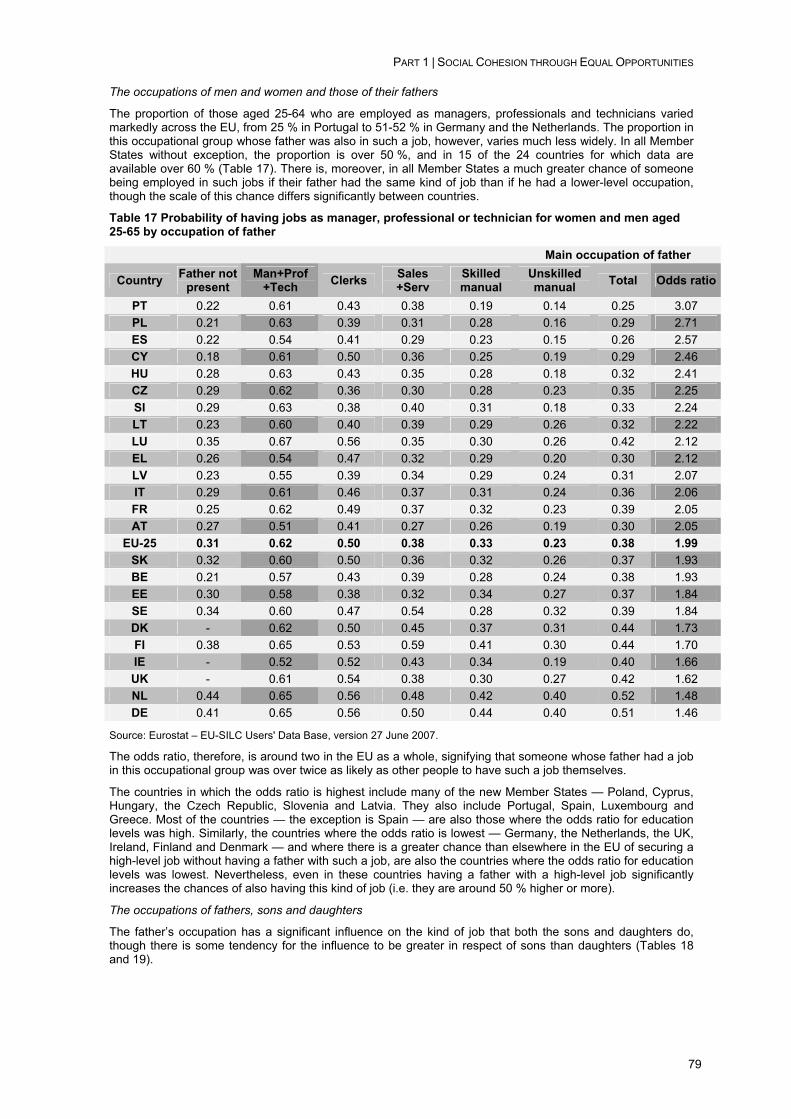
PART 1 | SOCIAL COHESION THROUGH EQUAL OPPORTUNITIES
79
The occupations of men and women and those of their fathers
The proportion of those aged 25-64 who are employed as managers, professionals and technicians varied markedly across the EU, from 25 % in Portugal to 51-52 % in Germany and the Netherlands. The proportion in this occupational group whose father was also in such a job, however, varies much less widely. In all Member States without exception, the proportion is over 50 %, and in 15 of the 24 countries for which data are available over 60 % (Table 17). There is, moreover, in all Member States a much greater chance of someone being employed in such jobs if their father had the same kind of job than if he had a lower-level occupation, though the scale of this chance differs significantly between countries.
Table 17 Probability of having jobs as manager, professional or technician for women and men aged 25-65 by occupation of father
Main occupation of father
Country Father not present
Man+Prof +Tech Clerks Sales
+Serv Skilled manual
Unskilled manual Total Odds ratio
PT 0.22 0.61 0.43 0.38 0.19 0.14 0.25 3.07 PL 0.21 0.63 0.39 0.31 0.28 0.16 0.29 2.71 ES 0.22 0.54 0.41 0.29 0.23 0.15 0.26 2.57 CY 0.18 0.61 0.50 0.36 0.25 0.19 0.29 2.46 HU 0.28 0.63 0.43 0.35 0.28 0.18 0.32 2.41 CZ 0.29 0.62 0.36 0.30 0.28 0.23 0.35 2.25 SI 0.29 0.63 0.38 0.40 0.31 0.18 0.33 2.24 LT 0.23 0.60 0.40 0.39 0.29 0.26 0.32 2.22 LU 0.35 0.67 0.56 0.35 0.30 0.26 0.42 2.12 EL 0.26 0.54 0.47 0.32 0.29 0.20 0.30 2.12 LV 0.23 0.55 0.39 0.34 0.29 0.24 0.31 2.07 IT 0.29 0.61 0.46 0.37 0.31 0.24 0.36 2.06 FR 0.25 0.62 0.49 0.37 0.32 0.23 0.39 2.05 AT 0.27 0.51 0.41 0.27 0.26 0.19 0.30 2.05
EU-25 0.31 0.62 0.50 0.38 0.33 0.23 0.38 1.99 SK 0.32 0.60 0.50 0.36 0.32 0.26 0.37 1.93 BE 0.21 0.57 0.43 0.39 0.28 0.24 0.38 1.93 EE 0.30 0.58 0.38 0.32 0.34 0.27 0.37 1.84 SE 0.34 0.60 0.47 0.54 0.28 0.32 0.39 1.84 DK - 0.62 0.50 0.45 0.37 0.31 0.44 1.73 FI 0.38 0.65 0.53 0.59 0.41 0.30 0.44 1.70 IE - 0.52 0.52 0.43 0.34 0.19 0.40 1.66 UK - 0.61 0.54 0.38 0.30 0.27 0.42 1.62 NL 0.44 0.65 0.56 0.48 0.42 0.40 0.52 1.48 DE 0.41 0.65 0.56 0.50 0.44 0.40 0.51 1.46
Source: Eurostat – EU-SILC Users' Data Base, version 27 June 2007.
The odds ratio, therefore, is around two in the EU as a whole, signifying that someone whose father had a job in this occupational group was over twice as likely as other people to have such a job themselves.
The countries in which the odds ratio is highest include many of the new Member States — Poland, Cyprus, Hungary, the Czech Republic, Slovenia and Latvia. They also include Portugal, Spain, Luxembourg and Greece. Most of the countries — the exception is Spain — are also those where the odds ratio for education levels was high. Similarly, the countries where the odds ratio is lowest — Germany, the Netherlands, the UK, Ireland, Finland and Denmark — and where there is a greater chance than elsewhere in the EU of securing a high-level job without having a father with such a job, are also the countries where the odds ratio for education levels was lowest. Nevertheless, even in these countries having a father with a high-level job significantly increases the chances of also having this kind of job (i.e. they are around 50 % higher or more).
The occupations of fathers, sons and daughters
The father’s occupation has a significant influence on the kind of job that both the sons and daughters do, though there is some tendency for the influence to be greater in respect of sons than daughters (Tables 18 and 19).
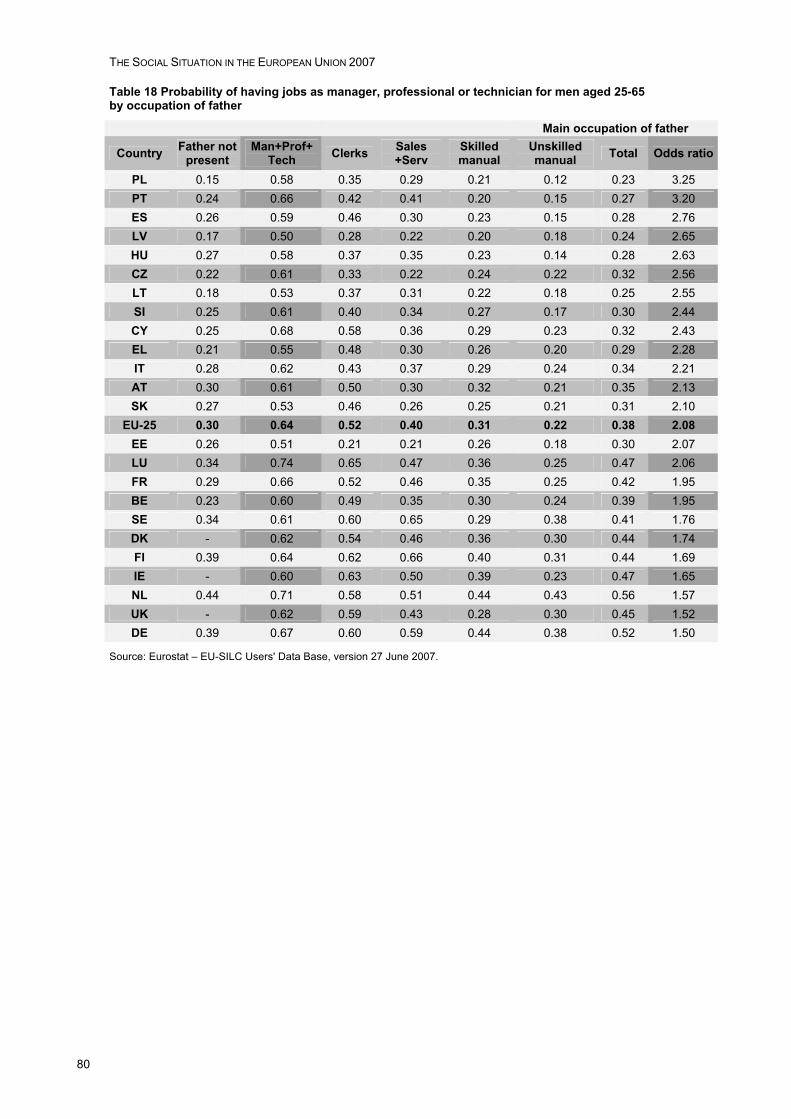
THE SOCIAL SITUATION IN THE EUROPEAN UNION 2007
80
Table 18 Probability of having jobs as manager, professional or technician for men aged 25-65 by occupation of father
Main occupation of father
Country Father not present
Man+Prof+ Tech Clerks Sales
+Serv Skilled manual
Unskilled manual Total Odds ratio
PL 0.15 0.58 0.35 0.29 0.21 0.12 0.23 3.25 PT 0.24 0.66 0.42 0.41 0.20 0.15 0.27 3.20 ES 0.26 0.59 0.46 0.30 0.23 0.15 0.28 2.76 LV 0.17 0.50 0.28 0.22 0.20 0.18 0.24 2.65 HU 0.27 0.58 0.37 0.35 0.23 0.14 0.28 2.63 CZ 0.22 0.61 0.33 0.22 0.24 0.22 0.32 2.56 LT 0.18 0.53 0.37 0.31 0.22 0.18 0.25 2.55 SI 0.25 0.61 0.40 0.34 0.27 0.17 0.30 2.44 CY 0.25 0.68 0.58 0.36 0.29 0.23 0.32 2.43 EL 0.21 0.55 0.48 0.30 0.26 0.20 0.29 2.28 IT 0.28 0.62 0.43 0.37 0.29 0.24 0.34 2.21 AT 0.30 0.61 0.50 0.30 0.32 0.21 0.35 2.13 SK 0.27 0.53 0.46 0.26 0.25 0.21 0.31 2.10
EU-25 0.30 0.64 0.52 0.40 0.31 0.22 0.38 2.08 EE 0.26 0.51 0.21 0.21 0.26 0.18 0.30 2.07 LU 0.34 0.74 0.65 0.47 0.36 0.25 0.47 2.06 FR 0.29 0.66 0.52 0.46 0.35 0.25 0.42 1.95 BE 0.23 0.60 0.49 0.35 0.30 0.24 0.39 1.95 SE 0.34 0.61 0.60 0.65 0.29 0.38 0.41 1.76 DK - 0.62 0.54 0.46 0.36 0.30 0.44 1.74 FI 0.39 0.64 0.62 0.66 0.40 0.31 0.44 1.69 IE - 0.60 0.63 0.50 0.39 0.23 0.47 1.65 NL 0.44 0.71 0.58 0.51 0.44 0.43 0.56 1.57 UK - 0.62 0.59 0.43 0.28 0.30 0.45 1.52 DE 0.39 0.67 0.60 0.59 0.44 0.38 0.52 1.50
Source: Eurostat – EU-SILC Users' Data Base, version 27 June 2007.
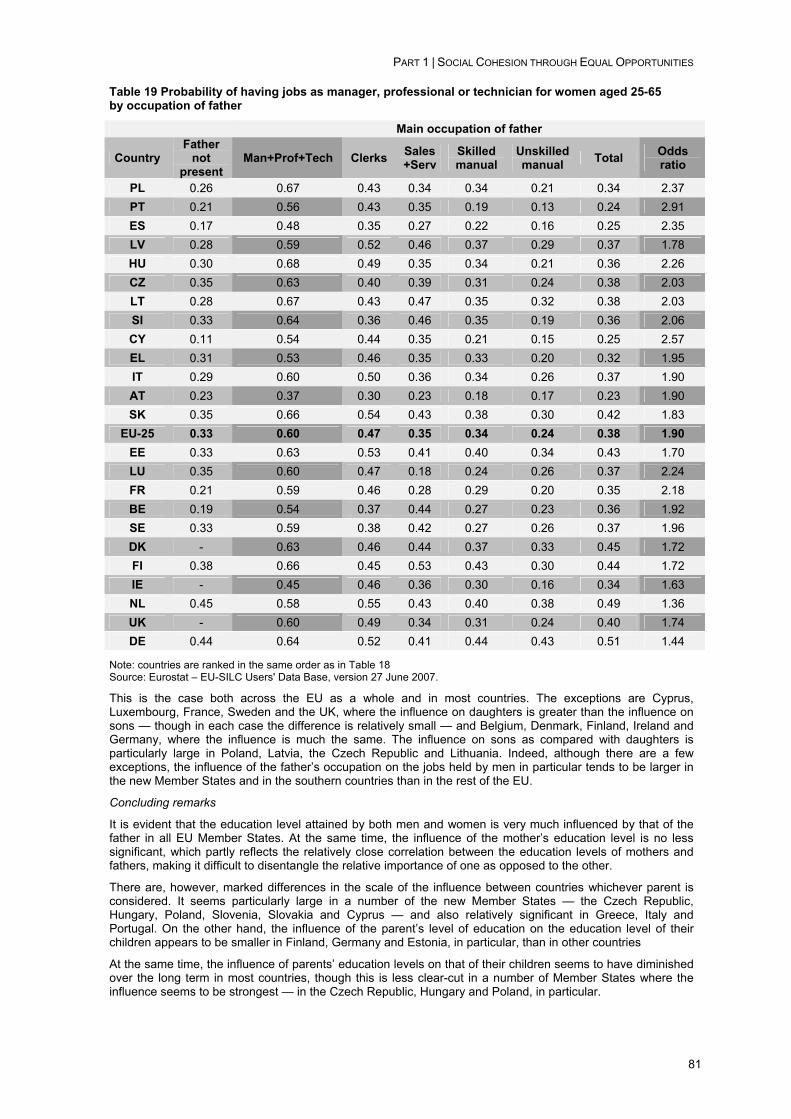
PART 1 | SOCIAL COHESION THROUGH EQUAL OPPORTUNITIES
81
Table 19 Probability of having jobs as manager, professional or technician for women aged 25-65 by occupation of father
Main occupation of father
Country Father
not present
Man+Prof+Tech Clerks Sales +Serv
Skilled manual
Unskilled manual Total Odds
ratio
PL 0.26 0.67 0.43 0.34 0.34 0.21 0.34 2.37 PT 0.21 0.56 0.43 0.35 0.19 0.13 0.24 2.91 ES 0.17 0.48 0.35 0.27 0.22 0.16 0.25 2.35 LV 0.28 0.59 0.52 0.46 0.37 0.29 0.37 1.78 HU 0.30 0.68 0.49 0.35 0.34 0.21 0.36 2.26 CZ 0.35 0.63 0.40 0.39 0.31 0.24 0.38 2.03 LT 0.28 0.67 0.43 0.47 0.35 0.32 0.38 2.03 SI 0.33 0.64 0.36 0.46 0.35 0.19 0.36 2.06 CY 0.11 0.54 0.44 0.35 0.21 0.15 0.25 2.57 EL 0.31 0.53 0.46 0.35 0.33 0.20 0.32 1.95 IT 0.29 0.60 0.50 0.36 0.34 0.26 0.37 1.90 AT 0.23 0.37 0.30 0.23 0.18 0.17 0.23 1.90 SK 0.35 0.66 0.54 0.43 0.38 0.30 0.42 1.83
EU-25 0.33 0.60 0.47 0.35 0.34 0.24 0.38 1.90 EE 0.33 0.63 0.53 0.41 0.40 0.34 0.43 1.70 LU 0.35 0.60 0.47 0.18 0.24 0.26 0.37 2.24 FR 0.21 0.59 0.46 0.28 0.29 0.20 0.35 2.18 BE 0.19 0.54 0.37 0.44 0.27 0.23 0.36 1.92 SE 0.33 0.59 0.38 0.42 0.27 0.26 0.37 1.96 DK - 0.63 0.46 0.44 0.37 0.33 0.45 1.72 FI 0.38 0.66 0.45 0.53 0.43 0.30 0.44 1.72 IE - 0.45 0.46 0.36 0.30 0.16 0.34 1.63 NL 0.45 0.58 0.55 0.43 0.40 0.38 0.49 1.36 UK - 0.60 0.49 0.34 0.31 0.24 0.40 1.74 DE 0.44 0.64 0.52 0.41 0.44 0.43 0.51 1.44
Note: countries are ranked in the same order as in Table 18 Source: Eurostat – EU-SILC Users' Data Base, version 27 June 2007.
This is the case both across the EU as a whole and in most countries. The exceptions are Cyprus, Luxembourg, France, Sweden and the UK, where the influence on daughters is greater than the influence on sons — though in each case the difference is relatively small — and Belgium, Denmark, Finland, Ireland and Germany, where the influence is much the same. The influence on sons as compared with daughters is particularly large in Poland, Latvia, the Czech Republic and Lithuania. Indeed, although there are a few exceptions, the influence of the father’s occupation on the jobs held by men in particular tends to be larger in the new Member States and in the southern countries than in the rest of the EU.
Concluding remarks
It is evident that the education level attained by both men and women is very much influenced by that of the father in all EU Member States. At the same time, the influence of the mother’s education level is no less significant, which partly reflects the relatively close correlation between the education levels of mothers and fathers, making it difficult to disentangle the relative importance of one as opposed to the other.
There are, however, marked differences in the scale of the influence between countries whichever parent is considered. It seems particularly large in a number of the new Member States — the Czech Republic, Hungary, Poland, Slovenia, Slovakia and Cyprus — and also relatively significant in Greece, Italy and Portugal. On the other hand, the influence of the parent’s level of education on the education level of their children appears to be smaller in Finland, Germany and Estonia, in particular, than in other countries
At the same time, the influence of parents’ education levels on that of their children seems to have diminished over the long term in most countries, though this is less clear-cut in a number of Member States where the influence seems to be strongest — in the Czech Republic, Hungary and Poland, in particular.
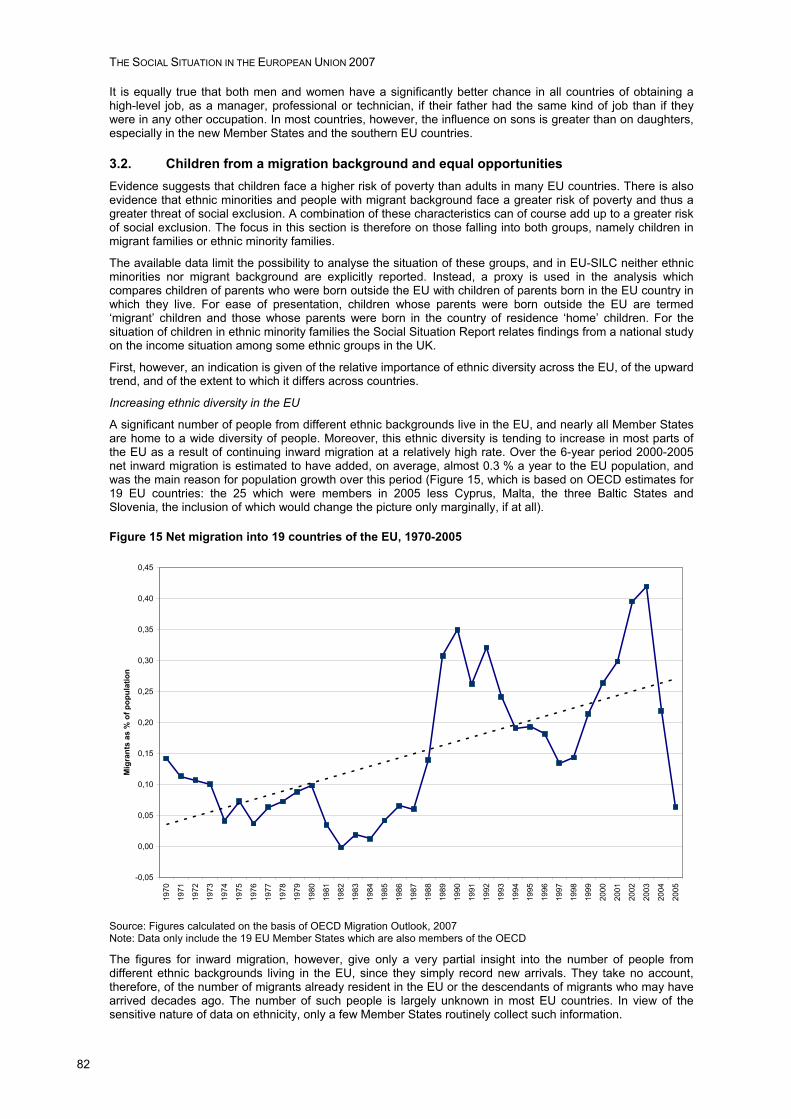
THE SOCIAL SITUATION IN THE EUROPEAN UNION 2007
82
It is equally true that both men and women have a significantly better chance in all countries of obtaining a high-level job, as a manager, professional or technician, if their father had the same kind of job than if they were in any other occupation. In most countries, however, the influence on sons is greater than on daughters, especially in the new Member States and the southern EU countries.
3.2. Children from a migration background and equal opportunities Evidence suggests that children face a higher risk of poverty than adults in many EU countries. There is also evidence that ethnic minorities and people with migrant background face a greater risk of poverty and thus a greater threat of social exclusion. A combination of these characteristics can of course add up to a greater risk of social exclusion. The focus in this section is therefore on those falling into both groups, namely children in migrant families or ethnic minority families.
The available data limit the possibility to analyse the situation of these groups, and in EU-SILC neither ethnic minorities nor migrant background are explicitly reported. Instead, a proxy is used in the analysis which compares children of parents who were born outside the EU with children of parents born in the EU country in which they live. For ease of presentation, children whose parents were born outside the EU are termed ‘migrant’ children and those whose parents were born in the country of residence ‘home’ children. For the situation of children in ethnic minority families the Social Situation Report relates findings from a national study on the income situation among some ethnic groups in the UK.
First, however, an indication is given of the relative importance of ethnic diversity across the EU, of the upward trend, and of the extent to which it differs across countries.
Increasing ethnic diversity in the EU
A significant number of people from different ethnic backgrounds live in the EU, and nearly all Member States are home to a wide diversity of people. Moreover, this ethnic diversity is tending to increase in most parts of the EU as a result of continuing inward migration at a relatively high rate. Over the 6-year period 2000-2005 net inward migration is estimated to have added, on average, almost 0.3 % a year to the EU population, and was the main reason for population growth over this period (Figure 15, which is based on OECD estimates for 19 EU countries: the 25 which were members in 2005 less Cyprus, Malta, the three Baltic States and Slovenia, the inclusion of which would change the picture only marginally, if at all).
Figure 15 Net migration into 19 countries of the EU, 1970-2005
-0,05
0,00
0,05
0,10
0,15
0,20
0,25
0,30
0,35
0,40
0,45
1970
1971
1972
1973
1974
1975
1976
1977
1978
1979
1980
1981
1982
1983
1984
1985
1986
1987
1988
1989
1990
1991
1992
1993
1994
1995
1996
1997
1998
1999
2000
2001
2002
2003
2004
2005
Mig
rant
s as
% o
f pop
ulat
ion
Source: Figures calculated on the basis of OECD Migration Outlook, 2007 Note: Data only include the 19 EU Member States which are also members of the OECD
The figures for inward migration, however, give only a very partial insight into the number of people from different ethnic backgrounds living in the EU, since they simply record new arrivals. They take no account, therefore, of the number of migrants already resident in the EU or the descendants of migrants who may have arrived decades ago. The number of such people is largely unknown in most EU countries. In view of the sensitive nature of data on ethnicity, only a few Member States routinely collect such information.
PART 1 | SOCIAL COHESION THROUGH EQUAL OPPORTUNITIES
83
Two proxies can be used to obtain an indication of ethnic diversity in EU Member States: one is citizenship — i.e. the number of people who do not have citizenship of the country in which they live or of any other EU Member State — and the other is country of birth. The country of birth tends to be more difficult to collect information on, though it is perhaps more indicative of the population from different ethnic backgrounds than citizenship, insofar as citizenship can usually be obtained in most countries after a period of residence. The number of people born outside the EU living in Member States will, therefore, tend to be larger than the number of non-EU citizens, the more so the quicker it is to obtain citizenship in the country in question. Neither, however, are likely to give anywhere near a full picture of ethnic diversity in the EU.
Nevertheless, there is another measure which could be used to give a fuller picture of ethnic diversity across the EU and which largely avoids the problems associated with collecting information on ethnic origin. This is the concept of ‘foreign descent’, defined as either being born outside the EU or having at least one parent who was born outside the EU, which would pick up second as well as first-generation migrants. Data on this concept, however, exist for only two Member States, Denmark and the Netherlands. These show that, even if the measure is not entirely satisfactory as an indicator of the number of people of different ethnic origin living in a country, since it still leaves out of account third or subsequent-generation descendants of migrants, it does represent a significant improvement over country of birth as an indicator, and still more over citizenship. In Denmark, therefore, the measures indicate that 25 % of people of foreign descent were born in the country and in the Netherlands, almost 50 %.
The composition of non-nationals in EU countries
Despite their limitations, data on citizenship provide the main indication of the number of different ethnic groups living in the EU, of the relative importance of the various groups in individual countries and of the way that this differs between countries. They show, first, that in all EU Member States, citizens from other parts of the EU and the rest of Europe account for most of the people without domestic citizenship; secondly, most of the people with non-European citizenship are from relatively near-by countries, e.g. the Middle East and North Africa; and, thirdly, that the relative importance of people with citizenship of non-EU countries varies markedly across the EU, as do the particular countries which they are citizens of, partly reflecting colonial and historical links in the past (see pie charts).
People with Turkish citizenship, therefore, account for a relatively large proportion of non-nationals in Germany (24 %), Austria (18 %), the Netherlands (14 %) and Denmark (11 %) but are less important elsewhere. Those from Morocco make up a significant proportion of non-nationals in France (around 15 %) — as do those from Algeria (also 15 %) — Spain (14 %), the Netherlands (13 %) and Italy (12 %). However, a far greater number of people of North African descent living in France and Spain in particular are likely to have acquired French or Spanish citizenship. Similarly, in the UK, people with Indian citizenship represent some 6 % of non-nationals and from Pakistan, just 3 %; in both cases the number involved is likely to be very much smaller than the number of persons of Indian and Pakistani descent living in the country.

THE SOCIAL SITUATION IN THE EUROPEAN UNION 2007
84
Figures 16 Foreign population by country of nationality, 2005
Austria
18.7
17.9
15.210.2
8.5
3.1
2.5
1.9
1.8
1.4
18.9
Serbia & Montenegro
Turkey
Bosnia & Herzegovina
Germany
Croatia
Poland
Romania
Macedonia
Hungary
Italy
Other
Belgium
21.3
13.4
11.79.5
5.1
4.84.1
3.1
3.0
2.0
22.0
Italy
France
Netherlands
Morocco
Spain
Turkey
Germany
Portugal
Great Britain
Greece
Other
Bulgaria
36.8
8.96.66.4
5.4
4.03.1
2.5
2.3
1.9
22.0
Russian Federation
Ukraine
Greece
Armenia
Macedonia
Turkey
Moldova
Syria
Poland
China (incl Hong Kong)
Other
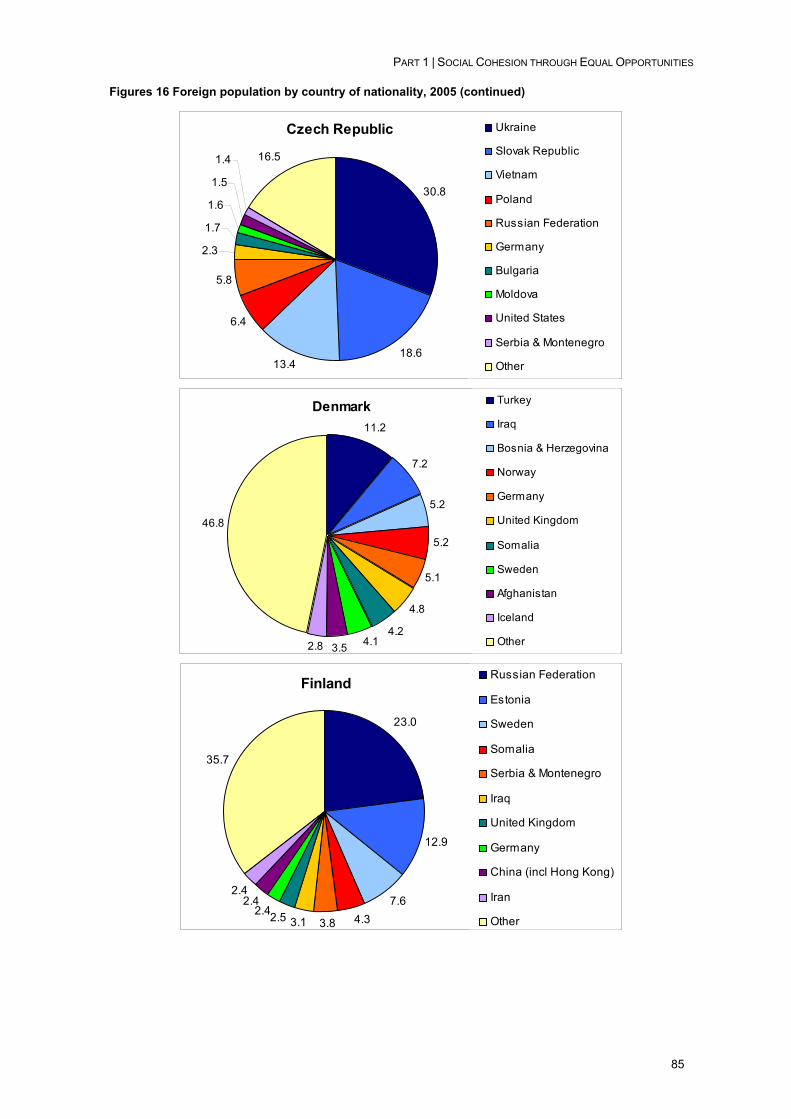
PART 1 | SOCIAL COHESION THROUGH EQUAL OPPORTUNITIES
85
Figures 16 Foreign population by country of nationality, 2005 (continued)
Czech Republic
30.8
18.613.4
6.4
5.8
2.3
1.7
1.6
1.5
1.4 16.5
Ukraine
Slovak Republic
Vietnam
Poland
Russian Federation
Germany
Bulgaria
Moldova
United States
Serbia & Montenegro
Other
Denmark11.2
7.2
5.2
5.2
5.1
4.8
4.24.13.52.8
46.8
Turkey
Iraq
Bosnia & Herzegovina
Norway
Germany
United Kingdom
Somalia
Sweden
Afghanistan
Iceland
Other
Finland
23.0
12.9
7.64.33.83.12.52.4
2.42.4
35.7
Russian Federation
Estonia
Sweden
Somalia
Serbia & Montenegro
Iraq
United Kingdom
Germany
China (incl Hong Kong)
Iran
Other
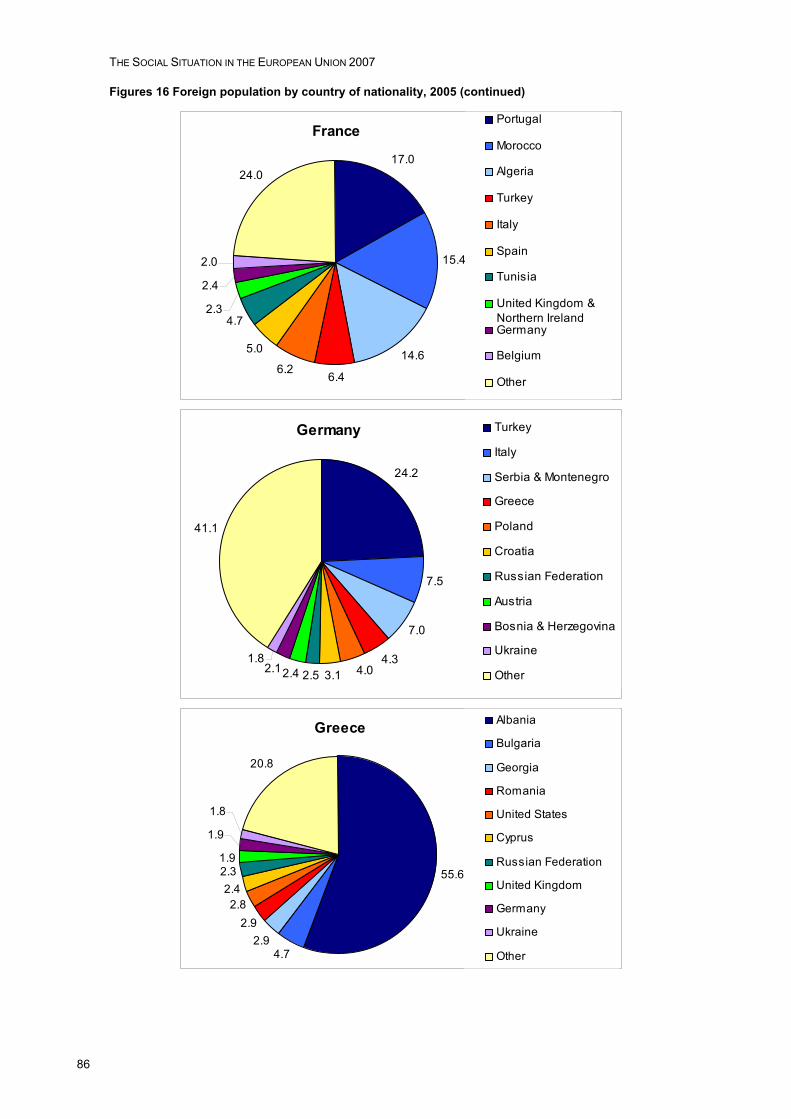
THE SOCIAL SITUATION IN THE EUROPEAN UNION 2007
86
Figures 16 Foreign population by country of nationality, 2005 (continued)
France
17.0
15.4
14.6
6.46.2
5.0
4.72.3
2.4
2.0
24.0
Portugal
Morocco
Algeria
Turkey
Italy
Spain
Tunisia
United Kingdom &Northern IrelandGermany
Belgium
Other
Germany
24.2
7.5
7.0
4.34.03.12.52.42.1
41.1
1.8
Turkey
Italy
Serbia & Montenegro
Greece
Poland
Croatia
Russian Federation
Austria
Bosnia & Herzegovina
Ukraine
Other
Greece
55.6
4.72.9
2.92.8
2.42.31.9
1.9
1.8
20.8
Albania
Bulgaria
Georgia
Romania
United States
Cyprus
Russian Federation
United Kingdom
Germany
Ukraine
Other
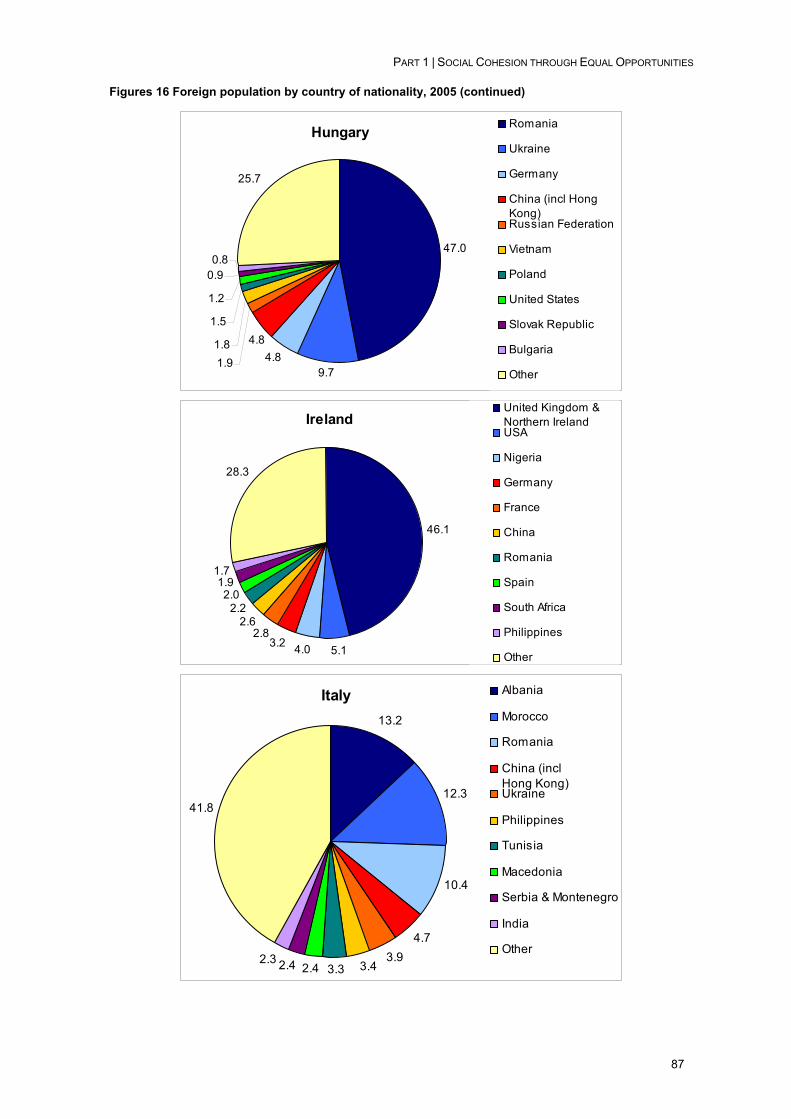
PART 1 | SOCIAL COHESION THROUGH EQUAL OPPORTUNITIES
87
Figures 16 Foreign population by country of nationality, 2005 (continued)
Hungary
47.0
9.74.8
1.8
1.5
1.2
0.9
25.7
1.9
0.8
4.8
Romania
Ukraine
Germany
China (incl HongKong)Russian Federation
Vietnam
Poland
United States
Slovak Republic
Bulgaria
Other
Ireland
46.1
5.14.03.22.8
2.62.2
2.01.9
1.7
28.3
United Kingdom &Northern IrelandUSA
Nigeria
Germany
France
China
Romania
Spain
South Africa
Philippines
Other
Italy13.2
12.3
10.4
4.73.9
3.43.32.42.4
41.8
2.3
Albania
Morocco
Romania
China (incl Hong Kong)Ukraine
Philippines
Tunisia
Macedonia
Serbia & Montenegro
India
Other
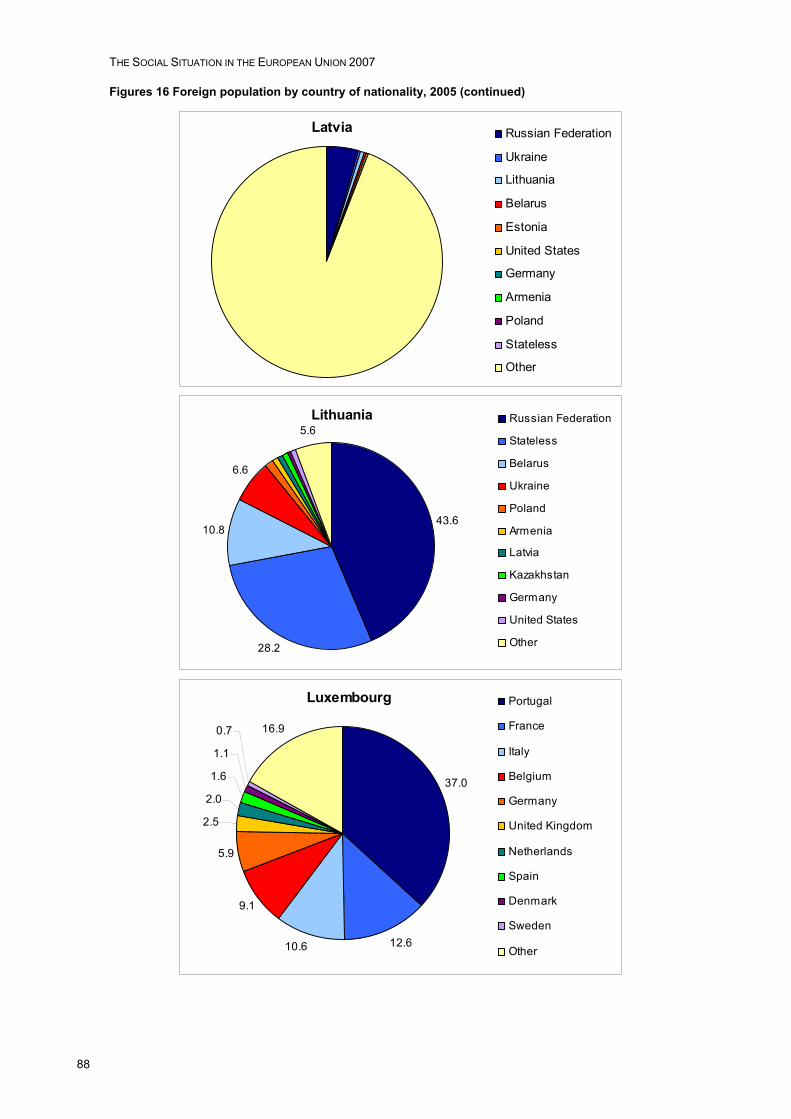
THE SOCIAL SITUATION IN THE EUROPEAN UNION 2007
88
Figures 16 Foreign population by country of nationality, 2005 (continued)
Latvia Russian Federation
Ukraine
Lithuania
Belarus
Estonia
United States
Germany
Armenia
Poland
Stateless
Other
Lithuania
43.6
28.2
10.8
6.6
5.6Russian Federation
Stateless
Belarus
Ukraine
Poland
Armenia
Latvia
Kazakhstan
Germany
United States
Other
Luxembourg
37.0
12.610.6
9.1
5.9
2.5
2.0
1.6
1.1
0.7 16.9
Portugal
France
Italy
Belgium
Germany
United Kingdom
Netherlands
Spain
Denmark
Sweden
Other
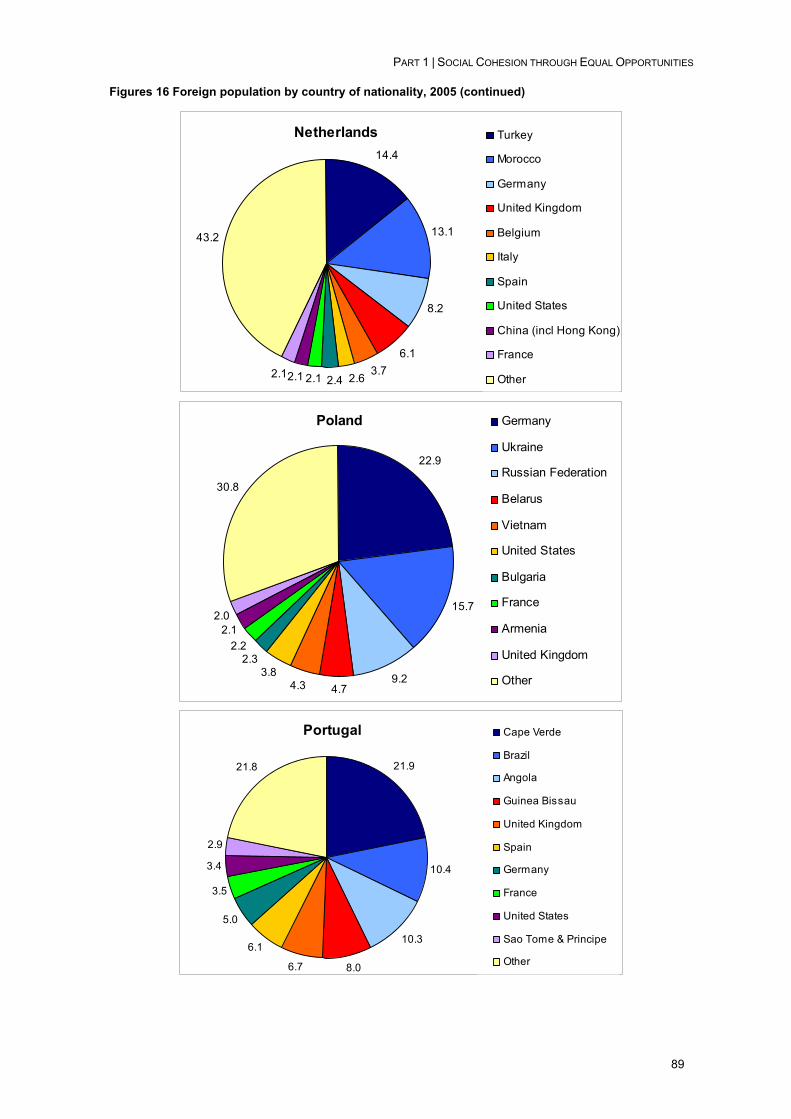
PART 1 | SOCIAL COHESION THROUGH EQUAL OPPORTUNITIES
89
Figures 16 Foreign population by country of nationality, 2005 (continued)
Netherlands14.4
13.1
8.2
6.13.7
2.62.42.12.12.1
43.2
Turkey
Morocco
Germany
United Kingdom
Belgium
Italy
Spain
United States
China (incl Hong Kong)
France
Other
Poland
22.9
15.7
9.24.74.3
3.82.3
2.22.1
2.0
30.8
Germany
Ukraine
Russian Federation
Belarus
Vietnam
United States
Bulgaria
France
Armenia
United Kingdom
Other
Portugal
21.9
10.4
10.3
8.06.7
6.1
5.0
3.5
3.4
2.9
21.8
Cape Verde
Brazil
Angola
Guinea Bissau
United Kingdom
Spain
Germany
France
United States
Sao Tome & Principe
Other

THE SOCIAL SITUATION IN THE EUROPEAN UNION 2007
90
Figures 16 Foreign population by country of nationality, 2005 (continued)
Romania
21.0
8.4
7.3
6.8
6.14.73.03.0
2.9
2.7
34.1
Moldova
Turkey
China (incl Hong Kong)
Italy
Greece
Syrian Arab Republic
Ukraine
Iraq
United States
Lebanon
Other
Slovakia
18.1
16.2
11.1
6.95.54.5
3.7
25.6
2.9
2.82.6
Ukraine
Czech Republic
Poland
Hungary
Russian Federation
Germany
Vietnam
United States
Bulgaria
Austria
Other
Slovenia
48.2
17.9
15.4
9.3
2.03.8
Bosnia & Herzegovina
Serbia & Montenegro
Croatia
Macedonia , ex Yug
Ukraine
China (incl HongKong)Russian Federation
Germany
Italy
Austria
Other
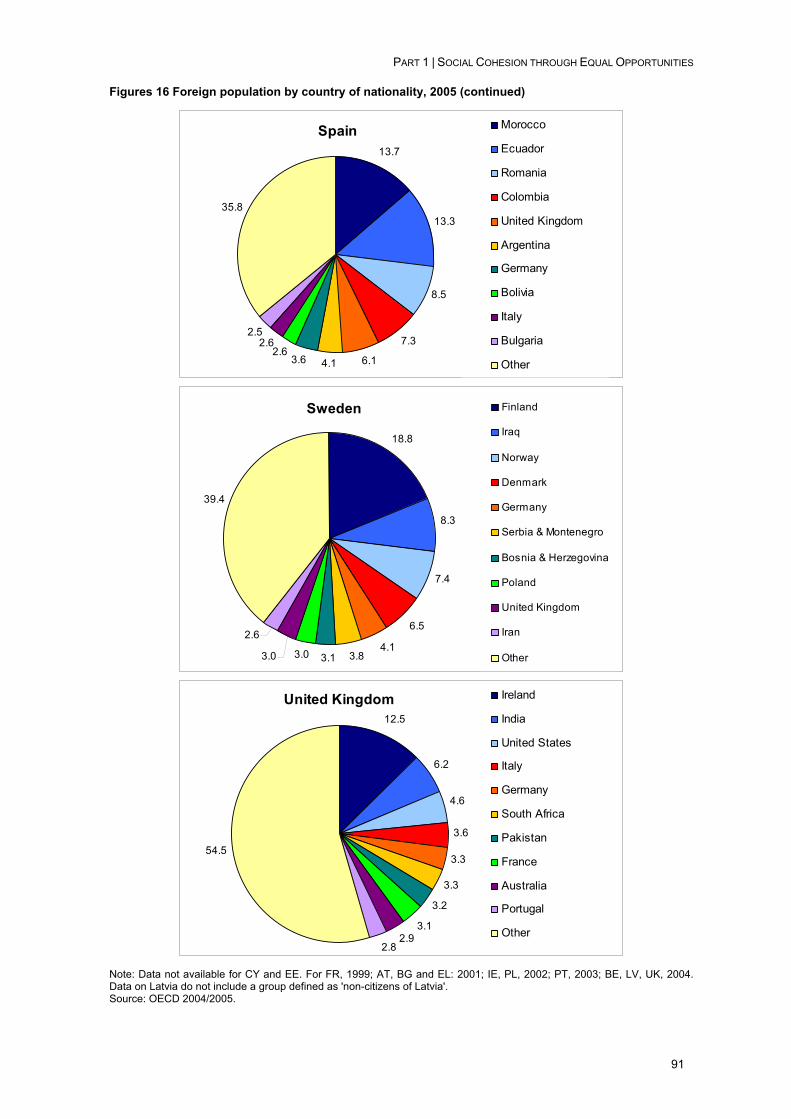
PART 1 | SOCIAL COHESION THROUGH EQUAL OPPORTUNITIES
91
Figures 16 Foreign population by country of nationality, 2005 (continued)
Spain13.7
13.3
8.5
7.3
6.14.13.62.6
2.62.5
35.8
Morocco
Ecuador
Romania
Colombia
United Kingdom
Argentina
Germany
Bolivia
Italy
Bulgaria
Other
Sweden
18.8
8.3
7.4
6.5
4.13.83.13.03.0
2.6
39.4
Finland
Iraq
Norway
Denmark
Germany
Serbia & Montenegro
Bosnia & Herzegovina
Poland
United Kingdom
Iran
Other
United Kingdom12.5
6.2
4.6
3.6
3.3
3.3
3.2
3.12.9
2.8
54.5
Ireland
India
United States
Italy
Germany
South Africa
Pakistan
France
Australia
Portugal
Other
Note: Data not available for CY and EE. For FR, 1999; AT, BG and EL: 2001; IE, PL, 2002; PT, 2003; BE, LV, UK, 2004. Data on Latvia do not include a group defined as 'non-citizens of Latvia'. Source: OECD 2004/2005.
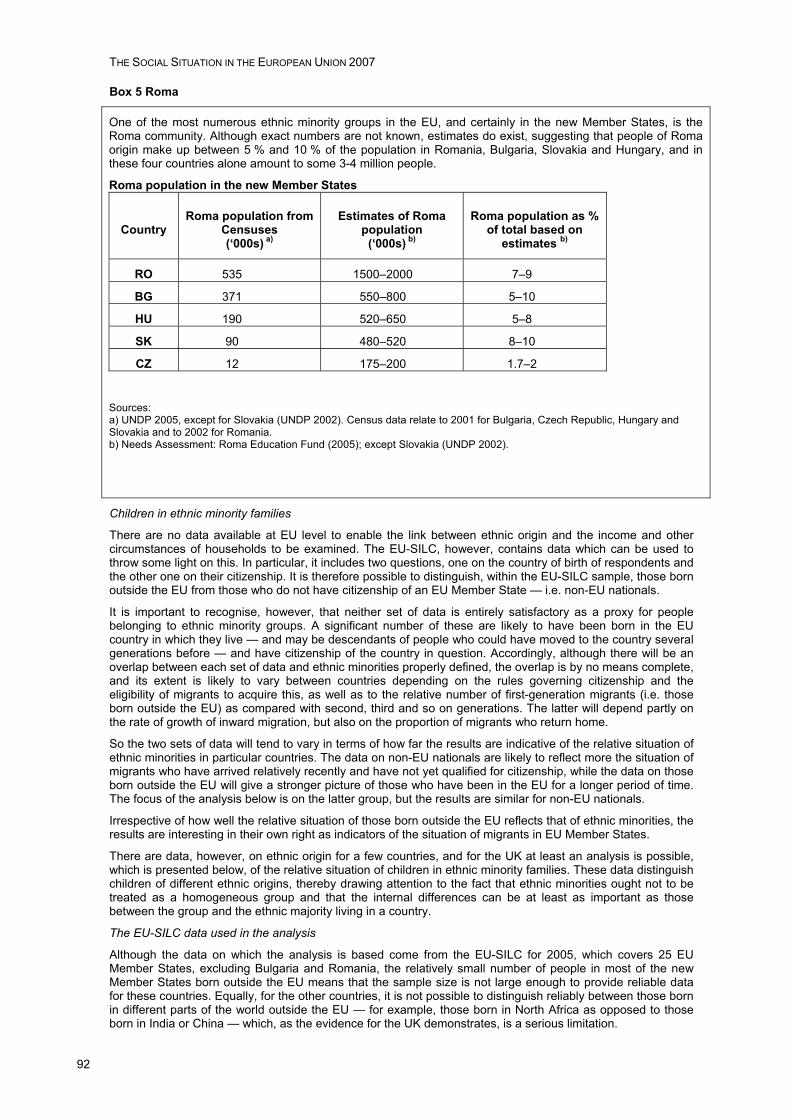
THE SOCIAL SITUATION IN THE EUROPEAN UNION 2007
92
Box 5 Roma
One of the most numerous ethnic minority groups in the EU, and certainly in the new Member States, is the Roma community. Although exact numbers are not known, estimates do exist, suggesting that people of Roma origin make up between 5 % and 10 % of the population in Romania, Bulgaria, Slovakia and Hungary, and in these four countries alone amount to some 3-4 million people.
Roma population in the new Member States
Sources: a) UNDP 2005, except for Slovakia (UNDP 2002). Census data relate to 2001 for Bulgaria, Czech Republic, Hungary and Slovakia and to 2002 for Romania. b) Needs Assessment: Roma Education Fund (2005); except Slovakia (UNDP 2002).
Children in ethnic minority families
There are no data available at EU level to enable the link between ethnic origin and the income and other circumstances of households to be examined. The EU-SILC, however, contains data which can be used to throw some light on this. In particular, it includes two questions, one on the country of birth of respondents and the other one on their citizenship. It is therefore possible to distinguish, within the EU-SILC sample, those born outside the EU from those who do not have citizenship of an EU Member State — i.e. non-EU nationals.
It is important to recognise, however, that neither set of data is entirely satisfactory as a proxy for people belonging to ethnic minority groups. A significant number of these are likely to have been born in the EU country in which they live — and may be descendants of people who could have moved to the country several generations before — and have citizenship of the country in question. Accordingly, although there will be an overlap between each set of data and ethnic minorities properly defined, the overlap is by no means complete, and its extent is likely to vary between countries depending on the rules governing citizenship and the eligibility of migrants to acquire this, as well as to the relative number of first-generation migrants (i.e. those born outside the EU) as compared with second, third and so on generations. The latter will depend partly on the rate of growth of inward migration, but also on the proportion of migrants who return home.
So the two sets of data will tend to vary in terms of how far the results are indicative of the relative situation of ethnic minorities in particular countries. The data on non-EU nationals are likely to reflect more the situation of migrants who have arrived relatively recently and have not yet qualified for citizenship, while the data on those born outside the EU will give a stronger picture of those who have been in the EU for a longer period of time. The focus of the analysis below is on the latter group, but the results are similar for non-EU nationals.
Irrespective of how well the relative situation of those born outside the EU reflects that of ethnic minorities, the results are interesting in their own right as indicators of the situation of migrants in EU Member States.
There are data, however, on ethnic origin for a few countries, and for the UK at least an analysis is possible, which is presented below, of the relative situation of children in ethnic minority families. These data distinguish children of different ethnic origins, thereby drawing attention to the fact that ethnic minorities ought not to be treated as a homogeneous group and that the internal differences can be at least as important as those between the group and the ethnic majority living in a country.
The EU-SILC data used in the analysis
Although the data on which the analysis is based come from the EU-SILC for 2005, which covers 25 EU Member States, excluding Bulgaria and Romania, the relatively small number of people in most of the new Member States born outside the EU means that the sample size is not large enough to provide reliable data for these countries. Equally, for the other countries, it is not possible to distinguish reliably between those born in different parts of the world outside the EU — for example, those born in North Africa as opposed to those born in India or China — which, as the evidence for the UK demonstrates, is a serious limitation.
Country Roma population from
Censuses (‘000s) a)
Estimates of Roma population
(‘000s) b)
Roma population as % of total based on
estimates b)
RO 535 1500–2000 7–9
BG 371 550–800 5–10
HU 190 520–650 5–8
SK 90 480–520 8–10
CZ 12 175–200 1.7–2
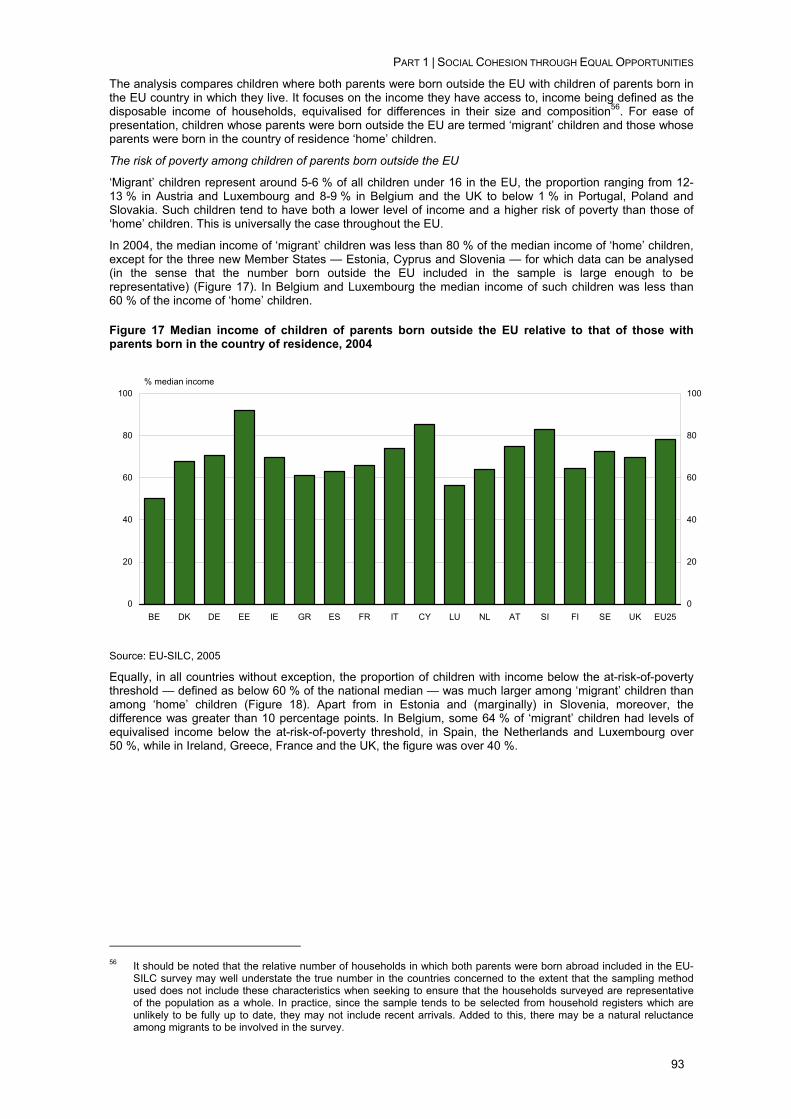
PART 1 | SOCIAL COHESION THROUGH EQUAL OPPORTUNITIES
93
The analysis compares children where both parents were born outside the EU with children of parents born in the EU country in which they live. It focuses on the income they have access to, income being defined as the disposable income of households, equivalised for differences in their size and composition56. For ease of presentation, children whose parents were born outside the EU are termed ‘migrant’ children and those whose parents were born in the country of residence ‘home’ children.
The risk of poverty among children of parents born outside the EU
‘Migrant’ children represent around 5-6 % of all children under 16 in the EU, the proportion ranging from 12-13 % in Austria and Luxembourg and 8-9 % in Belgium and the UK to below 1 % in Portugal, Poland and Slovakia. Such children tend to have both a lower level of income and a higher risk of poverty than those of ‘home’ children. This is universally the case throughout the EU.
In 2004, the median income of ‘migrant’ children was less than 80 % of the median income of ‘home’ children, except for the three new Member States — Estonia, Cyprus and Slovenia — for which data can be analysed (in the sense that the number born outside the EU included in the sample is large enough to be representative) (Figure 17). In Belgium and Luxembourg the median income of such children was less than 60 % of the income of ‘home’ children.
Figure 17 Median income of children of parents born outside the EU relative to that of those with parents born in the country of residence, 2004
0
20
40
60
80
100
BE DK DE EE IE GR ES FR IT CY LU NL AT SI FI SE UK EU250
20
40
60
80
100% median income
Source: EU-SILC, 2005
Equally, in all countries without exception, the proportion of children with income below the at-risk-of-poverty threshold — defined as below 60 % of the national median — was much larger among ‘migrant’ children than among ‘home’ children (Figure 18). Apart from in Estonia and (marginally) in Slovenia, moreover, the difference was greater than 10 percentage points. In Belgium, some 64 % of ‘migrant’ children had levels of equivalised income below the at-risk-of-poverty threshold, in Spain, the Netherlands and Luxembourg over 50 %, while in Ireland, Greece, France and the UK, the figure was over 40 %.
56 It should be noted that the relative number of households in which both parents were born abroad included in the EU-
SILC survey may well understate the true number in the countries concerned to the extent that the sampling method used does not include these characteristics when seeking to ensure that the households surveyed are representative of the population as a whole. In practice, since the sample tends to be selected from household registers which are unlikely to be fully up to date, they may not include recent arrivals. Added to this, there may be a natural reluctance among migrants to be involved in the survey.
THE SOCIAL SITUATION IN THE EUROPEAN UNION 2007
94
Figure 18 Proportion of children with income below the at-risk-of-poverty threshold, parents born outside the EU and parents born in the country of residence, 2004
0
10
20
30
40
50
60
BE DK DE EE IE GR ES FR IT CY LU NL AT SI FI SE UK EU250
10
20
30
40
50
60
born outside the EU born in country of residence
% of children of parents born ouside the EU/in country of residence
64,3
Source: Eurostat – EU-SILC Users' Data Base, version 27 June 2007.
These figures imply, together with the relatively large number of ‘migrant’ children in some cases, that such children account for a significant proportion of all children at risk of poverty in a number of EU Member States. In the EU as whole, therefore, ‘migrant’ children make up 11-12 % of all children at risk of poverty, while in France, they make up around 23 %, in Austria and Sweden 25-28 %, in Belgium almost a third and in Luxembourg just over a third.
The risk of poverty among households with and without children
The presence of children in the household, or family size, does not seem to be the main reason for the high risk of poverty among those whose parents were born outside the EU, although it does seem to be a contributory factor in a number of countries. People born outside the EU living in households without children also tend to be exposed to a higher risk of poverty than those living in childless households where all members were born in the country of residence. This is the case in all Member States without exception (Table 20).
The difference was particularly large (20 percentage points or more) in Belgium, France, Luxembourg and the three Nordic Member States. In Finland, the gap at risk of poverty between those born in the country of residence and those born abroad was greater in households without children than for households with children. However, Finland and Estonia are the only EU countries where this was the case. In all other Member States, therefore, the presence of children in households seems to increase the risk of poverty among those born outside the EU relative to those born in the country, in many cases markedly so (in Belgium, Ireland, Greece, Spain, Cyprus, the Netherlands and the UK, especially).
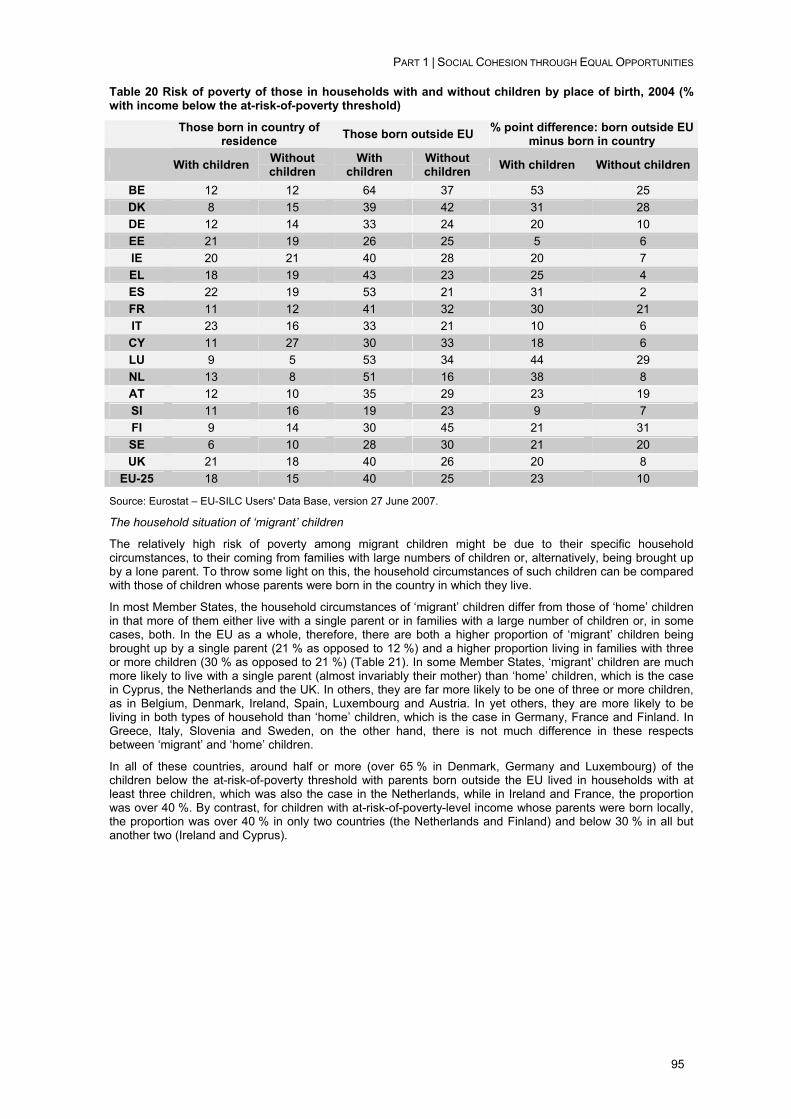
PART 1 | SOCIAL COHESION THROUGH EQUAL OPPORTUNITIES
95
Table 20 Risk of poverty of those in households with and without children by place of birth, 2004 (% with income below the at-risk-of-poverty threshold)
Those born in country of residence Those born outside EU % point difference: born outside EU
minus born in country
With children Without children
With children
Without children With children Without children
BE 12 12 64 37 53 25 DK 8 15 39 42 31 28 DE 12 14 33 24 20 10 EE 21 19 26 25 5 6 IE 20 21 40 28 20 7 EL 18 19 43 23 25 4 ES 22 19 53 21 31 2 FR 11 12 41 32 30 21 IT 23 16 33 21 10 6 CY 11 27 30 33 18 6 LU 9 5 53 34 44 29 NL 13 8 51 16 38 8 AT 12 10 35 29 23 19 SI 11 16 19 23 9 7 FI 9 14 30 45 21 31 SE 6 10 28 30 21 20 UK 21 18 40 26 20 8
EU-25 18 15 40 25 23 10
Source: Eurostat – EU-SILC Users' Data Base, version 27 June 2007.
The household situation of ‘migrant’ children
The relatively high risk of poverty among migrant children might be due to their specific household circumstances, to their coming from families with large numbers of children or, alternatively, being brought up by a lone parent. To throw some light on this, the household circumstances of such children can be compared with those of children whose parents were born in the country in which they live.
In most Member States, the household circumstances of ‘migrant’ children differ from those of ‘home’ children in that more of them either live with a single parent or in families with a large number of children or, in some cases, both. In the EU as a whole, therefore, there are both a higher proportion of ‘migrant’ children being brought up by a single parent (21 % as opposed to 12 %) and a higher proportion living in families with three or more children (30 % as opposed to 21 %) (Table 21). In some Member States, ‘migrant’ children are much more likely to live with a single parent (almost invariably their mother) than ‘home’ children, which is the case in Cyprus, the Netherlands and the UK. In others, they are far more likely to be one of three or more children, as in Belgium, Denmark, Ireland, Spain, Luxembourg and Austria. In yet others, they are more likely to be living in both types of household than ‘home’ children, which is the case in Germany, France and Finland. In Greece, Italy, Slovenia and Sweden, on the other hand, there is not much difference in these respects between ‘migrant’ and ‘home’ children.
In all of these countries, around half or more (over 65 % in Denmark, Germany and Luxembourg) of the children below the at-risk-of-poverty threshold with parents born outside the EU lived in households with at least three children, which was also the case in the Netherlands, while in Ireland and France, the proportion was over 40 %. By contrast, for children with at-risk-of-poverty-level income whose parents were born locally, the proportion was over 40 % in only two countries (the Netherlands and Finland) and below 30 % in all but another two (Ireland and Cyprus).
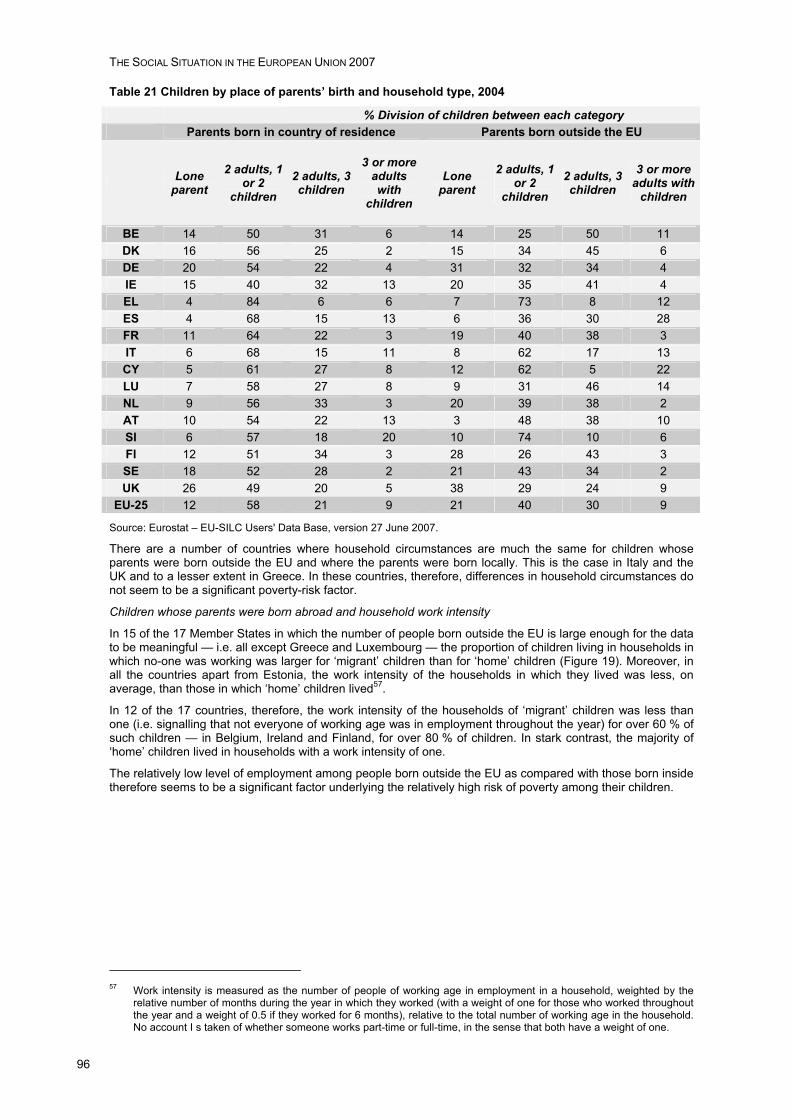
THE SOCIAL SITUATION IN THE EUROPEAN UNION 2007
96
Table 21 Children by place of parents’ birth and household type, 2004
% Division of children between each category Parents born in country of residence Parents born outside the EU
Lone parent
2 adults, 1 or 2
children 2 adults, 3 children
3 or more adults with
children
Lone parent
2 adults, 1 or 2
children 2 adults, 3 children
3 or more adults with
children
BE 14 50 31 6 14 25 50 11 DK 16 56 25 2 15 34 45 6 DE 20 54 22 4 31 32 34 4 IE 15 40 32 13 20 35 41 4 EL 4 84 6 6 7 73 8 12 ES 4 68 15 13 6 36 30 28 FR 11 64 22 3 19 40 38 3 IT 6 68 15 11 8 62 17 13 CY 5 61 27 8 12 62 5 22 LU 7 58 27 8 9 31 46 14 NL 9 56 33 3 20 39 38 2 AT 10 54 22 13 3 48 38 10 SI 6 57 18 20 10 74 10 6 FI 12 51 34 3 28 26 43 3 SE 18 52 28 2 21 43 34 2 UK 26 49 20 5 38 29 24 9
EU-25 12 58 21 9 21 40 30 9
Source: Eurostat – EU-SILC Users' Data Base, version 27 June 2007.
There are a number of countries where household circumstances are much the same for children whose parents were born outside the EU and where the parents were born locally. This is the case in Italy and the UK and to a lesser extent in Greece. In these countries, therefore, differences in household circumstances do not seem to be a significant poverty-risk factor.
Children whose parents were born abroad and household work intensity
In 15 of the 17 Member States in which the number of people born outside the EU is large enough for the data to be meaningful — i.e. all except Greece and Luxembourg — the proportion of children living in households in which no-one was working was larger for ‘migrant’ children than for ‘home’ children (Figure 19). Moreover, in all the countries apart from Estonia, the work intensity of the households in which they lived was less, on average, than those in which ‘home’ children lived57.
In 12 of the 17 countries, therefore, the work intensity of the households of ‘migrant’ children was less than one (i.e. signalling that not everyone of working age was in employment throughout the year) for over 60 % of such children — in Belgium, Ireland and Finland, for over 80 % of children. In stark contrast, the majority of ‘home’ children lived in households with a work intensity of one.
The relatively low level of employment among people born outside the EU as compared with those born inside therefore seems to be a significant factor underlying the relatively high risk of poverty among their children.
57 Work intensity is measured as the number of people of working age in employment in a household, weighted by the
relative number of months during the year in which they worked (with a weight of one for those who worked throughout the year and a weight of 0.5 if they worked for 6 months), relative to the total number of working age in the household. No account I s taken of whether someone works part-time or full-time, in the sense that both have a weight of one.
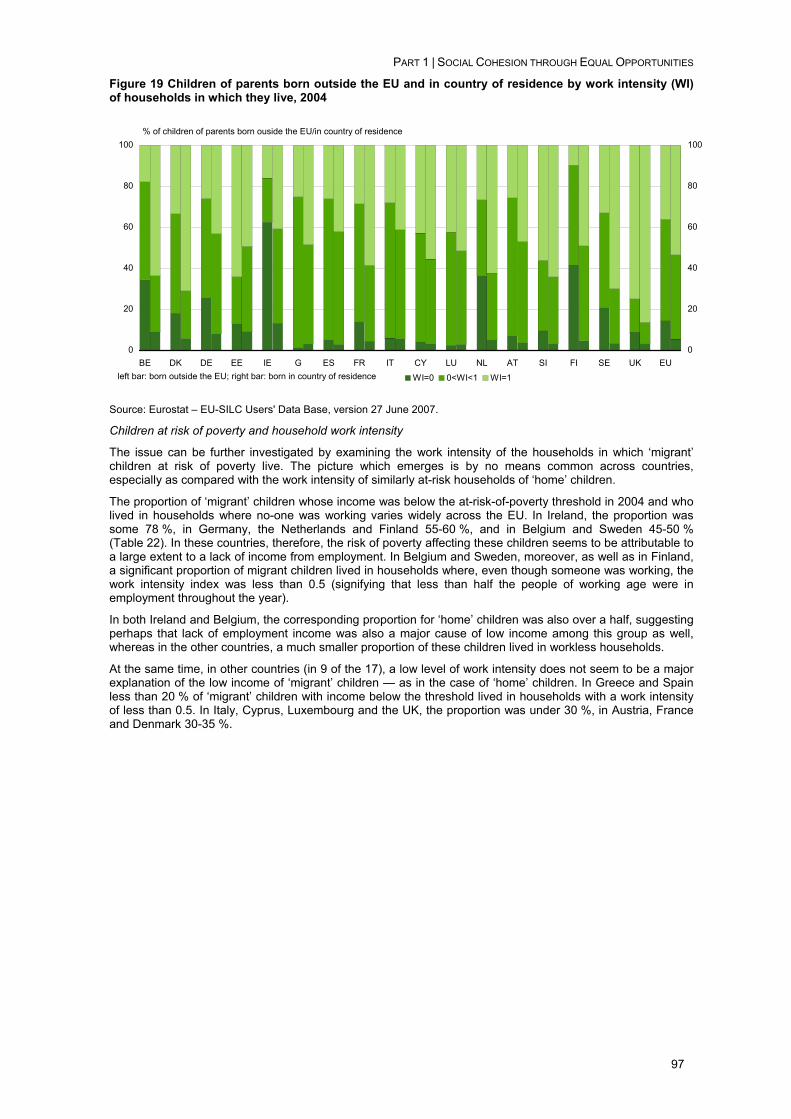
PART 1 | SOCIAL COHESION THROUGH EQUAL OPPORTUNITIES
97
Figure 19 Children of parents born outside the EU and in country of residence by work intensity (WI) of households in which they live, 2004
0
20
40
60
80
100
BE DK DE EE IE G ES FR IT CY LU NL AT SI FI SE UK EU0
20
40
60
80
100
WI=0 0<WI<1 WI=1
% of children of parents born ouside the EU/in country of residence
left bar: born outside the EU; right bar: born in country of residence
Source: Eurostat – EU-SILC Users' Data Base, version 27 June 2007.
Children at risk of poverty and household work intensity
The issue can be further investigated by examining the work intensity of the households in which ‘migrant’ children at risk of poverty live. The picture which emerges is by no means common across countries, especially as compared with the work intensity of similarly at-risk households of ‘home’ children.
The proportion of ‘migrant’ children whose income was below the at-risk-of-poverty threshold in 2004 and who lived in households where no-one was working varies widely across the EU. In Ireland, the proportion was some 78 %, in Germany, the Netherlands and Finland 55-60 %, and in Belgium and Sweden 45-50 % (Table 22). In these countries, therefore, the risk of poverty affecting these children seems to be attributable to a large extent to a lack of income from employment. In Belgium and Sweden, moreover, as well as in Finland, a significant proportion of migrant children lived in households where, even though someone was working, the work intensity index was less than 0.5 (signifying that less than half the people of working age were in employment throughout the year).
In both Ireland and Belgium, the corresponding proportion for ‘home’ children was also over a half, suggesting perhaps that lack of employment income was also a major cause of low income among this group as well, whereas in the other countries, a much smaller proportion of these children lived in workless households.
At the same time, in other countries (in 9 of the 17), a low level of work intensity does not seem to be a major explanation of the low income of ‘migrant’ children — as in the case of ‘home’ children. In Greece and Spain less than 20 % of ‘migrant’ children with income below the threshold lived in households with a work intensity of less than 0.5. In Italy, Cyprus, Luxembourg and the UK, the proportion was under 30 %, in Austria, France and Denmark 30-35 %.
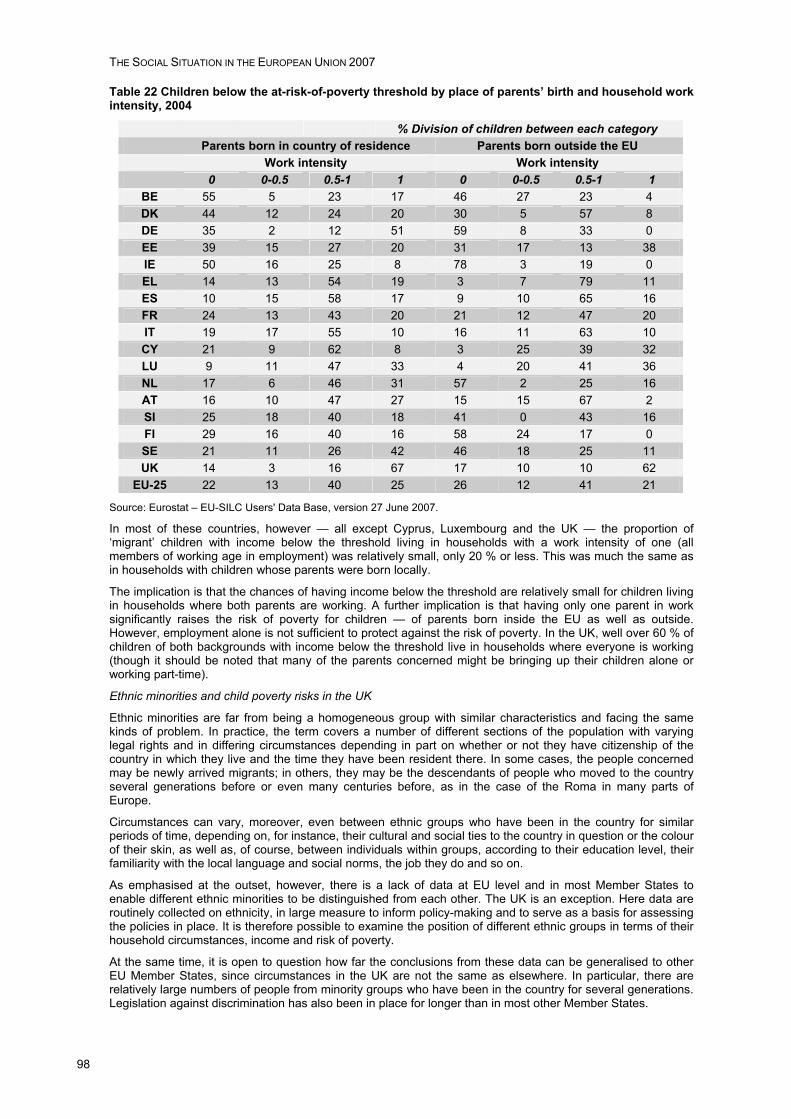
THE SOCIAL SITUATION IN THE EUROPEAN UNION 2007
98
Table 22 Children below the at-risk-of-poverty threshold by place of parents’ birth and household work intensity, 2004
% Division of children between each category Parents born in country of residence Parents born outside the EU Work intensity Work intensity 0 0-0.5 0.5-1 1 0 0-0.5 0.5-1 1
BE 55 5 23 17 46 27 23 4 DK 44 12 24 20 30 5 57 8 DE 35 2 12 51 59 8 33 0 EE 39 15 27 20 31 17 13 38 IE 50 16 25 8 78 3 19 0 EL 14 13 54 19 3 7 79 11 ES 10 15 58 17 9 10 65 16 FR 24 13 43 20 21 12 47 20 IT 19 17 55 10 16 11 63 10 CY 21 9 62 8 3 25 39 32 LU 9 11 47 33 4 20 41 36 NL 17 6 46 31 57 2 25 16 AT 16 10 47 27 15 15 67 2 SI 25 18 40 18 41 0 43 16 FI 29 16 40 16 58 24 17 0 SE 21 11 26 42 46 18 25 11 UK 14 3 16 67 17 10 10 62
EU-25 22 13 40 25 26 12 41 21
Source: Eurostat – EU-SILC Users' Data Base, version 27 June 2007.
In most of these countries, however — all except Cyprus, Luxembourg and the UK — the proportion of ‘migrant’ children with income below the threshold living in households with a work intensity of one (all members of working age in employment) was relatively small, only 20 % or less. This was much the same as in households with children whose parents were born locally.
The implication is that the chances of having income below the threshold are relatively small for children living in households where both parents are working. A further implication is that having only one parent in work significantly raises the risk of poverty for children — of parents born inside the EU as well as outside. However, employment alone is not sufficient to protect against the risk of poverty. In the UK, well over 60 % of children of both backgrounds with income below the threshold live in households where everyone is working (though it should be noted that many of the parents concerned might be bringing up their children alone or working part-time).
Ethnic minorities and child poverty risks in the UK
Ethnic minorities are far from being a homogeneous group with similar characteristics and facing the same kinds of problem. In practice, the term covers a number of different sections of the population with varying legal rights and in differing circumstances depending in part on whether or not they have citizenship of the country in which they live and the time they have been resident there. In some cases, the people concerned may be newly arrived migrants; in others, they may be the descendants of people who moved to the country several generations before or even many centuries before, as in the case of the Roma in many parts of Europe.
Circumstances can vary, moreover, even between ethnic groups who have been in the country for similar periods of time, depending on, for instance, their cultural and social ties to the country in question or the colour of their skin, as well as, of course, between individuals within groups, according to their education level, their familiarity with the local language and social norms, the job they do and so on.
As emphasised at the outset, however, there is a lack of data at EU level and in most Member States to enable different ethnic minorities to be distinguished from each other. The UK is an exception. Here data are routinely collected on ethnicity, in large measure to inform policy-making and to serve as a basis for assessing the policies in place. It is therefore possible to examine the position of different ethnic groups in terms of their household circumstances, income and risk of poverty.
At the same time, it is open to question how far the conclusions from these data can be generalised to other EU Member States, since circumstances in the UK are not the same as elsewhere. In particular, there are relatively large numbers of people from minority groups who have been in the country for several generations. Legislation against discrimination has also been in place for longer than in most other Member States.
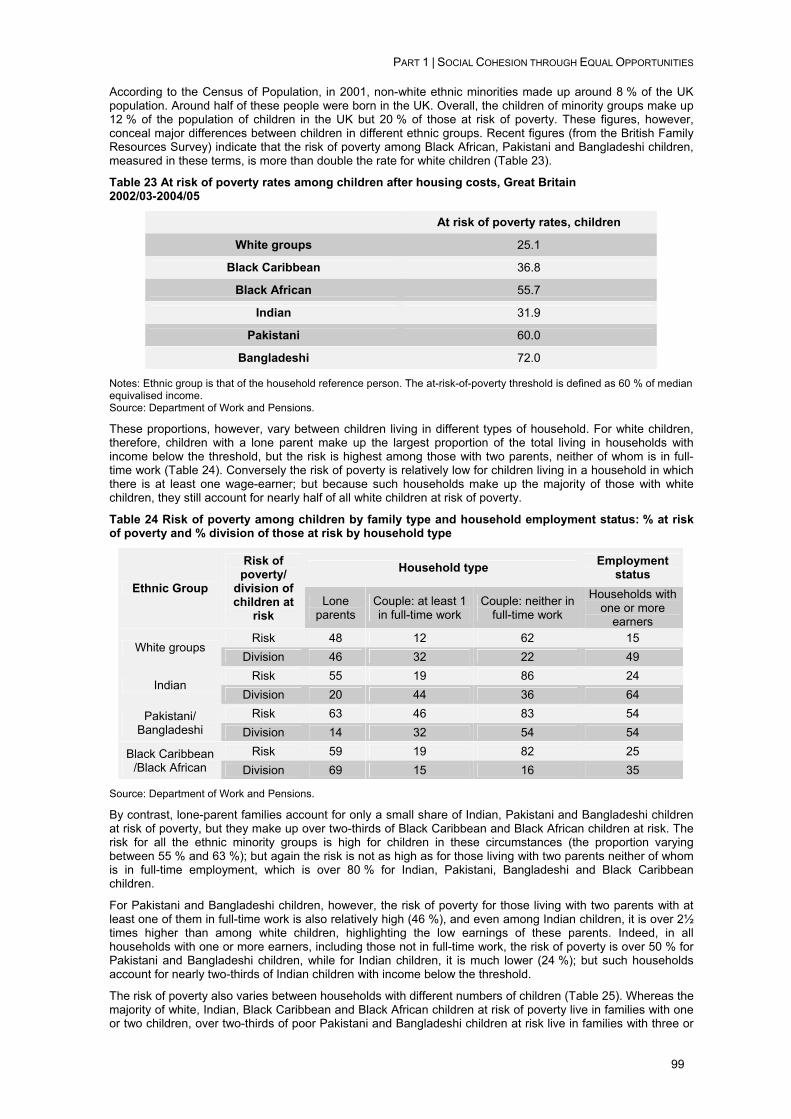
PART 1 | SOCIAL COHESION THROUGH EQUAL OPPORTUNITIES
99
According to the Census of Population, in 2001, non-white ethnic minorities made up around 8 % of the UK population. Around half of these people were born in the UK. Overall, the children of minority groups make up 12 % of the population of children in the UK but 20 % of those at risk of poverty. These figures, however, conceal major differences between children in different ethnic groups. Recent figures (from the British Family Resources Survey) indicate that the risk of poverty among Black African, Pakistani and Bangladeshi children, measured in these terms, is more than double the rate for white children (Table 23).
Table 23 At risk of poverty rates among children after housing costs, Great Britain 2002/03-2004/05
At risk of poverty rates, children White groups 25.1
Black Caribbean 36.8
Black African 55.7
Indian 31.9
Pakistani 60.0
Bangladeshi 72.0
Notes: Ethnic group is that of the household reference person. The at-risk-of-poverty threshold is defined as 60 % of median equivalised income. Source: Department of Work and Pensions.
These proportions, however, vary between children living in different types of household. For white children, therefore, children with a lone parent make up the largest proportion of the total living in households with income below the threshold, but the risk is highest among those with two parents, neither of whom is in full-time work (Table 24). Conversely the risk of poverty is relatively low for children living in a household in which there is at least one wage-earner; but because such households make up the majority of those with white children, they still account for nearly half of all white children at risk of poverty.
Table 24 Risk of poverty among children by family type and household employment status: % at risk of poverty and % division of those at risk by household type
Household type Employment status
Ethnic Group
Risk of poverty/
division of children at
risk Lone
parents Couple: at least 1 in full-time work
Couple: neither in full-time work
Households with one or more
earners Risk 48 12 62 15
White groups Division 46 32 22 49
Risk 55 19 86 24 Indian
Division 20 44 36 64 Risk 63 46 83 54 Pakistani/
Bangladeshi Division 14 32 54 54 Risk 59 19 82 25 Black Caribbean
/Black African Division 69 15 16 35
Source: Department of Work and Pensions.
By contrast, lone-parent families account for only a small share of Indian, Pakistani and Bangladeshi children at risk of poverty, but they make up over two-thirds of Black Caribbean and Black African children at risk. The risk for all the ethnic minority groups is high for children in these circumstances (the proportion varying between 55 % and 63 %); but again the risk is not as high as for those living with two parents neither of whom is in full-time employment, which is over 80 % for Indian, Pakistani, Bangladeshi and Black Caribbean children.
For Pakistani and Bangladeshi children, however, the risk of poverty for those living with two parents with at least one of them in full-time work is also relatively high (46 %), and even among Indian children, it is over 2½ times higher than among white children, highlighting the low earnings of these parents. Indeed, in all households with one or more earners, including those not in full-time work, the risk of poverty is over 50 % for Pakistani and Bangladeshi children, while for Indian children, it is much lower (24 %); but such households account for nearly two-thirds of Indian children with income below the threshold.
The risk of poverty also varies between households with different numbers of children (Table 25). Whereas the majority of white, Indian, Black Caribbean and Black African children at risk of poverty live in families with one or two children, over two-thirds of poor Pakistani and Bangladeshi children at risk live in families with three or
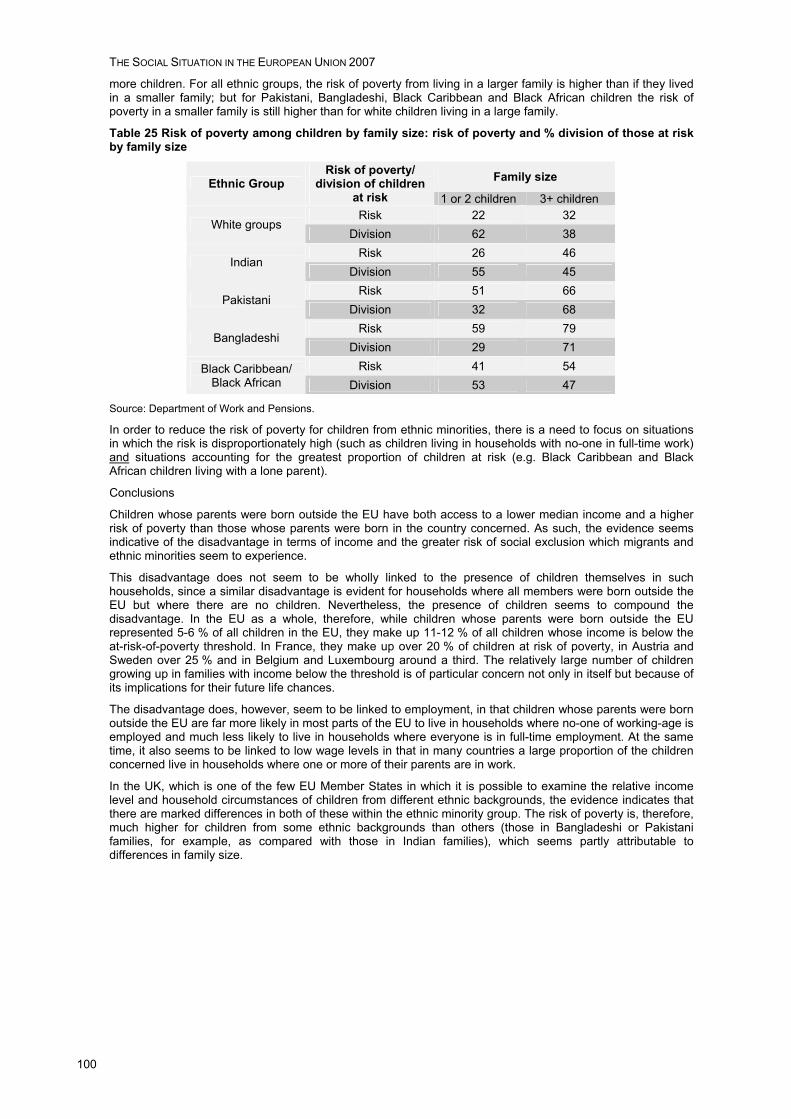
THE SOCIAL SITUATION IN THE EUROPEAN UNION 2007
100
more children. For all ethnic groups, the risk of poverty from living in a larger family is higher than if they lived in a smaller family; but for Pakistani, Bangladeshi, Black Caribbean and Black African children the risk of poverty in a smaller family is still higher than for white children living in a large family.
Table 25 Risk of poverty among children by family size: risk of poverty and % division of those at risk by family size
Family size Ethnic Group Risk of poverty/
division of children at risk 1 or 2 children 3+ children Risk 22 32
White groups Division 62 38
Risk 26 46 Indian
Division 55 45 Risk 51 66
Pakistani Division 32 68
Risk 59 79 Bangladeshi
Division 29 71 Risk 41 54 Black Caribbean/
Black African Division 53 47
Source: Department of Work and Pensions.
In order to reduce the risk of poverty for children from ethnic minorities, there is a need to focus on situations in which the risk is disproportionately high (such as children living in households with no-one in full-time work) and situations accounting for the greatest proportion of children at risk (e.g. Black Caribbean and Black African children living with a lone parent).
Conclusions
Children whose parents were born outside the EU have both access to a lower median income and a higher risk of poverty than those whose parents were born in the country concerned. As such, the evidence seems indicative of the disadvantage in terms of income and the greater risk of social exclusion which migrants and ethnic minorities seem to experience.
This disadvantage does not seem to be wholly linked to the presence of children themselves in such households, since a similar disadvantage is evident for households where all members were born outside the EU but where there are no children. Nevertheless, the presence of children seems to compound the disadvantage. In the EU as a whole, therefore, while children whose parents were born outside the EU represented 5-6 % of all children in the EU, they make up 11-12 % of all children whose income is below the at-risk-of-poverty threshold. In France, they make up over 20 % of children at risk of poverty, in Austria and Sweden over 25 % and in Belgium and Luxembourg around a third. The relatively large number of children growing up in families with income below the threshold is of particular concern not only in itself but because of its implications for their future life chances.
The disadvantage does, however, seem to be linked to employment, in that children whose parents were born outside the EU are far more likely in most parts of the EU to live in households where no-one of working-age is employed and much less likely to live in households where everyone is in full-time employment. At the same time, it also seems to be linked to low wage levels in that in many countries a large proportion of the children concerned live in households where one or more of their parents are in work.
In the UK, which is one of the few EU Member States in which it is possible to examine the relative income level and household circumstances of children from different ethnic backgrounds, the evidence indicates that there are marked differences in both of these within the ethnic minority group. The risk of poverty is, therefore, much higher for children from some ethnic backgrounds than others (those in Bangladeshi or Pakistani families, for example, as compared with those in Indian families), which seems partly attributable to differences in family size.
PART 1 | SOCIAL COHESION THROUGH EQUAL OPPORTUNITIES
101
Box 6 — Educational performance of students from a migration background
Schools have a central role in addressing the challenges posed by migration flows, given the close correlation between education and a successful working life. The recently published OECD report58 explores performance and school achievement of students with a migration family background. The report relies on the results of the OECD Programme for International Student Assessment (PISA) 2003, an internationally standardised assessment of performances in reading and mathematics administered on the part of 15-year-olds in schools.
Only in 14 OECD countries (8 European Union Member States)59 was the immigrant population big enough to be considered significant (>3 % of 15-year-olds). In these countries, foreign-born students show a marked deficit in comparison with native students: 48 points on the PISA mathematics scale, i.e. more than one average school year’s progress60. The gap is reduced to 30 points when socio-economic factors such as the occupation and education of parents are taken into account. The performance deficit of immigrant students varies widely across countries: from almost insignificant in Australia, Canada and New Zealand to more than 90 PISA points in Belgium and Germany, even for second-generation immigrant children.
The performance gap remains high (40 points) also for second-generation students. However, normally they perform better than first-generation students as they do not face the same linguistic and cultural problems. Here again there are major variations: in Canada, Luxembourg, Sweden and Switzerland second-generation students perform significantly better than first-generation ones, while in Germany and New Zealand it is the other way round. The immigration background also partly explains the performance variation between schools. Immigrant students tend de facto to be more or less directed towards schools with lower performance expectations. In general they are clustered in the same schools, which often present a more disadvantaged socio-economic student background and, in some countries, poorer learning conditions. However, the distribution of immigrant students across schools does not seem to account for international variations in performance gaps between immigrant and native students, even if high proportions of immigrant students in schools may impact on the performance levels. Literature on the latter point however presents mixed evidence61.
Interestingly enough, data show no negative relationship between the size of immigrant populations and overall performance. Countries with a large immigrant population in many cases also have good overall performances, which contradicts the idea that a large share of immigrants in the population could be an obstacle to integration. Another interesting result of the OECD analysis is that, despite lower performance and a generally worse socio-economic background, immigrant students are very motivated learners with a positive attitude to school. The indication, in all countries assessed, is of higher levels of interest and motivation in mathematics and a more positive attitude to school in general than among native and second-generation peers. They claim they expect to complete a university course more often than native students. Finally, they report belief in their own ability in mathematics but then show higher levels of anxiety when performing specific tasks.
58 Education at glance, OECD 2007. 59 They are: Australia, Austria, Belgium (with separate data for the Flemish and French Communities), Canada, Denmark,
France, Germany, Luxembourg, the Netherlands, New Zealand, Norway, Sweden, Switzerland, United States. Overall, 41 countries participated in the PISA 2003 assessment.
60 For the 26 OECD countries in which a sizeable number of 15-year-olds in the PISA samples were enrolled in at least two different grades, the difference between students in the two grades implies that one school year corresponds to an average of 41 score points on the PISA mathematics scale (for details on the methodology see OECD, The PISA 2003 Assessment Framework — Mathematics, Reading, Science and Problem Solving Knowledge and Skills, Paris, 2003).
61 Where immigrant students succeed — A comparative review of performance and engagement in PISA 2003, OECD 2006
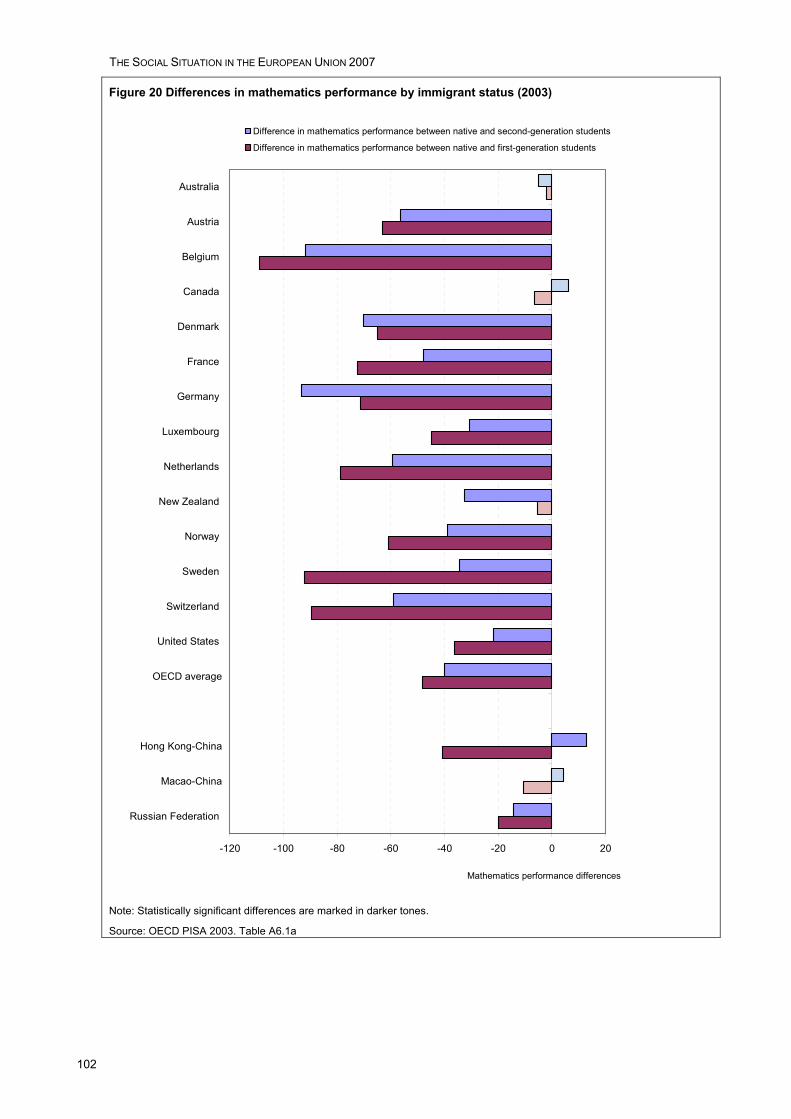
THE SOCIAL SITUATION IN THE EUROPEAN UNION 2007
102
Figure 20 Differences in mathematics performance by immigrant status (2003)
-120 -100 -80 -60 -40 -20 0 20
Australia
Austria
Belgium
Canada
Denmark
France
Germany
Luxembourg
Netherlands
New Zealand
Norway
Sweden
Switzerland
United States
OECD average
Hong Kong-China
Macao-China
Russian Federation
Mathematics performance differences
Difference in mathematics performance between native and second-generation students
Difference in mathematics performance between native and first-generation students
Note: Statistically significant differences are marked in darker tones.
Source: OECD PISA 2003. Table A6.1a
103
PART 2 — AREAS OF SOCIAL POLICY CONCERN: STATISTICAL PORTRAITS
The structure of the Part Two: Part Two presents a series of statistical portraits that address a range of social policy concerns for the European Union. Virtually all the main European social policy domains are covered: population; education and training; labour market; social protection; income, social inclusion and living conditions; gender equality and health and safety. The annexes present additional tables and explain terminology.
The Structure of the statistical portraits: Each statistical portrait is presented in the form of tables, charts and commentary. Gender issues are covered not only by the two portraits in the domain 'Gender equality' but also by other portraits and the statistical annexes where a number of indicators are disaggregated by sex.
Key indicators: Each portrait is built around one or two selected key indicators (see table in the next page). The first two portraits provide contextual information, one on the economic situation, the other on demography, households and families. Both of them have a context key indicator whereas the social portraits 3-18 have social key indicators. Together, this set of key indicators provides not only a snapshot of today's social situation and its background, but also an instrument for monitoring and comparing progress in the social field among the twenty-seven Member States and the three Candidate Countries.
Criteria in selecting the key indicators: The following criteria have been applied as much as possible in selecting the key indicators:
1. Each indicator should be:
(a) policy relevant at EU level;
(b) comparable across the twenty-seven Member States;
(c) available using Eurostat harmonised sources;
(d) measurable over time and;
(e) easily understood.
2. The set of indicators should be relatively stable over time to ensure continuity. However, a degree of flexibility is required to take account of changing policy needs and improvements in data availability.
The Structural Indicators: Sixteen of the chosen twenty-six key indicators are among the Structural Indicators, which are used in order to monitor the progress towards the agreed targets based on the Lisbon Strategy focusing on growth and jobs (More about the Lisbon Strategy can be found in the web address: http://europa.eu.int/growthandjobs/index_en.htm).
Annexes: A summary of the key indicators with the most recent data for each geopolitical entity, i.e. a country or a group of countries (EU-27, EU-25 and EA-13), can be found in Annex 1.1. Annex 1.2 consists of key indicator tables with time series for each geopolitical entity (mainly around the latest 10 available years). Detailed other statistical data covering the whole report can be found in Annex 1.3. Symbols, country codes, country groupings, other abbreviations and acronyms are explained in Annex 2.
Data used: The portraits in Section 2 and annexes 1.1, 1.2, and 1.3 are based mainly on data that were available in the end of September 2007. In some parts it has been possible to use data that became available later. An effort has been made to use the most recent data available and to present coherent data. However, since this publication is a result of contributions of tens of specialists, inconsistencies of data may have remained within it.
Sources of additional data: Additional or more recent data can be found in the Eurostat website http://europa.eu.int/comm/eurostat/, where one also can download free pdf files of Eurostat publications. Printed versions of Eurostat publications are sold by the worldwide network of sales agents of the Publications Office (Office for Official Publications of the European Communities, which is the publishing house of the institutions and other bodies of the European Union). The priced publications are available from EU Bookshop website http://bookshop.europa.eu, where you can place an order with the sales agent of your choice. A list of these sales agents' contact details can be found in the website http://publications.europa.eu/others/agents/index_en.htm or you can ask a paper copy by sending a fax to +352 2929-42758.

THE SOCIAL SITUATION IN THE EUROPEAN UNION 2007
104
Domain Statistical Portrait Selected key indicator(s)
Structural Indicators are written in italics (see the previous page)
Economy 1 Economic situation Real GDP growth rate
2 Demography, households and families
Total population
3 Ageing of the population Old age dependency ratio
Population
4 International migration and asylum
Crude rate of net migration including adjustments and corrections
5 Education and its outcomes Youth education attainment level Education and training
6 Lifelong learning Lifelong learning
7 Employment Employment rate and
Employment rate of older workers
8 Unemployment Unemployment rate and
Long-term unemployment rate
Labour market
(see also the portrait nr. 16)
9 Labour Market Policy expenditure
Public expenditure on LMP measures (categories 2-7) as a percentage of GDP
10 Social protection expenditure and receipts
Expenditure on social protection as a percentage of GDP
Social protection
11 Social benefits Old age and survivors benefits as a percentage of total social benefits
and
Sickness and health care benefits as a percentage of total social benefits
12 Income distribution Inequality of income distribution
13 Low-income households At-risk-of-poverty rate before social transfers
At-risk-of-poverty rate after social transfers
Income, social inclusion and living conditions
14 Jobless households and low wages
People aged 18-59 living in jobless households
Children aged 0-17 living in jobless households
15 Women and men in decision making
Percentage of women in the lower or single House of the national or federal Parliament
and
Percentage of women in the European Parliament
Gender equality
16 Earnings of women and men Gender pay gap in unadjusted form
17 Life and health expectancies Life expectancy at birth and
Healthy Life Years at birth
Health and safety
18 Accidents and work-related health problems
Serious accidents at work and
Fatal accidents at work
PART 2 | AREAS OF SOCIAL POLICY CONCERN: STATISTICAL PORTRAITS
105
1. ECONOMIC SITUATION Economic growth in 2006 in the EU-27 reached 3.0% after the moderate growth of 1.8% in 2005. In general, the new Member States and Candidate Countries outgrow the EU-15 Member States. Between 2005 and 2006 government debt fell as a percentage of GDP in both the euro area and the EU-27, to 69.0% and 61.7% respectively at end-2006.
Economic growth moderate in 2005 but gathered speed in 2006
In 2006, the European Union’s (EU-27) gross domestic product rose by 3.0%, improving considerably the moderate growth rate observed in 2005 (+1.8%). Different growth patterns can be identified when looking at the performance of individual Member States in 2006. A first group is composed mainly by the biggest Member States that registered GDP growth lower than the EU-27 average or grew with the EU-27 average rate: Portugal (1.3%), Italy (1.9%), France (2.0%), the United Kingdom (2.8%), Germany (2.9%) and the Netherlands (3.0%). A second group comprises Member States that attained robust growth rates: Belgium (3.2%), Malta (3.2%), Denmark (3.5%), Cyprus (3.8%), Hungary (3.9%), Spain (3.9%), Sweden (4.2%) and Greece (4.3%). A third group is formed by Member States that experienced high growth rates: Finland (5.5%), Ireland (5.7%), Slovenia (5.7%), Bulgaria (6.1%), Poland (6.1%), Luxembourg (6.2%), the Czech Republic (6.4%), Lithuania (7.5%), Romania (7.7%), Slovakia (8.3%), Estonia (11.2%) and Latvia (11.9%).
Preliminary results for 2007 indicate that EU-27 GDP grew by 3.4% in the first quarter of 2007 and by 2.5% in the second quarter (growth rates compared to the same quarter of the previous year). For the euro area (EA-13) the corresponding results were 3.0% and 2.5%, respectively. For the whole of the year 2007, GDP is projected to expand at rates of 2.9% for EU-27 and 2.6% for the euro area.
GDP per head varies widely between Member States, but the gap tends to decrease
In 2006, GDP per capita in the EU-27 amounted to 23 500 Euro, some 12% below the 26 600 Euro per capita for the euro area. The highest figures occurred in Luxembourg (71 500 Euro), Ireland (41 100) and Denmark (40 500 Euro), the lowest in Bulgaria (3 300 Euro), Romania (4 500 Euro) and Poland (7 100 Euro).
To make comparisons among Member States more meaningful, GDP per capita can be expressed in Purchasing Power Standards (PPS), thus eliminating the effect of different price levels. PPS are constructed in a way that renders one PPS equal to one Euro for the EU-27. GDP per head in the EU-27 thus is 23 500 PPS, while for the euro area, the figure of 25 800 PPS, although still ahead of the EU-27 figure, is somewhat lower than the respective value expressed in Euro, indicating that the purchasing power of one Euro is slightly lower in the euro area than in the European Union as a whole. For easier comparison, GDP per head in PPS is given relative to the EU-27 average. This figure for Luxembourg is a remarkable 178% above the EU-27 average. The second highest figure is that of Ireland, still 44% above the average. Denmark, Austria and the Netherlands all are around 30% above the average. The biggest differences for figures below the EU-27 average are in Bulgaria, Romania, Poland, Lithuania and Latvia which have values between 37% and 58% of the average. However, their values in Euro are only about 14% to 30% of the average. Obviously, lower price levels tend to partly compensate for the lower GDP per head. Compared to the situation in 1995, it can be seen that the positions at the extremes remain more or less unchanged, but almost all countries with relative values below 100 have moved somewhat closer to the EU-27 average. The most obvious changes were for Estonia, which passed from roughly on third of the average in 1995 to two thirds in 2006, and for Ireland, which recorded a figure for per capita GDP that was only slightly higher than the EU-27 average in 1995, while in 2006 it was 38% above, placing Ireland second among all Member States.
Turning to Candidate Countries, GDP per head in PPS in Macedonia and Turkey is about one quarter lower than the lowest value observed among Member States, at around 30% of the EU-27 value. Croatia, at 50% of the average, has a significantly higher GDP per head.
Moderate inflation
In July 2007, the annual inflation rate was 2.0% in the EU-27, down from 2.2% in June 2007. For the euro area a slightly lower annual inflation rate of 1.8% has been observed in July 2007, down from 1.9% in June 2007. A year earlier, slightly higher rates had been observed for the EU-27 (2.5%) and the euro area (2.4%). Among the Member States, the highest annual rates in July 2007 were observed in Latvia (9.5%), Hungary (8.3%) and Bulgaria (6.8%); while the lowest rates were observed in Malta (-0.2%), Denmark (1.1%), France and Slovakia (1.2% each). Compared with July 2006, annual inflation fell in seventeen of the Member States and rose in 9 countries, remaining at the same level in one of them. The highest increases were registered in Hungary (from 3.2% to 8.3%), Latvia (from 6.9% to 9.5%) and Slovenia (from 1.9% to 4.0%). The biggest falls were those in Malta (from 3.6% to -0.2%), Slovakia (from 5.0% to 1.2%) and Romania (from 6.2% to 4.1%). During the first part of 2007 the annual rate of euro area inflation was below the 2.0% medium-term stability threshold defined by the ECB. The 12-month average rate of change in consumer prices, which is less sensitive to transient effects, stood at 2.1% for the EU and 1.9% for the euro area in July 2007.
Interest rates increased from a low level
Long-term interest rates in the euro area increased during the first six months of 2007 up to 4.64%, now no longer close to their historical lows of 3.14% in September 2005. In August 2007 the aggregate interest rate for the euro area, as measured by 10-year government bond yields, stood at 4.42% (monthly average), compared with an annual average of 3.84% in 2006 and 3.42% in 2005. The most distinguishing feature still is
THE SOCIAL SITUATION IN THE EUROPEAN UNION 2007
106
the high degree of convergence achieved. Up to the start of 1999, when the third phase of monetary union began, the yield differentials on 10-year bonds among euro area members narrowed sharply and almost disappeared. Since then, yields have been at broadly similar levels throughout the euro area. In August 2007 the differential between Germany (the euro area member which usually has the lowest interest rates) and Slovenia (which has the highest rates) was a mere 40 basis points.
For the other EU Member States not participating in the single currency interest rates have been slightly higher in 2006, except for Denmark and Sweden. Regarding the interest rate differential with respect to the euro area, no clear tendency can be observed.
Public deficit and debt decrease as percentage of GDP
Public deficit is defined in the Maastricht Treaty as general government net borrowing according to the European system of accounts. In 2006, the government deficit of the euro area and the EU-27 improved compared to 2005. In the euro area, the government deficit decreased from 2.5% of GDP in 2005 to 1.5% in 2006, and in the EU-27 it fell from 2.4% in 2005 to 1.6% in 2006. In 2006 the largest government deficits in percentage of GDP were recorded by Hungary (-9.2%), Italy (-4.4%), Portugal (-3.9%), Poland (-3.8%) and Slovakia (-3.7%). Ten Member States registered a government surplus in 2006, with the largest surpluses in Denmark (+4.6%), Finland (+3.8%) and Estonia (+3.6%). In all, twenty-one Member States recorded an improved public balance relative to GDP, while five Member States registered a worsening and one remained unchanged.
Regarding Candidate Countries, Croatia registered a deficit of 2.2% of GDP in 2006 (an improvement on the 3.8% deficit in 2005). Turkey recorded a surplus (+0.4%) in 2006, compared with a deficit of 0.3% in 2005.
Public debt is defined in the Maastricht Treaty as consolidated general government gross debt at nominal value, outstanding at the end of the year. Between 2005 and 2006 government debt fell as a percentage of GDP in both the euro area and the EU-27, to 68.6% and 61.4% respectively at end-2006. The lowest ratios of government debt to GDP at end-2006 were recorded in Estonia (4.0%), Luxembourg (6.6%), Latvia (10.6%) and Romania (12.4%). Ten Member States had a government debt ratio higher than 60% of GDP in 2006 — Italy (106.8%), Greece (95.3%), Belgium (88.2%), Germany (67.5%), Malta (64.7%), Hungary (65.6%), Cyprus (65.2%), Portugal (64.8%), France (64.2%), and Austria (61.7%).
Croatia and Turkey have reduced their relative government debt levels during recent years, at 40.8% and 60.7% respectively at end-2006.
Policy Context
In March 2005, the European Council re-launched the Lisbon Strategy for Growth and Jobs by focusing on jobs and growth in Europe and invited the Commission to present a programme setting out the necessary actions at Community level to help delivering the Lisbon Agenda. The European Council reaffirmed that the renewed Lisbon strategy should be seen in the wider context of sustainable development. On 20th July 2005, the Commission presented the Community Lisbon Programme (CLP) which aims at contributing to the overall economic and employment policy agenda by implementing Community policies that support and complement national policies. However, the CLP is not only the Commission’s responsibility. The Council and the European Parliament are responsible for ensuring that the legislative actions outlined in the CLP are adopted.
The re-launch entailed a new governance architecture for the European economic reform process clarifying the responsibility for implementing individual actions of the revised Strategy between the national (Member States) or the Community level. While Member States have outlined their economic reform efforts at the national level in national reform programmes (NRPs), the Community Lisbon Programme covers policy actions at Community-level.
In 'A year of delivery' The European Commission's 2006 Annual Progress Report on Growth and Jobs, the Commission has looked at the progress made in National Reform Programmes and is proposing some country-specific recommendations to guide Member States.
The policy actions contained in the CLP cover areas where purely national action is insufficient because important cross-border externalities or economies of scale are concerned (e.g. investment in R&D). The actions are undertaken because of their important potential to contribute to growth and jobs in the three key areas: 1) Making Europe a more attractive place to invest and work; 2) Knowledge and Innovation; 3) More and better Jobs.
The EU’s medium-term economic policy strategy focuses on the contribution that economic policies can make to achieve the strategic Lisbon goal. This economic policy is laid down in the Broad Economic Policy Guidelines (BEPGs), which make both general and country-specific recommendations.
On 12 April 2005, the European Commission adopted the Integrated Guidelines 2005 – 2008, thus bringing together for the first time the Broad Economic Policy Guidelines (BEPGs) and the Employment Guidelines in one single document. The integrated policy guidelines underline the link between the Lisbon programme and sustainable development. They highlight that long-term growth depends on addressing a range of resource and environmental challenges which, if left unchecked, will act as a brake on future growth. The guidelines lay out a comprehensive strategy of macroeconomic, microeconomic and employment policies to redress Europe’s weak growth performance and insufficient job creation. This integration of guidelines follows the
PART 2 | AREAS OF SOCIAL POLICY CONCERN: STATISTICAL PORTRAITS
107
move from annual to multi-annual BEPGs in 2003. The 2003-05 BEPGs had been subject to two implementation reports whose findings fed into the Integrated Guidelines.
In order to participate in the euro area, Member States must fulfil legal convergence and the convergence criteria on price stability, government budgetary position, exchange rate and interest rate. At least once every two years, or at the request of a Member State with a derogation, the Commission and the European Central Bank (ECB) shall report to the Council on the progress made in the fulfilment by the Member States of their obligations regarding the achievement of economic and monetary union. Among those Member States not participating in the euro area, Denmark and the United Kingdom, negotiated opt-out clauses before the adoption of the Maastricht Treaty, and are not subject to regular convergence reports.
A specific convergence report, drawn up by the Commission in May 2006 in response to a request by Slovenia and Lithuania, concluded that Slovenia met all the conditions and could adopt the euro on 1 January 2007, while Lithuania retained its present status. The Council endorsed the Commission’s assessments in July 2006.
The 'regular' Convergence Report was adopted by the European Commission on 5. December 2006. Progress with convergence towards the requirements of EMU is assessed in the Czech Republic, Estonia, Cyprus, Latvia, Hungary, Malta, Poland, Slovakia and Sweden. The report examines whether the Member States without an opt-out meet the convergence criteria on price stability, the government budgetary position, exchange rates and interest rates and whether they ensure compatibility of their legislation with that required for euro membership. The report indicates that none of the countries examined fulfils all conditions for adopting the euro at this stage. In this light, the Commission concludes that there should be no change in the status of the nine countries assessed as a 'Member State with derogation'.
The European Commission adopted in May 2007 in response to a request by Cyprus and Malta specific convergence reports on these countries with a clear verdict: both countries meet the necessary economic and legal conditions for joining the euro area and could adopt the euro on 1 January 2008. The Council endorsed the Commission’s assessments in June 2007.
For the Candidate Countries the so-called Pre-Accession Fiscal Surveillance Procedure has been established, aiming at preparing countries for the participation in the multilateral surveillance and economic policy co-ordination procedures currently in place in the EU as part of the Economic and Monetary Union. The Pre-Accession Economic Programmes (PEPs) are part of this procedure.
Methodological Notes
National Accounts figures are compiled according to the European System of National and Regional Accounts in the Community (ESA95). ESA95 is the subject of Council regulation No 2223/96 of June 25, 1996.
Recent important methodological improvements to national accounts include the allocation of FISIM (Financial Intermediation Services Indirectly Measured) to user sectors/industries, and the introduction of chained volume measures to replace fixed-base volume measures. Most Member States have fully implemented the new methods by now. However, some outstanding implementations still impact on the comparability of data and on the availability of time series.
Gross domestic product indicates the size of a country’s economy in absolute terms, while GDP in relation to the population (GDP per capita) provides an indication comparable between economies of different size. To make international comparisons easier, some data are expressed in purchasing power standards (PPS). The advantage of using PPS is that they eliminate distortions arising from the different price levels in the EU countries: they don't use exchange rates as conversion factors, but rather purchasing power parities calculated as a weighted average of the price ratios of a basket of goods and services that are homogeneous, comparable and representative in each Member State.
Consumer price inflation is best compared at international level by the ‘harmonised indices of consumer prices’ (HICPs). They are calculated in each Member State of the European Union, Iceland and Norway. The EICP (European Index of Consumer Prices) as defined in Council Regulation (EC) No 2494/95 of 23 October 1995 is the official EU aggregate. It covers 15 Member States until April 2004, 25 Member States starting from May 2004 until December 2006 and 27 Member States starting from January 2007. The 10 new Member States are integrated into the EICP starting from May 2004 using a chain index formula. This means, for example, that the annual rate of change in October 2004 is the change from October 2003 to April 2004 of the 15 old Member States combined with the change from April 2004 to October 2004 of the 25 Member States. The 2 new Member States – Bulgaria and Romania — are integrated into the EICP from January 2007 using a chain index formula. HICPs are used by the European Central Bank (ECB) for monitoring inflation in the economic and monetary union and the assessment of inflation convergence. As required by the Treaty, the maintenance of price stability is the primary objective of the ECB which defined price stability ‘as a year-on-year increase in the harmonised index of consumer prices for the euro area of below 2%, to be maintained over the medium term’. A more stable measure of inflation is given by the 12-month average change that is the average index for the latest 12 months compared with the average index for the previous 12 months. It is less sensitive to transient changes in prices but it requires a longer time series of indices.
Government bond yields are a good indicator of long-term interest rates, since the government securities market normally attracts a large part of available capital. They also provide a fairly good reflection of a country’s financial situation and of expectations in terms of economic policy. The significance of government
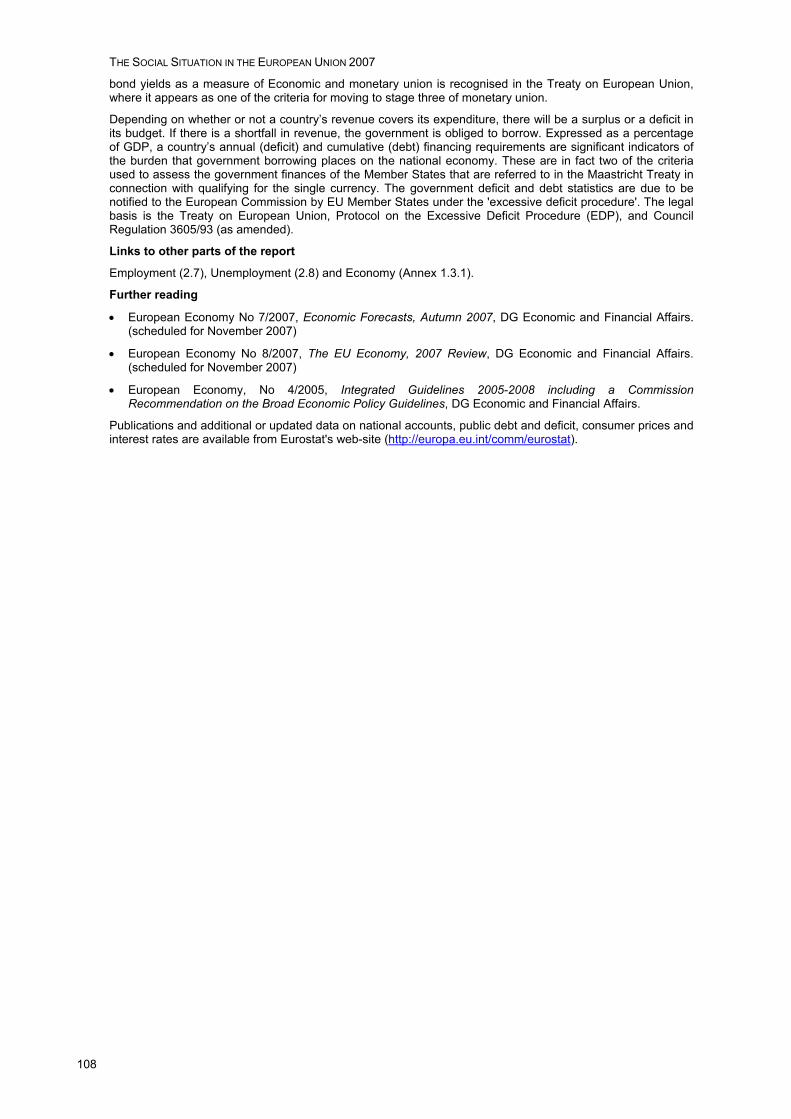
THE SOCIAL SITUATION IN THE EUROPEAN UNION 2007
108
bond yields as a measure of Economic and monetary union is recognised in the Treaty on European Union, where it appears as one of the criteria for moving to stage three of monetary union.
Depending on whether or not a country’s revenue covers its expenditure, there will be a surplus or a deficit in its budget. If there is a shortfall in revenue, the government is obliged to borrow. Expressed as a percentage of GDP, a country’s annual (deficit) and cumulative (debt) financing requirements are significant indicators of the burden that government borrowing places on the national economy. These are in fact two of the criteria used to assess the government finances of the Member States that are referred to in the Maastricht Treaty in connection with qualifying for the single currency. The government deficit and debt statistics are due to be notified to the European Commission by EU Member States under the 'excessive deficit procedure'. The legal basis is the Treaty on European Union, Protocol on the Excessive Deficit Procedure (EDP), and Council Regulation 3605/93 (as amended).
Links to other parts of the report
Employment (2.7), Unemployment (2.8) and Economy (Annex 1.3.1).
Further reading
• European Economy No 7/2007, Economic Forecasts, Autumn 2007, DG Economic and Financial Affairs. (scheduled for November 2007)
• European Economy No 8/2007, The EU Economy, 2007 Review, DG Economic and Financial Affairs. (scheduled for November 2007)
• European Economy, No 4/2005, Integrated Guidelines 2005-2008 including a Commission Recommendation on the Broad Economic Policy Guidelines, DG Economic and Financial Affairs.
Publications and additional or updated data on national accounts, public debt and deficit, consumer prices and interest rates are available from Eurostat's web-site (http://europa.eu.int/comm/eurostat).
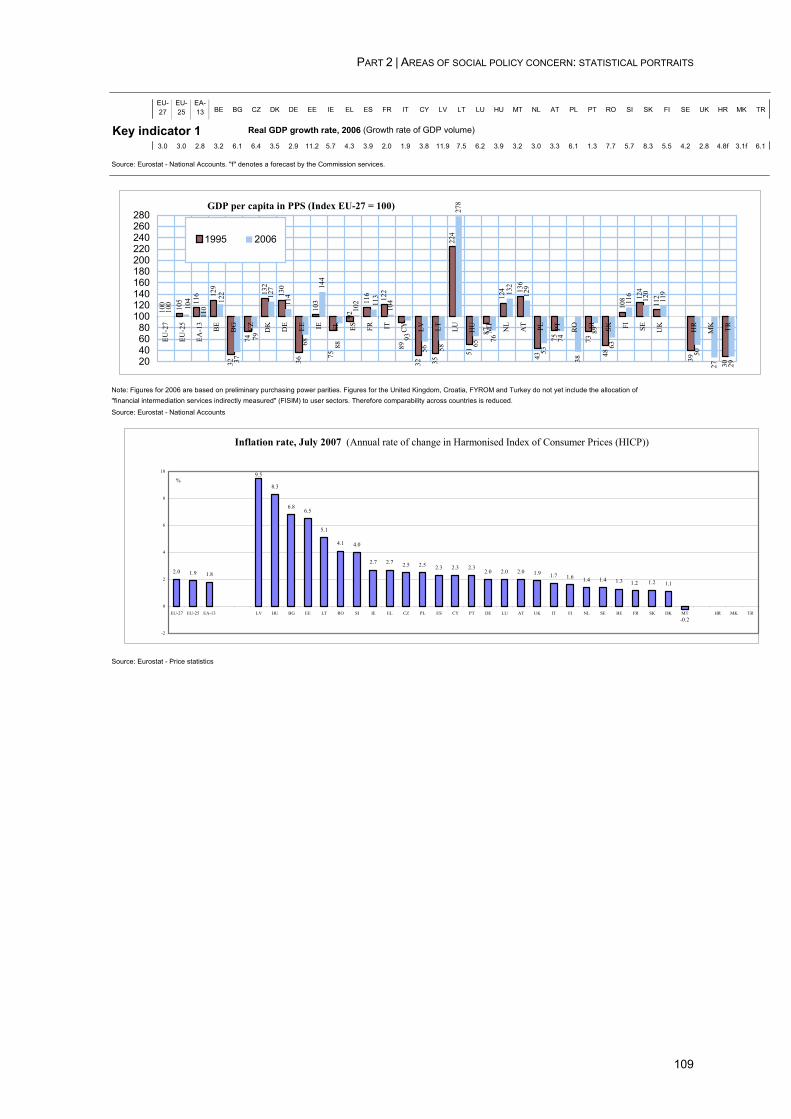
PART 2 | AREAS OF SOCIAL POLICY CONCERN: STATISTICAL PORTRAITS
109
EU-27
EU-25
EA-13 BE BG CZ DK DE EE IE EL ES FR IT CY LV LT LU HU MT NL AT PL PT RO SI SK FI SE UK HR MK TR
Key indicator 13.0 3.0 2.8 3.2 6.1 6.4 3.5 2.9 11.2 5.7 4.3 3.9 2.0 1.9 3.8 11.9 7.5 6.2 3.9 3.2 3.0 3.3 6.1 1.3 7.7 5.7 8.3 5.5 4.2 2.8 4.8f 3.1f 6.1
Source: Eurostat - National Accounts. "f" denotes a forecast by the Commission services.
Note: Figures for 2006 are based on preliminary purchasing power parities. Figures for the United Kingdom, Croatia, FYROM and Turkey do not yet include the allocation of"financial intermediation services indirectly measured" (FISIM) to user sectors. Therefore comparability across countries is reduced.
Source: Eurostat - National Accounts
Source: Eurostat - Price statistics
Real GDP growth rate, 2006 (Growth rate of GDP volume)
Inflation rate, July 2007 (Annual rate of change in Harmonised Index of Consumer Prices (HICP))
2.0 1.9 1.8
8.3
6.86.5
5.1
4.1 4.0
2.7 2.7 2.5 2.5 2.3 2.3 2.32.0 2.0 2.0 1.9 1.7 1.6 1.4 1.4 1.3 1.2 1.1
9.5
1.2
-0.2
-2
0
2
4
6
8
10
EU-27 EU-25 EA-13 LV HU BG EE LT RO SI IE EL CZ PL ES CY PT DE LU AT UK IT FI NL SE BE FR SK DK MT HR MK TR
%
GDP per capita in PPS (Index EU-27 = 100)
100 105 11
6 129
32
74
132
130
36
103 11
6 122
32 35
224
51
87
136
43
75 73
48
108 12
4
112
39
30
100
37
127
114
68
144
102
104
56 58
278
65
132
129
53
74
38
89
63
116
120
119
50
27 29
92
75
124
8993
122
88
76
113
79
104
110
20406080
100120140160180200220240260280
EU-2
7
EU-2
5
EA-1
3
BE BG CZ
DK DE EE IE EL ES FR IT CY LV LT LU HU
MT
NL
AT PL PT RO SI SK FI SE UK
HR
MK TR
1995 2006
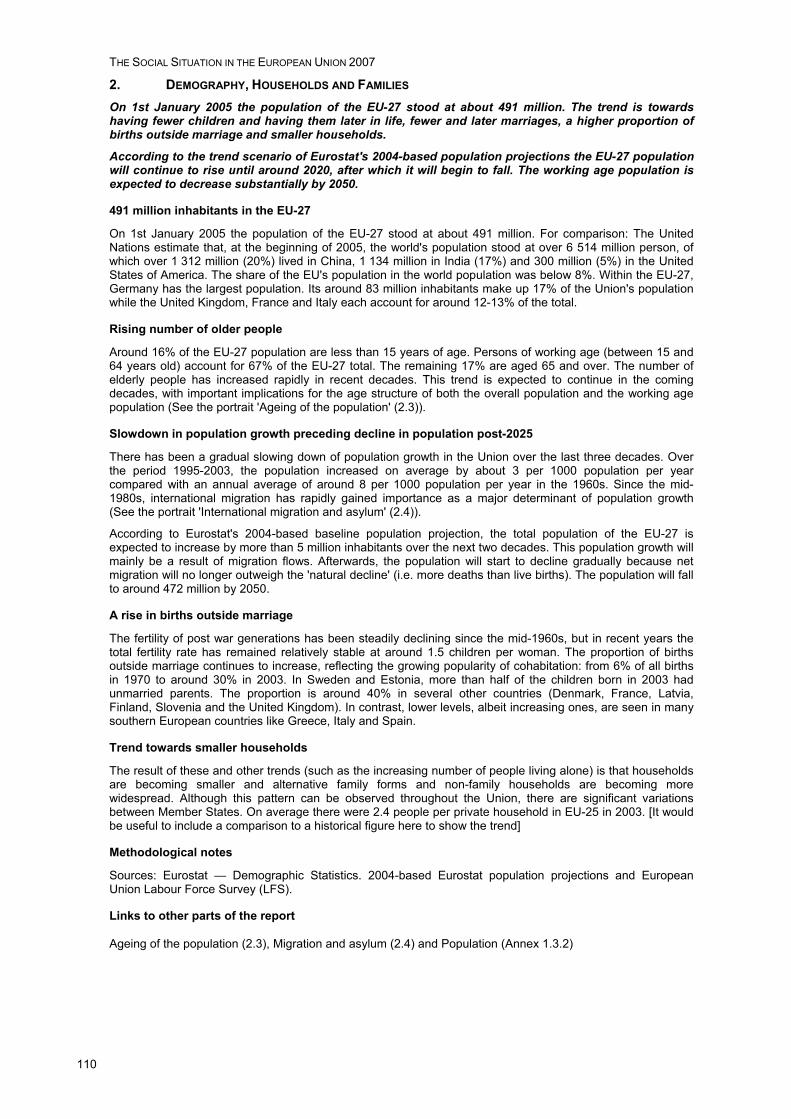
THE SOCIAL SITUATION IN THE EUROPEAN UNION 2007
110
2. DEMOGRAPHY, HOUSEHOLDS AND FAMILIES On 1st January 2005 the population of the EU-27 stood at about 491 million. The trend is towards having fewer children and having them later in life, fewer and later marriages, a higher proportion of births outside marriage and smaller households.
According to the trend scenario of Eurostat's 2004-based population projections the EU-27 population will continue to rise until around 2020, after which it will begin to fall. The working age population is expected to decrease substantially by 2050.
491 million inhabitants in the EU-27
On 1st January 2005 the population of the EU-27 stood at about 491 million. For comparison: The United Nations estimate that, at the beginning of 2005, the world's population stood at over 6 514 million person, of which over 1 312 million (20%) lived in China, 1 134 million in India (17%) and 300 million (5%) in the United States of America. The share of the EU's population in the world population was below 8%. Within the EU-27, Germany has the largest population. Its around 83 million inhabitants make up 17% of the Union's population while the United Kingdom, France and Italy each account for around 12-13% of the total.
Rising number of older people
Around 16% of the EU-27 population are less than 15 years of age. Persons of working age (between 15 and 64 years old) account for 67% of the EU-27 total. The remaining 17% are aged 65 and over. The number of elderly people has increased rapidly in recent decades. This trend is expected to continue in the coming decades, with important implications for the age structure of both the overall population and the working age population (See the portrait 'Ageing of the population' (2.3)).
Slowdown in population growth preceding decline in population post-2025
There has been a gradual slowing down of population growth in the Union over the last three decades. Over the period 1995-2003, the population increased on average by about 3 per 1000 population per year compared with an annual average of around 8 per 1000 population per year in the 1960s. Since the mid-1980s, international migration has rapidly gained importance as a major determinant of population growth (See the portrait 'International migration and asylum' (2.4)).
According to Eurostat's 2004-based baseline population projection, the total population of the EU-27 is expected to increase by more than 5 million inhabitants over the next two decades. This population growth will mainly be a result of migration flows. Afterwards, the population will start to decline gradually because net migration will no longer outweigh the 'natural decline' (i.e. more deaths than live births). The population will fall to around 472 million by 2050.
A rise in births outside marriage
The fertility of post war generations has been steadily declining since the mid-1960s, but in recent years the total fertility rate has remained relatively stable at around 1.5 children per woman. The proportion of births outside marriage continues to increase, reflecting the growing popularity of cohabitation: from 6% of all births in 1970 to around 30% in 2003. In Sweden and Estonia, more than half of the children born in 2003 had unmarried parents. The proportion is around 40% in several other countries (Denmark, France, Latvia, Finland, Slovenia and the United Kingdom). In contrast, lower levels, albeit increasing ones, are seen in many southern European countries like Greece, Italy and Spain.
Trend towards smaller households
The result of these and other trends (such as the increasing number of people living alone) is that households are becoming smaller and alternative family forms and non-family households are becoming more widespread. Although this pattern can be observed throughout the Union, there are significant variations between Member States. On average there were 2.4 people per private household in EU-25 in 2003. [It would be useful to include a comparison to a historical figure here to show the trend]
Methodological notes
Sources: Eurostat — Demographic Statistics. 2004-based Eurostat population projections and European Union Labour Force Survey (LFS).
Links to other parts of the report
Ageing of the population (2.3), Migration and asylum (2.4) and Population (Annex 1.3.2)
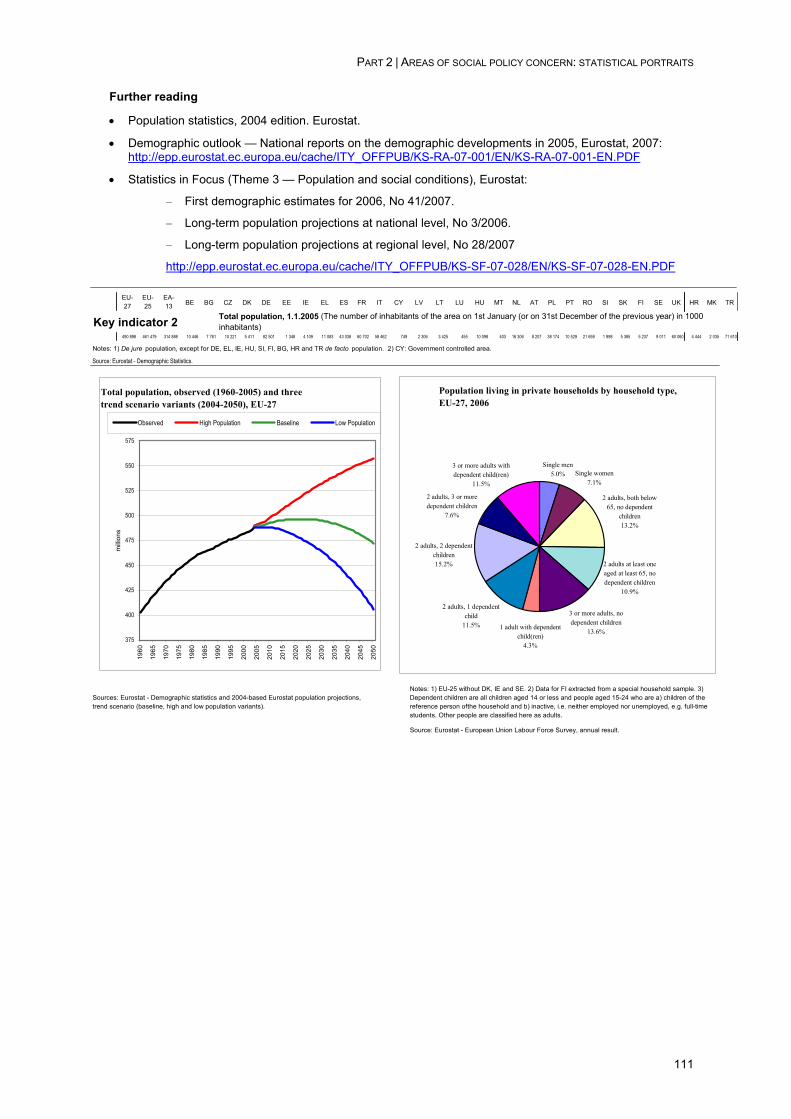
PART 2 | AREAS OF SOCIAL POLICY CONCERN: STATISTICAL PORTRAITS
111
Further reading
• Population statistics, 2004 edition. Eurostat.
• Demographic outlook — National reports on the demographic developments in 2005, Eurostat, 2007: http://epp.eurostat.ec.europa.eu/cache/ITY_OFFPUB/KS-RA-07-001/EN/KS-RA-07-001-EN.PDF
• Statistics in Focus (Theme 3 — Population and social conditions), Eurostat:
– First demographic estimates for 2006, No 41/2007.
– Long-term population projections at national level, No 3/2006.
– Long-term population projections at regional level, No 28/2007
http://epp.eurostat.ec.europa.eu/cache/ITY_OFFPUB/KS-SF-07-028/EN/KS-SF-07-028-EN.PDF
EU-27
EU-25
EA-13 BE BG CZ DK DE EE IE EL ES FR IT CY LV LT LU HU MT NL AT PL PT RO SI SK FI SE UK HR MK TR
Key indicator 2490 898 461 479 314 888 10 446 7 761 10 221 5 411 82 501 1 348 4 109 11 083 43 038 60 702 58 462 749 2 306 3 425 455 10 098 403 16 306 8 207 38 174 10 529 21 659 1 998 5 385 5 237 9 011 60 060 4 444 2 035 71 610
Notes: 1) De jure population, except for DE, EL, IE, HU, SI, FI, BG, HR and TR de facto population. 2) CY: Government controlled area.
Source: Eurostat - Demographic Statistics.
Source: Eurostat - European Union Labour Force Survey, annual result.
Notes: 1) EU-25 without DK, IE and SE. 2) Data for FI extracted from a special household sample. 3) Dependent children are all children aged 14 or less and people aged 15-24 who are a) children of the reference person ofthe household and b) inactive, i.e. neither employed nor unemployed, e.g. full-time students. Other people are classified here as adults.
Sources: Eurostat - Demographic statistics and 2004-based Eurostat population projections, trend scenario (baseline, high and low population variants).
Total population, 1.1.2005 (The number of inhabitants of the area on 1st January (or on 31st December of the previous year) in 1000 inhabitants)
Population living in private households by household type, EU-27, 2006
Single men5.0% Single women
7.1%
1 adult with dependent child(ren)
4.3%
3 or more adults with dependent child(ren)
11.5%
2 adults, 3 or more dependent children
7.6%
2 adults, 2 dependent children15.2%
2 adults, 1 dependent child
11.5%
3 or more adults, no dependent children
13.6%
2 adults at least one aged at least 65, no dependent children
10.9%
2 adults, both below 65, no dependent
children13.2%
Total population, observed (1960-2005) and three trend scenario variants (2004-2050), EU-27
375
400
425
450
475
500
525
550
575
1960
1965
1970
1975
1980
1985
1990
1995
2000
2005
2010
2015
2020
2025
2030
2035
2040
2045
2050
milli
ons
Observed High Population Baseline Low Population
THE SOCIAL SITUATION IN THE EUROPEAN UNION 2007
112
3. AGEING OF THE POPULATION In 2005, there were around 81 million elderly people aged 65 and over in the EU-27, compared with 38 million in 1960. Today there is one elderly person for every four people of working age (15-64). By 2050, the ratio is expected to be one elderly for every two people of working age. The proportion of very old people (aged 80 and more) is expected to almost triple in the EU-27, from 4% in 2004 to over 11% in 2050.
Low fertility levels, extended longevity and baby-boomers’ ageing mean that the EU-27 population is ageing
Three driving forces are behind the ageing of the population: fertility below replacement levels, a fall in mortality and the approach of the baby-boomers to the retirement age. The total fertility rate in the EU seems to have reached its lowest point at the end of the 1990s (1.4) and has remained close to the level of 1.5 children per woman ever since. It is still low compared to 2.6 in 1960. Countries with the highest fertility at the beginning of the 1980s (Greece, Spain, Ireland, Poland, Portugal and Slovakia) are those where it has subsequently fallen the most. In 2005, total fertility was below the level of 1.3 children per woman in the Czech Republic, Latvia, Poland, Slovenia and Slovakia. It was above 1.8 children per woman in Denmark, Ireland, France, and Finland. Life expectancy has increased over the last 50 years by about 10 years in total, due to improved socio-economic and environmental conditions and better medical treatment and care (See portrait 'Life and health expectancies' (2.17)).
Between 1960 and 2005, the proportion of older people (65 years and over) in the population has risen from 10% to almost 17% in the EU-27. All the signs are that this trend will continue well into the new century although in the course of this decade, the rate of change will be somewhat slower due to the drop in fertility during World War II. The proportion of people aged 65 and more in the total population is expected to rise in the period to 2050. In the EU-27 it is expected to increase from 17% in 2005 to 30% in 2050, reflecting an underlying increase in the number of older persons from 81.0 million in 2005 to 141.3 million in 2050. The largest shares of elderly people in 2050 are expected in Spain (2050: 36%), Italy (35%), Bulgaria (34%) and Greece (33%), and the lowest in Luxembourg (22%), the Netherlands (24%) and Denmark (24%).
Population growth fastest among the 'very old'
The growth of the population aged 80 or more will be even more pronounced in the future as more people are expected to survive to higher ages. The proportion of very old people (aged 80 and more) is expected to almost triple in the EU-27, from 4% in 2005 to 11% in 2050, with the highest proportions expected in Italy, Germany and Spain. It is worth noting that the population aged 55 to 64 will also grow considerably over the next fifteen years.
Dwindling 'demographic' basis of support for older citizens
In 1970, the EU-27 population aged 65 and over corresponded to 18% of what is considered to be the working age population (15-64 years). In 2005, this old age dependency ratio has risen to almost 25%. All Member States are expected to see an increase in this ratio between now and 2010 (to an EU average of 26%) although the extent of the rise will vary considerably between Member States. In the long run, the old age dependency ratio in the EU-27 is expected to rise to 53% in 2050, while the young dependency ratio would remain more or less constant throughout the projection period 2005 to 2050. The total dependency ratio in the EU-25 is projected to increase from around 50% in 2004 to 77% in 2050. This means that, in 2004, for every four persons of working age, there were two persons of non-working age (i.e. young or elderly persons) — the ratio will increase to over three young or elderly persons for every 4 people of working age by 2050.
Policy context
In its communication on the green paper 'Faced with demographic change, a new solidarity between the generations' (COM(2005) 94 final) the Commission concluded that 'in order to face up to demographic change, Europe should pursue three essential priorities:
• Return to demographic growth. We must ask two simple questions: What value do we attach to children? Do we want to give families, whatever their structure, their due place in European society? Thanks to the determined implementation of the Lisbon agenda (modernisation of social protection systems, increasing the rate of female employment and the employment of older workers), innovative measures to support the birth rate and judicious use of immigration, Europe can create new opportunities for investment, consumption and the creation of wealth.
• Ensure a balance between the generations, in the sharing of time throughout life, in the distribution of the benefits of growth, and in that of funding needs stemming from pensions and health-related expenditure.
• Find new bridges between the stages of life. Young people still find it difficult to get into employment. An increasing number of 'young retirees' want to participate in social and economic life. Study time is getting longer and young working people want to spend time with their children. These changes alter the frontiers and the bridges between activity and inactivity.'
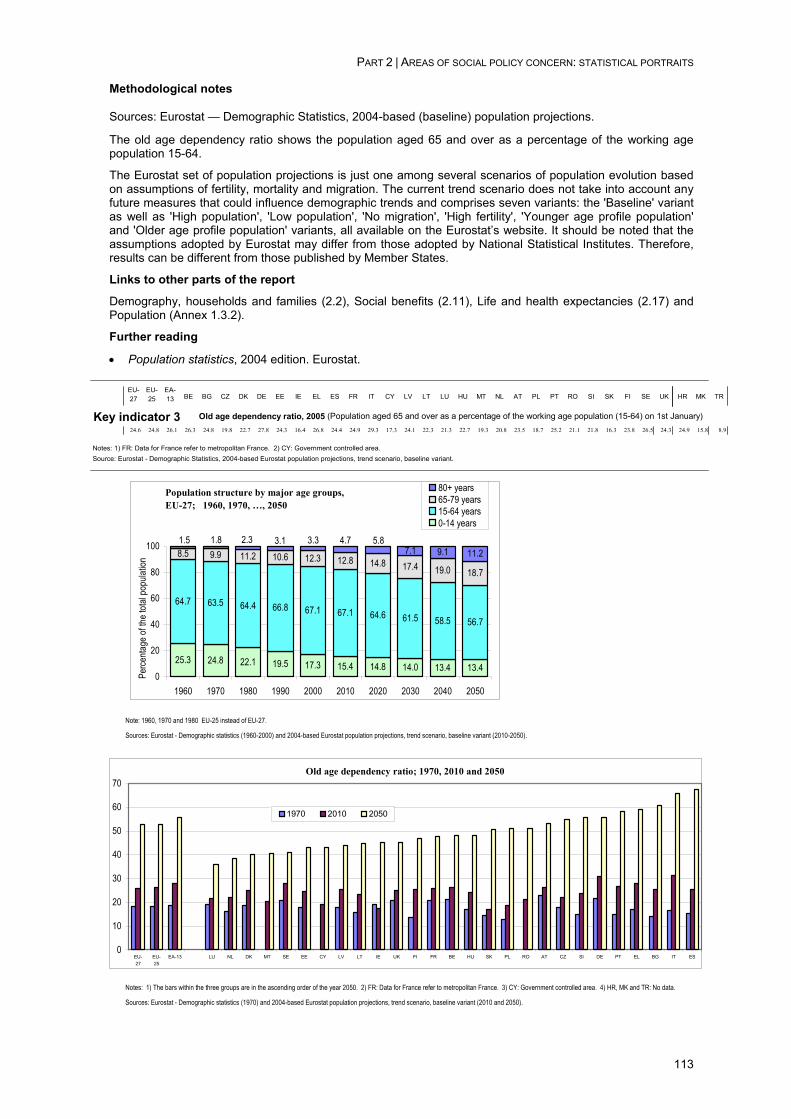
PART 2 | AREAS OF SOCIAL POLICY CONCERN: STATISTICAL PORTRAITS
113
Methodological notes
Sources: Eurostat — Demographic Statistics, 2004-based (baseline) population projections.
The old age dependency ratio shows the population aged 65 and over as a percentage of the working age population 15-64.
The Eurostat set of population projections is just one among several scenarios of population evolution based on assumptions of fertility, mortality and migration. The current trend scenario does not take into account any future measures that could influence demographic trends and comprises seven variants: the 'Baseline' variant as well as 'High population', 'Low population', 'No migration', 'High fertility', 'Younger age profile population' and 'Older age profile population' variants, all available on the Eurostat’s website. It should be noted that the assumptions adopted by Eurostat may differ from those adopted by National Statistical Institutes. Therefore, results can be different from those published by Member States.
Links to other parts of the report
Demography, households and families (2.2), Social benefits (2.11), Life and health expectancies (2.17) and Population (Annex 1.3.2).
Further reading
• Population statistics, 2004 edition. Eurostat.
EU-27
EU-25
EA-13 BE BG CZ DK DE EE IE EL ES FR IT CY LV LT LU HU MT NL AT PL PT RO SI SK FI SE UK HR MK TR
Key indicator 324.6 24.8 26.1 26.3 24.8 19.8 22.7 27.8 24.3 16.4 26.8 24.4 24.9 29.3 17.3 24.1 22.3 21.3 22.7 19.3 20.8 23.5 18.7 25.2 21.1 21.8 16.3 23.8 26.5 24.3 24.9 15.8 8.9
Notes: 1) FR: Data for France refer to metropolitan France. 2) CY: Government controlled area.Source: Eurostat - Demographic Statistics, 2004-based Eurostat population projections, trend scenario, baseline variant.
Note: 1960, 1970 and 1980 EU-25 instead of EU-27.
Sources: Eurostat - Demographic statistics (1960-2000) and 2004-based Eurostat population projections, trend scenario, baseline variant (2010-2050).
Notes: 1) The bars within the three groups are in the ascending order of the year 2050. 2) FR: Data for France refer to metropolitan France. 3) CY: Government controlled area. 4) HR, MK and TR: No data.
Sources: Eurostat - Demographic statistics (1970) and 2004-based Eurostat population projections, trend scenario, baseline variant (2010 and 2050).
Old age dependency ratio, 2005 (Population aged 65 and over as a percentage of the working age population (15-64) on 1st January)
Population structure by major age groups, EU-27; 1960, 1970, …, 2050
25.3 24.8 22.1 19.5 17.3 15.4 14.8 14.0 13.4 13.4
64.7 63.5 64.4 66.8 67.1 67.1 64.6 61.5 58.5 56.7
8.5 9.9 11.2 10.6 12.3 12.8 14.8 17.4 19.0 18.7
7.1 9.1 11.25.84.73.33.12.31.81.5
0
20
40
60
80
100
1960 1970 1980 1990 2000 2010 2020 2030 2040 2050
Perce
ntage
of th
e tota
l pop
ulatio
n
80+ years65-79 years15-64 years0-14 years
Old age dependency ratio; 1970, 2010 and 2050
0
10
20
30
40
50
60
70
EU-27
EU-25
EA-13 LU NL DK MT SE EE CY LV LT IE UK FI FR BE HU SK PL RO AT CZ SI DE PT EL BG IT ES
1970 2010 2050
THE SOCIAL SITUATION IN THE EUROPEAN UNION 2007
114
4. INTERNATIONAL MIGRATION AND ASYLUM Net migration is the main component of annual population change in the EU. In 2005, the annual net migration rate was 3.6 per 1 000 population in the 27 Member States of the EU, representing around 86% of total population growth. In 2006 there were 192 700 asylum requests in the EU-27.
Important role of international migration in population growth
In most of the EU Member States international migration plays an important role in population growth. Between 2001 and 2005 net migration ranged between 1.35 and 2.01 million. In absolute numbers the net migration in countries such as Spain, Italy, France and United Kingdom reached the level of several hundred thousands (in Spain more than 600 000 recorded as highest) in 2005. In relative terms, net migration was highest in Cyprus (1.92%), Ireland (1.61%) and Spain (1.49%). In 2005 only five of the EU-27 Member States reported a negative crude net migration rate – Latvia, Lithuania, the Netherlands, Poland and Romania. Indirect sources including flows registered by other Member States indicate the same tendency for Bulgaria and Estonia where the data are currently not available. In addition, due to positive net migration, the Czech Republic, Italy, and Slovenia had a positive population increase despite negative natural growth. Even though they experienced positive net migration, the populations of Germany and Hungary declined due to higher negative natural increase.
The estimated total annual number of immigrants to EU-27 Member States is over 3 millions while the number of emigrants is around half this. When expressed in relation to the total population, immigration in 2005 accounted for 0.36 percent of the total number of inhabitants in the EU-27. The highest numbers of immigrants including short-term migrants were reported by Germany and Spain (more than 700 000). In the United Kingdom, the number of immigrants who entered for a stay of at least one year was nearly 500 thousand according to national statistics. In recent years, available statistics in Italy indicate annual flows of more 300 000 immigrants per year.
As a result of long-standing positive net migration, in several Member States there are considerable populations of non-national citizens; that is, persons who are not citizens of their country of residence. According to official national statistics and Eurostat estimates, the total number of non-nationals living in the European Union Member States in 2005 was around 28 million, representing 5.7 percent of the total population. In absolute terms, the largest numbers of foreign citizens reside in Germany, France, Spain, the United Kingdom and Italy.
The non-national population varied from less than 1 percent of the total population in Romania, Bulgaria and Slovakia to 39 percent in Luxembourg in 2005. In addition to Luxembourg, according to Eurostat estimates, the proportion of non-nationals also exceeds 10 percent in Latvia, Estonia and Cyprus. Figures for Latvia and Estonia include persons who have been resident in the country since before break-up of the Soviet Union but have not yet acquired citizenship of Latvia or Estonia. In half of the Member States, the proportion of non-nationals was between 5 and 10 percent. In all EU Member States, except Luxembourg, Belgium, Ireland, Malta, Cyprus, Hungary and Slovakia, the majority of non-nationals are citizens of non-EU-27 countries.
The citizenship structures of foreign populations in the EU Member States vary greatly. As well as geographical proximity, the composition of the non-national population in each country strongly reflects their history, labour migration, recent political developments and historical links. For example, the largest non-national groups include Turkish citizens in Germany, Denmark and the Netherlands; citizens of former colonies in Portugal (citizens of Cape Verde, Brazil and Angola) and in Spain (Ecuadorians and Moroccans); migrants from Albania in Greece; citizens from other parts of the former Yugoslavia in Slovenia; Czech citizens in Slovakia; and citizens from CIS countries (particularly from Russia, Ukraine and Belarus) in Estonia, Latvia and Lithuania.
192 700 asylum requests in the EU-27 in 2006
In 2006 nearly 193 thousand requests for asylum were received in the EU-27. With this figure the level of requests is lower than in the five previous years. Compared to 2002, the number of new asylum applications in 2006 has fallen by more than half.
Although the total number of asylum seekers in the European Union has decreased significantly over the last few years, developments in the individual Member States vary considerably. While most countries show a decrease, some countries show an increasing number of asylum applications.
The largest decreases (in absolute terms between 2005 and 2006) were recorded in France (-16 300), Austria (-9 100), and Germany (-7 900). At the same time we observe the largest increases in Sweden (+6 800), Greece (+3 200) and Netherlands (+2 100).
In 2006, the United Kingdom received the largest number of applications: 28,320 (30 840 in 2005) followed by France (26 300), Sweden (24 300), Germany (21 000). However, as UK and Sweden are not able to distinguish between first and repeat applications, these figures are not fully comparable and should be interpreted with caution. In terms of overall population, Cyprus (5.9 applicants per 1 000 inhabitants), Malta (3.1), Sweden (2.7) and Austria (1.6) had the highest rates of asylum requests.
The short and long term impacts of asylum on population change are complex and cannot be related simply to the number of applicants in a particular year. The consideration of an asylum application may take 12 months
PART 2 | AREAS OF SOCIAL POLICY CONCERN: STATISTICAL PORTRAITS
115
or longer, meaning that some applicants who have not yet received a decision become residents of the destination country, even if only temporarily. Member States differ, both in terms of national asylum law and practice, and in terms of how asylum is accounted for in the national migration statistics. In some Member States, persons waiting for a decision on their application may be authorised to work. Some persons granted asylum will later return to their countries of origin when the situation there changes.
Policy context
The Treaty of Amsterdam introduced a new Title IV (Visas, asylum, immigration and other policies related to free movement of persons) into the EC Treaty. It covers the following fields: free movement of persons; controls on external borders; asylum, immigration and safeguarding of the rights of third-country nationals; judicial cooperation in civil matters and administrative cooperation.
The Treaty of Amsterdam thus established Community competence in the fields of immigration and asylum and transferred these areas from the intergovernmental third pillar to the community first pillar, with decisions in these fields being shaped in Community instruments such as directives. The European Council at its meeting in Tampere in October 1999 called for the development in the following 5 years of a common EU policy in these areas including the following elements: partnership with countries of origin, a common European asylum system, fair treatment of third country nationals and management of migration flows. The Hague Programme of 4-5 November 2004 set the priorities for the current period (2005-2010) and stressed the importance of having an open debate on economic migration at EU level, which – together with the best practices in Member States and their relevance for the implementation of the Lisbon strategy – should be the basis for 'a policy plan on legal migration including admission procedures capable of responding promptly to fluctuating demands for migrant labour in the labour market'. This Policy Plan was adopted by the Commission in December 2005 and is currently being implemented: the Commission presented in November 2007 proposals for two directives on the rights of third-country nationals and on the admission of highly-skilled migrants. In parallel, measures aiming at reducing illegal immigration are also being presented, like the proposals to establish sanctions for the employers of illegally staying immigrants, presented in May 2007, and to establish common standards for the return of illegally staying immigrants.
Asylum policy is also an important priority. After the adoption between 1999 and 2005 of a number of legislative instruments in this area, the Commission launched a debate about the future direction of the European asylum policy with the presentation of a Green Paper in June 2007. The results of the Green Paper consultation will inform a Policy Plan on Asylum to be presented in 2008.
Methodological notes
Source: Eurostat — Migration Statistics.
Population growth rates represent the relative increase of the total population per 1,000 inhabitants during the year(s) in question. The increase in total population is made up of the natural increase (live births less deaths) and net migration. Net migration is estimated on the basis of the difference between population change and natural increase (corrected net migration rate per 1,000 inhabitants).
Total immigration flows include immigration of nationals and non-nationals, and the latter category encompasses both nationals from other EU countries and third-country nationals. Different Member States apply different definitions of migration. Often, statistics are based on a person registering as a resident in another country or on a stated intention to stay longer than a certain period in a country.
Some countries record only permanent residents when counting the number of non-nationals, resulting in an underestimation of foreign (de facto) residents.
Some countries include some dependents in their figures for asylum applications, other countries do not. The same applies to repeat applications. The details are given in the table 'Asylum applications' in the part '2 Population' in Annex 1.3.
A further valuable source on international migration and the foreign population in the EU is the EU Labour Force Survey (LFS). The LFS provides breakdowns by nationality according to various social-demographic variables such as, e.g. gender, age, employment status, educational attainment.
Links to other parts of the report
Demography, households and families (2.2) and Population (Annex 1.3.2)
Further reading
• Population statistics, 2004 edition. Eurostat.
• Statistics in Focus (Population and social conditions): First results of the demographic data collection for 2003 in Europe, No 13/2004 and Acquisition of citizenship No 3/2004. Eurostat.
• Patterns and trends in international migration in Western Europe, 2000. Eurostat.
• Statistics in Focus (Population and social conditions): Non-national populations in the EU Member States, No 8/2006, Eurostat.
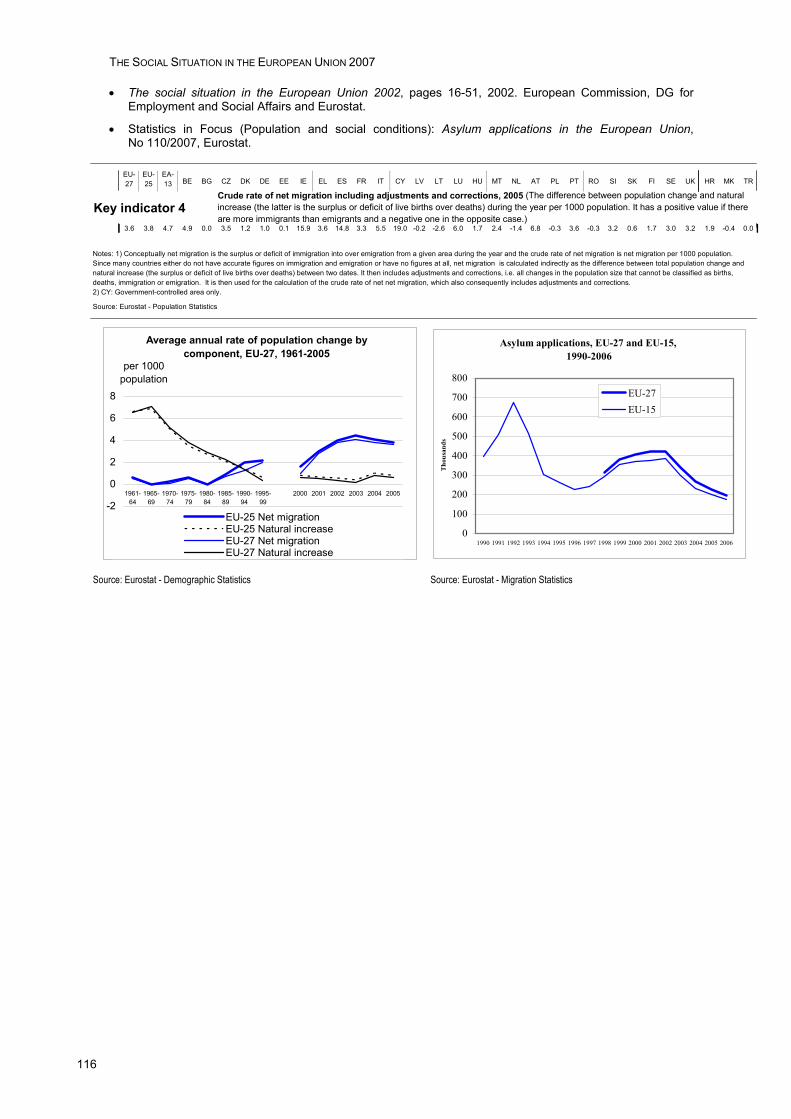
THE SOCIAL SITUATION IN THE EUROPEAN UNION 2007
116
• The social situation in the European Union 2002, pages 16-51, 2002. European Commission, DG for Employment and Social Affairs and Eurostat.
• Statistics in Focus (Population and social conditions): Asylum applications in the European Union, No 110/2007, Eurostat.
EU-27
EU-25
EA-13 BE BG CZ DK DE EE IE EL ES FR IT CY LV LT LU HU MT NL AT PL PT RO SI SK FI SE UK HR MK TR
Key indicator 43.6 3.8 4.7 4.9 0.0 3.5 1.2 1.0 0.1 15.9 3.6 14.8 3.3 5.5 19.0 -0.2 -2.6 6.0 1.7 2.4 -1.4 6.8 -0.3 3.6 -0.3 3.2 0.6 1.7 3.0 3.2 1.9 -0.4 0.0
Source: Eurostat - Population Statistics
Source: Eurostat - Demographic Statistics Source: Eurostat - Migration Statistics
Crude rate of net migration including adjustments and corrections, 2005 (The difference between population change and natural increase (the latter is the surplus or deficit of live births over deaths) during the year per 1000 population. It has a positive value if there are more immigrants than emigrants and a negative one in the opposite case.)
Notes: 1) Conceptually net migration is the surplus or deficit of immigration into over emigration from a given area during the year and the crude rate of net migration is net migration per 1000 population. Since many countries either do not have accurate figures on immigration and emigration or have no figures at all, net migration is calculated indirectly as the difference between total population change and natural increase (the surplus or deficit of live births over deaths) between two dates. It then includes adjustments and corrections, i.e. all changes in the population size that cannot be classified as births, deaths, immigration or emigration. It is then used for the calculation of the crude rate of net net migration, which also consequently includes adjustments and corrections.2) CY: Government-controlled area only.
Average annual rate of population change by component, EU-27, 1961-2005
-2
0
2
4
6
8
1961-64
1965-69
1970-74
1975-79
1980-84
1985-89
1990-94
1995-99
2000 2001 2002 2003 2004 2005
per 1000 population
EU-25 Net migrationEU-25 Natural increaseEU-27 Net migrationEU-27 Natural increase
Asylum applications, EU-27 and EU-15, 1990-2006
0
100
200
300
400
500
600
700
800
1990 1991 1992 1993 1994 1995 1996 1997 1998 1999 2000 2001 2002 2003 2004 2005 2006
Tho
usan
ds
EU-27EU-15
PART 2 | AREAS OF SOCIAL POLICY CONCERN: STATISTICAL PORTRAITS
117
5. EDUCATION AND ITS OUTCOMES Educational attainment levels of the population have improved significantly over the last thirty years, particularly among women. In 2006, 78% of young people aged 20-24 in the EU-27 had at least an upper secondary qualification. At the same time, however, 15% of people aged 18-24 left the education system with only lower secondary education at best.
Younger generation is better educated
By comparing those currently leaving the education system with older generations, it is possible to monitor the trends in educational attainment over a long time-period of around forty years. In 2006, 81% of the younger generation aged 25-29 had completed at least upper secondary education compared with only 60% of people aged 55-59. This increase of the educational attainment level is particularly observable for women: 83% of young women aged 25-29 years had completed at least upper secondary education, comparing with 55% characterising generation of their mothers (here: women aged 55-59 years). For men, these proportions get respectively 79% and 65%. Today, educational attainment level is higher among the young women than among young men in all EU-Member States.
Almost one in six Europeans leaves school with a low educational attainment level
Although educational attainment levels continue to improve, 15% of 18-24 year-olds in the Union are not in education or training even though they have not completed a qualification beyond lower secondary schooling. Malta, Portugal and Spain have the highest proportions (30% or more) of low-qualified young people who are not any more in the educational or training system. In virtually all Member States, women (EU-27 average of 13%) are less likely than men (EU-27 average of 18%) to be in this situation.
Higher education tends to reduce the risk of unemployment…
In general, higher education seems to reduce, albeit to differing degrees, the risks of unemployment in all Member States. In EU-27, the unemployment rate of 25-64 years old with tertiary education stood at 4.1% in 2006 compared with 7.3% for people who had completed at best upper secondary education and 10.1.% among those who had not gone beyond lower secondary schooling.
…and increase income…
The 200562 data for EU-25 show also that a person's income is likely to be considerably higher if he/she is better qualified. On average for the EU-25 overall, the median equivalised net income of highly educated persons (i.e. completed tertiary education) was 143% of the national median whereas it was 83% for those with a low-level education (i.e. completed at most lower-secondary schooling) and 102% for those with medium level of education (i.e. completed upper secondary or postsecondary, not tertiary education) . The ratio of the incomes between the well and low educated workers was largest in Portugal (2.72) and smallest in Germany and Sweden (1.36). The 2005 data also show that the at-risk-of-poverty rate among the highly educated was only 7% compared with 22% among those with a low-level education. For individuals with a medium level of education the at-risk-of-poverty rate was 13%.
…and lead to more training opportunities
Throughout the Union, the higher the educational level of adults, the greater the training opportunities afforded to them. See also Lifelong learning (2.6).
Policy context
EC Treaty (Title XI, Chapter 3, Art. 149(1): 'The Community shall contribute to the development of quality education by encouraging co-operation between Member States and, if necessary, by supporting and supplementing their action …' and Art. 150(1): 'The Community shall implement a vocational training policy which shall support and supplement the action of the Member States …'.
At the Lisbon European Council held in March 2000, the Heads of State and Government set the Union a major strategic goal for 2010 'to become the most competitive and dynamic knowledge-based economy in the world, capable of sustainable economic growth with more and better jobs and greater social cohesion'. In March 2001, the European Council adopted three strategic goals (and 13 associated concrete objectives) to be attained by 2010: education and training systems should be organised around quality, access, and openness to the world. A year later, it approved a detailed work programme ('Education & Training 2010') for the attainment of these goals and supported the ambition of the Ministers for Education to make education and training systems in Europe 'a worldwide quality reference by 2010'.
In its Communication on the success of the Lisbon strategy (COM (2003)685) the Commission outlined that Education and training policies are central to the creation and transmission of knowledge and are a determining factor in each society's potential for innovation. Nevertheless the Union as a whole is currently under-performing in the knowledge-driven economy in relation to some of its main competitors. Efforts are being made in all the European countries to adapt the education and training systems to the knowledge-driven society and economy, but the reforms undertaken are not up to the challenges and their current pace will not
62 EU-SILC survey year 2005, income reference year mainly 2004.
THE SOCIAL SITUATION IN THE EUROPEAN UNION 2007
118
enable the Union to attain the objectives set. The benchmarks adopted by the (Education) Council in May 2003 will for the most part be difficult to achieve by 2010. In particular, the level of take-up by Europeans of lifelong learning is low and the levels of failure at school and of social exclusion, which have a high individual, social and economic cost, remain too high.
Methodological notes
Sources: Eurostat — European Union Labour Force Survey (LFS) and Community Statistics on Income and Living Conditions (EU-SILC).
The levels of education are defined according to ISCED (International Standard Classification of Education — UNESCO 1997 version). Less than upper secondary corresponds to ISCED 0-2, upper secondary level to ISCED 3-4 (including thus post-secondary non-tertiary education) and tertiary education to ISCED 5-6.
The structural indicator on early school leavers shows the percentage of the population aged 18-24 with at most lower secondary education and not in further education or training.
Links to other parts of the report
Lifelong learning (2.6), Employment (2.7), Unemployment (2.8) and Education and training (Annex 1.3.3).
Further reading
• Education across Europe 2003, 2004, Eurostat.
• Key data on higher education in Europe — 2007 edition, 2007, DG Education and Culture, Eurostat and Eurydice (Information network on education in Europe). http://www.eurydice.org/ressources/eurydice/pdf/0_integral/088EN.pdf
• The transition from education to working life: Key data on vocational training in the European Union, 2001, DG Education and Culture, Eurostat and Cedefop (European Centre for the development of Vocational Training).
• Education and training 2010. The success of the Lisbon strategy hinges on urgent reforms. European Commission, DG Education and Culture
• Education at a glance 2006, 2006, OECD.
• Education for all – An international strategy to put the Dakar Framework for Action on Education for All into operation, 2002, UNESCO, http://www.unesco.org/education/efa/index.shtml.
• Statistics in Focus on education (Theme 3 — Population and social conditions), Eurostat:
– Education in Europe, No 13/2003.
– General indicators on transition from school to work, No 4/2003.
– School leavers in Europe and labour market effects of job mismatches, No 5/2003.
– Youth transitions from education to working life in Europe, No 6/2003.
– Education in Europe, Key statistics 2002/2003, No 10/2005
– 17 million tertiary students in the EU, No 19/2005
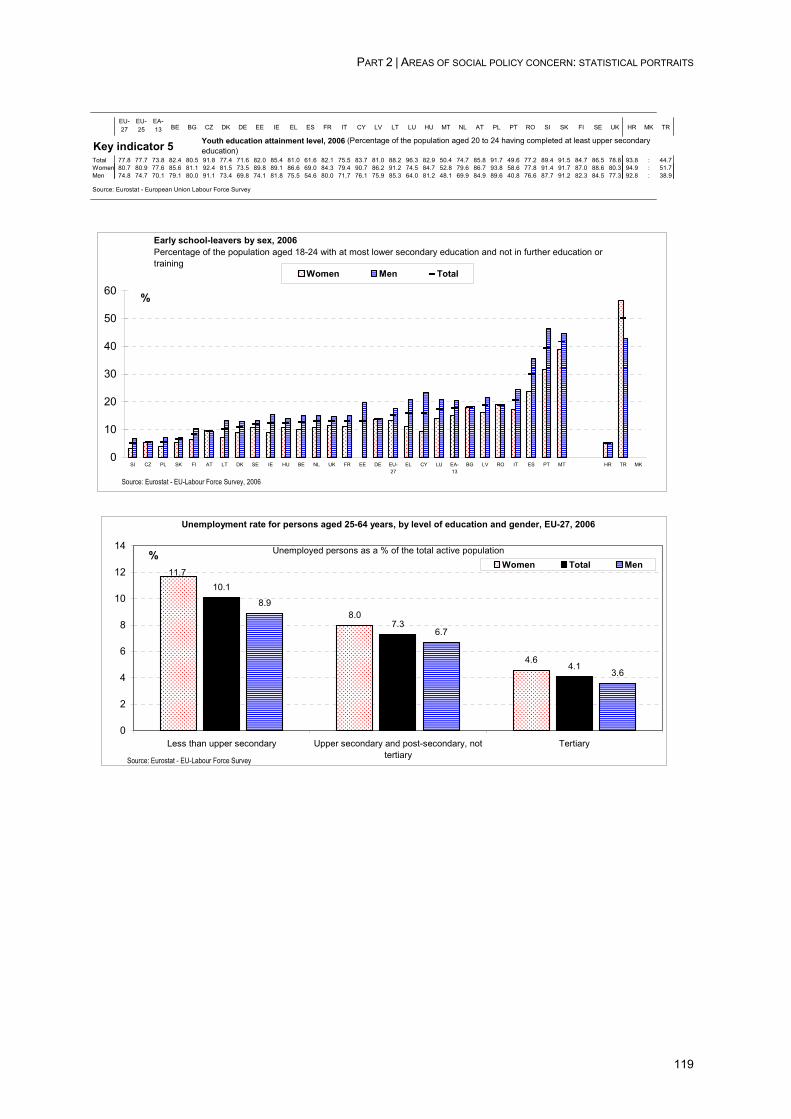
PART 2 | AREAS OF SOCIAL POLICY CONCERN: STATISTICAL PORTRAITS
119
EU-27
EU-25
EA-13 BE BG CZ DK DE EE IE EL ES FR IT CY LV LT LU HU MT NL AT PL PT RO SI SK FI SE UK HR MK TR
Key indicator 5Total 77.8 77.7 73.8 82.4 80.5 91.8 77.4 71.6 82.0 85.4 81.0 61.6 82.1 75.5 83.7 81.0 88.2 96.3 82.9 50.4 74.7 85.8 91.7 49.6 77.2 89.4 91.5 84.7 86.5 78.8 93.8 : 44.7Women 80.7 80.9 77.6 85.6 81.1 92.4 81.5 73.5 89.8 89.1 86.6 69.0 84.3 79.4 90.7 86.2 91.2 74.5 84.7 52.8 79.6 86.7 93.8 58.6 77.8 91.4 91.7 87.0 88.6 80.3 94.9 : 51.7Men 74.8 74.7 70.1 79.1 80.0 91.1 73.4 69.8 74.1 81.8 75.5 54.6 80.0 71.7 76.1 75.9 85.3 64.0 81.2 48.1 69.9 84.9 89.6 40.8 76.6 87.7 91.2 82.3 84.5 77.3 92.8 : 38.9
Source: Eurostat - European Union Labour Force Survey
Youth education attainment level, 2006 (Percentage of the population aged 20 to 24 having completed at least upper secondary education)
Early school-leavers by sex, 2006Percentage of the population aged 18-24 with at most lower secondary education and not in further education or training
0
10
20
30
40
50
60
SI CZ PL SK FI AT LT DK SE IE HU BE NL UK FR EE DE EU-27
EL CY LU EA-13
BG LV RO IT ES PT MT HR TR MK
%
Women Men Total
Source: Eurostat - EU-Labour Force Survey, 2006
Unemployment rate for persons aged 25-64 years, by level of education and gender, EU-27, 2006
Unemployed persons as a % of the total active population
4.6
10.1
7.3
4.1
8.0
11.7
3.6
6.7
8.9
0
2
4
6
8
10
12
14
Less than upper secondary Upper secondary and post-secondary, nottertiary
Tertiary
%Women Total Men
Source: Eurostat - EU-Labour Force Survey

THE SOCIAL SITUATION IN THE EUROPEAN UNION 2007
120
6. LIFELONG LEARNING In the Union (EU-27), 10% of the population aged 25-64 participated in education/training (over the four weeks prior to the survey) in 2006. Such learning activities are more prevalent (between 20 and 33%) in Denmark, Finland, Sweden and the United Kingdom. On the other hand, in many countries this proportion of people participating in lifelong learning is very small, lower than 10% of the 25-64 age-group.
Women, the young and the qualified participate more in education and training
The annual figures on participation in lifelong learning correspond to the number of people interviewed during the Labour Force Survey who answer positively to the question whether they have participated in formal or non-formal education or training during the 4 weeks preceding the survey. According to these figures for the Union as a whole, the level of participation in such activities decreases with age: from 16% among those aged 25-34 to 5% for the 55-64 age group.
Moreover, the level of education attained also influences the chances of participation in 'lifelong learning' for people aged 25-64: in 2006, 19% of those with a tertiary qualification participated in education or training, compared to just 4% of those with low educational level.
On the other hand, there were slightly more women (10.4%) than men (8.8%) participate in education and training. The gap in favour of women is particularly large in Baltic countries in the United Kingdom.
Almost 6 out of 10 Europeans have not participated in lifelong learning during a whole year.
An ad hoc survey on participation in lifelong learning over the 12 months preceding the survey was attached to the LFS in 2003. When asked whether they had participated in any kind of education and training, including self-learning, 4.4% of the respondents said that they had participated in formal education, typically leading to a recognised qualification, while 22.5% said that they had only used self-learning methods (including visiting libraries, using computers, self-study and broadcasting). However 58% answered that they had not taken any action to learn something during that year. The level of non participation is 70% or more in Poland (70%), Czech Republic (71%), Lithuania (72%), Spain (75%), Greece (83%) and Hungary (88%).
Source: LFS ad hoc module 2003 on lifelong learning
Continuing vocational training in enterprises: joint agreements between social partners increase the chance for employees to be trained
Continuing vocational training provided by enterprises is a crucial part of lifelong learning: it benefits not only the enterprises in improving competitiveness but also benefits employees by keeping up their employability and enhancing their quality of working life.
The results of the second European survey of continuing vocational training (CVTS2 — 1999) reflect a pronounced gap between the North and the South of Europe regarding the participation rates in continuing vocational training (courses). Whereas in the Scandinavian countries at least half of the employees of all enterprises participate in courses, in Greece and in Portugal this value is less than one fifth. In contrast, with respect to the training intensity in terms of ‘training hours per participant’, southern EU Member States perform at the same level as the northern and central 'training countries'. This pattern of the southern countries is repeated in most of the new eastern EU Member States.
CVTS2 results indicate the importance of training in the service sector. In all the EU Member States, the training intensity is highest in this area of economic activity.
Formal education Non-formal education
Informal learning
1.4 0.8
1.6 0.6 7.9
7.4
22.5 58
PART 2 | AREAS OF SOCIAL POLICY CONCERN: STATISTICAL PORTRAITS
121
Except in countries where continuing vocational training is generally widespread, the provision of training is biased towards larger enterprises. CVTS2 results have highlighted the fact that negotiated joint agreements on training between the employers and employees (or their representatives) are important measures which correct for this bias and increase considerably the participation in continuing vocational training courses in small enterprises. In Portugal, the participation rate in small enterprises with training agreements is 38%, compared with just 4% in small enterprises without such agreements.
At the EU-level, participation rate in CVT is a spot higher for men (41%) than for women (38%), however, this pattern is not observed for all countries, there being a significant bias in favour of men in the Czech Republic and in the Netherlands.
Planning for the next Continuing Vocational Training Survey CVTS3 is currently underway and an underpinning regulation is in preparation. The CVTS3 survey will be implemented in 2006 with reference year 2005, and first results will be available towards the end of 2007.
Age of students in formal education varies considerably
An alternative way of measuring 'lifelong learning' is to look at the proportion of students who are aged 30 or over in formal education. In tertiary education (i.e. education which focuses on university or equivalent post-secondary education), around 2.8 million students in the Union (EU-25) were aged 30 or over in 2002/03. About 1.5 millions were studying full-time, 1.3 millions were studying part-time. This age group accounted for 11% of all full-time students and for 16.7% of all students, part-time as well as full-time. In some countries, the proportion of students 30 years old or older was considerably above average. That was the case in Sweden (36%), the United Kingdom (35%), Finland (27%) and Denmark and Latvia (25%). In for example Greece (1%), Cyprus (3%), Ireland and France (9%) the percentage was below the average.
Many adults are as well enrolled in formal education on upper secondary and post-secondary–non-tertiary levels of education. In 2002/03, 4.6 million students on these levels were aged 30 or above. Most of these students were studying part-time, only 0.5 millions were studying full-time. The age group 30 years and above accounted for 14% of all upper secondary and post-secondary–non-tertiary students in 2002/03. Also this percentage varies between countries. In the United Kingdom (41%), Sweden and Belgium (22%), and Finland (18%) the percentage was above the EU average. In Ireland, Malta, Lithuania, Germany, Cyprus, Greece and Latvia the percentage was 0.5% or below.
Total public expenditure on education: 5.09% of EU-27 GDP in 2004
Although investment in education is influenced by various factors (e.g. demographical aspects or levels of participation and length of study), the percentage of national wealth devoted to education tends to reflect the importance which governments attach to it.
In 2004, total public resources allocated to the funding of all levels of education — including direct public expenditure for educational institutions and public transfers for education to private entities — represented on average 5.09% of EU-27 GDP.
In EU-27, primary education accounted on average for 1.16% of GDP in 2002, secondary education accounted for 2.31%, while tertiary education accounted for 1.13%. The remaining 0.49% includes the allocation for pre-primary education and allocation for education, which has not been allocated by level.
In EU-27, a government’s contribution to education varied greatly in 2004 from 3.29% of GDP in Romania, 3.93% in Luxembourg and 4.21% in Slovakia to 6.71% in Cyprus, 7.35% in Sweden and 8.47% in Denmark.
Policy context
EC Treaty (Title XI, Chapter 3, Art. 150(2): 'Community action shall aim to … facilitate access to vocational training …; stimulate co-operation on training between educational or training establishments and firms.'
In its Communication on the Future of the European Employment Strategy the Commission outlines the key link played by lifelong learning in improving quality at work and productivity, and as a factor promoting labour force participation and social inclusion. In particular the growing inequality in access to training, to the disadvantage of less skilled and older workers, is a priority. The current trend whereby firms' investment in training declines with the age of workers should be reversed. The 2001 Employment Guidelines included for the first time a horizontal guideline asking for 'comprehensive and coherent national strategies for lifelong learning' in order to promote employability, adaptability and participation in the knowledge-based society. Member States were also invited to set, and monitor progress towards, targets for increasing investment in human resources and participation in further education and training.
A Communication on Making a European Area of Lifelong Learning a Reality (COM(2001) 678 final of 21.11.2001) adopted by the Commission sets out proposals for improving the participation of Europeans in lifelong learning activities. In this communication lifelong learning is defined as 'all learning activity undertaken throughout life, with the aim of improving knowledge, skills and competences within a personal, civic, social and/or employment-related perspective'. A Report from the Education Council to the European Council on 'The concrete future objectives of education and training systems' was presented in Stockholm in 2001. In this the Ministers of Education adopted the following concrete strategic objectives: increasing the quality and effectiveness of education and training systems in the European Union; facilitating the access of all to the
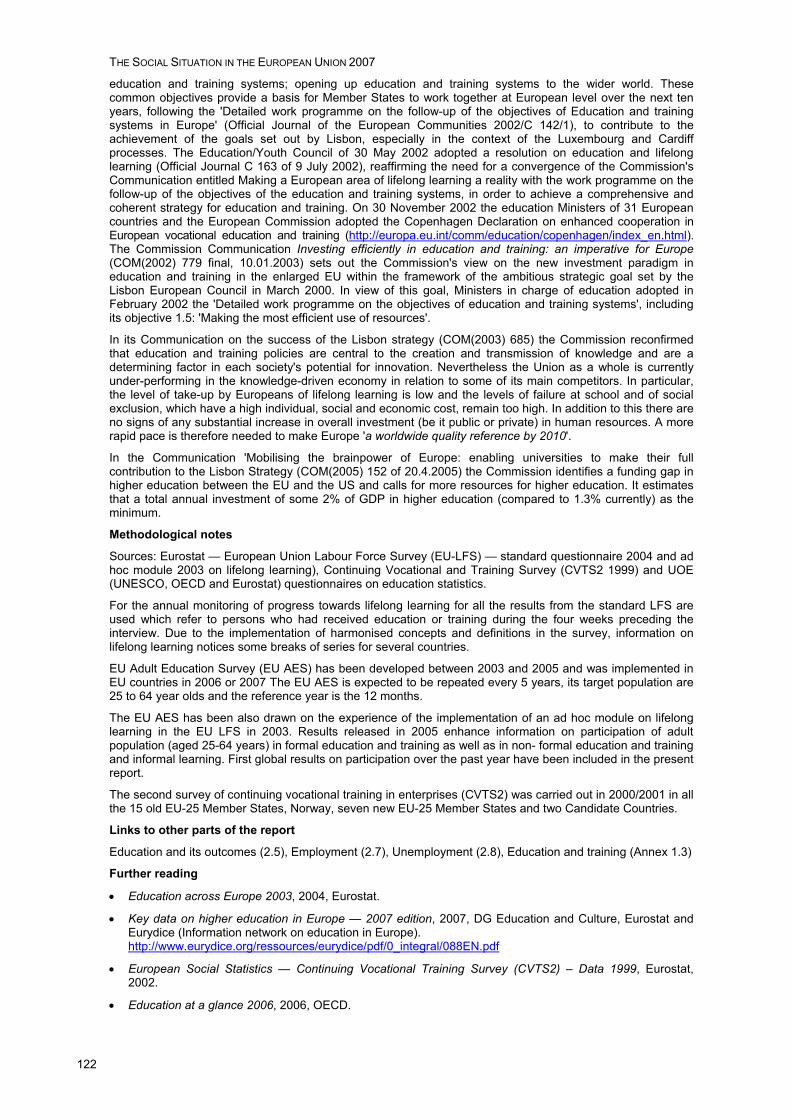
THE SOCIAL SITUATION IN THE EUROPEAN UNION 2007
122
education and training systems; opening up education and training systems to the wider world. These common objectives provide a basis for Member States to work together at European level over the next ten years, following the 'Detailed work programme on the follow-up of the objectives of Education and training systems in Europe' (Official Journal of the European Communities 2002/C 142/1), to contribute to the achievement of the goals set out by Lisbon, especially in the context of the Luxembourg and Cardiff processes. The Education/Youth Council of 30 May 2002 adopted a resolution on education and lifelong learning (Official Journal C 163 of 9 July 2002), reaffirming the need for a convergence of the Commission's Communication entitled Making a European area of lifelong learning a reality with the work programme on the follow-up of the objectives of the education and training systems, in order to achieve a comprehensive and coherent strategy for education and training. On 30 November 2002 the education Ministers of 31 European countries and the European Commission adopted the Copenhagen Declaration on enhanced cooperation in European vocational education and training (http://europa.eu.int/comm/education/copenhagen/index_en.html). The Commission Communication Investing efficiently in education and training: an imperative for Europe (COM(2002) 779 final, 10.01.2003) sets out the Commission's view on the new investment paradigm in education and training in the enlarged EU within the framework of the ambitious strategic goal set by the Lisbon European Council in March 2000. In view of this goal, Ministers in charge of education adopted in February 2002 the 'Detailed work programme on the objectives of education and training systems', including its objective 1.5: 'Making the most efficient use of resources'.
In its Communication on the success of the Lisbon strategy (COM(2003) 685) the Commission reconfirmed that education and training policies are central to the creation and transmission of knowledge and are a determining factor in each society's potential for innovation. Nevertheless the Union as a whole is currently under-performing in the knowledge-driven economy in relation to some of its main competitors. In particular, the level of take-up by Europeans of lifelong learning is low and the levels of failure at school and of social exclusion, which have a high individual, social and economic cost, remain too high. In addition to this there are no signs of any substantial increase in overall investment (be it public or private) in human resources. A more rapid pace is therefore needed to make Europe 'a worldwide quality reference by 2010'.
In the Communication 'Mobilising the brainpower of Europe: enabling universities to make their full contribution to the Lisbon Strategy (COM(2005) 152 of 20.4.2005) the Commission identifies a funding gap in higher education between the EU and the US and calls for more resources for higher education. It estimates that a total annual investment of some 2% of GDP in higher education (compared to 1.3% currently) as the minimum.
Methodological notes
Sources: Eurostat — European Union Labour Force Survey (EU-LFS) — standard questionnaire 2004 and ad hoc module 2003 on lifelong learning), Continuing Vocational and Training Survey (CVTS2 1999) and UOE (UNESCO, OECD and Eurostat) questionnaires on education statistics.
For the annual monitoring of progress towards lifelong learning for all the results from the standard LFS are used which refer to persons who had received education or training during the four weeks preceding the interview. Due to the implementation of harmonised concepts and definitions in the survey, information on lifelong learning notices some breaks of series for several countries.
EU Adult Education Survey (EU AES) has been developed between 2003 and 2005 and was implemented in EU countries in 2006 or 2007 The EU AES is expected to be repeated every 5 years, its target population are 25 to 64 year olds and the reference year is the 12 months.
The EU AES has been also drawn on the experience of the implementation of an ad hoc module on lifelong learning in the EU LFS in 2003. Results released in 2005 enhance information on participation of adult population (aged 25-64 years) in formal education and training as well as in non- formal education and training and informal learning. First global results on participation over the past year have been included in the present report.
The second survey of continuing vocational training in enterprises (CVTS2) was carried out in 2000/2001 in all the 15 old EU-25 Member States, Norway, seven new EU-25 Member States and two Candidate Countries.
Links to other parts of the report
Education and its outcomes (2.5), Employment (2.7), Unemployment (2.8), Education and training (Annex 1.3)
Further reading
• Education across Europe 2003, 2004, Eurostat.
• Key data on higher education in Europe — 2007 edition, 2007, DG Education and Culture, Eurostat and Eurydice (Information network on education in Europe). http://www.eurydice.org/ressources/eurydice/pdf/0_integral/088EN.pdf
• European Social Statistics — Continuing Vocational Training Survey (CVTS2) – Data 1999, Eurostat, 2002.
• Education at a glance 2006, 2006, OECD.

PART 2 | AREAS OF SOCIAL POLICY CONCERN: STATISTICAL PORTRAITS
123
• Statistics in Focus on education (Theme 3 — Population and social conditions), Eurostat:
– Education in Europe, Key statistics, 2002/2003, No 10/2005
– 17 million tertiary students in the EU, No 19/2005
– Lifelong learning in Europe, No 8/2005
• Statistics in Focus on finance of education (Theme 3 — Population and social conditions), Eurostat:
– Public expenditure on education in the EU-15 in 1999, No 22/2003- Public expenditure on education in the ACC countries in 1999, No 23/2003
– Spending on tertiary education in 2002, No 18/2005
• Statistics in focus on CVTS2 (Theme 3 — Population and social conditions), Eurostat:
– First survey on continuing vocational training in enterprises in candidate countries, No 2/2002.
– Continuing vocational training in enterprises in the European Union and Norway, No 3/2002.
– Costs and funding of continuing vocational training in enterprises in Europe, No 8/2002.
– Providers and fields of continuing vocational training in enterprises in Europe, No 10/2002.
– Disparities in access to continuing vocational training in enterprises in Europe, No 22/2002.
– Working time spent on continuing vocational training in enterprises in Europe, No 1/2003.
• Making a European Area of Lifelong Learning a Reality, COM(2001) 678 final of 21.11.2001.
• Education and training 2010. The success of the Lisbon strategy hinges on urgent reforms. European Commission.
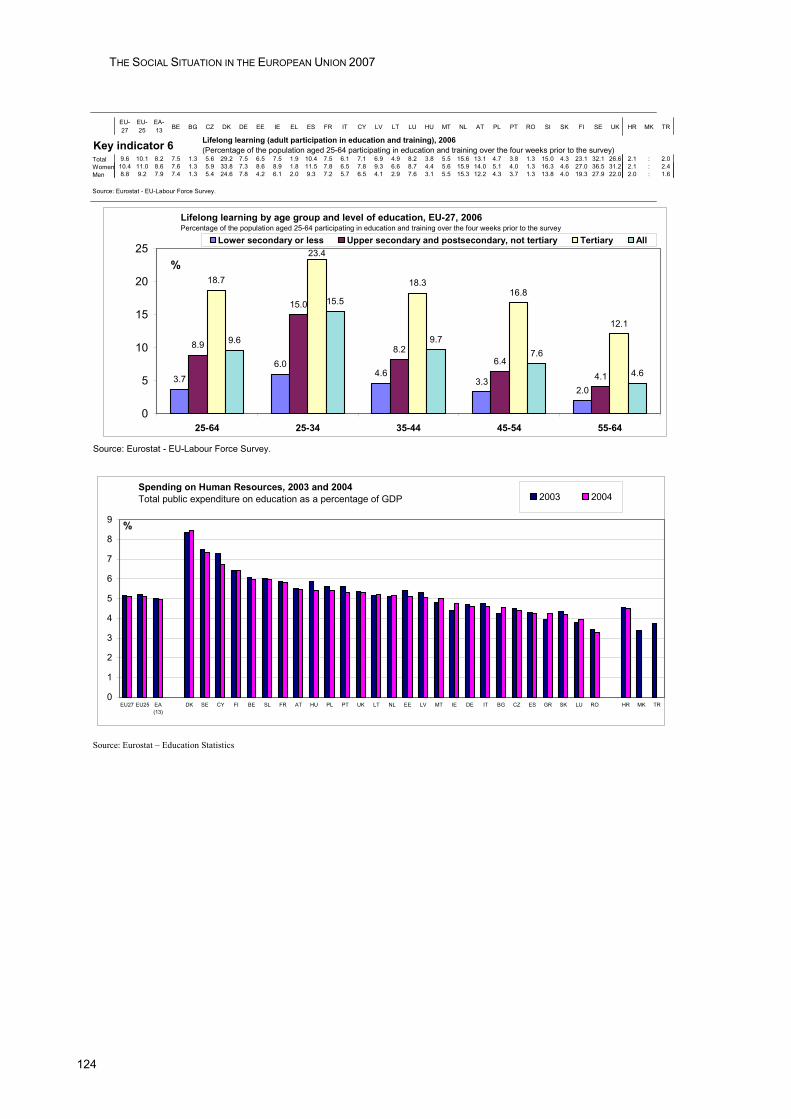
THE SOCIAL SITUATION IN THE EUROPEAN UNION 2007
124
EU-27
EU-25
EA-13 BE BG CZ DK DE EE IE EL ES FR IT CY LV LT LU HU MT NL AT PL PT RO SI SK FI SE UK HR MK TR
Key indicator 6Total 9.6 10.1 8.2 7.5 1.3 5.6 29.2 7.5 6.5 7.5 1.9 10.4 7.5 6.1 7.1 6.9 4.9 8.2 3.8 5.5 15.6 13.1 4.7 3.8 1.3 15.0 4.3 23.1 32.1 26.6 2.1 : 2.0Women 10.4 11.0 8.6 7.6 1.3 5.9 33.8 7.3 8.6 8.9 1.8 11.5 7.8 6.5 7.8 9.3 6.6 8.7 4.4 5.6 15.9 14.0 5.1 4.0 1.3 16.3 4.6 27.0 36.5 31.2 2.1 : 2.4Men 8.8 9.2 7.9 7.4 1.3 5.4 24.6 7.8 4.2 6.1 2.0 9.3 7.2 5.7 6.5 4.1 2.9 7.6 3.1 5.5 15.3 12.2 4.3 3.7 1.3 13.8 4.0 19.3 27.9 22.0 2.0 : 1.6
Source: Eurostat - EU-Labour Force Survey.
Source: Eurostat - EU-Labour Force Survey.
Source: Eurostat – Education Statistics
Lifelong learning (adult participation in education and training), 2006(Percentage of the population aged 25-64 participating in education and training over the four weeks prior to the survey)
Spending on Human Resources, 2003 and 2004 Total public expenditure on education as a percentage of GDP
0
1
2
3
4
5
6
7
8
9
EU27 EU25 EA(13)
DK SE CY FI BE SL FR AT HU PL PT UK LT NL EE LV MT IE DE IT BG CZ ES GR SK LU RO HR MK TR
%
2003 2004
Lifelong learning by age group and level of education, EU-27, 2006Percentage of the population aged 25-64 participating in education and training over the four weeks prior to the survey
3.7
6.04.6
3.32.0
8.9
15.0
8.26.4
4.1
18.7 18.316.8
12.1
9.6
15.5
9.77.6
4.6
23.4
0
5
10
15
20
25
25-64 25-34 35-44 45-54 55-64
%
Lower secondary or less Upper secondary and postsecondary, not tertiary Tertiary All

PART 2 | AREAS OF SOCIAL POLICY CONCERN: STATISTICAL PORTRAITS
125
7. EMPLOYMENT In 2006, employment growth of the EU-27 picked up to 1.6%, its highest level since 2000. After a rise of 0.9 point over 3 years from 2002 to 2005, average employment rate increased in 2006 by 1 percentage point, to reach 64.4%. The share of part-time employment and temporary contracts keep on rising in 2006.
Acceleration of employment growth in 2006
In 2006, about 219 million people were in employment in the Union of 27 Member States, a rise of 7 million since 2001. From 2001 to 2006, the largest increase in the number of persons in employment in absolute terms was in Spain (+ 2.9 million in five years), in Italy and in the United Kingdom (+ 1.3 million).
Employment growth has been accelerating since 2002 in the EU-27. Compared to the year before, employment increased by 1.6% in the Union in 2006, after +0.7% in 2004 and +0.9% in 2005. In 2006, employment growth was positive in all 27 Member States. In Estonia, Latvia, Ireland, Luxembourg, Spain and Poland, employment growth was 3% or more. In contrast, employment growth was less than 1% in Germany, France, Hungary; Malta Portugal, and United Kingdom. However Germany, Portugal and in particular the Netherlands, saw their employment grow again in 2006 after a bad performance in 2005.
EU total employment rate rose by 1 percentage point in 2006
In 2006, the employment rate for the population aged 15-64 ranged from 54.5% in Poland to 77.4% in Denmark. Denmark, the Netherlands, Austria, Sweden and United Kingdom have already reached the EU collective overall employment rate Lisbon target of 70% for 2010. In contrast, Bulgaria, Italy, Hungary, Mata, Poland, Romania and Slovakia showed employment rates below 60%.
Compared to the previous years, EU-27 average employment rate rose in 2006 by 1.0 percentage point to reach 64.4%, after a rise of 0.9 point from 2002 to 2005.
Positive trends in employment rate for women
In 2006, the employment rate of women in the Union stood at 57.2%, up by 1.0 percentage point in one year. It ranged from 34.9% in Malta to 73.4% in Denmark. Twelve Member States have already reached the EU collective female employment rate Lisbon target of more than 60% for 2010, but some of them are far from it: Greece, Italy, Malta and Poland had less than half of their women aged 15-64 in employment.
Slight decrease in the gender gap in employment
In 2006, the gender gap in employment rates in the Union went on narrowing, standing at 14.4 percentage points, compared to 14.6 in 2005 and 16.6 in 2001. This decrease of gender gap reflects a great rise in employment rate for women (from 54.3% in 2001 to 57.2% in 2006) as well as a slight increase for men (from 70.9% in 2001 to 71.6% in 2006). In Bulgaria, Denmark, Finland, the three Baltic countries, Slovenia and Sweden, the gender gap was less than 10 percentage points. In Malta, where the employment gender gap was the highest, the female employment rate was less than half of the male employment rate in 2006. In addition to the female employment rate being systematically lower than the male rate, many women work part-time.
Part-time work and temporary employment continued to rise
The share of part-time employment has increased from 16.2% in 2001 to 18.1% in 2006. In Belgium, Denmark, Germany, Austria, Sweden and the United Kingdom, more than 20% of employment, and in the Netherlands 46.2%, is part-time. At the other end of the scale, in Bulgaria, Hungary and Slovakia, part-time employment was less than 5%.
In the EU-27, 31.2% of women in employment were working part-time in 2006 against only 7.7% of men. Compared to one year before, the share of part-time employment rose by 0.3 percentage point both for women and men. Female part-time work is particularly prevalent in the Netherlands, where it accounts for almost three quarters of female employment, and in Germany (45.6%).
EU-wide, the share of temporary employment increased in 2006: 14.3% of the employees hold a limited duration contract, up by 0.4 percentage point in one year, and 1.9 percentage points from 2001. Unlike part-time work, the share of temporary employment shows no huge difference for men and women (14.9% for women, 13.9% for men).
THE SOCIAL SITUATION IN THE EUROPEAN UNION 2007
126
36.3% of young people (15-24 years old) and 43.5% of people aged 55-64 are employed in the EU
EU-wide 36.3% of the young people (aged 15-24) were employed in 2006, up by 0.4 percentage point a year earlier (33.3% of the young women and 39.3% of the young men) varying from 21.7% in Hungary to 66.2% in the Netherlands. However, since 2001 the youth employment rate has decreased by 1.2 percentage points. The differences between Member States and the decreasing trend may in part be explained by the proportion of people in this age group which remain in education.
EU-wide, 43.5% of the people around the retirement age (55-64 years) were in employment in 2006, an increase by 0.8 percentage points between 2005 and 2006, after an increase by 1.2 percentage points between 2005 and 2006. Denmark, Estonia, Ireland, Cyprus, Latvia, Portugal, Finland, Sweden and the United Kingdom have already reached the EU collective older people's employment rate Stockholm target of 50% by 2010. At the other end of the scale, less than 30% of older people are working in Poland.
In the EU-27, the employment rate of older people increased by 5.8 percentage points since 2001, considerably more than in the case of prime age adults. The employment rate of women aged 55-64 increased more than the male employment rate for this age group. Despite this trend, the rate for males (52.6%) remained higher than that of females (34.8%).
Looking at more detailed age groups: the employment rate of people aged 55-59 stood at 55.9% while it was 28.0% among those aged 60-64. Beyond the age of 65, the employment rate decreases sharply. In the EU-27, less than 5% of those aged 65 and over were in employment.
Exit from the labour force at the age of 60.9
In the EU-25, the average exit age from the labour force in 2005 was at the age 60.9. This exit age mirrors the trend of labour participation of older workers. In Ireland, Portugal, Romania, and Sweden, the average exit age reached 63 years or more. Men leave the labour force on average at the age of 61.4 while women do so about one year earlier.
Policy context
The Treaty of Amsterdam took an important step in committing the Union to a high level of employment as an explicit objective: 'The objective of a high level of employment shall be taken into consideration in the formulation and implementation of Community policies and activities' (Art.127(2)).
The Treaty states furthermore that 'the Community shall support and complement the activities of the Member States in … equality between men and women with regard to labour market opportunities and treatment at work.' (Art. 137).
The Lisbon European Council in March 2000 concluded that 'the employment rate is too low and is characterised by insufficient participation in the labour market by women and older workers'. The Lisbon European Council defined a strategic goal for the next decade 'to become the most competitive and dynamic knowledge-based economy in the world capable of sustainable economic growth with more and better jobs and greater social cohesion. (…) the overall aim should be to raise the employment rate to as close as possible to 70% by 2010 and to increase the number of women in employment to more than 60% by 2010'.
The Stockholm European Council in March 2001 agreed intermediate targets for employment rates (67% overall and 57% for women by 2005) and a target for employment participation of older workers by 2010 (50%).
The recent 2005-2008 Employment Guidelines (as a part of Integrated Guidelines) specify that Member States should implement policies aiming at achieving full employment, quality and productivity at work and social cohesion and inclusion (Guideline No 17).
Besides these overarching objectives, specific guidelines are agreed to attract and retain more people in employment, increase labour supply and modernize social protection systems.
In particular, Member States should promote a lifecycle approach (Guideline No 18) through a renewed endeavour to build employment pathways for young people and to reduce youth unemployment; resolute action to increase female participation and reduce gender gaps in employment, unemployment and pay; better reconciliation of work and private life and provision of accessible and affordable childcare facilities and care for other dependants; and support for active aging, including appropriate working conditions, improved (occupational) health status and adequate incentives to work and discouragement of early retirement; modern social protection systems.
Furthermore, Member States should improve matching of labour market needs (Guideline No 20) and improve adaptability of workers and enterprises, through promoting flexibility combined with employment security and reducing labour market segmentation (Guideline No 21) and ensuring employment-friendly labour cost developments and wage-setting mechanisms (Guideline No 22).
In the face of economic slowdown, the Spring Council invited the Commission to establish a European Employment Taskforce. Under the chairmanship of Wim Kok, the Taskforce reported to the Commission on practical reforms that can have the most direct and immediate impact on the Employment Strategy. The Report identified four key conditions for success: increasing adaptability of workers and enterprises; attracting
PART 2 | AREAS OF SOCIAL POLICY CONCERN: STATISTICAL PORTRAITS
127
more people to the labour market; investing more and more effectively in human capital; and ensuring effective implementation of reforms through better governance. The Brussels European Council of December 2003 invited the Commission and Council to consider the Taskforce's Report in the preparation of the 2004 Joint Employment Report.
Following the Mid-term review, the Commission presented a Communication on growth and jobs of February 2005 which proposed a new start for the Lisbon strategy refocusing efforts on two goals: delivering a stronger, lasting growth and more and better jobs. This included a complete revision of the EES governance so as to maximise the synergies and efficiency between national measures and Community action.
The Spring European Council on 22 and 23 March 2005 adopted the European Youth Pact (7619/1/05, conclusion 37 and Annex I). A part of this Pact is the sustained integration of young people into the labour market. The European Youth pact is discussed in the Commission communication of 30 May 2005 Addressing the concerns of young people in Europe – implementing the European Youth pact and promoting active citizenship (COM(2005) 206 final).
Methodological notes
Sources: Eurostat Annual Averages of Labour Force Data consist of employment by economic activity and status in employment, further broken down by sex and some job characteristics. They are based on the EU Labour Force Survey (LFS) and on the European System of National Accounts (ESA 95). All other data come from the EU Labour Force Survey (LFS).
Quarterly LFS data are available since the first quarter of 2005 in all EU countries, except Luxembourg. Data for France refer to metropolitan France (excluding overseas departments). French data for 2006 and German data for 2005 and 2006 are provisional.
Employment rates represent persons in employment aged 15-64 as a percentage of the population of the same age. Persons in employment are those who during the reference week (of the Labour Force Survey) did any work for pay or profit, including unpaid family workers, for at least one hour or were not working but had a job or a business from which they were temporarily absent. The classification by part-time or full-time job depends on a direct question in the LFS.
Links to other parts of the report
Education and its outcomes (2.5), Lifelong learning (2.6), Unemployment (2.8), Labour Market Policy expenditure (2.9) and Labour market (Annex 1.3.4).
Further reading
• Employment in Europe 2006, European Commission, Employment and Social Affairs DG.
• Data in focus (Population and social conditions), n° 5/2007 Labour market latest trends – 4th quarter 2004 data, Eurostat.
• Data in Focus (Population and social conditions) Theme 3, n° 14/2006 European Union Labour Force Survey- Annual Results 2006, Eurostat.
• Economic Policy Committee Key structural challenges in the acceding countries: the integration of the acceding countries into the Community’s economic policy co-ordination processes, European Commission, Economic and Financial Affairs DG, July 2003.
• Employment precarity, unemployment and social exclusion and Inclusion through participation, European Commission DG Research reports 2000.
• Increasing labour force participation and promoting active ageing Joint report from the Commission and the Council to the Barcelona Council, 2002
• Improving quality in work: a review of recent progress, COM (2003) 728 of 26.11.2003
• Statistics in Focus (Population and social conditions), n° 20/2006 The employment of seniors in the European Union, Eurostat.
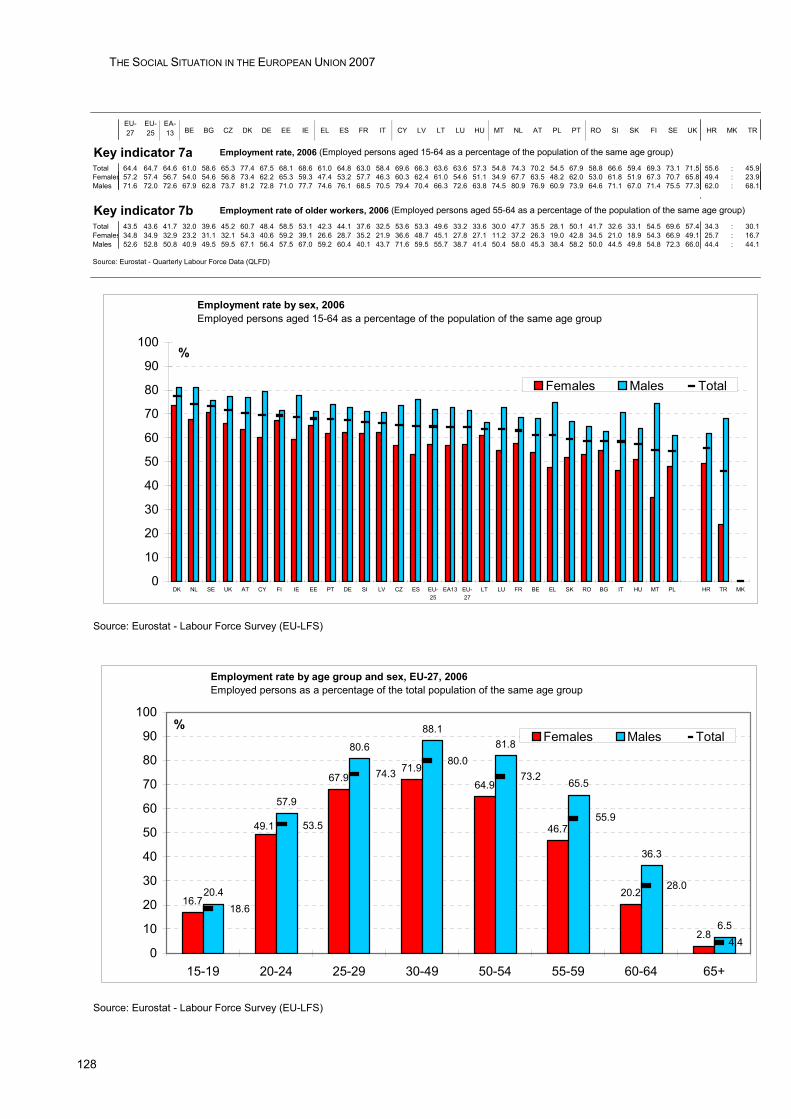
THE SOCIAL SITUATION IN THE EUROPEAN UNION 2007
128
EU-27
EU-25
EA-13 BE BG CZ DK DE EE IE EL ES FR IT CY LV LT LU HU MT NL AT PL PT RO SI SK FI SE UK HR MK TR
Key indicator 7a Employment rate, 2006 (Employed persons aged 15-64 as a percentage of the population of the same age group)
Total 64.4 64.7 64.6 61.0 58.6 65.3 77.4 67.5 68.1 68.6 61.0 64.8 63.0 58.4 69.6 66.3 63.6 63.6 57.3 54.8 74.3 70.2 54.5 67.9 58.8 66.6 59.4 69.3 73.1 71.5 55.6 : 45.9Females 57.2 57.4 56.7 54.0 54.6 56.8 73.4 62.2 65.3 59.3 47.4 53.2 57.7 46.3 60.3 62.4 61.0 54.6 51.1 34.9 67.7 63.5 48.2 62.0 53.0 61.8 51.9 67.3 70.7 65.8 49.4 : 23.9Males 71.6 72.0 72.6 67.9 62.8 73.7 81.2 72.8 71.0 77.7 74.6 76.1 68.5 70.5 79.4 70.4 66.3 72.6 63.8 74.5 80.9 76.9 60.9 73.9 64.6 71.1 67.0 71.4 75.5 77.3 62.0 : 68.1
Key indicator 7b Employment rate of older workers, 2006 (Employed persons aged 55-64 as a percentage of the population of the same age group)
Total 43.5 43.6 41.7 32.0 39.6 45.2 60.7 48.4 58.5 53.1 42.3 44.1 37.6 32.5 53.6 53.3 49.6 33.2 33.6 30.0 47.7 35.5 28.1 50.1 41.7 32.6 33.1 54.5 69.6 57.4 34.3 : 30.1Females 34.8 34.9 32.9 23.2 31.1 32.1 54.3 40.6 59.2 39.1 26.6 28.7 35.2 21.9 36.6 48.7 45.1 27.8 27.1 11.2 37.2 26.3 19.0 42.8 34.5 21.0 18.9 54.3 66.9 49.1 25.7 : 16.7Males 52.6 52.8 50.8 40.9 49.5 59.5 67.1 56.4 57.5 67.0 59.2 60.4 40.1 43.7 71.6 59.5 55.7 38.7 41.4 50.4 58.0 45.3 38.4 58.2 50.0 44.5 49.8 54.8 72.3 66.0 44.4 : 44.1
Source: Eurostat - Quarterly Labour Force Data (QLFD)
Source: Eurostat - Labour Force Survey (EU-LFS)
Source: Eurostat - Labour Force Survey (EU-LFS)
Employment rate by sex, 2006Employed persons aged 15-64 as a percentage of the population of the same age group
0
10
20
30
40
50
60
70
80
90
100
DK NL SE UK AT CY FI IE EE PT DE SI LV CZ ES EU-25
EA13 EU-27
LT LU FR BE EL SK RO BG IT HU MT PL HR TR MK
%
Females Males Total
Employment rate by age group and sex, EU-27, 2006Employed persons as a percentage of the total population of the same age group
16.7
67.971.9
64.9
46.7
20.2
2.8
20.4
57.9
80.6
88.181.8
65.5
36.3
6.5
49.1
4.4
28.0
55.9
73.280.0
74.3
53.5
18.6
0
10
20
30
40
50
60
70
80
90
100
15-19 20-24 25-29 30-49 50-54 55-59 60-64 65+
%Females Males Total
PART 2 | AREAS OF SOCIAL POLICY CONCERN: STATISTICAL PORTRAITS
129
8. UNEMPLOYMENT In 2006, the unemployment rate went down to 7.9% in the EU-27. Women remained more concerned than males by unemployment, although the gap has been narrowing.
EU-27 unemployment rate down in 2006
In 2006, the total number of unemployed people in the EU-27 stood at 18.4 million, leaving the unemployment rate (as a percentage of labour force) at 7.9%. Compared to 2005, the unemployment rate decreased by 0.8 point, after no change in 2005 and decrease of 0.3 percentage points in 2005. In 2006 the unemployment rate went down in all countries but Ireland, Luxembourg, Hungary, Malta, Portugal, Romania and the United Kingdom. In Denmark, Ireland, Cyprus, Luxembourg, the Netherlands, Austria, and the United Kingdom the unemployment rate remained below or around 5%. The unemployment rate was highest in Poland (13.8%) and in Slovakia (13.4%), despite remarkable decreases in a year by 3.9 and 2.9 percentage points, respectively.
Women more likely than men to be unemployed in most Member States
The female unemployment rate (8.8%) in the EU-27 remained higher than the male unemployment rate (7.2%) in 2006, although this gap has been on a declining trend. The unemployment rate for women is higher than that for men in most Member States, except Ireland, Estonia, Latvia, Lithuania, Romania, and the United Kingdom. The unemployment gender gap remained high above 3 percentage points in Greece, Italy and Spain.
Less people in long-term unemployment in 2006 compared to 2005
In 2006, 3.6% of the labour force in the EU-27 had been unemployed for at least one year. The long-term unemployment rate in the EU-27 decreased in 2006 by 0.4 point compared to 2005, the highest decrease since 2000. In Denmark and Cyprus, less than 1% of the labour force was affected. In contrast, 7.8% of the active population in Poland and 10.2% in Slovakia had been unemployed for at least one year. At close to 5% it also remains high in Germany, Greece and Bulgaria.
Women more affected than men by long-term unemployment
Unemployment among women remained much higher than for men. While women formed 45% of the EU-27 labour force, they accounted for half of the unemployed. In the EU-27, similar to overall unemployment rates, long-term unemployment was more prevalent among women than men (respectively 4.0% and 3.3%), with the largest gender differences being found in the Czech Republic, Spain, Italy, Poland, Slovakia, and, above all Greece.
High variations by country for the unemployment rate of young people
The unemployment rate among young people (15-24 years old) in the EU-27 was 17.5% varying from 6.6% in the Netherlands to 29.8% in Poland. Compared to 2005, it decreased by 0.9 percentage point. It went down from 18.6% in 2005 to 18% in 2006 for young women and from 16.4% to 15.2% for young men.
Policy context
The Luxembourg Jobs Summit in November 1997 observed that 'the encouraging growth results will not enable to make up for the job losses in the early ‘90s or to achieve the rate of employment growth needed to get most of the unemployed into work'. It concluded that a European Employment Strategy was needed in order to turn back the tide of unemployment.
The Lisbon European Council in March 2000 concluded that 'long-term structural unemployment and marked regional unemployment imbalances remain endemic in parts of the Union.' (Presidency conclusion No 4). Four key areas were identified as part of an active employment policy. One of these was 'improving employability and reducing skills gaps, in particular by … promoting special programmes to enable unemployed people to fill skill gaps'.
The recent 2005-2008 Employment Guidelines (as a part of Integrated Guidelines) continue stressing that Member States should implement policies aiming at achieving full employment, quality and productivity at work and social cohesion and inclusion (Guideline No 17).
Besides these overarching objectives, specific guidelines are agreed to attract and retain more people in employment, increase labour supply and modernize social protection systems.
In particular, Member States will promote a lifecycle approach (Guideline No 18) through a renewed endeavour to reduce youth unemployment; resolute action to reduce gender gaps in unemployment; and better reconciliation of work and private life.
Additionally, Member States should ensure inclusive labour markets, enhance work attractiveness, and make work pay for job seekers, including disadvantaged people and the inactive (Guideline No 19) through active and preventive labour market measures including early identification of needs, job search assistance, guidance and training, provision of necessary social services; continual review of incentives and disincentives from the tax and benefit systems; and development of new sources of jobs in services for individuals and businesses.
THE SOCIAL SITUATION IN THE EUROPEAN UNION 2007
130
Furthermore, Member States should increase investment in human capital through better education and skills. In particular, Member States should expand and improve investment in human capital (Guideline No 23) and adapt education and training systems in response to new competence requirements (Guideline No 24).
The Spring European Council on 22 and 23 March 2005 adopted the European Youth Pact (7619/1/05, conclusion 37 and Annex I). A part of this Pact is the sustained integration of young people into the labour market. The European Youth pact is discussed in the Commission communication of 30 May 2005 Addressing the concerns of young people in Europe – implementing the European Youth pact and promoting active citizenship (COM(2005) 206 final).
Methodological notes
Source: Eurostat – Harmonised unemployment rates and the European Union Labour Force Survey (LFS).
Unemployed people — according to the Commission Regulation n° 1897/2000 and International Labour Organisation (ILO) standards — are those persons aged 15-74 who i) are without work, ii) are available to start work within the next two weeks and iii) have actively sought employment at some time during the previous four weeks or have found a job to start later, i.e. within a period of at most 3 months. Unemployment rates represent unemployed persons as a percentage of the active population of the same age. The active population (or labour force) comprises employed and unemployed persons.
Links to other parts of the report
Education and its outcomes (2.5), Employment (2.7), Labour Market Policy expenditure (2.9) and Labour market (Annex 1.3.4).
Further reading
• Employment in Europe 2006, European Commission, Employment and Social Affairs DG.
• Data in Focus (Population and social conditions) Theme 3, n° 14/2006 European Union Labour Force Survey- Annual Results 2006, Eurostat.
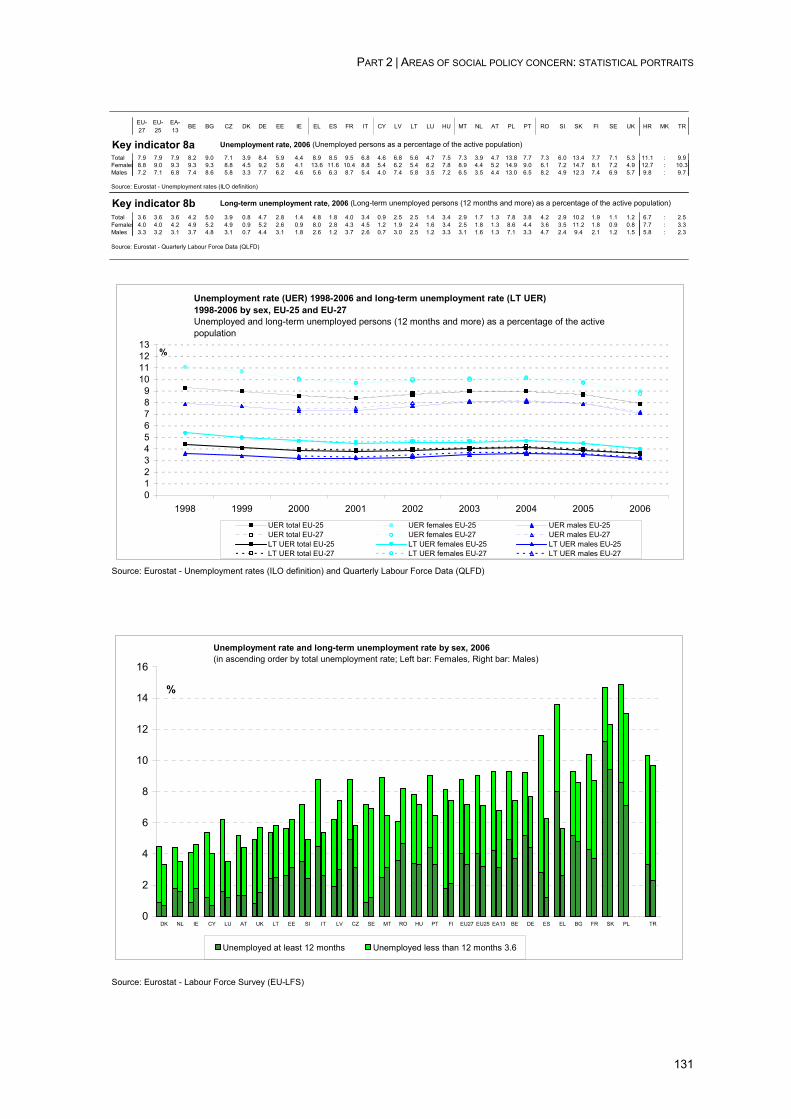
PART 2 | AREAS OF SOCIAL POLICY CONCERN: STATISTICAL PORTRAITS
131
EU-27
EU-25
EA-13
BE BG CZ DK DE EE IE EL ES FR IT CY LV LT LU HU MT NL AT PL PT RO SI SK FI SE UK HR MK TR
Key indicator 8a Unemployment rate, 2006 (Unemployed persons as a percentage of the active population)
Total 7.9 7.9 7.9 8.2 9.0 7.1 3.9 8.4 5.9 4.4 8.9 8.5 9.5 6.8 4.6 6.8 5.6 4.7 7.5 7.3 3.9 4.7 13.8 7.7 7.3 6.0 13.4 7.7 7.1 5.3 11.1 : 9.9Females 8.8 9.0 9.3 9.3 9.3 8.8 4.5 9.2 5.6 4.1 13.6 11.6 10.4 8.8 5.4 6.2 5.4 6.2 7.8 8.9 4.4 5.2 14.9 9.0 6.1 7.2 14.7 8.1 7.2 4.9 12.7 : 10.3Males 7.2 7.1 6.8 7.4 8.6 5.8 3.3 7.7 6.2 4.6 5.6 6.3 8.7 5.4 4.0 7.4 5.8 3.5 7.2 6.5 3.5 4.4 13.0 6.5 8.2 4.9 12.3 7.4 6.9 5.7 9.8 : 9.7
Source: Eurostat - Unemployment rates (ILO definition)
Key indicator 8b Long-term unemployment rate, 2006 (Long-term unemployed persons (12 months and more) as a percentage of the active population)
Total 3.6 3.6 3.6 4.2 5.0 3.9 0.8 4.7 2.8 1.4 4.8 1.8 4.0 3.4 0.9 2.5 2.5 1.4 3.4 2.9 1.7 1.3 7.8 3.8 4.2 2.9 10.2 1.9 1.1 1.2 6.7 : 2.5Females 4.0 4.0 4.2 4.9 5.2 4.9 0.9 5.2 2.6 0.9 8.0 2.8 4.3 4.5 1.2 1.9 2.4 1.6 3.4 2.5 1.8 1.3 8.6 4.4 3.6 3.5 11.2 1.8 0.9 0.8 7.7 : 3.3Males 3.3 3.2 3.1 3.7 4.8 3.1 0.7 4.4 3.1 1.8 2.6 1.2 3.7 2.6 0.7 3.0 2.5 1.2 3.3 3.1 1.6 1.3 7.1 3.3 4.7 2.4 9.4 2.1 1.2 1.5 5.8 : 2.3
Source: Eurostat - Quarterly Labour Force Data (QLFD)
Source: Eurostat - Unemployment rates (ILO definition) and Quarterly Labour Force Data (QLFD)
Source: Eurostat - Labour Force Survey (EU-LFS)
Unemployment rate (UER) 1998-2006 and long-term unemployment rate (LT UER) 1998-2006 by sex, EU-25 and EU-27 Unemployed and long-term unemployed persons (12 months and more) as a percentage of the active population
0123456789
10111213
1998 1999 2000 2001 2002 2003 2004 2005 2006
%
UER total EU-25 UER females EU-25 UER males EU-25UER total EU-27 UER females EU-27 UER males EU-27LT UER total EU-25 LT UER females EU-25 LT UER males EU-25LT UER total EU-27 LT UER females EU-27 LT UER males EU-27
Unemployment rate and long-term unemployment rate by sex, 2006(in ascending order by total unemployment rate; Left bar: Females, Right bar: Males)
0
2
4
6
8
10
12
14
16
DK NL IE CY LU AT UK LT EE SI IT LV CZ SE MT RO HU PT FI EU27 EU25 EA13 BE DE ES EL BG FR SK PL TR
%
Unemployed at least 12 months Unemployed less than 12 months 3.6
THE SOCIAL SITUATION IN THE EUROPEAN UNION 2007
132
9. LABOUR MARKET POLICY EXPENDITURE In 2005, Labour Market Policy (LMP) expenditure accounted for 2.2% of GDP on average among the fourteen countries that provided data within EU-15. Expenditure on LMP measures (or Active Labour Market Policies) amounted to 0.55% (0.52% for the EU-27), expenditure on labour market supports (essentially unemployment benefits) to 1.41% (1.36% for the EU-27), and expenditure in labour market policy services (Public Employment Services, PES) to 0.24%. Figures for 2005 confirm the existence of considerable heterogeneity across Member States: LMP expenditure ranged from 4.1% in Denmark to 0.2% in Estonia. This variation is linked to the extent of non-targeted support in some countries (i.e. policies which do not target exclusively unemployed and other groups with weak labour market attachment and, for this reason, are not included in the coverage of the LMP data collection).
Targeted policies
Labour market policies are by definition restricted in scope and only cover those interventions which are targeted to the unemployed and other groups with particular difficulties in entering or remaining in the labour market. Primary target groups in all countries (with the exception of Italy) are the unemployed who are registered with the public employment services. However, the size and structure of expenditure on LMP are not exclusively driven by the political commitment to combat unemployment. Other factors, such as the demographic situation and the income level, may affect cross-country variation.
Expenditure on services, measures and supports
The LMP database distinguishes three main types of intervention which are broken down into nine different categories by type of action.
LMP services (category 1) covers ad hoc information services and more formalised programmes of individual assistance to jobseekers, together with all other activities of the PES not specifically covered in other categories. Note that the functions undertaken by the PES vary between countries and this is reflected in expenditure differentials. In 2005, expenditure on LMP services accounted for just over 25 billion euro amongst the EU-15 countries – 11% of total LMP expenditure.
LMP measures (categories 2-7) cover targeted programmes such as training, job rotation/job-sharing, employment incentives, supported employment and rehabilitation, direct job creation and start-up incentives. These are commonly referred to as 'active' expenditures. However, it should be taken into account that the distinction between active and passive (i.e. unemployment benefits) measures is increasingly blurred by the tendency to establish closer links between eligibility to the latter and participation to the former, in the form of individualised job-search assistance and early intervention by the public employment service. This move reflects the increasing attention to the notion of flexicurity (see below) in the setting of labour market policies. In the EU-15 countries, expenditure on LMP measures has fallen from a peak of 69 billion euro in 2002 to 56 billion in 2005, just under 25% of the total expenditure on LMP.
LMP supports (categories 8-9) cover expenditure on out-of-work income maintenance (mostly unemployment benefits) and on early retirement and account for the largest share of LMP expenditure – on average 64% of the total in the EU-15, in 2005.
Distribution of expenditure on LMP measures by type of action
Concerning the 'ranking' of the categories in 2005, expenditure is highest on training programmes, as in previous years, accounting for 39.0% of expenditure on active measures. However, 'Direct job creation' which was in 2002 the second most important category, accounts in 2005 for only 13.8% of total expenditures on active measures, much less than expenditure on employment incentives (23.9%, which includes not only subsidies but also reduction in taxes and social contributions to employers). Expenditure in the integration of the disabled increased significantly, reaching 16.6% of the total. This increase is even more striking in view of the fact that most countries also undertake general employment measures which partly go to the benefit of disabled people. Start-up incentives represent nearly 6% of active expenditures, which also implies a sizable increase with respect to 1998 (2.2%). Job rotation/job sharing remains the smallest category in terms of expenditure, accounting for only 0.6% the total.
Policy context
The LMP data collection was developed as an instrument to monitor the evolution of targeted employment policies across the EU, following on the 'Jobs Summit' held in Luxembourg in November 1997, which had launched the European Employment Strategy. More recently, the notion of flexicurity has come to the forefront of the EU employment agenda (see COM 2007(359)), specifically including the provision of effective Active and Passive Labour Market Policies among the key instruments aimed at reconciling flexibility and security in the EU labour markets. The LMP database has been developed over the past years by Eurostat in close co-operation with DG Employment and Social Affairs, the EU-15 Member States and Norway, as well as the OECD. In 2005 the project has been extended to all New Member States as well as to Candidate Countries. Additionally, an agreement for a joint data collection has been concluded with the OECD, coming into effect with the 2004 wave of LMP data (launched in June 2005). Data for all New Member States and EU27 should be available as of 2008.
PART 2 | AREAS OF SOCIAL POLICY CONCERN: STATISTICAL PORTRAITS
133
Methodological notes
The scope of the LMP database refers to Public interventions in the labour market aimed at reaching its efficient functioning and to correct disequilibria and which can be distinguished from other general employment policy measures in that they act selectively to favour particular groups in the labour market.
The classification categories by type of action referred to in the graphs presented in this article include:
LMP services — category 1:
1 – Labour Market Services: all services and activities undertaken by the PES (Public Employment Services) together with services provided by other public agencies or any other bodies contracted under public finance, which facilitate the integration of the unemployed and other jobseekers in the labour market or which assist employers in recruiting and selecting staff.
LMP measures — categories 2-7:
2 - Training: measures that aim to improve the employability of LMP target groups through training, and which are financed by public bodies. All training measures should include some evidence of classroom teaching, or if in the workplace, supervision specifically for the purpose of instruction.
3 - Job rotation and job sharing: measures that facilitate the insertion of an unemployed person or a person from another target group into a work placement by substituting hours worked by an existing employee.
4 - Employment incentives: measures that facilitate the recruitment of unemployed persons and other target groups, or help to ensure the continued employment of persons at risk of involuntary job loss. Employment incentives refer to subsidies for open market jobs where the public money represents a contribution to the labour costs of the person employed and, typically, the majority of the labour costs are still covered by the employer.
5 - Supported employment and rehabilitation: measures that aim to promote the labour market integration of persons with reduced working capacity through supported employment and rehabilitation.
6 - Direct job creation: measures that create additional jobs, usually of community benefit or socially useful, in order to find employment for the long-term unemployed or persons otherwise difficult to place. Direct job creation refers to subsidies for temporary, non-market jobs which would not exist or be created without public intervention and where the majority of the labour cost is normally covered by the public finance.
7 - Start-up incentives: Programmes that promote entrepreneurship by encouraging the unemployed and target groups to start their own business or to become self-employed.
LMP supports - categories 8-9:
8 - Out-of-work income maintenance: Programmes which aim to compensate individuals for loss of wage or salary through the provision of cash benefits when:
• A person is capable of working and available for work but is unable to find suitable employment.
• A person is on lay-off or enforced short-time work or is otherwise temporarily idle for economic or other reasons (including seasonal effects).
• A person has lost his/her job due to restructuring or similar (redundancy compensation).
9 - Early retirement: Programmes which facilitate the full or partial early retirement of older workers who are assumed to have little chance of finding a job or whose retirement facilitates the placement of an unemployed person or a person from another target group.
Links to other parts of the report
Unemployment (2.8), Social benefits (2.11) and Social protection (Annex 1.3.5)
Further reading
• Labour Market Policy Database — Methodology, Revision of June 2006 — Eurostat methodologies and working Papers
• Labour Market Policy Seminar of October 2006, Eurostat methodologies and working papers
• European Social Statistics — Labour Market Policy — Expenditure and Participants — Data 1998 — Detailed Tables. Eurostat.
• European Social Statistics — Labour Market Policy — Expenditure and Participants — Data 1999 — Detailed Tables. Eurostat.
• European Social Statistics — Labour Market Policy — Expenditure and Participants — Data 2000 — Detailed Tables. Eurostat.
• European Social Statistics — Labour Market Policy — Expenditure and Participants — Data 2001 — Detailed Tables. Eurostat.

THE SOCIAL SITUATION IN THE EUROPEAN UNION 2007
134
• European Social Statistics — Labour Market Policy — Expenditure and Participants — Data 2002 — Detailed Tables. Eurostat.
• European Social Statistics — Labour Market Policy — Expenditure and Participants — Data 2003 — Detailed Tables. Eurostat
• European Social Statistics — Labour Market Policy — Expenditure and Participants — Data 2004 — Detailed Tables. Eurostat
• European Social Statistics — Labour Market Policy — Expenditure and Participants — Data 2005 — Statistical book
• Men and women participating in Labour Market Policies, 2004, Statistics in focus 66/2007
• Expenditure on Labour Market Policies in 2004, Statistics in focus 12/2006
• Employment in Europe 2006 report – chapter 2 (flexicurity) and chapter 3 (active labour market policies).
EU-27 EU-15 BE BG CZ DK DE EE IE EL ES FR IT CY LV LT LU HU MT NL AT PL PT RO SI SK FI SE UK HR MK TR
Key indicator 9 Public expenditure on LMP measures (categories 2-7) as a percentage of GDP, 20050.5255 0.5444 0.8522 0.4315 0.1221 1.4327 0.6162 0.047 0.4807 0.0611 0.5826 0.6641 0.4605 : 0.1483 0.1475 : 0.197 : 0.8524 0.458 0.3593 0.517 0.1076 0.1958 0.1701518 0.7113 1.0973 0.1156 : : :
Source: Eurostat - Labour Market Policy Database (LMP)
Notes: 1) No data for CY, MT
2) Estimates for EU-27, EU-15, BE, DK, DE, IE, EL, ES, FR, HU, NL, AT, PT, FI, SE, UK. Source: Eurostat - Labour Market Policy Database (LMP)
3) LU, PL, SI, EU-27: Expenditure data on category 1 is not available.
Source: Eurostat - Labour Market Policy Database (LMP)
Notes:Category 1: Labour Market Services. Categories 2-7: Training - Job rotation and job sharing - Employment incentives - Supported employment and rehabilitation - Direct job creation - Start-up incentives. Categories 8-9: Out of work income maintenance and support - Early retirement. Estimates for EU-27, EU-15, BE, DK, DE, IE, EL, FR, NL, AT, PT, FI, UK
Public expenditure on LMP measures as a percentage of GDP, 2005
0.0
0.5
1.0
1.5
2.0
2.5
3.0
3.5
4.0
4.5
EU-27 BG DK EE EL FR CY LT HU NL PL RO SK SE
%
LMP services (category 1)
LMP measures (2-7)
LMP supports (8-9)
Labour Market Policy expenditure by type of action (categories 2-7), EU-27, 2005
Training 38.6%
Job rotation and job sharing
0.6%Employment incentives
23.8%
Supported employment and
rehabilitation16.9%
Direct job creation14.0%
Start-up incentives
6.1%
PART 2 | AREAS OF SOCIAL POLICY CONCERN: STATISTICAL PORTRAITS
135
10. SOCIAL PROTECTION EXPENDITURE AND RECEIPTS There are considerable differences between Member States for the expenditure as a percentage of GDP and even more in terms of per-capita PPSs. Different countries have markedly different systems for financing social protection, depending on whether they favour social security contributions or general government contributions.
The weight of social protection expenditure as a percentage of GDP in the European Union shows major disparities between Member States
In 2004 the EU-25 countries devoted on average 27.3% of their GDP to social protection gross (see methodological notes in portrait 11 'Social benefits') expenditure. In the same year this percentage was higher (27.7%) for the aggregate EA-1363, including this area five out of the seven EU countries having ratios above the average (Belgium, Germany, France, the Netherlands and Austria and, out of EA, Sweden and Denmark all had percentages between 28.5% and 33%) and excluding the countries occupying the lowest positions in ranked EU figures; those last are the Baltic countries devoting to the social protection a part of their GDP that is less than half as much as done by the countries with the highest ratios: Latvia with 12.6%, Lithuania with 13.3% and Estonia with 13.4%.
For EU-25, the value of social protection expenditure as a percentage of GDP in 2004 represented a stop after 4 years, dating back at 2000, of an increasing pattern. For the time series of the ratio concerning EA-13 a roughly parallel increasing movement over the period 2002-2004 (in countertendency with the downwards pattern between 1996 and 2000). These pattern are the result of the combined evolutions of social protection expenditures and GDP, so that the resulting percentages were affected by the gradual contraction in the growth rate of GDP registered between 2000 and 2003 and its new upwards movement in 2004.
From a country-specific perspective, there are differences within EU member states and exceptions to this general situation that have to be taken into account. The general performance in 2004, characterized all through EU by larger GDP's growth rates than in the previous year, was particularly affecting the share of social protection expenditure in those countries where the GDP growth was quite strong: Czech Republic, Cyprus, Latvia, Hungary, Poland and Slovakia registered between 2003 and 2004 a reduction of the ratio.
Between the European countries for which longer time series are available, the patterns of social protection expenditure as a percentage of GDP showed wide disparities. For the majority of these countries (BE, DK, IE, ES, FR, LU, MT, NL, FI, SE and UK) the period 2000-2001 was the turning point, ending the decline characterizing the data since 1995-1996. The tendency was opposite, even if over a shorter period, in Slovakia, Latvia and Lithuania, which showed an increasing pattern before 2000 followed by a contraction along the subsequent five years. Just an increasing tendency characterized almost steadily all the years of the series in Slovenia (until 2002), Czech Republic (until 2003) and Portugal (until 2004). There was a less regular the tendency in the remaining countries.
The increase of the ratio between 2000 and 2004 was marked in Malta (2.5 percentage points), Luxembourg (3 percentage points) and Portugal (3.2 percentage points), with an overall growth over the period levelled off at 15% and, even more, at 20%, in Ireland (2.9 percentage points) and Cyprus (3 percentage points); the fall in Latvia and Slovakia led to loosing between a 10-18% of their ratio value with a reduction between 2.1 and 2.7 in terms of percentage points. It is worth noting that often these changes in the ratio can, to a large extent, be related to strong changes in the speed of growth of GDP: for the five years considered, this is the case of Ireland, Luxembourg and Malta, on one hand, and, in Latvia on the other.
Cross-country differences are more marked when expenditure is expressed in PPS per head of population
When expressing the expenditure on social protection in terms of per capita PPSs (purchasing power standards), a different picture is obtained with respect to the previous analysis (expenditure as percentage of GDP) in the extent the 'distance' between countries is somewhat more pronounced. The 2004 value for expenditure was set at 6188 for the EU-25 countries, and at 6877 for the EA-13.
Luxembourg64 gains positions with respect to the previous analysis and, with a value (12180 PPS per capita) roughly as twice as the average for EU-25, clearly cut off all the other countries with high ranks, Sweden and Denmark (extra EA-13) in the first place. At the other extreme, again, the Baltic countries, whose values were around one fourth than EU-25’s. The disparities between countries are partly related to differing levels of wealth and also reflect differences in social protection systems, demographic trends, unemployment rates and other social, institutional and economic factors.
63 EA-13: All through the text what indicated as EA-13 refers to EA-12; data for Slovenia are not available. 64 Luxembourg is a special case insofar as a significant proportion of benefits (primarily expenditure on health care,
pensions and family benefits) are paid to persons living outside the country; if this particular feature is left out of the calculation, expenditure falls to approximately 10200 PPS per capita.
THE SOCIAL SITUATION IN THE EUROPEAN UNION 2007
136
Two patterns of funding social protection
In 2004, the main sources of financing for social protection at EU-25 level were the social contributions, representing 59.5% of all receipts; of the two flows composing social contribution the wider contribute was derived from the employer’s contributions (38.6%); the remaining one, determined by contributions originating from protected persons65 (20.9%), ranked as the third financing source, following general government contributions (37.3%), i.e. contributions derived from taxes. The incidence of social contributions rose to 63% for the countries in EA-13. Comparing the years 2000 and 2004 (see annex 1.3), the funding share between the above mentioned categories is quite steady for both the aggregates.
The structure of funding is, rather, widely varying between countries, depending strongly on country-specific rules and on the institutional reasoning behind social protection systems ('Beveridgian' or 'Bismarckian' tradition). Countries like the Czech Republic, Estonia and Belgium were characterized by higher social contributions (more than 70%). Conversely, Denmark’s and Ireland’s systems relied for the 60% of their total receipts on government funding; Cyprus, the United Kingdom and Sweden followed with a taxes-related financing set over 45%.
General government contributions taking over from social contributions
The proportion of general government contributions in total funding rose between 2000 and 2004 by 1.9 percentage points for EU-25 and by 2.1 for EA-13.
Most of the time, the evolution in the share accounted for by general government is the result of a decline in social contributions. On average, the largest changes (as absolute value) within the social contribution interested the share accounted for by protected persons in EU-25 and, rather, that by employers’ social contribution in EA-13.
In these five years Cyprus, the Netherlands, United Kingdom, Latvia and Portugal's general government contributions increased by more than 3 percentage points while in the Czech Republic, Luxembourg and Slovakia their share in total receipts fell substantially.
For a few countries there were over the period 2000-2004 significant evolutions concerning both the components of social contribution. Along these five years, the Czech Republic raised both the components (altogether 5.4 percentage points), while, on the contrary, in Portugal there was a contraction of the two (altogether -5.5 percentage points); a compensation, rather, took place in Hungary (employers’ -4.2, protected persons +3.4) and, with opposite direction, in the Netherlands (employers’ +4.6, protected persons -3.4).
For information on the structure of expenditure on social benefits, see next portrait.
Policy context
The EC Treaty (Article2) states that 'the Community shall have as its task … to promote throughout the Community … a high level of … social protection'.
The Lisbon European Council of March 2000 attached great importance to the role of social protection systems in the achievement of the overall strategic objective it established. It set out the objective that the European social model, with its developed systems of social protection, must underpin the transformation to the knowledge economy. It went on to state that these systems need to be adapted as part of an active welfare state to ensure that work pays, to secure their long-term sustainability in the face of an ageing population, to promote social inclusion and gender equality, and to provide quality health services.
Subsequent European Councils, in particular Stockholm, Gothenburg and Laeken, decided to apply the Open Method of Coordination in specific sectors of social protection, in the field of pensions and health and long term care. Besides, the Commission presented its point of view on strengthening the social dimension of the Lisbon strategy by streamlining the open method of coordination in the field of social protection (COM(2003) 261 final).
The 2005 Communication providing contribution to the Hampton Court summit highlights that the responsibility for determining most aspects of financing of social protection remains firmly with Member States, but it that is highly relevant to enhance exchanges and mutual knowledge on how Member States adapt to the various pressures that their social protection systems are facing. The 2005 Commission working document, Sustainable Financing of Social Policies in the European Union (SEC (2005) 1774), states that 'it is clear that financing arrangements are critical to ensuring that social policies contribute to growth and employment while preserving overall budgetary sustainability'.
Methodological notes
Source: Eurostat — European System of integrated Social Protection Statistics (ESSPROS).
Social protection encompasses all interventions from public or private bodies intended to relieve households and individuals of the burden of a defined set of risks or needs, provided that there is neither a simultaneous reciprocal nor an individual arrangement involved. The risks or needs that may give rise to social protection
65 Employees, self-employed, pensioners and other persons.
PART 2 | AREAS OF SOCIAL POLICY CONCERN: STATISTICAL PORTRAITS
137
are classified by convention under eight 'social protection functions'. See Social benefits (2.11). Excluded are all insurance policies taken out on the private initiative of individuals or households solely in their own interest.
The 2004 data are provisional for CZ, DE, ES, FR, IT, LV, LT, NL, PL, PT, RO, SI, SK, SE and UK. The 2004 data for EU-25 are estimates.
The GDP, PPS and population data were extracted in November 2006. This might explain any differences from national publications.
Purchasing Power Parities (PPPs) convert every national monetary unit into a common reference unit, the purchasing power standard (PPS), of which every unit can buy the same amount of consumer goods and services across the Member States in a given year.
Links to other parts of the report
Labour Market Policy expenditure (2.9), Social benefits (2.11), Income distribution (2.12) and Social protection (Annex 1.3.5).
Further reading
• Methodology: ESSPROS Manual 1996, Eurostat.
• European Social Statistics — Social protection — Expenditure and receipts 1996-2004, 2007, Eurostat.
• Statistics in Focus (Population and social conditions): Social Protection in the European Union, No 99/2007, Eurostat.
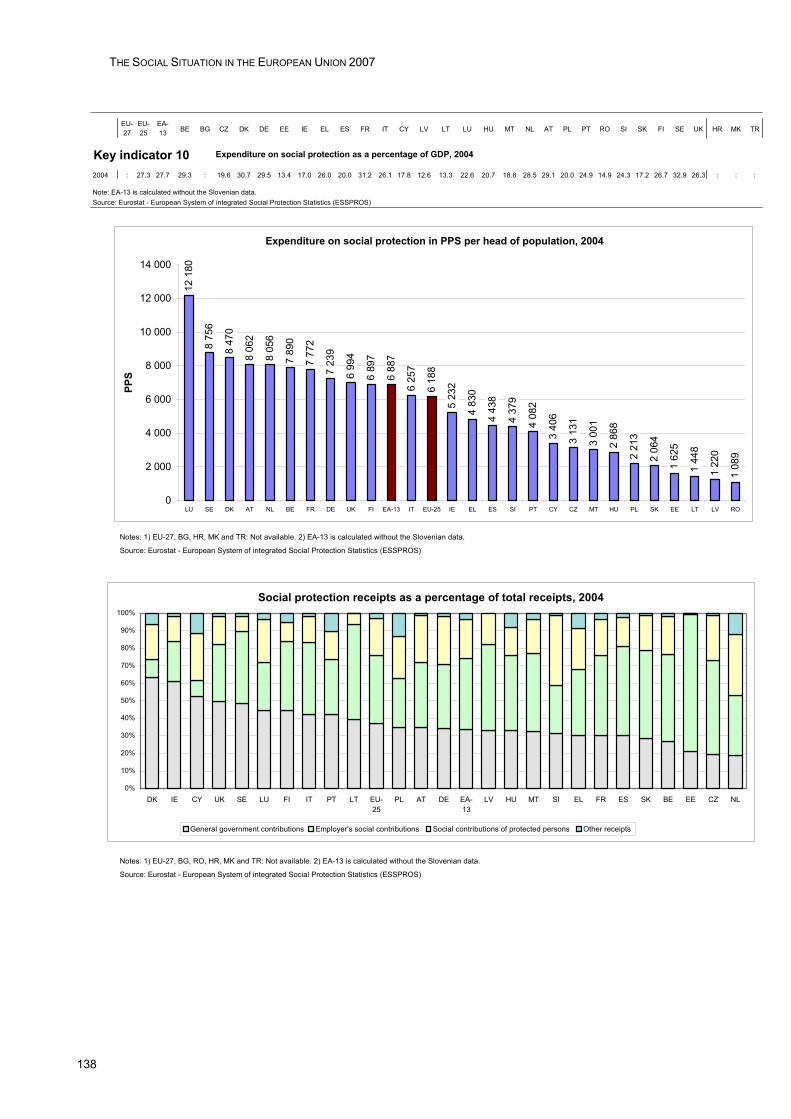
THE SOCIAL SITUATION IN THE EUROPEAN UNION 2007
138
EU-27
EU-25
EA-13 BE BG CZ DK DE EE IE EL ES FR IT CY LV LT LU HU MT NL AT PL PT RO SI SK FI SE UK HR MK TR
Key indicator 102004 : 27.3 27.7 29.3 : 19.6 30.7 29.5 13.4 17.0 26.0 20.0 31.2 26.1 17.8 12.6 13.3 22.6 20.7 18.8 28.5 29.1 20.0 24.9 14.9 24.3 17.2 26.7 32.9 26.3 : : :
Note: EA-13 is calculated without the Slovenian data.Source: Eurostat - European System of integrated Social Protection Statistics (ESSPROS)
Notes: 1) EU-27, BG, HR, MK and TR: Not available. 2) EA-13 is calculated without the Slovenian data.
Source: Eurostat - European System of integrated Social Protection Statistics (ESSPROS)
Notes: 1) EU-27, BG, RO, HR, MK and TR: Not available. 2) EA-13 is calculated without the Slovenian data.
Source: Eurostat - European System of integrated Social Protection Statistics (ESSPROS)
Expenditure on social protection as a percentage of GDP, 2004
Expenditure on social protection in PPS per head of population, 2004
12 1
80
8 75
6
8 47
0
8 06
2
8 05
6
7 89
0
7 77
2
7 23
9
6 99
4
6 89
7
6 88
7
6 25
7
6 18
8
5 23
2
4 83
0
4 43
8
4 37
9
4 08
2
3 40
6
3 13
1
3 00
1
2 86
8
2 21
3
2 06
4
1 62
5
1 44
8
1 22
0
1 08
9
0
2 000
4 000
6 000
8 000
10 000
12 000
14 000
LU SE DK AT NL BE FR DE UK FI EA-13 IT EU-25 IE EL ES SI PT CY CZ MT HU PL SK EE LT LV RO
PPS
Social protection receipts as a percentage of total receipts, 2004
0%
10%
20%
30%
40%
50%
60%
70%
80%
90%
100%
DK IE CY UK SE LU FI IT PT LT EU-25
PL AT DE EA-13
LV HU MT SI EL FR ES SK BE EE CZ NL
General government contributions Employer's social contributions Social contributions of protected persons Other receipts
PART 2 | AREAS OF SOCIAL POLICY CONCERN: STATISTICAL PORTRAITS
139
11. SOCIAL BENEFITS In most Member States the largest share of social protection expenditure was assigned to the old age and survivors functions, followed by the sickness and health care function. The other functions accounted for less than 30% of the total.
Social benefits are for social protection schemes the most considerable part of expenditure. In 2004 out of the total EU-25 expenditure on social protection, social benefits accounted for 96.2%, administration costs 3.1% and other expenditure 0.7%.
The old age and survivors functions account for the major part of benefits
Among the risks covered by social protection benefits, 'old-age' and 'survivors'' received in EU-25 the largest part of expenditure: 45.9% of total benefits (12.0% of GDP). Countries in EA-1366 performed on average quite closely (46.5% of total benefits and 12.3% of GDP) to the EU globally considered; the time tendency in the period 2000-2004 for both the aggregates was a slow decline.
Differences in countries' distributions for this category of benefits should be read in parallel with the most important contributory factor: the age composition of the population. In Italy67, historically (see the time series back to 1995), the benefits linked to old age and survivors' functions reach the highest levels in EU: in 2004 they accounted for 61.3% of the total expenditure for benefits and for the highest level (15.4%) as a percentage of GDP (in January 2004, 25.1% of the population aged 60 or over, while in EU-25 the percentage was 21.7%); nevertheless, the tendency for the share in the last 5 years was downwards. In Poland the increasing tendency since 2000 brought the share of old age and survivors' benefits to end up in 2004 as the second highest value in EU (60.1% of all benefits). Malta (51.2%), Greece (50.9%) and Latvia (50.0%) were also set fairly above the European average. Ireland68, with an age distribution stronger for young people than the European one (in January 2004, 28.4% of the population aged 20 or less while in EU-25 the percentage was 22.6%) and an incidence for those over 60 of the 15.2%, is in 2004 the country set to the lowest level in EU for benefits related to old age and survivors' not only in terms of the total expenditure for benefits but also in terms of GDP (3.8%) ;in addition, less and less expenditure in time were addressed to age-related benefits (from 26.5% of total benefits in 1995 to 23.3% in 2004).
Analyzing the situation back in time to the first year available from 1995 onwards for the remaining countries, the share of the functions old age and survivor’s developed differently in direction and speed through the Member States, with the strongest relative increases in Portugal, Finland and the Netherlands, and an important decline in Luxembourg.
Sickness and health care benefits gained importance in most of the countries with respect to the other functions
In 2004, the expenditure for sickness/health care made up, both in EU-25 and EA-13, a percentage slightly greater than 28% of all benefits (respectively 7.4% and 7.5% of the GDP). For both the aggregates, such values were the result of an increasing tendency, which for the EA-13 started back in 1996.
This class of benefits was the one with the highest relative importance in Ireland (42.1% of total benefits and 6.9% of GDP), with an increase from 1995 to 2004 of 5.9 percentage points. The Czech Republic spent on sickness/health care more than one third of its 2004 expenditure for benefits (and 6.7% of the GDP) but still, in spite of the increasing tendency started in 2000, the level was 1.9 percentage points below that recorded in 1995. The lowest shares were in Poland (19.5 %) and Denmark (20.6 %). In Denmark this share, however, slowly increasing in time, corresponded in 2004 to 6.1% of its GDP, far apart from the 3.8% recorded in Poland.
The measures to cope with health needs absorbed less than 4 % of GDP in Lithuania, Poland and Latvia, although in Latvia the increase of the share in terms of the overall benefits’ expenditure was more sustained (6.5 percentage points from 1997). The share of sickness and health care benefits of GDP was highest in France (8.8%), the Netherlands (8.1%) and Sweden (8.0 %).
The share of sickness and health care expenditure as a percentage of the expenditure for all the benefits was increasing in most countries during 1995-2004, especially in the United Kingdom, Finland and Sweden. The most important exceptions were Portugal and Germany, where the share decreased by 12 % and 16 %, respectively.
Differing pattern for the other social benefits
At an overall level, the third type of benefits for relative importance was the one including measures covering against the burden of disability (8.1% of total benefits, 2.1% of GDP). In the area EA-13 this percentage went down to the 7.3% (1.9%). If on one hand, the share of disability expenditure was pretty much higher than the
66 EA-13: All through the text what indicated as EA-13 refers to EA-12; data for Slovenia are not available. 67 In Italy such benefits also include severance allowances (TFR-trattamento di fine rapporto), which partly come under
unemployment expenditure. These benefits add up to some 4.1% of total social benefits. 68 For Ireland no data are available on (funded) occupational pension schemes for private-sector employees (by an
estimate for 2004 missing amount was about 1.3% of GDP).
THE SOCIAL SITUATION IN THE EUROPEAN UNION 2007
140
average in countries like Sweden (14.8%), Denmark (13.9%), Luxembourg69 (13.5%) and Finland (13.2%), on the other, it stood quite below the European level in Cyprus, Greece, Ireland and France (all less than 6%).
Nearly the same relative importance as the previous function characterizes in EU-25 the function family/children. The share of 7.8% in terms of total expenditure for benefits (2.1% of GDP) is close but smaller than the portion of resource dedicated in EA-13. From a country-specific perspective there is rather a greater variability, with a range reaching the upper limit with the 17.4% of Luxembourg and the lower limit with Spain, Italy, Poland and the Netherlands well below the 5%.
The function unemployment accounted for the 6.5% of all benefits in EU-25. The high figures found in Spain (12.9%) and Belgium (12.5%) set the share for EA-13 at a higher level, 7.4%. Expenditure on this function was less than the 3% of the total in Estonia, Lithuania, Italy, the United Kingdom and Hungary. It is worth noting that the spending on of unemployment benefits does not always correlate with the level of unemployment in the various countries, as there are substantial differences in coverage, the duration of benefits and the level of unemployment benefit.
See also the previous portrait 'Social protection expenditure and receipts'.
Policy context
In recent years the cooperation on the European level in the field of social protection, in particular pensions, health and long term care, has made considerable progress. This development was characterised by the creation of the 'Social Protection Committee' bringing together senior officials from Member States and the Commission and by the introduction of the Open Method of Coordination in the field of pensions and in the field of health care and care for the elderly.
This evolution was initiated by the European Council of Lisbon in March 2000, which mandated the preparation, on the basis of a Commission Communication, of a study on the future evolution of social protection systems. The Commission adopted in October 2000 a Communication (COM (2000) 622 final) on the 'Future Evolution of Social Protection from a Long-Term Point of View: Safe and Sustainable Pensions'. The European Council highlighted the need for a 'comprehensive approach' to the challenge of an ageing society and stressed the importance of both social policy and financial objectives. The 2001 Laeken European Council endorsed the proposition of objectives and working methods in order to apply the Open Method of Coordination in the domain of pension policy. Member States presented a first round of National Strategy Reports in 2002 and a second in 2005. These have been synthesized by the Commission in the Joint Report on Social Protection and Social Inclusion, endorsed by the European Council in 2006 and in a Commission Services Paper (SEC(2006)304), Synthesis Report on Adequate and Sustainable Pensions (and its annexes including country summaries and horizontal analysis).
In the area of health care, the Gothenburg European Council of 2001 asked the Council, in conformity with the Open Method of Coordination, to prepare an initial report for the Spring European Council in 2002 on orientations in the field of health care and care for the elderly. This report based on a Communication from the Commission (COM (2001) 723) stressed that health care and long-term care systems in the European Union face the challenge of ensuring at the same time the following three key objectives: accessibility, quality and financial viability of health and care systems. These three broad goals were endorsed by the Council in an initial orientation report on health care and care for the elderly to the Barcelona European Council in March 2002. The 2003 Spring European Council highlighted the need to intensify the cooperative exchange in the field and in April 2004 the Commission presented a communication (COM(2004) 304),which proposed to extend the Open Method of Coordination to the area of health and long term care.
Indeed, in a communication from December 2005 (COM 2005 (706)) the Commission proposed to create from Autumn 2006 a streamlined framework for further development of the Open Method of Coordination for social protection and social inclusion. It took account of experience gained to date in the development of the OMC and of wider developments, notably the revision of the Lisbon Strategy. It aimed to create a stronger, more visible OMC with a heightened focus on policy implementation, which will interact positively with the revised Lisbon Strategy, while simplifying reporting and expanding opportunities for policy exchange. In March 2006, the European Council adopted a new framework for the social protection and social inclusion process, with a new set of common objectives. These include three overarching objectives and objectives for each of the three policy areas of social inclusion, pensions and health and long-term care.
In June 2006, the Social Protection Committee adopted a set of common indicators in the newly streamlined social protection and social inclusion process, including indicators for the fields of pensions and health. These indicators are meant to show the evolution as regards the objectives. The whole list consists of a portfolio of 14 overarching indicators (+11 context indicators) meant to reflect the newly adopted overarching objectives and of three strand portfolios for social inclusion, pensions, and health and long-term care. In its report, the Indicators Group working under the auspices of the Social Protection Committee has identified a number of dimensions for which indicators need to be further developed, notably in the areas of social inclusion (child
69 In Luxembourg a new 'dependence insurance' scheme was introduced in 1999. These benefits accounted for 4.5% of
total social benefits in 2004. According to the 1996 ESSPROS Manual, most of these benefits should be recorded under old-age benefits.
PART 2 | AREAS OF SOCIAL POLICY CONCERN: STATISTICAL PORTRAITS
141
well-being, material deprivation, housing), pensions (employment of older workers and private pensions) and health and long term care for which the list of indicators adopted is only preliminary.
A key feature of the Open Method of Coordination (OMC) is the joint analysis and assessment by the European Commission and the Council of the National Action Plans submitted by the Member States. The Joint Reports assess progress made in the implementation of the OMC, set key priorities and identify good practice and innovative approaches of common interest to the Member States. Member States submitted for the first time integrated National Reports on strategies for social inclusion, pensions, healthcare and long-term care in the autumn 2006. These were synthesised in the 2007 Joint Report on Social Protection and Social Inclusion and its supporting documents on horizontal analysis (SEC(2007)329) and country analysis (SEC(2007)272).
Methodological notes
Source: Eurostat — European system of integrated social protection statistics (ESSPROS).
See also the previous portrait Social Protection expenditure and receipts. Social benefits are recorded without any deduction of taxes (gross) or other compulsory levies payable on them by beneficiaries. 'Tax benefits' (tax reductions granted to households for social protection purposes) are generally excluded. Social benefits are divided up into the following eight functions: Sickness/healthcare, Disability, Old age, Survivors, Family/children, Unemployment, Housing, Social exclusion not elsewhere classified (n.e.c.). The Old age function covers the provision of social protection against the risks linked to old age: loss of income, inadequate income, lack of independence in carrying out daily tasks, reduced participation in social life, and so on. Medical care of the elderly is not taken into account (reported under Sickness/health care function). Placing a given social benefit under its correct function is not always easy. In most Member States, a strong interdependence exists between the three functions Old age, Survivors and Disability. For the purposes of better EU-wide comparability, the Old age and Survivors functions have been grouped together. FR, IRL and PT record disability pensions paid to persons of retirement age as benefits under the disability function as opposed to the old age function.
The 2004 data are provisional for CZ, DE, ES, FR, IT, LV, LT, NL, PL, PT, RO, SI, SK, SE and UK. The 2004 data for EU-25 are estimates.
The GDP and population data were extracted in November 2006. This might explain any differences from national publications.
Links to other parts of the report
Ageing of the population (2.3), Social protection expenditure and receipts (2.10) and Social protection (Annex 1.3.5).
Further reading
• Methodology: ESSPROS Manual 1996, Eurostat.
• European Social Statistics — Social protection — Expenditure and receipts 1996-2004, 2007, Eurostat.
• Statistics in Focus (Population and social conditions): Social Protection in the European Union, No 99/2007, Eurostat.
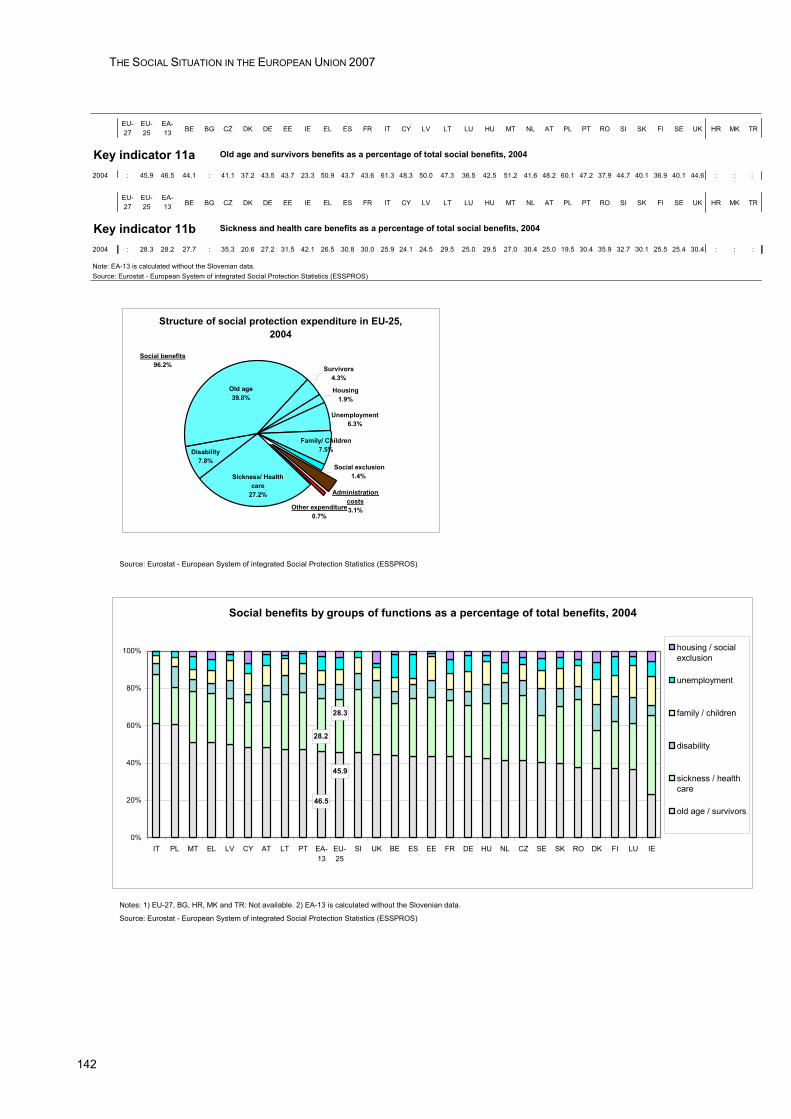
THE SOCIAL SITUATION IN THE EUROPEAN UNION 2007
142
EU-27
EU-25
EA-13 BE BG CZ DK DE EE IE EL ES FR IT CY LV LT LU HU MT NL AT PL PT RO SI SK FI SE UK HR MK TR
Key indicator 11a2004 : 45.9 46.5 44.1 : 41.1 37.2 43.5 43.7 23.3 50.9 43.7 43.6 61.3 48.3 50.0 47.3 36.5 42.5 51.2 41.6 48.2 60.1 47.2 37.9 44.7 40.1 36.9 40.1 44.6 : : :
EU-27
EU-25
EA-13 BE BG CZ DK DE EE IE EL ES FR IT CY LV LT LU HU MT NL AT PL PT RO SI SK FI SE UK HR MK TR
Key indicator 11b2004 : 28.3 28.2 27.7 : 35.3 20.6 27.2 31.5 42.1 26.5 30.8 30.0 25.9 24.1 24.5 29.5 25.0 29.5 27.0 30.4 25.0 19.5 30.4 35.9 32.7 30.1 25.5 25.4 30.4 : : :
Note: EA-13 is calculated without the Slovenian data.Source: Eurostat - European System of integrated Social Protection Statistics (ESSPROS)
Source: Eurostat - European System of integrated Social Protection Statistics (ESSPROS)
Notes: 1) EU-27, BG, HR, MK and TR: Not available. 2) EA-13 is calculated without the Slovenian data.
Source: Eurostat - European System of integrated Social Protection Statistics (ESSPROS)
Old age and survivors benefits as a percentage of total social benefits, 2004
Sickness and health care benefits as a percentage of total social benefits, 2004
Social benefits by groups of functions as a percentage of total benefits, 2004
46.5
45.9
28.3
28.2
0%
20%
40%
60%
80%
100%
IT PL MT EL LV CY AT LT PT EA-13
EU-25
SI UK BE ES EE FR DE HU NL CZ SE SK RO DK FI LU IE
housing / socialexclusion
unemployment
family / children
disability
sickness / healthcare
old age / survivors
Structure of social protection expenditure in EU-25, 2004
Survivors4.3%
Housing1.9%
Sickness/ Health care
27.2%
Disability7.8%
Old age39.8%
Other expenditure0.7%
Administration costs3.1%
Unemployment6.3%
Family/ Children7.5%
Social exclusion1.4%
Social benefits96.2%
PART 2 | AREAS OF SOCIAL POLICY CONCERN: STATISTICAL PORTRAITS
143
12. INCOME DISTRIBUTION As a population-weighted average for EU-27 Member States in survey year 2005 (income reference year 2004) the top (highest income) 20% of a Member State's population received 4.9 times as much of the Member State's total income as the bottom (poorest) 20% of the Member State's population. This gap between the most and least well-off people is smallest in Sweden (3.3), Slovenia (3.4), and Denmark (3.5). It is widest in Portugal (6.9), Lithuania (6.9), Latvia (6.7) and Poland (6.6).
Member States with lower levels of average income tend to have higher levels of inequality
In 200570, the median71 equivalised disposable annual income for thirteen out of the EU-25 countries, including Germany, France and UK, was over 13 000 PPS. Luxembourg is an outlier with 27 298 PPS, followed by United Kingdom with 17 792 PPS. A north/south divide remains apparent amongst former EU-15 countries, with income levels in Portugal, Greece and Spain ranging between 8 347 and 11 726 PPS. Italy differentiates itself from its Mediterranean neighbours with an average annual disposable income of 13 730 PPS. An east/west, old/new divide is also apparent, although Cyprus (14 646 PPS), Malta (11 021 PPS) and Slovenia (11 745 PPS) have median incomes similar to those of ‘old’ Member States. Median incomes are lowest in some of the Baltic States (less than 5 000 PPS).
Income distribution can be measured by looking at how total equivalised disposable income is shared among different strata of the population according to the level of income. As a population-weighted average amongst the Member States in survey year 2005 (income reference year 2004) the top (highest income) 20% of the population received 4.9 times as much of the total income as the bottom (lowest income) 20% of the population. This indicator, the inequality of income distribution (S80/S20 income quintile share ratio), is generally higher in the southern and non-continental Member States (Portugal and Lithuania being the highest with 6.9 — although Estonia, Greece, Spain, Ireland, Italy, Latvia, Poland, Lithuania and the UK also find themselves above the average). At the other extreme are Sweden (3.3), Slovenia (3.4) and Denmark (3.5).
Another way of looking at income inequality is to compare the Lorenz curve of actual income distribution to the line of perfectly equal income distribution72. Amongst the EU-25 member states, the country closest to equality was Sweden (coefficient 23) and the most unequal was Portugal (38). The EU-25 average coefficient was 30.
In general, Member States with higher levels of inequality tend to have a lower level of average income (with the exception of the United Kingdom, which has both above average income and above average inequality).
Policy context
The EC Treaty (Article 2) states that 'The Community shall have as its task … the raising of the standard of living and quality of life…'. Article 3 continues 'the activities of the Community shall include … the strengthening of economic and social cohesion.'
The Lisbon European Council in March 2000 set itself 'a new strategic goal for the next decade: to become the most competitive and dynamic knowledge-based economy in the world capable of sustainable economic growth with more and better jobs and greater social cohesion'. See also Communication adopted by the Commission in March 2000 entitled Building an Inclusive Europe.
The Lisbon Strategy was relaunched in 2005 focussing on growth and jobs. Summit presidency conclusions reaffirmed that the Open Method of Coordination in the field of social inclusion would continue in parallel, 'feeding-in' to the Lisbon Strategy and Sustainable Development Strategy (and vice versa).
The Social Policy Agenda (COM(2000) 379 final) states that 'social transfers covering pensions and social security do not only contribute to balance and re-distribute incomes throughout lifetimes and across social groups, but also support better quality in employment, with consequent economic benefits'.
In March 2006 the Employment, Social Policy, Health and Consumer Affairs (EPSCO) Council adopted streamlined objectives across the Open Method of Coordination in social inclusion, pensions and healthcare.
A list of statistical 'structural indicators' was agreed at the Nice summit in December 2000, including 7 indicators in the field of social cohesion. This list has been updated for the Synthesis Report from the Commission to the Barcelona Council in March 2002. This approach has been further developed by the Indicators Sub-Group of the Social Protection Committee, who proposed a list of 'cohesion indicators' which
70 From 2005, cross country comparable data from EU-SILC is available for all EU-25 countries. For EU-15 countries
except Germany, the United Kingdom and the Netherlands, EU-SILC data was also available for 2004. For Belgium, Denmark, Greece, Ireland, Luxembourg, Austria and Norway, data is available from a 2003 preliminary version of EU-SILC. Bulgaria, Romania and Turkey have launched EU-SILC in 2006. In this edition the data for the two new Member States (Bulgaria and Romania) and for Croatia and Turkey are obtained from national sources which are not fully comparable with EU-SILC. Trends in transition years cannot be interpreted reliably. Due to differences between these underlying sources, the indicators cannot be considered to be fully comparable either between themselves or with EU aggregates or with data reported in earlier years.
71 The median value is generally preferred as the measure of central tendency of incomes since it is less affected by values at the extremes of the distribution (rich and poor).
72 This can be expressed mathematically as the Gini coefficient (a mathematical expression of the ratio of the amount of graph between the line of perfectly-equal distribution and the curve of actual distribution to the total amount of graph below the line of perfectly-equal distribution).
THE SOCIAL SITUATION IN THE EUROPEAN UNION 2007
144
was adopted by the Laeken summit in December 2001. The Indicators Sub Group continues to refine and extend this list. In May 2006, the Social Protection Committee endorsed new best practice criteria for indicator design and adopted proposals for a portfolio of overarching indicators and for streamlining the social inclusion, pensions and health portfolios, setting the framework for the monitoring of national strategy reports which covered the period 2006-2008.
Methodological notes
Sources:
– Eurostat — European Community Household Panel (ECHP), Users' Data Base version December 2003; for data until 2001
– national data in the transition period
For EU-25 Eurostat – Community Statistics on Income and Living Conditions EU-SILC (2005) income data 2004; except for UK, income year 2005 and for IE moving income reference period (2004-2005).
New member states: For Bulgaria and Romania data is derived from the national Household Budget Survey (HBS), 2005, income data 2005.
Candidate countries: For Croatia data is derived from the national Household Budget Survey (HBS) 2004, income data 2004, for Turkey data is derived from the national Household Income, Consumption and Expenditure (HICE) survey 2004, income data 2004.
EU aggregates are Eurostat estimates are obtained as a population size weighted average of national data.
In EU-SILC the total income of each household (net or gross — from 2007 all countries using EU-SILC will supply gross data) is calculated by adding together the income received by all the members of the household from all component sources in the year preceding the survey year for most participant countries73.This includes income from work, private income (e.g. from investments or property), as well as pensions and other social transfers directly received. During the transition period to full implementation, no account is taken of indirect social transfers, imputed rent for owner-occupied accommodation, mortgage interest payments, receipts in kind (for former EU-15 Member States: it is taken into account for the new member states). These income components will be mandatory only from 2007. As the weight of these income components varies between countries, there is some limitation on the full comparability of income statistics. Moreover, due to the practical differences in the underlying national data sources during the transition period, derived indicators cannot be considered to fully comparable either between countries or over time.
In order to take account of differences in household size and composition in the comparison of income levels, the household's total income is divided by its 'equivalent size', computed using the modified OECD equivalence scale. This scale gives a weight of 1.0 to the first person aged 14 and over, 0.5 to the second and each subsequent person aged 14 and over, and 0.3 to each child aged under 14 in the household.
To calculate the income quintile share ratio, persons are first ranked according to their equivalised income and then divided into 5 groups of equal size known as quintiles. S80/S20 income quintile share ratio represents the sum of the income received by the 20% of the population with the highest income (top quintile) to that received by the 20% of the population with the lowest income (lowest quintile).
Links to other parts of the report
Social protection expenditure and receipts (2.10), Low-income households (2.13), Jobless households and low wages (2.14) and Income, social inclusion and living conditions (Annex 1.3.6).
Further reading
• European social statistics: Income, Poverty and Social Exclusion 2nd report, 2003 edition.
• Statistics in Focus (Population and social conditions): Poverty and social exclusion in the EU after Laeken – part 1, No 8/2003. Eurostat.
• Statistics in Focus (Population and social conditions): Poverty and social exclusion in the EU after Laeken – part 2, No 9/2003. Eurostat.
• Statistics in Focus (Population and social conditions): Monetary poverty in EU Acceding and Candidate Countries, No 21/2003. Eurostat.
• Statistics in Focus (Population and social conditions): Social protection: cash family benefits in Europe, No 19/2003. Eurostat.
• Statistics in Focus (Population and social conditions): The social protection in Europe, No 3/2003. Eurostat.
73 In EU-SILC 2005 income data is from 2004; except for UK, income year 2005 and for IE, moving income reference
period (2004-2005).
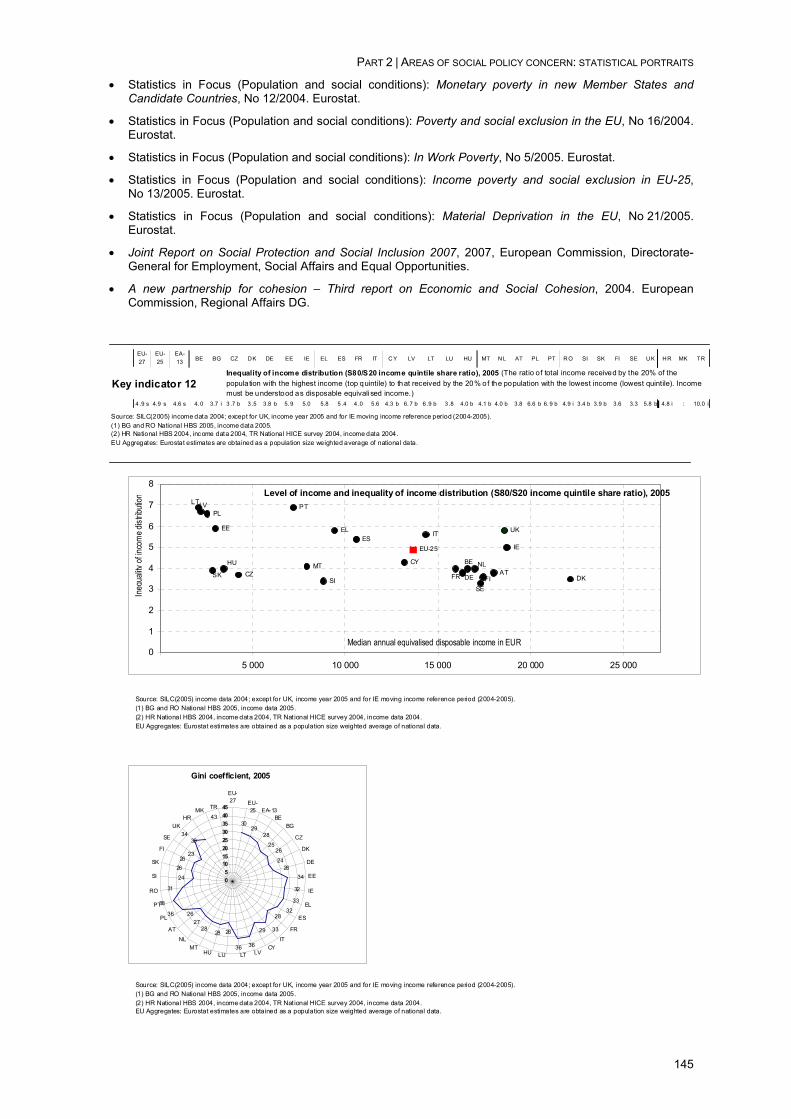
PART 2 | AREAS OF SOCIAL POLICY CONCERN: STATISTICAL PORTRAITS
145
• Statistics in Focus (Population and social conditions): Monetary poverty in new Member States and Candidate Countries, No 12/2004. Eurostat.
• Statistics in Focus (Population and social conditions): Poverty and social exclusion in the EU, No 16/2004. Eurostat.
• Statistics in Focus (Population and social conditions): In Work Poverty, No 5/2005. Eurostat.
• Statistics in Focus (Population and social conditions): Income poverty and social exclusion in EU-25, No 13/2005. Eurostat.
• Statistics in Focus (Population and social conditions): Material Deprivation in the EU, No 21/2005. Eurostat.
• Joint Report on Social Protection and Social Inclusion 2007, 2007, European Commission, Directorate-General for Employment, Social Affairs and Equal Opportunities.
• A new partnership for cohesion – Third report on Economic and Social Cohesion, 2004. European Commission, Regional Affairs DG.
EU-27
EU-25
EA-13 BE BG CZ DK DE EE IE EL ES FR IT CY LV LT LU HU MT NL AT PL PT RO SI SK FI SE UK HR MK TR
Key indicator 124 .9 s 4.9 s 4.6 s 4. 0 3.7 i 3 .7 b 3 .5 3.8 b 5. 9 5.0 5.8 5 .4 4 .0 5.6 4.3 b 6. 7 b 6 .9 b 3 .8 4.0 b 4.1 b 4.0 b 3.8 6.6 b 6. 9 b 4.9 i 3.4 b 3.9 b 3.6 3.3 5.8 b 4.8 i : 10.0 i
Source: SILC(2005) income data 2004; except for UK, income year 2005 and for IE moving income reference period (2004-2005). (1) BG and RO National HBS 2005, income data 2005. (2) HR National HBS 2004, income data 2004, TR Nat ional HICE survey 2004, income data 2004.EU Aggregates: Eurostat estimates are obtained as a population size weighted average of national data.
Source: SILC(2005) income data 2004; except for UK, income year 2005 and for IE moving income reference period (2004-2005). (1) BG and RO National HBS 2005, income data 2005. (2) HR National HBS 2004, income data 2004, TR Nat ional HICE survey 2004, income data 2004.EU Aggregates: Eurostat estimates are obtained as a population size weighted average of national data.
Source: SILC(2005) income data 2004; except for UK, income year 2005 and for IE moving income reference period (2004-2005). (1) BG and RO National HBS 2005, income data 2005. (2) HR National HBS 2004, income data 2004, TR National HICE survey 2004, income data 2004.EU Aggregates: Eurostat estimates are obtained as a population size weighted average of national data.
Inequality of income distribution (S80/S20 income quintile share ratio), 2005 (The ratio of total income received by the 20% of the population with the highest income (top quintile) to that received by the 20% of the population with the lowest income (lowest quintile). Income must be understood as disposable equivalised income.)
Level of income and inequality of income distribution (S80/S20 income quintile share ratio), 2005
EU-25
DK
EE
IE
ELES
IT
CYMTAT
PLPT
SI
UK
CZ
BE
DEFR
LVLT
HU NLSK FI
SE
0
1
2
3
4
5
6
7
8
5 000 10 000 15 000 20 000 25 000
Median annual equivalised disposable income in EUR
Ineq
uality
of in
com
e dist
ributi
on
Gini coefficient, 2005
3029
28
2526
2426
34
32
33
3228
3329
3636
262828
272636
38
31
24
2626
23
3430
43
05
1015202530354045
EU-27 EU-
25 EA-13BE
BG
CZ
DK
DE
EE
IE
EL
ES
FR
ITCY
LVLTLUHUMT
NL
AT
PL
PT
RO
SI
SK
FI
SE
UKHR
MK TR
THE SOCIAL SITUATION IN THE EUROPEAN UNION 2007
146
13. LOW-INCOME HOUSEHOLDS In 2005 around 16% of households in the EU-27 had an equivalised disposable income that was less than 60% of their respective national median in 2005 – these citizens are considered to be at risk of poverty74. Using 60% of the national median equivalised income as a cut-off threshold, the proportion of people at-risk-of-poverty after social transfers had been taken into account was highest in Lithuania and Poland, followed by Ireland, Greece, and Spain. It was lowest in Sweden (9%), followed by the Czech Republic (10%) and the Netherlands (11%). The proportion of people being at-risk-of-poverty was still relatively low (12%) in Denmark, Austria and Finland. In this context it should be remembered that with the at-risk-of-poverty rates we are analysing relative poverty within each country and relative to median income and not absolute poverty by reference to an independent or common cut-off threshold. When analysing the hypothetical case of the complete absence of social transfers (except pensions), in EU-27 countries an average of 26% of the population would be at-risk-of-poverty. In the majority of countries, social benefits reduce the proportion of people at risk of poverty between 25% and 50%.
The household types most at-risk-of-poverty are single parents with dependent children, single elderly people and single females
While the overall at-risk-of-poverty rate for EU-27 is 16% using income data for 2004-5 (survey data 2005), some household types are exposed to a much greater poverty risk than others. In EU-25 countries single parents with dependent children have the highest poverty risk – 31% have an equivalised disposable income lower than 60% of national median equivalised income.
Households composed of a single adult older than 65 had an at-risk-of-poverty rate of 25% (EU-25) using 2005 figures. The poverty risk of single adults aged 65 and over is very unevenly distributed across member states, with values ranging from 7% in Luxembourg, the Netherlands and Poland, to 62% in Ireland and 70% in Cyprus.
A quarter (25%) of single females was at risk of poverty in EU-25 countries in 2005. In Ireland (53%) and Cyprus (59%) well over half of single females were at risk of poverty in 2005. In only six EU-25 countries (Czech Republic 16%, Hungary 15%, Luxembourg 13%, the Netherlands 12%, Poland 12% and Slovakia 16%) the at-risk-of-poverty rate for single females was equal to or below the EU-25 average at-risk-of-poverty rate for all household types (16%). Poland seems to be atypical in this respect as it is the only country where the poverty risk of single females is lower than the national average (and also lower that of single male households).
The poverty risk of single parents and their dependent children varies much between countries
In Malta (49%) and Lithuania (48%) almost half of households composed of single parents and their dependent children were at-risk-of poverty. Ireland (45%) and Greece (44%) also record a comparatively high proportion of those households at-risk-of-poverty. The poverty risk of single parent households is lowest in the Nordic Member States. Within the EU, the lowest poverty risk for this household type is in Sweden (18%), followed by Finland (20%) and Denmark (21%).75
Uneven poverty risk between generations
The distribution of poverty risk among different age groups follows a U-shaped curve in most countries. In 2005 19% of young people under 24 lived in low income households in EU-25 member states. For working age adults (aged 24-64) the risk of living in a low income household was lowest (14%). 19% of people aged 65 and over lived at risk of poverty in EU-25 countries in 2005.
Women (compared with men) and children (compared with adults) are more likely to be poor
In the survey used for compiling the risk of poverty, no information can be obtained about the allocation of income within a household, and in particular, between people of different gender living in one household, so some caution is necessary in interpreting these figures. In a household composed of more than one individual, we cannot automatically assume that all household members have equal access to money, and therefore cannot know whether they should be considered as 'poor' or 'not poor'. What we can say, is that certain types of households are more at risk of poverty than others.
Throughout Europe in 2005, the probability of living in a household which can be considered to be at risk-of-poverty is slightly more prevalent among women than among men (EU-25 average of 17% versus 15%), although in Denmark, Luxembourg, the Netherlands, Romania and Slovakia there is parity, whilst for Hungary and Poland, it is men who are very slightly more at risk.
Among household types composed of a single individual, where questions of intra-household allocation are irrelevant, 25% of single women households were at risk of poverty in the EU-25 in 2005, compared to 22% of single men households. However, there is no uniform picture of this across countries: While Ireland (53% of
74 See the first footnote in the portrait nr. 12 'Income distribution'. 75 The EFTA countries among Scandinavian countries also record a low risk of poverty with 14% for Iceland and 19% for
Norway.

PART 2 | AREAS OF SOCIAL POLICY CONCERN: STATISTICAL PORTRAITS
147
single women at risk of poverty compared to 45% of men) and Cyprus (59% of single women at risk of poverty compared to 29% of men) had a very high poverty risk for single women in 2005, this does not hold for all countries. Indeed, in eight EU-27 countries, the poverty risk was higher for single men than for single women, with the difference in poverty rates being particularly marked (5 percentage points or more difference) in Lithuania, Hungary, the Netherlands and Poland.
In 2005 (EU-25), the proportion of children (under the age of 18) living in a household with low income (19%) is higher than for the adult population (15%). The proportion of children living in a low income household is highest in Spain (24%), Italy (24%), Lithuania (27%), Poland (29%) and Portugal (24%). By contrast, in 2005, children in Denmark, Cyprus and Finland were less likely to live in 'poor' households than adults. In this context, it also has to be noted, that households composed of two adults and three or more dependent children were 50% more likely to be at-risk-of-poverty than other household types (24% compared to 16% for all household types).
The impact of benefits on the proportion of poor people is significant
A comparison of the number of people on low incomes before social benefits other than pensions and those on low incomes after social benefits (i.e. old age pensions and survivors' benefits are included in income both 'before' and 'after'), illustrates one of the main purposes of such benefits: their redistributive effect and, in particular, their ability to alleviate the risk of poverty and reduce the percentage of population having to manage with a low income.
In 2005, the average at-risk-of-poverty rate in EU-27 countries was 26% before social transfers other than pensions were taken into account and 16% when calculated after social transfers were taken into account. So social transfers were successful in lifting 38% of persons with low income above the poverty line.
Social benefits other than pensions reduce the percentage of people at risk of poverty in all the countries, but to very disparate degrees. The reduction is smallest (less than 25%) in some Mediterranean States (Greece, Spain, Italy, Cyprus, Malta and Portugal), Latvia, Estonia, Bulgaria and the candidate country Turkey. The reduction is greatest in Sweden (69%). The Czech Republic, Denmark, France, Hungary, the Netherlands, Austria, Slovenia and Finland also record reductions due to social transfers of 50% or more.
In the absence of social benefits other than pensions, in 2005 in four member states (Denmark, Ireland, Poland and the United Kingdom) 30% or more of the population would have been at-risk-of-poverty.
EU poverty gap over one fifth of threshold value
Looking at income below the poverty line identifies those people at risk of income poverty, but does not show how whether these persons can really be considered as poor76. The relative median at-risk-of-poverty gap measures the difference between the at-risk-of-poverty threshold (60% of national median equivalised income and the median equivalised disposable income of persons below the at-risk-of-poverty threshold, expressed as a percentage of the at-risk-of-poverty threshold. Measuring the gap between the median level of income of the poor and the at-risk-of-poverty threshold provides an insight into the depth of income poverty — the poverty gap. In 2005, the relative median at-risk-poverty gap equalled 23% in EU-25 countries and EU-15 countries. While the average EU-25 at-risk-of-poverty threshold measured 8 275 Euros in the EU-25, this amounts to a relative poverty gap of roughly 1 903 Euros in equivalised disposable income. The at-risk-of-poverty threshold varied between 17 087 Euros in Luxembourg and 726 Euros in Romania. This illustrates the high differences in income in member states and that the poverty risk indicator and other derived from it are measures of relative poverty. It should be noted here that median income levels, whether compared nominally (in Euros or national currency) or with a measure of purchasing power standards (PPS) are markedly lower in most new Member States than in the EU-15 countries.
More than 35 million people in EU-15 living in persistent risk of poverty
In 2001, 9% of the EU-15 population were living in a low-income household and had been in this situation for at least two of the three preceding years. This figure suggests that more than half of all people in low income households are living at-persistent-risk-of-poverty. In 2001, the at-persistent-risk-of-income-poverty rate ranged from around 6% in Germany, Denmark, Netherlands and Finland up to 15% in Portugal. No data is currently available for New Member States for this indicator77.
Low income does not necessarily by itself imply low living standards, and in the short term consumption expenditure can sometimes be maintained in a number of ways, including use of accumulated savings, asset sales and access to credit. Typically it is the cumulative negative impact of persistent and/or multiple
76 The at-risk-of-poverty rate measures low income, not wealth. Households may have low income for a certain year, but
still not be 'poor' because they have some wealth to draw on. 77 During the transition to data collection under the EU-SILC regulations, statistics are currently neither available for the
‘new’ Member States, in the absence of a comparable national source of longitudinal panel data nor for more recent years. As the majority of countries have launched EU-SILC in 2005 and it requires four years of survey data to produce the ‘persistent risk of poverty’ indicator, results covering all EU-25 member states will first be available for the survey year 2008. First results for countries which have launched an advance version of EU-SILC in 2003 will be available for the survey year 2006.
THE SOCIAL SITUATION IN THE EUROPEAN UNION 2007
148
disadvantages, which may lead to poverty and social exclusion. The high levels of persistent risk reported for certain countries are consequently a source of particular concern.
Policy context
Art.136 of the EC Treaty lists 'the combating of exclusion' as one of the six objectives of European social policy. Art.137.1 cites the integration of people excluded from the labour market as one of the fields in which Community action should support and complement the activities of Member States. Art.137.2 creates scope for action at Community level by encouraging 'co-operation between Member States through initiatives aimed at improving knowledge, developing exchanges of information and best practices, promoting innovative approaches and evaluating experiences in order to combat social exclusion'.
The Lisbon European Council in March 2000 concluded that 'the number of people living below the poverty line and in social exclusion in the Union is unacceptable' and that 'the new knowledge-based society offers tremendous potential for reducing social exclusion' (Presidency conclusion No 32). This conclusion was reinforced at the Nice and Stockholm summits in December 2000 and Spring 2001.
The Social Policy Agenda (COM (2000) 379 final) also addresses the issues of poverty and social exclusion. The main objective is 'to prevent and eradicate poverty and exclusion and promote the integration and participation of all into economic and social life'. (Section 4.2.2.1).
The Lisbon Council agreed that Member States’ policies for combating social exclusion should be based on an Open Method of Coordination combining common objectives, National Action Plans and a programme presented by the Commission to encourage cooperation in this field. The Nice European Council in December 2000 adopted the common objectives in the fight against social exclusion and poverty: 'to facilitate participation in employment and access by all to the resources, rights, goods and services; to prevent the risks of exclusion; to help the most vulnerable; to mobilise all relevant bodies'.
Key elements of the Open Method of Coordination are the definition of commonly agreed objectives for the European Union (EU) as a whole, the development of appropriate national action plans to meet these objectives, and the periodic reporting and monitoring of progress made.
Similar approaches were subsequently adopted in many other areas, including economic policy, employment, education, sustainable development, social inclusion, social protection, etc.
Efforts were made since 2003 to create better links between separate processes (notably between social inclusion and social protection themes on the one hand and Broad Economic Policy Guidelines and European Employment Strategy on the other), and these links came under intense scrutiny during the mid-term review of the Lisbon Strategy. It was eventually decided to continue in parallel, with each policy 'pair' feeding-in to the other.
In March 2006 the Employment, Social Policy, Health and Consumer Affairs (EPSCO) Council adopted streamlined objectives across the Open Method of Coordination in social inclusion, pensions and healthcare.
Commonly agreed indicators have been developed by the Indicators Sub-Group of the Social Protection Committee. A first set of indicators was adopted at the Laeken European Council in December 2001. In May 2006, the Social Protection Committee endorsed new best practice criteria for indicator design and adopted proposals for a portfolio of overarching indicators and for streamlining the social inclusion, pensions and health portfolios, setting the framework for the monitoring of national strategy reports which cover the period 2006-2008.
Methodological notes
Sources:
For EU-25 Eurostat – Community Statistics on Income and Living Conditions EU-SILC (2005) income data 2004; except for UK, income year 2005 and for IE moving income reference period (2004-2005).
New member states: For Bulgaria and Romania data is derived from the national Household Budget Survey (HBS), 2005, income data 2005.
Candidate countries: For Croatia data is derived from the national Household Budget Survey (HBS) 2004, income data 2004, for Turkey data is derived from the national Household Income, Consumption and Expenditure (HICE) survey 2004, income data 2004.
EU aggregates are Eurostat estimates are obtained as a population size weighted average of national data.
The poverty risk or relative monetary poverty rate (indicator: at-risk-of-poverty rate) is measured in terms of the proportion of the population with an equivalised income below 60% of the median equivalised disposable income in each country. The median income is preferred over the mean income as it is less affected by extreme values of the income distribution.
The relative median at-risk-of-poverty gap is defined the difference between the at-risk-of-poverty threshold (cut-off point: 60% of median equivalised disposable income) and the median equivalised disposable income of persons below the at-risk-of-poverty threshold, expressed as a percentage of the at-risk-of-poverty threshold. See the portrait 'Income distribution' (2.12) for definition of income concepts and notes on data.

PART 2 | AREAS OF SOCIAL POLICY CONCERN: STATISTICAL PORTRAITS
149
Links to other parts of the report
Employment (2.7), Social protection expenditure and receipts (2.10), Income distribution (2.12), Jobless households and low wages (2.14), and Income, social inclusion and living conditions (Annex 1.3.6).
Further reading
• European social statistics: Income, Poverty and Social Exclusion 2nd Report, 2003 edition. Eurostat.
• Statistics in Focus (Population and social conditions): Monetary poverty in EU Acceding and Candidate Countries, No 21/2003. Poverty and social exclusion in the EU after Laeken-part1, No 8/2003. Social protection: cash family benefits in Europe, No 19/2003. Persistent income poverty and social exclusion in the European Union, No 13/2000. The social protection in Europe, No 3/2003. Income poverty in the European Union: Children, gender and poverty gaps, No 12/2000. Social benefits and their redistributive effect in the EU, No 9/2000. Social exclusion in the EU Member States, No 1/2000. Low income and low pay in a household context (EU-12), No 6/1998. Eurostat.
• Joint Report on Social Protection and Social Inclusion 2007, 2007, European Commission, Directorate-General for Employment, Social Affairs and Equal Opportunities.
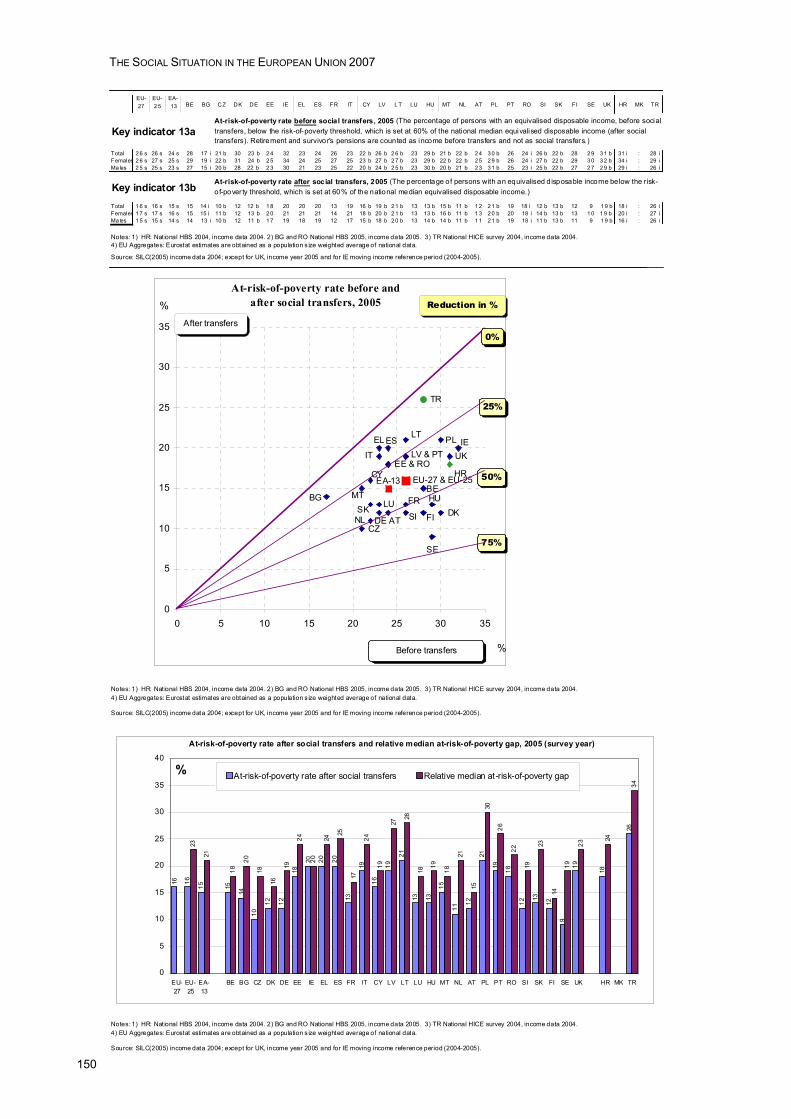
THE SOCIAL SITUATION IN THE EUROPEAN UNION 2007
150
EU-27
EU-2 5
EA-13 BE BG CZ DK DE EE IE EL ES FR IT CY LV L T LU HU MT NL AT PL PT RO SI SK FI SE UK HR MK TR
Key indicator 13a
Total 2 6 s 26 s 24 s 28 17 i 21 b 30 23 b 2 4 32 23 24 26 23 22 b 26 b 2 6 b 23 29 b 21 b 22 b 2 4 3 0 b 26 24 i 26 b 22 b 28 2 9 3 1 b 31 i : 28 iFemales 2 6 s 27 s 25 s 29 19 i 22 b 31 24 b 2 5 34 24 25 27 25 23 b 27 b 2 7 b 23 29 b 22 b 22 b 2 5 2 9 b 26 24 i 27 b 22 b 29 3 0 3 2 b 34 i : 29 iMa les 2 5 s 25 s 23 s 27 15 i 20 b 28 22 b 2 3 30 21 23 25 22 20 b 24 b 2 5 b 23 30 b 20 b 21 b 2 3 3 1 b 25 23 i 25 b 22 b 27 2 7 2 9 b 29 i : 26 i
Key indicator 13bTotal 1 6 s 16 s 15 s 15 14 i 10 b 12 12 b 1 8 20 20 20 13 19 16 b 19 b 2 1 b 13 13 b 15 b 11 b 1 2 2 1 b 19 18 i 12 b 13 b 12 9 1 9 b 18 i : 26 iFemales 1 7 s 17 s 16 s 15 15 i 11 b 12 13 b 2 0 21 21 21 14 21 18 b 20 b 2 1 b 13 13 b 16 b 11 b 1 3 2 0 b 20 18 i 14 b 13 b 13 1 0 1 9 b 20 i : 27 iMa les 1 5 s 15 s 14 s 14 13 i 10 b 12 11 b 1 7 19 18 19 12 17 15 b 18 b 2 0 b 13 14 b 14 b 11 b 1 1 2 1 b 19 18 i 11 b 13 b 11 9 1 9 b 16 i : 26 i
Source: SILC(2005) income data 2004; except for UK, income year 2005 and for IE moving income reference period (2004-2005).
Source: SILC(2005) income data 2004; except for UK, income year 2005 and for IE moving income reference period (2004-2005).
Source: SILC(2005) income data 2004; except for UK, income year 2005 and for IE moving income reference period (2004-2005).
At-risk-of-poverty rate before social transfers, 2005 (The percentage of persons with an equivalised disposable income, before social transfers, below the risk-of-poverty threshold, which is set at 60% of the national median equivalised disposable income (after social transfers). Retirement and survivor's pensions are counted as income before transfers and not as social transfers.)
At-risk-of-poverty rate after social transfers, 2005 (The percentage of persons with an equivalised d isposable income below the r isk-of-pover ty threshold, which is set at 60% of the national median equivalised disposable income.)
Notes: 1) HR: Nat ional HBS 2004, income data 2004. 2) BG and RO National HBS 2005, income data 2005. 3) TR National HICE survey 2004, income data 2004.4) EU Aggregates: Eurostat estimates are obtained as a population s ize weighted average of national data.
Notes: 1) HR: Nat ional HBS 2004, income data 2004. 2) BG and RO National HBS 2005, income data 2005. 3) TR National HICE survey 2004, income data 2004.4) EU Aggregates: Eurostat estimates are obtained as a population s ize weighted average of national data.
Notes: 1) HR: Nat ional HBS 2004, income data 2004. 2) BG and RO National HBS 2005, income data 2005. 3) TR National HICE survey 2004, income data 2004.4) EU Aggregates: Eurostat estimates are obtained as a population s ize weighted average of national data.
At-risk-of-poverty rate before and after social transfers, 2005
LV & PT UKEE & RO
LT
CY
MTBG
ESEL
IT
SK
IEPL
BEFR
DE ATDKFI
SE
NL
LU HU
CZSI
TR
HR EU-27 & EU-25EA-13
0
5
10
15
20
25
30
35
0 5 10 15 20 25 30 35
75%
50%
25%
After transfers
Before transfers
%
%
0%
Reduction in %
At-risk-of-poverty rate after social transfers and relative median at-risk-of-poverty gap, 2005 (survey year)
16 16
15 15
14
10
12 12
18
20 20 20
13
19
16
19
21
13 13
15
11
12
21
19
18
12
13
12
9
19
18
26
23
21
18
20
18
16
19
24
20
24
25
17
24
19
27
28
18
19
18
21
15
30
26
22
19
23
14
19
23
24
34
0
5
10
15
20
25
30
35
40
EU-27
EU-25
EA-13
BE BG CZ DK DE EE IE EL ES FR IT CY LV LT LU HU MT NL AT PL PT RO SI SK FI SE UK HR MK TR
% At-risk-of-poverty rate after social transfers Relative median at-risk-of-poverty gap
PART 2 | AREAS OF SOCIAL POLICY CONCERN: STATISTICAL PORTRAITS
151
14. JOBLESS HOUSEHOLDS AND LOW WAGES An important cause of poverty and social exclusion is the lack of a job or low wages from employment. In 2007 9.3% of people aged 18-59 were living in jobless households both in the EU-27 and EU-25 countries. For children aged 0-17 these figures were 9.4% in EU-27 and 9.3 in EU-25.
Persons living in households where no people of working age are in employment are 3 times more likely to be poor than people living in households where at least one person is working
In 2007 at EU level around 9% of children aged 0-17 and adults aged 18-59 (excluding students aged 18-24 living with other students) were living in jobless households, i.e. households where no member was in employment. Amongst adults, the proportion was lowest in Cyprus (4.5%) and Portugal (5.8%) followed by Estonia, Spain and Slovenia (6.0%). In contrast, Belgium (12.5%), Hungary (11.8%) and Poland (11.7%) record much higher rates. Rates amongst children are generally similar to those for adults, but in Slovenia; Greece, and Luxembourg children live in jobless households much less frequently than adults – whilst in Bulgaria, Ireland, Hungary and the United Kingdom the proportions of children living in jobless households are noticeably higher than for adults.
Amongst the enlarged EU-25 in 2005, persons who are unemployed (40%) or 'other inactive' (25%) have significantly higher risk of living in low income households than those at work (8%). However, having a job is not a sufficient condition to escape the risk of poverty. Having children increases poverty risk from 15% (households without dependent children) to 17% (households with dependent children). The impact of children is least noticeable for households where all persons of working age are working full-time, but is particularly significant for jobless households.
Working poor: a complex picture
Although people in employment are less likely to live in a low-income household, i.e. to be 'working poor', the risk of poverty is not removed. An employee's standard of living (as measured by income) is only partly determined by his/her wage. Indeed, in many cases, low wages received by one member of a household are 'compensated for' by higher wages received by one or more other members of the household. Similarly, a household may receive income other than wages (income from self-employed work or other types of income such as social benefits, income from property, etc.). Lastly, the standard of living depends not only on the resources available but also on the size of the household as well as its economic (number of people in employment, etc.) and demographic (number of children and other dependants, etc.) characteristics. All low-wage employees do not, therefore, live in low-income households. Inversely, employees whose wages are above the low-wage threshold may — e.g. if they have a number of dependants — be living in poor households.
EU-wide, 6% of employees are poor
In 2001, for the EU-25, the at-risk-of-poverty rate for employees is about 8%. It is higher in Estonia, Spain, Italy, Latvia (2002 data), Lithuania, Luxembourg, Poland, Portugal and Slovak Republic (2003 data). In all the countries analysed, the at-risk-of-poverty rate among employees is – as might be expected – lower than the at-risk-of-poverty rate among the population as a whole. At EU level and for most countries in 2001, the at-risk-of-poverty rate of employees is less than half that of the total population.
It is not necessarily the countries with the highest at-risk-of-poverty rates that have the highest proportions of employees living at-risk-of-poverty, but there does seem to be a correlation. Denmark has some of the lowest at-risk-of-poverty rates both for the population as a whole and for employees, while Portugal has some of the highest at-risk-of-poverty rates both for the population as a whole and for employees.
Policy context
The system of financial incentives is one of the main determinants of participation in the labour market and has been an important consideration both for the Employment Guidelines and the Broad Economic Policy Guidelines , and the future EES will place more emphasis on this issue. The objective of 'Making work pay' should be pursued both from the point of view of the jobseeker and from that of the employer. In line with the recommendations of the Joint Report on increasing labour force participation, there is a need for a systematic review of tax/benefit systems with a particular focus on eliminating unemployment and poverty traps, encouraging women to enter, remain in or reintegrate into the labour market after an interruption, and on retaining older workers longer in employment. In addition taxation on labour particularly for the low-skilled workers should be such as to reduce the attractiveness of undeclared work and to encourage job creation.
See also Low-income households (2.13)
Methodological notes
Sources: Eurostat – European Union Labour Force Survey (data on population living in jobless households). European Community Household Panel (ECHP) UDB, version December 2003, 2001 data, wave 8, Eurostat — Community Statistics on Income and Living Conditions, advance launch, 2003 and Eurostat – '4th round' of data collection from national sources, 2005.
See Income distribution (2.12) for income concept and definition of equivalised income. For definition of low-income (or poor) households, see Low-income households (2.13).
THE SOCIAL SITUATION IN THE EUROPEAN UNION 2007
152
Links to other parts of the report
Employment (2.7), Social protection expenditure and receipts (2.10), Income distribution (2.12), Low-income households (2.13) and Income, social inclusion and living conditions (Annex 1.3.6).
Further reading
• European social statistics: Income, Poverty and Social Exclusion 2nd Report, 2003 edition. Eurostat.
• Joint Report on Social Protection and Social Inclusion 2007, 2007, European Commission, Directorate-General for Employment, Social Affairs and Equal Opportunities.
• Statistics in Focus (Population and social conditions): Monetary poverty in EU Acceding and Candidate Countries, No 21/2003. Poverty and social exclusion in the EU after Laeken – part1, No 8/2003. Social protection: cash family benefits in Europe, No 19/2003. Persistent income poverty and social exclusion in the European Union, No 13/2000. The social protection in Europe, No 3/2003.
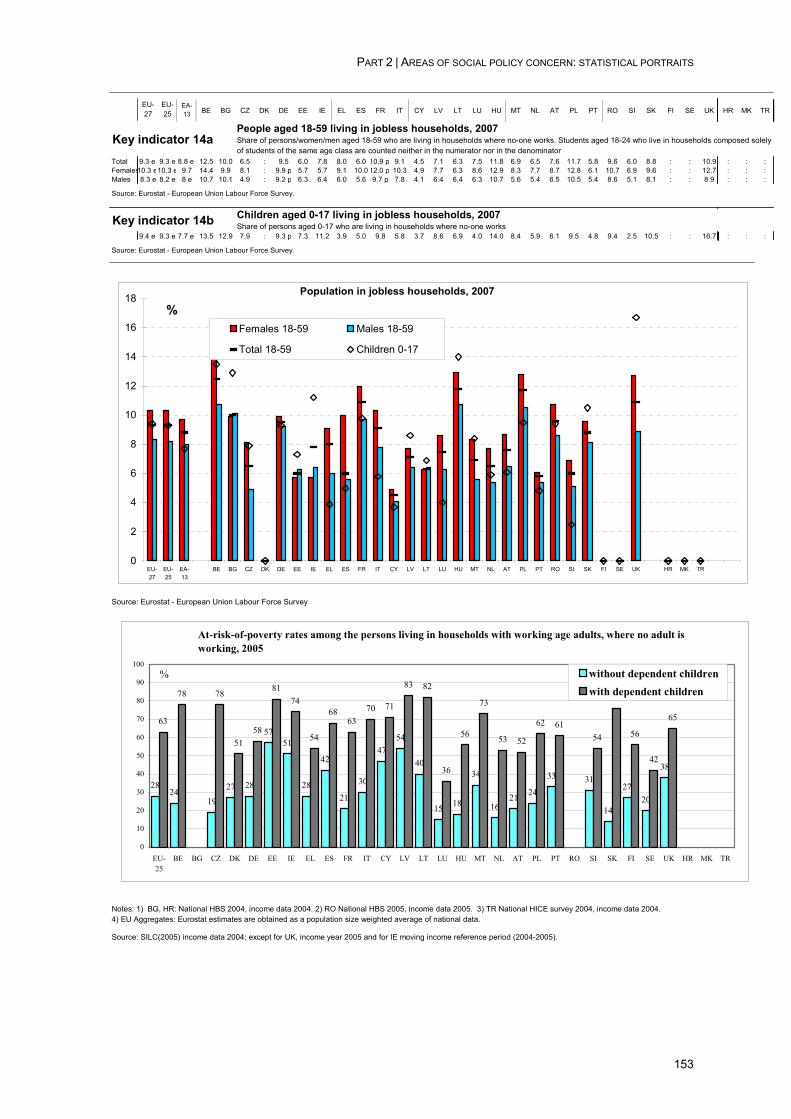
PART 2 | AREAS OF SOCIAL POLICY CONCERN: STATISTICAL PORTRAITS
153
EU-27
EU-25
EA-13 BE BG CZ DK DE EE IE EL ES FR IT CY LV LT LU HU MT NL AT PL PT RO SI SK FI SE UK HR MK TR
Key indicator 14aTotal 9.3 e 9.3 e 8.8 e 12.5 10.0 6.5 : 9.5 6.0 7.8 8.0 6.0 10.9 p 9.1 4.5 7.1 6.3 7.5 11.8 6.9 6.5 7.6 11.7 5.8 9.6 6.0 8.8 : : 10.9 : : :Females10.3 e10.3 e 9.7 14.4 9.9 8.1 : 9.9 p 5.7 5.7 9.1 10.0 12.0 p 10.3 4.9 7.7 6.3 8.6 12.9 8.3 7.7 8.7 12.8 6.1 10.7 6.9 9.6 : : 12.7 : : :Males 8.3 e 8.2 e 8 e 10.7 10.1 4.9 : 9.2 p 6.3 6.4 6.0 5.6 9.7 p 7.8 4.1 6.4 6.4 6.3 10.7 5.6 5.4 6.5 10.5 5.4 8.6 5.1 8.1 : : 8.9 : : :
Source: Eurostat - European Union Labour Force Survey.
Key indicator 14b9.4 e 9.3 e 7.7 e 13.5 12.9 7.9 : 9.3 p 7.3 11.2 3.9 5.0 9.8 5.8 3.7 8.6 6.9 4.0 14.0 8.4 5.9 6.1 9.5 4.8 9.4 2.5 10.5 : : 16.7 : : :
Source: Eurostat - European Union Labour Force Survey.
Source: Eurostat - European Union Labour Force Survey
Source: SILC(2005) income data 2004; except for UK, income year 2005 and for IE moving income reference period (2004-2005).
People aged 18-59 living in jobless households, 2007Share of persons/women/men aged 18-59 who are living in households where no-one works. Students aged 18-24 who live in households composed solely of students of the same age class are counted neither in the numerator nor in the denominator
Children aged 0-17 living in jobless households, 2007Share of persons aged 0-17 who are living in households where no-one works
Notes: 1) BG, HR: National HBS 2004, income data 2004. 2) RO National HBS 2005, income data 2005. 3) TR National HICE survey 2004, income data 2004.4) EU Aggregates: Eurostat estimates are obtained as a population size weighted average of national data.
Population in jobless households, 2007
0
2
4
6
8
10
12
14
16
18
EU-27
EU-25
EA-13
BE BG CZ DK DE EE IE EL ES FR IT CY LV LT LU HU MT NL AT PL PT RO SI SK FI SE UK HR MK TR
%Females 18-59 Males 18-59
Total 18-59 Children 0-17
At-risk-of-poverty rates among the persons living in households with working age adults, where no adult is working, 2005
2824
1927 28
5751
28
42
21
30
4754
40
15 18
34
1621 24
33 31
14
2720
38
63
78 78
5158
8174
54
6863
70 71
83 82
36
56
73
53 52
62 6154
76
56
42
65
0
10
20
30
40
50
60
70
80
90
100
EU-25
BE BG CZ DK DE EE IE EL ES FR IT CY LV LT LU HU MT NL AT PL PT RO SI SK FI SE UK HR MK TR
% without dependent childrenwith dependent children
THE SOCIAL SITUATION IN THE EUROPEAN UNION 2007
154
15. WOMEN AND MEN IN DECISION MAKING In the lower or single houses of national parliaments women continue to be under-represented in all Member States as the percentages of seats occupied by women in these bodies ranged in August 2007 from 9.2% in Malta to 47.3% in Sweden. The average of the 27 Member States’ percentages is 23.1%. In the European Parliament women's share of the national seats varied from no seats (Cyprus and Malta) to 51.9% (the Netherlands) in October 2007. Women occupied then 31.2% of the seats of the European Parliament.
Balanced participation of women and men in decision making is a key element in achieving gender equality and a fundamental requirement for well functioning democracies, which take into account the interests and needs of the whole population. There is however a persisting imbalance in the European Union concerning the participation of women and men at the level of decision making in politics, management, trade unions, universities, civil society and in the judiciary. Women are still far from taking an equal part in the decision making process. To tackle their under-representation is a structural and multifaceted challenge.
Political decision making
European level: Among the Members of the European Parliament there were 31.2% of women in October 2007, varying from no women from Cyprus and Malta to 57.9% (14 of 17) from the Netherlands. Eight of the twenty-seven (29.6%) Commissioners of the European Commission were then women.
National level: As an average in EU-27 (EU-25) Member States in August 2007, only 23.1% (23.6%) of the seats of the lower or single House of the national or federal Parliament were occupied by women. These percentages had risen 6.4 percentage points in nine years. The discrepancies between countries in August 2007 were fairly large, from a minimum share of 9.2% in Malta to a maximum of 47.3% in Sweden. The corresponding percentages of senior minister posts of the national governments in April/May 2007 were 23.5% for EU-27 and 24.5% for EU-25. The extremes were Cyprus and Romania with no women in the government and Finland with 60.0%.
Regional level: The regional institutions are not necessarily comparable in terms of power level and competency areas given the existing differences between political and administrative systems. Eleven Member States do not have regional councils and seven do not have regional governments78.
The regional council is the regional legislative assembly which has the legislative power on regional level According to data collected in autumn 2006, as an average in the 16 of the EU-27 Member States in which there exist regional councils, 26% of the members in and 14% of the presidents of the regional councils were women. The lowest percentages were observed in Hungary (12% women as members and 15% as presidents in Megyei Közgyülés), Italy (12% and 18% in Consiglio) and Slovakia (12% and not available in Zastupitelstvo) and the highest ones in Sweden (47% and 45% in Landstingsfullmäktige), Finland (43% and 21% in Maakuntavaltuusto) and partly in France (49% and 4% in Conseil Régional).
The regional government is the institution that is the governing authority of a regional political unit79. It has the highest executive powers at the regional level. According to data collected in autumn 2006, as an average in the 20 of the EU-27 Member States in which there exist regional governments, 24% of the members in and 8% of the presidents of the regional governments were women. The lowest percentages were observed in Portugal (6% women as members and 0% as presidents in Governo (Madeira/Açores) and Poland (8% and 0% in Zarząd województwa) and the highest ones in Sweden (46% and 30% in Landstingsstyrelsen) and Finland (49% and 21% in Maakuntahallitus).
Local level: For the local councils in the countries of the European Union, data are incomplete and not always comparable, due to the large differences in local level political decision-making. Data available for 1997 pointed to a female participation rate near to 20% in the local councils of the EU-15.
Balanced participation in decision-making will be helped by better reconciliation between work and family life
Reconciliation between work and family life is a key factor in women's accession to decision making posts. A study carried out by the Women's Institute80 in Spain shows that women who have acceded to managerial posts are more likely to be single than men, and have fewer children than their male counterparts. It further shows that the family may still constitute an important obstacle to the promotion of women to executive posts.
A project co-financed by the Gender Equality programme81 discussed the status of elected representatives in local councils in Europe and the difficulties met by women in taking up local mandates. It showed that problems with time management are a significant limiting factor. Fulfilling local mandates often implies time
78 In addition in Portugal an UK only a limited part of the country is covered by regional councils and governments. 79 In France (Président du conseil régional) and Greece (prefect/nomarchis) the regional government consists of only one
person. 80 Instituto de la Mujer (An autonomous public body), 'El acceso de las mujeres a los puestos de dirección'. The study
'Access of women to Executive Posts' by Ester Barberà, Professor of Basic Psychology at the Universidad de Valencia.
81 Why not Women Town Counsellors? http://perso.orange.fr/ellesaussi/index.htm (Bibliographie)

PART 2 | AREAS OF SOCIAL POLICY CONCERN: STATISTICAL PORTRAITS
155
schedules not compatible with raising children, if fathers do not share family responsibilities or adequate and affordable childcare services are not available.
Policy context
Equal treatment of women and men is a fundamental principle of Community law. The persistent under-representation of women in all areas of decision-making making represents an important obstacle to the democratic development of the European Union, to its cohesion and globally to its competitiveness, which requires action to be taken at Community level.
Political support was manifested by the Council in recommendation 96/694 of 2nd December 1996 on the Balanced Participation of Women in the decision-making process. However, the Commission’s report published in March 2000 on the implementation of this recommendation concluded that despite the overall positive outcome of policies applied since 1996, the level of improvement did not match expectations and that further action was required. In this context it is worthwhile noting the efforts and considerable progress made in most Member States to increase the participation of women in decision-making processes in recent years, even if the situation varies significantly between countries. Nevertheless, much remains to be done to improve the overall representation of women in decision-making across the Union.
Moreover, in the framework of the follow-up of the 1995 Beijing Platform for Action, it was decided to develop benchmarks and indicators at EU level to monitor its implementation. One area of concern of the Platform relates to women in power and decision-making. Therefore, the Council of the European Union adopted on 22 October 1999 conclusions on the subject of gender balance in all decision-making processes and took note of the Union Presidency report on Indicators and Benchmarking for Women in the Decision-making process in the political field.
Furthermore, in 2003, the Council of the European Union adopted new conclusions on women and men in economic decision making and took note of the Union Presidency report including nine indicators on Representation of Women and Men in Economic Decision-making Centres.
The Commission's Roadmap for equality between women and men (2006-2010) includes among its six priority areas for action on gender equality the promotion of equal representation of women and men in decision-making.
Alongside policy actions to tackle the under-representation of women in power and decision-making, the European Commission has recognised in a number of reports the need for reliable and comparable data in order to systematically monitor the current situation and the progress that is being made. Consequently, in 2002 the Commission initiated the process to establish a regular collection and publication of data on decision-making across Europe. The resulting database is accessible free on-line82 and currently covers decision-making positions within the EU institutions, the 27 EU Member States, EEA countries (Iceland, Liechtenstein and Norway) and two candidate countries (Turkey and Croatia). It is an important source of information for policy makers, researchers, students and all those interested in knowing the state of play in decision-making.
Methodological notes
Since Eurostat doesn’t collect data in this domain, other sources have been used. They are given in the tables and graphs.
Links to other parts of the report
Education and its outcomes (2.5), Earnings of women and men (2.16) and Gender equality (Annex 1.3.7).
Further reading
• Database of the European Commission on women and men in decision making : http://europa.eu.int/comm/employment_social/women_men_stats/index_en.htm
• Report on equality between women and men (in the European Union) 2007, European Commission, Catalogue No KE-AJ-07-001-EN-C, ISBN 92-79-03496-0, ISSN 1680-2381; Document drawn up on the basis of COM(2007)49.
• ETAN report on Women and sciences: Promoting excellence through mainstreaming gender equality, 2000.
• Women in science : Report She Figures: http://ec.europa.eu/research/science-society/pdf/she_figures_2006_en.pdf
82 The database is hosted on the website of DG-Employment, Social Affairs and Equal Opportunities and can be
consulted at http://ec.europa.eu/employment_social/women_men_stats/index_en.htm
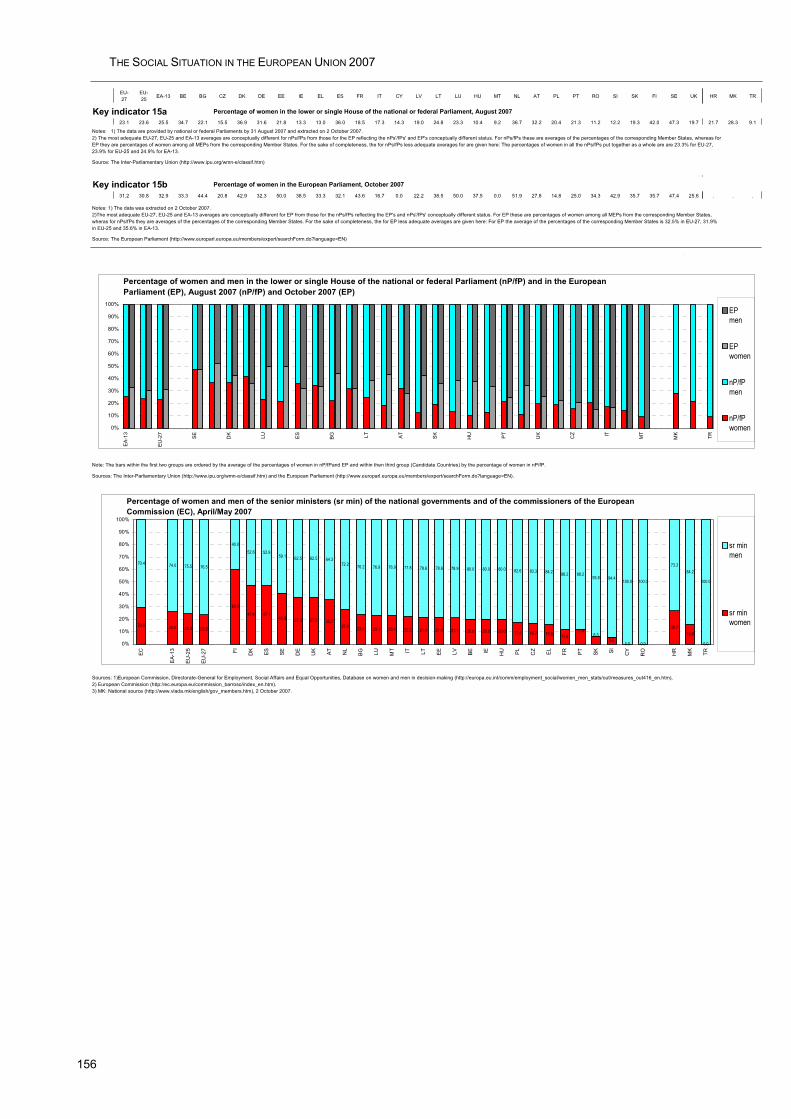
THE SOCIAL SITUATION IN THE EUROPEAN UNION 2007
156
EU-27
EU-25 EA-13 BE BG CZ DK DE EE IE EL ES FR IT CY LV LT LU HU MT NL AT PL PT RO SI SK FI SE UK HR MK TR
Key indicator 15a Percentage of women in the lower or single House of the national or federal Parliament, August 200723.1 23.6 25.5 34.7 22.1 15.5 36.9 31.6 21.8 13.3 13.0 36.0 18.5 17.3 14.3 19.0 24.8 23.3 10.4 9.2 36.7 32.2 20.4 21.3 11.2 12.2 19.3 42.0 47.3 19.7 21.7 28.3 9.1
Source: The Inter-Parliamentary Union (http://www.ipu.org/wmn-e/classif.htm)
Key indicator 15b Percentage of women in the European Parliament, October 200731.2 30.8 32.9 33.3 44.4 20.8 42.9 32.3 50.0 38.5 33.3 32.1 43.6 16.7 0.0 22.2 38.5 50.0 37.5 0.0 51.9 27.8 14.8 25.0 34.3 42.9 35.7 35.7 47.4 25.6 . . .
Source: The European Parliament (http://www.europarl.europa.eu/members/expert/searchForm.do?language=EN)
Note: The bars within the first two groups are ordered by the average of the percentages of women in nP/fPand EP and within then third group (Candidate Countries) by the percentage of women in nP/fP.
Sources: The Inter-Parliamentary Union (http://www.ipu.org/wmn-e/classif.htm) and the European Parliament (http://www.europarl.europa.eu/members/expert/searchForm.do?language=EN).
Notes: 1) The data was extracted on 2 October 2007.2)The most adequate EU-27, EU-25 and EA-13 averages are conceptually different for EP from those for the nPs/fPs reflecting the EP's and nPs'/fPs' conceptually different status. For EP these are percentages of women among all MEPs from the corresponding Member States, wheras for nPs/fPs they are averages of the percentages of the corresponding Member States. For the sake of completeness, the for EP less adequate averages are given here: For EP the average of the percentages of the corresponding Member States is 32.5% in EU-27, 31.9% in EU-25 and 35.6% in EA-13.
Sources: 1)European Commission, Directorate-General for Employment, Social Affairs and Equal Opportunities, Database on women and men in decision-making (http://europa.eu.int/comm/employment_social/women_men_stats/out/measures_out416_en.htm), 2) European Commission (http://ec.europa.eu/commission_barroso/index_en.htm).3) MK: National source (http://www.vlada.mk/english/gov_members.htm), 2 October 2007.
Notes: 1) The data are provided by national or federal Parliaments by 31 August 2007 and extracted on 2 October 2007. 2) The most adequate EU-27, EU-25 and EA-13 averages are conceptually different for nPs/fPs from those for the EP reflecting the nPs'/fPs' and EP's conceptually different status. For nPs/fPs these are averages of the percentages of the corresponding Member States, whereas for EP they are percentages of women among all MEPs from the corresponding Member States. For the sake of completeness, the for nPs/fPs less adequate averages for are given here: The percentages of women in all the nPs/fPs put together as a whole are are 23.3% for EU-27, 23.9% for EU-25 and 24.9% for EA-13.
Percentage of women and men in the lower or single House of the national or federal Parliament (nP/fP) and in the European Parliament (EP), August 2007 (nP/fP) and October 2007 (EP)
0%
10%
20%
30%
40%
50%
60%
70%
80%
90%
100%
EA-1
3
EU-2
7
SE DK LU ES BG LT AT
SK HU PT
UK CZ IT MT
MK
TR
EPmen
EPwomen
nP/fPmen
nP/fPwomen
Percentage of women and men of the senior ministers (sr min) of the national governments and of the commissioners of the European Commission (EC), April/May 2007
29.6 26.0 24.5 23.5
60.047.4 47.1
40.9 37.5 37.5 35.727.8 23.8 23.1 23.1 22.2 21.4 21.4 21.1 20.0 20.0 20.0 17.4 16.7 15.8 11.8
5.60.0 0.0
26.715.8
0.0
70.4 74.0 75.5 76.5
40.052.6 52.9
59.1 62.5 62.5 64.372.2 76.2 76.9 76.9 77.8 78.6 78.6 78.9 80.0 80.0 80.0 82.6 83.3 84.2 88.2 88.2
93.8 94.4100.0 100.0
73.384.2
100.0
11.86.3
0%
10%
20%
30%
40%
50%
60%
70%
80%
90%
100%
EC
EA-1
3
EU-2
5
EU-2
7 FI DK ES SE DE
UK AT NL
BG LU MT IT LT EE LV BE IE HU PL CZ EL FR PT SK SI CY
RO HR
MK
TR
sr minmen
sr minwomen
PART 2 | AREAS OF SOCIAL POLICY CONCERN: STATISTICAL PORTRAITS
157
16. EARNINGS OF WOMEN AND MEN In the EU-27, the average gross hourly earnings of women in 2005 were estimated at 15% less than the gross hourly earnings of men83. The smallest differences are found in Belgium, Malta and Slovenia, the biggest in Germany, Estonia, Cyprus, Slovakia, Finland and the United Kingdom. At EU level the difference remains fairly the same since 1994, the first date for which data are available. To reduce gender pay differences both direct pay-related discrimination and indirect discrimination related to labour market participation, occupational choice and career progression have to be addressed.
Important pay differences between men and women persist in Europe, with the difference between men’s and women’s average gross hourly earnings around 15%
According to national Structure of Earnings Surveys (SES) and other national earnings surveys, Statistics on Income and Living Conditions (EU-SILC: EL, IE and AT for 2003; BE, EL, ES, IE, IT, AT, PT, UK for 2004 and 2005) and the European Community Household Panel (ECHP: BE and IT for 2001), the gender pay gap – difference in average gross hourly earnings as a percentage of men’s average gross hourly earnings – varied between 4% and 25% in 2005. Women’s earnings remain on average below those of men in all EU countries. The statistics show that development over time varies at country level84. Differences decreased in many Member States (BE, EE, IE, GR, CY, LV, LU, HU, MT, NL, RO, SI, UK),but slightly increased in Denmark and Finland. In the remaining countries pay differences were fairly stable over time85.
The pay differences are related both to differences in the personal and job characteristics of men and women in employment and to differences in the remuneration of these characteristics
Women and men in employment show important differences with respect to their personal and job characteristics, including labour market participation, employment, earnings, the sector and occupational employment structures as well as job status, job type and career progression. The differences in pay are particularly high among older workers, the high-skilled and those employed with supervisory or managerial job status. They also vary between different sectors of activity and different occupations. The statistics on annual gross earnings (full-time workers) from 2005 show gender pay gaps in two sectors of activity, Industry and Wholesale and retail trade; Repair of motor vehicles and personal & household goods, for which data are available for most countries. Gender pay gaps vary between 10% in Belgium and 35% in Hungary for Industry which is a strongly male dominated sector. They vary between 19% in Belgium and 36% in the Slovakia for Wholesale and retail trade etc. which is a sector slightly dominated by women. In most countries the gender pay gaps are bigger in Wholesale and retail trade etc. than in Industry.
Women have managerial responsibilities much less frequently than men in the Member States for which data are available from the European Labour Force Survey. In the EU-25 Member States, 32% of managers are women in 2005, a slight increase since 2000. The highest percentages of women among managers are found in Lithuania and Latvia, while the lowest percentages are in Malta and Cyprus.
Women are furthermore often in non-standard employment such as fixed-term and part-time work. In the EU-25, 31.4% of women were working part-time in 2004, against 7% of men. Compared to 2001, the share of part-time employment rose by 3.1 percentage points for women and 1.5 percentage points for men. The share of female part-timers exceeded 30% in France, Denmark and Luxembourg, 40% in Sweden, Austria, Belgium, United Kingdom and Germany and even reached 75% in the Netherlands. Conversely, the share of part-timers among female workers was very low in Bulgaria, Slovakia, Hungary, the Czech Republic and Latvia.. Men are thus not only more concentrated in higher paid sectors and occupations, but within these sectors and occupations they are also more likely than women to hold managerial responsibilities and if they do so the earnings are relatively higher.
Furthermore, while both men and women have lower earnings in female-dominated sectors and occupations, this wage penalty is more pronounced for women. Finally, independently of the initial pay differential the gender pay differential widens considerably throughout working life.
Both the above differences in the composition of the male and female workforce and differences in the remuneration of the personal and job characteristics between men and women contribute to the overall gender differences in pay. As shown in Employment in Europe 2005, in particular differences in the male and female workforce composition related to the sector of employment and the occupational category contribute significantly to the gender differences in pay. Since such compositional differences can be due to various forms of indirect discrimination such as traditions and social norms and constraints on choices related to education, labour market participation, occupation and career progression both types of gender differences and both forms of potential discrimination — direct pay-related one and indirect one related to the above choices – have to be addressed to reduce the differences in pay.
83 Sources: Gender Pay Gap statistics are from national sources for CZ, EE, FR, CY, LV, LT, LU, HU, MT, NL, PL, SI,
SK, SE and from the European Community Household Panel survey (ECHP) for BE, DK, DE, EL, ES, IE, IT, AT, PT, FI, UK for data until 2001. In 2002, the ECHP source was replaced either by national sources or by the European Survey on Income and Living Conditions (EU-SILC).
84 Cross national and over time comparisons must be interpreted with caution, due to the multiplicity of data sources and to methodological differences in the national estimates
85 Apart from changes that can be attributed to breaks in the statistical series.
THE SOCIAL SITUATION IN THE EUROPEAN UNION 2007
158
Policy context
The important gender differences which persist in the European labour markets need to be tackled to promote economic growth, employment and social cohesion.
The EC Treaty (Article 141) states that 'Each Member State shall ensure that the principle of equal pay for male and female workers for equal work or work of equal value is applied'. For the purpose of this Article, 'pay' means the ordinary basic or minimum wage or salary and any other consideration, whether in cash or in kind, which the worker receives directly or indirectly, in respect of his employment, from his employer. Equal pay without discrimination based on sex means:
(a) that pay for the same work at piece rates shall be calculated on the basis of the same unit of measurement;
(b) that pay for work at time rates shall be the same for the same job.
Council Directive 75/117/EEC of 10 February 1975 on the approximation of the laws of the Member States relating to the application of the principle of equal pay for men and women.
The 2000 Employment Guidelines (No 19): 'They (Member States) will initiate positive steps to promote equal pay for equal work or work of equal value and to diminish differentials in incomes between women and men.' The 2001 Employment Guidelines further specified that actions are needed to address gender differences in pay in both the private and public sectors and that the impact of policies on gender differences in pay should be identified and addressed. The 2002 Employment Guidelines also asked to set targets to tackle the differences in pay and to include in the strategy, inter alia, a review of job classification and pay systems to eliminate gender bias, improving statistical and monitoring systems, and awareness-raising and transparency as regards differences in pay. The 2003 Employment Guidelines says that policies will aim to achieve by 2010 a substantial reduction in the gender pay gap in each Member State, through a multi-faceted approach addressing the underlying factors of the gender pay gap, including sectoral and occupational segregation, education and training.
Communication from the Commission to the Council, the European Parliament, the Economic and Social Committee and the Committee of the Regions on 'Employment and social policies: a framework for investing in quality'.
The Employment Committee Report on Indicators of Quality in Work contains indicators on earnings under the form of transition tables.
Methodological notes
The Gender Pay Gap in unadjusted form is given as the difference between average gross hourly earnings of male paid employees and of female paid employees as a percentage of average gross hourly earnings of male paid employees. The population consists of all paid employees aged 16-64 that are 'at work 15+ hours per week'.
Sources: The gender pay gap is based on several data sources, including the European Community Household Panel (ECHP), the EU Survey on Income and Living Conditions (EU-SILC) and national sources.
Administrative data are used for Luxembourg and the Labour Force Survey is used for France (up to 2002) and Malta. All other sources are national surveys except as follows:
2004, 2005: Statistics on Income and Living Conditions (EU-SILC) – BE, EL, ES, IE, IT, AT, PT and UK (provisional)
2003: Statistics on Income and Living Conditions — EL, IE and AT
2002: European Community Household Panel (ECHP) — EL
2001 and before: European Community Household Panel (ECHP) — BE, DE, IT, DK, IE, UK, EL, ES, PT, AT, FI.
EU-27, EU-25 and EU-15 estimates are population-weighted averages of the latest available national values adjusted, where possible, to take into account a change in the data source.
CZ — Figures are based on median earnings of employees working 30 or more planned hours per week.
DK — A change of data source from 2002 is estimated to have increased the gender pay gap value by 4 percentage points.
DE — From 2002 national earnings surveys and the German Socio-Economic Panel have been used. This change of source is estimated to have increased the gender pay gap value by 1 percentage point.
ES — From 2002 data from tax returns and the labour force survey have been used. This is estimated to have increased the gender pay gap value by 3 percentage points
FR — A change of data source in 2003 is estimated to have decreased the gender pay gap value by 1 percentage point
PART 2 | AREAS OF SOCIAL POLICY CONCERN: STATISTICAL PORTRAITS
159
FI — A change of data source from 2002 is estimated to have increased the gender pay gap value by 4 percentage points
UK — A change of data source from 2002 is estimated to have increased the gender pay gap value by 2 percentage points
The gender pay gap is not adjusted for age, occupation and sector. In May 2002, the ECHP Working Group concluded that an adjusted gender pay gap cannot be calculated on the basis of the ECHP.
Annual harmonised earnings data relate to enterprises with 10 or more employees, except for
HU – enterprises employing more than 4 employees
ES – enterprises employing more than 5 employees
BE, LU, UK, CZ, CY and SK – enterprises from all size groups
All data relate to full-time employees except for CZ, EE, LV and SI for which data relate to full-time equivalents.
Eurostat quarterly labour force data (QLFD) consist of employment by economic activity and status in employment, further broken down by sex and some job characteristics. They are based on the EU Labour Force Survey (LFS) and on European System of National Accounts (ESA 95).
Quarterly LFS data are available since the first quarter of 2003 in all EU countries, except Germany (provides quarterly estimates until German LFS becomes quarterly from 2005) and Luxembourg. Data for France refer to metropolitan France (excluding overseas departments).
The classification by part-time full-time job depends on a direct question in the LFS, except for the Netherlands where it depends on a threshold on the basis of the number of hours usually worked.
Links to other parts of the report
Employment (2.7), Labour market and Gender equality (Annex 1.3.7).
Further reading
• Tackling the pay gap between women and men (COM(2007) 424 final), Communication from the Commission to the European Parliament, the Council, the European Economic and Social Committee and the Committee of the Regions, July 2007.
• Link to communication: http://ec.europa.eu/employment_social/news/2007/jul/genderpaygap_en.pdf
• Gender equality policy: http://ec.europa.eu/employment_social/gender_equality
• Study on The gender pay gap: origins and policy responses: http://ec.europa.eu/employment_social/publications/2006/ke7606200_en.pdf
• European Year of Equal Opportunities for All: http://equality2007.europa.eu
• Fourth European Working conditions survey: http://www.eurofound.europa.eu/ewco/surveys/EWCS2005/index.htm
• Report on equality between women and men – 2007, February 2007, European Commission, Directorate-General for Employment, Social Affairs and Equal Opportunities, Unit G.1
• The gender pay gap — Origins and policy responses — A comparative review of 30 European countries, July 2006, European Commission Directorate-General for Employment, Social Affairs and Equal Opportunities, Unit G.1
• Gender Equality: a step ahead — A Roadmap for the future, Report from the conference organised by the European Commission on 4 and 5 May 2006, July 2006, European Commission Directorate-General for Employment, Social Affairs and Equal Opportunities Unit G.1
• A Roadmap for equality between women and men 2006-2010, April 2006, European Commission, Directorate-General for Employment, Social Affairs and Equal Opportunities, Unit G.1
• Report on equality between women and men, 2006, February 2006, European Commission, Directorate-General for Employment, Social Affairs and Equal Opportunities, Unit G.1
THE SOCIAL SITUATION IN THE EUROPEAN UNION 2007
160
• Making work pay debates from a gender perspective — A comparative review of some recent policy reforms in thirty European countries, September 2005, European Commission Directorate-General for Employment, Social Affairs and Equal Opportunities, Unit G.1
• Employment in Europe 2005, European Commission, Employment and Social Affairs DG, September 2005.
• 25th CEIES seminar: Gender statistics — Occupational segregation: extent, causes and consequences, 2004 edition, Stockholm, Monday 21 and Tuesday 22 June 2004, EUROSTAT, ISSN 1725-1338.
• Employment in Europe 2003, European Commission, Employment and Social Affairs DG, September 2003.
• Working paper of the Commission services on gender pay gaps in European labour markets (SEC(2003)937)
• Employment in Europe 2002, section 'Assessing gender pay gaps in the EU', September 2002. European Commission, Employment and Social Affairs DG.
• Panorama of the European Union (Population and social conditions): The life of women and men in Europe. A statistical portrait. Eurostat 2002.
• OECD Employment Outlook 2002 — Chapter 2 Women at Work: Who are They and How are They Faring?
• Statistics in Focus (Population and social conditions): Earnings of men and women in the EU: the gap narrowing but only slowly, No 5/2001 and Women’s earnings in the E.U: 28% less than men’s, No 6/1999. Eurostat.
• European Parliament: — Resolution and report on equal pay for work of equal value
• Industrial Relations in Europe, 2000. European Commission, Employment and Social Affairs DG.
• Indicators on gender pay equality: The Belgian presidency’s report, 2001.
• The adjusted gender pay gap: a critical appraisal of the standard decomposition techniques. Network of experts on employment and equality between women and men, DG Employment and Social Affairs.
• The gender pay gap and the gender mainstreaming pay policy: synthesis report of the gender pay equality in EU Member States. Network of experts on employment and equality between women and men, DG Employment and Social Affairs.
• Report on Equality between Women and Men in the European Union, 2005, COM(2005)44 final.
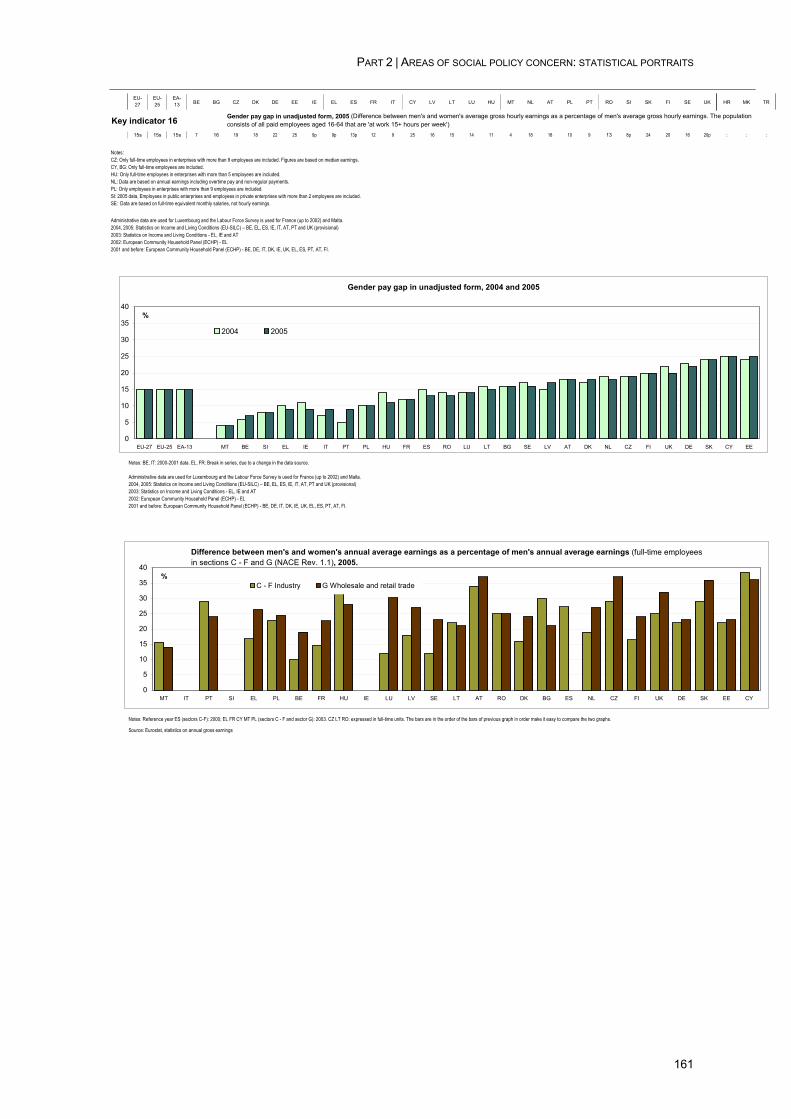
PART 2 | AREAS OF SOCIAL POLICY CONCERN: STATISTICAL PORTRAITS
161
EU-27
EU-25
EA-13 BE BG CZ DK DE EE IE EL ES FR IT CY LV LT LU HU MT NL AT PL PT RO SI SK FI SE UK HR MK TR
Key indicator 1615s 15s 15s 7 16 19 18 22 25 9p 9p 13p 12 9 25 16 15 14 11 4 18 18 10 9 13 8p 24 20 16 20p : : :
Source: Eurostat - Harmonised statistics on earnings
Notes: BE, IT: 2000-2001 data. EL, FR: Break in series, due to a change in the data source.
Notes: Reference year ES (sectors C-F): 2000; EL FR CY MT PL (sectors C - F and sector G): 2003. CZ LT RO: expressed in full-time units. The bars are in the order of the bars of previous graph in order make it easy to compare the two graphs.
Source: Eurostat, statistics on annual gross earnings
Administrative data are used for Luxembourg and the Labour Force Survey is used for France (up to 2002) and Malta.2004, 2005: Statistics on Income and Living Conditions (EU-SILC) – BE, EL, ES, IE, IT, AT, PT and UK (provisional)2003: Statistics on Income and Living Conditions - EL, IE and AT2002: European Community Household Panel (ECHP) - EL2001 and before: European Community Household Panel (ECHP) - BE, DE, IT, DK, IE, UK, EL, ES, PT, AT, FI.
Gender pay gap in unadjusted form, 2005 (Difference between men's and women's average gross hourly earnings as a percentage of men's average gross hourly earnings. The population consists of all paid employees aged 16-64 that are 'at work 15+ hours per week')
Administrative data are used for Luxembourg and the Labour Force Survey is used for France (up to 2002) and Malta.2004, 2005: Statistics on Income and Living Conditions (EU-SILC) – BE, EL, ES, IE, IT, AT, PT and UK (provisional)2003: Statistics on Income and Living Conditions - EL, IE and AT2002: European Community Household Panel (ECHP) - EL2001 and before: European Community Household Panel (ECHP) - BE, DE, IT, DK, IE, UK, EL, ES, PT, AT, FI.
Notes: CZ: Only full-time employees in enterprises with more than 9 employees are included. Figures are based on median earnings.CY, BG: Only full-time employees are included.HU: Only full-time employees in enterprises with more than 5 employees are included.NL: Data are based on annual earnings including overtime pay and non-regular payments. PL: Only employees in enterprises with more than 9 employees are included.SI: 2005 data, Employees in public enterprises and employees in private enterprises with more than 2 employees are included.SE: Data are based on full-time equivalent monthly salaries, not hourly earnings.
Gender pay gap in unadjusted form, 2004 and 2005
0
5
10
15
20
25
30
35
40
EU-27 EU-25 EA-13 MT BE SI EL IE IT PT PL HU FR ES RO LU LT BG SE LV AT DK NL CZ FI UK DE SK CY EE
%
2004 2005
Difference between men's and women's annual average earnings as a percentage of men's annual average earnings (full-time employees in sections C - F and G (NACE Rev. 1.1), 2005.
0
5
10
15
20
25
30
35
40
MT IT PT SI EL PL BE FR HU IE LU LV SE LT AT RO DK BG ES NL CZ FI UK DE SK EE CY
%C - F Industry G Wholesale and retail trade
THE SOCIAL SITUATION IN THE EUROPEAN UNION 2007
162
17. LIFE AND HEALTH EXPECTANCIES Life expectancy in EU-27 was 80.8 years for women and 74.6 for men in EU-27 in 2003. In all twenty-seven Member States and Croatia and the former Yugoslav Republic of Macedonia women live longer than men.
Women can expect to live 6.2 years longer than men in EU-27
From 1960 to 2005, life expectancy of women and men has risen quite steadily in almost all countries. Throughout the Union, women live longer than men. In 2003, the life expectancy of women in EU-27 was 80.8 years while that for men was 74.6 years which makes a difference of 6.2 years. Across the EU, considerable differences can be observed: life expectancy at birth varied for men from less than 66 years in Latvia and Lithuania to 78.5 years in Sweden and for women from around 76 in Bulgaria, Latvia and Romania to almost 84 years in Spain and France.
Differences in life expectancy without disability less distinct between women and men
Health expectancies are a group of health indicators combining data on mortality and disability / morbidity. The structural indicator Healthy Life Years (HLY) measures the number of remaining years that a person of a specific age is still expected to live without any severe or moderate limitation in functioning because of health problems / without any disability. A woman could expect to live 52 years without disability in Estonia and Finland, and up to over 68 years in Denmark and Malta. For men the Healthy Life Years ranged from 48 in Estonia to 68.5, again Denmark and Malta reporting the highest values. In most countries the HLY for women were higher than for men, but the differences were substantially smaller than for life expectancy. And, in five countries, men could expect to live about as long as women without disability (Belgium, Denmark, Germany, Spain and Luxembourg), and in 4 countries even longer than women (Cyprus, the Netherlands, Portugal and Sweden).
Circulatory diseases and cancer remained the major causes of death
Mortality patterns differ significantly according to age and sex. As a general rule, mortality is higher among men than women in all age groups. For both men and women in EU-27, circulatory diseases were the major cause of death in 2005, accounting for 38% of deaths for men and 45% for women. The second most frequent cause of death was cancer responsible for 28% of deaths for men and 22% of women in 2005. Amongst the cancers, malignant neoplasm of larynx and trachea/bronchus/lung were the most common cause of death for men (29% of all deaths due to cancer) while for women it was breast cancer (17% of all deaths due to cancer). Considering all ages, diseases of the respiratory system were the 3rd most frequent cause of death (8% of all deaths). However, as illustrated by the chart, diseases of the digestive system were far more frequent in the middle age groups. More than 163 000 men died through external causes of injury and poisoning in 2005; that were 7% of all deaths. This cause of death is particularly prominent for younger men (15-39) where almost half of deaths were due to external causes. With less than 4% of all deaths, external causes played a less prominent role for women.
Density of health care professionals is getting higher
Between 1995 and 2005, the density of physicians, dentists and nurses (expressed per 100 000 opulation) increased in almost all Member States but the figures across Europe vary. For doctors, they ranged from around 400 per 100 000 population in Belgium and Lithuania to less than 240 in Poland, Romania, Slovenia and the United Kingdom. For dentists as many as 95 per 100 000 population were reported for Cyprus but only 37 per 100 000 for Poland. Density of physicians increased strongest in Ireland, Luxembourg and Spain while Italy, Poland and Lithuania reported an overall slight decrease of their density rates (and Hungary with a decrease of 8% even a quite substantial one).
Eight Member States discharged over 20,000 in-patients per 100 000 population in 2005
The number of hospital discharges of in-patients ranged from less than 7,000 in Cyprus and Malta to over 20,000 in the Czech Republic, Germany, Latvia, Lithuania, Hungary, Austria, Romania and Finland. These differences may partly reflect the differences in organisation of healthcare services. Following the International Classification of Diseases (ICD), the highest share of discharges was reported for diseases of the circulatory system (around 14% of discharges for the countries with available data by diagnosis, the number of discharges per 100 000 ranging from less than 1,000 in Cyprus and Malta and 4,475 in Lithuania), followed by discharges for diseases of the digestive system (almost 10% of all discharges, in the Czech Republic, Germany, Austria and Romania, more than 2,000 in-patients are discharged per year due to digestive diseases). Cancers and injuries also played an important role, each accounting for around 9% of all hospital discharges.
The number of hospital beds further decreases
For many years the total number of hospital beds has decreased continuously in the EU. For EU-27, it decreased over 20% between 1995 and 2005. With up to 400 beds per 100 000 inhabitants, Denmark, Spain, Italy, Cyprus, Portugal and the United Kingdom reported the lowest number of beds per 100 000 in EU-27. The Czech Republic reported the highest rate with 850 hospital beds per 100 000 population, followed by Germany (846) and Lithuania (815). All these numbers refer to all available beds in both public and private hospitals. A considerable share of the observed reduction in hospital beds is likely to have been caused by the
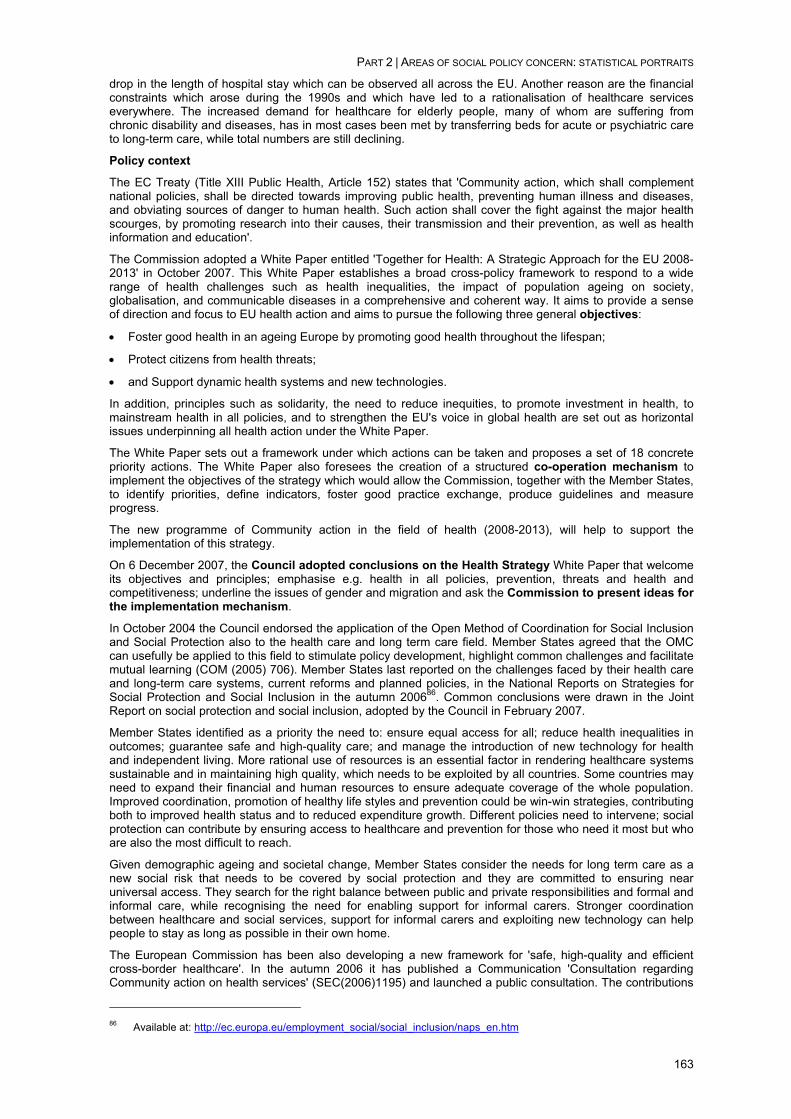
PART 2 | AREAS OF SOCIAL POLICY CONCERN: STATISTICAL PORTRAITS
163
drop in the length of hospital stay which can be observed all across the EU. Another reason are the financial constraints which arose during the 1990s and which have led to a rationalisation of healthcare services everywhere. The increased demand for healthcare for elderly people, many of whom are suffering from chronic disability and diseases, has in most cases been met by transferring beds for acute or psychiatric care to long-term care, while total numbers are still declining.
Policy context
The EC Treaty (Title XIII Public Health, Article 152) states that 'Community action, which shall complement national policies, shall be directed towards improving public health, preventing human illness and diseases, and obviating sources of danger to human health. Such action shall cover the fight against the major health scourges, by promoting research into their causes, their transmission and their prevention, as well as health information and education'.
The Commission adopted a White Paper entitled 'Together for Health: A Strategic Approach for the EU 2008-2013' in October 2007. This White Paper establishes a broad cross-policy framework to respond to a wide range of health challenges such as health inequalities, the impact of population ageing on society, globalisation, and communicable diseases in a comprehensive and coherent way. It aims to provide a sense of direction and focus to EU health action and aims to pursue the following three general objectives:
• Foster good health in an ageing Europe by promoting good health throughout the lifespan;
• Protect citizens from health threats;
• and Support dynamic health systems and new technologies.
In addition, principles such as solidarity, the need to reduce inequities, to promote investment in health, to mainstream health in all policies, and to strengthen the EU's voice in global health are set out as horizontal issues underpinning all health action under the White Paper.
The White Paper sets out a framework under which actions can be taken and proposes a set of 18 concrete priority actions. The White Paper also foresees the creation of a structured co-operation mechanism to implement the objectives of the strategy which would allow the Commission, together with the Member States, to identify priorities, define indicators, foster good practice exchange, produce guidelines and measure progress.
The new programme of Community action in the field of health (2008-2013), will help to support the implementation of this strategy.
On 6 December 2007, the Council adopted conclusions on the Health Strategy White Paper that welcome its objectives and principles; emphasise e.g. health in all policies, prevention, threats and health and competitiveness; underline the issues of gender and migration and ask the Commission to present ideas for the implementation mechanism.
In October 2004 the Council endorsed the application of the Open Method of Coordination for Social Inclusion and Social Protection also to the health care and long term care field. Member States agreed that the OMC can usefully be applied to this field to stimulate policy development, highlight common challenges and facilitate mutual learning (COM (2005) 706). Member States last reported on the challenges faced by their health care and long-term care systems, current reforms and planned policies, in the National Reports on Strategies for Social Protection and Social Inclusion in the autumn 200686. Common conclusions were drawn in the Joint Report on social protection and social inclusion, adopted by the Council in February 2007.
Member States identified as a priority the need to: ensure equal access for all; reduce health inequalities in outcomes; guarantee safe and high-quality care; and manage the introduction of new technology for health and independent living. More rational use of resources is an essential factor in rendering healthcare systems sustainable and in maintaining high quality, which needs to be exploited by all countries. Some countries may need to expand their financial and human resources to ensure adequate coverage of the whole population. Improved coordination, promotion of healthy life styles and prevention could be win-win strategies, contributing both to improved health status and to reduced expenditure growth. Different policies need to intervene; social protection can contribute by ensuring access to healthcare and prevention for those who need it most but who are also the most difficult to reach.
Given demographic ageing and societal change, Member States consider the needs for long term care as a new social risk that needs to be covered by social protection and they are committed to ensuring near universal access. They search for the right balance between public and private responsibilities and formal and informal care, while recognising the need for enabling support for informal carers. Stronger coordination between healthcare and social services, support for informal carers and exploiting new technology can help people to stay as long as possible in their own home.
The European Commission has been also developing a new framework for 'safe, high-quality and efficient cross-border healthcare'. In the autumn 2006 it has published a Communication 'Consultation regarding Community action on health services' (SEC(2006)1195) and launched a public consultation. The contributions
86 Available at: http://ec.europa.eu/employment_social/social_inclusion/naps_en.htm
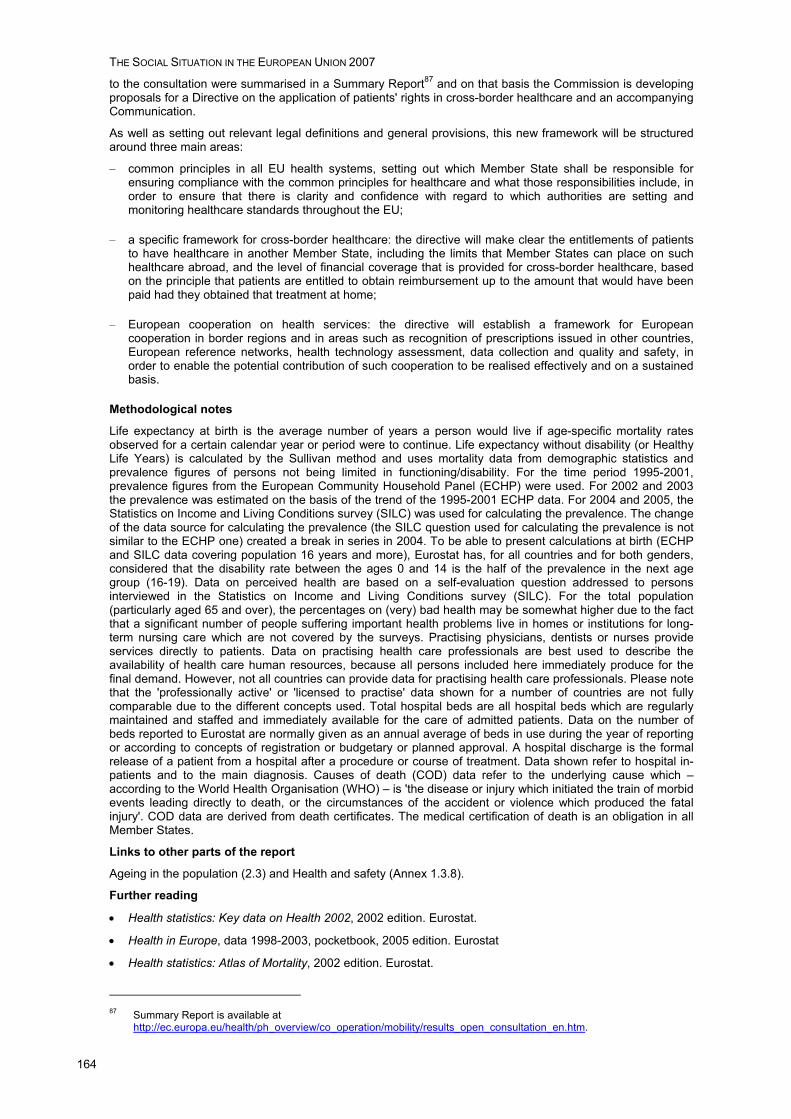
THE SOCIAL SITUATION IN THE EUROPEAN UNION 2007
164
to the consultation were summarised in a Summary Report87 and on that basis the Commission is developing proposals for a Directive on the application of patients' rights in cross-border healthcare and an accompanying Communication.
As well as setting out relevant legal definitions and general provisions, this new framework will be structured around three main areas:
– common principles in all EU health systems, setting out which Member State shall be responsible for ensuring compliance with the common principles for healthcare and what those responsibilities include, in order to ensure that there is clarity and confidence with regard to which authorities are setting and monitoring healthcare standards throughout the EU;
– a specific framework for cross-border healthcare: the directive will make clear the entitlements of patients to have healthcare in another Member State, including the limits that Member States can place on such healthcare abroad, and the level of financial coverage that is provided for cross-border healthcare, based on the principle that patients are entitled to obtain reimbursement up to the amount that would have been paid had they obtained that treatment at home;
– European cooperation on health services: the directive will establish a framework for European cooperation in border regions and in areas such as recognition of prescriptions issued in other countries, European reference networks, health technology assessment, data collection and quality and safety, in order to enable the potential contribution of such cooperation to be realised effectively and on a sustained basis.
Methodological notes
Life expectancy at birth is the average number of years a person would live if age-specific mortality rates observed for a certain calendar year or period were to continue. Life expectancy without disability (or Healthy Life Years) is calculated by the Sullivan method and uses mortality data from demographic statistics and prevalence figures of persons not being limited in functioning/disability. For the time period 1995-2001, prevalence figures from the European Community Household Panel (ECHP) were used. For 2002 and 2003 the prevalence was estimated on the basis of the trend of the 1995-2001 ECHP data. For 2004 and 2005, the Statistics on Income and Living Conditions survey (SILC) was used for calculating the prevalence. The change of the data source for calculating the prevalence (the SILC question used for calculating the prevalence is not similar to the ECHP one) created a break in series in 2004. To be able to present calculations at birth (ECHP and SILC data covering population 16 years and more), Eurostat has, for all countries and for both genders, considered that the disability rate between the ages 0 and 14 is the half of the prevalence in the next age group (16-19). Data on perceived health are based on a self-evaluation question addressed to persons interviewed in the Statistics on Income and Living Conditions survey (SILC). For the total population (particularly aged 65 and over), the percentages on (very) bad health may be somewhat higher due to the fact that a significant number of people suffering important health problems live in homes or institutions for long-term nursing care which are not covered by the surveys. Practising physicians, dentists or nurses provide services directly to patients. Data on practising health care professionals are best used to describe the availability of health care human resources, because all persons included here immediately produce for the final demand. However, not all countries can provide data for practising health care professionals. Please note that the 'professionally active' or 'licensed to practise' data shown for a number of countries are not fully comparable due to the different concepts used. Total hospital beds are all hospital beds which are regularly maintained and staffed and immediately available for the care of admitted patients. Data on the number of beds reported to Eurostat are normally given as an annual average of beds in use during the year of reporting or according to concepts of registration or budgetary or planned approval. A hospital discharge is the formal release of a patient from a hospital after a procedure or course of treatment. Data shown refer to hospital in-patients and to the main diagnosis. Causes of death (COD) data refer to the underlying cause which – according to the World Health Organisation (WHO) – is 'the disease or injury which initiated the train of morbid events leading directly to death, or the circumstances of the accident or violence which produced the fatal injury'. COD data are derived from death certificates. The medical certification of death is an obligation in all Member States.
Links to other parts of the report
Ageing in the population (2.3) and Health and safety (Annex 1.3.8).
Further reading
• Health statistics: Key data on Health 2002, 2002 edition. Eurostat.
• Health in Europe, data 1998-2003, pocketbook, 2005 edition. Eurostat
• Health statistics: Atlas of Mortality, 2002 edition. Eurostat.
87 Summary Report is available at
http://ec.europa.eu/health/ph_overview/co_operation/mobility/results_open_consultation_en.htm.
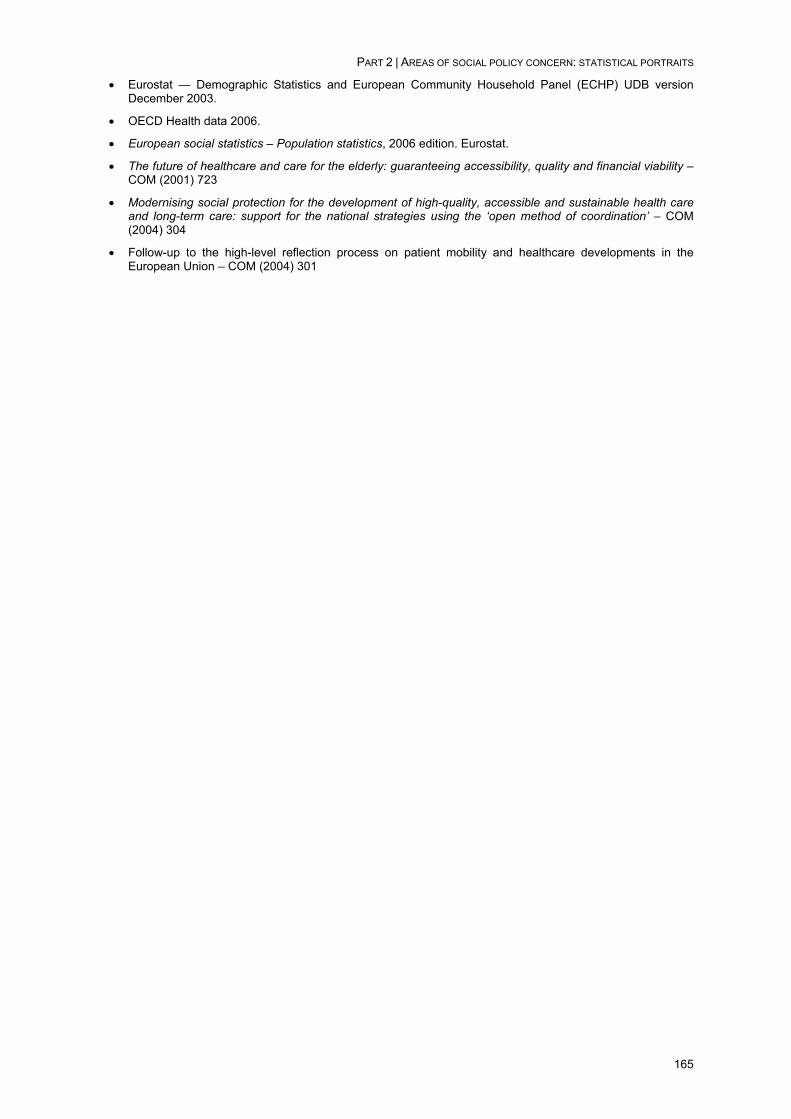
PART 2 | AREAS OF SOCIAL POLICY CONCERN: STATISTICAL PORTRAITS
165
• Eurostat — Demographic Statistics and European Community Household Panel (ECHP) UDB version December 2003.
• OECD Health data 2006.
• European social statistics – Population statistics, 2006 edition. Eurostat.
• The future of healthcare and care for the elderly: guaranteeing accessibility, quality and financial viability – COM (2001) 723
• Modernising social protection for the development of high-quality, accessible and sustainable health care and long-term care: support for the national strategies using the ‘open method of coordination’ – COM (2004) 304
• Follow-up to the high-level reflection process on patient mobility and healthcare developments in the European Union – COM (2004) 301
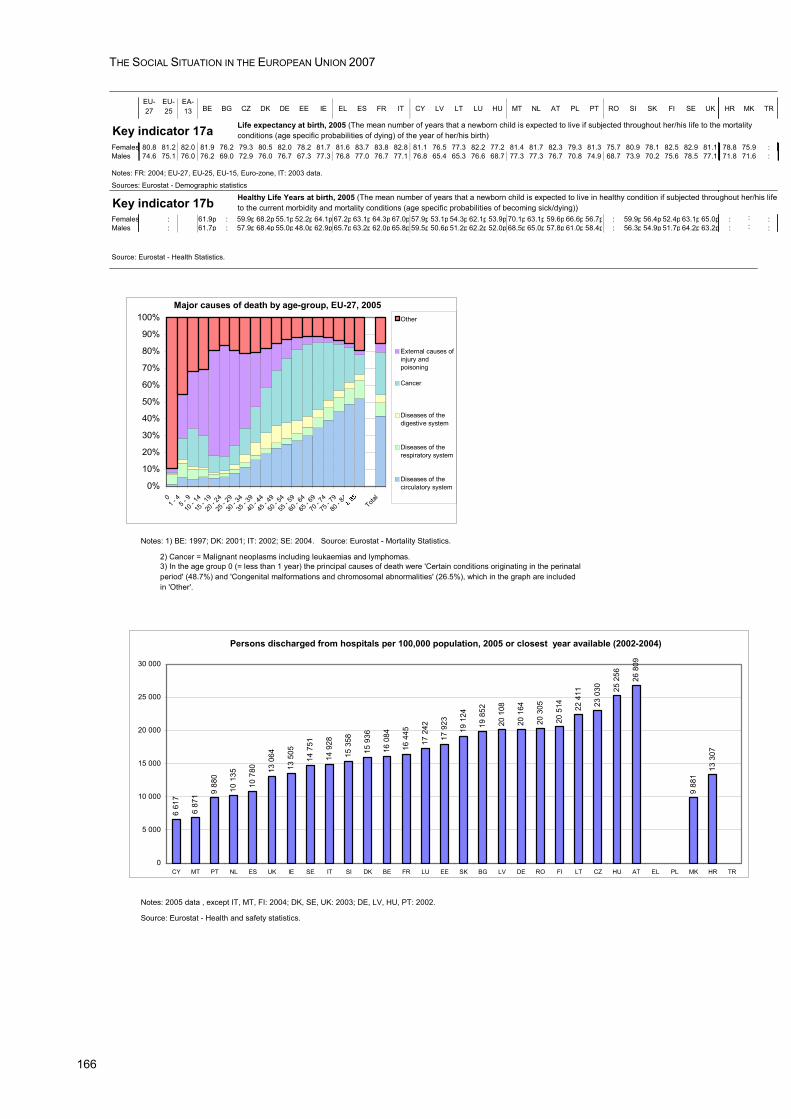
THE SOCIAL SITUATION IN THE EUROPEAN UNION 2007
166
EU-27
EU-25
EA-13 BE BG CZ DK DE EE IE EL ES FR IT CY LV LT LU HU MT NL AT PL PT RO SI SK FI SE UK HR MK TR
Key indicator 17aFemales 80.8 81.2 82.0 81.9 76.2 79.3 80.5 82.0 78.2 81.7 81.6 83.7 83.8 82.8 81.1 76.5 77.3 82.2 77.2 81.4 81.7 82.3 79.3 81.3 75.7 80.9 78.1 82.5 82.9 81.1 78.8 75.9 :Males 74.6 75.1 76.0 76.2 69.0 72.9 76.0 76.7 67.3 77.3 76.8 77.0 76.7 77.1 76.8 65.4 65.3 76.6 68.7 77.3 77.3 76.7 70.8 74.9 68.7 73.9 70.2 75.6 78.5 77.1 71.8 71.6 :
Notes: FR: 2004; EU-27, EU-25, EU-15, Euro-zone, IT: 2003 data.
Sources: Eurostat - Demographic statistics
Key indicator 17bFemales : 61.9p : 59.9p 68.2p 55.1p 52.2p 64.1p 67.2p 63.1p 64.3p 67.0p 57.9p 53.1p 54.3p 62.1p 53.9p 70.1p 63.1p 59.6p 66.6p 56.7p : 59.9p 56.4p 52.4p 63.1p 65.0p : : :Males : 61.7p : 57.9p 68.4p 55.0p 48.0p 62.9p 65.7p 63.2p 62.0p 65.8p 59.5p 50.6p 51.2p 62.2p 52.0p 68.5p 65.0p 57.8p 61.0p 58.4p : 56.3p 54.9p 51.7p 64.2p 63.2p : : :
Source: Eurostat - Health Statistics.
Notes: 1) BE: 1997; DK: 2001; IT: 2002; SE: 2004. Source: Eurostat - Mortality Statistics.
2) Cancer = Malignant neoplasms including leukaemias and lymphomas.
Notes: 2001 except: BE, DK, ES, FR, LU, AT, UK, SI and TR: 2000; EU-15, DE, EE, IT, HU and PL: 1999; EL: 1998. UK includes only England.
Source: Eurostat - Health and safety statistics.
Notes: 2005 data , except IT, MT, FI: 2004; DK, SE, UK: 2003; DE, LV, HU, PT: 2002.
Source: Eurostat - Health and safety statistics.
3) In the age group 0 (= less than 1 year) the principal causes of death were 'Certain conditions originating in the perinatal period' (48.7%) and 'Congenital malformations and chromosomal abnormalities' (26.5%), which in the graph are included in 'Other'.
Life expectancy at birth, 2005 (The mean number of years that a newborn child is expected to live if subjected throughout her/his life to the mortality conditions (age specific probabilities of dying) of the year of her/his birth)
Healthy Life Years at birth, 2005 (The mean number of years that a newborn child is expected to live in healthy condition if subjected throughout her/his life to the current morbidity and mortality conditions (age specific probabilities of becoming sick/dying))
Major causes of death by age-group, EU-27, 2005
0%
10%
20%
30%
40%
50%
60%
70%
80%
90%
100%
0 1 -
45 -
9
10 - 1
4
15 - 1
9
20 - 2
4
25 - 2
9
30 - 3
4
35 - 3
9
40 - 4
4
45 - 4
9
50 - 5
4
55 - 5
9
60 - 6
4
65 - 6
9
70 - 7
4
75 - 7
9
80 - 8
4Tota
l
Other
External causes ofinjury andpoisoning
Cancer
Diseases of thedigestive system
Diseases of therespiratory system
Diseases of thecirculatory system
Persons discharged from hospitals per 100,000 population, 2005 or closest year available (2002-2004)
6 61
7
6 87
1 9 88
0
10 1
35
10 7
80 13 0
64
13 5
05
14 7
51
14 9
28
15 3
58
15 9
36
16 0
84
16 4
45
17 2
42
17 9
23
19 1
24
19 8
52
20 1
08
20 1
64
20 3
05
20 5
14 22 4
11
23 0
30 25 2
56 26 8
09
9 88
1
13 3
07
0
5 000
10 000
15 000
20 000
25 000
30 000
CY MT PT NL ES UK IE SE IT SI DK BE FR LU EE SK BG LV DE RO FI LT CZ HU AT EL PL MK HR TR
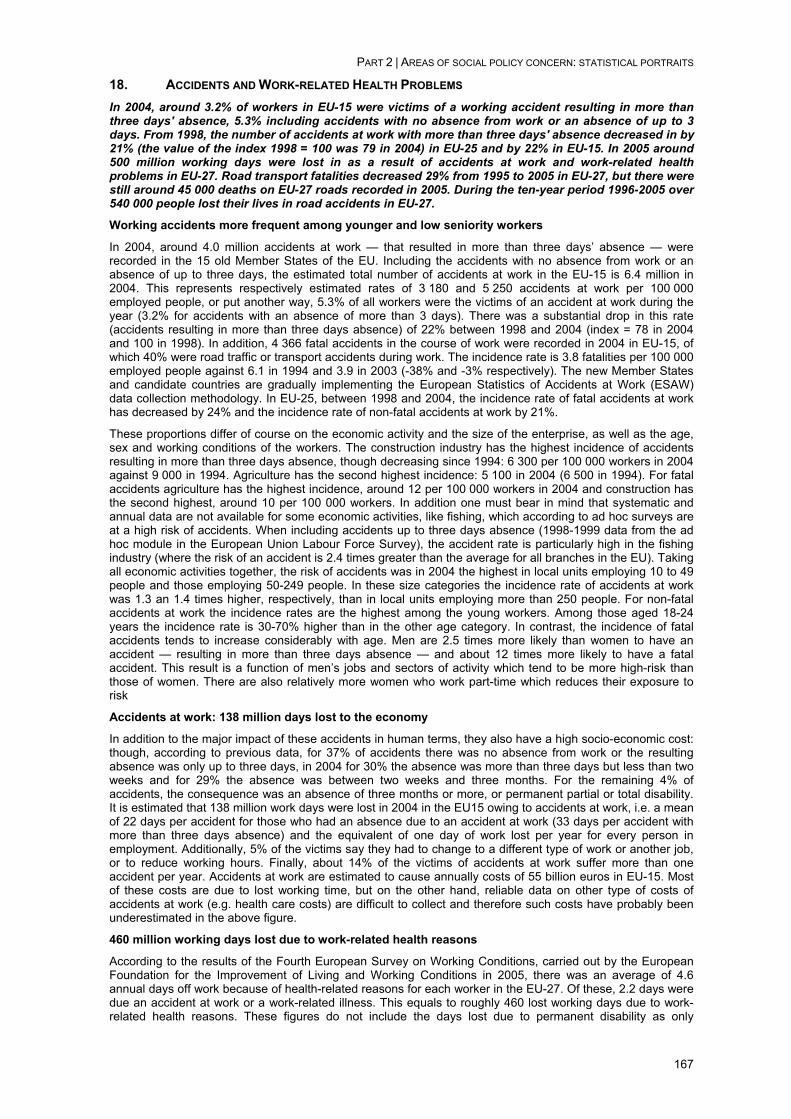
PART 2 | AREAS OF SOCIAL POLICY CONCERN: STATISTICAL PORTRAITS
167
18. ACCIDENTS AND WORK-RELATED HEALTH PROBLEMS In 2004, around 3.2% of workers in EU-15 were victims of a working accident resulting in more than three days' absence, 5.3% including accidents with no absence from work or an absence of up to 3 days. From 1998, the number of accidents at work with more than three days' absence decreased in by 21% (the value of the index 1998 = 100 was 79 in 2004) in EU-25 and by 22% in EU-15. In 2005 around 500 million working days were lost in as a result of accidents at work and work-related health problems in EU-27. Road transport fatalities decreased 29% from 1995 to 2005 in EU-27, but there were still around 45 000 deaths on EU-27 roads recorded in 2005. During the ten-year period 1996-2005 over 540 000 people lost their lives in road accidents in EU-27.
Working accidents more frequent among younger and low seniority workers
In 2004, around 4.0 million accidents at work — that resulted in more than three days’ absence — were recorded in the 15 old Member States of the EU. Including the accidents with no absence from work or an absence of up to three days, the estimated total number of accidents at work in the EU-15 is 6.4 million in 2004. This represents respectively estimated rates of 3 180 and 5 250 accidents at work per 100 000 employed people, or put another way, 5.3% of all workers were the victims of an accident at work during the year (3.2% for accidents with an absence of more than 3 days). There was a substantial drop in this rate (accidents resulting in more than three days absence) of 22% between 1998 and 2004 (index = 78 in 2004 and 100 in 1998). In addition, 4 366 fatal accidents in the course of work were recorded in 2004 in EU-15, of which 40% were road traffic or transport accidents during work. The incidence rate is 3.8 fatalities per 100 000 employed people against 6.1 in 1994 and 3.9 in 2003 (-38% and -3% respectively). The new Member States and candidate countries are gradually implementing the European Statistics of Accidents at Work (ESAW) data collection methodology. In EU-25, between 1998 and 2004, the incidence rate of fatal accidents at work has decreased by 24% and the incidence rate of non-fatal accidents at work by 21%.
These proportions differ of course on the economic activity and the size of the enterprise, as well as the age, sex and working conditions of the workers. The construction industry has the highest incidence of accidents resulting in more than three days absence, though decreasing since 1994: 6 300 per 100 000 workers in 2004 against 9 000 in 1994. Agriculture has the second highest incidence: 5 100 in 2004 (6 500 in 1994). For fatal accidents agriculture has the highest incidence, around 12 per 100 000 workers in 2004 and construction has the second highest, around 10 per 100 000 workers. In addition one must bear in mind that systematic and annual data are not available for some economic activities, like fishing, which according to ad hoc surveys are at a high risk of accidents. When including accidents up to three days absence (1998-1999 data from the ad hoc module in the European Union Labour Force Survey), the accident rate is particularly high in the fishing industry (where the risk of an accident is 2.4 times greater than the average for all branches in the EU). Taking all economic activities together, the risk of accidents was in 2004 the highest in local units employing 10 to 49 people and those employing 50-249 people. In these size categories the incidence rate of accidents at work was 1.3 an 1.4 times higher, respectively, than in local units employing more than 250 people. For non-fatal accidents at work the incidence rates are the highest among the young workers. Among those aged 18-24 years the incidence rate is 30-70% higher than in the other age category. In contrast, the incidence of fatal accidents tends to increase considerably with age. Men are 2.5 times more likely than women to have an accident — resulting in more than three days absence — and about 12 times more likely to have a fatal accident. This result is a function of men’s jobs and sectors of activity which tend to be more high-risk than those of women. There are also relatively more women who work part-time which reduces their exposure to risk
Accidents at work: 138 million days lost to the economy
In addition to the major impact of these accidents in human terms, they also have a high socio-economic cost: though, according to previous data, for 37% of accidents there was no absence from work or the resulting absence was only up to three days, in 2004 for 30% the absence was more than three days but less than two weeks and for 29% the absence was between two weeks and three months. For the remaining 4% of accidents, the consequence was an absence of three months or more, or permanent partial or total disability. It is estimated that 138 million work days were lost in 2004 in the EU15 owing to accidents at work, i.e. a mean of 22 days per accident for those who had an absence due to an accident at work (33 days per accident with more than three days absence) and the equivalent of one day of work lost per year for every person in employment. Additionally, 5% of the victims say they had to change to a different type of work or another job, or to reduce working hours. Finally, about 14% of the victims of accidents at work suffer more than one accident per year. Accidents at work are estimated to cause annually costs of 55 billion euros in EU-15. Most of these costs are due to lost working time, but on the other hand, reliable data on other type of costs of accidents at work (e.g. health care costs) are difficult to collect and therefore such costs have probably been underestimated in the above figure.
460 million working days lost due to work-related health reasons
According to the results of the Fourth European Survey on Working Conditions, carried out by the European Foundation for the Improvement of Living and Working Conditions in 2005, there was an average of 4.6 annual days off work because of health-related reasons for each worker in the EU-27. Of these, 2.2 days were due an accident at work or a work-related illness. This equals to roughly 460 lost working days due to work-related health reasons. These figures do not include the days lost due to permanent disability as only

THE SOCIAL SITUATION IN THE EUROPEAN UNION 2007
168
employed persons were questioned. According to the same survey 35% of the workers of EU-27 say that their work affects their health, ranging from 61% in agriculture to 21% in financial intermediation. The most often reported work-related health problems were backache, muscular pain, fatigue and stress. Physical risk factors like vibration, noise, handling of chemicals, painful and tiring positions as well as repetitive movement continue to affect a significant proportion of the workforce. Meanwhile the occurrence of violence at work appears to be increasing, especially in certain sectors like health and education where 15% and 8% of workers, respectively report violence at work.
About 630 000 commuting accidents in EU-15
The number of commuting accidents (accidents on the way to and from work) resulting in more than three days’ absence was estimated at approximately 630 000 in 2003 in EU-15 (in addition to accidents at work). The incidence rate was 430 per 100 000. The number of fatal commuting accidents, which were chiefly road traffic and transport accidents, was around 3 000 for EU-15.
EU-27 roads claimed around 45 000 lives in 2005
For the EU-27 as a whole, the number of road accident fatalities decreased 29% from 1995 to 2005, when around 45 000 deaths were caused by road accidents. During the ten-year period 1996-2005 over 540 000 people lost their lives in road accidents in EU-27. The annual data 1995-2005 per country is given in the annex 1.3.8.
In all Member States and Candidate Countries (no data available Turkey) there died much more men than women in transport accidents (road transport and other transport accidents) in the year 2000. The lowest standardised death rates were observed in Malta (13 women per million women and 62 men per million men), the Netherlands (28 and 77), Sweden (23 and 85) and the United Kingdom (26 and 88) and the highest ones in Cyprus (44 and 281), Lithuania (90 and 410) and Latvia (105 and 345).
Home and leisure accidents
There were an estimated 430 000 home and leisure accidents in the EU-15 in 1995 (men had 240 000, women 190 000). Accidents are most likely to occur at home (32% of the total number of accidents among men, 46% among women) followed by sporting accidents (18% among men, 10% among women).
Policy context
The EC Treaty (Article 137) states that 'the Community shall support and complement the activities of the Member States in … (the) improvement in particular of the working environment to protect workers’ health and safety'. Art.140 adds that 'the Commission shall encourage cooperation between the Member States and facilitate the coordination of their action in all social policy fields under this chapter, particularly in matters relating to … (the) prevention of occupational accidents and diseases'.
On 20.6.2001 the Commission gave the Communication on 'Employment and social policies: a framework for investing in quality'. It takes forward the Social Policy Agenda commitment and the Lisbon strategy reinforced by Nice and Stockholm, to promote quality in employment. In particular it defines the approach of improving quality of work and ensures its integration in employment and social policies. For this purpose it establishes a set of indicators on quality in work to be used within the framework of the European Employment Strategy.
The lists of indicators of both the Synthesis Report and the Employment Committee Report on Indicators of Quality in Work include the evolution (index 1998=100) of the incidence rate of accidents at work, as defined by the number of accidents at work per 100 000 people in employment.
More recently, on 21.02.2007, the Commission adopted a Communication (COM(2007) 62 final) on 'Improving quality and production at work: Community strategy 2007-2012 on health and safety at work' and on 25.07.2007 the Council adopted a Resolution on 'a new Community strategy on health and safety at work (2007–2012)'. Among other, the Community strategy 2007-2012 identify research priorities including psychosocial issues, musculoskeletal disorders, dangerous substances, knowledge of reproductive risks, occupational health and safety management, risks associated with several cross-factors (e.g. work organisation and workplace design issues, ergonomics, combined exposure to physical and chemical agents) and potential risks associated with nanotechnologies. The Council Resolution states as one of the main objectives: 'to achieve an ongoing, sustainable and consistent reduction in accidents at work and occupational illnesses' and it supports the Commission in seeking to reduce the incidence rate of accidents at work by 25% at Community level. National strategies should seek to establish measurable targets for reducing incidence of occupational accidents and illnesses for relevant categories of worker, types of company and/or sectors.
In its 2001 Transport White Paper, the Commission proposed the ambitious goal to save yearly 25.000 lives on European roads by the target date of 2010. This target has meanwhile been endorsed by the European Parliament and all Member States. In 2003, the European Road Safety Action Programme was tabled, containing many concrete measures proposed to achieve this goal. And in February 2006, the Commission has issued a mid-term review on our common endeavours to halve road fatalities. Summing up, Europe has achieved a lot in the last five years, but we need to do more together to achieve our objective.
The 'CARS21' Report of December 2005 and the mid-term review of the Transport White paper of June 2006 provide some guidance on the strategic direction of the European Union concerning road safety.
PART 2 | AREAS OF SOCIAL POLICY CONCERN: STATISTICAL PORTRAITS
169
In Europe, the agreed method to more road safety is the principle of 'shared responsibility'. Beyond all institutional rhetoric, each and everyone has a role to play to make Europe’s road safer. In this respect, the European Road Safety Charter is central, inviting all members of society, be they for instance a local school, a rural association or a large multinational company, to make their own measurable contribution to improving road safety.
Finally, road safety initiatives are — or should be — underpinned by solid statistical data on accident causes and other relevant issues. The collection and analysis of data, today in the European CARE accident data base, tomorrow in the European Road Safety Observatory is essential to devise effective and proportionate measures to improve road safety.
To achieve its objectives, the Commission proposes legislation and political action, but makes also some funding available through the European Research Framework Programmes and its Road Safety Subvention Programme.
Methodological notes
Sources: Eurostat — European Statistics on Accidents at Work (ESAW), ad hoc module on accidents at work and occupational diseases in the 1999 Labour Force Survey and Transport Statistics. European Commission Transport DG — Community Road Accident database (CARE). European Home and Leisure Accident Surveillance System (EHLASS).
For road accidents, people killed are all those killed within 30 days of the accident. For Member States not using this definition, corrective factors were applied.
The data on working accidents relate to almost 90% of people in employment in the EU-15. The new Member States are in the process of implementing the full ESAW methodology. Only those working accidents that lead to more than three days absence are included in the annual ESAW data but accidents with no absence from work or resulting in an absence from work from one to three days were also covered in the ad hoc module on accidents at work and occupational diseases in the 1999 Labour Force Survey which is being repeated in 2007. The ESAW incidence rates have been calculated for only nine major branches of economic activity (NACE Rev. 1 sections).
The fourth European Survey on Working Conditions was carried out in 2005 by the European Foundation for the Improvement of Living and Working Conditions. The previous surveys were carried out in 1990, 1996 and 2000.
The EHLASS (European Home and Leisure Accident Surveillance System) was introduced by the Council Decision 93/683/EEC of 29 October 1993 introducing a Community system of information on home and leisure. Since 1999 the EHLASS system has been integrated into the Community Programme of Prevention of Injuries.
Links to other parts of the report
Health and safety (Annex 1.3.8).
Further reading
• http://ec.europa.eu/transport/roadsafety/index_en.htm
• Work and Health in the EU – A statistical portrait. Panorama series — 2003 edition — Eurostat.
• European social statistics – Accidents at work and work-related health problems – Data 1994-2000 – Detailed tables series — 2002 edition — Eurostat.
• Statistics in Focus (Transport): EU road safety 2004: Regional differences, No 14/2007; Eurostat.
• European Statistics on Accidents at Work — Methodology, 2001 Edition. Eurostat and DG Employment and social affairs, Health and safety at work series.
• Panorama of transport (2007 edition), 2007. Eurostat.
• Fourth European Survey on Working Conditions European Foundation for the Improvement of Living and Working Conditions (http://www.eurofound.europa.eu).
• Guidance on work-related stress — Spice of life or kiss of death?, European Commission, 16 December 2002.
• Communication from the Commission COM(2007) 62 final of 21.2.2007 Improving quality and productivity at work: Community strategy 2007-2012 on health and safety at work.
• Council Resolution of 25 June 2007 on a new Community strategy on health and safety at work (2007-2012) [O.J. C145 of 30.06.2007, page 1].
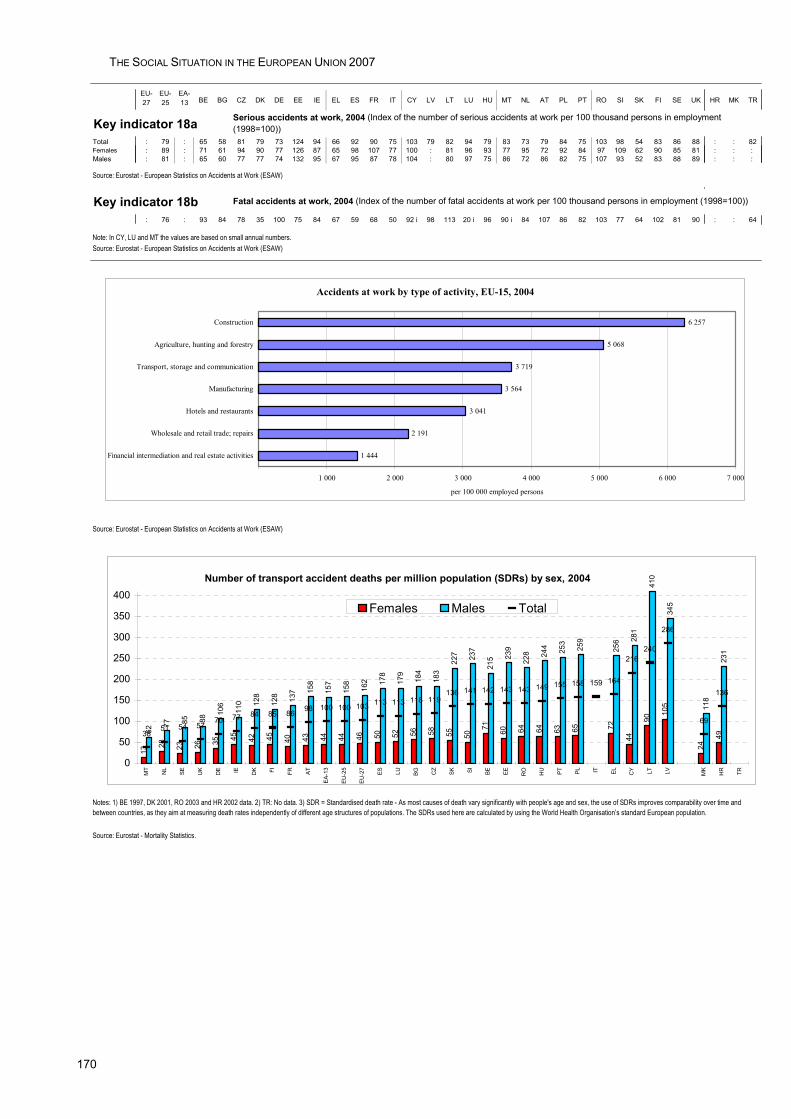
THE SOCIAL SITUATION IN THE EUROPEAN UNION 2007
170
EU-27
EU-25
EA-13 BE BG CZ DK DE EE IE EL ES FR IT CY LV LT LU HU MT NL AT PL PT RO SI SK FI SE UK HR MK TR
Key indicator 18aTotal : 79 : 65 58 81 79 73 124 94 66 92 90 75 103 79 82 94 79 83 73 79 84 75 103 98 54 83 86 88 : : 82Females : 89 : 71 61 94 90 77 126 87 65 98 107 77 100 : 81 96 93 77 95 72 92 84 97 109 62 90 85 81 : : : Males : 81 : 65 60 77 77 74 132 95 67 95 87 78 104 : 80 97 75 86 72 86 82 75 107 93 52 83 88 89 : : :
Source: Eurostat - European Statistics on Accidents at Work (ESAW)
Key indicator 18b: 76 : 93 84 78 35 100 75 84 67 59 68 50 92 i 98 113 20 i 96 90 i 84 107 86 82 103 77 64 102 81 90 : : 64
Note: In CY, LU and MT the values are based on small annual numbers. Source: Eurostat - European Statistics on Accidents at Work (ESAW)
Source: Eurostat - European Statistics on Accidents at Work (ESAW)
Source: Eurostat - Mortality Statistics.
Notes: 1) BE 1997, DK 2001, RO 2003 and HR 2002 data. 2) TR: No data. 3) SDR = Standardised death rate - As most causes of death vary significantly with people's age and sex, the use of SDRs improves comparability over time and between countries, as they aim at measuring death rates independently of different age structures of populations. The SDRs used here are calculated by using the World Health Organisation’s standard European population.
Serious accidents at work, 2004 (Index of the number of serious accidents at work per 100 thousand persons in employment (1998=100))
Fatal accidents at work, 2004 (Index of the number of fatal accidents at work per 100 thousand persons in employment (1998=100))
Accidents at work by type of activity, EU-15, 2004
1 444
2 191
3 041
3 564
3 719
5 068
6 257
1 000 2 000 3 000 4 000 5 000 6 000 7 000
Financial intermediation and real estate activities
Wholesale and retail trade; repairs
Hotels and restaurants
Manufacturing
Transport, storage and communication
Agriculture, hunting and forestry
Construction
per 100 000 employed persons
Number of transport accident deaths per million population (SDRs) by sex, 2004
13
28 23 26 35 45 42 45 40 43 44 44 46 50 52 56 58 55 50
71 60 64 64 63 65 72
44
90
105
24
49
62
77 85 88
106
110 12
8
128 137 15
8
157
158
162 17
8
179
184
183
227 23
7
215 23
9
228 24
4 253
259
256 28
1
410
345
118
231
3851 54 57
70 77 84 85 86 98 100 100 103 113 113 118 119136 141 142 143 143 149 155 158 159 164
216240
286
69
136
0
50
100
150
200
250
300
350
400
MT
NL
SE UK
DE IE DK FI FR AT
EA-1
3
EU-2
5
EU-2
7
ES LU BG CZ
SK SI BE EE RO HU PT PL IT EL CY LT LV MK
HR TR
Females Males Total
171
ANNEXES TO PART 2
Annex 1.1 Key Indicators per Geopolitical Entity*, Latest Year Available
Annex 1.2 Key Indicators per Geopolitical Entity*, Time Series (mainly latest 10 years, when available)
Annex 1.3 Other Statistical Tables per Geopolitical Entity*
1 Economy
2 Population
3 Education and training
4 Labour market
5 Social protection
6 Income, social inclusion and living conditions
7 Gender equality
8 Health and safety
Annex 2 Symbols, Country Codes and Country Groupings, other Abbreviations and Acronyms
* geopolitical entity = a country or a group of countries (EU-27, EU-25 and EA-13)

172
ANNEX 1.1 | KEY INDICATORS PER GEOPOLITICAL ENTITY — LATEST YEAR AVAILABLE
173
Annex 1.1
Key Indicators per Geopolitical Entity
Latest Year Available
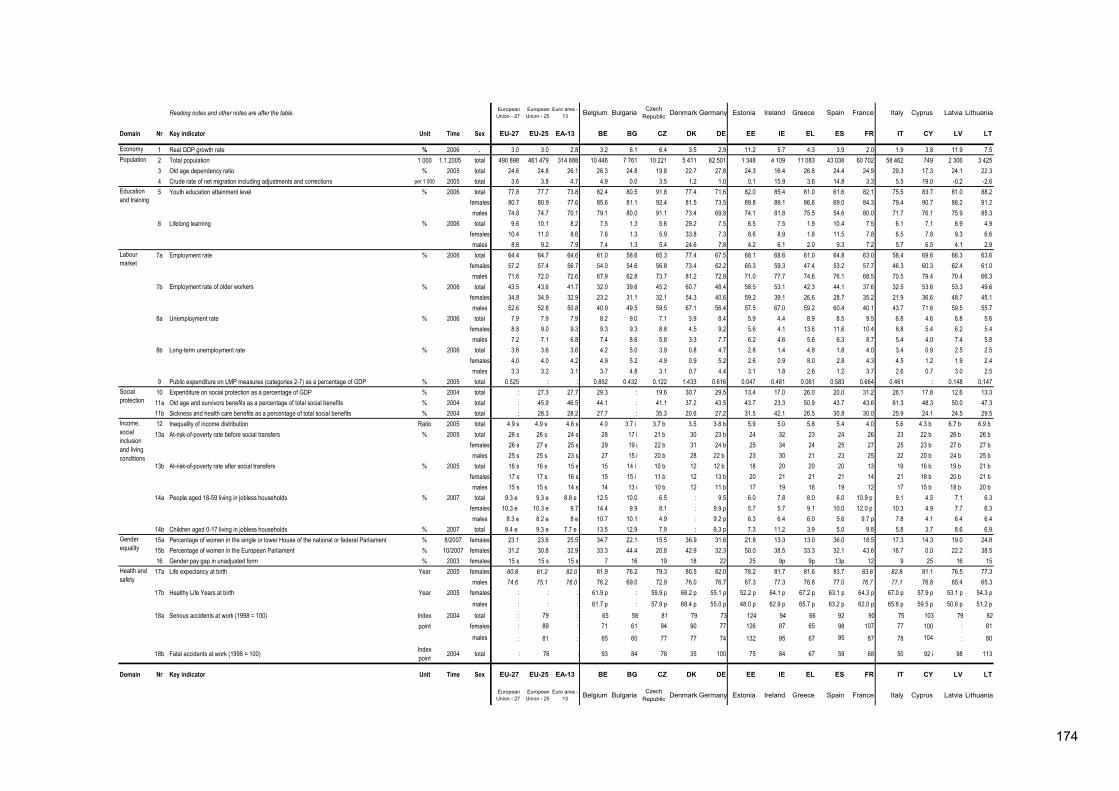
174
Reading notes and other notes are after the table. EuropeanUnion - 27
EuropeanUnion - 25
Euro area - 13 Belgium Bulgaria Czech
Republic Denmark Germany Estonia Ireland Greece Spain France Italy Cyprus Latvia Lithuania
Domain Nr Key indicator Unit Time Sex EU-27 EU-25 EA-13 BE BG CZ DK DE EE IE EL ES FR IT CY LV LT
Economy 1 Real GDP growth rate % 2006 . 3.0 3.0 2.8 3.2 6.1 6.4 3.5 2.9 11.2 5.7 4.3 3.9 2.0 1.9 3.8 11.9 7.52 Total population 1 000 1.1.2005 total 490 898 461 479 314 888 10 446 7 761 10 221 5 411 82 501 1 348 4 109 11 083 43 038 60 702 58 462 749 2 306 3 4253 Old age dependency ratio % 2005 total 24.6 24.8 26.1 26.3 24.8 19.8 22.7 27.8 24.3 16.4 26.8 24.4 24.9 29.3 17.3 24.1 22.34 Crude rate of net migration including adjustments and corrections per 1 000 2005 total 3.6 3.8 4.7 4.9 0.0 3.5 1.2 1.0 0.1 15.9 3.6 14.8 3.3 5.5 19.0 -0.2 -2.65 Youth education attainment level % 2006 total 77.8 77.7 73.8 82.4 80.5 91.8 77.4 71.6 82.0 85.4 81.0 61.6 82.1 75.5 83.7 81.0 88.2
females 80.7 80.9 77.6 85.6 81.1 92.4 81.5 73.5 89.8 89.1 86.6 69.0 84.3 79.4 90.7 86.2 91.2males 74.8 74.7 70.1 79.1 80.0 91.1 73.4 69.8 74.1 81.8 75.5 54.6 80.0 71.7 76.1 75.9 85.3
6 Lifelong learning % 2006 total 9.6 10.1 8.2 7.5 1.3 5.6 29.2 7.5 6.5 7.5 1.9 10.4 7.5 6.1 7.1 6.9 4.9females 10.4 11.0 8.6 7.6 1.3 5.9 33.8 7.3 8.6 8.9 1.8 11.5 7.8 6.5 7.8 9.3 6.6males 8.8 9.2 7.9 7.4 1.3 5.4 24.6 7.8 4.2 6.1 2.0 9.3 7.2 5.7 6.5 4.1 2.9
7a Employment rate % 2006 total 64.4 64.7 64.6 61.0 58.6 65.3 77.4 67.5 68.1 68.6 61.0 64.8 63.0 58.4 69.6 66.3 63.6females 57.2 57.4 56.7 54.0 54.6 56.8 73.4 62.2 65.3 59.3 47.4 53.2 57.7 46.3 60.3 62.4 61.0males 71.6 72.0 72.6 67.9 62.8 73.7 81.2 72.8 71.0 77.7 74.6 76.1 68.5 70.5 79.4 70.4 66.3
7b Employment rate of older workers % 2006 total 43.5 43.6 41.7 32.0 39.6 45.2 60.7 48.4 58.5 53.1 42.3 44.1 37.6 32.5 53.6 53.3 49.6females 34.8 34.9 32.9 23.2 31.1 32.1 54.3 40.6 59.2 39.1 26.6 28.7 35.2 21.9 36.6 48.7 45.1males 52.6 52.8 50.8 40.9 49.5 59.5 67.1 56.4 57.5 67.0 59.2 60.4 40.1 43.7 71.6 59.5 55.7
8a Unemployment rate % 2006 total 7.9 7.9 7.9 8.2 9.0 7.1 3.9 8.4 5.9 4.4 8.9 8.5 9.5 6.8 4.6 6.8 5.6females 8.8 9.0 9.3 9.3 9.3 8.8 4.5 9.2 5.6 4.1 13.6 11.6 10.4 8.8 5.4 6.2 5.4males 7.2 7.1 6.8 7.4 8.6 5.8 3.3 7.7 6.2 4.6 5.6 6.3 8.7 5.4 4.0 7.4 5.8
8b Long-term unemployment rate % 2006 total 3.6 3.6 3.6 4.2 5.0 3.9 0.8 4.7 2.8 1.4 4.8 1.8 4.0 3.4 0.9 2.5 2.5females 4.0 4.0 4.2 4.9 5.2 4.9 0.9 5.2 2.6 0.9 8.0 2.8 4.3 4.5 1.2 1.9 2.4males 3.3 3.2 3.1 3.7 4.8 3.1 0.7 4.4 3.1 1.8 2.6 1.2 3.7 2.6 0.7 3.0 2.5
9 Public expenditure on LMP measures (categories 2-7) as a percentage of GDP % 2005 total 0.525 : : 0.852 0.432 0.122 1.433 0.616 0.047 0.481 0.061 0.583 0.664 0.461 : 0.148 0.14710 Expenditure on social protection as a percentage of GDP % 2004 total : 27.3 27.7 29.3 : 19.6 30.7 29.5 13.4 17.0 26.0 20.0 31.2 26.1 17.8 12.6 13.3
11a Old age and survivors benefits as a percentage of total social benefits % 2004 total : 45.9 46.5 44.1 : 41.1 37.2 43.5 43.7 23.3 50.9 43.7 43.6 61.3 48.3 50.0 47.311b Sickness and health care benefits as a percentage of total social benefits % 2004 total : 28.3 28.2 27.7 : 35.3 20.6 27.2 31.5 42.1 26.5 30.8 30.0 25.9 24.1 24.5 29.512 Inequality of income distribution Ratio 2005 total 4.9 s 4.9 s 4.6 s 4.0 3.7 i 3.7 b 3.5 3.8 b 5.9 5.0 5.8 5.4 4.0 5.6 4.3 b 6.7 b 6.9 b
13a At-risk-of-poverty rate before social transfers % 2005 total 26 s 26 s 24 s 28 17 i 21 b 30 23 b 24 32 23 24 26 23 22 b 26 b 26 b females 26 s 27 s 25 s 29 19 i 22 b 31 24 b 25 34 24 25 27 25 23 b 27 b 27 b males 25 s 25 s 23 s 27 15 i 20 b 28 22 b 23 30 21 23 25 22 20 b 24 b 25 b
13b At-risk-of-poverty rate after social transfers % 2005 total 16 s 16 s 15 s 15 14 i 10 b 12 12 b 18 20 20 20 13 19 16 b 19 b 21 b females 17 s 17 s 16 s 15 15 i 11 b 12 13 b 20 21 21 21 14 21 18 b 20 b 21 b males 15 s 15 s 14 s 14 13 i 10 b 12 11 b 17 19 18 19 12 17 15 b 18 b 20 b
14a People aged 18-59 living in jobless households % 2007 total 9.3 e 9.3 e 8.8 e 12.5 10.0 6.5 : 9.5 6.0 7.8 8.0 6.0 10.9 p 9.1 4.5 7.1 6.3females 10.3 e 10.3 e 9.7 14.4 9.9 8.1 : 9.9 p 5.7 5.7 9.1 10.0 12.0 p 10.3 4.9 7.7 6.3males 8.3 e 8.2 e 8 e 10.7 10.1 4.9 : 9.2 p 6.3 6.4 6.0 5.6 9.7 p 7.8 4.1 6.4 6.4
14b Children aged 0-17 living in jobless households % 2007 total 9.4 e 9.3 e 7.7 e 13.5 12.9 7.9 : 9.3 p 7.3 11.2 3.9 5.0 9.8 5.8 3.7 8.6 6.915a Percentage of women in the single or lower House of the national or federal Parliament % 8/2007 females 23.1 23.6 25.5 34.7 22.1 15.5 36.9 31.6 21.8 13.3 13.0 36.0 18.5 17.3 14.3 19.0 24.815b Percentage of women in the European Parliament % 10/2007 females 31.2 30.8 32.9 33.3 44.4 20.8 42.9 32.3 50.0 38.5 33.3 32.1 43.6 16.7 0.0 22.2 38.516 Gender pay gap in unadjusted form % 2003 females 15 s 15 s 15 s 7 16 19 18 22 25 9p 9p 13p 12 9 25 16 15
17a Life expectancy at birth Year 2005 females 80.8 81.2 82.0 81.9 76.2 79.3 80.5 82.0 78.2 81.7 81.6 83.7 83.8 82.8 81.1 76.5 77.3males 74.6 75.1 76.0 76.2 69.0 72.9 76.0 76.7 67.3 77.3 76.8 77.0 76.7 77.1 76.8 65.4 65.3
17b Healthy Life Years at birth Year 2005 females : : : 61.9 p : 59.9 p 68.2 p 55.1 p 52.2 p 64.1 p 67.2 p 63.1 p 64.3 p 67.0 p 57.9 p 53.1 p 54.3 pmales : : : 61.7 p : 57.9 p 68.4 p 55.0 p 48.0 p 62.9 p 65.7 p 63.2 p 62.0 p 65.8 p 59.5 p 50.6 p 51.2 p
18a Serious accidents at work (1998 = 100) Index 2004 total : 79 : 65 58 81 79 73 124 94 66 92 90 75 103 79 82point females : 89 : 71 61 94 90 77 126 87 65 98 107 77 100 : 81
males : 81 : 65 60 77 77 74 132 95 67 95 87 78 104 : 80
18b Fatal accidents at work (1998 = 100) Indexpoint 2004 total : 76 : 93 84 78 35 100 75 84 67 59 68 50 92 i 98 113
Domain Nr Key indicator Unit Time Sex EU-27 EU-25 EA-13 BE BG CZ DK DE EE IE EL ES FR IT CY LV LT
EuropeanUnion - 27
EuropeanUnion - 25
Euro area - 13 Belgium Bulgaria Czech
Republic Denmark Germany Estonia Ireland Greece Spain France Italy Cyprus Latvia Lithuania
Population
Education and training
Labour market
Health and safety
Social protection
Income, social inclusion and living conditions
Gender equality
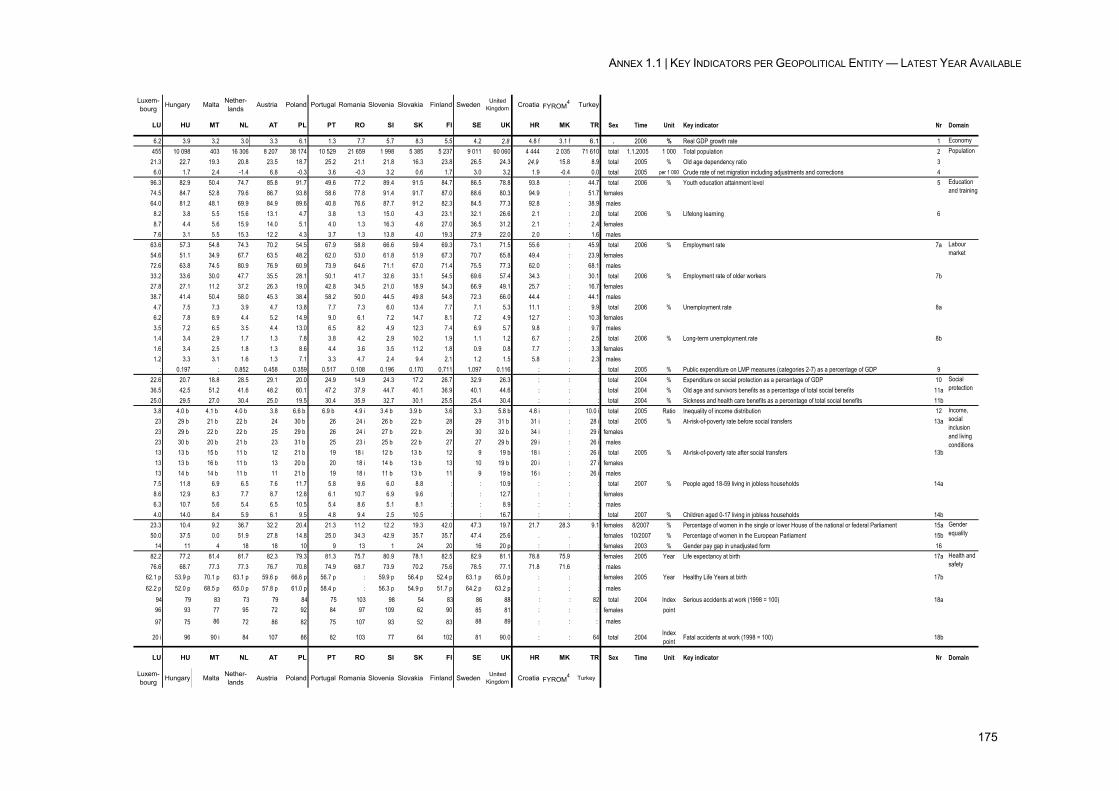
ANNEX 1.1 | KEY INDICATORS PER GEOPOLITICAL ENTITY — LATEST YEAR AVAILABLE
175
Luxem-bourg Hungary Malta Nether-
lands Austria Poland Portugal Romania Slovenia Slovakia Finland Sweden United Kingdom Croatia FYROM4 Turkey
LU HU MT NL AT PL PT RO SI SK FI SE UK HR MK TR Sex Time Unit Key indicator Nr Domain
6.2 3.9 3.2 3.0 3.3 6.1 1.3 7.7 5.7 8.3 5.5 4.2 2.8 4.8 f 3.1 f 6.1 . 2006 % Real GDP growth rate 1 Economy 455 10 098 403 16 306 8 207 38 174 10 529 21 659 1 998 5 385 5 237 9 011 60 060 4 444 2 035 71 610 total 1.1.2005 1 000 Total population 221.3 22.7 19.3 20.8 23.5 18.7 25.2 21.1 21.8 16.3 23.8 26.5 24.3 24.9 15.8 8.9 total 2005 % Old age dependency ratio 3
6.0 1.7 2.4 -1.4 6.8 -0.3 3.6 -0.3 3.2 0.6 1.7 3.0 3.2 1.9 -0.4 0.0 total 2005 per 1 000 Crude rate of net migration including adjustments and corrections 496.3 82.9 50.4 74.7 85.8 91.7 49.6 77.2 89.4 91.5 84.7 86.5 78.8 93.8 : 44.7 total 2006 % Youth education attainment level 574.5 84.7 52.8 79.6 86.7 93.8 58.6 77.8 91.4 91.7 87.0 88.6 80.3 94.9 : 51.7 females64.0 81.2 48.1 69.9 84.9 89.6 40.8 76.6 87.7 91.2 82.3 84.5 77.3 92.8 : 38.9 males
8.2 3.8 5.5 15.6 13.1 4.7 3.8 1.3 15.0 4.3 23.1 32.1 26.6 2.1 : 2.0 total 2006 % Lifelong learning 68.7 4.4 5.6 15.9 14.0 5.1 4.0 1.3 16.3 4.6 27.0 36.5 31.2 2.1 : 2.4 females7.6 3.1 5.5 15.3 12.2 4.3 3.7 1.3 13.8 4.0 19.3 27.9 22.0 2.0 : 1.6 males
63.6 57.3 54.8 74.3 70.2 54.5 67.9 58.8 66.6 59.4 69.3 73.1 71.5 55.6 : 45.9 total 2006 % Employment rate 7a54.6 51.1 34.9 67.7 63.5 48.2 62.0 53.0 61.8 51.9 67.3 70.7 65.8 49.4 : 23.9 females72.6 63.8 74.5 80.9 76.9 60.9 73.9 64.6 71.1 67.0 71.4 75.5 77.3 62.0 : 68.1 males33.2 33.6 30.0 47.7 35.5 28.1 50.1 41.7 32.6 33.1 54.5 69.6 57.4 34.3 : 30.1 total 2006 % Employment rate of older workers 7b27.8 27.1 11.2 37.2 26.3 19.0 42.8 34.5 21.0 18.9 54.3 66.9 49.1 25.7 : 16.7 females38.7 41.4 50.4 58.0 45.3 38.4 58.2 50.0 44.5 49.8 54.8 72.3 66.0 44.4 : 44.1 males
4.7 7.5 7.3 3.9 4.7 13.8 7.7 7.3 6.0 13.4 7.7 7.1 5.3 11.1 : 9.9 total 2006 % Unemployment rate 8a6.2 7.8 8.9 4.4 5.2 14.9 9.0 6.1 7.2 14.7 8.1 7.2 4.9 12.7 : 10.3 females3.5 7.2 6.5 3.5 4.4 13.0 6.5 8.2 4.9 12.3 7.4 6.9 5.7 9.8 : 9.7 males1.4 3.4 2.9 1.7 1.3 7.8 3.8 4.2 2.9 10.2 1.9 1.1 1.2 6.7 : 2.5 total 2006 % Long-term unemployment rate 8b1.6 3.4 2.5 1.8 1.3 8.6 4.4 3.6 3.5 11.2 1.8 0.9 0.8 7.7 : 3.3 females1.2 3.3 3.1 1.6 1.3 7.1 3.3 4.7 2.4 9.4 2.1 1.2 1.5 5.8 : 2.3 males
: 0.197 : 0.852 0.458 0.359 0.517 0.108 0.196 0.170 0.711 1.097 0.116 : : : total 2005 % Public expenditure on LMP measures (categories 2-7) as a percentage of GDP 922.6 20.7 18.8 28.5 29.1 20.0 24.9 14.9 24.3 17.2 26.7 32.9 26.3 : : : total 2004 % Expenditure on social protection as a percentage of GDP 1036.5 42.5 51.2 41.6 48.2 60.1 47.2 37.9 44.7 40.1 36.9 40.1 44.6 : : : total 2004 % Old age and survivors benefits as a percentage of total social benefits 11a25.0 29.5 27.0 30.4 25.0 19.5 30.4 35.9 32.7 30.1 25.5 25.4 30.4 : : : total 2004 % Sickness and health care benefits as a percentage of total social benefits 11b
3.8 4.0 b 4.1 b 4.0 b 3.8 6.6 b 6.9 b 4.9 i 3.4 b 3.9 b 3.6 3.3 5.8 b 4.8 i : 10.0 i total 2005 Ratio Inequality of income distribution 1223 29 b 21 b 22 b 24 30 b 26 24 i 26 b 22 b 28 29 31 b 31 i : 28 i total 2005 % At-risk-of-poverty rate before social transfers 13a23 29 b 22 b 22 b 25 29 b 26 24 i 27 b 22 b 29 30 32 b 34 i : 29 i females23 30 b 20 b 21 b 23 31 b 25 23 i 25 b 22 b 27 27 29 b 29 i : 26 i males13 13 b 15 b 11 b 12 21 b 19 18 i 12 b 13 b 12 9 19 b 18 i : 26 i total 2005 % At-risk-of-poverty rate after social transfers 13b13 13 b 16 b 11 b 13 20 b 20 18 i 14 b 13 b 13 10 19 b 20 i : 27 i females13 14 b 14 b 11 b 11 21 b 19 18 i 11 b 13 b 11 9 19 b 16 i : 26 i males7.5 11.8 6.9 6.5 7.6 11.7 5.8 9.6 6.0 8.8 : : 10.9 : : : total 2007 % People aged 18-59 living in jobless households 14a8.6 12.9 8.3 7.7 8.7 12.8 6.1 10.7 6.9 9.6 : : 12.7 : : : females6.3 10.7 5.6 5.4 6.5 10.5 5.4 8.6 5.1 8.1 : : 8.9 : : : males4.0 14.0 8.4 5.9 6.1 9.5 4.8 9.4 2.5 10.5 : : 16.7 : : : total 2007 % Children aged 0-17 living in jobless households 14b
23.3 10.4 9.2 36.7 32.2 20.4 21.3 11.2 12.2 19.3 42.0 47.3 19.7 21.7 28.3 9.1 females 8/2007 % Percentage of women in the single or lower House of the national or federal Parliament 15a50.0 37.5 0.0 51.9 27.8 14.8 25.0 34.3 42.9 35.7 35.7 47.4 25.6 . . . females 10/2007 % Percentage of women in the European Parliament 15b
14 11 4 18 18 10 9 13 1 24 20 16 20 p : : : females 2003 % Gender pay gap in unadjusted form 1682.2 77.2 81.4 81.7 82.3 79.3 81.3 75.7 80.9 78.1 82.5 82.9 81.1 78.8 75.9 : females 2005 Year Life expectancy at birth 17a76.6 68.7 77.3 77.3 76.7 70.8 74.9 68.7 73.9 70.2 75.6 78.5 77.1 71.8 71.6 : males
62.1 p 53.9 p 70.1 p 63.1 p 59.6 p 66.6 p 56.7 p : 59.9 p 56.4 p 52.4 p 63.1 p 65.0 p : : : females 2005 Year Healthy Life Years at birth 17b62.2 p 52.0 p 68.5 p 65.0 p 57.8 p 61.0 p 58.4 p : 56.3 p 54.9 p 51.7 p 64.2 p 63.2 p : : : males
94 79 83 73 79 84 75 103 98 54 83 86 88 : : 82 total 2004 Index Serious accidents at work (1998 = 100) 18a96 93 77 95 72 92 84 97 109 62 90 85 81 : : : females point
97 75 86 72 86 82 75 107 93 52 83 88 89 : : : males
20 i 96 90 i 84 107 86 82 103 77 64 102 81 90.0 : : 64 total 2004 Indexpoint Fatal accidents at work (1998 = 100) 18b
LU HU MT NL AT PL PT RO SI SK FI SE UK HR MK TR Sex Time Unit Key indicator Nr Domain
Luxem-bourg Hungary Malta Nether-
lands Austria Poland Portugal Romania Slovenia Slovakia Finland Sweden United Kingdom Croatia FYROM4 Turkey
Population
Education and training
Labour market
Social protection
Income, social inclusion and living conditions
Gender equality
Health and safety
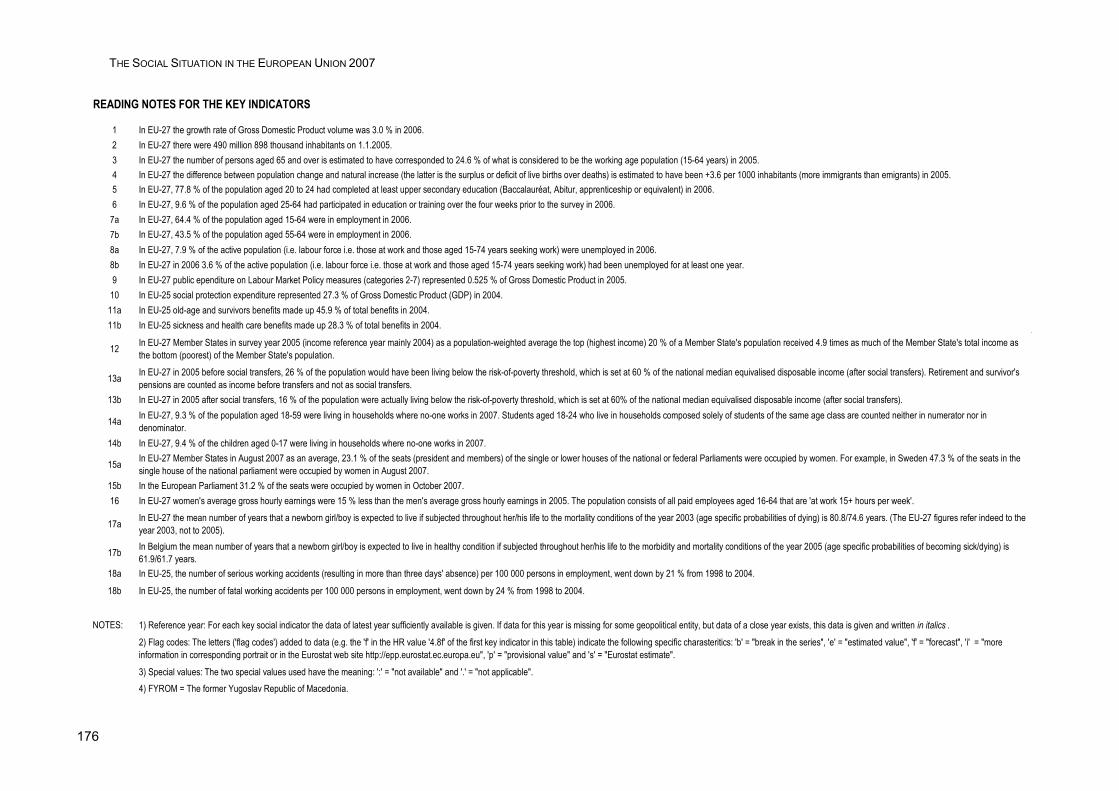
THE SOCIAL SITUATION IN THE EUROPEAN UNION 2007
176
READING NOTES FOR THE KEY INDICATORS
1 In EU-27 the growth rate of Gross Domestic Product volume was 3.0 % in 2006.2 In EU-27 there were 490 million 898 thousand inhabitants on 1.1.2005. 3 In EU-27 the number of persons aged 65 and over is estimated to have corresponded to 24.6 % of what is considered to be the working age population (15-64 years) in 2005.4 In EU-27 the difference between population change and natural increase (the latter is the surplus or deficit of live births over deaths) is estimated to have been +3.6 per 1000 inhabitants (more immigrants than emigrants) in 2005. 5 In EU-27, 77.8 % of the population aged 20 to 24 had completed at least upper secondary education (Baccalauréat, Abitur, apprenticeship or equivalent) in 2006. 6 In EU-27, 9.6 % of the population aged 25-64 had participated in education or training over the four weeks prior to the survey in 2006.
7a In EU-27, 64.4 % of the population aged 15-64 were in employment in 2006.7b In EU-27, 43.5 % of the population aged 55-64 were in employment in 2006.8a In EU-27, 7.9 % of the active population (i.e. labour force i.e. those at work and those aged 15-74 years seeking work) were unemployed in 2006.8b In EU-27 in 2006 3.6 % of the active population (i.e. labour force i.e. those at work and those aged 15-74 years seeking work) had been unemployed for at least one year. 9 In EU-27 public ependiture on Labour Market Policy measures (categories 2-7) represented 0.525 % of Gross Domestic Product in 2005.
10 In EU-25 social protection expenditure represented 27.3 % of Gross Domestic Product (GDP) in 2004.11a In EU-25 old-age and survivors benefits made up 45.9 % of total benefits in 2004.11b In EU-25 sickness and health care benefits made up 28.3 % of total benefits in 2004.
12 In EU-27 Member States in survey year 2005 (income reference year mainly 2004) as a population-weighted average the top (highest income) 20 % of a Member State's population received 4.9 times as much of the Member State's total income as the bottom (poorest) of the Member State's population.
13a In EU-27 in 2005 before social transfers, 26 % of the population would have been living below the risk-of-poverty threshold, which is set at 60 % of the national median equivalised disposable income (after social transfers). Retirement and survivor's pensions are counted as income before transfers and not as social transfers.
13b In EU-27 in 2005 after social transfers, 16 % of the population were actually living below the risk-of-poverty threshold, which is set at 60% of the national median equivalised disposable income (after social transfers).
14a In EU-27, 9.3 % of the population aged 18-59 were living in households where no-one works in 2007. Students aged 18-24 who live in households composed solely of students of the same age class are counted neither in numerator nor in denominator.
14b In EU-27, 9.4 % of the children aged 0-17 were living in households where no-one works in 2007.
15a In EU-27 Member States in August 2007 as an average, 23.1 % of the seats (president and members) of the single or lower houses of the national or federal Parliaments were occupied by women. For example, in Sweden 47.3 % of the seats in the single house of the national parliament were occupied by women in August 2007.
15b In the European Parliament 31.2 % of the seats were occupied by women in October 2007.16 In EU-27 women's average gross hourly earnings were 15 % less than the men's average gross hourly earnings in 2005. The population consists of all paid employees aged 16-64 that are 'at work 15+ hours per week'.
17a In EU-27 the mean number of years that a newborn girl/boy is expected to live if subjected throughout her/his life to the mortality conditions of the year 2003 (age specific probabilities of dying) is 80.8/74.6 years. (The EU-27 figures refer indeed to the year 2003, not to 2005).
17b In Belgium the mean number of years that a newborn girl/boy is expected to live in healthy condition if subjected throughout her/his life to the morbidity and mortality conditions of the year 2005 (age specific probabilities of becoming sick/dying) is 61.9/61.7 years.
18a In EU-25, the number of serious working accidents (resulting in more than three days' absence) per 100 000 persons in employment, went down by 21 % from 1998 to 2004.
18b In EU-25, the number of fatal working accidents per 100 000 persons in employment, went down by 24 % from 1998 to 2004.
NOTES: 1) Reference year: For each key social indicator the data of latest year sufficiently available is given. If data for this year is missing for some geopolitical entity, but data of a close year exists, this data is given and written in italics .2) Flag codes: The letters ('flag codes') added to data (e.g. the 'f' in the HR value '4.8f' of the first key indicator in this table) indicate the following specific charasteritics: 'b' = "break in the series", 'e' = "estimated value", 'f' = "forecast", 'i' = "more information in corresponding portrait or in the Eurostat web site http://epp.eurostat.ec.europa.eu", 'p' = "provisional value" and 's' = "Eurostat estimate".
3) Special values: The two special values used have the meaning: ':' = "not available" and '.' = "not applicable".4) FYROM = The former Yugoslav Republic of Macedonia.
177
Annex 1.2
Key Indicators per Geopolitical Entity
Time Series (mainly latest 10 years,
when available)
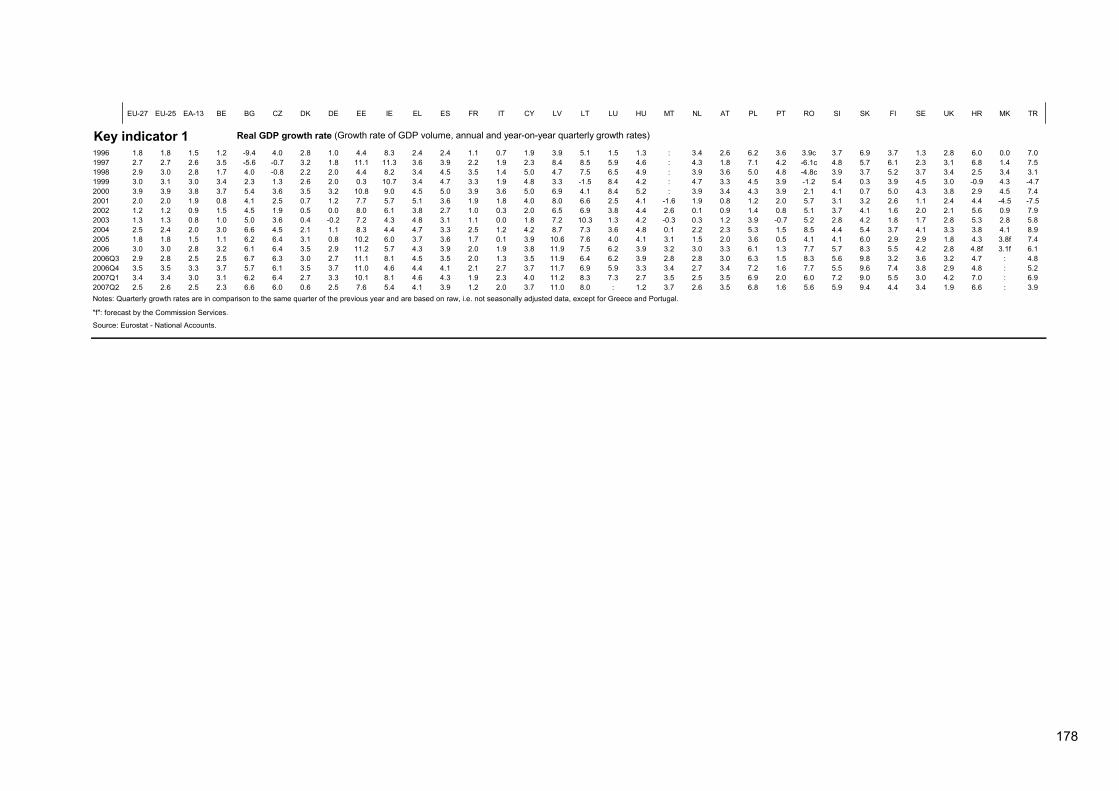
178
EU-27 EU-25 EA-13 BE BG CZ DK DE EE IE EL ES FR IT CY LV LT LU HU MT NL AT PL PT RO SI SK FI SE UK HR MK TR
Key indicator 11996 1.8 1.8 1.5 1.2 -9.4 4.0 2.8 1.0 4.4 8.3 2.4 2.4 1.1 0.7 1.9 3.9 5.1 1.5 1.3 : 3.4 2.6 6.2 3.6 3.9c 3.7 6.9 3.7 1.3 2.8 6.0 0.0 7.01997 2.7 2.7 2.6 3.5 -5.6 -0.7 3.2 1.8 11.1 11.3 3.6 3.9 2.2 1.9 2.3 8.4 8.5 5.9 4.6 : 4.3 1.8 7.1 4.2 -6.1c 4.8 5.7 6.1 2.3 3.1 6.8 1.4 7.51998 2.9 3.0 2.8 1.7 4.0 -0.8 2.2 2.0 4.4 8.2 3.4 4.5 3.5 1.4 5.0 4.7 7.5 6.5 4.9 : 3.9 3.6 5.0 4.8 -4.8c 3.9 3.7 5.2 3.7 3.4 2.5 3.4 3.11999 3.0 3.1 3.0 3.4 2.3 1.3 2.6 2.0 0.3 10.7 3.4 4.7 3.3 1.9 4.8 3.3 -1.5 8.4 4.2 : 4.7 3.3 4.5 3.9 -1.2 5.4 0.3 3.9 4.5 3.0 -0.9 4.3 -4.72000 3.9 3.9 3.8 3.7 5.4 3.6 3.5 3.2 10.8 9.0 4.5 5.0 3.9 3.6 5.0 6.9 4.1 8.4 5.2 : 3.9 3.4 4.3 3.9 2.1 4.1 0.7 5.0 4.3 3.8 2.9 4.5 7.42001 2.0 2.0 1.9 0.8 4.1 2.5 0.7 1.2 7.7 5.7 5.1 3.6 1.9 1.8 4.0 8.0 6.6 2.5 4.1 -1.6 1.9 0.8 1.2 2.0 5.7 3.1 3.2 2.6 1.1 2.4 4.4 -4.5 -7.52002 1.2 1.2 0.9 1.5 4.5 1.9 0.5 0.0 8.0 6.1 3.8 2.7 1.0 0.3 2.0 6.5 6.9 3.8 4.4 2.6 0.1 0.9 1.4 0.8 5.1 3.7 4.1 1.6 2.0 2.1 5.6 0.9 7.92003 1.3 1.3 0.8 1.0 5.0 3.6 0.4 -0.2 7.2 4.3 4.8 3.1 1.1 0.0 1.8 7.2 10.3 1.3 4.2 -0.3 0.3 1.2 3.9 -0.7 5.2 2.8 4.2 1.8 1.7 2.8 5.3 2.8 5.82004 2.5 2.4 2.0 3.0 6.6 4.5 2.1 1.1 8.3 4.4 4.7 3.3 2.5 1.2 4.2 8.7 7.3 3.6 4.8 0.1 2.2 2.3 5.3 1.5 8.5 4.4 5.4 3.7 4.1 3.3 3.8 4.1 8.92005 1.8 1.8 1.5 1.1 6.2 6.4 3.1 0.8 10.2 6.0 3.7 3.6 1.7 0.1 3.9 10.6 7.6 4.0 4.1 3.1 1.5 2.0 3.6 0.5 4.1 4.1 6.0 2.9 2.9 1.8 4.3 3.8f 7.42006 3.0 3.0 2.8 3.2 6.1 6.4 3.5 2.9 11.2 5.7 4.3 3.9 2.0 1.9 3.8 11.9 7.5 6.2 3.9 3.2 3.0 3.3 6.1 1.3 7.7 5.7 8.3 5.5 4.2 2.8 4.8f 3.1f 6.12006Q3 2.9 2.8 2.5 2.5 6.7 6.3 3.0 2.7 11.1 8.1 4.5 3.5 2.0 1.3 3.5 11.9 6.4 6.2 3.9 2.8 2.8 3.0 6.3 1.5 8.3 5.6 9.8 3.2 3.6 3.2 4.7 : 4.82006Q4 3.5 3.5 3.3 3.7 5.7 6.1 3.5 3.7 11.0 4.6 4.4 4.1 2.1 2.7 3.7 11.7 6.9 5.9 3.3 3.4 2.7 3.4 7.2 1.6 7.7 5.5 9.6 7.4 3.8 2.9 4.8 : 5.22007Q1 3.4 3.4 3.0 3.1 6.2 6.4 2.7 3.3 10.1 8.1 4.6 4.3 1.9 2.3 4.0 11.2 8.3 7.3 2.7 3.5 2.5 3.5 6.9 2.0 6.0 7.2 9.0 5.5 3.0 4.2 7.0 : 6.92007Q2 2.5 2.6 2.5 2.3 6.6 6.0 0.6 2.5 7.6 5.4 4.1 3.9 1.2 2.0 3.7 11.0 8.0 : 1.2 3.7 2.6 3.5 6.8 1.6 5.6 5.9 9.4 4.4 3.4 1.9 6.6 : 3.9
Source: Eurostat - National Accounts.
Real GDP growth rate (Growth rate of GDP volume, annual and year-on-year quarterly growth rates)
Notes: Quarterly growth rates are in comparison to the same quarter of the previous year and are based on raw, i.e. not seasonally adjusted data, except for Greece and Portugal.
"f": forecast by the Commission Services.

ANNEX 1.2 | KEY INDICATORS PER GEOPOLITICAL ENTITY — TIME SERIES
179
EU-27 EU-25 EA-13 BE BG CZ DK DE EE IE EL ES FR IT CY LV LT LU HU MT NL AT PL PT RO SI SK FI SE UK HR MK TR
Key indicator 2a1950 : : : 8 639 : : 4 251 68 376 : 2 969 7 566 28 009 41 647 47 101 : : : 295 : : 10 027 6 926 : 8 437 : : : 3 988 6 986 50 616 : : :1960 402 607 376 423 252 205 9 129 7 829 9 638 4 565 72 543 1 209 2 836 8 300 30 327 45 465 50 026 572 2 104 2 756 313 9 961 327 11 417 7 030 29 480 8 826 18 319 1 581 3 970 4 413 7 471 52 200 4 127 1 384 27 1201970 435 474 406 870 273 235 9 660 8 464 9 906 4 907 78 269 1 356 2 943 8 781 33 588 50 528 53 685 612 2 352 3 119 339 10 322 303 12 958 7 455 32 671 8 698 20 140 1 718 4 537 4 614 8 004 55 546 4 403 1 617 34 8811980 457 053 426 081 286 751 9 855 8 846 10 316 5 122 78 180 1 472 3 393 9 584 37 242 53 731 56 388 510e 2 509 3 404 363 10 709 315 14 091 7 546 35 413 9 714 22 133 1 893 4 963 4 771 8 303 56 285 4 598 1 878 44 0211990 470 388 438 712 294 670 9 948 8 767 10 362 5 135 79 113 1 571 3 507 10 121 38 826 56 577 56 694 573 2 668 3 694 379 10 375 352 14 893 7 645 38 038 9 996 23 211 1 996 5 288 4 974 8 527 57 157 4 778 1 873 55 4951995 476 491 446 428 300 681 10 131 8 427 10 333 5 216 81 539 1 448 3 598 10 595 39 343 57 753 56 844 645 2 501 3 643 406 10 337 369 15 424 7 943 38 581 10 018 22 194 1 989 5 356 5 099 8 816 57 943 4 669 1 957 61 2041996 477 333 447 426 301 474 10 143 8 385 10 321 5 251 81 817 1 425 3 620 10 674 39 431 57 936 56 844 656 2 470 3 615 412 10 321 371 15 494 7 953 38 609 10 043 22 133 1 990 5 368 5 117 8 837 58 095 4 494 1 972 62 3381997 478 102 448 376 302 241 10 170 8 341 10 309 5 275 82 012 1 406 3 655 10 745 39 525 58 116 56 876 666 2 445 3 588 417 10 301 374 15 567 7 965 38 639 10 073 22 054 1 987 5 379 5 132 8 844 58 239 4 572 1 991 63 4851998 480 383 449 174 304 520 10 192 8 283 10 299 5 295 82 057 1 393 3 694 10 808 39 639 58 299 56 904 675 2 421 3 562 422 10 280 377 15 654 7 971 38 660 10 110 21 989 1 985 5 388 5 147 8 848 58 395 4 501 2 002 64 6421999 481 076 450 053 305 172 10 214 8 230 10 290 5 314 82 037 1 379 3 732 10 861 39 803 58 497 56 909 683 2 399 3 536 427 10 253 379 15 760 7 982 38 667 10 149 21 946 1 978 5 393 5 160 8 854 58 580 4 554 2 013 65 7872000 482 188 451 169 306 225 10 239 8 191 10 278 5 330 82 163 1 372 3 778 10 904 40 050 58 825 56 924 690 2 382 3 512 434 10 222 380 15 864 8 002 38 654 10 195 21 908 1 988 5 399 5 171 8 861 58 785 4 442 2 022 66 8892001 482 958 452 151 307 514 10 263 7 929 10 267 5 349 82 260 1 367 3 833 10 931 40 477 59 200 56 961 698 2 364 3 487 439 10 200 391 15 987 8 021 38 254 10 257 21 876 1 990 5 379 5 181 8 883 59 000 4 437 2 031 67 8962002 484 541 452 755 309 035 10 310 7 892 10 206 5 368 82 440 1 361 3 900 10 969 40 964 59 586 56 994 706 2 346 3 476 444 10 175 395 16 105 8 065 38 242 10 329 21 833 1 994 5 379 5 195 8 909 59 217 4 444 2 039 68 8382003 486 520 454987 p 310 934 10 356 7 846 10 203 5 384 82 537 1 356 3 964 11 006 41 664 59 970 57 321 715 2 331 3 463 448 10 142 397 16 193 8 102 38 219 10 407 21 773 1 995 5 379 5 206 8 941 59 438 4 442 2 024 69 7702004 488 632 457 162 p 312 901 10 396 7 801 10 211 5 398 82 532 1 351 4 028 11 041 42 345 60 340 57 888 730 2 319 3 446 452 10 117 400 16 258 8 140 38 191 10 475 21 711 1 996 5 380 5 220 8 976 59 700 4 442 2 030 70 6922005 490 898 461 479 314 888 10 446 7 761 10 221 5 411 82 501 1 348 4 109 11 083 43 038 60 702 58 462 749 2 306 3 425 455 10 098 403 16 306 8 207 38 174 10 529 21 659 1 998 5 385 5 237 9 011 60 060 4 444 2 035 71 610Note: De jure population, except for DE, IE, HU, SI, FI, BG and TR de facto population.
Source: Eurostat - Demographic Statistics, except TR: 1960-2000: Council of Europe.
EU-27 EU-25 EA-13 BE BG CZ DK DE EE IE EL ES FR IT CY LV LT LU HU MT NL AT PL PT RO SI SK FI SE UK HR MK TR
Key indicator 2b2005 487 881 458 490 310 108 10 425 7 737 10 197 5 411 82 600 1 346 4 077 11 083 42 920 60 183 58 189 739 2 305 3 429 456 10 096 404 16 331 8 140 38 137 10 524 21 654 2 000 5 376 5 233 9 010 59 880 4 551i : 73 193i2010 492 838 464 054 315 076 10 554 7 439 10 122 5 465 82 824 1 314 4 323 11 269 44 603 61 486 58 631 784 2 240 3 345 477 9 982 423 16 672 8 256 37 830 10 686 21 345 2 015 5 347 5 294 9 187 60 924 4 532i : 78 081i2015 495 353 467 306 317 922 10 674 7 130 10 012 5 498 82 864 1 279 4 555 11 390 45 264 62 616 58 630 828 2 174 3 258 499 9 834 439 16 957 8 358 37 428 10 762 20 917 2 019 5 309 5 353 9 373 61 934 4 454i : 82 640i2020 496 408 469 270 319 426 10 790 6 796 9 902 5 526 82 676 1 248 4 756 11 427 45 559 63 571 58 300 866 2 115 3 182 521 9 693 454 17 209 8 441 37 065 10 771 20 342 2 017 5 271 5 405 9 575 62 930 4 367i : 86 774i2025 496 268 470 057 319 662 10 898 6 465 9 812 5 557 82 108 1 224 4 922 11 394 45 556 64 392 57 751 897 2 068 3 134 544 9 588 468 17 429 8 501 36 836 10 730 19 746 2 014 5 237 5 439 9 769 63 792 4 271i : 90 565i2030 494 784 469 365 318 861 10 984 6 175 9 693 5 577 81 146 1 202 5 066 11 316 45 379 65 118 57 071 921 2 022 3 092 567 9 484 479 17 589 8 520 36 542 10 660 19 244 2 006 5 186 5 443 9 911 64 388 4 164i : 93 876i2035 491 703 467 007 317 112 11 031 5 908 9 523 5 573 79 885 1 182 5 198 11 208 45 095 65 705 56 276 939 1 979 3 045 589 9 362 488 17 662 8 491 36 053 10 560 18 787 1 989 5 107 5 412 9 997 64 659 4 047i : 96 573i2040 486 992 463 044 314 278 11 029 5 644 9 320 5 539 78 447 1 163 5 317 11 062 44 646 65 995 55 330 952 1 942 2 995 608 9 224 495 17 636 8 430 35 373 10 425 18 304 1 965 5 001 5 353 10 060 64 736 3 926i : 98 651i2045 480 398 457 270 310 018 10 982 5 373 9 109 5 486 76 697 1 145 5 413 10 872 43 918 65 949 54 158 964 1 909 2 941 626 9 072 501 17 537 8 340 34 547 10 244 17 755 1 935 4 876 5 283 10 128 64 637 3 806i : 100 189i2050 472 050 449 831 304 395 10 906 5 094 8 894 5 430 74 642 1 126 5 478 10 632 42 834 65 704 52 709 975 1 873 2 881 643 8 915 508 17 406 8 216 33 665 10 009 17 125 1 901 4 738 5 217 10 202 64 330 3 686i : 101 208i
Note: Data for France refer to metropolitan France.
Total population, 1st January (The number of inhabitants of the area on 1st January (or on 31st December of the previous year) in 1000 inhabitants),Observed
Total population, 1st January (The number of inhabitants of the area on 1st January (or on 31st December of the previous year) in 1000 inhabitants), Eurostat 2004-based population projections, trend scenario, baseline variant
Sources: 1) Eurostat - 2004-based population projections, trend scenario, baseline variant, except 2) HR and TR: United Nations, Population Division - Population Estimates and Projections, Medium variant projection - 2005 data is estimate and 2010-2050 data from the 'Medium variant projection' (http://unstats.un.org/unsd/cdb/cdb_series_xrxx.asp?series_code=13660).
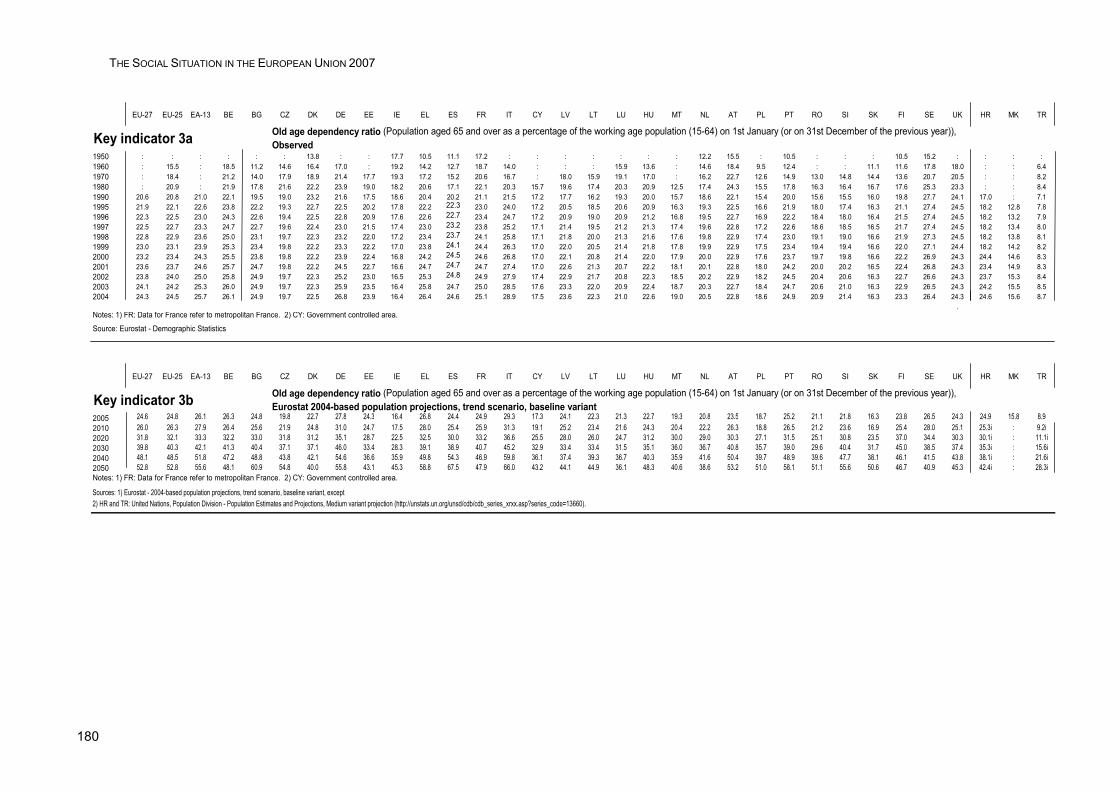
THE SOCIAL SITUATION IN THE EUROPEAN UNION 2007
180
EU-27 EU-25 EA-13 BE BG CZ DK DE EE IE EL ES FR IT CY LV LT LU HU MT NL AT PL PT RO SI SK FI SE UK HR MK TR
1950 : : : : : : 13.8 : : 17.7 10.5 11.1 17.2 : : : : : : : 12.2 15.5 : 10.5 : : : 10.5 15.2 : : : :1960 : 15.5 : 18.5 11.2 14.6 16.4 17.0 : 19.2 14.2 12.7 18.7 14.0 : : : 15.9 13.6 : 14.6 18.4 9.5 12.4 : : 11.1 11.6 17.8 18.0 : : 6.41970 : 18.4 : 21.2 14.0 17.9 18.9 21.4 17.7 19.3 17.2 15.2 20.6 16.7 : 18.0 15.9 19.1 17.0 : 16.2 22.7 12.6 14.9 13.0 14.8 14.4 13.6 20.7 20.5 : : 8.21980 : 20.9 : 21.9 17.8 21.6 22.2 23.9 19.0 18.2 20.6 17.1 22.1 20.3 15.7 19.6 17.4 20.3 20.9 12.5 17.4 24.3 15.5 17.8 16.3 16.4 16.7 17.6 25.3 23.3 : : 8.41990 20.6 20.8 21.0 22.1 19.5 19.0 23.2 21.6 17.5 18.6 20.4 20.2 21.1 21.5 17.2 17.7 16.2 19.3 20.0 15.7 18.6 22.1 15.4 20.0 15.6 15.5 16.0 19.8 27.7 24.1 17.0 : 7.11995 21.9 22.1 22.6 23.8 22.2 19.3 22.7 22.5 20.2 17.8 22.2 22.3 23.0 24.0 17.2 20.5 18.5 20.6 20.9 16.3 19.3 22.5 16.6 21.9 18.0 17.4 16.3 21.1 27.4 24.5 18.2 12.8 7.81996 22.3 22.5 23.0 24.3 22.6 19.4 22.5 22.8 20.9 17.6 22.6 22.7 23.4 24.7 17.2 20.9 19.0 20.9 21.2 16.8 19.5 22.7 16.9 22.2 18.4 18.0 16.4 21.5 27.4 24.5 18.2 13.2 7.91997 22.5 22.7 23.3 24.7 22.7 19.6 22.4 23.0 21.5 17.4 23.0 23.2 23.8 25.2 17.1 21.4 19.5 21.2 21.3 17.4 19.6 22.8 17.2 22.6 18.6 18.5 16.5 21.7 27.4 24.5 18.2 13.4 8.01998 22.8 22.9 23.6 25.0 23.1 19.7 22.3 23.2 22.0 17.2 23.4 23.7 24.1 25.8 17.1 21.8 20.0 21.3 21.6 17.6 19.8 22.9 17.4 23.0 19.1 19.0 16.6 21.9 27.3 24.5 18.2 13.8 8.11999 23.0 23.1 23.9 25.3 23.4 19.8 22.2 23.3 22.2 17.0 23.8 24.1 24.4 26.3 17.0 22.0 20.5 21.4 21.8 17.8 19.9 22.9 17.5 23.4 19.4 19.4 16.6 22.0 27.1 24.4 18.2 14.2 8.22000 23.2 23.4 24.3 25.5 23.8 19.8 22.2 23.9 22.4 16.8 24.2 24.5 24.6 26.8 17.0 22.1 20.8 21.4 22.0 17.9 20.0 22.9 17.6 23.7 19.7 19.8 16.6 22.2 26.9 24.3 24.4 14.6 8.32001 23.6 23.7 24.6 25.7 24.7 19.8 22.2 24.5 22.7 16.6 24.7 24.7 24.7 27.4 17.0 22.6 21.3 20.7 22.2 18.1 20.1 22.8 18.0 24.2 20.0 20.2 16.5 22.4 26.8 24.3 23.4 14.9 8.32002 23.8 24.0 25.0 25.8 24.9 19.7 22.3 25.2 23.0 16.5 25.3 24.8 24.9 27.9 17.4 22.9 21.7 20.8 22.3 18.5 20.2 22.9 18.2 24.5 20.4 20.6 16.3 22.7 26.6 24.3 23.7 15.3 8.42003 24.1 24.2 25.3 26.0 24.9 19.7 22.3 25.9 23.5 16.4 25.8 24.7 25.0 28.5 17.6 23.3 22.0 20.9 22.4 18.7 20.3 22.7 18.4 24.7 20.6 21.0 16.3 22.9 26.5 24.3 24.2 15.5 8.52004 24.3 24.5 25.7 26.1 24.9 19.7 22.5 26.8 23.9 16.4 26.4 24.6 25.1 28.9 17.5 23.6 22.3 21.0 22.6 19.0 20.5 22.8 18.6 24.9 20.9 21.4 16.3 23.3 26.4 24.3 24.6 15.6 8.7
.Notes: 1) FR: Data for France refer to metropolitan France. 2) CY: Government controlled area.
Source: Eurostat - Demographic Statistics
EU-27 EU-25 EA-13 BE BG CZ DK DE EE IE EL ES FR IT CY LV LT LU HU MT NL AT PL PT RO SI SK FI SE UK HR MK TR
2005 24.6 24.8 26.1 26.3 24.8 19.8 22.7 27.8 24.3 16.4 26.8 24.4 24.9 29.3 17.3 24.1 22.3 21.3 22.7 19.3 20.8 23.5 18.7 25.2 21.1 21.8 16.3 23.8 26.5 24.3 24.9 15.8 8.92010 26.0 26.3 27.9 26.4 25.6 21.9 24.8 31.0 24.7 17.5 28.0 25.4 25.9 31.3 19.1 25.2 23.4 21.6 24.3 20.4 22.2 26.3 18.8 26.5 21.2 23.6 16.9 25.4 28.0 25.1 25.3i : 9.2i2020 31.8 32.1 33.3 32.2 33.0 31.8 31.2 35.1 28.7 22.5 32.5 30.0 33.2 36.6 25.5 28.0 26.0 24.7 31.2 30.0 29.0 30.3 27.1 31.5 25.1 30.8 23.5 37.0 34.4 30.3 30.1i : 11.1i2030 39.8 40.3 42.1 41.3 40.4 37.1 37.1 46.0 33.4 28.3 39.1 38.9 40.7 45.2 32.9 33.4 33.4 31.5 35.1 36.0 36.7 40.8 35.7 39.0 29.6 40.4 31.7 45.0 38.5 37.4 35.3i : 15.6i2040 48.1 48.5 51.8 47.2 48.8 43.8 42.1 54.6 36.6 35.9 49.8 54.3 46.9 59.8 36.1 37.4 39.3 36.7 40.3 35.9 41.6 50.4 39.7 48.9 39.6 47.7 38.1 46.1 41.5 43.8 38.1i : 21.6i2050 52.8 52.8 55.6 48.1 60.9 54.8 40.0 55.8 43.1 45.3 58.8 67.5 47.9 66.0 43.2 44.1 44.9 36.1 48.3 40.6 38.6 53.2 51.0 58.1 51.1 55.6 50.6 46.7 40.9 45.3 42.4i : 28.3iNotes: 1) FR: Data for France refer to metropolitan France. 2) CY: Government controlled area.
Sources: 1) Eurostat - 2004-based population projections, trend scenario, baseline variant, except 2) HR and TR: United Nations, Population Division - Population Estimates and Projections, Medium variant projection (http://unstats.un.org/unsd/cdb/cdb_series_xrxx.asp?series_code=13660).
Key indicator 3a
Key indicator 3b
Old age dependency ratio (Population aged 65 and over as a percentage of the working age population (15-64) on 1st January (or on 31st December of the previous year)),Observed
Old age dependency ratio (Population aged 65 and over as a percentage of the working age population (15-64) on 1st January (or on 31st December of the previous year)),Eurostat 2004-based population projections, trend scenario, baseline variant
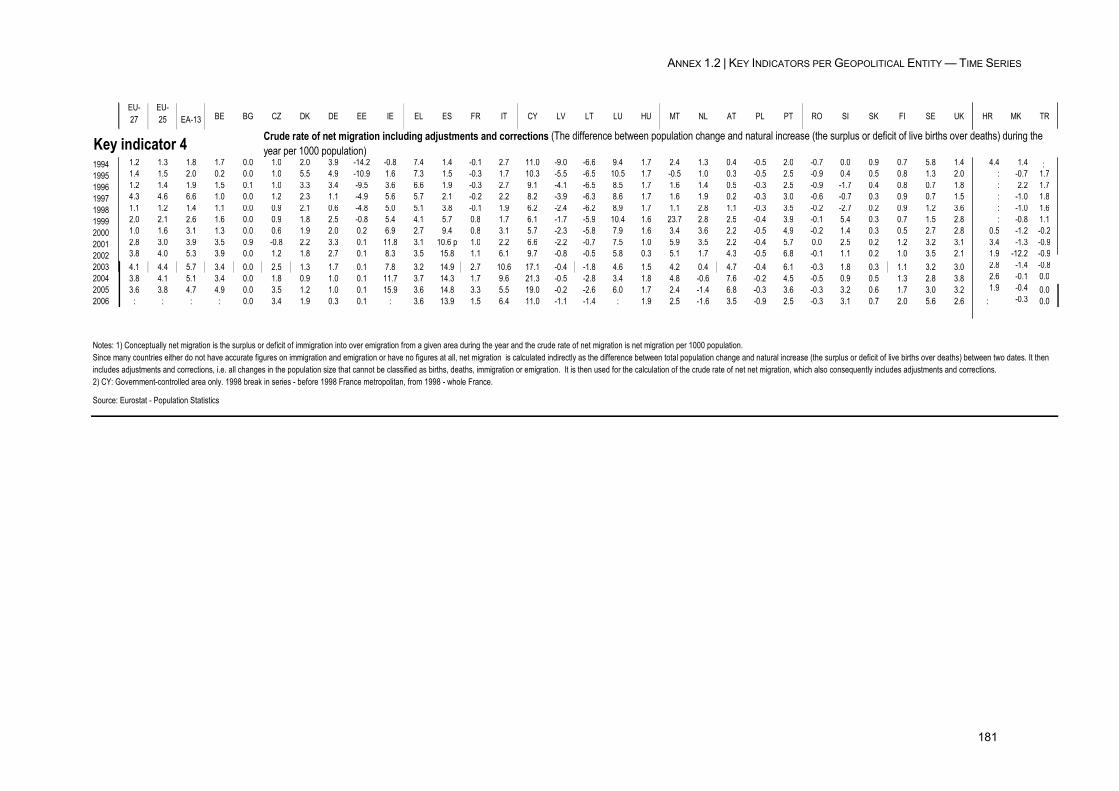
ANNEX 1.2 | KEY INDICATORS PER GEOPOLITICAL ENTITY — TIME SERIES
181
EU-27
EU-25 EA-13 BE BG CZ DK DE EE IE EL ES FR IT CY LV LT LU HU MT NL AT PL PT RO SI SK FI SE UK HR MK TR
Key indicator 41994 1.2 1.3 1.8 1.7 0.0 1.0 2.0 3.9 -14.2 -0.8 7.4 1.4 -0.1 2.7 11.0 -9.0 -6.6 9.4 1.7 2.4 1.3 0.4 -0.5 2.0 -0.7 0.0 0.9 0.7 5.8 1.4 4.4 1.4 : 1995 1.4 1.5 2.0 0.2 0.0 1.0 5.5 4.9 -10.9 1.6 7.3 1.5 -0.3 1.7 10.3 -5.5 -6.5 10.5 1.7 -0.5 1.0 0.3 -0.5 2.5 -0.9 0.4 0.5 0.8 1.3 2.0 : -0.7 1.71996 1.2 1.4 1.9 1.5 0.1 1.0 3.3 3.4 -9.5 3.6 6.6 1.9 -0.3 2.7 9.1 -4.1 -6.5 8.5 1.7 1.6 1.4 0.5 -0.3 2.5 -0.9 -1.7 0.4 0.8 0.7 1.8 : 2.2 1.71997 4.3 4.6 6.6 1.0 0.0 1.2 2.3 1.1 -4.9 5.6 5.7 2.1 -0.2 2.2 8.2 -3.9 -6.3 8.6 1.7 1.6 1.9 0.2 -0.3 3.0 -0.6 -0.7 0.3 0.9 0.7 1.5 : -1.0 1.81998 1.1 1.2 1.4 1.1 0.0 0.9 2.1 0.6 -4.8 5.0 5.1 3.8 -0.1 1.9 6.2 -2.4 -6.2 8.9 1.7 1.1 2.8 1.1 -0.3 3.5 -0.2 -2.7 0.2 0.9 1.2 3.6 : -1.0 1.61999 2.0 2.1 2.6 1.6 0.0 0.9 1.8 2.5 -0.8 5.4 4.1 5.7 0.8 1.7 6.1 -1.7 -5.9 10.4 1.6 23.7 2.8 2.5 -0.4 3.9 -0.1 5.4 0.3 0.7 1.5 2.8 : -0.8 1.12000 1.0 1.6 3.1 1.3 0.0 0.6 1.9 2.0 0.2 6.9 2.7 9.4 0.8 3.1 5.7 -2.3 -5.8 7.9 1.6 3.4 3.6 2.2 -0.5 4.9 -0.2 1.4 0.3 0.5 2.7 2.8 0.5 -1.2 -0.22001 2.8 3.0 3.9 3.5 0.9 -0.8 2.2 3.3 0.1 11.8 3.1 10.6 p 1.0 2.2 6.6 -2.2 -0.7 7.5 1.0 5.9 3.5 2.2 -0.4 5.7 0.0 2.5 0.2 1.2 3.2 3.1 3.4 -1.3 -0.92002 3.8 4.0 5.3 3.9 0.0 1.2 1.8 2.7 0.1 8.3 3.5 15.8 1.1 6.1 9.7 -0.8 -0.5 5.8 0.3 5.1 1.7 4.3 -0.5 6.8 -0.1 1.1 0.2 1.0 3.5 2.1 1.9 -12.2 -0.92003 4.1 4.4 5.7 3.4 0.0 2.5 1.3 1.7 0.1 7.8 3.2 14.9 2.7 10.6 17.1 -0.4 -1.8 4.6 1.5 4.2 0.4 4.7 -0.4 6.1 -0.3 1.8 0.3 1.1 3.2 3.0 2.8 -1.4 -0.82004 3.8 4.1 5.1 3.4 0.0 1.8 0.9 1.0 0.1 11.7 3.7 14.3 1.7 9.6 21.3 -0.5 -2.8 3.4 1.8 4.8 -0.6 7.6 -0.2 4.5 -0.5 0.9 0.5 1.3 2.8 3.8 2.6 -0.1 0.02005 3.6 3.8 4.7 4.9 0.0 3.5 1.2 1.0 0.1 15.9 3.6 14.8 3.3 5.5 19.0 -0.2 -2.6 6.0 1.7 2.4 -1.4 6.8 -0.3 3.6 -0.3 3.2 0.6 1.7 3.0 3.2 1.9 -0.4 0.02006 : : : : 0.0 3.4 1.9 0.3 0.1 : 3.6 13.9 1.5 6.4 11.0 -1.1 -1.4 : 1.9 2.5 -1.6 3.5 -0.9 2.5 -0.3 3.1 0.7 2.0 5.6 2.6 : -0.3 0.0
Source: Eurostat - Population Statistics
Crude rate of net migration including adjustments and corrections (The difference between population change and natural increase (the surplus or deficit of live births over deaths) during the year per 1000 population)
Notes: 1) Conceptually net migration is the surplus or deficit of immigration into over emigration from a given area during the year and the crude rate of net migration is net migration per 1000 population. Since many countries either do not have accurate figures on immigration and emigration or have no figures at all, net migration is calculated indirectly as the difference between total population change and natural increase (the surplus or deficit of live births over deaths) between two dates. It then includes adjustments and corrections, i.e. all changes in the population size that cannot be classified as births, deaths, immigration or emigration. It is then used for the calculation of the crude rate of net net migration, which also consequently includes adjustments and corrections.2) CY: Government-controlled area only. 1998 break in series - before 1998 France metropolitan, from 1998 - whole France.
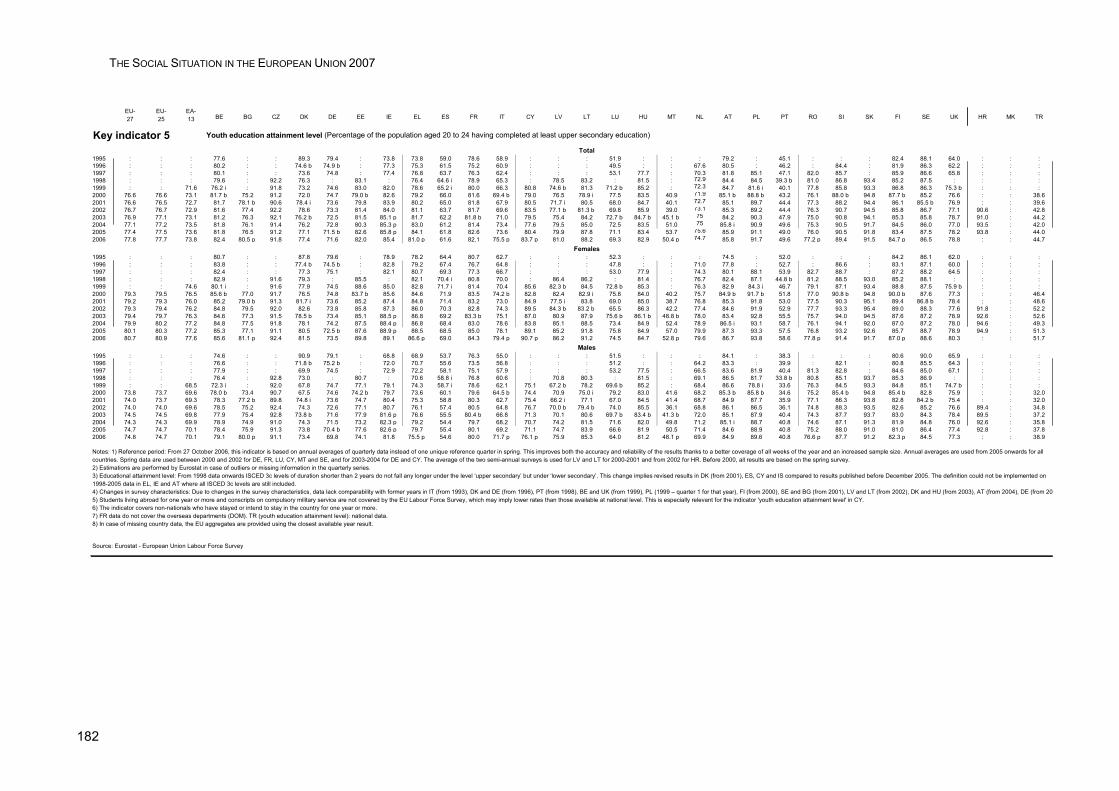
THE SOCIAL SITUATION IN THE EUROPEAN UNION 2007
182
EU-27
EU-25
EA-13 BE BG CZ DK DE EE IE EL ES FR IT CY LV LT LU HU MT NL AT PL PT RO SI SK FI SE UK HR MK TR
Key indicator 5 Youth education attainment level (Percentage of the population aged 20 to 24 having completed at least upper secondary education)
Total1995 : : : 77.6 : : 89.3 79.4 : 73.8 73.8 59.0 78.6 58.9 : : : 51.9 : : : 79.2 : 45.1 : : : 82.4 88.1 64.0 : : :1996 : : : 80.2 : : 74.6 b 74.9 b : 77.3 75.3 61.5 75.2 60.9 : : : 49.5 : : 67.6 80.5 : 46.2 : 84.4 : 81.9 86.3 62.2 : : :1997 : : : 80.1 : : 73.6 74.8 : 77.4 76.8 63.7 76.3 62.4 : : : 53.1 77.7 : 70.3 81.8 85.1 47.1 82.0 85.7 : 85.9 86.6 65.8 : : :1998 : : : 79.6 : 92.2 76.3 : 83.1 : 76.4 64.6 i 78.9 65.3 : 78.5 83.2 : 81.5 : 72.9 84.4 84.5 39.3 b 81.0 86.8 93.4 85.2 87.5 : : : :1999 : : 71.6 76.2 i : 91.8 73.2 74.6 83.0 82.0 78.6 65.2 i 80.0 66.3 80.8 74.6 b 81.3 71.2 b 85.2 : 72.3 84.7 81.6 i 40.1 77.8 85.8 93.3 86.8 86.3 75.3 b : : :2000 76.6 76.6 73.1 81.7 b 75.2 91.2 72.0 74.7 79.0 b 82.6 79.2 66.0 81.6 69.4 b 79.0 76.5 78.9 i 77.5 83.5 40.9 71.9 85.1 b 88.8 b 43.2 76.1 88.0 b 94.8 87.7 b 85.2 76.6 : : 38.62001 76.6 76.5 72.7 81.7 78.1 b 90.6 78.4 i 73.6 79.8 83.9 80.2 65.0 81.8 67.9 80.5 71.7 i 80.5 68.0 84.7 40.1 72.7 85.1 89.7 44.4 77.3 88.2 94.4 86.1 85.5 b 76.9 : : 39.62002 76.7 76.7 72.9 81.6 77.4 92.2 78.6 73.3 81.4 84.0 81.1 63.7 81.7 69.6 83.5 77.1 b 81.3 b 69.8 85.9 39.0 73.1 85.3 89.2 44.4 76.3 90.7 94.5 85.8 86.7 77.1 90.6 : 42.82003 76.9 77.1 73.1 81.2 76.3 92.1 76.2 b 72.5 81.5 85.1 p 81.7 62.2 81.8 b 71.0 79.5 75.4 84.2 72.7 b 84.7 b 45.1 b 75 84.2 90.3 47.9 75.0 90.8 94.1 85.3 85.8 78.7 91.0 : 44.22004 77.1 77.2 73.5 81.8 76.1 91.4 76.2 72.8 80.3 85.3 p 83.0 61.2 81.4 73.4 77.6 79.5 85.0 72.5 83.5 51.0 75 85.8 i 90.9 49.6 75.3 90.5 91.7 84.5 86.0 77.0 93.5 : 42.02005 77.4 77.5 73.6 81.8 76.5 91.2 77.1 71.5 b 82.6 85.8 p 84.1 61.8 82.6 73.6 80.4 79.9 87.8 71.1 83.4 53.7 75.6 85.9 91.1 49.0 76.0 90.5 91.8 83.4 87.5 78.2 93.8 : 44.02006 77.8 77.7 73.8 82.4 80.5 p 91.8 77.4 71.6 82.0 85.4 81.0 p 61.6 82.1 75.5 p 83.7 p 81.0 88.2 69.3 82.9 50.4 p 74.7 85.8 91.7 49.6 77.2 p 89.4 91.5 84.7 p 86.5 78.8 : : 44.7
Females1995 : : : 80.7 : : 87.8 79.6 : 78.9 78.2 64.4 80.7 62.7 : : : 52.3 : : : 74.5 : 52.0 : : : 84.2 86.1 62.0 : : :1996 : : : 83.8 : : 77.4 b 74.5 b : 82.8 79.2 67.4 76.7 64.8 : : : 47.8 : : 71.0 77.8 : 52.7 : 86.6 : 83.1 87.1 60.0 : : :1997 : : : 82.4 : : 77.3 75.1 : 82.1 80.7 69.3 77.3 66.7 : : : 53.0 77.9 : 74.3 80.1 88.1 53.9 82.7 88.7 : 87.2 88.2 64.5 : : :1998 : : : 82.9 : 91.6 79.3 : 85.5 : 82.1 70.4 i 80.8 70.0 : 86.4 86.2 : 81.4 : 76.7 82.4 87.1 44.8 b 81.2 88.5 93.0 85.2 88.1 : : : :1999 : : 74.6 80.1 i : 91.6 77.9 74.5 88.6 85.0 82.8 71.7 i 81.4 70.4 85.6 82.3 b 84.5 72.8 b 85.3 : 76.3 82.9 84.3 i 46.7 79.1 87.1 93.4 88.8 87.5 75.9 b : : :2000 79.3 79.5 76.5 85.6 b 77.0 91.7 76.5 74.8 83.7 b 85.6 84.6 71.9 83.5 74.2 b 82.8 82.4 82.9 i 75.8 84.0 40.2 75.7 84.9 b 91.7 b 51.8 77.0 90.8 b 94.8 90.0 b 87.6 77.3 : : 46.42001 79.2 79.3 76.0 85.2 79.0 b 91.3 81.7 i 73.6 85.2 87.4 84.8 71.4 83.2 73.0 84.9 77.5 i 83.8 69.0 85.0 38.7 76.8 85.3 91.8 53.0 77.5 90.3 95.1 89.4 86.8 b 78.4 : : 48.62002 79.3 79.4 76.2 84.8 79.5 92.0 82.6 73.8 85.8 87.3 86.0 70.3 82.8 74.3 89.5 84.3 b 83.2 b 65.5 86.3 42.2 77.4 84.6 91.9 52.9 77.7 93.3 95.4 89.0 88.3 77.6 91.8 : 52.22003 79.4 79.7 76.3 84.6 77.3 91.5 78.5 b 73.4 85.1 88.5 p 86.8 69.2 83.3 b 75.1 87.0 80.9 87.9 75.6 b 86.1 b 48.8 b 78.0 83.4 92.8 55.5 75.7 94.0 94.5 87.6 87.2 78.9 92.6 : 52.62004 79.9 80.2 77.2 84.8 77.5 91.8 78.1 74.2 87.5 88.4 p 86.8 68.4 83.0 78.6 83.8 85.1 88.5 73.4 84.9 52.4 78.9 86.5 i 93.1 58.7 76.1 94.1 92.0 87.0 87.2 78.0 94.6 : 49.32005 80.1 80.3 77.2 85.3 77.1 91.1 80.5 72.5 b 87.6 88.9 p 88.5 68.5 85.0 78.1 89.1 85.2 91.8 75.8 84.9 57.0 79.9 87.3 93.3 57.5 76.8 93.2 92.6 85.7 88.7 78.9 94.9 : 51.32006 80.7 80.9 77.6 85.6 81.1 p 92.4 81.5 73.5 89.8 89.1 86.6 p 69.0 84.3 79.4 p 90.7 p 86.2 91.2 74.5 84.7 52.8 p 79.6 86.7 93.8 58.6 77.8 p 91.4 91.7 87.0 p 88.6 80.3 : : 51.7
Males1995 : : : 74.6 : : 90.9 79.1 : 68.8 68.9 53.7 76.3 55.0 : : : 51.5 : : : 84.1 : 38.3 : : : 80.6 90.0 65.9 : : :1996 : : : 76.6 : : 71.8 b 75.2 b : 72.0 70.7 55.6 73.5 56.8 : : : 51.2 : : 64.2 83.3 : 39.9 : 82.1 : 80.8 85.5 64.3 : : :1997 : : : 77.9 : : 69.9 74.5 : 72.9 72.2 58.1 75.1 57.9 : : : 53.2 77.5 : 66.5 83.6 81.9 40.4 81.3 82.8 : 84.6 85.0 67.1 : : :1998 : : : 76.4 : 92.8 73.0 : 80.7 : 70.6 58.8 i 76.8 60.6 : 70.8 80.3 : 81.5 : 69.1 86.5 81.7 33.8 b 80.8 85.1 93.7 85.3 86.9 : : : :1999 : : 68.5 72.3 i : 92.0 67.8 74.7 77.1 79.1 74.3 58.7 i 78.6 62.1 75.1 67.2 b 78.2 69.6 b 85.2 : 68.4 86.6 78.8 i 33.6 76.3 84.5 93.3 84.8 85.1 74.7 b : : :2000 73.8 73.7 69.6 78.0 b 73.4 90.7 67.5 74.6 74.2 b 79.7 73.6 60.1 79.6 64.5 b 74.4 70.9 75.0 i 79.2 83.0 41.6 68.2 85.3 b 85.8 b 34.6 75.2 85.4 b 94.8 85.4 b 82.8 75.9 : : 32.02001 74.0 73.7 69.3 78.3 77.2 b 89.8 74.8 i 73.6 74.7 80.4 75.3 58.8 80.3 62.7 75.4 66.2 i 77.1 67.0 84.5 41.4 68.7 84.9 87.7 35.9 77.1 86.3 93.8 82.8 84.2 b 75.4 : : 32.02002 74.0 74.0 69.6 78.5 75.2 92.4 74.3 72.6 77.1 80.7 76.1 57.4 80.5 64.8 76.7 70.0 b 79.4 b 74.0 85.5 36.1 68.8 86.1 86.5 36.1 74.8 88.3 93.5 82.6 85.2 76.6 89.4 : 34.82003 74.5 74.5 69.8 77.9 75.4 92.8 73.8 b 71.6 77.9 81.6 p 76.6 55.5 80.4 b 66.8 71.3 70.1 80.6 69.7 b 83.4 b 41.3 b 72.0 85.1 87.9 40.4 74.3 87.7 93.7 83.0 84.3 78.4 89.5 : 37.22004 74.3 74.3 69.9 78.9 74.9 91.0 74.3 71.5 73.2 82.3 p 79.2 54.4 79.7 68.2 70.7 74.2 81.5 71.6 82.0 49.8 71.2 85.1 i 88.7 40.8 74.6 87.1 91.3 81.9 84.8 76.0 92.6 : 35.82005 74.7 74.7 70.1 78.4 75.9 91.3 73.8 70.4 b 77.6 82.6 p 79.7 55.4 80.1 69.2 71.1 74.7 83.9 66.6 81.9 50.5 71.4 84.6 88.9 40.8 75.2 88.0 91.0 81.0 86.4 77.4 92.8 : 37.82006 74.8 74.7 70.1 79.1 80.0 p 91.1 73.4 69.8 74.1 81.8 75.5 p 54.6 80.0 71.7 p 76.1 p 75.9 85.3 64.0 81.2 48.1 p 69.9 84.9 89.6 40.8 76.6 p 87.7 91.2 82.3 p 84.5 77.3 : : 38.9
Source: Eurostat - European Union Labour Force Survey
Notes: 1) Reference period: From 27 October 2006, this indicator is based on annual averages of quarterly data instead of one unique reference quarter in spring. This improves both the accuracy and reliability of the results thanks to a better coverage of all weeks of the year and an increased sample size. Annual averages are used from 2005 onwards for all countries. Spring data are used between 2000 and 2002 for DE, FR, LU, CY, MT and SE, and for 2003-2004 for DE and CY. The average of the two semi-annual surveys is used for LV and LT for 2000-2001 and from 2002 for HR. Before 2000, all results are based on the spring survey.2) Estimations are performed by Eurostat in case of outliers or missing information in the quarterly series.3) Educational attainment level: From 1998 data onwards ISCED 3c levels of duration shorter than 2 years do not fall any longer under the level ‘upper secondary’ but under ‘lower secondary’. This change implies revised results in DK (from 2001), ES, CY and IS compared to results published before December 2005. The definition could not be implemented on 1998-2005 data in EL, IE and AT where all ISCED 3c levels are still included.4) Changes in survey characteristics: Due to changes in the survey characteristics, data lack comparability with former years in IT (from 1993), DK and DE (from 1996), PT (from 1998), BE and UK (from 1999), PL (1999 – quarter 1 for that year), FI (from 2000), SE and BG (from 2001), LV and LT (from 2002), DK and HU (from 2003), AT (from 2004), DE (from 205) Students living abroad for one year or more and conscripts on compulsory military service are not covered by the EU Labour Force Survey, which may imply lower rates than those available at national level. This is especially relevant for the indicator 'youth education attainment level' in CY.6) The indicator covers non-nationals who have stayed or intend to stay in the country for one year or more. 7) FR data do not cover the overseas departments (DOM). TR (youth education attainment level): national data.8) In case of missing country data, the EU aggregates are provided using the closest available year result.
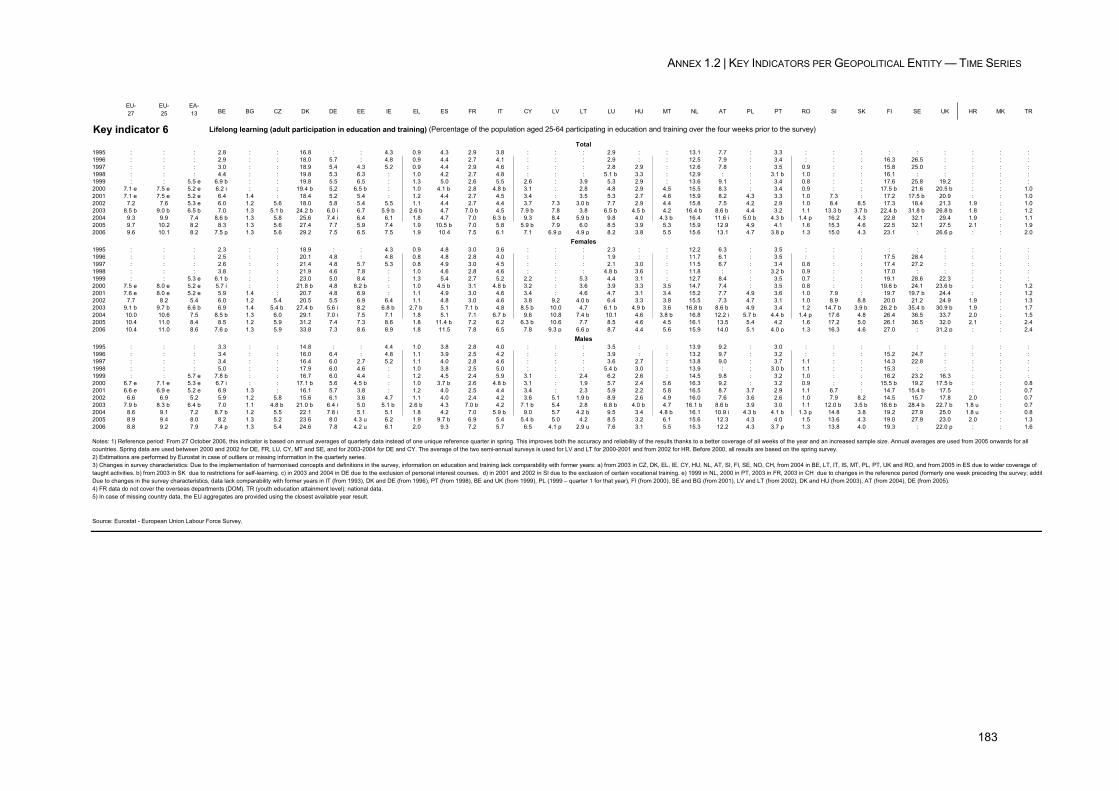
ANNEX 1.2 | KEY INDICATORS PER GEOPOLITICAL ENTITY — TIME SERIES
183
EU-27
EU-25
EA-13 BE BG CZ DK DE EE IE EL ES FR IT CY LV LT LU HU MT NL AT PL PT RO SI SK FI SE UK HR MK TR
Key indicator 6 Lifelong learning (adult participation in education and training) (Percentage of the population aged 25-64 participating in education and training over the four weeks prior to the survey)
Total1995 : : : 2.8 : : 16.8 : : 4.3 0.9 4.3 2.9 3.8 : : : 2.9 : : 13.1 7.7 : 3.3 : : : : : : : : :1996 : : : 2.9 : : 18.0 5.7 : 4.8 0.9 4.4 2.7 4.1 : : : 2.9 : : 12.5 7.9 : 3.4 : : : 16.3 26.5 : : : :1997 : : : 3.0 : : 18.9 5.4 4.3 5.2 0.9 4.4 2.9 4.6 : : : 2.8 2.9 : 12.6 7.8 : 3.5 0.9 : : 15.8 25.0 : : : :1998 : : : 4.4 : : 19.8 5.3 6.3 : 1.0 4.2 2.7 4.8 : : : 5.1 b 3.3 : 12.9 : : 3.1 b 1.0 : : 16.1 : : : : :1999 : : 5.5 e 6.9 b : : 19.8 5.5 6.5 : 1.3 5.0 2.6 5.5 2.6 : 3.9 5.3 2.9 : 13.6 9.1 : 3.4 0.8 : : 17.6 25.8 19.2 : : :2000 7.1 e 7.5 e 5.2 e 6.2 i : : 19.4 b 5.2 6.5 b : 1.0 4.1 b 2.8 4.8 b 3.1 : 2.8 4.8 2.9 4.5 15.5 8.3 : 3.4 0.9 : : 17.5 b 21.6 20.5 b : : 1.02001 7.1 e 7.5 e 5.2 e 6.4 1.4 : 18.4 5.2 5.4 : 1.2 4.4 2.7 4.5 3.4 : 3.5 5.3 2.7 4.6 15.9 8.2 4.3 3.3 1.0 7.3 : 17.2 17.5 b 20.9 : : 1.02002 7.2 7.6 5.3 e 6.0 1.2 5.6 18.0 5.8 5.4 5.5 1.1 4.4 2.7 4.4 3.7 7.3 3.0 b 7.7 2.9 4.4 15.8 7.5 4.2 2.9 1.0 8.4 8.5 17.3 18.4 21.3 1.9 : 1.02003 8.5 b 9.0 b 6.5 b 7.0 1.3 5.1 b 24.2 b 6.0 i 6.7 5.9 b 2.6 b 4.7 7.0 b 4.5 7.9 b 7.8 3.8 6.5 b 4.5 b 4.2 16.4 b 8.6 b 4.4 3.2 1.1 13.3 b 3.7 b 22.4 b 31.8 b 26.8 b 1.8 : 1.22004 9.3 9.9 7.4 8.6 b 1.3 5.8 25.6 7.4 i 6.4 6.1 1.8 4.7 7.0 6.3 b 9.3 8.4 5.9 b 9.8 4.0 4.3 b 16.4 11.6 i 5.0 b 4.3 b 1.4 p 16.2 4.3 22.8 32.1 29.4 1.9 : 1.12005 9.7 10.2 8.2 8.3 1.3 5.6 27.4 7.7 5.9 7.4 1.9 10.5 b 7.0 5.8 5.9 b 7.9 6.0 8.5 3.9 5.3 15.9 12.9 4.9 4.1 1.6 15.3 4.6 22.5 32.1 27.5 2.1 : 1.92006 9.6 10.1 8.2 7.5 p 1.3 5.6 29.2 7.5 6.5 7.5 1.9 10.4 7.5 6.1 7.1 6.9 p 4.9 p 8.2 3.8 5.5 15.6 13.1 4.7 3.8 p 1.3 15.0 4.3 23.1 : 26.6 p : : 2.0
Females1995 : : : 2.3 : : 18.9 : : 4.3 0.9 4.8 3.0 3.6 : : : 2.3 : : 12.2 6.3 : 3.5 : : : : : : : : :1996 : : : 2.5 : : 20.1 4.8 : 4.8 0.8 4.8 2.8 4.0 : : : 1.9 : : 11.7 6.1 : 3.5 : : : 17.5 28.4 : : : :1997 : : : 2.6 : : 21.4 4.8 5.7 5.3 0.8 4.9 3.0 4.5 : : : 2.1 3.0 : 11.5 6.7 : 3.4 0.8 : : 17.4 27.2 : : : :1998 : : : 3.8 : : 21.9 4.6 7.8 : 1.0 4.6 2.8 4.6 : : : 4.8 b 3.6 : 11.8 : : 3.2 b 0.9 : : 17.0 : : : : :1999 : : 5.3 e 6.1 b : : 23.0 5.0 8.4 : 1.3 5.4 2.7 5.2 2.2 : 5.3 4.4 3.1 : 12.7 8.4 : 3.5 0.7 : : 19.1 28.6 22.3 : : :2000 7.5 e 8.0 e 5.2 e 5.7 i : : 21.8 b 4.8 8.2 b : 1.0 4.5 b 3.1 4.8 b 3.2 : 3.6 3.9 3.3 3.5 14.7 7.4 : 3.5 0.8 : : 19.6 b 24.1 23.6 b : : 1.22001 7.6 e 8.0 e 5.2 e 5.9 1.4 : 20.7 4.8 6.9 : 1.1 4.9 3.0 4.6 3.4 : 4.6 4.7 3.1 3.4 15.2 7.7 4.9 3.6 1.0 7.9 : 19.7 19.7 b 24.4 : : 1.22002 7.7 8.2 5.4 6.0 1.2 5.4 20.5 5.5 6.9 6.4 1.1 4.8 3.0 4.6 3.8 9.2 4.0 b 6.4 3.3 3.8 15.5 7.3 4.7 3.1 1.0 8.9 8.8 20.0 21.2 24.9 1.9 : 1.32003 9.1 b 9.7 b 6.6 b 6.9 1.4 5.4 b 27.4 b 5.6 i 8.2 6.8 b 2.7 b 5.1 7.1 b 4.8 8.5 b 10.0 4.7 6.1 b 4.9 b 3.6 16.8 b 8.6 b 4.9 3.4 1.2 14.7 b 3.9 b 26.2 b 35.4 b 30.9 b 1.9 : 1.72004 10.0 10.6 7.5 8.5 b 1.3 6.0 29.1 7.0 i 7.5 7.1 1.8 5.1 7.1 6.7 b 9.6 10.8 7.4 b 10.1 4.6 3.8 b 16.8 12.2 i 5.7 b 4.4 b 1.4 p 17.6 4.8 26.4 36.5 33.7 2.0 : 1.52005 10.4 11.0 8.4 8.5 1.2 5.9 31.2 7.4 7.3 8.6 1.8 11.4 b 7.2 6.2 6.3 b 10.6 7.7 8.5 4.6 4.5 16.1 13.5 5.4 4.2 1.6 17.2 5.0 26.1 36.5 32.0 2.1 : 2.42006 10.4 11.0 8.6 7.6 p 1.3 5.9 33.8 7.3 8.6 8.9 1.8 11.5 7.8 6.5 7.8 9.3 p 6.6 p 8.7 4.4 5.6 15.9 14.0 5.1 4.0 p 1.3 16.3 4.6 27.0 : 31.2 p : : 2.4
Males1995 : : : 3.3 : : 14.8 : : 4.4 1.0 3.8 2.8 4.0 : : : 3.5 : : 13.9 9.2 : 3.0 : : : : : : : : :1996 : : : 3.4 : : 16.0 6.4 : 4.8 1.1 3.9 2.5 4.2 : : : 3.9 : : 13.2 9.7 : 3.2 : : : 15.2 24.7 : : : :1997 : : : 3.4 : : 16.4 6.0 2.7 5.2 1.1 4.0 2.8 4.6 : : : 3.6 2.7 : 13.8 9.0 : 3.7 1.1 : : 14.3 22.8 : : : :1998 : : : 5.0 : : 17.9 6.0 4.6 : 1.0 3.8 2.5 5.0 : : : 5.4 b 3.0 : 13.9 : : 3.0 b 1.1 : : 15.3 : : : : :1999 : : 5.7 e 7.8 b : : 16.7 6.0 4.4 : 1.2 4.5 2.4 5.9 3.1 : 2.4 6.2 2.6 : 14.5 9.8 : 3.2 1.0 : : 16.2 23.2 16.3 : : :2000 6.7 e 7.1 e 5.3 e 6.7 i : : 17.1 b 5.6 4.5 b : 1.0 3.7 b 2.6 4.8 b 3.1 : 1.9 5.7 2.4 5.6 16.3 9.2 : 3.2 0.9 : : 15.5 b 19.2 17.5 b : : 0.82001 6.6 e 6.9 e 5.2 e 6.9 1.3 : 16.1 5.7 3.8 : 1.2 4.0 2.5 4.4 3.4 : 2.3 5.9 2.2 5.8 16.5 8.7 3.7 2.9 1.1 6.7 : 14.7 15.4 b 17.5 : : 0.72002 6.6 6.9 5.2 5.9 1.2 5.8 15.6 6.1 3.6 4.7 1.1 4.0 2.4 4.2 3.6 5.1 1.9 b 8.9 2.6 4.9 16.0 7.6 3.6 2.6 1.0 7.9 8.2 14.5 15.7 17.8 2.0 : 0.72003 7.9 b 8.3 b 6.4 b 7.0 1.1 4.8 b 21.0 b 6.4 i 5.0 5.1 b 2.6 b 4.3 7.0 b 4.2 7.1 b 5.4 2.8 6.8 b 4.0 b 4.7 16.1 b 8.6 b 3.9 3.0 1.1 12.0 b 3.5 b 18.6 b 28.4 b 22.7 b 1.8 u : 0.72004 8.6 9.1 7.2 8.7 b 1.2 5.5 22.1 7.8 i 5.1 5.1 1.8 4.2 7.0 5.9 b 9.0 5.7 4.2 b 9.5 3.4 4.8 b 16.1 10.9 i 4.3 b 4.1 b 1.3 p 14.8 3.8 19.2 27.9 25.0 1.8 u : 0.82005 8.9 9.4 8.0 8.2 1.3 5.2 23.6 8.0 4.3 u 6.2 1.9 9.7 b 6.9 5.4 5.4 b 5.0 4.2 8.5 3.2 6.1 15.6 12.3 4.3 4.0 1.5 13.6 4.3 19.0 27.9 23.0 2.0 : 1.32006 8.8 9.2 7.9 7.4 p 1.3 5.4 24.6 7.8 4.2 u 6.1 2.0 9.3 7.2 5.7 6.5 4.1 p 2.9 u 7.6 3.1 5.5 15.3 12.2 4.3 3.7 p 1.3 13.8 4.0 19.3 : 22.0 p : : 1.6
Source: Eurostat - European Union Labour Force Survey.
Notes: 1) Reference period: From 27 October 2006, this indicator is based on annual averages of quarterly data instead of one unique reference quarter in spring. This improves both the accuracy and reliability of the results thanks to a better coverage of all weeks of the year and an increased sample size. Annual averages are used from 2005 onwards for all countries. Spring data are used between 2000 and 2002 for DE, FR, LU, CY, MT and SE, and for 2003-2004 for DE and CY. The average of the two semi-annual surveys is used for LV and LT for 2000-2001 and from 2002 for HR. Before 2000, all results are based on the spring survey.2) Estimations are performed by Eurostat in case of outliers or missing information in the quarterly series.3) Changes in survey characteristics: Due to the implementation of harmonised concepts and definitions in the survey, information on education and training lack comparability with former years: a) from 2003 in CZ, DK, EL, IE, CY, HU, NL, AT, SI, FI, SE, NO, CH, from 2004 in BE, LT, IT, IS, MT, PL, PT, UK and RO, and from 2005 in ES due to wider coverage of taught activities. b) from 2003 in SK due to restrictions for self-learning. c) in 2003 and 2004 in DE due to the exclusion of personal interest courses. d) in 2001 and 2002 in SI due to the exclusion of certain vocational training. e) 1999 in NL, 2000 in PT, 2003 in FR, 2003 in CH due to changes in the reference period (formerly one week preceding the survey; additDue to changes in the survey characteristics, data lack comparability with former years in IT (from 1993), DK and DE (from 1996), PT (from 1998), BE and UK (from 1999), PL (1999 – quarter 1 for that year), FI (from 2000), SE and BG (from 2001), LV and LT (from 2002), DK and HU (from 2003), AT (from 2004), DE (from 2005).4) FR data do not cover the overseas departments (DOM). TR (youth education attainment level): national data.5) In case of missing country data, the EU aggregates are provided using the closest available year result.
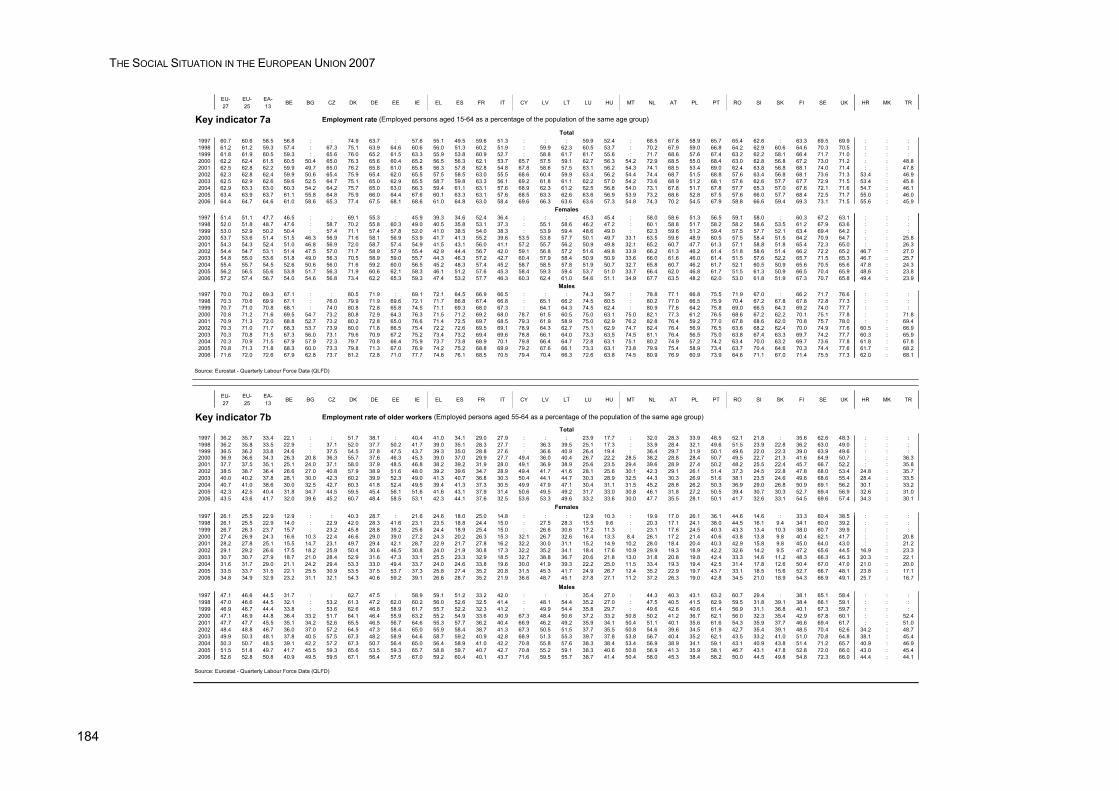
THE SOCIAL SITUATION IN THE EUROPEAN UNION 2007
184
EU-27
EU-25
EA-13
BE BG CZ DK DE EE IE EL ES FR IT CY LV LT LU HU MT NL AT PL PT RO SI SK FI SE UK HR MK TR
Key indicator 7a Employment rate (Employed persons aged 15-64 as a percentage of the population of the same age group)
Total1997 60.7 60.6 58.5 56.8 : : 74.9 63.7 : 57.6 55.1 49.5 59.6 51.3 : : : 59.9 52.4 : 68.5 67.8 58.9 65.7 65.4 62.6 : 63.3 69.5 69.9 : : :1998 61.2 61.2 59.3 57.4 : 67.3 75.1 63.9 64.6 60.6 56.0 51.3 60.2 51.9 : 59.9 62.3 60.5 53.7 : 70.2 67.9 59.0 66.8 64.2 62.9 60.6 64.6 70.3 70.5 : : :1999 61.8 61.9 60.5 59.3 : 65.6 76.0 65.2 61.5 63.3 55.9 53.8 60.9 52.7 : 58.8 61.7 61.7 55.6 : 71.7 68.6 57.6 67.4 63.2 62.2 58.1 66.4 71.7 71.0 : : :2000 62.2 62.4 61.5 60.5 50.4 65.0 76.3 65.6 60.4 65.2 56.5 56.3 62.1 53.7 65.7 57.5 59.1 62.7 56.3 54.2 72.9 68.5 55.0 68.4 63.0 62.8 56.8 67.2 73.0 71.2 : : 48.82001 62.5 62.8 62.2 59.9 49.7 65.0 76.2 65.8 61.0 65.8 56.3 57.8 62.8 54.8 67.8 58.6 57.5 63.1 56.2 54.3 74.1 68.5 53.4 69.0 62.4 63.8 56.8 68.1 74.0 71.4 : : 47.82002 62.3 62.8 62.4 59.9 50.6 65.4 75.9 65.4 62.0 65.5 57.5 58.5 63.0 55.5 68.6 60.4 59.9 63.4 56.2 54.4 74.4 68.7 51.5 68.8 57.6 63.4 56.8 68.1 73.6 71.3 53.4 : 46.92003 62.5 62.9 62.6 59.6 52.5 64.7 75.1 65.0 62.9 65.5 58.7 59.8 63.3 56.1 69.2 61.8 61.1 62.2 57.0 54.2 73.6 68.9 51.2 68.1 57.6 62.6 57.7 67.7 72.9 71.5 53.4 : 45.82004 62.9 63.3 63.0 60.3 54.2 64.2 75.7 65.0 63.0 66.3 59.4 61.1 63.1 57.6 68.9 62.3 61.2 62.5 56.8 54.0 73.1 67.8 51.7 67.8 57.7 65.3 57.0 67.6 72.1 71.6 54.7 : 46.12005 63.4 63.9 63.7 61.1 55.8 64.8 75.9 66.0 64.4 67.6 60.1 63.3 63.1 57.6 68.5 63.3 62.6 63.6 56.9 53.9 73.2 68.6 52.8 67.5 57.6 66.0 57.7 68.4 72.5 71.7 55.0 : 46.02006 64.4 64.7 64.6 61.0 58.6 65.3 77.4 67.5 68.1 68.6 61.0 64.8 63.0 58.4 69.6 66.3 63.6 63.6 57.3 54.8 74.3 70.2 54.5 67.9 58.8 66.6 59.4 69.3 73.1 71.5 55.6 : 45.9
Females1997 51.4 51.1 47.7 46.5 : : 69.1 55.3 : 45.9 39.3 34.6 52.4 36.4 : : : 45.3 45.4 : 58.0 58.6 51.3 56.5 59.1 58.0 : 60.3 67.2 63.1 : : :1998 52.0 51.8 48.7 47.6 : 58.7 70.2 55.8 60.3 49.0 40.5 35.8 53.1 37.3 : 55.1 58.6 46.2 47.2 : 60.1 58.8 51.7 58.2 58.2 58.6 53.5 61.2 67.9 63.6 : : :1999 53.0 52.9 50.2 50.4 : 57.4 71.1 57.4 57.8 52.0 41.0 38.5 54.0 38.3 : 53.9 59.4 48.6 49.0 : 62.3 59.6 51.2 59.4 57.5 57.7 52.1 63.4 69.4 64.2 : : :2000 53.7 53.6 51.4 51.5 46.3 56.9 71.6 58.1 56.9 53.9 41.7 41.3 55.2 39.6 53.5 53.8 57.7 50.1 49.7 33.1 63.5 59.6 48.9 60.5 57.5 58.4 51.5 64.2 70.9 64.7 : : 25.82001 54.3 54.3 52.4 51.0 46.8 56.9 72.0 58.7 57.4 54.9 41.5 43.1 56.0 41.1 57.2 55.7 56.2 50.9 49.8 32.1 65.2 60.7 47.7 61.3 57.1 58.8 51.8 65.4 72.3 65.0 : : 26.32002 54.4 54.7 53.1 51.4 47.5 57.0 71.7 58.9 57.9 55.4 42.9 44.4 56.7 42.0 59.1 56.8 57.2 51.6 49.8 33.9 66.2 61.3 46.2 61.4 51.8 58.6 51.4 66.2 72.2 65.2 46.7 : 27.02003 54.8 55.0 53.6 51.8 49.0 56.3 70.5 58.9 59.0 55.7 44.3 46.3 57.2 42.7 60.4 57.9 58.4 50.9 50.9 33.6 66.0 61.6 46.0 61.4 51.5 57.6 52.2 65.7 71.5 65.3 46.7 : 25.72004 55.4 55.7 54.5 52.6 50.6 56.0 71.6 59.2 60.0 56.5 45.2 48.3 57.4 45.2 58.7 58.5 57.8 51.9 50.7 32.7 65.8 60.7 46.2 61.7 52.1 60.5 50.9 65.6 70.5 65.6 47.8 : 24.32005 56.2 56.5 55.6 53.8 51.7 56.3 71.9 60.6 62.1 58.3 46.1 51.2 57.6 45.3 58.4 59.3 59.4 53.7 51.0 33.7 66.4 62.0 46.8 61.7 51.5 61.3 50.9 66.5 70.4 65.9 48.6 : 23.82006 57.2 57.4 56.7 54.0 54.6 56.8 73.4 62.2 65.3 59.3 47.4 53.2 57.7 46.3 60.3 62.4 61.0 54.6 51.1 34.9 67.7 63.5 48.2 62.0 53.0 61.8 51.9 67.3 70.7 65.8 49.4 : 23.9
Males1997 70.0 70.2 69.3 67.1 : : 80.5 71.9 : 69.1 72.1 64.5 66.9 66.5 : : : 74.3 59.7 : 78.8 77.1 66.8 75.5 71.9 67.0 : 66.2 71.7 76.6 : : :1998 70.3 70.6 69.9 67.1 : 76.0 79.9 71.9 69.6 72.1 71.7 66.8 67.4 66.8 : 65.1 66.2 74.5 60.5 : 80.2 77.0 66.5 75.9 70.4 67.2 67.8 67.8 72.8 77.3 : : :1999 70.7 71.0 70.8 68.1 : 74.0 80.8 72.8 65.8 74.5 71.1 69.3 68.0 67.3 : 64.1 64.3 74.5 62.4 : 80.9 77.6 64.2 75.8 69.0 66.5 64.3 69.2 74.0 77.7 : : :2000 70.8 71.2 71.6 69.5 54.7 73.2 80.8 72.9 64.3 76.3 71.5 71.2 69.2 68.0 78.7 61.5 60.5 75.0 63.1 75.0 82.1 77.3 61.2 76.5 68.6 67.2 62.2 70.1 75.1 77.8 : : 71.82001 70.9 71.3 72.0 68.8 52.7 73.2 80.2 72.8 65.0 76.6 71.4 72.5 69.7 68.5 79.3 61.9 58.9 75.0 62.9 76.2 82.8 76.4 59.2 77.0 67.8 68.6 62.0 70.8 75.7 78.0 : : 69.42002 70.3 71.0 71.7 68.3 53.7 73.9 80.0 71.8 66.5 75.4 72.2 72.6 69.5 69.1 78.9 64.3 62.7 75.1 62.9 74.7 82.4 76.4 56.9 76.5 63.6 68.2 62.4 70.0 74.9 77.6 60.5 : 66.92003 70.3 70.8 71.5 67.3 56.0 73.1 79.6 70.9 67.2 75.2 73.4 73.2 69.4 69.6 78.8 66.1 64.0 73.3 63.5 74.5 81.1 76.4 56.5 75.0 63.8 67.4 63.3 69.7 74.2 77.7 60.3 : 65.92004 70.3 70.9 71.5 67.9 57.9 72.3 79.7 70.8 66.4 75.9 73.7 73.8 68.9 70.1 79.8 66.4 64.7 72.8 63.1 75.1 80.2 74.9 57.2 74.2 63.4 70.0 63.2 69.7 73.6 77.8 61.8 : 67.82005 70.8 71.3 71.8 68.3 60.0 73.3 79.8 71.3 67.0 76.9 74.2 75.2 68.8 69.9 79.2 67.6 66.1 73.3 63.1 73.8 79.9 75.4 58.9 73.4 63.7 70.4 64.6 70.3 74.4 77.6 61.7 : 68.22006 71.6 72.0 72.6 67.9 62.8 73.7 81.2 72.8 71.0 77.7 74.6 76.1 68.5 70.5 79.4 70.4 66.3 72.6 63.8 74.5 80.9 76.9 60.9 73.9 64.6 71.1 67.0 71.4 75.5 77.3 62.0 : 68.1
Source: Eurostat - Quarterly Labour Force Data (QLFD)
EU-27
EU-25
EA-13
BE BG CZ DK DE EE IE EL ES FR IT CY LV LT LU HU MT NL AT PL PT RO SI SK FI SE UK HR MK TR
Key indicator 7b Employment rate of older workers (Employed persons aged 55-64 as a percentage of the population of the same age group)
Total1997 36.2 35.7 33.4 22.1 : : 51.7 38.1 : 40.4 41.0 34.1 29.0 27.9 : : : 23.9 17.7 : 32.0 28.3 33.9 48.5 52.1 21.8 : 35.6 62.6 48.3 : : :1998 36.2 35.8 33.5 22.9 : 37.1 52.0 37.7 50.2 41.7 39.0 35.1 28.3 27.7 : 36.3 39.5 25.1 17.3 : 33.9 28.4 32.1 49.6 51.5 23.9 22.8 36.2 63.0 49.0 : : :1999 36.5 36.2 33.8 24.6 : 37.5 54.5 37.8 47.5 43.7 39.3 35.0 28.8 27.6 : 36.6 40.9 26.4 19.4 : 36.4 29.7 31.9 50.1 49.6 22.0 22.3 39.0 63.9 49.6 : : :2000 36.9 36.6 34.3 26.3 20.8 36.3 55.7 37.6 46.3 45.3 39.0 37.0 29.9 27.7 49.4 36.0 40.4 26.7 22.2 28.5 38.2 28.8 28.4 50.7 49.5 22.7 21.3 41.6 64.9 50.7 : : 36.32001 37.7 37.5 35.1 25.1 24.0 37.1 58.0 37.9 48.5 46.8 38.2 39.2 31.9 28.0 49.1 36.9 38.9 25.6 23.5 29.4 39.6 28.9 27.4 50.2 48.2 25.5 22.4 45.7 66.7 52.2 : : 35.82002 38.5 38.7 36.4 26.6 27.0 40.8 57.9 38.9 51.6 48.0 39.2 39.6 34.7 28.9 49.4 41.7 41.6 28.1 25.6 30.1 42.3 29.1 26.1 51.4 37.3 24.5 22.8 47.8 68.0 53.4 24.8 : 35.72003 40.0 40.2 37.8 28.1 30.0 42.3 60.2 39.9 52.3 49.0 41.3 40.7 36.8 30.3 50.4 44.1 44.7 30.3 28.9 32.5 44.3 30.3 26.9 51.6 38.1 23.5 24.6 49.6 68.6 55.4 28.4 : 33.52004 40.7 41.0 38.6 30.0 32.5 42.7 60.3 41.8 52.4 49.5 39.4 41.3 37.3 30.5 49.9 47.9 47.1 30.4 31.1 31.5 45.2 28.8 26.2 50.3 36.9 29.0 26.8 50.9 69.1 56.2 30.1 : 33.22005 42.3 42.5 40.4 31.8 34.7 44.5 59.5 45.4 56.1 51.6 41.6 43.1 37.9 31.4 50.6 49.5 49.2 31.7 33.0 30.8 46.1 31.8 27.2 50.5 39.4 30.7 30.3 52.7 69.4 56.9 32.6 : 31.02006 43.5 43.6 41.7 32.0 39.6 45.2 60.7 48.4 58.5 53.1 42.3 44.1 37.6 32.5 53.6 53.3 49.6 33.2 33.6 30.0 47.7 35.5 28.1 50.1 41.7 32.6 33.1 54.5 69.6 57.4 34.3 : 30.1
Females1997 26.1 25.5 22.9 12.9 : : 40.3 28.7 : 21.6 24.6 18.0 25.0 14.8 : : : 12.9 10.3 : 19.9 17.0 26.1 36.1 44.6 14.6 : 33.3 60.4 38.5 : : :1998 26.1 25.5 22.9 14.0 : 22.9 42.0 28.3 41.6 23.1 23.5 18.8 24.4 15.0 : 27.5 28.3 15.5 9.6 : 20.3 17.1 24.1 38.0 44.5 16.1 9.4 34.1 60.0 39.2 : : :1999 26.7 26.3 23.7 15.7 : 23.2 45.8 28.8 39.2 25.6 24.4 18.9 25.4 15.0 : 26.6 30.6 17.2 11.3 : 23.1 17.6 24.5 40.3 43.3 13.4 10.3 38.0 60.7 39.9 : : :2000 27.4 26.9 24.3 16.6 10.3 22.4 46.6 29.0 39.0 27.2 24.3 20.2 26.3 15.3 32.1 26.7 32.6 16.4 13.3 8.4 26.1 17.2 21.4 40.6 43.8 13.8 9.8 40.4 62.1 41.7 : : 20.82001 28.2 27.8 25.1 15.5 14.7 23.1 49.7 29.4 42.1 28.7 22.9 21.7 27.8 16.2 32.2 30.0 31.1 15.2 14.9 10.2 28.0 18.4 20.4 40.3 42.9 15.8 9.8 45.0 64.0 43.0 : : 21.22002 29.1 29.2 26.6 17.5 18.2 25.9 50.4 30.6 46.5 30.8 24.0 21.9 30.8 17.3 32.2 35.2 34.1 18.4 17.6 10.9 29.9 19.3 18.9 42.2 32.6 14.2 9.5 47.2 65.6 44.5 16.9 : 23.32003 30.7 30.7 27.9 18.7 21.0 28.4 52.9 31.6 47.3 33.1 25.5 23.3 32.9 18.5 32.7 38.8 36.7 20.6 21.8 13.0 31.8 20.8 19.8 42.4 33.3 14.6 11.2 48.3 66.3 46.3 20.3 : 22.12004 31.6 31.7 29.0 21.1 24.2 29.4 53.3 33.0 49.4 33.7 24.0 24.6 33.8 19.6 30.0 41.9 39.3 22.2 25.0 11.5 33.4 19.3 19.4 42.5 31.4 17.8 12.6 50.4 67.0 47.0 21.0 : 20.02005 33.5 33.7 31.5 22.1 25.5 30.9 53.5 37.5 53.7 37.3 25.8 27.4 35.2 20.8 31.5 45.3 41.7 24.9 26.7 12.4 35.2 22.9 19.7 43.7 33.1 18.5 15.6 52.7 66.7 48.1 23.8 : 17.12006 34.8 34.9 32.9 23.2 31.1 32.1 54.3 40.6 59.2 39.1 26.6 28.7 35.2 21.9 36.6 48.7 45.1 27.8 27.1 11.2 37.2 26.3 19.0 42.8 34.5 21.0 18.9 54.3 66.9 49.1 25.7 : 16.7
Males1997 47.1 46.6 44.5 31.7 : : 62.7 47.5 : 58.9 59.1 51.2 33.2 42.0 : : : 35.4 27.0 : 44.3 40.3 43.1 63.2 60.7 29.4 : 38.1 65.1 58.4 : : :1998 47.0 46.6 44.5 32.1 : 53.2 61.3 47.2 62.0 60.2 56.0 52.6 32.5 41.4 : 48.1 54.4 35.2 27.0 : 47.5 40.5 41.5 62.9 59.5 31.8 39.1 38.4 66.1 59.1 : : :1999 46.9 46.7 44.4 33.8 : 53.6 62.6 46.8 58.9 61.7 55.7 52.2 32.3 41.2 : 49.9 54.4 35.8 29.7 : 49.6 42.6 40.6 61.4 56.9 31.1 36.8 40.1 67.3 59.7 : : :2000 47.1 46.9 44.8 36.4 33.2 51.7 64.1 46.4 55.9 63.2 55.2 54.9 33.6 40.9 67.3 48.4 50.6 37.2 33.2 50.8 50.2 41.2 36.7 62.1 56.0 32.3 35.4 42.9 67.8 60.1 : : 52.42001 47.7 47.7 45.5 35.1 34.2 52.6 65.5 46.5 56.7 64.6 55.3 57.7 36.2 40.4 66.9 46.2 49.2 35.9 34.1 50.4 51.1 40.1 35.6 61.6 54.3 35.9 37.7 46.6 69.4 61.7 : : 51.02002 48.4 48.8 46.7 36.0 37.0 57.2 64.5 47.3 58.4 65.0 55.9 58.4 38.7 41.3 67.3 50.5 51.5 37.7 35.5 50.8 54.6 39.6 34.5 61.9 42.7 35.4 39.1 48.5 70.4 62.6 34.2 : 48.72003 49.9 50.3 48.1 37.8 40.5 57.5 67.3 48.2 58.9 64.6 58.7 59.2 40.9 42.8 68.9 51.3 55.3 39.7 37.8 53.8 56.7 40.4 35.2 62.1 43.5 33.2 41.0 51.0 70.8 64.8 38.1 : 45.42004 50.3 50.7 48.5 39.1 42.2 57.2 67.3 50.7 56.4 65.0 56.4 58.9 41.0 42.2 70.8 55.8 57.6 38.3 38.4 53.4 56.9 38.9 34.1 59.1 43.1 40.9 43.8 51.4 71.2 65.7 40.9 : 46.92005 51.5 51.8 49.7 41.7 45.5 59.3 65.6 53.5 59.3 65.7 58.8 59.7 40.7 42.7 70.8 55.2 59.1 38.3 40.6 50.8 56.9 41.3 35.9 58.1 46.7 43.1 47.8 52.8 72.0 66.0 43.0 : 45.42006 52.6 52.8 50.8 40.9 49.5 59.5 67.1 56.4 57.5 67.0 59.2 60.4 40.1 43.7 71.6 59.5 55.7 38.7 41.4 50.4 58.0 45.3 38.4 58.2 50.0 44.5 49.8 54.8 72.3 66.0 44.4 : 44.1
Source: Eurostat - Quarterly Labour Force Data (QLFD)
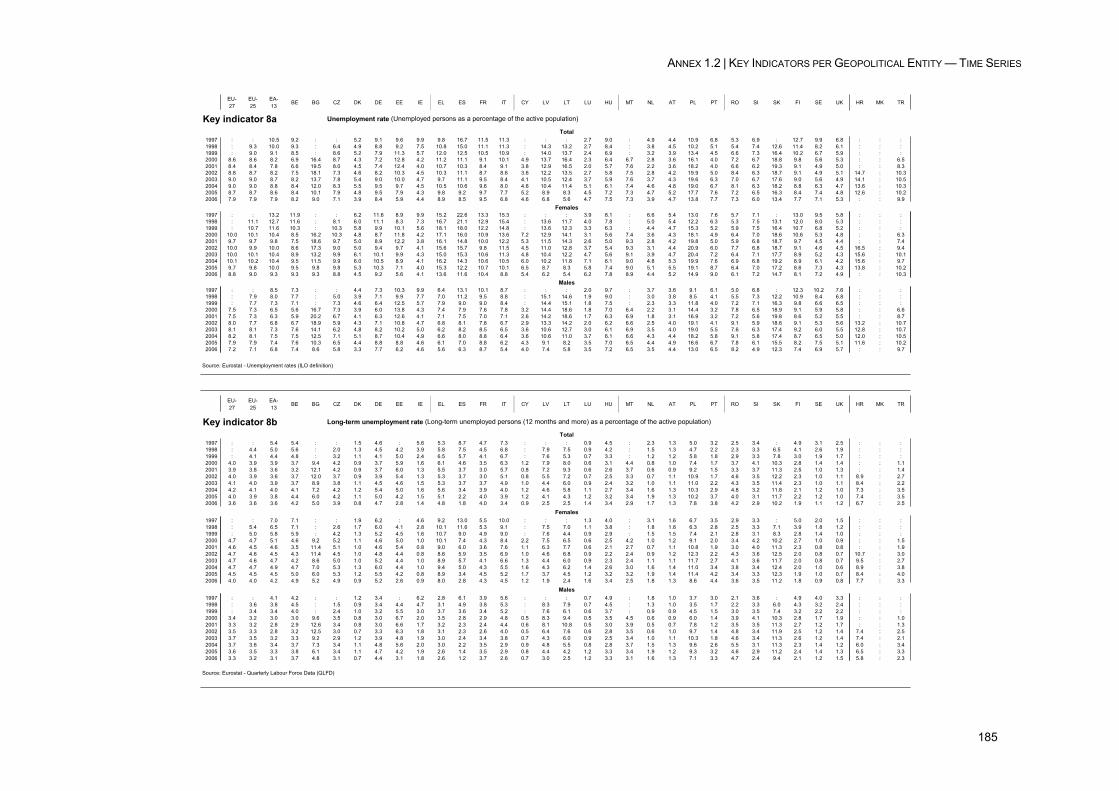
ANNEX 1.2 | KEY INDICATORS PER GEOPOLITICAL ENTITY — TIME SERIES
185
EU-27
EU-25
EA-13
BE BG CZ DK DE EE IE EL ES FR IT CY LV LT LU HU MT NL AT PL PT RO SI SK FI SE UK HR MK TR
Key indicator 8a Unemployment rate (Unemployed persons as a percentage of the active population)
Total1997 : : 10.5 9.2 : : 5.2 9.1 9.6 9.9 9.8 16.7 11.5 11.3 : : : 2.7 9.0 : 4.9 4.4 10.9 6.8 5.3 6.9 : 12.7 9.9 6.8 : : :1998 : 9.3 10.0 9.3 : 6.4 4.9 8.8 9.2 7.5 10.8 15.0 11.1 11.3 : 14.3 13.2 2.7 8.4 : 3.8 4.5 10.2 5.1 5.4 7.4 12.6 11.4 8.2 6.1 : : :1999 : 9.0 9.1 8.5 : 8.6 5.2 7.9 11.3 5.7 12.0 12.5 10.5 10.9 : 14.0 13.7 2.4 6.9 : 3.2 3.9 13.4 4.5 6.6 7.3 16.4 10.2 6.7 5.9 : : :2000 8.6 8.6 8.2 6.9 16.4 8.7 4.3 7.2 12.8 4.2 11.2 11.1 9.1 10.1 4.9 13.7 16.4 2.3 6.4 6.7 2.8 3.6 16.1 4.0 7.2 6.7 18.8 9.8 5.6 5.3 : : 6.52001 8.4 8.4 7.8 6.6 19.5 8.0 4.5 7.4 12.4 4.0 10.7 10.3 8.4 9.1 3.8 12.9 16.5 2.0 5.7 7.6 2.2 3.6 18.2 4.0 6.6 6.2 19.3 9.1 4.9 5.0 : : 8.32002 8.8 8.7 8.2 7.5 18.1 7.3 4.6 8.2 10.3 4.5 10.3 11.1 8.7 8.6 3.6 12.2 13.5 2.7 5.8 7.5 2.8 4.2 19.9 5.0 8.4 6.3 18.7 9.1 4.9 5.1 14.7 : 10.32003 9.0 9.0 8.7 8.2 13.7 7.8 5.4 9.0 10.0 4.7 9.7 11.1 9.5 8.4 4.1 10.5 12.4 3.7 5.9 7.6 3.7 4.3 19.6 6.3 7.0 6.7 17.6 9.0 5.6 4.9 14.1 : 10.52004 9.0 9.0 8.8 8.4 12.0 8.3 5.5 9.5 9.7 4.5 10.5 10.6 9.6 8.0 4.6 10.4 11.4 5.1 6.1 7.4 4.6 4.8 19.0 6.7 8.1 6.3 18.2 8.8 6.3 4.7 13.6 : 10.32005 8.7 8.7 8.6 8.4 10.1 7.9 4.8 9.5 7.9 4.3 9.8 9.2 9.7 7.7 5.2 8.9 8.3 4.5 7.2 7.3 4.7 5.2 17.7 7.6 7.2 6.5 16.3 8.4 7.4 4.8 12.6 : 10.22006 7.9 7.9 7.9 8.2 9.0 7.1 3.9 8.4 5.9 4.4 8.9 8.5 9.5 6.8 4.6 6.8 5.6 4.7 7.5 7.3 3.9 4.7 13.8 7.7 7.3 6.0 13.4 7.7 7.1 5.3 : : 9.9
Females1997 : : 13.2 11.9 : : 6.2 11.6 8.9 9.9 15.2 22.6 13.3 15.3 : : : 3.9 8.1 : 6.6 5.4 13.0 7.6 5.7 7.1 : 13.0 9.5 5.8 : : :1998 : 11.1 12.7 11.6 : 8.1 6.0 11.1 8.3 7.3 16.7 21.1 12.9 15.4 : 13.6 11.7 4.0 7.8 : 5.0 5.4 12.2 6.3 5.3 7.5 13.1 12.0 8.0 5.3 : : :1999 : 10.7 11.6 10.3 : 10.3 5.8 9.9 10.1 5.6 18.1 18.0 12.2 14.8 : 13.6 12.3 3.3 6.3 : 4.4 4.7 15.3 5.2 5.9 7.5 16.4 10.7 6.8 5.2 : : :2000 10.0 10.1 10.4 8.5 16.2 10.3 4.8 8.7 11.8 4.2 17.1 16.0 10.9 13.6 7.2 12.9 14.1 3.1 5.6 7.4 3.6 4.3 18.1 4.9 6.4 7.0 18.6 10.6 5.3 4.8 : : 6.32001 9.7 9.7 9.8 7.5 18.6 9.7 5.0 8.9 12.2 3.8 16.1 14.8 10.0 12.2 5.3 11.5 14.3 2.6 5.0 9.3 2.8 4.2 19.8 5.0 5.9 6.8 18.7 9.7 4.5 4.4 : : 7.42002 10.0 9.9 10.0 8.6 17.3 9.0 5.0 9.4 9.7 4.1 15.6 15.7 9.8 11.5 4.5 11.0 12.8 3.7 5.4 9.3 3.1 4.4 20.9 6.0 7.7 6.8 18.7 9.1 4.6 4.5 16.5 : 9.42003 10.0 10.1 10.4 8.9 13.2 9.9 6.1 10.1 9.9 4.3 15.0 15.3 10.6 11.3 4.8 10.4 12.2 4.7 5.6 9.1 3.9 4.7 20.4 7.2 6.4 7.1 17.7 8.9 5.2 4.3 15.6 : 10.12004 10.1 10.2 10.4 9.5 11.5 9.9 6.0 10.5 8.9 4.1 16.2 14.3 10.6 10.5 6.0 10.2 11.8 7.1 6.1 9.0 4.8 5.3 19.9 7.6 6.9 6.8 19.2 8.9 6.1 4.2 15.6 : 9.72005 9.7 9.8 10.0 9.5 9.8 9.8 5.3 10.3 7.1 4.0 15.3 12.2 10.7 10.1 6.5 8.7 8.3 5.8 7.4 9.0 5.1 5.5 19.1 8.7 6.4 7.0 17.2 8.6 7.3 4.3 13.8 : 10.22006 8.8 9.0 9.3 9.3 9.3 8.8 4.5 9.2 5.6 4.1 13.6 11.6 10.4 8.8 5.4 6.2 5.4 6.2 7.8 8.9 4.4 5.2 14.9 9.0 6.1 7.2 14.7 8.1 7.2 4.9 : : 10.3
Males1997 : : 8.5 7.3 : : 4.4 7.3 10.3 9.9 6.4 13.1 10.1 8.7 : : : 2.0 9.7 : 3.7 3.6 9.1 6.1 5.0 6.8 : 12.3 10.2 7.6 : : :1998 : 7.9 8.0 7.7 : 5.0 3.9 7.1 9.9 7.7 7.0 11.2 9.5 8.8 : 15.1 14.6 1.9 9.0 : 3.0 3.8 8.5 4.1 5.5 7.3 12.2 10.9 8.4 6.8 : : :1999 : 7.7 7.3 7.1 : 7.3 4.6 6.4 12.5 5.7 7.9 9.0 9.0 8.4 : 14.4 15.1 1.8 7.5 : 2.3 3.3 11.8 4.0 7.2 7.1 16.3 9.8 6.6 6.5 : : :2000 7.5 7.3 6.5 5.6 16.7 7.3 3.9 6.0 13.8 4.3 7.4 7.9 7.6 7.8 3.2 14.4 18.6 1.8 7.0 6.4 2.2 3.1 14.4 3.2 7.8 6.5 18.9 9.1 5.9 5.8 : : 6.62001 7.5 7.3 6.3 5.9 20.2 6.7 4.1 6.3 12.6 4.1 7.1 7.5 7.0 7.1 2.6 14.2 18.6 1.7 6.3 6.9 1.8 3.1 16.9 3.2 7.2 5.6 19.8 8.6 5.2 5.5 : : 8.72002 8.0 7.7 6.8 6.7 18.9 5.9 4.3 7.1 10.8 4.7 6.8 8.1 7.8 6.7 2.9 13.3 14.2 2.0 6.2 6.6 2.5 4.0 19.1 4.1 9.1 5.9 18.6 9.1 5.3 5.6 13.2 : 10.72003 8.1 8.1 7.3 7.6 14.1 6.2 4.8 8.2 10.2 5.0 6.2 8.2 8.5 6.5 3.6 10.6 12.7 3.0 6.1 6.9 3.5 4.0 19.0 5.5 7.6 6.3 17.4 9.2 6.0 5.5 12.8 : 10.72004 8.2 8.1 7.5 7.5 12.5 7.1 5.1 8.7 10.4 4.9 6.6 8.0 8.8 6.4 3.6 10.6 11.0 3.7 6.1 6.6 4.3 4.4 18.2 5.8 9.1 5.8 17.4 8.7 6.5 5.0 12.0 : 10.52005 7.9 7.9 7.4 7.6 10.3 6.5 4.4 8.8 8.8 4.6 6.1 7.0 8.8 6.2 4.3 9.1 8.2 3.5 7.0 6.5 4.4 4.9 16.6 6.7 7.8 6.1 15.5 8.2 7.5 5.1 11.6 : 10.22006 7.2 7.1 6.8 7.4 8.6 5.8 3.3 7.7 6.2 4.6 5.6 6.3 8.7 5.4 4.0 7.4 5.8 3.5 7.2 6.5 3.5 4.4 13.0 6.5 8.2 4.9 12.3 7.4 6.9 5.7 : : 9.7
Source: Eurostat - Unemployment rates (ILO definition)
EU-27
EU-25
EA-13
BE BG CZ DK DE EE IE EL ES FR IT CY LV LT LU HU MT NL AT PL PT RO SI SK FI SE UK HR MK TR
Key indicator 8b Long-term unemployment rate (Long-term unemployed persons (12 months and more) as a percentage of the active population)
Total1997 : : 5.4 5.4 : : 1.5 4.6 : 5.6 5.3 8.7 4.7 7.3 : : : 0.9 4.5 : 2.3 1.3 5.0 3.2 2.5 3.4 : 4.9 3.1 2.5 : : :1998 : 4.4 5.0 5.6 : 2.0 1.3 4.5 4.2 3.9 5.8 7.5 4.5 6.8 : 7.9 7.5 0.9 4.2 : 1.5 1.3 4.7 2.2 2.3 3.3 6.5 4.1 2.6 1.9 : : :1999 : 4.1 4.4 4.8 : 3.2 1.1 4.1 5.0 2.4 6.5 5.7 4.1 6.7 : 7.6 5.3 0.7 3.3 : 1.2 1.2 5.8 1.8 2.9 3.3 7.8 3.0 1.9 1.7 : : :2000 4.0 3.9 3.9 3.7 9.4 4.2 0.9 3.7 5.9 1.6 6.1 4.6 3.5 6.3 1.2 7.9 8.0 0.6 3.1 4.4 0.8 1.0 7.4 1.7 3.7 4.1 10.3 2.8 1.4 1.4 : : 1.12001 3.9 3.8 3.6 3.2 12.1 4.2 0.9 3.7 6.0 1.3 5.5 3.7 3.0 5.7 0.8 7.2 9.3 0.6 2.6 3.7 0.6 0.9 9.2 1.5 3.3 3.7 11.3 2.5 1.0 1.3 : : 1.42002 4.0 3.9 3.6 3.7 12.0 3.7 0.9 3.9 5.4 1.3 5.3 3.7 3.0 5.1 0.8 5.5 7.2 0.7 2.5 3.3 0.7 1.1 10.9 1.7 4.6 3.5 12.2 2.3 1.0 1.1 8.9 : 2.72003 4.1 4.0 3.9 3.7 8.9 3.8 1.1 4.5 4.6 1.5 5.3 3.7 3.7 4.9 1.0 4.4 6.0 0.9 2.4 3.2 1.0 1.1 11.0 2.2 4.3 3.5 11.4 2.3 1.0 1.1 8.4 : 2.22004 4.2 4.1 4.0 4.1 7.2 4.2 1.2 5.4 5.0 1.6 5.6 3.4 3.9 4.0 1.2 4.6 5.8 1.1 2.7 3.4 1.6 1.3 10.3 2.9 4.8 3.2 11.8 2.1 1.2 1.0 7.3 : 3.52005 4.0 3.9 3.8 4.4 6.0 4.2 1.1 5.0 4.2 1.5 5.1 2.2 4.0 3.9 1.2 4.1 4.3 1.2 3.2 3.4 1.9 1.3 10.2 3.7 4.0 3.1 11.7 2.2 1.2 1.0 7.4 : 3.52006 3.6 3.6 3.6 4.2 5.0 3.9 0.8 4.7 2.8 1.4 4.8 1.8 4.0 3.4 0.9 2.5 2.5 1.4 3.4 2.9 1.7 1.3 7.8 3.8 4.2 2.9 10.2 1.9 1.1 1.2 6.7 : 2.5
Females1997 : : 7.0 7.1 : : 1.9 6.2 : 4.6 9.2 13.0 5.5 10.0 : : : 1.3 4.0 : 3.1 1.6 6.7 3.5 2.9 3.3 : 5.0 2.0 1.5 : : :1998 : 5.4 6.5 7.1 : 2.6 1.7 6.0 4.1 2.8 10.1 11.6 5.3 9.1 : 7.5 7.0 1.1 3.8 : 1.8 1.8 6.3 2.8 2.5 3.3 7.1 3.9 1.8 1.2 : : :1999 : 5.0 5.8 5.9 : 4.2 1.3 5.2 4.5 1.6 10.7 9.0 4.9 9.0 : 7.6 4.4 0.9 2.9 : 1.5 1.5 7.4 2.1 2.8 3.1 8.3 2.8 1.4 1.0 : : :2000 4.7 4.7 5.1 4.6 9.2 5.2 1.1 4.6 5.0 1.0 10.1 7.4 4.3 8.4 2.2 7.5 6.5 0.6 2.5 4.2 1.0 1.2 9.1 2.0 3.4 4.2 10.2 2.7 1.0 0.9 : : 1.52001 4.6 4.5 4.6 3.5 11.4 5.1 1.0 4.6 5.4 0.8 9.0 6.0 3.6 7.6 1.1 6.3 7.7 0.6 2.1 2.7 0.7 1.1 10.8 1.9 3.0 4.0 11.3 2.3 0.8 0.8 : : 1.92002 4.7 4.6 4.5 4.3 11.4 4.5 1.0 4.8 4.4 0.8 8.6 5.9 3.5 6.9 1.0 4.6 6.8 0.9 2.2 2.4 0.9 1.2 12.3 2.2 4.3 3.6 12.5 2.0 0.8 0.7 10.7 : 3.02003 4.7 4.6 4.7 4.2 8.6 5.0 1.0 5.2 4.4 1.0 8.9 5.7 4.1 6.6 1.3 4.4 6.0 0.9 2.3 2.4 1.1 1.1 11.7 2.7 4.1 3.6 11.7 2.0 0.8 0.7 9.5 : 2.72004 4.7 4.7 4.9 4.7 7.0 5.3 1.3 6.0 4.4 1.0 9.4 5.0 4.3 5.5 1.6 4.3 6.2 1.4 2.6 3.0 1.6 1.4 11.0 3.4 3.8 3.4 12.4 2.0 1.0 0.6 8.9 : 3.82005 4.5 4.5 4.5 5.0 6.0 5.3 1.2 5.5 4.2 0.8 8.9 3.4 4.5 5.2 1.7 3.7 4.5 1.2 3.2 3.2 1.9 1.4 11.4 4.2 3.4 3.3 12.3 1.9 1.0 0.7 8.4 : 4.02006 4.0 4.0 4.2 4.9 5.2 4.9 0.9 5.2 2.6 0.9 8.0 2.8 4.3 4.5 1.2 1.9 2.4 1.6 3.4 2.5 1.8 1.3 8.6 4.4 3.6 3.5 11.2 1.8 0.9 0.8 7.7 : 3.3
Males1997 : : 4.1 4.2 : : 1.2 3.4 : 6.2 2.8 6.1 3.9 5.6 : : : 0.7 4.9 : 1.8 1.0 3.7 3.0 2.1 3.6 : 4.9 4.0 3.3 : : :1998 : 3.6 3.8 4.5 : 1.5 0.9 3.4 4.4 4.7 3.1 4.9 3.8 5.3 : 8.3 7.9 0.7 4.5 : 1.3 1.0 3.5 1.7 2.2 3.3 6.0 4.3 3.2 2.4 : : :1999 : 3.4 3.4 4.0 : 2.4 1.0 3.2 5.5 3.0 3.7 3.6 3.4 5.2 : 7.6 6.1 0.6 3.7 : 0.9 0.9 4.5 1.5 3.0 3.5 7.4 3.2 2.2 2.2 : : :2000 3.4 3.2 3.0 3.0 9.6 3.5 0.8 3.0 6.7 2.0 3.5 2.8 2.9 4.8 0.5 8.3 9.4 0.5 3.5 4.5 0.6 0.9 6.0 1.4 3.9 4.1 10.3 2.8 1.7 1.9 : : 1.02001 3.3 3.2 2.8 2.9 12.6 3.4 0.8 3.0 6.6 1.7 3.2 2.3 2.4 4.4 0.6 8.1 10.8 0.5 3.0 3.9 0.5 0.7 7.8 1.2 3.5 3.5 11.3 2.7 1.2 1.7 : : 1.32002 3.5 3.3 2.8 3.2 12.5 3.0 0.7 3.3 6.3 1.8 3.1 2.3 2.6 4.0 0.5 6.4 7.6 0.6 2.8 3.5 0.6 1.0 9.7 1.4 4.8 3.4 11.9 2.5 1.2 1.4 7.4 : 2.52003 3.7 3.5 3.2 3.3 9.2 2.9 1.2 3.9 4.8 1.9 3.0 2.4 3.4 3.8 0.7 4.3 6.0 0.9 2.5 3.4 1.0 1.1 10.3 1.8 4.6 3.4 11.3 2.6 1.2 1.4 7.4 : 2.12004 3.7 3.6 3.4 3.7 7.3 3.4 1.1 4.8 5.6 2.0 3.0 2.2 3.5 2.9 0.9 4.8 5.5 0.8 2.8 3.7 1.5 1.3 9.6 2.6 5.5 3.1 11.3 2.3 1.4 1.2 6.0 : 3.42005 3.6 3.5 3.3 3.8 6.1 3.4 1.1 4.7 4.2 1.9 2.6 1.4 3.5 2.9 0.8 4.4 4.2 1.2 3.3 3.4 1.9 1.2 9.3 3.2 4.6 2.9 11.2 2.4 1.4 1.3 6.5 : 3.32006 3.3 3.2 3.1 3.7 4.8 3.1 0.7 4.4 3.1 1.8 2.6 1.2 3.7 2.6 0.7 3.0 2.5 1.2 3.3 3.1 1.6 1.3 7.1 3.3 4.7 2.4 9.4 2.1 1.2 1.5 5.8 : 2.3
Source: Eurostat - Quarterly Labour Force Data (QLFD)
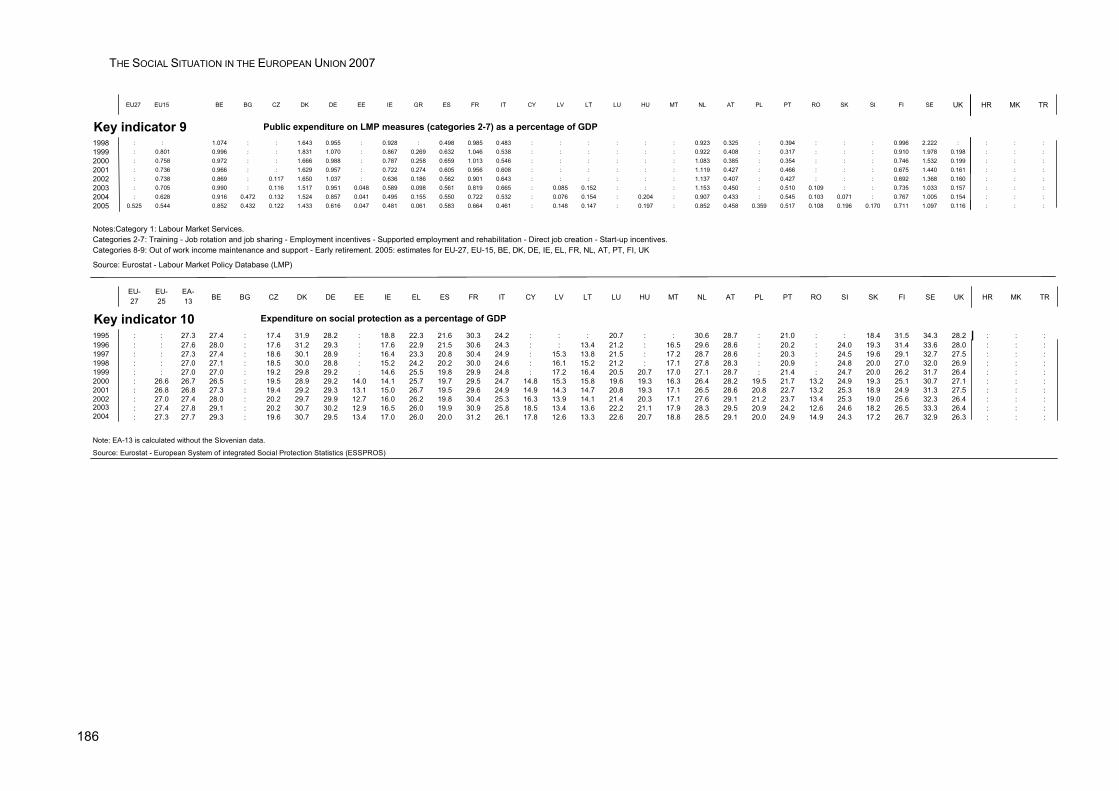
THE SOCIAL SITUATION IN THE EUROPEAN UNION 2007
186
EU27 EU15 BE BG CZ DK DE EE IE GR ES FR IT CY LV LT LU HU MT NL AT PL PT RO SK SI FI SE UK HR MK TR
Key indicator 9 Public expenditure on LMP measures (categories 2-7) as a percentage of GDP1998 : : 1.074 : : 1.643 0.955 : 0.928 : 0.498 0.985 0.483 : : : : : : 0.923 0.325 : 0.394 : : : 0.996 2.222 : : : :1999 : 0.801 0.996 : : 1.831 1.070 : 0.867 0.269 0.632 1.046 0.538 : : : : : : 0.922 0.408 : 0.317 : : : 0.910 1.978 0.198 : : :2000 : 0.758 0.972 : : 1.666 0.988 : 0.787 0.258 0.659 1.013 0.546 : : : : : : 1.083 0.385 : 0.354 : : : 0.746 1.532 0.199 : : :2001 : 0.736 0.966 : : 1.629 0.957 : 0.722 0.274 0.605 0.956 0.608 : : : : : : 1.119 0.427 : 0.466 : : : 0.675 1.440 0.161 : : :2002 : 0.738 0.869 : 0.117 1.650 1.037 : 0.636 0.186 0.562 0.901 0.643 : : : : : : 1.137 0.407 : 0.427 : : : 0.692 1.368 0.160 : : :2003 : 0.705 0.990 : 0.116 1.517 0.951 0.048 0.589 0.098 0.561 0.819 0.665 : 0.085 0.152 : : : 1.153 0.450 : 0.510 0.109 : : 0.735 1.033 0.157 : : :2004 : 0.628 0.916 0.472 0.132 1.524 0.857 0.041 0.495 0.155 0.550 0.722 0.532 : 0.076 0.154 : 0.204 : 0.907 0.433 : 0.545 0.103 0.071 : 0.767 1.005 0.154 : : :2005 0.525 0.544 0.852 0.432 0.122 1.433 0.616 0.047 0.481 0.061 0.583 0.664 0.461 : 0.148 0.147 : 0.197 : 0.852 0.458 0.359 0.517 0.108 0.196 0.170 0.711 1.097 0.116 : : :
Source: Eurostat - Labour Market Policy Database (LMP)
Notes:Category 1: Labour Market Services. Categories 2-7: Training - Job rotation and job sharing - Employment incentives - Supported employment and rehabilitation - Direct job creation - Start-up incentives. Categories 8-9: Out of work income maintenance and support - Early retirement. 2005: estimates for EU-27, EU-15, BE, DK, DE, IE, EL, FR, NL, AT, PT, FI, UK
EU-27
EU-25
EA-13 BE BG CZ DK DE EE IE EL ES FR IT CY LV LT LU HU MT NL AT PL PT RO SI SK FI SE UK HR MK TR
Key indicator 101995 : : 27.3 27.4 : 17.4 31.9 28.2 : 18.8 22.3 21.6 30.3 24.2 : : : 20.7 : : 30.6 28.7 : 21.0 : : 18.4 31.5 34.3 28.2 : : :1996 : : 27.6 28.0 : 17.6 31.2 29.3 : 17.6 22.9 21.5 30.6 24.3 : : 13.4 21.2 : 16.5 29.6 28.6 : 20.2 : 24.0 19.3 31.4 33.6 28.0 : : :1997 : : 27.3 27.4 : 18.6 30.1 28.9 : 16.4 23.3 20.8 30.4 24.9 : 15.3 13.8 21.5 : 17.2 28.7 28.6 : 20.3 : 24.5 19.6 29.1 32.7 27.5 : : :1998 : : 27.0 27.1 : 18.5 30.0 28.8 : 15.2 24.2 20.2 30.0 24.6 : 16.1 15.2 21.2 : 17.1 27.8 28.3 : 20.9 : 24.8 20.0 27.0 32.0 26.9 : : :1999 : : 27.0 27.0 : 19.2 29.8 29.2 : 14.6 25.5 19.8 29.9 24.8 : 17.2 16.4 20.5 20.7 17.0 27.1 28.7 : 21.4 : 24.7 20.0 26.2 31.7 26.4 : : :2000 : 26.6 26.7 26.5 : 19.5 28.9 29.2 14.0 14.1 25.7 19.7 29.5 24.7 14.8 15.3 15.8 19.6 19.3 16.3 26.4 28.2 19.5 21.7 13.2 24.9 19.3 25.1 30.7 27.1 : : :2001 : 26.8 26.8 27.3 : 19.4 29.2 29.3 13.1 15.0 26.7 19.5 29.6 24.9 14.9 14.3 14.7 20.8 19.3 17.1 26.5 28.6 20.8 22.7 13.2 25.3 18.9 24.9 31.3 27.5 : : :2002 : 27.0 27.4 28.0 : 20.2 29.7 29.9 12.7 16.0 26.2 19.8 30.4 25.3 16.3 13.9 14.1 21.4 20.3 17.1 27.6 29.1 21.2 23.7 13.4 25.3 19.0 25.6 32.3 26.4 : : :2003 : 27.4 27.8 29.1 : 20.2 30.7 30.2 12.9 16.5 26.0 19.9 30.9 25.8 18.5 13.4 13.6 22.2 21.1 17.9 28.3 29.5 20.9 24.2 12.6 24.6 18.2 26.5 33.3 26.4 : : :2004 : 27.3 27.7 29.3 : 19.6 30.7 29.5 13.4 17.0 26.0 20.0 31.2 26.1 17.8 12.6 13.3 22.6 20.7 18.8 28.5 29.1 20.0 24.9 14.9 24.3 17.2 26.7 32.9 26.3 : : :
Note: EA-13 is calculated without the Slovenian data.
Source: Eurostat - European System of integrated Social Protection Statistics (ESSPROS)
Expenditure on social protection as a percentage of GDP

ANNEX 1.2 | KEY INDICATORS PER GEOPOLITICAL ENTITY — TIME SERIES
187
EU-27
EU-25
EA-13 BE BG CZ DK DE EE IE EL ES FR IT CY LV LT LU HU MT NL AT PL PT RO SI SK FI SE UK HR MK TR
Key indicator 11a1995 : : 45.5 43.1 : 39.7 37.7 42.7 : 26.5 52.1 43.9 43.5 63.4 : : : 45.1 : 51.4 38.0 46.9 : 41.1 : : 38.1 32.8 37.4 43.1 : : :1996 : : 45.7 42.5 : 40.4 38.9 41.7 : 25.7 53.2 44.7 43.6 63.2 : : 47.2 43.6 : 51.7 39.5 47.3 : 44.4 : 46.1 36.4 33.8 39.2 44.0 : : :1997 : : 46.4 43.4 : 42.9 39.4 42.1 : 25.4 52.7 45.6 43.8 63.9 : 55.0 47.6 43.7 : 50.5 40.6 47.9 : 44.3 : 45.6 36.4 33.8 39.6 45.8 : : :1998 : : 46.6 44.0 : 43.9 38.3 42.4 : 25.8 53.9 45.5 43.9 64.0 : 56.4 46.6 43.2 : 51.0 41.0 48.0 : 44.1 : 45.5 36.3 34.4 39.9 45.2 : : :1999 : : 46.6 44.0 : 43.5 38.0 42.2 : 25.1 52.0 45.4 44.2 64.2 : 56.4 48.5 40.2 41.1 52.1 41.8 47.6 : 44.9 : 45.2 36.5 35.2 39.5 46.4 : : :2000 : 46.7 46.7 44.1 : 43.3 38.1 42.4 45.3 25.1 49.7 46.2 44.4 63.2 48.8 57.1 47.8 39.9 41.4 51.8 42.4 48.4 55.8 44.7 : 45.2 37.2 35.8 39.4 48.8 : : :2001 : 46.4 46.7 44.7 : 42.9 38.0 42.8 44.2 24.4 51.4 45.1 44.4 62.3 46.9 55.1 47.6 37.4 42.4 54.0 41.9 48.6 56.9 45.8 : 45.5 38.3 36.6 39.8 46.3 : : :2002 : 45.9 46.4 44.9 : 42.4 37.7 42.6 44.9 23.5 50.5 44.7 43.8 62.1 49.5 55.0 47.5 37.4 43.2 53.1 41.6 48.4 57.0 45.4 : 46.5 38.4 36.9 39.4 45.3 : : :2003 : 45.8 46.3 44.3 : 41.2 37.2 42.8 44.8 23.1 50.8 44.0 43.5 62.1 47.0 51.9 47.6 37.2 41.3 52.4 40.7 48.0 58.4 46.2 : 45.0 39.2 37.0 40.3 44.7 : : :2004 : 45.9 46.5 44.1 : 41.1 37.2 43.5 43.7 23.3 50.9 43.7 43.6 61.3 48.3 50.0 47.3 36.5 42.5 51.2 41.6 48.2 60.1 47.2 37.9 44.7 40.1 36.9 40.1 44.6 : : :
Note: EA-13 is calculated without the Slovenian data.
Source: Eurostat - European System of integrated Social Protection Statistics (ESSPROS)
EU-27
EU-25
EA-13 BE BG CZ DK DE EE IE EL ES FR IT CY LV LT LU HU MT NL AT PL PT RO SI SK FI SE UK HR MK TR
Key indicator 11b1995 : : 28.3 23.6 : 37.2 17.8 31.0 : 36.2 26.0 28.6 28.3 23.2 : : : 24.9 : 24.4 28.5 25.6 : 36.2 : : 33.0 20.9 22.0 24.0 : : :1996 : : 27.6 24.6 : 36.9 17.7 29.6 : 35.2 25.1 28.9 28.2 23.2 : : 30.3 26.1 : 23.2 27.6 25.1 : 31.5 : 30.8 37.5 21.4 22.1 24.0 : : :1997 : : 27.0 23.8 : 34.7 18.1 28.4 : 36.6 25.2 28.7 27.9 23.3 : 18.0 31.4 25.5 : 25.1 27.4 25.6 : 31.8 : 30.7 37.0 21.9 22.9 24.0 : : :1998 : : 27.2 24.0 : 33.6 19.3 28.1 : 37.8 24.2 28.8 28.2 23.6 : 16.8 32.5 25.2 : 24.3 28.2 25.9 : 32.0 : 30.9 36.1 22.7 24.4 25.3 : : :1999 : : 27.4 24.4 : 33.1 19.6 28.2 : 40.0 24.5 29.6 28.1 23.6 : 16.7 30.4 25.8 27.4 24.0 29.2 26.3 : 32.4 : 30.7 34.0 22.9 25.3 25.5 : : :2000 : 27.1 27.8 24.2 : 33.7 20.2 28.3 32.1 41.0 26.5 29.4 28.8 25.1 27.2 16.7 29.8 25.4 27.9 25.6 29.3 25.4 19.8 32.0 : 30.7 34.9 23.8 27.0 25.5 : : :2001 : 27.8 28.2 24.2 : 34.3 20.3 28.5 31.9 42.2 25.8 30.0 29.1 26.1 26.6 19.4 30.1 25.3 27.6 25.5 30.4 25.4 19.4 31.3 : 31.4 35.0 24.5 26.8 27.6 : : :2002 : 27.9 28.1 23.9 : 35.0 20.9 28.0 31.1 41.6 26.2 29.9 29.4 25.4 25.2 19.9 30.0 25.3 27.9 25.4 30.7 25.3 20.4 30.9 : 31.3 34.2 24.8 27.2 28.5 : : :2003 : 28.1 28.2 27.0 : 35.5 20.5 27.9 31.8 41.8 26.5 30.1 29.7 25.0 25.8 23.3 29.8 24.7 29.7 25.9 31.1 24.9 20.1 28.8 : 32.4 32.9 25.1 26.0 29.9 : : :2004 : 28.3 28.2 27.7 : 35.3 20.6 27.2 31.5 42.1 26.5 30.8 30.0 25.9 24.1 24.5 29.5 25.0 29.5 27.0 30.4 25.0 19.5 30.4 35.9 32.7 30.1 25.5 25.4 30.4 : : :
Note: EA-13 is calculated without the Slovenian data.
Source: Eurostat - European System of integrated Social Protection Statistics (ESSPROS)
Old age and survivors benefits as a percentage of total social benefits
Sickness and health care benefits as a percentage of total social benefits
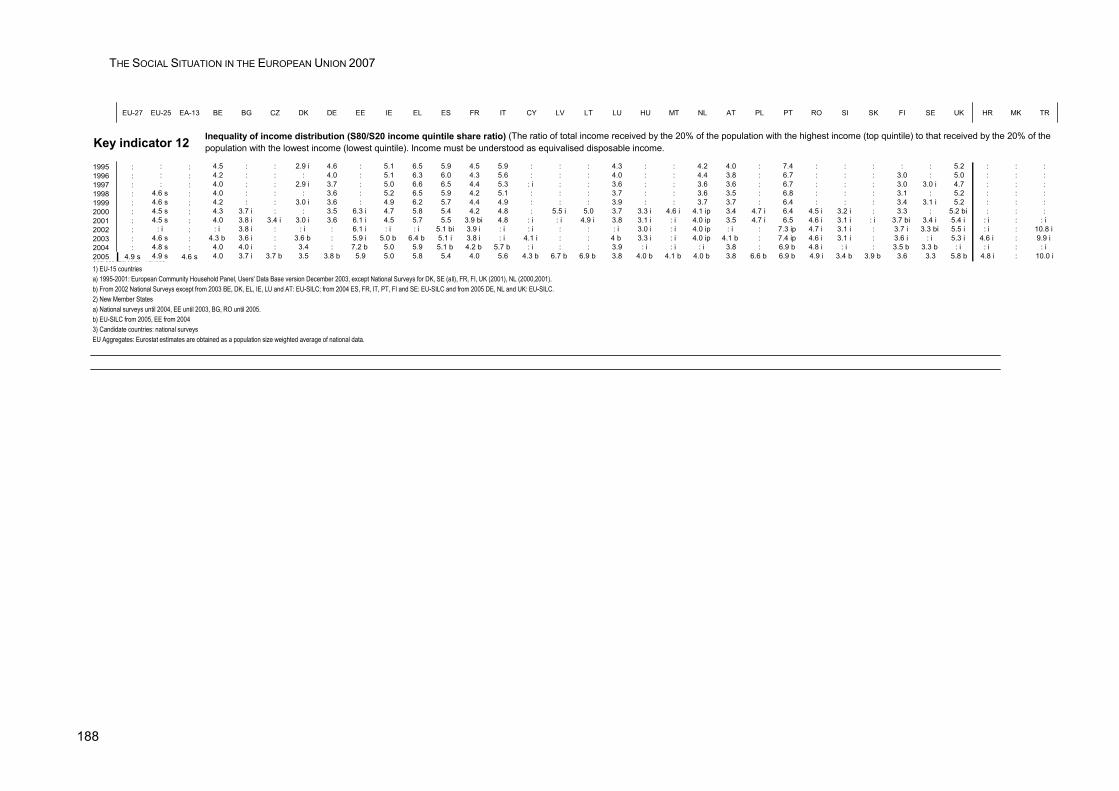
THE SOCIAL SITUATION IN THE EUROPEAN UNION 2007
188
EU-27 EU-25 EA-13 BE BG CZ DK DE EE IE EL ES FR IT CY LV LT LU HU MT NL AT PL PT RO SI SK FI SE UK HR MK TR
Key indicator 12
1995 : : : 4.5 : : 2.9 i 4.6 : 5.1 6.5 5.9 4.5 5.9 : : : 4.3 : : 4.2 4.0 : 7.4 : : : : : 5.2 : : :1996 : : : 4.2 : : : 4.0 : 5.1 6.3 6.0 4.3 5.6 : : : 4.0 : : 4.4 3.8 : 6.7 : : : 3.0 : 5.0 : : :1997 : : : 4.0 : : 2.9 i 3.7 : 5.0 6.6 6.5 4.4 5.3 : i : : 3.6 : : 3.6 3.6 : 6.7 : : : 3.0 3.0 i 4.7 : : :1998 : 4.6 s : 4.0 : : : 3.6 : 5.2 6.5 5.9 4.2 5.1 : : : 3.7 : : 3.6 3.5 : 6.8 : : : 3.1 : 5.2 : : :1999 : 4.6 s : 4.2 : : 3.0 i 3.6 : 4.9 6.2 5.7 4.4 4.9 : : : 3.9 : : 3.7 3.7 : 6.4 : : : 3.4 3.1 i 5.2 : : :2000 : 4.5 s : 4.3 3.7 i : : 3.5 6.3 i 4.7 5.8 5.4 4.2 4.8 : 5.5 i 5.0 3.7 3.3 i 4.6 i 4.1 ip 3.4 4.7 i 6.4 4.5 i 3.2 i : 3.3 : 5.2 bi : : :2001 : 4.5 s : 4.0 3.8 i 3.4 i 3.0 i 3.6 6.1 i 4.5 5.7 5.5 3.9 bi 4.8 : i : i 4.9 i 3.8 3.1 i : i 4.0 ip 3.5 4.7 i 6.5 4.6 i 3.1 i : i 3.7 bi 3.4 i 5.4 i : i : : i 2002 : : i : : i 3.8 i : : i : 6.1 i : i : i 5.1 bi 3.9 i : i : i : : : i 3.0 i : i 4.0 ip : i : 7.3 ip 4.7 i 3.1 i : 3.7 i 3.3 bi 5.5 i : i : 10.8 i 2003 : 4.6 s : 4.3 b 3.6 i : 3.6 b : 5.9 i 5.0 b 6.4 b 5.1 i 3.8 i : i 4.1 i : : 4 b 3.3 i : i 4.0 ip 4.1 b : 7.4 ip 4.6 i 3.1 i : 3.6 i : i 5.3 i 4.6 i : 9.9 i 2004 : 4.8 s : 4.0 4.0 i : 3.4 : 7.2 b 5.0 5.9 5.1 b 4.2 b 5.7 b : i : : 3.9 : i : i : i 3.8 : 6.9 b 4.8 i : i : 3.5 b 3.3 b : i : i : : i 2005 4.9 s 4.9 s 4.6 s 4.0 3.7 i 3.7 b 3.5 3.8 b 5.9 5.0 5.8 5.4 4.0 5.6 4.3 b 6.7 b 6.9 b 3.8 4.0 b 4.1 b 4.0 b 3.8 6.6 b 6.9 b 4.9 i 3.4 b 3.9 b 3.6 3.3 5.8 b 4.8 i : 10.0 iSources: Eurostat Various. 1) EU-15 countries a) 1995-2001: European Community Household Panel, Users' Data Base version December 2003, except National Surveys for DK, SE (all), FR, FI, UK (2001), NL (2000,2001). b) From 2002 National Surveys except from 2003 BE, DK, EL, IE, LU and AT: EU-SILC; from 2004 ES, FR, IT, PT, FI and SE: EU-SILC and from 2005 DE, NL and UK: EU-SILC. 2) New Member States a) National surveys until 2004, EE until 2003, BG, RO until 2005. b) EU-SILC from 2005, EE from 20043) Candidate countries: national surveysEU Aggregates: Eurostat estimates are obtained as a population size weighted average of national data.
Inequality of income distribution (S80/S20 income quintile share ratio) (The ratio of total income received by the 20% of the population with the highest income (top quintile) to that received by the 20% of the population with the lowest income (lowest quintile). Income must be understood as equivalised disposable income.
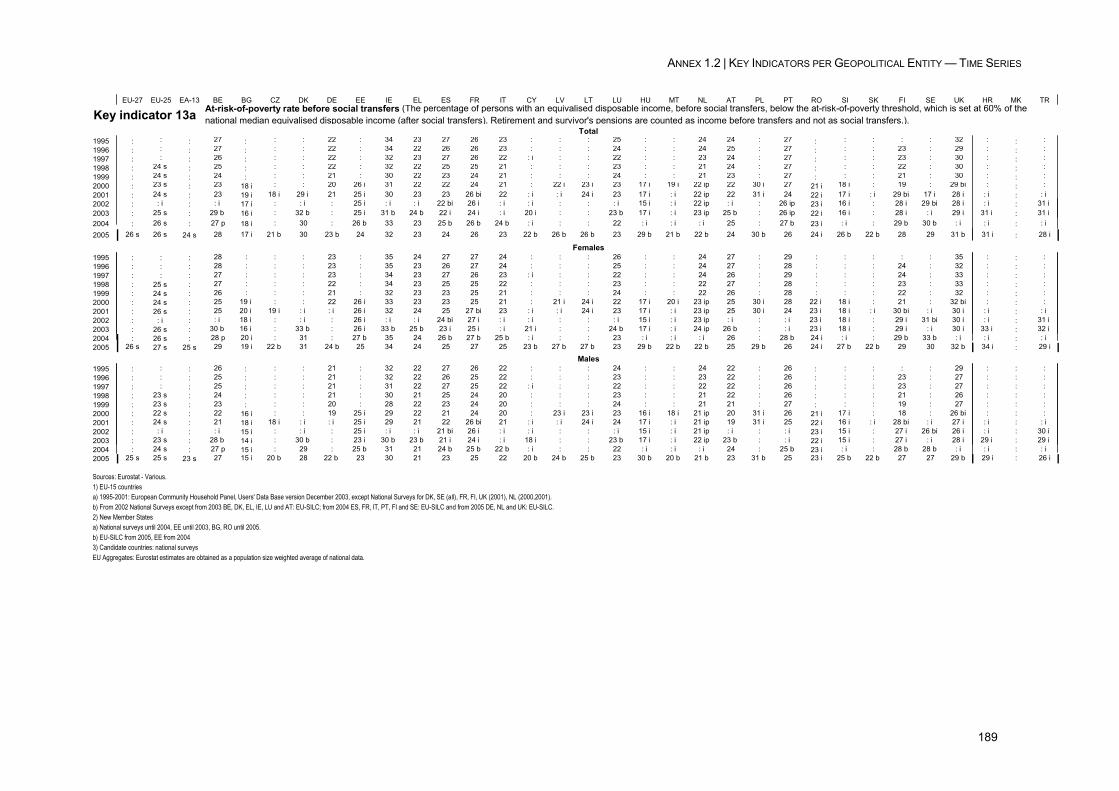
ANNEX 1.2 | KEY INDICATORS PER GEOPOLITICAL ENTITY — TIME SERIES
189
EU-27 EU-25 EA-13 BE BG CZ DK DE EE IE EL ES FR IT CY LV LT LU HU MT NL AT PL PT RO SI SK FI SE UK HR MK TR
Key indicator 13aTotal
1995 : : : 27 : : : 22 : 34 23 27 26 23 : : : 25 : : 24 24 : 27 : : : : : 32 : : :1996 : : : 27 : : : 22 : 34 22 26 26 23 : : : 24 : : 24 25 : 27 : : : 23 : 29 : : :1997 : : : 26 : : : 22 : 32 23 27 26 22 : i : : 22 : : 23 24 : 27 : : : 23 : 30 : : :1998 : 24 s : 25 : : : 22 : 32 22 25 25 21 : : : 23 : : 21 24 : 27 : : : 22 : 30 : : :1999 : 24 s : 24 : : : 21 : 30 22 23 24 21 : : : 24 : : 21 23 : 27 : : : 21 : 30 : : :2000 : 23 s : 23 18 i : : 20 26 i 31 22 22 24 21 : 22 i 23 i 23 17 i 19 i 22 ip 22 30 i 27 21 i 18 i : 19 : 29 bi : : :2001 : 24 s : 23 19 i 18 i 29 i 21 25 i 30 23 23 26 bi 22 : i : i 24 i 23 17 i : i 22 ip 22 31 i 24 22 i 17 i : i 29 bi 17 i 28 i : i : : i 2002 : : i : : i 17 i : : i : 25 i : i : i 22 bi 26 i : i : i : : : i 15 i : i 22 ip : i : 26 ip 23 i 16 i : 28 i 29 bi 28 i : i : 31 i 2003 : 25 s : 29 b 16 i : 32 b : 25 i 31 b 24 b 22 i 24 i : i 20 i : : 23 b 17 i : i 23 ip 25 b : 26 ip 22 i 16 i : 28 i : i 29 i 31 i : 31 i 2004 : 26 s : 27 p 18 i : 30 : 26 b 33 23 25 b 26 b 24 b : i : : 22 : i : i : i 25 : 27 b 23 i : i : 29 b 30 b : i : i : : i 2005 26 s 26 s 24 s 28 17 i 21 b 30 23 b 24 32 23 24 26 23 22 b 26 b 26 b 23 29 b 21 b 22 b 24 30 b 26 24 i 26 b 22 b 28 29 31 b 31 i : 28 i
Females1995 : : : 28 : : : 23 : 35 24 27 27 24 : : : 26 : : 24 27 : 29 : : : : : 35 : : :1996 : : : 28 : : : 23 : 35 23 26 27 24 : : : 25 : : 24 27 : 28 : : : 24 : 32 : : :1997 : : : 27 : : : 23 : 34 23 27 26 23 : i : : 22 : : 24 26 : 29 : : : 24 : 33 : : :1998 : 25 s : 27 : : : 22 : 34 23 25 25 22 : : : 23 : : 22 27 : 28 : : : 23 : 33 : : :1999 : 24 s : 26 : : : 21 : 32 23 23 25 21 : : : 24 : : 22 26 : 28 : : : 22 : 32 : : :2000 : 24 s : 25 19 i : : 22 26 i 33 23 23 25 21 : 21 i 24 i 22 17 i 20 i 23 ip 25 30 i 28 22 i 18 i : 21 : 32 bi : : :2001 : 26 s : 25 20 i 19 i : i : i 26 i 32 24 25 27 bi 23 : i : i 24 i 23 17 i : i 23 ip 25 30 i 24 23 i 18 i : i 30 bi : i 30 i : i : : i 2002 : : i : : i 18 i : : i : 26 i : i : i 24 bi 27 i : i : i : : : i 15 i : i 23 ip : i : : i 23 i 18 i : 29 i 31 bi 30 i : i : 31 i 2003 : 26 s : 30 b 16 i : 33 b : 26 i 33 b 25 b 23 i 25 i : i 21 i : : 24 b 17 i : i 24 ip 26 b : : i 23 i 18 i : 29 i : i 30 i 33 i : 32 i 2004 : 26 s : 28 p 20 i : 31 : 27 b 35 24 26 b 27 b 25 b : i : : 23 : i : i : i 26 : 28 b 24 i : i : 29 b 33 b : i : i : : i 2005 26 s 27 s 25 s 29 19 i 22 b 31 24 b 25 34 24 25 27 25 23 b 27 b 27 b 23 29 b 22 b 22 b 25 29 b 26 24 i 27 b 22 b 29 30 32 b 34 i : 29 i
Males1995 : : : 26 : : : 21 : 32 22 27 26 22 : : : 24 : : 24 22 : 26 : : : : : 29 : : :1996 : : : 25 : : : 21 : 32 22 26 25 22 : : : 23 : : 23 22 : 26 : : : 23 : 27 : : :1997 : : : 25 : : : 21 : 31 22 27 25 22 : i : : 22 : : 22 22 : 26 : : : 23 : 27 : : :1998 : 23 s : 24 : : : 21 : 30 21 25 24 20 : : : 23 : : 21 22 : 26 : : : 21 : 26 : : :1999 : 23 s : 23 : : : 20 : 28 22 23 24 20 : : : 24 : : 21 21 : 27 : : : 19 : 27 : : :2000 : 22 s : 22 16 i : : 19 25 i 29 22 21 24 20 : 23 i 23 i 23 16 i 18 i 21 ip 20 31 i 26 21 i 17 i : 18 : 26 bi : : :2001 : 24 s : 21 18 i 18 i : i : i 25 i 29 21 22 26 bi 21 : i : i 24 i 24 17 i : i 21 ip 19 31 i 25 22 i 16 i : i 28 bi : i 27 i : i : : i 2002 : : i : : i 15 i : : i : 25 i : i : i 21 bi 26 i : i : i : : : i 15 i : i 21 ip : i : : i 23 i 15 i : 27 i 26 bi 26 i : i : 30 i 2003 : 23 s : 28 b 14 i : 30 b : 23 i 30 b 23 b 21 i 24 i : i 18 i : : 23 b 17 i : i 22 ip 23 b : : i 22 i 15 i : 27 i : i 28 i 29 i : 29 i 2004 : 24 s : 27 p 15 i : 29 : 25 b 31 21 24 b 25 b 22 b : i : : 22 : i : i : i 24 : 25 b 23 i : i : 28 b 28 b : i : i : : i 2005 25 s 25 s 23 s 27 15 i 20 b 28 22 b 23 30 21 23 25 22 20 b 24 b 25 b 23 30 b 20 b 21 b 23 31 b 25 23 i 25 b 22 b 27 27 29 b 29 i : 26 i
At-risk-of-poverty rate before social transfers (The percentage of persons with an equivalised disposable income, before social transfers, below the at-risk-of-poverty threshold, which is set at 60% of the national median equivalised disposable income (after social transfers). Retirement and survivor's pensions are counted as income before transfers and not as social transfers.).
Sources: Eurostat - Various. 1) EU-15 countries a) 1995-2001: European Community Household Panel, Users' Data Base version December 2003, except National Surveys for DK, SE (all), FR, FI, UK (2001), NL (2000,2001). b) From 2002 National Surveys except from 2003 BE, DK, EL, IE, LU and AT: EU-SILC; from 2004 ES, FR, IT, PT, FI and SE: EU-SILC and from 2005 DE, NL and UK: EU-SILC.2) New Member States a) National surveys until 2004, EE until 2003, BG, RO until 2005. b) EU-SILC from 2005, EE from 20043) Candidate countries: national surveysEU Aggregates: Eurostat estimates are obtained as a population size weighted average of national data.
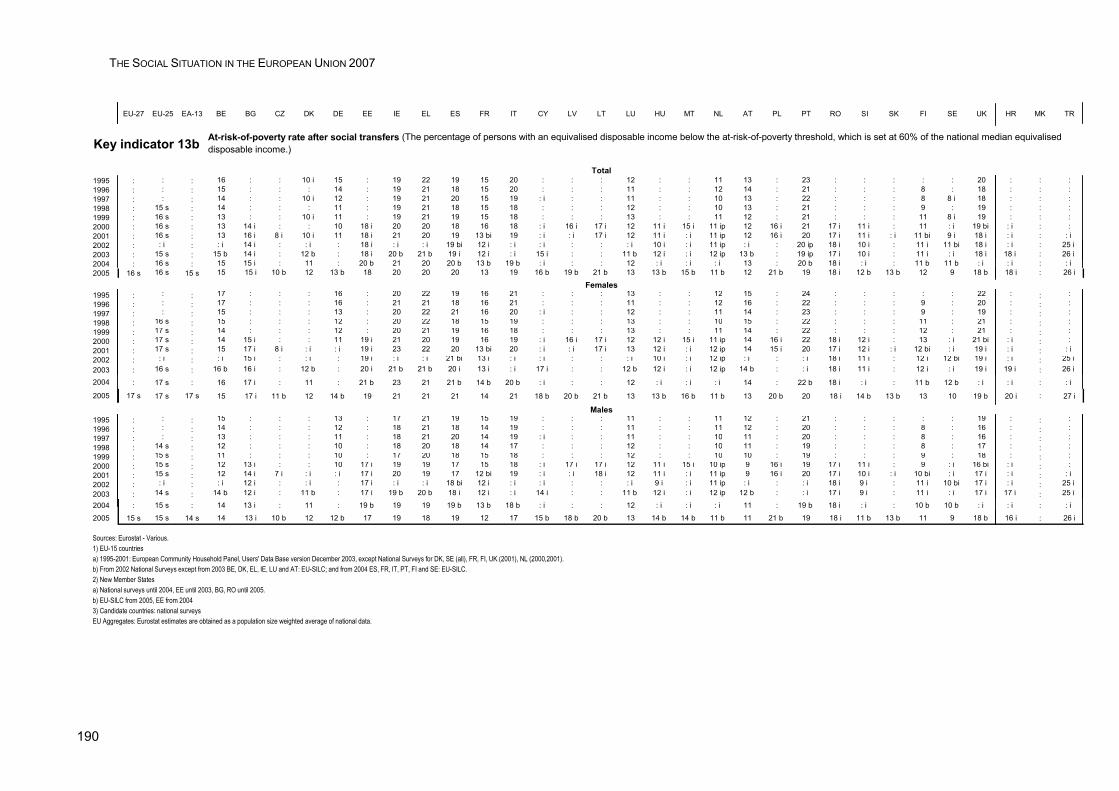
THE SOCIAL SITUATION IN THE EUROPEAN UNION 2007
190
EU-27 EU-25 EA-13 BE BG CZ DK DE EE IE EL ES FR IT CY LV LT LU HU MT NL AT PL PT RO SI SK FI SE UK HR MK TR
Key indicator 13b
Total1995 : : : 16 : : 10 i 15 : 19 22 19 15 20 : : : 12 : : 11 13 : 23 : : : : : 20 : : :1996 : : : 15 : : : 14 : 19 21 18 15 20 : : : 11 : : 12 14 : 21 : : : 8 : 18 : : :1997 : : : 14 : : 10 i 12 : 19 21 20 15 19 : i : : 11 : : 10 13 : 22 : : : 8 8 i 18 : : :1998 : 15 s : 14 : : : 11 : 19 21 18 15 18 : : : 12 : : 10 13 : 21 : : : 9 : 19 : : :1999 : 16 s : 13 : : 10 i 11 : 19 21 19 15 18 : : : 13 : : 11 12 : 21 : : : 11 8 i 19 : : :2000 : 16 s : 13 14 i : : 10 18 i 20 20 18 16 18 : i 16 i 17 i 12 11 i 15 i 11 ip 12 16 i 21 17 i 11 i : 11 : i 19 bi : i : :2001 : 16 s : 13 16 i 8 i 10 i 11 18 i 21 20 19 13 bi 19 : i : i 17 i 12 11 i : i 11 ip 12 16 i 20 17 i 11 i : i 11 bi 9 i 18 i : i : : i 2002 : : i : : i 14 i : : i : 18 i : i : i 19 bi 12 i : i : i : : : i 10 i : i 11 ip : i : 20 ip 18 i 10 i : 11 i 11 bi 18 i : i : 25 i 2003 : 15 s : 15 b 14 i : 12 b : 18 i 20 b 21 b 19 i 12 i : i 15 i : : 11 b 12 i : i 12 ip 13 b : 19 ip 17 i 10 i : 11 i : i 18 i 18 i : 26 i 2004 : 16 s : 15 15 i : 11 : 20 b 21 20 20 b 13 b 19 b : i : : 12 : i : i : i 13 : 20 b 18 i : i : 11 b 11 b : i : i : : i 2005 16 s 16 s 15 s 15 15 i 10 b 12 13 b 18 20 20 20 13 19 16 b 19 b 21 b 13 13 b 15 b 11 b 12 21 b 19 18 i 12 b 13 b 12 9 18 b 18 i : 26 i
Females1995 : : : 17 : : : 16 : 20 22 19 16 21 : : : 13 : : 12 15 : 24 : : : : : 22 : : :1996 : : : 17 : : : 16 : 21 21 18 16 21 : : : 11 : : 12 16 : 22 : : : 9 : 20 : : :1997 : : : 15 : : : 13 : 20 22 21 16 20 : i : : 12 : : 11 14 : 23 : : : 9 : 19 : : :1998 : 16 s : 15 : : : 12 : 20 22 18 15 19 : : : 13 : : 10 15 : 22 : : : 11 : 21 : : :1999 : 17 s : 14 : : : 12 : 20 21 19 16 18 : : : 13 : : 11 14 : 22 : : : 12 : 21 : : :2000 : 17 s : 14 15 i : : 11 19 i 21 20 19 16 19 : i 16 i 17 i 12 12 i 15 i 11 ip 14 16 i 22 18 i 12 i : 13 : i 21 bi : i : :2001 : 17 s : 15 17 i 8 i : i : i 19 i 23 22 20 13 bi 20 : i : i 17 i 13 12 i : i 12 ip 14 15 i 20 17 i 12 i : i 12 bi : i 19 i : i : : i 2002 : : i : : i 15 i : : i : 19 i : i : i 21 bi 13 i : i : i : : : i 10 i : i 12 ip : i : : i 18 i 11 i : 12 i 12 bi 19 i : i : 25 i 2003 : 16 s : 16 b 16 i : 12 b : 20 i 21 b 21 b 20 i 13 i : i 17 i : : 12 b 12 i : i 12 ip 14 b : : i 18 i 11 i : 12 i : i 19 i 19 i : 26 i
2004 : 17 s : 16 17 i : 11 : 21 b 23 21 21 b 14 b 20 b : i : : 12 : i : i : i 14 : 22 b 18 i : i : 11 b 12 b : i : i : : i
2005 17 s 17 s 17 s 15 17 i 11 b 12 14 b 19 21 21 21 14 21 18 b 20 b 21 b 13 13 b 16 b 11 b 13 20 b 20 18 i 14 b 13 b 13 10 19 b 20 i : 27 i
Males1995 : : : 15 : : : 13 : 17 21 19 15 19 : : : 11 : : 11 12 : 21 : : : : : 19 : : :1996 : : : 14 : : : 12 : 18 21 18 14 19 : : : 11 : : 11 12 : 20 : : : 8 : 16 : : :1997 : : : 13 : : : 11 : 18 21 20 14 19 : i : : 11 : : 10 11 : 20 : : : 8 : 16 : : :1998 : 14 s : 12 : : : 10 : 18 20 18 14 17 : : : 12 : : 10 11 : 19 : : : 8 : 17 : : :1999 : 15 s : 11 : : : 10 : 17 20 18 15 18 : : : 12 : : 10 10 : 19 : : : 9 : 18 : : :2000 : 15 s : 12 13 i : : 10 17 i 19 19 17 15 18 : i 17 i 17 i 12 11 i 15 i 10 ip 9 16 i 19 17 i 11 i : 9 : i 16 bi : i : :2001 : 15 s : 12 14 i 7 i : i : i 17 i 20 19 17 12 bi 19 : i : i 18 i 12 11 i : i 11 ip 9 16 i 20 17 i 10 i : i 10 bi : i 17 i : i : : i 2002 : : i : : i 12 i : : i : 17 i : i : i 18 bi 12 i : i : i : : : i 9 i : i 11 ip : i : : i 18 i 9 i : 11 i 10 bi 17 i : i : 25 i 2003 : 14 s : 14 b 12 i : 11 b : 17 i 19 b 20 b 18 i 12 i : i 14 i : : 11 b 12 i : i 12 ip 12 b : : i 17 i 9 i : 11 i : i 17 i 17 i : 25 i
2004 : 15 s : 14 13 i : 11 : 19 b 19 19 19 b 13 b 18 b : i : : 12 : i : i : i 11 : 19 b 18 i : i : 10 b 10 b : i : i : : i
2005 15 s 15 s 14 s 14 13 i 10 b 12 12 b 17 19 18 19 12 17 15 b 18 b 20 b 13 14 b 14 b 11 b 11 21 b 19 18 i 11 b 13 b 11 9 18 b 16 i : 26 i
At-risk-of-poverty rate after social transfers (The percentage of persons with an equivalised disposable income below the at-risk-of-poverty threshold, which is set at 60% of the national median equivalised disposable income.)
Sources: Eurostat - Various. 1) EU-15 countries a) 1995-2001: European Community Household Panel, Users' Data Base version December 2003, except National Surveys for DK, SE (all), FR, FI, UK (2001), NL (2000,2001). b) From 2002 National Surveys except from 2003 BE, DK, EL, IE, LU and AT: EU-SILC; and from 2004 ES, FR, IT, PT, FI and SE: EU-SILC. 2) New Member States a) National surveys until 2004, EE until 2003, BG, RO until 2005. b) EU-SILC from 2005, EE from 20043) Candidate countries: national surveysEU Aggregates: Eurostat estimates are obtained as a population size weighted average of national data.

ANNEX 1.2 | KEY INDICATORS PER GEOPOLITICAL ENTITY — TIME SERIES
191
EU-27 EU-25 EA-13 BE BG CZ DK DE EE IE EL ES FR IT CY LV LT LU HU MT NL AT PL PT RO SI SK FI SE UK HR MK TR
Key indicator 14aTotal
1995 : : : 14.1 : : : 10.6 : 13.5 10.3 12.5 11.0 11.9 : : : 6.5 : : 11.0 7.0 : 5.9 : : : : : 13.7 : : :1996 : : : 14.1 : : : 10.9 : 12.9 9.8 12.1 10.9 12.0 : : : 7.6 15.8 : 10.2 8.1 : 6.3 : 8.8 : : : 13.5 : : :1997 : : : 14.3 : 5.3 : 11.4 9.6 12.5 10.0 11.3 11.4 12.2 : : : 7.0 15.7 : 8.9 7.7 9.8 5.9 6.8 8.7 : : : 12.9 : : :1998 : : : 14.4 : 6.2 : 11.1 8.7 : 9.6 10.2 11.3 12.0 : 14.0 10.4 7.3 15.8 : 8.8 8.4 : 5.1 b 7.3 8.3 9.0 : : 12.5 : : :1999 : : 10.2 e 13.0 b : 7.2 : 10.5 10.4 9.8 9.6 8.5 11.3 11.7 : 14.9 b 8.8 6.7 14.2 : 7.8 8.2 : 4.7 7.8 9.6 9.8 : : 11.8 : : :2000 : : 9.6 e 12.4 15.5 7.8 : 9.7 9.6 8.6 9.2 7.5 10.7 11.2 5.6 15.0 9.2 6.9 13.5 7.4 7.6 8.3 : 4.6 8.4 9.0 10.9 : : 11.4 : : :2001 10.2 e 10.1 e 9.4 b 13.8 17.3 b 7.9 : 9.7 11.0 8.8 8.8 7.4 10.3 10.8 4.9 12.8 10.0 6.7 13.2 7.8 6.9 7.9 13.8 4.3 8.7 8.2 10.0 : : 11.2 : : :2002 10.3 e 10.2 e 9.4 e 14.2 16.6 7.3 7.6 10.0 10.8 8.5 8.9 7.3 10.4 10.2 5.3 10.5 b 9.1 b 6.3 13.0 7.2 6.7 7.5 15.1 4.6 11.3 b 8.0 10.9 : : 11.3 14.0 : :2003 10.3 e 10.2 e 9.5 e 14.4 15.3 7.7 8.6 10.6 10.9 8.9 8.5 7.2 10.5 9.7 5.2 8.7 7.4 7.5 i 11.6 b 7.9 8.0 7.4 14.8 5.5 11.1 8.7 10.1 10.9 : 10.9 13.2 : :2004 10.4 i 10.3 i 9.6 i 13.7 13.7 8.0 8.5 11.1 9.5 8.6 8.5 7.3 10.8 9.1 5.0 7.8 8.1 7.1 11.9 8.6 8.0 8.8 i 15.8 5.3 11.1 7.5 10.8 11.0 : 11.0 11.2 : :2005 10.3 e 10.2 e 9.5 e 13.5 13.0 7.4 7.7 11.0 p 8.5 8.4 8.5 6.7 10.7 9.5 5.2 8.1 6.6 6.7 12.3 8.2 8.0 8.7 15.3 5.5 10.4 6.7 10.2 10.5 : 11.0 12.5 : :2006 9.8 e 9.8 e 9.3 e 14.3 11.6 7.3 6.9 10.5 p 6.0 7.9 8.1 6.3 10.9 9.2 4.9 6.8 7.0 7.1 11.6 6.7 7.4 8.8 13.5 5.8 9.7 7.2 9.6 9.5 : 10.7 12.9 : :2007 9.3 e 9.3 e 8.8 e 12.5 10.0 6.5 : 9.5 6.0 7.8 8.0 6.0 10.9 p 9.1 4.5 7.1 6.3 7.5 11.8 6.9 6.5 7.6 11.7 5.8 9.6 6.0 8.8 : : 10.9 : : :
Females1995 : : : 16.2 : : : 11.7 : 14.6 12.9 13.2 12.1 13.9 : : : 8.1 : : 12.5 8.4 : 6.8 : : : : : 15.7 : : :1996 : : : 16.0 : : : 11.8 : 14.1 12.4 12.8 12.1 13.8 : : : 9.6 17.5 : 11.6 9.6 : 7.3 : 9.7 : : : 15.5 : : :1997 : : : 16.3 : 6.6 : 12.4 9.9 13.6 12.5 12.1 12.6 14.1 : : : 8.9 17.1 : 10.5 9.1 10.7 7.0 7.8 9.4 : : : 15.0 : : :1998 : : : 16.3 : 7.7 : 12.0 8.9 : 12.1 11.0 12.5 13.8 : 14.5 11.2 9.0 17.1 : 10.6 10.0 : 6.1 b 8.3 9.0 9.9 : : 14.6 : : :1999 : : 11.5 e 14.8 b : 8.8 : 11.4 10.4 11.1 12.1 9.3 12.5 13.5 : 16.4 b 8.5 8.4 15.6 : 9.4 9.8 : 5.3 8.6 10.5 10.9 : : 13.9 : : :2000 : : 10.9 e 14.5 16.3 9.5 : 10.7 9.6 9.8 11.7 8.2 11.9 13.0 7.1 15.4 8.6 8.8 14.6 8.8 9.4 10.0 : 5.1 9.3 9.6 11.4 : : 13.5 : : :2001 11.4 e 11.4 e 10.7 b 16.2 17.8 b 9.5 : 10.5 11.1 10.2 11.2 8.3 11.6 12.4 6.3 13.2 10.0 8.1 14.3 9.9 8.5 9.6 14.7 4.9 9.6 9.4 10.5 : : 13.2 : : :2002 11.6 e 11.4 e 10.5 e 16.6 17.0 9.1 8.0 10.7 10.9 9.7 11.2 8.0 11.8 11.8 6.5 10.3 b 9.7 b 7.0 14.0 8.6 8.1 8.8 16.1 5.2 12.5 b 8.9 11.4 : : 13.3 15.8 : :2003 11.4 e 11.3 e 10.6 e 16.2 15.8 9.7 9.3 11.2 10.5 10.2 10.8 7.8 11.7 11.3 6.1 8.6 7.4 9.0 i 12.2 b 9.7 9.3 8.6 15.9 6.1 12.4 9.6 10.9 10.3 : 12.9 14.4 : :2004 11.5 i 11.4 i 10.6 i 16.0 14.2 9.6 8.8 11.4 8.7 10.1 10.7 7.9 12.0 10.4 6.1 8.4 8.0 8.5 12.7 10.4 9.3 10.0 i 16.8 5.7 11.7 8.0 11.6 10.9 : 13.0 12.0 : :2005 11.2 e 11.2 e 10.3 e 15.4 13.5 9.0 7.8 11.2 p 7.0 9.8 10.7 7.2 11.8 10.8 6.2 7.6 6.4 8.1 13.1 9.9 9.0 9.6 16.6 5.8 11.3 7.1 10.9 10.0 : 12.8 13.6 : :2006 10.8 e 10.8 e 10.2 e 16.4 12.0 8.8 7.3 10.7 p 5.8 9.3 10.1 6.8 12.0 10.6 5.9 6.2 6.9 8.9 12.6 8.2 8.6 9.8 14.6 6.4 10.6 7.8 10.2 9.0 : 12.5 14.0 : :2007 10.3 e 10.3 e 9.7 14.4 9.9 8.1 : 9.9 p 5.7 5.7 9.1 10.0 12.0 p 10.3 4.9 7.7 6.3 8.6 12.9 8.3 7.7 8.7 12.8 6.1 10.7 6.9 9.6 : : 12.7 : : :
Males1995 : : : 12.1 : : : 9.5 : 12.5 7.5 11.9 9.9 9.9 : : : 5.0 : : 9.5 5.6 : 5.0 : : : : : 11.8 : : :1996 : : : 12.3 : : : 9.9 : 11.8 7.1 11.4 9.7 10.1 : : : 5.6 14.1 : 8.8 6.7 : 5.1 : 7.9 : : : 11.6 : : :1997 : : : 12.4 : 3.9 : 10.5 9.3 11.5 7.2 10.5 10.2 10.3 : : : 5.2 14.1 : 7.4 6.3 8.8 4.8 5.8 8.0 : : : 10.9 : : :1998 : : : 12.4 : 4.6 : 10.1 8.5 : 7.0 9.4 10.1 10.2 : 13.4 9.5 5.5 14.5 : 7.1 6.9 : 4.0 b 6.3 7.5 8.1 : : 10.3 : : :1999 : : 8.9 e 11.2 b : 5.6 : 9.5 10.5 8.5 7.0 7.7 10.1 9.8 : 13.4 b 9.0 5.1 12.8 : 6.3 6.5 : 4.1 7.0 8.7 8.8 : : 9.6 : : :2000 : : 8.3 e 10.4 14.6 6.1 : 8.8 9.7 7.4 6.7 6.8 9.4 9.4 3.9 14.6 9.8 5.0 12.4 6.0 5.8 6.5 : 4.1 7.4 8.4 10.3 : : 9.1 : : :2001 8.9 e 8.8 e 8.1 b 11.5 16.8 b 6.2 : 8.9 10.9 7.4 6.4 6.6 8.9 9.1 3.4 12.3 10.1 5.3 12.0 5.7 5.4 6.2 12.9 3.7 7.7 7.1 9.6 : : 9.1 : : :2002 9.1 e 8.9 e 8.2 e 11.9 16.1 5.6 7.2 9.4 10.6 7.3 6.5 6.6 9.1 8.6 3.9 10.7 b 8.5 b 5.6 12.0 5.8 5.3 6.2 14.1 3.9 10.1 b 7.0 10.4 : : 9.2 12.2 : :2003 9.1 e 9.0 e 8.5 e 12.7 14.7 5.8 7.8 10.0 11.3 7.6 6.2 6.5 9.4 8.1 4.3 8.9 7.4 6.0 i 10.9 b 6.2 6.7 6.1 13.7 4.8 9.8 7.8 9.3 11.6 : 8.9 12.0 : :2004 9.4 i 9.3 i 8.7 i 11.3 13.2 6.4 8.3 10.8 10.2 7.2 6.2 6.7 9.5 7.9 3.8 7.1 8.3 5.7 11.1 6.8 6.7 7.6 i 14.8 5.0 10.4 7.0 10.0 11.2 : 9.0 10.3 : :2005 9.3 e 9.2 e 8.8 e 11.6 12.6 5.8 7.7 10.9 p 10.2 7.2 6.4 6.2 9.6 8.3 4.2 8.7 6.9 5.4 11.6 6.5 6.9 7.7 14.0 5.1 9.4 6.3 9.5 11.0 : 9.2 11.5 : :2006 8.8 e 8.8 e 8.5 e 12.3 11.1 5.8 6.4 10.3 p 6.1 6.5 6.1 5.8 9.9 7.8 3.7 7.5 7.2 5.4 10.6 5.2 6.2 7.8 12.3 5.3 8.8 6.6 9.0 10.1 : 8.8 11.7 : :2007 8.3 e 8.2 e 8 e 10.7 10.1 4.9 : 9.2 p 6.3 6.4 6.0 5.6 9.7 p 7.8 4.1 6.4 6.4 6.3 10.7 5.6 5.4 6.5 10.5 5.4 8.6 5.1 8.1 : : 8.9 : : :
Source: Eurostat - European Union Labour Force Survey
People aged 18-59 living in jobless householdsShare of persons/women/men aged 18-59 who are living in households where no-one works. Students aged 18-24 who live in households composed solely of students of the same age class are counted neither in the numerator nor in the denominator
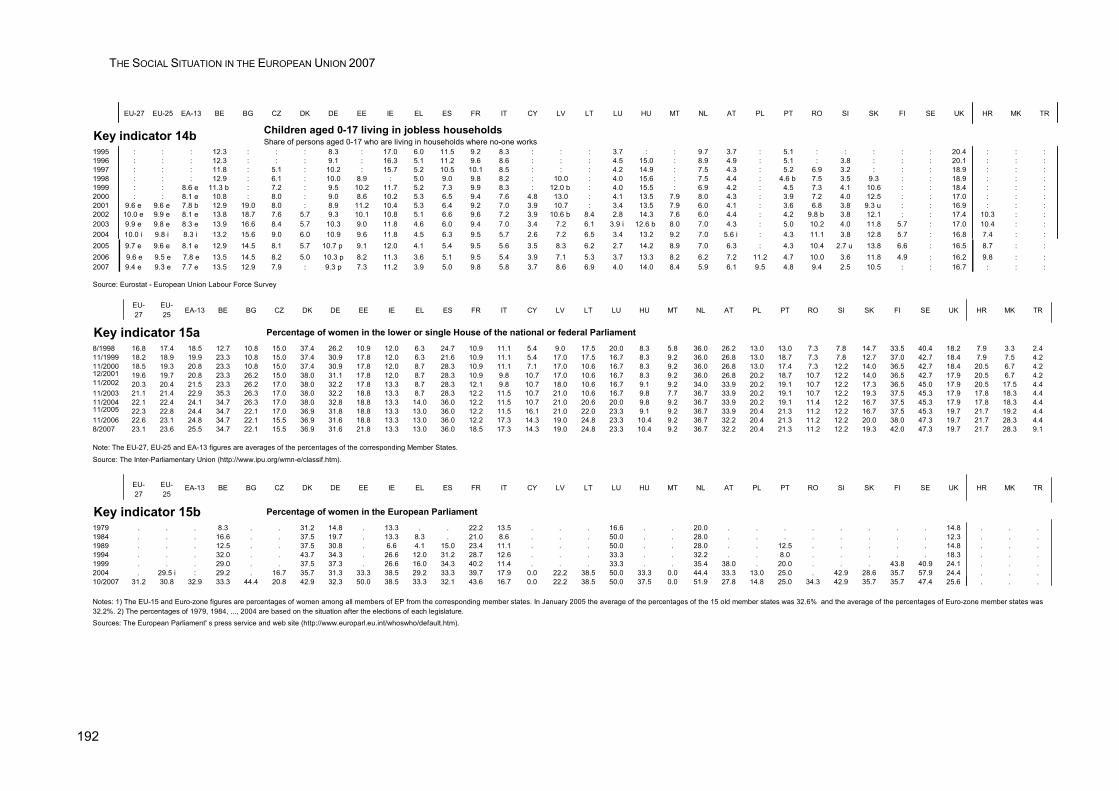
THE SOCIAL SITUATION IN THE EUROPEAN UNION 2007
192
EU-27 EU-25 EA-13 BE BG CZ DK DE EE IE EL ES FR IT CY LV LT LU HU MT NL AT PL PT RO SI SK FI SE UK HR MK TR
Key indicator 14b1995 : : : 12.3 : : : 8.3 : 17.0 6.0 11.5 9.2 8.3 : : : 3.7 : : 9.7 3.7 : 5.1 : : : : : 20.4 : : :1996 : : : 12.3 : : : 9.1 : 16.3 5.1 11.2 9.6 8.6 : : : 4.5 15.0 : 8.9 4.9 : 5.1 : 3.8 : : : 20.1 : : :1997 : : : 11.8 : 5.1 : 10.2 : 15.7 5.2 10.5 10.1 8.5 : : : 4.2 14.9 : 7.5 4.3 : 5.2 6.9 3.2 : : : 18.9 : : :1998 : : : 12.9 : 6.1 : 10.0 8.9 : 5.0 9.0 9.8 8.2 : 10.0 : 4.0 15.6 : 7.5 4.4 : 4.6 b 7.5 3.5 9.3 : : 18.9 : : :1999 : : 8.6 e 11.3 b : 7.2 : 9.5 10.2 11.7 5.2 7.3 9.9 8.3 : 12.0 b : 4.0 15.5 : 6.9 4.2 : 4.5 7.3 4.1 10.6 : : 18.4 : : :2000 : : 8.1 e 10.8 : 8.0 : 9.0 8.6 10.2 5.3 6.5 9.4 7.6 4.8 13.0 : 4.1 13.5 7.9 8.0 4.3 : 3.9 7.2 4.0 12.5 : : 17.0 : : :2001 9.6 e 9.6 e 7.8 b 12.9 19.0 8.0 : 8.9 11.2 10.4 5.3 6.4 9.2 7.0 3.9 10.7 : 3.4 13.5 7.9 6.0 4.1 : 3.6 6.8 3.8 9.3 u : : 16.9 : : :2002 10.0 e 9.9 e 8.1 e 13.8 18.7 7.6 5.7 9.3 10.1 10.8 5.1 6.6 9.6 7.2 3.9 10.6 b 8.4 2.8 14.3 7.6 6.0 4.4 : 4.2 9.8 b 3.8 12.1 : : 17.4 10.3 : :2003 9.9 e 9.8 e 8.3 e 13.9 16.6 8.4 5.7 10.3 9.0 11.8 4.6 6.0 9.4 7.0 3.4 7.2 6.1 3.9 i 12.6 b 8.0 7.0 4.3 : 5.0 10.2 4.0 11.8 5.7 : 17.0 10.4 : :2004 10.0 i 9.8 i 8.3 i 13.2 15.6 9.0 6.0 10.9 9.6 11.8 4.5 6.3 9.5 5.7 2.6 7.2 6.5 3.4 13.2 9.2 7.0 5.6 i : 4.3 11.1 3.8 12.8 5.7 : 16.8 7.4 : :2005 9.7 e 9.6 e 8.1 e 12.9 14.5 8.1 5.7 10.7 p 9.1 12.0 4.1 5.4 9.5 5.6 3.5 8.3 6.2 2.7 14.2 8.9 7.0 6.3 : 4.3 10.4 2.7 u 13.8 6.6 : 16.5 8.7 : :2006 9.6 e 9.5 e 7.8 e 13.5 14.5 8.2 5.0 10.3 p 8.2 11.3 3.6 5.1 9.5 5.4 3.9 7.1 5.3 3.7 13.3 8.2 6.2 7.2 11.2 4.7 10.0 3.6 11.8 4.9 : 16.2 9.8 : :2007 9.4 e 9.3 e 7.7 e 13.5 12.9 7.9 : 9.3 p 7.3 11.2 3.9 5.0 9.8 5.8 3.7 8.6 6.9 4.0 14.0 8.4 5.9 6.1 9.5 4.8 9.4 2.5 10.5 : : 16.7 : : :
Source: Eurostat - European Union Labour Force Survey
Children aged 0-17 living in jobless householdsShare of persons aged 0-17 who are living in households where no-one works
EU-27
EU-25 EA-13 BE BG CZ DK DE EE IE EL ES FR IT CY LV LT LU HU MT NL AT PL PT RO SI SK FI SE UK HR MK TR
Key indicator 15a Percentage of women in the lower or single House of the national or federal Parliament8/1998 16.8 17.4 18.5 12.7 10.8 15.0 37.4 26.2 10.9 12.0 6.3 24.7 10.9 11.1 5.4 9.0 17.5 20.0 8.3 5.8 36.0 26.2 13.0 13.0 7.3 7.8 14.7 33.5 40.4 18.2 7.9 3.3 2.411/1999 18.2 18.9 19.9 23.3 10.8 15.0 37.4 30.9 17.8 12.0 6.3 21.6 10.9 11.1 5.4 17.0 17.5 16.7 8.3 9.2 36.0 26.8 13.0 18.7 7.3 7.8 12.7 37.0 42.7 18.4 7.9 7.5 4.211/2000 18.5 19.3 20.8 23.3 10.8 15.0 37.4 30.9 17.8 12.0 8.7 28.3 10.9 11.1 7.1 17.0 10.6 16.7 8.3 9.2 36.0 26.8 13.0 17.4 7.3 12.2 14.0 36.5 42.7 18.4 20.5 6.7 4.212/2001 19.6 19.7 20.8 23.3 26.2 15.0 38.0 31.1 17.8 12.0 8.7 28.3 10.9 9.8 10.7 17.0 10.6 16.7 8.3 9.2 36.0 26.8 20.2 18.7 10.7 12.2 14.0 36.5 42.7 17.9 20.5 6.7 4.211/2002 20.3 20.4 21.5 23.3 26.2 17.0 38.0 32.2 17.8 13.3 8.7 28.3 12.1 9.8 10.7 18.0 10.6 16.7 9.1 9.2 34.0 33.9 20.2 19.1 10.7 12.2 17.3 36.5 45.0 17.9 20.5 17.5 4.411/2003 21.1 21.4 22.9 35.3 26.3 17.0 38.0 32.2 18.8 13.3 8.7 28.3 12.2 11.5 10.7 21.0 10.6 16.7 9.8 7.7 36.7 33.9 20.2 19.1 10.7 12.2 19.3 37.5 45.3 17.9 17.8 18.3 4.411/2004 22.1 22.4 24.1 34.7 26.3 17.0 38.0 32.8 18.8 13.3 14.0 36.0 12.2 11.5 10.7 21.0 20.6 20.0 9.8 9.2 36.7 33.9 20.2 19.1 11.4 12.2 16.7 37.5 45.3 17.9 17.8 18.3 4.411/2005 22.3 22.8 24.4 34.7 22.1 17.0 36.9 31.8 18.8 13.3 13.0 36.0 12.2 11.5 16.1 21.0 22.0 23.3 9.1 9.2 36.7 33.9 20.4 21.3 11.2 12.2 16.7 37.5 45.3 19.7 21.7 19.2 4.411/2006 22.6 23.1 24.8 34.7 22.1 15.5 36.9 31.6 18.8 13.3 13.0 36.0 12.2 17.3 14.3 19.0 24.8 23.3 10.4 9.2 36.7 32.2 20.4 21.3 11.2 12.2 20.0 38.0 47.3 19.7 21.7 28.3 4.48/2007 23.1 23.6 25.5 34.7 22.1 15.5 36.9 31.6 21.8 13.3 13.0 36.0 18.5 17.3 14.3 19.0 24.8 23.3 10.4 9.2 36.7 32.2 20.4 21.3 11.2 12.2 19.3 42.0 47.3 19.7 21.7 28.3 9.1
Note: The EU-27, EU-25 and EA-13 figures are averages of the percentages of the corresponding Member States.
Source: The Inter-Parliamentary Union (http://www.ipu.org/wmn-e/classif.htm).
EU-27
EU-25
EA-13 BE BG CZ DK DE EE IE EL ES FR IT CY LV LT LU HU MT NL AT PL PT RO SI SK FI SE UK HR MK TR
Key indicator 15b Percentage of women in the European Parliament1979 . . . 8.3 . . 31.2 14.8 . 13.3 . . 22.2 13.5 . . . 16.6 . . 20.0 . . . . . . . . 14.8 . . .1984 . . . 16.6 . . 37.5 19.7 . 13.3 8.3 . 21.0 8.6 . . . 50.0 . . 28.0 . . . . . . . . 12.3 . . .1989 . . . 12.5 . . 37.5 30.8 . 6.6 4.1 15.0 23.4 11.1 . . . 50.0 . . 28.0 . . 12.5 . . . . . 14.8 . . .1994 . . . 32.0 . . 43.7 34.3 . 26.6 12.0 31.2 28.7 12.6 . . . 33.3 . . 32.2 . . 8.0 . . . . . 18.3 . . .1999 . . . 29.0 . . 37.5 37.3 . 26.6 16.0 34.3 40.2 11.4 . . . 33.3 . . 35.4 38.0 . 20.0 . . . 43.8 40.9 24.1 . . .2004 . 29.5 i : 29.2 . 16.7 35.7 31.3 33.3 38.5 29.2 33.3 39.7 17.9 0.0 22.2 38.5 50.0 33.3 0.0 44.4 33.3 13.0 25.0 . 42.9 28.6 35.7 57.9 24.4 . . .10/2007 31.2 30.8 32.9 33.3 44.4 20.8 42.9 32.3 50.0 38.5 33.3 32.1 43.6 16.7 0.0 22.2 38.5 50.0 37.5 0.0 51.9 27.8 14.8 25.0 34.3 42.9 35.7 35.7 47.4 25.6 . . .
Sources: The European Parliament' s press service and web site (http://www.europarl.eu.int/whoswho/default.htm).
Notes: 1) The EU-15 and Euro-zone figures are percentages of women among all members of EP from the corresponding member states. In January 2005 the average of the percentages of the 15 old member states was 32.6% and the average of the percentages of Euro-zone member states was 32.2%. 2) The percentages of 1979, 1984, ..., 2004 are based on the situation after the elections of each legislature.
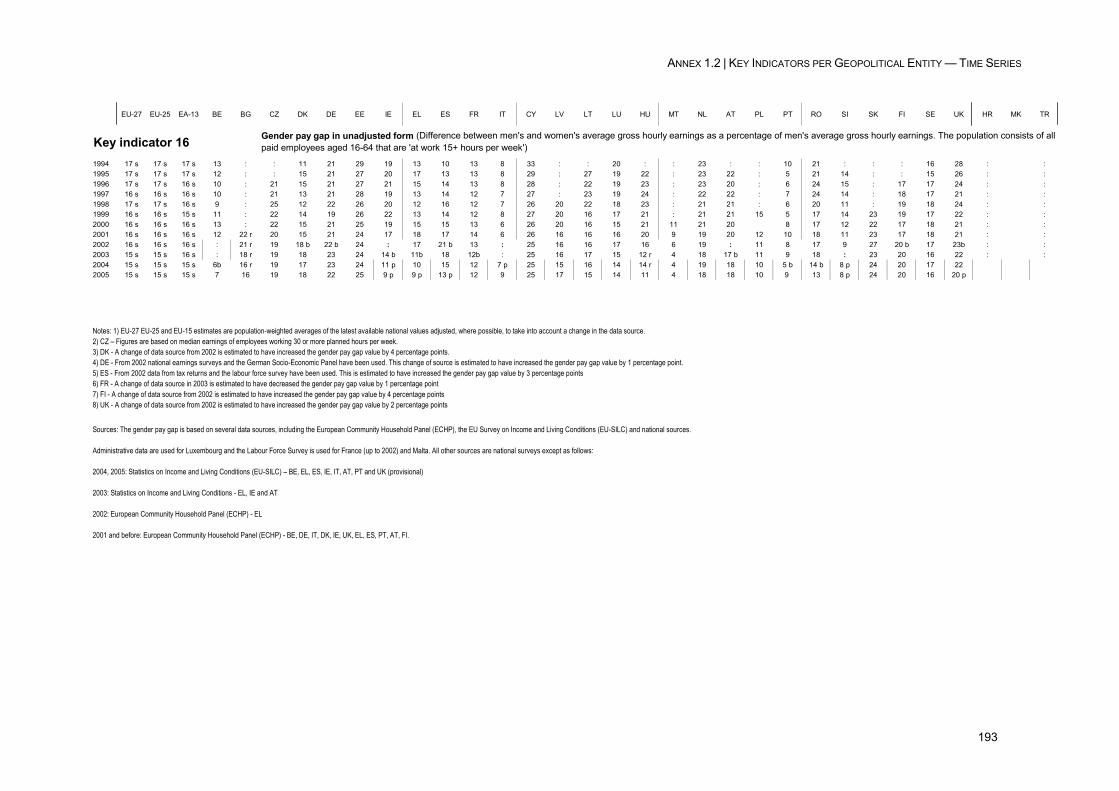
ANNEX 1.2 | KEY INDICATORS PER GEOPOLITICAL ENTITY — TIME SERIES
193
EU-27 EU-25 EA-13 BE BG CZ DK DE EE IE EL ES FR IT CY LV LT LU HU MT NL AT PL PT RO SI SK FI SE UK HR MK TR
Key indicator 161994 17 s 17 s 17 s 13 : : 11 21 29 19 13 10 13 8 33 : : 20 : : 23 : : 10 21 : : : 16 28 : :1995 17 s 17 s 17 s 12 : : 15 21 27 20 17 13 13 8 29 : 27 19 22 : 23 22 : 5 21 14 : : 15 26 : :1996 17 s 17 s 16 s 10 : 21 15 21 27 21 15 14 13 8 28 : 22 19 23 : 23 20 : 6 24 15 : 17 17 24 : :1997 16 s 16 s 16 s 10 : 21 13 21 28 19 13 14 12 7 27 : 23 19 24 : 22 22 : 7 24 14 : 18 17 21 : :1998 17 s 17 s 16 s 9 : 25 12 22 26 20 12 16 12 7 26 20 22 18 23 : 21 21 : 6 20 11 : 19 18 24 : :1999 16 s 16 s 15 s 11 : 22 14 19 26 22 13 14 12 8 27 20 16 17 21 : 21 21 15 5 17 14 23 19 17 22 : :2000 16 s 16 s 16 s 13 : 22 15 21 25 19 15 15 13 6 26 20 16 15 21 11 21 20 8 17 12 22 17 18 21 : :2001 16 s 16 s 16 s 12 22 r 20 15 21 24 17 18 17 14 6 26 16 16 16 20 9 19 20 12 10 18 11 23 17 18 21 : :2002 16 s 16 s 16 s : 21 r 19 18 b 22 b 24 : 17 21 b 13 : 25 16 16 17 16 6 19 : 11 8 17 9 27 20 b 17 23b : :2003 15 s 15 s 16 s : 18 r 19 18 23 24 14 b 11b 18 12b : 25 16 17 15 12 r 4 18 17 b 11 9 18 : 23 20 16 22 : :2004 15 s 15 s 15 s 6b 16 r 19 17 23 24 11 p 10 15 12 7 p 25 15 16 14 14 r 4 19 18 10 5 b 14 b 8 p 24 20 17 222005 15 s 15 s 15 s 7 16 19 18 22 25 9 p 9 p 13 p 12 9 25 17 15 14 11 4 18 18 10 9 13 8 p 24 20 16 20 p
Sources: The gender pay gap is based on several data sources, including the European Community Household Panel (ECHP), the EU Survey on Income and Living Conditions (EU-SILC) and national sources.
Administrative data are used for Luxembourg and the Labour Force Survey is used for France (up to 2002) and Malta. All other sources are national surveys except as follows:
2004, 2005: Statistics on Income and Living Conditions (EU-SILC) – BE, EL, ES, IE, IT, AT, PT and UK (provisional)
2003: Statistics on Income and Living Conditions - EL, IE and AT
2002: European Community Household Panel (ECHP) - EL
2001 and before: European Community Household Panel (ECHP) - BE, DE, IT, DK, IE, UK, EL, ES, PT, AT, FI.
Notes: 1) EU-27 EU-25 and EU-15 estimates are population-weighted averages of the latest available national values adjusted, where possible, to take into account a change in the data source.2) CZ – Figures are based on median earnings of employees working 30 or more planned hours per week.3) DK - A change of data source from 2002 is estimated to have increased the gender pay gap value by 4 percentage points.4) DE - From 2002 national earnings surveys and the German Socio-Economic Panel have been used. This change of source is estimated to have increased the gender pay gap value by 1 percentage point.5) ES - From 2002 data from tax returns and the labour force survey have been used. This is estimated to have increased the gender pay gap value by 3 percentage points6) FR - A change of data source in 2003 is estimated to have decreased the gender pay gap value by 1 percentage point7) FI - A change of data source from 2002 is estimated to have increased the gender pay gap value by 4 percentage points8) UK - A change of data source from 2002 is estimated to have increased the gender pay gap value by 2 percentage points
Gender pay gap in unadjusted form (Difference between men's and women's average gross hourly earnings as a percentage of men's average gross hourly earnings. The population consists of all paid employees aged 16-64 that are 'at work 15+ hours per week')
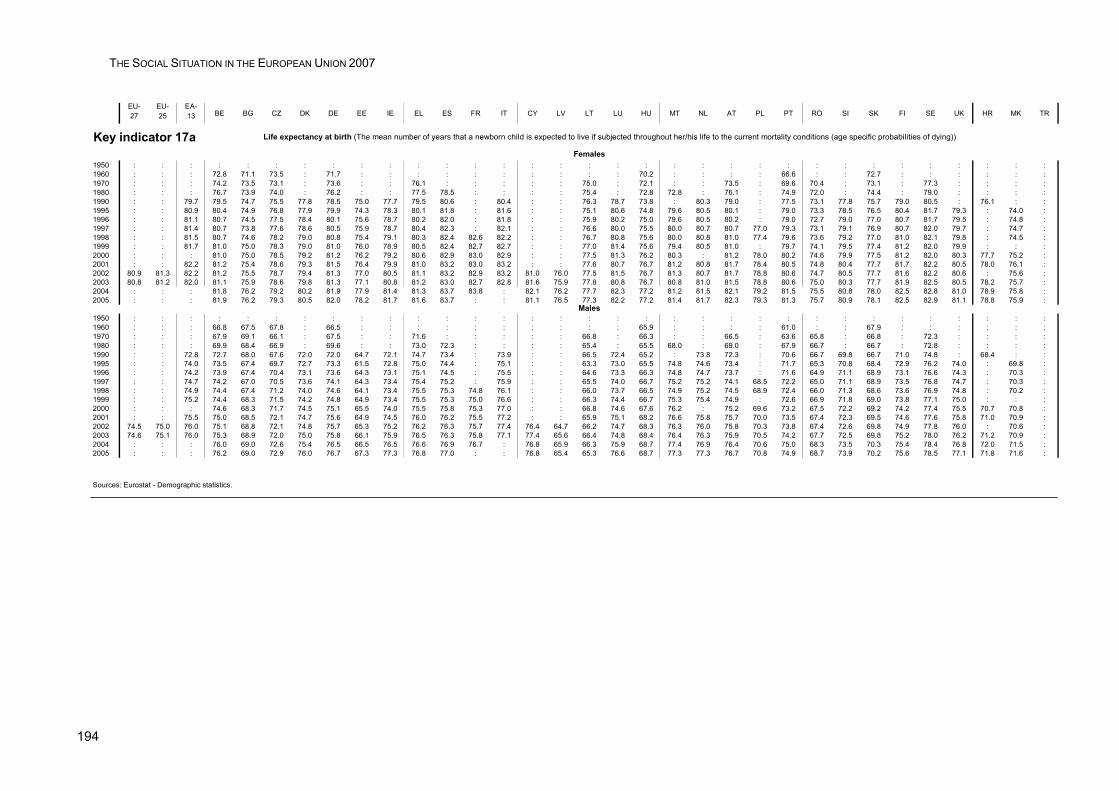
THE SOCIAL SITUATION IN THE EUROPEAN UNION 2007
194
EU-27
EU-25
EA-13 BE BG CZ DK DE EE IE EL ES FR IT CY LV LT LU HU MT NL AT PL PT RO SI SK FI SE UK HR MK TR
Key indicator 17a Life expectancy at birth (The mean number of years that a newborn child is expected to live if subjected throughout her/his life to the current mortality conditions (age specific probabilities of dying))
Females1950 : : : : : : : : : : : : : : : : : : : : : : : : : : : : : : : : :1960 : : : 72.8 71.1 73.5 : 71.7 : : : : : : : : : : 70.2 : : : : 66.6 : : 72.7 : : : : : :1970 : : : 74.2 73.5 73.1 : 73.6 : : 76.1 : : : : : 75.0 : 72.1 : : 73.5 : 69.6 70.4 : 73.1 : 77.3 : : : :1980 : : : 76.7 73.9 74.0 : 76.2 : : 77.5 78.5 : : : : 75.4 : 72.8 72.8 : 76.1 : 74.9 72.0 : 74.4 : 79.0 : : : :1990 : : 79.7 79.5 74.7 75.5 77.8 78.5 75.0 77.7 79.5 80.6 : 80.4 : : 76.3 78.7 73.8 : 80.3 79.0 : 77.5 73.1 77.8 75.7 79.0 80.5 : 76.1 : :1995 : : 80.9 80.4 74.9 76.8 77.9 79.9 74.3 78.3 80.1 81.8 : 81.6 : : 75.1 80.6 74.8 79.6 80.5 80.1 : 79.0 73.3 78.5 76.5 80.4 81.7 79.3 : 74.0 :1996 : : 81.1 80.7 74.5 77.5 78.4 80.1 75.6 78.7 80.2 82.0 : 81.8 : : 75.9 80.2 75.0 79.6 80.5 80.2 : 79.0 72.7 79.0 77.0 80.7 81.7 79.5 : 74.8 :1997 : : 81.4 80.7 73.8 77.6 78.6 80.5 75.9 78.7 80.4 82.3 : 82.1 : : 76.6 80.0 75.5 80.0 80.7 80.7 77.0 79.3 73.1 79.1 76.9 80.7 82.0 79.7 : 74.7 :1998 : : 81.5 80.7 74.6 78.2 79.0 80.8 75.4 79.1 80.3 82.4 82.6 82.2 : : 76.7 80.8 75.6 80.0 80.8 81.0 77.4 79.6 73.6 79.2 77.0 81.0 82.1 79.8 : 74.5 :1999 : : 81.7 81.0 75.0 78.3 79.0 81.0 76.0 78.9 80.5 82.4 82.7 82.7 : : 77.0 81.4 75.6 79.4 80.5 81.0 : 79.7 74.1 79.5 77.4 81.2 82.0 79.9 : : :2000 : : : 81.0 75.0 78.5 79.2 81.2 76.2 79.2 80.6 82.9 83.0 82.9 : : 77.5 81.3 76.2 80.3 : 81.2 78.0 80.2 74.6 79.9 77.5 81.2 82.0 80.3 77.7 75.2 :2001 : : 82.2 81.2 75.4 78.6 79.3 81.5 76.4 79.9 81.0 83.2 83.0 83.2 : : 77.6 80.7 76.7 81.2 80.8 81.7 78.4 80.5 74.8 80.4 77.7 81.7 82.2 80.5 78.0 76.1 :2002 80.9 81.3 82.2 81.2 75.5 78.7 79.4 81.3 77.0 80.5 81.1 83.2 82.9 83.2 81.0 76.0 77.5 81.5 76.7 81.3 80.7 81.7 78.8 80.6 74.7 80.5 77.7 81.6 82.2 80.6 : 75.6 :2003 80.8 81.2 82.0 81.1 75.9 78.6 79.8 81.3 77.1 80.8 81.2 83.0 82.7 82.8 81.6 75.9 77.8 80.8 76.7 80.8 81.0 81.5 78.8 80.6 75.0 80.3 77.7 81.9 82.5 80.5 78.2 75.7 :2004 : : : 81.8 76.2 79.2 80.2 81.9 77.9 81.4 81.3 83.7 83.8 : 82.1 76.2 77.7 82.3 77.2 81.2 81.5 82.1 79.2 81.5 75.5 80.8 78.0 82.5 82.8 81.0 78.9 75.8 :2005 : : : 81.9 76.2 79.3 80.5 82.0 78.2 81.7 81.6 83.7 : : 81.1 76.5 77.3 82.2 77.2 81.4 81.7 82.3 79.3 81.3 75.7 80.9 78.1 82.5 82.9 81.1 78.8 75.9 :
Males1950 : : : : : : : : : : : : : : : : : : : : : : : : : : : : : : : : :1960 : : : 66.8 67.5 67.8 : 66.5 : : : : : : : : : : 65.9 : : : : 61.0 : : 67.9 : : : : : :1970 : : : 67.9 69.1 66.1 : 67.5 : : 71.6 : : : : : 66.8 : 66.3 : : 66.5 : 63.6 65.8 : 66.8 : 72.3 : : : :1980 : : : 69.9 68.4 66.9 : 69.6 : : 73.0 72.3 : : : : 65.4 : 65.5 68.0 : 69.0 : 67.9 66.7 : 66.7 : 72.8 : : : :1990 : : 72.8 72.7 68.0 67.6 72.0 72.0 64.7 72.1 74.7 73.4 : 73.9 : : 66.5 72.4 65.2 : 73.8 72.3 : 70.6 66.7 69.8 66.7 71.0 74.8 : 68.4 : :1995 : : 74.0 73.5 67.4 69.7 72.7 73.3 61.5 72.8 75.0 74.4 : 75.1 : : 63.3 73.0 65.5 74.8 74.6 73.4 : 71.7 65.3 70.8 68.4 72.9 76.2 74.0 : 69.8 :1996 : : 74.2 73.9 67.4 70.4 73.1 73.6 64.3 73.1 75.1 74.5 : 75.5 : : 64.6 73.3 66.3 74.8 74.7 73.7 : 71.6 64.9 71.1 68.9 73.1 76.6 74.3 : 70.3 :1997 : : 74.7 74.2 67.0 70.5 73.6 74.1 64.3 73.4 75.4 75.2 : 75.9 : : 65.5 74.0 66.7 75.2 75.2 74.1 68.5 72.2 65.0 71.1 68.9 73.5 76.8 74.7 : 70.3 :1998 : : 74.9 74.4 67.4 71.2 74.0 74.6 64.1 73.4 75.5 75.3 74.8 76.1 : : 66.0 73.7 66.5 74.9 75.2 74.5 68.9 72.4 66.0 71.3 68.6 73.6 76.9 74.8 : 70.2 :1999 : : 75.2 74.4 68.3 71.5 74.2 74.8 64.9 73.4 75.5 75.3 75.0 76.6 : : 66.3 74.4 66.7 75.3 75.4 74.9 : 72.6 66.9 71.8 69.0 73.8 77.1 75.0 : : :2000 : : : 74.6 68.3 71.7 74.5 75.1 65.5 74.0 75.5 75.8 75.3 77.0 : : 66.8 74.6 67.6 76.2 : 75.2 69.6 73.2 67.5 72.2 69.2 74.2 77.4 75.5 70.7 70.8 :2001 : : 75.5 75.0 68.5 72.1 74.7 75.6 64.9 74.5 76.0 76.2 75.5 77.2 : : 65.9 75.1 68.2 76.6 75.8 75.7 70.0 73.5 67.4 72.3 69.5 74.6 77.6 75.8 71.0 70.9 :2002 74.5 75.0 76.0 75.1 68.8 72.1 74.8 75.7 65.3 75.2 76.2 76.3 75.7 77.4 76.4 64.7 66.2 74.7 68.3 76.3 76.0 75.8 70.3 73.8 67.4 72.6 69.8 74.9 77.8 76.0 : 70.6 :2003 74.6 75.1 76.0 75.3 68.9 72.0 75.0 75.8 66.1 75.9 76.5 76.3 75.8 77.1 77.4 65.6 66.4 74.8 68.4 76.4 76.3 75.9 70.5 74.2 67.7 72.5 69.8 75.2 78.0 76.2 71.2 70.9 :2004 : : : 76.0 69.0 72.6 75.4 76.5 66.5 76.5 76.6 76.9 76.7 : 76.8 65.9 66.3 75.9 68.7 77.4 76.9 76.4 70.6 75.0 68.3 73.5 70.3 75.4 78.4 76.8 72.0 71.5 :2005 : : : 76.2 69.0 72.9 76.0 76.7 67.3 77.3 76.8 77.0 : : 76.8 65.4 65.3 76.6 68.7 77.3 77.3 76.7 70.8 74.9 68.7 73.9 70.2 75.6 78.5 77.1 71.8 71.6 :
Sources: Eurostat - Demographic statistics.
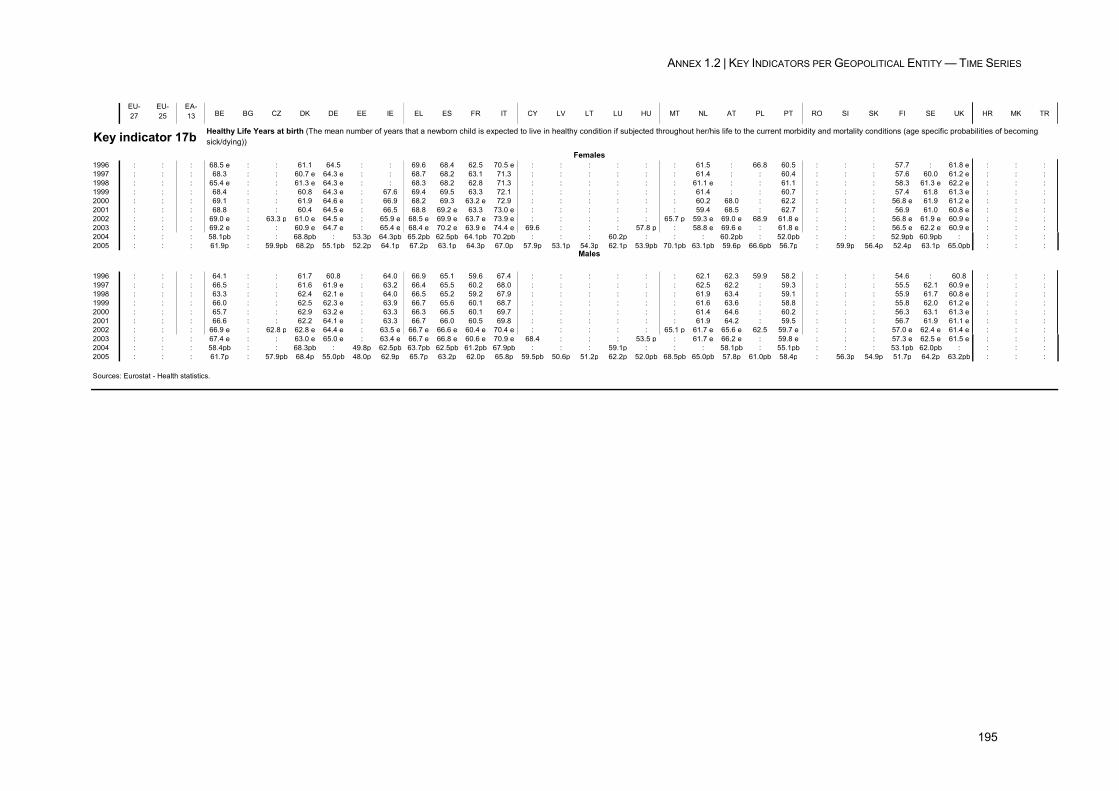
ANNEX 1.2 | KEY INDICATORS PER GEOPOLITICAL ENTITY — TIME SERIES
195
EU-27
EU-25
EA-13 BE BG CZ DK DE EE IE EL ES FR IT CY LV LT LU HU MT NL AT PL PT RO SI SK FI SE UK HR MK TR
Key indicator 17bFemales
1996 : : : 68.5 e : : 61.1 64.5 : : 69.6 68.4 62.5 70.5 e : : : : : : 61.5 : 66.8 60.5 : : : 57.7 : 61.8 e : : :1997 : : : 68.3 : : 60.7 e 64.3 e : : 68.7 68.2 63.1 71.3 : : : : : : 61.4 : : 60.4 : : : 57.6 60.0 61.2 e : : :1998 : : : 65.4 e : : 61.3 e 64.3 e : : 68.3 68.2 62.8 71.3 : : : : : : 61.1 e : : 61.1 : : : 58.3 61.3 e 62.2 e : : :1999 : : : 68.4 : : 60.8 64.3 e : 67.6 69.4 69.5 63.3 72.1 : : : : : : 61.4 : : 60.7 : : : 57.4 61.8 61.3 e : : :2000 : : : 69.1 : : 61.9 64.6 e : 66.9 68.2 69.3 63.2 e 72.9 : : : : : : 60.2 68.0 : 62.2 : : : 56.8 e 61.9 61.2 e : : :2001 : : : 68.8 : : 60.4 64.5 e : 66.5 68.8 69.2 e 63.3 73.0 e : : : : : : 59.4 68.5 : 62.7 : : : 56.9 61.0 60.8 e : : :2002 : : : 69.0 e : 63.3 p 61.0 e 64.5 e : 65.9 e 68.5 e 69.9 e 63.7 e 73.9 e : : : : : 65.7 p 59.3 e 69.0 e 68.9 61.8 e : : : 56.8 e 61.9 e 60.9 e : : :2003 : : : 69.2 e : : 60.9 e 64.7 e : 65.4 e 68.4 e 70.2 e 63.9 e 74.4 e 69.6 : : : 57.8 p : 58.8 e 69.6 e : 61.8 e : : : 56.5 e 62.2 e 60.9 e : : :2004 : : : 58.1pb : : 68.8pb : 53.3p 64.3pb 65.2pb 62.5pb 64.1pb 70.2pb : : : 60.2p : : : 60.2pb : 52.0pb : : : 52.9pb 60.9pb : : : :2005 : : : 61.9p : 59.9pb 68.2p 55.1pb 52.2p 64.1p 67.2p 63.1p 64.3p 67.0p 57.9p 53.1p 54.3p 62.1p 53.9pb 70.1pb 63.1pb 59.6p 66.6pb 56.7p : 59.9p 56.4p 52.4p 63.1p 65.0pb : : :
Males
1996 : : : 64.1 : : 61.7 60.8 : 64.0 66.9 65.1 59.6 67.4 : : : : : : 62.1 62.3 59.9 58.2 : : : 54.6 : 60.8 : : :1997 : : : 66.5 : : 61.6 61.9 e : 63.2 66.4 65.5 60.2 68.0 : : : : : : 62.5 62.2 : 59.3 : : : 55.5 62.1 60.9 e : : :1998 : : : 63.3 : : 62.4 62.1 e : 64.0 66.5 65.2 59.2 67.9 : : : : : : 61.9 63.4 : 59.1 : : : 55.9 61.7 60.8 e : : :1999 : : : 66.0 : : 62.5 62.3 e : 63.9 66.7 65.6 60.1 68.7 : : : : : : 61.6 63.6 : 58.8 : : : 55.8 62.0 61.2 e : : :2000 : : : 65.7 : : 62.9 63.2 e : 63.3 66.3 66.5 60.1 69.7 : : : : : : 61.4 64.6 : 60.2 : : : 56.3 63.1 61.3 e : : :2001 : : : 66.6 : : 62.2 64.1 e : 63.3 66.7 66.0 60.5 69.8 : : : : : : 61.9 64.2 : 59.5 : : : 56.7 61.9 61.1 e : : :2002 : : : 66.9 e : 62.8 p 62.8 e 64.4 e : 63.5 e 66.7 e 66.6 e 60.4 e 70.4 e : : : : : 65.1 p 61.7 e 65.6 e 62.5 59.7 e : : : 57.0 e 62.4 e 61.4 e : : :2003 : : : 67.4 e : : 63.0 e 65.0 e : 63.4 e 66.7 e 66.8 e 60.6 e 70.9 e 68.4 : : : 53.5 p : 61.7 e 66.2 e : 59.8 e : : : 57.3 e 62.5 e 61.5 e : : :2004 : : : 58.4pb : : 68.3pb : 49.8p 62.5pb 63.7pb 62.5pb 61.2pb 67.9pb : : : 59.1p : : : 58.1pb : 55.1pb : : : 53.1pb 62.0pb : : : :2005 : : : 61.7p : 57.9pb 68.4p 55.0pb 48.0p 62.9p 65.7p 63.2p 62.0p 65.8p 59.5pb 50.6p 51.2p 62.2p 52.0pb 68.5pb 65.0pb 57.8p 61.0pb 58.4p : 56.3p 54.9p 51.7p 64.2p 63.2pb : : :
Sources: Eurostat - Health statistics.
Healthy Life Years at birth (The mean number of years that a newborn child is expected to live in healthy condition if subjected throughout her/his life to the current morbidity and mortality conditions (age specific probabilities of becoming sick/dying))
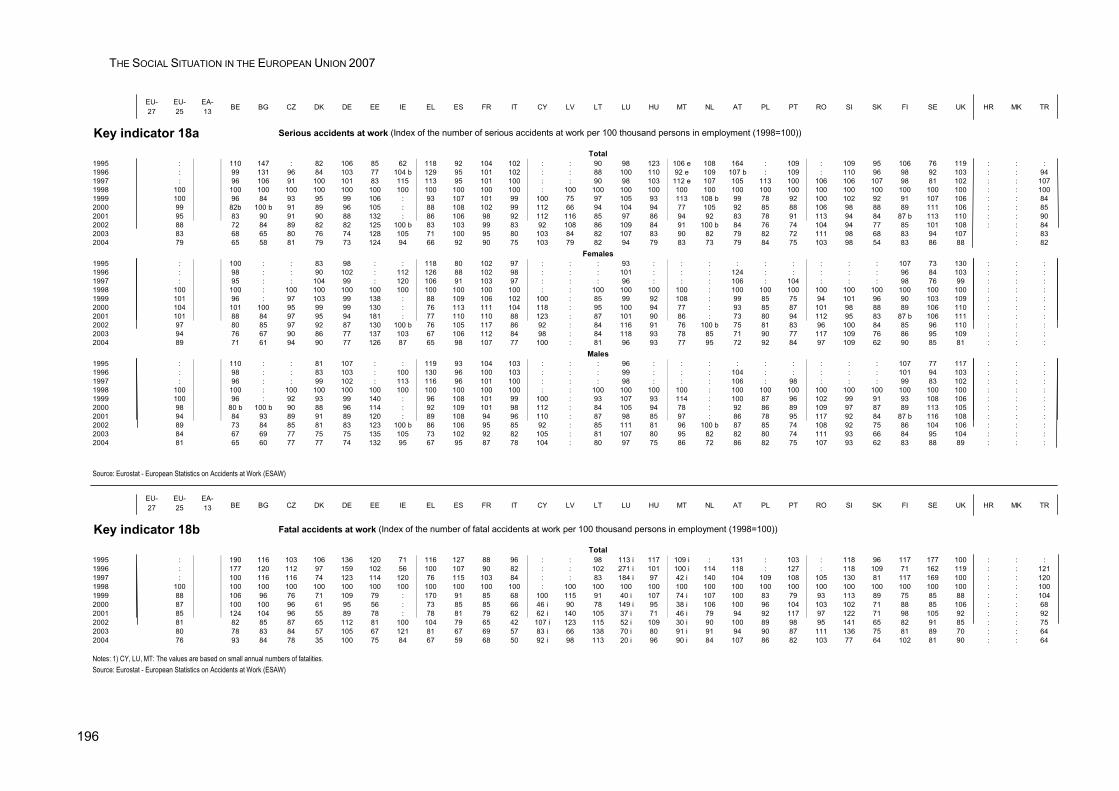
THE SOCIAL SITUATION IN THE EUROPEAN UNION 2007
196
EU-27
EU-25
EA-13 BE BG CZ DK DE EE IE EL ES FR IT CY LV LT LU HU MT NL AT PL PT RO SI SK FI SE UK HR MK TR
Key indicator 18a Serious accidents at work (Index of the number of serious accidents at work per 100 thousand persons in employment (1998=100))
Total1995 : 110 147 : 82 106 85 62 118 92 104 102 : : 90 98 123 106 e 108 164 : 109 : 109 95 106 76 119 : : :1996 : 99 131 96 84 103 77 104 b 129 95 101 102 : : 88 100 110 92 e 109 107 b : 109 : 110 96 98 92 103 : : 941997 : 96 106 91 100 101 83 115 113 95 101 100 : : 90 98 103 112 e 107 105 113 100 106 106 107 98 81 102 : : 1071998 100 100 100 100 100 100 100 100 100 100 100 100 : 100 100 100 100 100 100 100 100 100 100 100 100 100 100 100 : : 1001999 100 96 84 93 95 99 106 : 93 107 101 99 100 75 97 105 93 113 108 b 99 78 92 100 102 92 91 107 106 : : 842000 99 82b 100 b 91 89 96 105 : 88 108 102 99 112 66 94 104 94 77 105 92 85 88 106 98 88 89 111 106 : : 852001 95 83 90 91 90 88 132 : 86 106 98 92 112 116 85 97 86 94 92 83 78 91 113 94 84 87 b 113 110 : : 902002 88 72 84 89 82 82 125 100 b 83 103 99 83 92 108 86 109 84 91 100 b 84 76 74 104 94 77 85 101 108 : : 842003 83 68 65 80 76 74 128 105 71 100 95 80 103 84 82 107 83 90 82 79 82 72 111 98 68 83 94 107 : 832004 79 65 58 81 79 73 124 94 66 92 90 75 103 79 82 94 79 83 73 79 84 75 103 98 54 83 86 88 : 82
Females1995 : 100 : : 83 98 : : 118 80 102 97 : : : 93 : : : : : : : : : 107 73 130 : : :1996 : 98 : : 90 102 : 112 126 88 102 98 : : : 101 : : : 124 : : : : : 96 84 103 : : :1997 : 95 : : 104 99 : 120 106 91 103 97 : : : 96 : : : 106 : 104 : : : 98 76 99 : : :1998 100 100 : 100 100 100 100 100 100 100 100 100 : : 100 100 100 100 : 100 100 100 100 100 100 100 100 100 : : :1999 101 96 : 97 103 99 138 : 88 109 106 102 100 : 85 99 92 108 : 99 85 75 94 101 96 90 103 109 : : :2000 104 101 100 95 99 99 130 : 76 113 111 104 118 : 95 100 94 77 : 93 85 87 101 98 88 89 106 110 : : :2001 101 88 84 97 95 94 181 : 77 110 110 88 123 : 87 101 90 86 : 73 80 94 112 95 83 87 b 106 111 : : :2002 97 80 85 97 92 87 130 100 b 76 105 117 86 92 : 84 116 91 76 100 b 75 81 83 96 100 84 85 96 110 : : :2003 94 76 67 90 86 77 137 103 67 106 112 84 98 : 84 118 93 78 85 71 90 77 117 109 76 86 95 109 : : :2004 89 71 61 94 90 77 126 87 65 98 107 77 100 : 81 96 93 77 95 72 92 84 97 109 62 90 85 81 : : :
Males1995 : 110 : : 81 107 : : 119 93 104 103 : : : 96 : : : : : : : : : 107 77 117 : : :1996 : 98 : : 83 103 : 100 130 96 100 103 : : : 99 : : : 104 : : : : : 101 94 103 : : :1997 : 96 : : 99 102 : 113 116 96 101 100 : : : 98 : : : 106 : 98 : : : 99 83 102 : : :1998 100 100 : 100 100 100 100 100 100 100 100 100 : : 100 100 100 100 : 100 100 100 100 100 100 100 100 100 : : :1999 100 96 : 92 93 99 140 : 96 108 101 99 100 : 93 107 93 114 : 100 87 96 102 99 91 93 108 106 : : :2000 98 80 b 100 b 90 88 96 114 : 92 109 101 98 112 : 84 105 94 78 : 92 86 89 109 97 87 89 113 105 : : :2001 94 84 93 89 91 89 120 : 89 108 94 96 110 : 87 98 85 97 : 86 78 95 117 92 84 87 b 116 108 : : :2002 89 73 84 85 81 83 123 100 b 86 106 95 85 92 : 85 111 81 96 100 b 87 85 74 108 92 75 86 104 106 : : :2003 84 67 69 77 75 75 135 105 73 102 92 82 105 : 81 107 80 95 82 82 80 74 111 93 66 84 95 104 : : :2004 81 65 60 77 77 74 132 95 67 95 87 78 104 : 80 97 75 86 72 86 82 75 107 93 62 83 88 89 : : :
Source: Eurostat - European Statistics on Accidents at Work (ESAW)
EU-27
EU-25
EA-13 BE BG CZ DK DE EE IE EL ES FR IT CY LV LT LU HU MT NL AT PL PT RO SI SK FI SE UK HR MK TR
Key indicator 18b Fatal accidents at work (Index of the number of fatal accidents at work per 100 thousand persons in employment (1998=100))
Total1995 : 190 116 103 106 136 120 71 116 127 88 96 : : 98 113 i 117 109 i : 131 : 103 : 118 96 117 177 100 : : :1996 : 177 120 112 97 159 102 56 100 107 90 82 : : 102 271 i 101 100 i 114 118 : 127 : 118 109 71 162 119 : : 1211997 : 100 116 116 74 123 114 120 76 115 103 84 : : 83 184 i 97 42 i 140 104 109 108 105 130 81 117 169 100 : : 1201998 100 100 100 100 100 100 100 100 100 100 100 100 : 100 100 100 100 100 100 100 100 100 100 100 100 100 100 100 : : 1001999 88 106 96 76 71 109 79 : 170 91 85 68 100 115 91 40 i 107 74 i 107 100 83 79 93 113 89 75 85 88 : : 1042000 87 100 100 96 61 95 56 : 73 85 85 66 46 i 90 78 149 i 95 38 i 106 100 96 104 103 102 71 88 85 106 : : 682001 85 124 104 96 55 89 78 : 78 81 79 62 62 i 140 105 37 i 71 46 i 79 94 92 117 97 122 71 98 105 92 : : 922002 81 82 85 87 65 112 81 100 104 79 65 42 107 i 123 115 52 i 109 30 i 90 100 89 98 95 141 65 82 91 85 : : 752003 80 78 83 84 57 105 67 121 81 67 69 57 83 i 66 138 70 i 80 91 i 91 94 90 87 111 136 75 81 89 70 : : 642004 76 93 84 78 35 100 75 84 67 59 68 50 92 i 98 113 20 i 96 90 i 84 107 86 82 103 77 64 102 81 90 : : 64
Notes: 1) CY, LU, MT: The values are based on small annual numbers of fatalities. Source: Eurostat - European Statistics on Accidents at Work (ESAW)
ANNEX 1.3 | OTHER STATISTICAL TABLES PER GEOPOLITICAL ENTITY
197
Annex 1.3
Other Statistical Tables
per Geopolitical Entity
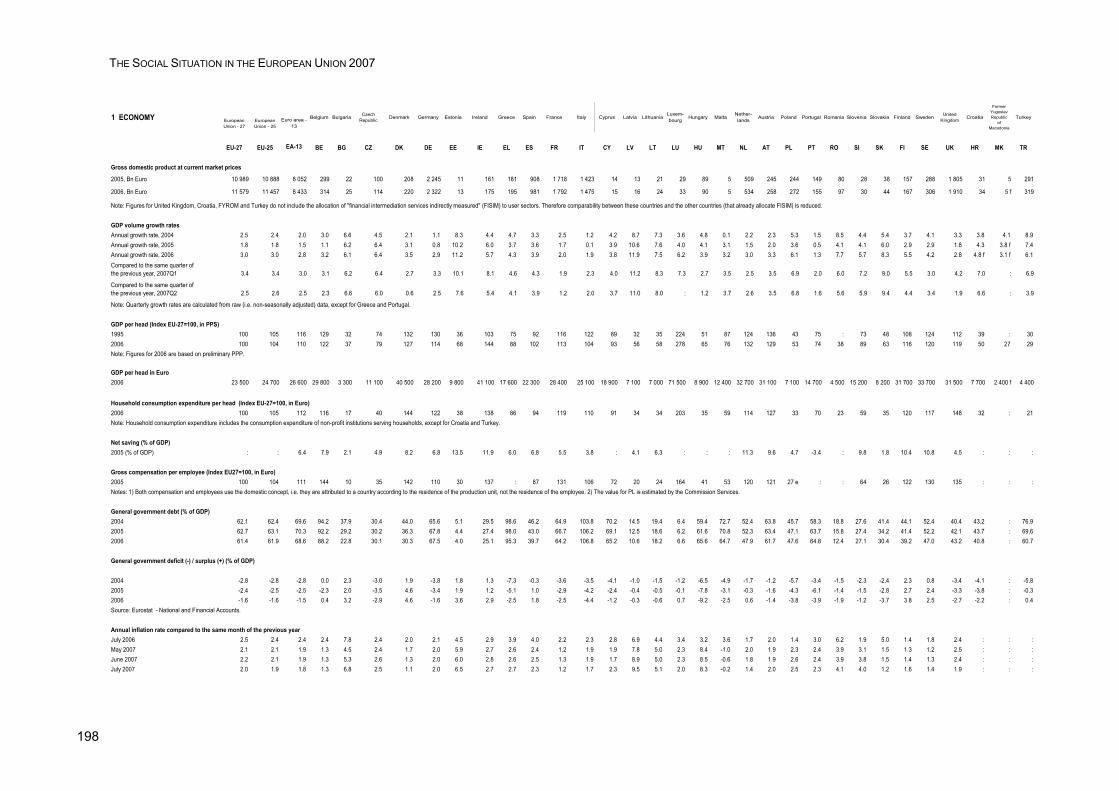
THE SOCIAL SITUATION IN THE EUROPEAN UNION 2007
198
1 ECONOMY EuropeanUnion - 27
EuropeanUnion - 25
Euro area -13
Belgium Bulgaria Czech Republic Denmark Germany Estonia Ireland Greece Spain France Italy Cyprus Latvia Lithuania
Luxem-bourg Hungary Malta
Nether-lands Austria Poland Portugal Romania Slovenia Slovakia Finland Sweden United
Kingdom Croatia
FormerYugoslav Republic
of Macedonia
Turkey
EU-27 EU-25 EA-13 BE BG CZ DK DE EE IE EL ES FR IT CY LV LT LU HU MT NL AT PL PT RO SI SK FI SE UK HR MK TR
Gross domestic product at current market prices
2005, Bn Euro 10 989 10 888 8 052 299 22 100 208 2 245 11 161 181 908 1 718 1 423 14 13 21 29 89 5 509 245 244 149 80 28 38 157 288 1 805 31 5 291
2006, Bn Euro 11 579 11 457 8 433 314 25 114 220 2 322 13 175 195 981 1 792 1 475 15 16 24 33 90 5 534 258 272 155 97 30 44 167 306 1 910 34 5 f 319
Note: Figures for United Kingdom, Croatia, FYROM and Turkey do not include the allocation of "financial intermediation services indirectly measured" (FISIM) to user sectors. Therefore comparability between these countries and the other countries (that already allocate FISIM) is reduced.
GDP volume growth ratesAnnual growth rate, 2004 2.5 2.4 2.0 3.0 6.6 4.5 2.1 1.1 8.3 4.4 4.7 3.3 2.5 1.2 4.2 8.7 7.3 3.6 4.8 0.1 2.2 2.3 5.3 1.5 8.5 4.4 5.4 3.7 4.1 3.3 3.8 4.1 8.9Annual growth rate, 2005 1.8 1.8 1.5 1.1 6.2 6.4 3.1 0.8 10.2 6.0 3.7 3.6 1.7 0.1 3.9 10.6 7.6 4.0 4.1 3.1 1.5 2.0 3.6 0.5 4.1 4.1 6.0 2.9 2.9 1.8 4.3 3.8 f 7.4Annual growth rate, 2006 3.0 3.0 2.8 3.2 6.1 6.4 3.5 2.9 11.2 5.7 4.3 3.9 2.0 1.9 3.8 11.9 7.5 6.2 3.9 3.2 3.0 3.3 6.1 1.3 7.7 5.7 8.3 5.5 4.2 2.8 4.8 f 3.1 f 6.1Compared to the same quarter of the previous year, 2007Q1 3.4 3.4 3.0 3.1 6.2 6.4 2.7 3.3 10.1 8.1 4.6 4.3 1.9 2.3 4.0 11.2 8.3 7.3 2.7 3.5 2.5 3.5 6.9 2.0 6.0 7.2 9.0 5.5 3.0 4.2 7.0 : 6.9
Compared to the same quarter of the previous year, 2007Q2 2.5 2.6 2.5 2.3 6.6 6.0 0.6 2.5 7.6 5.4 4.1 3.9 1.2 2.0 3.7 11.0 8.0 : 1.2 3.7 2.6 3.5 6.8 1.6 5.6 5.9 9.4 4.4 3.4 1.9 6.6 : 3.9
Note: Quarterly growth rates are calculated from raw (i.e. non-seasonally adjusted) data, except for Greece and Portugal.
GDP per head (Index EU-27=100, in PPS)1995 100 105 116 129 32 74 132 130 36 103 75 92 116 122 89 32 35 224 51 87 124 136 43 75 : 73 48 108 124 112 39 : 302006 100 104 110 122 37 79 127 114 68 144 88 102 113 104 93 56 58 278 65 76 132 129 53 74 38 89 63 116 120 119 50 27 29Note: Figures for 2006 are based on preliminary PPP.
GDP per head in Euro2006 23 500 24 700 26 600 29 800 3 300 11 100 40 500 28 200 9 800 41 100 17 600 22 300 28 400 25 100 18 900 7 100 7 000 71 500 8 900 12 400 32 700 31 100 7 100 14 700 4 500 15 200 8 200 31 700 33 700 31 500 7 700 2 400 f 4 400
Household consumption expenditure per head (Index EU-27=100, in Euro)2006 100 105 112 116 17 40 144 122 38 138 86 94 119 110 91 34 34 203 35 59 114 127 33 70 23 59 35 120 117 148 32 : 21Note: Household consumption expenditure includes the consumption expenditure of non-profit institutions serving households, except for Croatia and Turkey.
Net saving (% of GDP)2005 (% of GDP) : : 6.4 7.9 2.1 4.9 8.2 6.8 13.5 11.9 6.0 6.8 5.5 3.8 : 4.1 6.3 : : : 11.3 9.6 4.7 -3.4 : 9.8 1.8 10.4 10.8 4.5 : : :
Gross compensation per employee (Index EU27=100, in Euro)2005 100 104 111 144 10 35 142 110 30 137 : 87 131 106 72 20 24 164 41 53 120 121 27 e : : 64 26 122 130 135 : : :Notes: 1) Both compensation and employees use the domestic concept, i.e. they are attributed to a country according to the residence of the production unit, not the residence of the employee. 2) The value for PL is estimated by the Commission Services.
General government debt (% of GDP)2004 62.1 62.4 69.6 94.2 37.9 30.4 44.0 65.6 5.1 29.5 98.6 46.2 64.9 103.8 70.2 14.5 19.4 6.4 59.4 72.7 52.4 63.8 45.7 58.3 18.8 27.6 41.4 44.1 52.4 40.4 43.2 : 76.92005 62.7 63.1 70.3 92.2 29.2 30.2 36.3 67.8 4.4 27.4 98.0 43.0 66.7 106.2 69.1 12.5 18.6 6.2 61.6 70.8 52.3 63.4 47.1 63.7 15.8 27.4 34.2 41.4 52.2 42.1 43.7 : 69.62006 61.4 61.9 68.6 88.2 22.8 30.1 30.3 67.5 4.0 25.1 95.3 39.7 64.2 106.8 65.2 10.6 18.2 6.6 65.6 64.7 47.9 61.7 47.6 64.8 12.4 27.1 30.4 39.2 47.0 43.2 40.8 : 60.7
General government deficit (-) / surplus (+) (% of GDP)
2004 -2.8 -2.8 -2.8 0.0 2.3 -3.0 1.9 -3.8 1.8 1.3 -7.3 -0.3 -3.6 -3.5 -4.1 -1.0 -1.5 -1.2 -6.5 -4.9 -1.7 -1.2 -5.7 -3.4 -1.5 -2.3 -2.4 2.3 0.8 -3.4 -4.1 : -5.82005 -2.4 -2.5 -2.5 -2.3 2.0 -3.5 4.6 -3.4 1.9 1.2 -5.1 1.0 -2.9 -4.2 -2.4 -0.4 -0.5 -0.1 -7.8 -3.1 -0.3 -1.6 -4.3 -6.1 -1.4 -1.5 -2.8 2.7 2.4 -3.3 -3.8 : -0.32006 -1.6 -1.6 -1.5 0.4 3.2 -2.9 4.6 -1.6 3.6 2.9 -2.5 1.8 -2.5 -4.4 -1.2 -0.3 -0.6 0.7 -9.2 -2.5 0.6 -1.4 -3.8 -3.9 -1.9 -1.2 -3.7 3.8 2.5 -2.7 -2.2 : 0.4Source: Eurostat - National and Financial Accounts.
Annual inflation rate compared to the same month of the previous yearJuly 2006 2.5 2.4 2.4 2.4 7.8 2.4 2.0 2.1 4.5 2.9 3.9 4.0 2.2 2.3 2.8 6.9 4.4 3.4 3.2 3.6 1.7 2.0 1.4 3.0 6.2 1.9 5.0 1.4 1.8 2.4 : : :May 2007 2.1 2.1 1.9 1.3 4.5 2.4 1.7 2.0 5.9 2.7 2.6 2.4 1.2 1.9 1.9 7.8 5.0 2.3 8.4 -1.0 2.0 1.9 2.3 2.4 3.9 3.1 1.5 1.3 1.2 2.5 : : :June 2007 2.2 2.1 1.9 1.3 5.3 2.6 1.3 2.0 6.0 2.8 2.6 2.5 1.3 1.9 1.7 8.9 5.0 2.3 8.5 -0.6 1.8 1.9 2.6 2.4 3.9 3.8 1.5 1.4 1.3 2.4 : : :July 2007 2.0 1.9 1.8 1.3 6.8 2.5 1.1 2.0 6.5 2.7 2.7 2.3 1.2 1.7 2.3 9.5 5.1 2.0 8.3 -0.2 1.4 2.0 2.5 2.3 4.1 4.0 1.2 1.6 1.4 1.9 : : :
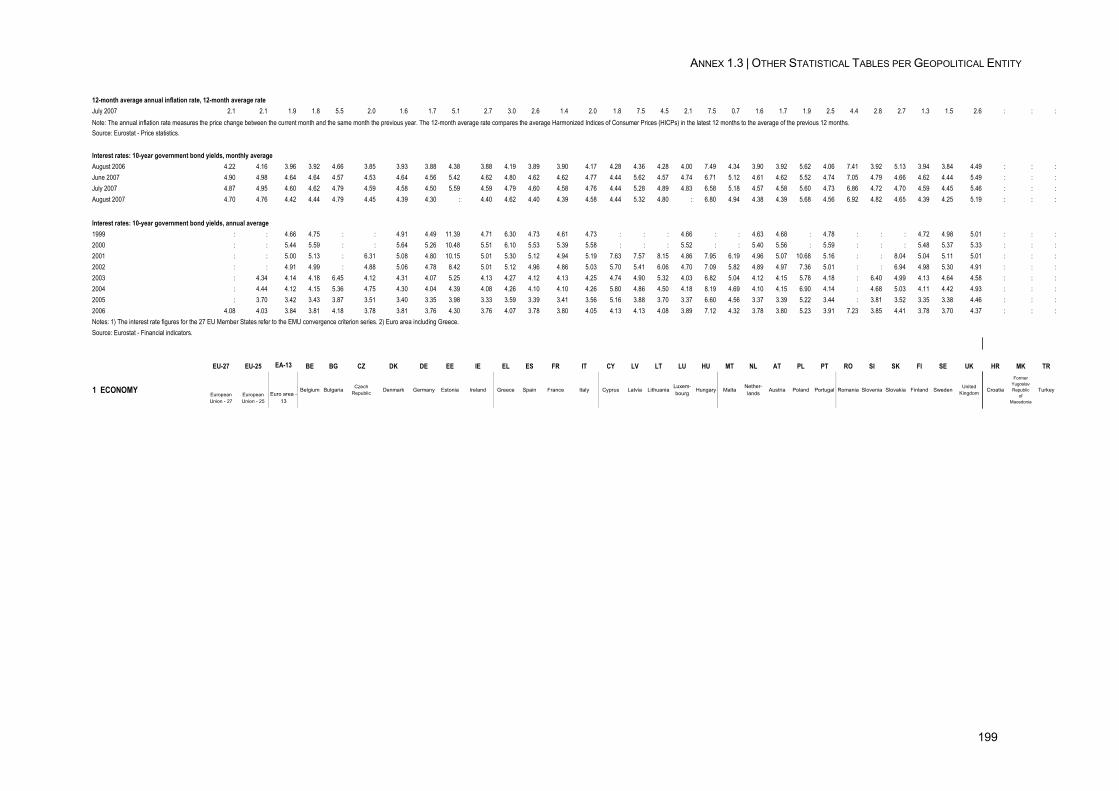
ANNEX 1.3 | OTHER STATISTICAL TABLES PER GEOPOLITICAL ENTITY
199
12-month average annual inflation rate, 12-month average rateJuly 2007 2.1 2.1 1.9 1.8 5.5 2.0 1.6 1.7 5.1 2.7 3.0 2.6 1.4 2.0 1.8 7.5 4.5 2.1 7.5 0.7 1.6 1.7 1.9 2.5 4.4 2.8 2.7 1.3 1.5 2.6 : : :Note: The annual inflation rate measures the price change between the current month and the same month the previous year. The 12-month average rate compares the average Harmonized Indices of Consumer Prices (HICPs) in the latest 12 months to the average of the previous 12 months. Source: Eurostat - Price statistics.
Interest rates: 10-year government bond yields, monthly averageAugust 2006 4.22 4.16 3.96 3.92 4.66 3.85 3.93 3.88 4.38 3.88 4.19 3.89 3.90 4.17 4.28 4.36 4.28 4.00 7.49 4.34 3.90 3.92 5.62 4.06 7.41 3.92 5.13 3.94 3.84 4.49 : : :June 2007 4.90 4.98 4.64 4.64 4.57 4.53 4.64 4.56 5.42 4.62 4.80 4.62 4.62 4.77 4.44 5.62 4.57 4.74 6.71 5.12 4.61 4.62 5.52 4.74 7.05 4.79 4.66 4.62 4.44 5.49 : : :July 2007 4.87 4.95 4.60 4.62 4.79 4.59 4.58 4.50 5.59 4.59 4.79 4.60 4.58 4.76 4.44 5.28 4.89 4.83 6.58 5.18 4.57 4.58 5.60 4.73 6.86 4.72 4.70 4.59 4.45 5.46 : : :August 2007 4.70 4.76 4.42 4.44 4.79 4.45 4.39 4.30 : 4.40 4.62 4.40 4.39 4.58 4.44 5.32 4.80 : 6.80 4.94 4.38 4.39 5.68 4.56 6.92 4.82 4.65 4.39 4.25 5.19 : : :
Interest rates: 10-year government bond yields, annual average1999 : : 4.66 4.75 : : 4.91 4.49 11.39 4.71 6.30 4.73 4.61 4.73 : : : 4.66 : : 4.63 4.68 : 4.78 : : : 4.72 4.98 5.01 : : :2000 : : 5.44 5.59 : : 5.64 5.26 10.48 5.51 6.10 5.53 5.39 5.58 : : : 5.52 : : 5.40 5.56 : 5.59 : : : 5.48 5.37 5.33 : : :2001 : : 5.00 5.13 : 6.31 5.08 4.80 10.15 5.01 5.30 5.12 4.94 5.19 7.63 7.57 8.15 4.86 7.95 6.19 4.96 5.07 10.68 5.16 : : 8.04 5.04 5.11 5.01 : : :2002 : : 4.91 4.99 : 4.88 5.06 4.78 8.42 5.01 5.12 4.96 4.86 5.03 5.70 5.41 6.06 4.70 7.09 5.82 4.89 4.97 7.36 5.01 : : 6.94 4.98 5.30 4.91 : : :2003 : 4.34 4.14 4.18 6.45 4.12 4.31 4.07 5.25 4.13 4.27 4.12 4.13 4.25 4.74 4.90 5.32 4.03 6.82 5.04 4.12 4.15 5.78 4.18 : 6.40 4.99 4.13 4.64 4.58 : : :2004 : 4.44 4.12 4.15 5.36 4.75 4.30 4.04 4.39 4.08 4.26 4.10 4.10 4.26 5.80 4.86 4.50 4.18 8.19 4.69 4.10 4.15 6.90 4.14 : 4.68 5.03 4.11 4.42 4.93 : : :2005 : 3.70 3.42 3.43 3.87 3.51 3.40 3.35 3.98 3.33 3.59 3.39 3.41 3.56 5.16 3.88 3.70 3.37 6.60 4.56 3.37 3.39 5.22 3.44 : 3.81 3.52 3.35 3.38 4.46 : : :2006 4.08 4.03 3.84 3.81 4.18 3.78 3.81 3.76 4.30 3.76 4.07 3.78 3.80 4.05 4.13 4.13 4.08 3.89 7.12 4.32 3.78 3.80 5.23 3.91 7.23 3.85 4.41 3.78 3.70 4.37 : : :Notes: 1) The interest rate figures for the 27 EU Member States refer to the EMU convergence criterion series. 2) Euro area including Greece.Source: Eurostat - Financial indicators.
EU-27 EU-25 EA-13 BE BG CZ DK DE EE IE EL ES FR IT CY LV LT LU HU MT NL AT PL PT RO SI SK FI SE UK HR MK TR
1 ECONOMYEuropeanUnion - 27
EuropeanUnion - 25
Euro area -13
Belgium Bulgaria Czech Republic Denmark Germany Estonia Ireland Greece Spain France Italy Cyprus Latvia Lithuania
Luxem-bourg Hungary Malta
Nether-lands Austria Poland Portugal Romania Slovenia Slovakia Finland Sweden United
Kingdom Croatia
FormerYugoslav Republic
of Macedonia
Turkey
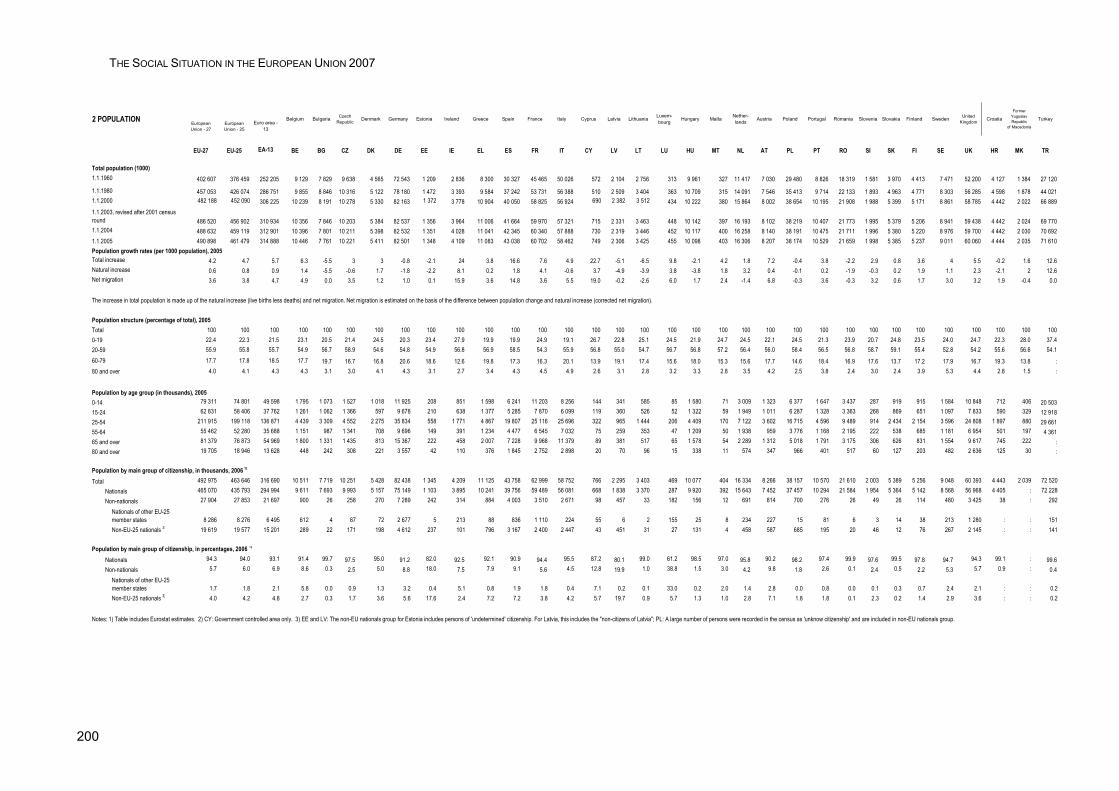
THE SOCIAL SITUATION IN THE EUROPEAN UNION 2007
200
2 POPULATIONEuropeanUnion - 27
EuropeanUnion - 25
Euro area - 13
Belgium Bulgaria Czech Republic
Denmark Germany Estonia Ireland Greece Spain France Italy Cyprus Latvia LithuaniaLuxem-bourg
Hungary MaltaNether-lands
Austria Poland Portugal Romania Slovenia Slovakia Finland Sweden United Kingdom
Croatia
FormerYugoslav Republic
of Macedonia
Turkey
EU-27 EU-25 EA-13 BE BG CZ DK DE EE IE EL ES FR IT CY LV LT LU HU MT NL AT PL PT RO SI SK FI SE UK HR MK TR
Total population (1000)1.1.1960 402 607 376 459 252 205 9 129 7 829 9 638 4 565 72 543 1 209 2 836 8 300 30 327 45 465 50 026 572 2 104 2 756 313 9 961 327 11 417 7 030 29 480 8 826 18 319 1 581 3 970 4 413 7 471 52 200 4 127 1 384 27 120
1.1.1980 457 053 426 074 286 751 9 855 8 846 10 316 5 122 78 180 1 472 3 393 9 584 37 242 53 731 56 388 510 2 509 3 404 363 10 709 315 14 091 7 546 35 413 9 714 22 133 1 893 4 963 4 771 8 303 56 285 4 598 1 878 44 0211.1.2000 482 188 452 090 306 225 10 239 8 191 10 278 5 330 82 163 1 372 3 778 10 904 40 050 58 825 56 924 690 2 382 3 512 434 10 222 380 15 864 8 002 38 654 10 195 21 908 1 988 5 399 5 171 8 861 58 785 4 442 2 022 66 8891.1.2003, revised after 2001 census round 486 520 456 902 310 934 10 356 7 846 10 203 5 384 82 537 1 356 3 964 11 006 41 664 59 970 57 321 715 2 331 3 463 448 10 142 397 16 193 8 102 38 219 10 407 21 773 1 995 5 379 5 206 8 941 59 438 4 442 2 024 69 7701.1.2004 488 632 459 119 312 901 10 396 7 801 10 211 5 398 82 532 1 351 4 028 11 041 42 345 60 340 57 888 730 2 319 3 446 452 10 117 400 16 258 8 140 38 191 10 475 21 711 1 996 5 380 5 220 8 976 59 700 4 442 2 030 70 6921.1.2005 490 898 461 479 314 888 10 446 7 761 10 221 5 411 82 501 1 348 4 109 11 083 43 038 60 702 58 462 749 2 306 3 425 455 10 098 403 16 306 8 207 38 174 10 529 21 659 1 998 5 385 5 237 9 011 60 060 4 444 2 035 71 610Population growth rates (per 1000 population), 2005Total increase 4.2 4.7 5.7 6.3 -5.5 3 3 -0.8 -2.1 24 3.8 16.6 7.6 4.9 22.7 -5.1 -6.5 9.8 -2.1 4.2 1.8 7.2 -0.4 3.8 -2.2 2.9 0.8 3.6 4 5.5 -0.2 1.6 12.6Natural increase 0.6 0.8 0.9 1.4 -5.5 -0.6 1.7 -1.8 -2.2 8.1 0.2 1.8 4.1 -0.6 3.7 -4.9 -3.9 3.8 -3.8 1.8 3.2 0.4 -0.1 0.2 -1.9 -0.3 0.2 1.9 1.1 2.3 -2.1 2 12.6Net migration 3.6 3.8 4.7 4.9 0.0 3.5 1.2 1.0 0.1 15.9 3.6 14.8 3.6 5.5 19.0 -0.2 -2.6 6.0 1.7 2.4 -1.4 6.8 -0.3 3.6 -0.3 3.2 0.6 1.7 3.0 3.2 1.9 -0.4 0.0
The increase in total population is made up of the natural increase (live births less deaths) and net migration. Net migration is estimated on the basis of the difference between population change and natural increase (corrected net migration).
Population structure (percentage of total), 2005Total 100 100 100 100 100 100 100 100 100 100 100 100 100 100 100 100 100 100 100 100 100 100 100 100 100 100 100 100 100 100 100 100 1000-19 22.4 22.3 21.5 23.1 20.5 21.4 24.5 20.3 23.4 27.9 19.9 19.9 24.9 19.1 26.7 22.8 25.1 24.5 21.9 24.7 24.5 22.1 24.5 21.3 23.9 20.7 24.8 23.5 24.0 24.7 22.3 28.0 37.420-59 55.9 55.8 55.7 54.9 56.7 58.9 54.6 54.8 54.9 56.8 56.9 58.5 54.3 55.9 56.8 55.0 54.7 56.7 56.8 57.2 56.4 56.0 58.4 56.5 56.8 58.7 59.1 55.4 52.8 54.2 55.6 56.6 54.160-79 17.7 17.8 18.5 17.7 19.7 16.7 16.8 20.6 18.6 12.6 19.8 17.3 16.3 20.1 13.9 19.1 17.4 15.6 18.0 15.3 15.6 17.7 14.6 18.4 16.9 17.6 13.7 17.2 17.9 16.7 19.3 13.8 :80 and over 4.0 4.1 4.3 4.3 3.1 3.0 4.1 4.3 3.1 2.7 3.4 4.3 4.5 4.9 2.6 3.1 2.8 3.2 3.3 2.8 3.5 4.2 2.5 3.8 2.4 3.0 2.4 3.9 5.3 4.4 2.8 1.5 :
Population by age group (in thousands), 20050-14 79 311 74 801 49 598 1 795 1 073 1 527 1 018 11 925 208 851 1 598 6 241 11 203 8 256 144 341 585 85 1 580 71 3 009 1 323 6 377 1 647 3 437 287 919 915 1 584 10 848 712 406 20 50315-24 62 831 58 406 37 762 1 261 1 062 1 366 597 9 678 210 638 1 377 5 285 7 870 6 099 119 360 526 52 1 322 59 1 949 1 011 6 287 1 328 3 363 268 869 651 1 097 7 833 590 329 12 91825-54 211 915 199 118 136 871 4 439 3 309 4 552 2 275 35 834 558 1 771 4 867 19 807 25 116 25 696 322 965 1 444 206 4 409 170 7 122 3 602 16 715 4 596 9 489 914 2 434 2 154 3 596 24 808 1 897 880 29 66155-64 55 462 52 280 35 688 1 151 987 1 341 708 9 696 149 391 1 234 4 477 6 545 7 032 75 259 353 47 1 209 50 1 938 959 3 776 1 168 2 195 222 538 685 1 181 6 954 501 197 4 36165 and over 81 379 76 873 54 969 1 800 1 331 1 435 813 15 367 222 458 2 007 7 228 9 968 11 379 89 381 517 65 1 578 54 2 289 1 312 5 018 1 791 3 175 306 626 831 1 554 9 617 745 222 :80 and over 19 705 18 946 13 628 448 242 308 221 3 557 42 110 376 1 845 2 752 2 898 20 70 96 15 338 11 574 347 966 401 517 60 127 203 482 2 636 125 30 :
Population by main group of citizenship, in thousands, 2006 1)
Total 492 975 463 646 316 690 10 511 7 719 10 251 5 428 82 438 1 345 4 209 11 125 43 758 62 999 58 752 766 2 295 3 403 469 10 077 404 16 334 8 266 38 157 10 570 21 610 2 003 5 389 5 256 9 048 60 393 4 443 2 039 72 520Nationals 465 070 435 793 294 994 9 611 7 693 9 993 5 157 75 149 1 103 3 895 10 241 39 756 59 489 56 081 668 1 838 3 370 287 9 920 392 15 643 7 452 37 457 10 294 21 584 1 954 5 364 5 142 8 568 56 968 4 405 : 72 228Non-nationals 27 904 27 853 21 697 900 26 258 270 7 289 242 314 884 4 003 3 510 2 671 98 457 33 182 156 12 691 814 700 276 26 49 26 114 480 3 425 38 : 292
Nationals of other EU-25 member states 8 286 8 276 6 495 612 4 87 72 2 677 5 213 88 836 1 110 224 55 6 2 155 25 8 234 227 15 81 6 3 14 38 213 1 280 : : 151Non-EU-25 nationals 3) 19 619 19 577 15 201 289 22 171 198 4 612 237 101 796 3 167 2 400 2 447 43 451 31 27 131 4 458 587 685 195 20 46 12 76 267 2 145 : : 141
Population by main group of citizenship, in percentages, 2006 1)
Nationals 94.3 94.0 93.1 91.4 99.7 97.5 95.0 91.2 82.0 92.5 92.1 90.9 94.4 95.5 87.2 80.1 99.0 61.2 98.5 97.0 95.8 90.2 98.2 97.4 99.9 97.6 99.5 97.8 94.7 94.3 99.1 : 99.6Non-nationals 5.7 6.0 6.9 8.6 0.3 2.5 5.0 8.8 18.0 7.5 7.9 9.1 5.6 4.5 12.8 19.9 1.0 38.8 1.5 3.0 4.2 9.8 1.8 2.6 0.1 2.4 0.5 2.2 5.3 5.7 0.9 : 0.4
Nationals of other EU-25 member states 1.7 1.8 2.1 5.8 0.0 0.9 1.3 3.2 0.4 5.1 0.8 1.9 1.8 0.4 7.1 0.2 0.1 33.0 0.2 2.0 1.4 2.8 0.0 0.8 0.0 0.1 0.3 0.7 2.4 2.1 : : 0.2Non-EU-25 nationals 3) 4.0 4.2 4.8 2.7 0.3 1.7 3.6 5.6 17.6 2.4 7.2 7.2 3.8 4.2 5.7 19.7 0.9 5.7 1.3 1.0 2.8 7.1 1.8 1.8 0.1 2.3 0.2 1.4 2.9 3.6 : : 0.2
Notes: 1) Table includes Eurostat estimates. 2) CY: Government controlled area only. 3) EE and LV: The non-EU nationals group for Estonia includes persons of 'undetermined' citizenship. For Latvia, this includes the "non-citizens of Latvia"; PL: A large number of persons were recorded in the census as 'unknow citizenship' and are included in non-EU nationals group.
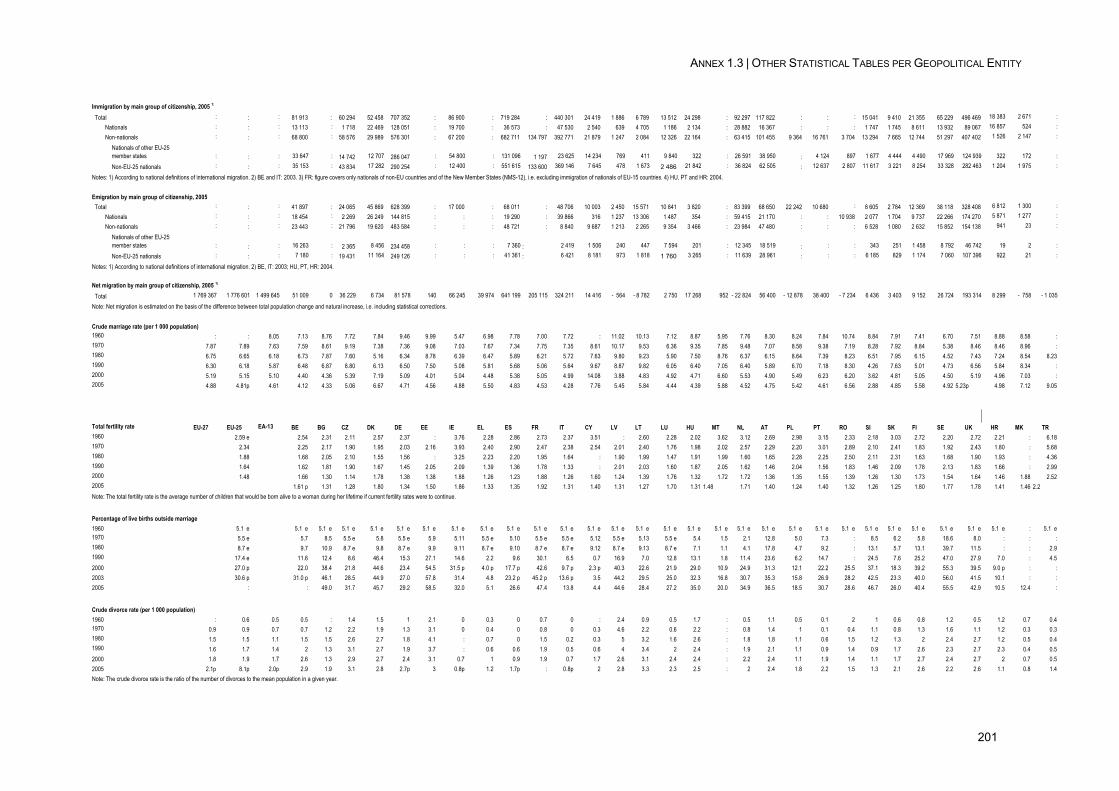
ANNEX 1.3 | OTHER STATISTICAL TABLES PER GEOPOLITICAL ENTITY
201
Immigration by main group of citizenship, 2005 1)
Total : : : 81 913 : 60 294 52 458 707 352 : 86 900 : 719 284 : 440 301 24 419 1 886 6 789 13 512 24 298 : 92 297 117 822 : : : 15 041 9 410 21 355 65 229 496 469 18 383 2 671 :Nationals : : : 13 113 : 1 718 22 469 128 051 : 19 700 : 36 573 : 47 530 2 540 639 4 705 1 186 2 134 : 28 882 16 367 : : : 1 747 1 745 8 611 13 932 89 067 16 857 524 :Non-nationals : : : 68 800 : 58 576 29 989 576 301 : 67 200 : 682 711 134 797 392 771 21 879 1 247 2 084 12 326 22 164 : 63 415 101 455 9 364 16 761 3 704 13 294 7 665 12 744 51 297 407 402 1 526 2 147 :
Nationals of other EU-25 member states : : : 33 647 : 14 742 12 707 286 047 : 54 800 : 131 096 1 197 23 625 14 234 769 411 9 840 322 : 26 591 38 950 : 4 124 897 1 677 4 444 4 490 17 969 124 939 322 172 :Non-EU-25 nationals : : : 35 153 : 43 834 17 282 290 254 : 12 400 : 551 615 133 600 369 146 7 645 478 1 673 2 486 21 842 : 36 824 62 505 : 12 637 2 807 11 617 3 221 8 254 33 328 282 463 1 204 1 975 :
Notes: 1) According to national definitions of international migration. 2) BE and IT: 2003. 3) FR: figure covers only nationals of non-EU countries and of the New Member States (NMS-12), i.e. excluding immigration of nationals of EU-15 countries. 4) HU, PT and HR: 2004.
Emigration by main group of citizenship, 2005 Total : : : 41 897 : 24 065 45 869 628 399 : 17 000 : 68 011 : 48 706 10 003 2 450 15 571 10 841 3 820 : 83 399 68 650 22 242 10 680 : 8 605 2 784 12 369 38 118 328 408 6 812 1 300 :
Nationals : : : 18 454 : 2 269 26 249 144 815 : : : 19 290 : 39 866 316 1 237 13 306 1 487 354 : 59 415 21 170 : : 10 938 2 077 1 704 9 737 22 266 174 270 5 871 1 277 :Non-nationals : : : 23 443 : 21 796 19 620 483 584 : : : 48 721 : 8 840 9 687 1 213 2 265 9 354 3 466 : 23 984 47 480 : : : 6 528 1 080 2 632 15 852 154 138 941 23 :
Nationals of other EU-25 member states : : : 16 263 : 2 365 8 456 234 458 : : : 7 360 : 2 419 1 506 240 447 7 594 201 : 12 345 18 519 : : : 343 251 1 458 8 792 46 742 19 2 :Non-EU-25 nationals : : : 7 180 : 19 431 11 164 249 126 : : : 41 361 : 6 421 8 181 973 1 818 1 760 3 265 : 11 639 28 961 : : : 6 185 829 1 174 7 060 107 396 922 21 :
Notes: 1) According to national definitions of international migration. 2) BE, IT: 2003; HU, PT, HR: 2004.
Net migration by main group of citizenship, 2005 1)
Total 1 769 367 1 776 601 1 499 645 51 009 0 36 229 6 734 81 578 140 66 245 39 974 641 199 205 115 324 211 14 416 - 564 - 8 782 2 750 17 268 952 - 22 824 56 400 - 12 878 38 400 - 7 234 6 436 3 403 9 152 26 724 193 314 8 299 - 758 - 1 035
Crude marriage rate (per 1 000 population)1960 : : 8.05 7.13 8.76 7.72 7.84 9.46 9.99 5.47 6.98 7.78 7.00 7.72 : 11.02 10.13 7.12 8.87 5.95 7.76 8.30 8.24 7.84 10.74 8.84 7.91 7.41 6.70 7.51 8.88 8.58 :1970 7.87 7.89 7.63 7.59 8.61 9.19 7.38 7.36 9.08 7.03 7.67 7.34 7.75 7.35 8.61 10.17 9.53 6.36 9.35 7.85 9.48 7.07 8.58 9.38 7.19 8.28 7.92 8.84 5.38 8.46 8.46 8.96 :1980 6.75 6.65 6.18 6.73 7.87 7.60 5.16 6.34 8.78 6.39 6.47 5.89 6.21 5.72 7.63 9.80 9.23 5.90 7.50 8.76 6.37 6.15 8.64 7.39 8.23 6.51 7.95 6.15 4.52 7.43 7.24 8.54 8.231990 6.30 6.18 5.87 6.48 6.87 8.80 6.13 6.50 7.50 5.08 5.81 5.68 5.06 5.64 9.67 8.87 9.82 6.05 6.40 7.05 6.40 5.89 6.70 7.18 8.30 4.26 7.63 5.01 4.73 6.56 5.84 8.34 :2000 5.19 5.15 5.10 4.40 4.36 5.39 7.19 5.09 4.01 5.04 4.48 5.38 5.05 4.99 14.08 3.88 4.83 4.92 4.71 6.60 5.53 4.90 5.49 6.23 6.20 3.62 4.81 5.05 4.50 5.19 4.96 7.03 :2005 4.88 4.81p 4.61 4.12 4.33 5.06 6.67 4.71 4.56 4.88 5.50 4.83 4.53 4.28 7.76 5.45 5.84 4.44 4.39 5.88 4.52 4.75 5.42 4.61 6.56 2.88 4.85 5.58 4.92 5.23p 4.98 7.12 9.05
Total fertility rate EU-27 EU-25 EA-13 BE BG CZ DK DE EE IE EL ES FR IT CY LV LT LU HU MT NL AT PL PT RO SI SK FI SE UK HR MK TR1960 2.59 e 2.54 2.31 2.11 2.57 2.37 : 3.76 2.28 2.86 2.73 2.37 3.51 : 2.60 2.28 2.02 3.62 3.12 2.69 2.98 3.15 2.33 2.18 3.03 2.72 2.20 2.72 2.21 : 6.181970 2.34 2.25 2.17 1.90 1.95 2.03 2.16 3.93 2.40 2.90 2.47 2.38 2.54 2.01 2.40 1.76 1.98 2.02 2.57 2.29 2.20 3.01 2.89 2.10 2.41 1.83 1.92 2.43 1.80 : 5.681980 1.88 1.68 2.05 2.10 1.55 1.56 : 3.25 2.23 2.20 1.95 1.64 : 1.90 1.99 1.47 1.91 1.99 1.60 1.65 2.28 2.25 2.50 2.11 2.31 1.63 1.68 1.90 1.93 : 4.361990 1.64 1.62 1.81 1.90 1.67 1.45 2.05 2.09 1.39 1.36 1.78 1.33 : 2.01 2.03 1.60 1.87 2.05 1.62 1.46 2.04 1.56 1.83 1.46 2.09 1.78 2.13 1.83 1.66 : 2.992000 1.48 1.66 1.30 1.14 1.78 1.38 1.38 1.88 1.26 1.23 1.88 1.26 1.60 1.24 1.39 1.76 1.32 1.72 1.72 1.36 1.35 1.55 1.39 1.26 1.30 1.73 1.54 1.64 1.46 1.88 2.522005 1.61 p 1.31 1.28 1.80 1.34 1.50 1.86 1.33 1.35 1.92 1.31 1.40 1.31 1.27 1.70 1.31 1.48 1.71 1.40 1.24 1.40 1.32 1.26 1.25 1.80 1.77 1.78 1.41 1.46 2.2Note: The total fertility rate is the average number of children that would be born alive to a woman during her lifetime if current fertility rates were to continue.
Percentage of live births outside marriage1960 5.1 e 5.1 e 5.1 e 5.1 e 5.1 e 5.1 e 5.1 e 5.1 e 5.1 e 5.1 e 5.1 e 5.1 e 5.1 e 5.1 e 5.1 e 5.1 e 5.1 e 5.1 e 5.1 e 5.1 e 5.1 e 5.1 e 5.1 e 5.1 e 5.1 e 5.1 e 5.1 e 5.1 e 5.1 e : 5.1 e1970 5.5 e 5.7 8.5 5.5 e 5.8 5.5 e 5.9 5.11 5.5 e 5.10 5.5 e 5.5 e 5.12 5.5 e 5.13 5.5 e 5.4 1.5 2.1 12.8 5.0 7.3 : 8.5 6.2 5.8 18.6 8.0 : : :1980 8.7 e 9.7 10.9 8.7 e 9.8 8.7 e 9.9 9.11 8.7 e 9.10 8.7 e 8.7 e 9.12 8.7 e 9.13 8.7 e 7.1 1.1 4.1 17.8 4.7 9.2 : 13.1 5.7 13.1 39.7 11.5 : : 2.91990 17.4 e 11.6 12.4 8.6 46.4 15.3 27.1 14.6 2.2 9.6 30.1 6.5 0.7 16.9 7.0 12.8 13.1 1.8 11.4 23.6 6.2 14.7 : 24.5 7.6 25.2 47.0 27.9 7.0 : 4.52000 27.0 p 22.0 38.4 21.8 44.6 23.4 54.5 31.5 p 4.0 p 17.7 p 42.6 9.7 p 2.3 p 40.3 22.6 21.9 29.0 10.9 24.9 31.3 12.1 22.2 25.5 37.1 18.3 39.2 55.3 39.5 9.0 p : :2003 30.6 p 31.0 p 46.1 28.5 44.9 27.0 57.8 31.4 4.8 23.2 p 45.2 p 13.6 p 3.5 44.2 29.5 25.0 32.3 16.8 30.7 35.3 15.8 26.9 28.2 42.5 23.3 40.0 56.0 41.5 10.1 : :2005 : : 49.0 31.7 45.7 29.2 58.5 32.0 5.1 26.6 47.4 13.8 4.4 44.6 28.4 27.2 35.0 20.0 34.9 36.5 18.5 30.7 28.6 46.7 26.0 40.4 55.5 42.9 10.5 12.4 :
Crude divorce rate (per 1 000 population)1960 : 0.6 0.5 0.5 : 1.4 1.5 1 2.1 0 0.3 0 0.7 0 : 2.4 0.9 0.5 1.7 : 0.5 1.1 0.5 0.1 2 1 0.6 0.8 1.2 0.5 1.2 0.7 0.41970 0.9 0.9 0.7 0.7 1.2 2.2 1.9 1.3 3.1 0 0.4 0 0.8 0 0.3 4.6 2.2 0.6 2.2 : 0.8 1.4 1 0.1 0.4 1.1 0.8 1.3 1.6 1.1 1.2 0.3 0.31980 1.5 1.5 1.1 1.5 1.5 2.6 2.7 1.8 4.1 : 0.7 0 1.5 0.2 0.3 5 3.2 1.6 2.6 : 1.8 1.8 1.1 0.6 1.5 1.2 1.3 2 2.4 2.7 1.2 0.5 0.41990 1.6 1.7 1.4 2 1.3 3.1 2.7 1.9 3.7 : 0.6 0.6 1.9 0.5 0.6 4 3.4 2 2.4 : 1.9 2.1 1.1 0.9 1.4 0.9 1.7 2.6 2.3 2.7 2.3 0.4 0.52000 1.8 1.9 1.7 2.6 1.3 2.9 2.7 2.4 3.1 0.7 1 0.9 1.9 0.7 1.7 2.6 3.1 2.4 2.4 : 2.2 2.4 1.1 1.9 1.4 1.1 1.7 2.7 2.4 2.7 2 0.7 0.52005 2.1p 8.1p 2.0p 2.9 1.9 3.1 2.8 2.7p 3 0.8p 1.2 1.7p : 0.8p 2 2.8 3.3 2.3 2.5 : 2 2.4 1.8 2.2 1.5 1.3 2.1 2.6 2.2 2.6 1.1 0.8 1.4Note: The crude divorce rate is the ratio of the number of divorces to the mean population in a given year.
Note: Net migration is estimated on the basis of the difference between total population change and natural increase, i.e. including statistical corrections.
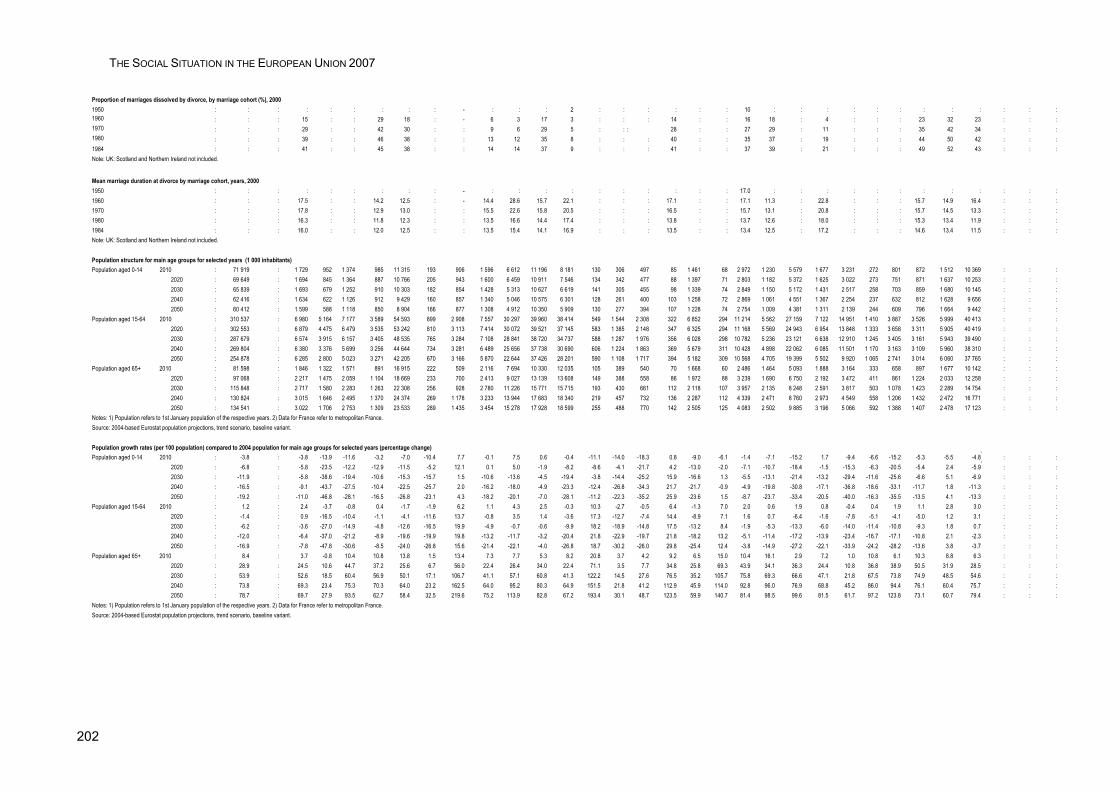
THE SOCIAL SITUATION IN THE EUROPEAN UNION 2007
202
Proportion of marriages dissolved by divorce, by marriage cohort (%), 20001950 : : : : : : : : : - : : : 2 : : : : : : 10 : : : : : : : : : : : :1960 : : : 15 : : 29 18 : - 6 3 17 3 : : : 14 : : 16 18 : 4 : : : 23 32 23 : : :1970 : : : 29 : : 42 30 : : 9 6 29 5 : : : 28 : : 27 29 : 11 : : : 35 42 34 : : :1980 : : : 39 : : 46 38 : : 13 12 35 8 : : : 40 : : 35 37 : 19 : : : 44 50 42 : : :1984 : : : 41 : : 45 38 : : 14 14 37 9 : : : 41 : : 37 39 : 21 : : : 49 52 43 : : :Note: UK: Scotland and Northern Ireland not included.
Mean marriage duration at divorce by marriage cohort, years, 20001950 : : : : : : : : : - : : : : : : : : : : 17.0 : : : : : : : : : : : :1960 : : : 17.5 : : 14.2 12.5 : - 14.4 28.6 15.7 22.1 : : : 17.1 : : 17.1 11.3 : 22.8 : : : 15.7 14.9 16.4 : : :1970 : : : 17.8 : : 12.9 13.0 : : 15.5 22.6 15.8 20.5 : : : 16.5 : : 15.7 13.1 : 20.8 : : : 15.7 14.5 13.3 : : :1980 : : : 16.3 : : 11.8 12.3 : : 13.5 16.6 14.4 17.4 : : : 13.8 : : 13.7 12.6 : 18.0 : : : 15.3 13.4 11.9 : : :1984 : : : 16.0 : : 12.0 12.5 : : 13.5 15.4 14.1 16.9 : : : 13.5 : : 13.4 12.5 : 17.2 : : : 14.6 13.4 11.5 : : :Note: UK: Scotland and Northern Ireland not included.
Population structure for main age groups for selected years (1 000 inhabitants)Population aged 0-14 2010 : 71 919 : 1 729 952 1 374 985 11 315 193 906 1 596 6 612 11 196 8 181 130 306 497 85 1 461 68 2 972 1 230 5 579 1 677 3 231 272 801 872 1 512 10 369 : : :
2020 : 69 649 : 1 694 845 1 364 887 10 766 205 943 1 600 6 459 10 911 7 546 134 342 477 88 1 397 71 2 803 1 182 5 372 1 625 3 022 273 751 871 1 637 10 253 : : :2030 : 65 839 : 1 693 679 1 252 910 10 303 182 854 1 428 5 313 10 627 6 619 141 305 455 98 1 339 74 2 849 1 150 5 172 1 431 2 517 258 703 859 1 680 10 145 : : :2040 : 62 416 : 1 634 622 1 126 912 9 429 160 857 1 340 5 046 10 575 6 301 128 261 400 103 1 258 72 2 869 1 061 4 551 1 367 2 254 237 632 812 1 628 9 656 : : :2050 : 60 412 : 1 599 588 1 118 850 8 904 166 877 1 308 4 912 10 350 5 909 130 277 394 107 1 228 74 2 754 1 009 4 381 1 311 2 139 244 609 796 1 664 9 442 : : :
Population aged 15-64 2010 : 310 537 : 6 980 5 164 7 177 3 589 54 593 899 2 908 7 557 30 297 39 960 38 414 549 1 544 2 308 322 6 852 294 11 214 5 562 27 159 7 122 14 951 1 410 3 887 3 526 5 999 40 413 : : :2020 : 302 553 : 6 879 4 475 6 479 3 535 53 242 810 3 113 7 414 30 072 39 521 37 145 583 1 385 2 148 347 6 325 294 11 168 5 569 24 943 6 954 13 848 1 333 3 658 3 311 5 905 40 419 : : :2030 : 287 679 : 6 574 3 915 6 157 3 405 48 535 765 3 284 7 108 28 841 38 720 34 737 588 1 287 1 976 356 6 028 298 10 782 5 236 23 121 6 638 12 910 1 245 3 405 3 161 5 943 39 490 : : :2040 : 269 804 : 6 380 3 376 5 699 3 256 44 644 734 3 281 6 489 25 656 37 738 30 690 606 1 224 1 863 369 5 679 311 10 428 4 898 22 062 6 085 11 501 1 170 3 163 3 109 5 960 38 310 : : :2050 : 254 878 : 6 285 2 800 5 023 3 271 42 205 670 3 166 5 870 22 644 37 426 28 201 590 1 108 1 717 394 5 182 309 10 568 4 705 19 399 5 502 9 920 1 065 2 741 3 014 6 060 37 765 : : :
Population aged 65+ 2010 : 81 598 : 1 846 1 322 1 571 891 16 915 222 509 2 116 7 694 10 330 12 035 105 389 540 70 1 668 60 2 486 1 464 5 093 1 888 3 164 333 658 897 1 677 10 142 : : :2020 : 97 068 : 2 217 1 475 2 059 1 104 18 669 233 700 2 413 9 027 13 139 13 608 149 388 558 86 1 972 88 3 239 1 690 6 750 2 192 3 472 411 861 1 224 2 033 12 258 : : :2030 : 115 848 : 2 717 1 580 2 283 1 263 22 308 256 928 2 780 11 226 15 771 15 715 193 430 661 112 2 118 107 3 957 2 135 8 248 2 591 3 817 503 1 078 1 423 2 289 14 754 : : :2040 : 130 824 : 3 015 1 646 2 495 1 370 24 374 269 1 178 3 233 13 944 17 683 18 340 219 457 732 136 2 287 112 4 339 2 471 8 760 2 973 4 549 558 1 206 1 432 2 472 16 771 : : :2050 : 134 541 : 3 022 1 706 2 753 1 309 23 533 289 1 435 3 454 15 278 17 928 18 599 255 488 770 142 2 505 125 4 083 2 502 9 885 3 196 5 066 592 1 388 1 407 2 478 17 123 : : :
Notes: 1) Population refers to 1st January population of the respective years. 2) Data for France refer to metropolitan France.Source: 2004-based Eurostat population projections, trend scenario, baseline variant.
Population growth rates (per 100 population) compared to 2004 population for main age groups for selected years (percentage change)Population aged 0-14 2010 : -3.8 : -3.8 -13.9 -11.6 -3.2 -7.0 -10.4 7.7 -0.1 7.5 0.6 -0.4 -11.1 -14.0 -18.3 0.8 -9.0 -6.1 -1.4 -7.1 -15.2 1.7 -9.4 -6.6 -15.2 -5.3 -5.5 -4.8 : : :
2020 : -6.8 : -5.8 -23.5 -12.2 -12.9 -11.5 -5.2 12.1 0.1 5.0 -1.9 -8.2 -8.6 -4.1 -21.7 4.2 -13.0 -2.0 -7.1 -10.7 -18.4 -1.5 -15.3 -6.3 -20.5 -5.4 2.4 -5.9 : : :2030 : -11.9 : -5.8 -38.6 -19.4 -10.6 -15.3 -15.7 1.5 -10.6 -13.6 -4.5 -19.4 -3.8 -14.4 -25.2 15.9 -16.6 1.3 -5.5 -13.1 -21.4 -13.2 -29.4 -11.6 -25.6 -6.6 5.1 -6.9 : : :2040 : -16.5 : -9.1 -43.7 -27.5 -10.4 -22.5 -25.7 2.0 -16.2 -18.0 -4.9 -23.3 -12.4 -26.8 -34.3 21.7 -21.7 -0.9 -4.9 -19.8 -30.8 -17.1 -36.8 -18.6 -33.1 -11.7 1.8 -11.3 : : :2050 : -19.2 : -11.0 -46.8 -28.1 -16.5 -26.8 -23.1 4.3 -18.2 -20.1 -7.0 -28.1 -11.2 -22.3 -35.2 25.9 -23.6 1.5 -8.7 -23.7 -33.4 -20.5 -40.0 -16.3 -35.5 -13.5 4.1 -13.3 : : :
Population aged 15-64 2010 : 1.2 : 2.4 -3.7 -0.8 0.4 -1.7 -1.9 6.2 1.1 4.3 2.5 -0.3 10.3 -2.7 -0.5 6.4 -1.3 7.0 2.0 0.6 1.9 0.8 -0.4 0.4 1.9 1.1 2.8 3.0 : : :2020 : -1.4 : 0.9 -16.5 -10.4 -1.1 -4.1 -11.6 13.7 -0.8 3.5 1.4 -3.6 17.3 -12.7 -7.4 14.4 -8.9 7.1 1.6 0.7 -6.4 -1.6 -7.8 -5.1 -4.1 -5.0 1.2 3.1 : : :2030 : -6.2 : -3.6 -27.0 -14.9 -4.8 -12.6 -16.5 19.9 -4.9 -0.7 -0.6 -9.9 18.2 -18.9 -14.8 17.5 -13.2 8.4 -1.9 -5.3 -13.3 -6.0 -14.0 -11.4 -10.8 -9.3 1.8 0.7 : : :2040 : -12.0 : -6.4 -37.0 -21.2 -8.9 -19.6 -19.9 19.8 -13.2 -11.7 -3.2 -20.4 21.8 -22.9 -19.7 21.8 -18.2 13.2 -5.1 -11.4 -17.2 -13.9 -23.4 -16.7 -17.1 -10.8 2.1 -2.3 : : :2050 : -16.9 : -7.8 -47.8 -30.6 -8.5 -24.0 -26.8 15.6 -21.4 -22.1 -4.0 -26.8 18.7 -30.2 -26.0 29.8 -25.4 12.4 -3.8 -14.9 -27.2 -22.1 -33.9 -24.2 -28.2 -13.6 3.8 -3.7 : : :
Population aged 65+ 2010 : 8.4 : 3.7 -0.8 10.4 10.8 13.8 1.5 13.4 7.3 7.7 5.3 8.2 20.8 3.7 4.2 9.2 6.5 15.0 10.4 16.1 2.9 7.2 1.0 10.8 6.1 10.3 8.8 6.3 : : :2020 : 28.9 : 24.5 10.6 44.7 37.2 25.6 6.7 56.0 22.4 26.4 34.0 22.4 71.1 3.5 7.7 34.8 25.8 69.3 43.9 34.1 36.3 24.4 10.8 36.8 38.9 50.5 31.9 28.5 : : :2030 : 53.9 : 52.6 18.5 60.4 56.9 50.1 17.1 106.7 41.1 57.1 60.8 41.3 122.2 14.5 27.6 76.5 35.2 105.7 75.8 69.3 66.6 47.1 21.8 67.5 73.8 74.9 48.5 54.6 : : :2040 : 73.8 : 69.3 23.4 75.3 70.3 64.0 23.2 162.5 64.0 95.2 80.3 64.9 151.5 21.8 41.2 112.9 45.9 114.0 92.8 96.0 76.9 68.8 45.2 86.0 94.4 76.1 60.4 75.7 : : :2050 : 78.7 : 69.7 27.9 93.5 62.7 58.4 32.5 219.6 75.2 113.9 82.8 67.2 193.4 30.1 48.7 123.5 59.9 140.7 81.4 98.5 99.6 81.5 61.7 97.2 123.8 73.1 60.7 79.4 : : :
Notes: 1) Population refers to 1st January population of the respective years. 2) Data for France refer to metropolitan France.Source: 2004-based Eurostat population projections, trend scenario, baseline variant.
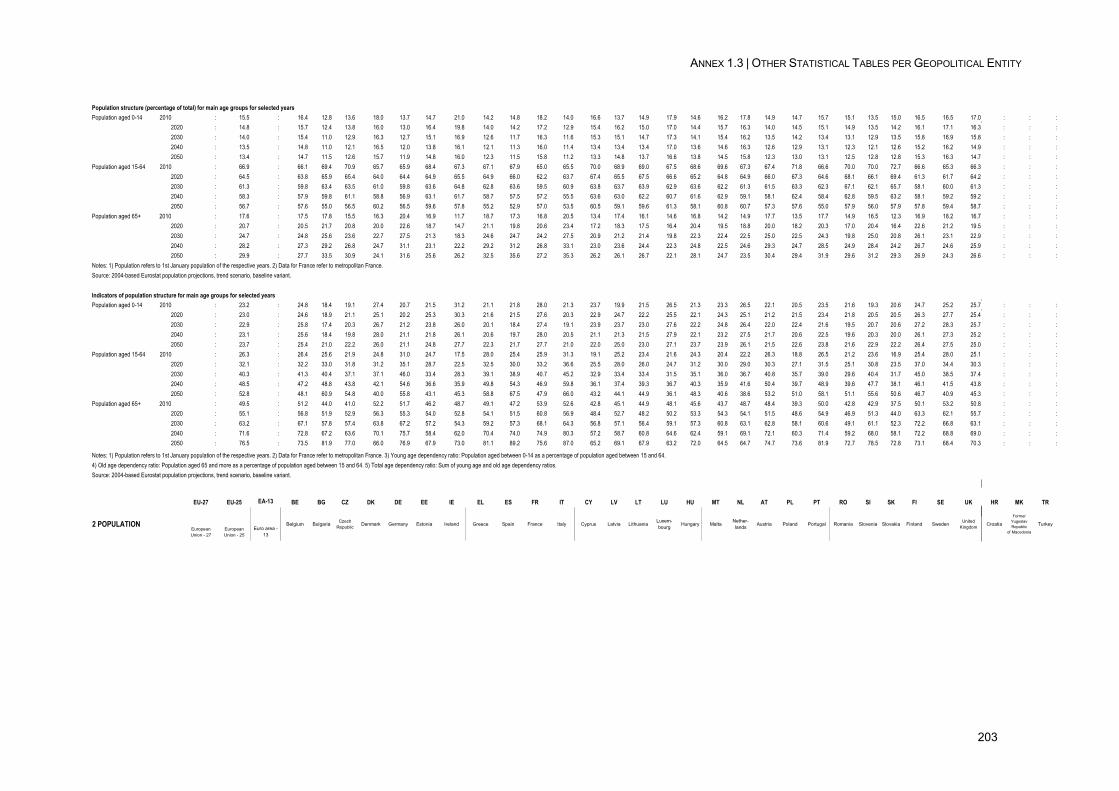
ANNEX 1.3 | OTHER STATISTICAL TABLES PER GEOPOLITICAL ENTITY
203
Population structure (percentage of total) for main age groups for selected yearsPopulation aged 0-14 2010 : 15.5 : 16.4 12.8 13.6 18.0 13.7 14.7 21.0 14.2 14.8 18.2 14.0 16.6 13.7 14.9 17.9 14.6 16.2 17.8 14.9 14.7 15.7 15.1 13.5 15.0 16.5 16.5 17.0 : : :
2020 : 14.8 : 15.7 12.4 13.8 16.0 13.0 16.4 19.8 14.0 14.2 17.2 12.9 15.4 16.2 15.0 17.0 14.4 15.7 16.3 14.0 14.5 15.1 14.9 13.5 14.2 16.1 17.1 16.3 : : :2030 : 14.0 : 15.4 11.0 12.9 16.3 12.7 15.1 16.9 12.6 11.7 16.3 11.6 15.3 15.1 14.7 17.3 14.1 15.4 16.2 13.5 14.2 13.4 13.1 12.9 13.5 15.8 16.9 15.8 : : :2040 : 13.5 : 14.8 11.0 12.1 16.5 12.0 13.8 16.1 12.1 11.3 16.0 11.4 13.4 13.4 13.4 17.0 13.6 14.6 16.3 12.6 12.9 13.1 12.3 12.1 12.6 15.2 16.2 14.9 : : :2050 : 13.4 : 14.7 11.5 12.6 15.7 11.9 14.8 16.0 12.3 11.5 15.8 11.2 13.3 14.8 13.7 16.6 13.8 14.5 15.8 12.3 13.0 13.1 12.5 12.8 12.8 15.3 16.3 14.7 : : :
Population aged 15-64 2010 : 66.9 : 66.1 69.4 70.9 65.7 65.9 68.4 67.3 67.1 67.9 65.0 65.5 70.0 68.9 69.0 67.5 68.6 69.6 67.3 67.4 71.8 66.6 70.0 70.0 72.7 66.6 65.3 66.3 : : :2020 : 64.5 : 63.8 65.9 65.4 64.0 64.4 64.9 65.5 64.9 66.0 62.2 63.7 67.4 65.5 67.5 66.6 65.2 64.8 64.9 66.0 67.3 64.6 68.1 66.1 69.4 61.3 61.7 64.2 : : :2030 : 61.3 : 59.8 63.4 63.5 61.0 59.8 63.6 64.8 62.8 63.6 59.5 60.9 63.8 63.7 63.9 62.9 63.6 62.2 61.3 61.5 63.3 62.3 67.1 62.1 65.7 58.1 60.0 61.3 : : :2040 : 58.3 : 57.9 59.8 61.1 58.8 56.9 63.1 61.7 58.7 57.5 57.2 55.5 63.6 63.0 62.2 60.7 61.6 62.9 59.1 58.1 62.4 58.4 62.8 59.5 63.2 58.1 59.2 59.2 : : :2050 : 56.7 : 57.6 55.0 56.5 60.2 56.5 59.6 57.8 55.2 52.9 57.0 53.5 60.5 59.1 59.6 61.3 58.1 60.8 60.7 57.3 57.6 55.0 57.9 56.0 57.9 57.8 59.4 58.7 : : :
Population aged 65+ 2010 : 17.6 : 17.5 17.8 15.5 16.3 20.4 16.9 11.7 18.7 17.3 16.8 20.5 13.4 17.4 16.1 14.6 16.8 14.2 14.9 17.7 13.5 17.7 14.9 16.5 12.3 16.9 18.2 16.7 : : :2020 : 20.7 : 20.5 21.7 20.8 20.0 22.6 18.7 14.7 21.1 19.8 20.6 23.4 17.2 18.3 17.5 16.4 20.4 19.5 18.8 20.0 18.2 20.3 17.0 20.4 16.4 22.6 21.2 19.5 : : :2030 : 24.7 : 24.8 25.6 23.6 22.7 27.5 21.3 18.3 24.6 24.7 24.2 27.5 20.9 21.2 21.4 19.8 22.3 22.4 22.5 25.0 22.5 24.3 19.8 25.0 20.8 26.1 23.1 22.9 : : :2040 : 28.2 : 27.3 29.2 26.8 24.7 31.1 23.1 22.2 29.2 31.2 26.8 33.1 23.0 23.6 24.4 22.3 24.8 22.5 24.6 29.3 24.7 28.5 24.9 28.4 24.2 26.7 24.6 25.9 : : :2050 : 29.9 : 27.7 33.5 30.9 24.1 31.6 25.6 26.2 32.5 35.6 27.2 35.3 26.2 26.1 26.7 22.1 28.1 24.7 23.5 30.4 29.4 31.9 29.6 31.2 29.3 26.9 24.3 26.6 : : :
Notes: 1) Population refers to 1st January population of the respective years. 2) Data for France refer to metropolitan France.Source: 2004-based Eurostat population projections, trend scenario, baseline variant.
Indicators of population structure for main age groups for selected yearsPopulation aged 0-14 2010 : 23.2 : 24.8 18.4 19.1 27.4 20.7 21.5 31.2 21.1 21.8 28.0 21.3 23.7 19.9 21.5 26.5 21.3 23.3 26.5 22.1 20.5 23.5 21.6 19.3 20.6 24.7 25.2 25.7 : : :
2020 : 23.0 : 24.6 18.9 21.1 25.1 20.2 25.3 30.3 21.6 21.5 27.6 20.3 22.9 24.7 22.2 25.5 22.1 24.3 25.1 21.2 21.5 23.4 21.8 20.5 20.5 26.3 27.7 25.4 : : :2030 : 22.9 : 25.8 17.4 20.3 26.7 21.2 23.8 26.0 20.1 18.4 27.4 19.1 23.9 23.7 23.0 27.6 22.2 24.8 26.4 22.0 22.4 21.6 19.5 20.7 20.6 27.2 28.3 25.7 : : :2040 : 23.1 : 25.6 18.4 19.8 28.0 21.1 21.8 26.1 20.6 19.7 28.0 20.5 21.1 21.3 21.5 27.9 22.1 23.2 27.5 21.7 20.6 22.5 19.6 20.3 20.0 26.1 27.3 25.2 : : :2050 : 23.7 : 25.4 21.0 22.2 26.0 21.1 24.8 27.7 22.3 21.7 27.7 21.0 22.0 25.0 23.0 27.1 23.7 23.9 26.1 21.5 22.6 23.8 21.6 22.9 22.2 26.4 27.5 25.0 : : :
Population aged 15-64 2010 : 26.3 : 26.4 25.6 21.9 24.8 31.0 24.7 17.5 28.0 25.4 25.9 31.3 19.1 25.2 23.4 21.6 24.3 20.4 22.2 26.3 18.8 26.5 21.2 23.6 16.9 25.4 28.0 25.1 : : :2020 : 32.1 : 32.2 33.0 31.8 31.2 35.1 28.7 22.5 32.5 30.0 33.2 36.6 25.5 28.0 26.0 24.7 31.2 30.0 29.0 30.3 27.1 31.5 25.1 30.8 23.5 37.0 34.4 30.3 : : :2030 : 40.3 : 41.3 40.4 37.1 37.1 46.0 33.4 28.3 39.1 38.9 40.7 45.2 32.9 33.4 33.4 31.5 35.1 36.0 36.7 40.8 35.7 39.0 29.6 40.4 31.7 45.0 38.5 37.4 : : :2040 : 48.5 : 47.2 48.8 43.8 42.1 54.6 36.6 35.9 49.8 54.3 46.9 59.8 36.1 37.4 39.3 36.7 40.3 35.9 41.6 50.4 39.7 48.9 39.6 47.7 38.1 46.1 41.5 43.8 : : :2050 : 52.8 : 48.1 60.9 54.8 40.0 55.8 43.1 45.3 58.8 67.5 47.9 66.0 43.2 44.1 44.9 36.1 48.3 40.6 38.6 53.2 51.0 58.1 51.1 55.6 50.6 46.7 40.9 45.3 : : :
Population aged 65+ 2010 : 49.5 : 51.2 44.0 41.0 52.2 51.7 46.2 48.7 49.1 47.2 53.9 52.6 42.8 45.1 44.9 48.1 45.6 43.7 48.7 48.4 39.3 50.0 42.8 42.9 37.5 50.1 53.2 50.8 : : :2020 : 55.1 : 56.8 51.9 52.9 56.3 55.3 54.0 52.8 54.1 51.5 60.8 56.9 48.4 52.7 48.2 50.2 53.3 54.3 54.1 51.5 48.6 54.9 46.9 51.3 44.0 63.3 62.1 55.7 : : :2030 : 63.2 : 67.1 57.8 57.4 63.8 67.2 57.2 54.3 59.2 57.3 68.1 64.3 56.8 57.1 56.4 59.1 57.3 60.8 63.1 62.8 58.1 60.6 49.1 61.1 52.3 72.2 66.8 63.1 : : :2040 : 71.6 : 72.8 67.2 63.6 70.1 75.7 58.4 62.0 70.4 74.0 74.9 80.3 57.2 58.7 60.8 64.6 62.4 59.1 69.1 72.1 60.3 71.4 59.2 68.0 58.1 72.2 68.8 69.0 : : :2050 : 76.5 : 73.5 81.9 77.0 66.0 76.9 67.9 73.0 81.1 89.2 75.6 87.0 65.2 69.1 67.9 63.2 72.0 64.5 64.7 74.7 73.6 81.9 72.7 78.5 72.8 73.1 68.4 70.3 : : :
Notes: 1) Population refers to 1st January population of the respective years. 2) Data for France refer to metropolitan France. 3) Young age dependency ratio: Population aged between 0-14 as a percentage of population aged between 15 and 64.4) Old age dependency ratio: Population aged 65 and more as a percentage of population aged between 15 and 64. 5) Total age dependency ratio: Sum of young age and old age dependency ratios.Source: 2004-based Eurostat population projections, trend scenario, baseline variant.
EU-27 EU-25 EA-13 BE BG CZ DK DE EE IE EL ES FR IT CY LV LT LU HU MT NL AT PL PT RO SI SK FI SE UK HR MK TR
2 POPULATIONEuropeanUnion - 27
EuropeanUnion - 25
Euro area - 13
Belgium Bulgaria Czech Republic Denmark Germany Estonia Ireland Greece Spain France Italy Cyprus Latvia Lithuania
Luxem-bourg Hungary Malta
Nether-lands Austria Poland Portugal Romania Slovenia Slovakia Finland Sweden United
Kingdom Croatia
FormerYugoslav Republic
of Macedonia
Turkey

THE SOCIAL SITUATION IN THE EUROPEAN UNION 2007
204
3 EDUCATION AND TRAININGEuropeanUnion - 27
EuropeanUnion -
25Euro
area - 13
Belgium Bulgaria Czech Republic Denmark Germany Estonia Ireland Greece Spain France Italy Cyprus Latvia Lithuania
Luxem-bourg Hungary Malta
Nether-lands Austria Poland Portugal Romania Slovenia Slovakia Finland Sweden United
Kingdom Croatia
FormerYugoslav Republic
of Macedonia
Turkey
EU-27 EU-25 EA-13 BE BG CZ DK DE EE IE EL ES FR IT CY LV LT LU HU MT NL AT PL PT RO SI SK FI SE UK HR MK TR
Training enterprises as a percentage of all enterprises by size class, 199910-49 employees : : : 66 24 62 95 71 58 75 11 31 70 20 : 49 37 67 32 : 85 68 36 17 8 35 : 78 88 85 : : :50-249 employees : : : 93 34 84 98 87 85 98 43 58 93 48 : 70 60 83 51 : 96 91 52 46 13 72 : 97 99 91 : : :250 or more employees : : : 100 62 96 100 98 96 100 78 86 98 81 : 91 80 99 79 : 98 96 63 78 38 96 : 99 99 98 : : :All size classes : : : 282 f 19 f 69 96 75 9 f 146 f 18 793 f 1625 f 24 : 53 43 71 37 : 465 f 72 39 22 57 f 48 : 82 91 87 27 f : 244 f
Percentage of employees of all enterprises participating in CVT courses by gender, 1999Total : : : 41 13 42 53 32 19 41 15 25 46 26 : 12 10 36 12 : 41 31 16 17 8 32 : 50 61 49 : : :Males : : : : 16 46 52 34 18 40 14 25 48 27 : 13 10 34 13 : 44 31 17 17 8 32 : 48 60 50 : : :Females : : : : 5.5 f 35 54 29 5.9 f 43 16 26 44 23 : 12 9 4.0 f 11 : 1.4 f 32 15 17 7.2 f 33 : 53 61 46 3.8 f : 8.5 f
Hours in CVT courses per participant by economic activity (*), 1999NACE D : : : 29 19 24 41 29 26 40 49 46 33 30 : 31 39 47 34 : 39 28 24 44 33 20 : 35 34 29 : : :NACE G : : : 29 35 24 30 21 42 32 32 36 25 32 : 26 45 26 42 : 35 26 29 24 31 14 : 26 23 15 : : :NACE J : : : 34 20 41 41 35 46 28 34 44 37 35 : 32 29 43 19 : 48 49 36 55 27 27 : 38 26 27 : : :NACE K : : : 38 50 46 60 40 32 41 43 43 36 43 : 56 48 53 47 : 43 33 43 44 57 47 : 49 36 41 : : :NACE O : : : 31 72 22 42 15 19 59 44 54 38 39 : 27 19 37 30 : 26 15 27 38 45 34 : 31 26 15 : : :Other : : : 28 46 20 42 20 26 43 38 38 49 30 : 34 45 28 44 : 32 25 25 34 56 31 : 36 28 26 : : :Total : : : 31 35 25 41 27 31 40 39 42 36 32 : 34 41 39 38 : 37 29 28 38 42 24 : 36 31 26 : : :
Percentage of employees in small and large enterprises with and without 'a joint agreement' participating in CVT courses, 1999small - with : : : 48 25 45 57 40 27 57 14 39 44 34 : 34 24 49 18 : 53 : 23 38 14 30 : 53 65 52 : : :small - without : : : 23 4 22 45 24 11 26 2 9 22 9 : 7 4 19 6 : 29 : 8 4 1 13 : 39 47 31 : : :large - with : : : 61 31 58 56 50 28 59 31 50 65 58 : 25 23 55 26 : 45 45 25 52 18 57 : 67 70 52 : : :large - without : : : 57 12 44 54 30 29 57 23 31 54 37 : 14 13 44 16 : 37 36 27 30 6 42 : 52 62 52 : : :
Source: Eurostat - Continuing Vocational Training Survey 2 (CVTS2)
EU-27 EU-25 EA-13 BE BG CZ DK DE EE IE EL ES FR IT CY LV LT LU HU MT NL AT PL PT RO SI SK FI SE UK HR MK TR
3 EDUCATION AND TRAINING EuropeanUnion - 27
EuropeanUnion -
25Euro
area - 13
Belgium Bulgaria Czech Republic Denmark Germany Estonia Ireland Greece Spain France Italy Cyprus Latvia Lithuania
Luxem-bourg Hungary Malta
Nether-lands Austria Poland Portugal Romania Slovenia Slovakia Finland Sweden United
Kingdom Croatia
FormerYugoslav Republic
of Macedonia
Turkey
(*) NACE D: Manufacturing, NACE G: Wholesale and retail trade; repair of motor vehicles, motorcycles and personal and household goods, NACE J: Financial intermediation, NACE K: Real estate, renting and business activities, NACE O: Other community, social and personal service activities, Other (C, E, F, H, I) Mining and quarrying; Electricity, gas, water; Construction; Hotels and restaurants; Transport, communication.
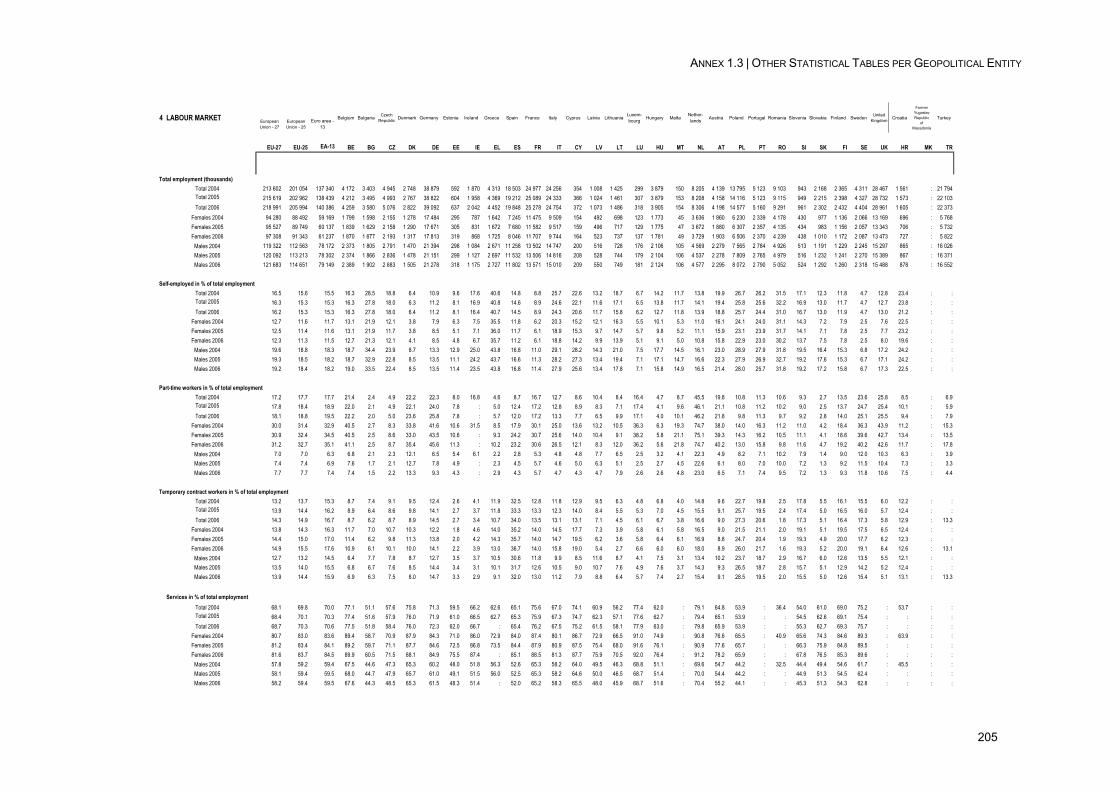
ANNEX 1.3 | OTHER STATISTICAL TABLES PER GEOPOLITICAL ENTITY
205
4 LABOUR MARKET EuropeanUnion - 27
EuropeanUnion - 25
Euro area - 13
Belgium Bulgaria Czech Republic Denmark Germany Estonia Ireland Greece Spain France Italy Cyprus Latvia Lithuania
Luxem-bourg Hungary Malta
Nether-lands Austria Poland Portugal Romania Slovenia Slovakia Finland Sweden United
Kingdom Croatia
FormerYugoslav Republic
of Macedonia
Turkey
EU-27 EU-25 EA-13 BE BG CZ DK DE EE IE EL ES FR IT CY LV LT LU HU MT NL AT PL PT RO SI SK FI SE UK HR MK TR
Total employment (thousands)Total 2004 213 602 201 054 137 340 4 172 3 403 4 945 2 748 38 879 592 1 870 4 313 18 503 24 977 24 256 354 1 008 1 425 299 3 879 150 8 205 4 139 13 795 5 123 9 103 943 2 168 2 365 4 311 28 467 1 561 : 21 794Total 2005 215 619 202 962 138 439 4 212 3 495 4 993 2 767 38 822 604 1 958 4 369 19 212 25 089 24 333 366 1 024 1 461 307 3 879 153 8 208 4 158 14 116 5 123 9 115 949 2 215 2 398 4 327 28 732 1 573 : 22 103Total 2006 218 991 205 994 140 386 4 259 3 580 5 076 2 822 39 092 637 2 042 4 452 19 848 25 278 24 754 372 1 073 1 486 318 3 905 154 8 306 4 198 14 577 5 160 9 291 961 2 302 2 432 4 404 28 961 1 605 : 22 373
Females 2004 94 280 88 492 59 169 1 799 1 598 2 155 1 278 17 484 295 787 1 642 7 245 11 475 9 509 154 492 698 123 1 773 45 3 636 1 860 6 230 2 339 4 178 430 977 1 136 2 066 13 169 696 : 5 768Females 2005 95 527 89 749 60 137 1 839 1 629 2 158 1 290 17 671 305 831 1 672 7 680 11 582 9 517 159 496 717 129 1 775 47 3 672 1 880 6 307 2 357 4 135 434 983 1 156 2 057 13 343 706 : 5 732Females 2006 97 308 91 343 61 237 1 870 1 677 2 193 1 317 17 813 319 868 1 725 8 046 11 707 9 744 164 523 737 137 1 781 49 3 729 1 903 6 506 2 370 4 239 438 1 010 1 172 2 087 13 473 727 : 5 822
Males 2004 119 322 112 563 78 172 2 373 1 805 2 791 1 470 21 394 298 1 084 2 671 11 258 13 502 14 747 200 516 728 176 2 106 105 4 569 2 279 7 565 2 784 4 926 513 1 191 1 229 2 245 15 297 865 : 16 026Males 2005 120 092 113 213 78 302 2 374 1 866 2 836 1 478 21 151 299 1 127 2 697 11 532 13 506 14 816 208 528 744 179 2 104 106 4 537 2 278 7 809 2 765 4 979 516 1 232 1 241 2 270 15 389 867 : 16 371Males 2006 121 683 114 651 79 149 2 389 1 902 2 883 1 505 21 278 318 1 175 2 727 11 802 13 571 15 010 209 550 749 181 2 124 106 4 577 2 295 8 072 2 790 5 052 524 1 292 1 260 2 318 15 488 878 : 16 552
Self-employed in % of total employmentTotal 2004 16.5 15.6 15.5 16.3 28.5 18.8 6.4 10.9 9.6 17.6 40.6 14.8 8.8 25.7 22.6 13.2 18.7 6.7 14.2 11.7 13.8 19.9 26.7 26.2 31.5 17.1 12.3 11.8 4.7 12.8 23.4 : :Total 2005 16.3 15.3 15.3 16.3 27.8 18.0 6.3 11.2 8.1 16.9 40.8 14.6 8.9 24.6 22.1 11.6 17.1 6.5 13.8 11.7 14.1 19.4 25.8 25.6 32.2 16.9 13.0 11.7 4.7 12.7 23.8 : :Total 2006 16.2 15.3 15.3 16.3 27.8 18.0 6.4 11.2 8.1 16.4 40.7 14.5 8.9 24.3 20.6 11.7 15.8 6.2 12.7 11.8 13.9 18.8 25.7 24.4 31.0 16.7 13.0 11.9 4.7 13.0 21.2 : :
Females 2004 12.7 11.6 11.7 13.1 21.9 12.1 3.8 7.9 6.3 7.5 35.5 11.8 6.2 20.3 15.2 12.1 16.3 5.5 10.1 5.3 11.0 16.1 24.1 24.0 31.1 14.3 7.2 7.9 2.5 7.6 22.5 : :Females 2005 12.5 11.4 11.6 13.1 21.9 11.7 3.8 8.5 5.1 7.1 36.0 11.7 6.1 18.9 15.3 9.7 14.7 5.7 9.8 5.2 11.1 15.9 23.1 23.9 31.7 14.1 7.1 7.8 2.5 7.7 23.2 : :Females 2006 12.3 11.3 11.5 12.7 21.3 12.1 4.1 8.5 4.8 6.7 35.7 11.2 6.1 18.8 14.2 9.9 13.9 5.1 9.1 5.0 10.8 15.8 22.9 23.0 30.2 13.7 7.5 7.8 2.5 8.0 19.6 : :
Males 2004 19.6 18.8 18.3 18.7 34.4 23.9 8.7 13.3 12.9 25.0 43.8 16.8 11.0 29.1 28.2 14.3 21.0 7.5 17.7 14.5 16.1 23.0 28.9 27.9 31.8 19.5 16.4 15.3 6.8 17.2 24.2 : :Males 2005 19.3 18.5 18.2 18.7 32.9 22.8 8.5 13.5 11.1 24.2 43.7 16.6 11.3 28.2 27.3 13.4 19.4 7.1 17.1 14.7 16.6 22.3 27.9 26.9 32.7 19.2 17.6 15.3 6.7 17.1 24.2 : :Males 2006 19.2 18.4 18.2 19.0 33.5 22.4 8.5 13.5 11.4 23.5 43.8 16.8 11.4 27.9 25.6 13.4 17.8 7.1 15.8 14.9 16.5 21.4 28.0 25.7 31.8 19.2 17.2 15.8 6.7 17.3 22.5 : :
Part-time workers in % of total employmentTotal 2004 17.2 17.7 17.7 21.4 2.4 4.9 22.2 22.3 8.0 16.8 4.6 8.7 16.7 12.7 8.6 10.4 8.4 16.4 4.7 8.7 45.5 19.8 10.8 11.3 10.6 9.3 2.7 13.5 23.6 25.8 8.5 : 6.9Total 2005 17.8 18.4 18.9 22.0 2.1 4.9 22.1 24.0 7.8 : 5.0 12.4 17.2 12.8 8.9 8.3 7.1 17.4 4.1 9.6 46.1 21.1 10.8 11.2 10.2 9.0 2.5 13.7 24.7 25.4 10.1 : 5.9Total 2006 18.1 18.8 19.5 22.2 2.0 5.0 23.6 25.8 7.8 : 5.7 12.0 17.2 13.3 7.7 6.5 9.9 17.1 4.0 10.1 46.2 21.8 9.8 11.3 9.7 9.2 2.8 14.0 25.1 25.5 9.4 : 7.9
Females 2004 30.0 31.4 32.9 40.5 2.7 8.3 33.8 41.6 10.6 31.5 8.5 17.9 30.1 25.0 13.6 13.2 10.5 36.3 6.3 19.3 74.7 38.0 14.0 16.3 11.2 11.0 4.2 18.4 36.3 43.9 11.2 : 15.3Females 2005 30.9 32.4 34.5 40.5 2.5 8.6 33.0 43.5 10.6 : 9.3 24.2 30.7 25.6 14.0 10.4 9.1 38.2 5.8 21.1 75.1 39.3 14.3 16.2 10.5 11.1 4.1 18.6 39.6 42.7 13.4 : 13.5Females 2006 31.2 32.7 35.1 41.1 2.5 8.7 35.4 45.6 11.3 : 10.2 23.2 30.6 26.5 12.1 8.3 12.0 36.2 5.6 21.8 74.7 40.2 13.0 15.8 9.8 11.6 4.7 19.2 40.2 42.6 11.7 : 17.8
Males 2004 7.0 7.0 6.3 6.8 2.1 2.3 12.1 6.5 5.4 6.1 2.2 2.8 5.3 4.8 4.8 7.7 6.5 2.5 3.2 4.1 22.3 4.9 8.2 7.1 10.2 7.9 1.4 9.0 12.0 10.3 6.3 : 3.9Males 2005 7.4 7.4 6.9 7.6 1.7 2.1 12.7 7.8 4.9 : 2.3 4.5 5.7 4.6 5.0 6.3 5.1 2.5 2.7 4.5 22.6 6.1 8.0 7.0 10.0 7.2 1.3 9.2 11.5 10.4 7.3 : 3.3Males 2006 7.7 7.7 7.4 7.4 1.5 2.2 13.3 9.3 4.3 : 2.9 4.3 5.7 4.7 4.3 4.7 7.9 2.6 2.6 4.8 23.0 6.5 7.1 7.4 9.5 7.2 1.3 9.3 11.8 10.6 7.5 : 4.4
Temporary contract workers in % of total employmentTotal 2004 13.2 13.7 15.3 8.7 7.4 9.1 9.5 12.4 2.6 4.1 11.9 32.5 12.8 11.8 12.9 9.5 6.3 4.8 6.8 4.0 14.8 9.6 22.7 19.8 2.5 17.8 5.5 16.1 15.5 6.0 12.2 : :Total 2005 13.9 14.4 16.2 8.9 6.4 8.6 9.8 14.1 2.7 3.7 11.8 33.3 13.3 12.3 14.0 8.4 5.5 5.3 7.0 4.5 15.5 9.1 25.7 19.5 2.4 17.4 5.0 16.5 16.0 5.7 12.4 : :Total 2006 14.3 14.9 16.7 8.7 6.2 8.7 8.9 14.5 2.7 3.4 10.7 34.0 13.5 13.1 13.1 7.1 4.5 6.1 6.7 3.8 16.6 9.0 27.3 20.6 1.8 17.3 5.1 16.4 17.3 5.8 12.9 : 13.3
Females 2004 13.8 14.3 16.3 11.7 7.0 10.7 10.3 12.2 1.8 4.6 14.0 35.2 14.0 14.5 17.7 7.3 3.9 5.8 6.1 5.8 16.5 9.0 21.5 21.1 2.0 19.1 5.1 19.5 17.5 6.5 12.4 : :Females 2005 14.4 15.0 17.0 11.4 6.2 9.8 11.3 13.8 2.0 4.2 14.3 35.7 14.0 14.7 19.5 6.2 3.6 5.8 6.4 6.1 16.9 8.8 24.7 20.4 1.9 19.3 4.9 20.0 17.7 6.2 12.3 : :Females 2006 14.9 15.5 17.6 10.9 6.1 10.1 10.0 14.1 2.2 3.9 13.0 36.7 14.0 15.8 19.0 5.4 2.7 6.6 6.0 6.0 18.0 8.9 26.0 21.7 1.6 19.3 5.2 20.0 19.1 6.4 12.6 : 13.1
Males 2004 12.7 13.2 14.5 6.4 7.7 7.8 8.7 12.7 3.5 3.7 10.5 30.6 11.8 9.9 8.5 11.6 8.7 4.1 7.5 3.1 13.4 10.2 23.7 18.7 2.9 16.7 6.0 12.6 13.5 5.5 12.1 : :Males 2005 13.5 14.0 15.5 6.8 6.7 7.6 8.5 14.4 3.4 3.1 10.1 31.7 12.6 10.5 9.0 10.7 7.6 4.9 7.6 3.7 14.3 9.3 26.5 18.7 2.8 15.7 5.1 12.9 14.2 5.2 12.4 : :Males 2006 13.9 14.4 15.9 6.9 6.3 7.5 8.0 14.7 3.3 2.9 9.1 32.0 13.0 11.2 7.9 8.8 6.4 5.7 7.4 2.7 15.4 9.1 28.5 19.5 2.0 15.5 5.0 12.6 15.4 5.1 13.1 : 13.3
Services in % of total employmentTotal 2004 68.1 69.8 70.0 77.1 51.1 57.6 75.8 71.3 59.5 66.2 62.6 65.1 75.6 67.0 74.1 60.9 56.2 77.4 62.0 : 79.1 64.8 53.9 : 36.4 54.0 61.0 69.0 75.2 : 53.7 : :Total 2005 68.4 70.1 70.3 77.4 51.6 57.9 76.0 71.9 61.0 66.5 62.7 65.3 75.9 67.3 74.7 62.3 57.1 77.6 62.7 : 79.4 65.1 53.9 : : 54.5 62.6 69.1 75.4 : : : :Total 2006 68.7 70.3 70.6 77.5 51.8 58.4 76.0 72.3 62.0 66.7 : 65.4 76.2 67.5 75.2 61.5 58.1 77.9 63.0 : 79.8 65.9 53.9 : : 55.3 62.7 69.3 75.7 : : : :
Females 2004 80.7 83.0 83.6 89.4 58.7 70.9 87.9 84.3 71.0 86.0 72.9 84.0 87.4 80.1 86.7 72.9 66.5 91.0 74.9 : 90.8 76.6 65.5 : 40.9 65.6 74.3 84.6 89.3 : 63.9 : :Females 2005 81.2 83.4 84.1 89.2 59.7 71.1 87.7 84.6 72.5 86.8 73.5 84.4 87.9 80.9 87.5 75.4 68.0 91.6 76.1 : 90.9 77.6 65.7 : : 66.3 75.9 84.8 89.5 : : : :Females 2006 81.6 83.7 84.5 89.9 60.5 71.5 88.1 84.9 75.5 87.4 : 85.1 88.5 81.3 87.7 75.9 70.5 92.0 76.4 : 91.2 78.2 65.9 : : 67.8 76.5 85.3 89.6 : : : :
Males 2004 57.8 59.2 59.4 67.5 44.6 47.3 65.3 60.2 48.0 51.8 56.3 52.6 65.3 58.2 64.0 49.5 46.3 68.8 51.1 : 69.6 54.7 44.2 : 32.5 44.4 49.4 54.6 61.7 : 45.5 : :Males 2005 58.1 59.4 59.5 68.0 44.7 47.9 65.7 61.0 49.1 51.5 56.0 52.5 65.3 58.2 64.6 50.0 46.5 68.7 51.4 : 70.0 54.4 44.2 : : 44.9 51.3 54.5 62.4 : : : :Males 2006 58.2 59.4 59.5 67.6 44.3 48.5 65.3 61.5 48.3 51.4 : 52.0 65.2 58.3 65.5 48.0 45.9 68.7 51.6 : 70.4 55.2 44.1 : : 45.3 51.3 54.3 62.8 : : : :
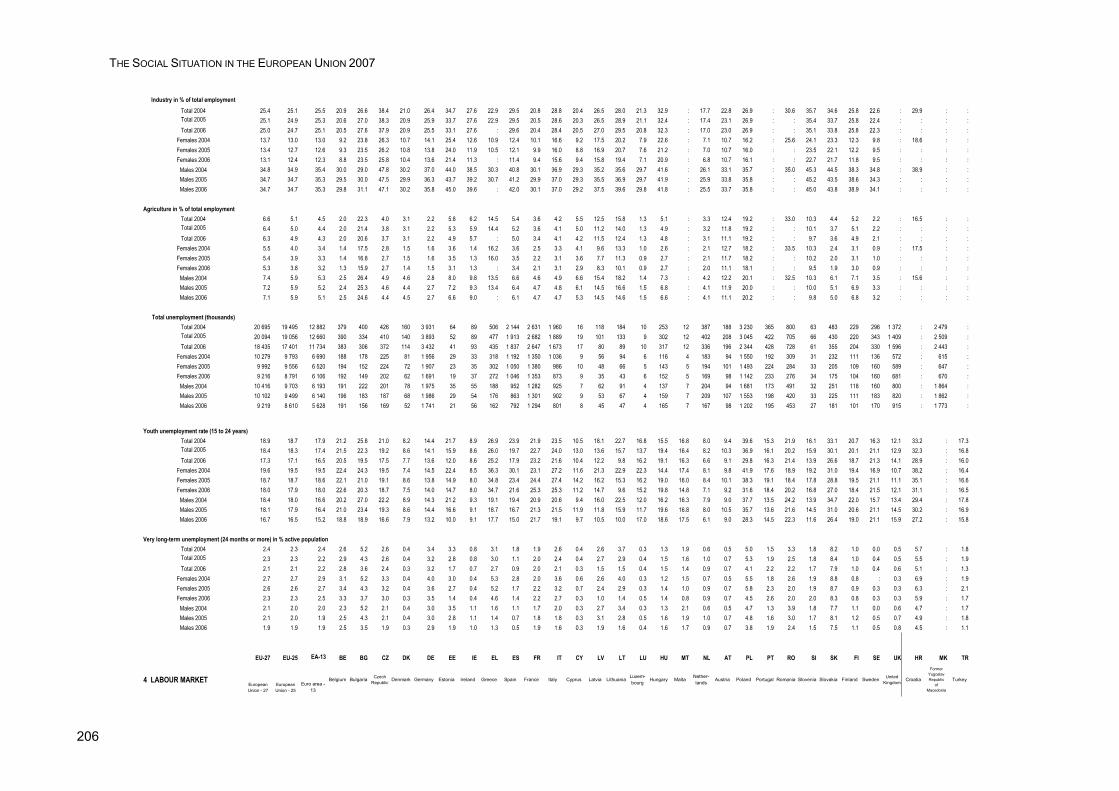
THE SOCIAL SITUATION IN THE EUROPEAN UNION 2007
206
Industry in % of total employmentTotal 2004 25.4 25.1 25.5 20.9 26.6 38.4 21.0 26.4 34.7 27.6 22.9 29.5 20.8 28.8 20.4 26.5 28.0 21.3 32.9 : 17.7 22.8 26.9 : 30.6 35.7 34.6 25.8 22.6 : 29.9 : :Total 2005 25.1 24.9 25.3 20.6 27.0 38.3 20.9 25.9 33.7 27.6 22.9 29.5 20.5 28.6 20.3 26.5 28.9 21.1 32.4 : 17.4 23.1 26.9 : : 35.4 33.7 25.8 22.4 : : : :Total 2006 25.0 24.7 25.1 20.5 27.6 37.9 20.9 25.5 33.1 27.6 : 29.6 20.4 28.4 20.5 27.0 29.5 20.8 32.3 : 17.0 23.0 26.9 : : 35.1 33.8 25.8 22.3 : : : :
Females 2004 13.7 13.0 13.0 9.2 23.8 26.3 10.7 14.1 25.4 12.6 10.9 12.4 10.1 16.6 9.2 17.5 20.2 7.9 22.6 : 7.1 10.7 16.2 : 25.6 24.1 23.3 12.3 9.8 : 18.6 : :Females 2005 13.4 12.7 12.6 9.3 23.5 26.2 10.8 13.8 24.0 11.9 10.5 12.1 9.9 16.0 8.8 16.9 20.7 7.6 21.2 : 7.0 10.7 16.0 : : 23.5 22.1 12.2 9.5 : : : :Females 2006 13.1 12.4 12.3 8.8 23.5 25.8 10.4 13.6 21.4 11.3 : 11.4 9.4 15.6 9.4 15.8 19.4 7.1 20.9 : 6.8 10.7 16.1 : : 22.7 21.7 11.8 9.5 : : : :
Males 2004 34.8 34.9 35.4 30.0 29.0 47.8 30.2 37.0 44.0 38.5 30.3 40.8 30.1 36.9 29.3 35.2 35.6 29.7 41.6 : 26.1 33.1 35.7 : 35.0 45.3 44.5 38.3 34.8 : 38.9 : :Males 2005 34.7 34.7 35.3 29.5 30.0 47.5 29.9 36.3 43.7 39.2 30.7 41.2 29.9 37.0 29.3 35.5 36.9 29.7 41.9 : 25.9 33.8 35.8 : : 45.2 43.5 38.6 34.3 : : : :Males 2006 34.7 34.7 35.3 29.8 31.1 47.1 30.2 35.8 45.0 39.6 : 42.0 30.1 37.0 29.2 37.5 39.6 29.8 41.8 : 25.5 33.7 35.8 : : 45.0 43.8 38.9 34.1 : : : :
Agriculture in % of total employmentTotal 2004 6.6 5.1 4.5 2.0 22.3 4.0 3.1 2.2 5.8 6.2 14.5 5.4 3.6 4.2 5.5 12.5 15.8 1.3 5.1 : 3.3 12.4 19.2 : 33.0 10.3 4.4 5.2 2.2 : 16.5 : :Total 2005 6.4 5.0 4.4 2.0 21.4 3.8 3.1 2.2 5.3 5.9 14.4 5.2 3.6 4.1 5.0 11.2 14.0 1.3 4.9 : 3.2 11.8 19.2 : : 10.1 3.7 5.1 2.2 : : : :Total 2006 6.3 4.9 4.3 2.0 20.6 3.7 3.1 2.2 4.9 5.7 : 5.0 3.4 4.1 4.2 11.5 12.4 1.3 4.8 : 3.1 11.1 19.2 : : 9.7 3.6 4.9 2.1 : : : :
Females 2004 5.5 4.0 3.4 1.4 17.5 2.8 1.5 1.6 3.6 1.4 16.2 3.6 2.5 3.3 4.1 9.6 13.3 1.0 2.6 : 2.1 12.7 18.2 : 33.5 10.3 2.4 3.1 0.9 : 17.5 : :Females 2005 5.4 3.9 3.3 1.4 16.8 2.7 1.5 1.6 3.5 1.3 16.0 3.5 2.2 3.1 3.6 7.7 11.3 0.9 2.7 : 2.1 11.7 18.2 : : 10.2 2.0 3.1 1.0 : : : :Females 2006 5.3 3.8 3.2 1.3 15.9 2.7 1.4 1.5 3.1 1.3 : 3.4 2.1 3.1 2.9 8.3 10.1 0.9 2.7 : 2.0 11.1 18.1 : : 9.5 1.9 3.0 0.9 : : : :
Males 2004 7.4 5.9 5.3 2.5 26.4 4.9 4.6 2.8 8.0 9.8 13.5 6.6 4.6 4.9 6.6 15.4 18.2 1.4 7.3 : 4.2 12.2 20.1 : 32.5 10.3 6.1 7.1 3.5 : 15.6 : :Males 2005 7.2 5.9 5.2 2.4 25.3 4.6 4.4 2.7 7.2 9.3 13.4 6.4 4.7 4.8 6.1 14.5 16.6 1.5 6.8 : 4.1 11.9 20.0 : : 10.0 5.1 6.9 3.3 : : : :Males 2006 7.1 5.9 5.1 2.5 24.6 4.4 4.5 2.7 6.6 9.0 : 6.1 4.7 4.7 5.3 14.5 14.6 1.5 6.6 : 4.1 11.1 20.2 : : 9.8 5.0 6.8 3.2 : : : :
Total unemployment (thousands)Total 2004 20 695 19 495 12 882 379 400 426 160 3 931 64 89 506 2 144 2 631 1 960 16 118 184 10 253 12 387 188 3 230 365 800 63 483 229 296 1 372 : 2 479 :Total 2005 20 094 19 056 12 660 390 334 410 140 3 893 52 89 477 1 913 2 682 1 889 19 101 133 9 302 12 402 208 3 045 422 705 66 430 220 343 1 409 : 2 509 :Total 2006 18 435 17 401 11 734 383 306 372 114 3 432 41 93 435 1 837 2 647 1 673 17 80 89 10 317 12 336 196 2 344 428 728 61 355 204 330 1 596 : 2 443 :
Females 2004 10 279 9 793 6 690 188 178 225 81 1 956 29 33 318 1 192 1 350 1 036 9 56 94 6 116 4 183 94 1 550 192 309 31 232 111 136 572 : 615 :Females 2005 9 992 9 556 6 520 194 152 224 72 1 907 23 35 302 1 050 1 380 986 10 48 66 5 143 5 194 101 1 493 224 284 33 205 109 160 589 : 647 :Females 2006 9 216 8 791 6 106 192 149 202 62 1 691 19 37 272 1 046 1 353 873 9 35 43 6 152 5 169 98 1 142 233 276 34 175 104 160 681 : 670 :
Males 2004 10 416 9 703 6 193 191 222 201 78 1 975 35 55 188 952 1 282 925 7 62 91 4 137 7 204 94 1 681 173 491 32 251 118 160 800 : 1 864 :Males 2005 10 102 9 499 6 140 196 183 187 68 1 986 29 54 176 863 1 301 902 9 53 67 4 159 7 209 107 1 553 198 420 33 225 111 183 820 : 1 862 :Males 2006 9 219 8 610 5 628 191 156 169 52 1 741 21 56 162 792 1 294 801 8 45 47 4 165 7 167 98 1 202 195 453 27 181 101 170 915 : 1 773 :
Youth unemployment rate (15 to 24 years)Total 2004 18.9 18.7 17.9 21.2 25.8 21.0 8.2 14.4 21.7 8.9 26.9 23.9 21.9 23.5 10.5 18.1 22.7 16.8 15.5 16.8 8.0 9.4 39.6 15.3 21.9 16.1 33.1 20.7 16.3 12.1 33.2 : 17.3Total 2005 18.4 18.3 17.4 21.5 22.3 19.2 8.6 14.1 15.9 8.6 26.0 19.7 22.7 24.0 13.0 13.6 15.7 13.7 19.4 16.4 8.2 10.3 36.9 16.1 20.2 15.9 30.1 20.1 21.1 12.9 32.3 : 16.8Total 2006 17.3 17.1 16.5 20.5 19.5 17.5 7.7 13.6 12.0 8.6 25.2 17.9 23.2 21.6 10.4 12.2 9.8 16.2 19.1 16.3 6.6 9.1 29.8 16.3 21.4 13.9 26.6 18.7 21.3 14.1 28.9 : 16.0
Females 2004 19.6 19.5 19.5 22.4 24.3 19.5 7.4 14.5 22.4 8.5 36.3 30.1 23.1 27.2 11.6 21.3 22.9 22.3 14.4 17.4 8.1 9.8 41.9 17.6 18.9 19.2 31.0 19.4 16.9 10.7 38.2 : 16.4Females 2005 18.7 18.7 18.6 22.1 21.0 19.1 8.6 13.8 14.9 8.0 34.8 23.4 24.4 27.4 14.2 16.2 15.3 16.2 19.0 16.0 8.4 10.1 38.3 19.1 18.4 17.8 28.8 19.5 21.1 11.1 35.1 : 16.6Females 2006 18.0 17.9 18.0 22.6 20.3 18.7 7.5 14.0 14.7 8.0 34.7 21.6 25.3 25.3 11.2 14.7 9.6 15.2 19.8 14.8 7.1 9.2 31.6 18.4 20.2 16.8 27.0 18.4 21.5 12.1 31.1 : 16.5
Males 2004 18.4 18.0 16.6 20.2 27.0 22.2 8.9 14.3 21.2 9.3 19.1 19.4 20.9 20.6 9.4 16.0 22.5 12.0 16.2 16.3 7.9 9.0 37.7 13.5 24.2 13.9 34.7 22.0 15.7 13.4 29.4 : 17.8Males 2005 18.1 17.9 16.4 21.0 23.4 19.3 8.6 14.4 16.6 9.1 18.7 16.7 21.3 21.5 11.9 11.8 15.9 11.7 19.6 16.8 8.0 10.5 35.7 13.6 21.6 14.5 31.0 20.6 21.1 14.5 30.2 : 16.9Males 2006 16.7 16.5 15.2 18.8 18.9 16.6 7.9 13.2 10.0 9.1 17.7 15.0 21.7 19.1 9.7 10.5 10.0 17.0 18.6 17.5 6.1 9.0 28.3 14.5 22.3 11.6 26.4 19.0 21.1 15.9 27.2 : 15.8
Very long-term unemployment (24 months or more) in % active populationTotal 2004 2.4 2.3 2.4 2.6 5.2 2.6 0.4 3.4 3.3 0.8 3.1 1.8 1.9 2.6 0.4 2.6 3.7 0.3 1.3 1.9 0.6 0.5 5.0 1.5 3.3 1.8 8.2 1.0 0.0 0.5 5.7 : 1.8Total 2005 2.3 2.3 2.2 2.9 4.3 2.6 0.4 3.2 2.8 0.8 3.0 1.1 2.0 2.4 0.4 2.7 2.9 0.4 1.5 1.6 1.0 0.7 5.3 1.9 2.5 1.8 8.4 1.0 0.4 0.5 5.5 : 1.9Total 2006 2.1 2.1 2.2 2.8 3.6 2.4 0.3 3.2 1.7 0.7 2.7 0.9 2.0 2.1 0.3 1.5 1.5 0.4 1.5 1.4 0.9 0.7 4.1 2.2 2.2 1.7 7.9 1.0 0.4 0.6 5.1 : 1.3
Females 2004 2.7 2.7 2.9 3.1 5.2 3.3 0.4 4.0 3.0 0.4 5.3 2.8 2.0 3.6 0.6 2.6 4.0 0.3 1.2 1.5 0.7 0.5 5.5 1.8 2.6 1.9 8.8 0.8 : 0.3 6.9 : 1.9Females 2005 2.6 2.6 2.7 3.4 4.3 3.2 0.4 3.6 2.7 0.4 5.2 1.7 2.2 3.2 0.7 2.4 2.9 0.3 1.4 1.0 0.9 0.7 5.8 2.3 2.0 1.9 8.7 0.9 0.3 0.3 6.3 : 2.1Females 2006 2.3 2.3 2.5 3.3 3.7 3.0 0.3 3.5 1.4 0.4 4.6 1.4 2.2 2.7 0.3 1.0 1.4 0.5 1.4 0.8 0.9 0.7 4.5 2.6 2.0 2.0 8.3 0.8 0.3 0.3 5.9 : 1.7
Males 2004 2.1 2.0 2.0 2.3 5.2 2.1 0.4 3.0 3.5 1.1 1.6 1.1 1.7 2.0 0.3 2.7 3.4 0.3 1.3 2.1 0.6 0.5 4.7 1.3 3.9 1.8 7.7 1.1 0.0 0.6 4.7 : 1.7Males 2005 2.1 2.0 1.9 2.5 4.3 2.1 0.4 3.0 2.8 1.1 1.4 0.7 1.8 1.8 0.3 3.1 2.8 0.5 1.6 1.9 1.0 0.7 4.8 1.6 3.0 1.7 8.1 1.2 0.5 0.7 4.9 : 1.8Males 2006 1.9 1.9 1.9 2.5 3.5 1.9 0.3 2.9 1.9 1.0 1.3 0.5 1.9 1.6 0.3 1.9 1.6 0.4 1.6 1.7 0.9 0.7 3.8 1.9 2.4 1.5 7.5 1.1 0.5 0.8 4.5 : 1.1
EU-27 EU-25 EA-13 BE BG CZ DK DE EE IE EL ES FR IT CY LV LT LU HU MT NL AT PL PT RO SI SK FI SE UK HR MK TR
4 LABOUR MARKETEuropeanUnion - 27
EuropeanUnion - 25
Euro area - 13
Belgium Bulgaria Czech Republic
Denmark Germany Estonia Ireland Greece Spain France Italy Cyprus Latvia LithuaniaLuxem-bourg
Hungary MaltaNether-lands
Austria Poland Portugal Romania Slovenia Slovakia Finland Sweden United Kingdom
Croatia
FormerYugoslav Republic
of Macedonia
Turkey
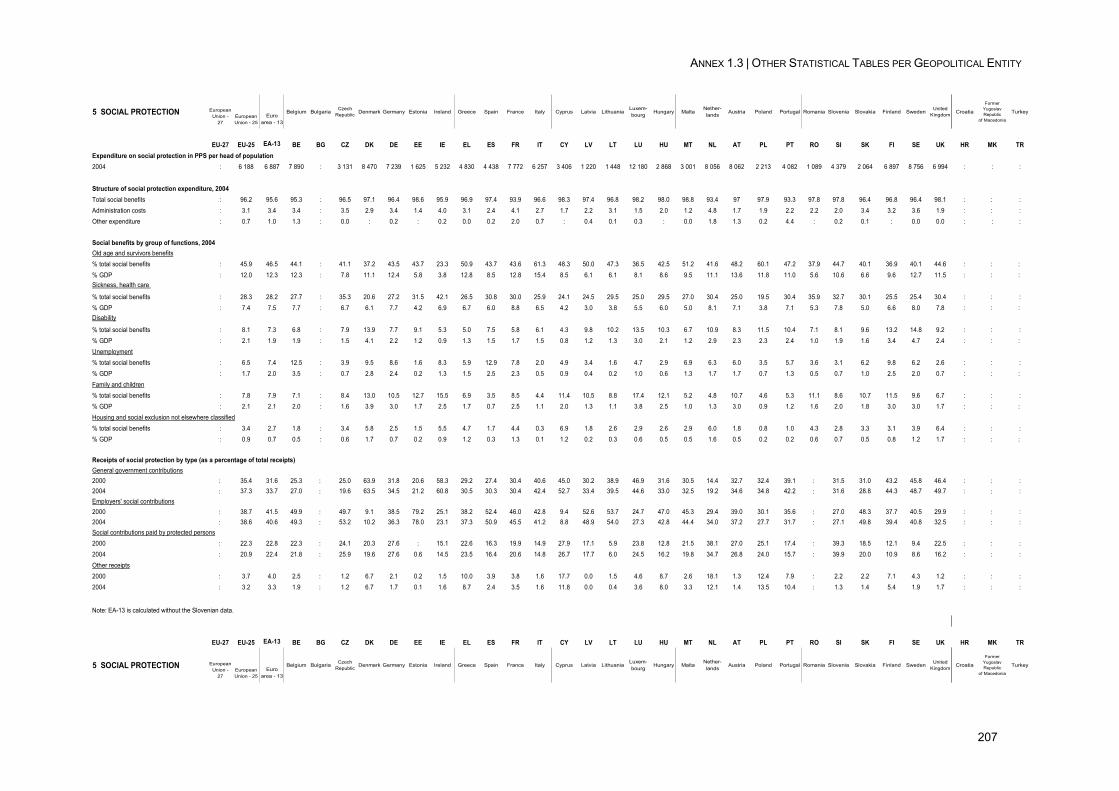
ANNEX 1.3 | OTHER STATISTICAL TABLES PER GEOPOLITICAL ENTITY
207
5 SOCIAL PROTECTION EuropeanUnion -
27EuropeanUnion - 25
Euro area - 13
Belgium Bulgaria Czech Republic Denmark Germany Estonia Ireland Greece Spain France Italy Cyprus Latvia Lithuania
Luxem-bourg Hungary Malta
Nether-lands Austria Poland Portugal Romania Slovenia Slovakia Finland Sweden United
Kingdom Croatia
FormerYugoslav Republic
of Macedonia
Turkey
EU-27 EU-25 EA-13 BE BG CZ DK DE EE IE EL ES FR IT CY LV LT LU HU MT NL AT PL PT RO SI SK FI SE UK HR MK TRExpenditure on social protection in PPS per head of population2004 : 6 188 6 887 7 890 : 3 131 8 470 7 239 1 625 5 232 4 830 4 438 7 772 6 257 3 406 1 220 1 448 12 180 2 868 3 001 8 056 8 062 2 213 4 082 1 089 4 379 2 064 6 897 8 756 6 994 : : :
Structure of social protection expenditure, 2004Total social benefits : 96.2 95.6 95.3 : 96.5 97.1 96.4 98.6 95.9 96.9 97.4 93.9 96.6 98.3 97.4 96.8 98.2 98.0 98.8 93.4 97 97.9 93.3 97.8 97.8 96.4 96.8 96.4 98.1 : : :Administration costs : 3.1 3.4 3.4 : 3.5 2.9 3.4 1.4 4.0 3.1 2.4 4.1 2.7 1.7 2.2 3.1 1.5 2.0 1.2 4.8 1.7 1.9 2.2 2.2 2.0 3.4 3.2 3.6 1.9 : : :Other expenditure : 0.7 1.0 1.3 : 0.0 : 0.2 : 0.2 0.0 0.2 2.0 0.7 : 0.4 0.1 0.3 : 0.0 1.8 1.3 0.2 4.4 : 0.2 0.1 : 0.0 0.0 : : :
Social benefits by group of functions, 2004Old age and survivors benefits% total social benefits : 45.9 46.5 44.1 : 41.1 37.2 43.5 43.7 23.3 50.9 43.7 43.6 61.3 48.3 50.0 47.3 36.5 42.5 51.2 41.6 48.2 60.1 47.2 37.9 44.7 40.1 36.9 40.1 44.6 : : : % GDP : 12.0 12.3 12.3 : 7.8 11.1 12.4 5.8 3.8 12.8 8.5 12.8 15.4 8.5 6.1 6.1 8.1 8.6 9.5 11.1 13.6 11.8 11.0 5.6 10.6 6.6 9.6 12.7 11.5 : : : Sickness, health care
% total social benefits : 28.3 28.2 27.7 : 35.3 20.6 27.2 31.5 42.1 26.5 30.8 30.0 25.9 24.1 24.5 29.5 25.0 29.5 27.0 30.4 25.0 19.5 30.4 35.9 32.7 30.1 25.5 25.4 30.4 : : :% GDP : 7.4 7.5 7.7 : 6.7 6.1 7.7 4.2 6.9 6.7 6.0 8.8 6.5 4.2 3.0 3.8 5.5 6.0 5.0 8.1 7.1 3.8 7.1 5.3 7.8 5.0 6.6 8.0 7.8 : : : Disability
% total social benefits : 8.1 7.3 6.8 : 7.9 13.9 7.7 9.1 5.3 5.0 7.5 5.8 6.1 4.3 9.8 10.2 13.5 10.3 6.7 10.9 8.3 11.5 10.4 7.1 8.1 9.6 13.2 14.8 9.2 : : :% GDP : 2.1 1.9 1.9 : 1.5 4.1 2.2 1.2 0.9 1.3 1.5 1.7 1.5 0.8 1.2 1.3 3.0 2.1 1.2 2.9 2.3 2.3 2.4 1.0 1.9 1.6 3.4 4.7 2.4 : : : Unemployment% total social benefits : 6.5 7.4 12.5 : 3.9 9.5 8.6 1.6 8.3 5.9 12.9 7.8 2.0 4.9 3.4 1.6 4.7 2.9 6.9 6.3 6.0 3.5 5.7 3.6 3.1 6.2 9.8 6.2 2.6 : : :% GDP : 1.7 2.0 3.5 : 0.7 2.8 2.4 0.2 1.3 1.5 2.5 2.3 0.5 0.9 0.4 0.2 1.0 0.6 1.3 1.7 1.7 0.7 1.3 0.5 0.7 1.0 2.5 2.0 0.7 : : : Family and children% total social benefits : 7.8 7.9 7.1 : 8.4 13.0 10.5 12.7 15.5 6.9 3.5 8.5 4.4 11.4 10.5 8.8 17.4 12.1 5.2 4.8 10.7 4.6 5.3 11.1 8.6 10.7 11.5 9.6 6.7 : : :% GDP : 2.1 2.1 2.0 : 1.6 3.9 3.0 1.7 2.5 1.7 0.7 2.5 1.1 2.0 1.3 1.1 3.8 2.5 1.0 1.3 3.0 0.9 1.2 1.6 2.0 1.8 3.0 3.0 1.7 : : : Housing and social exclusion not elsewhere classified% total social benefits : 3.4 2.7 1.8 : 3.4 5.8 2.5 1.5 5.5 4.7 1.7 4.4 0.3 6.9 1.8 2.6 2.9 2.6 2.9 6.0 1.8 0.8 1.0 4.3 2.8 3.3 3.1 3.9 6.4 : : :% GDP : 0.9 0.7 0.5 : 0.6 1.7 0.7 0.2 0.9 1.2 0.3 1.3 0.1 1.2 0.2 0.3 0.6 0.5 0.5 1.6 0.5 0.2 0.2 0.6 0.7 0.5 0.8 1.2 1.7 : : :
Receipts of social protection by type (as a percentage of total receipts)General government contributions2000 : 35.4 31.6 25.3 : 25.0 63.9 31.8 20.6 58.3 29.2 27.4 30.4 40.6 45.0 30.2 38.9 46.9 31.6 30.5 14.4 32.7 32.4 39.1 : 31.5 31.0 43.2 45.8 46.4 : : :2004 : 37.3 33.7 27.0 : 19.6 63.5 34.5 21.2 60.8 30.5 30.3 30.4 42.4 52.7 33.4 39.5 44.6 33.0 32.5 19.2 34.6 34.8 42.2 : 31.6 28.8 44.3 48.7 49.7 : : :Employers' social contributions2000 : 38.7 41.5 49.9 : 49.7 9.1 38.5 79.2 25.1 38.2 52.4 46.0 42.8 9.4 52.6 53.7 24.7 47.0 45.3 29.4 39.0 30.1 35.6 : 27.0 48.3 37.7 40.5 29.9 : : :2004 : 38.6 40.6 49.3 : 53.2 10.2 36.3 78.0 23.1 37.3 50.9 45.5 41.2 8.8 48.9 54.0 27.3 42.8 44.4 34.0 37.2 27.7 31.7 : 27.1 49.8 39.4 40.8 32.5 : : :Social contributions paid by protected persons2000 : 22.3 22.8 22.3 : 24.1 20.3 27.6 : 15.1 22.6 16.3 19.9 14.9 27.9 17.1 5.9 23.8 12.8 21.5 38.1 27.0 25.1 17.4 : 39.3 18.5 12.1 9.4 22.5 : : :2004 : 20.9 22.4 21.8 : 25.9 19.6 27.6 0.6 14.5 23.5 16.4 20.6 14.8 26.7 17.7 6.0 24.5 16.2 19.8 34.7 26.8 24.0 15.7 : 39.9 20.0 10.9 8.6 16.2 : : :Other receipts2000 : 3.7 4.0 2.5 : 1.2 6.7 2.1 0.2 1.5 10.0 3.9 3.8 1.6 17.7 0.0 1.5 4.6 8.7 2.6 18.1 1.3 12.4 7.9 : 2.2 2.2 7.1 4.3 1.2 : : :2004 : 3.2 3.3 1.9 : 1.2 6.7 1.7 0.1 1.6 8.7 2.4 3.5 1.6 11.8 0.0 0.4 3.6 8.0 3.3 12.1 1.4 13.5 10.4 : 1.3 1.4 5.4 1.9 1.7 : : :
Note: EA-13 is calculated without the Slovenian data.
EU-27 EU-25 EA-13 BE BG CZ DK DE EE IE EL ES FR IT CY LV LT LU HU MT NL AT PL PT RO SI SK FI SE UK HR MK TR
5 SOCIAL PROTECTION EuropeanUnion -
27EuropeanUnion - 25
Euro area - 13
Belgium Bulgaria Czech Republic Denmark Germany Estonia Ireland Greece Spain France Italy Cyprus Latvia Lithuania
Luxem-bourg
Hungary MaltaNether-lands
Austria Poland Portugal Romania Slovenia Slovakia Finland Sweden United Kingdom Croatia
FormerYugoslav Republic
of Macedonia
Turkey
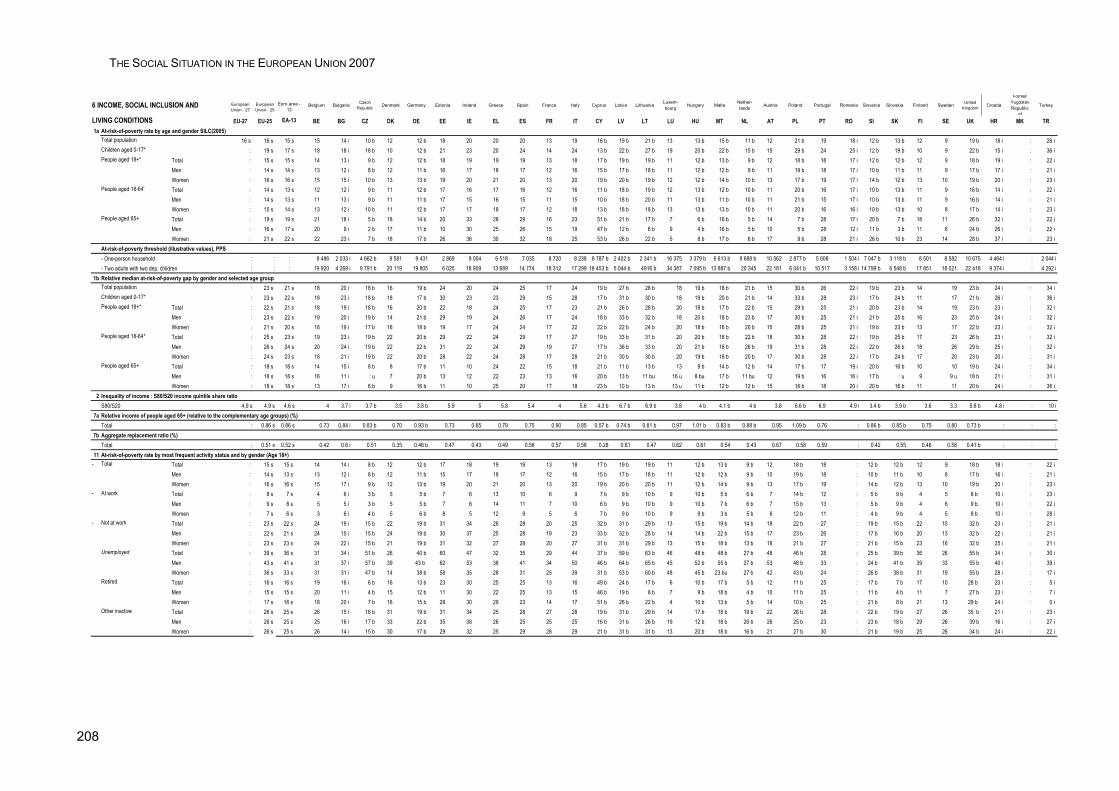
THE SOCIAL SITUATION IN THE EUROPEAN UNION 2007
208
6 INCOME, SOCIAL INCLUSION AND EuropeanUnion - 27
EuropeanUnion - 25
Euro area - 13
Belgium Bulgaria Czech Republic Denmark Germany Estonia Ireland Greece Spain France Italy Cyprus Latvia Lithuania
Luxem-bourg
Hungary MaltaNether-lands
Austria Poland Portugal Romania Slovenia Slovakia Finland Sweden United Kingdom Croatia
FormerYugoslav Republic
of
Turkey
LIVING CONDITIONS EU-27 EU-25 EA-13 BE BG CZ DK DE EE IE EL ES FR IT CY LV LT LU HU MT NL AT PL PT RO SI SK FI SE UK HR MK TR1a At-risk-of-poverty rate by age and gender SILC(2005)
Total population 16 s 16 s 15 s 15 14 i 10 b 12 12 b 18 20 20 20 13 19 16 b 19 b 21 b 13 13 b 15 b 11 b 12 21 b 19 18 i 12 b 13 b 12 9 19 b 18 i : 26 iChildren aged 0-17* : 19 s 17 s 18 18 i 18 b 10 12 b 21 23 20 24 14 24 13 b 22 b 27 b 19 20 b 22 b 15 b 15 29 b 24 25 i 12 b 19 b 10 9 22 b 15 i : 36 iPeople aged 18+* Total : 15 s 15 s 14 13 i 9 b 12 12 b 18 19 19 19 13 18 17 b 19 b 19 b 11 12 b 13 b 9 b 12 18 b 18 17 i 12 b 12 b 12 9 18 b 19 i : 22 i
Men : 14 s 14 s 13 12 i 8 b 12 11 b 16 17 18 17 12 16 15 b 17 b 18 b 11 12 b 12 b 9 b 11 19 b 18 17 i 10 b 11 b 11 9 17 b 17 i : 21 iWomen : 16 s 16 s 15 15 i 10 b 13 13 b 19 20 21 20 13 20 19 b 20 b 19 b 12 12 b 14 b 10 b 13 17 b 19 17 i 14 b 12 b 13 10 19 b 20 i : 23 i
People aged 18-64' Total : 14 s 13 s 12 12 i 9 b 11 12 b 17 16 17 16 12 16 11 b 18 b 19 b 12 13 b 12 b 10 b 11 20 b 16 17 i 10 b 13 b 11 9 16 b 14 i : 22 iMen : 14 s 13 s 11 13 i 9 b 11 11 b 17 15 16 15 11 15 10 b 18 b 20 b 11 13 b 11 b 10 b 11 21 b 15 17 i 10 b 13 b 11 9 16 b 14 i : 21 iWomen : 15 s 14 s 13 12 i 10 b 11 12 b 17 17 18 17 12 18 13 b 18 b 18 b 13 13 b 13 b 10 b 11 20 b 16 16 i 10 b 13 b 10 8 17 b 14 i : 23 i
People aged 65+ Total : 19 s 19 s 21 18 i 5 b 18 14 b 20 33 28 29 16 23 51 b 21 b 17 b 7 6 b 16 b 5 b 14 7 b 28 17 i 20 b 7 b 18 11 26 b 32 i : 22 iMen : 16 s 17 s 20 9 i 2 b 17 11 b 10 30 25 26 15 19 47 b 12 b 6 b 9 4 b 16 b 5 b 10 5 b 28 12 i 11 b 3 b 11 6 24 b 26 i : 22 iWomen : 21 s 22 s 22 23 i 7 b 18 17 b 26 36 30 32 18 25 53 b 26 b 22 b 5 8 b 17 b 6 b 17 9 b 28 21 i 26 b 10 b 23 14 28 b 37 i : 23 i
At-risk-of-poverty threshold (illustrative values), PPS - One-person household : : : 9 486 2 033 i 4 662 b 9 581 9 431 2 869 9 004 6 518 7 035 8 720 8 238 8 787 b 2 402 b 2 341 b 16 375 3 379 b 6 613 b 9 688 b 10 562 2 877 b 5 008 1 504 i 7 047 b 3 118 b 8 501 8 582 10 675 4 464 i : 2 044 i- Two adults with two dep. children : : : 19 920 4 269 i 9 791 b 20 119 19 805 6 025 18 909 13 689 14 774 18 312 17 299 18 453 b 5 044 b 4916 b 34 387 7 095 b 13 887 b 20 345 22 181 6 041 b 10 517 3 158 i 14 799 b 6 548 b 17 851 18 021 22 418 9 374 i : 4 292 i
1b Relative median at-risk-of-poverty gap by gender and selected age group Total population : 23 s 21 s 18 20 i 18 b 16 19 b 24 20 24 25 17 24 19 b 27 b 28 b 18 19 b 18 b 21 b 15 30 b 26 22 i 19 b 23 b 14 19 23 b 24 i : 34 iChildren aged 0-17* : 23 s 22 s 18 23 i 18 b 18 17 b 30 23 23 29 15 28 17 b 31 b 30 b 18 19 b 20 b 21 b 14 33 b 28 23 i 17 b 24 b 11 17 21 b 26 i : 36 iPeople aged 18+* Total : 22 s 21 s 18 19 i 18 b 16 20 b 22 18 24 25 17 23 21 b 26 b 28 b 20 18 b 17 b 22 b 15 29 b 25 21 i 20 b 23 b 14 19 23 b 23 i : 32 i
Men : 23 s 22 s 19 20 i 19 b 14 21 b 29 19 24 26 17 24 18 b 33 b 32 b 18 20 b 18 b 23 b 17 30 b 25 21 i 21 b 25 b 16 23 25 b 24 i : 32 iWomen : 21 s 20 s 16 19 i 17 b 16 18 b 19 17 24 24 17 22 22 b 22 b 24 b 20 18 b 16 b 20 b 15 28 b 25 21 i 19 b 23 b 13 17 22 b 23 i : 32 i
People aged 18-64* Total : 25 s 23 s 19 23 i 19 b 22 20 b 29 22 24 29 17 27 19 b 33 b 31 b 20 20 b 18 b 22 b 18 30 b 28 22 i 19 b 25 b 17 23 26 b 23 i : 32 iMen : 26 s 24 s 20 24 i 19 b 22 22 b 31 22 24 29 19 27 17 b 36 b 33 b 20 21 b 18 b 26 b 19 31 b 28 22 i 22 b 26 b 18 26 29 b 25 i : 32 iWomen : 24 s 23 s 18 21 i 19 b 22 20 b 28 22 24 28 17 28 21 b 30 b 30 b 20 19 b 18 b 20 b 17 30 b 28 22 i 17 b 24 b 17 20 23 b 20 i : 31 i
People aged 65+ Total : 18 s 18 s 14 15 i 8 b 8 17 b 11 10 24 22 15 18 21 b 11 b 13 b 13 9 b 14 b 12 b 14 17 b 17 19 i 20 b 16 b 10 10 19 b 24 i : 34 iMen : 18 s 18 s 16 11 i : u 7 20 b 13 12 22 23 13 16 20 b 13 b 11 bu 16 u 8 bu 17 b 11 bu 12 19 b 16 16 i 17 b : u 9 9 u 18 b 21 i : 31 iWomen : 18 s 18 s 13 17 i 6 b 9 16 b 11 10 25 20 17 18 23 b 10 b 13 b 13 u 11 b 12 b 12 b 15 16 b 18 20 i 20 b 16 b 11 11 20 b 24 i : 36 i
2 Inequality of income : S80/S20 income quintile share ratio S80/S20 4.9 s 4.9 s 4.6 s 4 3.7 i 3.7 b 3.5 3.8 b 5.9 5 5.8 5.4 4 5.6 4.3 b 6.7 b 6.9 b 3.8 4 b 4.1 b 4 b 3.8 6.6 b 6.9 4.9 i 3.4 b 3.9 b 3.6 3.3 5.8 b 4.8 i : 10 i
7a Relative income of people aged 65+ (relative to the complementary age groups) (%) Total : 0.86 s 0.86 s 0.73 0.84 i 0.83 b 0.70 0.93 b 0.73 0.65 0.79 0.75 0.90 0.85 0.57 b 0.74 b 0.81 b 0.97 1.01 b 0.83 b 0.88 b 0.95 1.09 b 0.76 : 0.86 b 0.85 b 0.75 0.80 0.73 b : : :
7b Aggregate replacement ratio (%)Total : 0.51 s 0.52 s 0.42 0.6 i 0.51 0.35 0.46 b 0.47 0.43 0.49 0.56 0.57 0.58 0.28 0.61 0.47 0.62 0.61 0.54 0.43 0.67 0.58 0.59 : 0.42 0.55 0.46 0.58 0.41 b : : :
11 At-risk-of-poverty rate by most frequent activity status and by gender (Age 18+)- Total Total : 15 s 15 s 14 14 i 8 b 12 12 b 17 18 19 19 13 18 17 b 19 b 19 b 11 12 b 13 b 9 b 12 18 b 18 : 12 b 12 b 12 9 18 b 18 i : 22 i
Men : 14 s 13 s 13 12 i 8 b 12 11 b 15 17 18 17 12 16 15 b 17 b 18 b 11 12 b 12 b 9 b 10 19 b 18 : 10 b 11 b 10 8 17 b 16 i : 21 iWomen : 16 s 16 s 15 17 i 9 b 12 13 b 19 20 21 20 13 20 19 b 20 b 20 b 11 12 b 14 b 9 b 13 17 b 19 : 14 b 12 b 13 10 19 b 20 i : 23 i
- At work Total : 8 s 7 s 4 6 i 3 b 5 5 b 7 6 13 10 6 9 7 b 9 b 10 b 9 10 b 5 b 6 b 7 14 b 12 : 5 b 9 b 4 5 8 b 10 i : 23 iMen : 9 s 8 s 5 5 i 3 b 5 5 b 7 6 14 11 7 10 6 b 9 b 10 b 9 10 b 7 b 6 b 7 15 b 13 : 5 b 9 b 4 6 9 b 10 i : 22 iWomen : 7 s 6 s 3 6 i 4 b 5 6 b 8 5 12 9 5 6 7 b 9 b 10 b 9 9 b 3 b 5 b 6 12 b 11 : 4 b 9 b 4 5 8 b 10 i : 28 i
- Not at work Total : 23 s 22 s 24 19 i 15 b 22 19 b 31 34 26 28 20 25 32 b 31 b 29 b 13 15 b 19 b 14 b 18 22 b 27 : 19 b 15 b 22 15 32 b 23 i : 21 iMen : 22 s 21 s 24 15 i 15 b 24 19 b 30 37 25 28 19 23 33 b 32 b 28 b 14 14 b 22 b 15 b 17 23 b 26 : 17 b 16 b 20 13 32 b 22 i : 21 iWomen : 23 s 23 s 24 22 i 15 b 21 19 b 31 32 27 28 20 27 31 b 31 b 29 b 13 15 b 18 b 13 b 18 21 b 27 : 21 b 15 b 23 16 32 b 25 i : 21 i
Unemployed Total : 39 s 36 s 31 34 i 51 b 26 40 b 60 47 32 35 29 44 37 b 59 b 63 b 46 48 b 48 b 27 b 48 46 b 28 : 25 b 39 b 36 26 55 b 34 i : 30 iMen : 43 s 41 s 31 37 i 57 b 39 43 b 62 53 38 41 34 50 46 b 64 b 65 b 45 52 b 55 b 27 b 53 48 b 33 : 24 b 41 b 39 33 55 b 40 i : 39 iWomen : 36 s 33 s 31 31 i 47 b 14 38 b 58 35 28 31 25 39 31 b 53 b 60 b 48 45 b 23 bu 27 b 42 43 b 24 : 26 b 38 b 31 19 55 b 28 i : 17 i
Retired Total : 16 s 16 s 19 16 i 6 b 16 13 b 23 30 25 25 13 16 49 b 24 b 17 b 6 10 b 17 b 5 b 12 11 b 25 : 17 b 7 b 17 10 28 b 23 i : 5 iMen : 15 s 15 s 20 11 i 4 b 15 12 b 11 30 22 25 13 15 46 b 19 b 8 b 7 9 b 18 b 4 b 10 11 b 25 : 11 b 4 b 11 7 27 b 23 i : 7 iWomen : 17 s 16 s 18 20 i 7 b 16 15 b 28 30 29 23 14 17 51 b 26 b 22 b 4 10 b 13 b 5 b 14 10 b 25 : 21 b 8 b 21 13 29 b 24 i : 0 i
Other inactive Total : 26 s 25 s 26 15 i 16 b 31 19 b 31 34 25 28 27 28 19 b 31 b 29 b 14 17 b 18 b 19 b 22 26 b 28 : 22 b 19 b 27 26 35 b 21 i : 23 iMen : 26 s 25 s 25 16 i 17 b 33 22 b 35 38 26 25 25 25 16 b 31 b 26 b 19 12 b 18 b 26 b 26 25 b 23 : 23 b 18 b 29 26 39 b 16 i : 27 iWomen : 26 s 25 s 26 14 i 15 b 30 17 b 29 32 25 29 28 29 21 b 31 b 31 b 13 20 b 18 b 16 b 21 27 b 30 : 21 b 19 b 25 26 34 b 24 i : 22 i
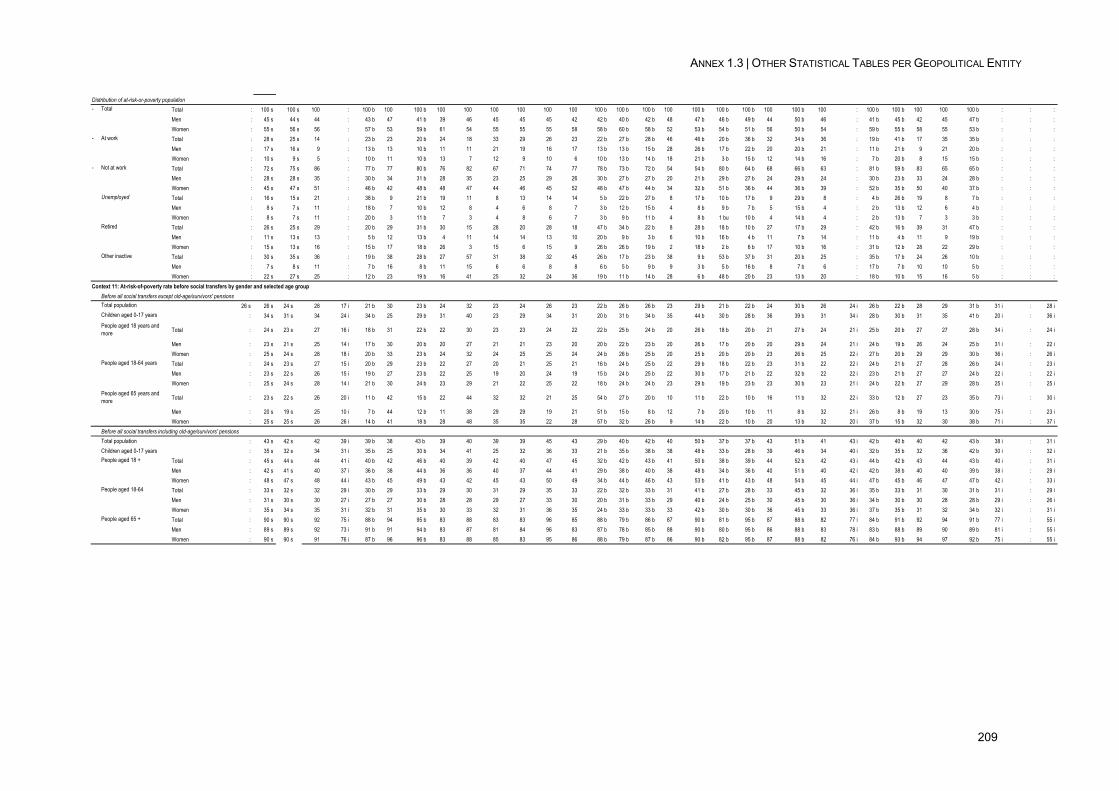
ANNEX 1.3 | OTHER STATISTICAL TABLES PER GEOPOLITICAL ENTITY
209
Distribution of at-risk-or-poverty population- Total Total : 100 s 100 s 100 : 100 b 100 100 b 100 100 100 100 100 100 100 b 100 b 100 b 100 100 b 100 b 100 b 100 100 b 100 : 100 b 100 b 100 100 100 b : : :
Men : 45 s 44 s 44 : 43 b 47 41 b 39 46 45 45 45 42 42 b 40 b 42 b 48 47 b 46 b 49 b 44 50 b 46 : 41 b 45 b 42 45 47 b : : :Women : 55 s 56 s 56 : 57 b 53 59 b 61 54 55 55 55 58 58 b 60 b 58 b 52 53 b 54 b 51 b 56 50 b 54 : 59 b 55 b 58 55 53 b : : :
- At work Total : 28 s 25 s 14 : 23 b 23 20 b 24 18 33 29 26 23 22 b 27 b 28 b 46 46 b 20 b 36 b 32 34 b 36 : 19 b 41 b 17 35 35 b : : :Men : 17 s 16 s 9 : 13 b 13 10 b 11 11 21 19 16 17 13 b 13 b 15 b 28 26 b 17 b 22 b 20 20 b 21 : 11 b 21 b 9 21 20 b : : :Women : 10 s 9 s 5 : 10 b 11 10 b 13 7 12 9 10 6 10 b 13 b 14 b 18 21 b 3 b 15 b 12 14 b 16 : 7 b 20 b 8 15 15 b : : :
- Not at work Total : 72 s 75 s 86 : 77 b 77 80 b 76 82 67 71 74 77 78 b 73 b 72 b 54 54 b 80 b 64 b 68 66 b 63 : 81 b 59 b 83 65 65 b : : :Men : 28 s 28 s 35 : 30 b 34 31 b 28 35 23 25 29 26 30 b 27 b 27 b 20 21 b 29 b 27 b 24 29 b 24 : 30 b 23 b 33 24 28 b : : :Women : 45 s 47 s 51 : 46 b 42 48 b 48 47 44 46 45 52 48 b 47 b 44 b 34 32 b 51 b 36 b 44 36 b 39 : 52 b 35 b 50 40 37 b : : :
Unemployed Total : 16 s 15 s 21 : 38 b 9 21 b 19 11 8 13 14 14 5 b 22 b 27 b 8 17 b 10 b 17 b 9 29 b 8 : 4 b 26 b 19 8 7 b : : :Men : 8 s 7 s 11 : 18 b 7 10 b 12 8 4 6 8 7 3 b 12 b 15 b 4 8 b 9 b 7 b 5 15 b 4 : 2 b 13 b 12 6 4 b : : :Women : 8 s 7 s 11 : 20 b 3 11 b 7 3 4 8 6 7 3 b 9 b 11 b 4 8 b 1 bu 10 b 4 14 b 4 : 2 b 13 b 7 3 3 b : : :
Retired Total : 26 s 25 s 29 : 20 b 29 31 b 30 15 28 20 28 18 47 b 34 b 22 b 8 28 b 18 b 10 b 27 17 b 29 : 42 b 16 b 39 31 47 b : : :Men : 11 s 13 s 13 : 5 b 12 13 b 4 11 14 14 13 10 20 b 9 b 3 b 6 10 b 16 b 4 b 11 7 b 14 : 11 b 4 b 11 9 19 b : : :Women : 15 s 13 s 16 : 15 b 17 18 b 26 3 15 6 15 9 26 b 26 b 19 b 2 18 b 2 b 6 b 17 10 b 16 : 31 b 12 b 28 22 29 b : : :
Other inactive Total : 30 s 35 s 36 : 19 b 38 28 b 27 57 31 38 32 45 26 b 17 b 23 b 38 9 b 53 b 37 b 31 20 b 25 : 35 b 17 b 24 26 10 b : : :Men : 7 s 8 s 11 : 7 b 16 8 b 11 15 6 6 8 8 6 b 5 b 9 b 9 3 b 5 b 16 b 8 7 b 6 : 17 b 7 b 10 10 5 b : : :Women : 22 s 27 s 25 : 12 b 23 19 b 16 41 25 32 24 36 19 b 11 b 14 b 28 6 b 48 b 20 b 23 13 b 20 : 18 b 10 b 15 16 5 b : : :
Context 11: At-risk-of-poverty rate before social transfers by gender and selected age group Before all social transfers except old-age/survivors' pensionsTotal population 26 s 26 s 24 s 28 17 i 21 b 30 23 b 24 32 23 24 26 23 22 b 26 b 26 b 23 29 b 21 b 22 b 24 30 b 26 24 i 26 b 22 b 28 29 31 b 31 i : 28 iChildren aged 0-17 years : 34 s 31 s 34 24 i 34 b 25 29 b 31 40 23 29 34 31 20 b 31 b 34 b 35 44 b 30 b 28 b 36 39 b 31 34 i 28 b 30 b 31 35 41 b 20 i : 36 iPeople aged 18 years and more Total : 24 s 23 s 27 16 i 18 b 31 22 b 22 30 23 23 24 22 22 b 25 b 24 b 20 26 b 18 b 20 b 21 27 b 24 21 i 25 b 20 b 27 27 28 b 34 i : 24 i
Men : 23 s 21 s 25 14 i 17 b 30 20 b 20 27 21 21 23 20 20 b 22 b 23 b 20 26 b 17 b 20 b 20 29 b 24 21 i 24 b 19 b 26 24 25 b 31 i : 22 iWomen : 25 s 24 s 28 18 i 20 b 33 23 b 24 32 24 25 25 24 24 b 26 b 25 b 20 25 b 20 b 20 b 23 26 b 25 22 i 27 b 20 b 29 29 30 b 36 i : 26 i
People aged 18-64 years Total : 24 s 23 s 27 15 i 20 b 29 23 b 22 27 20 21 25 21 16 b 24 b 25 b 22 29 b 18 b 22 b 23 31 b 22 22 i 24 b 21 b 27 28 26 b 24 i : 23 iMen : 23 s 22 s 26 15 i 19 b 27 23 b 22 25 19 20 24 19 15 b 24 b 25 b 22 30 b 17 b 21 b 22 32 b 22 22 i 23 b 21 b 27 27 24 b 22 i : 22 iWomen : 25 s 24 s 28 14 i 21 b 30 24 b 23 29 21 22 25 22 18 b 24 b 24 b 23 29 b 19 b 23 b 23 30 b 23 21 i 24 b 22 b 27 29 28 b 25 i : 25 i
People aged 65 years and more Total : 23 s 22 s 26 20 i 11 b 42 15 b 22 44 32 32 21 25 54 b 27 b 20 b 10 11 b 22 b 10 b 16 11 b 32 22 i 33 b 12 b 27 23 35 b 73 i : 30 i
Men : 20 s 19 s 25 10 i 7 b 44 12 b 11 38 29 29 19 21 51 b 15 b 8 b 12 7 b 20 b 10 b 11 8 b 32 21 i 26 b 8 b 19 13 30 b 75 i : 23 iWomen : 25 s 25 s 26 26 i 14 b 41 18 b 28 48 35 35 22 28 57 b 32 b 26 b 9 14 b 22 b 10 b 20 13 b 32 20 i 37 b 15 b 32 30 38 b 71 i : 37 i
Before all social transfers including old-age/survivors' pensions: 43 s 42 s 42 39 i 39 b 38 43 b 39 40 39 39 45 43 29 b 40 b 42 b 40 50 b 37 b 37 b 43 51 b 41 43 i 42 b 40 b 40 42 43 b 38 i : 31 i: 35 s 32 s 34 31 i 35 b 25 30 b 34 41 25 32 36 33 21 b 35 b 38 b 38 48 b 33 b 28 b 39 46 b 34 40 i 32 b 35 b 32 36 42 b 30 i : 32 i
People aged 18 + Total : 45 s 44 s 44 41 i 40 b 42 46 b 40 39 42 40 47 45 32 b 42 b 43 b 41 50 b 38 b 39 b 44 52 b 42 43 i 44 b 42 b 43 44 43 b 40 i : 31 iMen : 42 s 41 s 40 37 i 36 b 38 44 b 36 36 40 37 44 41 29 b 38 b 40 b 38 48 b 34 b 36 b 40 51 b 40 42 i 42 b 38 b 40 40 39 b 38 i : 29 iWomen : 48 s 47 s 48 44 i 43 b 45 49 b 43 42 45 43 50 49 34 b 44 b 46 b 43 53 b 41 b 43 b 48 54 b 45 44 i 47 b 45 b 46 47 47 b 42 i : 33 i
People aged 18-64 Total : 33 s 32 s 32 29 i 30 b 29 33 b 29 30 31 29 35 33 22 b 32 b 33 b 31 41 b 27 b 28 b 33 45 b 32 36 i 35 b 33 b 31 30 31 b 31 i : 29 iMen : 31 s 30 s 30 27 i 27 b 27 30 b 28 28 29 27 33 30 20 b 31 b 33 b 29 40 b 24 b 25 b 30 45 b 30 36 i 34 b 30 b 30 28 28 b 29 i : 26 iWomen : 35 s 34 s 35 31 i 32 b 31 35 b 30 33 32 31 36 35 24 b 33 b 33 b 33 42 b 30 b 30 b 36 45 b 33 36 i 37 b 35 b 31 32 34 b 32 i : 31 i
People aged 65 + Total : 90 s 90 s 92 75 i 88 b 94 95 b 83 88 83 83 96 85 88 b 79 b 86 b 87 90 b 81 b 95 b 87 88 b 82 77 i 84 b 91 b 92 94 91 b 77 i : 55 iMen : 89 s 89 s 92 73 i 91 b 91 94 b 83 87 81 84 96 83 87 b 78 b 85 b 88 90 b 80 b 95 b 86 88 b 83 78 i 83 b 88 b 89 90 89 b 81 i : 55 iWomen : 90 s 90 s 91 76 i 87 b 96 96 b 83 88 85 83 95 86 88 b 79 b 87 b 86 90 b 82 b 95 b 87 88 b 82 76 i 84 b 93 b 94 97 92 b 75 i : 55 i
Total populationChildren aged 0-17 years
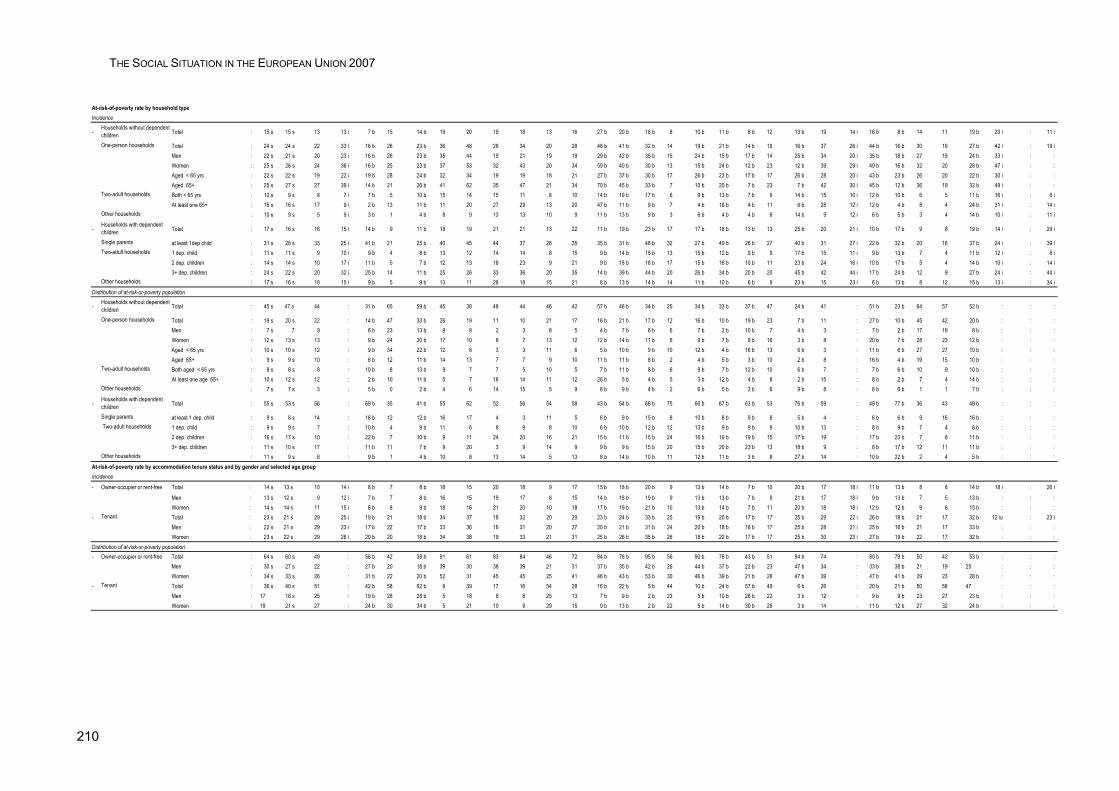
THE SOCIAL SITUATION IN THE EUROPEAN UNION 2007
210
At-risk-of-poverty rate by household typeIncidence
-Households without dependent children Total : 15 s 15 s 13 13 i 7 b 15 14 b 19 20 19 18 13 16 27 b 20 b 18 b 8 10 b 11 b 8 b 12 13 b 19 14 i 16 b 8 b 14 11 19 b 23 i : 11 i
One-person households Total : 24 s 24 s 22 33 i 16 b 26 23 b 36 48 28 34 20 28 48 b 41 b 32 b 14 19 b 21 b 14 b 19 16 b 37 26 i 44 b 16 b 30 19 27 b 42 i : 19 iMen : 22 s 21 s 20 23 i 16 b 26 23 b 35 44 19 21 19 19 29 b 42 b 35 b 15 24 b 15 b 17 b 14 25 b 34 20 i 35 b 18 b 27 19 24 b 33 i : :Women : 25 s 26 s 24 36 i 16 b 25 23 b 37 53 32 43 20 34 59 b 40 b 30 b 13 15 b 24 b 12 b 23 12 b 39 29 i 49 b 16 b 32 20 28 b 47 i : :Aged < 65 yrs : 22 s 22 s 19 22 i 19 b 28 24 b 32 34 19 19 18 21 27 b 37 b 30 b 17 26 b 23 b 17 b 17 26 b 28 20 i 43 b 23 b 26 20 22 b 30 i : :Aged 65+ : 25 s 27 s 27 39 i 14 b 21 20 b 41 62 35 47 21 34 70 b 45 b 33 b 7 10 b 20 b 7 b 23 7 b 42 30 i 45 b 12 b 36 19 32 b 49 i : :
Two-adult households Both < 65 yrs : 10 s 9 s 8 7 i 7 b 5 10 b 15 14 15 11 8 10 14 b 19 b 17 b 6 9 b 13 b 7 b 9 14 b 15 10 i 12 b 10 b 6 5 11 b 16 i : 6 iAt least one 65+ : 16 s 16 s 17 9 i 2 b 13 11 b 11 20 27 29 13 20 47 b 11 b 9 b 7 4 b 18 b 4 b 11 6 b 28 12 i 12 b 4 b 8 4 24 b 31 i : 14 i
Other households : 10 s 9 s 5 9 i 3 b 1 4 b 8 9 13 13 10 9 11 b 13 b 9 b 3 6 b 4 b 4 b 6 14 b 9 12 i 6 b 5 b 3 4 14 b 10 i : 11 i
-Households with dependent children Total : 17 s 16 s 16 15 i 14 b 9 11 b 18 19 21 21 13 22 11 b 19 b 23 b 17 17 b 18 b 13 b 13 25 b 20 21 i 10 b 17 b 9 8 19 b 14 i : 29 i
Single parents at least 1dep child : 31 s 28 s 33 25 i 41 b 21 25 b 40 45 44 37 26 35 35 b 31 b 48 b 32 27 b 49 b 26 b 27 40 b 31 27 i 22 b 32 b 20 18 37 b 24 i : 39 iTwo-adult households 1 dep. child : 11 s 11 s 9 10 i 9 b 4 8 b 13 12 14 14 8 15 9 b 14 b 15 b 13 15 b 12 b 9 b 9 17 b 15 11 i 9 b 13 b 7 4 11 b 12 i : 8 i
2 dep. children : 14 s 14 s 10 17 i 11 b 5 7 b 12 13 18 23 9 21 9 b 18 b 18 b 17 15 b 16 b 10 b 11 23 b 24 16 i 10 b 17 b 5 4 14 b 10 i : 14 i3+ dep. children : 24 s 22 s 20 32 i 25 b 14 11 b 25 26 33 36 20 35 14 b 39 b 44 b 20 26 b 34 b 20 b 20 45 b 42 44 i 17 b 24 b 12 9 27 b 24 i : 44 i
Other households : 17 s 16 s 18 15 i 9 b 5 9 b 13 11 28 18 15 21 8 b 13 b 14 b 14 11 b 10 b 6 b 9 23 b 15 23 i 6 b 13 b 8 12 15 b 13 i : 34 iDistribution of at-risk-or-poverty population
-Households without dependent children Total : 45 s 47 s 44 : 31 b 65 59 b 45 38 48 44 46 42 57 b 46 b 34 b 25 34 b 33 b 37 b 47 24 b 41 : 51 b 23 b 64 57 52 b : : :
One-person households Total : 19 s 20 s 22 : 14 b 47 33 b 26 19 11 10 21 17 16 b 21 b 17 b 12 16 b 10 b 19 b 23 7 b 11 : 27 b 10 b 45 42 20 b : : :Men : 7 s 7 9 : 6 b 23 13 b 9 8 2 3 8 5 4 b 7 b 6 b 6 7 b 2 b 10 b 7 4 b 3 : 7 b 2 b 17 19 8 b : : :Women : 12 s 13 s 13 : 9 b 24 20 b 17 10 8 7 13 12 12 b 14 b 11 b 6 9 b 7 b 9 b 16 3 b 8 : 20 b 7 b 28 23 12 b : : :Aged < 65 yrs : 10 s 10 s 12 : 9 b 34 22 b 12 6 3 3 11 6 5 b 10 b 9 b 10 12 b 4 b 16 b 13 6 b 3 : 11 b 6 b 27 27 10 b : : :Aged 65+ : 9 s 9 s 10 : 6 b 12 11 b 14 13 7 7 9 10 11 b 11 b 8 b 2 4 b 5 b 3 b 10 2 b 8 : 16 b 4 b 19 15 10 b : : :
Two-adult households Both aged < 65 yrs : 8 s 8 s 8 : 10 b 8 13 b 9 7 7 5 10 5 7 b 11 b 8 b 6 9 b 7 b 12 b 10 6 b 7 : 7 b 6 b 10 9 10 b : : :At least one age 65+ : 10 s 12 s 12 : 2 b 10 11 b 5 7 16 14 11 12 26 b 5 b 4 b 5 3 b 12 b 4 b 8 2 b 15 : 8 b 2 b 7 4 14 b : : :
Other households : 7 s 7 s 3 : 5 b 0 2 b 4 6 14 15 5 9 8 b 9 b 4 b 2 6 b 5 b 2 b 6 9 b 8 : 8 b 6 b 1 1 7 b : : :
-Households with dependent children Total : 55 s 53 s 56 : 69 b 35 41 b 55 62 52 56 54 58 43 b 54 b 66 b 75 66 b 67 b 63 b 53 76 b 59 : 49 b 77 b 36 43 49 b : : :
Single parents at least 1 dep. child : 9 s 8 s 14 : 16 b 12 12 b 16 17 4 3 11 5 6 b 9 b 15 b 8 10 b 8 b 9 b 8 5 b 4 : 6 b 6 b 9 16 16 b : : : Two-adult households 1 dep. child : 9 s 9 s 7 : 10 b 4 9 b 11 6 8 9 8 10 6 b 10 b 12 b 12 13 b 9 b 9 b 9 10 b 13 : 8 b 9 b 7 4 6 b : : :
2 dep. children : 16 s 17 s 10 : 22 b 7 10 b 9 11 24 20 16 21 15 b 11 b 15 b 24 16 b 19 b 19 b 15 17 b 19 : 17 b 23 b 7 8 11 b : : :3+ dep. children : 11 s 10 s 17 : 11 b 11 7 b 9 20 3 9 14 9 9 b 9 b 15 b 20 15 b 20 b 23 b 13 18 b 9 : 8 b 17 b 12 11 11 b : : :
Other households : 11 s 9 s 8 : 9 b 1 4 b 10 8 13 14 5 13 8 b 14 b 10 b 11 12 b 11 b 3 b 8 27 b 14 : 10 b 22 b 2 4 5 b : : :At-risk-of-poverty rate by accommodation tenure status and by gender and selected age groupIncidence
- Owner-occupier or rent-free Total : 14 s 13 s 10 14 i 8 b 7 8 b 18 15 20 18 9 17 15 b 18 b 20 b 9 13 b 14 b 7 b 10 20 b 17 18 i 11 b 13 b 8 6 14 b 18 i : 26 i
Men : 13 s 12 s 9 12 i 7 b 7 8 b 16 15 19 17 8 15 14 b 18 b 19 b 9 13 b 13 b 7 b 9 21 b 17 18 i 9 b 13 b 7 5 13 b : : :Women : 14 s 14 s 11 15 i 8 b 8 9 b 18 16 21 20 10 18 17 b 19 b 21 b 10 13 b 14 b 7 b 11 20 b 18 18 i 12 b 12 b 9 6 15 b : : :
- Tenant Total : 23 s 21 s 29 25 i 19 b 21 18 b 34 37 18 32 20 29 23 b 24 b 33 b 25 19 b 20 b 17 b 17 25 b 29 22 i 26 b 18 b 21 17 32 b 12 iu : 23 iMen : 22 s 21 s 29 23 i 17 b 22 17 b 33 36 16 31 20 27 20 b 21 b 31 b 24 20 b 18 b 18 b 17 25 b 28 21 i 25 b 16 b 21 17 33 b : : :Women : 23 s 22 s 29 26 i 20 b 20 18 b 34 38 19 33 21 31 25 b 26 b 35 b 26 18 b 22 b 17 b 17 25 b 30 23 i 27 b 19 b 22 17 32 b : : :
Distribution of at-risk-or-poverty population- Owner-occupier or rent-free Total : 64 s 60 s 49 : 58 b 42 38 b 91 61 83 84 46 72 84 b 78 b 95 b 56 90 b 76 b 43 b 51 94 b 74 : 80 b 79 b 50 42 53 b : : :
Men : 30 s 27 s 22 : 27 b 20 18 b 39 30 38 39 21 31 37 b 35 b 42 b 26 44 b 37 b 22 b 23 47 b 34 : 33 b 38 b 21 19 25 : : :Women : 34 s 33 s 26 : 31 b 22 20 b 52 31 45 45 25 41 46 b 43 b 53 b 30 46 b 39 b 21 b 28 47 b 39 : 47 b 41 b 29 23 28 b : : :
- Tenant Total : 36 s 40 s 51 : 42 b 58 62 b 9 39 17 16 54 28 16 b 22 b 5 b 44 10 b 24 b 57 b 49 6 b 26 : 20 b 21 b 50 58 47 : : :Men : 17 18 s 25 : 19 b 28 28 b 5 18 8 8 25 13 7 b 9 b 2 b 23 5 b 10 b 28 b 22 3 b 12 : 9 b 9 b 23 27 23 b : : :Women : 19 21 s 27 : 24 b 30 34 b 5 21 10 9 29 15 9 b 13 b 2 b 22 5 b 14 b 30 b 26 3 b 14 : 11 b 12 b 27 32 24 b : : :
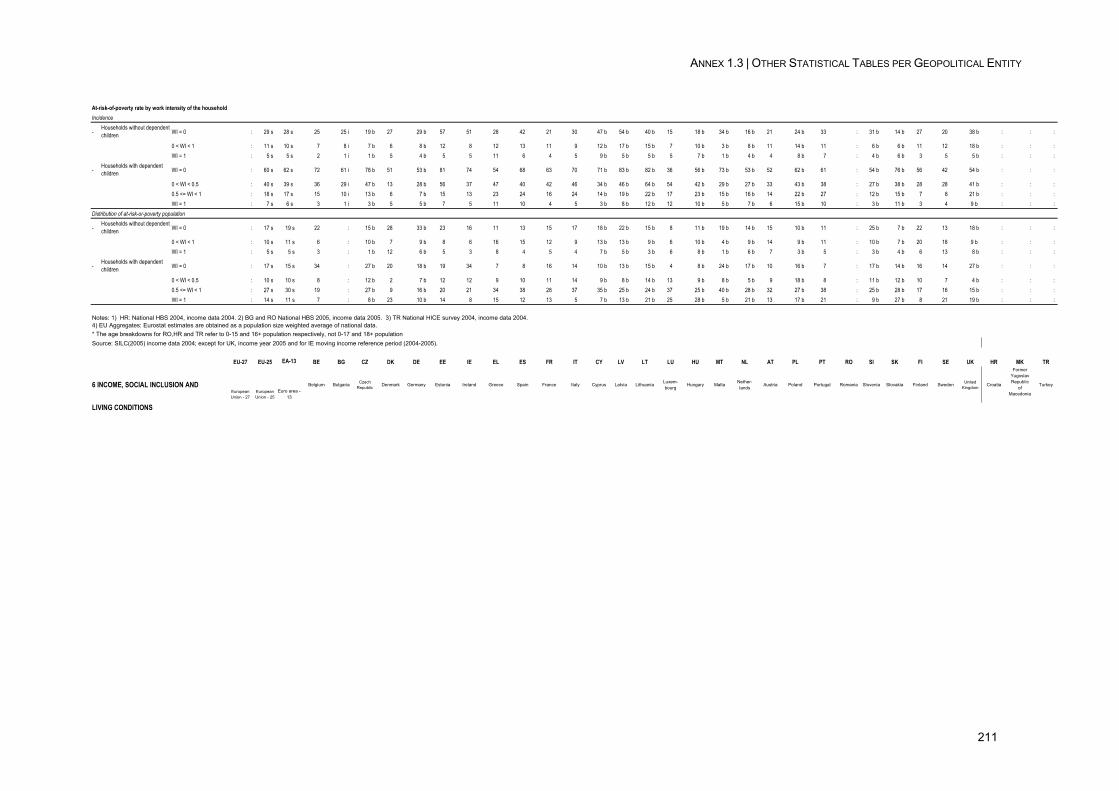
ANNEX 1.3 | OTHER STATISTICAL TABLES PER GEOPOLITICAL ENTITY
211
At-risk-of-poverty rate by work intensity of the householdIncidence
-Households without dependent children WI = 0 : 29 s 28 s 25 25 i 19 b 27 29 b 57 51 28 42 21 30 47 b 54 b 40 b 15 18 b 34 b 16 b 21 24 b 33 : 31 b 14 b 27 20 38 b : : :
0 < WI < 1 : 11 s 10 s 7 8 i 7 b 6 8 b 12 8 12 13 11 9 12 b 17 b 15 b 7 10 b 3 b 8 b 11 14 b 11 : 6 b 6 b 11 12 18 b : : :WI = 1 : 5 s 5 s 2 1 i 1 b 5 4 b 5 5 11 6 4 5 9 b 5 b 5 b 5 7 b 1 b 4 b 4 8 b 7 : 4 b 6 b 3 5 5 b : : :
-Households with dependent children WI = 0 : 60 s 62 s 72 61 i 78 b 51 53 b 81 74 54 68 63 70 71 b 83 b 82 b 36 56 b 73 b 53 b 52 62 b 61 : 54 b 76 b 56 42 54 b : : :
0 < WI < 0.5 : 40 s 39 s 36 29 i 47 b 13 28 b 56 37 47 40 42 46 34 b 46 b 64 b 54 42 b 29 b 27 b 33 43 b 38 : 27 b 38 b 28 28 41 b : : :0.5 <= WI < 1 : 18 s 17 s 15 10 i 13 b 6 7 b 15 13 23 24 16 24 14 b 19 b 22 b 17 23 b 15 b 16 b 14 22 b 27 : 12 b 15 b 7 8 21 b : : :WI = 1 : 7 s 6 s 3 1 i 3 b 5 5 b 7 5 11 10 4 5 3 b 8 b 12 b 12 10 b 5 b 7 b 6 15 b 10 : 3 b 11 b 3 4 9 b : : :
Distribution of at-risk-or-poverty population
-Households without dependent children WI = 0 : 17 s 19 s 22 : 15 b 28 33 b 23 16 11 13 15 17 18 b 22 b 15 b 8 11 b 19 b 14 b 15 10 b 11 : 25 b 7 b 22 13 18 b : : :
0 < WI < 1 : 10 s 11 s 6 : 10 b 7 9 b 8 6 16 15 12 9 13 b 13 b 9 b 6 10 b 4 b 9 b 14 9 b 11 : 10 b 7 b 20 18 9 b : : :WI = 1 : 5 s 5 s 3 : 1 b 12 6 b 5 3 8 4 5 4 7 b 5 b 3 b 6 8 b 1 b 6 b 7 3 b 5 : 3 b 4 b 6 13 8 b : : :
-Households with dependent children WI = 0 : 17 s 15 s 34 : 27 b 20 18 b 19 34 7 8 16 14 10 b 13 b 15 b 4 8 b 24 b 17 b 10 16 b 7 : 17 b 14 b 16 14 27 b : : :
0 < WI < 0.5 : 10 s 10 s 8 : 12 b 2 7 b 12 12 9 10 11 14 9 b 8 b 14 b 13 9 b 8 b 5 b 9 18 b 8 : 11 b 12 b 10 7 4 b : : :0.5 <= WI < 1 : 27 s 30 s 19 : 27 b 9 16 b 20 21 34 38 28 37 35 b 25 b 24 b 37 25 b 40 b 28 b 32 27 b 38 : 25 b 28 b 17 16 15 b : : :WI = 1 : 14 s 11 s 7 : 8 b 23 10 b 14 8 15 12 13 5 7 b 13 b 21 b 25 28 b 5 b 21 b 13 17 b 21 : 9 b 27 b 8 21 19 b : : :
Source: SILC(2005) income data 2004; except for UK, income year 2005 and for IE moving income reference period (2004-2005).
EU-27 EU-25 EA-13 BE BG CZ DK DE EE IE EL ES FR IT CY LV LT LU HU MT NL AT PL PT RO SI SK FI SE UK HR MK TR
6 INCOME, SOCIAL INCLUSION AND EuropeanUnion - 27
EuropeanUnion - 25
Euro area - 13
Belgium Bulgaria Czech Republic
Denmark Germany Estonia Ireland Greece Spain France Italy Cyprus Latvia Lithuania Luxem-bourg
Hungary Malta Nether-lands
Austria Poland Portugal Romania Slovenia Slovakia Finland Sweden United Kingdom
Croatia
FormerYugoslav Republic
of Macedonia
Turkey
LIVING CONDITIONS
Notes: 1) HR: National HBS 2004, income data 2004. 2) BG and RO National HBS 2005, income data 2005. 3) TR National HICE survey 2004, income data 2004.4) EU Aggregates: Eurostat estimates are obtained as a population size weighted average of national data.* The age breakdowns for RO,HR and TR refer to 0-15 and 16+ population respectively, not 0-17 and 18+ population
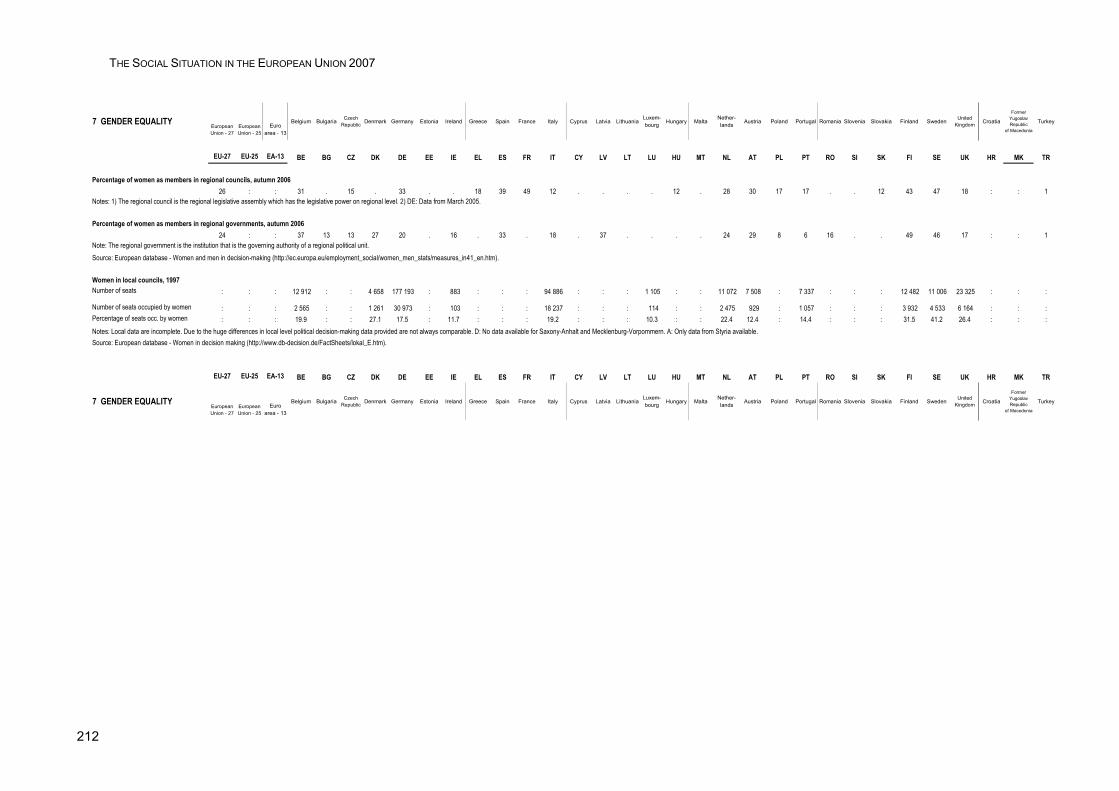
THE SOCIAL SITUATION IN THE EUROPEAN UNION 2007
212
7 GENDER EQUALITYEuropeanUnion - 27
EuropeanUnion - 25
Euro area - 13
Belgium Bulgaria Czech Republic Denmark Germany Estonia Ireland Greece Spain France Italy Cyprus Latvia Lithuania
Luxem-bourg Hungary Malta
Nether-lands Austria Poland Portugal Romania Slovenia Slovakia Finland Sweden United
Kingdom Croatia
FormerYugoslav Republic
of Macedonia
Turkey
EU-27 EU-25 EA-13 BE BG CZ DK DE EE IE EL ES FR IT CY LV LT LU HU MT NL AT PL PT RO SI SK FI SE UK HR MK TR
26 : : 31 . 15 . 33 . . 18 39 49 12 . . . . 12 . 28 30 17 17 . . 12 43 47 18 : : 1Notes: 1) The regional council is the regional legislative assembly which has the legislative power on regional level. 2) DE: Data from March 2005.
24 : : 37 13 13 27 20 . 16 . 33 . 18 . 37 . . . . 24 29 8 6 16 . . 49 46 17 : : 1Note: The regional government is the institution that is the governing authority of a regional political unit.Source: European database - Women and men in decision-making (http://ec.europa.eu/employment_social/women_men_stats/measures_in41_en.htm).
Number of seats : : : 12 912 : : 4 658 177 193 : 883 : : : 94 886 : : : 1 105 : : 11 072 7 508 : 7 337 : : : 12 482 11 006 23 325 : : :
Number of seats occupied by women : : : 2 565 : : 1 261 30 973 : 103 : : : 18 237 : : : 114 : : 2 475 929 : 1 057 : : : 3 932 4 533 6 164 : : :Percentage of seats occ. by women : : : 19.9 : : 27.1 17.5 : 11.7 : : : 19.2 : : : 10.3 : : 22.4 12.4 : 14.4 : : : 31.5 41.2 26.4 : : :Notes: Local data are incomplete. Due to the huge differences in local level political decision-making data provided are not always comparable. D: No data available for Saxony-Anhalt and Mecklenburg-Vorpommern. A: Only data from Styria available.Source: European database - Women in decision making (http://www.db-decision.de/FactSheets/lokal_E.htm).
EU-27 EU-25 EA-13 BE BG CZ DK DE EE IE EL ES FR IT CY LV LT LU HU MT NL AT PL PT RO SI SK FI SE UK HR MK TR
7 GENDER EQUALITYEuropeanUnion - 27
EuropeanUnion - 25
Euro area - 13
Belgium Bulgaria Czech Republic Denmark Germany Estonia Ireland Greece Spain France Italy Cyprus Latvia Lithuania
Luxem-bourg Hungary Malta
Nether-lands Austria Poland Portugal Romania Slovenia Slovakia Finland Sweden United
Kingdom Croatia
FormerYugoslav Republic
of Macedonia
Turkey
Percentage of women as members in regional councils, autumn 2006
Percentage of women as members in regional governments, autumn 2006
Women in local councils, 1997
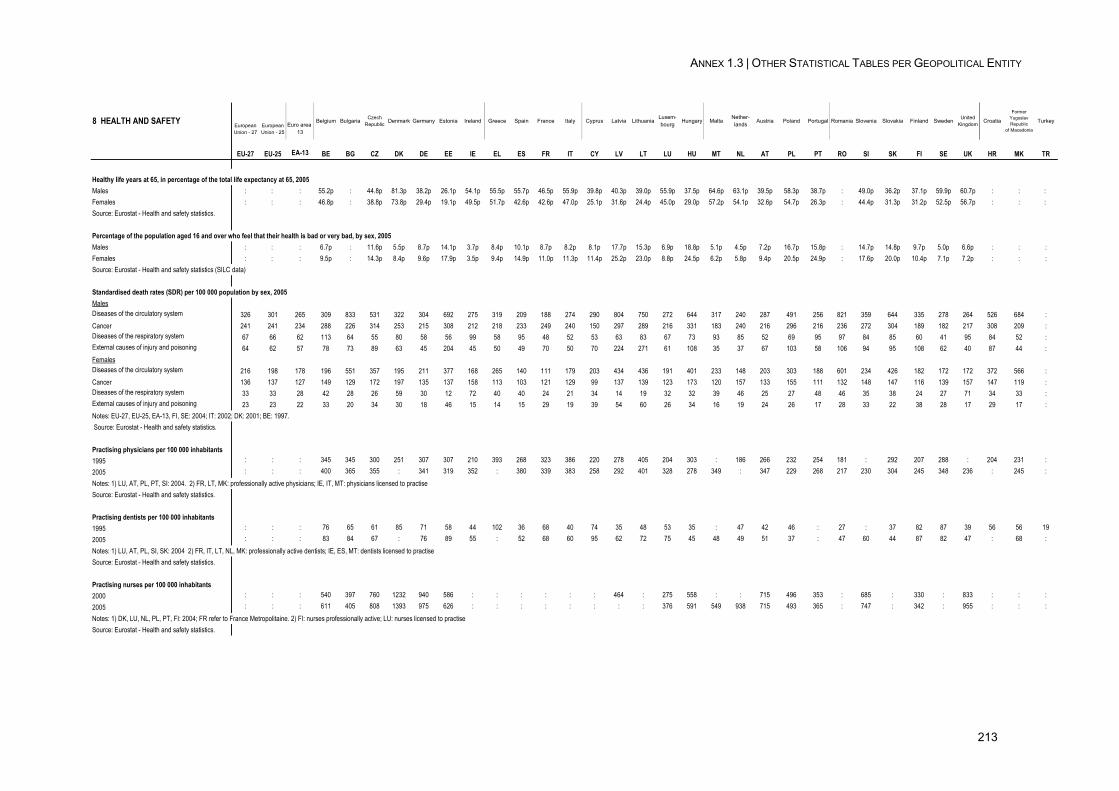
ANNEX 1.3 | OTHER STATISTICAL TABLES PER GEOPOLITICAL ENTITY
213
8 HEALTH AND SAFETY EuropeanUnion - 27
EuropeanUnion - 25
Euro area 13
Belgium Bulgaria Czech Republic Denmark Germany Estonia Ireland Greece Spain France Italy Cyprus Latvia Lithuania
Luxem-bourg Hungary Malta
Nether-lands Austria Poland Portugal Romania Slovenia Slovakia Finland Sweden United
Kingdom Croatia
FormerYugoslav Republic
of Macedonia
Turkey
EU-27 EU-25 EA-13 BE BG CZ DK DE EE IE EL ES FR IT CY LV LT LU HU MT NL AT PL PT RO SI SK FI SE UK HR MK TR
Healthy life years at 65, in percentage of the total life expectancy at 65, 2005Males : : : 55.2p : 44.8p 81.3p 38.2p 26.1p 54.1p 55.5p 55.7p 46.5p 55.9p 39.8p 40.3p 39.0p 55.9p 37.5p 64.6p 63.1p 39.5p 58.3p 38.7p : 49.0p 36.2p 37.1p 59.9p 60.7p : : : Females : : : 46.8p : 38.8p 73.8p 29.4p 19.1p 49.5p 51.7p 42.6p 42.6p 47.0p 25.1p 31.6p 24.4p 45.0p 29.0p 57.2p 54.1p 32.6p 54.7p 26.3p : 44.4p 31.3p 31.2p 52.5p 56.7p : : : Source: Eurostat - Health and safety statistics.
Percentage of the population aged 16 and over who feel that their health is bad or very bad, by sex, 2005Males : : : 6.7p : 11.6p 5.5p 8.7p 14.1p 3.7p 8.4p 10.1p 8.7p 8.2p 8.1p 17.7p 15.3p 6.9p 18.8p 5.1p 4.5p 7.2p 16.7p 15.8p : 14.7p 14.8p 9.7p 5.0p 6.6p : : :Females : : : 9.5p : 14.3p 8.4p 9.6p 17.9p 3.5p 9.4p 14.9p 11.0p 11.3p 11.4p 25.2p 23.0p 8.8p 24.5p 6.2p 5.8p 9.4p 20.5p 24.9p : 17.6p 20.0p 10.4p 7.1p 7.2p : : :Source: Eurostat - Health and safety statistics (SILC data)
Standardised death rates (SDR) per 100 000 population by sex, 2005MalesDiseases of the circulatory system 326 301 265 309 833 531 322 304 692 275 319 209 188 274 290 804 750 272 644 317 240 287 491 256 821 359 644 335 278 264 526 684 :Cancer 241 241 234 288 226 314 253 215 308 212 218 233 249 240 150 297 289 216 331 183 240 216 296 216 236 272 304 189 182 217 308 209 :Diseases of the respiratory system 67 66 62 113 64 55 80 58 56 99 58 95 48 52 53 63 83 67 73 93 85 52 69 95 97 84 85 60 41 95 84 52 :External causes of injury and poisoning 64 62 57 78 73 89 63 45 204 45 50 49 70 50 70 224 271 61 108 35 37 67 103 58 106 94 95 108 62 40 87 44 :FemalesDiseases of the circulatory system 216 198 178 196 551 357 195 211 377 168 265 140 111 179 203 434 436 191 401 233 148 203 303 188 601 234 426 182 172 172 372 566 :Cancer 136 137 127 149 129 172 197 135 137 158 113 103 121 129 99 137 139 123 173 120 157 133 155 111 132 148 147 116 139 157 147 119 :Diseases of the respiratory system 33 33 28 42 28 26 59 30 12 72 40 40 24 21 34 14 19 32 32 39 46 25 27 48 46 35 38 24 27 71 34 33 :External causes of injury and poisoning 23 23 22 33 20 34 30 18 46 15 14 15 29 19 39 54 60 26 34 16 19 24 26 17 28 33 22 38 28 17 29 17 :Notes: EU-27, EU-25, EA-13, FI, SE: 2004; IT: 2002; DK: 2001; BE: 1997. Source: Eurostat - Health and safety statistics.
Practising physicians per 100 000 inhabitants1995 : : : 345 345 300 251 307 307 210 393 268 323 386 220 278 405 204 303 : 186 266 232 254 181 : 292 207 288 : 204 231 :2005 : : : 400 365 355 : 341 319 352 : 380 339 383 258 292 401 328 278 349 : 347 229 268 217 230 304 245 348 236 : 245 :Notes: 1) LU, AT, PL, PT, SI: 2004. 2) FR, LT, MK: professionally active physicians; IE, IT, MT: physicians licensed to practiseSource: Eurostat - Health and safety statistics.
Practising dentists per 100 000 inhabitants1995 : : : 76 65 61 85 71 58 44 102 36 68 40 74 35 48 53 35 : 47 42 46 : 27 : 37 82 87 39 56 56 192005 : : : 83 84 67 : 76 89 55 : 52 68 60 95 62 72 75 45 48 49 51 37 : 47 60 44 87 82 47 : 68 :Notes: 1) LU, AT, PL, SI, SK: 2004 2) FR, IT, LT, NL, MK: professionally active dentists; IE, ES, MT: dentists licensed to practiseSource: Eurostat - Health and safety statistics.
Practising nurses per 100 000 inhabitants2000 : : : 540 397 760 1232 940 586 : : : : : : 464 : 275 558 : : 715 496 353 : 685 : 330 : 833 : : :2005 : : : 611 405 808 1393 975 626 : : : : : : : : 376 591 549 938 715 493 365 : 747 : 342 : 955 : : :Notes: 1) DK, LU, NL, PL, PT, FI: 2004; FR refer to France Metropolitaine. 2) FI: nurses professionally active; LU: nurses licensed to practiseSource: Eurostat - Health and safety statistics.
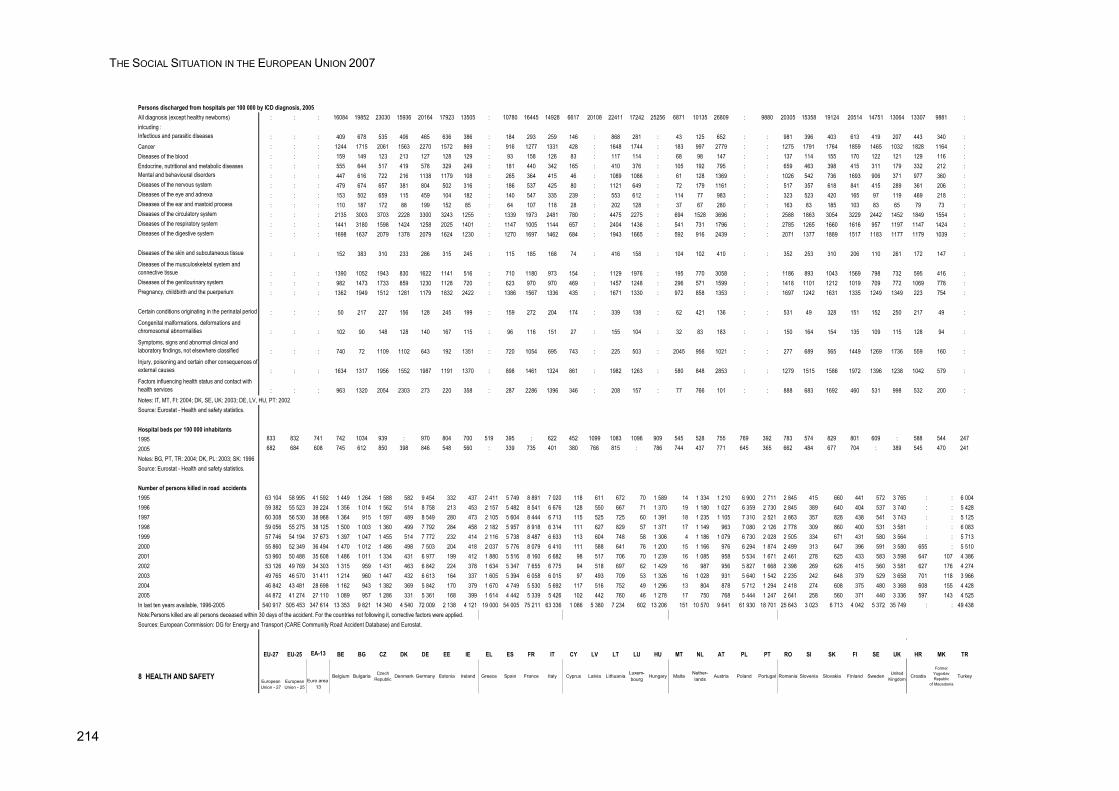
THE SOCIAL SITUATION IN THE EUROPEAN UNION 2007
214
Persons discharged from hospitals per 100 000 by ICD diagnosis, 2005All diagnosis (except healthy newborns) : : : 16084 19852 23030 15936 20164 17923 13505 : 10780 16445 14928 6617 20108 22411 17242 25256 6871 10135 26809 : 9880 20305 15358 19124 20514 14751 13064 13307 9881 :inlcuding :Infectious and parasitic diseases : : : 409 678 535 406 465 636 386 : 184 293 259 146 : 868 281 : 43 125 652 : : 981 396 403 613 419 207 443 340 :Cancer : : : 1244 1715 2061 1563 2270 1572 869 : 916 1277 1331 428 : 1648 1744 : 183 997 2779 : : 1275 1791 1764 1859 1465 1032 1828 1164 :Diseases of the blood : : : 159 149 123 213 127 128 129 : 93 158 126 83 : 117 114 : 68 98 147 : : 137 114 155 170 122 121 129 116 :Endocrine, nutritional and metabolic diseases : : : 555 644 517 419 578 329 249 : 181 440 342 165 : 410 376 : 105 192 795 : : 659 463 398 415 311 179 332 212 :Mental and behavioural disorders : : : 447 616 722 216 1138 1179 108 : 265 364 415 46 : 1089 1086 : 61 128 1369 : : 1026 542 736 1693 906 371 977 360 :Diseases of the nervous system : : : 479 674 657 381 804 502 316 : 186 537 425 80 : 1121 649 : 72 179 1161 : : 517 357 618 841 415 289 361 206 :Diseases of the eye and adnexa : : : 153 502 659 115 459 104 182 : 140 547 335 239 : 553 612 : 114 77 983 : : 323 523 420 165 97 119 469 218 :Diseases of the ear and mastoid process : : : 110 187 172 88 199 152 85 : 64 107 118 28 : 202 128 : 37 67 280 : : 163 83 185 103 83 65 79 73 :Diseases of the circulatory system : : : 2135 3003 3703 2228 3300 3243 1255 : 1339 1973 2481 780 : 4475 2275 : 694 1528 3696 : : 2588 1863 3054 3229 2442 1452 1849 1554 :Diseases of the respiratory system : : : 1441 3180 1598 1424 1258 2025 1401 : 1147 1005 1144 657 : 2404 1436 : 541 731 1796 : : 2785 1265 1660 1616 957 1197 1147 1424 :Diseases of the digestive system : : : 1698 1637 2079 1378 2079 1624 1230 : 1270 1697 1462 684 : 1943 1665 : 592 916 2439 : : 2071 1377 1889 1517 1183 1177 1179 1039 :
Diseases of the skin and subcutaneous tissue : : : 152 383 310 233 286 315 245 : 115 185 168 74 : 416 158 : 104 102 410 : : 352 253 310 206 110 261 172 147 :Diseases of the musculoskeletal system and connective tissue : : : 1390 1052 1943 830 1622 1141 516 : 710 1180 973 154 : 1129 1976 : 195 770 3058 : : 1186 893 1043 1569 798 732 595 416 :Diseases of the genitourinary system : : : 982 1473 1733 859 1230 1128 720 : 623 970 970 469 : 1457 1248 : 296 571 1599 : : 1418 1101 1212 1019 709 772 1069 778 :Pregnancy, childbirth and the puerperium : : : 1362 1949 1512 1281 1179 1832 2422 : 1386 1567 1336 435 : 1671 1330 : 972 858 1353 : : 1697 1242 1631 1335 1249 1349 223 754 :
Certain conditions originating in the perinatal period : : : 50 217 227 156 128 245 199 : 159 272 204 174 : 339 138 : 62 421 136 : : 531 49 328 151 152 250 217 49 :Congenital malformations, deformations and chromosomal abnormalities : : : 102 90 148 128 140 167 115 : 96 116 151 27 : 155 104 : 32 83 183 : : 150 164 154 135 109 115 128 94 :Symptoms, signs and abnormal clinical and laboratory findings, not elsewhere classified : : : 740 72 1109 1102 643 192 1351 : 720 1054 695 743 : 225 503 : 2045 956 1021 : : 277 689 565 1449 1269 1736 559 160 :Injury, poisoning and certain other consequences of external causes : : : 1634 1317 1956 1552 1987 1191 1370 : 898 1461 1324 861 : 1982 1263 : 580 848 2853 : : 1279 1515 1586 1972 1396 1238 1042 579 :Factors influencing health status and contact with health services : : : 963 1320 2054 2303 273 220 358 : 287 2286 1396 346 : 208 157 : 77 766 101 : : 888 683 1692 460 531 998 532 200 :Notes: IT, MT, FI: 2004; DK, SE, UK: 2003; DE, LV, HU, PT: 2002 Source: Eurostat - Health and safety statistics.
Hospital beds per 100 000 inhabitants1995 833 832 741 742 1034 939 : 970 804 700 519 395 : 622 452 1099 1083 1096 909 545 528 755 769 392 783 574 829 801 609 : 588 544 2472005 682 684 608 745 612 850 398 846 548 560 : 339 735 401 380 766 815 : 786 744 437 771 645 365 662 484 677 704 : 389 545 470 241Notes: BG, PT, TR: 2004; DK, PL: 2003; SK: 1996Source: Eurostat - Health and safety statistics.
Number of persons killed in road accidents1995 63 104 58 995 41 592 1 449 1 264 1 588 582 9 454 332 437 2 411 5 749 8 891 7 020 118 611 672 70 1 589 14 1 334 1 210 6 900 2 711 2 845 415 660 441 572 3 765 : : 6 0041996 59 382 55 523 39 224 1 356 1 014 1 562 514 8 758 213 453 2 157 5 482 8 541 6 676 128 550 667 71 1 370 19 1 180 1 027 6 359 2 730 2 845 389 640 404 537 3 740 : : 5 4281997 60 308 56 530 38 968 1 364 915 1 597 489 8 549 280 473 2 105 5 604 8 444 6 713 115 525 725 60 1 391 18 1 235 1 105 7 310 2 521 2 863 357 828 438 541 3 743 : : 5 1251998 59 056 55 275 38 125 1 500 1 003 1 360 499 7 792 284 458 2 182 5 957 8 918 6 314 111 627 829 57 1 371 17 1 149 963 7 080 2 126 2 778 309 860 400 531 3 581 : : 6 0831999 57 746 54 194 37 673 1 397 1 047 1 455 514 7 772 232 414 2 116 5 738 8 487 6 633 113 604 748 58 1 306 4 1 186 1 079 6 730 2 028 2 505 334 671 431 580 3 564 : : 5 7132000 55 860 52 349 36 494 1 470 1 012 1 486 498 7 503 204 418 2 037 5 776 8 079 6 410 111 588 641 76 1 200 15 1 166 976 6 294 1 874 2 499 313 647 396 591 3 580 655 : 5 5102001 53 960 50 488 35 608 1 486 1 011 1 334 431 6 977 199 412 1 880 5 516 8 160 6 682 98 517 706 70 1 239 16 1 085 958 5 534 1 671 2 461 278 625 433 583 3 598 647 107 4 3862002 53 126 49 769 34 303 1 315 959 1 431 463 6 842 224 378 1 634 5 347 7 655 6 775 94 518 697 62 1 429 16 987 956 5 827 1 668 2 398 269 626 415 560 3 581 627 176 4 2742003 49 765 46 570 31 411 1 214 960 1 447 432 6 613 164 337 1 605 5 394 6 058 6 015 97 493 709 53 1 326 16 1 028 931 5 640 1 542 2 235 242 648 379 529 3 658 701 118 3 9662004 46 842 43 481 28 698 1 162 943 1 382 369 5 842 170 379 1 670 4 749 5 530 5 692 117 516 752 49 1 296 13 804 878 5 712 1 294 2 418 274 608 375 480 3 368 608 155 4 4282005 44 872 41 274 27 110 1 089 957 1 286 331 5 361 168 399 1 614 4 442 5 339 5 426 102 442 760 46 1 278 17 750 768 5 444 1 247 2 641 258 560 371 440 3 336 597 143 4 525In last ten years available, 1996-2005 540 917 505 453 347 614 13 353 9 821 14 340 4 540 72 009 2 138 4 121 19 000 54 005 75 211 63 336 1 086 5 380 7 234 602 13 206 151 10 570 9 641 61 930 18 701 25 643 3 023 6 713 4 042 5 372 35 749 : : 49 438Note:Persons killed are all persons deceased within 30 days of the accident. For the countries not following it, corrective factors were applied.Sources: European Commission: DG for Energy and Transport (CARE Community Road Accident Database) and Eurostat.
EU-27 EU-25 EA-13 BE BG CZ DK DE EE IE EL ES FR IT CY LV LT LU HU MT NL AT PL PT RO SI SK FI SE UK HR MK TR
8 HEALTH AND SAFETYEuropeanUnion - 27
EuropeanUnion - 25
Euro area 13
Belgium Bulgaria Czech Republic
Denmark Germany Estonia Ireland Greece Spain France Italy Cyprus Latvia LithuaniaLuxem-bourg Hungary Malta
Nether-lands Austria Poland Portugal Romania Slovenia Slovakia Finland Sweden United
KingdomCroatia
FormerYugoslav Republic
of Macedonia
Turkey
215
Annex 2
Symbols, Country Codes and Country
Groupings,
other Abbreviations and Acronyms
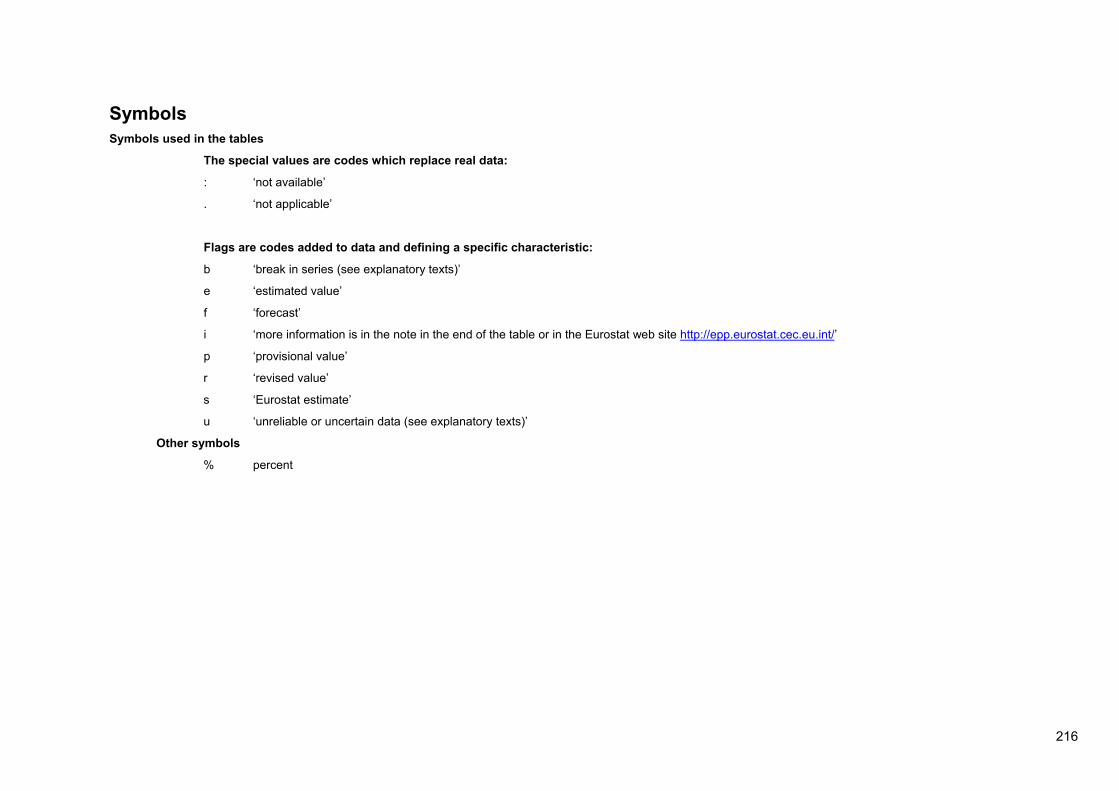
216
Symbols Symbols used in the tables
The special values are codes which replace real data:
: ‘not available’
. ‘not applicable’
Flags are codes added to data and defining a specific characteristic:
b ‘break in series (see explanatory texts)’
e ‘estimated value’
f ‘forecast’
i ‘more information is in the note in the end of the table or in the Eurostat web site http://epp.eurostat.cec.eu.int/’
p ‘provisional value’
r ‘revised value’
s ‘Eurostat estimate’
u ‘unreliable or uncertain data (see explanatory texts)’
Other symbols
% percent
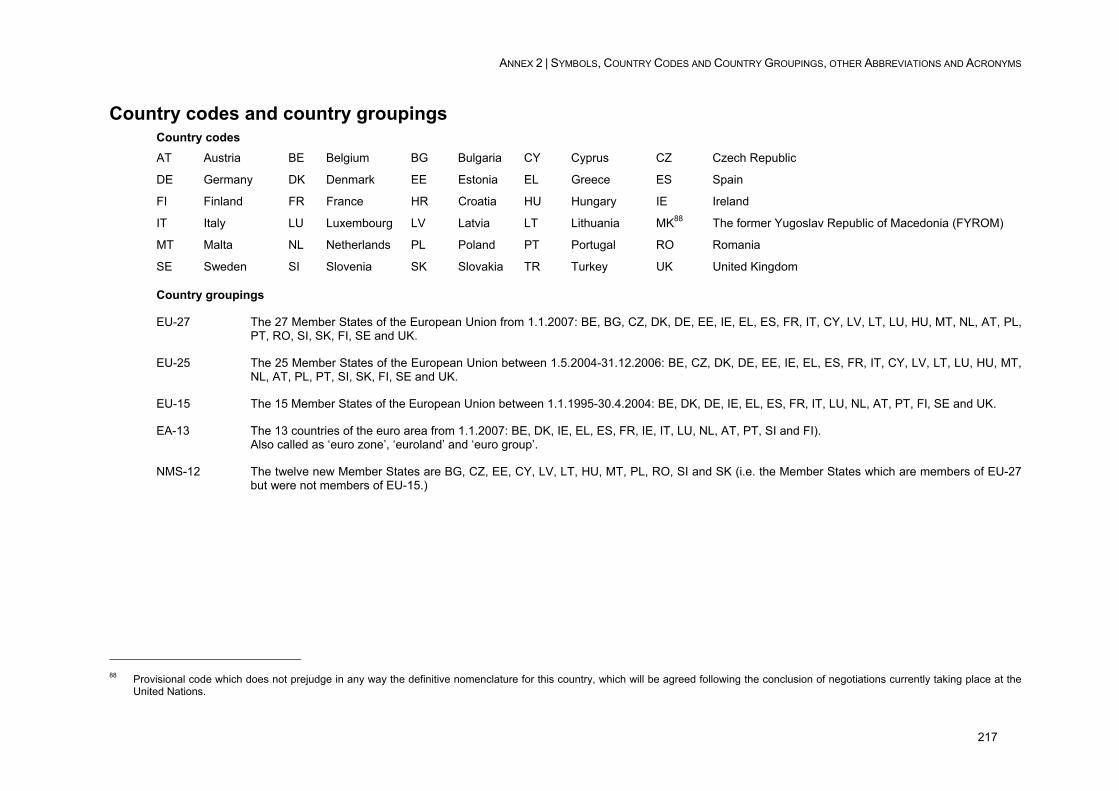
ANNEX 2 | SYMBOLS, COUNTRY CODES AND COUNTRY GROUPINGS, OTHER ABBREVIATIONS AND ACRONYMS
217
Country codes and country groupings Country codes AT Austria BE Belgium BG Bulgaria CY Cyprus CZ Czech Republic
DE Germany DK Denmark EE Estonia EL Greece ES Spain
FI Finland FR France HR Croatia HU Hungary IE Ireland
IT Italy LU Luxembourg LV Latvia LT Lithuania MK88 The former Yugoslav Republic of Macedonia (FYROM)
MT Malta NL Netherlands PL Poland PT Portugal RO Romania
SE Sweden SI Slovenia SK Slovakia TR Turkey UK United Kingdom
Country groupings
EU-27 The 27 Member States of the European Union from 1.1.2007: BE, BG, CZ, DK, DE, EE, IE, EL, ES, FR, IT, CY, LV, LT, LU, HU, MT, NL, AT, PL, PT, RO, SI, SK, FI, SE and UK.
EU-25 The 25 Member States of the European Union between 1.5.2004-31.12.2006: BE, CZ, DK, DE, EE, IE, EL, ES, FR, IT, CY, LV, LT, LU, HU, MT, NL, AT, PL, PT, SI, SK, FI, SE and UK.
EU-15 The 15 Member States of the European Union between 1.1.1995-30.4.2004: BE, DK, DE, IE, EL, ES, FR, IT, LU, NL, AT, PT, FI, SE and UK.
EA-13 The 13 countries of the euro area from 1.1.2007: BE, DK, IE, EL, ES, FR, IE, IT, LU, NL, AT, PT, SI and FI). Also called as ‘euro zone’, ‘euroland’ and ‘euro group’.
NMS-12 The twelve new Member States are BG, CZ, EE, CY, LV, LT, HU, MT, PL, RO, SI and SK (i.e. the Member States which are members of EU-27 but were not members of EU-15.)
88 Provisional code which does not prejudge in any way the definitive nomenclature for this country, which will be agreed following the conclusion of negotiations currently taking place at the
United Nations.
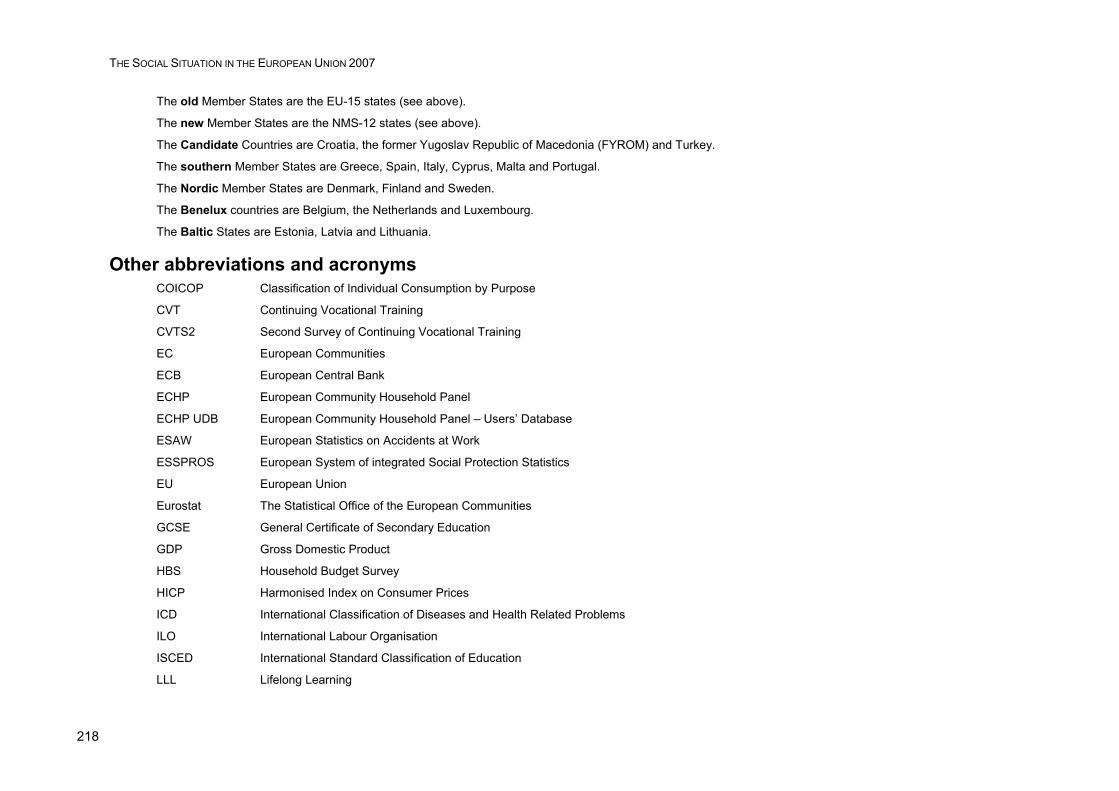
THE SOCIAL SITUATION IN THE EUROPEAN UNION 2007
218
The old Member States are the EU-15 states (see above).
The new Member States are the NMS-12 states (see above).
The Candidate Countries are Croatia, the former Yugoslav Republic of Macedonia (FYROM) and Turkey.
The southern Member States are Greece, Spain, Italy, Cyprus, Malta and Portugal.
The Nordic Member States are Denmark, Finland and Sweden.
The Benelux countries are Belgium, the Netherlands and Luxembourg.
The Baltic States are Estonia, Latvia and Lithuania.
Other abbreviations and acronyms COICOP Classification of Individual Consumption by Purpose
CVT Continuing Vocational Training
CVTS2 Second Survey of Continuing Vocational Training
EC European Communities
ECB European Central Bank
ECHP European Community Household Panel
ECHP UDB European Community Household Panel – Users’ Database
ESAW European Statistics on Accidents at Work
ESSPROS European System of integrated Social Protection Statistics
EU European Union
Eurostat The Statistical Office of the European Communities
GCSE General Certificate of Secondary Education
GDP Gross Domestic Product
HBS Household Budget Survey
HICP Harmonised Index on Consumer Prices
ICD International Classification of Diseases and Health Related Problems
ILO International Labour Organisation
ISCED International Standard Classification of Education
LLL Lifelong Learning
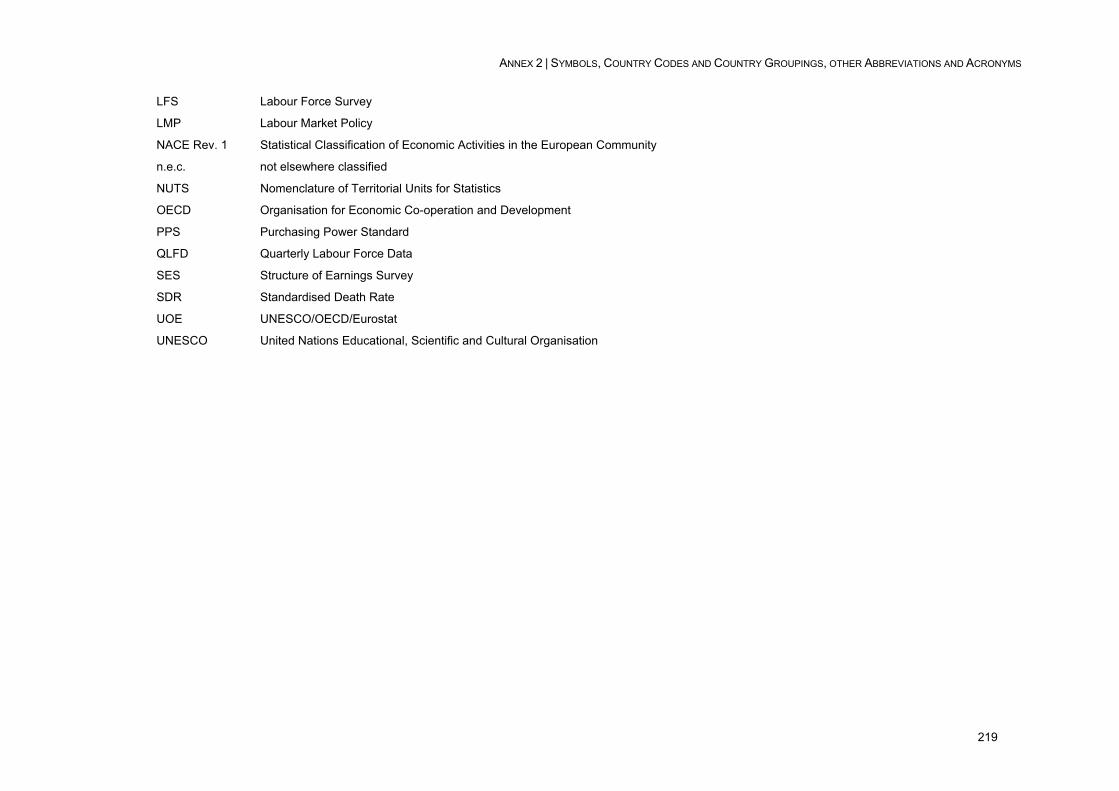
ANNEX 2 | SYMBOLS, COUNTRY CODES AND COUNTRY GROUPINGS, OTHER ABBREVIATIONS AND ACRONYMS
219
LFS Labour Force Survey
LMP Labour Market Policy
NACE Rev. 1 Statistical Classification of Economic Activities in the European Community
n.e.c. not elsewhere classified
NUTS Nomenclature of Territorial Units for Statistics
OECD Organisation for Economic Co-operation and Development
PPS Purchasing Power Standard
QLFD Quarterly Labour Force Data
SES Structure of Earnings Survey
SDR Standardised Death Rate
UOE UNESCO/OECD/Eurostat
UNESCO United Nations Educational, Scientific and Cultural Organisation

220
European Commission
The Social Situation in the European Union 2007 — Social Cohesion through Equal Opportunities Luxembourg: Office for Official Publications of the European Communities 2008 — 219 pp. — 21 × 29.7 cm ISBN 978-92-79-08932-9 DOI 10.2767/8058

How to obtain EU publicationsOur priced publications are available from EU Bookshop (http://bookshop.europa.eu), where you can place an order with the sales agent of your choice.The Publications Office has a worldwide network of sales agents. You can obtain their contact details by sending a fax to (352) 29 29-42758.
KE-AG-08-001-EN
-C
http://ec.europa.eu/social
Are you interested in the publications of the Directorate-General for Employment, Social Affairs and Equal Opportunities?
If so, you can download them athttp://ec.europa.eu/employment_social/emplweb/publications/index_en.cfm
or take out a free online subscription athttp://ec.europa.eu/employment_social/sagapLink/dspSubscribe.do?lang=en
ESmail is the electronic newsletter from the Directorate-General for Employment,
Social Affairs and Equal Opportunities.
You can subscribe to it online athttp://ec.europa.eu/employment_social/emplweb/news/esmail_en.cfm