The Significance of Information Technology to Educational Development: An Evidence Based Approach
14
IOSR Journal of Research & Method in Education (IOSR-JRME) e-ISSN: 2320–7388,p-ISSN: 2320–737X Volume 4, Issue 5 Ver. VI (Sep-Oct. 2014), PP 06-19 www.iosrjournals.org www.iosrjournals.org 6 | Page The Significance of Information Technology to Educational Development: An Evidence Based Approach Grace Korter 1 , Olusanya Olubusoye 2 1,2 (Department of Statistics/University of Ibadan, Nigeria) Abstract: To engage students, improve learning and become a cutting edge educator, it is necessary to combine traditional classroom instruction with online or mobile learning activities through the technological world which moves so fast and changes so rapidly. The focus of this study was to build an evidence-based framework that explains the challenge of the developing countries’ students in respect of maximizing the full potentials of the computer for educational activities. Questionnaires were administered to 213 students of the University of Ibadan, and the Polytechnic, Ibadan, Oyo state of Nigeria. 96.2% of the studied population supports the need for computer as an interactive tool for learning. However, only 46.2% departments of the respondents had computers as interactive tools for learning, while, 21.4 % of the total respondents used the computer regularly in class. Due to financial constraint 74.2% could not afford to own a personal computer and 62.9 % paid between #50 and #100 plus per hour to use a computer for 1 to 9 hours per week. Our findings should enable the orientation of educational development strategies targeted towards students in the developing countries. Keywords: Challenges, Development, Education, Information communication technology, Statistics I. Introduction Education is the bedrock for development, while, sustainable development leads to poverty reduction. To engage students, improve learning and become a cutting edge educator, it is necessary to combine traditional classroom instruction with online or mobile learning activities through the technological world which moves so fast and changes so rapidly. Using the power of the internet, students can now learn different things wherever and whenever they want. The role of Information Communication Technology (ICT) in educational development is unquestioned, and very significantly, the place of energy for effective use of ICT cannot be over emphasized. Classroom face to face instruction, often referred to as the traditional form of educational delivery has many advantages. This provides immediate feedback mechanism for both the teacher and students and as such, misunderstanding can be clarified and arrested at an early stage. The opportunity of learning through all the senses (multimodal pedagogy) is enabled. Also, the traditional educational delivery system provides an environment for social interactions in a manner that allows students to learn from one another and by so doing enhance their social skills. Above all, classroom instruction provides a great deal of flexibility to the teacher who can arrange and rearrange the classroom environment to meet the needs of the students, the contents and the pedagogy and consequently promote learning. Despite, all the benefits of traditional classroom instruction it is highly limited in geographical coverage, access to information , access to learning resources, interaction with a larger audience and access to many possible instructors. Therefore, the traditional classroom instruction needs to be complimented with ICT. The automation of information processing is part of a technology that evolved since the World War II in the scientific research associated with development of radar and the military systems for using radar data in directing combat fire control. ICT is built on the twin foundations of information theory and physical advances in electronics, optics and other related sciences. Together, they are yielding to mankind entirely new tools, new resources and new capabilities. The technology is developing at an accelerating rate. The electronic computer was the first physical manifestation of the automation of information processing technology. The program learning activities can alter some fundamental concepts of industrial training and public education. Machine systems can pace the individual student, analyze his learning difficulties and mistakes as they occur, and can introduce remedial instructions as needed. They encourage a degree of personal participation by the student which is impossible in normal classroom work [1]. Technology can be used to facilitate the display of information, to increase access to external explicit information, and to increase the sharing and construction of knowledge. Technology is not suggested as a panacea for educational problems, in fact many problems in education are social rather than learning related. Yet technology can enable the effective application of constructive, cognitive, collaborative and sociocultural models of learning. In short, ICT is primarily used to automate the information delivery function in classrooms [2].
Transcript of The Significance of Information Technology to Educational Development: An Evidence Based Approach
IOSR Journal of Research & Method in Education (IOSR-JRME)
e-ISSN: 2320–7388,p-ISSN: 2320–737X Volume 4, Issue 5 Ver. VI (Sep-Oct. 2014), PP 06-19 www.iosrjournals.org
www.iosrjournals.org 6 | Page
The Significance of Information Technology to Educational
Development: An Evidence Based Approach
Grace Korter1, Olusanya Olubusoye
2
1,2(Department of Statistics/University of Ibadan, Nigeria)
Abstract: To engage students, improve learning and become a cutting edge educator, it is necessary to
combine traditional classroom instruction with online or mobile learning activities through the technological
world which moves so fast and changes so rapidly. The focus of this study was to build an evidence-based
framework that explains the challenge of the developing countries’ students in respect of maximizing the full
potentials of the computer for educational activities. Questionnaires were administered to 213 students of the
University of Ibadan, and the Polytechnic, Ibadan, Oyo state of Nigeria. 96.2% of the studied population
supports the need for computer as an interactive tool for learning. However, only 46.2% departments of the
respondents had computers as interactive tools for learning, while, 21.4 % of the total respondents used the
computer regularly in class. Due to financial constraint 74.2% could not afford to own a personal computer and
62.9 % paid between #50 and #100 plus per hour to use a computer for 1 to 9 hours per week. Our findings
should enable the orientation of educational development strategies targeted towards students in the developing
countries.
Keywords: Challenges, Development, Education, Information communication technology, Statistics
I. Introduction
Education is the bedrock for development, while, sustainable development leads to poverty reduction.
To engage students, improve learning and become a cutting edge educator, it is necessary to combine traditional
classroom instruction with online or mobile learning activities through the technological world which moves so
fast and changes so rapidly. Using the power of the internet, students can now learn different things wherever
and whenever they want. The role of Information Communication Technology (ICT) in educational
development is unquestioned, and very significantly, the place of energy for effective use of ICT cannot be over
emphasized. Classroom face to face instruction, often referred to as the traditional form of educational delivery has
many advantages. This provides immediate feedback mechanism for both the teacher and students and as such,
misunderstanding can be clarified and arrested at an early stage. The opportunity of learning through all the
senses (multimodal pedagogy) is enabled. Also, the traditional educational delivery system provides an
environment for social interactions in a manner that allows students to learn from one another and by so doing
enhance their social skills. Above all, classroom instruction provides a great deal of flexibility to the teacher
who can arrange and rearrange the classroom environment to meet the needs of the students, the contents and
the pedagogy and consequently promote learning. Despite, all the benefits of traditional classroom instruction it
is highly limited in geographical coverage, access to information , access to learning resources, interaction with
a larger audience and access to many possible instructors. Therefore, the traditional classroom instruction needs
to be complimented with ICT. The automation of information processing is part of a technology that evolved since the World War II
in the scientific research associated with development of radar and the military systems for using radar data in
directing combat fire control. ICT is built on the twin foundations of information theory and physical advances
in electronics, optics and other related sciences. Together, they are yielding to mankind entirely new tools, new
resources and new capabilities. The technology is developing at an accelerating rate. The electronic computer
was the first physical manifestation of the automation of information processing technology. The program
learning activities can alter some fundamental concepts of industrial training and public education. Machine
systems can pace the individual student, analyze his learning difficulties and mistakes as they occur, and can
introduce remedial instructions as needed. They encourage a degree of personal participation by the student
which is impossible in normal classroom work [1].
Technology can be used to facilitate the display of information, to increase access to external explicit
information, and to increase the sharing and construction of knowledge. Technology is not suggested as a panacea for educational problems, in fact many problems in education are social rather than learning related.
Yet technology can enable the effective application of constructive, cognitive, collaborative and sociocultural
models of learning. In short, ICT is primarily used to automate the information delivery function in classrooms
[2].
The Significance of Information Technology to Educational Development: An Evidence …..
www.iosrjournals.org 7 | Page
ICT can enable collaborative learning and teaching with multiple instructors, and integration of
external expertise. It can be used for video conferencing system to create geographically distributed discussion
panels of experts. Over the coming years, universities will face many challenges to the one-course, one-semester, one-instructor, one-site traditions of today’s educational systems. This is because, no university can
employ every good instructor, and no university can maintain every useful perspective on a domain and no
student can attend every university [3]
ICT is highly versatile. It can be tailored to meet a variety of diverse challenges. The same network,
server, and peripheral devices such as PCs or cell phones can help support distance education and remote health
delivery and connect rural communities to global markets. ICT can help transcend traditional barriers of
geography. It allows individuals and entities anywhere in the world access to the same information without the
time and cost associated with physical transportation. This is an advantage substantially enhanced by the advent
of wireless and satellite communications and voice-over internet protocol long-distance service. It also
facilitates the transfer of know-how across the full spectrum of knowledge, allowing developing countries to
reap productivity gains and harness state of the art technology [4]. One major reason for ICT’s failure to deliver on some of its potentials is poor energy supply. Amongst
several others is the lack of skilled workers to maintain equipment and train potential users. Also, poor
government technological policies that have made costs for internet connection out of reach, and the lack of
applications tailored to meet the unique needs of developing countries. This study investigates the performance
of ICT as teaching aids for educational development. The focus is to build an evidence-based framework that
explains the challenge of the developing countries’ students in respect of maximizing the full potentials of the
computer. Questionnaires were administered to 213 students of the University of Ibadan, and the Polytechnic,
Ibadan, Oyo state of Nigeria. These two higher institutions of learning happen to be amongst the oldest
institutions in the western part of the country. The basic underlying assumption is that computers are the
simplest interactive instructional devices and that energy is a fundamental requirement for its functionality. Our
findings should enable the orientation of educational development strategies targeted towards students in the
developing countries.
II. Energy, Information Communication Technology, Poverty and Development Access to modern energy is essential for the provision of clean water, sanitation and healthcare and
provides great benefits to development through the provision of reliable and efficient lighting, heating, cooking,
mechanical power, transport and telecommunications services. The international community has long been
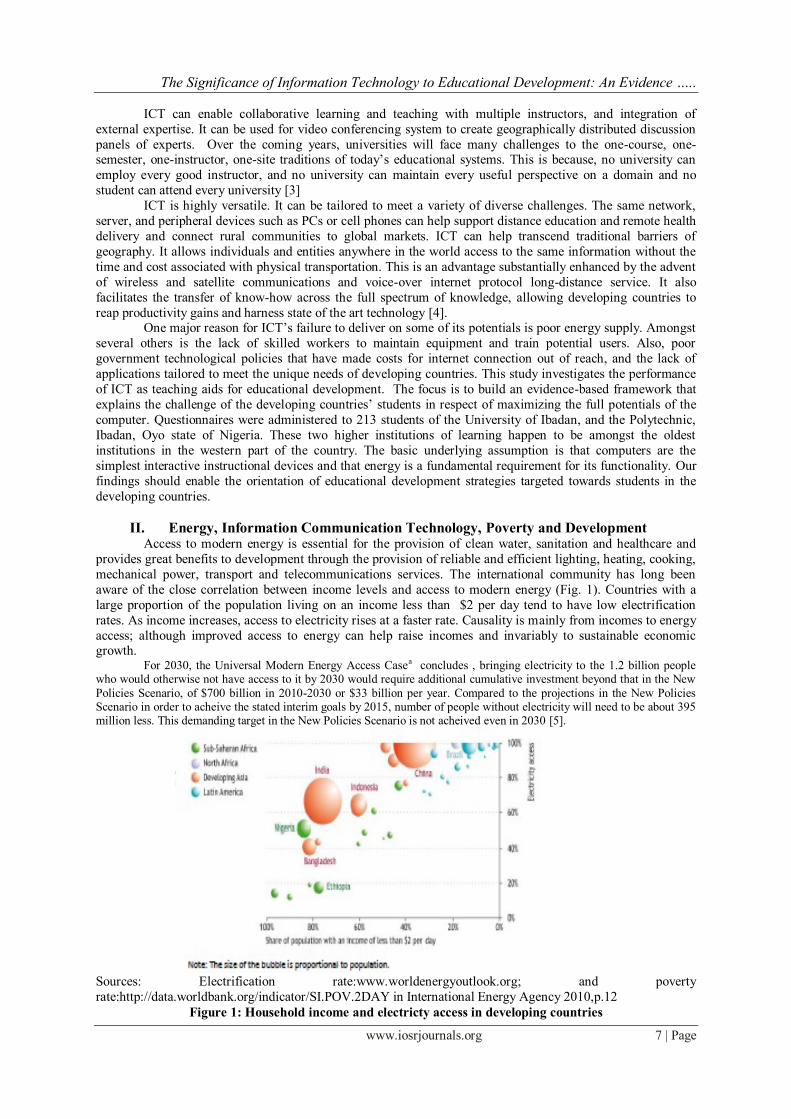
aware of the close correlation between income levels and access to modern energy (Fig. 1). Countries with a
large proportion of the population living on an income less than $2 per day tend to have low electrification
rates. As income increases, access to electricity rises at a faster rate. Causality is mainly from incomes to energy
access; although improved access to energy can help raise incomes and invariably to sustainable economic growth.
For 2030, the Universal Modern Energy Access Casea concludes , bringing electricity to the 1.2 billion people who would otherwise not have access to it by 2030 would require additional cumulative investment beyond that in the New
Policies Scenario, of $700 billion in 2010-2030 or $33 billion per year. Compared to the projections in the New Policies Scenario in order to acheive the stated interim goals by 2015, number of people without electricity will need to be about 395 million less. This demanding target in the New Policies Scenario is not acheived even in 2030 [5].
Sources: Electrification rate:www.worldenergyoutlook.org; and poverty
rate:http://data.worldbank.org/indicator/SI.POV.2DAY in International Energy Agency 2010,p.12
Figure 1: Household income and electricty access in developing countries
The Significance of Information Technology to Educational Development: An Evidence …..
www.iosrjournals.org 8 | Page
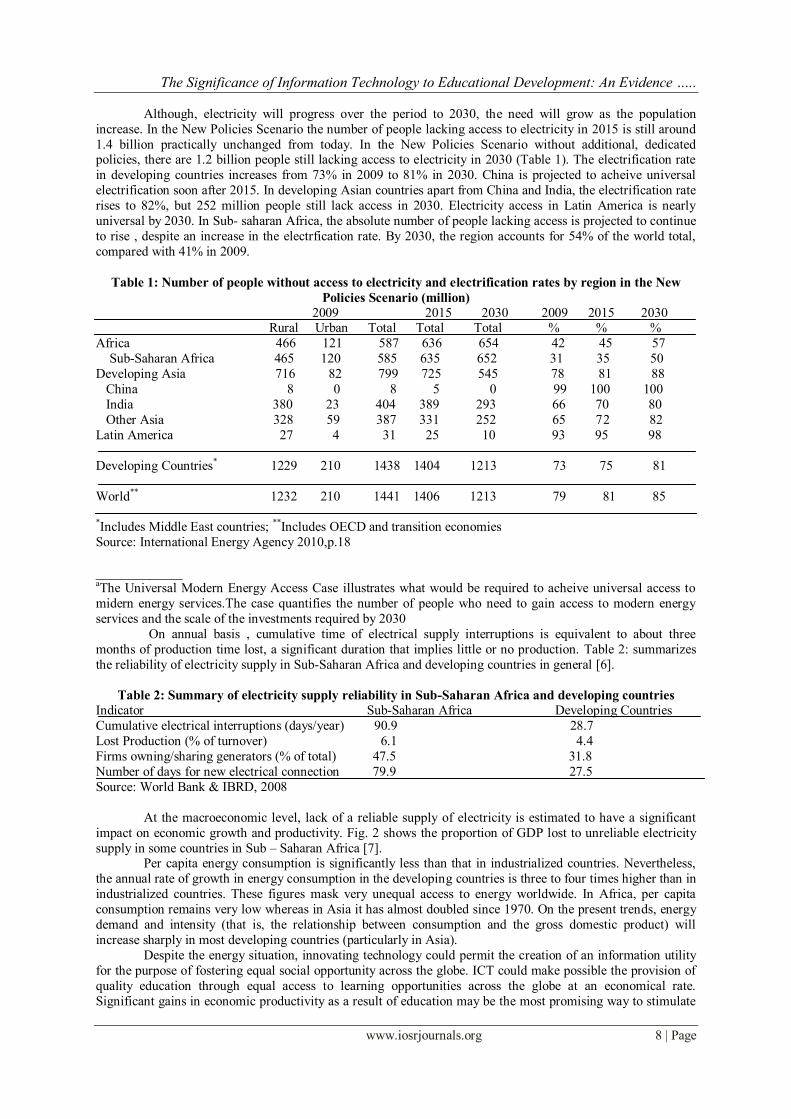
Although, electricity will progress over the period to 2030, the need will grow as the population
increase. In the New Policies Scenario the number of people lacking access to electricity in 2015 is still around
1.4 billion practically unchanged from today. In the New Policies Scenario without additional, dedicated policies, there are 1.2 billion people still lacking access to electricity in 2030 (Table 1). The electrification rate
in developing countries increases from 73% in 2009 to 81% in 2030. China is projected to acheive universal
electrification soon after 2015. In developing Asian countries apart from China and India, the electrification rate
rises to 82%, but 252 million people still lack access in 2030. Electricity access in Latin America is nearly
universal by 2030. In Sub- saharan Africa, the absolute number of people lacking access is projected to continue
to rise , despite an increase in the electrfication rate. By 2030, the region accounts for 54% of the world total,
compared with 41% in 2009.
Table 1: Number of people without access to electricity and electrification rates by region in the New
Policies Scenario (million) 2009 2015 2030 2009 2015 2030 Rural Urban Total Total Total % % %
Africa 466 121 587 636 654 42 45 57
Sub-Saharan Africa 465 120 585 635 652 31 35 50
Developing Asia 716 82 799 725 545 78 81 88
China 8 0 8 5 0 99 100 100
India 380 23 404 389 293 66 70 80
Other Asia 328 59 387 331 252 65 72 82
Latin America 27 4 31 25 10 93 95 98
Developing Countries* 1229 210 1438 1404 1213 73 75 81
World** 1232 210 1441 1406 1213 79 81 85 *Includes Middle East countries; **Includes OECD and transition economies
Source: International Energy Agency 2010,p.18
_____________ aThe Universal Modern Energy Access Case illustrates what would be required to acheive universal access to
midern energy services.The case quantifies the number of people who need to gain access to modern energy
services and the scale of the investments required by 2030
On annual basis , cumulative time of electrical supply interruptions is equivalent to about three
months of production time lost, a significant duration that implies little or no production. Table 2: summarizes
the reliability of electricity supply in Sub-Saharan Africa and developing countries in general [6].
Table 2: Summary of electricity supply reliability in Sub-Saharan Africa and developing countries
Indicator Sub-Saharan Africa Developing Countries
Cumulative electrical interruptions (days/year) 90.9 28.7
Lost Production (% of turnover) 6.1 4.4
Firms owning/sharing generators (% of total) 47.5 31.8
Number of days for new electrical connection 79.9 27.5
Source: World Bank & IBRD, 2008
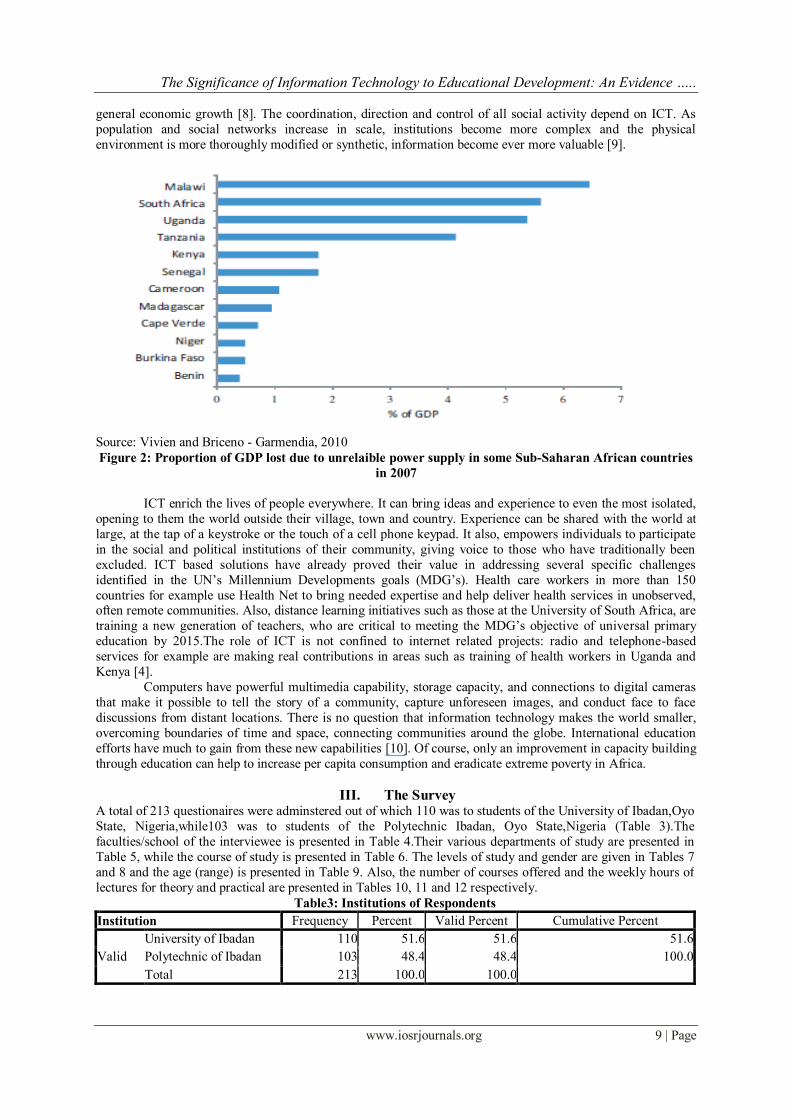
At the macroeconomic level, lack of a reliable supply of electricity is estimated to have a significant
impact on economic growth and productivity. Fig. 2 shows the proportion of GDP lost to unreliable electricity
supply in some countries in Sub – Saharan Africa [7]. Per capita energy consumption is significantly less than that in industrialized countries. Nevertheless,
the annual rate of growth in energy consumption in the developing countries is three to four times higher than in
industrialized countries. These figures mask very unequal access to energy worldwide. In Africa, per capita
consumption remains very low whereas in Asia it has almost doubled since 1970. On the present trends, energy
demand and intensity (that is, the relationship between consumption and the gross domestic product) will
increase sharply in most developing countries (particularly in Asia).
Despite the energy situation, innovating technology could permit the creation of an information utility
for the purpose of fostering equal social opportunity across the globe. ICT could make possible the provision of
quality education through equal access to learning opportunities across the globe at an economical rate.
Significant gains in economic productivity as a result of education may be the most promising way to stimulate
The Significance of Information Technology to Educational Development: An Evidence …..
www.iosrjournals.org 9 | Page
general economic growth [8]. The coordination, direction and control of all social activity depend on ICT. As
population and social networks increase in scale, institutions become more complex and the physical
environment is more thoroughly modified or synthetic, information become ever more valuable [9].
Source: Vivien and Briceno - Garmendia, 2010
Figure 2: Proportion of GDP lost due to unrelaible power supply in some Sub-Saharan African countries
in 2007
ICT enrich the lives of people everywhere. It can bring ideas and experience to even the most isolated,
opening to them the world outside their village, town and country. Experience can be shared with the world at
large, at the tap of a keystroke or the touch of a cell phone keypad. It also, empowers individuals to participate
in the social and political institutions of their community, giving voice to those who have traditionally been
excluded. ICT based solutions have already proved their value in addressing several specific challenges
identified in the UN’s Millennium Developments goals (MDG’s). Health care workers in more than 150
countries for example use Health Net to bring needed expertise and help deliver health services in unobserved, often remote communities. Also, distance learning initiatives such as those at the University of South Africa, are
training a new generation of teachers, who are critical to meeting the MDG’s objective of universal primary
education by 2015.The role of ICT is not confined to internet related projects: radio and telephone-based
services for example are making real contributions in areas such as training of health workers in Uganda and
Kenya [4].
Computers have powerful multimedia capability, storage capacity, and connections to digital cameras
that make it possible to tell the story of a community, capture unforeseen images, and conduct face to face
discussions from distant locations. There is no question that information technology makes the world smaller,
overcoming boundaries of time and space, connecting communities around the globe. International education
efforts have much to gain from these new capabilities [10]. Of course, only an improvement in capacity building
through education can help to increase per capita consumption and eradicate extreme poverty in Africa.
III. The Survey A total of 213 questionaires were adminstered out of which 110 was to students of the University of Ibadan,Oyo
State, Nigeria,while103 was to students of the Polytechnic Ibadan, Oyo State,Nigeria (Table 3).The
faculties/school of the interviewee is presented in Table 4.Their various departments of study are presented in
Table 5, while the course of study is presented in Table 6. The levels of study and gender are given in Tables 7
and 8 and the age (range) is presented in Table 9. Also, the number of courses offered and the weekly hours of
lectures for theory and practical are presented in Tables 10, 11 and 12 respectively.
Table3: Institutions of Respondents
Institution Frequency Percent Valid Percent Cumulative Percent
Valid
University of Ibadan 110 51.6 51.6 51.6
Polytechnic of Ibadan 103 48.4 48.4 100.0
Total 213 100.0 100.0
The Significance of Information Technology to Educational Development: An Evidence …..
www.iosrjournals.org 10 | Page
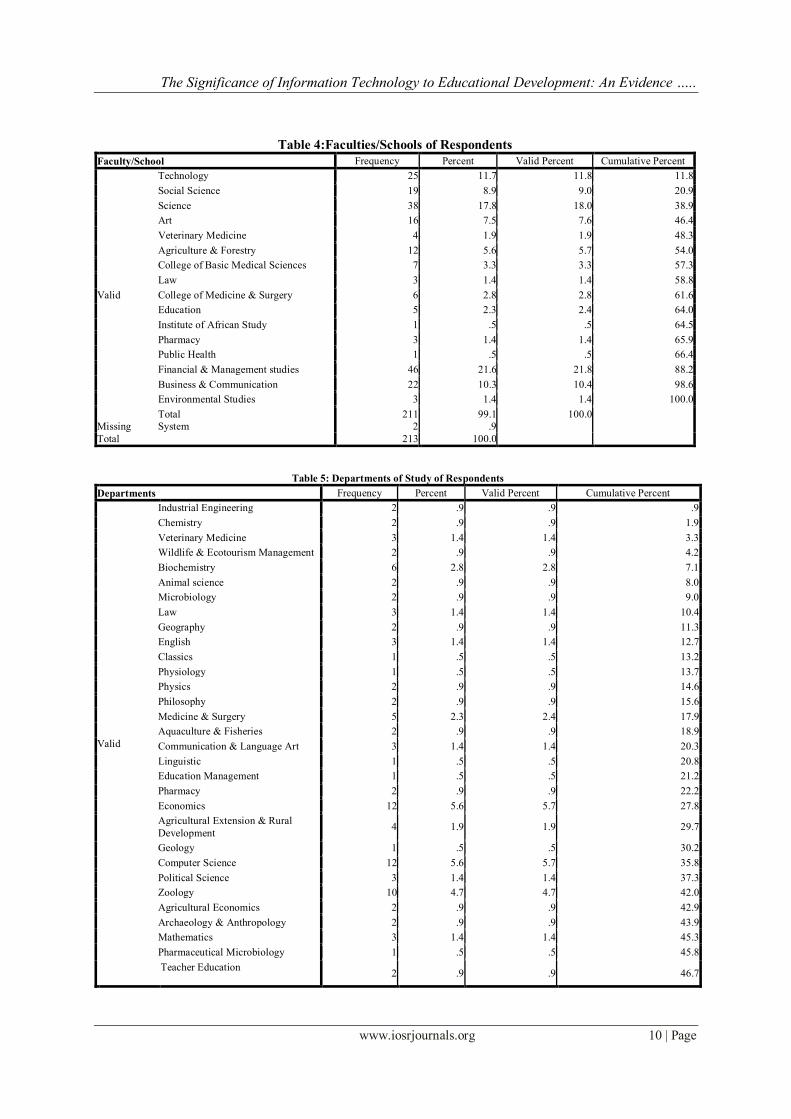
Table 4:Faculties/Schools of Respondents
Faculty/School Frequency Percent Valid Percent Cumulative Percent
Valid
Technology 25 11.7 11.8 11.8
Social Science 19 8.9 9.0 20.9
Science 38 17.8 18.0 38.9
Art 16 7.5 7.6 46.4
Veterinary Medicine 4 1.9 1.9 48.3
Agriculture & Forestry 12 5.6 5.7 54.0
College of Basic Medical Sciences 7 3.3 3.3 57.3
Law 3 1.4 1.4 58.8
College of Medicine & Surgery 6 2.8 2.8 61.6
Education 5 2.3 2.4 64.0
Institute of African Study 1 .5 .5 64.5
Pharmacy 3 1.4 1.4 65.9
Public Health 1 .5 .5 66.4
Financial & Management studies 46 21.6 21.8 88.2
Business & Communication 22 10.3 10.4 98.6
Environmental Studies 3 1.4 1.4 100.0
Total 211 99.1 100.0
Missing System 2 .9
Total 213 100.0
Table 5: Departments of Study of Respondents
Departments Frequency Percent Valid Percent Cumulative Percent
Valid
Industrial Engineering 2 .9 .9 .9
Chemistry 2 .9 .9 1.9
Veterinary Medicine 3 1.4 1.4 3.3
Wildlife & Ecotourism Management 2 .9 .9 4.2
Biochemistry 6 2.8 2.8 7.1
Animal science 2 .9 .9 8.0
Microbiology 2 .9 .9 9.0
Law 3 1.4 1.4 10.4
Geography 2 .9 .9 11.3
English 3 1.4 1.4 12.7
Classics 1 .5 .5 13.2
Physiology 1 .5 .5 13.7
Physics 2 .9 .9 14.6
Philosophy 2 .9 .9 15.6
Medicine & Surgery 5 2.3 2.4 17.9
Aquaculture & Fisheries 2 .9 .9 18.9
Communication & Language Art 3 1.4 1.4 20.3
Linguistic 1 .5 .5 20.8
Education Management 1 .5 .5 21.2
Pharmacy 2 .9 .9 22.2
Economics 12 5.6 5.7 27.8
Agricultural Extension & Rural
Development 4 1.9 1.9 29.7
Geology 1 .5 .5 30.2
Computer Science 12 5.6 5.7 35.8
Political Science 3 1.4 1.4 37.3
Zoology 10 4.7 4.7 42.0
Agricultural Economics 2 .9 .9 42.9
Archaeology & Anthropology 2 .9 .9 43.9
Mathematics 3 1.4 1.4 45.3
Pharmaceutical Microbiology 1 .5 .5 45.8
Teacher Education
2 .9 .9 46.7
The Significance of Information Technology to Educational Development: An Evidence …..
www.iosrjournals.org 11 | Page
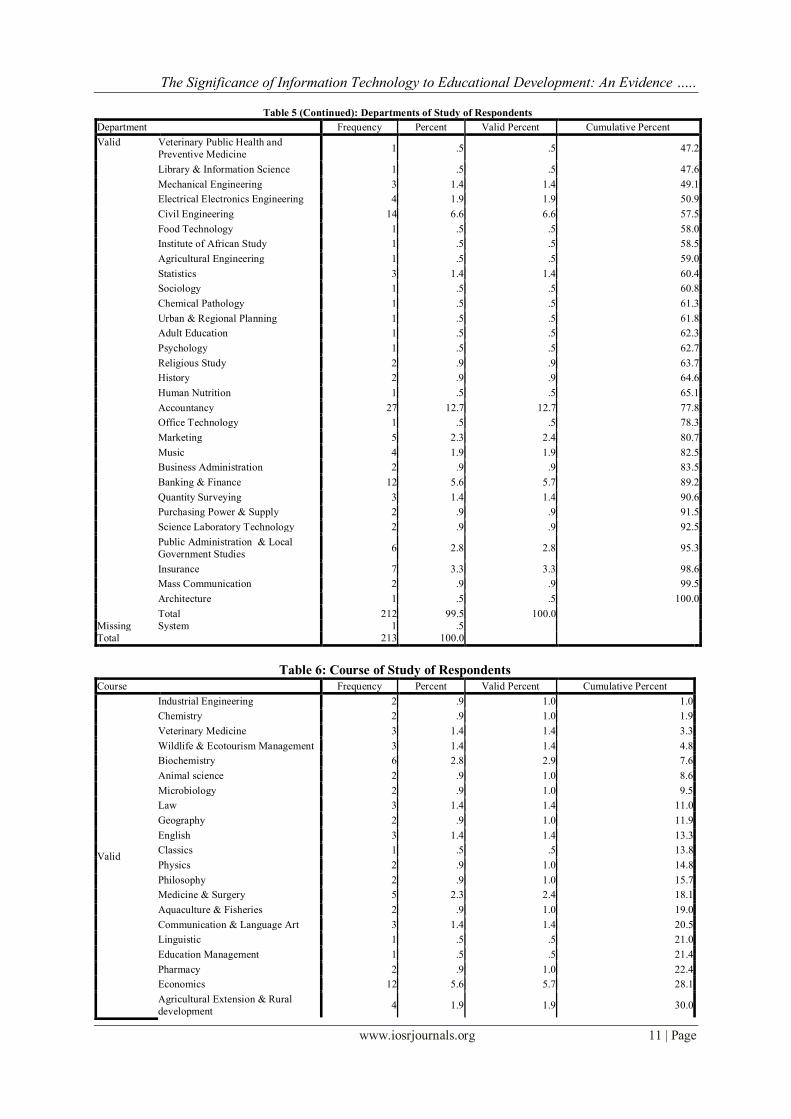
Table 5 (Continued): Departments of Study of Respondents
Department Frequency Percent Valid Percent Cumulative Percent
Valid Veterinary Public Health and
Preventive Medicine 1 .5 .5 47.2
Library & Information Science 1 .5 .5 47.6
Mechanical Engineering 3 1.4 1.4 49.1
Electrical Electronics Engineering 4 1.9 1.9 50.9
Civil Engineering 14 6.6 6.6 57.5
Food Technology 1 .5 .5 58.0
Institute of African Study 1 .5 .5 58.5
Agricultural Engineering 1 .5 .5 59.0
Statistics 3 1.4 1.4 60.4
Sociology 1 .5 .5 60.8
Chemical Pathology 1 .5 .5 61.3
Urban & Regional Planning 1 .5 .5 61.8
Adult Education 1 .5 .5 62.3
Psychology 1 .5 .5 62.7
Religious Study 2 .9 .9 63.7
History 2 .9 .9 64.6
Human Nutrition 1 .5 .5 65.1
Accountancy 27 12.7 12.7 77.8
Office Technology 1 .5 .5 78.3
Marketing 5 2.3 2.4 80.7
Music 4 1.9 1.9 82.5
Business Administration 2 .9 .9 83.5
Banking & Finance 12 5.6 5.7 89.2
Quantity Surveying 3 1.4 1.4 90.6
Purchasing Power & Supply 2 .9 .9 91.5
Science Laboratory Technology 2 .9 .9 92.5
Public Administration & Local
Government Studies 6 2.8 2.8 95.3
Insurance 7 3.3 3.3 98.6
Mass Communication 2 .9 .9 99.5
Architecture 1 .5 .5 100.0
Total 212 99.5 100.0
Missing System 1 .5
Total 213 100.0
Table 6: Course of Study of Respondents
Course Frequency Percent Valid Percent Cumulative Percent
Valid
Industrial Engineering 2 .9 1.0 1.0
Chemistry 2 .9 1.0 1.9
Veterinary Medicine 3 1.4 1.4 3.3
Wildlife & Ecotourism Management 3 1.4 1.4 4.8
Biochemistry 6 2.8 2.9 7.6
Animal science 2 .9 1.0 8.6
Microbiology 2 .9 1.0 9.5
Law 3 1.4 1.4 11.0
Geography 2 .9 1.0 11.9
English 3 1.4 1.4 13.3
Classics 1 .5 .5 13.8
Physics 2 .9 1.0 14.8
Philosophy 2 .9 1.0 15.7
Medicine & Surgery 5 2.3 2.4 18.1
Aquaculture & Fisheries 2 .9 1.0 19.0
Communication & Language Art 3 1.4 1.4 20.5
Linguistic 1 .5 .5 21.0
Education Management 1 .5 .5 21.4
Pharmacy 2 .9 1.0 22.4
Economics 12 5.6 5.7 28.1
Agricultural Extension & Rural
development 4 1.9 1.9 30.0
The Significance of Information Technology to Educational Development: An Evidence …..
www.iosrjournals.org 12 | Page
Geology 1 .5 .5 30.5
Computer Science 12 5.6 5.7 36.2
Political Science 3 1.4 1.4 37.6
Zoology 10 4.7 4.8 42.4
Agricultural Economics 2 .9 1.0 43.3
Archaeology & Anthropology 2 .9 1.0 44.3
Mathematics 3 1.4 1.4 45.7
Pharmaceutical Microbiology 1 .5 .5 46.2
Teacher Education 1 .5 .5 46.7
Veterinary public health and
preventive medicine 1 .5 .5 47.1
Table 6 (Continued): Course of Study of Respondents
Course Frequency Percent Valid Percent Cumulative Percent
Valid Library & Information Science 1 .5 .5 47.6
Mechanical Engineering 3 1.4 1.4 49.0
Electrical-Electronics Engineering 4 1.9 1.9 51.0
Civil Engineering 14 6.6 6.7 57.6
Food Technology 1 .5 .5 58.1
Institute of African Study 1 .5 .5 58.6
Agricultural Engineering 1 .5 .5 59.0
Statistics 3 1.4 1.4 60.5
Sociology 1 .5 .5 61.0
Chemical Pathology 1 .5 .5 61.4
Urban & Regional planning 1 .5 .5 61.9
Adult Education 1 .5 .5 62.4
Psychology 1 .5 .5 62.9
Religious Study 2 .9 1.0 63.8
History 2 .9 1.0 64.8
Human Nutrition 1 .5 .5 65.2
Accountancy 27 12.7 12.9 78.1
Office Technology 1 .5 .5 78.6
Marketing 5 2.3 2.4 81.0
Music 4 1.9 1.9 82.9
Business Administration 2 .9 1.0 83.8
Banking & Finance 12 5.6 5.7 89.5
Quantity Surveying 2 .9 1.0 90.5
Purchasing Power & Supply 2 .9 1.0 91.4
Science Laboratory Technology 2 .9 1.0 92.4
Public Administration & Local
Government Studies 6 2.8 2.9 95.2
Insurance 7 3.3 3.3 98.6
Mass communication 2 .9 1.0 99.5
Architecture 1 .5 .5 100.0
Total 210 98.6 100.0
Missing System 3 1.4
Total 213 100.0
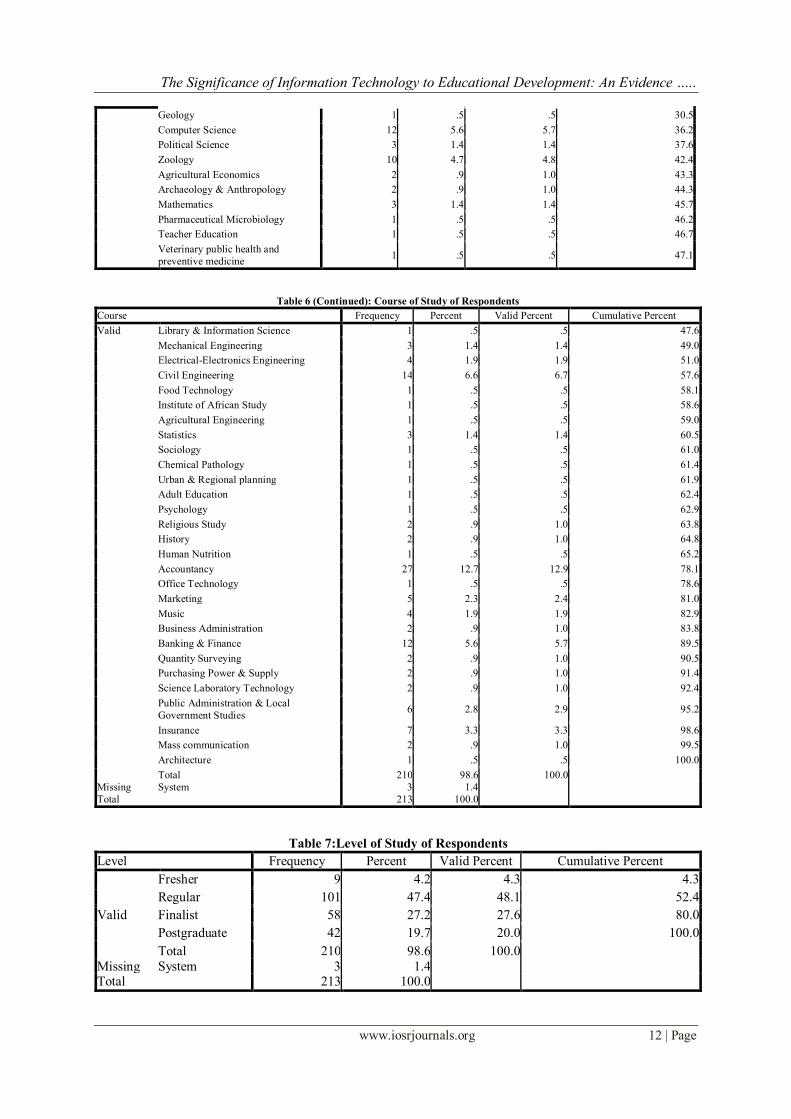
Table 7:Level of Study of Respondents
Level Frequency Percent Valid Percent Cumulative Percent
Valid
Fresher 9 4.2 4.3 4.3
Regular 101 47.4 48.1 52.4
Finalist 58 27.2 27.6 80.0
Postgraduate 42 19.7 20.0 100.0
Total 210 98.6 100.0
Missing System 3 1.4 Total 213 100.0
The Significance of Information Technology to Educational Development: An Evidence …..
www.iosrjournals.org 13 | Page
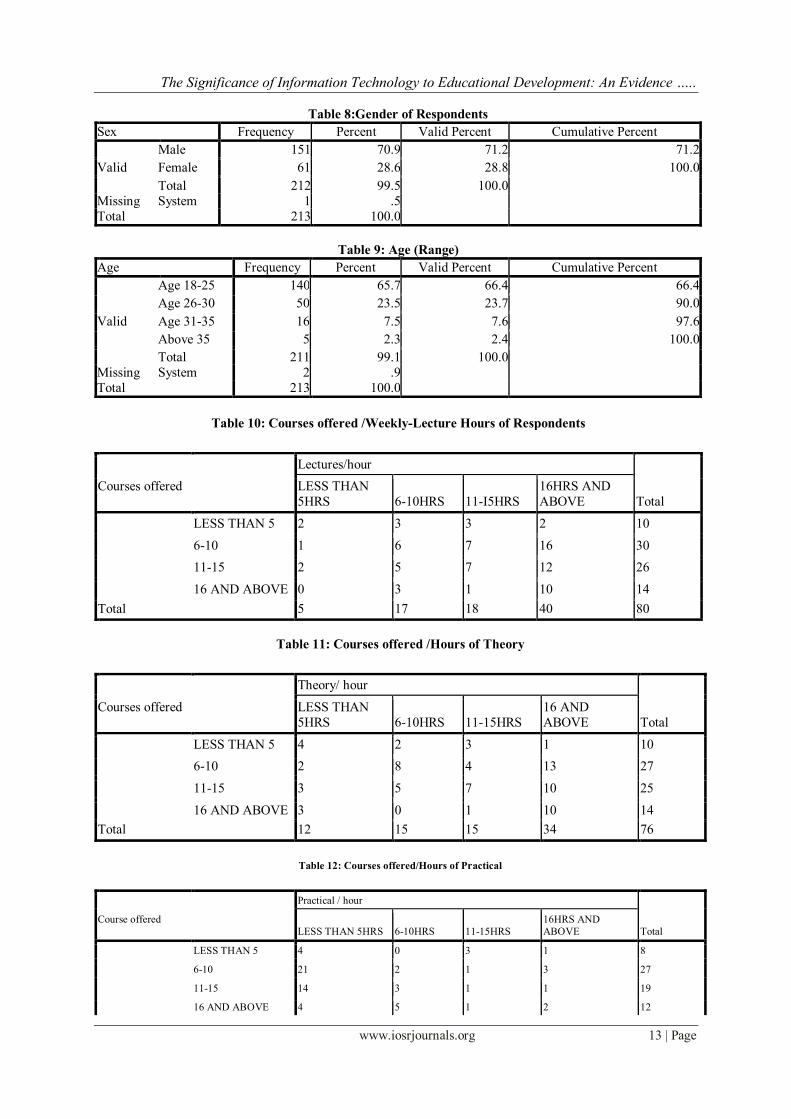
Table 8:Gender of Respondents
Sex Frequency Percent Valid Percent Cumulative Percent
Valid
Male 151 70.9 71.2 71.2
Female 61 28.6 28.8 100.0
Total 212 99.5 100.0
Missing System 1 .5
Total 213 100.0
Table 9: Age (Range)
Age Frequency Percent Valid Percent Cumulative Percent
Valid
Age 18-25 140 65.7 66.4 66.4
Age 26-30 50 23.5 23.7 90.0
Age 31-35 16 7.5 7.6 97.6
Above 35 5 2.3 2.4 100.0
Total 211 99.1 100.0
Missing System 2 .9
Total 213 100.0
Table 10: Courses offered /Weekly-Lecture Hours of Respondents
Lectures/hour
Total
Courses offered LESS THAN
5HRS 6-10HRS 11-I5HRS
16HRS AND
ABOVE
LESS THAN 5 2 3 3 2 10
6-10 1 6 7 16 30
11-15 2 5 7 12 26
16 AND ABOVE 0 3 1 10 14
Total 5 17 18 40 80
Table 11: Courses offered /Hours of Theory
Theory/ hour
Total
Courses offered LESS THAN
5HRS 6-10HRS 11-15HRS
16 AND
ABOVE
LESS THAN 5 4 2 3 1 10
6-10 2 8 4 13 27
11-15 3 5 7 10 25
16 AND ABOVE 3 0 1 10 14
Total 12 15 15 34 76
Table 12: Courses offered/Hours of Practical
Practical / hour
Total
Course offered
LESS THAN 5HRS 6-10HRS 11-15HRS
16HRS AND
ABOVE
LESS THAN 5 4 0 3 1 8
6-10 21 2 1 3 27
11-15 14 3 1 1 19
16 AND ABOVE 4 5 1 2 12
The Significance of Information Technology to Educational Development: An Evidence …..
www.iosrjournals.org 14 | Page
Table 12: Courses offered/Hours of Practical
Practical / hour
Total
Course offered
LESS THAN 5HRS 6-10HRS 11-15HRS
16HRS AND
ABOVE
LESS THAN 5 4 0 3 1 8
6-10 21 2 1 3 27
11-15 14 3 1 1 19
16 AND ABOVE 4 5 1 2 12
Total 43 10 6 7 66
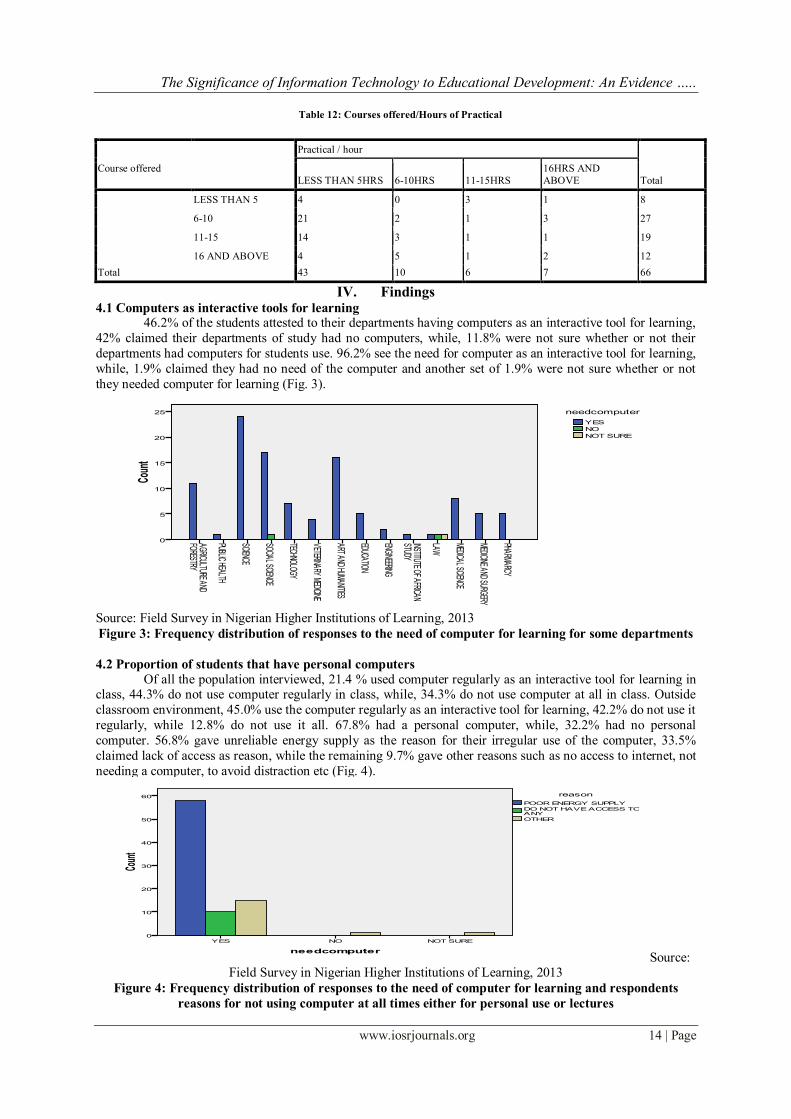
IV. Findings 4.1 Computers as interactive tools for learning
46.2% of the students attested to their departments having computers as an interactive tool for learning,
42% claimed their departments of study had no computers, while, 11.8% were not sure whether or not their
departments had computers for students use. 96.2% see the need for computer as an interactive tool for learning,
while, 1.9% claimed they had no need of the computer and another set of 1.9% were not sure whether or not
they needed computer for learning (Fig. 3).
Source: Field Survey in Nigerian Higher Institutions of Learning, 2013
Figure 3: Frequency distribution of responses to the need of computer for learning for some departments
4.2 Proportion of students that have personal computers
Of all the population interviewed, 21.4 % used computer regularly as an interactive tool for learning in class, 44.3% do not use computer regularly in class, while, 34.3% do not use computer at all in class. Outside
classroom environment, 45.0% use the computer regularly as an interactive tool for learning, 42.2% do not use it
regularly, while 12.8% do not use it all. 67.8% had a personal computer, while, 32.2% had no personal
computer. 56.8% gave unreliable energy supply as the reason for their irregular use of the computer, 33.5%
claimed lack of access as reason, while the remaining 9.7% gave other reasons such as no access to internet, not
needing a computer, to avoid distraction etc (Fig. 4).
Source: Field Survey in Nigerian Higher Institutions of Learning, 2013
Figure 4: Frequency distribution of responses to the need of computer for learning and respondents
reasons for not using computer at all times either for personal use or lectures
The Significance of Information Technology to Educational Development: An Evidence …..
www.iosrjournals.org 15 | Page
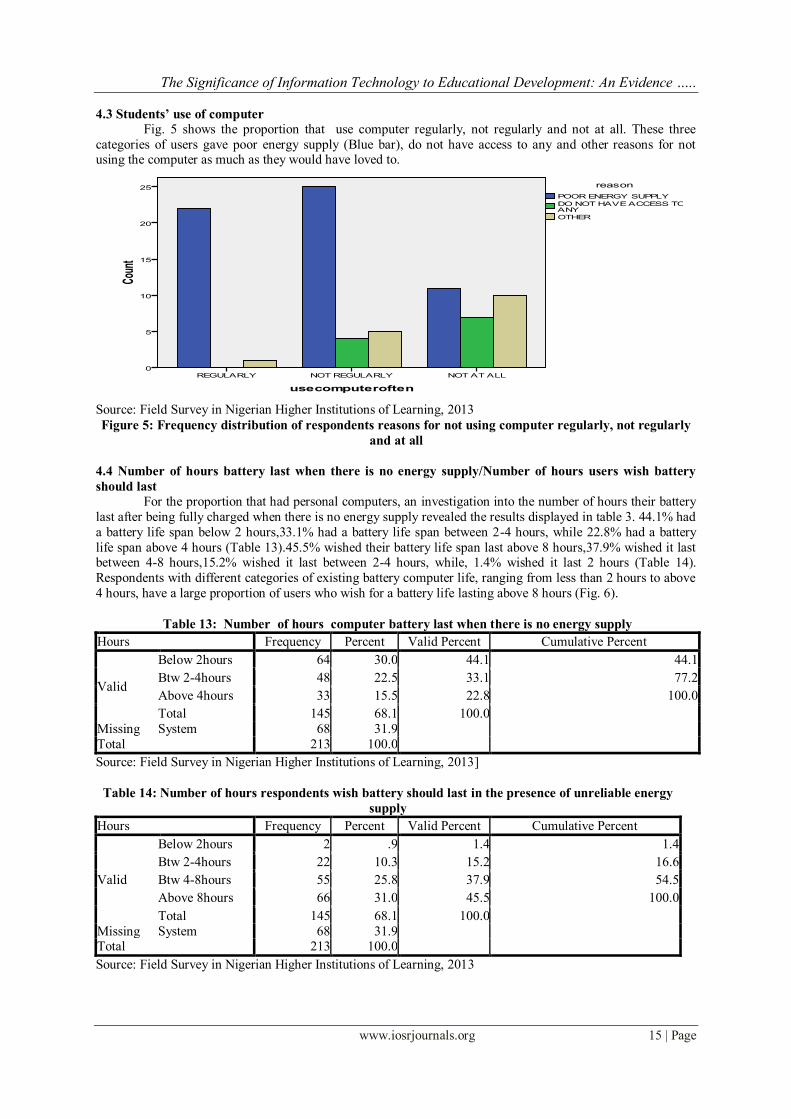
4.3 Students’ use of computer
Fig. 5 shows the proportion that use computer regularly, not regularly and not at all. These three
categories of users gave poor energy supply (Blue bar), do not have access to any and other reasons for not using the computer as much as they would have loved to.
Source: Field Survey in Nigerian Higher Institutions of Learning, 2013
Figure 5: Frequency distribution of respondents reasons for not using computer regularly, not regularly
and at all
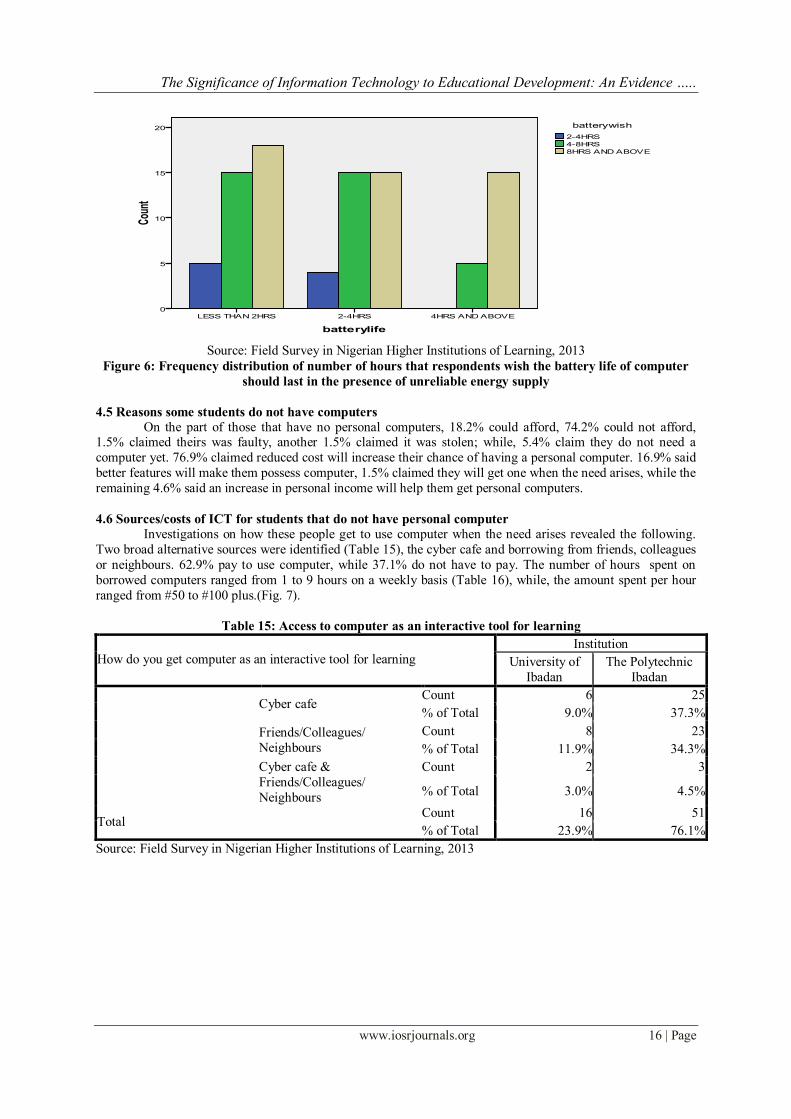
4.4 Number of hours battery last when there is no energy supply/Number of hours users wish battery
should last
For the proportion that had personal computers, an investigation into the number of hours their battery
last after being fully charged when there is no energy supply revealed the results displayed in table 3. 44.1% had
a battery life span below 2 hours,33.1% had a battery life span between 2-4 hours, while 22.8% had a battery
life span above 4 hours (Table 13).45.5% wished their battery life span last above 8 hours,37.9% wished it last between 4-8 hours,15.2% wished it last between 2-4 hours, while, 1.4% wished it last 2 hours (Table 14).
Respondents with different categories of existing battery computer life, ranging from less than 2 hours to above
4 hours, have a large proportion of users who wish for a battery life lasting above 8 hours (Fig. 6).
Table 13: Number of hours computer battery last when there is no energy supply
Hours Frequency Percent Valid Percent Cumulative Percent
Valid
Below 2hours 64 30.0 44.1 44.1
Btw 2-4hours 48 22.5 33.1 77.2
Above 4hours 33 15.5 22.8 100.0
Total 145 68.1 100.0
Missing System 68 31.9
Total 213 100.0
Source: Field Survey in Nigerian Higher Institutions of Learning, 2013]
Table 14: Number of hours respondents wish battery should last in the presence of unreliable energy
supply
Hours Frequency Percent Valid Percent Cumulative Percent
Valid
Below 2hours 2 .9 1.4 1.4
Btw 2-4hours 22 10.3 15.2 16.6
Btw 4-8hours 55 25.8 37.9 54.5
Above 8hours 66 31.0 45.5 100.0
Total 145 68.1 100.0
Missing System 68 31.9 Total 213 100.0
Source: Field Survey in Nigerian Higher Institutions of Learning, 2013
The Significance of Information Technology to Educational Development: An Evidence …..
www.iosrjournals.org 16 | Page
Source: Field Survey in Nigerian Higher Institutions of Learning, 2013
Figure 6: Frequency distribution of number of hours that respondents wish the battery life of computer
should last in the presence of unreliable energy supply
4.5 Reasons some students do not have computers
On the part of those that have no personal computers, 18.2% could afford, 74.2% could not afford, 1.5% claimed theirs was faulty, another 1.5% claimed it was stolen; while, 5.4% claim they do not need a
computer yet. 76.9% claimed reduced cost will increase their chance of having a personal computer. 16.9% said
better features will make them possess computer, 1.5% claimed they will get one when the need arises, while the
remaining 4.6% said an increase in personal income will help them get personal computers.
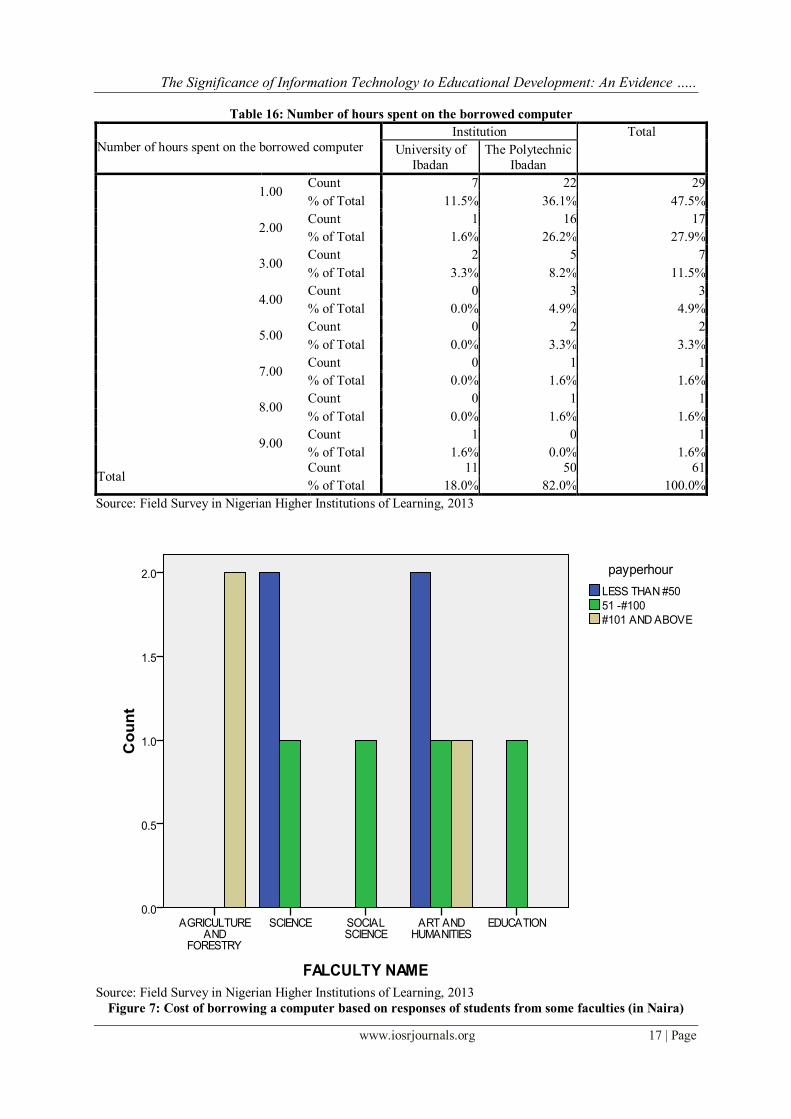
4.6 Sources/costs of ICT for students that do not have personal computer
Investigations on how these people get to use computer when the need arises revealed the following.
Two broad alternative sources were identified (Table 15), the cyber cafe and borrowing from friends, colleagues
or neighbours. 62.9% pay to use computer, while 37.1% do not have to pay. The number of hours spent on
borrowed computers ranged from 1 to 9 hours on a weekly basis (Table 16), while, the amount spent per hour
ranged from #50 to #100 plus.(Fig. 7).
Table 15: Access to computer as an interactive tool for learning
How do you get computer as an interactive tool for learning
Institution
University of
Ibadan
The Polytechnic
Ibadan
Cyber cafe Count 6 25
% of Total 9.0% 37.3%
Friends/Colleagues/
Neighbours
Count 8 23
% of Total 11.9% 34.3%
Cyber cafe &
Friends/Colleagues/
Neighbours
Count 2 3
% of Total 3.0% 4.5%
Total Count 16 51
% of Total 23.9% 76.1%
Source: Field Survey in Nigerian Higher Institutions of Learning, 2013
The Significance of Information Technology to Educational Development: An Evidence …..
www.iosrjournals.org 17 | Page
Table 16: Number of hours spent on the borrowed computer
Number of hours spent on the borrowed computer
Institution Total
University of
Ibadan
The Polytechnic
Ibadan
1.00 Count 7 22 29
% of Total 11.5% 36.1% 47.5%
2.00 Count 1 16 17
% of Total 1.6% 26.2% 27.9%
3.00 Count 2 5 7
% of Total 3.3% 8.2% 11.5%
4.00 Count 0 3 3
% of Total 0.0% 4.9% 4.9%
5.00 Count 0 2 2
% of Total 0.0% 3.3% 3.3%
7.00 Count 0 1 1
% of Total 0.0% 1.6% 1.6%
8.00 Count 0 1 1
% of Total 0.0% 1.6% 1.6%
9.00 Count 1 0 1
% of Total 1.6% 0.0% 1.6%
Total Count 11 50 61
% of Total 18.0% 82.0% 100.0%
Source: Field Survey in Nigerian Higher Institutions of Learning, 2013
Source: Field Survey in Nigerian Higher Institutions of Learning, 2013
Figure 7: Cost of borrowing a computer based on responses of students from some faculties (in Naira)
The Significance of Information Technology to Educational Development: An Evidence …..
www.iosrjournals.org 18 | Page
V. Conclusion
This study strongly supports the use of information communication technology for promoting
educational activities with 96.2% of the population under studied supporting the need for computer as
an interactive tool for learning [1], [3], [4], [10]. However, only 46.2% departments of the
respondents have computers as an interactive tool for learning. 21.4 % of the respondents used
computer regularly in class, while, 74.2% could not afford to own a personal computer because of
financial constraint. 62.9 % of our respondents pay between #50 and #100 plus per hour to use a
computer for 1 to 9 hours on a weekly basis. Apparently, some students in developing countries do
not maximize the full potentials of the computer as a result of lack of access in class and as a personal
asset. These students are therefore, not exposed to equal platforms and opportunities for learning with
students across the globe. Majority of the students do not have access to computer and a larger
proportion of those that have access to a computer gave poor energy supply as a reason for not using
the computer as regularly as they ought to.
The above mentioned challenges discourage personal participation by the student which is
impossible in normal classroom work; collaborative learning and teaching with multiple instructors;
integration of external expertise and video conferencing system to create geographically distributed
discussion panels of experts. Also, individuals and entities in the developing countries are denied
access to the same information without the time and cost associated with physical transportation. In
addition, the transfer of know-how across the full spectrum of knowledge that allows developing
countries to reap productivity gains and harness state of the art technology is lost. Ultimately, the
significant gain in economic productivity as a result of education which may be the most promising
way to stimulate general economic growth is lost.
This study calls for strategic planning by governments and stakeholders to ensure that
educational activities are not hindered as a result of lack of access to information communication
technology and poor energy supply.
Acknowledgement
We acknowledge the UNESCO Chair in Technologies for Development for its financial
support which enabled the results of this research to be presented at the UNESCO Chair International
Conference on Technologies for Development (Tech4Dev 2014). We are also grateful to partcipants
at the conference whose contributions have helped to improve the quality of our presentation.
References
[1]. J. Diebold, The application of information technology, Annals of the American Academy of Political and Social
Science, 340, 1962, 38-45.
[2]. D.E. Leidner and S.L. Jarvenpaa, The use of Information technology to enhance management school education: a
theoretical view. Special issue on IS curricula and pedagogy, MIS Quarterly, 1973, 1995, 265-291.
[3]. M. Alavi, Y. Yoo and D. R. Vogel, Using information technology to add value to management education, The
Academy of Management Journal, 40(6), 1997, 1310-1333.
[4]. J. Steinberg, Information technology and development: beyond “either/or”, The Brokings Review, 21(2), 2003, 45-
48.
[5]. International Energy Agency (IEA), Special early excerpts of the world energy outlook 2010 for the UN General
Assembly on the Millennium Development Goals, OECD/IEA, Paris, 2010.
[6]. World Bank & IBRD, Africa development indicators 2007, The World Bank and International Bank for
Reconstruction and Development (IBRD). Washington, DC, 2008.
[7]. F. Vivien and C. Briceno–Garmendia (eds.), Africa’s infrastructure – A time for transformation, The International
Bank for Reconstruction and Development and the World Bank, Washington , DC, 2010.
[8]. E.B. Parker and D. A. Dunn, Information technology: its social potential, Science, New Series, 176(4042), 1972,
1392-1399.
The Significance of Information Technology to Educational Development: An Evidence …..
www.iosrjournals.org 19 | Page
[9]. V.T. Coates, The future of information technology. Annals of the American Academy of Political and Social Science,
522, 1992, 45-56.
[10]. L.G. Roberts, Harnessing information technology for international education. The Phi Delta Kappan, 86(3), 2004,
225-228.