The Signals And Systems Concept Inventory - Asee peer logo
29
Session 1532 The Signals and Systems Concept Inventory Kathleen E. Wage Department of Electrical and Computer Engineering George Mason University, VA John R. Buck Department of Electrical and Computer Engineering University of Massachusetts Darmouth, MA Thad B. Welch Department of Electrical Engineering U.S. Naval Academy, MD Cameron H. G. Wright Department of Electrical Engineering U.S. Air Force Academy, CO Abstract This paper describes the development of continuous-time and discrete-time sig- nals and systems concept inventory exams for undergraduate electrical engineering curricula. Both exams have twenty-five multiple choice questions to assess students’ understanding of core concepts in these courses. The questions require little or no com- putation, and contain incorrect answers that capture common student misconceptions. The design of both exams is discussed, as are ongoing studies evaluating the exams at four campuses. Preliminary results from administering the continuous-time exam as a pre-test and post-test indicate a normalized gain of 0.24 ± 0.08 for traditional lecture courses, consistent with reported results for the Force Concept Inventory exam in lecture courses for freshman physics. 1 1 Introduction Faculty have expressed a strong need to quantitatively assess the ”amount” of learning achieved by students taking a particular class. Having the ability to do so would allow more reliable assessment and comparison of various teaching methods. One measurement technique is a concept inventory exam given at the start and end of a course (or sequence of courses). Proceedings of the 2002 American Society for Engineering Education Annual Conference & Exposition Copyright c 2002, American Society for Engineering Education Page 7.1184.1
-
Upload
khangminh22 -
Category
Documents
-
view
3 -
download
0
Transcript of The Signals And Systems Concept Inventory - Asee peer logo

Session 1532
The S ignals and S ystems Concept Inventory
Kathleen E. WageDepartment of Electrical and Computer Engineering
George Mason University, VA
John R. BuckDepartment of Electrical and Computer Engineering
University of Massachusetts Darmouth, MA
Thad B. WelchDepartment of Electrical Engineering
U.S. Naval Academy, MD
Cameron H. G. WrightDepartment of Electrical Engineering
U.S. Air Force Academy, CO
Abstract
This paper describes the development of continuous-time and discrete-time sig-nals and systems concept inventory exams for undergraduate electrical engineeringcurricula. Both exams have twenty-five multiple choice questions to assess students’understanding of core concepts in these courses. The questions require little or no com-putation, and contain incorrect answers that capture common student misconceptions.The design of both exams is discussed, as are ongoing studies evaluating the examsat four campuses. Preliminary results from administering the continuous-time examas a pre-test and post-test indicate a normalized gain of 0.24 ± 0.08 for traditionallecture courses, consistent with reported results for the Force Concept Inventory examin lecture courses for freshman physics.1
1 Introduction
Faculty have expressed a strong need to quantitatively assess the ”amount” of learningachieved by students taking a particular class. Having the ability to do so would allowmore reliable assessment and comparison of various teaching methods. One measurementtechnique is a concept inventory exam given at the start and end of a course (or sequenceof courses).
Proceedings of the 2002 American Society for Engineering Education Annual Conference & ExpositionCopyright c© 2002, American Society for Engineering Education
Page 7.1184.1

This paper describes the design of concept inventory exams for undergraduate signals andsystems classes. Several current pedagogical issues motivate the need for signals and sys-tems concept inventory (SSCI) exams. First, the signal processing community is debatingthe appropriate order to present discrete-time (DT) and continuous-time (CT) signals andsystems.2,3 Second, many engineering educators are evaluating pedagogical choices such aslecture vs. studio classrooms, and collaborative vs. individual learning. Surveys and coursegrades are important assessment techniques for evaluating the benefit of these alternatives,but there is clearly a need for a quantitative measure of student performance that can beused for inter-campus comparisons. Third, the advent of ABET Engineering Criteria 2000,4
which requires all programs to implement an assessment feedback cycle, further amplifies theneed for objective assessment techniques throughout all undergraduate engineering curricula.
One of our models in developing the SSCI exams was the Force Concept Inventory (FCI),which spurred recent reform in and debate about the freshman physics curriculum.1,5 TheFCI is a multiple choice exam covering Newtonian physics. The exam includes carefullycrafted incorrect answers that encompass many common student misconceptions about fun-damental concepts. The questions incorporate visual diagrams and everyday situations toemphasize conceptual understanding over mathematical manipulation.
Inspired by all of these factors, as well as a grant from the NSF-funded Foundation Coalition,we set out to develop both CT and DT SSCI exams. We sought to write exams coveringthe core concepts of signals and systems in a manner emphasizing conceptual understand-ing over computational mechanics. This paper reports preliminary results from studies forboth exams. The following section describes the development of the SSCI exams, includinginventories of the core concepts assessed by each exam. Section 3 describes the design ofthe questions on the SSCI exams, including eight example questions taken directly from theexams. Section 4 outlines the studies now underway to evaluate the current versions of theexams. Section 5 presents the results from these studies with the data collected to date.Lastly, Section 6 summarizes our findings thus far and describes our future plans.
2 Exam Development
Signals and systems is typically taught in the late sophomore or early junior year. Represen-tative texts for this subject include the books by Oppenheim and Willsky with Nawab,6 andby Lathi.7 As indicated in the introduction, there are several ways to organize the signalsand systems material. One approach is to present continuous-time topics first, followed bydiscrete-time topics; a second approach reverses that order; and a third approach presentscontinuous- and discrete-time topics in parallel. Depending on the curriculum, signals andsystems may be taught in one course or distributed over several courses.
Regardless of the pedagogical organization, introductory courses focus almost exclusivelyon linear, time-invariant (LTI) systems, with the primary application being filtering. LTIanalysis techniques, such as convolution and Fourier, Laplace, and z transforms, constitute
Proceedings of the 2002 American Society for Engineering Education Annual Conference & ExpositionCopyright c© 2002, American Society for Engineering Education
Page 7.1184.2

much of the curriculum. Sampling is the key concept that links the continuous and discretetime domains. The study of all these topics requires a certain level of mathematical sophis-tication. At a minimum, students must be familiar with basic signals such as sinusoids andunit step functions, and must be capable of simple signal manipulations such as amplitudescaling, time shifting, and time reversal. In designing the SSCI exams, we grouped the coreconcepts in signals and systems into six categories: background mathematical concepts, lin-earity and time-invariance, convolution, transform representations, filtering, and sampling.Sections 2.1 and 2.2 below describe the development of the continuous and discrete-timeexams, respectively, and document the concepts covered by each exam.
2.1 CT SSCI Development
We began developing the continuous-time version of the SSCI in late 2000, and produced aninitial draft in January of 2001. Version 1.0 of the CT SSCI consisted of 30 multiple choicequestions on the topics outlined above. During spring 2001 we administered the exam to 128students at George Mason University and the University of Massachusetts Dartmouth. Thetest population consisted of undergraduate and graduate students from six courses in theareas of linear systems, signal processing, and communications. We had two primary goalsfor the alpha-testing phase: to examine the clarity and appropriateness of the questions andto investigate which alternate (distractor) answers were most attractive to the students. Foreach question we asked students to select one of five prescribed choices or to fill in a responseof their own, allowing us to capture novel distractors caused by unanticipated conceptualconfusions.
The initial round of testing indicated that, while the questions were generally clear∗, theexam was too long and too difficult. Most students struggled to finish within the one-hour proposed time limit, and the mean score was 29.5/100. The difficulty of the exam isfurther illustrated by the fact that 87% of students scored below 40/100. Regarding thedistractor analysis, Version 1.0 appeared to capture almost all common misconceptions sincefew students gave a solution different from the prescribed alternatives.
Based on the alpha-test results, we revised the CT SSCI during summer 2001 and madeseveral important changes. First, we added several new questions that address the math-ematical background knowledge required for the study of signals and systems. Second, weused the results of the distractor analysis to eliminate the least common alternate answers,resulting in four choices for each question. Finally, we reduced the total number of questionsto 25 by focusing the exam on the most basic concepts. Table 1 shows the core conceptscovered by CT SSCI version 2.0. The lists in parentheses next to each of the five main topicscontain the question numbers in this version of the exam that address that topic. Note thatsome questions cover more than one concept.
∗Requests for clarification of the questions were minimal.
Proceedings of the 2002 American Society for Engineering Education Annual Conference & ExpositionCopyright c© 2002, American Society for Engineering Education
Page 7.1184.3

• Background mathematical concepts (1-4, 14)
– basic signals, e.g., sinusoids and unit step functions
– basic signal manipulations, e.g., amplitude scaling, time shifting, time reversal
– forms of the solutions to linear, constant-coefficient differential equations
• Linearity and time invariance (5, 23, 24)
• Convolution (8, 12, 15, 23)
– mechanics
– commutative and distributive properties
– relationship of impulse response and causality
• Fourier and Laplace transform representations (6, 7, 9-11, 13, 15-22, 25)
– Fourier series
– connection between time and frequency domain properties of a signal
– Fourier transform properties and theorems including linearity, conjugate sym-metry, delay theorem, and modulation theorem
– effect of the poles and zeros of a system function on the frequency response,impulse response, and stability of causal systems
• Filtering with LTI systems (6, 25)
– of infinite-extent sinusoids
– of narrowband pulses
Table 1: CT Signals and Systems Concept Inventory list.
2.2 DT SSCI Development
Using the continuous-time exam as a model, we began developing a discrete-time version ofthe SSCI during spring 2001. We produced an initial draft by writing DT versions of each ofthe 30 questions on version 1.0 of the CT SSCI. As we revised the CT exam questions (basedon the alpha-testing results), we made similar revisions to their discrete-time counterparts.In addition, we wrote three new questions that address concepts central to DT signals andsystems that are not covered by the CT exam, such as sampling. From this pool of questions,we selected 25 for version 1.0 of the DT SSCI. Table 2 shows the list of fundamentalconcepts covered by the DT exam. The DT SSCI contains two sampling questions and anadditional background mathematics question that the CT exam does not have. To includethese questions without increasing the total number of questions beyond 25, we had toeliminate the DT counterparts of several CT questions. Specifically, we eliminated two
Proceedings of the 2002 American Society for Engineering Education Annual Conference & ExpositionCopyright c© 2002, American Society for Engineering Education
Page 7.1184.4

questions related to the modulation theorem and one question involving Bode plots, whichwe felt were relatively less important in discrete time than the new questions. We completedversion 1.0 of the DT SSCI in time to begin alpha-testing in fall 2001. Similar to the alphaversion of the CT exam, the alpha version of each DT question asks students to select oneof five prescribed choices or to fill in their own answer. This provides the opportunity forstudents to provide unanticipated distractors.
3 Question Design
The goal of the SSCI is to assess conceptual understanding rather than computational skills.Several studies of pedagogical techniques in freshman physics courses found that coursesfocusing on conceptual understanding also improve students’ problem solving skills.1,8 Indesigning questions to probe the concepts outlined in the previous section, we consideredseveral important issues: notational conventions, the relative merits of single-concept vs. syn-thesis questions, presentation modality (whether questions are posed using words, figures,and/or equations), and the types of reasoning required. The four following paragraphs brieflydescribe each of these issues, and Sections 3.1 and 3.2 illustrate how these issues were ad-dressed during the development of the SSCI by presenting questions from the CT and DTexams, respectively.
Regarding notation, the most important variable is frequency. Some textbooks use radianfrequency,6 while others use hertz.9 Our goal was to design an exam that could be usedwith either notational convention. The SSCI uses radian frequency, however the distractorsdo not distinguish between radians and Hz. In other words, incorrectly scaling frequency bya factor of 2π should never cause the student to pick the wrong answer. The SSCI denotesthe continuous-time Fourier transform by X(jω) and the discrete-time Fourier transformby X(ejω), which is consistent with notation used in the text by Oppenheim, Willsky, withNawab.6 These notational conventions are clearly stated on the cover pages of both the CTand DT exams.
The second issue we considered in designing the SSCI is whether to include questions thatprobe multiple concepts. Single-concept questions have the advantage that they provide aclear measure of what a student does and does not understand. Questions involving multipleconcepts are more difficult to interpret, but need to be included because some core signalsand systems topics inherently require the synthesis of several concepts. For example, tounderstand frequency-selective filtering, students must understand sinusoidal signals, LTIprocessing, and the relationship between the time and frequency domains. We designed fourlinked questions, including one synthesis question, to explore these filtering-related concepts.The linked questions are discussed further in Section 3.1 below. In addition to the filteringsynthesis question, each of the SSCI exams has two other synthesis questions. The firstof these deals with impulse responses, parallel and cascade system interconnections, andcausality, and the second question examines the concepts of linearity and time-invariance.
Proceedings of the 2002 American Society for Engineering Education Annual Conference & ExpositionCopyright c© 2002, American Society for Engineering Education
Page 7.1184.5

• Background mathematical concepts (1-5, 8, 16)
– basic signals, e.g., sinusoids and unit step sequences
– basic signal manipulations, e.g., amplitude scaling, time shifting, time reversal
– forms of the solutions to linear, constant-coefficient difference equations
• Linearity and time invariance (6, 23, 24)
• Convolution (11, 14, 23)
– mechanics
– commutative and distributive properties
– relationship of impulse response and causality
• Fourier and z transform representations (9, 10, 12, 13, 15, 17-22, 25)
– Fourier series
– connection between time and frequency domain properties of a signal
– Fourier transform properties and theorems including linearity, conjugate sym-metry, and delay theorem
– effect of the poles and zeros of a system function on the frequency response,impulse response, and stability of causal systems
• Filtering with LTI systems (9, 25)
– of infinite-extent sinusoids
– of narrowband pulses
• Sampling (7, 8)
– mechanics
– Nyquist criteria
Table 2: DT Signals and Systems Concept Inventory list.
Proceedings of the 2002 American Society for Engineering Education Annual Conference & ExpositionCopyright c© 2002, American Society for Engineering Education
Page 7.1184.6

The third issue is the format used to present information in the question statements. Indesigning these exams, we used three modalities to convey information: words, figures, andequations. Twenty-four of the 25 questions on both the CT and DT exams use graphs, blockdiagrams, and other plots as a part of the question statement. Twelve of 25 questions onthe CT exam and 13 of 25 questions on the DT exam use equations or other mathematicalexpressions. The SSCI relies more heavily on figures than equations because it emphasizesconceptual understanding over computation.
Finally, the fourth issue is the type of reasoning students must use to answer the questions.We classified questions on the SSCI as requiring one of two types of reasoning skills: “for-ward” and “reverse.” Consider a simple example with a relationship among three piecesof information a, b, and c. Suppose that the typical textbook or classroom presentationof the relationship provides a and b then demonstrates how to find c. We would considera problem providing a and b and asking the students to find c an example of a problemrequiring forward reasoning. In a reverse reasoning problem, the students mights be given aand c and be asked to find b. This relationship might be as simple as an equation ab = c, ormight be more general where a, b and c are figures or facts describing a signal or system. Weoften found that students who do not understand a concept can correctly answer a forwardquestion by rote, but that they reveal their lack of understanding when they try to answera permuted version of that same question. Reverse reasoning skills are very important inengineering because they are often required to solve design problems, e.g., to design theappropriate frequency response for a filter that will produce a desired output for a giveninput. Three questions on the CT SSCI and four questions on the DT SSCI require reversereasoning.
3.1 CT SSCI Questions
To illustrate the exam design issues and to highlight what we learned during the SSCI’s de-velopment, this section and the next provide example questions from the CT and DT exams.For the CT exam, we consider the four linked questions mentioned above. Figure 1 shows thefiltering synthesis question. In this question, students are asked to determine what happensto a signal x(t) containing two narrowband pulses as it passes through a lowpass filter. Thestudents are given a plot of x(t), its corresponding Fourier transform magnitude |X(jω)|,and a plot of the Fourier transform magnitude |H(jω)| of the filter. The question asks whichof the plots in Figure 1(d) could be the output of the filter. To answer this question, studentsmust: (1) be able to distinguish between high and low sinusoidal frequencies, (2) understandthat LTI processing corresponds to a multiplication of transforms, and (3) be able to relatethe time- and frequency-domain representations of a signal.
The filtering question described above was the first question on version 1.0 of the CT SSCI.†
Alpha-test results for this question were very poor: less than 28% of the 128 students tested
†In version 1.0 this question had two additional distractors, y = 0 and y = 0.5ya(t), which were subse-quently deleted due to low response rates.
Proceedings of the 2002 American Society for Engineering Education Annual Conference & ExpositionCopyright c© 2002, American Society for Engineering Education
Page 7.1184.7

Question 25Consider a real, continuous-time signal x(t), which contains two narrowband pulses(windowed sinusoids). Figures 1(a) and 1(b) below depict x(t) and its Fourier transformmagnitude |X(jω)|. The signal x(t) is the input to a real LTI filter with the frequencyresponse magnitude |H(jω)|, shown in Figure 1(c). Figure 1(d) on the next page shows fourpossible output signals ya(t) through yd(t). Which of these four signals could be the outputof the filter in Figure 1(c) when x(t) is the input?
(a) ya(t) (b) yb(t) (c) yc(t) (d) yd(t)
0 0.1 0.2 0.3 0.4 0.5 0.6−1
0
1
t
x(t)
(a) Input signal x(t) for Question 25.
0 100 200 300 400 500 600 700 800 900 10000
5
10
15
ω
|X(jω
)|
(b) Input signal spectrum magnitude |X(jω)| for Question 25.
0 100 200 300 400 500 600 700 800 900 10000
0.2
0.4
0.6
0.8
1
1.2
ω
|H(jω
)|
(c) Filter magnitude response |H(jω)| for Question 25.
Figure 1: CT-SSCI Question 25.
Proceedings of the 2002 American Society for Engineering Education Annual Conference & ExpositionCopyright c© 2002, American Society for Engineering Education
Page 7.1184.8

0 0.1 0.2 0.3 0.4 0.5 0.6−1
0
1
y a(t)
0 0.1 0.2 0.3 0.4 0.5 0.6−1
0
1
y b(t)
0 0.1 0.2 0.3 0.4 0.5 0.6−1
0
1
y c(t)
0 0.1 0.2 0.3 0.4 0.5 0.6−1
0
1
t
y d(t)
(d) Output signals ya(t) through yd(t) for Question 25.
Figure 1: CT-SSCI Question 25.
answered the question correctly. Many (39%) of the students confused the low- and high-frequency pulses and chose ya(t), presumably due to the fact that they associated the high-frequency pulse, which is on the left side of the time plot, with the low-frequency spectralcomponents on the left of the frequency plot.
To analyze student misconceptions about filtering, we drafted three simpler questions forversion 2.0 of the CT SSCI. These questions test the three component concepts (enumer-ated above) of the filtering synthesis question. The first of the new questions is CT SSCIQuestion 1 shown in Figure 2. This question shows plots of four sinusoids and asks which hasthe highest frequency. Distractors probe whether the students confuse high frequency withhigh amplitude or large period. The second new question (CT SSCI Question 6 shown inFigure 3) considers the filtering of infinite-extent sinusoids with an LTI system. Students aregiven plots of the magnitude and phase of a lowpass filter and asked to determine the outputwhen the input is a cosine. The third new question explores time-frequency relationships.This question (CT SSCI Question 7) is shown in Figure 4. Students are given a plot of thetime signal and the corresponding Fourier transform magnitude for one narrowband pulse.They are shown the time signal plot for a second narrowband pulse of higher frequency andasked to determine which of the choices in Figure 4(b) is a plot of the Fourier transform
Proceedings of the 2002 American Society for Engineering Education Annual Conference & ExpositionCopyright c© 2002, American Society for Engineering Education
Page 7.1184.9

magnitude for the higher frequency pulse. In addition to these three new questions, weretained the synthesis question as the last question (Question 25) on version 2.0.
In terms of presentation style, Questions 1, 6, 7, and 25 are typical of the questions onboth SSCI exams. As noted above, both SSCIs use a combination of words, figures, andequations in the question statements. CT Question 6 (Figure 3) is an example of using allthree modalities. The question describes the system (input and output) both in words andwith a block diagram. The system frequency response is given as a plot of magnitude andphase, and the choices are specified using mathematical expressions. We would characterizeall four of these problems as forward reasoning problems.
3.2 DT SSCI Questions
As indicated in Section 2, many of the questions on the DT exam parallel those on the CTexam. The four linked questions described above are also included on the DT SSCI. Whilethe DT questions are very similar to their CT counterparts, there are some subtle differences,particularly for the question about sinusoidal frequency (CT Question 1, Figure 2). Figure 5shows the DT version of this question. In discrete time, radian frequency is periodic withperiod 2π, and π is the highest frequency possible. DT Question 1 shows five sinusoids andasks which has the highest frequency. The question probes whether students can identifythe sinusoid cos (πn) as having the highest frequency. Distractors include three signals thathave obvious sinusoidal shapes (i.e., they look like finely-sampled analog waveforms) andone signal with a frequency lower than π that looks less like a “typical” sampled sinusoid.
To further assess students’ understanding of DT sinusoidal frequency, an additional mathbackground question was written for the DT SSCI. Question 5 shown in Figure 6 probeswhether students know that the DT frequency variable is periodic with period 2π. Thequestion shows a plot of a signal cos(ω0n) and asks students choose the signal cos((ω0+2π)n)from among five alternatives. Distractors for this question include cosine signals with largeramplitude, lower frequency, higher frequency, and with a phase change of π/2.
There are two other questions on the DT SSCI that have no CT counterparts. These arethe questions about the concept of sampling. Figure 7 is the first sampling problem (DTQuestion 7). This question probes whether students understand the basic mechanics of thesampling process. They are told that the signal xc(t) = sin(2π(3)t) is sampled every Tseconds to produce the DT signal shown in Figure 7(a) and are asked to determine the valueof T . This is an example of a question that requires reverse reasoning, i.e., students mustdetermine a quantity (T ) that is one of the given quantities in typical homework problems.
The second sampling question on the DT SSCI, shown in Figure 8 focuses on the Nyquisttheorem. DT Question 8 asks students to determine which of the five sinusoids shown in theplot could be sampled at a rate of 5 Hz without aliasing.‡ This question requires students to
‡There is a conflict in the use of subscripts in this question. Specifically, xc(t) is used to denote both the
Proceedings of the 2002 American Society for Engineering Education Annual Conference & ExpositionCopyright c© 2002, American Society for Engineering Education
Page 7.1184.10

Question 1Figure 2(a) shows four signals xa(t) through xd(t), all on the same time and amplitude scale.Which signal has the highest frequency?(a) xa(t) (b) xb(t) (c) xc(t) (d) xd(t)
−1 0 1 2 3 4−2
−1
0
1
2
x a(t)
t−1 0 1 2 3 4
−2
−1
0
1
2
x b(t)
t
−1 0 1 2 3 4−2
−1
0
1
2
x c(t)
t−1 0 1 2 3 4
−2
−1
0
1
2
x d(t)
t
(a) Signals xa(t) through xd(t) for Question 1.
Figure 2: CT-SSCI Question 1.
Question 6Consider the system with input x(t) and output y(t) shown in Figure 3(a). The magnitudeand phase response (in radians) of the system are shown in Figure 3(b).
x(t) y(t)H(jω)
(a) System for Question 6.
ω ω
|H(jω)| � H(jω)
-π2
π2
3
200-200
(b) Magnitude and phase response of the system in Question 6.
Suppose that the input x(t) = cos(50t) for all time. What is the output y(t)?(a) 3 cos(50t+ π
2) (b) cos(50t+ π
2) (c) 3 cos(50t) (d) 3 cos(200t)
Figure 3: CT-SSCI Question 6.
Proceedings of the 2002 American Society for Engineering Education Annual Conference & ExpositionCopyright c© 2002, American Society for Engineering Education
Page 7.1184.11

determine the frequency of each sinusoid by reading the plots and to understand the Nyquistsampling criteria. It is another example of a question that uses reverse reasoning because atypical Nyquist question would ask students to determine the minimum required samplingfrequency for a single given signal.
continuous-time signal and the third choice. We detected this conflict after version 1.0 was administered in fall2001. Analysis of the fall exams indicates that the conflicting wording was not a major factor in determiningstudents’ answers to this question. Of the 53 students who answered DT Question 8, three chose (a), sixchose (b), eight chose (c), 30 chose the correct answer (d), three chose (e), and three chose (f). As part of asurvey, three of the students who answered (c) were later asked to justify their answers. The justificationsthey provided indicate that their choice of (c) was based on a conceptual misunderstanding rather than onthe wording of the question. We will correct the wording of DT Question 8 prior to administering the examin spring 2002.
Proceedings of the 2002 American Society for Engineering Education Annual Conference & ExpositionCopyright c© 2002, American Society for Engineering Education
Page 7.1184.12

Question 7Signals x1(t) and x2(t) are shown on the left hand side of Figure 4(a). The Fourier transformmagnitude, |X1(jω)|, for signal x1(t) is shown on the right side of the figure.
0 0.1 0.2 0.3 0.4 0.5−A
0
A
x 1(t)
−200 −100 0 100 200 0
C
2C
ω
|X1(jω
)|
0 0.1 0.2 0.3 0.4 0.5−A
0
A
t
x 2(t)
(a) Signals x1(t) and x2(t) and the Fourier transform magnitude |X1(jω)| for Question 7.
Which of the plots shown in Figure 4(b) could be |X2(jω)|, the Fourier transform magnitudefor signal x2(t)?
−200 −100 0 100 200 0
C
2C
|Xa(jω
)|
−200 −100 0 100 200 0
C
2C
|Xb(jω
)|
−200 −100 0 100 200 0
C
2C
ω
|Xc(jω
)|
−200 −100 0 100 200 0
C
2C
ω
|Xd(jω
)|
(b) Fourier transform magnitudes |Xa(jω)| through |Xd(jω)| for Question 7.
Figure 4: CT-SSCI Question 7.
Proceedings of the 2002 American Society for Engineering Education Annual Conference & ExpositionCopyright c© 2002, American Society for Engineering Education
Page 7.1184.13
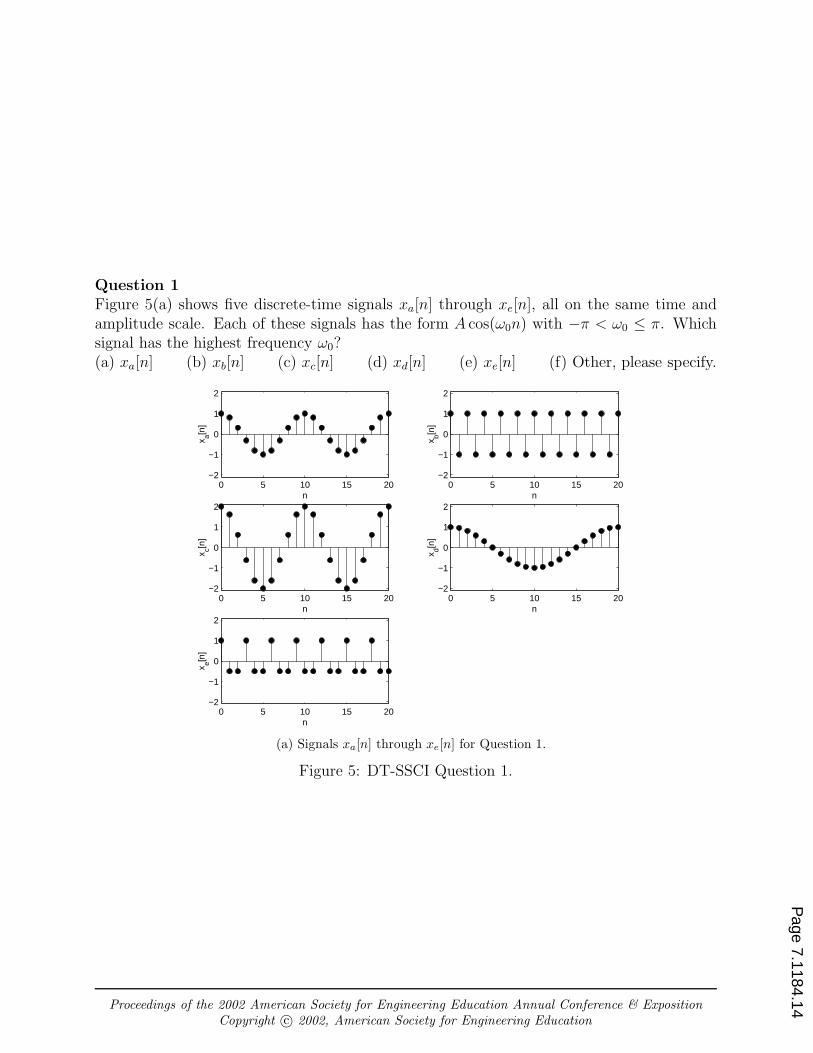
Question 1Figure 5(a) shows five discrete-time signals xa[n] through xe[n], all on the same time andamplitude scale. Each of these signals has the form A cos(ω0n) with −π < ω0 ≤ π. Whichsignal has the highest frequency ω0?(a) xa[n] (b) xb[n] (c) xc[n] (d) xd[n] (e) xe[n] (f) Other, please specify.
0 5 10 15 20−2
−1
0
1
2
x a[n]
n0 5 10 15 20
−2
−1
0
1
2
x b[n]
n
0 5 10 15 20−2
−1
0
1
2
x c[n]
n0 5 10 15 20
−2
−1
0
1
2
x d[n]
n
0 5 10 15 20−2
−1
0
1
2
x e[n]
n
(a) Signals xa[n] through xe[n] for Question 1.
Figure 5: DT-SSCI Question 1.
Proceedings of the 2002 American Society for Engineering Education Annual Conference & ExpositionCopyright c© 2002, American Society for Engineering Education
Page 7.1184.14

Question 5Figure 6(a) is a plot of the signal cos(ω0n).
0 10 20 30 40 50 60 70 80 90 100−2
0
2
n
(a) Plot of cos(ω0n) for Question 5.
Which of the following signals is cos ((ω0 + 2π)n)?
(a) sa[n] (b) sb[n] (c) sc[n] (d) sd[n] (e) se[n] (f) Other, please specify.
0 10 20 30 40 50 60 70 80 90 100−2
0
2
s a[n]
0 10 20 30 40 50 60 70 80 90 100−2
0
2
s b[n]
0 10 20 30 40 50 60 70 80 90 100−2
0
2
s c[n]
0 10 20 30 40 50 60 70 80 90 100−2
0
2
s d[n]
0 10 20 30 40 50 60 70 80 90 100−2
0
2
n
s e[n]
(b) Signals sa[n] through se[n] for Question 5.
Figure 6: DT-SSCI Question 5.
Proceedings of the 2002 American Society for Engineering Education Annual Conference & ExpositionCopyright c© 2002, American Society for Engineering Education
Page 7.1184.15

Question 7A continuous-time signal xc(t) = sin(2π(3)t) is sampled every T seconds to produce thediscrete-time signal x[n] = xc(nT ) shown in Figure 7(a). Which of the following choices ofT would give the signal x[n] shown below?(a) 1/72 (b) 1/6 (c) 1/12 (d) 1/18 (e) 1/36 (f) Other, please specify.
0 5 10 15 20 25 30 35
−1
0
1
n
x[n]
(a) Signal x[n] for Question 7.
Figure 7: DT-SSCI Question 7.
Proceedings of the 2002 American Society for Engineering Education Annual Conference & ExpositionCopyright c© 2002, American Society for Engineering Education
Page 7.1184.16

Question 8A continuous-time signal xc(t) is sampled at sampling frequency fs = 1/T = 5 Hz to obtaina discrete-time signal x[n] = xc(nT ). Which of the continuous-time sinusoids in Figure 8(a)could be sampled at this rate without aliasing?(a) xa(t) (b) xb(t) (c) xc(t) (d) xd(t) (e) xe(t) (f) None of the above.
0 0.1 0.2 0.3 0.4 0.5 0.6 0.7 0.8 0.9 1
−1
0
1
x 1(t)
0 0.1 0.2 0.3 0.4 0.5 0.6 0.7 0.8 0.9 1
−1
0
1
x 2(t)
0 0.1 0.2 0.3 0.4 0.5 0.6 0.7 0.8 0.9 1
−1
0
1
x 3(t)
0 0.1 0.2 0.3 0.4 0.5 0.6 0.7 0.8 0.9 1
−1
0
1
x 4(t)
0 0.1 0.2 0.3 0.4 0.5 0.6 0.7 0.8 0.9 1
−1
0
1
Time (sec)
x 5(t)
(a) Signals xa(t) through xe(t) for Question 8.
Figure 8: DT-SSCI Question 8.
Proceedings of the 2002 American Society for Engineering Education Annual Conference & ExpositionCopyright c© 2002, American Society for Engineering Education
Page 7.1184.17

4 Current Study
This section describes the studies currently underway to develop and refine both the CT SSCIand the DT SSCI. The CT SSCI exam is more mature and is roughly a year ahead of theDT SSCI in its development cycle. Consequently, the study for the CT SSCI is relativelysophisticated, looking to duplicate previous concept inventory exam evaluations publishedin Hake’s survey of the FCI.1 The DT SSCI study focuses on simpler goals of verifying thatthe question wordings are clear and determining which incorrect answers capture commonstudent confusions.
4.1 CT SSCI Study
Version 2.0 of the CT SSCI is currently being tested at four schools: George Mason University(GMU), the U.S. Air Force Academy (USAFA), the U.S. Naval Academy (USNA) and theUniversity of Massachusetts Dartmouth (UMD). Table 3 summarizes the curricular contextof continuous-time signals and systems for each of the schools. Instructors are administeringthe CT SSCI exam as a pre-test and a post-test for the CT portion of their curriculum.Motivated by Hake’s survey of the FCI,1 we will compute the normalized gain g for eachstudent, as well as normalized gains for each course (based on the average pre-test andpost-test scores for each course). The normalized gain is defined as
g =posttest-pretest
100-pretest,
i.e., the fraction of the available improvement in score that was obtained during the course orcourses. In analyzing the FCI, Hake has shown that normalized gain is a stable performancemeasure for courses that have similar pedagogical formats, regardless of variations in studentbackground or instructor experience.1
Outside of the classroom and independent of the testing, the following data is being collectedabout each student participating in the study: class year, GPA, calculus grades, differentialequations grade, circuits grade (where relevant), race, and gender. To protect student pri-vacy, the academic and demographic data are linked to the exam scores through anonymousstudy IDs.
Course Year Circuits DT/CT TextCourse First Used
GMU ECE 220 Soph 2 Co-Req DT 9
USAFA EE 332, 333 Jr 1&2 Pre-req CT 9
USNA EE 322 Jr 1 Pre-req CT 6
UMD ECE 321 Jr 1 Pre-req CT 7
Table 3: Curricular contexts of CT SSCI study courses.
Proceedings of the 2002 American Society for Engineering Education Annual Conference & ExpositionCopyright c© 2002, American Society for Engineering Education
Page 7.1184.18

The current study of the CT SSCI has four goals:
1. To gather information for ongoing refinement of the questions and the concept inven-tory list,
2. To begin to establish a baseline for the gain statistic on the exam, similar to Hake’sresults for the FCI,1
3. To investigate whether the exam has race or gender biases,
4. To examine the extent to which previous academic performance is a predictor of successon the CT SSCI exam.
This paper presents results from goals (1) and (2) in Section 5.1. Data for goals (3) and (4)are still being collected and analyzed, and will be reported in future publications.
4.2 DT SSCI Study
Version 1.0 of the DT SSCI is currently being tested at UMD and GMU. The goals ofthe DT exam study are more limited than for the CT exam study. Specifically, the DTSSCI study seeks to gather information for ongoing refinement of the questions and theDT concept inventory list, similar to what was done during the alpha-tests of the CT SSCIdescribed in Section 2.1. In fall 2001, the DT exam was administered once during thesemester to students in three different courses. Table 4 summarizes the curricular contextof these courses, including the level (undergraduate or graduate), whether the DT SSCI wasused as a pre-test or post-test, and the textbooks used.
In addition to the exam data, GMU ECE 410 also collected short answer justifications fromstudents for Questions 7, 8, 12, 23 and 25 on the DT SSCI 1.0. This student input will beused to analyze common misconceptions for these questions. GMU ECE 320 will administerthe exam to another set of students in spring 2002. We will revise the DT SSCI exam basedon the statistical analyses of students’ responses and the GMU justifications. This revisedexam will be used starting in fall 2002 for a study with the same methodology and goals asthe CT SSCI study in Section 4.1. Initial results of the DT SSCI are presented in Section 5.2.
Course Year Material Pre/Post TextGMU ECE 320 Jr 1 DT Signals & Systems Post 9
GMU ECE 410 Sr 1 DSP Post 10
UMD ECE 574 Grad DSP Pre 11
Table 4: Curricular contexts of DT SSCI study courses.
Proceedings of the 2002 American Society for Engineering Education Annual Conference & ExpositionCopyright c© 2002, American Society for Engineering Education
Page 7.1184.19

5 Results
Sections 5.1 and 5.2 below report the results to date from the ongoing CT SSCI and DT SSCIstudies described in the previous section
5.1 CT SSCI Results
This section reports the analysis of results for 97 students at GMU, UMD, and the USNAwho took the CT SSCI as a pre- and post-test during the fall 2001 semester. We computedthe normalized gain, denoted <g> by Hake,1,12 for each course based on the average pre-testand post-test scores of those students who took the exam both times. Table 5 reports theresults for the pre-test, post-test, and gain for each campus. The values on this table arereported on a scale where 100 is a perfect score (25 correct answers) on the exam. Theaverage gain over the three classes was 0.24± 0.08 (std dev). This value is consistent withthe FCI gain of 0.23± 0.04 reported in Hake’s survey1 for “traditional” courses, in contrastwith “interactive-engagement” (IE) courses, which have gains of 0.48± 0.14 (std dev). Allthree of the signals and systems courses using the CT SSCI are considered traditional coursesin Hake’s characterization, since they make “little or no use of IE methods, relying primarilyon passive-student lectures”.1
Pre-Test Post-TestCampus Students Mean Std. Dev. Mean Std. Dev. Gain gGMU 43 40.4 9.6 49.6 9.9 0.15UMD 13 44.3 13.1 60.0 15.5 0.28USNA 41 44.7 11.0 60.1 11.3 0.28
Table 5: Results of fall 2001 CT SSCI study by campus.
Additionally, 29 USAFA students took the pre-test during this semester, but have not yettaken the post-test. The USAFA curriculum divides the signals and systems material acrosssemester boundaries, so these students will take the post-test after finishing the signals andsystems material during the Spring 2002 semester. These results will be incorporated intothis analysis and reported in future publications.
The CT SSCI study data were also analyzed by pooling all students across all campuses.Since all courses were traditional courses, and covered very similar syllabi, this appears well-founded. Figure 9 plots the histograms of the pre-test and post-test scores for all studentstaking the exam both times. The improvement in the students’ conceptual understandingduring the semester is clearly visible from this data.
Figure 10 plots a histogram of the normalized gain g for individual students. The gainsare broadly spread, ranging from −0.43 to +0.80. Fourteen students actually had negativegain, with post-test scores less than their pre-test scores. As suggested by Hake,12 we also
Proceedings of the 2002 American Society for Engineering Education Annual Conference & ExpositionCopyright c© 2002, American Society for Engineering Education
Page 7.1184.20

5 15 25 35 45 55 65 75 85 950
10
20
30
40
Exam score
Num
ber
of s
tude
nts
(a) Pre-test score histogram.
5 15 25 35 45 55 65 75 85 950
10
20
30
40
Exam score
Num
ber
of s
tude
nts
(b) Post-test score histogram.
Figure 9: CT SSCI pre-test and post-test histograms.
−1 −0.8 −0.6 −0.4 −0.2 0 0.2 0.4 0.6 0.8 10
2
4
6
8
10
Normalized Gain g
Num
ber
of S
tude
nts
Figure 10: CT SSCI histogram of individual students normalized gains g.
Proceedings of the 2002 American Society for Engineering Education Annual Conference & ExpositionCopyright c© 2002, American Society for Engineering Education
Page 7.1184.21

analyzed the standard deviation of the gains within each class to obtain an estimate of therandom error of each population, which is associated with the spread. Table 6 presents thestandard deviation of individual student’s g for each course, and indicates that the averagestandard deviation over all three classes is 0.21±0.04. This random error of 0.21 exceeds theerror of 0.08 calculated for the gain of 0.24±0.08 from Table 5, which suggests that randomerrors within the student population dominate any systematic errors between the courses.
Campus Std. Dev gGMU 0.19UMD 0.19USNA 0.26
Mean 0.21± 0.04 (sd)
Table 6: CT SSCI random error analysis results.
Figure 11 shows scatter plots of individual student performance on the exams. The leftpanel, Figure 11(a), represents each student as a dot using the student’s pre-test score asthe abscissa and their post-test score as the ordinate. Note that there are fewer than 97dots on the graph since some students obtained identical pre- and post-test scores. Almostall student scores fall above the diagonal solid line representing equal pre-test and post-testscores. Therefore, almost all students performed better on the post-test than the pre-test.The dashed line represents the mean normalized gain of 0.24 reported from Table 5. Theright panel, Figure 11(b), represents each student’s performance using the pre-test score asthe abscissa and their normalized gain g as the ordinate. It is curious to note that althoughmost students achieved a positive gain in score during the semester, eleven of the fourteenstudents with a negative gain scored better than the average pre-test score of 42.7.
As suggested in Hake’s unpublished memo on diagnostic exams,12 we also calculated thecorrelation coefficient between individual students’ g and pre-test scores. This value, −0.33,is less than zero, which suggests that “the instruction favors students who have less priorknowledge of the subject as judged by the pre-test score”.12 It would be premature to drawstrong conclusions about this without a larger sample size, but the preliminary indicationsare intriguing.
The CT SSCI exam results were also analyzed on a question by question basis. The difficultyindex for each question on the exam is defined as the fraction of the students getting thisquestion correct. Figure 12(a) plots the difficulty index vs. question number for the pooledstudent data. The pre-test data appears as a solid line, while the post-test data appears as adashed line. Based on these scores, the normalized gain was computed for each question, andthe results are also plotted in Figure 12(b). Questions 2, 3, 4, and 11 show high gains (over0.5). The first three of these (2, 3 and 4) assess students’ understanding of basic shiftingand scaling operations. Question 11 requires the students to identify the correct spectrumfor an amplitude modulated signal. Note that Figure 12(b) also shows that several questionsactually have negative gains through the semester. Questions 9, 10 and 18 had fewer studentsget them correct on the post-test than did on the pre-test. Question 9 asks the students
Proceedings of the 2002 American Society for Engineering Education Annual Conference & ExpositionCopyright c© 2002, American Society for Engineering Education
Page 7.1184.22

0 20 40 60 80 1000
20
40
60
80
100
Pre−test scores
Pos
t−te
st s
core
s
(a) Scatter plot of pre- and post-test scores
0 20 40 60 80 100
−0.4
−0.2
0
0.2
0.4
0.6
0.8
Pre−test scores
Nor
mal
ized
Gai
n g
(b) Scatter plot of pre-test score vs. normalizedgain g
Figure 11: Scatter plots of individual student performance on the CT SSCI
to identify the spectrum of a signal which has been convolved with itself. Question 10 asksthe students to identify the spectrum after the signal has been scaled by 2. Question 18asks the students to identify which pole-zero diagrams correspond to real impulse responses.It should be noted that although the performance on Questions 9 and 10 was worse afterthe course than before, these were two of the highest scoring questions in both the pre-test and post-test, with about 80% of students getting them correct. Thus, the small lossin performance on Questions 9 and 10 may not be cause for tremendous alarm, especiallyfor the modest population size. The results for Question 18, however, suggest that duringthe semester the students form strong incorrect ideas about the pole-zero locations for realsignals. Twenty-three percent of the students got this question correct on the pre-test, whichis roughly what would be expected by chance since there are four answers to choose from.For the post-test, only 6% of the students chose the correct answer, with a strong majority(77%) choosing a distractor that included only poles on the real s axis, but not complexconjugate poles.
Analysis of the four linked questions described in Section 3 sheds light on the problemsstudents have in understanding frequency-selective filtering. Recall that CT SSCI Questions1, 6 and 7 separately test the concepts that students must synthesize to get Question 25correct. Both the pre-test and post-test data in Figure 12(a) suggest that the concept onQuestion 7 is the limiting factor in students’ performance on Question 25. On the pre-test, the students scored 27% on both questions, while on the post-test 48% got Question7 and 43% got Question 25. The scores for Questions 1 and 6 are much higher on bothpre- and post-tests (over 95% for Question 1 and over 65% for Question 6). Consequently,it appears that confusion about the relationship between time and frequency domain signalrepresentations limits students’ performance more than their ability to synthesize the threedistinct concepts required to solve the problem.
Proceedings of the 2002 American Society for Engineering Education Annual Conference & ExpositionCopyright c© 2002, American Society for Engineering Education
Page 7.1184.23

5 10 15 20 250
0.2
0.4
0.6
0.8
1
Problem Number
diffi
culty
Inde
x
pre−test post−testchance
(a) Difficulty index by question number.
5 10 15 20 25−0.4
−0.2
0
0.2
0.4
0.6
Problem Number
Nor
mal
ized
Gai
n g
(b) Normalized gain g by question number.
Figure 12: CT SSCI difficulty index and normalized gain g for each question for pooledstudents.
Proceedings of the 2002 American Society for Engineering Education Annual Conference & ExpositionCopyright c© 2002, American Society for Engineering Education
Page 7.1184.24

5.2 DT SSCI Results
This section presents results from the preliminary testing of version 1.0 of the DT SSCIduring fall 2001. As noted in Section 4.2, this study sought to verify that the questions wereclearly written, and to confirm that the set of distractors covered the most common studentconfusions. A total of 55 students took this exam during the fall 2001 semester. Table 7reports the statistics from each campus individually. Recall from Table 4 that these coursesare for different class years. The only course in which the exam was administered as a pre-test was in a graduate DSP course, for which the material on the DT SSCI is taught in theprerequisite of the prerequisite, so the students should have been reasonably familiar with it.As one might expect, the post-test scores of the seniors in GMU ECE 410 were statisticallysimilar to the pre-test scores of the new graduate students in UMD ECE 574. The overallmean score was 49.2 with a standard deviation of 16.7. Figure 13 shows a histogram of thepooled scores from all three classes.
Course Students Mean Score Std. Dev.GMU ECE 320 15 39 14.5GMU ECE 410 23 55 15.2UMD ECE 574 17 50 17.0
Table 7: Fall 2001 DT SSCI version 1.0 results.
Figure 14 plots the difficulty index of each question on the DT SSCI. The dashed lineindicates the 20% performance expected from random guessing, since there are 5 answers foreach question. Comparing these results with the CT SSCI scores reveals several interestingpoints. Similar to the CT exam, students did better on the the basic background conceptquestions, tested by 1, 2, 3, and 5, than on most of the other questions. The DT SSCIQuestion 1 (Figure 5) was more difficult than the comparable CT SSCI question on frequency(Figure 2). This is consistent with our experience that many students find DT frequencya more subtle concept to grasp than CT frequency, particularly the notion that there isa highest effective frequency in DT. Intriguingly, the strong performance on DT SSCIQuestion 5 (Figure 6) demonstrates that the students do understand the periodic nature ofDT frequency.
Examining the linked questions on filtering reveals a difference between the CT and DTresults. Recall that Question 25 of the DT SSCI synthesizes three concepts, similar toQuestion 25 of the CT SSCI. DT SSCI Questions 1, 9 and 10 separately test the constituentconcepts that appear together in Question 25. Figure 14 shows that, unlike the CT SSCI,there is no clear bottleneck question limiting performance on Question 25. All three ofQuestions 1, 9 and 10 have more than 50% of the students getting them correct, whileonly 36% of the students get Question 25 correct. One interpretation is that since the DTstudents we tested have had at least one more signals and systems class than those in theCT study, they are more comfortable with the time and frequency domain representationstested in DT Question 10 (the analog to CT SSCI Question 7 shown in Figure 4). The lowerperformance on DT SSCI Question 25 would be consistent with an explanation that the
Proceedings of the 2002 American Society for Engineering Education Annual Conference & ExpositionCopyright c© 2002, American Society for Engineering Education
Page 7.1184.25

5 15 25 35 45 55 65 75 85 950
5
10
15
20
Exam Score
Num
ber
of S
tude
nts
Figure 13: DT SSCI histogram of scores.
5 10 15 20 250
20
40
60
80
100
Question number
Per
cent
age
corr
ect
Student ScoresChance
Figure 14: DT SSCI difficulty index by question number.
students understand the individual concepts in Questions 1, 6 and 7, but cannot synthesizetheir knowledge to get Question 25 correct. We would expect somewhat different resultsfrom schools which teach DT topics before CT topics in their signals and systems courses.
6 Conclusion
We developed concept inventory exams for continuous-time and discrete-time signals andsystems. This paper described the content of these exams by presenting eight sample ques-tions and reported the results of the current study being conducted on four campuses. Incompiling statistics for the CT exam, we duplicated the analyses done by Hake for the ForceConcept Inventory exam.1 Analysis of the data for three of the participating schools shows anormalized gain of 0.24±0.08, which is consistent with the reported results for other conceptinventory studies of traditional lecture courses.
Study and development of the CT and DT SSCI exams is an ongoing project. In additionto incorporating the USAFA post-test scores into the analysis as they become available, we
Proceedings of the 2002 American Society for Engineering Education Annual Conference & ExpositionCopyright c© 2002, American Society for Engineering Education
Page 7.1184.26

plan to examine the demographic and academic data collected as a part of the current study.We will use this data to examine whether the exam has race or gender biases and investigatethe correlation between previous academic performance and performance on the SSCI.
We are actively seeking additional instructors to participate in the SSCI study. In particular,we would like to recruit professors who are using interactive engagement techniques as apart of their curriculum. All who are interested in participating should contact John Buckor Kathleen Wage. Additional information about the study, including an information packetfor instructors, may be found on the SSCI website, located at http://ece.gmu.edu/~kwage/research/ssci. The website also contains copies of current versions of the exams, whichare available to signals and systems instructors or other interested non-students who requesta password.
7 Acknowledgments
We thank the following professors for administering the SSCI in their classes: Lee Estes,Susan Jarvis, and Karen Payton of UMD, Guy Beale, Yariv Ephraim, Janos Gertler, andPatrick Kreidl of GMU, Daniel Pack of USAFA. We thank Hamid Nawab (BU) for hisinput on the first version of the exam, David Hestenes (ASU) for sharing insights on writingconceptual exam questions, and Tianzhu Meng (UMD) for assisting with the data analysis.We thank the Foundation Coalition for sponsoring this work, specifically Jeff Froyd (TAMU)and Don Evans (ASU).
Proceedings of the 2002 American Society for Engineering Education Annual Conference & ExpositionCopyright c© 2002, American Society for Engineering Education
Page 7.1184.27
References
[1] R. R. Hake, “Interactive-engagement vs. traditional methods: A six-thousand-studentsurvey of mechanics test data for introductory physics courses,” Am. J. Phys., vol. 66,pp. 64–74, 1998.
[2] J. H. McClellan, R. W. Schafer, and M. A. Yoder, “Digital Signal Processing First,”IEEE Signal Processing Magazine, vol. 16, pp. 29–34, Sept. 1999.
[3] D. C. Munson, Jr. and D. L. Jones, “Analog Signal Processing First,” IEEE SignalProcessing Magazine, vol. 16, pp. 24–29, Sept. 1999.
[4] Accreditation Board for Engineering and Technology, “Criteria for Accrediting Engi-neering Programs.” ABET Publication 01AB-7, Baltimore, MD, March 2000.
[5] D. Hestenes, M. Wells, and G. Swackhamer, “Force Concept Inventory,” The PhysicsTeacher, vol. 30, pp. 141–158, Mar. 1992.
[6] A. V. Oppenheim and A. S. Willsky with H. Nawab, Signals and Systems. Prentice HallSignal Processing Series, Englewood Cliffs, NJ: Prentice Hall, second ed., 1997.
[7] B. P. Lathi, Signal Processing and Linear Systems. Berkeley, CA: Berkeley-CambridgePress, 1998.
[8] E. Mazur, Peer Instruction: A User’s Manual. Englewood Cliffs, NJ: Prentice Hall,1997.
[9] R. Ziemer, W. Tranter, and D. Fannin, Signals and Systems: Continuous and Discrete.Englewood Cliffs, NJ: Prentice Hall, fourth ed., 1998.
[10] B. Porat, A Course in Digital Signal Processing. New York, NY: John Wiley and Sons,Inc., 1997.
[11] A. V. Oppenheim and R. W. Schafer with J. R. Buck, Discrete-Time Signal Processing.Upper Saddle River, NJ: Prentice Hall, second ed., 1999.
[12] R. R. Hake, “Suggestions for Administering and Reporting Pre/Post Diagnostic Tests.”online as ref. 14 at <http://physics.indiana.edu/~hake>, May 2001.
KATHLEEN E. WAGE, Ph.D., is an Assistant Professor in the Department of Electrical and ComputerEngineering at George Mason University, Fairfax, VA. Her research interests include signal processing, adap-tive arrays, and underwater acoustics. Dr. Wage is a member of IEEE, ASEE, ASA, Tau Beta Pi, Eta KappaNu, and Sigma Xi. E-mail: [email protected]
JOHN R. BUCK, Ph.D., is an Associate Professor jointly appointed in the Department of Electrical andComputer Engineering and the School of Marine Science and Technology at the University of MassachusettsDartmouth. His research interests include signal processing, underwater acoustics, and marine mammalbioacoustics. Dr. Buck is a member of IEEE, ASEE, ASA, AMS, Phi Beta Kappa, Sigma Xi and Tau BetaPi. E-mail: [email protected]
Proceedings of the 2002 American Society for Engineering Education Annual Conference & ExpositionCopyright c© 2002, American Society for Engineering Education
Page 7.1184.28

THAD B. WELCH, Ph.D, P.E., is an Associate Professor in the Department of Electrical Engineering atthe U.S. Naval Academy, Annapolis, MD (from 1994–1997 he was an Assistant Professor in the Departmentof Electrical Engineering at the U.S. Air Force Academy). His research interests include multicarrier com-munication systems analysis and signal processing. Commander Welch is a member of ASEE, IEEE, andEta Kappa Nu. E-mail: [email protected]
CAMERON H. G. WRIGHT, Ph.D, P.E., is Professor and Deputy Department Head of the Departmentof Electrical Engineering at the U.S. Air Force Academy, Colorado Springs, CO. His research interests includesignal and image processing, biomedical instrumentation, communications systems, and laser/electro-opticsapplications. Lt. Colonel Wright is a member of ASEE, IEEE, SPIE, NSPE, Tau Beta Pi, and Eta KappaNu. E-mail: [email protected]
Proceedings of the 2002 American Society for Engineering Education Annual Conference & ExpositionCopyright c© 2002, American Society for Engineering Education
Page 7.1184.29