
The Shand CCS Feasibility Study Public Report
124
INTERNATIONAL CCS KNOWLEDGE CENTRE THE SHAND CCS FEASIBILITY STUDY PUBLIC REPORT The Shand CCS Feasibility Study Public Report NOVEMBER 2018 ccsknowledge.com
-
Upload
khangminh22 -
Category
Documents
-
view
0 -
download
0
Transcript of The Shand CCS Feasibility Study Public Report

I N T E R N A T I O N A L C C S K N O W L E D G E C E N T R E T H E S H A N D C C S F E A S I B I L I T Y S T U D Y P U B L I C R E P O R T
The Shand CCS Feasibility StudyPublic ReportN O V E M B E R 2 0 1 8
ccsknowledge.com

I N T E R N A T I O N A L C C S K N O W L E D G E C E N T R E T H E S H A N D C C S F E A S I B I L I T Y S T U D Y P U B L I C R E P O R T

i
The Shand CCS Feasibility Study and its associated documents reflect the findings and opinions of the Knowledge Centre. SaskPower has many factors that will determine if or when CCS will be deployed on units beyond BD3.
About this Study

I N T E R N A T I O N A L C C S K N O W L E D G E C E N T R E T H E S H A N D C C S F E A S I B I L I T Y S T U D Y P U B L I C R E P O R T
The Canadian province of Saskatchewan is a world-leader in Carbon Capture and Storage (CCS). Saskatchewan and its provincial utility, SaskPower, pioneered the way for full-scale carbon capture facilities around the world with their fully-integrated carbon capture and storage demonstration project on Unit 3 of the Boundary Dam coal-fired power plant (BD3). Operations at BD3 have steadily improved since initial startup. The facility has addressed safety issues and has recently started to demonstrate a level of reliability that is consistent with a thermal-generating facility, although still at below design CO2 production levels. Once stable operation of the facility is achieved, it will allow the plant operations and support staff to focus on improving the efficiency and cost effectiveness of the operation.
As with any world-first project, many lessons were learned through the design, construction and operations of the facility. These lessons have resulted in novel optimizations, operating methods and overall learnings for the facility and its role as a power generator in the power utility. While ongoing improvements are anticipated, second-generation CCS will undoubtedly realize many improvements over the first generation – which this report will highlight.
The province and its Crown utility are now approaching another important decision related to electricity supply and considerations for CCS into the future. The utility has a need to provide reliable and affordable base-load power, which regionally is only available from coal or natural gas, while meeting Canadian federal regulations limiting emissions from traditional coal-fired power plants.
The International CCS Knowledge Centre (Knowledge Centre) is currently executing a feasibility study with SaskPower to determine if a business case can be made for a post combustion carbon capture retrofit of the 305MW Shand Power Station. This report is therefore titled the Shand CCS Feasibility Study.
This detailed technical public document focuses specifically on the potential retrofit of the Shand Power Station. While no decision has been made, should SaskPower decide to proceed, the Shand CCS project would produce the second, full-scale capture facility in Saskatchewan with a nominal capacity of 2 million tonnes of CO2 (Mt) per year – twice the capacity of BD3. Information contained herein represents the interpretation of the public and non-confidential portion of this study to highlight both the overall impact on the cost of CO2 capture, as well as contrasting the impact of the major design modifications with the BD3 system.
The physics and economics that govern the design and operation of thermal power plants is remarkably similar throughout the world; as such, the methods and concepts explored in this report extend more broadly. In fact, many of the same fundamental findings can be further applied to other industrial processes such as cement or iron and steel. General application of this information to other facilities globally are further articulated in the Knowledge Centre’s compendium document Summary for Decision Makers on Second Generation CCS.
A B O U T T H I S S T U D Y C O N T I N U E D
Saskatchewan and its provincial utility,
SaskPower, pioneered the way for full-scale
carbon capture facilities around the world.

iii
Key findings of feasibility study evaluates the economics of CCS on a 300MW coal-fired power plant in Saskatchewan
Designed to capture 2Mt/year
67% capital cost reduction (per tonne of CO2 captured)
Cost of capture at USD$45/t CO2
Capture rate can reach up to 97% with reduced load (i.e. integrates well with renewable electricity)
Fly ash sales can further reduce CO2 (potential 125,000t CO2/year reduced). Some believe this means the facility can be carbon neutral.
How did costs come down?
Lessons learned from building and operating BD3
Construction at a larger scale using extensive modularization
Effective integration (a case-by-case imperative)
Boundary Dam CCS Facility in Saskatchewan

I N T E R N A T I O N A L C C S K N O W L E D G E C E N T R E T H E S H A N D C C S F E A S I B I L I T Y S T U D Y P U B L I C R E P O R T
The International CCS Knowledge Centre is a non-profit organization created and sponsored by BHP and SaskPower. Its mission is to accelerate the understanding and use of CCS as a means of managing greenhouse (GHG) emissions. The Knowledge Centre houses seconded employees from SaskPower who were instrumental in the development and operations of the Boundary Dam CCS facility. Our team actively engages financiers and decision makers to ensure high-level information on CCS is conveyed with political, economic and other broad considerations. We also add practical, hands-on development experience, technical advice for planning, design, construction, and operation of CCS.
The Knowledge Centre’s staff are available to provide experience-based guidance for CCS projects, including case-by-case feasibility analyses like the Shand CCS Feasibility Study.
About the International CCS Knowledge Centre
Please visit our website at www.ccsknowledge.com
or email us at [email protected]
for more information.

v
Boundary Dam CCS Facility: Building on KnowledgeBoundary Dam Power Station in Saskatchewan, Canada, is one of three coal-fired power plants in the province. Boundary Dam consisted of six units, commissioned between 1959 and 1978 and had a total capacity of 882 MW. In 2010, SaskPower considered the future of its fleet and the implications of potential new environmental regulations and made the decision to retire Units 1 and 2 in 2013 and 2014 respectively. In addition, upgrades along with studies for a retrofit of carbon capture technology were considered and subsequently implemented at BD3. Among carbon capture technologies considered, post-combustion capture was the most promising.
The BD3 project was aided by a one-time CDN$240 million grant from the Government of Canada. This grant, coupled with an assumed sale of the CO2 for Enhanced Oil Recovery (EOR), and extensive re-use of an end of life coal plant combined to create a project which evaluated to a Levelized Cost of Electricity (LCOE) which was equivalent to building a new Natural Gas Combined Cycle (NGCC) plant at that time.
When completed, the integrated carbon capture plant was designed to capture 1 Mt per year, reflecting a 90% capture rate and extending the life of the plant by 30 years. Approval for the construction of the facility on BD3 occurred early in 2011 and construction began that spring. The total initial investment in the power unit’s
retrofit and carbon capture plant was approximately CDN$1.5 billion.
In October 2014, BD3 went on line and became the world’s first utility-scale, fully-integrated post-combustion carbon capture facility on a coal-fired power plant. Captured CO2 is used for Enhanced Oil Recovery (EOR) in a nearby oil field and for test injection into a deep saline reservoir at a research project called Aquistore. Overall the BD3 demonstration project transformed Unit 3 at Boundary Dam Power Station into a long-term producer of more than 110 megawatts (MW) of clean, base-load electricity, while demonstrating EOR potential in a fully integrated process.
The startup of BD3 was the culmination of a decade’s worth of work by SaskPower focused on continued operation of coal-fired power-generating stations which provide fuel diversity for its fleet, while mitigating the climate change impact of associated air emissions. Operations have steadily improved since initial startup. The facility has addressed safety issues and has recently started to demonstrate a level of reliability that is consistent with a thermal-generating facility, although still at below design CO2 production levels. Once stable operation of the facility is achieved, it will allow the plant operations and support staff to focus on improving the efficiency and cost effectiveness of the process.
Boundary Dam CCS Facility in Saskatchewan

I N T E R N A T I O N A L C C S K N O W L E D G E C E N T R E T H E S H A N D C C S F E A S I B I L I T Y S T U D Y P U B L I C R E P O R T
FIGURE 1: Greenhouse Gas Emissions Profiles and Performance Standards in Saskatchewan
*name plate capacity
1100 t/GWh = Lignite Coal Plant
550-500 = Current Natural Gas Plant
420 = Canadian regulations on Coal Plant
375-400 = New Natural Gas Plant
300-325 = Wind (with peakers)
120-140 = CCS on Boundary Dam 3*
CL
EA
NE
R
The Reduction of Carbon Dioxide Emissions from Coal-fired Generation of Electricity Regulations, which came in to effect July 1, 2015, set a stringent performance standard for new coal-fired electricity generation units and units that have reached the end of their useful life (nominally 50 years). The level of the performance standard is fixed at 420 tonnes of carbon dioxide per gigawatt hour (t/GWh). The aim of these regulations is to implement a permanent shift to lower- or non-emitting types of generation, such as high-efficiency natural gas, renewable energy, or fossil fuel-fired power with CCS. CCS is the only method by which coal-fired power generation plants (old and new) can achieve these emission targets. Therefore, in Canada, a coal fired power plant past its retirement date must be retrofitted with carbon capture technology or be closed [2].
Conventional lignite coal-fired power generation (used in Saskatchewan, Canada) emits roughly 1,100 tonnes of CO2/GWh (t/GWh). Traditional natural gas-fired power facilities emit in excess of 500 t/GWh. Newer combined-cycle facilities operate as low as 375t CO2/GWh and when used as a backup to intermittent non-emitting renewable energy can contribute to an effective emission intensity less than 300t/GWh. In contrast, BD3 was designed to capture up to 90% of the CO2 in the flue gas and operate as low as 120-140 t/GWh. The greatest gains in CO2 emissions reductions, in an electrical system without the ability to add hydro or nuclear facilities, are realized with CCS.
Federal Regulations: Abating Coal Emissions

vii
Studying the Shand Power Station
Shand Power Station is a single unit plant located 12 km from Boundary Dam. With a gross output of 305 MW, Shand’s current capacity is approximately twice that of BD3. Shand was originally designed with provisions for a second unit that was never built, and therefore has the space to house a carbon capture facility. Commissioned in 1992, Shand is also SaskPower’s newest coal-fired power plant and is thought to be the best candidate for a CCS retrofit if SaskPower were to consider another CCS Project.
A fundamental driver in the utility industry has always been the economies of scale. In general, facilities that are larger are more economic. Previous studies had been completed on combining two 150 MW units with a single carbon capture plant to increase the scale of the capture plant (i.e. Boundary Dam Units 4 and 5 at the Boundary Dam plant). While this decreased the capital cost of the capture facility on a full nameplate capacity basis, the realities of interaction of the maintenance of the three plants resulted in a lower utilization factor which muted the improvements on capital cost.
Commissioned in 1992, Shand is SaskPower’s
newest coal-fired power plant and is
considered to be the best candidate for
another CCS Project.
Rendering of Shand Power Station and Carbon Capture Facility

I N T E R N A T I O N A L C C S K N O W L E D G E C E N T R E T H E S H A N D C C S F E A S I B I L I T Y S T U D Y P U B L I C R E P O R T
In Saskatchewan, the largest coal units are in the 300 MW class. SaskPower has four units that are in the 300MW class: Boundary Dam Unit 6, Poplar River Units 1 and 2, and the Shand Power Station. With effectively double the total emissions of BD3, a 90% capture plant on these units would have an annual nameplate capture size of 2Mt per year. Due to the proximity of the Shand facility to Boundary Dam (12km), an infrastructural hub with access to the neighbouring oil fields could yield increased economical consideration for CCS applicability.
In order to meet the emission performance standard that would allow continued operation of the Shand power unit, a CCS retrofit would be required to be in operation in 2029. This points to a project final investment decision as late as 2024/2025. Alternatively, a business case might be justifiable for an earlier conversion of the plant to CCS based on potential additional revenue streams which could include byproduct sales or avoidance of a carbon tax, additional flexibility on the regulatory impacts to the operation of other units in the generation fleet, and other considerations as are explored in this study. Under the direction of the International CCS Knowledge Centre whose mandate it is the accelerate the deployment of CCS, this study is based solely on this “Early Conversion” (EC) option for Shand.
In order to take next steps for the early conversion CCS facility at Shand, a development budget and 18 months would be required. A Front End Engineering Design (FEED) study would be executed to de-risk the process and allow a budget and provisional contracts to be put in place to support a Final Investment Decision (FID) as early as July 2020. Additional funds would be required to complete the FEED studies for the target oil field infrastructure and associated development, pipeline infrastructure, designing and pricing of an expanded deep saline storage facility, completing production trials, as well as permitting and public engagement activities that are beyond the scope of this report.
Based on the early conversion timeline, the Shand CCS facility could be commercially operational by 2024, which would clear the way for removing regulatory hurdles that are forcing a retirement of SaskPower’s coal fleet. Furthermore, the design of all four of SaskPower’s 300 MW units are sufficiently similar to what was evaluated in this study. Therefore, the Shand feasibility study has established the basis for a standard CCS retrofit design that could be deployed with minor variations across SaskPower’s 300 MW coal fleet and more importantly has direct application to other global coal-fired power plants and industrial applications.
National policies play a role in the case-by-case circumstances surrounding CCS deployment. Such is the case for considering CCS in Saskatchewan at the Shand CCS facility. The federal Canadian regulations which mandate the closure of all non-CCS equipped coal-fired power plants as they reach 50 years of age can be substituted by provincial regulations provided they are equal to or more stringent than the federal Canadian regulations – this is called an equivalency agreement. If an equivalency agreement with the federal government is reached, the early conversion retrofit of Shand could potentially remove the regulatory hurdles that prevent Boundary Dam Units 4 and 5 from running until their scheduled retirement dates in 2021 and 2024. Should an equivalency agreement not be reached, and the early CCS conversion of Shand be completed, the existing federal regulations could remove the emission restrictions on one of those two units and allow Boundary Dam 5 to run to its scheduled retirement date in 2024. If no equivalency agreement is reached, and the early conversion schedule CCS retrofit of Shand is not implemented, both Boundary Dam Units 4 and 5 will be retired in 2019.
S T U D Y I N G T H E S H A N D P O W E R S T A T I O N C O N T I N U E D

ix
B U S I N E S S C A S E C O N S I D E R A T I O N S F O R T H E S H A N D S T U D Y
Regulations in Canada are closing the window on coal-fired power generation without carbon capture, and while there is a significant revenue opportunity to utilize and sequester CO2 for EOR operations, low oil prices have softened the demand for the CO2. The economics of retrofitting coal with CCS are further challenged by a supply of natural gas which is available at all-time low prices that have persisted long enough that the price level is perceived to have found a new norm in North America.
A second-generation CCS facility in Saskatchewan would show improvements in capital and operating cost to support additional EOR activity, while eliminating the net CO2 emissions from the local coal resource. CCS on coal represents a sustainable, long-term, and environmentally superior solution that keeps investment in the province while providing stable low-cost power that is not subject to market forces or the uncertainty associated with future regulations on CO2 emissions from natural gas, and the importing of energy from neighboring jurisdictions. The continued sustainable use of coal will maintain, and in fact expand high quality local employment, preserve value in existing assets, and will extract value from the local coal reserves.
The proximity to BD3, along with the ability to connect the two CO2 supplies by pipeline, would create a more stable supply and would reduce operational costs associated with delivery challenges. CO2 from BD3 that is currently not sold could be used to develop the CO2-use market prior to the completion of the Shand CCS facility. Review by the Ministry of the Economy of the Government of Saskatchewan indicates the potential to store all CO2 from this project, while unlocking an incremental oil recovery of up to 40,000 barrels of oil per day from depleted oil fields in the area. If additional capture projects and sources of CO2 become available then the total capacity for CO2 storage combined with EOR is up to 230 million tons of CO2, while unlocking 660 million barrels of oil.
The provincial Crown utility SaskPower owns BD3. The Crown and Freehold royalty / tax regime allows for a near elimination of the royalties and taxes until capital costs are recovered, followed by a net income-based fee structure. This improvement to the net revenue from a CCS plant combined with an EOR project could provide incentive to motivate a CCS retrofit financed by private industry. While this is a specific local incentive, it can specifically reduce the economic impact of the large capital cost.
Shand Power Station in Saskatchewan

I N T E R N A T I O N A L C C S K N O W L E D G E C E N T R E T H E S H A N D C C S F E A S I B I L I T Y S T U D Y P U B L I C R E P O R T
Capital Costs: Reductions in capital costs have been evaluated and are projected at 67% less expensive than they were for BD3 on a cost per tonne of CO2 basis.
Operating Costs: The larger Shand CCS facility would also offer lower operating costs compared with BD3. The anticipated cost of capture from the Shand CCS Facility would be $45US/tonne of CO2, assuming a 30-year sustained run-time of the power plant and purchasing of lost power at costs consistent with new Natural Gas Combined Cycle (NGCC) power projects. However, the improvement in the Levelized Cost of Electricity (LCOE), which includes the value of the existing assets, the price differential between coal and natural gas, a return from selling the CO2 or avoidance of a carbon tax, along with the associated operating cost differences, while certainly positive, are specific to each region, and not presented in this public report.
Renewable Integration: The requirement for power generation flexibility, to accommodate variable renewables, was coupled with the ability to maintain the capture facility capacity such that the CCS plant increases its capture rate when the load is reduced. While 90% CO2 capture is expected at a full power plant load, more than 96% CO2 capture could be achievable at 62% electrical load. This reduction in emission intensity at lower loads allows this plant to integrate with renewables and effectively multiplies their impact on emissions reduction. As well, when combined with the effective emissions reduction from selling fly ash for use in concrete applications, the result is an annual average emission intensity of 0. In other words, a carbon-neutral coal-fired power plant is within reach.
Water: Water supply at Shand is limited and additional water draw for the capture facility would be a regulatory hurdle, if possible at all. As a result, the system was designed without the requirement for additional water. The proposed heat-rejection design would eliminate
K E Y T E C H N I C A L F I N D I N G S O F T H E S H A N D S T U D Y
this burden by only requiring the use of water that has been condensed from the flue gas. Availability of water is often a key driver when siting a new thermal power plant and is often the limiting factor for expansion of a facility. Limited water for cooling will be a common theme for CCS retrofits of thermal power plants, making this solution broadly applicable.
Load: The BD3 design was optimized to run at full load of its power unit. The Shand capture facility would overcome this limitation through a design that could follow the normal power output variation that has been historically required from Shand. These variations in power output are related to varying loads on the electrical system, variable amounts of un-dispatchable renewables, fuel price fluctuations, import and export

xi
activity with neighbouring states and provinces, hydroelectric power plant water management, and outages of other units on the Saskatchewan power system. A CCS conversion for the SaskPower coal fleet that did not include flexibility in power generation would be impractical from an electric-system operation standpoint. The requirement for variability is mirrored throughout the world and has been exacerbated by higher levels of variable renewable generation. The addition of the capture facility would not result in any new limitations to the operational flexibility of the power plant itself. The power plant could continue to run at its current full output if the CCS facility was taken off-line for maintenance or in emergency situations.
Amine Maintenance Cost:Potential project risks for increased operating costs and barriers to project approval have been mitigated. Proactive measures to evaluate amine maintenance costs, which are of most concern for effective management of ongoing operating costs, would be realized by executing pilot testing at SaskPower’s
Carbon Capture Test Facility (CCTF). The CCTF’s flue gas supply is directly sourced from Shand, allowing rigorous evaluation of emissions and maintenance costs prior to a Final Investment Decision (FID). While this benefit is specific to this facility, the Knowledge Centre is working with the CCS community in an effort to reduce the size, cost and complexity of systems required to validate the maintenance and operation costs of a specific amine / flue-gas combination.
Interior of Boundary Dam 3 CCS Facility


Table of ContentsAbout this Study
About the International CCS Knowledge Centre
About the Boundary Dam CCS Facility – Building on Knowledge
About Federal Regulations – Abating Coal Emissions
About Studying the Shand Power Station
Business Case Considerations for the Shand Study
Key Technical Findings of the Shand Study
Chapter 1. Basis of Design
1.1 An Overview of the Steam Cycle in a Coal-Fired Power Plant
1.2 An Overview of Shand Power Station
1.3 Current Performance of Shand Power Station
1.4 Design Inputs
1.4.1 Site Conditions
1.4.2 Flue Gas Composition
1.5 Performance Criteria and Drivers for CCS Implementation
1.5.1 Capture Plant Size
1.5.2 Power Plant Reliability / Capture Plant Partial Capacity
1.5.3 Thermal Integration and Host Selection
1.5.4 Grid Support and Ancillary Services
1.5.5 Over-Capture at Reduced Load
1.5.6 Flexible Load Operations and Integration with Renewable Energy Sources
1.5.7 Matching Capture Capacity to Regulatory Requirement
1.5.8 Increasing Capture Capacity From 90% to 95%
1.5.9 CO2 Market
1.5.10 Fuel Pricing and Common Services
1.5.11 Site Layout and Modularization
1.5.12 Flue Gas Pre-Treatment and Emissions Credits from Fly Ash Revenue
1.5.13 CCS Technology Vendor Selection
1.5.14 Heat Rejection Design Considerations
i
iv
v
vi
vii
ix
x
1
2
2
3
3
3
3
4
5
5
5
6
7
7
7
8
8
9
10
11
11
11

1.5.15 Plant Maintainability
Chapter 2. Power Island Modifications
2.1 Modifications to the Existing Turbine
2.2 Pipe and Utility Bridge
2.3 Modifications to the Steam Cycle to accommodate Steam Supply to and Return from the Capture Facility
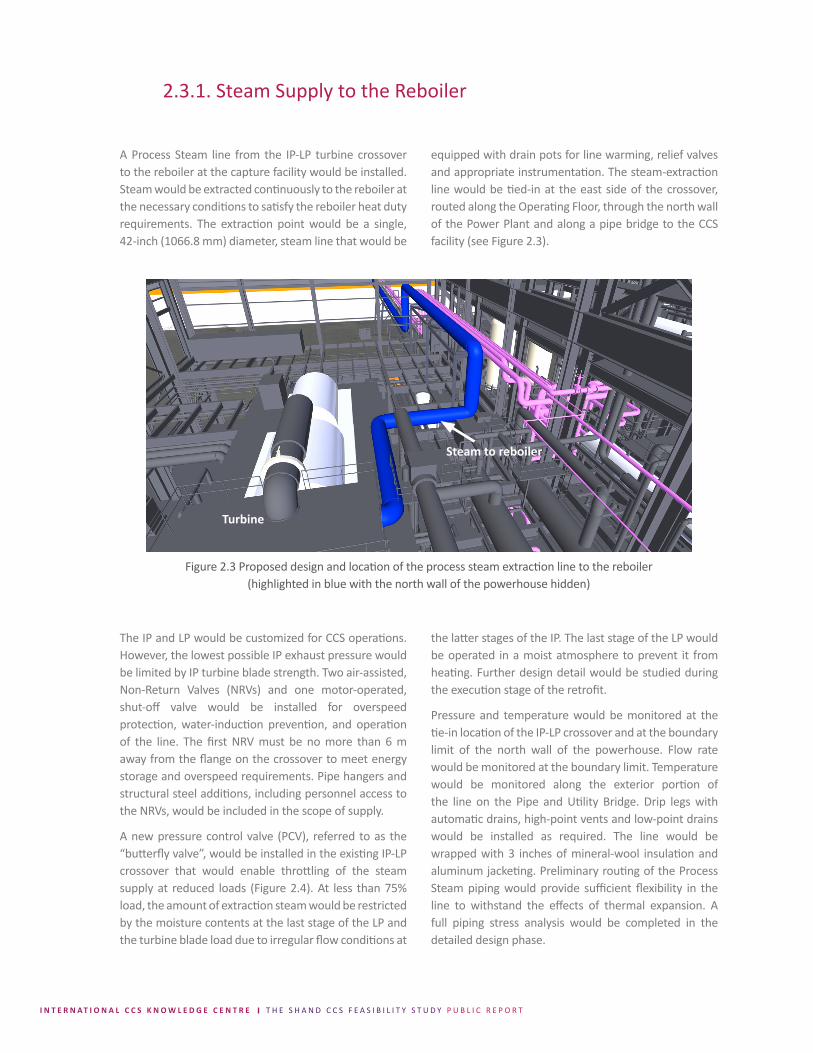
2.3.1. Steam Supply to the Reboiler
2.3.2 Purpose of the Butterfly Valve in the IP-LP crossover
2.3.3 Steam Supply to the Reclaimer
2.3.4 Additional Condensate Supply Line
2.3.5 Condensate Return to the Power Plant
2.3.6 Auxiliary Steam
2.4 Modifications to the HP Feed-heating System
2.4.1 New Steam Extraction Line to the DEA
2.4.2 HP FWH 4 Bypass Drain
2.5 DEA Replacement
2.6 Modifications to the LP feed-heating system
2.6.1 System Description
2.6.1.1 Condensate Preheater 1
2.6.1.2 Condensate Preheater 2
2.6.1.3 Condensate Preheater 3
2.6.2 Condensate Piping
2.6.3 FGC Recirculating Water Lines
Chapter 3. Flue Gas Supply and Conditioning
3.1 Flue Gas Supply to the Battery Limit
3.1.1 System Description
3.1.2 System Equipment
3.1.2.1 Ductwork
3.1.2.2 Diverter Dampers
3.1.2.3 Guillotine Damper
3.1.2.4 Seal Air System
3.2 Flue Gas Pre-Conditioning
T A B L E O F C O N T E N T S C O N T I N U E D
12
13
14
15
15
16
17
18
19
19
20
20
20
22
23
24
26
27
28
29
29
30
31
32
32
33
33
33
34
34
35
35
35
37
37
37
38
38
39
40
40
40
41
42
43
43
43
43
45
46
47
47
50
51
54
54
55
56
56
56
57
62
T A B L E O F C O N T E N T S C O N T I N U E D
3.2.1 Flue Gas Cooler (FGC)
3.2.1.1 System Description
3.2.2 Flue Gas Desulphurization (FGD)
3.2.2.1 Limestone Feed System
3.2.2.2 Absorbing System
3.2.2.3 Gypsum Dewatering System
3.2.3 Quencher
Chapter 4. CO2 Capture and Compression
4.1 Post Combustion CO2 Capture Theory
4.1.1 CO2 Absorption
4.1.1.1 CO2 Absorption Section
4.1.1.2 Flue Gas Washing Section
4.1.2 Solvent Regeneration
4.1.3 Solvent Filtration
4.1.4 Solvent Storage and Makeup
4.1.5 Solvent Reclaiming (Intermittent Operations)
4.2 CO2 Compression
Chapter 5. Heat Rejection, Water Balance and Utilities
5.1 System Description
5.2 Current Heat Rejection System at Shand Power Station
5.3 Accounting for Additional Heat Rejection Load and Liquid Water Discharge Streams
5.4 New Hybrid Heat Rejection System Design
5.4.1 Design Parameters
5.5 Chemical Consumption
5.6 Waste Disposal
Chapter 6. CO2 Sale and Storage Options
6.1 Introduction
6.2 Current CO2 EOR Flooding in Saskatchewan
6.3 Screening Criteria in Field Selection for CO2 EOR
6.4 Suitable Fields for EOR and Potential Oil Recovery
Chapter 7. Performance

7.1 Power Plant Performance
7.1.1 Output at Full Load
7.1.2 Output at Variable Loads
7.2 Capture Performance at Variable Load
7.3 Emissions Profile of the Proposed Shand Integrated CCS Power Plant
7.4 Start-up Schedule and Limitations
7.5 Maintenance Requirements
Chapter 8. Cost of CCS
8.1 Introduction
8.2 Projected Project Costs
8.2.1 Capital Costs
8.2.1.1 Facility Costs
8.2.1.2 Owner’s Costs
8.2.1.3 OM&A Costs
8.3 Determining the Cost of Capture
8.3.1 The Energy Costs of CCS
8.3.2 Capital Costs per Tonne of CO2 Captured Comparison Between BD3 and Shand CCS
8.3.3 Determining the Levelized Cost of Capture
Chapter 9. Regulations Compliance and CCS Drivers
9.1 Introduction
9.2 Canadian Federal Regulatory Drivers for CCS
9.3 Equivalency Agreements
Chapter 10. Environmental Impact Comparison of CCS
10.1 Introduction
10.2 Power Generation Options
10.3 Low Emission Power Generation Options
10.4 Characterizing NGCC as Backup Power for Variable Renewable Generation
10.5 Characterizing Shand CCS as Backup Power for Variable Renewable Generation
10.6 A Case for Selecting a 95% Carbon Capture Rate
10.7 Aggregate Emission Intensity of Wind and Alternative Backup Generation Sources
10.8 Capture Rate Selection
T A B L E O F C O N T E N T S C O N T I N U E D
63
63
63
67
67
69
70
71
72
72
72
72
73
73
74
75
76
77
80
81
81
82
83
84
84
85
86
86
87
88
91

92
93
94
94
94
95
95
96
96
96
96
97
97
97
98
99
T A B L E O F C O N T E N T S C O N T I N U E D
Chapter 11. Proposed Project Implementation
11.1 Introduction
11.2 Proposed Project Schedule
11.2.1 Power Plant Modifications
11.2.2 Capture Facility Construction
11.3 Contract Strategy
11.4 FEED Study Deliverables
11.4.1 CCTF Pilot Testing of MHI’s Proprietary KS-1 Solvent
11.4.2 Proposed FEED Study Investigations
11.4.2.1 Refine Steam Cycle Integration and Heat Balances
11.4.2.2 Capture Rate at 95%
11.4.2.3 FGD Material Selection
11.4.2.4 Power Plant Modifications
11.4.2.5 Waste Disposal
11.4.2.6 Heat Rejection and Water Management
Works Cited

List of TablesTable 1.1 Shand’s current operating performance
Table 1.2 Design conditions at Shand Power Station
Table 1.3 Flue Gas composition at Shand up to the FGD inlet with varying load
Table 2.1 Summary of CPH train heat duties
Table 5.1 Summary of chemical consumption for wet FGD and CO2 capture process
Table 5.2 Summary of wastes produced and proposed disposal methods
Table 6.1 Summary of Screening Criteria for CO2 EOR Implementation
Table 6.2 Reservoir Properties Summary of Oil Fields in South East Saskatchewan with CO2 EOR Potential
Table 7.1 Summary of Shand’s performance at full load
Table 7.2 Summary of Shand’s performance with flexible load
Table 7.3 Increased CO2 capture at reduced flue gas flowrates for Shand
Table 7.4 Summary of Shand emissions at varying loads assuming a 0.85 capacity factor
Table 7.5 Average annual performance for Shand CCS with 90% and 95% design capture at full load
Table 7.6 Typical startup procedure for capture facility
Table 7.7 Planned maintenance outage frequency and duration at Shand
Table 8.1 Summary of total costs of a Shand CCS retrofit ($M)
Table 8.2 Summary of owner’s costs for Shand CCS ($M)
Table 8.3 OM&A costs summary (all costs are in 2030 dollars)
Table 8.4 Capture rate of BD3 and Shand
Table 8.5 Data used to calculate the levelized cost of capture
Table 11.1 Summary of FEED
3
3
4
27
54
54
57
58
65
66
67
68
69
70
70
72
73
74
75
78
93

List of FiguresFigure 2.1 Proposed steam turbine modification
Figure 2.2 Proposed design and location of the pipe and utility bridge (highlighted in pink)
Figure 2.3 Proposed design and location of the process steam extraction line to the reboiler (highlighted in blue with the north wall of the powerhouse hidden)
Figure 2.4 Crossover pipe steam extraction point and butterfly valve location
Figure 2.5 Proposed design and location of reclaimer steam line (highlighted in blue with the north wall of the powerhouse hidden)
Figure 2.6 Proposed design and location of condensate supply line (highlighted in blue with the north wall of the powerhouse and the operating floor hidden)
Figure 2.7 Proposed design and location of condensate return line (highlighted in blue with the north wall of the powerhouse hidden)
Figure 2.8 Proposed design and location of the new steam extraction line to the DEA (highlighted in blue)
Figure 2.9 Proposed design and location of the new HP FWH 4 bypass drain (highlighted in blue)
Figure 2.10 Drawing of the proposed new DEA
Figure 2.11 Proposed new DEA installation
Figure 2.12 Boiler feedwater enthalpy profile of the current steam cycle at Shand
Figure 2.13 Boiler feedwater enthalpy profile of the steam cycle with CCS integration of Shand
Figure 2.14 Comparison of the associated duty for each component in the feed-heating train between the current power plant and the potential CCS-integrated power plant
Figure 2.15 proposed design and location of CPH 1 and associated piping (highlighted in blue with some existing piping and steel hidden)
Figure 2.16 Proposed design and location of CPH 2 and associated piping (highlighted in blue with CPH 3 hidden)
Figure 2.17 Proposed design and location of CPH 2 and associated piping (highlighted in blue with existing piping and steel hidden)
Figure 2.18 Proposed design and location of the FGC recirculating water line (highlighted in blue with the north wall, operating floor and existing piping and steel hidden)
Figure 3.1 Proposed design and location of diverter and guillotine dampers
Figure 3.2 Configuration of flue gas diversion and path
Figure 3.3 Proposed ducting layout from the stack to the FGC
Figure 3.4 Location of FGC and FGD
14
15
16
17
18
19
20
21
22
23
24
25
25
26
28
28
29
30
32
33
34
35

Figure 3.5 FGC modules, casing and transition
Figure 3.6 Schematic of wet FGD and flue gas quencher
Figure 4.1 Schematic of CO2 absorber
Figure 4.2 Schematic of CO2 regenerator
Figure 4.3 Eight-stage CO2 compressor
Figure 5.1 Shand Power Station current site layout
Figure 5.2 Block diagram of water usage and integration flows for the hybrid cooling system
Figure 5.3 Simplified water usage diagram for the hybrid cooling water system
Figure 5.4 Proposed Shand hybrid cooling system
Figure 5.5 Site layout for Shand Power Station with SO2 and CO2 capture and heat rejection systems
Figure 5.6 Monthly average humidity, dry bulb temperature and wet bulb temperature in Southeastern Saskatchewan
Figure 5.7 Effect of ambient temperature on heat rejection load in dry and wet cooling
Figure 5.8 Monthly power consumption in heat rejection system
Figure 6.1 Location of suitable reservoirs for CO2 EOR deployment in south east Saskatchewan
Figure 6.2 Potential oil production with CO2 EOR in south east Saskatchewan
Figure 7.1 Relationships between CO2 produced and CO2 captured with load
Figure 7.2 Shand typical load distribution over a three-year period
Figure 8.1 Comparing the efficiency penalty of CO2 capture between BD3 and Shand CCS
Figure 8.2 Cost reduction of the Shand second-generation CCS facility compared with the BD3 project
Figure 8.3 Break down of LCOC for Shand CCS
Figure 10.1 Capacity of Centennial Wind-Power Facility represented as the percent of time as a function of load between 2015 - 2018
Figure 10.2 Emission intensity of modern NGCC plant as a function of load
Figure 10.3 Emission intensity of the Shand CCS unit as a function of load
Figure 10.4 Emission intensity of the 95% sensitivity case unit as a function of load
Figure 10.5 Emission intensity of NGCC and wind
Figure 10.6 Emission intensity of 90% CCS and wind
L I S T O F F I G U R E S C O N T I N U E D
36
38
41
42
44
46
48
49
50
51
52
53
53
60
61
68
69
76
77
79
85
86
87
88
89
90

Chapter 1. Basis of Design

I N T E R N A T I O N A L C C S K N O W L E D G E C E N T R E T H E S H A N D C C S F E A S I B I L I T Y S T U D Y P U B L I C R E P O R T
1.1 An Overview of the Steam Cycle in a Coal-Fired Power Plant
Thermal power plants produce electricity by manipulating the behaviour of steam. The main components of a thermal power plant include a boiler, a turbine (which often is comprised of 3 distinct sections - High Pressure (HP), Intermediate Pressure (IP), and Low Pressure (LP)), a condenser, low-pressure Feed Water Heaters (FWHs), a deaerator (DEA), and high-pressure feedwater heaters. A fuel source is combusted in the boiler to generate thermal energy which heats incoming condensate, thereby producing steam.
In the case of coal-fired power plants, thermal energy is derived from the combustion of coal. Coal is burned in the boiler’s furnace to generate hot flue gas that transfers its thermal energy to feedwater, thereby producing superheated steam. The superheated steam is fed to the HP turbine. As steam passes through the turbine, it expands. The high pressure and kinetic energy of the steam cause the turbine blades to rotate, which turns the turbine shaft enabling the generation of work that is converted into electricity by the generator.
The expanded steam exiting the HP turbine is circulated back into the boiler through a reheater to absorb additional thermal energy, before passing in sequence
through the IP and LP turbines. The exhaust steam exiting the LP turbine flows to a condenser where the low-pressure steam is cooled at constant pressure forming a saturated liquid; this is referred to as condensate. Condensate Extraction Pumps (CEP) move the condensate through Low Pressure (LP) Feed Water Heaters (FWHs) before entering the DEA. The CEPs develop sufficient head to deliver the condensate to the DEA, which is located in an elevated position inside the plant to provide adequate suction head for the Boiler Feed Pump (BFP). The DEA is positioned between the LP and HP FWHs and, as its name implies, its purpose is to remove dissolved gases from boiler feedwater. This is accomplished by increasing the temperature of the condensate to its full saturation temperature at DEA pressure by utilizing steam from the turbine. FWHs preheat the condensate (or boiler feedwater) prior to its re-entry into the boiler. Preheating is accomplished by drawing steam from the turbine. The combined arrangement of the LP FWHs, the DEA and the HP FWHs are often referred to as the Feed-heating Train. Once condensate passes through the feed-heating train it re-enters the boiler and the cycle repeats.
1.2 An Overview of Shand Power Station
Commissioned in 1992, Shand Power Station is a single-unit, coal-fired power generating station. Shand’s current gross capacity is 305 MW. Shand was designed with various advanced environmental considerations including:
1. Finely-tuned burners with overfire separated air to stage the combustion of the coal, and reduce the flame temperature in order to reduce nitrogen oxides formation by up to 50 per cent;
2. The Limestone Injection into the Furnace and Re-activation of Calcium (LIFAC) system that uses a powdered limestone sorbent and water to reduce sulphur dioxide emissions (which has been recently taken out of service);
3. A zero-liquid discharge water management system to ensure facility water is not discharged into the environment, except through evaporation; and
4. A high-efficiency, electro-static precipitator (ESP) that removes over 99 per cent of the fly ash prior to flue gas exiting the power plant through its stack.

3
Table 1.1 shows a summary of the assumptions made for Shand’s current operating performance.
1.3 Current Performance of Shand Power Station
Table 1.1 Shand’s current operating performance
1.4 Design Inputs
1.4.1 Site Conditions
Site conditions influence the design of a power plant and its capture island. Parameters such as air temperature and humidity are critical to the design of the capture facility since they directly affect the capture process. Table 1.2 shows the design conditions used for the Shand CCS Feasibility Study.
Table 1.2 Design conditions at Shand Power Station
*85th percentile
1.4.2 Flue Gas Composition
A pre-requisite for implementing post-combustion capture is a well-understood flue gas composition.
Current flue gas conditioning technologies installed at Shand include the LIFAC system for sulphur dioxide (SO2) control and Electrostatic Precipitators (ESPs) for removal of particulates. The LIFAC process, as originally installed, involved the combination of upper-boiler limestone injection, followed by post-boiler humidification to desulphurize the flue gas. This system, which did not perform well, has been recently taken out of service. Upon integrating Shand with CCS, LIFAC would be replaced by a wet-limestone, flue gas desulfurization process. The existing ESP system at Shand has a design
efficiency of 99.74%. The ESPs have 2 casings: A side and B side with each casing including three fields. When an ESP is operated, an electric field is produced by high voltage transformer-rectifiers that are connected to a system of emitting electrodes. The electric field charges the ash particles, which are collected onto a system of plates. Tumbling hammers strike the collection system causing ash to fall off the electrodes and plates into the ash hoppers.
Flue gas composition is monitored at Shand using the Continuous Emission Monitoring System (CEMS) that employs an online Fourier Transform Infrared (FTIR) spectrometry technology to measure flue gas

I N T E R N A T I O N A L C C S K N O W L E D G E C E N T R E T H E S H A N D C C S F E A S I B I L I T Y S T U D Y P U B L I C R E P O R T
constituents. FTIR data, and in fact all measured operational data from the plant, is logged in a data historian supplied by OSI, which is often generally referred to as the Pi System. Flue gas stack testing is performed annually to verify flue gas composition and to support emissions reporting. Coal composition is key to predicting flue gas composition. Using the combustion conditions and the quantity of excess air, flue gas composition could be calculated. For this study, flue gas composition was determined at 100% and
75% loads of the power plant. This data is summarized in Table 1.3. Using the flue gas composition at various loads, Mitsubishi Heavy Industries (MHI) and Mitsubishi Hitachi Power Systems (MHPS) were able to predict the capture efficiency and turbine performance of the Shand integrated power plant and capture facility in order to verify that the capture process was able to continue operating at reduced loads. Section 1.4.3 considers reduced load capture performance.
1.5 Performance Criteria and Drivers for CCS Implementation
Certain performance criteria are required of the power plant and the capture facility. Identifying these key performance parameters at the initiation of the study influenced the design methodology utilized to achieve these desired performance criteria. A tailored design methodology is crucial with industrial scale CCS retrofits as each power plant and its environment is unique in operating parameters and constraints. As such, each CCS retrofit must be tailored for its specified host plant.
The key drivers that influenced the design methodology for the Shand CCS retrofit are outlined in this section.
Table 1.3 Flue Gas composition at Shand up to the FGD inlet with varying load
*Contaminant concentrations not confirmed for reduced load operation
A tailored design methodology is crucial
with industrial scale CCS retrofits as each power plant and its
environment is unique in operating parameters
and constraints.

5
1.5.1 Capture Plant Size
A fundamental driver in the utility industry has always been the economies of scale. In general, facilities that are larger are more economic. Previous studies had been completed on combining two 150MW units with a single carbon capture plant in order to increase the scale of the capture plant. While this decreased the capital cost of the capture facility on a full nameplate capacity basis, the realities of interaction of the maintenance of the three plants resulted in a lower utilization factor which muted the improvements on capital cost. The operational experience with BD3 makes it seem doubtful that a next generation capture plant could be more reliable and require less maintenance downtime than the two accompanying coal-fired power units.
In Saskatchewan, the largest coal units are in the 300MW class. With effectively double the total emissions of
BD3, a 90% capture plant on these units would have an annual nameplate size of 2,000,000 tonnes/year. The four units at SaskPower within the 300MW class, are Boundary Dam Unit 6, Poplar River Units 1 & 2, and Shand Unit 1. Boundary Dam and Shand are located near Estevan Saskatchewan, while the Poplar River Power Station is located 200 km west of Estevan. Preliminary review indicated that most components for the capture facility would still be at a reasonable size, with the exception of the CO2 compressor which would be larger than is currently commercially available, and the CO2 regenerator, which may become too large in diameter to be fabricated as a single pressure vessel. The four units are sufficiently similar such that a successful CCS retrofit of Shand could pave the way for additional CCS retrofits on the remainder of the 300MW units.
1.5.2 Power Plant Reliability / Capture Plant Partial Capacity
Provisions for continued power plant operations in the event of issues with the capture facility were built into the original design of BD3 as a risk mitigation strategy. This feature is generally referred to as dual mode. It worked, and was needed often, especially in the early days of operation for BD3. A key design characteristic allowed steam consumption to be varied somewhat independently of capture plant demand while the use of diverter dampers allowed flue gas to be directed towards either the original stack, the capture facility, or a combination of the two. While the dual modes provide
reliability for the power plant, it is the ability to partially bypass the capture facility that is key in establishing its operational flexibility. For the Shand study, the systems would be the same, and partial bypass of the capture facility would be designed to be the normal means of dealing with lack of capacity in the capture facility for any number of reasons. This allows design margins in the capture facility to be tighter and assures continued power plant reliability. The design of this system is presented in Chapter 3.
1.5.3 Thermal Integration and Host Selection
For this study, integration with the steam turbine for the regeneration energy source was predetermined based on the BD3 design. Although benefits for dispatch flexibility are available with the addition of a large combined cycle facility to be used as the regeneration energy source, none of the coal-fired power plants in SaskPower’s fleet currently have adequate natural gas infrastructure to support such a facility.
Units 4 and 5 at Boundary Dam have a similar turbine thermal design to the original BD3 turbine which was replaced as part of the conversion to CCS. To modify BD4 and BD5, the turbine would have to be replaced in its entirety. As well, if the plant was optimized for CCS steam delivery, it would not be able to reach full load in non-CCS mode without the replacement of the entire feed-heating plant as was done for BD3. The cost and

I N T E R N A T I O N A L C C S K N O W L E D G E C E N T R E T H E S H A N D C C S F E A S I B I L I T Y S T U D Y P U B L I C R E P O R T
complexity of this modification is not trivial.
All of the 300MW units at SaskPower have relatively similar turbine thermal designs. Rather conveniently, the pressure at the crossover is much more amenable for conversion and use for carbon capture. Preliminary modeling concluded the possibility that the regeneration energy could be sourced from the turbine relatively efficiently with very few changes to the feed-heating plant, and bolt in modifications to the steam turbine. Use of rejected flue gas heat for low pressure condensate preheating along with modifications to the high-pressure condensate preheating train contributed in reducing the associated output penalty. The overall
parasitic load was determined at 22.2%. Details on power plant performance are summarized in Chapter 7. Further, it was determined that the modifications would not preclude the unit from running at full load when the CO2 capture facility was not drawing steam from the turbine. The thermal modifications suggested were reviewed, analyzed and refined by the turbine Original Equipment Manufacturer (OEM), Mitsubishi Hitachi Power System (MHPS). A budget proposal which incorporated the main concept was found to be an economic and workable solution. Modifications to the power island are summarized in Chapter 2.
1.5.4 Grid Support and Ancillary Services
Large thermal power stations play an important role in the electricity system as it relates to system response to frequency disruptions and power factor correction. In addition, these units are required to adjust their load to maintain the supply-demand balance in the electricity grid. If significant additional CCS units were added to a grid, and if these units had been designed like BD3, with very limited capacity to adjust load, the load adjustment range of the balance of the fleet would become un-workable. If CCS were to be viable for a large build-out, it would have to maintain the flexible operating range of the existing unit, and it would spend enough time at these loads, that CO2 capture rate would need to be maintained.
Considerations for planned curtailment were made in designing the capture system for Shand. Power plants are designed to provide maximum output during peak-power consumption periods in their service area. In many cases, these times coincide with the hottest days of the year. The design of the proposed capture system for Shand relies on planned curtailment of the capture rate to avoid excessive design margins. The capture system would reduce the rate of carbon capture on hot days, or due to other restrictions such as off-spec fuel, while maintaining power output.
At partial load, the CCS facility is essentially over-sized for the amount of CO2 that needs to be captured. The only limitation is the amount of steam that is available from the steam turbine. The decision was made to design the thermal cycle so that it could meet full load with the turbine as optimized, and then to add a butterfly valve in the IP-LP crossover which would be fully opened except when the unit was at partial load, or when off performance design margin was required. This valve would allow throttling of the steam flow at reduced loads which enables continued capture operations at full capacity while the power plant operates at reduced load. This would result in a plant operating profile that can maintain, and potentially increase its capture rate across its normal dispatch range. This would eliminate the need for excess capital to be spent on equipment that would be rarely utilized. Details of this design are presented in Chapter 2.

7
1.5.5 Over-Capture at Reduced Load
The Shand Feasibility Study sought to capitalize on the inherent ability of a post combustion capture plant to capture a higher fraction of the CO2 at reduced flue gas flows. It was imperative that the capture facility at Shand be designed to allow significant load following of the integrated unit during carbon capture mode. In other words, the power plant should retain the ability to adjust power output based on fluctuating demand during a given day while still being able to capture CO2. Incorporating a butterfly valve in the IP-LP crossover to enable steam throttling at reduced loads enables this. A variable load design significantly reduces the requirements for design margins. A sensitivity analysis was performed by MHI that showed probable capture rates reaching in excess of 96% at 62% electrical load on the power station. Details of this investigation are summarized in Chapter 7.
From a CO2 supply point of view, this means more consistent volumes of CO2 delivered while allowing the plant to vary its load. From an emissions mitigation point of view, it means that the CCS equipped coal-fired power plant could be made responsive to variable renewable generation, and when it does, would emit less CO2 per MWh, effectively increasing the emissions reduction of the renewables. In contrast, a natural gas plant without CCS that is dispatched down in load to support variable renewable generation increases its emission intensity, somewhat muting the impact of the environmental benefit of the renewable generation. The relative effectiveness of CCS on a dispatchable thermal generation station as load support for variable renewables, as opposed to the most modern and highest efficiency Natural Gas Combined Cycle power plant is a key unanticipated outcome of this study. See Chapters 7 and 10 for a more thorough review.
1.5.6 Flexible Load Operations and Integration with Renewable Energy Sources
SaskPower’s Renewable Road map sets a target of up to 50 percent generation capacity system wide from renewable energy sources by 2030. Meeting this target would necessitate the flexibility to increase the integration of variable renewable energy (VRE) into the power system. The performance of non-renewable energy sources, such as coal and gas, must be able to provide ancillary services for VRE during periods when renewable power cannot match electricity demand. Consequently, a high value is placed on the ability to vary the output of any power plant in the overall system
in response to dispatches from the system operator. The proposed CCS integration of Shand would allow the unit to maintain its range of dispatch and loading rate with the CCS island operating, while allowing increased capture at lower loads. This builds an extremely desirable scenario in which a capture plant supports the integration of renewable power sources, while further reducing its own CO2 footprint. The opposite response is encountered at a traditional natural gas plant that supports VRE integration. Details and analysis on this topic are presented in Chapter 10.
1.5.7 Matching Capture Capacity to Regulatory Requirement
With current regulations known in Canada as of 2012, and the focus on reducing capital cost, there is logic in building the CCS plant only as big as it needs to be to capture the required amount of CO2. Studies were undertaken to determine the amount of capital cost reduction that could be realized, as well as determining the relative benefit of treating all of the flue gas to capture 70% of the CO2 or capturing 90% of the CO2 from
80% of the flue gas. Due to the economies of scale, the 80% sized capture plant had capital costs on a per tonne basis that increased by 7%, and the plant that processed all of the flue gas at a lower capture rate increased the cost by more than 10%. It is clear that building the plant smaller or designing the plant to capture less than 90% of the CO2 in the flue gas will ultimately increase the per ton cost of CO2 capture.

I N T E R N A T I O N A L C C S K N O W L E D G E C E N T R E T H E S H A N D C C S F E A S I B I L I T Y S T U D Y P U B L I C R E P O R T
The regulations in Canada contain language that encourages the provinces to draft their own equivalent legislation that best fits their region and achieves the same CO2 reduction [2]. For a staged reduction in the emissions from coal, a plan where the biggest units are completed first, and are built to capture at least 90% of the CO2 produced is the most cost-efficient way of reducing the emissions from coal while maintaining it as a fuel source.
From a global perspective, in addition to the increased per ton cost for lower capture rates, future regulatory tightening makes building a plant that is less than best available technology a risk that is difficult to quantify and would be a barrier to any investment decision. Building too small could in fact undermine the value of the entire endeavor. To reduce the long-term risk of costs from tightening CO2 policy, it is likely that only projects exceeding rates of 90% CO2 capture would be planned and approved.
1.5.8 Increasing Capture Capacity From 90% to 95%
As a sensitivity case, the effects of capture efficiency were also investigated by evaluating the cost increase from a 90% capture rate to a 95% capture rate. An estimate for the increase in overall capital costs and steam requirements were provided by MHI and MHPS. The increased volume of CO2 captured at a 95% capture efficiency was also calculated. These values were used to determine the changes in capital costs and energy penalty per tonne of CO2 captured. Details of this investigation and environmental benefits are further examined in Chapter 10.
The overall increase in capital costs required to facilitate the increase in capture produces a lower overall cost per
tonne. The steam requirements however are increased when moving to higher capture capacity. Further investigation reflecting overall changes in the NPV of the cost of capture must be done although preliminary analysis results indicate a potentially lower cost of CO2 capture at the higher capture rate. Investigating potential increase in CO2 revenue from the added volume of captured CO2 must also be considered to determine the point of diminished returns for capture efficiency. The selection of a higher capture rate would appear to have merit in situations where the unit is sufficiently base-loaded so as not to benefit from the inherent increased capture rate at lower load.
1.5.9 CO2 Market
Key to the approval of the BD3 project was the prospect of a sale of the CO2 for use in EOR operations. In fact, the revenue from the sale of CO2 was a required component of the business case for the project to be competitive with Natural Gas Combined Cycle (NGCC). While not in place at the time of project approval for BD3, it was clear that an opportunity existed, and in fact a sale agreement was entered into with an oil operator for their nearby Weyburn oil field - a field that had already been injecting CO2 from another source for many years.
There are potential additional opportunities for CO2 EOR within 100 km of Estevan, Saskatchewan [3]. However, it is uncertain whether these opportunities can be economically developed. The opportunity depends on oil prices that can support the associated higher production costs, and an ability to attract companies to
develop and co-ordinate new CO2 EOR projects, as well as improvements in knowledge for using CO2 EOR in the Bakken. While there are no nearby EOR opportunities in the area of the Poplar River Power Station, a long-distance pipeline to transport CO2 to oil producing regions might be economically feasible if the amount of CO2 transported is large. The larger the pipeline the lower the cost per tonne of CO2 transported. The potential market for CO2 and evaluation of the most probable fields is further explored in Chapter 6.
When CO2 is used in an EOR operation, the needs of the oil field are somewhat inconsistent with the capability of a single carbon capture plant. The EOR facility requires a reliable supply of CO2, as interruptions in availability of CO2 has impacts on the oil operation. As well, the quantities of CO2 that can be injected into a new field

9
will gradually increase over the first three to five years of operation. By contrast, a single capture facility is prone to interruptions and trips from either the capture process, or the associated power facility, and once on-line, the economics and the facility work best at full output. The Aquistore CO2 storage facility, has similar characteristics to the EOR oil fields, taking significant periods of time to get to full capability after any interruption. Although the agreement between SaskPower and their EOR off-taker is confidential, there is significant public information on the operational costs that SaskPower has experienced due to the lack of reliability of the CO2 supply [4]. Not all of the CO2 from the BD3 facility has been sold.
The opportunity exists to join the Shand CO2 pipeline to the BD3 pipeline. This would benefit the reliability, as the two power units and associated capture units would not be scheduled to do planned maintenance concurrently, and the probability of simultaneous unplanned outages
would be low. It is anticipated that the combined reliability of the two facilities would exceed 98% in comparison to the single facility reliability which was originally targeted at 85%. If the pipeline between the new EOR off-taker and Shand, and the connection to the BD3 pipeline was completed in advance of the carbon capture plant completion, the excess un-sold CO2 from BD3, could be delivered to the new fields so that the fields could develop capacity to accept the higher volumes of CO2 that would be available when the new capture facility comes on-line. This would also improve the economics of the BD3 facility by increasing the number of off-takers and potential volumes of CO2 to be sold.
Interconnection of the two facilities increases the reliability and economic feasibility of both facilities. Details on EOR potential in Saskatchewan are presented in Chapter 6.
1.5.10 Fuel Pricing and Common Services
A consideration when determining where best to site the next potential CCS facility, especially when considering the economics and environmental policies that are making the future of coal-fired power plants uncertain, is to ensure that critical mass of the industry is maintained.
Coal mining is a capital-intensive undertaking, and there is significant investment in being able to deliver the coal at peak demand. As has been seen in West Virginia and other locations in the USA, scaling back on coal deliveries does not decrease the fixed costs of coal mining, and
the price of the delivered fuel rises on a per ton basis as the demand is decreased. This negative feedback loop results in ever increasing costs for coal as the demand is decreased, and ever decreasing demand for coal as the price of the electricity from the coal-fired power plant increases. In the case of Shand, it is fed from a common mine with Boundary Dam, and with BD3 already being converted to CCS, it is the coal fuel source with the best long-term viability. CCS plants, especially those fed by mine mouth operations are likely to be concentrated for this reason.
Figure I. Coal mining in Saskatchewan

I N T E R N A T I O N A L C C S K N O W L E D G E C E N T R E T H E S H A N D C C S F E A S I B I L I T Y S T U D Y P U B L I C R E P O R T
1.5.11 Site Layout and Modularization
The availability of space for the CCS plant footprint is a factor in determining a suitable location. The distance between the power facility and the capture facility on BD3 resulted in significant capital expenditures for interconnections between the two plants, that amounted to almost 8% of the overall capital costs for BD3. In addition, the physical distance between the plants makes integration of the operations more difficult and less likely.
In contrast to the Boundary Dam site, the Shand site with its single unit is un-congested and open. The original project concept of locating the CCS plant parallel to the existing power unit, with the CO2 absorber tower aligned with the boiler house, the CO2 regenerator aligned with the boiler house/turbine house wall, and the CO2 compressor aligned with the power generator, minimized the length of interconnections for flue gas, steam, and electricity. The concept of sharing common steel and adjoining the two plants was abandoned in favor of construction access and to support modular construction, although there may be merit of re-using elevators and access in locations where modularity is not a significant benefit.
Modular construction for major infrastructure projects in western Canada, specifically the Alberta oil sands, has been embraced as a means of controlling costs. Routes exist in Saskatchewan and Alberta that can support the road delivery of modules and vessels that can be 30 feet (9m) high, 24 feet (8m) wide, and 120 feet (40m) long. This shop assembly of structural steel, equipment, piping, electrical and instrumentation dramatically increases productivity, reduces travel costs and results in shorter on-site construction time. Details on strategic factors to be considered in project implementation are presented in Chapter 10.
Figure II. Examples of transporting a modularized facilitytchewan

11
1.5.12 Flue Gas Pre-Treatment and Emissions Credits from Fly Ash Revenue
The coal-fired power plants in Saskatchewan, with the exception of BD3, are similar in pollution control equipment, with generally low NOx burners and separated over-fire air for NOx reduction, and electrostatic precipitators. A portion of the units are fitted with activated carbon injection for mercury abatement. The Shand unit was the only unit fitted with SO2 abatement, using a furnace-based limestone injection system. This system has been challenging to operate and not overly effective. In addition, the configuration of the system makes the fly ash from the unit un-saleable for use in concrete.
Preconditioning of flue gas is required prior to carbon capture. This includes reducing the temperature and removing SO2. A Flue Gas Cooler (FGC) would be installed for flue gas heat rejection purposes and integrate with the power plant to provide condensate preheating. A wet-limestone FGD would replace the current SO2 abatement system. This new contemporary FGD would improve the utilization efficiency of the limestone and reduce the amount of SO2 that would have to be removed in the SO2 polishing step. Details of flue gas pre-conditioning are summarized in Chapter 3. More importantly, the 140,000 tonnes per year of fly ash that
would now be saleable for the concrete market would create a valuable revenue stream.
In addition, although not universally recognized, the sale of fly ash for concrete use is itself a carbon offset when compared to the emissions associated with producing cement. While numbers vary on the impact, if an effective rate of 0.9 tons of CO2 reduction per ton of fly ash is used, this translates into a carbon reduction offset of 78 t/GWh [5]. Interestingly, the combination of these fly ash sales emission offsets to cement production with a plant designed for 95% capture as described above could result in a coal-fired power plant that is carbon negative as discussed in Chapter 11. The ability to sell the fly ash, as an addition to the fly ash that is sold from Boundary Dam, and to take advantage of the common infrastructure to ship the product would be a benefit to the project. As it has transpired, SaskPower has received approval to discontinue the SO2 abatement on Shand based on the SO2 that is now captured at BD3. The fly ash sale benefits are already being realized and can no longer be attributed to this project, and as such are not included in the financial benefit that would be realized from the project.
1.5.13 CCS Technology Vendor Selection
MHI’s KM CDR ProcessTM is currently used at Petra Nova, the world’s largest CCS plant. Details of this CO2 technology are presented in Chapter 4. By evaluating the KM CDR ProcessTM for Shand, the project team was
able to assess the relative merits of the two technology providers who have built systems at commercial scale, Cansolv and MHI.
1.5.14 Heat Rejection Design Considerations
Experience has shown that the addition of CCS to a coal-fired power plant results in a 50% increase in the heat rejection requirement. Since the availability of cooling is generally one of the first design concerns for siting a new facility, and quite often ends up being the limiting factor for further expansion at a given site. It is anticipated that
the availability of cooling capacity will quite often be a major project impediment for a new CCS facility.
For the Shand facility, there is limited water in the area, and an additional water use permit is not probable. In addition, the plants operating license is based on a Zero Liquid Discharge (ZLD) original plant design and

I N T E R N A T I O N A L C C S K N O W L E D G E C E N T R E T H E S H A N D C C S F E A S I B I L I T Y S T U D Y P U B L I C R E P O R T
maintaining this designation would be an important consideration for the plant.
A major challenge in western Canada, where the ambient temperature can range from +40deg C to -40deg C, is the selection of the design temperature for the cooling system. De-rates of the CCS facility are viewed as being acceptable at high ambient temperatures, especially when the impact is slightly lower CO2 capture with increased power output during times of excessive temperatures, and more CO2 can be captured at low ambient temperatures. To this end, the heat rejection system for Shand CCS was designed for the 85th percentile. This became the basis for the design case and provided reduced margins in favor of cost savings.
The only new water used in the system is the water that is condensed out of the unit’s flue gas. The use of a hybrid cooling system with dry coolers and wet surface air coolers (1) provides a double layer of protections for
the leakage of process fluids to the evaporation side of the cooling tower, (2) allows the amount of water evaporated to be controlled by biasing heat rejection duty between the two coolers, and (3) results in an air cooler system with high approaches and an evaporative system which provides the lower approach final cooling of the circuit. This type of cooling system has the potential to be a reasonable first approach to cooling at any coal-fired power plant and is especially effective with high moisture low rank coals. Details on the design and performance of the new hybrid heat rejection system are presented in Chapter 5.
1.5.15 Plant Maintainability
The coal-fired power plants to which CCS facilities are attached are the product of multiple generations of revision. The economics, equipment and process characteristics has led to designs that balance costs and reliability which have been proven over and over again. In a sub-critical coal-fired power plant the inclusion of critical spares and capacity margins is common. For instance, the large fans are sized for 2 x 50% capacity while groups of heat exchangers can be bypassed to allow the process to continue to run with one or more out of service.
This same level of refinement has not yet been achieved for amine based CCS plants. The BD3 facility has undergone complex and difficult renovation projects to add redundancy, isolation, and other modifications. In the short term, where the cost of adding equipment after the original construction is an order of magnitude more expensive than installing as part of the original design, it is believed that there is value in including additional process isolations and redundancy at selected locations in the process. To this end, the capital cost estimate presented in this report includes additional funds to cover this enhanced functionality.
The economics, equipment and process
characteristics has led to designs that balance
costs and reliability which have been proven
over and over again.

Chapter 2. Power Island Modifications

I N T E R N A T I O N A L C C S K N O W L E D G E C E N T R E T H E S H A N D C C S F E A S I B I L I T Y S T U D Y P U B L I C R E P O R T
The turbine is the fundamental component in a thermal power plant, and steam is the main working fluid. Steam is also an essential requirement for the carbon capture process. Steam may either be sourced from an external dedicated steam generator (such as the one deployed at the Petra Nova Project) or it could be extracted from the power unit’s steam cycle using an integration philosophy (such as the installation at BD3). The proposed CCS retrofit of Shand would entail the steam extraction for the capture island to be sourced from the power island’s steam cycle. This integrated approach, however, would reduce the quantity of steam available for electricity generation which would result in a production output penalty. This type of reduction is also commonly referred to as the “parasitic load”.
It is imperative for the CCS retrofit to minimize any power generation losses such as parasitic load. Several turbine modifications would help to minimize net output losses with CCS in service. These modifications would include changes to the High Pressure (HP) and Intermediate Pressure (IP) turbine including its rotor, blades, all diaphragms, inner casing, and packing. Low Pressure (LP) turbine modifications would include changes to the first through the third blade stages and diaphragms with packing. In particular:
• The HP turbine stages would be increased from 6 to 11 stages.
• The IP turbine stages would be increased from 4 to 5.
• And all HP, IP and LP stage replacements would be designed based on the Continuous Cover Blade (CCB) structure. CCB structure would reduce leakage which would ensure higher reliability by avoiding tenon caulking and the labyrinth effect at the tip portion of the blades.
MHPS has indicated that turbine modifications (see Figure 2.1) could be completed within a 65-day outage period.
2.1 Modifications to the Existing Turbine
It is imperative for the CCS retrofit to minimize
any power generation losses
Figure 2.1 Proposed steam turbine modification
LP Turbine blades5-staged IPTurbine
11-staged HPTurbine

15
A Pipe and Utility Bridge would be installed between the Powerhouse and the CCS facility to support and provide access to new piping and utilities (see Figure 2.2). The Pipe and Utility Bridge would span the 56-metre distance between the north wall of the Powerhouse and the CCS facility. It is assumed that the Pipe and Utility Bridge could terminate at any location along the CCS facility boundary limit and that piping inside the CCS facility could be routed to this terminal point.
The bridge would be an open design without an enclosure. There would be a walkway in the middle of the bridge to provide access to piping. Access to the Powerhouse and CCS facility would be provided at each end of the bridge. The 42-inch Process Steam line
required for steam extraction to meet the requirements of the capture facility would run along the west side of the bridge, with all other piping and utilities supported along the east side of the bridge. The piping bridge would also handle all interconnections between the power plant and the capture facility including steam, condensate, demineralized and potable water, and all interconnecting utilities.
It is assumed that the Pipe and Utility Bridge would be fabricated in modules off site and set in place on site. It is expected that modular construction would result in capital and labour cost savings due the higher productivity associated with shop fabrication over field erection.
Figure 2.2 Proposed design and location of the pipe and utility bridge (highlighted in pink)
2.2 Pipe and Utility Bridge
2.3 Modifications to the Steam Cycle to accommodate Steam Supply to and Return from the Capture Facility
The proposed CCS retrofit would require Process Steam to provide the necessary reboiler heat duty for the regenerator and for solvent reclaiming. The CCS facility would be fully integrated with the power plant. Steam for the reboiler would be sourced from the IP-LP crossover and would be in continuous supply while the
CCS island is on-line. Steam for the reclaimer would be sourced from the cold reheat steam pipe. Various other modifications to the steam cycle would also be required to facilitate full integration of the power island with the capture island. They are presented in the following sections.
Power plant
Capture facility
Utility bridge
I N T E R N A T I O N A L C C S K N O W L E D G E C E N T R E T H E S H A N D C C S F E A S I B I L I T Y S T U D Y P U B L I C R E P O R T
2.3.1. Steam Supply to the Reboiler
A Process Steam line from the IP-LP turbine crossover to the reboiler at the capture facility would be installed. Steam would be extracted continuously to the reboiler at the necessary conditions to satisfy the reboiler heat duty requirements. The extraction point would be a single, 42-inch (1066.8 mm) diameter, steam line that would be
equipped with drain pots for line warming, relief valves and appropriate instrumentation. The steam-extraction line would be tied-in at the east side of the crossover, routed along the Operating Floor, through the north wall of the Power Plant and along a pipe bridge to the CCS facility (see Figure 2.3).
The IP and LP would be customized for CCS operations. However, the lowest possible IP exhaust pressure would be limited by IP turbine blade strength. Two air-assisted, Non-Return Valves (NRVs) and one motor-operated, shut-off valve would be installed for overspeed protection, water-induction prevention, and operation of the line. The first NRV must be no more than 6 m away from the flange on the crossover to meet energy storage and overspeed requirements. Pipe hangers and structural steel additions, including personnel access to the NRVs, would be included in the scope of supply.
A new pressure control valve (PCV), referred to as the “butterfly valve”, would be installed in the existing IP-LP crossover that would enable throttling of the steam supply at reduced loads (Figure 2.4). At less than 75% load, the amount of extraction steam would be restricted by the moisture contents at the last stage of the LP and the turbine blade load due to irregular flow conditions at
the latter stages of the IP. The last stage of the LP would be operated in a moist atmosphere to prevent it from heating. Further design detail would be studied during the execution stage of the retrofit.
Pressure and temperature would be monitored at the tie-in location of the IP-LP crossover and at the boundary limit of the north wall of the powerhouse. Flow rate would be monitored at the boundary limit. Temperature would be monitored along the exterior portion of the line on the Pipe and Utility Bridge. Drip legs with automatic drains, high-point vents and low-point drains would be installed as required. The line would be wrapped with 3 inches of mineral-wool insulation and aluminum jacketing. Preliminary routing of the Process Steam piping would provide sufficient flexibility in the line to withstand the effects of thermal expansion. A full piping stress analysis would be completed in the detailed design phase.
Figure 2.3 Proposed design and location of the process steam extraction line to the reboiler (highlighted in blue with the north wall of the powerhouse hidden)
Steam to reboiler
Turbine

17
2.3.2 Purpose of the Butterfly Valve in the IP-LP crossover
The Shand CCS facility would be designed for seamless and continuous capture operation at 90% capture during decreased power plant output as dictated by a reduction in grid load demand. The modified design of Shand’s steam cycle, that incorporates insertion of a butterfly valve in the IP-LP crossover between the steam extraction point and the inlet to the LP turbine, would facilitate operational flexibility of the capture plant by enabling the thermal cycle to operate under planned curtailment conditions. It is worth noting that traditionally, butterfly valves are often employed to maintain the pressure at the back end of the IP turbine, thus avoiding costly modifications to the turbine itself, albeit at the cost of reduced efficiency of power generation. However, for the Shand design at full load the butterfly valve would remain completely open to maximize efficiency.
Reduction in power plant load would reduce the quantity and quality of the main supply of steam. This would hinder the performance of the capture facility for the following reasons:
• As the power plant load decreases, the quantity of steam flowing through the turbine decreases in proportion to load. The reduction in the desired
duty to the reboiler however is disproportional to the reduction in power plant load, resulting in a greater percentage of the steam consumed for capture operations.
• At reduced loads with an uncontrolled IP-LP crossover extraction, the pressure drops in proportion to the steam flow to the LP turbine. Eventually the pressure at the IP-LP crossover drops below the pressure required for the reboilers and solvent regeneration cannot be maintained. This limiting factor prevents continued capture operations at reduced loads.
Throttling the steam at reduced loads, via the butterfly valve, would maintain sufficient flow and energy density to the reboiler for continued capture operations.
The butterfly valve would also enable over-capture (beyond the 90% capture design parameter) at reduced loads by increasing extraction steam pressure. From a CO2 supply point of view this would mean more consistent volumes of CO2 would be delivered while enabling load variation of the Power Island. From an emissions-mitigation point of view, CCS equipped
Figure 2.4 Crossover pipe steam extraction point and butterfly valve location

I N T E R N A T I O N A L C C S K N O W L E D G E C E N T R E T H E S H A N D C C S F E A S I B I L I T Y S T U D Y P U B L I C R E P O R T
coal-fired power plants could be made responsive to variable renewable generation and would emit less CO2 per MWh, thereby effectively increasing the emissions reduction contribution of renewable power.
The emission intensity realized by coupling a carbon capture plant that is capable of exceeding 90% capture
at partial load when supporting a wind power facility is six times less than the emission intensity that can be achieved with a modern NGCC plant serving the same duty. For further details refer to Chapter 11.
A new Reclaimer Steam line from the cold reheat steam piping would be installed to the CCS facility to provide intermittent steam to the CCS Thermal Reclaimer. The tie-in would be located at Operating Floor elevation between LP FWH 2 and HP FWH 4. The line would be routed along the Operating Floor, through the north wall of the Powerhouse and along the Pipe and Utility Bridge to the boundary limit of the CCS facility (see Figure 2.5). Steam would be sourced prior to the reheat attemperator and, would be tied into the single 8-inch steam-extraction piping that enters the HP FWH 6 feedwater heater. The line would supply steam when the Thermal Reclaimer is in service. The line would be designed to the 150# carbon-steel piping specification and would be constructed of NPS 6 SCH 40 A106 GR B piping. One free-swing NRV and one motor operated shut-off valve would be installed for back-flow and water-induction prevention. High-point vents and low-point drains would be installed as required. Two drip legs with
automatic drains would be installed in the line. Pressure and temperature would be monitored. Piping would be wrapped with 1-inch mineral wool insulation and aluminum jacketing. The line would be supported every 6.4 metres (21 feet), or as required, to accommodate the effects of thermal expansion.
Originally, two options were considered for the Reclaimer Steam source: (1) IP intermediate extraction steam or (2) cold reheat steam. Results from this study indicated that the difference in heat rate (or kW power) between these options was negligible. However, it was noted that the IP extraction-line steam velocity would be relatively high at approximately 110 m/s, which could potentially lead to noise and/or vibrations. Therefore, the cold reheat source was selected.
2.3.3 Steam Supply to the Reclaimer
Figure 2.5 Proposed design and location of reclaimer steam line(highlighted in blue with the north wall of the powerhouse hidden)
Steam to reclaimer
Steam to reboilerTurbine

19
2.3.4 Additional Condensate Supply Line
A new condensate supply line from the powerhouse to the CCS facility would be installed. The line would supply condensate to the CCS facility to sub-cool condensate from the reboiler and the thermal reclaimer prior to return to the powerhouse. Condensate would be sourced from the existing gland steam condenser outlet line (SD-PIP-006-10”) beneath the Operating Floor. The line would be routed along the Operating Floor, through the North wall of the Powerhouse and
along the Pipe and Utility Bridge to the boundary limit of the CCS facility (see Figure 2.6). Piping would be designed to the 150# carbon-steel piping specification and would be constructed of NPS 2 SCH 80 A106 GR B piping. Double-block and bleed valves would be installed at the tie-in location for isolation purposes as well as high-point vents and low-point drains as required. Piping would be supported every 3 meters, or as required, to accommodate thermal expansion.
Figure 2.6 Proposed design and location of condensate supply line (highlighted in blue with the north wall of the powerhouse and the operating floor hidden)
2.3.5 Condensate Return to the Power Plant
Condensate from the reboiler and reclaimer would accumulate inside the steam condensate drum before returning to the power plant steam cycle. A condensate return line from the CCS facility to the Powerhouse would be installed. The line would deliver condensate produced in the CCS Reboiler and its Thermal Reclaimer to the Powerhouse and would tie into the existing condensate inlet line (SD-PIP-012-10”) to the DEA. Condensate-forwarding pumps would be used to return the condensate to the power island from the capture facility. The tie-in would be located at Operating Floor
elevation between LP FWH 2 and HP FWH 4. The line would be routed along the Pipe and Utility Bridge, through the north wall of the Powerhouse and along the Operating Floor to the tie-in location (see Figure 2.7).
Piping would be designed to the 150# carbon steel piping specification and would be constructed of NPS 10 SCH 40 A106 GR B piping. A check valve and an isolation valve would be installed in the Condensate Return line, as well as high-point vents and low-point drains, as required. Provisions to reroute the condensate away from the power cycle, in the event of any quality deficiencies,
Steam to reboiler
Turbine
Condensate supply line
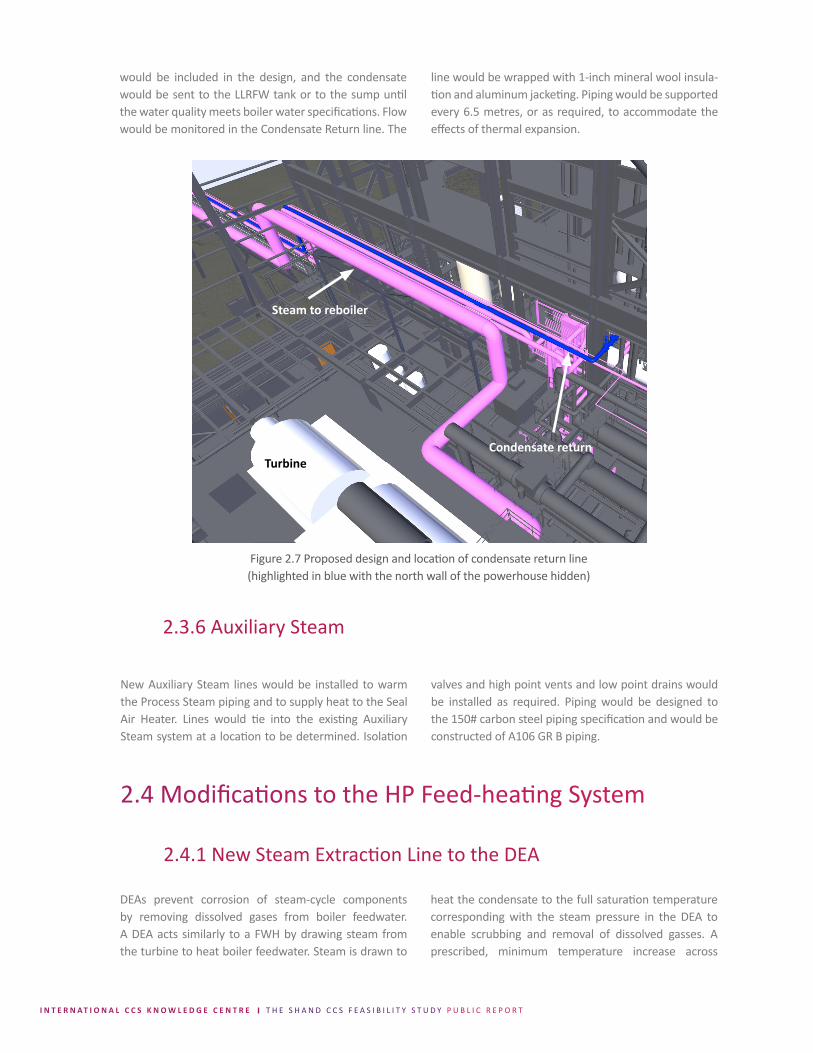
I N T E R N A T I O N A L C C S K N O W L E D G E C E N T R E T H E S H A N D C C S F E A S I B I L I T Y S T U D Y P U B L I C R E P O R T
2.3.6 Auxiliary Steam
line would be wrapped with 1-inch mineral wool insula-tion and aluminum jacketing. Piping would be supported every 6.5 metres, or as required, to accommodate the effects of thermal expansion.
New Auxiliary Steam lines would be installed to warm the Process Steam piping and to supply heat to the Seal Air Heater. Lines would tie into the existing Auxiliary Steam system at a location to be determined. Isolation
valves and high point vents and low point drains would be installed as required. Piping would be designed to the 150# carbon steel piping specification and would be constructed of A106 GR B piping.
Figure 2.7 Proposed design and location of condensate return line (highlighted in blue with the north wall of the powerhouse hidden)
would be included in the design, and the condensate would be sent to the LLRFW tank or to the sump until the water quality meets boiler water specifications. Flow would be monitored in the Condensate Return line. The
2.4 Modifications to the HP Feed-heating System
2.4.1 New Steam Extraction Line to the DEA
DEAs prevent corrosion of steam-cycle components by removing dissolved gases from boiler feedwater. A DEA acts similarly to a FWH by drawing steam from the turbine to heat boiler feedwater. Steam is drawn to
heat the condensate to the full saturation temperature corresponding with the steam pressure in the DEA to enable scrubbing and removal of dissolved gasses. A prescribed, minimum temperature increase across
Steam to reboiler
Condensate returnTurbine

21
the DEA, as per manufacturer’s specification, must be achieved using steam extraction. For Shand the required temperature increase would be 15°C.
Currently, the DEA at Shand extracts steam from the LP turbine. During CCS operations, the steam extraction required for the capture facility would be sourced from the IP-LP crossover. This would reduce the pressure of the usual LP steam extraction supply to the DEA. Furthermore, integrating Shand with CCS would generate a return condensate stream from the capture facility. The condensate return would tie into the feedwater condensate stream between the LP FWH 2 and DEA. The enthalpy of the return condensate stream would be higher than the current feedwater saturation condition. Furthermore, using rejected flue gas heat for condensate preheating would increase the enthalpy of the feedwater condensate during capture mode. The combined effects of these two factors would increase the temperature of the condensate entering the DEA from 115.7oC, current Maximum Design Flow conditions (MDF), to 136.1oC (MDF with CCS).
Currently, steam extraction would not provide sufficient energy to adequately deaerate by providing the required 15-degree temperature increase in the condensate as it passes through the DEA. To adjust for this, the temperature and pressure of the DEA would be increased by changing its steam extraction source to a
higher-energy steam extraction supply. Therefore, a new extraction steam line to the DEA at Floor EL. 602.4 (+44.4) would be installed. The line would tie into the existing extraction steam line (SE-PIP-007-10”) to HP FWH 5 at Floor EL. 579.9 (+21.9), downstream from the existing motor-operated valve SE-MOV-043 (see Figure 2.8). The line would be tied into the existing extraction steam line to the DEA to enable the existing steam source to supply the DEA with steam while the CCS facility is off line. The new line would operate at 1,534 kPa (absolute) and 434.8 °C with a flow rate of 18,860 kg/hr. The line would be designed to the 150# alloy steel-piping specification and would be constructed of NPS 10 SCH STD A335 P11 piping. Isolation valves, high-point vents and low-point drains would be installed as required. Pressure and temperature would be monitored at the tie-in location and at the DEA. The line would be wrapped in 4-inch mineral wool insulation and aluminum jacketing. Piping would be supported every 8.2 meters, or as required to accommodate the effects of thermal expansion.
In summary these modifications would allow the DEA to continue operating at current conditions with the existing extraction to the DEA from the LP turbine when CCS is off line. With CCS online, however, the extraction from the DEA would change and be sourced from the HP FWH 5 extraction line while also bypassing HP FWH 4.
Figure 2.8 Proposed design and location of the new steam extraction line to the DEA (highlighted in blue)
Steam to DEA

I N T E R N A T I O N A L C C S K N O W L E D G E C E N T R E T H E S H A N D C C S F E A S I B I L I T Y S T U D Y P U B L I C R E P O R T
2.4.2 HP FWH 4 Bypass Drain
Figure 2.9 Proposed design and location of the new HP FWH 4 bypass drain (highlighted in blue)
The increased LP condensate preheating, combined with the increased temperature and pressure of the condensate exiting the new DEA, would eliminate the need for HP FWH 4 while CCS is on line. Therefore, HP FWH 4 would be taken out of service during capture operation. Currently, HP FWH 5 drains into HP FWH 4. With HP FWH 4 out of service, a bypass drain around the heater to the DEA would be required. The tie-in location would be on the Operating Floor downstream of the existing level control valve SN-LCV-011. The line would be routed to the DEA on Floor EL. 602.4 (+44.4). A separate line would also be routed to the Condenser Hot Well at Floor EL. 558 (+0.0) (see Figure 2.9). With the CCS facility on-line, 135,466 kg/hr of condensate at 161.5 °C would drain to the DEA.
Alternatively, the condensate could be sent to the Condenser Hot Well. With the CCS facility off-line, the HP FWH 5 would drain through the existing cascading drains. The new drain lines would be designed to the 150# carbon steel-piping specification with lines being constructed of NPS 8 SCH 40 A106 GR B piping. Isolation valves, high-point vents and low-point drains would be installed as required. The line would be wrapped in 38.1 mm of mineral wool insulation and aluminum jacketing. Piping would be supported every 5.8 metres, or as required, to accommodate the effects of thermal expansion.
HP FWH4
HP FWH4bypass drain

23
The source of steam extraction for the DEA from the IP to FWH 5 extraction line would increase the pressure of the DEA from 303.6 kPa to 517.3 kPa, which would be beyond the current DEA design limit. Therefore, DEA replacement would be necessary. MHPS has undertaken a preliminary investigation and has verified that all piping to and from the DEA could adequately handle the aforementioned pressure increase. Assumptions for this investigation would be verified during the FEED study. Two alternatives were evaluated as discussed in
this subsection: a spray-type DEA and a replacement tray-type DEA.
A new spray-type DEA (see Figure 2.10) would be installed to replace the existing tray-type DEA. The spray-type DEA comprises a single vessel design that effectively combines the DEA and the storage tank into a single tank without any trays. The DEA would be fabricated using A516 GR 70 carbon steel.
2.5 DEA Replacement
When the CCS facility is off line, the existing LP Extraction Steam line to the DEA would be used. However, when the CCS facility is on line, a new extraction line tie into the IP to HP FWH 5 extraction would be used to supply steam to the DEA. Given the higher temperature and pressure of the cold reheat steam source when the CCS facility is on-line, non-standard materials of construction would be required for the supply of a replacement tray-type DEA. However, a new spray-type DEA could be fabricated using standard carbon-steel plate.
A distinct advantage of the proposed spray-type DEA is important to consider. The new spray-type DEA has
a significantly lower profile due to the single-tank design compared with the dual-tank design of the existing tray-type DEA. Consequently, it would easily fit into the existing DEA installation location whereas a replacement tray-type DEA would not. A replacement tray-type DEA would be larger than the existing DEA and would not fit within the existing steel structure, thereby necessitating significant modifications to the power island infrastructure. Consequently, it is expected that a new spray-type DEA would result in significant cost savings compared with a replacement tray-type DEA.
Figure 2.10 Drawing of the proposed new DEA

I N T E R N A T I O N A L C C S K N O W L E D G E C E N T R E T H E S H A N D C C S F E A S I B I L I T Y S T U D Y P U B L I C R E P O R T
Modifications to the LP feed-heating system would include the installation of three Condensate Preheaters (CPHs). During CCS operation, the steam extraction line for the reboiler from the IP-LP crossover hinders the use of LP FWH 1 and 2 for normal condensate preheating. Flue gas would be cooled to the desired temperature prior to entering the capture facility to facilitate favorable reaction kinetics and to avoid thermal degradation of amine solvent used for CO2 capture. The rejected flue gas heat could be recovered for LP feed-heating using heat integration methods. The low-grade heat rejected from the flue gas is available in excess. However, applications to fully utilize the heat are limited. The proposed modifications to the feed-heating system, primarily involving the increase in DEA temperature and pressure, enables maximizing the usage of this low-grade heat. This would fittingly lower the production penalty or parasitic load associated with CO2 capture operation. In total, 47.24 MWth would be incorporated into LP condensate preheating utilizing the rejected low-grade heat from the flue gas through heat integration.
Modification of the feed-heating train must account for the need to conserve steam-cycle performance and overall power plant efficiency that are associated with maintaining increased enthalpy from the boiler feedwater that is passed through the train. The steam cycle would be optimized to ensure that boiler feedwater re-entry into the boiler preserves sufficient thermal energy to mitigate any impact on the steam output of the boiler. A decrease in boiler feedwater enthalpy would require more work from the boiler and additional fuel to generate thermal energy thereby reducing the efficiency of the steam cycle and increasing the heat rate of the power plant. This would be an undesirable scenario. The boiler feedwater enthalpy profiles of the current steam cycle and the steam cycle integrated with CCS are summarized in Figures 2.12 and 2.13, respectively. The duty comparisons of each component in the feed-heating train between the two cases are summarized in Figure 2.14.
Figure 2.11 Proposed new DEA installation
The existing DEA and its overlying access platform would be demolished and removed from the Powerhouse via the adjacent lifting bay. Any piping connections within the immediate vicinity of the existing DEA would be demolished to accommodate the demolition and installation of the new DEA tank. A crane would lift
the new DEA and set it outside the north wall of the Powerhouse. Building siding would be removed from the north wall of the DEA bay and temporary steel would be erected upon which to set the DEA. The DEA would be put into place and new piping would be used to reconnect all existing lines to the DEA (see Figure 2.11).
2.6 Modifications to the LP Feed-Heating System
DEA

25
Figure 2.12 Boiler feedwater enthalpy profile of the current steam cycle at Shand
Figure 2.13 Boiler feedwater enthalpy profile of the steam cycle with CCS integration of Shand

I N T E R N A T I O N A L C C S K N O W L E D G E C E N T R E T H E S H A N D C C S F E A S I B I L I T Y S T U D Y P U B L I C R E P O R T
Comparisons may be drawn between the two enthalpy profiles. The resulting final enthalpies of the boiler feedwater are similar for the two cases. HP FWH 6 and the DEA also experience similar duties in both cases. HP FWH 4 would be taken out of service during CCS operations, as it becomes redundant due to the lowered pressure at the crossover, which was the original extraction point for this FWH and the new higher pressure extraction point to the deaerator. The new higher pressure deaerator would only partially compensate for the duty make up requirements, as such, the duty and steam extraction volume of HP FWH 5 would increase.This would be attributed to the increased pressure difference between the HP FWH 5 extraction and the crossover, which is the next lowest pressure extraction. The LP feed-heating requirements would be compensated by CPH 1, 2 and 3. However, the total duty of the LP feed-heating system that would result from the LP feed-heating equipment
would be lower in the CCS integrated case. This is compensated by the large extent of duty supplied by the stream of condensate returning from the capture facility (condensate return). The condensate return has a higher energy density than the power plant condensate stream that it ties into. Consequently, a condensate returning with higher energy would greatly improve boiler feedwater warming and reduce its heating requirement. The CCS-integrated model would experience a 3.7% decrease in overall duty within the entire feed-heating train. This could be attributed to operational changes in the LP feed-heating train when CCS is on line. During CCS operation, the DEA would experience an 87% increase in pressure and a 17% increase in temperature. Changes in the DEA operating parameters combined with the preheating effects of the condensate return would alter the feed-heating profile of the LP feed-heating train.
Figure 2.14 Comparison of the associated duty for each component in the feed-heating train between the current power plant and the potential CCS-integrated power plant
2.6.1 System Description
At BD3, the intent was to leave FWH 1 and 2 out of service while CCS was on line. Should the FGC come off line, the flue gas would be diverted to the stack and
the capture island would shut down, while the power plant would continue to operate with the LP FWHs out of service. In this instance, the DEA would be required

27
to compensate for the loss in condensate preheating by increasing the volume of its steam bleed. A differential pressure would be established between the DEA and the turbine extraction point that would generate high flow velocity conditions inside the steam extraction line. This would be an unacceptable situation for continuous operation and would require the implementation of an automated system to return the LP heaters to service within a relatively short delay.
To avoid this situation at the proposed Shand CCS-integrated plant, three smaller CPHs would be configured in series with LP FWHs 1 and 2. With the capture island on line, LP condensate preheating would
be primarily supplied by the CPH. However, the amount of heat transfer through each of the CPHs would need to be adjusted with a bypass temperature-control valve to ensure that LP FWHs 1 and 2 would continue to consume a small amount of steam (~5% of MDF heat duty). This would help to facilitate the transition between power plant operating with the capture island in and out of service. The “cool” condensate would be configured to flow from CPH 1 to CPH 3 while the “hot” circulating water from the FGC would flow from CPH 3 to CPH 1 enabling countercurrent flow. Table 2.1 shows a summary of CPHs train heat duties.
Table 2.1 Summary of CPH train heat duties
It was assumed in this study that the additional differential pressure caused by the CPHs, when combined with the changes in pressure in the DEA and the lower condensate flow, would be within the capacity of the existing CEPs. This must be verified during the FEED
study. The FEED study would also evaluate if improved performance and lower power consumption for the use of Variable Frequency Drives (VFD’s) for the CEPs would compensate for the additional capital costs and would be justifiable as it was for BD3.
2.6.1.1 Condensate Preheater 1
CPH1 would be located on the Mezzanine Floor and would be installed in series before LP FWH 1 (see Figure 2.15). CPH1 would be a plate-and-frame heat exchanger with 419 304 stainless-steel plates, a total heat transfer area of 442.85 m2 and a heat duty of 18,986 kW. FGC Recirculating Water would enter the hot side of CPH1 at 92.72°C and exit at 57.47°C with an associated pressure
drop of 10.0 kPa across the exchanger. Condensate would enter the cold side of CPH1 at 45.02°C and exit at 80.47°C with an associated pressure drop of 9.95 kPa across the exchanger. CPH1 would have NPS 12 ANSI 16.5 150# carbon-steel process connections and a footprint of 1099mm W x 4382mm L x 2010mm H.

I N T E R N A T I O N A L C C S K N O W L E D G E C E N T R E T H E S H A N D C C S F E A S I B I L I T Y S T U D Y P U B L I C R E P O R T
CPH2 would be located on the Operating Floor and would be installed in series between LP FWHs 1 and 2 (see Figure 2.16). CPH2 would be a plate-and-frame heat exchanger with 187 304 stainless-steel plates, a total heat transfer area of 253.63 m2 and a heat duty of 7,835 kW. FGC Recirculating Water would enter the hot side of CPH2 at 107.33°C and exit at 92.86°C with
an associated pressure drop of 9.97 kPa across the exchanger. Condensate would enter the cold side of CPH2 at 84.53°C and exit at 99.10°C with an associated pressure drop of 9.91 kPa across the exchanger. CPH2 would have NPS 14 ANSI 16.5 150# 316L SS process connections and a footprint of 1186mm W x 2718mm L x 2353mm H.
Figure 2.15 proposed design and location of CPH 1 and associated piping (highlighted in blue with some existing piping and steel hidden)
2.6.1 System Description
2.6.1.2 Condensate Preheater 2
Figure 2.16 Proposed design and location of CPH 2 and associated piping (highlighted in blue with CPH 3 hidden)
CPH
CPH 2

29
CPH3 would be located on the Operating Floor and would be installed between the LP FWH 2 and the DEA (see Figure 2.17). CPH3 would be a plate-and-frame heat exchanger with 380 304SS plates, a total heat transfer area of 666.04 m2 and a heat duty of 18,094 kW. FGC Recirculating Water would enter the hot side of CPH3 at 140.66°C and exit at 107.57°C with an associated pressure
drop of 9.95 kPa across the exchanger. Condensate would enter the cold side of CPH3 at 100.59°C and exit at 133.94°C with an associated pressure drop of 9.77 kPa across the exchanger. CPH3 would have NPS 12 ANSI 16.5 150# carbon-steel process connections and a footprint of 1099mm W x 4382mm L x 2590mm H.
The CPHs would be installed in series with the LP FWHs, locating CPH1 before the LP FWH 1, CPH2 between the LP FWH 1 and 2 and CPH3 after the LP FWH 2. Existing condensate piping would be modified to divert condensate through each preheater. Piping would be designed to a 150# carbon-steel piping specification and would be constructed of NPS 10 SCH 40 A106 GR B pipe.
High-point vents and low-point drains would be installed as required. Double block and bleed would be added to existing valves for isolating exchangers to facilitate ease of maintenance. Experience from BD3 suggests that this equipment is highly reliable and resistant to fouling due to its service.
2.6.1.3 Condensate Preheater 3
Figure 2.17 Proposed design and location of CPH 2 and associated piping (highlighted in blue with existing piping and steel hidden)
2.6.2 Condensate Piping
CPH 3

I N T E R N A T I O N A L C C S K N O W L E D G E C E N T R E T H E S H A N D C C S F E A S I B I L I T Y S T U D Y P U B L I C R E P O R T
A single new FGC Recirculating Water supply line would be installed from the FGC building to each of the three CPHs. A new return line would also be installed from the preheaters to the FGC building. The recirculating lines would supply 462,536 kg/hr of hot flue gas cooling water to the CPHs to recover heat for utilization in the condensate system. The lines would be routed from the FGC building boundary limit, through the CCS facility and onto the Pipe and Utility Bridge. The lines would come through the north wall of the Powerhouse and along the Operating Floor to and from the CPHs (see Figure
2.18). Piping would be designed to a 150# carbon-steel piping specification and would be constructed of NPS 14 SCH STD A106 GR B pipe. A control valve would be installed around each CPH to manage the heat duty of the exchangers that would maintain some heating in the LP Heaters and assure an acceptable minimum temperature rise in the DEA. High-point vents and low-point drains would be installed as required. The supply line would be wrapped in 1-inch mineral wool insulation and aluminum jacketing.
Figure 2.18 Proposed design and location of the FGC recirculating water line (highlighted in blue with the north wall, operating floor and existing piping and steel hidden)
2.6.3 FGC Recirculating Water Lines
Steam to reboiler
FGC recirculatingwater

Chapter 3. Flue Gas Supply and Conditioning

I N T E R N A T I O N A L C C S K N O W L E D G E C E N T R E T H E S H A N D C C S F E A S I B I L I T Y S T U D Y P U B L I C R E P O R T
A new flue gas duct would be installed to supply combustion gas from the boiler to the CCS facility. Flue gas would be diverted from the existing stack through a large duct using two diverter dampers. A seal-air
system would be installed to seal the diverter dampers. A guillotine damper would be installed to isolate the flue gas duct.
3.1 Flue Gas Supply to the Battery Limit
3.1.1 System Description
The combustion gas from the boiler is divided into two streams before the primary and secondary air heater. These two flue gas streams flow to one common duct and then pass through the ESP and the Induced Draft (ID) fans before reaching the diverter dampers. The two diverters would be used to direct the combustion gas to either the stack or to the CCS facility or a combination of the two. The guillotine damper provides positive isolation of the combustion gas to the capture plant. The location of the diverter dampers and guillotine damper is illustrated in Figure 3.1.
During boiler startup and under normal operation without SO2 and CO2 capture in service, the diverter dampers would be in the closed position, isolating the
capture plant and diverting combustion gas to the stack. The seal-air system would seal against gas leakage with the blade in the closed position. The guillotine damper would also be in the closed position.
During normal operation with the capture plant in service, the diverter dampers would be in the open position diverting the combustion gas to the capture plant. The seal-air system would be activated and seal against gas leakage with the blade in the open position. The flue gas booster downstream from the flue gas quencher would draw flue gas through the FGC, the flue gas desulphurization (FGD) and the flue gas quencher (see Figure 3.2).
Figure 3.1 Proposed design and location of diverter and guillotine dampers
Ductwork
Stack ESP
GuillotineDamper
DiverterDampers

33
The diverter dampers would consist of structural casing, a diverter blade, a shaft, seals, a seal-air system and a drive assembly. The diverter casing provides structural support for the diverter blade and drive system. It would be constructed of a carbon-steel plate and would include structural beam reinforcement. The diverter blade would direct flow by pivoting on a shaft within the diverter casing. When the blade is fully seated, seals at the edge of the blade would contact seal-landing bards mounted on the walls of the diverter housing which would form a chamber around the perimeter of the blade. This chamber would be pressurized by the seal-air system which would be supplied from the seal-air fan and heated by auxiliary steam drawn from the steam cycle.
The diverter dampers would be positioned by a servo hydraulic system. This system would include
accumulators and emergency provisions such that failure results in the diverters opening to the exisitng stack. The system would also require capacity to position the diverters quickly in response to pressure variations that would result from loss of the capture plant booster fan. As was done with BD3, the goal would be to isolate capture plant disruptions from having an impact on the reliability of the power plant.
Figure 3.2 Configuration of flue gas diversion and path
3.1.2 System Equipment
3.1.2.1 Ductwork
The flue gas ductwork would carry flue gas from the diverter dampers at the flue gas stack to the inlet of the FGC which would be located at the east side of the capture building. The ductwork would have a 6.6 x 6.6 m2 crossection, would be 325 meters in length from
the stack to the FGC casings and would be constructed of carbon steel. The ductwork would be constructed in sections along its length, each section would be separated by an expansion joint.
3.1.2.2 Diverter Dampers
The goal would be to isolate capture plant
disruptions from having an impact on the reliability of the
power plant.

I N T E R N A T I O N A L C C S K N O W L E D G E C E N T R E T H E S H A N D C C S F E A S I B I L I T Y S T U D Y P U B L I C R E P O R T
The guillotine damper would consist of a port-frame assembly, corrugated-structural blade, drive-housing assembly and bonnet assembly. It would be operated using an electric actuator to open and close the damper. Blade-guide tracks would be attached to the inside sidewalls of the damper frame and would control side motion within allowable limits and hold the seals in place. The drive system would consist of two pin racks attached to the blade, a drive pinion on each rack, drive
actuator, and a gearbox at which point the drive system would penetrate the pressure envelope. The pressure envelope would be a high-alloy labyrinth assembly to seal against leakage. The bonnet would be fully enclosed to prevent fugitive emissions when the blade is in its retracted position. The bonnet would be heat-traced to maintain the system at 150°C and to prevent corrosion due to flue gas condensation.
Figure 3.3 Proposed ducting layout from the stack to the FGC
3.1.2.4 Seal Air System
3.1.2.3 Guillotine Damper
Unlike tubular-type primary air heaters installed at BD3, the Shand air preheater is a rotary, regenerative, air heater with the potential for cross-contamination of fly ash from the flue gas to the air. If this hot, primary air were used as the seal air for the diverter dampers, as installed at BD3, the contaminated seal air could lead to corrosion problems on the damper and stack. In the Shand design, auxiliary steam would be extracted from
the steam cycle in the powerhouse and its energy would be transferred to the seal air via the seal-air steam heater located near the ESP. The seal air system would be designed to supply 93.5 m3/min of seal air to the diverters to prevent flue gas leakage affording a higher pressure than the cavity between the front and back seal perimeters. Each diverter would be supplied with seal air at 129°C to avoid flue gas condensation.
Flue Gas Cooler
CCTFFlue Gas
Stack
Diverter DampersCoal Conveyer
Flue Gas Duct

35
The FGC removes sensible higher-grade heat from the flue gas. The FGC design for Shand would be based on the existing BD3 FGC supplied by Babcock Borsig Steinmuller (BBS). It would be located at the east side of the CCS building consisting of two units connected in parallel. The FGC would interface with the flue gas duct receiving flue gas from the boiler, the LP FWHs in the steam cycle at the powerhouse, and the MHPS-designed FGD. The following design basis would be used for the FGC:
• Flue gas at an operating temperature of 175°C would enter the FGC at a flow rate of 1,737 tonnes/hr and exit at a temperature of 85oC. This would have an energy value of 47.24 MWh that would be used for condensate preheating with the condensate
subsequently transferred to the circulating water loop that is a common system shared by the FGC, the trim cooler, and the CPHs. The circulating-water flow rate required to cool the flue gas would be 462.5 tonnes/hr.
• The FGC bundles for each of the two parallel units would contain ten G-FLON (fluoroplastic material) heat exchangers, featuring five modules installed parallel to gas flow; two modules would be in series. Configuration of the FGC modules requires isolation of two modules in series if a repair should be required on a single module. A schematic is shown in Figure 3.5.
• Two pumps would be used to circulate water from the FGC to the three new CPHs located in the
3.2 Flue Gas Pre-Conditioning
Flue gas pre-conditioning is essential for the CO2 capture process as it reduces impurities to ensure suitable flue gas conditions prior to the CO2 capture process. Pre-conditioning results in favorable CO2 absorption reaction
kinetics and mitigates solvent degradation. The flue gas conditioning train would comprise of a FGC, a FGD and a flue gas quencher (see Figure 3.4).
Figure 3.4 Location of FGC and FGD
3.2.1 Flue Gas Cooler (FGC)
3.2.1.1 System Description
Shand Powerhouse
Flue Gas Quencher and FGD
CO2 AbsorberCO2
Compression Building
CO2 Capture Building
Gypsum Dewatering Handling System
Flue GasCooler (FGC)
Duct

I N T E R N A T I O N A L C C S K N O W L E D G E C E N T R E T H E S H A N D C C S F E A S I B I L I T Y S T U D Y P U B L I C R E P O R T
powerhouse. The FGC circulation pumps would operate at 462,540 kg/hr at a total dynamic head (TDH) of 53 metres with a power input of 112 kW. To accommodate variable flue gas flows and the associated amount of heat transfer, the circulation pumps would be fitted with variable-speed drives to match the water-circulation rate to the amount of flue gas.
• Additional heat removed by the FGC to maintain the flue gas temperature below 85°C that cannot be used for condensate preheating would be rejected into the trim cooler. A plate-and-frame heat exchanger would serve as the trim cooler with a heat duty of 2,215 kWth.
• A pressurization system would be installed before the FGC circulation pumps to maintain pressure at the level necessary to prevent boiling in the system. It would also serve as a cushion for thermal expansion of water in the circuit.
• The demineralized water for the FGC circulating-water cycle makeup would be sourced from the existing demineralized water tank. Two demineralized-water pumps located in the powerhouse would take water from the tank and deliver it to the CCS facility and the FGC building through a common 4-inch line running from the pump discharge to an outside rack positioned between the powerhouse and CCS facility.
• Each module would be equipped with a cleaning system upstream of the module. The cleaning system would consist of a series of perforated tubes connected to spray pipes that would be equipped with automated ON/OFF valves. The valves would be activated to wash one module approximately every 18 minutes, giving each module 4 wash cycles per 24 hour period. This would prevent ash deposition on the tubes and maintain thermal conductivity of the FGC tubes.
• The wastewater system would be used to collect and transfer the wastewater stream generated from periodic washing of the FGC tube bundles. Wash water and condensates would be drained from the bottom of the FGC casing to the FGC wastewater tank at a rate of approximately 33 tonnes/hour. A crystallizer would be required to dispose of the net wastewater that is currently evaporated into the flue gas as detailed in section 5.6.
• Approximately 88% of the FGC wastewater would be directed to the CCS facility for FGD water makeup. Fly ash and water-soluble flue gas constituents, such as chlorides and fluorides, deposited on the FGC tubes would result in acidic FGD makeup water. The pH of the makeup water would be increased to 6 prior to sending it to the FGD unit.
Figure 3.5 FGC modules, casing and transition
37
The reaction of SO2 with amines could form problematic degradation products known as heat-stable salts (HSSs). Removal of SO2, prior to CO2 scrubbing is required to minimize HSS formation. The FGD process selected in this study was a wet limestone FGD system. Particulate
matter and halide removal are additional benefits of this system. The FGD train would consist of a limestone feed system, an absorbing system, and a gypsum dewatering system.
3.2.2 Flue Gas Desulphurization (FGD)
3.2.2.1 Limestone Feed System
Pulverized limestone would be trucked to site and transported to the limestone silo using compressed air. Limestone powder would be directly transferred to the limestone hopper from the limestone silo (near the SO2 absorber) by conveyor belt. From the hopper,
limestone powder would be mixed with bleed-return gypsum slurry, filtrate return from the filtrate sump, and absorber make-up water. The resulting limestone slurry would be injected into the absorber tank from the bottom section of limestone hopper.
3.2.2.2 Absorbing System
The purpose of the absorbing system is twofold. First, it first removes SO2 from the flue gas and facilitates its oxidization to form the stable gypsum byproduct. SO2 would be absorbed by the circulating gypsum/limestone slurry inside the absorber. The overall SO2 content of the flue gas would be reduced to 12 ppmv-d. The main components of the absorber would include: a double-contact-flow scrubber (DCFS), a mist eliminator, and an integrated tank to hold the slurry. Flue gas would exit the FGC at a temperature of 85oC and enter the bottom of the absorber. Flue gas would then travel upwards though the absorbing section and contact the liquid absorbent (gypsum/limestone slurry).
Liquid absorbent would be sprayed upward by several simple nozzles installed on the spray pipe located at the bottom of the absorbing towers. This arrangement forms a slurry fountain or “liquid column” which effectively removes SO2, particulate matter and halides. Absorber recirculation pumps circulate the slurry between the tank and the sprayers. Flue gas would then be directed into a two-stage mist eliminator, located at the top of
the absorber, to remove liquid droplets before entering the next downstream unit - the flue gas quencher. Liquid droplets collected in the mist eliminator are returned to the absorber as makeup liquid.
The absorbed SO2 is partially oxidized by O2 in the flue gas. Any remaining oxidation occurs in situ via the Jet Air Sparger (JAS) oxidation system. JAS is a forced oxidation system utilizing fluid dynamics that eliminate the need for oxidation air blowers. Part of the circulated slurry from the recirculation pumps is diverted through several JAS nozzles before reaching the reaction tank of the absorber. Orifice plates generate a negative pressure downstream of the plates and inside the JAS nozzles. This facilitates the natural induction of oxidation air from the atmosphere into the air induction nozzle by differential static pressure. By mixing the air and slurry in the JAS nozzle under turbulent flow conditions, fine air bubbles are generated that effectively disperse in the tank to produce efficient air-slurry contact and agitation conditions that cause the partial oxidation of the SO2 in the flue gas.

I N T E R N A T I O N A L C C S K N O W L E D G E C E N T R E T H E S H A N D C C S F E A S I B I L I T Y S T U D Y P U B L I C R E P O R T
Gypsum would be produced as a waste product from the FGD system at a rate of 6.7 ton/hr. The gypsum would be dewatered, resulting in a product with 12 wt% moisture content. The selected gypsum dewatering system would include equipment for pumping and dewatering the gypsum slurry from the absorber and for storing/pumping capacity to return the filtrate to the absorber. The slurry from absorber would be directly fed onto the filter cloth of a vacuum belt filter. Water would be removed by vacuum pump. The resulting filtrate water
would be collected to the filtrate sump and sent back to the absorber through the limestone hopper. Discharged gypsum would be temporarily stored in the gypsum storage building . The proposed location of the gypsum storage building is north of existing flue gas stack. It would have three days of storage capacity. Gypsum disposal would be combined with the existing bottom-ash waste-hauling arrangements yielding negligible additional disposal cost.
3.2.3 Quencher
A quencher would be used to cool the flue gas prior to the CO2 amine absorption process. It is composed of two components: (1) a trim FGD and (2) a flue gas cooler (see Figure 3.6).
As previously indicated, flue gas exiting the absorber section of the wet limestone FGD would have a low residual SO2 concentration. However, this level still poses a threat to amine solvent health in the CO2 capture system. Furthermore, CO2 absorption by amine solvent is an exothermic reaction, consequently the efficiency of absorption increases as temperature decreases. It is therefore advantageous to ensure the flue gas is as cool as reasonably possible prior to the absorption process.
To further cool the flue gas and remove residual SO2, a 50 wt% caustic-soda solution would be injected into the quencher column and circulated. This would reduce the concentration of SO2 in the flue gas to sufficiently low levels. Caustic soda would be injected using a caustic-soda makeup pump and introduced at the top of the packing. Circulated water would be chilled by the flue gas cooling-water cooler, resulting in a flue gas temperature suitable for CO2 absorption. The cooled condensate would be collected for use in FGC washing and FGD makeup. Any remaining water would be sent to the heat-rejection system for disposal in order to adhere with the ZLD policy of the power plant.
3.2.2.3 Gypsum Dewatering System
Figure 3.6 Schematic of wet FGD and flue gas quencher

Chapter 4. CO2 Capture and Compression

I N T E R N A T I O N A L C C S K N O W L E D G E C E N T R E T H E S H A N D C C S F E A S I B I L I T Y S T U D Y P U B L I C R E P O R T
Flue gas pretreatment would be followed by CO2 removal. The CO2 capture system comprises the following processes: CO2 absorption, solvent regeneration, solvent
filtration, solvent storage, solvent reclaiming and CO2 compression.
4.1 Post Combustion CO2 Capture Theory
4.1.1 CO2 Absorption
The CO2 absorber would consist of a rectangular tower with dimensionally-configured structured packing. The proposed CO2 Absorber would have two sections: (1) CO2 absorption section at the bottom and (2) flue gas washing section at the top (see Figure 4.1).
Traditionally, absorber towers were designed in the same manner as distillation columns and used trays or plates to optimize the gas absorption process by solvents. The packing in the CO2 absorber tower facilitates continuous contact between the flue gas and the amine solvent compared with step-wise contact using trays, while improving the contact efficiency for gas-liquid mass
transfer, maximizing gas-liquid heat transfer to improve CO2 recovery and assuring optimal fluid circulation and mixing. Structured packing would be selected versus random packing to increase the surface area that would further improve gas-liquid contact by maximizing solvent spreading, reducing the resistance to flow, and reducing the pressure drop across the column. In situations with lower gas flow rates and lower pressure, the performance benefits of structured packing are significant. Packed columns also handle foaming better than trays, which is a known potential challenge of CO2 absorption amines.
4.1.1.1 CO2 Absorption Section
The cooled flue gas exiting the quencher would be introduced into the bottom of the CO2 absorber and flow upward through the packing (see Figure 4.1). Movement of the flue gas would be facilitated by the flue gas booster fan located between the quencher and the CO2 absorber. Amine solvent with low CO2 loading, often termed “lean amine”, would be supplied at the top of the absorption section and move downward through the packing. The flue gas would contact the solvent in a countercurrent fashion at the surface of the packing, where 90% of the CO2 in the flue gas would be absorbed by the solvent. Solvent bearing absorbed CO2 would move down the absorber tower; this solvent is often termed “rich amine”. Rich-amine solvent would collect at the bottom of the CO2 absorber before being pumped through a heat exchanger by the rich-amine solution pumps to the top of the regenerator.
The exothermic CO2 absorption process results in a temperature increase as the solvent travels down the CO2 absorber. An intermediate cooling section would be paired with the absorber tower to enhance CO2 absorption performance. Solvent would be extracted from the middle of the CO2 absorption section by the absorption intermediate cooling solution pump and cooled by the bottom absorption intermediate cooler before returning to a point just below the extraction point.

41
Flue gas would flow from the lower absorption section of the absorber tower upward into the flue gas washing section at the top of the column (see Figure 4.1). The washing section would be similar to the flue gas quencher (see Section 3.2.3) with cooled water directly in contact with the flue gas to enable recovery of entrained amine solvent while also cooling the gas to maintain water balance in the system through condensation. The wash water circulation pump would circulate water from the
bottom of the chimney tray through the wash-water cooler before returning the cooled water to the top of the packing. An MHI proprietary amine emission reduction system would be installed at the outlet of the absorption section to recover amine mist from the treated gas. Following the flue gas washing sections, the treated gas would be exhausted to the atmosphere from the top of the CO2 absorber tower.
Figure 4.1 Schematic of CO2 absorber
4.1.1.2 Flue Gas Washing Section

I N T E R N A T I O N A L C C S K N O W L E D G E C E N T R E T H E S H A N D C C S F E A S I B I L I T Y S T U D Y P U B L I C R E P O R T
Solvent based post combustion capture processes exploit the reversible nature of the amine - CO2 molecule bond. The bond formed between the molecules is broken through the application of heat, which would be supplied in the regenerator column. The proposed regenerator would comprise a cylindrical column with structured packing (see Figure 4.2). It would provide the necessary heat required to break the CO2-amine solvent bond which would separate CO2 from the rich solvent by steam-stripping. Rich solvent exiting the bottom of the absorber would be preheated by the lean amine exiting
the bottom of the regenerator using the solution heat exchanger. Preheated, rich solvent would be introduced into the upper section of the regenerator; steam sourced at the reboiler from the IP-LP crossover would be supplied to the reboiler for regenerator column heating purposes. The rich solvent would contact the steam in a countercurrent fashion. This would desorb CO2 from the solvent. Solvent regeneration would apply MHI’s proprietary energy saving process to reduce steam consumption.
4.1.2 Solvent Regeneration
Figure 4.2 Schematic of CO2 regenerator

43
During normal operation, variations in system volume are compensated by makeup or surplus to the amine solution sump tank. The solvent storage and makeup system would also be used during periodic maintenance and inspection should draining of process equipment
be required. The solvent could readily be drained at any point in the plant into the underground drain collection system which would be connected to the Solution Sump Tank. Since the amine solvent does not easily oxidize, nitrogen blanketing would be unnecessary.
4.1.3 Solvent Filtration
The majority of residual fly ash in the flue gas entering the capture island would be removed by the flue gas quencher (see Section 3.2.3). However, a small portion would pass through the flue gas quencher and accumulate in the CO2 capture solvent. Accumulated fly
ash could cause flooding, corrosion, and fouling in the CO2 facility. Therefore, continuous removal of particulate matter from the CO2 solvent would be implemented at the solvent circulation system.
4.1.4 Solvent Storage and Makeup
4.1.5 Solvent Reclaiming (Intermittent Operations)
Reclaiming would remove solvent degradation products, such as HSSs, and suspended solids from the system. The Reclaimer would operate as a simple batch distiller using medium pressure (MP) steam. Since solvent degradation products have a higher boiling temperature than water or solvent, they remain in the Reclaimer while evaporated water and solvent would be returned
to the Regenerator. The solvent would be doused with caustic inside the Reclaimer to release HSSs. After the reclaiming operation has been completed, the reclaimed waste would be drained from the Reclaimed Waste Tank by the Reclaimed Waste Pump and treated offsite by a third party.
4.2 CO2 Compression
Following the capture process, the pressure of the CO2 gas would be increased above super critical conditions to a specified pressure of 17,513 kPag before transport through pipeline. Auxiliary power required for compression is significant and constitutes a significant part of the parasitic load associated with carbon capture. While there would be economic benefit to a single CO2 compressor, it would be the largest of its kind in the world and be accompanied by first of a kind risks. Alternatively, using two CO2 compressors modelled after the current CO2 compressor at BD3 could be beneficial. As such, for this study the two-compression train design
was investigated. Additional analysis would be required to determine the optimum configuration and supply option for CO2 compression.
Current study results indicate that the CO2 Compression Unit would consist of low pressure (LP) and high pressure (HP) compression sections. A CO2 Dehydration Unit utilizing a triethylene glycol (TEG) process would also be installed between LP and HP compression sections to remove moisture from the CO2 gas. The LP and HP compression sections would each have anti-surge lines.

I N T E R N A T I O N A L C C S K N O W L E D G E C E N T R E T H E S H A N D C C S F E A S I B I L I T Y S T U D Y P U B L I C R E P O R T
The LP CO2 compression unit would have four stages, each referred to as “wet-stage” compressors due to high moisture content in the CO2 gas. Moisture would be removed from the partially-compressed CO2 using inter-stage coolers between each of the compression stages. Condensate from wet-stage CO2 compression would be sent back to the capture system as to avoid generating a water discharge stream.
The HP compression unit would involve of four stages (5th to 8th). The CO2 exiting the TEG dehydration unit would be introduced into the 5th stage compressor and an inter-stage cooler before entering the 6th, 7th, and 8th stage compressors – all of which would be “dry-stage” compressors. After compression, the CO2 gas would be cooled by the Final Stage Discharge Cooler and delivered to the pipeline for transport to the contracted offtaker(s) or long-term, dedicated geological storage.
Figure 4.3 Eight-stage CO2 compressor

Chapter 5. Heat Rejection, Water Balance and Utilities
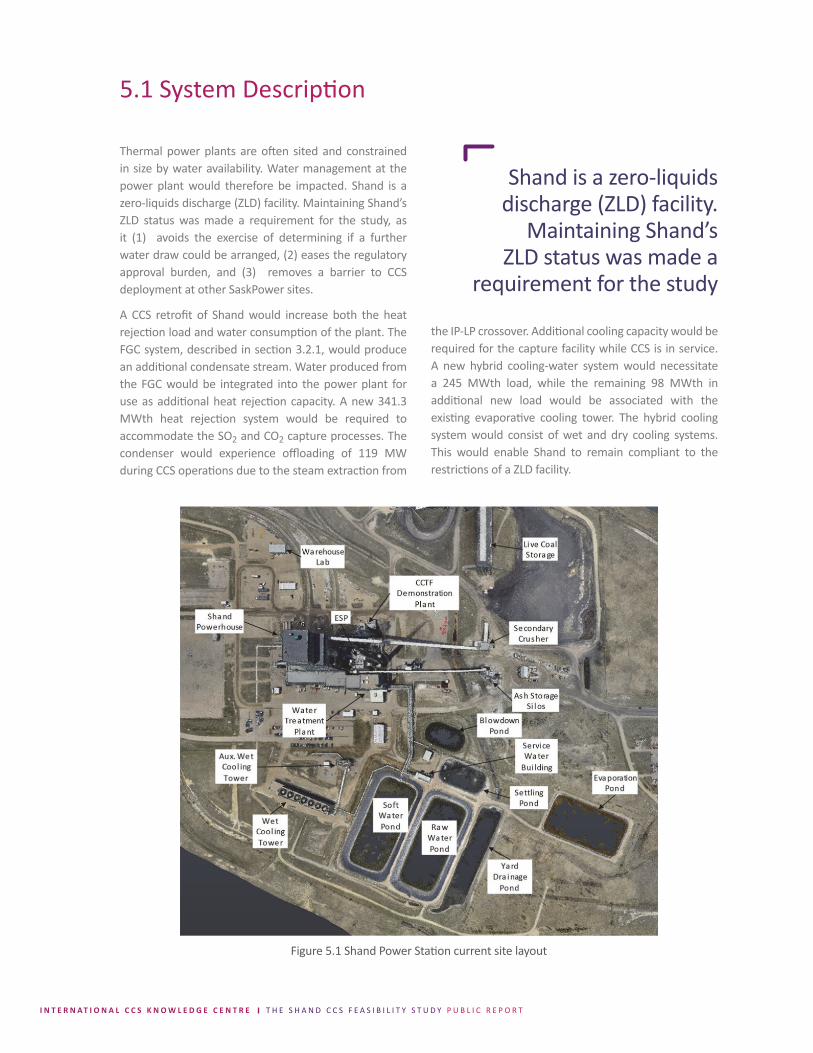
I N T E R N A T I O N A L C C S K N O W L E D G E C E N T R E T H E S H A N D C C S F E A S I B I L I T Y S T U D Y P U B L I C R E P O R T
Thermal power plants are often sited and constrained in size by water availability. Water management at the power plant would therefore be impacted. Shand is a zero-liquids discharge (ZLD) facility. Maintaining Shand’s ZLD status was made a requirement for the study, as it (1) avoids the exercise of determining if a further water draw could be arranged, (2) eases the regulatory approval burden, and (3) removes a barrier to CCS deployment at other SaskPower sites.
A CCS retrofit of Shand would increase both the heat rejection load and water consumption of the plant. The FGC system, described in section 3.2.1, would produce an additional condensate stream. Water produced from the FGC would be integrated into the power plant for use as additional heat rejection capacity. A new 341.3 MWth heat rejection system would be required to accommodate the SO2 and CO2 capture processes. The condenser would experience offloading of 119 MW during CCS operations due to the steam extraction from
the IP-LP crossover. Additional cooling capacity would be required for the capture facility while CCS is in service. A new hybrid cooling-water system would necessitate a 245 MWth load, while the remaining 98 MWth in additional new load would be associated with the existing evaporative cooling tower. The hybrid cooling system would consist of wet and dry cooling systems. This would enable Shand to remain compliant to the restrictions of a ZLD facility.
Figure 5.1 Shand Power Station current site layout
5.1 System Description
Shand is a zero-liquids discharge (ZLD) facility.
Maintaining Shand’s ZLD status was made a
requirement for the study

47
Shand currently rejects 425.7 MWth of heat through wet cooling towers. Shand draws a volume of 3,512 dam3/year of water from three sources:
1. Surface water from Rafferty Dam
2. Secondary treated sewage water from the city of Estevan after its passage through a constructed wetland
3. Snow melt, rain and runoff from a Shand yard drainage collection system.
In full-stream operation mode, the water is pumped to the Raw Water Pond and sent to the cold lime softener to be clarified and softened (see Figure 5.1 for current
site layout). In side-stream operation mode, the existing cooling tower receives water from the Raw Water Pond and the cold lime softener receives water from the existing condenser blowdown. The treated water is collected in the soft water pond for the existing evaporative cooling tower makeup. The blowdown water from the cooling tower is sent either to the cold lime softener in the water treatment plant to produce soft water or to the blowdown pond and subsequently to the vapour-compression evaporation unit (VCE) to produce distilled water. The residue from VCE is sent to the Decant Pond and used in LIFAC to maintain the plant as ZLD. The LIFAC system is used to evaporate wastewater in the latter sections of the flue gas path.
5.3 Accounting for Additional Heat Rejection Load and Liquid Water Discharge Streams
Integrating Shand with a post-combustion CO2 capture process would introduce a new combined heat rejection load of 341.3 MWth. The additional cooling load would be attributed to the flue gas cooling water cooler, wash water cooler at the top of absorber, CO2 absorber and regenerator cooler, and CO2 compression and dehydration unit. Due to the steam extraction for solvent regeneration, the existing condenser would experience duty offloading of approximately 119 MWth. Condenser offloading would free up heat duty from the existing cooling tower. However, the use of rejected flue gas heat for condensate preheating would reduce the steam bleeds to LP FWHs 1 and 2 to a minimum. This steam would end up in the condenser which would decrease the extent of duty offloading experienced by the condenser. Overall, the resulting condenser offloading would enable the flue gas cooling load (98 MWth) to be serviced using the existing cooling tower while freeing up some of the makeup water allowance that could be used in the new hybrid cooling system.
The new supply and return lines for the 98 MWth flue gas cooling-water cooler would be tied into the existing cooling water lines at the south side of the powerhouse between the powerhouse and existing cooling tower. The new lines would be designed to connect to the existing cooling water supply line and to the existing cooling water return line.
The addition of a capture facility at Shand would generate three new water discharge streams. These streams need to be integrated into the overall water use and treatment on site in order to maintain a neutral water balance and to avoid creating a waste water stream. The three discharge streams of concern would include:
1. Quench water generated from the CCS facility (124 tonnes/hr)
2. Acidic water (pH ≈ 4) from FGC wash water
3. Blowdown water from the Wet Surface Air Cooler (WSAC) basin
5.2 Current Heat Rejection System at Shand Power Station

I N T E R N A T I O N A L C C S K N O W L E D G E C E N T R E T H E S H A N D C C S F E A S I B I L I T Y S T U D Y P U B L I C R E P O R T
These generated water discharge streams would be managed as follows:
• 91 tonnes/hr of quench water would be dosed with caustic to adjust pH then combined with 31 tonnes/hr water from the soft-water pond to be used as makeup in the WSAC.
• 33 tonnes/hr of quench water would be used as FGC wash water.
• A portion of the acidic FGC wastewater would be mixed with the WSAC water blowdown at 13 Cycles of Concentration (COC) and directed to the blowdown pond.
• The remaining water from FGC wash water would be dosed with caustic prior to using it at the FGD as water makeup.
Water in the blowdown pond is naturally evaporated while some water is drawn to be treated by VCE. Figures 5.2 and 5.3 depict a simplified water usage and waste block diagram for the hybrid cooling water system.
Figure 5.2 Block diagram of water usage and integration flows for the hybrid cooling system

49
Figure 5.3 Simplified water usage diagram for the hybrid cooling water system
Water condensed out of the flue gas residing in the direct contact cooler (also referred to as the quencher) would be used in the hybrid heat-rejection system. The designed quenching system would generate 124 tonne/hr of liquid water. Most of this stream would be used for the makeup requirements of the WSAC with a small portion being utilized for the FGC wash. After washing the FGC, this water would be acidic (pH ≈ 4) due to the dissolution of contaminants in the flue gas. The spent wash water would be pH adjusted and used as FGD makeup; any unrequired surplus would be sent
to the blowdown pond without adjusting its pH. Based on water analysis, the WSAC could be operated with 13 Cycles of Concentration (COC). The WSAC blowdown would be mixed with the excess water from FGD make up in the blowdown pond. Some of the water in the blowdown pond would be naturally evaporated while some of the water would be drawn and treated by VCEs which demineralize the water. The demineralized water produced would be used as boiler makeup with the excess recycled into the heat rejection system.

I N T E R N A T I O N A L C C S K N O W L E D G E C E N T R E T H E S H A N D C C S F E A S I B I L I T Y S T U D Y P U B L I C R E P O R T
The hybrid heat rejection system would consist of twenty six air-cooled heat exchangers (ACHE) and four WSACs connected in series. Warm cooling water with a mass flow of 10.8×10⁶ kg/hr from the CO2 capture plant would be treated initially by the ACHE, where the process water would flow through a bundle of finned tubes while forced air would pass over the surface of the tubes in a cross-flow direction. The ACHE would consist of 26 bays; each equipped with three fans. The cooling water would exit the ACHE at a temperature of 31°C and enter the WSAC through bundles of heat-exchanger tubes. Cooling water in the WSAC basin beneath the tube bundles would be deluged through spray nozzles installed above the exterior surfaces of tube bundles. Cooling air and deluge water would flow downward over the tubes in the same direction as the nozzle spray. Air would be drawn over the tubes and a demister before entering the fan, where it would be released to
the atmosphere, while the cooling water would flow down to the basin. Blowdown would be withdrawn to maintain certain limitations, such as conductivity and total dissolved solids (TDS). Losses in water volume in the WSAC through evaporation, blowdown and drift would be compensated by makeup water as described above.
The hybrid cooling system would be installed north of the facility. The WSAC units would be installed at the north of the dry air cooler so that the collective plume would not impact the air intake at the power plant based on prevailing wind direction. The closed-circuit cooling water pumps and the expansion tank would be installed at the pump suction side located in a pumphouse on the east side of the CO2 compression building. Figure 5.4 and 5.5 shows the proposed design and layout of the new hybrid cooling system.
Figure 5.4 Proposed Shand hybrid cooling system
5.4 New Hybrid Heat Rejection System Design
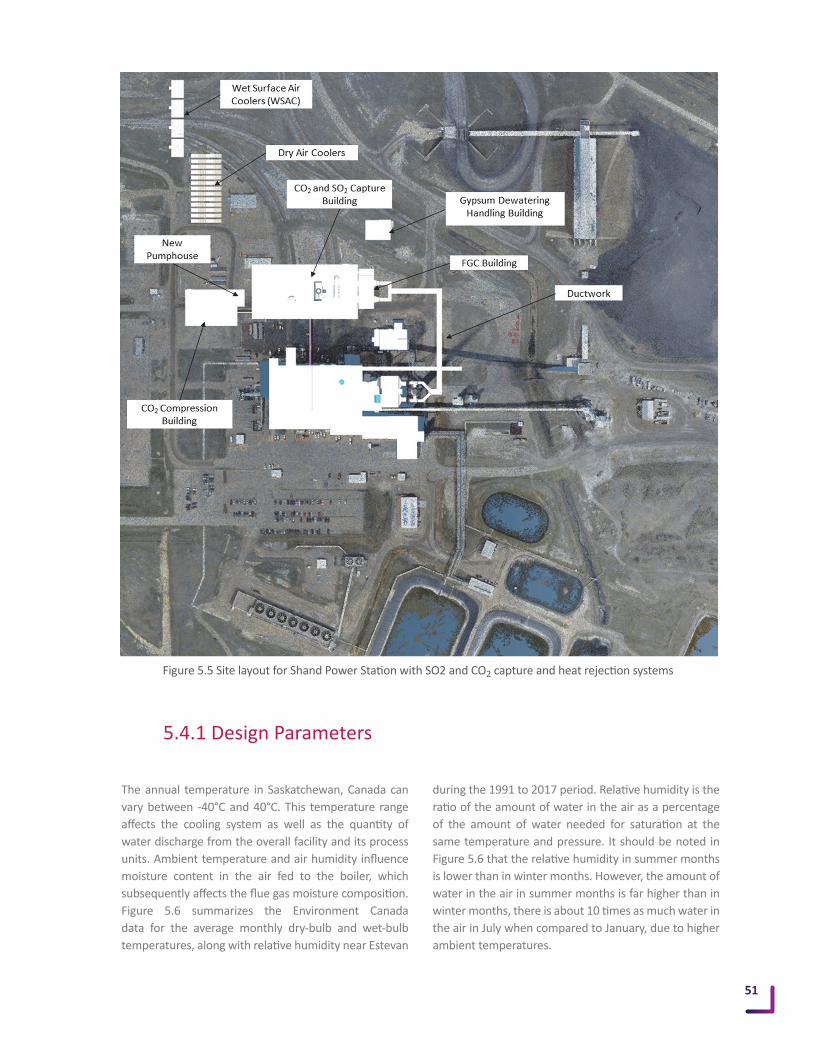
51
Figure 5.5 Site layout for Shand Power Station with SO2 and CO2 capture and heat rejection systems
The annual temperature in Saskatchewan, Canada can vary between -40°C and 40°C. This temperature range affects the cooling system as well as the quantity of water discharge from the overall facility and its process units. Ambient temperature and air humidity influence moisture content in the air fed to the boiler, which subsequently affects the flue gas moisture composition. Figure 5.6 summarizes the Environment Canada data for the average monthly dry-bulb and wet-bulb temperatures, along with relative humidity near Estevan
during the 1991 to 2017 period. Relative humidity is the ratio of the amount of water in the air as a percentage of the amount of water needed for saturation at the same temperature and pressure. It should be noted in Figure 5.6 that the relative humidity in summer months is lower than in winter months. However, the amount of water in the air in summer months is far higher than in winter months, there is about 10 times as much water in the air in July when compared to January, due to higher ambient temperatures.
5.4.1 Design Parameters

I N T E R N A T I O N A L C C S K N O W L E D G E C E N T R E T H E S H A N D C C S F E A S I B I L I T Y S T U D Y P U B L I C R E P O R T
Figure 5.6 Monthly average humidity, dry bulb temperature and wet bulb temperature in Southeastern Saskatchewan
Changes in ambient temperatures and humidity would affect the performance of both the wet and dry cooling systems. While the dry-cooling system is directly affected by the dry-bulb temperature, the wet-cooling system is affected by the wet bulb temperature that is a function of both temperature and humidity. Condensed water from the flue gas cooling would serve as water makeup to the wet-cooling system. Accordingly, water availability for the wet-cooling system would be dependent upon flue gas moisture content.
The total heat rejection load would be comprised of a combination of wet and dry cooling. Changes in weather throughout the year would alter the composition of this combination. Monthly variations in total heat rejection composition are summarized in Figure 5.7. During the winter months when the ambient temperature is low, the heat rejection load would shift to favour more wet cooling compared with the summer months. This could be attributed to the interaction between the cooling
water and the ambient air. Cold ambient air draws heat out of the water, which in turn decreases the temperature of the cooling water without the need for evaporation. In contrast, during the summer months when the ambient temperature is higher, increased rates of evaporation would be required to sufficiently reduce the temperature of the cooling water. The cooling load would therefore shift from wet cooling to dry cooling. Overall, the total designed heat rejection load of the hybrid cooling system would be 245 MWth. Cooling load between the design case and the annual average values was compared. In the design case the composition of the heat rejection load would be 67% dry cooling and 33% wet cooling. However, taking into consideration annual variations in temperature, the annual average cooling load would be 58% dry cooling and 42 % wet cooling.

53
Figure 5.7 Effect of ambient temperature on heat rejection load in dry and wet cooling
The size and power consumption of the hybrid heat-rejection system requires evaluation. The pumps and fans in the circulating water loop and wet-cooling towers would require significant amounts of electricity. The proposed power consumption for the heat rejection system is summarized in Figure 5.8. It should be noted that the circulating cooling-water pump would consume
a nearly constant amount of power throughout the year with an average of 0.8 MWe. During the summer months, power consumption for the dry-cooling system would increase significantly due to increased fan usage. Overall, power consumption for the design case would be 4.96 MWe compared to the annual average of 2.58 MWe
Figure 5.8 Monthly power consumption in heat rejection system

I N T E R N A T I O N A L C C S K N O W L E D G E C E N T R E T H E S H A N D C C S F E A S I B I L I T Y S T U D Y P U B L I C R E P O R T
Quantities of materials related to the capture process were estimated based on MHI’s experience and its detailed knowledge of the KM CDR ProcessTM chemistry. Chemicals for use in the water treatment
facility were calculated by Stantec and the Knowledge Centre. Table 5.1 summarizes the primary chemicals and their required quantities for the capture process.
5.5 Chemical Consumption
Table 5.1 Summary of chemical consumption for wet FGD and CO2 capture process
5.6 Waste Disposal
The primary wastes, their quantities and proposed disposal methods are summarized in Table 5.2. Disposal methods for wastes were not recommended by MHI, however Stantec and the Knowledge Centre determined appropriate methods, also shown in Table 5.2. Further investigation of an appropriate integrated waste-disposal system would be conducted during the FEED study.
Preliminary investigation of the purchasing and installation options for a crystallizer to handle the
VCE waste was undertaken by the Knowledge Centre. Specifications for the crystallizer include: an 8L/s capacity, a power requirement of 1300 kWe, and an energy consumption for steam generation of 1200 kW. Total installed costs have been estimated at approximately US$15 million. This analysis is based on the systems available from SUEZ Water Technologies & Solutions in Montana, USA.
Table 5.2 Summary of wastes produced and proposed disposal methods

Chapter 6. CO2 Sale and Storage Options

I N T E R N A T I O N A L C C S K N O W L E D G E C E N T R E T H E S H A N D C C S F E A S I B I L I T Y S T U D Y P U B L I C R E P O R T
The information presented in this Chapter was provided by Gavin Jensen, M.Sc. P.Geo., from the Government of Saskatchewan, Ministry of Energy and Resources.
Potential CO2 EOR opportunities within Saskatchewan exist due to the large number of depleted oil fields within the province; some of which have been producing since the 1950s. Most of these fields have been developed by vertical, horizontal and infill drilling. Water flooding has also been employed to prolong their production.
In general, once primary and secondary production methods have been exhausted, tertiary production projects can be implemented. One of the most common tertiary production methods include the injection of a miscible gas to increase the pressure in the reservoir subsequently leading to increased oil production. This method is referred to as Enhanced Oil Recovery (EOR). Commonly, CO2 is used as the gas in EOR miscible flooding operations. The aforementioned depleted oil fields of Saskatchewan are prime candidates for tertiary CO2 EOR injection.
6.1 Introduction
Potential CO2 EOR oppor-tunities within Saskatche-wan exist due to the large
number of depleted oil fields within the province; some of which have been
producing since the 1950s.
6.2 Current CO2 EOR Flooding in Saskatchewan
The Weyburn and Midale fields, located in southeastern Saskatchewan, are an example of successful CO2 EOR applications. Traditional water flooding techniques could not access oil still contained within these reservoirs, as such, CO2 injection began in 2000 and continues until today. The application of CO2 EOR has increased the life of these fields by 15-20 years beyond conventional
production methods. During CO2 EOR production, daily oil production is 28 000 barrels (176 120m3), of which 18 000 barrels (113 220m3) is incremental oil resulting from the injection of CO2 [6]. Over the life of the Weyburn CO2 EOR project it is projected that 155 million barrels of oil will be produced due to CO2 EOR operations.
6.3 Screening Criteria in Field Selection for CO2 EOR
A filtering method would need to be established to determine which of the numerous depleted fields in southeastern Saskatchewan would be the best candidates for deploying CO2 EOR technology. Based on previous research, parameters from other studies as well as Original Oil In Place (OOIP), a set of screening
criteria was defined. These criteria, summarized in Table 6.1, were used to detect which fields would have the optimal geologic and economic potential to develop into CO2 EOR projects. Data used for the filtering was from the Saskatchewan Ministry of Economy oil reserves report (2013).

57
Oil density is a key factor in determining the viability for CO2 EOR, as it influences oil’s mobility and in turn production volume. Miscible conditions have much greater oil production potential than immiscible conditions. For CO2 EOR to result in miscible flooding, CO2 must remain in its supercritical state. This occurs at a reservoir temperature and pressure greater than 31.1°C and 7.36 mPa, respectively. The reservoir depth in southeastern Saskatchewan required for miscible flooding is approximately 1000 metres. Pools with high recovery factors are typically excellent candidates for
miscible floods. Pools that have low recovery factors could be a result of reservoir heterogeneity, thinner reservoirs, and low sweep efficiency (affected by oil API and pressure within the reservoir). These reservoir characteristics will decrease the recovery of the oil that can be produced from the field. An original minimum oil saturation of 40% was used to further define field suitability. This would ensure there is enough oil in the reservoir to warrant the deployment of a CO2 EOR project.
Table 6.1 Summary of Screening Criteria for CO2 EOR Implementation
6.4 Suitable Fields for EOR and Potential Oil Recovery
Thirty two fields that satisfy the screening criteria were identified in southeastern Saskatchewan (Table 6.2). Figure 6.1 displays these fields along with the Boundary Dam and Shand power stations, and the two CO2 pipelines that currently exist. A proposed CO2 pipeline has been added to access the potential oil fields that are suitable for CO2 EOR deployment (Figure 6.1). This list includes the Weyburn and Midale fields, which demonstrate the validity of the screening parameters. The relative closeness in proximity of not only the oil fields to one another but also to the sources of CO2 makes for an ideal situation to deploy large scale CO2 EOR project on multiple fields. OOIP of the Weyburn and Midale fields is 397 million cubic metres, while the
other 30 fields boast a cumulative OOIP of 703 million cubic metres. Assuming a recovery factor similar to the Weyburn field, which is a 15% increase in oil production over the life of the field, CO2 EOR deployment to these other 30 fields could potentially produce an additional 105.5 million cubic metres of oil, or 663.3 million barrels of oil. As of July 2018 the Weyburn field has stored 38 million tonnes of CO2. In addition, 44% of the filed has yet to benefit from CO2 injection. The potential to store 50 million of CO2 at the Weyburn field is probable through continued development. In total the Weyburn field could potentially produce 155 million barrels of oil while storing 50 million tonnes of CO2.

I N T E R N A T I O N A L C C S K N O W L E D G E C E N T R E T H E S H A N D C C S F E A S I B I L I T Y S T U D Y P U B L I C R E P O R T
Tabl
e 6.
2 Re
serv
oir P
rope
rties
Sum
mar
y of
Oil
Fiel
ds in
Sou
th E
ast S
aska
tche
wan
with
CO
2 EO
R Po
tenti
al

59
Tabl
e 6.
2 Re
serv
oir P
rope
rties
Sum
mar
y of
Oil
Fiel
ds in
Sou
th E
ast S
aska
tche
wan
with
CO
2 EO
R Po
tenti
al -
Conti
nued

I N T E R N A T I O N A L C C S K N O W L E D G E C E N T R E T H E S H A N D C C S F E A S I B I L I T Y S T U D Y P U B L I C R E P O R T
6.2 Current CO2 EOR Flooding in Saskatchewan
Applying this oil production to CO2 storage ratio to the other 30 identified fields indicates the potential to store more than 200 million tonnes of CO2. As a note, this CO2 volume does not take into account any further development of the Midale and Weyburn fields. As such the volume of CO2 needed to flood all 32 fields could potentially be more than 230 Mt CO2. The potential oil production by means of CO2 EOR and as well as the potential CO2 volume in southeastern Saskatchewan
are displayed in Figure 6.2. The lower and upper oil production values are based on how many fields are deployed for CO2 EOR. The potential CO2 volume is based upon the Shand plant being converted to produce a supply of 7 000 tonnes per day of CO2 combined with the supply from the Boundary Dam plant amounting to 10, 000 tonnes per day. This value was decreased to 8500 tonnes per day to account for plant maintenance.
Figure 6.1 Location of suitable reservoirs for CO2 EOR deployment in south east Saskatchewan

61
In summary, the deployment of CO2 EOR in southeastern to the 30 identified fields could potentially produce an additional 663 million barrels of oil. Further deployment beyond the 30 identified fields could also be possible.
The amount of oil production from these 32 fields represents decades of sustained economic development for the province of Saskatchewan.
Figure 6.2 Potential oil production with CO2 EOR in south east Saskatchewan

Chapter 7. Performance
63
Shand’s net output performance was evaluated at full load for the following four cases:
1. Current Operation (Case 1, or the “Base Case”)
2. Operation following Turbine Upgrade, CCS not in Service (Case 2)
3. Operation with CCS in Service (Case 3)
4. Operation with CCS & Reclaimer in Service (Case 4)
MHI provided thermal energy requirements for capture, while MHPS provided turbine heat balances to support the evaluation of cases 2 through 4. Upgraded turbine technology was included in cases 2 to 4 which would result in improved electrical output. The estimated performance of Shand in each case is shown in Table 7.1. MHPS performed turbine calculations that were based on the original Maximum Design Flow (MDF) steam conditions. It should be noted, however, that the current turbine operates at significantly higher steam flows to compensate for age related degradation. The new turbine should be designed to take advantage of the boiler’s demonstrated additional steam generation capacity. The proposed turbine upgrades necessary to facilitate steam extraction to supply the CCS facility would rejuvenate the turbine, eliminating the degrading
performance associated with the age of the original turbine. Consequently, an additional 3% gross power output would be realized, which was included in the estimation of performance for cases 2, 3 and 4. Opportunities to increase the steam output from the boiler to the turbine above current levels, therefore improving project economics, were beyond the scope of the feasibility study considered herein. Anticipated power output increases and steam flows would require confirmation in the ensuing FEED study.
Auxiliary loads for the existing plant were estimated using historical plant operational data. The loads for new equipment associated with capture were calculated by MHI and Stantec. In some cases, only rated motor size was available, hence running load was approximated by division of those sizes by a factor of 1.1.
Net output performance of the power plant was estimated as follows in comparison with current operation (Base Case or Case 1):
• Case 2: an increase in power output of 4.3%,
• Case 3: a decrease in power output (“parasitic load”) of 22.2%, and
• Case 4: a decrease in power output of 22.7%.
7.1 Power Plant Performance
7.1.1 Output at Full Load
7.1.2 Output at Variable Loads
The net output at Shand was evaluated at variable loads. The range of flue gas flow rates considered included flows from 100% (Case 3) down to 75% (Case 8). MHI evaluated three points of interest between these flowrates. The following four different cases were evaluated to consider the impact of varying the load at the capture facility:
5. 95% Flue gas flowrate (Case 5)
6. 90% Flue gas flowrate (Case 6)
7. 82.5% Flue gas flowrate (Case 7)
8. 75% Flue gas flowrate (Case 8)
The results of this evaluation are summarized in Table 7.2. MHI completed preliminary calculations to determine the capture efficiencies and reboiler energy requirements for Cases 5 through 8 (see Table 7.3). Additional heat balances corresponding to these cases would be estimated by MHPS in the FEED study phase of this work. A turbine steam cycle model for the upgraded Shand turbine was built using GateCycle. The reboiler energy requirement provided by MHI was used to determine the gross output of Shand at reduced flue

I N T E R N A T I O N A L C C S K N O W L E D G E C E N T R E T H E S H A N D C C S F E A S I B I L I T Y S T U D Y P U B L I C R E P O R T
gas flow rates (Cases 5 through 8). It was determined that the capture efficiency would be 97.5% utilizing a reduced load of 75% flue gas flowrate to the capture facility (Case 8).
Auxiliary loads associated with reduced load at the existing power plant were determined using historical plant operational data. Loads for new plant equipment were scaled from full load values where performance curves were available. In the situation in which no data was available for reduced load performance, the data at full load was used. A more thorough evaluation of loads in the FEED study would improve the net output estimates at partial load.
A comparison of Case 8 (75% flue gas flow rate) with Case 9 (current operation at 75% load) demonstrated an overall decrease in net output of 34.5%. This decrease may be an over-estimation since some capture-related auxiliary loads were not reduced from the full load case in the calculation. Case 8 represents a turn down
of 37.5% in net output from Case 3 (full load with CCS in service). The full design operating range for the CCS system would include flue gas flows down to 50%. However, the performance calculations in this report were limited to the normal operating range for Shand. A broader range of loads could be considered in the FEED study.
The capture island’s performance response to varying load would be considered an asset. In the event that power demands increase well beyond normal peak load quantities, there may be value in the ability to operate without the carbon capture facility in order to achieve higher power plant output. However, given the contractual need for a constant product stream by a CO2 off-taker, interrupting CO2 production may not be a viable option to consider further. The ability to interrupt CO2 production in favor of greater power generation would likely have value if the CO2 was instead destined for dedicated geological storage.

65
Tabl
e 7.
1 Su
mm
ary
of S
hand
’s pe
rform
ance
at f
ull l
oad

I N T E R N A T I O N A L C C S K N O W L E D G E C E N T R E T H E S H A N D C C S F E A S I B I L I T Y S T U D Y P U B L I C R E P O R T
Tabl
e 7.
2 Su
mm
ary
of S
hand
’s pe
rform
ance
with
flex
ible
load

67
7.2 Capture Performance at Variable Load
As previously introduced in sections 1.5.4, the Shand feasibility study sought to design a capture facility that could maintain high capture efficiency while responding to variations in load. MHI and MHPS investigated the capture performance at reduced loads using the reduced-load flue gas compositions and flowrates provided by the Knowledge Centre. The maximum
steam extraction in their investigations was limited to 110% of the steam-mass flowrate at any particular load with capture operating at 90% or using the required reboiler heat duty value at full load (which ever was less). Results from these investigations, summarized in Table 7.3, showed the percent of CO2 captured could be increased well above the “traditional 90%”.
Table 7.3 Increased CO2 capture at reduced flue gas flowrates for Shand
The Shand feasibility study sought to capitalize on the inherent ability of a post combustion capture plant to capture a higher fraction of the CO2 at reduced flue gas flows associated with power plant loads below 100%. Applying this observation to a typical loading pattern for Shand would result in an aggregate CO2 capture
rate that would exceed 95%. In addition, the power unit would capture and sell its fly ash for use by the cement industry in the production of concrete as an additional marketable offset product. The combined emissions and GHG emission reduction offsets could potentially result in a “Carbon Neutral Coal-fired Power Plant”.
7.3 Emissions Profile of the Proposed Shand Integrated CCS Power Plant
The emissions profile of the proposed Shand CCS retrofit was calculated at various loads as summarized in Table 7.4. The emission rates were observed to decrease at decreased loads due to the ability of the power plant to increase capture rate at reduced load rather than simply maintaining it. The relationships between the produced
CO2, captured CO2 and overall capture rate are depicted graphically in Figure 7.1. Furthermore, the combination of a wet FGD along with the CO2 capture systems was found to remove all measurable SO2 and particulate emissions.

I N T E R N A T I O N A L C C S K N O W L E D G E C E N T R E T H E S H A N D C C S F E A S I B I L I T Y S T U D Y P U B L I C R E P O R T
Table 7.4 Summary of Shand emissions at varying loads assuming a 0.85 capacity factor
Figure 7.1 Relationships between CO2 produced and CO2 captured with load
Federal regulations impose a CO2 emissions limit of 420 t/GWh on electricity generation. Currently, SaskPower’s coal-fired power stations typically emit 1100 t/GWh. However, its operating natural gas plants emit 550-500 t/GWh, while new natural gas plants would emit 375-400 t/GWh. The BD3 facility at full capture was designed to emit 120-140 t/GWh, a value significantly below the federal regulatory limit.
Based on the predicted capture performance at variable load estimated by MHI in this Shand CCS feasibility
study, an average emission intensity was calculated assuming the “traditional 90%” capture design case. In this calculation, Shand’s future dispatch schedule was modelled to reflect recent operational experience between the years 2015 and 2017 (see Figure 7.2), yielding an overall emission intensity of 106 t/GWh (see Table 7.5), which is lower than BD3 and significantly lower than proposed federal regulations. Modifications to Shand’s turbine and the use of a butterfly valve on the IP-LP crossover would enable continued steam extraction to support sustained capture operations as
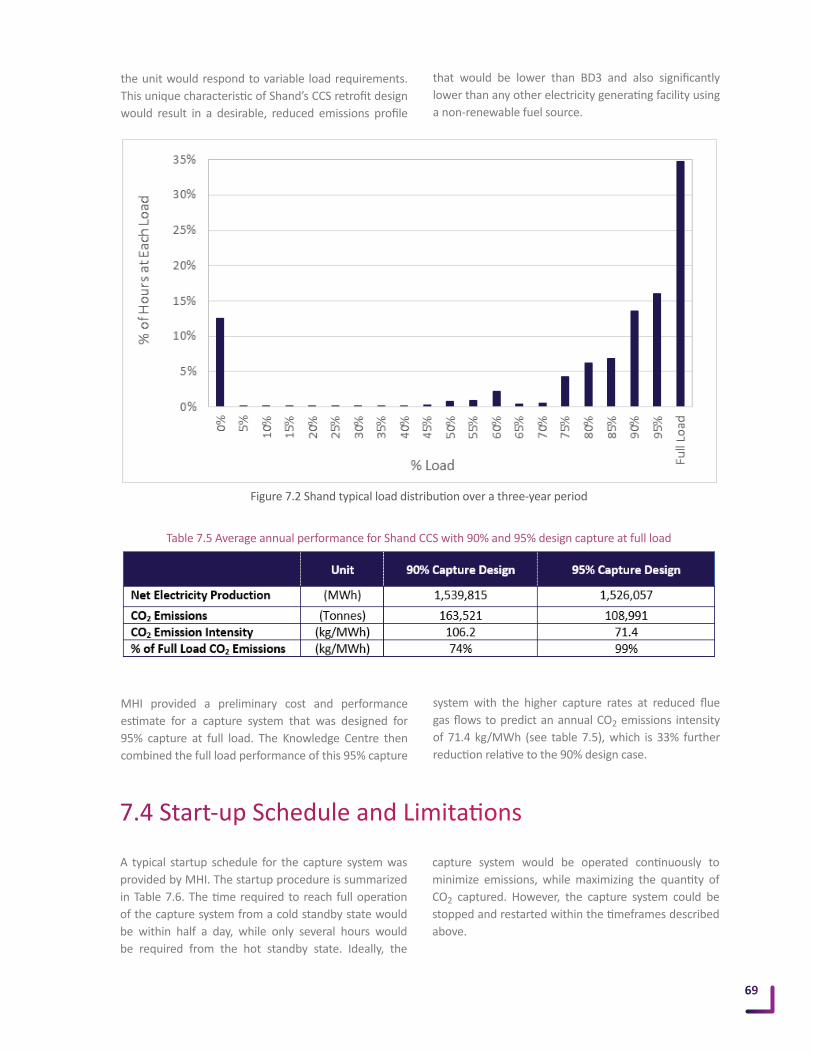
69
Table 7.5 Average annual performance for Shand CCS with 90% and 95% design capture at full load
the unit would respond to variable load requirements. This unique characteristic of Shand’s CCS retrofit design would result in a desirable, reduced emissions profile
that would be lower than BD3 and also significantly lower than any other electricity generating facility using a non-renewable fuel source.
MHI provided a preliminary cost and performance estimate for a capture system that was designed for 95% capture at full load. The Knowledge Centre then combined the full load performance of this 95% capture
system with the higher capture rates at reduced flue gas flows to predict an annual CO2 emissions intensity of 71.4 kg/MWh (see table 7.5), which is 33% further reduction relative to the 90% design case.
Figure 7.2 Shand typical load distribution over a three-year period
7.4 Start-up Schedule and Limitations
A typical startup schedule for the capture system was provided by MHI. The startup procedure is summarized in Table 7.6. The time required to reach full operation of the capture system from a cold standby state would be within half a day, while only several hours would be required from the hot standby state. Ideally, the
capture system would be operated continuously to minimize emissions, while maximizing the quantity of CO2 captured. However, the capture system could be stopped and restarted within the timeframes described above.

I N T E R N A T I O N A L C C S K N O W L E D G E C E N T R E T H E S H A N D C C S F E A S I B I L I T Y S T U D Y P U B L I C R E P O R T
Table 7.6 Typical startup procedure for capture facility
Table 7.7 summarizes the planned frequency and duration of outages for the capture system. The current maintenance schedule at Shand includes planned pre-winter outages each year, minor overhauls every two years and a major overhaul every 10 years. To achieve continuous operation of the capture system between these planned outages, the capture plant would be
designed to allow on-line cleaning or maintenance of critical pieces of equipment. The compression train at Shand will include two compressors operating parallel to each other. This would enable continued operation at reduced capture in the event that one compressor was inoperable.
7.5 Maintenance Requirements
Table 7.7 Planned maintenance outage frequency and duration at Shand

Chapter 8. Cost of CCS

I N T E R N A T I O N A L C C S K N O W L E D G E C E N T R E T H E S H A N D C C S F E A S I B I L I T Y S T U D Y P U B L I C R E P O R T
8.1 Introduction
Overall facility capital costs were determined using the following cost data:
1. CO2 capture island, including all necessary kit and the building (provided by MHI)
2. SO2 removal system (provided by MHPS)
3. Modifications to the steam turbine (provided by MHPS). This estimate comprised parts installed by the owner during the planned outage
4. Amine solvent (KS-1) including initial fill, commissioning, and makeup costs (provided by MHI)
5. Flue gas supply, including isolation dampers, ducting, transition ducting and all necessary
supports (provided by Stantec)
6. Flue gas cooler (provided by Stantec)
7. New hybrid heat rejection system required for the additional CCS heat load (provided by Stantec)
8. Condensate preheating train, including CPH1, CPH2, CPH3, and Trim Cooler (provided by Stantec)
9. Modifications to the HP feed heating plant and the DEA replacement (provided by Stantec)
10. Waste disposal, including amine, gypsum and TEG (provided by Stantec)
11. Electrical supply to the capture island (scaled and priced by SaskPower Engineering Services)
The contents of this chapter outline the economic analyses that were performed as part of the Shand CCS feasibility study. An overall Levelized Cost of Capture (LCOC) for Shand was determined using Net Present
Value (NPV) calculation methods. Several factors were considered including capital and operating costs of the project, and the costs associated with the decrease in net output.
8.2 Projected Project CostsA high-level summary of the total costs for a Shand CCS retrofit is provided in Table 8.1.
Table 8.1 Summary of total costs of a Shand CCS retrofit ($M)
8.2.1 Capital Costs
8.2.1.1 Facility Costs
Capital costs were divided into facility costs and owner’s costs.

73
Owner’s costs were identified and determined by the KC as follows (see Table 8.2):
IDC
MHI provided a typical payment schedule that indicated a 37-month construction period. A cost “S” curve was constructed based on that schedule.
OCIP
OCIP was scaled based on the rates received from the BD3 ICCS project that included a significant premium compared with more standard construction projects. This may be attributed to the “first of a kind” nature of CCS projects.
Table 8.2 Summary of owner’s costs for Shand CCS ($M)
OM&A costs were partitioned into fixed and variable costs. The results are summarized in Table 8.3. Overall fixed OM&A costs were determined based on the following:
• 23 additional personal would be required to operate the capture related facilities.
• Annual maintenance costs for the capture island, compression island, additional heat rejection system and flue gas cooler, along with the flue gas supply equipment, were estimated from the BD3 project.
Overall variable costs were determined as follows:
• An 85% capacity factor was assumed for the overall facility.
• Cost of consumables were determined by identifying and calculating the total of all consumables per facility, including consumables for the FGD, capture island, compression island and water treatment plant.
• Costs were escalated to 2024 dollars.
8.2.1.2 Owner’s Costs
8.2.1.3 OM&A Costs

I N T E R N A T I O N A L C C S K N O W L E D G E C E N T R E T H E S H A N D C C S F E A S I B I L I T Y S T U D Y P U B L I C R E P O R T
In Canada, the federal emissions performance standard for coal-fired electrical generators is unachievable without the integration of CCS. Continued operation of a coal-fired facility will be a result of an investment in CCS. Consequently, the valuable products from the facility could include electricity, in addition to CO2 and other byproducts, such as sulfuric acid, fly ash, gypsum, etc. For an electrical utility, it is common to evaluate the cost of electricity generated by the facility over the course of its lifetime by taking into consideration capital and ongoing costs, such as fuel and maintenance, and are offset by anticipated revenue from byproducts. The combination of these variables is used to determine the Levelized Cost of Electricity (LCOE) or other related methods which attempt to determine the minimum cost of providing the electricity. The LCOE of coal with CCS, after adjustment for revenue from by-product sales, would usually be compared to the LCOE of the best available alternative.
In the majority of the world where individual power unit emission intensity is not regulated, it is more appropriate to evaluate the cost of capturing CO2 and the value of selling CO2 and other by-products relative to not installing CO2 capture. This number in dollars per tonne of CO2 abated may be readily used to compare the economics of the facility to other emission mitigation options, such as fuel switching, or to a carbon tax or emission credit. This metric would also be appropriate for potential CO2 off-takers since it enables a determination of the economics of supplying CO2 to an EOR operation or other beneficial uses of CO2.
For an international audience, the key performance metric normally used is the Levelized Cost of CO2 Capture (LCOC). The estimates in this report are converted for presentation in $US per metric tonne. This method assumes that the existing power facility continues to be operated and is maintained at a reasonable level of reliability that is consistent with an 85% capacity factor. Both units are evaluated at 90% capture, which would correspond to an emission intensity of 120-140 tonnes/GWh.
8.3 Determining the Cost of Capture
Table 8.3 OM&A costs summary (all costs are in 2030 dollars)

75
Table 8.4 Capture rate of BD3 and Shand
The overall annual capture rate for a Shand CCS Retrofit was determined as part of the study. Shand, which outputs twice the electricity of BD3, would capture 6540
metric tonnes per day (tpd) if it was retrofitted with CCS. This would be slightly more than double the design capture rate for the BD3 facility, which was 3,240 tpd.
8.3.1 The Energy Costs of CCS
BD3 underwent extensive turbine upgrades to assure CCS compatibility and efficiency, including an increase in the steam temperature which resulted in a gross output increase from 150 MW to 161.1 MW. CCS on Shand would require only minor modifications to the turbine, however this would afford the opportunity to
restore the turbine to as-new condition while taking advantage of advancements in turbine design. Increases in gross output of the turbine would be attributed to reversing the age-related deterioration (3% of current gross output) and increased turbine efficiency. The costs in terms of energy were calculated using Equation 8.1.
The energy costs in kWh per tonne of CO2 captured were evaluated for three parameters:
1. Gross output increase due to modifications undertaken concurrently with the CCS retrofit
2. Regeneration steam requirements, and
3. Capture island auxiliary loads
Comparisons between BD3 and Shand CCS are summarized in Figure 8.1. These outcomes may be explained as follows:
• BD3 was at the end of its life at the time of its retrofit. Consequently, more extensive modifications were undertaken in parallel with the CCS retrofit resulting in greater increases to the existing facility’s gross output when compared with the situation for Shand. In general, this may be attributed to improved performance of equipment that was replaced due to its age.
• The capture system retrofitted at the Shand facility would have a simpler flow sheet, as currently contemplated, which would result in lower auxiliary loads at the cost of additional steam consumption by the CO2 system.
• The amine-based SO2 removal system at BD3 (as opposed to the limestone system at Shand) increased the auxiliary load requirements for BD3. However, overall steam requirements were decreased on BD3, even though additional steam was required for SO2 amine regeneration. Although not portrayed in Figure 8.1, this increase in energy consumption has been offset by the benefit of a lower consumables requirement due to the regenerable nature of amine.
In total, the net change in energy consumption for the Shand facility would be greater than BD3 by approximately 5%.

I N T E R N A T I O N A L C C S K N O W L E D G E C E N T R E T H E S H A N D C C S F E A S I B I L I T Y S T U D Y P U B L I C R E P O R T
Figure 8.1 Comparing the efficiency penalty of CO2 capture between BD3 and Shand CCS
8.3.2 Capital Costs per Tonne of CO2 Captured Comparison Between BD3 and Shand CCS
Capital costs of the Shand CCS retrofit were determined based on the cost estimation methodology that was in place at the time of the original approval for the BD3 project. These included interest charges during construction, contingency, owner-controlled insurance program, and project and site management, as well as transition to operations activities. Costs related to extending the life of the existing Shand unit, although relatively minor due to its age, were excluded for consistency with the BD3 calculation method.
Capital costs for the CCS portion of the BD3 project were determined independent of the life-extension work undertaken at the power plant. The modification costs of the power plant that were necessary to support the BD3 capture facility rather than life extension costs were estimated based on a review of the expense items in the final project budget. It was determined that CCS related costs represented approximately 40% of the capital costs expended at the power island. The cost reduction related to the federal government contribution to the BD3 project were not included in order to represent
an unsubsidized project. Local taxes and permits were removed from both project cost estimates for the purpose of global relevance. The capital cost differential was adjusted to account for 10 years at an escalation rate of 2% per year for BD3.
Due to the nature of the estimates provided herein and the system design, both projects include an SO2 abatement system that is difficult to extricate from the overall project costs. It is worthy to note that the BD3 system produces a sulfuric acid byproduct that is saleable, while the wet limestone FGD at Shand would require the purchase of limestone as a consumable.
In order to account for a less efficient heat integration at the proposed Shand facility, which was part of the efforts to significantly reduce estimated capital costs, the loss in power generated, or the power production penalty due to capture operation was accounted for and converted to a cost value by forcing the project to “purchase” this power loss using an non-escalated estimate of the LCOE from an NGCC plant. This methodology would

77
be consistent with a system that is experiencing an expansion in electrical power demand, which is the situation in southeastern Saskatchewan.
The capital cost of the Shand facility has been projected to be 67% lower than the BD3 facility on a dollar per tonne of CO2 basis. This estimate has compensated for the lost energy penalty difference between the two projects. It is worthy to note that factors such as scale, modularization, simplifications and other lessons learned as a result of building and operating the BD3 facility contributed directly to the cost reductions realized in this estimate.
The capital cost of the Shand facility has been
projected to be 67% lower than the BD3 facility on
a dollar per tonne of CO2 basis.
Figure 8.2 Cost reduction of the Shand second-generation CCS facility compared with the BD3 project
8.3.3 Determining the Levelized Cost of Capture
Factors considered in the calculation of the levelized cost of capture included: capture island capital costs, capture island OM&A and consumables costs, the cost of modifications to the power island, and the cost of the power production penalty. Construction of the capture island was given a start date of 2020, while it
was assumed that commissioning would be completed by the end of 2023. CO2 capture operation was to commence at the beginning of 2024. A 30-year life span was assumed for the project. Data were projected up until the end of 2054.

I N T E R N A T I O N A L C C S K N O W L E D G E C E N T R E T H E S H A N D C C S F E A S I B I L I T Y S T U D Y P U B L I C R E P O R T
The net present value (NPV) methodology was used to calculate the levelized cost per tonne of CO2 captured (Equation 8.2).
Where the present value (PV) was calculated using:
Where the present value (PV) was calculated using:
Table 8.5 Data used to calculate the levelized cost of capture
The overall cost for Shand CCS was determined to be approximately $45 USD/tonne of CO2, and by necessity, included the costs related to SO2 abatement. Costs have been attributed to four major cost categories (see
Figure 8.3): capture facility capital costs, OM&A and consumable costs, cost of electricity lost, and cost of limestone.

79
Figure 8.3 Break down of LCOC for Shand CCS

Chapter 9. Regulations Compliance and CCS Drivers

81
The primary driver for completing a CCS project is to reduce the emissions of greenhouse gases that are the leading cause of climate change. The regulatory mechanisms to encourage this transition to lower emissions are varied throughout the world, but the underlying motivation remains the same. In Canada, where this project would take place, there are many policies that encourage the use of CCS. These include a federal government initiative to introduce a broad carbon tax that would increase over time reaching $50/tonne by 2022 and a specific initiative targeted at eliminating coal-fired power plants that aren’t equipped with CCS once they reach 50 years of age.
Regulations for natural gas power generation are based on meeting the emission intensity of commercially-available NGCC power plants. There is some evidence that these plants may not reach the end of their economic lifespan before a requirement to reduce the
associated CO2 emissions is put into place, either by lowering the dispatch of the facility, or by the addition of CCS. In the short term, regulatory certainty and low commodity prices for natural gas, make transition from coal-fired generation to natural gas a simple means of mitigating climate change in a palatable manner.
To date, the production of CO2 for beneficial re-use has been the most effective driver for CCS projects, especially in North America. It was a major component of the business case for both the BD3 and Petra Nova CCS projects. While the additional oil production that results from injection of CO2 into an oil field, as explored in Chapter 6, has driven many projects, in Saskatchewan the EOR royalty / tax regime provides an additional incentive. Royalty relief is available until the capital cost of an EOR project is recovered, which could span a decade or two.
9.1 Introduction
The Reduction of Carbon Dioxide Emissions from Coal-fired Generation of Electricity Regulations set a fixed performance standard of 420 tonnes of carbon dioxide per gigawatt hour (tonnes of CO2/GWh or t/GWh) for new coal-fired electricity generation units and units that have reached the end of their useful life. Advances in High Efficiency Low Emission (HELE) coal-fired power plants, which are under construction in various parts of the world, have significantly lower emissions than the subcritical plants operated in Saskatchewan. However, there is no technology other than CCS that will enable any coal-fired power plant to meet the 420t/GWh emission target. The aim of these regulations is to implement a permanent shift to lower- or non-emitting types of generation, including CCS. Some noteworthy elements of the regulations on coal-fired electricity generation include:
a. Units commissioned before the beginning of 1975 will reach their end-of-life after 50 years of operation or at the end of 2019, whichever comes earlier.
b. Units commissioned after the end of 1974 but before the beginning of 1986 will reach their end-
of-life on December 31st of 2029 or on December 31st of the 50th year that follows commissioning date, whichever comes first.
c. Units commissioned in or after 1986 will reach their end-of-life on December 31st of the 50th year that follows commissioning date.
d. New and old units would be permitted to apply for a temporary deferral until January 1, 2025 from the application of the performance standard if technology for CCS is incorporated using “system to be built” provisions in the regulations. Units that are granted this deferral must meet a number of regulated implementation/construction milestones and submit implementation reports on progress made with respect to those milestones as outlined below.
e. Existing units that employ CCS technology before the date required to meet the performance standard will be able to transfer a two-year deferral from the performance standard to old units in recognition of early action.
f. Under a twenty-four month exemption provision, a
9.2 Canadian Federal Regulatory Drivers for CCS

I N T E R N A T I O N A L C C S K N O W L E D G E C E N T R E T H E S H A N D C C S F E A S I B I L I T Y S T U D Y P U B L I C R E P O R T
unit may swap its performance standard compliance obligation with another unit provided both units have the same owner and are of similar size.
g. Through the substitution provision, existing units that permanently shut down or meet the performance standard early can transfer a deferral to an old unit.
In order to meet the requirement for temporary deferral of regulations, the Knowledge Centre’s proposed early conversion schedule would be required, and the following provisions would have to be met:
a. Complete a Front-End Engineering and Design Study by January 1, 2020;
b. Purchase all major pieces of capture element of the CCS system by January 1, 2021;
c. Take all necessary steps to obtain regulatory approvals for the capture element of the CCS system by January 1, 2022;
d. Have contracts in place concerning the transportation and storage of CO2 by January 1, 2022; and
e. Begin commissioning stage of CCS system including the capture, transport and storage of CO2 by January 1, 2024
9.3 Equivalency Agreements
Provincially developed regulations for coal can be solely applied if both the provincial and federal governments agree they are equivalent. An Equivalency Agreement can be considered to avoid duplicative regulatory burden if provincial regulations serve the same purpose and have the same effect as federal regulations. Such agreements are not common and take time to be negotiated. An agreement-in-principle for equivalency between Saskatchewan and Canada exists, but the
final agreement is still outstanding. Equivalency may be satisfied by balancing out the total emissions of all coal plants within a jurisdiction to satisfy regulations. The impact of emissions stem beyond individual plants, and individual jurisdictions; the balancing of emissions to meet regulatory requirements across a system therefore has greater benefits than a regulation targeted to specific units.
The federal regulations comment, in particular, on the future of coal fired electrical generation in Saskatchewan by stating:
“two coal-fired generating units are expected to retire in 2020 [BD4 and BD5], another in 2028 [BD6], and two more in 2030 [Poplar River units 1 and 2]. The remaining unit, with a capacity of 276 MW [Shand] is expected to retire in 2043. Most of the electricity generated by the coal units retiring before 2030 is expected to be generated by a new natural gas-fired generating unit that would begin operating in 2020” [2].
The provisions were later revised to indicate that coal fired power stations must be retired at 50 years of life or by 2030, whichever comes first. This significantly reduces the life span of Shand, therefore negatively impacting the value of the plant.
In order to enable maximum flexibility, the Shand CCS early conversion project would have a final investment decision (FID) made and the associated Front End Engineering Design (FEED) study approved by the owner within a time period that would permit meeting the requirement for a temporary deferral as outlined above.

Chapter 10. Environmental Impact Comparison of CCS

I N T E R N A T I O N A L C C S K N O W L E D G E C E N T R E T H E S H A N D C C S F E A S I B I L I T Y S T U D Y P U B L I C R E P O R T
10.1 Introduction
Power generation choices are heavily impacted by the local circumstances. In Saskatchewan, where this plant is located, several factors impact the choices available for low emission power generation. Power demand in Saskatchewan is too small to support the large commercially-available, nuclear power plants due to their typical 1,000+ MW capacity, which is quite simply too high to appropriately match the total power demand in the region. Small, modular, nuclear power facilities could be a promising alternative, but are still several years from technology readiness and commercial availability. The best hydroelectric resources have been developed and only limited and very costly resources remain to be developed. Flat regional topography is well suited for wind and photo-voltaic (PV) solar power, however, these sources of power are intermittent and must be part of a system that includes very large amounts of dispatchable generation that can provide electricity when the wind is not blowing, and the sun is not shining. The seasonal variation that is associated with a northern latitude paired with the variations in ambient temperature of a continental climate impact the effectiveness of renewable generation options.
Locally, there are significant quantities of low-quality, lignite coal, that have historically provided a low-cost source of electricity in Saskatchewan. Concerns about climate change and the need to reduce greenhouse
gas emissions has led to the demonstration project on Boundary Dam Unit 3 and to investment in gas generation which has lower emissions than coal generation. A majority of the natural gas is imported from plentiful supplies in Alberta and Northern BC. Natural gas generation is becoming an increasingly large part of electricity supply and costs for Saskatchewan electricity, however, a risk from this remains. Although gas prices have been low in the past recent years, historical experience has shown gas pricing to be volatile in nature - gas prices have been considerably higher in the past. The import of some hydroelectric power from neighboring Manitoba, is possible and SaskPower has been negotiating import contracts. The amount of hydro imports is expected to be limited and will not displace the need for most electricity to be produced within Saskatchewan. Importing of fuel or electricity creates a negative shift in the interprovincial trade balance.
Based on these factors, and the prevailing regulatory landscape as discussed in Chapter 9, SaskPower’s generation plans calls for up to 50% renewable generation by 2030 supported by a series of new natural-gas, combined-cycle (NGCC) power plants. Increased power load due to provincial population and industrial growth, combined with retirement of the existing generation of power plants, will be served by the addition of new NGCC power plants.
While there may be benefits related to beneficial re-use of CO2, or preservation of value in existing infrastructure, the ultimate goal of CCS is to reduce the emission intensity of anthropogenic activity. Consequently, it is important to compare the net impact of a proposed CCS installation with other low emission alternatives. In this comparison, guidance from the IEA 2DS scenario, which calls for emissions from the power sector to decrease from a projected 40Gt CO2 in 2060 to less than 10Gt, or a 75% reduction, is useful. In late 2015, nations met at COP21 to sign the Paris Agreement which committed all signatories to anthropogenic GHG reductions that would assure a global average temperature of well below 2°C above pre-industrial levels by the end of the
21st century. Signatory nations were responsible for more than 55% of global anthropogenic GHG emissions. The Agreement came into force in November 2016. This target is consistent with the IEA2DS scenario that requires the elimination of emissions from the power generation sector.
While the discussion that follows is based on the specifics of implementing CCS in Saskatchewan, the same driving factors that resulted in a predominantly thermal power fleet in Saskatchewan are paralleled at many utilities throughout the world. This section compares the emission intensity impact of the options for Shand CCS compared to the alternatives.
10.2 Power Generation Options
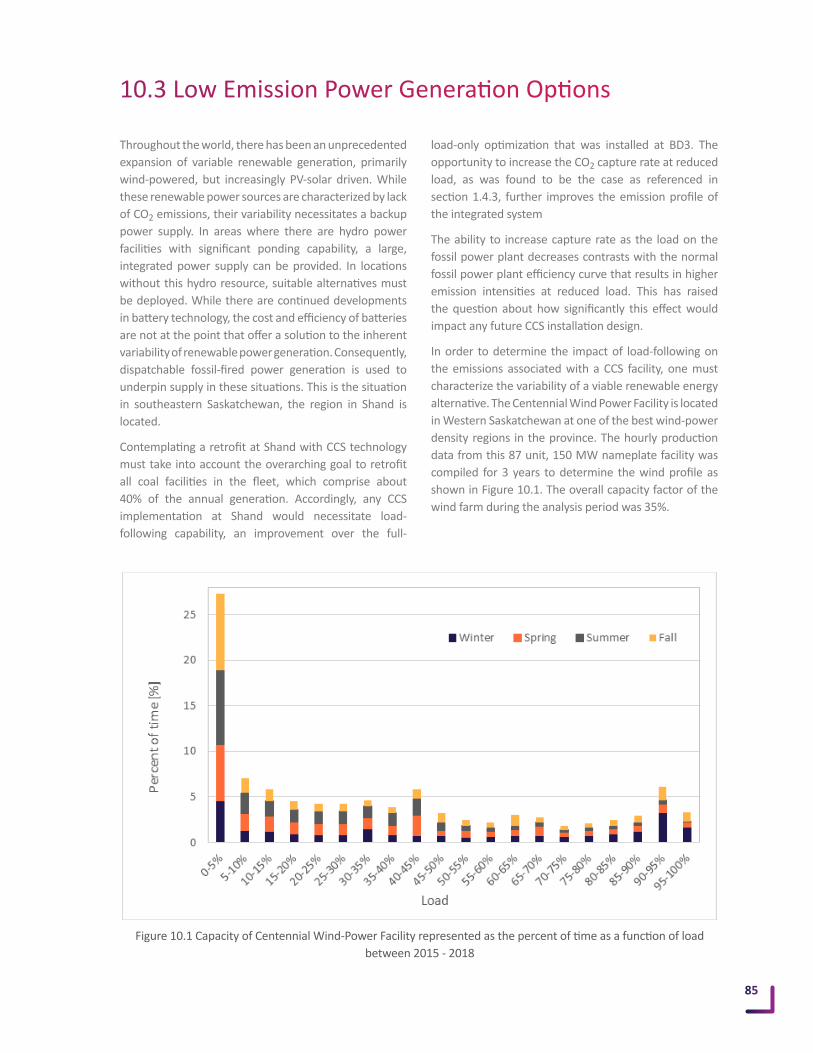
85
Throughout the world, there has been an unprecedented expansion of variable renewable generation, primarily wind-powered, but increasingly PV-solar driven. While these renewable power sources are characterized by lack of CO2 emissions, their variability necessitates a backup power supply. In areas where there are hydro power facilities with significant ponding capability, a large, integrated power supply can be provided. In locations without this hydro resource, suitable alternatives must be deployed. While there are continued developments in battery technology, the cost and efficiency of batteries are not at the point that offer a solution to the inherent variability of renewable power generation. Consequently, dispatchable fossil-fired power generation is used to underpin supply in these situations. This is the situation in southeastern Saskatchewan, the region in Shand is located.
Contemplating a retrofit at Shand with CCS technology must take into account the overarching goal to retrofit all coal facilities in the fleet, which comprise about 40% of the annual generation. Accordingly, any CCS implementation at Shand would necessitate load-following capability, an improvement over the full-
load-only optimization that was installed at BD3. The opportunity to increase the CO2 capture rate at reduced load, as was found to be the case as referenced in section 1.4.3, further improves the emission profile of the integrated system
The ability to increase capture rate as the load on the fossil power plant decreases contrasts with the normal fossil power plant efficiency curve that results in higher emission intensities at reduced load. This has raised the question about how significantly this effect would impact any future CCS installation design.
In order to determine the impact of load-following on the emissions associated with a CCS facility, one must characterize the variability of a viable renewable energy alternative. The Centennial Wind Power Facility is located in Western Saskatchewan at one of the best wind-power density regions in the province. The hourly production data from this 87 unit, 150 MW nameplate facility was compiled for 3 years to determine the wind profile as shown in Figure 10.1. The overall capacity factor of the wind farm during the analysis period was 35%.
10.3 Low Emission Power Generation Options
Figure 10.1 Capacity of Centennial Wind-Power Facility represented as the percent of time as a function of load between 2015 - 2018

I N T E R N A T I O N A L C C S K N O W L E D G E C E N T R E T H E S H A N D C C S F E A S I B I L I T Y S T U D Y P U B L I C R E P O R T
10.4 Characterizing NGCC as Backup Power for Variable Renewable GenerationPower utilities preferentially dispatch their lowest-cost, highest-efficiency generators to cover as much of the load as possible. High-cost generators are the first units used to reduce load when variable renewable power generation supply is available. However, as more wind is added to a system, progressively lower-cost units are dispatched to meet demand. Given the levels of wind generation that are planned in Saskatchewan, load following will be of value for all power generators in the system.
The Shand CCS conversion is compared to a new NGCC plant which would be the most likely generation source choice should a CCS installation not be implemented.
For the case where a new natural gas combined cycle plant serves as the backup energy source, a GT Pro model of a GE 7F.04 coupled to a HRSG and Steam turbine was developed and evaluated for its efficiency and emissions intensity over its usable load range. The emission intensity of the reference NGCC plant is shown in Figure 10.2
Figure 10.2 Emission intensity of modern NGCC plant as a function of load
10.5 Characterizing Shand CCS as Backup Power for Variable Renewable Generation
As outlined in Chapter 7, the system envisioned for Shand, has the ability to increase the CO2 capture rate at decreased load.
Coal fired power plants have the ability to sell fly ash as a beneficial byproduct. With the retirement of the LIFAC system, the fly ash is now of a quality that can

87
be used for concrete mixes. The low quality, high ash, fuel burned at Shand contributes to the production of 140,000 tonnes per year of fly ash that is now sold for the concrete market. This created a valuable revenue stream that, along with the historical poor performance of the system, was used as justification for the changes to the SO2 abatement plan in the area.
In addition to the direct revenue stream, there is also a valuable environmental impact. Although not universally recognized, the sale of fly ash for concrete use is a carbon offset when compared to the emissions associated with
producing cement. While numbers vary on the impact, if an effective rate of 0.9 tons of CO2 reduction per ton of fly ash is used, this translates into a carbon reduction offset of 78 t/GWh at full load [5].
The impact of dispatched load on the emission intensity, and the carbon credits that result from fly ash sales is shown in Figure 10.3. It is noteworthy that carbon credits from fly ash sales are not universally recognized, even though the sale of fly ash for concrete use is itself a carbon offset when compared to the emissions associated with producing cement.
Figure 10.3 Emission intensity of the Shand CCS unit as a function of load
10.6 A Case for Selecting a 95% Carbon Capture Rate
The investigation of increased capture at reduced loads provides the opportunity to design a base carbon capture rate of 95% at Shand CCS rather than the 90% capture rate of its predecessor. A 95% carbon capture facility would reduce the average emission intensity while increasing the potential revenue from CO2 sales and other associated credits.
A 95% carbon capture rate is achievable using the KM CDR ProcessTM. MHI and MHPS completed a preliminary investigation that considered the increased costs associated with the installation of a 95% capture plant.
A 95% carbon capture facility would reduce the average emission
intensity while increasing the potential revenue
from CO2 sales and other associated credits.
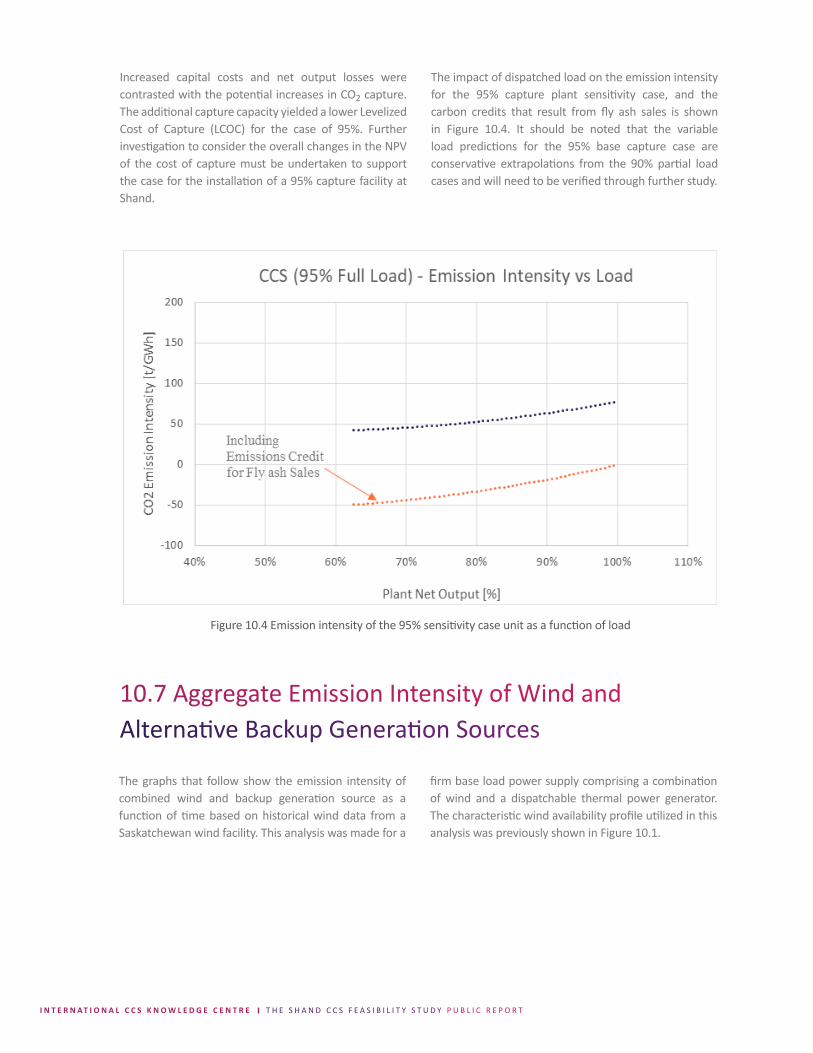
I N T E R N A T I O N A L C C S K N O W L E D G E C E N T R E T H E S H A N D C C S F E A S I B I L I T Y S T U D Y P U B L I C R E P O R T
The impact of dispatched load on the emission intensity for the 95% capture plant sensitivity case, and the carbon credits that result from fly ash sales is shown in Figure 10.4. It should be noted that the variable load predictions for the 95% base capture case are conservative extrapolations from the 90% partial load cases and will need to be verified through further study.
Figure 10.4 Emission intensity of the 95% sensitivity case unit as a function of load
10.7 Aggregate Emission Intensity of Wind and Alternative Backup Generation Sources
The graphs that follow show the emission intensity of combined wind and backup generation source as a function of time based on historical wind data from a Saskatchewan wind facility. This analysis was made for a
firm base load power supply comprising a combination of wind and a dispatchable thermal power generator. The characteristic wind availability profile utilized in this analysis was previously shown in Figure 10.1.
Increased capital costs and net output losses were contrasted with the potential increases in CO2 capture. The additional capture capacity yielded a lower Levelized Cost of Capture (LCOC) for the case of 95%. Further investigation to consider the overall changes in the NPV of the cost of capture must be undertaken to support the case for the installation of a 95% capture facility at Shand.

89
Figure 10.5 Emission intensity of NGCC and win
From the graph above it is apparent that the emission intensity of the NGCC plant deteriorates slightly as the NGCC load (blue area height) decreases. The combined emission intensity of the system ranges from the no wind condition at 350 t/GWh, to 200 t/GWh when wind is at its maximum. Based on the historical operating profile for the wind, the aggregate emission intensity is less than 300 t/GWh.
It is worthwhile noting that the NGCC plant has a usable normal dispatch operating range of 49-100% (corresponding to a 56% to 100% fuel flow), while the comparable coal CCS unit has an operating range of 63-100% load (corresponding to a 73-100% fuel flow due to the higher energy penalty during over-capture). To account for this, the NGCC plant option is paired with a larger wind source in order to provide a fair representation.
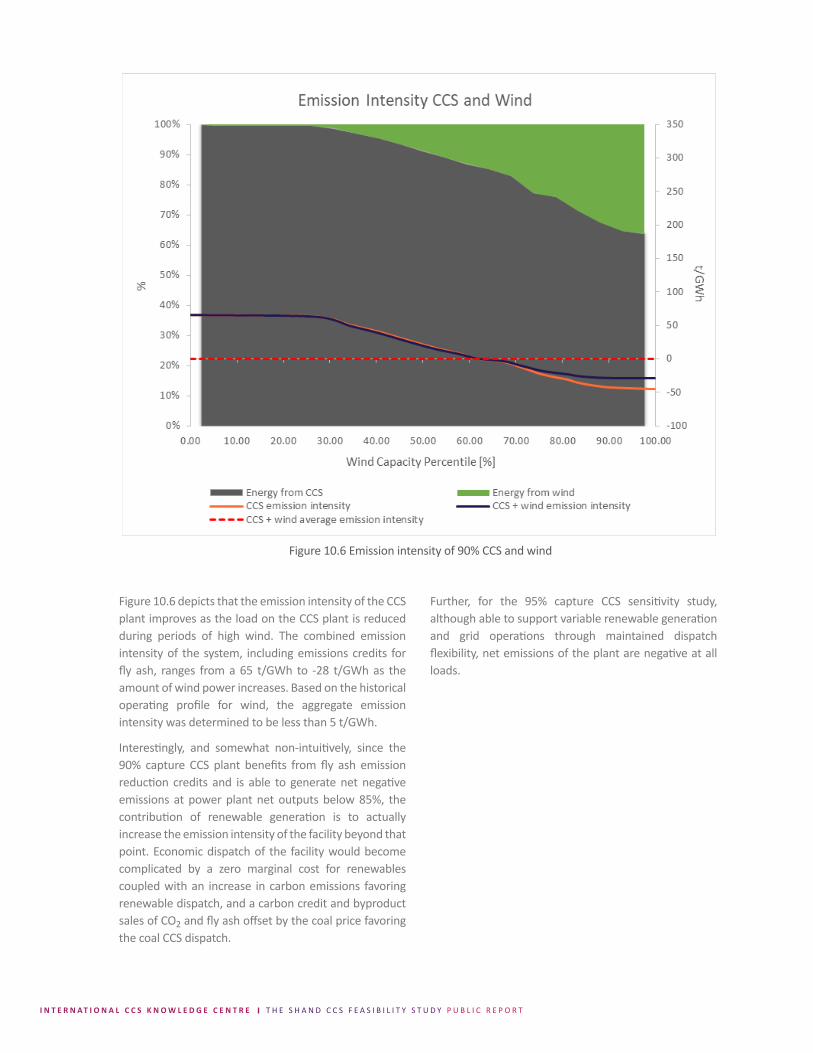
I N T E R N A T I O N A L C C S K N O W L E D G E C E N T R E T H E S H A N D C C S F E A S I B I L I T Y S T U D Y P U B L I C R E P O R T
Figure 10.6 Emission intensity of 90% CCS and wind
Figure 10.6 depicts that the emission intensity of the CCS plant improves as the load on the CCS plant is reduced during periods of high wind. The combined emission intensity of the system, including emissions credits for fly ash, ranges from a 65 t/GWh to -28 t/GWh as the amount of wind power increases. Based on the historical operating profile for wind, the aggregate emission intensity was determined to be less than 5 t/GWh.
Interestingly, and somewhat non-intuitively, since the 90% capture CCS plant benefits from fly ash emission reduction credits and is able to generate net negative emissions at power plant net outputs below 85%, the contribution of renewable generation is to actually increase the emission intensity of the facility beyond that point. Economic dispatch of the facility would become complicated by a zero marginal cost for renewables coupled with an increase in carbon emissions favoring renewable dispatch, and a carbon credit and byproduct sales of CO2 and fly ash offset by the coal price favoring the coal CCS dispatch.
Further, for the 95% capture CCS sensitivity study, although able to support variable renewable generation and grid operations through maintained dispatch flexibility, net emissions of the plant are negative at all loads.

91
The preceding section concludes that CCS on a coal fired power plant, aided by emissions credits for selling valuable byproducts, and integrating with variable renewable generation sources can combine to create emission intensities that can range from slightly positive to slightly negative and are lower than NGCC as a support for renewables. There appears to be significant
merit in selecting capture rates above 90%, however the determination of the appropriate design capture rate would need to be explored fully in the FEED study.
A carbon-neutral coal fired power plant is clearly within reach.
10.8 Capture Rate Selection
A carbon-neutral coal- fired power plant is clearly
within reach.

Chapter 11. Proposed Project Implementation

93
The contents of this chapter outline an implementation strategy and FEED deliverables for the CCS retrofit portion at a coal power plant. The discussion will be with respect to Shand which is the case analyzed in this report, but the process is applicable to a decision to be made to retrofit CCS on any coal plant. Prior to proceeding with this work, it would be necessary to do a business feasibility study of installing CCS at a coal power plant that showed it would likely be cost effective relative to the alternative options.
While several project structures have been considered, for the purpose of this public report, the scenario of a third party owner of the CO2 capture facility has been used. It is possible that a consortium of companies with an interest in accessing CO2 EOR opportunities could finance and deliver such a project. This could have many parallels to the business structure that was used for the Petra-Nova project. For the purpose of this study, the Knowledge Centre has assumed that the over-arching goal is to maximize oil production, and as such, a final scenario where capture facilities are installed at all four of the provinces 300MW units and are all connected by a carbon trunk-line, similar to Alberta, is envisaged.
In order to meet the emission performance standard that would allow continued operation of the Shand power unit, a CCS retrofit would be required to be in operation
in 2029. This points to a project final investment decision as late as 2024/2025. Alternatively, a business case might be justifiable for an earlier conversion of the plant to CCS based on potential additional revenue streams which could include byproduct sales or avoidance of a carbon tax, additional flexibility on the regulatory impacts to the operation of other units in the generation fleet, and other considerations as are explored in this study. Under the direction of the International CCS Knowledge Centre whose mandate it is the accelerate the deployment of CCS, this study is based solely on this “Early Conversion” (EC) option for Shand.
In order to de-risk the early conversion opportunity, a development budget and 18 months would be required. A Front End Engineering Design (FEED) for the capture facility itself would be executed to de-risk the process and allow a budget and provisional contracts to be put in place to support a Final Investment Decision (FID) as early as July 2020. The balance of the funds would be spent completing the FEED studies for the target oil fields infrastructure and associated development, pipeline infrastructure, designing and pricing of an expanded deep saline storage facility, completing production trials, as well as permitting and public engagement activities that are beyond the scope of this report.
11.1 Introduction
Table 11.1 Summary of FEED

I N T E R N A T I O N A L C C S K N O W L E D G E C E N T R E T H E S H A N D C C S F E A S I B I L I T Y S T U D Y P U B L I C R E P O R T
11.2 Proposed Project Schedule
For the Shand early conversion timeline, power plant modifications could be completed as an extension to a planned maintenance outage on the unit. This may be an option at other relatively new coal facilities. For older coal facilities such as Boundary Dam Unit 3, it may be desirable to undertake a major rebuild which will require additional downtime. At the end of this outage, all facilities that are required to integrate with the capture facility would be installed with appropriate isolations to allow termination of interconnections with the capture facility. This includes modifications to the turbine and feed heating plant, as outlined in Chapter 2, installation of the flue gas diverter and isolation dampers as outlined in Chapter 3, tie-in with the existing open cooling water system as described in Chapter 5, as well as the installation of switchyard isolation equipment to
allow for the medium voltage supply feed to the capture facility.
The critical path for this outage would be dictated by the turbine modifications, which at an estimated duration of 65 days, will require a 37-day extension to the outage in April of 2022 for Shand.
A critical project schedule component would be ensuring that the required turbine rotor forging, which can require up to 3 years lead-time, can be secured. Based on the 22 month gap between FID and the power plant outage, a provisional contract would be required for the turbine which includes cancelation for convenience provisions. The incurred cost for this contract at the FID date is accounted for as part of the FEED budget.
The early conversion project would take place as two major scopes of work; capture facility build and power plant modifications. Construction of the capture facility would be executed as a large multi-year construction project. Modifications to the power plant would
be executed as an extension to an existing planned shutdown, and would have to fit into a tight timeline with significant pressure to return the power unit to service.
11.2.1 Power Plant Modifications
11.2.2 Capture Facility Construction
MHI has indicated a 36-month construction period is required for the capture system, which would be the critical path for the capture plant construction. Construction on the capture island and related facilities would begin seven months after EPC commencement. Under the Knowledge Centre’s early conversion plan, the capture system would be operational by July 2023 and commercial by early 2024. Further evaluations of the required time for construction would be evaluated during the FEED study to confirm the 36-month timeline.
The capture facility would be housed in a separate detached building located to the North West of Shand Power Station. All parts of the facility would be enclosed within the building save for the flue gas quencher, CO2
absorber and regenerator vessels which would extend above the building roof and be fitted with heat tracing.
Modularization is key in construction related cost savings. Having large sections of the capture facility built off site as modules would minimize onsite construction equating to significant cost savings. MHI worked with contractors for construction estimates for the capture facility and the wet limestone FGD. Modularization of the capture facility’s items was also determined by the contractors to have a weight limit of 140,000kg per module. This was determined sufficient for this level of study. All heat exchangers and pumps within the modules would be installed on steel and fitted with all necessary plumbing in the factory.

95
MHI consulted with a local fabricator for construction of the CO2 absorber and quencher. Larger module sizes would be considered during a FEED study for added savings resulting from less modules. Alternate routing
and/or route reinforcement would also be evaluated during the FEED to reduce the number of modules and increasing cost savings by limiting construction time on site.
11.3 Contract Strategy
A successful implementation of a CCS retrofit at Shand would provide an example of how to implement CCS at other coal units. One of the challenges is to develop a contracting strategy that isolates the process risks from the construction risks and allocates risk to the party who could manage the risk in the most cost-effective manner.
One approach would be to focus on proven technology and to ensure that the technology provider has the organizational depth to deal with technical challenges. This is one of the advantages that a provider such as MHI has with their substantial experience installing CO2 capture on industrial facilities, including coal fired power plants. Rather than look for a range of bids, a choice could be made to focus on a sole source technology provider such as MHI. The advantage of this would be the ability to work in partnership with the technology provider throughout the project. For example, the choice of MHI at the beginning of the FEED study provides the opportunity to do extensive testing of emission and amine maintenance costs for the MHI technology on the 120 tpd Carbon Capture Test Facility (CCTF)already located at Shand.
Construction risk could be mitigated, by employing a standard design based on extensive use of modularization. Experience gained with each new CCS plant built would allow subsequent facilities to be built with lower cost and less risk. While this feasibility study was based on significant modularization in Edmonton, AB., the cost of transport, transport bridge restrictions, and desire for provincial employment may make a location closer to the project site more feasible.
In order to control the quality and operability of the facility, the capture facility could be engineered, and equipment procured in a partnership between an engineering contractor and the technology provider such as MHI. Construction would be based on modular fabrication and construction contracts. Consideration would be given to executing extendable contracts for the supply of major components to control price inflation and ensure commonality of equipment on successive potential builds. For Shand or any facility, a design model which maximizes early contractor involvement with multiple bidders for work on components should be pursued.
11.4 FEED Study Deliverables
The completion of the FEED study would support the Final Investment Decisions (FID) by producing:
• capital cost estimate
• a package of main executable contracts for the project
• secured forgings for the turbine modifications
• complete operating budget
• staffing and transition to operations plan
• environmental assessment
• construction permit, and
• preliminary hazard and operability review results
The FEED would validate certain concepts introduced in the feasibility study and expand on others. Pilot testing of MHI’s KS-1 solvent at the CCTF has also been proposed as a component of the FEED.

I N T E R N A T I O N A L C C S K N O W L E D G E C E N T R E T H E S H A N D C C S F E A S I B I L I T Y S T U D Y P U B L I C R E P O R T
Concepts introduced during the feasibility phase would require additional study and verification. The following
items have been proposed to be included in a FEED study:
Pilot testing of KS-1 would be completed at the CCTF to compliment the FEED study. The aims of this testing would include 1) verifying amine emissions from the top of absorber and 2) verifying amine consumption.
The capture rate or steam consumption would not be investigated as the CCTF’s sizing and configuration is not optimized for the KM CDR ProcessTM. Various
modifications to the CCTF would be required in order to complete this testing. It is important to realize the risk mitigation benefits of a CCTF pilot test. The flue gas at the CCTF is sourced directly from Shand. Favorable performance of KS-1 at the CCTF would greatly favor a CCS retrofit of Shand using the KS-1 solvent with the KM CDR ProcessTM.
11.4.1 CCTF Pilot Testing of MHI’s Proprietary KS-1 Solvent
Design parameters of this study included a capture rate of 90%. However, a 95% capture rate is desirable. Preliminary investigations by MHI and MHPS indicated this is possible.
Corresponding GateCycleTM modelling has indicated an overall decrease in gross output of 4 MW for this additional energy requirement. Furthermore, the
additional capture capacity would require increased capacity in the regenerator column.
Increases in capital costs to accommodate 95% capture were projected. The increase in capital costs resulting from increased capture capacity would be further analyzed in the FEED study.
11.4.2 Proposed FEED Study Investigations
11.4.2.1 Refine Steam Cycle Integration and Heat Balances
The heat balances produced by MHPS for this study were centered around optimizing the steam extraction to the capture facility. These heat balances assumed complete by pass of LP FWHs 1 and 2. The concept of allowing a 5% duty on LP FHWs 1 an 2 was established
later in the study and modelled using GateCyleTM only. Both models (MHPS’s heat balances and GateCylceTM) were used for distinct aspects of this report. A new set of heat balances verifying the 5% duty on LP FWHs 1 and 2 would be requested from MHPS.
11.4.2.2 Capture Rate at 95%

97
Increased Steam Input
Due to turbine degradation the power plant’s current heat rate is higher than the design heat rate. Turbine degradation is compensated for by increasing the firing rate of the boiler to produce more steam. The proposed turbine modifications to accommodate CCS would also repair turbine degradation; this when combined with the proven increase capacity of the boiler would increase the output of the plant. This increase should be studied and quantified by the Knowledge Centre and MHPS. An updated heat balance would be requested from MHPS.
DEA Replacement
Current modifications to the feed heating system include a new DEA with increased operating pressure and temperature. This would increase costs as expensive construction materials would be used to manufacture the new DEA. To avoid such costs, a desuperheater could be configured between the extraction point of the IP and the new DEA. This modification could also decrease the extent of physical modifications to the feed heating system and associated labour costs.
11.4.2.3 FGD Material Selection
MHI and MHPS have indicated savings in capital costs would be possible if the FGD could be constructed with lower grade alloy. Flue gas analysis would be required
to confirm sufficiently low chlorides concentration. MHI has requested additional flue gas testing to aid in FGD material selection.
11.4.2.4 Power Plant Modifications
11.4.2.5 Waste Disposal
Gypsum
Gypsum is produced as a byproduct from the FGD. Currently, the gypsum slurry is dewatered and stored in a silo in the gypsum handling building provided in MHI’s scope before being transported by truck to the ash pile for disposal. To avoid trucking costs and to provide a more integrated solution, the gypsum waste stream should be interconnected to the bottom ash disposal system using a conveyer belt. Location of the gypsum slurry dewatering system would also be optimized in this evaluation.
Amine Waste
Reclaimer waste would be contaminated with amine. Due to Shand ZLD status this waste must be dealt with. For this study amine contaminated reclaimer waste would be disposed of by deep well injection. A more integrated and permanent solution to handle this waste would be evaluated.
Triethylene Glycol
The dehydration system produces a 5% TEG waste stream. For this study all TEG waste is concentrated and transported by truck for offsite disposal. A more integrated and permanent solution to handle this waste would be evaluated.

I N T E R N A T I O N A L C C S K N O W L E D G E C E N T R E T H E S H A N D C C S F E A S I B I L I T Y S T U D Y P U B L I C R E P O R T
Combine Caustic Sources
Caustic (NaOH) is used in many areas in the plant. The CO2 capture plant and heat rejection system would require additional caustic supply. For the capture process MHI has included a caustic tank in their scope. Stantec has also indicated that the caustic skid used for heat rejection system would require a tank sized for 15 days storage (12’ x 10’ 6” for 7,000 gallon storage or 26.5 m3). These two sources of caustic should be tied into a single source.
Reconfigure FGC Wash Water Stream
In the currently propose water balance, FGC wash water would be pH adjusted (from 4 to 6) and sent to the FGD for makeup requirements. To avoid this pH adjustment and save costs on caustic, water with a higher pH could be sourced from the raw water or soft water pond and used for FGD makeup. The FGC wash water could be sent directly to blowdown pond. The lower pH of the FGC wash water would help lower the acid requirement needed for blowdown pond water conditioning before it enters the VCEs.
Water Treatment Plant
An investigation should be carried out to determine if additional capacity is required in the VCEs and softener.
Cooling Tower vs WSAC
An investigation into replacing the WSAC in the new hybrid heat rejection system with a cooling tower for dry cooling should be carried out. If the substitution is probable, cost savings are expected.
Optimizing the CPH Loop
Sizing of the components in the CPH loop would be verified in the FEED. Current modelling indicates that the FGC is slightly oversized since a minimal duty is present on the trim cooler at design case conditions (FGC inlet temperature of 175oC). Duty on the trim cooler during average conditions is not ideal; this indicates that a portion of the recovered heat is simply rejected into the trim cooler. These two components were originally sized by doubling the dimensions of the equivalent BD3 components. Sizing of the FGC and trim cooler should only be optimized to maximize heat utilization at average conditions.
11.4.2.6 Heat Rejection and Water Management

99
Works Cited 1. Baxter, D. SaskPower not moving ahead with further carbon capture projects at Boundary Dam 4 and 5. Global
News. 2018, July 9.
2. Canadian Environmental Protection Act, 1999. Regulations Limiting Carbon Dioxide Emissions from Natural Gas-fired Generation of Electricity. Canada Gazette Part I, Vol. 152, No. 7. Web. February 17, 2018.
3. Jensen, G.K.S. Assessing the potential for CO2 enhanced oil recovery and storage in depleted oil pools in southeastern Saskatchewan; in Summary of Investigations 2015, Volume 1, Saskatchewan Geological Survey, Saskatchewan Ministry of the Economy, Paper A-5, 7p; 2015.
4. Langenegger, S. SaskPower spending more to capture carbon than expected. CBC News. 2016, December 14.
5. Vargas J, Halog A, Effective Carbon Emission Reductions from Using Upgraded Fly Ash in the Cement Industry, Journal of Cleaner Production; 2015.
6. Saskatchewan Ministry of the Economy (2013): 2013 Oil Reserve Summary Report; Saskatchewan Ministry of the Economy, Resource Management Branch. http://publications.gov.sk.ca/details.cfm?p=4705
7. Government of Canada - National Energy Board. (2018, August). Provincial and Territorial Energy Profiles. Retrieved from https://www.neb-one.gc.ca/nrg/ntgrtd/mrkt/nrgsstmprfls/cda-eng.html

I N T E R N A T I O N A L C C S K N O W L E D G E C E N T R E T H E S H A N D C C S F E A S I B I L I T Y S T U D Y P U B L I C R E P O R T
Experience-Based Decision Making

101Carbon Capture Test Facility and Shand Power Station

The Shand CCS Feasibility Study Public ReportN O V E M B E R 2 0 1 8
ccsknowledge.com