Conceptualization of CO2 Terminal for Offshore CCS Using ...
18
energies Article Conceptualization of CO 2 Terminal for Offshore CCS Using System Engineering Process Hyonjeong Noh 1 , Kwangu Kang 1, *, Cheol Huh 2 , Seong-Gil Kang 3 , Seong Jong Han 1 and Hyungwoo Kim 1 1 Offshore Industries R&BD Center, Korea Research Institute of Ships & Ocean Engineering, Geoje 53201, Korea; [email protected] (H.N.); [email protected] (S.J.H.); [email protected] (H.K.) 2 Ocean Science & Technology School, Korea Maritime and Ocean University, Busan 49112, Korea; [email protected] 3 Global Cooperation Center, Korea Research Institute of Ships & Ocean Engineering, Daejeon 34103, Korea; [email protected] * Correspondence: [email protected] Received: 14 August 2019; Accepted: 11 November 2019; Published: 15 November 2019 Abstract: In this study, the basic configuration and operation concept of a CO 2 terminal were identified by conducting a system engineering process. The performance goal of a CO 2 terminal was determined by requirement analysis. Then, functions and timelines were derived by functional analysis to meet the performance goal. Equipment to perform the functions were defined and finally, a process flow block diagram of the CO 2 terminal was acquired. The CO 2 terminal in this study consisted of three parts. First, the CO 2 loading/unloading part is responsible for liquid CO 2 unloading from the carrier and loading vapor CO 2 onto the carrier. Secondly, the liquid CO 2 transmission part extracts liquid CO 2 from the storage tanks and increases the pressure until it satisfies the offshore pipeline transportation condition. The vapor-treatment part collects boil-off gas, generates vapor CO 2 , and charges the storage tanks with vapor CO 2 to control the pressure of the storage tanks that discharge liquid CO 2 . Finally, the study results were compared with a liquefied natural gas (LNG) terminal. The biggest difference between the CO 2 terminal in this study and the LNG terminal is that a vaporizer is essential in the CO 2 terminal due to the smaller storage capacity of the CO 2 terminal and, therefore, the lower amount of boil-off gas. Keywords: CO 2 terminal; CO 2 storage tank; system engineering process; conceptual design; CO 2 loading/unloading 1. Introduction Many efforts are underway worldwide to reduce atmospheric emissions of carbon dioxide (CO 2 ), which is a dominant cause of global warming. To limit the global temperature increase to below 2 ◦ C, the annual amount of greenhouse gas emissions should be less than approximately 14 Gt CO 2 by 2050, which is about a 60% reduction compared with the current level [1]. Countries that have a manufacturing-oriented industrial structure or rely heavily on electricity production from fossil fuels may struggle to quickly switch to a low-carbon emission structure using renewable energy. Carbon capture and storage (CCS) can be an attractive greenhouse gas reduction option for these countries [2]. CCS basically consists of three parts: (1) separating and capturing CO 2 from a large-scale emitter such as a power plant; (2) transporting CO 2 through pipelines or carriers from capture stations to storage sites; and (3) injecting and storing CO 2 into geological formations [3]. Many studies have focused on the capture and storage aspects, but few have focused on transportation [4,5]. However, interest is growing in the transportation aspect as it has been shown to be responsible for a high proportion of the costs in CCS projects [6]. Energies 2019, 12, 4350; doi:10.3390/en12224350 www.mdpi.com/journal/energies
-
Upload
khangminh22 -
Category
Documents
-
view
5 -
download
0
Transcript of Conceptualization of CO2 Terminal for Offshore CCS Using ...

energies
Article
Conceptualization of CO2 Terminal for Offshore CCSUsing System Engineering Process
Hyonjeong Noh 1, Kwangu Kang 1,*, Cheol Huh 2, Seong-Gil Kang 3, Seong Jong Han 1 andHyungwoo Kim 1
1 Offshore Industries R&BD Center, Korea Research Institute of Ships & Ocean Engineering, Geoje 53201,Korea; [email protected] (H.N.); [email protected] (S.J.H.); [email protected] (H.K.)
2 Ocean Science & Technology School, Korea Maritime and Ocean University, Busan 49112, Korea;[email protected]
3 Global Cooperation Center, Korea Research Institute of Ships & Ocean Engineering, Daejeon 34103, Korea;[email protected]
* Correspondence: [email protected]
Received: 14 August 2019; Accepted: 11 November 2019; Published: 15 November 2019�����������������
Abstract: In this study, the basic configuration and operation concept of a CO2 terminal wereidentified by conducting a system engineering process. The performance goal of a CO2 terminalwas determined by requirement analysis. Then, functions and timelines were derived by functionalanalysis to meet the performance goal. Equipment to perform the functions were defined and finally,a process flow block diagram of the CO2 terminal was acquired. The CO2 terminal in this studyconsisted of three parts. First, the CO2 loading/unloading part is responsible for liquid CO2 unloadingfrom the carrier and loading vapor CO2 onto the carrier. Secondly, the liquid CO2 transmission partextracts liquid CO2 from the storage tanks and increases the pressure until it satisfies the offshorepipeline transportation condition. The vapor-treatment part collects boil-off gas, generates vaporCO2, and charges the storage tanks with vapor CO2 to control the pressure of the storage tanks thatdischarge liquid CO2. Finally, the study results were compared with a liquefied natural gas (LNG)terminal. The biggest difference between the CO2 terminal in this study and the LNG terminal is thata vaporizer is essential in the CO2 terminal due to the smaller storage capacity of the CO2 terminaland, therefore, the lower amount of boil-off gas.
Keywords: CO2 terminal; CO2 storage tank; system engineering process; conceptual design; CO2
loading/unloading
1. Introduction
Many efforts are underway worldwide to reduce atmospheric emissions of carbon dioxide (CO2),which is a dominant cause of global warming. To limit the global temperature increase to below2 ◦C, the annual amount of greenhouse gas emissions should be less than approximately 14 Gt CO2
by 2050, which is about a 60% reduction compared with the current level [1]. Countries that have amanufacturing-oriented industrial structure or rely heavily on electricity production from fossil fuelsmay struggle to quickly switch to a low-carbon emission structure using renewable energy. Carboncapture and storage (CCS) can be an attractive greenhouse gas reduction option for these countries [2].CCS basically consists of three parts: (1) separating and capturing CO2 from a large-scale emitter suchas a power plant; (2) transporting CO2 through pipelines or carriers from capture stations to storagesites; and (3) injecting and storing CO2 into geological formations [3]. Many studies have focused onthe capture and storage aspects, but few have focused on transportation [4,5]. However, interest isgrowing in the transportation aspect as it has been shown to be responsible for a high proportion ofthe costs in CCS projects [6].
Energies 2019, 12, 4350; doi:10.3390/en12224350 www.mdpi.com/journal/energies

Energies 2019, 12, 4350 2 of 18
Between pipelines and carriers, which are the two most common methods of CO2 transportation,pipelines have been the most widely used [5]. When transporting CO2 to a pipe, a variable CO2
transportation network is required for the flexible operation of the CCS chain, which is technicallychallenging [7,8]. Considering the flexibility of CO2 carriers, however, the significance of carriersis likely to increase in the near future [9–13]. A CO2 terminal is required when multiple sourcesand storage sinks are linked or when pipelines and carriers are linked in the CCS transportationchain [14–17]. In the future, once CCS is widely distributed as a CO2 emission reduction option, thelikelihood of CCS projects using multiple sources and storage sites will be high [11]. This means thatCO2 terminals will become important facilities within the whole CCS chain that can simultaneouslycontribute to the realization of CO2 carriers as a rational CO2 transportation option.
Unfortunately, research regarding the configuration, functions, and roles of CO2 terminals hasbeen limited. Only a few studies [15,18–23] addressed CO2 terminals. It is worth mentioning theNorwegian full-scale CCS project named the Northern light project [20,22,24], which includes theconcept of CO2 terminal. The terminal is located onshore and has a role of receiving and temporarystoring of CO2 transported by a carrier. It is equipped with a vaporizer to maintain vapor and liquidCO2 balance during injection [24]. Vermeulen [15] suggested a CO2 liquid logistics shipping concept fora complex CCS chain connecting multiple CO2 emitters and storage sites. This concept uses complexCO2 terminals that can receive large amounts of CO2 through pipeline networks and barges fromvarious emitters and can send CO2 out to multiple storage sites using carriers and pipelines. However,no study has defined an overall configuration of the terminal and its operational concept. Lee et al. [21]simulated a CO2 process flow in an intermediate storage facility attached to a capture site on thecoast for loading CO2 to a carrier. The storage facility in their study consisted of a CO2 input process,a storage tank, a loading process, a recirculation process, and a boil-off gas (BOG) reliquefaction process.However, they did not clearly explain how they chose the components for the CO2 terminal. In afew studies about CO2 carrier transportation, CO2 terminals are considered part of the description ofthe CCS chain, but the research did not focus on CO2 terminals [18,19,25–27]. Several studies [28–31]focused on the direct injection of CO2 into geological formations from carriers did not consider the CO2
terminal. As such, the configuration of a CO2 terminal, reflecting its functions and roles, has rarelybeen studied. Conversely, considerable research has been conducted on liquefied natural gas (LNG)terminals [32–43], which can be thought of as similar to CO2 terminals. LNG terminals can be used indeveloping CO2 terminals, but a cautious approach is required as the transport characteristics of CO2
and LNG differ.Designing a simple system or a precedent system without systematic design processes is possible.
However, for a complex system or an unprecedented system like a CO2 terminal, it is highlyrecommended to follow a system engineering process (SEP), as shown in Figure 1.Energies 2019, 12, x FOR PEER REVIEW 3 of 19
Figure 1. The systems engineering process (SEP).
The SEP consists of (1) requirements analysis, which transforms the stakeholder’s system needs into functional requirements from an engineering point of view; (2) functional analysis and allocation, which defines what functions are to be performed; and (3) design synthesis, which determines how these functions are combined into the design [44]. The SEP is completed when this series of processes is conducted. The strength of SEP during the concept development stage is that necessary functions are reflected, whereas unnecessary functions are removed in advance.
In this study, the conceptual design of a CO2 terminal was structurally and systematically developed using the SEP. Our conceptual design focuses on the configuration and basic operation concept of a CO2 terminal. In the requirement analysis (Figure 1), a CCS chain was analyzed to derive the goal and performance objectives of a CO2 terminal. For requirement analysis, specific conditions of the CCS demonstration project promoted in Korea were applied. Then, the functions were derived to meet the goal and performance objectives of the CO2 terminal using functional analyses. Several functional analyses were conducted to define the top-level functions and their basic operational concepts. Design synthesis was performed to determine the equipment that corresponds to each function. Based on the SEP, a process flow block diagram of the CO2 terminal was finally suggested that explicitly depicts the configuration of the CO2 terminal.
2. Description of CCS Chain
CO2 terminals have various forms depending on the connection methods between capture and storage sites [15]. Since the objective of this study was to demonstrate the basic configuration and operation concept of a CO2 terminal, a relatively simple form of a CCS chain was selected as a target system (Figure 2a). The concept of a CCS chain displayed in Figure 2 is identical to the 1-million-ton-scale demonstration project in Korea. This CCS chain liquefies captured CO2 at a thermal power plant located on the coast, and transports liquid CO2 (LCO2) to a CO2 terminal through CO2 carriers. CO2 is transmitted to an offshore platform through an offshore pipeline and injected into offshore geological formations.
Figure 1. The systems engineering process (SEP).

Energies 2019, 12, 4350 3 of 18
The SEP consists of (1) requirements analysis, which transforms the stakeholder’s system needsinto functional requirements from an engineering point of view; (2) functional analysis and allocation,which defines what functions are to be performed; and (3) design synthesis, which determines howthese functions are combined into the design [44]. The SEP is completed when this series of processesis conducted. The strength of SEP during the concept development stage is that necessary functionsare reflected, whereas unnecessary functions are removed in advance.
In this study, the conceptual design of a CO2 terminal was structurally and systematicallydeveloped using the SEP. Our conceptual design focuses on the configuration and basic operationconcept of a CO2 terminal. In the requirement analysis (Figure 1), a CCS chain was analyzed toderive the goal and performance objectives of a CO2 terminal. For requirement analysis, specificconditions of the CCS demonstration project promoted in Korea were applied. Then, the functions werederived to meet the goal and performance objectives of the CO2 terminal using functional analyses.Several functional analyses were conducted to define the top-level functions and their basic operationalconcepts. Design synthesis was performed to determine the equipment that corresponds to eachfunction. Based on the SEP, a process flow block diagram of the CO2 terminal was finally suggestedthat explicitly depicts the configuration of the CO2 terminal.
2. Description of CCS Chain
CO2 terminals have various forms depending on the connection methods between captureand storage sites [15]. Since the objective of this study was to demonstrate the basic configurationand operation concept of a CO2 terminal, a relatively simple form of a CCS chain was selected asa target system (Figure 2a). The concept of a CCS chain displayed in Figure 2 is identical to the1-million-ton-scale demonstration project in Korea. This CCS chain liquefies captured CO2 at a thermalpower plant located on the coast, and transports liquid CO2 (LCO2) to a CO2 terminal through CO2
carriers. CO2 is transmitted to an offshore platform through an offshore pipeline and injected intooffshore geological formations.Energies 2019, 12, x FOR PEER REVIEW 4 of 19
(a)
(b)
Figure 2. The carbon capture and storage (CCS) chain process in this study: (a) graphical representation and (b) functional flow block diagram. L = liquid, V = vapor.
The CCS chain can be expressed as a functional flow block diagram, as depicted in Figure 2b. Since we focused on the CO2 terminal, we omitted the explanation of a functional flow block diagram of the whole CCS chain. Contrary to other CCS chain descriptions, the return of CO2 carriers is included to consider the vaporized CO2 (VCO2) in returning carriers.
The specific conditions of the CCS project in Figure 2 are as follows. The annual transport amount is 1 million tons of CO2. The distance from the capture source to the CO2 terminal is 580 km. The temperature and pressure of CO2 are to be maintained at −27 °C and 16 bar, respectively, during the CO2 carrier and CO2 terminal operation. The CO2 in the terminal is to be pressurized and heated for offshore pipeline transportation.
3. System Engineering Process
In this study, the SEP in Figure 1 was followed to identify the basic configuration and operation concept of the CO2 terminal. System engineering is a useful method for designing new systems that are complex or did not exist previously. Figure 1 depicts the system engineering process presented by the U.S. Department of Defense, which is widely used in many fields [44]. The system engineering process involves requirement analysis, functional analysis and design synthesis, as shown in Figure 1. Requirement analysis, functional analysis and allocation, and design synthesis are iterative and mutually complementary [18]. A system analysis and control were performed to balance this series of procedures. A more detailed explanation of each procedure is provided below.
3.1. Requirement Analysis
Requirements analysis is the first step in the system engineering process, in which the system requirements definition process converts the stakeholder representation into a technical representation of the product. The requirement analysis can transforms the project’s needs into engineering language, which consequently enables the system designer to conduct the design concept [45]. During requirement analysis, the CCS chain is analyzed to derive the performance requirement of the CO2 terminal.
3.2. Functional Analysis
Figure 2. The carbon capture and storage (CCS) chain process in this study: (a) graphical representationand (b) functional flow block diagram. L = liquid, V = vapor.
The CCS chain can be expressed as a functional flow block diagram, as depicted in Figure 2b. Sincewe focused on the CO2 terminal, we omitted the explanation of a functional flow block diagram of the

Energies 2019, 12, 4350 4 of 18
whole CCS chain. Contrary to other CCS chain descriptions, the return of CO2 carriers is included toconsider the vaporized CO2 (VCO2) in returning carriers.
The specific conditions of the CCS project in Figure 2 are as follows. The annual transportamount is 1 million tons of CO2. The distance from the capture source to the CO2 terminal is 580 km.The temperature and pressure of CO2 are to be maintained at −27 ◦C and 16 bar, respectively, duringthe CO2 carrier and CO2 terminal operation. The CO2 in the terminal is to be pressurized and heatedfor offshore pipeline transportation.
3. System Engineering Process
In this study, the SEP in Figure 1 was followed to identify the basic configuration and operationconcept of the CO2 terminal. System engineering is a useful method for designing new systems thatare complex or did not exist previously. Figure 1 depicts the system engineering process presented bythe U.S. Department of Defense, which is widely used in many fields [44]. The system engineeringprocess involves requirement analysis, functional analysis and design synthesis, as shown in Figure 1.Requirement analysis, functional analysis and allocation, and design synthesis are iterative andmutually complementary [18]. A system analysis and control were performed to balance this series ofprocedures. A more detailed explanation of each procedure is provided below.
3.1. Requirement Analysis
Requirements analysis is the first step in the system engineering process, in which the systemrequirements definition process converts the stakeholder representation into a technical representationof the product. The requirement analysis can transforms the project’s needs into engineering language,which consequently enables the system designer to conduct the design concept [45]. During requirementanalysis, the CCS chain is analyzed to derive the performance requirement of the CO2 terminal.
3.2. Functional Analysis
After identifying the system requirements, functional analysis is performed to define the logicalarchitecture that can satisfy the identified requirements. Functional analysis is the step of defining thebasic functions that the system should perform. This analysis focuses on “what” must be performed,not “how” functions will be performed. Notably, this analysis is function-oriented rather thanequipment-oriented. In functional analysis, three functional analysis tools are used: a functional flowblock diagram (FFBD), integration definition for function modeling (IDEF0), and timeline analysis(TLA). Through FFBD, the functional flow of the whole CCS transport chain is determined. The sequenceand relationships between the functions of the CO2 terminal are defined by IDEF0. To consider thetime durations of functions, TLA is used. The results of TLA support the operation concept of theCO2 terminal.
3.2.1. Functional Flow Block Diagram (FFBD)
FFBD is graphical tool used to show the sequence of all functions that the system should perform.FFBD focuses the sequence of each function, not the time required or the flow of time betweenfunctions [8]. In FFBD, each function represented by a block is identified in terms of inputs andoutputs [45]. Each block can be expanded to a series of sub-functions. A function is represented by arectangular block with the title of the function. The title of the function is composed of an action verbfollowed by a noun. Some functions may be performed in parallel when necessary.
3.2.2. Integration Definition for Function Modeling (IDEF0)
The IDEF0 diagram integrates the inputs, control, outputs, and mechanisms of functions. IEDF0allows us to understand the correlation between functions derived from FFBD. In IDEF0, the blockrepresents the function to be performed, and the left and right arrows show the input and output of

Energies 2019, 12, 4350 5 of 18
the process, respectively. The up and down arrows indicate the controls and the mechanism of thefunction, respectively (Figure 3).
Energies 2019, 12, x FOR PEER REVIEW 5 of 19
After identifying the system requirements, functional analysis is performed to define the logical architecture that can satisfy the identified requirements. Functional analysis is the step of defining the basic functions that the system should perform. This analysis focuses on “what” must be performed, not “how” functions will be performed. Notably, this analysis is function-oriented rather than equipment-oriented. In functional analysis, three functional analysis tools are used: a functional flow block diagram (FFBD), integration definition for function modeling (IDEF0), and timeline analysis (TLA). Through FFBD, the functional flow of the whole CCS transport chain is determined. The sequence and relationships between the functions of the CO2 terminal are defined by IDEF0. To consider the time durations of functions, TLA is used. The results of TLA support the operation concept of the CO2 terminal.
3.2.1. Functional Flow Block Diagram (FFBD)
FFBD is graphical tool used to show the sequence of all functions that the system should perform. FFBD focuses the sequence of each function, not the time required or the flow of time between functions [8]. In FFBD, each function represented by a block is identified in terms of inputs and outputs [45]. Each block can be expanded to a series of sub-functions. A function is represented by a rectangular block with the title of the function. The title of the function is composed of an action verb followed by a noun. Some functions may be performed in parallel when necessary.
3.2.2. Integration Definition for Function Modeling (IDEF0)
The IDEF0 diagram integrates the inputs, control, outputs, and mechanisms of functions. IEDF0 allows us to understand the correlation between functions derived from FFBD. In IDEF0, the block represents the function to be performed, and the left and right arrows show the input and output of the process, respectively. The up and down arrows indicate the controls and the mechanism of the function, respectively (Figure 3).
Figure 3. Integration definition for function modeling (IDEF0) shows the inputs, control, outputs, and mechanisms of functions.
3.2.3. Timeline Analysis (TLA)
Although the FFBD and IDEF0 represent the logical sequence of functions, they cannot show the time duration of or between functions. TLA is a method for identifying specific time-related design or operating requirements, useful for reflecting the durations of time-critical functions, such as reaction time, turnaround time, time limits, etc., and to clarify time-related design constraints. TLA complements FFBD or IDEF0 [46].
3.3. Design Synthesis
Physical equipment that performs the functions of the system is specified in the final stage of the design synthesis. In this study, the requirement allocation sheet (RAS) was used for the design synthesis. In the RAS, the configuration or equipment that will perform the functions are derived by connecting the functions with the allocated performance and the physical system. Usually the
Figure 3. Integration definition for function modeling (IDEF0) shows the inputs, control, outputs, andmechanisms of functions.
3.2.3. Timeline Analysis (TLA)
Although the FFBD and IDEF0 represent the logical sequence of functions, they cannot showthe time duration of or between functions. TLA is a method for identifying specific time-relateddesign or operating requirements, useful for reflecting the durations of time-critical functions, such asreaction time, turnaround time, time limits, etc., and to clarify time-related design constraints. TLAcomplements FFBD or IDEF0 [46].
3.3. Design Synthesis
Physical equipment that performs the functions of the system is specified in the final stage ofthe design synthesis. In this study, the requirement allocation sheet (RAS) was used for the designsynthesis. In the RAS, the configuration or equipment that will perform the functions are derivedby connecting the functions with the allocated performance and the physical system. Usually thefunctions are listed in the left column in the RAS, the performance or requirements that each functionshould meet are listed in the middle column, and the corresponding equipment that can perform eachfunction is listed in the right column [47]. This methodology clearly indicates the interrelationshipsbetween the main equipment and minimizes the risk of missing key design variables.
4. Results
4.1. CO2 Carrier and CO2 Terminal Requirements
To derive the performance requirements of the CO2 terminal, we clearly defined the logisticsconcept, including carrier size, number of the carriers, carrier transportation cycle, etc., using the CCSchain conditions of the Korean project described in Section 2. This CCS chain aims to store 1 milliontons of CO2 annually, which can be converted into a daily transport rate of 2740 tons/day.
4.1.1. Time for Carrier Round Trip and the Availability of Transport
The distance from the capture site to the CO2 terminal is about 580 km, and the carrier speed isusually about 14 knots. In other words, one day is required for one-way transportation. An additionalday is required for berthing, purging the pipeline, and loading/unloading CO2 at the capture siteand the CO2 terminal each. Therefore, a total of four days is required for one carrier to completea round trip between the capture site and the CO2 terminal, including loading and unloading ofLCO2. The availability of transport is assumed to be less than 80% considering the possibility of badweather conditions.

Energies 2019, 12, 4350 6 of 18
4.1.2. Number of Carriers
In general, large carriers have lower capital expenditure (CAPEX) and operating expenditure(OPEX) per cargo volume than smaller carriers. Therefore, operating a small number of carriers is costeffective. In other words, the cost of one carrier is inexpensive comparing the cost of two half-sizedcarriers. A more detailed comparison of costs between one and two carriers is explained in Section 5.3.
When operating only one carrier, if an unexpected failure of the carrier occurs, the entire CCS chainwill be stopped, making the continuous injection of CO2 difficult. Intermittent injection of CO2 lowersthe CO2 injection capacity, reducing the efficiency of the entire CCS chain [48,49]. On the other hand,if two carriers are operated, one will be able to operate even if the other stops due to an unforeseenfailure. Therefore, the entire CCS chain can be operated with a reduced injection rate while avoidinginjection interruption, even if it is not able to satisfy the target storage amount of 1 million tons/year.Thus, this study determined the number of carriers as two even though it is inexpensive to operate onecarrier. In the case of this study, even if one carrier fails to operate, it will be able to transport 75% ofthe normal transport rate if the maximum availability of the other carrier is maintained during therepair period.
4.1.3. Size of Carrier
With two carriers, four days of shipping time, and less than 80% shipping availability, the minimumamount of LCO2 carried by single transportation can be derived as follows:
1 × 10⁶ tons/(365 days × 80%/4 days)/2 carriers ≈ 6849 tons/carrier. (1)
A total of 2.5 days are required to capture 6849 tons of LCO2 considering a capture rate of 2740tons/day. However, the CCS transport chain can be both safe and simple if one carrier transports 3days’ worth of captured CO2 at one time. Therefore, one carrier transports 8220 tons (2740 tons × 3days) of LCO2. In this case, the availability is about 66%. Since one carrier transports 3 days’ worth ofcaptured CO2, the carrier arrival cycle in the CO2 terminal is also 3 days.
The same volume of VCO2 must be loaded into the carrier’s cargo tank when unloading LCO2
from the carrier to the CO2 terminal. The carrier’s cargo tank is displaced by the VCO2 of the storagetanks at the terminal, while LCO2 fills the storage tanks. There are two reasons for loading VCO2
into the carrier’s cargo tank. The first is to allow the pressure and temperature of the cargo tank to becontrolled during the unloading process. Constant pressure and temperature facilitate the process.The second reason is to prevent the rapid decrease in temperature due to Joule–Thomson cooling.This rapid decrease in temperature could lead to material damage [50]. The VCO2 and LCO2 densityratio is about 0.041 under conditions of −27 ◦C and 16 bar. Therefore, 337 tons of VCO2, whichcorrespond to 4.1% of the 8220 tons of LCO2, is returned to the capture site. For the net transportamount of CO2 to be 8220 tons per carrier, this amount of CO2 should be additionally carried from thecapture site. The total transport rate is, therefore, 8557 tons per carrier. Considering the BOG in thecargo tanks during the ship transportation, the cargo tanks should be approximately 95% filled andthen, the total size of the CO2 cargo tanks would be increased to be ~9000 tons. In conclusion, two9000-ton carriers that transport 8857 tons of LCO2 over four days in one shipment are needed in ourCCS chain and two unloadings of CO2 in six days would be completed in the CO2 terminal.
4.1.4. Size and Number of Storage Tank in Terminal
Since the maximum capacity of a pressurized CO2 storage tank is 5000 tons, the size of the CO2
storage tanks in the CO2 terminal can be easily determined to be half the size of a carrier, 4500 tons.Two empty tanks should be ready before unloading the LCO2. The CO2 terminal should maintain anappropriate amount of buffer CO2 to operate smoothly, although the CO2 supplied by the carrier maybe halted for at least 60 h due to typhoons or other events and conditions. The 60-h buffer correspondsto 6850 tons of CO2. At this stage, four CO2 storage tanks are required. The number of storage tanks
Energies 2019, 12, 4350 7 of 18
will be checked again using TLA to determine if four tanks are sufficient for buffering CO2 in the nextsection. These requirements will be checked through functional analysis and allocation and designsynthesis in the SEP in the following sections.
4.1.5. The Estimation of the Amount of BOG in the CO2 Storage Tank at Terminal
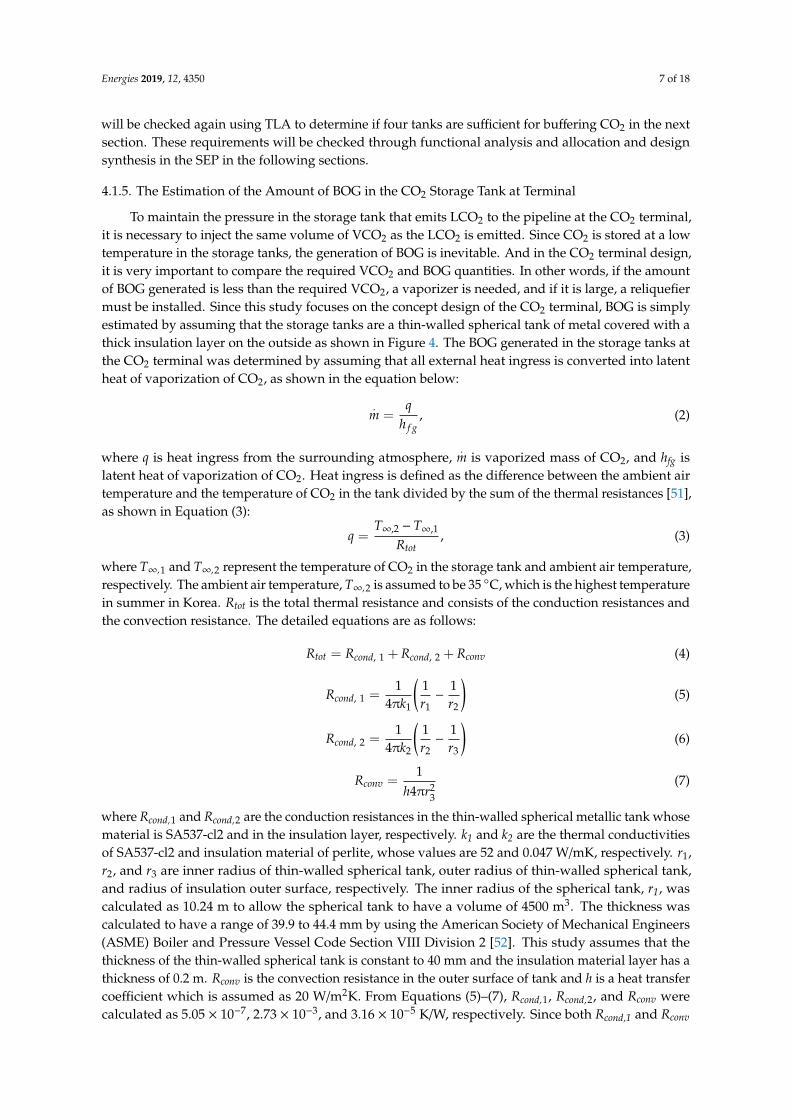
To maintain the pressure in the storage tank that emits LCO2 to the pipeline at the CO2 terminal,it is necessary to inject the same volume of VCO2 as the LCO2 is emitted. Since CO2 is stored at a lowtemperature in the storage tanks, the generation of BOG is inevitable. And in the CO2 terminal design,it is very important to compare the required VCO2 and BOG quantities. In other words, if the amountof BOG generated is less than the required VCO2, a vaporizer is needed, and if it is large, a reliquefiermust be installed. Since this study focuses on the concept design of the CO2 terminal, BOG is simplyestimated by assuming that the storage tanks are a thin-walled spherical tank of metal covered with athick insulation layer on the outside as shown in Figure 4. The BOG generated in the storage tanks atthe CO2 terminal was determined by assuming that all external heat ingress is converted into latentheat of vaporization of CO2, as shown in the equation below:
.m =
qh f g
, (2)
where q is heat ingress from the surrounding atmosphere,.
m is vaporized mass of CO2, and hfg islatent heat of vaporization of CO2. Heat ingress is defined as the difference between the ambient airtemperature and the temperature of CO2 in the tank divided by the sum of the thermal resistances [51],as shown in Equation (3):
q =T∞,2 − T∞,1
Rtot, (3)
where T∞,1 and T∞,2 represent the temperature of CO2 in the storage tank and ambient air temperature,respectively. The ambient air temperature, T∞,2 is assumed to be 35 ◦C, which is the highest temperaturein summer in Korea. Rtot is the total thermal resistance and consists of the conduction resistances andthe convection resistance. The detailed equations are as follows:
Rtot = Rcond, 1 + Rcond, 2 + Rconv (4)
Rcond, 1 =1
4πk1
(1r1−
1r2
)(5)
Rcond, 2 =1
4πk2
(1r2−
1r3
)(6)
Rconv =1
h4πr23
(7)
where Rcond,1 and Rcond,2 are the conduction resistances in the thin-walled spherical metallic tank whosematerial is SA537-cl2 and in the insulation layer, respectively. k1 and k2 are the thermal conductivitiesof SA537-cl2 and insulation material of perlite, whose values are 52 and 0.047 W/mK, respectively. r1,r2, and r3 are inner radius of thin-walled spherical tank, outer radius of thin-walled spherical tank,and radius of insulation outer surface, respectively. The inner radius of the spherical tank, r1, wascalculated as 10.24 m to allow the spherical tank to have a volume of 4500 m3. The thickness wascalculated to have a range of 39.9 to 44.4 mm by using the American Society of Mechanical Engineers(ASME) Boiler and Pressure Vessel Code Section VIII Division 2 [52]. This study assumes that thethickness of the thin-walled spherical tank is constant to 40 mm and the insulation material layer has athickness of 0.2 m. Rconv is the convection resistance in the outer surface of tank and h is a heat transfercoefficient which is assumed as 20 W/m2K. From Equations (5)–(7), Rcond,1, Rcond,2, and Rconv werecalculated as 5.05 × 10⁻⁷, 2.73 × 10⁻³, and 3.16 × 10⁻⁵ K/W, respectively. Since both Rcond,1 and Rconv

Energies 2019, 12, 4350 8 of 18
are much smaller than Rcond,2, Rtot is almost the same as Rcond,2, where Rtot calculated by Equation (4) is2.77 × 10−3 K/W.
Energies 2019, 12, x FOR PEER REVIEW 8 of 19
𝑅 = 𝑅 , + 𝑅 , + 𝑅 (4)
𝑅 , = 14π𝑘 1𝑟 − 1𝑟 (5)
𝑅 , = 14π𝑘 1𝑟 − 1𝑟 (6)
𝑅 = 1ℎ4π𝑟 (7)
where Rcond,1 and Rcond,2 are the conduction resistances in the thin-walled spherical metallic tank whose material is SA537-cl2 and in the insulation layer, respectively. k1 and k2 are the thermal conductivities of SA537-cl2 and insulation material of perlite, whose values are 52 and 0.047 W/mK, respectively. r1, r2, and r3 are inner radius of thin-walled spherical tank, outer radius of thin-walled spherical tank, and radius of insulation outer surface, respectively. The inner radius of the spherical tank, r1, was calculated as 10.24 m to allow the spherical tank to have a volume of 4500 m3. The thickness was calculated to have a range of 39.9 to 44.4 mm by using the American Society of Mechanical Engineers (ASME) Boiler and Pressure Vessel Code Section VIII Division 2 [52]. This study assumes that the thickness of the thin-walled spherical tank is constant to 40 mm and the insulation material layer has a thickness of 0.2 m. Rconv is the convection resistance in the outer surface of tank and h is a heat transfer coefficient which is assumed as 20 W/m2K. From Equations (5)–(7), Rcond,1, Rcond,2, and Rconv
were calculated as 5.05 × 10⁻⁷, 2.73 × 10⁻³, and 3.16 × 10⁻⁵ K/W, respectively. Since both Rcond,1 and Rconv are much smaller than Rcond,2, Rtot is almost the same as Rcond,2, where Rtot calculated by Equation (4) is 2.77 × 10⁻³ K/W.
Figure 4. Schematics of simplified storage tank for boil-off gas (BOG) calculation.
The amount of BOG calculated by Equation (2) is 241 kg/h. Since the number of tanks in the CO2 terminal is 4, the total BOG is 965 kg/h. The amount of VCO2 required is 4.1% of the emitted CO2, which corresponds to 4680 kg/h. Since the amount of BOG in the storage tanks is about 20% of the required VCO2, a vaporizer is needed to fully obtain the required VCO2 [24]. It is noted that BOG generated per day a tank is 6.65 tons/day, which corresponds to about 0.16% of the CO2 storage capacity. It is also noted that the stratification phenomena inside of the CO2 tank [53] could increase the BOG generation, but the amount of BOG generated would be still smaller than the required amount.
4.2. Functional Analysis of the CO2 Terminal
4.2.1. FFBD of CO2 Transport Chain
Figure 4. Schematics of simplified storage tank for boil-off gas (BOG) calculation.
The amount of BOG calculated by Equation (2) is 241 kg/h. Since the number of tanks in theCO2 terminal is 4, the total BOG is 965 kg/h. The amount of VCO2 required is 4.1% of the emittedCO2, which corresponds to 4680 kg/h. Since the amount of BOG in the storage tanks is about 20%of the required VCO2, a vaporizer is needed to fully obtain the required VCO2 [24]. It is noted thatBOG generated per day a tank is 6.65 tons/day, which corresponds to about 0.16% of the CO2 storagecapacity. It is also noted that the stratification phenomena inside of the CO2 tank [53] could increase theBOG generation, but the amount of BOG generated would be still smaller than the required amount.
4.2. Functional Analysis of the CO2 Terminal
4.2.1. FFBD of CO2 Transport Chain
To derive the basic functions of the CO2 terminal, a functional flow block diagram was used. Sincethe basic functions should be connected with the entire CCS chain, the three CO2-terminal-relatedfunctions—‘6.0 Unload LCO2 to CO2 terminal’, ‘7.0 Store LCO2 intermediately’, and ‘8.0 Pressurize’(Figure 2b)—were set as the higher-level functions.
For the higher-level function of ‘6.0 Unload LCO2 to CO2 terminal’, the lower-level functions of‘6.1 Unload LCO2’ and ‘6.2 Load VCO2’ are developed. The function ‘6.2 Load VCO2’ involves loadingthe VCO2 into the CO2 cargo tank on the carrier to prevent the rapid pressure decrease of cargo tankson the carrier caused by unloading LCO2 from the carrier.
To achieve the function of ‘7.0 Store LCO2 intermediately’, LCO2 should be stored in the CO2
storage tank after unloading LCO2 from the carrier at adequate temperature and pressure, and thenbe transmitted for offshore pipeline transport. Therefore, ‘7.1 Receive LCO2’, ‘7.2 Store LCO2’, and‘7.3 Transmit LCO2’ functions can be derived as lower-level functions. VCO2, which will be loadedonto the carrier, is supplied from the CO2 terminal, so the function of ‘7.4 Generate VCO2’ can also bederived. The temperature and pressure of LCO2 extracted from the storage tanks needs to be increasedto meet the appropriate conditions for injection before transmission through the offshore pipeline.Therefore, the function of ‘8.1 Increase LCO2 T & P’ is included as the lower-level function of ‘8.0Pressurize’. To summarize, seven basic functions are defined for the CO2 terminal: ‘6.1 Unload LCO2’,‘6.2 Load VCO2’, ‘7.1 Receive LCO2’, ‘7.2 Store LCO2’, ‘7.3 Transmit LCO2’, ‘7.4 Generate VCO2’, and‘8.1 Increase LCO2 T & P’, indicated by the blue region in Figure 5.

Energies 2019, 12, 4350 9 of 18
Energies 2019, 12, x FOR PEER REVIEW 9 of 19
To derive the basic functions of the CO2 terminal, a functional flow block diagram was used. Since the basic functions should be connected with the entire CCS chain, the three CO2-terminal-related functions—‘6.0 Unload LCO2 to CO2 terminal’, ‘7.0 Store LCO2 intermediately’, and ‘8.0 Pressurize’ (Figure 2b)—were set as the higher-level functions.
For the higher-level function of ‘6.0 Unload LCO2 to CO2 terminal’, the lower-level functions of ‘6.1 Unload LCO2’ and ‘6.2 Load VCO2’ are developed. The function ‘6.2 Load VCO2’ involves loading the VCO2 into the CO2 cargo tank on the carrier to prevent the rapid pressure decrease of cargo tanks on the carrier caused by unloading LCO2 from the carrier.
To achieve the function of ‘7.0 Store LCO2 intermediately’, LCO2 should be stored in the CO2 storage tank after unloading LCO2 from the carrier at adequate temperature and pressure, and then be transmitted for offshore pipeline transport. Therefore, ‘7.1 Receive LCO2’, ‘7.2 Store LCO2’, and ‘7.3 Transmit LCO2’ functions can be derived as lower-level functions. VCO2, which will be loaded onto the carrier, is supplied from the CO2 terminal, so the function of ‘7.4 Generate VCO2’ can also be derived. The temperature and pressure of LCO2 extracted from the storage tanks needs to be increased to meet the appropriate conditions for injection before transmission through the offshore pipeline. Therefore, the function of ‘8.1 Increase LCO2 T & P’ is included as the lower-level function of ‘8.0 Pressurize’. To summarize, seven basic functions are defined for the CO2 terminal: ‘6.1 Unload LCO2’, ‘6.2 Load VCO2’, ‘7.1 Receive LCO2’, ‘7.2 Store LCO2’, ‘7.3 Transmit LCO2’, ‘7.4 Generate VCO2’, and ‘8.1 Increase LCO2 T & P’, indicated by the blue region in Figure 5.
Figure 5. A functional flow block diagram of CCS project and scope of CO2 terminal functions (blue region).
4.2.2. Integration Definition for Function Modeling (IDEF0) of CO2 Terminal
Through IDEF0, input and output between functions can be explicitly diagrammed. IDEF0 clearly demonstrates the correlations between the functions to be performed. These IDEF0 relationships are represented in Figure 6.
As the input of the system is LCO2 moved by a carrier, the function ‘6.1 Unload LCO2’ is the first function among the seven functions. When the carrier and the CO2 terminal are connected, LCO2 is unloaded from the carrier. The function ‘7.1 Receive LCO2’ is receiving the unloaded LCO2 at the CO2 terminal. Therefore, the output of function 6.1 is ‘Unloaded LCO2’, which becomes the input of function 7.1. Once LCO2 is received, LCO2 should be retained until transmitted to the offshore pipeline, and this function corresponds to function ‘7.2 Store LCO2’. To store the received LCO2 in storage tanks, the temperature and pressure of LCO2 should be maintained constantly until LCO2 is transmitted. In this study, we assumed that the temperature and pressure of LCO2 are controlled by extraction of BOG. Therefore, the outputs of the function ‘7.2 Store LCO2’ are ‘Stored LCO2’ and ‘Removed VCO2’.
Figure 5. A functional flow block diagram of CCS project and scope of CO2 terminal functions(blue region).
4.2.2. Integration Definition for Function Modeling (IDEF0) of CO2 Terminal
Through IDEF0, input and output between functions can be explicitly diagrammed. IDEF0 clearlydemonstrates the correlations between the functions to be performed. These IDEF0 relationships arerepresented in Figure 6.Energies 2019, 12, x FOR PEER REVIEW 10 of 19
Figure 6. IDEF0 of CO2 terminal.
After, the function ‘7.3 Transmit LCO2’ is completed, which is the transmission of the LCO2 from the storage tanks to offshore pipeline transportation and then the input of function 7.3 is ‘Stored LCO2’. When LCO2 is transmitted from the CO2 storage tanks, the pressure in the CO2 storage tanks decreases. To prevent this decrease in pressure, VCO2 should be supplied to the storage tanks and this function corresponds to ‘7.4 Generate VCO2’. To minimize the wasted CO2, we assumed that input of function 7.4 is the above-mentioned BOG. However, this might not provide a sufficient amount of VCO2. Therefore, we also assumed that the small amount of LCO2 transmitted from the CO2 storage tanks is the second input of function 7.4 and this LCO2 should be vaporized to meet the required VCO2 supply. Once LCO2 transmission is finished, the CO2 storage tank is again ready to receive the LCO2 that is transported by the next carrier.
When conducting ‘7.1 Receive LCO2’, the VCO2 filled in the CO2 storage tanks should be removed to receive LCO2. We assumed that the VCO2 in the CO2 storage tank is loaded into the carrier cargo for the safe return of the carrier to the capture site for the next LCO2 transport. This function corresponds to ‘6.2 Load VCO2’.
Most of the LCO2 transmitted from the CO2 storage tank is transported via offshore pipelines for injection. Before offshore pipeline transport, the temperature and pressure of LCO2 should be increased appropriately and this function corresponds to ‘8.1 Increase LCO2 T & P’. Then, the output of function 8.1, ‘The temperature and pressure increased LCO2’, becomes the input of function ‘9.0 Transport LCO2 through offshore pipeline’.
4.2.3. Timeline Analysis (TLA) of the CO2 Storage Tank Operation
For this study’s CO2 terminal, the CO2 is supplied by a CO2 carrier and then transmitted to an offshore pipeline. The CO2 terminal should have enough buffer CO2 to manage CO2 supply interruption. The transmission of CO2 from the CO2 terminal to the offshore pipeline is continuous, whereas the supply of CO2 from a carrier is intermittent. The amount of buffer CO2 should be balanced by both the continuous transmission and the intermittent supply of CO2; therefore, the simple calculation cannot assure the smooth operation of the CO2 terminal without any logistics problems. In this study, TLA, which was explained in Section 3, was used to verify the CO2 logistics supply concept, transmission and buffer amounts, and to determine the storage time of LCO2 and VCO2 per storage tank. In TLA, it is assumed that concurrent filling and transmitting of CO2 in the same tank is forbidden for operational safety reasons.
Figure 6. IDEF0 of CO2 terminal.
As the input of the system is LCO2 moved by a carrier, the function ‘6.1 Unload LCO2’ is the firstfunction among the seven functions. When the carrier and the CO2 terminal are connected, LCO2 isunloaded from the carrier. The function ‘7.1 Receive LCO2’ is receiving the unloaded LCO2 at theCO2 terminal. Therefore, the output of function 6.1 is ‘Unloaded LCO2’, which becomes the input offunction 7.1. Once LCO2 is received, LCO2 should be retained until transmitted to the offshore pipeline,and this function corresponds to function ‘7.2 Store LCO2’. To store the received LCO2 in storage tanks,the temperature and pressure of LCO2 should be maintained constantly until LCO2 is transmitted.In this study, we assumed that the temperature and pressure of LCO2 are controlled by extraction ofBOG. Therefore, the outputs of the function ‘7.2 Store LCO2’ are ‘Stored LCO2’ and ‘Removed VCO2’.

Energies 2019, 12, 4350 10 of 18
After, the function ‘7.3 Transmit LCO2’ is completed, which is the transmission of the LCO2
from the storage tanks to offshore pipeline transportation and then the input of function 7.3 is ‘StoredLCO2’. When LCO2 is transmitted from the CO2 storage tanks, the pressure in the CO2 storage tanksdecreases. To prevent this decrease in pressure, VCO2 should be supplied to the storage tanks and thisfunction corresponds to ‘7.4 Generate VCO2’. To minimize the wasted CO2, we assumed that inputof function 7.4 is the above-mentioned BOG. However, this might not provide a sufficient amount ofVCO2. Therefore, we also assumed that the small amount of LCO2 transmitted from the CO2 storagetanks is the second input of function 7.4 and this LCO2 should be vaporized to meet the required VCO2
supply. Once LCO2 transmission is finished, the CO2 storage tank is again ready to receive the LCO2
that is transported by the next carrier.When conducting ‘7.1 Receive LCO2’, the VCO2 filled in the CO2 storage tanks should be removed
to receive LCO2. We assumed that the VCO2 in the CO2 storage tank is loaded into the carrier cargo forthe safe return of the carrier to the capture site for the next LCO2 transport. This function correspondsto ‘6.2 Load VCO2’.
Most of the LCO2 transmitted from the CO2 storage tank is transported via offshore pipelinesfor injection. Before offshore pipeline transport, the temperature and pressure of LCO2 should beincreased appropriately and this function corresponds to ‘8.1 Increase LCO2 T & P’. Then, the outputof function 8.1, ‘The temperature and pressure increased LCO2’, becomes the input of function ‘9.0Transport LCO2 through offshore pipeline’.
4.2.3. Timeline Analysis (TLA) of the CO2 Storage Tank Operation
For this study’s CO2 terminal, the CO2 is supplied by a CO2 carrier and then transmitted toan offshore pipeline. The CO2 terminal should have enough buffer CO2 to manage CO2 supplyinterruption. The transmission of CO2 from the CO2 terminal to the offshore pipeline is continuous,whereas the supply of CO2 from a carrier is intermittent. The amount of buffer CO2 should bebalanced by both the continuous transmission and the intermittent supply of CO2; therefore, the simplecalculation cannot assure the smooth operation of the CO2 terminal without any logistics problems.In this study, TLA, which was explained in Section 3, was used to verify the CO2 logistics supplyconcept, transmission and buffer amounts, and to determine the storage time of LCO2 and VCO2 perstorage tank. In TLA, it is assumed that concurrent filling and transmitting of CO2 in the same tank isforbidden for operational safety reasons.
Figure 7 shows the TLA results. In Figure 7, each cell on the x-axis represents four hours, and they-axis represents the seven functions derived in Section 4.1. The activating time of each function isspecified by filling the correspondent time square in Figure 7. On the y-axis below the functions,rows are additionally inserted to show each LCO2 storage tank state and the arrows represent thetransmission of CO2 to the pipeline. Each carrier shipping CO2 is distinguished by filling the timesquares with green and blue colors. The yellow represents the initially filled CO2.
In our TLA, we assumed that the CO2 unloading work is conducted for four hours startingfrom 12:00 every three days. The normal operating period is days 1 to 12. As shown in Figure 7,the seven functions are performed successfully. In a normal operating period, immediately before andafter unloading the LCO2, the lowest and highest amounts of buffer CO2 are 7130 and 15,212 tons,respectively. During a three-day cycle, two storage tanks retain VCO2 for 12 and 48 h, respectively,while the other two storage tanks store LCO2. This means that in case of emergency, it is possible toinspect any dysfunctional CO2 storage tank after evacuation of VCO2.
The period from days 13 to 15, marked in red in Figure 7, corresponds to an emergency periodwhere the CO2 carrier arrives at the CO2 terminal 60 h late, but was originally scheduled to arriveon day 13 at noon. As shown in Figure 7, if the unloading of LCO2 from the carrier starts at 20:00on day 15, it is possible to continuously transmit the LCO2 to the offshore pipeline without any gap.This means four storage tanks enable a buffer of 60 h. For longer buffer hours, additional storage tankswould be required.

Energies 2019, 12, 4350 11 of 18
Energies 2019, 12, x FOR PEER REVIEW 11 of 19
Figure 7 shows the TLA results. In Figure 7, each cell on the x-axis represents four hours, and the y-axis represents the seven functions derived in Section 4.1. The activating time of each function is specified by filling the correspondent time square in Figure 7. On the y-axis below the functions, rows are additionally inserted to show each LCO2 storage tank state and the arrows represent the transmission of CO2 to the pipeline. Each carrier shipping CO2 is distinguished by filling the time squares with green and blue colors. The yellow represents the initially filled CO2.
Figure 7. Timelines for the activated functions and CO2 storage tanks status. The green and blue colors show each carrier shipping CO2. The yellow represents the initially filled CO2 and the red corresponds to an emergency period.
In our TLA, we assumed that the CO2 unloading work is conducted for four hours starting from 12:00 every three days. The normal operating period is days 1 to 12. As shown in Figure 7, the seven functions are performed successfully. In a normal operating period, immediately before and after unloading the LCO2, the lowest and highest amounts of buffer CO2 are 7130 and 15,212 tons,
4 8 12 16 20 24 4 8 12 16 20 24 4 8 12 16 20 24 4 8 12 16 20 24 4 8 12 16 20 24 4 8 12 16 20 24
6.1 Unload LCO2
7.1 Receive LCO2
6.2 Load VCO2
7.2 Store LCO2
7.3 Transmit LCO2
7.4 Generate VCO2
8.1 Increase LCO2 T&P
tank 1 LCO2
tank 2 LCO2
tank 3 LCO2
tank 4 LCO2
4 8 12 16 20 24 4 8 12 16 20 24 4 8 12 16 20 24 4 8 12 16 20 24 4 8 12 16 20 24 4 8 12 16 20 24
6.1 Unload LCO2
7.1 Receive LCO2
6.2 Load VCO2
7.2 Store LCO2
7.3 Transmit LCO2
7.4 Generate VCO2
8.1 Increase LCO2 T&P
tank 1 LCO2
tank 2 LCO2
tank 3 LCO2
tank 4 LCO2
4 8 12 16 20 24 4 8 12 16 20 24 4 8 12 16 20 24 4 8 12 16 20 24 4 8 12 16 20 24 4 8 12 16 20 24
6.1 Unload LCO2
7.1 Receive LCO2
6.2 Load VCO2
7.2 Store LCO2
7.3 Transmit LCO2
7.4 Generate VCO2
8.1 Increase LCO2 T&P
tank 1 LCO2
tank 2 LCO2
tank 3 LCO2
tank 4 LCO2
4 8 12 16 20 24 4 8 12 16 20 24 4 8 12 16 20 24 4 8 12 16 20 24 4 8 12 16 20 24 4 8 12 16 20 24
6.1 Unload LCO2
7.1 Receive LCO2
6.2 Load VCO2
7.2 Store LCO2
7.3 Transmit LCO2
7.4 Generate VCO2
8.1 Increase LCO2 T&P
tank 1 LCO2
tank 2 LCO2
tank 3 LCO2
tank 4 LCO2
Day 6Day 1 Day 2 Day 3 Day 4 Day 5
Day 18
Day 10 Day 11 Day 12
Day 13 Day 14 Day 15 Day 16 Day 17
Day 7 Day 8 Day 9
Day 24Day 19 Day 20 Day 21 Day 22 Day 23
Figure 7. Timelines for the activated functions and CO2 storage tanks status. The green and blue colorsshow each carrier shipping CO2. The yellow represents the initially filled CO2 and the red correspondsto an emergency period.
4.3. Identification of Physical Equipment of CO2 Terminal
Identifying the equipment consisting of the system and the performance requirements is importantin the system design. In this study, a RAS was used to determine the requirements related to theseven lower-level functions. Firstly, the functions and the related requirements are specified in the leftcolumns in Table 1, which were obtained from Section 2 and the results of Section 4.1. Then, the derivedrequirements were written in the next column, which were derived from Sections 4.2.1 and 4.2.2.Finally, the necessary equipment was determined and is listed in the right column in Table 1.

Energies 2019, 12, 4350 12 of 18
Table 1. The derived requirements and equipment corresponding to functions of the CO2 terminal.
No. Functions Requirements Equipment
5.0and11.0
Transport LCO2 by carrier andReturn carrier to capture site
(1) Number of carriers = 2(2) One-way transport time ≤ 1 day
(3) Availability of carriers < 80%(4) Amount of CO2 per one carrier = 8549 tons
Two 9000-ton CO2 carriers
6.1 Unload LCO2(1) Amount of unloaded LCO2 = 8549 tons
(2) Time required for unloading ≤ 4 h LCO2 unloading system
6.2 Load VCO2(1) Amount of loaded VCO2 = 329 tons
(2) Time required for loading ≤ 4 hVCO2 extracting system
VCO2 loading system
7.1 Receive LCO2 (1) The size of 1 storage tank = 4500 tons 4500-ton storage tanks
7.2 Store LCO2
(1) Temperature and pressure CO2 in storage tank aremaintained at −27 °C and 16 bar, respectively, by
removing BOG(2) Buffer capacity = 60 h’ injection amount(3) The required number of CO2 tanks = 4
BOG removal systemFour 4500-ton storage tanks
7.3 Transmit LCO2 (1) Continuous extraction rate of LCO2 from storagetank ≥ 2740 tons/day LP Pump
7.4 Generate VCO2
(1) Daily required amount of VCO2 = 109.7 tons(2) Prevent decrease in pressure of storage tanks by
charging VCO2
VCO2 generating systemVCO2 charging system
8.1 Increase LCO2 T &P
(1) Target temperature = 3–5 °C(2) Target pressure ≥ 120 bar
Heat exchangerBooster pump
5. Discussion
5.1. Process Flow Block Diagram of CO2 Terminal
Based on the results obtained from the five analyses, a process flow block diagram of the CO2
terminal was derived (Figure 8). The solid lines and the dotted lines in Figure 8 represent flows ofLCO2 and VCO2, respectively. Figure 8 shows that the CO2 terminal consists of three major parts.The first part is the CO2 loading/unloading part (Figure 8, yellow), including an LCO2 unloadingsystem, a VCO2 loading system, and a VCO2 extracting system. According to the TLA result, theCO2 loading/unloading part operates for four hours during a three-day operating cycle. The VCO2
displaced from the storage tanks in the terminal is loaded into the cargo tanks in the carrier. This meansthe CO2 loading/unloading parts do not require any externally supplied VCO2. The second partis LCO2 transmission (Figure 8, blue), which controls the temperature and pressure of LCO2 fortransmission to the offshore pipeline. The corresponding equipment systems are a low pressure (LP)pump, a heat exchanger, and a booster pump. It operates all the time for continuous injection of LCO2.The final part is the vapor-treatment part (Figure 8, red), which is necessary to control the temperatureand pressure of the storage tanks for smoothly discharging LCO2 to the offshore pipeline. The mosteffective method is to recharge the storage tank with VCO2 in the same volume as the dischargedLCO2. The vapor-treatment part aims to produce and charge the required VCO2. The vapor-treatmentconsists of a BOG removal system, a VCO2 charging system, and a VCO2 generating system. In thisstudy, the required VCO2 can be obtained using two methods. The first method involves obtainingVCO2 by BOG from other tanks that are not under discharge. The system responsible for this functionis a BOG removal system. The second method involves vaporizing a small portion of the dischargedLCO2. This function is handled by a VCO2 generating system. A VCO2 charging system is responsiblefor injecting VCO2 determined by the above two methods into the storage tanks that discharge LCO2.
The process flow block diagram depicted in Figure 8 helps with understanding the entire CO2 flowand equipment groups. However, with the four CO2 storage tanks and the roles of each tank changingwith time, it is difficult to understand the role of each tank using Figure 8 alone. The storage tanksblock in Figure 8 is included in all three parts. Then, the storage tanks block is expanded in Figure 8into four tanks to clarify the different roles of CO2 storage tanks explicitly, as shown in Figure 9.
Figure 9 shows the extended process block flow diagram when storage tanks 1 and 2 are beingfilled with LCO2 from the carrier during normal operation. This time corresponds to 12:00 to 16:00 ondays 7 and 10 in Figure 7. These two CO2 storage tanks belong to the CO2 loading/unloading part(yellow) in Figure 8. Before the carrier has arrived, the two tanks are filled with VCO2 subsequent

Energies 2019, 12, 4350 13 of 18
to the transmission of LCO2 to the offshore pipeline. After filling LCO2 into CO2 storage tanks 1and 2, the function of CO2 storage tanks 1 and 2 are converted to the function ‘Store LCO2
′ and thecorresponding equipment in Figure 9 is ‘storage tank 3′. ‘Storage tank 3′ belongs to the vapor-treatmentpart in Figure 8 (red). At this time, the pressure and temperature in the CO2 storage tank are keptconstant by extracting the BOG generated in the tank. The equipment responsible for this role is shownin Figures 8 and 9 as ‘BOG removal system’. After a period of time, the LCO2 in the tank is thentransmitted by the ‘LP pump’ and the corresponding tank is ‘storage tank 4′. ‘Storage tank 4′ belongsto the LCO2 transmission part in Figure 8 (blue). Most of LCO2 is sent to the ‘offshore pipeline’ via the‘heat exchanger’ and a ‘booster pump’, and only a small portion of LCO2 is sent to a ‘vapor generatingsystem’ to generate VCO2. Here, the ‘vapor generating system’ should also collect the BOG fromthe ‘BOG removal system’. The generated VCO2 is moved into ‘storage tank 4′ through the ‘vaporcharging system’ to control the pressure of the tank being discharged. VCO2 is ultimately reloaded tothe CO2 carrier through a ‘VCO2 extracting system’ and a ‘VCO2 loading system’.
Energies 2019, 12, x FOR PEER REVIEW 13 of 19
Table 1. The derived requirements and equipment corresponding to functions of the CO2 terminal.
No. Functions Requirements Equipment
5.0 and 11.0
Transport LCO2 by carrier and Return carrier to capture site
(1) Number of carriers = 2 (2) One-way transport time ≤ 1 day
(3) Availability of carriers < 80% (4) Amount of CO2 per one carrier = 8549 tons
Two 9000-ton CO2 carriers
6.1 Unload LCO2 (1) Amount of unloaded LCO2 = 8549 tons (2) Time required for unloading ≤ 4 h
LCO2 unloading system
6.2 Load VCO2 (1) Amount of loaded VCO2 = 329 tons
(2) Time required for loading ≤ 4 h
VCO2 extracting system
VCO2 loading system 7.1 Receive LCO2 (1) The size of 1 storage tank = 4500 tons 4500-ton storage tanks
7.2 Store LCO2
(1) Temperature and pressure CO2 in storage tank are maintained at −27 ℃ and 16 bar,
respectively, by removing BOG (2) Buffer capacity = 60 h’ injection amount (3) The required number of CO2 tanks = 4
BOG removal system Four 4500-ton storage
tanks
7.3 Transmit LCO2
(1) Continuous extraction rate of LCO2 from storage tank ≥ 2740 tons/day
LP Pump
7.4 Generate VCO2
(1) Daily required amount of VCO2 = 109.7 tons
(2) Prevent decrease in pressure of storage tanks by charging VCO2
VCO2 generating system
VCO2 charging system
8.1 Increase LCO2 T & P
(1) Target temperature = 3–5 ℃ (2) Target pressure ≥ 120 bar
Heat exchanger Booster pump
Figure 8. The process flow block diagram of the CO2 terminal. The yellow, red, and blue parts represent the CO2 loading/unloading, vapor-treatment, and LCO2 transmission parts, respectively.
The process flow block diagram depicted in Figure 8 helps with understanding the entire CO2 flow and equipment groups. However, with the four CO2 storage tanks and the roles of each tank changing with time, it is difficult to understand the role of each tank using Figure 8 alone. The storage tanks block in Figure 8 is included in all three parts. Then, the storage tanks block is expanded in Figure 8 into four tanks to clarify the different roles of CO2 storage tanks explicitly, as shown in Figure 9.
Figure 8. The process flow block diagram of the CO2 terminal. The yellow, red, and blue parts representthe CO2 loading/unloading, vapor-treatment, and LCO2 transmission parts, respectively.Energies 2019, 12, x FOR PEER REVIEW 14 of 19
Figure 9. The extended process flow block diagram of the CO2 terminal.
Figure 9 shows the extended process block flow diagram when storage tanks 1 and 2 are being filled with LCO2 from the carrier during normal operation. This time corresponds to 12:00 to 16:00 on days 7 and 10 in Figure 7. These two CO2 storage tanks belong to the CO2 loading/unloading part (yellow) in Figure 8. Before the carrier has arrived, the two tanks are filled with VCO2 subsequent to the transmission of LCO2 to the offshore pipeline. After filling LCO2 into CO2 storage tanks 1 and 2, the function of CO2 storage tanks 1 and 2 are converted to the function ‘Store LCO2′ and the corresponding equipment in Figure 9 is ‘storage tank 3′. ‘Storage tank 3′ belongs to the vapor-treatment part in Figure 8 (red). At this time, the pressure and temperature in the CO2 storage tank are kept constant by extracting the BOG generated in the tank. The equipment responsible for this role is shown in Figures 8 and 9 as ‘BOG removal system’. After a period of time, the LCO2 in the tank is then transmitted by the ‘LP pump’ and the corresponding tank is ‘storage tank 4′. ‘Storage tank 4′ belongs to the LCO2 transmission part in Figure 8 (blue). Most of LCO2 is sent to the ‘offshore pipeline’ via the ‘heat exchanger’ and a ‘booster pump’, and only a small portion of LCO2 is sent to a ‘vapor generating system’ to generate VCO2. Here, the ‘vapor generating system’ should also collect the BOG from the ‘BOG removal system’. The generated VCO2 is moved into ‘storage tank 4′ through the ‘vapor charging system’ to control the pressure of the tank being discharged. VCO2 is ultimately reloaded to the CO2 carrier through a ‘VCO2 extracting system’ and a ‘VCO2 loading system’.
5.2. Comparison with LNG Terminal
LNG terminals have already been commercialized, with many models available. The concepts CO2 and LNG terminals are similar for temporarily storing carrier-transported liquid in a storage tank and then sending it out through a pipeline. This similarity leads to the mis-prediction that the differences between the LNG terminal and the CO2 terminal are limited to size and operational pressure and temperature conditions. The LNG transport chain and CCS transport chain have considerable differences in transportation distance and transportation pressure and temperature conditions. The LNG transport chain typically has a long carrier transport distance of 6500 km on average [54] because the LNG production sites are distributed only in a specific area. However, a CCS chain’s carrier transport routes are relatively short because offshore CO2 storage sites are widely distributed around the world and the probability of offshore storage sites being near capture sites is high. The temperature and pressure conditions of LNG carriers are usually −162 °C and atmospheric pressure, respectively [55], but the temperature and pressure conditions of CO2 carriers range between the triple point of −56 °C and 5.1 bar and the critical point of 31 °C and 74 bar. Based on the results of this study, the differences in the transportation conditions between an LNG chain and a CCS chain lead to the following important differences in terminal design and operation:
(1) Differences in the number of storage tanks due to the size limit: LNG carriers usually travel long distances and convey a large amount of LNG, so this necessitates a large amount of LNG storage. However, relatively less CO2 storage is required in a CO2 terminal. Since the LNG tanks are operated in cryogenic and atmospheric pressure conditions except for small-scale satellite terminals, one LNG storage tank can be as large as ~160,000 m3 [56]. However, the pressure of
Figure 9. The extended process flow block diagram of the CO2 terminal.
5.2. Comparison with LNG Terminal
LNG terminals have already been commercialized, with many models available. The conceptsCO2 and LNG terminals are similar for temporarily storing carrier-transported liquid in a storagetank and then sending it out through a pipeline. This similarity leads to the mis-prediction thatthe differences between the LNG terminal and the CO2 terminal are limited to size and operationalpressure and temperature conditions. The LNG transport chain and CCS transport chain haveconsiderable differences in transportation distance and transportation pressure and temperature

Energies 2019, 12, 4350 14 of 18
conditions. The LNG transport chain typically has a long carrier transport distance of 6500 km onaverage [54] because the LNG production sites are distributed only in a specific area. However, aCCS chain’s carrier transport routes are relatively short because offshore CO2 storage sites are widelydistributed around the world and the probability of offshore storage sites being near capture sites ishigh. The temperature and pressure conditions of LNG carriers are usually −162 ◦C and atmosphericpressure, respectively [55], but the temperature and pressure conditions of CO2 carriers range betweenthe triple point of −56 ◦C and 5.1 bar and the critical point of 31 ◦C and 74 bar. Based on the results ofthis study, the differences in the transportation conditions between an LNG chain and a CCS chainlead to the following important differences in terminal design and operation:
(1) Differences in the number of storage tanks due to the size limit: LNG carriers usually travellong distances and convey a large amount of LNG, so this necessitates a large amount of LNGstorage. However, relatively less CO2 storage is required in a CO2 terminal. Since the LNG tanksare operated in cryogenic and atmospheric pressure conditions except for small-scale satelliteterminals, one LNG storage tank can be as large as ~160,000 m3 [56]. However, the pressureof the CO2 storage tank should be higher than the triple-point pressure of 5.1 bar, meaning theCO2 storage tanks are pressurized tanks, which are hard to manufacture at capacity bigger thanaround 5000 tons. This means the CO2 terminal requires multiple tanks, and in many cases, thecarrier-transported CO2 has to be unloaded into several storage tanks. In this study, the carriertransports ~9000 tons of CO2, which is unloaded into two tanks that are 4500 tons each. Becauseoverfill is one of the common causes of operational accidents [57], the multiple tanks in the CO2
terminal pose a high risk of overfill. Therefore, ensuring a high level of safety is necessary.(2) Importance of vaporizer: The storage time in an LNG terminal is usually longer than in a CCS
terminal due to the longer carrier transport cycle. In this case, the amount of BOG generated inLNG carriers or storage tanks is huge and needs to be re-liquefied at a high cost and requiringconsiderable amounts of energy [58]. However, the CO2 carrier transportation cycle and temporarystorage period in the terminal are relatively short. In our study, the carrier-transported CO2 issent to the offshore pipeline within six days according to the TLA results. The amount of BOGin the CO2 terminal is less than the required vapor for preventing the decrease in pressure inthe CO2 storage tanks as LCO2 is discharged to the pipeline. Therefore, the vaporizer in a CO2
terminal is essential.
5.3. Cost Comparison between One and Two Carriers
This study has determined the number of carriers as two in Section 4.1.2 because operating twocarriers is advantageous for continuous injection, although operating one carrier is economically moreadvantageous. If only one carrier is operated, the design of the terminal is also partially changed, so itis meaningful to check the costs according to the number of carriers operated, including the changes inthe cost of terminal induced by the number of carriers.
In the case of operating one carrier, the carrier size and the number/size of storage tanks atthe terminal were obtained by following the procedures in Sections 4.1.3 and 4.1.4. According toEquation (1), the amount of CO2 transported during one cycle is 13,700 tons, when operating onecarrier, which corresponds to the amount CO2 captured for 5 days. Taking into account the additionalVCO2 required at the terminal and assuming that 95% of the cargo tank is filled, the carrier size can bedetermined as 15,200 tons. As mentioned in Section 4.1.4, the maximum size of one storage tank at theterminal is 5000 tons. Therefore, the number and size of storage tanks required for unloading of LCO2
at the CO2 terminal will be four and 3800 tons, respectively. Considering two buffer tanks and oneemitting tank, the total number of required storage tanks is seven.
CAPEX for a CO2 carrier was calculated as $210,000,000 × (carrier capacity/155,000 tons) 0.65 bycalibrating the price of LNG carrier of 155,000-ton size. OPEX for a CO2 carrier was calculated asthe sum of 5% of CAPEX and fuel costs. Fuel costs for 9000-ton carrier and 15,000-ton carrier weredetermined as $5500 and $7100, respectively by applying the equation of the daily fuel cost × 365

Energies 2019, 12, 4350 15 of 18
days × availability. Assuming that only the number and capacity of storage tanks at the terminals arechanged depending on the number of carriers, this study only considered storage tank costs at the CO2
terminal. CAPEX of one storage tank was estimated to be 3.46 times the metal price corresponding tothe weight of a thin-wall spherical tank. The weight of the thin-walled spherical tank was obtainedfrom its diameter and thickness, and the metal price was assumed to be $1,666 per ton. OPEX isassumed to be 5% of CAPEX.
To make the comparison between costs easier, CAPEX is converted into the capital recovery costusing the capital recovery factor. The capital recovery cost means the annual equivalent cost of CAPEX.The capital recovery factor is 0.061 with a repayment period of 20 years and an interest rate of 2%.
The calculation results are summarized in Table 2. As shown in Table 2, the annual cost of onecarrier is $7.2 million, which is 72% of the cost of two carriers. However, if the storage tank cost isincluded, the total annual cost when operating one carrier increases to 80% of the total annual costwhen operating two carriers. This is due to the increased number of storage tanks at the terminalwhen operating one carrier. The results show that the number of carriers is very closely related to theterminal design. Therefore, to make an accurate economic evaluation, it is necessary to consider thedesign parameters of carriers and terminal simultaneously.
Table 2. Summary of capacity, capital expenditure (CAPEX), and operating expenditure (OPEX) ofcarrier and CO2 terminal depending on the numbers of carriers.
No. of Carriers One Carrier Two Carriers
Carrier
Size of one carrier (tons) 15,000 9000CAPEX ($) 51.7 M 76.2 M
Capital Recovery Cost ($) 2.8 M 4.0 MOPEX ($) 4.4 M 6.0 M
Annual cost of carrier ($) 7.2 M 10.0 M
Terminal
No. of storage tanks 7 4Size of storage tank (tons) 3800 4500
CAPEX of Storage tanks ($) 14.9 M 9.5 MCapital Recovery Cost ($) 1.0 M 0.6 MOPEX of storage tanks ($) 0.7 M 0.5 M
Annual cost of storage tanks ($) 1.7 M 1.1 M
Total Sum of annual costs of carriersand storage tanks at terminal ($) 8.8 M 11.0 M
It is still economical to operate one carrier even if the cost of the terminal increases. If the carrier’sfailure rate can be reduced to very low values, operating one carrier would be a good option. Adoptingnovel technologies such as prognostics and health management which have been emerging recently,can minimize unexpected failure of carriers.
6. Conclusions
In this study, we aimed to derive the configuration and the operational concept of a CO2 terminalthat connects CO2 carriers and an offshore pipeline using the SEP. This paper helps understandinga basic concept of a CO2 terminal. In addition it clearly shows how system engineering process isapplied. The following points were derived by conducting the SEP:
(1) FFBD was used to identify the seven basic functions of the CO2 terminal: ‘Unload LCO2′, ‘Load
VCO2′, ‘Receive LCO2
′, ‘Store LCO2′, ‘Transmit LCO2
′, ‘Generate VCO2′, and ‘Increase LCO2
T&P’. Then, IDEF0 was used to identify the correlation between these functions.(2) The short and repetitive CO2 carrier transport affects the configuration of the CO2 terminal.
The CO2 terminal here is operated with a three-day cycle and at least four 4500-ton storagetanks are needed. The four tanks allow for continuous CO2 transmission to an offshore pipelineeven if a CO2 carrier could not arrive at the CO2 terminal due to the bad weather for 2.5 days.This operational concept of a CO2 terminal was verified by the TLA.

Energies 2019, 12, 4350 16 of 18
(3) A process flow block diagram was derived from the results of the functional analysis and designsynthesis. The configuration of the CO2 terminal consists of a CO2 loading/unloading part, anLCO2 transmission part, and a VCO2 treatment part. These results were used in the subsequentdesign phase.
(4) In this study, VCO2 is required for two purposes. The first is for filling the carrier cargo tankwith VCO2 when unloading LCO2 from the CO2 carrier. In this case, the required VCO2 iscovered by displaced VCO2 as LCO2 fills the storage tanks in the terminal. The second purpose isfor controlling the pressure in the storage tank that is transmitting LCO2 to offshore pipelines.The required VCO2 is supplied from BOG from the other three storage tanks and vaporized CO2
from the small portion of discharged LCO2.(5) The comparison of our results with an LNG terminal indicated that a vaporizer is important
in the CO2 terminal. As mentioned above, the BOG alone cannot meet the required amountfor discharging the VCO2 in a storage tank. Therefore, it is necessary to pay more attention tovaporization rather than reliquefaction in the CO2 terminal. The CO2 terminal requires multiplesmall-sized storage tanks, unlike the LNG terminal.
(6) Major design factors, such as the number and capacity of storage tanks at terminal, changedepending on the number of carriers. Therefore, in order to minimize costs, the design parametersof the carrier and the terminal must be considered simultaneously.
Author Contributions: Conceptualization, H.N. and K.K.; methodology, H.N.; validation, C.H. and S.J.H.; formalanalysis, K.K.; investigation, H.N.; data curation, C.H.; writing—original draft preparation, H.N.; writing—reviewand editing, K.K.; visualization, H.N.; supervision, K.K.; project administration, H.K.; funding acquisition, S.-G.K.
Funding: This research was supported by a grant from Endowment Project of “Technology development ofmaterial handling and risk management for operation and maintenance service of offshore plant” funded by theKorea Research Institute of Ships and Ocean engineering (PES3081).
Acknowledgments: The authors are grateful for the full support from the Korea Research Institute of Ships &Ocean Engineering (KRISO).
Conflicts of Interest: The authors declare no conflict of interest.
References
1. IEA. Energy Technology Perspectives 2016; OECD: Paris, France, 2015.2. Budinis, S.; Krevor, S.; Dowell, N.M.; Brandon, N.; Hawkes, A. An assessment of CCS costs, barriers and
potential. Energy Strategy Rev. 2018, 22, 61–81. [CrossRef]3. IPCC. IPCC Special Report on Carbon Dioxide Capture and Storage; Cambridge University Press: Cambridge,
UK; New York, NY, USA, 2005; p. 422.4. Jung, J.-Y.; Huh, C.; Kang, S.-G.; Seo, Y.; Chang, D. CO2 transport strategy and its cost estimation for the
offshore CCS in Korea. Appl. Energy 2013, 111, 1054–1060. [CrossRef]5. Yoo, B.-Y. The development and comparison of CO2 BOG re-liquefaction processes for LNG fueled CO2
carriers. Energy 2017, 127, 186–197. [CrossRef]6. Kang, K.; Huh, C.; Kang, S.-G.; Baek, J.-H.; Noh, H.J. Estimation of CO2 Pipeline Transport Cost in South
Korea Based on the Scenarios. Energy Procedia 2014, 63, 2475–2480. [CrossRef]7. Wetenhall, B.; Race, J.; Aghajani, H.; Fernandez, E.S.; Naylor, M.; Lucquiaud, M.; Chalmers, H. Considerations
in the Development of Flexible CCS Networks. Energy Procedia 2017, 114, 6800–6812. [CrossRef]8. Spitz, T.; Avagyan, V.; Ascui, F.; Bruce, A.R.W.; Chalmers, H.; Lucquiaud, M. On the variability of CO2 feed
flows into CCS transportation and storage networks. Int. J. Greenh. Gas Control 2018, 74, 296–311. [CrossRef]9. Kang, K.; Seo, Y.; Chang, D.; Kang, S.-G.; Huh, C. Estimation of CO2 Transport Costs in South Korea Using a
Techno-Economic Model. Energies 2015, 8, 2176. [CrossRef]10. Seo, Y.; Chang, D.; Jung, J.-Y.; Huh, C.; Kang, S.-G. Economic Evaluation of Ship-based CCS with Availability.
Energy Procedia 2013, 37, 2511–2518. [CrossRef]11. Yoo, B.-Y.; Choi, D.-K.; Kim, H.-J.; Moon, Y.-S.; Na, H.-S.; Lee, S.-G. Development of CO2 terminal and CO2
carrier for future commercialized CCS market. Int. J. Greenh. Gas Control 2013, 12, 323–332. [CrossRef]

Energies 2019, 12, 4350 17 of 18
12. Yoo, B.-Y.; Lee, S.-G.; Rhee, K.-p.; Na, H.-S.; Park, J.-M. New CCS system integration with CO2 carrier andliquefaction process. Energy Procedia 2011, 4, 2308–2314. [CrossRef]
13. Knoope, M.M.J.; Ramírez, A.; Faaij, A.P.C. Investing in CO2 transport infrastructure under uncertainty:A comparison between ships and pipelines. Int. J. Greenh. Gas Control 2015, 41, 174–193. [CrossRef]
14. Brown, M.; Baddeley, A.; Coulthurst, A.; Taylor, S. The East Irish Sea CCS Cluster: A Conceptual Design;Eunomia Research & Consulting Ltd: Bristol, UK, 2011; pp. 1–19.
15. Vermeulen, T.N. CO2 Liquid Logistics Shipping Concept (LLSC) Overall Supply Chain Optimization; Global CCSInstitute: Canberra, Australia, 2011.
16. Lauri, K.; Jouko, R.; Nicklas, N.; Sebastian, T. Scenarios and new technologies for a North-European CO2
transport infrastructure in 2050. Energy Procedia 2014, 63, 2738–2756. [CrossRef]17. Kujanpää, L.; Teir, S. Implications of the New EU Maritime Emission Monitoring Regulation on Ship
Transportation of CO2. Energy Procedia 2017, 114, 7415–7421. [CrossRef]18. Brownsort, P. Ship Transport of CO2 for Enhanced Oil Recovery—Literature Survey; Murchison House: Edinburgh,
UK, 2015.19. Emrah durusut, M.J. Shipping CO2—UK Cost Estimation Study; Suite 1 Bishop Bateman Court, Thompson’s
Lane: Cambridege, UK, 2018.20. Furre, A.K.; Meneguolo, R.; Ringrose, P.; Kassold, S. Building confidence in CCS: From sleipner to the
northern Lights project. First Break 2019, 37, 81–87.21. Lee, U.; Lim, Y.; Lee, S.; Jung, J.; Han, C. CO2 Storage Terminal for Ship Transportation. Ind. Eng. Chem. Res.
2012, 51, 389–397. [CrossRef]22. Riis, F. Norway CCS demonstration project: Evaluation of Jurassic reservoirs for safe CO2 injection
and storage. In Proceedings of the 5th CO2 Geological Storage Workshop, Utrecht, The Netherlands,21–23 November 2018.
23. ZEP. The Costs of CO2 Transport; Zero Emission Platform: Brussels, Belgium, 2011.24. Northern Lights—Part of The Full-Scale CCS Project in Norway. Available online: https://northernlightsccs.
com/en/about (accessed on 15 October 2019).25. Seo, Y.; Huh, C.; Lee, S.; Chang, D. Comparison of CO2 liquefaction pressures for ship-based carbon capture
and storage (CCS) chain. Int. J. Greenh. Gas Control 2016, 52, 1–12. [CrossRef]26. Suzuki, T.; Toriumi, M.; Sakemi, T.; Masui, N.; Yano, S.; Fujita, H.; Furukawa, H. Conceptual Design of CO2
Transportation System for CCS. Energy Procedia 2013, 37, 2989–2996. [CrossRef]27. Tan, Y.; Nookuea, W.; Li, H.; Thorin, E.; Yan, J. Property impacts on Carbon Capture and Storage (CCS)
processes: A review. Energy Convers. Manag. 2016, 118, 204–222. [CrossRef]28. Kokubun, N.; Ko, K.; Ozaki, M. Cargo Conditions of CO2 in Shuttle Transport by Ship. Energy Procedia 2013,
37, 3160–3167. [CrossRef]29. Miyazaki, T.; Osawa, H.; Matsuura, M.; Ohta, M.; Ozaki, M. Offshore Operational Availability of Onboard
Direct Injection of CO2 into Sub-seabed Geological Formations. Energy Procedia 2013, 37, 3168–3175.[CrossRef]
30. Nakazawa, N.; Kikuchi, K.; Ishii, K.-I.; Yamaguchi, T.; Ohta, M.; Ozaki, M. Ship-based CO2 Injection intoSubseabed Geological Formations Using a Flexible Riser Pipe Pickup System. Energy Procedia 2013, 37,3176–3183. [CrossRef]
31. Ozaki, M.; Ohsumi, T.; Kajiyama, R. Ship-based Offshore CCS Featuring CO2 Shuttle Ships Equipped withInjection Facilities. Energy Procedia 2013, 37, 3184–3190. [CrossRef]
32. Aneziris, O.N.; Papazoglou, I.A.; Konstantinidou, M.; Nivolianitou, Z. Integrated risk assessment for LNGterminals. J. Loss Prev. Process Ind. 2014, 28, 23–35. [CrossRef]
33. Li, Y.; Li, Y. Dynamic optimization of the Boil-Off Gas (BOG) fluctuations at an LNG receiving terminal.J. Nat. Gas Sci. Eng. 2016, 30, 322–330. [CrossRef]
34. Trotter, I.M.; Gomes, M.F.M.; Braga, M.J.; Brochmann, B.; Lie, O.N. Optimal LNG (liquefied natural gas)regasification scheduling for import terminals with storage. Energy 2016, 105, 80–88. [CrossRef]
35. Bisen, V.S.; Karimi, I.A.; Farooq, S. Dynamic Simulation of a LNG Regasification Terminal and Managementof Boil-off Gas. In Computer Aided Chemical Engineering; Eden, M.R., Ierapetritou, M.G., Towler, G.P., Eds.;Elsevier: Amsterdam, The Netherlands, 2018; Volume 44, pp. 685–690.
36. Nagesh Rao, H.; Karimi, I.A. Optimal design of boil-off gas reliquefaction process in LNG regasificationterminals. Comput. Chem. Eng. 2018, 117, 171–190. [CrossRef]

Energies 2019, 12, 4350 18 of 18
37. Noh, Y.; Kim, J.; Kim, J.; Chang, D. Economic evaluation of BOG management systems with LNG coldenergy recovery in LNG import terminals considering quantitative assessment of equipment failures.Appl. Therm. Eng. 2018, 143, 1034–1045. [CrossRef]
38. Rao, H.N.; Karimi, I.A.; Farooq, S. Optimal Design of Boil-Off Gas Liquefaction in LNG RegasificationTerminals. In Computer Aided Chemical Engineering; Eden, M.R., Ierapetritou, M.G., Towler, G.P., Eds.; Elsevier:Amsterdam, The Netherlands, 2018; Volume 44, pp. 2407–2412.
39. Yoon, B.; Shin, J.; Lee, S. Technology assessment model for sustainable development of LNG terminals.J. Clean. Prod. 2018, 172, 927–937. [CrossRef]
40. George, J.J.; Renjith, V.R.; George, P.; George, A.S. Application of fuzzy failure mode effect and criticalityanalysis on unloading facility of LNG terminal. J. Loss Prev. Process Ind. 2019, 61, 104–113. [CrossRef]
41. Khan, M.S.; Effendy, S.; Karimi, I.A.; Wazwaz, A. Improving design and operation at LNG regasificationterminals through a corrected storage tank model. Appl. Therm. Eng. 2019, 149, 344–353. [CrossRef]
42. Pokkatt, P.P.; Srinivasan, R. Effect of Ambient Conditions on Boil Off Gas Generation in LNG regasificationterminals. In Computer Aided Chemical Engineering; Kiss, A.A., Zondervan, E., Lakerveld, R., Özkan, L., Eds.;Elsevier: Amsterdam, The Netherlands, 2019; Volume 46, pp. 445–450.
43. Reddy, H.V.; Bisen, V.S.; Rao, H.N.; Dutta, A.; Garud, S.S.; Karimi, I.A.; Farooq, S. Towards energy-efficientLNG terminals: Modeling and simulation of reciprocating compressors. Comput. Chem. Eng. 2019, 128,312–321. [CrossRef]
44. DoD. Systems Engineering Fundamentals: Supplementary Text; Systems Management College: Fort Belvoir, VA,USA, 2001.
45. Grady, J.O. System Requirements Analysis, 2nd ed.; Elsevier: Oxford, UK, 2014; pp. 1–801.46. NASA. NASA Systems Engineering Handbook; NASA Headquarters: Washington, DC, USA, 2007.47. Grady, J.O. System Requirements Analysis; Elsevier: Amsterdam, The Netherlands, 2006.48. Spitz, T.; Chalmers, H.; Ascui, F.; Lucquiaud, L. Operating Flexibility of CO2 Injection Wells in Future Low
Carbon Energy System. Energy Procedia 2017, 114, 4797–4810. [CrossRef]49. IEAGHG. Operational Flexibility of CO2 Transport and Storage; IEAGHG: Cheltenham, UK, 2016.50. DNV. CO2RISKMAN. Guideance on CCS CO2 Safety and Environment, Major Accident Hazard Risk Management,
Level 4—Specific CCS Chain Guidance; DNV-GL: Oslo, Norway, 2013; p. 307.51. Incropera, F.P. Fundamentals of Heat and Mass Transfer; John Wiley: Hoboken, NJ, USA, 2007; p. 1032.52. ASME. BPVC Section VIII-Rules for Construction of Pressure Vessels Division 2-Alternative Rules; The American
Society of Mechanical Engineers: New York, NY, USA, 2015.53. Yoo, B.-Y. An Experimental Study on the Thermocline Layer in a Cargo Tank of CO2 Carriers; Seoul National
University: Seoul, Korea, 2011.54. Thomas, K. What Are the Prospects for LNG-Carrier Tonne-Mile Demand to 2020? Available online:
http://www.lngworldshipping.com/news/view,what-are-the-prospects-for-lngcarrier-tonnemile-demand-to-2020_46622.htm (accessed on 2 February 2018).
55. Niu, W.C.; Li, G.L.; Ju, Y.L.; Fu, Y.Z. Design and analysis of the thermal insulation system for a newindependent type B LNG carrier. Ocean Eng. 2017, 142, 51–61. [CrossRef]
56. Lv, D.; Tan, W.; Liu, L.; Zhu, G.; Peng, L. Research on maximum explosion overpressure in LNG storage tankareas. J. Loss Prev. Process Ind. 2017, 49, 162–170. [CrossRef]
57. Casal, A.; Olsen, H. Operational risks in QRAs. Chem. Eng. Trans. 2016, 48, 589–594.58. Tan, H.; Zhao, Q.; Sun, N.; Li, Y. Enhancement of energy performance in a boil-off gas re-liquefaction system
of LNG carriers using ejectors. Energy Convers. Manag. 2016, 126, 875–888. [CrossRef]
© 2019 by the authors. Licensee MDPI, Basel, Switzerland. This article is an open accessarticle distributed under the terms and conditions of the Creative Commons Attribution(CC BY) license (http://creativecommons.org/licenses/by/4.0/).