
The Servet 3.0 benchmark suite: Characterization of network performance degradation
18
The Servet 3.0 Benchmark Suite: Characterization of Network Performance Degradation Jorge Gonz´ alez-Dom´ ınguez * , Mar´ ıa J. Mart´ ın, Guillermo L. Taboada, Roberto R. Exp´ osito, Juan Touri˜ no Computer Architecture Group, Department of Electronics and Systems, University of A Coru˜ na Campus de Elvi˜ na s/n, 15071 A Coru˜ na, Spain Abstract Servet is a suite of benchmarks focused on extracting a set of parameters with high influence on the overall performance of multicore clusters. These parameters can be used to optimize the performance of parallel applications by adapting part of their behavior to the characteristics of the machine. Up to now the tool considered network bandwidth as constant and independent of the communication pattern. Nev- ertheless, the inter-node communication bandwidth decreases on modern large supercomputers depending on the number of cores per node that simultaneously access the network and on the distance between the communicating nodes. This paper describes two new benchmarks that improve Servet by characterizing the network performance degradation depending on these factors. This work also shows the experimental results of these benchmarks on a Cray XE6 supercomputer and some examples of how real parallel codes can be optimized by using the information about network degradation. Keywords: Multicore Cluster, Benchmarking, Network Performance, Performance Degradation, Network Congestion * Principal corresponding author: Jorge Gonz´alez-Dom´ ınguez; Tel.: +34-981-167000 (Ext 1376); fax: +34-981-167160 Email addresses: [email protected] (JorgeGonz´alez-Dom´ ınguez), [email protected] (Mar´ ıa J. Mart´ ın), [email protected] (Guillermo L. Taboada), [email protected] (Roberto R. Exp´ osito), [email protected] (Juan Touri˜ no) Preprint submitted to Computers and Electrical Engineering. August 28, 2013
Transcript of The Servet 3.0 benchmark suite: Characterization of network performance degradation
The Servet 3.0 Benchmark Suite: Characterization of Network PerformanceDegradation
Jorge Gonzalez-Domınguez∗, Marıa J. Martın, Guillermo L. Taboada, Roberto R. Exposito, Juan Tourino
Computer Architecture Group, Department of Electronics and Systems, University of A CorunaCampus de Elvina s/n, 15071 A Coruna, Spain
Abstract
Servet is a suite of benchmarks focused on extracting a set of parameters with high influence on the
overall performance of multicore clusters. These parameters can be used to optimize the performance of
parallel applications by adapting part of their behavior to the characteristics of the machine. Up to now
the tool considered network bandwidth as constant and independent of the communication pattern. Nev-
ertheless, the inter-node communication bandwidth decreases on modern large supercomputers depending
on the number of cores per node that simultaneously access the network and on the distance between the
communicating nodes. This paper describes two new benchmarks that improve Servet by characterizing
the network performance degradation depending on these factors. This work also shows the experimental
results of these benchmarks on a Cray XE6 supercomputer and some examples of how real parallel codes
can be optimized by using the information about network degradation.
Keywords: Multicore Cluster, Benchmarking, Network Performance, Performance Degradation, Network
Congestion
∗Principal corresponding author: Jorge Gonzalez-Domınguez; Tel.: +34-981-167000 (Ext 1376); fax: +34-981-167160
Email addresses: [email protected] (Jorge Gonzalez-Domınguez), [email protected] (Marıa J. Martın), [email protected]
(Guillermo L. Taboada), [email protected] (Roberto R. Exposito), [email protected] (Juan Tourino)
Preprint submitted to Computers and Electrical Engineering. August 28, 2013
1. Introduction
The growing complexity in computer system hierarchies due to the increase of the number of cores
per processor, levels of cache (some of them shared) and processors per node, as well as the high-speed
interconnects, demands the use of new optimization techniques and libraries to get the most from their
features. Most of the approaches in the state of the art focus on minimizing the communication time.
Some examples are the communication avoiding algorithms [1, 2], the improvement of collective operations
through the modification of their underlying algorithms [3, 4] or the use of efficient mapping policies [5, 6].
All these techniques need some knowledge about architectural parameters and hardware characteristics.
However, the system parameters and specifications are usually vendor-dependent and often inaccessible to
user applications. Servet [7] is a portable tool designed to obtain through benchmarking relevant hardware
parameters of multicore clusters and thus support the automatic optimization of parallel codes on these
architectures. It provides information about cache size and hierarchy, bottlenecks in memory access and
intra-node communication overheads [8], as well as a mechanism to provide efficient process mappings based
on these parameters [9]. Servet also includes an API that applications can use to access the extracted
parameters.
Regarding inter-node communication, Servet assumes constant bandwidth and latency. However, this
assumption is not completely accurate for current large supercomputers, where multiple cores share the
same resources. On the one hand, in presence of congestion, very busy networks present a performance
degradation when increasing the distance of the nodes that are communicating, at least in the prevailing 3D
torus topology [10]. On the other hand, the communication time also increases if several cores within the
same node share hardware to access the network and send simultaneous messages.
This paper presents two new benchmarks that characterize these two types of communication perfor-
mance degradation, as well as the new functions included in the Servet’s API to get this information from
inside any code. Furthermore, the process mapping algorithm presented in [9] is also improved by consider-
ing the impact of this degradation. Experimental results prove that the characterization of the performance
degradation is useful to optimize parallel applications.
The rest of the paper is organized as follows. Section 2 summarizes previous works on obtaining hardware
parameters, specially those related to communications. Section 3 presents an overview of Servet. Section 4
explains the novelties included in Servet to deal with performance degradation in inter-node communications:
two new benchmarks, new API functions and the improvement of the process mapping algorithm. Section 5
shows the results obtained by these benchmarks on a large Cray XE6 supercomputer. Section 6 describes
some optimization techniques that take advantage of the knowledge about this degradation and presents
some experimental results that prove their usability for real parallel applications. Finally, concluding remarks
are presented in Section 7.
2
2. Related Work
Several works tackled the topic of identifying the topology of parallel systems in order to provide support
for optimization techniques. The information about which cores are grouped in processors, cells or nodes is
often used to implement efficient process mappings. One of the most well-known and constantly evolving tool
is hwloc [11, 12], which uses standard OS information to provide a portable abstraction of the hierarchical
topology of modern architectures. However, the OS does not always provide all the needed information or
it could be even inaccurate due to system updates.
Benchmarking has been proved to be a more portable and precise mechanism to obtain hardware param-
eters. One of the pioneering works focused on extracting the architecture topology through benchmarking
is X-Ray [13], which automatically provides some characteristics of the CPU and the cache hierarchy for
unicore systems. It was extended for multicore systems in [14]. Different algorithms taken from previous
works (Servet among them) were integrated in [15] to improve the accuracy of the results. In this work
different benchmarks are executed to estimate each parameter and, if the estimations vary, the authors arbi-
trate among them to provide the correct result. Benchmarks to obtain topology features of shared memory
systems were presented in [16].
All the previous works are completely focused on the topology of multicore architectures but they do not
pay attention to important features for supercomputers such as bandwidths and latencies of interconnection
networks. Once known the internal topology of the nodes, most works usually employ a model, such as the
LogP family [17, 18], to characterize the communication costs. Inter-node communications are assumed to
be more expensive than intra-node ones [19, 20]. However, the distance between the communicating nodes
and the total number of messages in the network are not considered as relevant factors. These assumptions
were appropriate during years because these factors did not have great influence on high-speed networks
thanks to the development of techniques such as cut-through or wormhole routing. However, close to the
Exascale era, extremely large systems are being built. In these systems interconnects are shared among
many nodes, each of them with many cores that can send messages at the same time. Bhatele and Kale
demonstrate in [10] that, in very large supercomputers with 3D torus networks, such as IBM BlueGene and
Cray XT families, the latency increases when sending messages to very distant nodes. The reason is that the
longer the distance is, the more links of the network the messages have to cross, sharing the network capacity
with other messages. Our characterization of the inter-node communication performance degradation on
large supercomputers is motivated by the conclusions of this previous work.
3. The Servet Benchmark Suite
Servet [7, 8] is a portable suite of benchmarks to obtain the most important hardware parameters and
thus support the automatic optimization of parallel applications. The Servet benchmarks determine the
3
number of cache levels, their sizes, the cache topology of shared caches, the memory access bottlenecks, and
the communications scalability and overheads. The main advantage over other similar tools [11, 13, 14, 16]
is that Servet does not limit to detect the intra-node topology but it also characterizes possible performance
overheads caused by memory accesses or different intra-node communication layers. Additionally, Servet
provides information about inter-node communications as its target systems are multicore clusters.
Among other uses, the information provided by Servet can be employed to automatically map processes
to certain cores in order to avoid either communication or memory access bottlenecks. Even if not all the
overheads can be avoided, mappings that minimize their impact can be applied. Servet includes an algorithm
that generates the most efficient mapping of processes to specific cores. This algorithm was widely described
and tested in [9]. The mapping is based on the information about shared caches, overheads in the memory
accesses and the different communication layers provided by Servet, and requires the characterization of
the code as memory bound or communication intensive. Each core in the system is assigned a weight that
represents its overhead cost. All the weights are initially set to 0 and, once a specific core is selected, the
weights of the others are updated according to the following rules:
1. The weights of the cores that share cache with the selected one are increased. This rule is applied for
each cache level to avoid the loss of performance when shared caches lead to an increase of the number
of cache misses.
2. The weights of the cores that show additional overhead when accessing memory concurrently with the
selected core are increased.
3. The weights of the cores whose communication latencies with the selected one are significantly lower
than the maximum latency in the system are decreased to promote their selection. They are decreased
in a magnitude that depends on the difference between the current and the maximum latency.
In a memory bound code the increase due to rules 1 and 2 is ten times larger than the decrease applied
by rule 3. In a communication intensive code the opposite practice is applied.
Servet also provides an API to easily access the extracted hardware parameters and the optimal process
mapping from inside the parallel applications. Servet saves the obtained parameters and data into a text file
and the API provides functions to access the information stored into this file. When an application requires
information about the hardware characteristics it resorts to calling the API of Servet instead of running any
benchmark. Therefore, the overhead introduced into the applications is almost negligible.
This work extends Servet by including new benchmarks to characterize the network performance degra-
dation in large-scale systems.
4
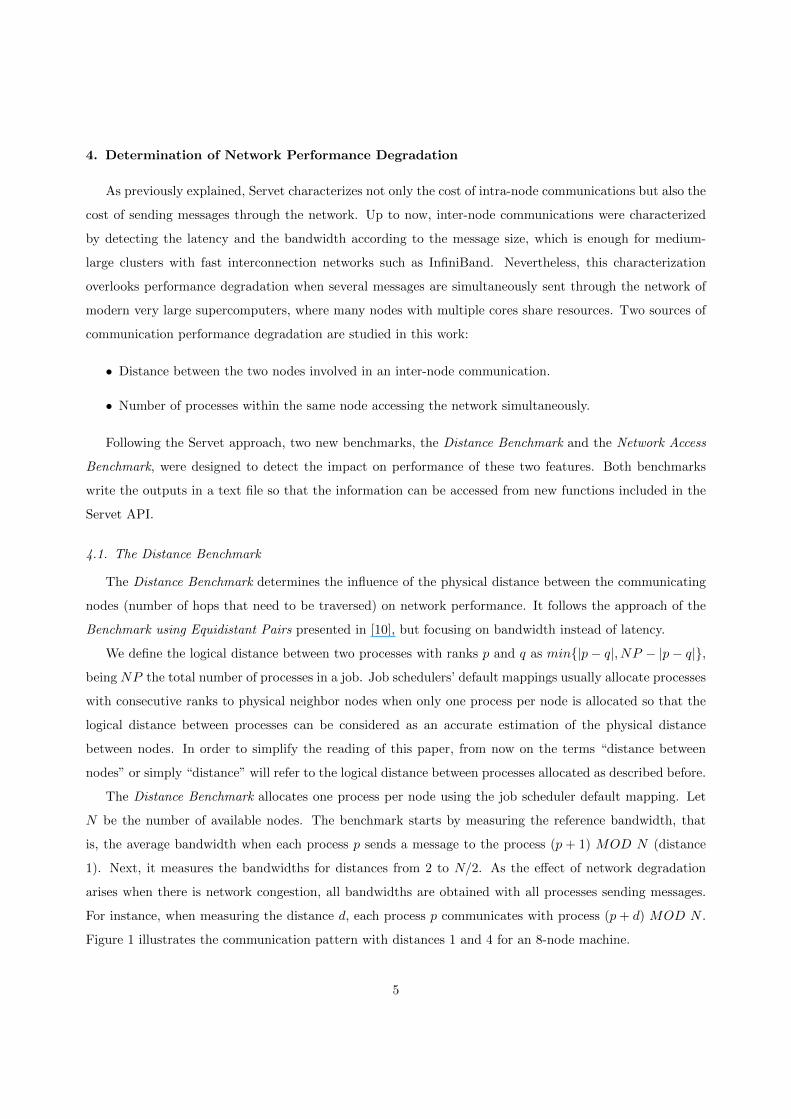
4. Determination of Network Performance Degradation
As previously explained, Servet characterizes not only the cost of intra-node communications but also the
cost of sending messages through the network. Up to now, inter-node communications were characterized
by detecting the latency and the bandwidth according to the message size, which is enough for medium-
large clusters with fast interconnection networks such as InfiniBand. Nevertheless, this characterization
overlooks performance degradation when several messages are simultaneously sent through the network of
modern very large supercomputers, where many nodes with multiple cores share resources. Two sources of
communication performance degradation are studied in this work:
• Distance between the two nodes involved in an inter-node communication.
• Number of processes within the same node accessing the network simultaneously.
Following the Servet approach, two new benchmarks, the Distance Benchmark and the Network Access
Benchmark, were designed to detect the impact on performance of these two features. Both benchmarks
write the outputs in a text file so that the information can be accessed from new functions included in the
Servet API.
4.1. The Distance Benchmark
The Distance Benchmark determines the influence of the physical distance between the communicating
nodes (number of hops that need to be traversed) on network performance. It follows the approach of the
Benchmark using Equidistant Pairs presented in [10], but focusing on bandwidth instead of latency.
We define the logical distance between two processes with ranks p and q as min{|p− q|, NP − |p− q|},
being NP the total number of processes in a job. Job schedulers’ default mappings usually allocate processes
with consecutive ranks to physical neighbor nodes when only one process per node is allocated so that the
logical distance between processes can be considered as an accurate estimation of the physical distance
between nodes. In order to simplify the reading of this paper, from now on the terms “distance between
nodes” or simply “distance” will refer to the logical distance between processes allocated as described before.
The Distance Benchmark allocates one process per node using the job scheduler default mapping. Let
N be the number of available nodes. The benchmark starts by measuring the reference bandwidth, that
is, the average bandwidth when each process p sends a message to the process (p + 1) MOD N (distance
1). Next, it measures the bandwidths for distances from 2 to N/2. As the effect of network degradation
arises when there is network congestion, all bandwidths are obtained with all processes sending messages.
For instance, when measuring the distance d, each process p communicates with process (p + d) MOD N .
Figure 1 illustrates the communication pattern with distances 1 and 4 for an 8-node machine.
5

Figure 1: Communication patterns with distances 1 and 4 in the Distance Benchmark.
As in most large supercomputers there are resource restrictions so that the users can run their codes with
only a subset of all nodes, the total number of nodes used to execute the benchmark (N) must be specified
by the user. Users can also set the message size used for communications, although a representative size of
32MB is selected by default.
The output of this benchmark is an array ratDist of size N/2 where the element ratDist[i] provides
the ratio between the reference bandwidth and the one obtained for a distance i. If the values of this
array increase with i, it can be concluded that the distance has a negative influence on the communication
performance.
4.2. The Network Access Benchmark
The Network Access Benchmark detects the overhead caused by the simultaneous accesses to the net-
work from different processes within the same node. This benchmark uses 2 ∗ NC processes, being NC
the number of cores per node. Initially the benchmark allocates one process per node and measures the
average bandwidth when all of them send a message to the next process (distance 1). This is the reference
bandwidth, where only one process per node accesses the network. Next, the benchmark measures the av-
erage bandwidths when increasing the number of processes per node but keeping constant the total number
of processes, until all the cores within each node are used. The processes always send the message to the
next node (distance 1) in order to avoid the influence of the distance. Furthermore, as the total number
of processes remains constant, the total number of messages sent is the same in all cases. Therefore, the
differences in bandwidth results are only caused by the shared accesses. It must be remarked that, within
a node, the cores to which the processes are mapped are evenly distributed. For instance, if the experiment
with two processes per node is being run on a machine with two processors per node, one core per processor
is selected.
Similarly to the previous benchmark, the user can choose the message size, although a representative
value of 32MB is provided by default. The output is an array ratNC of size NC, where ratNC[i] keeps the
ratio between the reference bandwidth and the one using i processes per node.
One of the applications of the Network Access Benchmark is to improve the mapping algorithm explained
6
in [9] and summarized in Section 3 by using the information stored in the array ratNC. Specifically, a new
rule is added to update the weights of the cores:
• The weights of the cores that show ratios higher than 1.5 when accessing the network at the same time
that the selected core are increased. The groups of cores that present overhead when concurrently
accessing the network are easily identified using the information provided by ratNC and knowing that
the benchmark evenly maps processes to cores within the same node.
As this new benchmark identifies communication overheads, the increase of the weights is ten times larger
for communication intensive than for memory bound codes. The mapping algorithm using this benchmark
will be experimentally assessed in Section 6.2.
4.3. The Servet API
The Servet API was extended in order to make the information about the communication performance
degradation easily accessible to parallel applications. A structure (or descriptor) named degr desc is used to
keep this information. Users do not need to know the name and type of the fields included in this structure
as they must simply load and release the information using the following functions:
• int load degr info(degr desc *degr info). It reads the values of the ratDist and ratNC arrays
from the text file and fills all the fields of the structure.
• void release degr info(degr desc *degr info). It releases all the information stored in the struc-
ture and deallocates the necessary internal variables.
Once the information is loaded in the structure, the following functions can be used to extract the
information about performance degradation:
• double get network dist ratio(degr desc *degr info, int dist). It returns the ratio between
the reference bandwidth and the bandwidth when communicating with distance dist in presence of
network congestion (i.e. ratDist[dist]).
• double get network access ratio(degr desc *degr info, int nprocs per node). It returns the
ratio between the reference bandwidth of this benchmark and the bandwidth when nprocs per node
processes within the same node access the network at the same time (i.e. ratNC[nprocs per node]).
5. Characterization of the Degradation on a Cray XE6 System
HECToR [21], a very large Cray XE6 supercomputer installed at the Edinburgh Parallel Computing
Center (EPCC), has been used to run the new benchmarks explained in the previous section, determine if
7
they provide correct estimations and test if the results are helpful so that parallel codes can obtain better
performance on this kind of machines.
HECToR has 90,112 cores and 90TB of memory and it was ranked 35th in the November 2012 TOP500
list [22]. The system consists of 2,816 nodes, each of them with two AMD Interlagos processors with 16
cores (grouped in two NUMA regions, with 8 cores each) at 2.3GHz and 16GB of memory. The cache
topology is complex: each core has an independent 16KB L1 cache, whereas the L2 (2MB) and L3 (8MB)
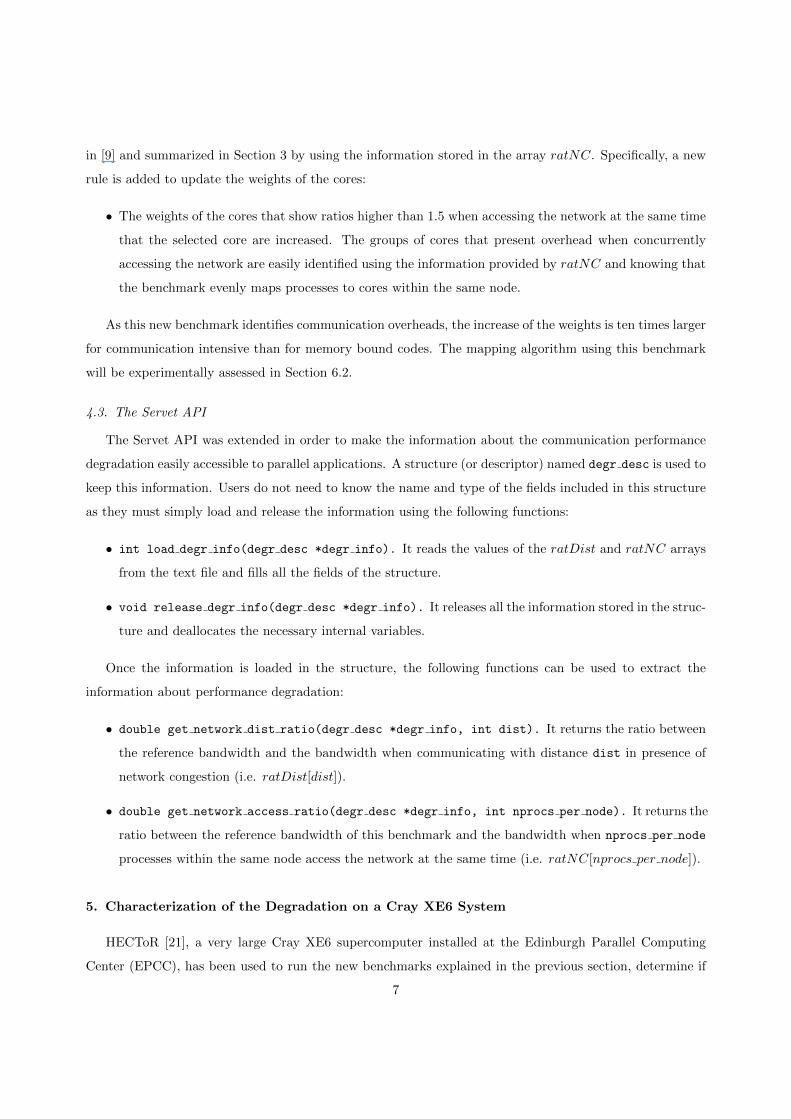
caches are shared by groups of four and eight cores, respectively. Figure 2 illustrates the architecture of
a node. Inter-node communications are performed through the custom Cray Gemini Network, which is
a high-bandwidth and low-latency 3D torus interconnect with RDMA hardware support that facilitates
communication overlapping. Servet was compiled with Cray MPI available in the Cray CC compiler 8.0.4.
This machine is a more modern system than the ones studied in [10], but with similar characteristics (very
large supercomputer with 3D interconnection network).
Figure 2: Intra-node architecture of HECToR.
Servet accurately extracts the cache topology (not only their sizes but also which caches are shared by
which cores). Furthermore, the tool concludes that there is no overhead caused by concurrent memory
accesses and therefore the intra-node communication bandwidth when sending messages between a pair of
cores is constant, that is, it is independent of the connected cores.
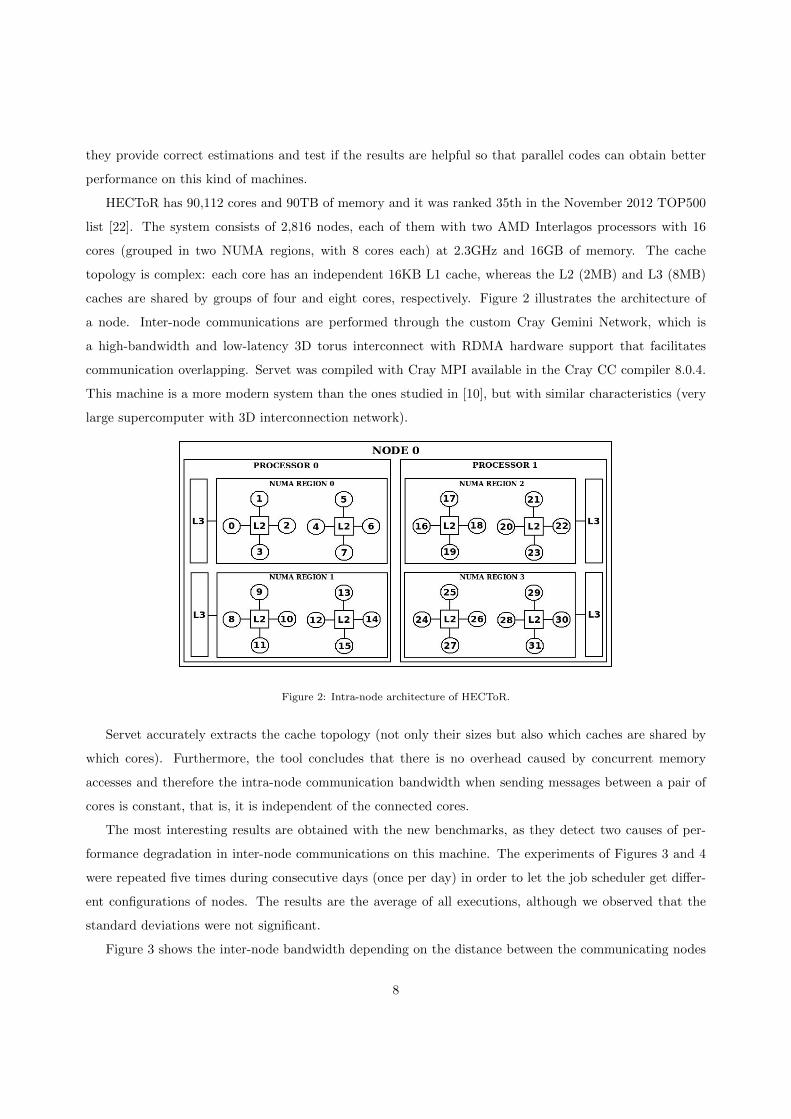
The most interesting results are obtained with the new benchmarks, as they detect two causes of per-
formance degradation in inter-node communications on this machine. The experiments of Figures 3 and 4
were repeated five times during consecutive days (once per day) in order to let the job scheduler get differ-
ent configurations of nodes. The results are the average of all executions, although we observed that the
standard deviations were not significant.
Figure 3 shows the inter-node bandwidth depending on the distance between the communicating nodes
8
400
500
600
700
800
900
1000
1100
1200
1 2 4 8 16 32
Bandw
idth
(M
B/s
)
Distance between Nodes
Network performance with messages of 32MB
(1.00)
(1.07)
(1.15)
(1.28)
(1.61)
(2.60)
Bandwidth
Figure 3: Inter-node communication bandwidth depending on the distance in presence of network congestion. The ratDist
values are in parentheses.
100
200
300
400
500
600
700
800
900
1000
1100
1200
1 2 4 8 16 32
Bandw
idth
(M
B/s
)
Number of Processes per Node
Network performance with messages of 32MB
(1.00) (1.02)
(1.54)
(2.07)
(2.94)
(5.97)
Bandwidth
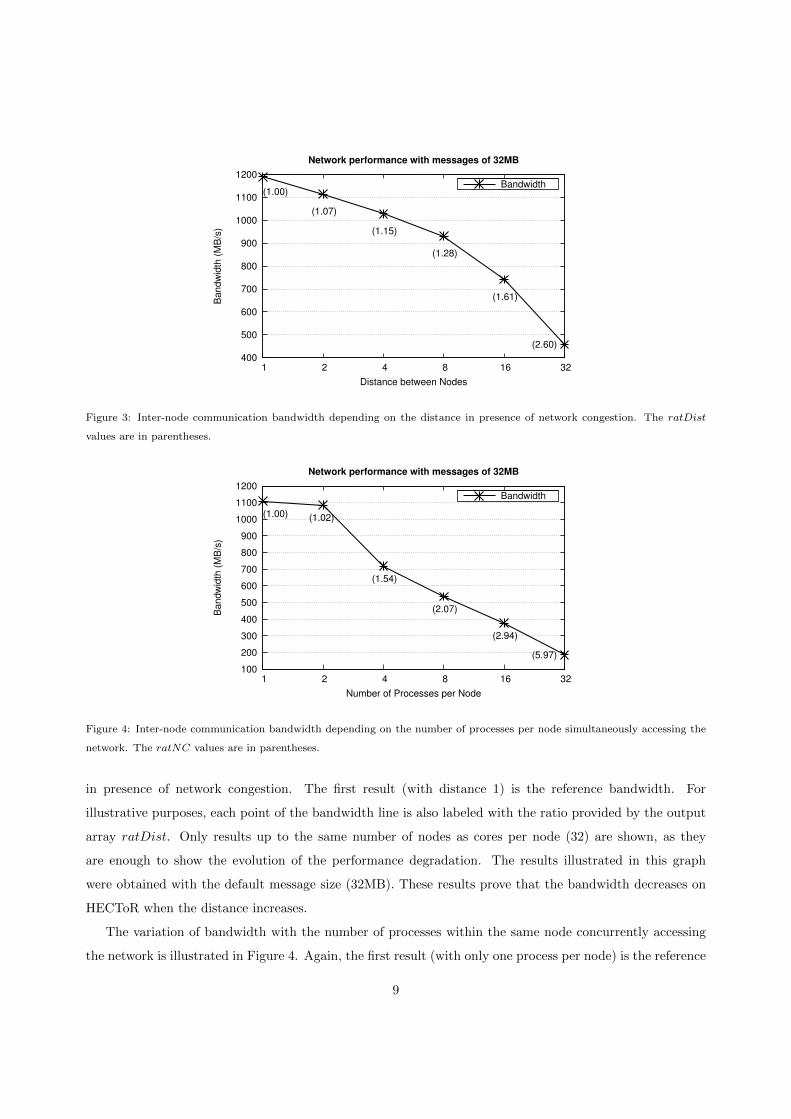
Figure 4: Inter-node communication bandwidth depending on the number of processes per node simultaneously accessing the
network. The ratNC values are in parentheses.
in presence of network congestion. The first result (with distance 1) is the reference bandwidth. For
illustrative purposes, each point of the bandwidth line is also labeled with the ratio provided by the output
array ratDist. Only results up to the same number of nodes as cores per node (32) are shown, as they
are enough to show the evolution of the performance degradation. The results illustrated in this graph
were obtained with the default message size (32MB). These results prove that the bandwidth decreases on
HECToR when the distance increases.
The variation of bandwidth with the number of processes within the same node concurrently accessing
the network is illustrated in Figure 4. Again, the first result (with only one process per node) is the reference
9
bandwidth of the benchmark and the ratios (values of the array ratNC) are indicated with labels for each
point of the bandwidth line. The line starts showing no significant difference between using one or two
processes per node. Note that this Cray machine has two processors per node and the benchmark allocates
processes to cores evenly distributed. Therefore, each process is allocated in a different processor when using
two processes per node. Hence, the results indicate that there is no overhead when accessing the network from
different processors although they are within the same node. Nevertheless, network performance decreases
for experiments with more processes (≥ 4) within the same node, which means that concurrent accesses
from cores within the same processor penalize performance significantly.
6. Optimization of Parallel Applications Using Servet
If Servet is previously installed and executed on the system, parallel codes can use its API to obtain
some hardware parameters and automatically adapt their behavior to the characteristics of the machine. For
instance, the use of Servet to optimize some routines of a parallel numerical library was presented in [23].
Moreover, a previous work [9] proved that the process mapping included in Servet is useful to increase
the performance of the NAS Parallel Benchmarks (NPB) [24]. This section focuses on optimizations using
the information about the network performance degradation presented in this work. The techniques here
proposed are only some optimization examples.
6.1. Selection of the Most Suitable Communication Pattern
The network performance degradation associated to the distance between the communicating nodes could
cause that some parallel codes that perform reasonably well on medium-large systems present a considerable
overhead when using a significant number of nodes on extremely large supercomputers. The more distance
there is between the communicating nodes the greater the overhead is. Therefore, decreasing the average
communication distance is always a good policy.
Depending on the characteristics of the code, this reduction could involve complex modifications in the
source code that would require huge programming efforts. Nevertheless, in other scenarios, simple changes
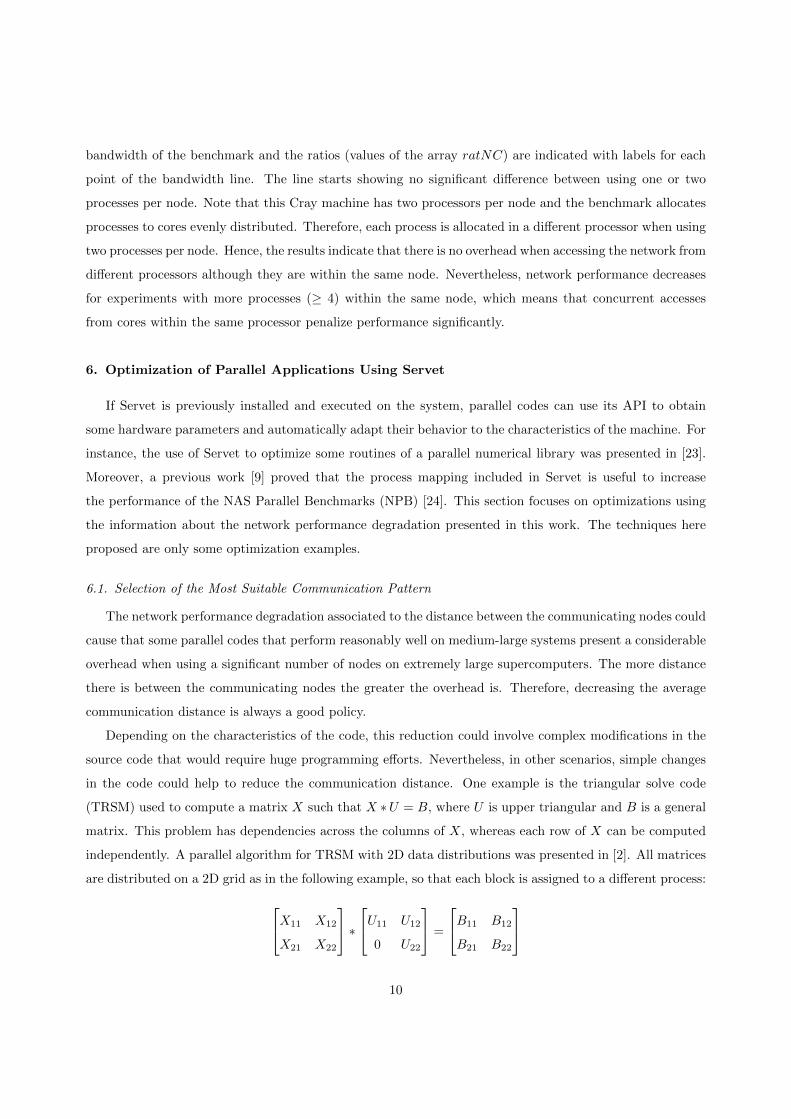
in the code could help to reduce the communication distance. One example is the triangular solve code
(TRSM) used to compute a matrix X such that X ∗U = B, where U is upper triangular and B is a general
matrix. This problem has dependencies across the columns of X, whereas each row of X can be computed
independently. A parallel algorithm for TRSM with 2D data distributions was presented in [2]. All matrices
are distributed on a 2D grid as in the following example, so that each block is assigned to a different process:
X11 X12
X21 X22
∗U11 U12
0 U22
=
B11 B12
B21 B22
10
At each step of the 2D algorithm, a block-column of X is computed. This block-column can then be
used to update the trailing matrix B. In particular, for the previous example the computation proceeds as
follows:
1. Broadcast U11 and U12 vertically (↓)
2. Solve column 1: X11 = B11 ∗ U−111 and X21 = B21 ∗ U−1
11
3. Broadcast X11 and X21 horizontally (→)
4. Compute update: B12 = B12 −X11 ∗ U12 and B22 = B22 −X21 ∗ U12
5. Broadcast U22 vertically (↓ ↑)
6. Solve column 2: X12 = B12 ∗ U−122 and X22 = B22 ∗ U−1
22
The communications present in this algorithm are broadcasts along rows and columns of the grid. On the
one hand, the broadcasts along columns (vertical) involve the blocks of U . As this matrix is triangular, the
number of blocks to send decreases in each step. On the other hand, the broadcasts along rows (horizontal),
which involve the dense matrix X, do not decrease. Consequently, the total amount of communications in
the broadcasts along rows is more significant than along columns. As illustrated in Figure 3, the output
array of the Distance Benchmark indicated that the communication performance on HECToR decreases
with the distance in presence of congestion. Therefore, this algorithm can be optimized by minimizing the
distance between the nodes involved in the horizontal broadcasts.
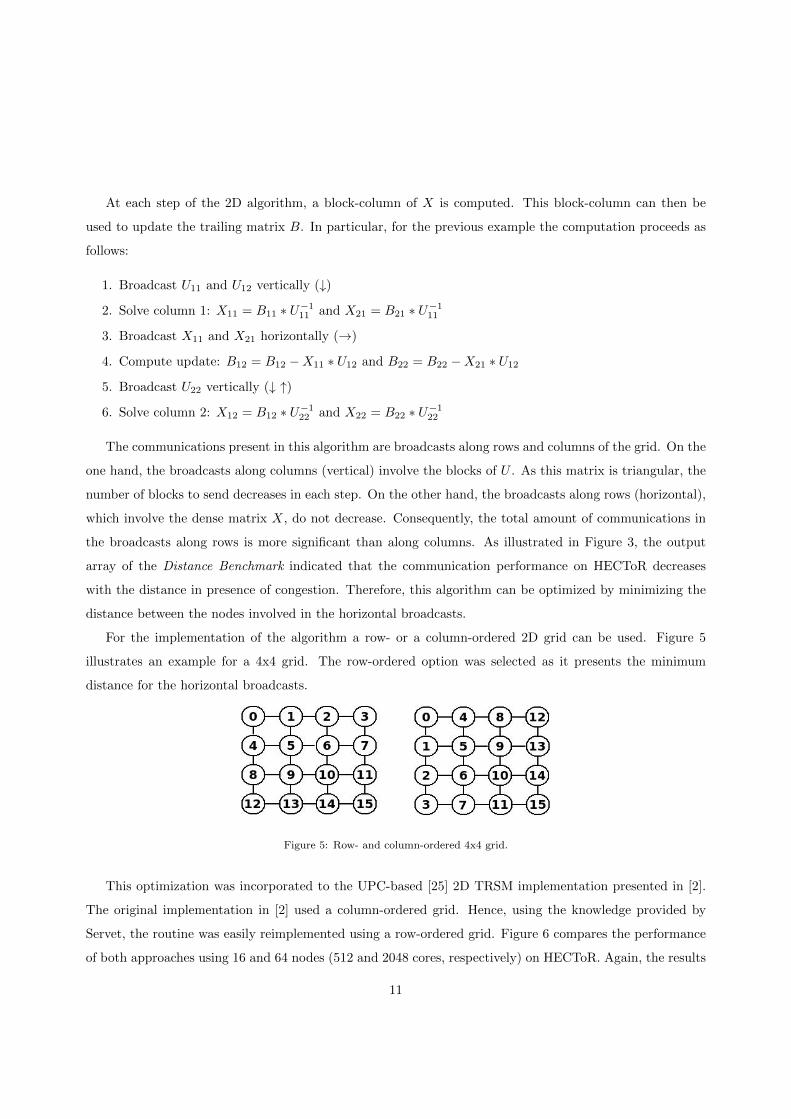
For the implementation of the algorithm a row- or a column-ordered 2D grid can be used. Figure 5
illustrates an example for a 4x4 grid. The row-ordered option was selected as it presents the minimum
distance for the horizontal broadcasts.
Figure 5: Row- and column-ordered 4x4 grid.
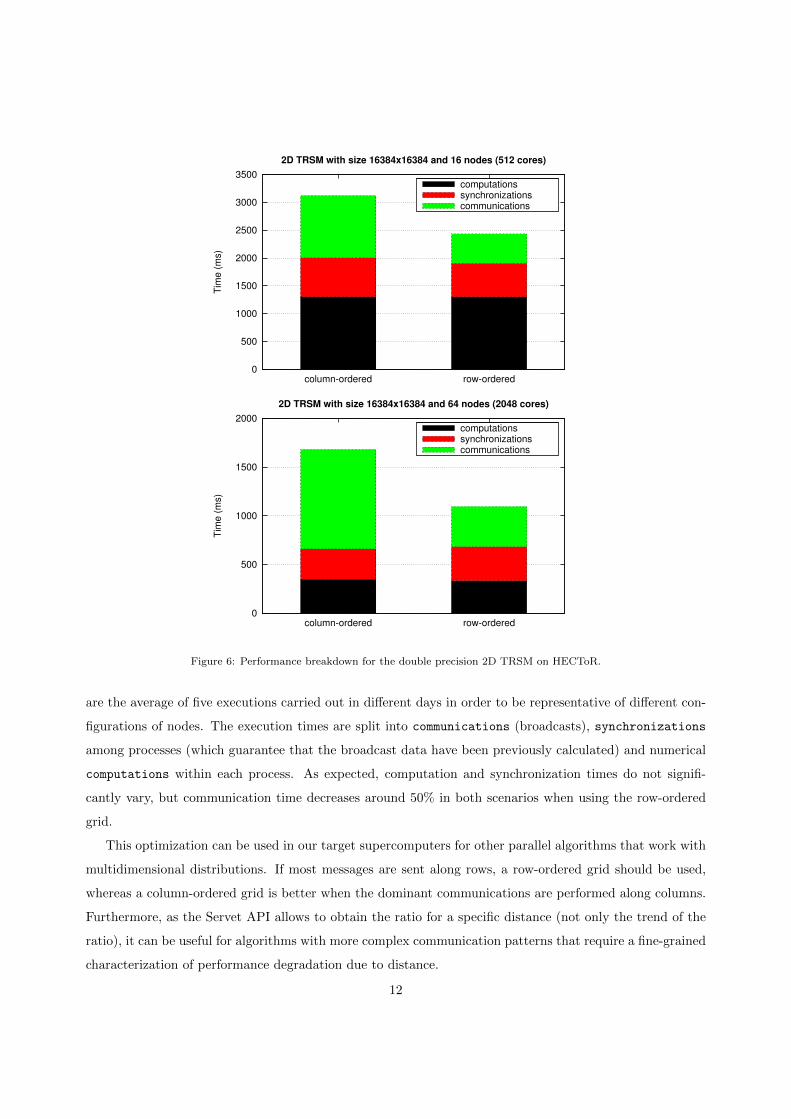
This optimization was incorporated to the UPC-based [25] 2D TRSM implementation presented in [2].
The original implementation in [2] used a column-ordered grid. Hence, using the knowledge provided by
Servet, the routine was easily reimplemented using a row-ordered grid. Figure 6 compares the performance
of both approaches using 16 and 64 nodes (512 and 2048 cores, respectively) on HECToR. Again, the results
11
0
500
1000
1500
2000
2500
3000
3500
column-ordered row-ordered
Tim
e (
ms)
2D TRSM with size 16384x16384 and 16 nodes (512 cores)
computationssynchronizationscommunications
0
500
1000
1500
2000
column-ordered row-ordered
Tim
e (
ms)
2D TRSM with size 16384x16384 and 64 nodes (2048 cores)
computationssynchronizationscommunications
Figure 6: Performance breakdown for the double precision 2D TRSM on HECToR.
are the average of five executions carried out in different days in order to be representative of different con-
figurations of nodes. The execution times are split into communications (broadcasts), synchronizations
among processes (which guarantee that the broadcast data have been previously calculated) and numerical
computations within each process. As expected, computation and synchronization times do not signifi-
cantly vary, but communication time decreases around 50% in both scenarios when using the row-ordered
grid.
This optimization can be used in our target supercomputers for other parallel algorithms that work with
multidimensional distributions. If most messages are sent along rows, a row-ordered grid should be used,
whereas a column-ordered grid is better when the dominant communications are performed along columns.
Furthermore, as the Servet API allows to obtain the ratio for a specific distance (not only the trend of the
ratio), it can be useful for algorithms with more complex communication patterns that require a fine-grained
characterization of performance degradation due to distance.
12
6.2. Efficient Proccess Mapping on Multicore Clusters
As explained in Section 4.2, the algorithm available in Servet to provide a process mapping according
to the characteristics of the machine (see Section 3) was improved by including a new rule that considers
the overhead due to concurrent accesses to the network. The new mapping can significantly improve the
performance of parallel applications on supercomputers with many nodes and many cores per node without
modifying the source code.
In this section the new mapping is tested on HECToR. In this testbed, Servet does not detect any overhead
caused by concurrent memory accesses or by any variance in the intra-node communication bandwidths.
Therefore, the mapping algorithm presented in [9] coincides with the one employed by default by the job
scheduler (usage of all cores available in each node). Nevertheless, the new algorithm presented in Section 4.2
takes into account the information about network degradation provided by the Network Access Benchmark
and represented in Figure 4, and consequently tries to allocate only one process per processor.
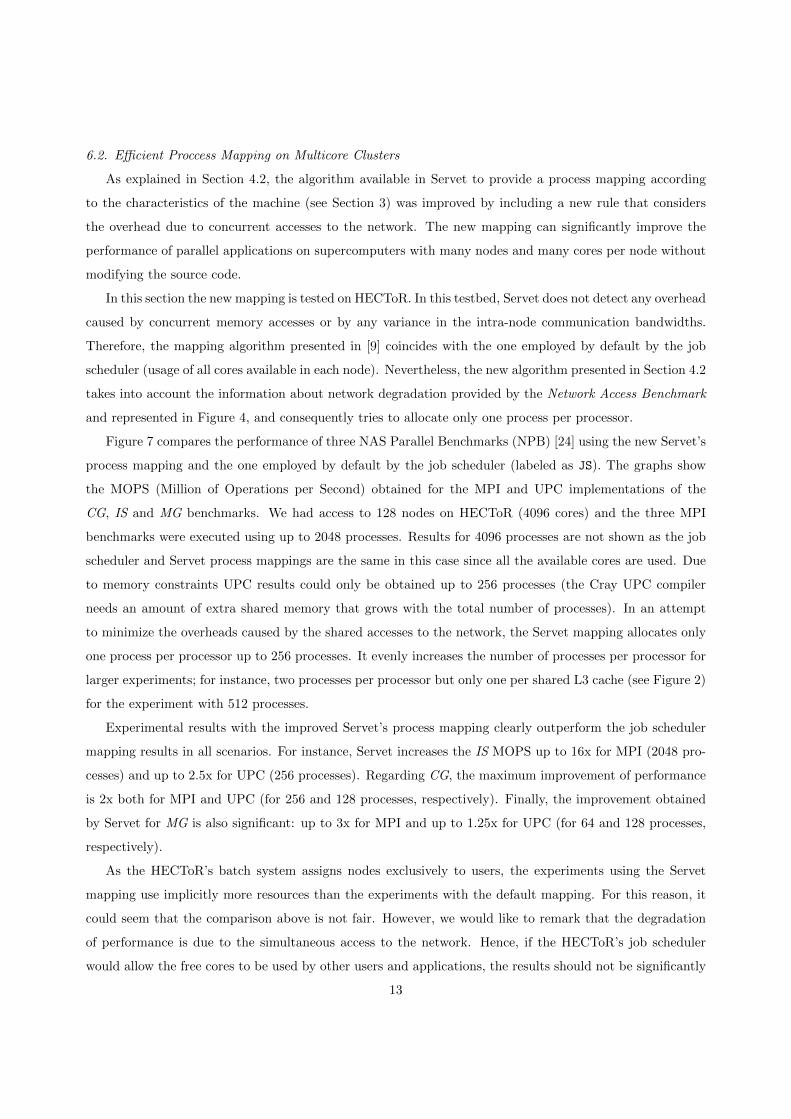
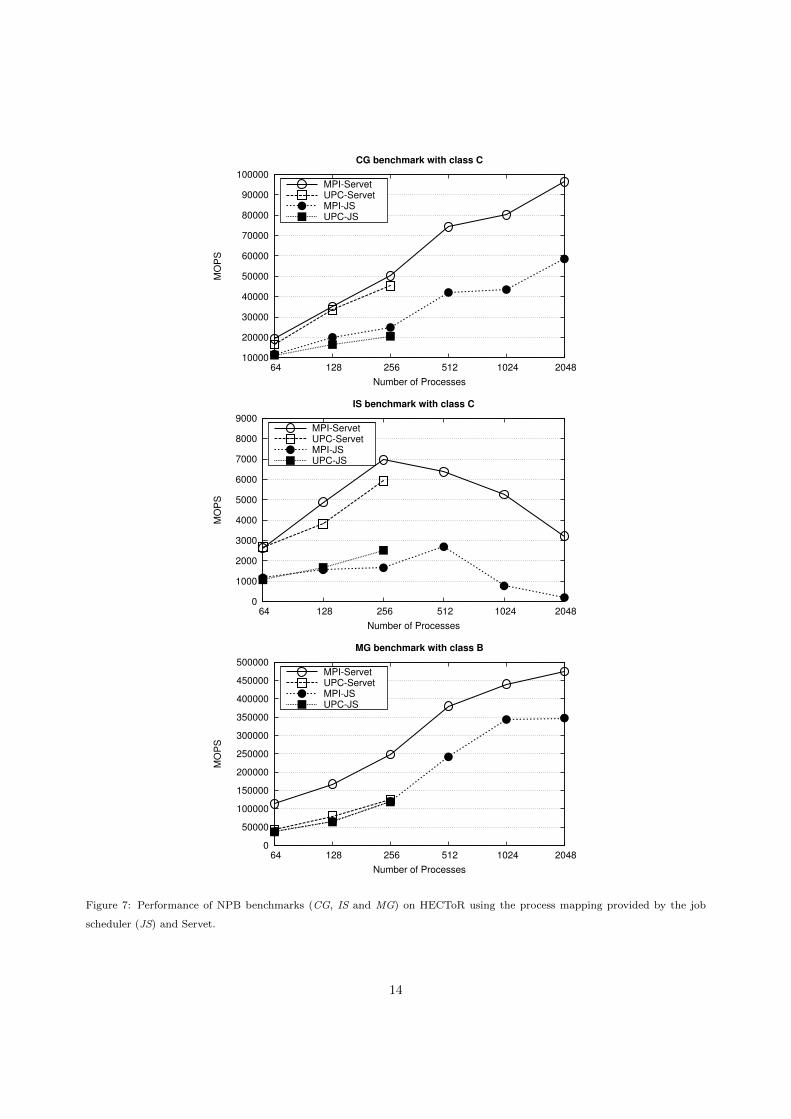
Figure 7 compares the performance of three NAS Parallel Benchmarks (NPB) [24] using the new Servet’s
process mapping and the one employed by default by the job scheduler (labeled as JS). The graphs show
the MOPS (Million of Operations per Second) obtained for the MPI and UPC implementations of the
CG, IS and MG benchmarks. We had access to 128 nodes on HECToR (4096 cores) and the three MPI
benchmarks were executed using up to 2048 processes. Results for 4096 processes are not shown as the job
scheduler and Servet process mappings are the same in this case since all the available cores are used. Due
to memory constraints UPC results could only be obtained up to 256 processes (the Cray UPC compiler
needs an amount of extra shared memory that grows with the total number of processes). In an attempt
to minimize the overheads caused by the shared accesses to the network, the Servet mapping allocates only
one process per processor up to 256 processes. It evenly increases the number of processes per processor for
larger experiments; for instance, two processes per processor but only one per shared L3 cache (see Figure 2)
for the experiment with 512 processes.
Experimental results with the improved Servet’s process mapping clearly outperform the job scheduler
mapping results in all scenarios. For instance, Servet increases the IS MOPS up to 16x for MPI (2048 pro-
cesses) and up to 2.5x for UPC (256 processes). Regarding CG, the maximum improvement of performance
is 2x both for MPI and UPC (for 256 and 128 processes, respectively). Finally, the improvement obtained
by Servet for MG is also significant: up to 3x for MPI and up to 1.25x for UPC (for 64 and 128 processes,
respectively).
As the HECToR’s batch system assigns nodes exclusively to users, the experiments using the Servet
mapping use implicitly more resources than the experiments with the default mapping. For this reason, it
could seem that the comparison above is not fair. However, we would like to remark that the degradation
of performance is due to the simultaneous access to the network. Hence, if the HECToR’s job scheduler
would allow the free cores to be used by other users and applications, the results should not be significantly
13
10000
20000
30000
40000
50000
60000
70000
80000
90000
100000
64 128 256 512 1024 2048
MO
PS
Number of Processes
CG benchmark with class C
MPI-Servet
UPC-Servet
MPI-JS
UPC-JS
0
1000
2000
3000
4000
5000
6000
7000
8000
9000
64 128 256 512 1024 2048
MO
PS
Number of Processes
IS benchmark with class C
MPI-Servet
UPC-Servet
MPI-JS
UPC-JS
0
50000
100000
150000
200000
250000
300000
350000
400000
450000
500000
64 128 256 512 1024 2048
MO
PS
Number of Processes
MG benchmark with class B
MPI-Servet
UPC-Servet
MPI-JS
UPC-JS
Figure 7: Performance of NPB benchmarks (CG, IS and MG) on HECToR using the process mapping provided by the job
scheduler (JS) and Servet.
14
0
0.2
0.4
0.6
0.8
1
1.2
1.4
1.6
1.8
2
256 512 1024 2048 4096
Speedup
Number of Processes
MPI NPB speedups allocating 128 nodes
CG-ServetIS-ServetMG-Servet
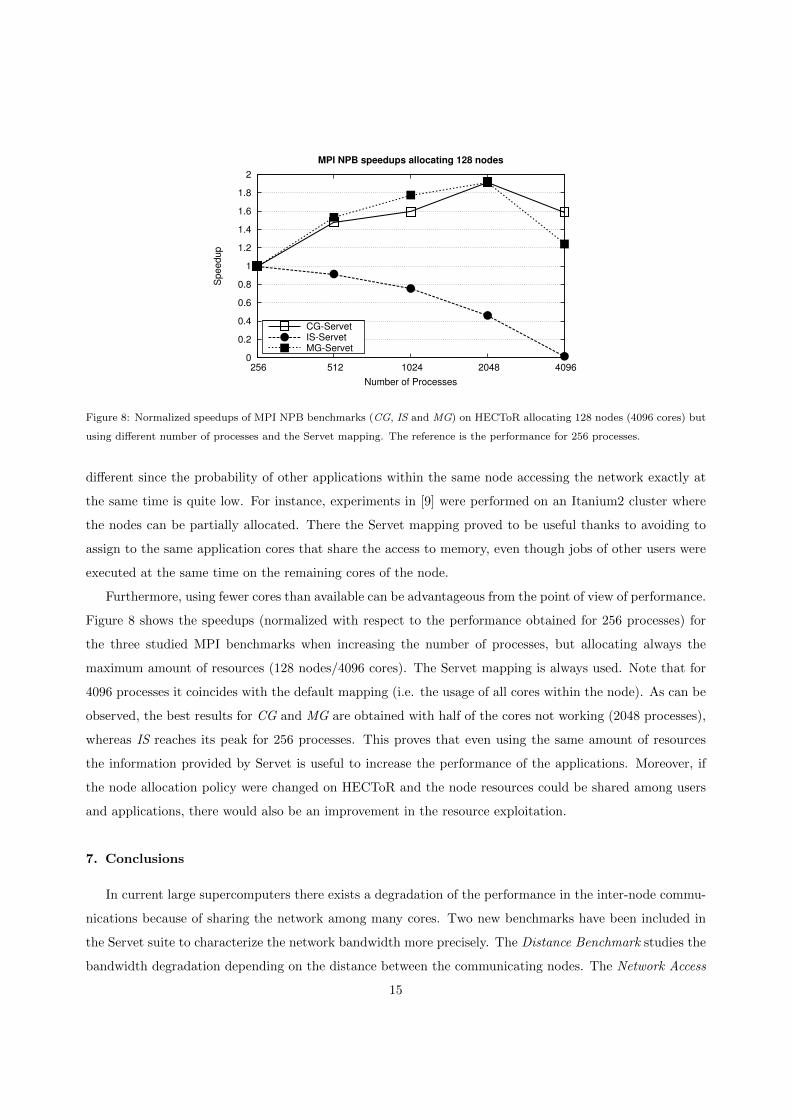
Figure 8: Normalized speedups of MPI NPB benchmarks (CG, IS and MG) on HECToR allocating 128 nodes (4096 cores) but
using different number of processes and the Servet mapping. The reference is the performance for 256 processes.
different since the probability of other applications within the same node accessing the network exactly at
the same time is quite low. For instance, experiments in [9] were performed on an Itanium2 cluster where
the nodes can be partially allocated. There the Servet mapping proved to be useful thanks to avoiding to
assign to the same application cores that share the access to memory, even though jobs of other users were
executed at the same time on the remaining cores of the node.
Furthermore, using fewer cores than available can be advantageous from the point of view of performance.
Figure 8 shows the speedups (normalized with respect to the performance obtained for 256 processes) for
the three studied MPI benchmarks when increasing the number of processes, but allocating always the
maximum amount of resources (128 nodes/4096 cores). The Servet mapping is always used. Note that for
4096 processes it coincides with the default mapping (i.e. the usage of all cores within the node). As can be
observed, the best results for CG and MG are obtained with half of the cores not working (2048 processes),
whereas IS reaches its peak for 256 processes. This proves that even using the same amount of resources
the information provided by Servet is useful to increase the performance of the applications. Moreover, if
the node allocation policy were changed on HECToR and the node resources could be shared among users
and applications, there would also be an improvement in the resource exploitation.
7. Conclusions
In current large supercomputers there exists a degradation of the performance in the inter-node commu-
nications because of sharing the network among many cores. Two new benchmarks have been included in
the Servet suite to characterize the network bandwidth more precisely. The Distance Benchmark studies the
bandwidth degradation depending on the distance between the communicating nodes. The Network Access
15
Benchmark detects possible overheads due to concurrent accesses to the network from cores within the same
node. These benchmarks were run on a very large Cray XE6 supercomputer that uses a custom network
with a 3D torus topology. The experimental results demonstrate that now Servet is able to accurately
characterize network performance degradation on this kind of systems.
Furthermore, the information about bandwidth degradation can be employed to optimize parallel ap-
plications. The algorithm available in Servet to provide an efficient process mapping according to the
characteristics of the architecture has been modified to take into account the possible overheads caused by
the simultaneous accesses to the network. Performance results using some of the widely extended NPB
benchmarks on the Cray XE6 machine were presented, proving that the modified algorithm can successfully
provide efficient process mappings for this type of architectures. Additionally, an example about how to
reduce the communication distance and thus improve the performance of numerical routines was also in-
cluded. It can be concluded that the reduction of the average distance between the communicating nodes is
always a good practice to improve performance on large supercomputers.
The benchmarks to detect network performance degradation, the functions of the API to obtain the
information from parallel applications and the improvement of the algorithm to provide efficient process
mappings will be included in the next release of Servet (version 3.0), publicly available under GPL license
at http://servet.des.udc.es.
Acknowledgments
This work was funded by the Ministry of Science and Innovation of Spain and FEDER funds of the
European Union (Project TIN2010-16735) and the Ministry of Education (FPU grants AP2008-01578 and
AP2010-4348). This work was carried out under the HPC-Europa2 Programme (project number 228398)
with the support of the European Commission Capacities Area-Research Infrastructures Initiative. This
work made use of the facilities of HECToR, the UK’s national High Performance Computing service, which
is provided by UoE HPCx Ltd. at the University of Edinburgh, Cray Inc. and NAG Ltd., and funded by
the Office of Science and Technology through EPSRC’s High End Computing Programme.
References
[1] E. Solomonik, J. Demmel, Communication-Optimal Parallel 2.5D Matrix Multiplication and LU Factorization Algorithms,
in: Proc. 17th Intl. European Conf. on Parallel and Distributed Computing (Euro-Par’11), Vol. 6853 of Lecture Notes in
Computer Science, Bordeaux, France, 2011, pp. 90–109.
[2] E. Georganas, J. Gonzalez-Domınguez, E. Solomonik, Y. Zheng, J. Tourino, K. Yelick, Communication Avoiding and
Overlapping for Numerical Linear Algebra, in: Proc. 24th ACM/IEEE Intl. Conf. for High Performance Computing,
Networking, Storage and Analysis (SC’12), Salt Lake City, UT, USA, 2012.
16
[3] K. Kandalla, H. Subramoni, A. Vishnu, D. K. Panda, Designing Topology-Aware Collective Communication Algorithms for
Large Scale InfiniBand Clusters: Case Studies with Scatter and Gather, in: Proc. 24th IEEE Intl. Parallel and Distributed
Processing Symp. (IPDPS’10), Atlanta, GA, USA, 2010.
[4] T. Hoefler, T. Schneider, Optimization Principles for Collective Neighborhood Communications, in: Proc. 24th ACM/IEEE
Intl. Conf. for High Performance Computing, Networking, Storage and Analysis (SC’12), Salt Lake City, UT, USA, 2012.
[5] E. Solomonik, A. Bhatele, J. Demmel, Improving Communication Performance in Dense Linear Algebra via Topology
Aware Collectives, in: Proc. 23rd ACM/IEEE Intl. Conf. for High Performance Computing, Networking, Storage and
Analysis (SC’11), Seattle, WA, USA, 2011.
[6] A. Bhatele, T. Gamblin, S. H. Langer, P.-T. Bremer, E. W. Draeger, B. Hamann, K. E. Isaacs, A. G. Landge, J. A. Levine,
V. Pascucci, M. Schulz, C. H. Still, Mapping Applications with Collectives over Sub-communicators on Torus Networks,
in: Proc. 24th ACM/IEEE Intl. Conf. for High Performance Computing, Networking, Storage and Analysis (SC’12), Salt
Lake City, UT, USA, 2012.
[7] The Servet Benchmark Suite, http://servet.des.udc.es/ (Last visited: August 2013).
[8] J. Gonzalez-Domınguez, G. L. Taboada, B. B. Fraguela, M. J. Martın, J. Tourino, Servet: A Benchmark Suite for
Autotuning on Multicore Clusters, in: Proc. 24th IEEE Intl. Parallel and Distributed Processing Symp. (IPDPS’10),
Atlanta, GA, USA, 2010.
[9] J. Gonzalez-Domınguez, G. L. Taboada, B. B. Fraguela, M. J. Martın, J. Tourino, Automatic Mapping of Parallel Appli-
cations on Multicore Architectures using the Servet Benchmark Suite, Computers and Electrical Engineering 32 (2) (2012)
258–269.
[10] A. Bhatele, L. V. Kale, Quantifying Network Contention on Large Parallel Machines, Parallel Processing Letters 19 (4)
(2007) 553–572.
[11] F. Broquedis, J. Clet-Ortega, S. Moreaud, N. Furmento, B. Goglin, G. Mercier, S. Thibault, R. Namyst, hwloc: a Generic
Framework for Managing Hardware Affinities in HPC Applications, in: Proc. 18th Euromicro Intl. Conf. on Parallel,
Distributed and Network-Based Processing (PDP’10), Pisa, Italy, 2010, pp. 180–186.
[12] Portable Hardware Locality (hwloc), http://www.open-mpi.org/projects/hwloc/ (Last visited: August 2013).
[13] K. Yotov, K. Pingali, P. Stodghill, X-Ray: A Tool for Automatic Measurement of Hardware Parameters, in: Proc. 2nd
Intl. Conf. on the Quantitative Evaluation of Systems (QEST’05), Torino, Italy, 2005, pp. 168–177.
[14] A. X. Duchateau, A. Sidelnik, M. J. Garzaran, D. A. Padua, P-Ray: A Suite of Micro-benchmarks for Multi-core Ar-
chitectures, in: Proc. 21st Intl. Workshop on Languages and Compilers for Parallel Computing (LCPC’08), Vol. 5335 of
Lecture Notes in Computer Science, Edmonton, Canada, 2008, pp. 187–201.
[15] A. Sussman, N. Lo, T. Anderson, Automatic Computer System Characterization for a Parallelizing Compiler, in: Proc.
13th IEEE Intl. Conf. on Cluster Computing (CLUSTER’11), Austin, TX, USA, 2011.
[16] A. Danalis, P. Luszczek, G. Marin, J. S. Vetter, J. J. Dongarra, BlackjackBench: Portable Hardware Characterization,
ACM SIGMETRICS Performance Evaluation Review 40 (2) (2012) 74–79.
[17] D. E. Culler, R. M. Karp, D. A. Patterson, A. Sahay, K. E. Schauser, E. Santos, R. Subramonian, T. von Eicken, LogP:
Towards a Realistic Model of Parallel Computation, in: Proc. 4th ACM SIGPLAN Symp. on Principles and Practice of
Parallel Programming (PPoPP’93), San Diego, CA, USA, 1993, pp. 1–12.
[18] A. Alexandrov, M. F. Ionescu, K. E. Schauser, C. Scheiman, LogGP: Incorporating Long Messages into the LogP Model,
Journal of Parallel and Distributed Computing 44 (1) (1997) 71–79.
[19] H. Chen, W. Chen, J. Huang, B. Robert, H. Kuhn, MPIPP: An Automatic Profile-guided Parallel Process Placement
Toolset for SMP Clusters and Multiclusters, in: Proc. 20th ACM Intl. Conf. on Supercomputing (ICS’06), Cairns, Aus-
tralia, 2006, pp. 353–360.
[20] G. Mercier, J. Clet-Ortega, Towards an Efficient Process Placement Policy for MPI Applications in Multicore Environ-
17

ments, in: Proc. 16th European PVM/MPI Users’ Group Meeting (EuroPVM/MPI’09), Vol. 5759 of Lecture Notes in
Computer Science, Espoo, Finland, 2009, pp. 104–115.
[21] HECToR: UK National Supercomputing Service, https://www.hector.ac.uk/ (Last visited: August 2013).
[22] TOP500 List - November 2012, http://www.top500.org/list/2012/11/ (Last visited: August 2013).
[23] J. Gonzalez-Domınguez, M. J. Martın, G. L. Taboada, J. Tourino, R. Doallo, D. A. Mallon, B. Wibecan, UPCBLAS: A
Library for Parallel Matrix Computations in Unified Parallel C, Concurrency and Computation: Practice and Experience
24 (14) (2012) 1645–1667.
[24] NASA Advanced Computing Division. NAS Parallel Benchmarks, http://www.nas.nasa.gov/software/npb/ (Last visited:
August 2013).
[25] UPC Consortium, UPC Language Specifications, v1.2, Tech. Rep. LBNL-59208, Lawrence Berkeley National Laboratory,
USA (2005).
Jorge Gonzalez-Domınguez received a Ph.D. in Computer Science in 2013 from the University of A Coruna, Spain, where
he is currently a Postdoctoral Researcher in the Computer Architecture Group. His main research interests are in the areas of
PGAS programming languages, communication-avoiding algorithms and middleware for high performance computing.
Marıa J. Martın received a Ph.D. in Physics in 1999 from the University of Santiago de Compostela, Spain. She is currently
an Associate Professor of Computer Engineering at the University of A Coruna. Her major research interests include parallel
algorithms and applications, and fault tolerance for message-passing applications.
Guillermo L. Taboada received a Ph.D. in Computer Science in 2009 from the University of A Coruna, where he is cur-
rently an Associate Professor in the Department of Electronics and Systems. His main research interest is in the area of High
Performance Computing (HPC), focused on high-speed networks, programming languages, cluster and cloud computing and
middleware for HPC.
Roberto R. Exposito received a M.S. in Computer Science in 2011 from the University of A Coruna, where he is currently
a PhD student in the Department of Electronics and Systems. His main research interest is in the area of High Performance
Computing (HPC), focused on message-passing communications on high-speed networks and cluster/cloud computing.
Juan Tourino received a Ph.D. in Computer Science in 1998 from the University of A Corua, where he is currently Full
Professor. His main research interest is in the area of High Performance Computing (HPC), covering a wide range of topics
such as compilers and programming languages for HPC, architectures and networks, parallel and distributed applications, and
cloud computing.
18