The screen for social interaction (SSI): A screening measure for autism spectrum disorders in...
22
The Screen for Social Interaction (SSI): A Screening Measure for Autism Spectrum Disorders in Preschoolers Jaswinder K. Ghuman 1 , Sarah L. Leone 2 , Luc Lecavalier 2 , and Rebecca J. Landa 3 Jaswinder K. Ghuman: [email protected]; Sarah L. Leone: [email protected]; Luc Lecavalier: [email protected]; Rebecca J. Landa: [email protected] 1 University of Arizona, Child and Adolescent Psychiatry, 1501 N. Campbell Avenue Tucson, Arizona 85724-5002, USA 2 Ohio State University, Nisonger Center, UAP, 1581 Dodd Drive, Columbus, Ohio 43210, USA 2 Ohio State University, Nisonger Center, UAP, 1581 Dodd Drive, Columbus, Ohio 43210, USA 3 Johns Hopkins University, Kennedy Krieger Institute, Center for Autism and Related Disorders, 3901 Greenspring Avenue, Baltimore, Maryland 21211, USA Abstract We report on the preliminary validity and utility of the Ghuman-Folstein Screen for Social Interaction (SSI), a measure of social interaction that can serve to screen for autism spectrum disorders (ASDs) in clinical samples of young high-risk children. Caregivers of 350 children (176 younger participants, ages 24 to 42 months, mean age = 34.1 months; and 174 older participants, ages 43 to 61 months, mean age = 52.4 months) with ASDs, non-ASD developmental and/or psychiatric disorders, or without developmental concerns completed the SSI. A series of analyses resulted in shortened versions of the SSI: a 26-item SSI-Younger (SSI-Y) and a 21-item SSI-Older (SSI-O) version. The SSI-Y and SSI-O showed moderate convergence with ASD diagnostic measures and significantly differentiated ASD and non-ASD clinical groups. Sensitivity and specificity values for discriminating ASD and non-ASD clinical participants were 0.87 and 0.71, respectively for the SSI-Y and 0.81 and 0.70, respectively for the SSI-O. Scoring recommendations were made based on the ROC results. Keywords Autism spectrum disorders; social interaction; joint attention; preschool; screening; early identification © 2011 Elsevier Ltd. All rights reserved. Corresponding author: Jaswinder K Ghuman, M.D., University of Arizona, Room AHSC 7304, 1501 N. Campbell Avenue, Tucson, Arizona 85724-5002, Tel: 520-626-3603, Fax: 520-626-6050, [email protected]. Financial Disclosures: The following financial disclosures indicate potential conflicts of interest among the investigators and industry sources. 1 Honoraria/Consultant, 2 Research Support, 3 Speaker’s Bureau, 4 Significant Equity (> $50,000). Dr. J. Ghuman: Bristol Myers-Squibb 2 Drs. Leone, Lecavalier, and Landa report no biomedical financial interests or potential conflicts of interest. Publisher's Disclaimer: This is a PDF file of an unedited manuscript that has been accepted for publication. As a service to our customers we are providing this early version of the manuscript. The manuscript will undergo copyediting, typesetting, and review of the resulting proof before it is published in its final citable form. Please note that during the production process errors may be discovered which could affect the content, and all legal disclaimers that apply to the journal pertain. NIH Public Access Author Manuscript Res Dev Disabil. Author manuscript; available in PMC 2012 November 1. Published in final edited form as: Res Dev Disabil. 2011 November ; 32(6): 2519–2529. doi:10.1016/j.ridd.2011.07.008. NIH-PA Author Manuscript NIH-PA Author Manuscript NIH-PA Author Manuscript
-
Upload
independent -
Category
Documents
-
view
0 -
download
0
Transcript of The screen for social interaction (SSI): A screening measure for autism spectrum disorders in...

The Screen for Social Interaction (SSI): A Screening Measure forAutism Spectrum Disorders in Preschoolers
Jaswinder K. Ghuman1, Sarah L. Leone2, Luc Lecavalier2, and Rebecca J. Landa3
Jaswinder K. Ghuman: [email protected]; Sarah L. Leone: [email protected]; Luc Lecavalier:[email protected]; Rebecca J. Landa: [email protected] of Arizona, Child and Adolescent Psychiatry, 1501 N. Campbell Avenue Tucson,Arizona 85724-5002, USA2Ohio State University, Nisonger Center, UAP, 1581 Dodd Drive, Columbus, Ohio 43210, USA2Ohio State University, Nisonger Center, UAP, 1581 Dodd Drive, Columbus, Ohio 43210, USA3Johns Hopkins University, Kennedy Krieger Institute, Center for Autism and Related Disorders,3901 Greenspring Avenue, Baltimore, Maryland 21211, USA
AbstractWe report on the preliminary validity and utility of the Ghuman-Folstein Screen for SocialInteraction (SSI), a measure of social interaction that can serve to screen for autism spectrumdisorders (ASDs) in clinical samples of young high-risk children. Caregivers of 350 children (176younger participants, ages 24 to 42 months, mean age = 34.1 months; and 174 older participants,ages 43 to 61 months, mean age = 52.4 months) with ASDs, non-ASD developmental and/orpsychiatric disorders, or without developmental concerns completed the SSI. A series of analysesresulted in shortened versions of the SSI: a 26-item SSI-Younger (SSI-Y) and a 21-item SSI-Older(SSI-O) version. The SSI-Y and SSI-O showed moderate convergence with ASD diagnosticmeasures and significantly differentiated ASD and non-ASD clinical groups. Sensitivity andspecificity values for discriminating ASD and non-ASD clinical participants were 0.87 and 0.71,respectively for the SSI-Y and 0.81 and 0.70, respectively for the SSI-O. Scoringrecommendations were made based on the ROC results.
KeywordsAutism spectrum disorders; social interaction; joint attention; preschool; screening; earlyidentification
© 2011 Elsevier Ltd. All rights reserved.Corresponding author: Jaswinder K Ghuman, M.D., University of Arizona, Room AHSC 7304, 1501 N. Campbell Avenue, Tucson,Arizona 85724-5002, Tel: 520-626-3603, Fax: 520-626-6050, [email protected] Disclosures: The following financial disclosures indicate potential conflicts of interest among the investigators and industrysources. 1Honoraria/Consultant, 2Research Support, 3Speaker’s Bureau, 4Significant Equity (> $50,000).Dr. J. Ghuman: BristolMyers-Squibb2Drs. Leone, Lecavalier, and Landa report no biomedical financial interests or potential conflicts of interest.Publisher's Disclaimer: This is a PDF file of an unedited manuscript that has been accepted for publication. As a service to ourcustomers we are providing this early version of the manuscript. The manuscript will undergo copyediting, typesetting, and review ofthe resulting proof before it is published in its final citable form. Please note that during the production process errors may bediscovered which could affect the content, and all legal disclaimers that apply to the journal pertain.
NIH Public AccessAuthor ManuscriptRes Dev Disabil. Author manuscript; available in PMC 2012 November 1.
Published in final edited form as:Res Dev Disabil. 2011 November ; 32(6): 2519–2529. doi:10.1016/j.ridd.2011.07.008.
NIH
-PA Author Manuscript
NIH
-PA Author Manuscript
NIH
-PA Author Manuscript
1. IntroductionSocial interaction problems are considered a core deficit in autism spectrum disorders(ASDs) and are the single most powerful predictor for diagnosing ASDs (Volkmar,Chawarska, and Klin, 2005). Social interaction problems manifest early in young at-riskchildren. Problems in joint attention, social responsiveness, pretend play skills, motorimitation, and use of conventional gestures have been identified in a number of studies inyoung children with autistic disorder (Landa, Holman, & Garrett-Mayer, 2007; Ventola etal., 2007). Impairment in joint attention is one of the most reliable markers of ASDs(Ventola et al., 2007). Joint attention typically emerges between 6 and 18 months of age(Mundy & Burnette 2005) and can potentially help screen young at-risk children. On theother hand, restricted interests/repetitive (RR) behaviors that define ASDs, may begin toemerge later than other social indicators (Volkmar et al., 2005). Furthermore, there isevidence that RR behaviors failed to differentiate ASD children from non-ASD children at20 and at 42 months of age (Cox et al., 1999; Wiggins & Robins, 2008). Screening effortsfor early identification in young children should therefore attend to basic social interactionbehaviors (i.e., joint attention, imitation, gestures, and play behaviors) that seem todistinguish ASDs from general developmental delay. Early identification is important as itprovides the best opportunity for early intervention, thus maximizing prospects for improvedshort- and long-term developmental outcomes (Barbaro & Dissanayake, 2009).
Parent-report questionnaires offer a valuable, easily accessible and cost-effective format forearly ASD screening in both general unselected populations, as well as high-risk clinicalpopulations. For the purposes of this study, we focus on the use of parent reportquestionnaires in young high-risk clinical populations. The Modified Checklist for Autism inToddlers (M-CHAT; Robins, Fein, Barton, and Green, 2001), an adaptation of the CHAT(Baron-Cohen, Allen, and Gillberg, 1992; Baron-Cohen et al., 1996) is a parent-completedscreening measure that includes 23 yes/no dichotomously scored items. The M-CHAT is afirst screening measure originally validated for screening in the general population. It wasrecently evaluated in 56 clinically-referred 18- to 48-month old children referred forpossible pervasive developmental disorders and was shown to have fair sensitivity (0.70)and PPV (0.79), but lower specificity (0.38) and AUC (0.65) in the at-risk sample (Snow &Lecavalier, 2008).
The Baby and Infant Screen for Children with aUtIsm Traits (BISCUIT; Matson et al.,2009) is a three-part informant-based comprehensive assessment measure that includesassessment of the three ASD symptom domains (62-item Part 1), comorbid mental healthconditions (65-item Part 2) and challenging behaviors (17-item Part 3). The items are scoredon a three-point frequency scale. The BISCUIT was administered by experienced andtrained professionals in a one-to-one parent interview format to the parents of 1007, 27- to37-month old children enrolled in a program to provide services to children withdevelopmental delay or a medical condition (Matson et al., 2009). Good sensitivity (0.84)and specificity (0.86), but lower AUC (0.55) were reported for the final selected cut points(Matson et al., 2009).
The Early Screening for Autistic Traits (ESAT; Dietz, Swinkels, van Daalen, van Engeland,& Buitelaar, 2006; Swinkels et al., 2006) is a 14-item parent-completed yes/nodichotomously scored screening measure. The items span across the three ASD symptomdomains and also address reaction to sensory stimuli. Good sensitivity (0.88), but lowspecificity (0.14), Positive Predictive Value (PPV; 0.68), and Area Under the Curve (AUC;0.58) were reported in 238 children (mean age = 29.6 ± 6.4 months) at risk for ASD(Oosterling et al., 2009).
Ghuman et al. Page 2
Res Dev Disabil. Author manuscript; available in PMC 2012 November 1.
NIH
-PA Author Manuscript
NIH
-PA Author Manuscript
NIH
-PA Author Manuscript
The Developmental Behavior Checklist-Early Screen (DBC-ES; Gray, Tonge, Sweeney, &Einfeld, 2008) is a 17-item parent-completed screening measure with items relating to thethree ASD symptom domains as well as behavior and emotional problems. The items arescored on a three-point frequency scale. Good sensitivity (0.83), but low specificity (0.48),and fair PPV (0.78) were reported in 207, 20–51 month old children suspected ofdevelopmental delay (Gray et al., 2008).
The Social Communication Questionnaire (SCQ; Berument, Rutter, Lord, Pickles, andBailey, 1999) is a 40-item parent-completed yes/no dichotomously scored screeningmeasure with items relating to the three ASD symptom domains based on questions from theAutism Diagnostic Interview-Revised (ADI-R; Rutter, LeCouteur, & Lord, 2003). It wasoriginally validated in at-risk children who were 4 years old and older. Attempts to screenchildren younger than 4 years with the SCQ showed poor balance among sensitivity,specificity and discriminative validity in 208, 20–40 month old children at risk for ASDs(Oosterling et al., 2010).
In summary, currently available ASD screening instruments for use in clinical samples ofyoung high-risk children have items that span the three ASD symptom domains; have goodsensitivity, but lower specificity or lower AUC. The objective of the current study was toassess preliminary validity and utility of the Ghuman-Folstein Screen for Social Interaction(SSI), an instrument that emphasizes reciprocal social interaction including joint attentionskills, which are of particular concern for children with ASDs (Ghuman, Peebles, &Ghuman, 1998; Mundy et al., 2005). Specifically, we wished to evaluate its utility indetecting children with ASD in a large heterogeneous high-risk clinical sample of youngchildren with and without ASDs. A second objective was to shorten and refine theinstrument for use with younger (ages 24 to 42 months) and older (ages 43 to 61 months)preschool age children.
2. Methods and materials2.1. Study population
The study sample consisted of 350 children between the ages of 24 to 61 months. Theparticipants included a convenience sample of 168 typically-developing children recruitedduring routine visits with the primary health care providers, and 182 children, hereafterreferred to as the Clinical Group, recruited during clinic appointments in various psychiatry,autism, developmental, or specialty research clinics for genetic and developmental disorders.The Clinical Group included clinically-referred high risk children who were assessed forASDs (Autistic Disorder = 66, Pervasive Developmental Disorder-Not Otherwise Specified[PDD-NOS] = 48, and those determined to have no ASDs [non-ASD clinical] = 68).
Table 1 summarizes participant characteristics. Among younger age group participants (ages24 to 42 months), the typically-developing group was significantly younger than the otherdiagnostic groups. Differences in gender distribution followed the expected pattern of alarger proportion of males (approximate male:female ratio of 5:1) among the two ASDgroups. Socio-economic status (SES) for the typically-developing children was significantlyhigher than for the PDD NOS group among older age group participants (ages 43 to 61months). Both ASD groups had a significantly lower proportion of verbal participants andhad significantly lower adaptive Vineland Adaptive Behavior Scales (VABS; Sparrow,Balla, and Cichetti, 1984) Socialization domain scores than the non-ASD clinical group. Theautistic disorder group had significantly lower mean IQ and adaptive behavior VABScomposite scores than the non-ASD clinical group, and had significantly lower adaptiveVABS Communication domain scores than both the PDD-NOS and non-ASD clinicalgroups.
Ghuman et al. Page 3
Res Dev Disabil. Author manuscript; available in PMC 2012 November 1.
NIH
-PA Author Manuscript
NIH
-PA Author Manuscript
NIH
-PA Author Manuscript

2.2. Measure2.2.1. Ghuman-Folstein Screen for Social Interaction (SSI)—The Ghuman-Folstein Screen for Social Interaction (SSI) is a 54-item parent/caregiver-report screeninginstrument that emphasizes reciprocal social interaction including joint attention skills. Forexample, the items include a child’s response to social overtures by others, joint attention,initiation of social interaction by the child, interaction during meals, affectionate socialinteraction, playful interaction, and peer interaction. The items are positive (prosocial) andare scored on a four-point frequency scale (child displays the behavior “almost never” = 0 to“almost all the time” = 3). Thus lower scores reflect a slower or delayed development, andhigher scores reflect more normative development. The SSI takes 10–15 minutes tocomplete. In a sample of 24 to 61 month old children (51 clinically-referred children and 60typical healthy controls), the SSI has shown good internal consistency (α= 0.76) and test-retest reliability (r = 0.88), and moderate interrater reliability. The SSI scores convergedwith the VABS-Socialization scores (r = 0.67) and with the algorithm items of the ADI-Rtotal score and Reciprocal Social Interaction and Communication categories scores (r rangedfrom −0.55 to −0.88). Finally, the SSI scores differentiated the clinically-referred childrenwho met all, part, and none of the ADI-R algorithm criteria (Ghuman, Freund, Reiss,Serwint,& Folstein, 1998).
3. ProcedureFor most (95.4% of cases), the SSI was completed before the child’s diagnostic assessment;mothers completed the SSI in 82% of cases. Assessment for ASD among the 182 children inthe Clinical Group was done via expert clinical diagnosis (Charman & Baird, 2002) by achild psychiatrist, psychologist or multidisciplinary team consisting of child psychiatrist,psychologist, developmental pediatrician, speech and communication pathologist and/orpediatric neurologist. Additionally, clinical diagnosis of ASD was supported by the ADI-Rin 106 children (58.2%); the Childhood Autism Rating Scale (CARS; Schopler, Reichler, &Renner, 1988) in 15 children (8.2%) and by both the ADI-R and the CARS in 26 children(14.3%). Diagnoses for the non-ASD clinical group included communication disorders,intellectual disability, other developmental disorders, and 17% of the children hadpsychiatric disorders only. Intellectual/developmental levels (IQ/DQ) were available for 79children; the two most frequently used tests were the Stanford-Binet Intelligence Scales, 4th
edition (Thorndike, Hagen, & Sattler, 1986) in 35 children and the Bayley Scales of Infantand Toddler Development (Bayley, 1993) in 19 children. Adaptive behavior was evaluatedusing the VABS Composite Score (n=44) and/or its Socialization (n=90) andCommunication (n=49) subscales.
4. Statistical analysisSince it is expected that development will impact social interaction and communicationbetween 24 and 61 months, the sample was divided in two halves, younger (ages 24 to 42months) and older (ages 43 to 61 months) age groups. Diagnostic validity was assessedseparately for the two age groups. Factorial one-way analysis of variance (ANOVA) withthree sets of planned a-priori contrasts and post-hoc comparisons were conducted on the SSItotal score to determine if SSI scores differentiated the four groups (autistic disorder, PDD-NOS, non-ASD clinical and typically-developing). In addition, several other strategies wereused to assess the diagnostic validity of the instrument at the item-level in the ClinicalGroup (n = 182): (a) individual SSI item-means were compared between ASD (autisticdisorder and PDD-NOS combined; n = 114) and non-ASD clinical (n = 68) participantsusing independent samples t-tests, (b) binary logistic regressions were conducted to identifySSI items that predict ASD diagnostic group membership and (c) inter-item Pearson
Ghuman et al. Page 4
Res Dev Disabil. Author manuscript; available in PMC 2012 November 1.
NIH
-PA Author Manuscript
NIH
-PA Author Manuscript
NIH
-PA Author Manuscript

correlations were examined within younger and older age groups to detect and eliminateredundancy between SSI items.
Binary logistic regressions used SSI items as predictor variables and ASD diagnosticmembership as the binary outcome variable. Items were entered in seven separate blocks tomaintain a cases-to-predictors ratio of approximately 10:1 or higher, as recommended byPeduzzi et al. (1996). Backward stepwise procedure was chosen in light of the exploratorynature of the analyses, the relative number of cases and predictors, and its ability to uncoversuppressor effects among independent variables (Menard, 2002). SSI items whose removalwould significantly impact the ability to predict diagnostic membership in the regressionmodel were deemed critical items (using the significance in change of the -2 log likelihoodstatistic; significance level was set at p < 0.01 due to multiple analyses conducted).
Based on the results of the above item-level analyses, several items were dropped and twoseparate scales for younger and older age groups were developed. The relationship wasassessed (via two-tailed Spearman’s or Pearson product-moment correlations) between thetotal summary scores for the revised SSI scales and age, IQ/DQ, VABS and ASD diagnosticmeasures (ADI-R and CARS).
4.1. Determination of scoring systemReceiver Operating Characteristic (ROC) curve analyses were conducted to determine cutoffscores for optimal sensitivity and specificity for the younger and older age groups. Emphasiswas placed on the discrimination between combined ASD (autistic disorder or PDD-NOS; n= 114) and non-ASD clinical (n = 68) groups. To ensure that the differences in the SSIscores across groups are based on the behaviors measured by the SSI rather than as afunction of age or IQ/DQ level of the children, participants from the ASD and non-ASDclinical groups were individually matched on age (within 6.5 months of each other) and IQ/DQ level (within 12 full scale IQ or DQ points of each other). Narrow matching criteriawere chosen so the group comparisons were well controlled within the available sample.This resulted in 10 matched pairs (n = 20) for the younger and 17 matched pairs (n = 34) forthe older age groups. Differences in verbal ability, gender, ethnicity, and SES in the matchedASD and non-ASD clinical groups were examined. The mean SES score for the older non-ASD matched participants was higher than the mean SES score for the older ASD matchedparticipants (t = −2.89; p = 0.008); no other differences were found.
5. ResultsKolmogorov-Smirnov test for normality for the SSI score distributions within the ClinicalGroup and the typically-developing participants was non-significant, indicating each to benormally distributed (Z values = 0.74, and 0.83, respectively).
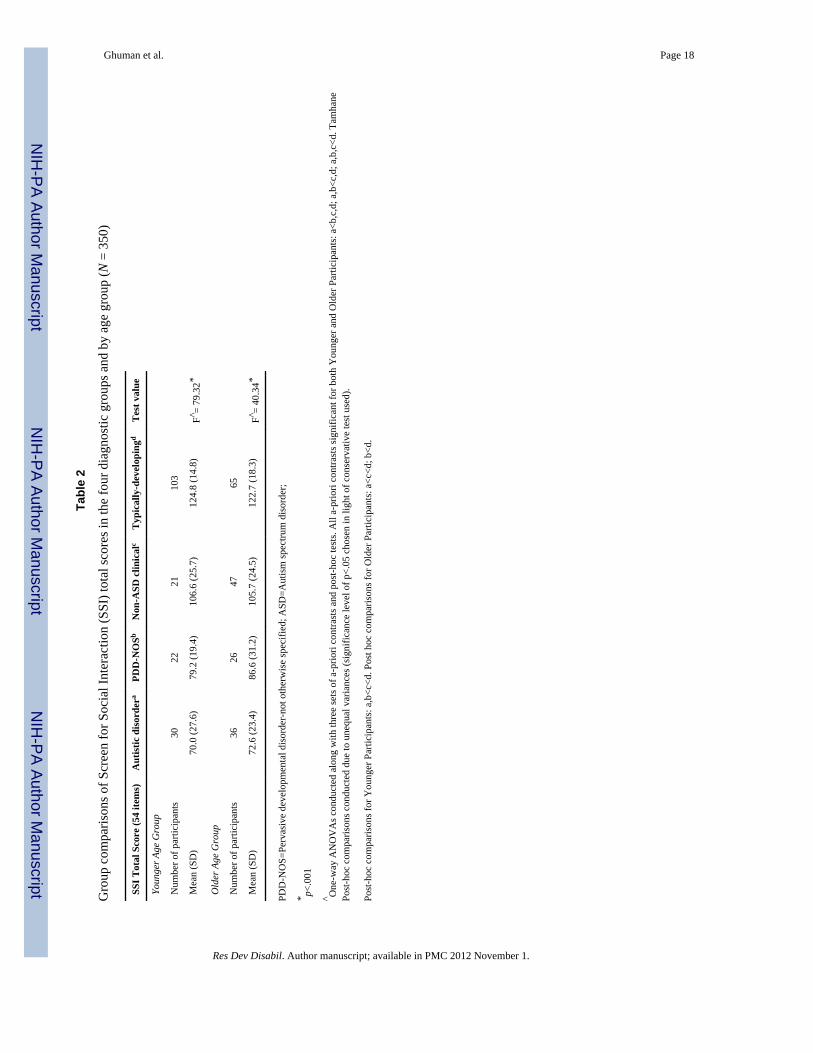
5.1. Diagnostic validity5.1.1. Group comparisons—Factorial ANOVA were conducted on the SSI total scores,and assessment for and correction of any violation of equal variances were addressed, asdescribed in Table 2. The SSI total scores significantly differentiated each one of the fourdiagnostic groups (F = 79.32 and 40.34, respectively for the younger and older age groups; p< 0.001 in both cases). As expected, the autistic disorder group had the lowest scores, thePDD-NOS and the non-ASD clinical groups had intermediate scores, and the typically-developing group had the highest scores; all contrasts were significant (see Table 2).
To examine if SSI total scores differed based on age or verbal ability, we conducted anANOVA by verbal ability and age group in the 132 children who were administered the
Ghuman et al. Page 5
Res Dev Disabil. Author manuscript; available in PMC 2012 November 1.
NIH
-PA Author Manuscript
NIH
-PA Author Manuscript
NIH
-PA Author Manuscript

ADI-R. Verbal ability was defined via ADI-R classification of a presence of daily functionalspeech of at least three-word phrases. There were no differences in the mean SSI total scoresamong younger (n = 59) or older (n = 73) or among non-verbal (n = 58) and verbal (n = 74)preschoolers. No interaction effect for verbal ability and age group was found.
5.1.2. Item-level contribution and scale refinement—Using independent samples t-tests, comparison of the individual SSI item-mean scores between the ASD (combinedautistic disorder and PDD-NOS) and non-ASD clinical groups identified 31 items among theyounger children and 26 items among the older children that were significantly different (p< 0.01) in the anticipated direction.
The binary logistic regressions identified ten items from the younger and eight items fromthe older age group that predicted ASD diagnostic group membership (p < 0.01). However,even though item 49 (takes toys from siblings or other children) met criteria as a criticalitem in both age groups; it was dropped because there was no difference in the item-meanscores between the ASD and non-ASD clinical group participants. Hence, nine critical items(reflecting the expression and detection of emotion, praise-seeking, and peer play-relatedbehaviors) were identified for the younger participants. Seven critical items (reflectingdisplay of greeting, reading and expressing emotions, praise-seeking, pretend play, and peerplay-related behaviors) were identified for the older age group participants (see Table 3).Three common critical items emerged for both the younger and older participants: seekspraise by showing what s/he did (item #25), joins play when invited by other children (item#40), and shares favorite items or toys with other children (item #54). All items, except onecritical item from each age group, were also identified in the above analysis as items thatsignificantly differentiated the ASD and non-ASD clinical group participants.
Six SSI items were highly intercorrelated with the other SSI items (r ≥ 0.70) and werechosen for elimination in each age group. Items 19 (looks at you during meals), 35 (can seeyou are angry by your face or voice) and 46 (other children his/her age want to play/bearound him/her) were highly intercorrelated with the other items for the younger age group;items 10 (greets your return by seeking proximity), 37 (shows interest in other children bymoving towards them) and 53 (shares favorite items or toys with adults) were highlyintercorrelated with the other items for the older age group; and items 39 (tries to play withother children), 43 (can join in social exchange with other children) and 44 (can maintainsocial exchange with other children) were highly intercorrelated with the other items forboth age groups; range of intercorrelations were 0.70 through 0.92. In most cases, the itemwith the lesser discriminative power was dropped. There was one exception to this criterion.Even though both SSI items 5 (tries to get attention to show things) and 25 (seeks praise byshowing what s/he did) were highly intercorrelated, neither item was dropped since both ofthe items related to joint attention, an especially clinically relevant indicator for youngchildren with ASDs.
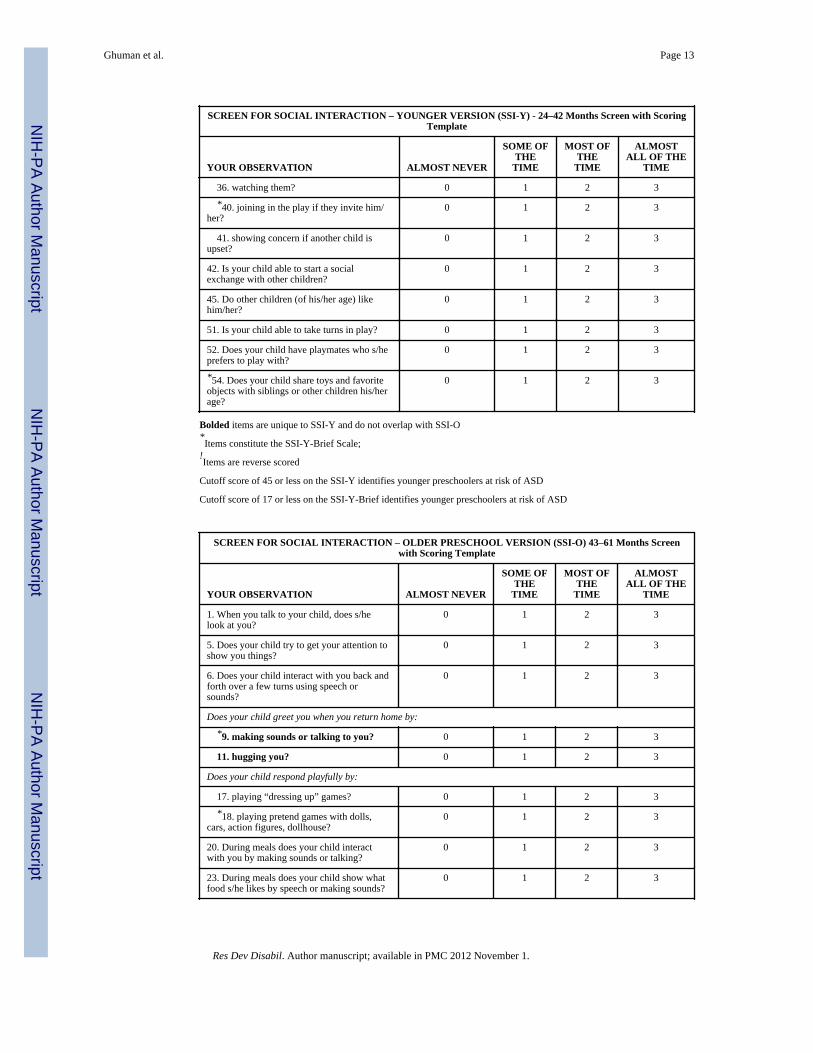
These refinements resulted in a 26-item instrument for the younger (24- to 42-month old),and a 21-item instrument for the older (43- to 61-month old) participants. The shortenedinstruments are labeled “SSI-Younger” (SSI-Y), and “SSI-Older” (SSI-O), respectively. Thetwo sets of critical items are labeled as “SSI-Brief” (SSI-Brief-Y and SSI-Brief-O for theyounger and older age groups, respectively).
The mean SSI-Y and SSI-O total scores did not differ based on gender among the fourdiagnostic groups (autistic disorder, PDD-NOS, non-ASD clinical and typically-developing)or based on verbal ability among the three clinical groups (autistic disorder, PDD-NOS, non-ASD clinical). We examined the relationship of the mean SSI-Y and SSI-O total scores withage, IQ/DQ, and adaptive behavior. The SSI-Y and SSI-O total scores did not significantly
Ghuman et al. Page 6
Res Dev Disabil. Author manuscript; available in PMC 2012 November 1.
NIH
-PA Author Manuscript
NIH
-PA Author Manuscript
NIH
-PA Author Manuscript

correlate with age (r = −0.07 and r = 0.02, respectively). IQ/DQ and adaptive behaviorscores were coded ordinally into eight bands, each 15 IQ/DQ points (one standard deviation)apart. The mean SSI-Y total scores did not significantly correlate with IQ/DQ scores in theyounger age group (ρ= 0.10; n = 31). The mean SSI-O total scores were significantlycorrelated with the available IQ/DQ scores in the older preschool age group (ρ= 0.47, p <0.01, n = 48). The mean SSI-Y and SSI-O total scores correlated with the VABSSocialization domain (ρ = 0.38, p < 0.05, n = 39; and ρ = 0.58, p < 0.01, n = 51,respectively) and VABS Communication domain scores (ρ = 0.50, p < 0.05, n = 18; and ρ =0.65, p < 0.01, n = 31, respectively).
All correlations between the SSI-Y and SSI-O total scores and the ADI-R social andcommunication subscale scores were significant at p < 0.0001. The relationships arenegative because SSI scores increase with typicality, whereas the ADI-R scores decreasewith typicality. The strongest correlation occurred with the ADI-R social subscale (r =−0.75 and −0.76, respectively for SSI-Y and SSI-O), followed by the ADI-Rcommunication subscale (r = −0.55 and −0.62, respectively for SSI-Y and SSI-O) and theADI Restrictive/Repetitive subscale (r = −0.45 and −0.39, respectively for SSI-Y and SSI-O, p < 0.001 for both the SSI-Y and SSI-O). The correlation of the SSI with the ADI-R totalscore was much higher (r = −0.72, p < 0.0001 for both the SSI-Y and SSI-O) than with theCARS (r = −0.48 and −0.55, p < 0.05 for SSI-Y and SSI-O respectively).
5.1.3. Determination of scoring system—Table 4 depicts the ROC discriminations ofgreatest clinical interest: participants with ASD (both autistic disorder and PDD-NOS)versus non-ASD clinical participants for both the unmatched and the subset of matchedparticipants. For each comparison, the cutoff score judged to have the optimal balance ofboth sensitivity and specificity is placed in the middle, in boldface, between nearby cutoffscores. Optimal balance of sensitivity and specificity was achieved with a screen cutoffscore of 45 or lower for the SSI-Y (PPV = 0.87 and Negative Predictive Value [NPV] =0.70), 37 or lower for the SSI-O (PPV = 0.78 and NPV = 0.76), ≤ 17 for the SSI-Brief-Y(PPV = 0.86 and NPV = 0.76), and ≤ 13 for the SSI-Brief-O (PPV = 0.76 and NPV = 0.77).Comparatively, the screen cutoff scores for the matched group were higher by three to fivepoints for the SSI-Y and SSI-O and by one to two points for the SSI-Brief-Y and SSI-Brief-O scales.
ROC analyses to examine the impact of verbal ability on diagnostic discrimination showedthat the nonverbal younger age group (n = 28) had slightly higher levels of sensitivity (0.91)and specificity (0.83) than the verbal younger age group (n = 31; 0.85 and 0.64,respectively) on the SSI-Y. The nonverbal older participants (n = 30) had slightly higherlevels of sensitivity (0.87) than the verbal older participants (n = 43; 0.79) and had similarspecificity (0.71 for both) on the SSI-O.
5.1.4. Evaluation of false negatives—The optimal screen cutoff scores for theshortened SSI and/or the critical items scales together failed to identify 7 of the 52 (13.5%)younger and 11 of the 62 (17.8%) older preschoolers with ASD. Both the younger and theolder preschool-age false negatives had lower mean ADI-R total, Social and Communicationscores (27.6 ± 6.3 and 23.8 ± 5.9; 13.2 ± 3.9 and 11.3 ± 4.2; and 9.2 ± 4.4 and 8.6 ± 2.6,respectively) compared to the younger and the older preschool-age true positives (33.0 ±12.0 and 34.3 ± 8.6; 17.8 ± 6.7 and 18.3 ± 5.7; and 11.9 ± 6 and 11.8 ± 4.3, respectively).However there were no differences in the Restrictive/Repetitive subscale scores. The falsenegative younger preschoolers had somewhat lower IQ scores (69.4 ± 12.7) compared to thetrue positive younger preschoolers (77.1 ± 25.2), and the false negative older preschoolershad somewhat higher IQ scores (66.4 ± 18.4) compared to the true positive olderpreschoolers (57.2 ± 20.3). Type of ASD diagnosis differed for the older preschoolers, but
Ghuman et al. Page 7
Res Dev Disabil. Author manuscript; available in PMC 2012 November 1.
NIH
-PA Author Manuscript
NIH
-PA Author Manuscript
NIH
-PA Author Manuscript

not for the younger preschoolers. Nearly all (91%) of the false negative older preschoolers(10 of 11) had a diagnosis of PDD-NOS, versus 16 of 51 (31%) for the true positive olderpreschoolers. In other words, 69% of the true positive older preschoolers had a diagnosis ofautistic disorder, compared to 9% of the false negative older preschoolers. No significantdifferences were observed for age, ethnicity, or presence of verbal ability for false negativeand true positive younger and older preschoolers.
5.1.5. Scoring recommendations—Recognizing that discrimination in a matchedsample is a more stringent test, together with the potentially greater statistical power of thelarger unmatched sample, it was decided that the mean of the unmatched and the matchedoptimal screen cutoff scores for each of the SSI scales would be used as the recommendedclinical cutoff thresholds. Thus, for younger preschoolers, recommended clinical cutoffs area score of ≤ 47 on the SSI-Y items, or a score of ≤ 18 on the SSI-Brief-Y critical items. Forolder preschoolers, the recommended clinical cutoffs are a score of ≤ 40 on SSI-O items, ora score of ≤ 14 on the SSI-Brief-O critical items.
6. DiscussionThe results of this study indicated that the SSI can discriminate children diagnosed withASDs from children with other developmental and/or psychiatric disorders, and can behelpful in screening young at-risk children in clinical high-risk populations. Diagnosticvalidity was found to be equally strong for both the matched and the unmatched samples ofyounger (24–42 months old) and older (43–61 months old) preschool-age children. The SSIperformance was not markedly affected by presence or absence of verbal ability. Highsensitivity and specificity was obtained with the screening cutoff scores established throughROC analysis. Scoring recommendations were provided based on stringent diagnosticcomparisons between overall ASD (autism and PDD-NOS combined) and non-ASD clinicalreferrals, and incorporated the relative benefits of both the greater experimental control ofthe matched and the greater statistical power of the larger unmatched samples.
As expected, the SSI-Y and SSI-O showed moderate correlation with the ADI-R and itssubscales indicating shared variance on one hand and independence of the SSI constructfrom the ADI-R on the other hand. The relationship of the SSI-Y and SSI-O to the CARSwas notably lower than for the ADI-R total score, which is likely explained by much greaterfocus on communication, sensory issues, and repetitive behaviors in the CARS. Associationsbetween SSI-Y and SSI-O scores and IQ/DQ and adaptive levels were lower for the youngerthan the older preschoolers. However, this finding may be due to the lower number ofyounger preschoolers with available cognitive/developmental/adaptive scores.
The SSI-Y and SSI-O, and the SSI-Brief-Y and SSI-Brief-O held up to stringent tests ofdiagnostic validity. The levels of accuracy for younger and older preschool-agediscriminations were similar to one another. The levels of accuracy for the matched andunmatched samples were likewise high and remarkably similar to one another. The matchedsample provided control for the impact of participant age and developmental level. Somesmall differences were found for verbal ability. As expected, the nonverbal participants hadslightly higher sensitivity levels compared to verbal participants for both age groups. Theoverall levels of sensitivity for the SSI were similar to other screening instruments used withyoung high-risk children; however specificity rates, AUC and PPV for the SSI were higher.For instance, M-CHAT had specificity of 0.38 and AUC of 0.65 (Snow & Lecavalier, 2008),ESAT had specificity of 0.14, AUC of 0.58 and PPV of 0.68 (Oosterling et al., 2009), andDBC-ES achieved specificity of 0.48 (Gray et al., 2008) compared to specificity of 0.70,AUC of 0.82 and PPV of 0.87 for the SSI-Y and specificity of 0.71, AUC of 0.85 and PPVof 0.78 for the SSI-O. The PPV value for the SSI-O was similar to the M-CHAT (Snow &
Ghuman et al. Page 8
Res Dev Disabil. Author manuscript; available in PMC 2012 November 1.
NIH
-PA Author Manuscript
NIH
-PA Author Manuscript
NIH
-PA Author Manuscript

Lecavalier, 2008) and DBC-ES (Gray et al., 2008). The BISCUIT had higher specificity(0.86) but lower balance between sensitivity and specificity as depicted by AUC value of0.55 (Matson et al., 2009).
Both younger and older preschool-age false negatives had less severe autism symptoms onthe ADI-R and its subscales (with the exception of restrictive/repetitive behaviors) than truepositives. The false negative older preschoolers were almost exclusively diagnosed withPDD-NOS and may point to limitation of the SSI-O in screening older preschool childrenwith PPD-NOS. The false negative younger preschoolers had lower IQ than true positiveyounger preschoolers, and the false negative older preschoolers had higher IQ than truepositive older preschoolers. However, it is difficult to draw any conclusions based on thisfinding due to the limited range of IQ/DQ levels of the children in this study sample.
6.1. LimitationsDue to the clinical and heterogeneous nature of the sample, a standard assessment batterywas not administered across participants. As recommended by Charman and Baird (2002),ASD diagnoses were determined via detailed clinical assessment by experiencedprofessionals in all cases, and were aided by the ADI-R and/or the CARS in most cases.Additionally, cognitive and communication assessments were not available for all thechildren, and there were few participants with severe developmental delays in the studysample, such that the findings may not generalize to these groups. Further validation studiesin a larger matched sample with a broad range of intellectual abilities will confirm utility ofthe SSI in children of higher and lower reaches of intellectual ability. Another limitation ofthe study was the relatively small number of available positive cases with ASD diagnosis(n=114) to the number of predictors (54 SSI items) for the binary logistic regression analysisto identify the critical items. As already discussed, SSI items were entered in seven separateblocks to maintain a cases-to-predictors ratio of approximately 10:1 or higher, asrecommended by Peduzzi et al. (1996). Additionally, due to the relatively small number ofASD participants, we were not able to identify a matched group for the regression analysisto identify critical items.
6.2. ConclusionsThe findings support preliminary validity and utility of the SSI-Y and SSI-O as a screeningtool in clinical settings for detection of young at-risk children in order to facilitate referralsfor appropriate assessment and treatment services for ASDs. This study was conducted in aheterogeneous clinic sample of children with a variety of suspected delays or abnormalitiesand used expert clinical diagnosis. This likely increases generalizability of the findings tomany types of clinical populations, and avoids some of the potential bias associated withsingle-clinic referrals. The SSI provides a picture of the relative presence of many socialinteraction behaviors that appear to be continuously distributed within different samples ofindividuals with and without social or general developmental delay and can add to the bodyof research on the autism phenotype.
The SSI-Y and SSI-O have a number of desirable features as autism screening instruments.First, emphasis is placed on presence of joint attention and other social initiation andresponse behaviors which have been found to discriminate young children with ASDs fromthose with other developmental delays much more reliably than language delay, sensoryprocessing issues, or repetitive behaviors (Ventola et al., 2007). Of note, the three commoncritical items that emerged for the younger- and older preschool-age participants reflectedjoint attention and development of peer relationships, which are both specifically noted asclinically-significant deficits in children with ASDs in the DSM-IV (APA, 2000).Additionally, identification of social interaction and joint attention deficits can aid in
Ghuman et al. Page 9
Res Dev Disabil. Author manuscript; available in PMC 2012 November 1.
NIH
-PA Author Manuscript
NIH
-PA Author Manuscript
NIH
-PA Author Manuscript
implementing specifically targeted interventions. A second desirable feature of the SSI isthat it can be completed independently by caregivers, such that expert administration orguidance are not required. Third, most of the items tap into typical behaviors with a positivevalence, which may be more appealing and easier for caregivers to recognize and reportupon. Additionally, the items are presented with varying developmental gradations so theyare appropriate for children with or without speech or cognitive delay and can tap into theexpanding repertoire of a child’s early social interaction development period. Fourth, thefour-point scoring method allows for detection of subtle differences and may be helpful ingauging response to targeted therapies aimed at improving social interaction and socialcommunication behaviors. Finally, the two versions for younger and older preschoolers (theSSI-Y and SSI-O) allow for capture of age-specific social communication behaviors. This isespecially relevant given that symptom profiles and severity seem to change significantly formany children with ASD between two to four years of age (e.g., Chawarska, Klin, Paul,Macari, and Volkmar, 2009; Cox et al., 1999).
AcknowledgmentsThis research was supported by an NIMH Minority Supplement grant MH50047 to JKG – Parent RO1 GrantMH50047 to Allan Reiss, M.D. Special thanks to the families and the children who participated in this project, my(JKG) mentors, Drs. Susan Folstein and Michael Aman, for their guidance, encouragement and generosity, my(JKG) biostatistics teachers, Drs. Marie Diener-West and James Tonascia, Irena Bukelis and Lynn Medley for theirhelp with the project, and Rachele Peterson for her help with the bibliography.
ReferencesAPA. Diagnostic and statistical manual of mental disorders. Washington, DC: American Psychiatric
Association; 2000.Barbaro J, Dissanayake C. Autism spectrum disorders in infancy and toddlerhood: a review of the
evidence on early signs, early identification tools, and early diagnosis. Journal of Developmentaland Behavioral Pediatrics: JDBP. 2009; 30:447–459. [PubMed: 19823139]
Baron-Cohen S, Allen J, Gillberg C. Can autism be detected at 18 months? The needle, the haystack,and the CHAT. British Journal of Psychiatry. 1992; 161:839–843. [PubMed: 1483172]
Baron-Cohen S, Cox A, Baird G, Swettenham J, Nightingale N, Morgan K, Drew A, Charman T.Psychological markers in the detection of autism in infancy in a large population. British Journal ofPsychiatry. 1996; 168:158–163. [PubMed: 8837904]
Bayley, N. The Bayley Scales of Infant Development (Report No. 2nd). San Antonio, TX: HarcourtBrace; 1993.
Berument S, Rutter M, Lord C, Pickles A, Bailey A. Autism Screening Questionnaire: diagnosticvalidity. Br J Psychiatry. 1999; 175:444–451. [PubMed: 10789276]
Charman T, Baird G. Practitioner review: Diagnosis of autism spectrum disorder in 2- and 3-year-oldchildren. Journal of Child Psychology and Psychiatry. 2002; 43:289–305. [PubMed: 11944873]
Chawarska K, Klin A, Paul R, Macari S, Volkmar F. A prospective study of toddlers with ASD: short-term diagnostic and cognitive outcomes. Journal of Child Psychology and Psychiatry, and AlliedDisciplines. 2009; 50:1235–1245.
Cox A, Klein K, Charman T, Baird G, Baron-Cohen S, Swettenham J, Drew A, Wheelwright S.Autism spectrum disorders at 20 and 42 months of age: stability of clinical and ADI-R diagnosis.Journal of Child Psychology and Psychiatry, and Allied Disciplines. 1999; 40:719–732.
Dietz C, Swinkels S, van Daalen E, van Engeland H, Buitelaar J. Screening for autistic spectrumdisorder in children aged 14–15 months. II: population screening with the Early Screening ofAutistic Traits Questionnaire (ESAT). Design and general findings. Journal of Autism andDevelopmental Disorders. 2006; 36:713–722. [PubMed: 16633887]
Ghuman JK, Freund L, Reiss A, Serwint J, Folstein S. Early detection of social interaction problems:development of a social interaction instrument in young children. Journal of Developmental andBehavioral Pediatrics. 1998; 19:411–419. [PubMed: 9866088]
Ghuman et al. Page 10
Res Dev Disabil. Author manuscript; available in PMC 2012 November 1.
NIH
-PA Author Manuscript
NIH
-PA Author Manuscript
NIH
-PA Author Manuscript
Ghuman JK, Peebles CD, Ghuman HS. Review of social interaction measures in infants and preschoolchildren. Infants and Young Children. 1998; 11:21–44.
Gray K, Tonge B, Sweeney D, Einfeld S. Screening for autism in young children with developmentaldelay: an evaluation of the developmental behaviour checklist: early screen. Journal AutismDevelopmental Disorders. 2008; 38:1003–1010. Epub 2007 Oct 1030.
Landa R, Holman K, Garrett-Mayer E. Social and communication development in toddlers with earlyand later diagnosis of autism spectrum disorders. Archives General Psychiatry. 2007; 64:853–864.
Matson JL, Wilkins J, Sharp B, Knight C, Sevin JA, Boisjoli JA. Sensitivity and specificity of theBaby and Infant Screen for Children with Autism Traits (BISCUIT): Validity and cutoff scores forautism and PDD-NOS in toddlers. Research in Autism Spectrum Disorders. 2009; 3:924–930.
Menard, SW. Quantitative applications in the social sciences #106: applied logistic regression analysis.Thousand Oaks, CA: Sage Publications; 2002.
Mundy, P.; Burnette, C.; Volkmar, FR. Handbook of autism and pervasive developmental disorders,volume 1: diagnosis, development, neurobiology, and behavior. 3. Hoboken, NJ: John Wiley &Sons, Inc; 2005. Joint attention and neurodevelopmental models of autism; p. 650-681.
Oosterling I, Rommelse N, De Jonge M, Van Der Gaag R, Swinkels S, Roos S, Visser J, Buitelaar J.How useful is the Social Communication Questionnaire in toddlers at risk of autism spectrumdisorder? Journal of Child Psychology and Psychiatry. 2010; 51:1260–1268. [PubMed: 20626528]
Oosterling I, Swinkels S, van der Gaag R, Visser J, Dietz C, Buitelaar J. Comparative analysis of threescreening instruments for autism spectrum disorder in toddlers at high risk. J AutismDevelopmental Disorders. 2009; 39:897–909. Epub 2009 Feb 2010.
Peduzzi P, Concato J, Kemper E, Holford TR, Feinstein AR. A simulation study of the number ofevents per variable in logistic regression analysis. Journal of Clinical Epidemiology. 1996;49:1373–1379. [PubMed: 8970487]
Robins DL, Fein D, Barton ML, Green JA. The Modified Checklist for Autism in Toddlers: an initialstudy investigating the early detection of autism and pervasive developmental disorders. J AutismDev Disord. 2001:131–44. [PubMed: 11450812]
Rutter, M.; LeCouteur, A.; Lord, C. Autism Diagnostic Interview-Revised (ADI-R). WesternPsychological Services; Los Angeles, CA: 2003.
Schopler, E.; Reichler, R.; Renner, B. The Childhood Autism Rating Scale (CARS) (Report). LosAngeles, CA: Western Psychological Services; 1988.
Snow A, Lecavalier L. Sensitivity and specificity of the Modified Checklist for Autism in Toddlersand the Social Communication Questionnaire in preschoolers suspected of having pervasivedevelopmental disorders. Autism. 2008; 12:627–644. [PubMed: 19005032]
Sparrow, S.; Balla, D.; Cichetti, DV. Vineland Adaptive Behavior Scales (Report). Circle Pines, MN:American Guidance Service; 1984.
Swinkels S, Dietz C, van Daalen E, Kerkhof I, van Engeland H, Buitelaar J. Screening for autisticspectrum in children aged 14 to 15 months. I: the development of the Early Screening of AutisticTraits Questionnaire (ESAT). Journal of Autism and Developmental Disorders. 2006; 36:723–732.[PubMed: 16614790]
Thorndike, RL.; Hagen, EP.; Sattler, JM. The Stanford-Binet Intelligence Scale (Report No. 4th).Chicago, IL: Riverside Publishing Company; 1986.
Ventola P, Kleinman J, Pandey J, Wilson L, Esser E, Boorstein H, Dumont-Mathieu T, Marshia G,Barton M, Hodgson S, Green J, Volkmar F, Chawarska K, Babitz T, Robins D, Fein D.Differentiating between autism spectrum disorders and other developmental disabilities in childrenwho failed a screening instrument for ASD. Journal of Autism and Developmental Disorders.2007; 37:425–436. [PubMed: 16897377]
Volkmar F, Chawarska K, Klin A. Autism in infancy and early childhood. Annual ReviewPsychology. 2005; 56:315–336.
Wiggins LD, Robins DL. Brief report: excluding the ADI-R behavioral domain improves diagnosticagreement in toddlers. Journal of Autism and Developmental Disorders. 2008; 38:972–976.[PubMed: 17879150]
Ghuman et al. Page 11
Res Dev Disabil. Author manuscript; available in PMC 2012 November 1.
NIH
-PA Author Manuscript
NIH
-PA Author Manuscript
NIH
-PA Author Manuscript

APPENDIX
Final shortened screening instrumentsSocial Screen for Interaction-Younger (SSI-Y)
Social Screen for Interaction-Older (SSI-O)
SCREEN FOR SOCIAL INTERACTION – YOUNGER VERSION (SSI-Y) - 24–42 Months Screen with ScoringTemplate
YOUR OBSERVATION ALMOST NEVER
SOME OFTHE
TIME
MOST OFTHE
TIME
ALMOSTALL OF THE
TIME
*1. When you talk to your child, does s/helook at you?
0 1 2 3
5. Does your child try to get your attention toshow you things?
0 1 2 3
6. Does your child interact with you back andforth over a few turns using speech orsounds?
0 1 2 3
12. Does your child show affection bycuddling up to you?
0 1 2 3
Does your child respond playfully by:
*15. laughing when you make sillysounds?
0 1 2 3
17. playing “dressing up” games? 0 1 2 3
18. playing pretend games with dolls, cars,action figures, dollhouse?
0 1 2 3
20. During meals does your child interactwith you by making sounds or talking?
0 1 2 3
During meals does your child show what food s/he likes by:
21. making sounds or talking? 0 1 2 3
22. pointing or other gestures? 0 1 2 3
23. speech or making sounds? 0 1 2 3
24. Does your child copy you by washingdishes, pretending to cook or mow the lawn,etc.?
0 1 2 3
*25. Does your child show you things that s/he had done and wants you to praise?
0 1 2 3
26. Does your child smile when you praisehim/her?
0 1 2 3
*31. Is your child shy around people s/hedoes not know well?
0 1 2 3
Does your child:
*!32. have a blank face? 3 2 1 0
*!33. look distant or removed? 3 2 1 0
*34. Can your child tell from the look on yourface or the tone of your voice that you arehappy?
0 1 2 3
Does your child show interest in other children by:
Ghuman et al. Page 12
Res Dev Disabil. Author manuscript; available in PMC 2012 November 1.
NIH
-PA Author Manuscript
NIH
-PA Author Manuscript
NIH
-PA Author Manuscript
SCREEN FOR SOCIAL INTERACTION – YOUNGER VERSION (SSI-Y) - 24–42 Months Screen with ScoringTemplate
YOUR OBSERVATION ALMOST NEVER
SOME OFTHE
TIME
MOST OFTHE
TIME
ALMOSTALL OF THE
TIME
36. watching them? 0 1 2 3
*40. joining in the play if they invite him/her?
0 1 2 3
41. showing concern if another child isupset?
0 1 2 3
42. Is your child able to start a socialexchange with other children?
0 1 2 3
45. Do other children (of his/her age) likehim/her?
0 1 2 3
51. Is your child able to take turns in play? 0 1 2 3
52. Does your child have playmates who s/heprefers to play with?
0 1 2 3
*54. Does your child share toys and favoriteobjects with siblings or other children his/herage?
0 1 2 3
Bolded items are unique to SSI-Y and do not overlap with SSI-O*Items constitute the SSI-Y-Brief Scale;
!Items are reverse scored
Cutoff score of 45 or less on the SSI-Y identifies younger preschoolers at risk of ASD
Cutoff score of 17 or less on the SSI-Y-Brief identifies younger preschoolers at risk of ASD
SCREEN FOR SOCIAL INTERACTION – OLDER PRESCHOOL VERSION (SSI-O) 43–61 Months Screenwith Scoring Template
YOUR OBSERVATION ALMOST NEVER
SOME OFTHE
TIME
MOST OFTHE
TIME
ALMOSTALL OF THE
TIME
1. When you talk to your child, does s/helook at you?
0 1 2 3
5. Does your child try to get your attention toshow you things?
0 1 2 3
6. Does your child interact with you back andforth over a few turns using speech orsounds?
0 1 2 3
Does your child greet you when you return home by:
*9. making sounds or talking to you? 0 1 2 3
11. hugging you? 0 1 2 3
Does your child respond playfully by:
17. playing “dressing up” games? 0 1 2 3
*18. playing pretend games with dolls,cars, action figures, dollhouse?
0 1 2 3
20. During meals does your child interactwith you by making sounds or talking?
0 1 2 3
23. During meals does your child show whatfood s/he likes by speech or making sounds?
0 1 2 3
Ghuman et al. Page 13
Res Dev Disabil. Author manuscript; available in PMC 2012 November 1.
NIH
-PA Author Manuscript
NIH
-PA Author Manuscript
NIH
-PA Author Manuscript

SCREEN FOR SOCIAL INTERACTION – OLDER PRESCHOOL VERSION (SSI-O) 43–61 Months Screenwith Scoring Template
YOUR OBSERVATION ALMOST NEVER
SOME OFTHE
TIME
MOST OFTHE
TIME
ALMOSTALL OF THE
TIME
24. Does your child copy you by washingdishes, pretending to cook or mow the lawn,etc.?
0 1 2 3
*25. Does your child show you things that s/he had done and wants you to praise?
0 1 2 3
26. Does your child smile when you praisehim/her?
0 1 2 3
*35. Can your child tell from the look onyour face or the tone of your voice that youare angry?
0 1 2 3
Does your child show interest in other children by:
36. watching them? 0 1 2 3
38. staying close to them? 0 1 2 3
*40. joining in the play if they invite him/her?
0 1 2 3
41. showing concern if another child isupset?
0 1 2 3
*42. Is your child able to start a socialexchange with other children?
0 1 2 3
51. Is your child able to take turns in play? 0 1 2 3
52. Does your child have playmates who s/heprefers to play with?
0 1 2 3
*54. Does your child share toys and favoriteobjects with siblings or other children his/herage?
0 1 2 3
Bolded items are unique to SSI-O and do not overlap with SSI-Y*Items constitute the SSI-O-Brief Scale
Cutoff score of 37 or less on the SSI-O identifies older preschoolers at risk of ASD
Cutoff score of 13 or less on the SSI-O-Brief identifies older preschoolers at risk of ASD
Ghuman et al. Page 14
Res Dev Disabil. Author manuscript; available in PMC 2012 November 1.
NIH
-PA Author Manuscript
NIH
-PA Author Manuscript
NIH
-PA Author Manuscript

Highlights
• Caregivers of 350 preschoolers (ages 24 to 61 months) with ASDs, non-ASDdevelopmental and/or psychiatric disorders, or without developmental concernscompleted the Ghuman-Folstein Screen for Social Interaction (SSI).
• Two shortened versions were derived for younger (SSI-Y) and older (SSI-O)children.
• The SSI-Y and SSI-O showed moderate convergence with ASD diagnosticmeasures and significantly differentiated ASD and non-ASD clinical groups.
• Sensitivity was .87 and .81, and specificity was.71 and .70, respectively for theSSI-Y and SSI-O.
Ghuman et al. Page 15
Res Dev Disabil. Author manuscript; available in PMC 2012 November 1.
NIH
-PA Author Manuscript
NIH
-PA Author Manuscript
NIH
-PA Author Manuscript

NIH
-PA Author Manuscript
NIH
-PA Author Manuscript
NIH
-PA Author Manuscript
Ghuman et al. Page 16
Tabl
e 1
Cha
ract
eris
tics o
f par
ticip
ants
in th
e fo
ur d
iagn
ostic
gro
ups (
N =
350
)
Cha
ract
eris
ticA
utis
tic d
isor
dera
PDD
-NO
SbN
on-A
SD c
linic
alc
Typ
ical
ly- d
evel
opin
gdSi
gnifi
canc
e te
st† /
test
val
uePo
st-h
oc te
st
Dem
ogra
phic
s of Y
oung
er P
artic
ipan
ts (a
ges 2
4–42
mon
ths)
: n =
176
Subg
roup
n:
3022
2110
3
Age
in m
onth
s: m
ean
(SD
)36
.4 (4
.8)
35.0
(6.5
)36
.0 (5
.1)
32.9
(5.8
)F=
4.1
7**
a>d#
Gen
der:
n (%
) mal
e24
(80%
)18
(82%
)15
(71%
)53
(52%
)X2 =
13.
50**
Ethn
icity
: n (%
) Cau
casi
an22
(73%
)18
/20«
(90%
)13
(62%
)63
(61%
)X2 =
7.1
2
Mot
her’
s edu
catio
n: H
igh
scho
ol o
r bey
ond:
n (%
)26
/27«
(96%
)20
(91%
)14
/19«
(74%
)83
/101
« (8
2%)
X2 = 5
.70
SES:
n; M
ean
(SD
)26
; 32.
2 (1
7.2)
21; 3
2.1
(20.
0)19
; 40.
2 (2
3.1)
100;
44.
1 (2
2.3)
F= 3
.30*
*N
S#
Dem
ogra
phic
s of O
lder
Par
ticip
ants
(age
s 43–
61 m
onth
s): n
= 1
74
Su
bgro
up n
:36
2647
65
A
ge in
mon
ths:
n; m
ean
(SD
)52
.9 (6
.0)
52.5
(5.8
)52
.5 (4
.9)
52.1
(5.3
)F=
.179
G
ende
r: n
(%) m
ale
29 (8
1%)
22 (8
5%)
32 (6
8%)
35 (5
4%)
X2 = 1
1.85
**
Et
hnic
ity: n
(%) C
auca
sian
28/3
5« (8
0%)
20 (7
7%)
28 (6
0%)
42/6
4« (6
6%)
X2 = 4
.99
M
othe
r’s e
duca
tion:
Hig
h sc
hool
or b
eyon
d: n
(%)
33/3
5« (9
4%)
21/2
5« (8
4%)
38/4
1« (9
3%)
53 (8
2%)
X2 = 4
.82
SE
S: n
; Mea
n (S
D)
35; 3
4.0
(21.
4)22
; 29.
6 (1
8.8)
35; 4
2.4
(20.
0)62
; 46.
3 (2
3.9)
F= 4
.42*
*b<
d#
Cog
nitiv
e an
d Ad
aptiv
e le
vels
–All
Ages
Full
grou
p n:
6648
58
Ver
bal^
: n (%
)23
/47«
(49%
)16
/37«
(43%
)35
/48«
(73%
)-
X2 = 8
.97*
IQ/D
Q: n
; mea
n (S
D)
20; 6
1.8
(21.
9)22
; 70.
6 (2
2.3)
37; 8
0.9
(17.
4)-
F= 6
.14*
*a<
c#
VA
BS-
Soci
aliz
atio
n: n
; mea
n (S
D)
32; 5
7.7
(11.
6)25
; 65.
6 (1
7.7)
33; 7
5.6
(14.
2)-
F= 1
2.63
**a,
b<c#
VA
BS-
Com
mun
icat
ion:
n; m
ean
(SD
)20
; 60.
0 (1
3.5)
14; 7
4.6
(15.
9)15
; 80.
3 (1
7.5)
-F=
8.0
8**
a<b,
c#
VA
BS
Com
posi
te: n
; mea
n (S
D)
19; 6
0.5
(9.8
)12
; 68.
6 (1
1.2)
13; 8
0.5
(18.
8)-
F= 8
.59*
*a<
c‡
PDD
-NO
S=Pe
rvas
ive
deve
lopm
enta
l dis
orde
r-no
t oth
erw
ise
spec
ified
; ASD
=Aut
ism
spec
trum
dis
orde
r; SD
=Sta
ndar
d de
viat
ion;
IQ=I
ntel
ligen
ce q
uotie
nt, D
Q=D
evel
opm
enta
l quo
tient
; VA
BS=
Vin
elan
dA
dapt
ive
Beh
avio
r Sca
les;
SES
= S
ocio
econ
omic
stat
us (H
ollin
gshe
ad fo
ur-f
acto
r met
hod)
, NS
= N
ot si
gnifi
cant
† AN
OV
A o
r Chi
Squ
are
com
paris
ons b
y gr
oup
# AN
OV
A p
ost-h
oc (S
heff
é) c
ompa
rison
s (si
gnifi
canc
e va
lue
of p
<.05
)
Res Dev Disabil. Author manuscript; available in PMC 2012 November 1.

NIH
-PA Author Manuscript
NIH
-PA Author Manuscript
NIH
-PA Author Manuscript
Ghuman et al. Page 17« D
enom
inat
or d
iffer
s fro
m th
e to
tal n
umbe
r of p
artic
ipan
ts in
the
subg
roup
due
to m
issi
ng d
ata
^ Ver
bal a
bilit
y as
det
erm
ined
by
AD
I-R
func
tiona
l lan
guag
e de
finiti
on
‡ AN
OV
A p
ost-h
oc (T
amha
ne d
ue to
une
qual
var
ianc
es a
mon
g sa
mpl
es, s
igni
fican
ce v
alue
of p
<.05
)
* p<.0
5;
**p<
.01
Res Dev Disabil. Author manuscript; available in PMC 2012 November 1.
NIH
-PA Author Manuscript
NIH
-PA Author Manuscript
NIH
-PA Author Manuscript
Ghuman et al. Page 18
Tabl
e 2
Gro
up c
ompa
rison
s of S
cree
n fo
r Soc
ial I
nter
actio
n (S
SI) t
otal
scor
es in
the
four
dia
gnos
tic g
roup
s and
by
age
grou
p (N
= 3
50)
SSI T
otal
Sco
re (5
4 ite
ms)
Aut
istic
dis
orde
raPD
D-N
OSb
Non
-ASD
clin
ical
cT
ypic
ally
-dev
elop
ingd
Tes
t val
ue
Youn
ger A
ge G
roup
Num
ber o
f par
ticip
ants
3022
2110
3
Mea
n (S
D)
70.0
(27.
6)79
.2 (1
9.4)
106.
6 (2
5.7)
124.
8 (1
4.8)
F^=
79.3
2*
Old
er A
ge G
roup
Num
ber o
f par
ticip
ants
3626
4765
Mea
n (S
D)
72.6
(23.
4)86
.6 (3
1.2)
105.
7 (2
4.5)
122.
7 (1
8.3)
F^=
40.3
4*
PDD
-NO
S=Pe
rvas
ive
deve
lopm
enta
l dis
orde
r-no
t oth
erw
ise
spec
ified
; ASD
=Aut
ism
spec
trum
dis
orde
r;
* p<.0
01
^ One
-way
AN
OV
As c
ondu
cted
alo
ng w
ith th
ree
sets
of a
-prio
ri co
ntra
sts a
nd p
ost-h
oc te
sts.
All
a-pr
iori
cont
rast
s sig
nific
ant f
or b
oth
You
nger
and
Old
er P
artic
ipan
ts: a
<b,c
,d; a
,b<c
,d; a
,b,c
<d. T
amha
nePo
st-h
oc c
ompa
rison
s con
duct
ed d
ue to
une
qual
var
ianc
es (s
igni
fican
ce le
vel o
f p<.
05 c
hose
n in
ligh
t of c
onse
rvat
ive
test
use
d).
Post
-hoc
com
paris
ons f
or Y
oung
er P
artic
ipan
ts: a
,b<c
<d. P
ost h
oc c
ompa
rison
s for
Old
er P
artic
ipan
ts: a
<c<d
; b<d
.
Res Dev Disabil. Author manuscript; available in PMC 2012 November 1.

NIH
-PA Author Manuscript
NIH
-PA Author Manuscript
NIH
-PA Author Manuscript
Ghuman et al. Page 19
Table 3
Binary logistic regression analyses to predict membership in autism spectrum disorders (autistic disorder orPDD-NOS) versus Non-ASD Clinical Group (n = 182)
Predictorsa: Item and description β Change in -2 Log Likelihoodb,c
Statistically significant (p < 0.05) items for younger age group (24–42 months of age): n = 73
1. looks at you when you talk to him/her −1.10 6.87d
2. smiles at you when you talk to him/her 1.05 5.04
6. interacts with you via speech or sounds −0.87 4.89
7. interacts with you via gestures −0.79 5.37
8. greets your return by looking at you 0.84 4.61
11. greets your return by hugging you −0.97 6.34
12. shows affection by cuddling −0.92 4.35
15. laughs when you make silly sounds −1.59 11.02d
25. seeks praise by showing what s/he did −1.02 12.98e
31. shy around people s/he doesn’t know well −1.06 9.95d
32. has a blank face (reverse scored) −0.92 7.37d
33. looks distant/removed (reverse scored) −1.98 12.24e
34. can see you are happy by your face or voice −0.95 9.14d
38. stays close to other children 1.22 6.49
40. joins play when invited by other children −1.21 7.69d
41. shows concern if another child is upset −0.96 5.46
42. can start social exchange with other children −0.67 4.62
45. is liked by other children his/her age −0.81 5.47
49. takes toys from siblings or other children (reverse scored) 0.86 7.07d
54. shares favorite items or toys with children −0.98 8.13d
Statistically significant (p < 0.05) items for older age group (43−61 months of age): n = 109
1. looks at you when you talk to him/her −0.72 6.07
9. greets your return with sounds or talking −0.74 12.43e
18. plays pretend games (dolls, cars) −0.66 8.08d
25. seeks praise by showing what s/he did −1.12 27.98e
35. can see you are angry by your face or voice −0.74 9.32d
42. can start a social exchange with other children −1.31 35.42e
40. joins play when invited by other children −1.09 31.03e
49. takes toys from siblings/other children (reverse scored) 0.71 8.01d
54. shares favorite items or toys with children −0.99 17.62e
PDD-NOS=Pervasive developmental disorder-not otherwise specified
aItems were entered using Backward Stepwise method in seven separate blocks
bChange in model if item removed
Res Dev Disabil. Author manuscript; available in PMC 2012 November 1.

NIH
-PA Author Manuscript
NIH
-PA Author Manuscript
NIH
-PA Author Manuscript
Ghuman et al. Page 20
cBoldface indicates critical items chosen
dp < 0.01
ep < 0.001
Res Dev Disabil. Author manuscript; available in PMC 2012 November 1.

NIH
-PA Author Manuscript
NIH
-PA Author Manuscript
NIH
-PA Author Manuscript
Ghuman et al. Page 21
Tabl
e 4
Sens
itivi
ty a
nd sp
ecifi
city
for d
iscr
imin
atin
g be
twee
n au
tism
spec
trum
dis
orde
r (A
SD) a
nd N
on-A
SD c
linic
al p
artic
ipan
ts
Dis
crim
inat
ion:
ASD
(aut
ism
and
PD
D-N
OS)
vs.
Non
-ASD
Clin
ical
Gro
up (n
= 1
82)
Tes
t var
iabl
e an
d G
roup
s:n
SSI m
ean
(SD
); ra
nge
RO
C (A
UC
)Sc
reen
Sco
re^
Sens
itivi
tySp
ecifi
city
You
nger
– S
SI-Y
(26
item
s):
440.
850.
71
A
SD52
30.8
(12.
8); 1
0–68
450.
870.
71
N
on-A
SD C
linic
al21
52.7
(13.
8); 2
5–76
0.88
460.
890.
67
You
nger
– 9
Crit
ical
SSI
item
s:16
0.75
0.90
A
SD52
12.3
(4.4
); 4–
2417
0.85
0.71
N
on-A
SD C
linic
al21
19.6
(4.4
); 9–
260.
8918
0.92
0.62
Old
er –
SSI-
O (2
1 ite
ms)
:36
0.76
0.74
A
SD62
24.8
(13.
7); 4
–58
370.
810.
70
N
on-A
SD C
linic
al47
42.5
(11.
0); 1
4–63
0.84
380.
840.
68
Old
er –
7 C
ritic
al S
SI it
ems:
120.
770.
77
A
SD62
7.6
(4.8
); 0–
1913
0.82
0.72
N
on-A
SD C
linic
al47
14.6
(4.0
); 5–
210.
8614
0.86
0.64
Dis
crim
inat
ion:
Mat
ched
† A
SD (a
utis
m a
nd P
DD
-NO
S) v
s. N
on-A
SD C
linic
al (n
= 5
4)
Tes
t var
iabl
e an
d G
roup
s:n
SSI m
ean
(SD
); ra
nge
RO
C (A
UC
)Sc
reen
Sco
re^
Sens
itivi
tySp
ecifi
city
You
nger
– S
SI-Y
(26
item
s):
460.
700.
70
A
SD10
36.0
(12.
4); 1
6–54
480.
800.
70
N
on-A
SD C
linic
al10
52.8
(14.
3); 2
5–73
0.82
520.
900.
60
You
nger
– 9
Crit
ical
SSI
item
s:17
0.80
0.70
A
SD10
13.4
(3.5
); 9–
1918
0.90
0.70
N
on-A
SD C
linic
al10
19.0
(4.8
); 9–
250.
8319
0.90
0.50
Old
er –
SSI
-O (2
1 ite
ms)
:38
0.77
0.88
A
SD17
29.2
(15.
0); 4
–58
420.
820.
71
N
on-A
SD C
linic
al17
46.6
(8.9
); 30
–60
0.85
450.
880.
59
Res Dev Disabil. Author manuscript; available in PMC 2012 November 1.

NIH
-PA Author Manuscript
NIH
-PA Author Manuscript
NIH
-PA Author Manuscript
Ghuman et al. Page 22
Dis
crim
inat
ion:
Mat
ched
† A
SD (a
utis
m a
nd P
DD
-NO
S) v
s. N
on-A
SD C
linic
al (n
= 5
4)
Tes
t var
iabl
e an
d G
roup
s:n
SSI m
ean
(SD
); ra
nge
RO
C (A
UC
)Sc
reen
Sco
re^
Sens
itivi
tySp
ecifi
city
Old
er –
7 C
ritic
al S
SI it
ems:
140.
770.
82
A
SD17
9.2
(5.0
); 1–
1715
0.88
0.65
N
on-A
SD C
linic
al17
16.1
(3.0
); 11
–21
0.89
160.
940.
59
PDD
-NO
S=Pe
rvas
ive
deve
lopm
enta
l dis
orde
r-no
t oth
erw
ise
spec
ified
^ Cut
offs
refe
r to
scre
en sc
ores
equ
al to
or l
ess t
han
the
scor
e(s)
list
ed
† Mat
ched
par
ticip
ants
are
a su
bset
of t
he p
artic
ipan
ts d
epic
ted
in th
e to
p ha
lf of
the
tabl
e
Res Dev Disabil. Author manuscript; available in PMC 2012 November 1.