The Roles of Cassava in Marginal Semi-Arid Farming in East ...
22
Citation: Ngongo, Y.; Basuki, T.; deRosari, B.; Mau, Y.S.; Noerwijati, K.; daSilva, H.; Sitorus, A.; Kotta, N.R.E.; Utomo, W.H.; Wisnubroto, E.I. The Roles of Cassava in Marginal Semi-Arid Farming in East Nusa Tenggara—Indonesia. Sustainability 2022, 14, 5439. https://doi.org/ 10.3390/su14095439 Academic Editors: Emanuele Radicetti and Georgios Koubouris Received: 9 February 2022 Accepted: 27 April 2022 Published: 30 April 2022 Publisher’s Note: MDPI stays neutral with regard to jurisdictional claims in published maps and institutional affil- iations. Copyright: © 2022 by the authors. Licensee MDPI, Basel, Switzerland. This article is an open access article distributed under the terms and conditions of the Creative Commons Attribution (CC BY) license (https:// creativecommons.org/licenses/by/ 4.0/). sustainability Review The Roles of Cassava in Marginal Semi-Arid Farming in East Nusa Tenggara—Indonesia Yohanis Ngongo 1, *, Tony Basuki 1 , Bernard deRosari 1 , Yosep Seran Mau 2 , Kartika Noerwijati 3 , Helena daSilva 1 , Alfonso Sitorus 1 , Noldy R. E. Kotta 1 , Wani Hadi Utomo 4 and Erwin Ismu Wisnubroto 5 1 East Nusa Tenggara Assessment Institute of Agricultural Technology (ENT AIAT), Kupang 85362, East Nusa Tenggara, Indonesia; [email protected] (T.B.); [email protected] (B.d.); [email protected] (H.d.); [email protected] (A.S.); [email protected] (N.R.E.K.) 2 Agriculture Faculty, University of Nusa Cendana, Kupang 85001, East Nusa Tenggara, Indonesia; [email protected] 3 Indonesian Legumes and Tuber Crops Research Institute, Malang 65101, East Java, Indonesia; [email protected] 4 Centre for Soil and Land Management, Brawijaya University, Malang 65145, East Java, Indonesia; [email protected] 5 Faculty of Agro-Eco Technology, Tribuana University, Malang 65144, East Java, Indonesia; [email protected] * Correspondence: [email protected]; Tel.: +62-813-5329-3979 Abstract: Risk and uncertainty in grain crop production are common in marginal semi-arid environ- ments, such as East Nusa Tenggara province. Growing root and tuber crops in a mixed-cropping system is one of the strategies developed by smallholder farmers to substitute food grains and mini- mize risk. Nevertheless, root and tuber crops are not prioritized for food production systems since food crops in Indonesia are based more on grain and wetland rice production systems. This paper reviews cassava crops, which are widely cultivated by smallholder farmers. This paper contributes to understanding the roles of cassava for smallholder farmers, the diversity of the cassava germ plasm, the progress made to increase cassava productivity, and the potency of cassava crops to improve farmers’ incomes. This paper highlights that, in the low and erratic rainfall of dominant semi-arid regions, the development of cassava is pivotal to secure the harvest of food crops or food availability and income generation for marginal farmers. Keywords: food crops; cassava; marginal farmers; semi-arid; risk and uncertainty 1. Introduction The agricultural environment of East Nusa Tenggara (ENT) is mainly characterized by infertile soils as well as low and erratic rainfall. In this marginal semi-arid environment, grain-based farming is fragile to drought and harvest failure. As a result, most farmers dependent on upland farming face frequent crop failure and food shortages. Therefore, planting various root and tuber crops in the mixed-cropping pattern is the most common practice developed by most marginal farmers in the semi-arid area of ENT [1]. Cassava (Manihot esculenta Crantz) is one of the primary root and tuber crops widely planted in ENT. For marginal environments, poor soils, and drought-prone regions, cassava is the primary carbohydrate source for small farmers [2–5] and supplies most of the starch used by industries [6]. Despite provincial government campaigns encouraging people to diversify and con- sume more locally produced food/commodities, the infrastructure for agriculture is still biased towards grains, particularly rice and maize. Long investments for rice and maize production in ENT have little impact on provincial food sufficiency. Total imported rice by ENT Logistic Procurement or “BULOG NTT” in 2010 was 126,300 tons [7], and, to date, this Sustainability 2022, 14, 5439. https://doi.org/10.3390/su14095439 https://www.mdpi.com/journal/sustainability
-
Upload
khangminh22 -
Category
Documents
-
view
0 -
download
0
Transcript of The Roles of Cassava in Marginal Semi-Arid Farming in East ...

Citation: Ngongo, Y.; Basuki, T.;
deRosari, B.; Mau, Y.S.;
Noerwijati, K.; daSilva, H.;
Sitorus, A.; Kotta, N.R.E.;
Utomo, W.H.; Wisnubroto, E.I. The
Roles of Cassava in Marginal
Semi-Arid Farming in East Nusa
Tenggara—Indonesia. Sustainability
2022, 14, 5439. https://doi.org/
10.3390/su14095439
Academic Editors:
Emanuele Radicetti and
Georgios Koubouris
Received: 9 February 2022
Accepted: 27 April 2022
Published: 30 April 2022
Publisher’s Note: MDPI stays neutral
with regard to jurisdictional claims in
published maps and institutional affil-
iations.
Copyright: © 2022 by the authors.
Licensee MDPI, Basel, Switzerland.
This article is an open access article
distributed under the terms and
conditions of the Creative Commons
Attribution (CC BY) license (https://
creativecommons.org/licenses/by/
4.0/).
sustainability
Review
The Roles of Cassava in Marginal Semi-Arid Farming in EastNusa Tenggara—IndonesiaYohanis Ngongo 1,*, Tony Basuki 1, Bernard deRosari 1, Yosep Seran Mau 2, Kartika Noerwijati 3, Helena daSilva 1,Alfonso Sitorus 1 , Noldy R. E. Kotta 1, Wani Hadi Utomo 4 and Erwin Ismu Wisnubroto 5
1 East Nusa Tenggara Assessment Institute of Agricultural Technology (ENT AIAT),Kupang 85362, East Nusa Tenggara, Indonesia; [email protected] (T.B.); [email protected] (B.d.);[email protected] (H.d.); [email protected] (A.S.); [email protected] (N.R.E.K.)
2 Agriculture Faculty, University of Nusa Cendana, Kupang 85001, East Nusa Tenggara, Indonesia;[email protected]
3 Indonesian Legumes and Tuber Crops Research Institute, Malang 65101, East Java, Indonesia;[email protected]
4 Centre for Soil and Land Management, Brawijaya University, Malang 65145, East Java, Indonesia;[email protected]
5 Faculty of Agro-Eco Technology, Tribuana University, Malang 65144, East Java, Indonesia;[email protected]
* Correspondence: [email protected]; Tel.: +62-813-5329-3979
Abstract: Risk and uncertainty in grain crop production are common in marginal semi-arid environ-ments, such as East Nusa Tenggara province. Growing root and tuber crops in a mixed-croppingsystem is one of the strategies developed by smallholder farmers to substitute food grains and mini-mize risk. Nevertheless, root and tuber crops are not prioritized for food production systems sincefood crops in Indonesia are based more on grain and wetland rice production systems. This paperreviews cassava crops, which are widely cultivated by smallholder farmers. This paper contributes tounderstanding the roles of cassava for smallholder farmers, the diversity of the cassava germ plasm,the progress made to increase cassava productivity, and the potency of cassava crops to improvefarmers’ incomes. This paper highlights that, in the low and erratic rainfall of dominant semi-aridregions, the development of cassava is pivotal to secure the harvest of food crops or food availabilityand income generation for marginal farmers.
Keywords: food crops; cassava; marginal farmers; semi-arid; risk and uncertainty
1. Introduction
The agricultural environment of East Nusa Tenggara (ENT) is mainly characterized byinfertile soils as well as low and erratic rainfall. In this marginal semi-arid environment,grain-based farming is fragile to drought and harvest failure. As a result, most farmersdependent on upland farming face frequent crop failure and food shortages. Therefore,planting various root and tuber crops in the mixed-cropping pattern is the most commonpractice developed by most marginal farmers in the semi-arid area of ENT [1].
Cassava (Manihot esculenta Crantz) is one of the primary root and tuber crops widelyplanted in ENT. For marginal environments, poor soils, and drought-prone regions, cassavais the primary carbohydrate source for small farmers [2–5] and supplies most of the starchused by industries [6].
Despite provincial government campaigns encouraging people to diversify and con-sume more locally produced food/commodities, the infrastructure for agriculture is stillbiased towards grains, particularly rice and maize. Long investments for rice and maizeproduction in ENT have little impact on provincial food sufficiency. Total imported rice byENT Logistic Procurement or “BULOG NTT” in 2010 was 126,300 tons [7], and, to date, this
Sustainability 2022, 14, 5439. https://doi.org/10.3390/su14095439 https://www.mdpi.com/journal/sustainability
Sustainability 2022, 14, 5439 2 of 22
number has not significantly changed. Similar to maize, the productivity and productionof rice are volatile according to the climate, particularly rainfall.
Cultivating cassava is a strategy developed by upland farmers to minimize risk anduncertainty in upland farming. Cassava is an important crop for marginal semi-aridenvironments as a substitute for grain crops and as a source of cash income. Traditionalcassava farming is cultivated with no external input used. Small farmers grow cassava asan integral part of the conventional farming system [8,9]. In terms of various root and tubercrops spread in different agroecological zones (AEZs), only cassava and sweet potatoesare planted in large areas and recorded officially [10] as well as having been studied morecomprehensively [11–13].
This paper reviews cassava crops, which smallholder farmers widely cultivate inthe dominant semi-arid environment of ENT—Indonesia. This paper aims to understandthe roles of cassava for smallholder semi-arid farmers and how they manage to improvecassava farming, productivity, and income generation. It highlights that in the low anderratic rainfall of the dominant semi-arid region, the development of cassava is pivotalto secure the harvesting of food crops or food availability and income generation formarginal farmers.
2. Land and Soil Suitability for Cassava in ENT Province
In Indonesia, cassava plants are found in vast growing environments, in drylandagroecosystems with dry climates and drylands with wet climates, especially on Inceptisol,Ultisol, and Alfisol soils, as well as in areas with varied agroecological conditions, such asareas with dry climates, marginal lands, and optimal lands [14].
Based on the land suitability direction for this commodity, the S1 (very suitable) landsuitability class requires rainfall between 1000 and 2000 mm·year−1; temperature 22–28 ◦C;soil texture, slightly fine and medium; and rocks on the surface and rock outcrops, <5% andnot threatened by flood hazard. In the conditions of land slope between 8 and 15%, thisplant still grows with limited conditions, and at a sulfidic depth of 40 to 75 cm this plantis also still growing, although the level of productivity is not optimal. Cassava can growunder moderate soil moisture conditions and avoid extremes of inundation or dryness [15].
Furthermore, from the perspective of nutrient availability, cassava plants will still growoptimally if the availability of nitrogen, P2O5, and K2O is in the medium category, namelyfor total nitrogen, >2%, P2O5, >21 mg·100 g−1 soil, and K2O, 21 mg·100 g−1 soil [15].Furthermore, this plant grows well on Rendzina soil (black soil) with a pH of six andKambisol soil (red soil) with a pH of five in Southeast Maluku [16]. Although cassava canbe grown in a wide range of soil textures and fertility, cassava grows well and produces ahigh yield of tubers in light sandy loam, fertile, and deep soils [17,18]. Depending on thevariety and crop management, in a favorable soil environment cassava crops can producefresh tubers around 31–45 tons·ha−1 in Indonesia [19] and up to 67 tons·ha−1 in Thailandby applying an additional 100 kg N fertilizer [20]. A summary of land suitability criteriafor cassava is presented in Table 1.
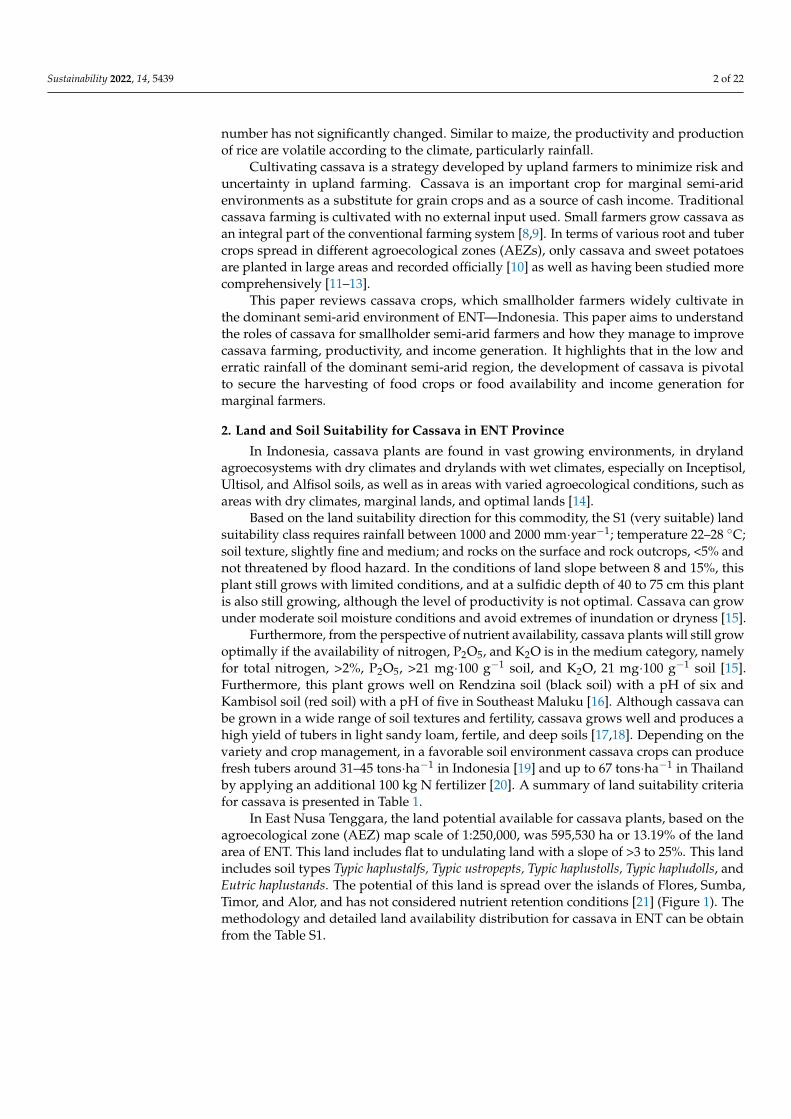
In East Nusa Tenggara, the land potential available for cassava plants, based on theagroecological zone (AEZ) map scale of 1:250,000, was 595,530 ha or 13.19% of the landarea of ENT. This land includes flat to undulating land with a slope of >3 to 25%. This landincludes soil types Typic haplustalfs, Typic ustropepts, Typic haplustolls, Typic hapludolls, andEutric haplustands. The potential of this land is spread over the islands of Flores, Sumba,Timor, and Alor, and has not considered nutrient retention conditions [21] (Figure 1). Themethodology and detailed land availability distribution for cassava in ENT can be obtainfrom the Table S1.
Sustainability 2022, 14, 5439 3 of 22
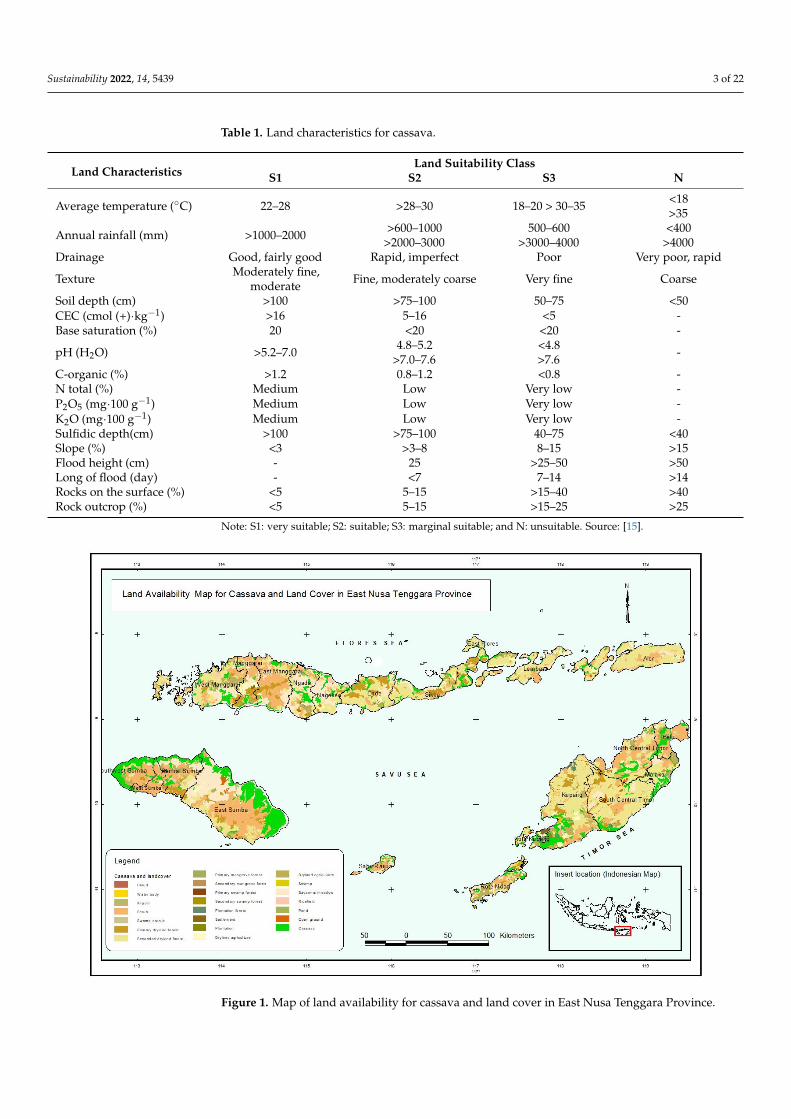
Table 1. Land characteristics for cassava.
Land CharacteristicsLand Suitability Class
S1 S2 S3 N
Average temperature (◦C) 22–28 >28–30 18–20 > 30–35 <18>35
Annual rainfall (mm) >1000–2000 >600–1000>2000–3000
500–600>3000–4000
<400>4000
Drainage Good, fairly good Rapid, imperfect Poor Very poor, rapid
Texture Moderately fine,moderate Fine, moderately coarse Very fine Coarse
Soil depth (cm) >100 >75–100 50–75 <50CEC (cmol (+)·kg−1) >16 5–16 <5 -Base saturation (%) 20 <20 <20 -
pH (H2O) >5.2–7.0 4.8–5.2>7.0–7.6
<4.8>7.6 -
C-organic (%) >1.2 0.8–1.2 <0.8 -N total (%) Medium Low Very low -P2O5 (mg·100 g−1) Medium Low Very low -K2O (mg·100 g−1) Medium Low Very low -Sulfidic depth(cm) >100 >75–100 40–75 <40Slope (%) <3 >3–8 8–15 >15Flood height (cm) - 25 >25–50 >50Long of flood (day) - <7 7–14 >14Rocks on the surface (%) <5 5–15 >15–40 >40Rock outcrop (%) <5 5–15 >15–25 >25
Note: S1: very suitable; S2: suitable; S3: marginal suitable; and N: unsuitable. Source: [15].
Sustainability 2022, 14, x FOR PEER REVIEW 4 of 23
Figure 1. Map of land availability for cassava and land cover in East Nusa Tenggara Province.
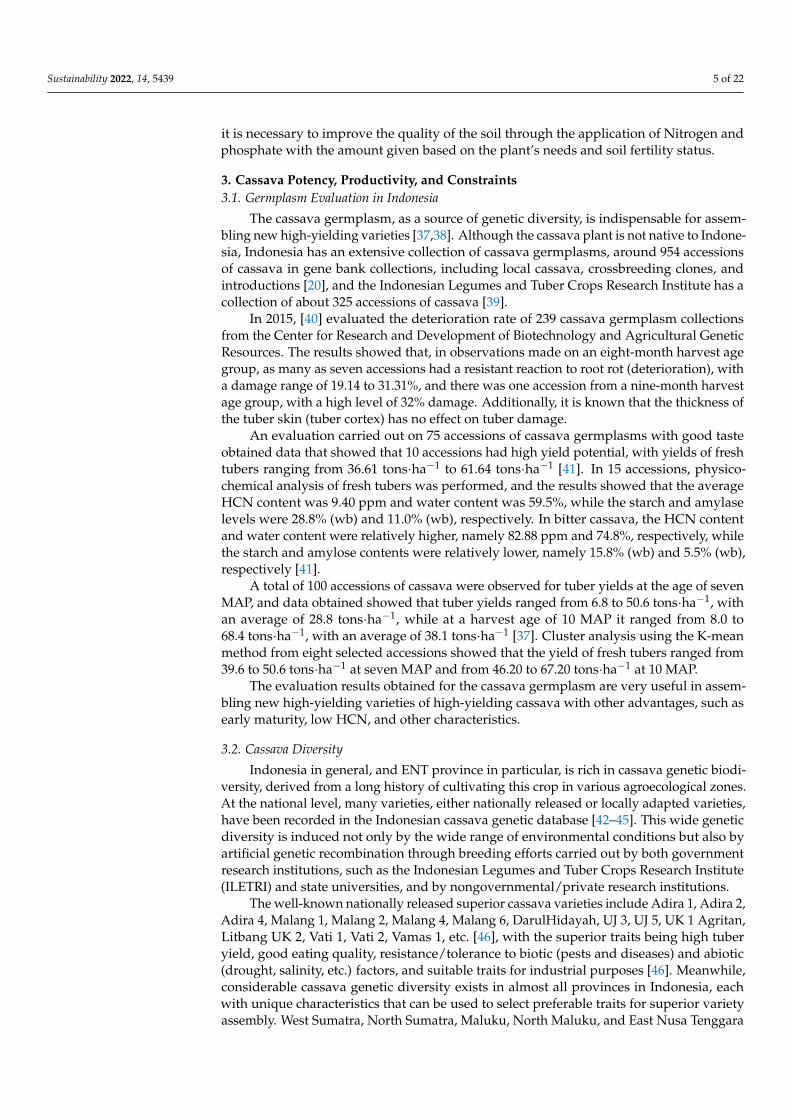
Climatologically, the East Nusa Tenggara region is included in the semi-arid area [22,23], with altitudes ranging from lowlands less than 700 m asl covering 74% to high-lands above 700 m asl [1]. In terms of soil development, it is dominated by underdevel-oped soils, such as Entisol and Inceptisols, and more developed soils, such as Vertisols, Mollisols, Alfisols, and Andosols. These soils develop from basic materials, such as lime-stone, calcareous sediments, and volcanic materials [21]. Regarding nutrient retention and soil nutrient availability, the value of soil chemical parameters varies, but is generally in the low to high categories.
In West Timor, part of East Nusa Tenggara, the degree of acidity (pH H2O) generally varies in the neutral to slightly alkaline categories, with values ranging from 7.3 to 8.2, for all the districts in the island [24–29]. C-organic in West Timor varies between locations [30]. Research by [28] showed that the soils overgrown with Sandalwood (Satalum album) contained 1.18% (low) organic C-organic located in North Central Timor district and 4.39% (high). Meanwhile, as reported by [31], from each type of Vertisol and Alfisol soil in Kupang, the C-organic values were 1.26 and 1.05% (low), respectively, including for rice fields in Malaka [27]. Similar soil conditions occurred in other locations in Kupang[25] and the medium category, 2.85% [32].
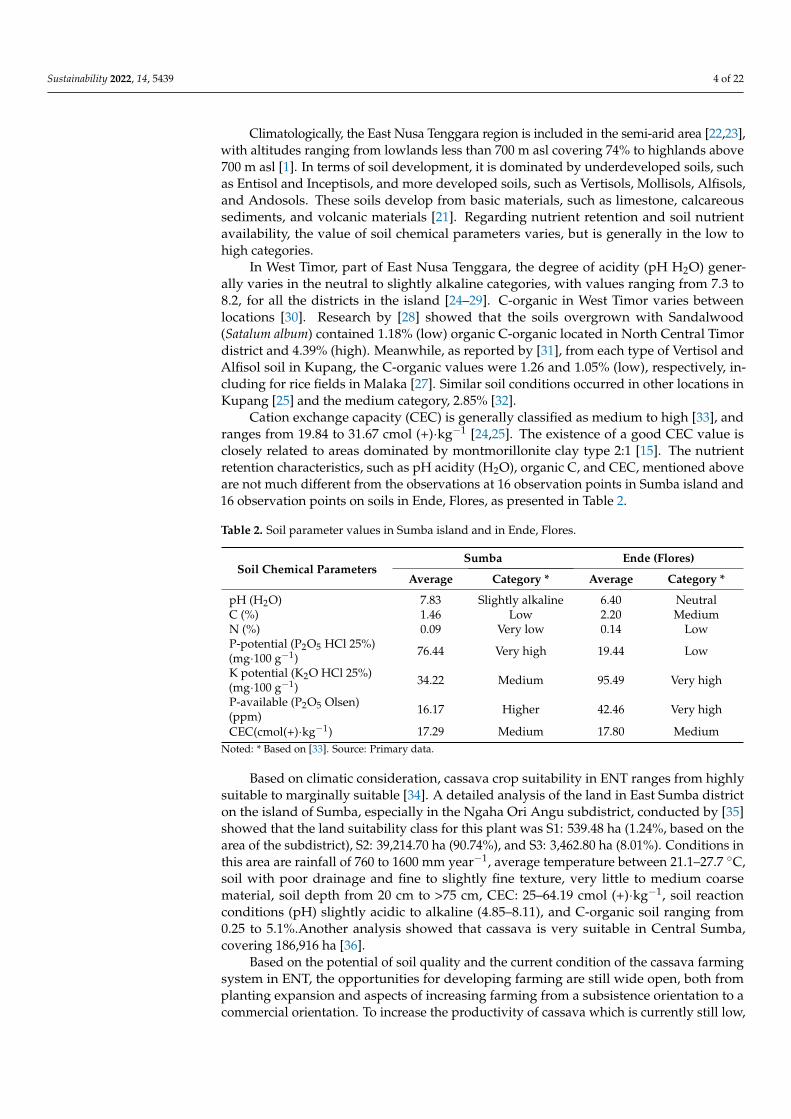
Cation exchange capacity (CEC) is generally classified as medium to high [33], and ranges from 19.84 to 31.67 cmol (+)·kg−1 [24,25]. The existence of a good CEC value is closely related to areas dominated by montmorillonite clay type 2:1 [15]. The nutrient re-tention characteristics, such as pH acidity (H2O), organic C, and CEC, mentioned above are not much different from the observations at 16 observation points in Sumba island and 16 observation points on soils in Ende, Flores, as presented in Table 2.
Figure 1. Map of land availability for cassava and land cover in East Nusa Tenggara Province.
Sustainability 2022, 14, 5439 4 of 22
Climatologically, the East Nusa Tenggara region is included in the semi-arid area [22,23],with altitudes ranging from lowlands less than 700 m asl covering 74% to highlands above700 m asl [1]. In terms of soil development, it is dominated by underdeveloped soils, suchas Entisol and Inceptisols, and more developed soils, such as Vertisols, Mollisols, Alfisols,and Andosols. These soils develop from basic materials, such as limestone, calcareoussediments, and volcanic materials [21]. Regarding nutrient retention and soil nutrientavailability, the value of soil chemical parameters varies, but is generally in the low tohigh categories.
In West Timor, part of East Nusa Tenggara, the degree of acidity (pH H2O) gener-ally varies in the neutral to slightly alkaline categories, with values ranging from 7.3 to8.2, for all the districts in the island [24–29]. C-organic in West Timor varies betweenlocations [30]. Research by [28] showed that the soils overgrown with Sandalwood(Satalum album) contained 1.18% (low) organic C-organic located in North Central Timordistrict and 4.39% (high). Meanwhile, as reported by [31], from each type of Vertisol andAlfisol soil in Kupang, the C-organic values were 1.26 and 1.05% (low), respectively, in-cluding for rice fields in Malaka [27]. Similar soil conditions occurred in other locations inKupang [25] and the medium category, 2.85% [32].
Cation exchange capacity (CEC) is generally classified as medium to high [33], andranges from 19.84 to 31.67 cmol (+)·kg−1 [24,25]. The existence of a good CEC value isclosely related to areas dominated by montmorillonite clay type 2:1 [15]. The nutrientretention characteristics, such as pH acidity (H2O), organic C, and CEC, mentioned aboveare not much different from the observations at 16 observation points in Sumba island and16 observation points on soils in Ende, Flores, as presented in Table 2.
Table 2. Soil parameter values in Sumba island and in Ende, Flores.
Soil Chemical ParametersSumba Ende (Flores)
Average Category * Average Category *
pH (H2O) 7.83 Slightly alkaline 6.40 NeutralC (%) 1.46 Low 2.20 MediumN (%) 0.09 Very low 0.14 LowP-potential (P2O5 HCl 25%)(mg·100 g−1) 76.44 Very high 19.44 Low
K potential (K2O HCl 25%)(mg·100 g−1) 34.22 Medium 95.49 Very high
P-available (P2O5 Olsen)(ppm) 16.17 Higher 42.46 Very high
CEC(cmol(+)·kg−1) 17.29 Medium 17.80 MediumNoted: * Based on [33]. Source: Primary data.
Based on climatic consideration, cassava crop suitability in ENT ranges from highlysuitable to marginally suitable [34]. A detailed analysis of the land in East Sumba districton the island of Sumba, especially in the Ngaha Ori Angu subdistrict, conducted by [35]showed that the land suitability class for this plant was S1: 539.48 ha (1.24%, based on thearea of the subdistrict), S2: 39,214.70 ha (90.74%), and S3: 3,462.80 ha (8.01%). Conditions inthis area are rainfall of 760 to 1600 mm year−1, average temperature between 21.1–27.7 ◦C,soil with poor drainage and fine to slightly fine texture, very little to medium coarsematerial, soil depth from 20 cm to >75 cm, CEC: 25–64.19 cmol (+)·kg−1, soil reactionconditions (pH) slightly acidic to alkaline (4.85–8.11), and C-organic soil ranging from0.25 to 5.1%.Another analysis showed that cassava is very suitable in Central Sumba,covering 186,916 ha [36].
Based on the potential of soil quality and the current condition of the cassava farmingsystem in ENT, the opportunities for developing farming are still wide open, both fromplanting expansion and aspects of increasing farming from a subsistence orientation to acommercial orientation. To increase the productivity of cassava which is currently still low,
Sustainability 2022, 14, 5439 5 of 22
it is necessary to improve the quality of the soil through the application of Nitrogen andphosphate with the amount given based on the plant’s needs and soil fertility status.
3. Cassava Potency, Productivity, and Constraints3.1. Germplasm Evaluation in Indonesia
The cassava germplasm, as a source of genetic diversity, is indispensable for assem-bling new high-yielding varieties [37,38]. Although the cassava plant is not native to Indone-sia, Indonesia has an extensive collection of cassava germplasms, around 954 accessionsof cassava in gene bank collections, including local cassava, crossbreeding clones, andintroductions [20], and the Indonesian Legumes and Tuber Crops Research Institute has acollection of about 325 accessions of cassava [39].
In 2015, [40] evaluated the deterioration rate of 239 cassava germplasm collectionsfrom the Center for Research and Development of Biotechnology and Agricultural GeneticResources. The results showed that, in observations made on an eight-month harvest agegroup, as many as seven accessions had a resistant reaction to root rot (deterioration), witha damage range of 19.14 to 31.31%, and there was one accession from a nine-month harvestage group, with a high level of 32% damage. Additionally, it is known that the thickness ofthe tuber skin (tuber cortex) has no effect on tuber damage.
An evaluation carried out on 75 accessions of cassava germplasms with good tasteobtained data that showed that 10 accessions had high yield potential, with yields of freshtubers ranging from 36.61 tons·ha−1 to 61.64 tons·ha−1 [41]. In 15 accessions, physico-chemical analysis of fresh tubers was performed, and the results showed that the averageHCN content was 9.40 ppm and water content was 59.5%, while the starch and amylaselevels were 28.8% (wb) and 11.0% (wb), respectively. In bitter cassava, the HCN contentand water content were relatively higher, namely 82.88 ppm and 74.8%, respectively, whilethe starch and amylose contents were relatively lower, namely 15.8% (wb) and 5.5% (wb),respectively [41].
A total of 100 accessions of cassava were observed for tuber yields at the age of sevenMAP, and data obtained showed that tuber yields ranged from 6.8 to 50.6 tons·ha−1, withan average of 28.8 tons·ha−1, while at a harvest age of 10 MAP it ranged from 8.0 to68.4 tons·ha−1, with an average of 38.1 tons·ha−1 [37]. Cluster analysis using the K-meanmethod from eight selected accessions showed that the yield of fresh tubers ranged from39.6 to 50.6 tons·ha−1 at seven MAP and from 46.20 to 67.20 tons·ha−1 at 10 MAP.
The evaluation results obtained for the cassava germplasm are very useful in assem-bling new high-yielding varieties of high-yielding cassava with other advantages, such asearly maturity, low HCN, and other characteristics.
3.2. Cassava Diversity
Indonesia in general, and ENT province in particular, is rich in cassava genetic biodi-versity, derived from a long history of cultivating this crop in various agroecological zones.At the national level, many varieties, either nationally released or locally adapted varieties,have been recorded in the Indonesian cassava genetic database [42–45]. This wide geneticdiversity is induced not only by the wide range of environmental conditions but also byartificial genetic recombination through breeding efforts carried out by both governmentresearch institutions, such as the Indonesian Legumes and Tuber Crops Research Institute(ILETRI) and state universities, and by nongovernmental/private research institutions.
The well-known nationally released superior cassava varieties include Adira 1, Adira 2,Adira 4, Malang 1, Malang 2, Malang 4, Malang 6, DarulHidayah, UJ 3, UJ 5, UK 1 Agritan,Litbang UK 2, Vati 1, Vati 2, Vamas 1, etc. [46], with the superior traits being high tuberyield, good eating quality, resistance/tolerance to biotic (pests and diseases) and abiotic(drought, salinity, etc.) factors, and suitable traits for industrial purposes [46]. Meanwhile,considerable cassava genetic diversity exists in almost all provinces in Indonesia, eachwith unique characteristics that can be used to select preferable traits for superior varietyassembly. West Sumatra, North Sumatra, Maluku, North Maluku, and East Nusa Tenggara
Sustainability 2022, 14, 5439 6 of 22
provinces are the provinces in Indonesia that have recorded their local cassava geneticdiversity in the Indonesian cassava database.
Local cassava genotypes from West Sumatra province were recorded with narrow towide variability based on leaf, stem, and tuber characteristics [47]. A study on another col-lection of the cassava germplasm from West Sumatra province revealed that the germplasmwas highly diverse and distinguishable based on leaf morphological characteristics, tubermorphology (tuber color and shape), and tuber chemical composition (carbohydrate con-tent and protein content) [48]. More recently, a high-yielding local cassava cultivar fromWest Sumatra has also been identified [49] with a potential tuber yield of up to 80 tons·ha−1,much higher than the average of nationally released varieties (22–42 tons·ha−1) [46].
In North Sumatra province, various local cassava germplasms from different districtshave been identified and found to be highly diverse. These cassava germplasms play avital role in supporting food security in the region [50]. High local cassava biodiversity alsooccurs in Maluku province [51] and in North Maluku [52], where the cassava genotypeswere highly diverse based on morphological and agronomical characteristics. In ENTprovince, there was high cassava genetic diversity distributed in the districts within theisland of West Timor, each with unique characteristics and local adaptability [53]. Amongthe local cassava germplasms in ENT province is the Ubi Nuabosi from Ende District,registered as a superior local variety for its taste and preferred eating quality. This localvariety is well-known by consumers in ENT province, and hence has the potential to bedeveloped and more widely distributed in terms of planting location.
All of the aforementioned cassava varieties are precious genetic assets that can beused to develop cassava in East Nusa Tenggara province, either as genetic resources forsuperior variety assembly or directly employed by farmers as both food and income sources.Furthermore, the nationally released cassava varieties and local cassava varieties from otherprovinces can also be incorporated into the farming system in ENT province based on theirsuitability and superiority. The superior high-yielding variety from West Sumatra [49] andnationally released varieties [46], for instance, can be evaluated for their adaptability to theagroecological zone of ENT or may be directly adopted into the cassava farming system inENT. The same is true for other superior varieties with high tolerance/resistance to abioticand abiotic stresses, which can also be adopted for cassava cultivation in ENT province.Combining all the likely strategies of utilizing cassava biodiversity from Indonesia wouldbe of great assistance for the development of cassava in the marginal and drought-proneagricultural land of ENT province.
3.3. National and ENT Provincial Cassava Production
Based on the Agricultural Ministry of Indonesia, in 2018 cassava productivity in ENTwas 12.2 tons·ha−1, but still below national productivity (23.12 tons·ha−1) [54]. Basedon trade map data in 2020, Indonesia exported 16.529 tons of frozen cassava (HS 71410)with a total value of USD 9.7 million, an increase from 4.829 tons in 2019 with a value ofUSD 4.1 million.
Dominant cultivated land with dry climatic conditions in East Nusa Tenggara (ENT)does not support rice growth. However, cassava is one of the plants that can survive indry conditions and develop in ENT [18,55]. Therefore, cassava is used as a primary foodsource [56–58]. Because of the tolerance of cassava to the dry climate, cultivating cassava inENT is very promising. Currently, the agricultural land used for cassava cultivation in ENTis about 60,557 ha of the total dry land available (527,397.2 ha). Therefore, the opportunityfor cassava development is still widely open [59].
The total cassava production in ENT in 2015 was 637,315 tons and the average pro-ductivity was 10.52 tons·ha−1 [60], while the average yield of superior varieties can reach40 tons·ha−1.The productivity of national cassava varieties ranges from 20 tons·ha−1 to102 tons·ha−1 [61]. One of the causes of low productivity in ENT is using local varietiesthat have low productivity. In line with [62,63], who stated that local varieties are one of thecauses of low root yields, there should be efforts to increase production by introducing new
Sustainability 2022, 14, 5439 7 of 22
varieties that have a high yield potential. It is expected that farmers can choose one varietyto be developed in East Nusa Tenggara. According to [64–66], one of the efforts neededto increase agricultural productivity is to adopt new technologies, such as high-yieldingcassava varieties.
In ENT, cassava is mainly used as a staple food (in the dry season), substituting a smallamount of cassava chips for snacks [67]. Some constraints for developing cassava in ENTwere low yield (5–10 tons·ha−1), dominant local varieties (sweet cassava for consumption,low yield and low starch), and it being cultivated as an intercropping plant with maize. As aresult, farmers grew the ‘Yellow-flesh’ variety as the most common variety, followed by the‘White-flesh’ variety, with only a handful of farmers still planting the local variety [19,68].
In ENT province, cassava is widely cultivated in mixed farming, especially in moun-tainous areas with a minimum altitude of ~300 m above sea level. Most cassava pro-duction is utilized by villagers in hilly areas (60%), and the remaining amount (40%) isconsumed by urban residents in coastal areas, which are urban areas, such as the city ofMaumere [19,69,70].
Farmers do not use fertilizer or manure, and they are worried about increasing theyield because there is no market; however, they are keen to apply fertilizer and increaseproduction when there is a market for cassava. The application of fertilizer is still relativelylow and based on reports from farmers who have used fertilizer on cassava, on averagearound 21% stated that they used organic fertilizers, while the use of inorganic fertilizerswas higher, at 50%. In cultivating their cassava fields, most farmers use two- or four-wheeltractors, especially for farmers in the lowlands. Farmers in NTT tend to use more manualtools for land cultivation, especially in upland areas, and not many farmers make moundsto plant cassava [19].
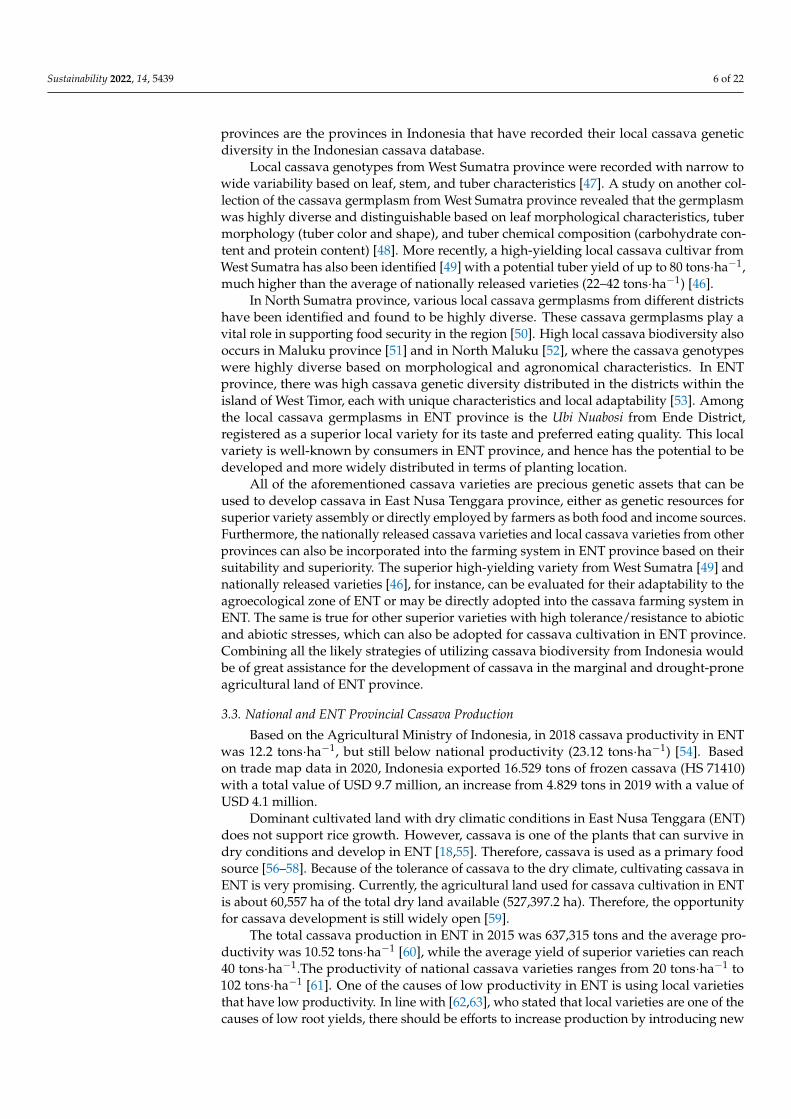
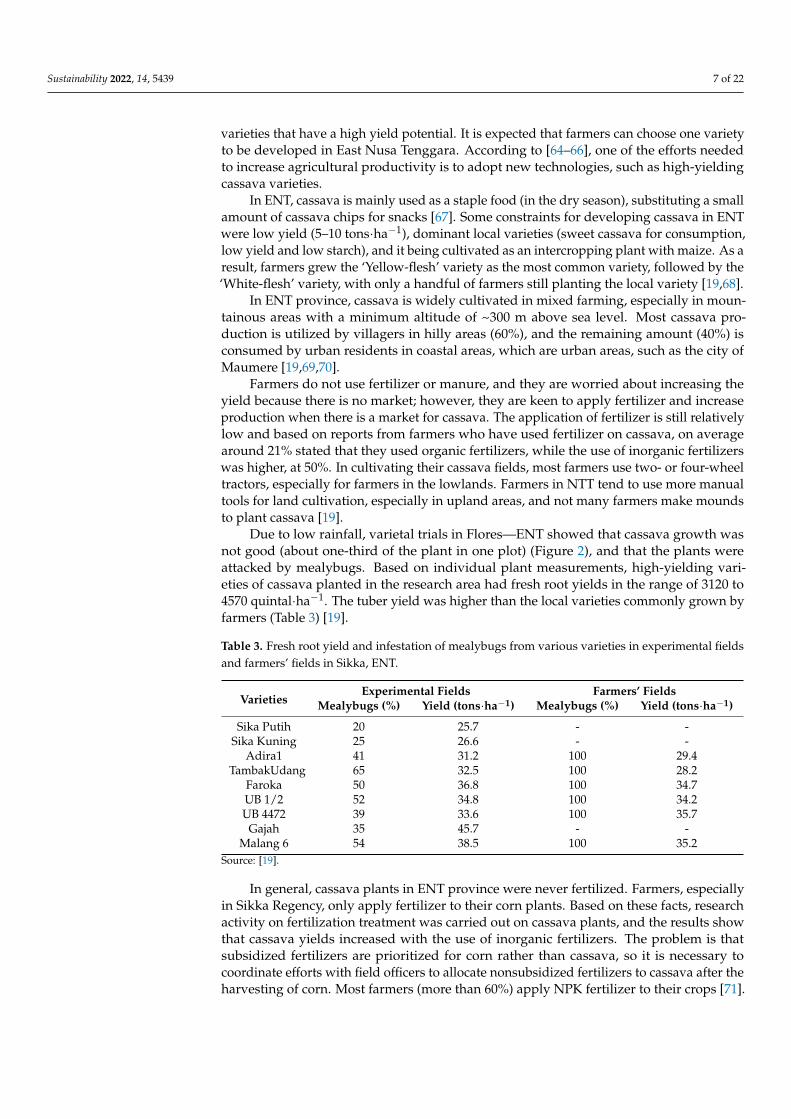
Due to low rainfall, varietal trials in Flores—ENT showed that cassava growth wasnot good (about one-third of the plant in one plot) (Figure 2), and that the plants wereattacked by mealybugs. Based on individual plant measurements, high-yielding vari-eties of cassava planted in the research area had fresh root yields in the range of 3120 to4570 quintal·ha−1. The tuber yield was higher than the local varieties commonly grown byfarmers (Table 3) [19].
Table 3. Fresh root yield and infestation of mealybugs from various varieties in experimental fieldsand farmers’ fields in Sikka, ENT.
VarietiesExperimental Fields Farmers’ Fields
Mealybugs (%) Yield (tons·ha−1) Mealybugs (%) Yield (tons·ha−1)
Sika Putih 20 25.7 - -Sika Kuning 25 26.6 - -
Adira1 41 31.2 100 29.4TambakUdang 65 32.5 100 28.2
Faroka 50 36.8 100 34.7UB 1/2 52 34.8 100 34.2UB 4472 39 33.6 100 35.7
Gajah 35 45.7 - -Malang 6 54 38.5 100 35.2
Source: [19].
In general, cassava plants in ENT province were never fertilized. Farmers, especiallyin Sikka Regency, only apply fertilizer to their corn plants. Based on these facts, researchactivity on fertilization treatment was carried out on cassava plants, and the results showthat cassava yields increased with the use of inorganic fertilizers. The problem is thatsubsidized fertilizers are prioritized for corn rather than cassava, so it is necessary tocoordinate efforts with field officers to allocate nonsubsidized fertilizers to cassava after theharvesting of corn. Most farmers (more than 60%) apply NPK fertilizer to their crops [71].
Sustainability 2022, 14, 5439 8 of 22
Sustainability 2022, 14, x FOR PEER REVIEW 8 of 23
more manual tools for land cultivation, especially in upland areas, and not many farmers make mounds to plant cassava [19].
Due to low rainfall, varietal trials in Flores—ENT showed that cassava growth was not good (about one-third of the plant in one plot) (Figure 2), and that the plants were attacked by mealybugs. Based on individual plant measurements, high-yielding varieties of cassava planted in the research area had fresh root yields in the range of 3120 to 4570 quintal·ha−1. The tuber yield was higher than the local varieties commonly grown by farm-ers (Table 3) [19].
Table 3. Fresh root yield and infestation of mealybugs from various varieties in experimental fields and farmers’ fields in Sikka, ENT.
Varieties Experimental Fields Farmers’ Fields
Mealybugs (%) Yield
(tons·ha−1) Mealybugs
(%) Yield
(tons·ha−1) Sika Putih 20 25.7 - -
Sika Kuning 25 26.6 - - Adira1 41 31.2 100 29.4
TambakUdang 65 32.5 100 28.2 Faroka 50 36.8 100 34.7 UB ½ 52 34.8 100 34.2
UB 4472 39 33.6 100 35.7 Gajah 35 45.7 - -
Malang 6 54 38.5 100 35.2 Source: [19].
In general, cassava plants in ENT province were never fertilized. Farmers, especially in Sikka Regency, only apply fertilizer to their corn plants. Based on these facts, research activity on fertilization treatment was carried out on cassava plants, and the results show that cassava yields increased with the use of inorganic fertilizers. The problem is that sub-sidized fertilizers are prioritized for corn rather than cassava, so it is necessary to coordi-nate efforts with field officers to allocate nonsubsidized fertilizers to cassava after the har-vesting of corn. Most farmers (more than 60%) apply NPK fertilizer to their crops [71].
(A) (B)
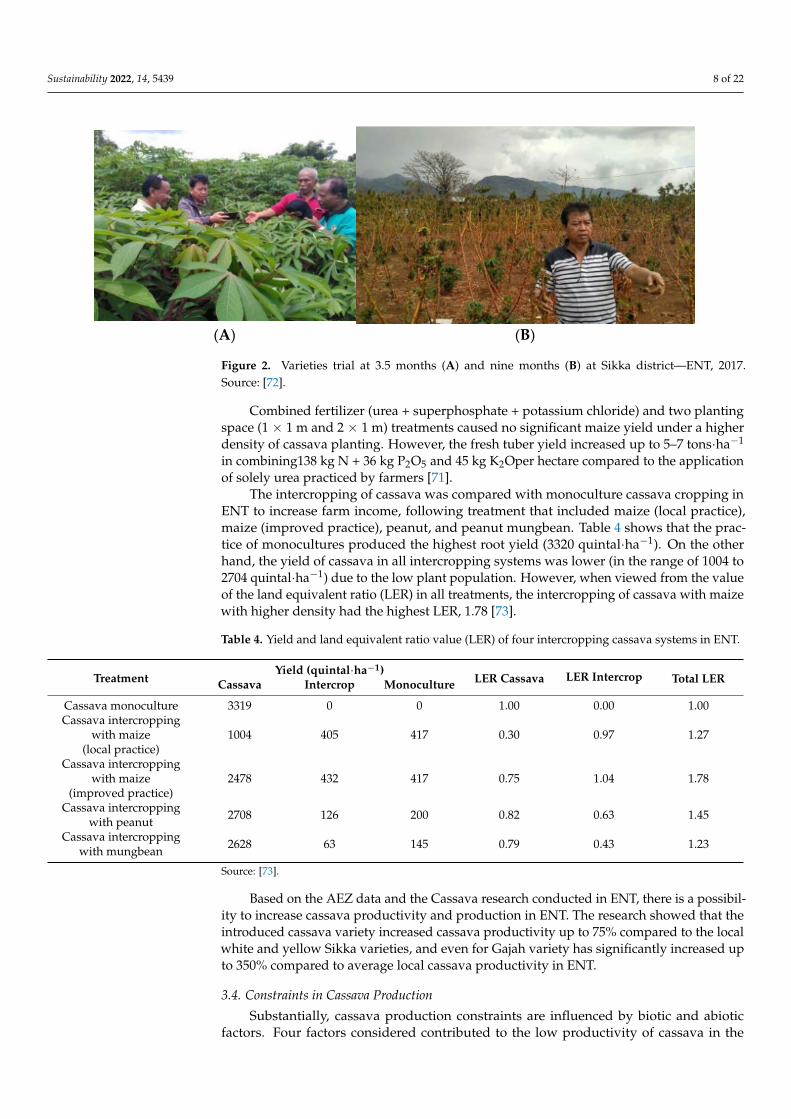
Figure 2. Varieties trial at 3.5 months (A) and nine months (B) at Sikka district—ENT, 2017. Source: [72].
Combined fertilizer (urea + superphosphate + potassium chloride) and two planting space (1 × 1 m and 2 × 1 m) treatments caused no significant maize yield under a higher density of cassava planting. However, the fresh tuber yield increased up to 5–7 tons·ha−1 in combining138 kg N + 36 kg P2O5 and 45 kg K2Oper hectare compared to the application of solely urea practiced by farmers [71].
The intercropping of cassava was compared with monoculture cassava cropping in ENT to increase farm income, following treatment that included maize (local practice),
Figure 2. Varieties trial at 3.5 months (A) and nine months (B) at Sikka district—ENT, 2017.Source: [72].
Combined fertilizer (urea + superphosphate + potassium chloride) and two plantingspace (1 × 1 m and 2 × 1 m) treatments caused no significant maize yield under a higherdensity of cassava planting. However, the fresh tuber yield increased up to 5–7 tons·ha−1
in combining138 kg N + 36 kg P2O5 and 45 kg K2Oper hectare compared to the applicationof solely urea practiced by farmers [71].
The intercropping of cassava was compared with monoculture cassava cropping inENT to increase farm income, following treatment that included maize (local practice),maize (improved practice), peanut, and peanut mungbean. Table 4 shows that the prac-tice of monocultures produced the highest root yield (3320 quintal·ha−1). On the otherhand, the yield of cassava in all intercropping systems was lower (in the range of 1004 to2704 quintal·ha−1) due to the low plant population. However, when viewed from the valueof the land equivalent ratio (LER) in all treatments, the intercropping of cassava with maizewith higher density had the highest LER, 1.78 [73].
Table 4. Yield and land equivalent ratio value (LER) of four intercropping cassava systems in ENT.
TreatmentYield (quintal·ha−1)
LER Cassava LER Intercrop Total LERCassava Intercrop Monoculture
Cassava monoculture 3319 0 0 1.00 0.00 1.00Cassava intercropping
with maize(local practice)
1004 405 417 0.30 0.97 1.27
Cassava intercroppingwith maize
(improved practice)2478 432 417 0.75 1.04 1.78
Cassava intercroppingwith peanut 2708 126 200 0.82 0.63 1.45
Cassava intercroppingwith mungbean 2628 63 145 0.79 0.43 1.23
Source: [73].
Based on the AEZ data and the Cassava research conducted in ENT, there is a possibil-ity to increase cassava productivity and production in ENT. The research showed that theintroduced cassava variety increased cassava productivity up to 75% compared to the localwhite and yellow Sikka varieties, and even for Gajah variety has significantly increased upto 350% compared to average local cassava productivity in ENT.
3.4. Constraints in Cassava Production
Substantially, cassava production constraints are influenced by biotic and abioticfactors. Four factors considered contributed to the low productivity of cassava in the
Sustainability 2022, 14, 5439 9 of 22
dry climate of ENT, namely drought conditions, pests and diseases, local varieties, andresistant varieties. Several developing countries with dry climates have also reported thatlimited cassava production is affected by pest and disease problems which are influenced byfavorable climatic conditions [66,74–76]. Some pests can reproduce and migrate optimallyin dry conditions [74].
This section discussed the main pests of cassava in ENT which are affected by a dryclimate that causes low production. In ENT, endemic pests on cassava are mealybugs andred mites, which are elaborated on below. Data on the percentage of mealybugs infestationand cassava production were the results of the experimental research at Sikka Regency,while the influence of climate on pests and diseases is more of a literature study.
3.4.1. Mealybugs
Under controlled environmental conditions, cassava cultivated under water stressor water shortage intensifies Phenacoccus manihoti performance [77,78]. The long droughtthat limits crop production in the tropics is exacerbated by the existence of P. manihoti [79],which reduces yield significantly [80,81].
P. manihoti was first detected in Thailand [82,83] and then spread rapidly throughThailand and neighboring countries, including Indonesia [83–85], where it was first de-tected in Bogor in 2010 [85,86]. It is reported that there are 27 species of P.manihoti af-fecting Manihot spp. in general and 24 species affecting M. esculenta in particular [82].Mealybugs are commonly found on the underside of leaves, especially around the mainveins [77]. The first-instar nymph is quite mobile, while there is limited movement in theremaining instars. Mealybugs associated with cassava may reproduce by parthenogenesis(e.g., P. manihoti) or by sexual reproduction (e.g., P. herreni) [66].
The mealybug pest is a new pest on cassava plants in Indonesia that began to attackin 2009 [87]; the Indonesian environment is climatically suitable for the vast invasion ofP. Manihoti [88–91], which has led to this pest being discovered in all areas of cassavafarming (Table 3) [19].
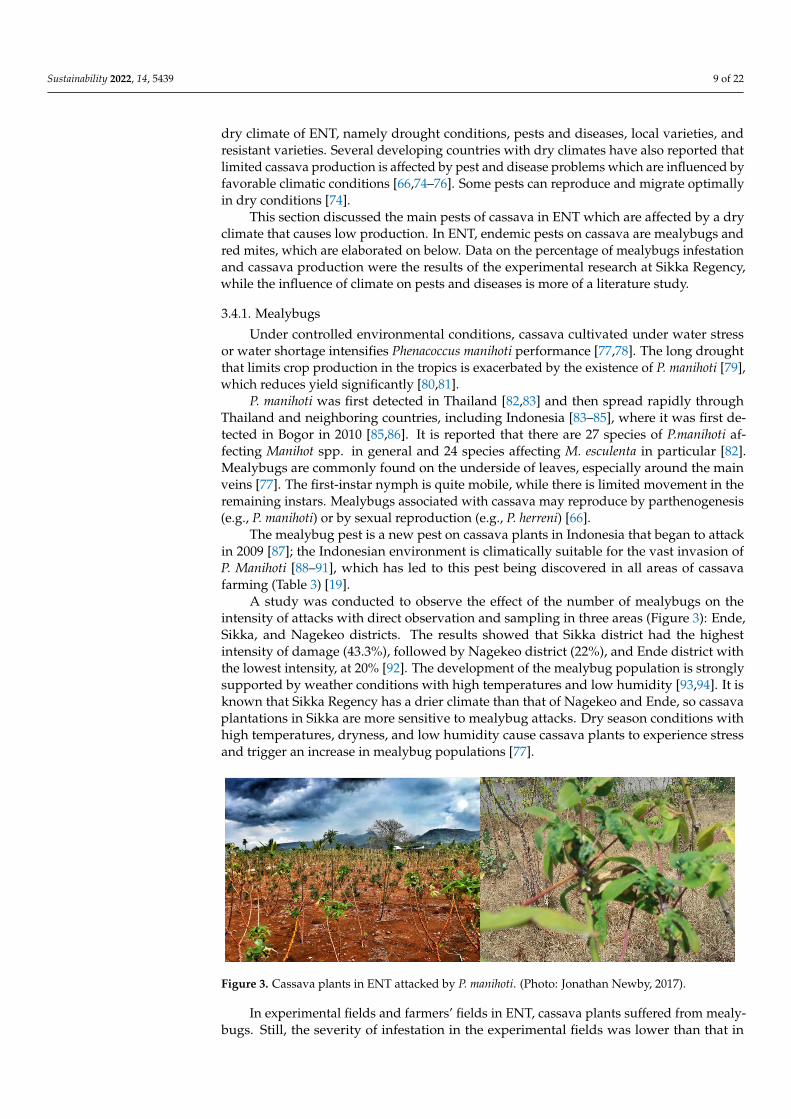
A study was conducted to observe the effect of the number of mealybugs on theintensity of attacks with direct observation and sampling in three areas (Figure 3): Ende,Sikka, and Nagekeo districts. The results showed that Sikka district had the highestintensity of damage (43.3%), followed by Nagekeo district (22%), and Ende district withthe lowest intensity, at 20% [92]. The development of the mealybug population is stronglysupported by weather conditions with high temperatures and low humidity [93,94]. It isknown that Sikka Regency has a drier climate than that of Nagekeo and Ende, so cassavaplantations in Sikka are more sensitive to mealybug attacks. Dry season conditions withhigh temperatures, dryness, and low humidity cause cassava plants to experience stressand trigger an increase in mealybug populations [77].
Sustainability 2022, 14, x FOR PEER REVIEW 10 of 23
instars. Mealybugs associated with cassava may reproduce by parthenogenesis (e.g., P. manihoti) or by sexual reproduction (e.g., P. herreni) [66].
The mealybug pest is a new pest on cassava plants in Indonesia that began to attack in 2009 [87]; the Indonesian environment is climatically suitable for the vast invasion of P. Manihoti [88–91], which has led to this pest being discovered in all areas of cassava farm-ing (Table 3) [19].
Figure 3. Cassava plants in ENT attacked by P. manihoti. (Photo: Jonathan Newby, 2017).
A study was conducted to observe the effect of the number of mealybugs on the in-tensity of attacks with direct observation and sampling in three areas (Figure 3): Ende, Sikka, and Nagekeo districts. The results showed that Sikka district had the highest inten-sity of damage (43.3%), followed by Nagekeo district (22%), and Ende district with the lowest intensity, at 20% [92]. The development of the mealybug population is strongly supported by weather conditions with high temperatures and low humidity [93,94]. It is known that Sikka Regency has a drier climate than that of Nagekeo and Ende, so cassava plantations in Sikka are more sensitive to mealybug attacks. Dry season conditions with high temperatures, dryness, and low humidity cause cassava plants to experience stress and trigger an increase in mealybug populations [77].
In experimental fields and farmers’ fields in ENT, cassava plants suffered from mealybugs. Still, the severity of infestation in the experimental fields was lower than that in farmers’ fields (Table 3) [19]. Furthermore, according to ACIAR, the mealybug infesta-tion percentage did not affect the root yield [95], presumably because the mealybug attack occurred in the final phase of cassava growth, when the cassava tuber had already devel-oped.
To prevent mealybug attacks, integrated treatment and a combination of various methods are needed [96]. Some recommended management methods include the conser-vation of natural enemies, continuous monitoring of cassava plants, destruction of in-fected plants, and preventing the spread of pests through exchanging planting materials to other areas [20].
Research aiming to determine the geographical distribution of mealybugs has been carried out in seven provinces, namely Lampung, Banten, West Java, Central Java, East Java (representing a relatively wet climate area), West Nusa Tenggara (WNT), and East Nusa Tenggara (representing a dry climate area) [97]. The results showed that the inci-dence of mealybugs ranged from 35.5% to 74.18%. The highest mealybugs incidence oc-curred in Lampung province, and the lowest was in Central Java province. The highest incidence of mealybugs occurred in Lampung, presumably because cassava cultivation in Lampung was the most extensive compared to other areas. Meanwhile, the abundance of mealybugs was lowest in Lampung. This is because Lampung is a wet area, so the devel-opment of mealybugs is lowest, as is the severity of attacks, as supported by [98,99]. Mean-while, in WNT and ENT, the level of crop damage (44.05% and 36.57%, respectively) and the abundance of the mealybug population (37.33 and 43.89 insect/tip, respectively) were
Figure 3. Cassava plants in ENT attacked by P. manihoti. (Photo: Jonathan Newby, 2017).
In experimental fields and farmers’ fields in ENT, cassava plants suffered from mealy-bugs. Still, the severity of infestation in the experimental fields was lower than that in
Sustainability 2022, 14, 5439 10 of 22
farmers’ fields (Table 3) [19]. Furthermore, according to ACIAR, the mealybug infestationpercentage did not affect the root yield [95], presumably because the mealybug attack oc-curred in the final phase of cassava growth, when the cassava tuber had already developed.
To prevent mealybug attacks, integrated treatment and a combination of variousmethods are needed [96]. Some recommended management methods include the conserva-tion of natural enemies, continuous monitoring of cassava plants, destruction of infectedplants, and preventing the spread of pests through exchanging planting materials to otherareas [20].
Research aiming to determine the geographical distribution of mealybugs has beencarried out in seven provinces, namely Lampung, Banten, West Java, Central Java, EastJava (representing a relatively wet climate area), West Nusa Tenggara (WNT), and EastNusa Tenggara (representing a dry climate area) [97]. The results showed that the incidenceof mealybugs ranged from 35.5% to 74.18%. The highest mealybugs incidence occurred inLampung province, and the lowest was in Central Java province. The highest incidence ofmealybugs occurred in Lampung, presumably because cassava cultivation in Lampungwas the most extensive compared to other areas. Meanwhile, the abundance of mealybugswas lowest in Lampung. This is because Lampung is a wet area, so the development ofmealybugs is lowest, as is the severity of attacks, as supported by [98,99]. Meanwhile,in WNT and ENT, the level of crop damage (44.05% and 36.57%, respectively) and theabundance of the mealybug population (37.33 and 43.89 insect/tip, respectively) were high.This is because both areas have a dry climate that is very suitable for the development ofmealybugs [89,90,97,99–101].
In the semi-arid climatic conditions in ENT province, mealybug attacks often occur inthe dry season of August–November [102,103]. Farmers reportedly understand the effectof mealybugs on lowering their cassava yields. The main recommendation for dealingwith mealybug attacks in ENT is to set the planting time. The recommended growingseason for cassava in Sikka is early December or early January. This will help cassava growthroughout the wet season (December–March), and during the dry season the cassava willbe 7–8 months old. Therefore, mealybug infestation is expected to have less impact onyields. The following recommendation is to increase the capacity of farmers to carry outintegrated pest management, including the release of natural predators for mealybugs [71].
3.4.2. Red Mites
Red mites (Tetranychusurticae) are the main pests in the world that attack many plants.A severe attack during the early growth phase of a plant can lead to yield loss and significanteconomic decline [104–106]. The red mite has a stylet it uses to attack plants by damagingthe leaves, thereby forming green and yellow spots [107,108]. A severe infestation of redmites can cause plant growth to stop and yield losses of around 50–70% [109].
There are about 50 species of pest mites associated with cassava plants; among themare spider mites (T. urticae, T. cinnabarinus, Mononychellus caribbeanae, M. tanajoa, andM. progressives). These mite species can cause a high intensity of damage, yield reductionsof up to 87%, and stem cuttings losses for planting materials of up to 82% [110]. In Asia,mites cause significant yield reductions of 2–10% for minor damage and up to 60% forsevere damage [111,112].
The population of red mites declines at the beginning of the rainy season and remainsat a very low level in winter. The temperatures, mainly maximum and minimum temper-atures, have a significant positive correlation with mite attacks [113]. Low humidity andhigh temperature will cause an increase in mite populations and reduce the biodiversity ofpredatory mites [114]. Dry and hot weather supports the reproduction and survival of redmites, because in such conditions biological control by entomopathogenic fungi is almostnonexistent [115]. Moreover, the spider mite population (T. urticae) is more resistant toclimate change, including global warming, than its predatory mites [116].
So far, farmers have not carried out the optimal control of mite pests, which may berelated to the low price of cassava compared to the price of pesticides (Acarisida), which
Sustainability 2022, 14, 5439 11 of 22
are considered expensive for most farmers. Therefore, a control system consisting of acombination of two or more control methods in an integrated control system is needed sothat yields and farmers’ incomes can be increased in addition to environmental sustainabil-ity and health being maintained. The control of mites can be carried out through severalmethods, such as cultural practices, the use of resistant varieties, farm sanitation, propertime of planting, mechanical control methods, and biological control as well as chemicalcontrol using pesticides [117]. Biological control can employ potential predators, such asOligotaminuta and several predators from the family Coccinellidae, as well as pathogenicfungal pathogens from the genera Neozygites (Zygomycetes: Enthomophthora) and Hir-suta (Hyphomycetes: Monilia) [118]. Thus, the impact of red mites on cassava in ENT isevident, since drought-prone areas dominate the region.
4. Trends in Cassava Production and Consumption
In this section, we used data on food commodities (rice, cassava, and sweet potatoes)gathered from the food commodity balance data or data Neraca Bahan Pangan released by theFood Institute—Ministry of Agriculture [119]. We included rice and sweet potatoes here asa comparison in positioning cassava’s outlook. Twenty-five years of time series data, from1993 to 2017, were used. The trend analysis of rice, cassava, and sweet potato consumptionuses regression analysis through estimation curve analysis (R-square, ANOVA, and t-test).In addition, a t-test was employed to analyze the per capita consumption. The analysis wasperformed using IBM SPSS 26.
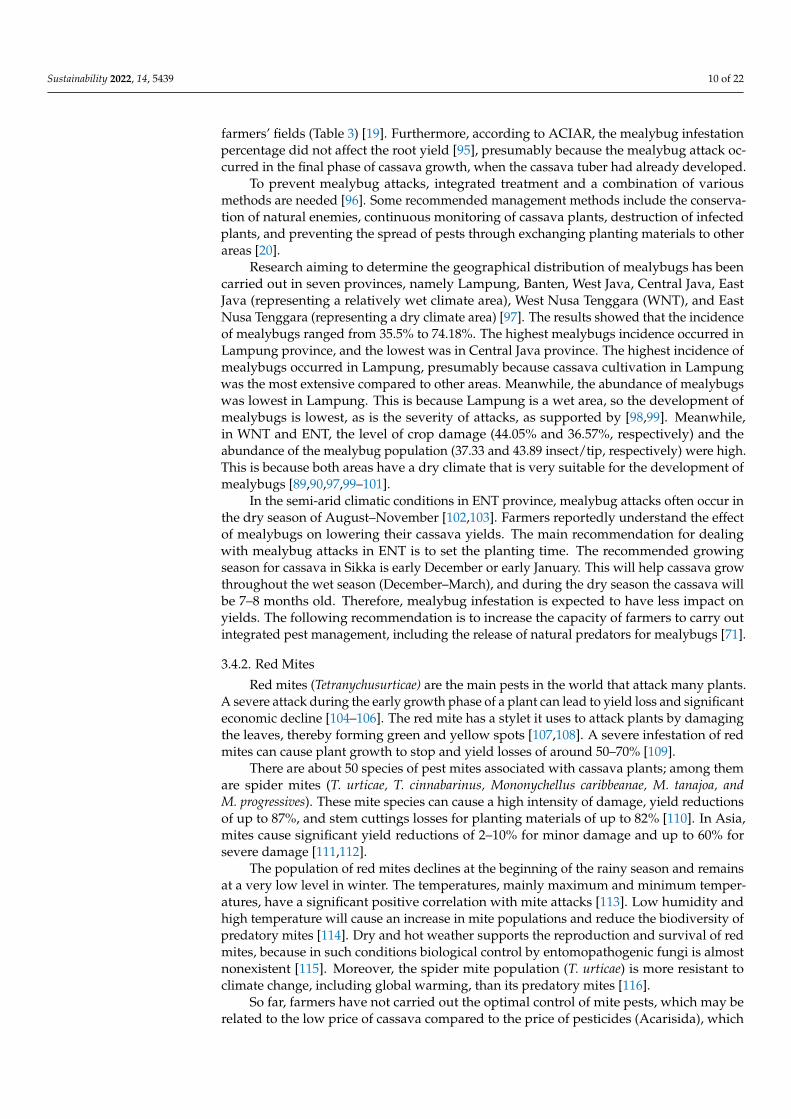
We grouped the use of the above commodities based on the food, nonfood, feed, andloss. Rice consumption in Indonesia tended to increase in the last 24 years (1993–2016).Fluctuation in the use of rice is parallel for consumption and other uses. However, theuse of commodities for feed and nonfood have different fluctuation patterns. For example,2002–2005 was when rice used for nonfood increased (Figure 4).
Sustainability 2022, 14, x FOR PEER REVIEW 12 of 23
consumption uses regression analysis through estimation curve analysis (R-square, ANOVA, and t-test). In addition, a t-test was employed to analyze the per capita con-sumption. The analysis was performed using IBM SPSS 26.
We grouped the use of the above commodities based on the food, nonfood, feed, and loss. Rice consumption in Indonesia tended to increase in the last 24 years (1993–2016). Fluctuation in the use of rice is parallel for consumption and other uses. However, the use of commodities for feed and nonfood have different fluctuation patterns. For example, 2002–2005 was when rice used for nonfood increased (Figure 4).
Figure 4. Use of rice in Indonesia, 1993-2016. Source: [119]. Primary axis: food; secondary axis: feed, nonfood, and loss.
Rice consumption tends to increase significantly (t < 0.00; ANOVA F < 000; and R = 0.84 and R2 = 0.70). This implies that rice consumption increased as food or main source of carbohydrate, nonfood, feed, and loss. The constant point for rice was 27,066,930 tons and increased by 619,258 tons annually. Besides increases in human population, increases in rice consumption in Indonesia have also been related to the mainstream food policy in Indonesia to provide subsidies for rice production and maintain affordable rice prices [120].
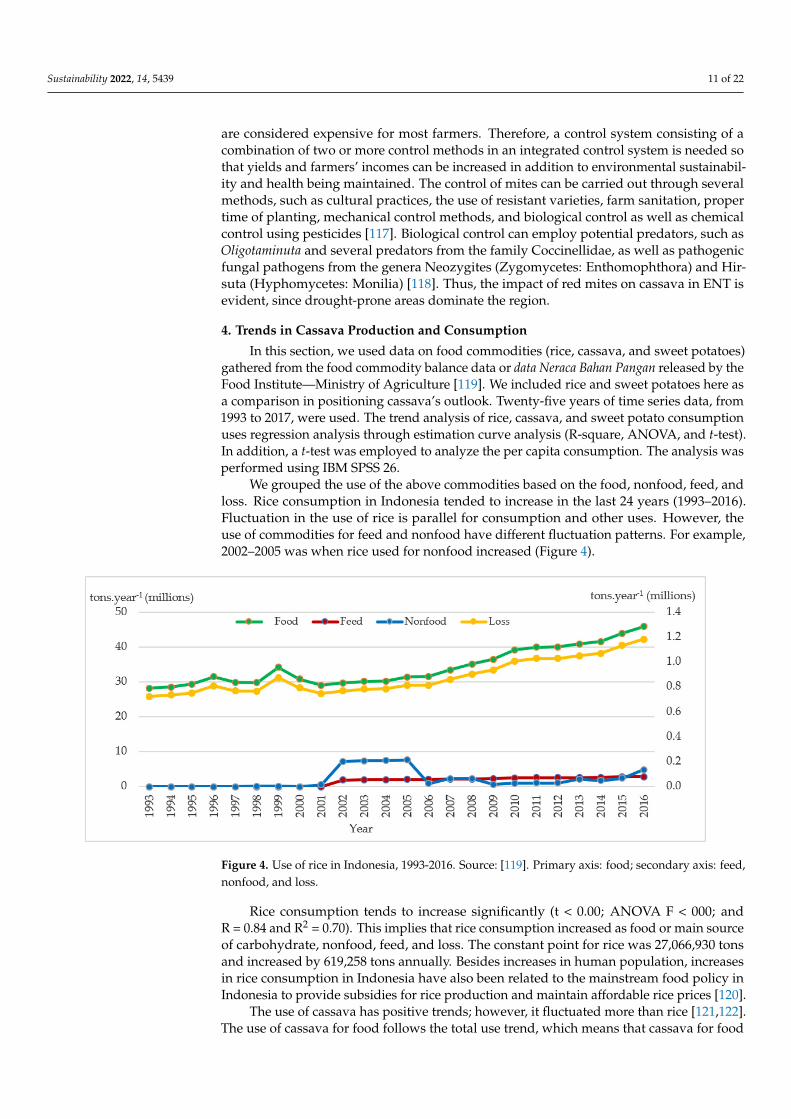
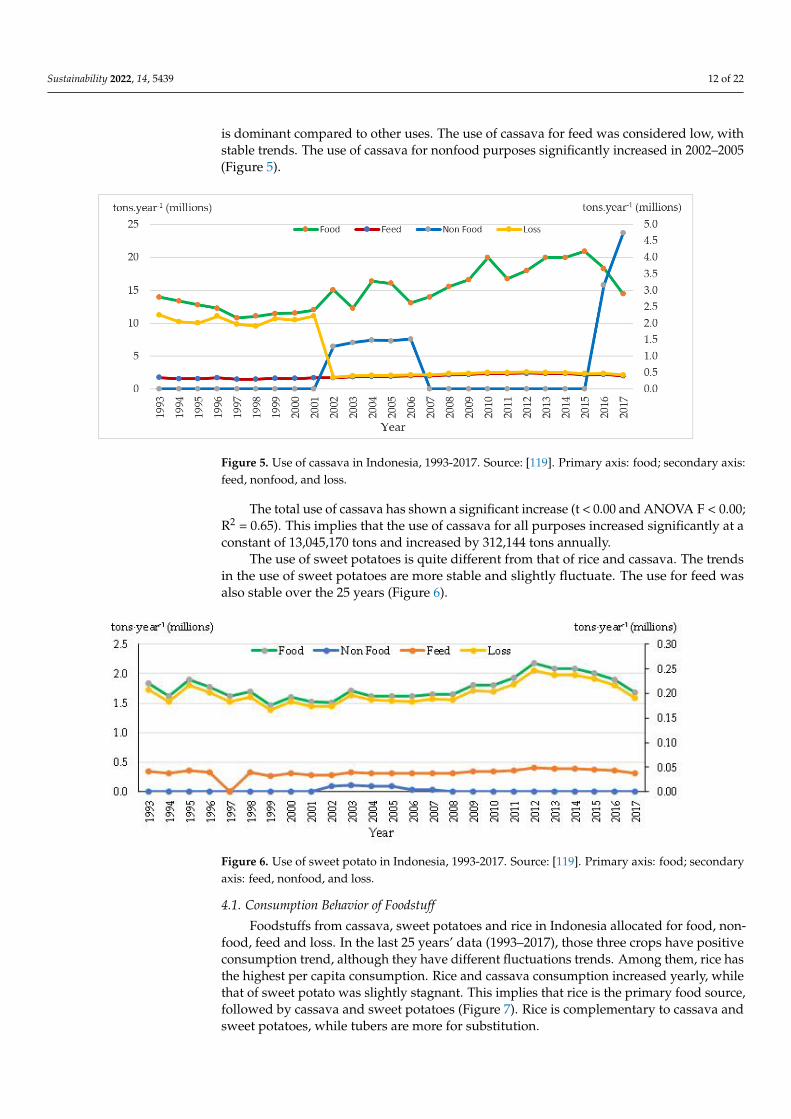
The use of cassava has positive trends; however, it fluctuated more than rice [121,122]. The use of cassava for food follows the total use trend, which means that cassava for food is dominant compared to other uses. The use of cassava for feed was considered low, with stable trends. The use of cassava for nonfood purposes significantly increased in 2002–2005 (Figure 5).
Figure 4. Use of rice in Indonesia, 1993-2016. Source: [119]. Primary axis: food; secondary axis: feed,nonfood, and loss.
Rice consumption tends to increase significantly (t < 0.00; ANOVA F < 000; andR = 0.84 and R2 = 0.70). This implies that rice consumption increased as food or main sourceof carbohydrate, nonfood, feed, and loss. The constant point for rice was 27,066,930 tonsand increased by 619,258 tons annually. Besides increases in human population, increasesin rice consumption in Indonesia have also been related to the mainstream food policy inIndonesia to provide subsidies for rice production and maintain affordable rice prices [120].
The use of cassava has positive trends; however, it fluctuated more than rice [121,122].The use of cassava for food follows the total use trend, which means that cassava for food
Sustainability 2022, 14, 5439 12 of 22
is dominant compared to other uses. The use of cassava for feed was considered low, withstable trends. The use of cassava for nonfood purposes significantly increased in 2002–2005(Figure 5).
Sustainability 2022, 14, x FOR PEER REVIEW 13 of 23
Figure 5. Use of cassava in Indonesia, 1993-2017. Source: [119]. Primary axis: food; secondary axis: feed, nonfood, and loss.
The total use of cassava has shown a significant increase (t < 0.00 and ANOVA F < 0,00; R2 = 0.65). This implies that the use of cassava for all purposes increased significantly at a constant of 13,045,170 tons and increased by 312,144 tons annually.
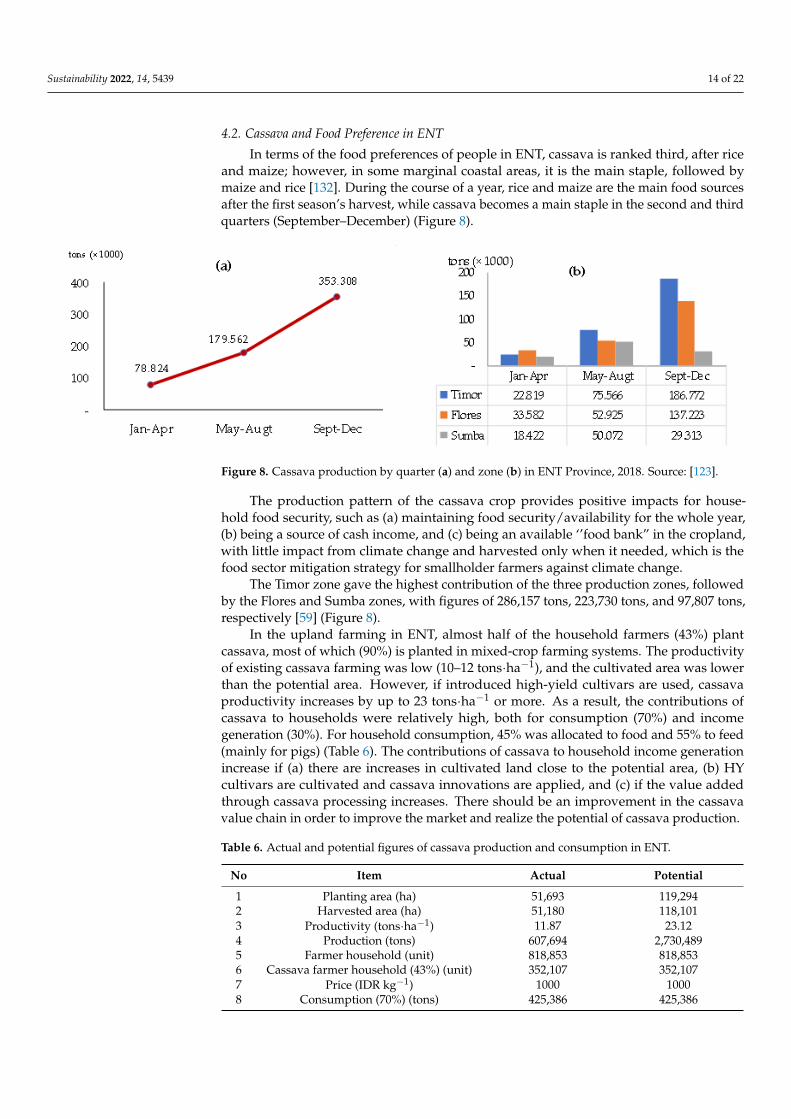
The use of sweet potatoes is quite different from that of rice and cassava. The trends in the use of sweet potatoes are more stable and slightly fluctuate. The use for feed was also stable over the 25 years (Figure 6).
Figure 6. Use of sweet potato in Indonesia, 1993-2017. Source: [119]. Primary axis: food; secondary axis: feed, nonfood, and loss.
4.1. Consumption Behavior of Foodstuff Foodstuffs from cassava, sweet potatoes and rice in Indonesia allocated for food, non-
food, feed and loss. In the last 25 years’ data (1993–2017), those three crops have positive consumption trend, although they have different fluctuations trends. Among them, rice has the highest per capita consumption. Rice and cassava consumption increased yearly, while that of sweet potato was slightly stagnant. This implies that rice is the primary food source, followed by cassava and sweet potatoes (Figure 7). Rice is complementary to cas-sava and sweet potatoes, while tubers are more for substitution.
Figure 5. Use of cassava in Indonesia, 1993-2017. Source: [119]. Primary axis: food; secondary axis:feed, nonfood, and loss.
The total use of cassava has shown a significant increase (t < 0.00 and ANOVA F < 0.00;R2 = 0.65). This implies that the use of cassava for all purposes increased significantly at aconstant of 13,045,170 tons and increased by 312,144 tons annually.
The use of sweet potatoes is quite different from that of rice and cassava. The trendsin the use of sweet potatoes are more stable and slightly fluctuate. The use for feed wasalso stable over the 25 years (Figure 6).
Sustainability 2022, 14, x FOR PEER REVIEW 13 of 23
Figure 5. Use of cassava in Indonesia, 1993-2017. Source: [119]. Primary axis: food; secondary axis:
feed, nonfood, and loss.
The total use of cassava has shown a significant increase (t < 0.00 and ANOVA F <
0,00; R2 = 0.65). This implies that the use of cassava for all purposes increased significantly
at a constant of 13,045,170 tons and increased by 312,144 tons annually.
The use of sweet potatoes is quite different from that of rice and cassava. The trends
in the use of sweet potatoes are more stable and slightly fluctuate. The use for feed was
also stable over the 25 years (Figure 6).
Figure 6. Use of sweet potato in Indonesia, 1993-2017. Source: [119]. Primary axis: food; secondary
axis: feed, nonfood, and loss.
4.1. Consumption Behavior of Foodstuff
Foodstuffs from cassava, sweet potatoes and rice in Indonesia allocated for food,
non-food, feed and loss. In the last 25 years’ data (1993–2017), those three crops have
positive consumption trend, although they have different fluctuations trends. Among
them, rice has the highest per capita consumption. Rice and cassava consumption in-
creased yearly, while that of sweet potato was slightly stagnant. This implies that rice is
the primary food source, followed by cassava and sweet potatoes (Figure 7). Rice is
complementary to cassava and sweet potatoes, while tubers are more for substitution.
Figure 6. Use of sweet potato in Indonesia, 1993-2017. Source: [119]. Primary axis: food; secondaryaxis: feed, nonfood, and loss.
4.1. Consumption Behavior of Foodstuff
Foodstuffs from cassava, sweet potatoes and rice in Indonesia allocated for food, non-food, feed and loss. In the last 25 years’ data (1993–2017), those three crops have positiveconsumption trend, although they have different fluctuations trends. Among them, rice hasthe highest per capita consumption. Rice and cassava consumption increased yearly, whilethat of sweet potato was slightly stagnant. This implies that rice is the primary food source,followed by cassava and sweet potatoes (Figure 7). Rice is complementary to cassava andsweet potatoes, while tubers are more for substitution.

Sustainability 2022, 14, 5439 13 of 22Sustainability 2022, 14, x FOR PEER REVIEW 14 of 23
Figure 7. Per capita consumption of rice, cassava, and sweet potato in Indonesia, 1993-2017. Source: [21,123,124].
Consumption consistency analysis of rice, cassava, and sweet crops in the period of 1993–2017 showed significant consistency for these three crops (t < 0.00). Per capita con-sumption level interval between the lowest and the highest confidence at 95%: The highest per capita consumption for cassava was 57.2 kg·capita−1·year−1,and the lowest was 45.5 kg·capita−1·year−1; for sweet potatoes, it was 8.2 kg·capita−1·year−1 (highest) and 7.53 kg·cap-ita−1·year−1 (lowest); and for rice, the highest was 158 kg·capita−1·year−1 and the lowest was 148.2 kg·capita−1·year−1 (Figure 7) [122,125].
The decision for food consumption showed that households consume cassava and sweet potatoes as complementary to the rice. Rice is the first option that combines with cassava and sweet potatoes in overall household carbohydrate-based consumption. Cas-sava and sweet potatoes have a substitution relation (Table 5).
Table 5. Consumption rate and relation between foodstuffs.
Food Stuffs Mean Value
(Millions Tons) Correlation
Consumption (kg·capita·year−1)
Cassava Sweet Potato Rice Lowest Highest
Cassava 15,065 - substitution complementar
y 45.50 57.20
Sweet potato 1756 Substitution - complementar
y 7.53 8.20
Rice 34,172 Complementar
y Complementar
y - 148.20 158.00
Source: Analyzed from [119].
The increase in rice and cassava consumption in 1993–2017 was mainly due to the fact that demand for rice and cassava increased. It was also due to the human population increasing, enough rice stock being available at an affordable price, and being supported by the government through ‘‘rice for poor’’ [126]. The demand for cassava increased due to an increased number of processed products being cassava-based, health reasons, and complimentary food diversification. Cassava contains a low glycemic index (GI), which is recommended as an alternative food source for diabetic people for rice substitution [127].
The use of sweet potatoes was indicated to be more stable and slightly fluctuate. This showed that the demand for sweet potatoes does not change much due to the increased human population, complementarity and substitution of other foodstuffs. Sweet potatoes in recent years have been more processed for snacks and health food. Therefore, some
Figure 7. Per capita consumption of rice, cassava, and sweet potato in Indonesia, 1993–2017.Source: [21,123,124].
Consumption consistency analysis of rice, cassava, and sweet crops in the periodof 1993–2017 showed significant consistency for these three crops (t < 0.00). Per capitaconsumption level interval between the lowest and the highest confidence at 95%: Thehighest per capita consumption for cassava was 57.2 kg·capita−1·year−1,and the lowestwas 45.5 kg·capita−1·year−1; for sweet potatoes, it was 8.2 kg·capita−1·year−1 (highest)and 7.53 kg·capita−1·year−1 (lowest); and for rice, the highest was 158 kg·capita−1·year−1
and the lowest was 148.2 kg·capita−1·year−1 (Figure 7) [122,125].The decision for food consumption showed that households consume cassava and
sweet potatoes as complementary to the rice. Rice is the first option that combines with cas-sava and sweet potatoes in overall household carbohydrate-based consumption. Cassavaand sweet potatoes have a substitution relation (Table 5).
Table 5. Consumption rate and relation between foodstuffs.
Food StuffsMean Value
(Millions Tons)Correlation Consumption(kg·capita·year−1)
Cassava Sweet Potato Rice Lowest Highest
Cassava 15,065 - substitution complementary 45.50 57.20Sweet potato 1756 Substitution - complementary 7.53 8.20
Rice 34,172 Complementary Complementary - 148.20 158.00
Source: Analyzed from [119].
The increase in rice and cassava consumption in 1993–2017 was mainly due to thefact that demand for rice and cassava increased. It was also due to the human populationincreasing, enough rice stock being available at an affordable price, and being supportedby the government through “rice for poor” [126]. The demand for cassava increased dueto an increased number of processed products being cassava-based, health reasons, andcomplimentary food diversification. Cassava contains a low glycemic index (GI), which isrecommended as an alternative food source for diabetic people for rice substitution [127].
The use of sweet potatoes was indicated to be more stable and slightly fluctuate. Thisshowed that the demand for sweet potatoes does not change much due to the increasedhuman population, complementarity and substitution of other foodstuffs. Sweet pota-toes in recent years have been more processed for snacks and health food. Therefore,some potential crops need to be developed for food diversification [128,129] through cropdiversification and food processing [130,131].
Sustainability 2022, 14, 5439 14 of 22
4.2. Cassava and Food Preference in ENT
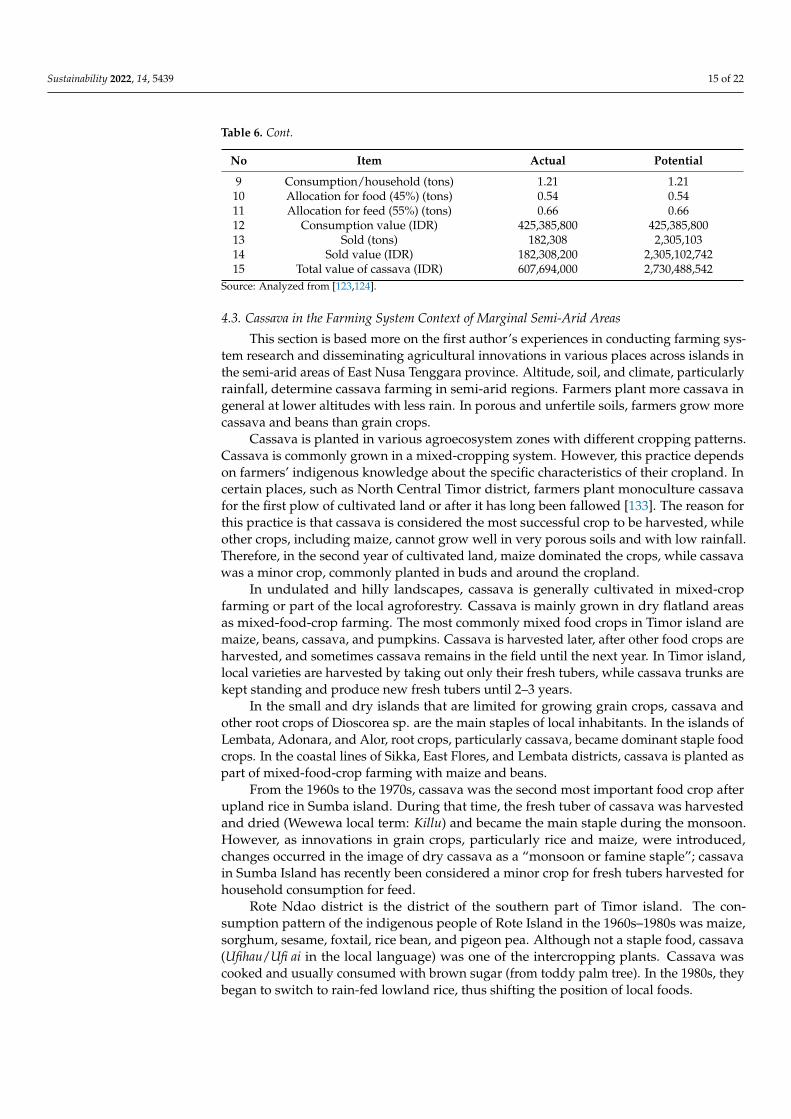
In terms of the food preferences of people in ENT, cassava is ranked third, after riceand maize; however, in some marginal coastal areas, it is the main staple, followed bymaize and rice [132]. During the course of a year, rice and maize are the main food sourcesafter the first season’s harvest, while cassava becomes a main staple in the second and thirdquarters (September–December) (Figure 8).
Sustainability 2022, 14, x FOR PEER REVIEW 15 of 23
potential crops need to be developed for food diversification [128,129] through crop di-versification and food processing [130,131].
4.2. Cassava and Food Preference in ENT In terms of the food preferences of people in ENT, cassava is ranked third, after rice
and maize; however, in some marginal coastal areas, it is the main staple, followed by maize and rice [132]. During the course of a year, rice and maize are the main food sources after the first season’s harvest, while cassava becomes a main staple in the second and third quarters (September–December) (Figure 8).
Figure 8. Cassava production by quarter (a) and zone (b) in ENT Province, 2018. Source: [123].
The production pattern of the cassava crop provides positive impacts for household food security, such as (a) maintaining food security/availability for the whole year, (b) being a source of cash income, and (c) being an available ‘’food bank’’ in the cropland, with little impact from climate change and harvested only when it needed, which is the food sector mitigation strategy for smallholder farmers against climate change.
The Timor zone gave the highest contribution of the three production zones, followed by the Flores and Sumba zones, with figures of 286,157 tons, 223,730 tons, and 97,807 tons, respectively [59] (Figure 8).
In the upland farming in ENT, almost half of the household farmers (43%) plant cas-sava, most of which (90%) is planted in mixed-crop farming systems. The productivity of existing cassava farming was low (10–12 tons·ha−1), and the cultivated area was lower than the potential area. However, if introduced high-yield cultivars are used, cassava produc-tivity increases by up to 23 tons·ha−1 or more. As a result, the contributions of cassava to households were relatively high, both for consumption (70%) and income generation (30%). For household consumption, 45% was allocated to food and 55% to feed (mainly for pigs) (Table 6). The contributions of cassava to household income generation increase if (a) there are increases in cultivated land close to the potential area, (b) HY cultivars are cultivated and cassava innovations are applied, and (c) if the value added through cassava processing increases. There should be an improvement in the cassava value chain in order to improve the market and realize the potential of cassava production.
Table 6. Actual and potential figures of cassava production and consumption in ENT.
No Item Actual Potential 1 Planting area (ha) 51,693 119,294 2 Harvested area (ha) 51,180 118,101 3 Productivity (tons·ha−1) 11.87 23.12 4 Production (tons) 607,694 2,730,489 5 Farmer household (unit) 818,853 818,853 6 Cassava farmer household (43%) (unit) 352,107 352,107
Figure 8. Cassava production by quarter (a) and zone (b) in ENT Province, 2018. Source: [123].
The production pattern of the cassava crop provides positive impacts for house-hold food security, such as (a) maintaining food security/availability for the whole year,(b) being a source of cash income, and (c) being an available ‘’food bank” in the cropland,with little impact from climate change and harvested only when it needed, which is thefood sector mitigation strategy for smallholder farmers against climate change.
The Timor zone gave the highest contribution of the three production zones, followedby the Flores and Sumba zones, with figures of 286,157 tons, 223,730 tons, and 97,807 tons,respectively [59] (Figure 8).
In the upland farming in ENT, almost half of the household farmers (43%) plantcassava, most of which (90%) is planted in mixed-crop farming systems. The productivityof existing cassava farming was low (10–12 tons·ha−1), and the cultivated area was lowerthan the potential area. However, if introduced high-yield cultivars are used, cassavaproductivity increases by up to 23 tons·ha−1 or more. As a result, the contributions ofcassava to households were relatively high, both for consumption (70%) and incomegeneration (30%). For household consumption, 45% was allocated to food and 55% to feed(mainly for pigs) (Table 6). The contributions of cassava to household income generationincrease if (a) there are increases in cultivated land close to the potential area, (b) HYcultivars are cultivated and cassava innovations are applied, and (c) if the value addedthrough cassava processing increases. There should be an improvement in the cassavavalue chain in order to improve the market and realize the potential of cassava production.
Table 6. Actual and potential figures of cassava production and consumption in ENT.
No Item Actual Potential
1 Planting area (ha) 51,693 119,2942 Harvested area (ha) 51,180 118,1013 Productivity (tons·ha−1) 11.87 23.124 Production (tons) 607,694 2,730,4895 Farmer household (unit) 818,853 818,8536 Cassava farmer household (43%) (unit) 352,107 352,1077 Price (IDR kg−1) 1000 10008 Consumption (70%) (tons) 425,386 425,386
Sustainability 2022, 14, 5439 15 of 22
Table 6. Cont.
No Item Actual Potential
9 Consumption/household (tons) 1.21 1.2110 Allocation for food (45%) (tons) 0.54 0.5411 Allocation for feed (55%) (tons) 0.66 0.6612 Consumption value (IDR) 425,385,800 425,385,80013 Sold (tons) 182,308 2,305,10314 Sold value (IDR) 182,308,200 2,305,102,74215 Total value of cassava (IDR) 607,694,000 2,730,488,542
Source: Analyzed from [123,124].
4.3. Cassava in the Farming System Context of Marginal Semi-Arid Areas
This section is based more on the first author’s experiences in conducting farming sys-tem research and disseminating agricultural innovations in various places across islands inthe semi-arid areas of East Nusa Tenggara province. Altitude, soil, and climate, particularlyrainfall, determine cassava farming in semi-arid regions. Farmers plant more cassava ingeneral at lower altitudes with less rain. In porous and unfertile soils, farmers grow morecassava and beans than grain crops.
Cassava is planted in various agroecosystem zones with different cropping patterns.Cassava is commonly grown in a mixed-cropping system. However, this practice dependson farmers’ indigenous knowledge about the specific characteristics of their cropland. Incertain places, such as North Central Timor district, farmers plant monoculture cassavafor the first plow of cultivated land or after it has long been fallowed [133]. The reason forthis practice is that cassava is considered the most successful crop to be harvested, whileother crops, including maize, cannot grow well in very porous soils and with low rainfall.Therefore, in the second year of cultivated land, maize dominated the crops, while cassavawas a minor crop, commonly planted in buds and around the cropland.
In undulated and hilly landscapes, cassava is generally cultivated in mixed-cropfarming or part of the local agroforestry. Cassava is mainly grown in dry flatland areasas mixed-food-crop farming. The most commonly mixed food crops in Timor island aremaize, beans, cassava, and pumpkins. Cassava is harvested later, after other food crops areharvested, and sometimes cassava remains in the field until the next year. In Timor island,local varieties are harvested by taking out only their fresh tubers, while cassava trunks arekept standing and produce new fresh tubers until 2–3 years.
In the small and dry islands that are limited for growing grain crops, cassava andother root crops of Dioscorea sp. are the main staples of local inhabitants. In the islands ofLembata, Adonara, and Alor, root crops, particularly cassava, became dominant staple foodcrops. In the coastal lines of Sikka, East Flores, and Lembata districts, cassava is planted aspart of mixed-food-crop farming with maize and beans.
From the 1960s to the 1970s, cassava was the second most important food crop afterupland rice in Sumba island. During that time, the fresh tuber of cassava was harvestedand dried (Wewewa local term: Killu) and became the main staple during the monsoon.However, as innovations in grain crops, particularly rice and maize, were introduced,changes occurred in the image of dry cassava as a “monsoon or famine staple”; cassavain Sumba Island has recently been considered a minor crop for fresh tubers harvested forhousehold consumption for feed.
Rote Ndao district is the district of the southern part of Timor island. The con-sumption pattern of the indigenous people of Rote Island in the 1960s–1980s was maize,sorghum, sesame, foxtail, rice bean, and pigeon pea. Although not a staple food, cassava(Ufihau/Ufi ai in the local language) was one of the intercropping plants. Cassava wascooked and usually consumed with brown sugar (from toddy palm tree). In the 1980s, theybegan to switch to rain-fed lowland rice, thus shifting the position of local foods.
Sustainability 2022, 14, 5439 16 of 22
5. Conclusions and Future Cassava Development
With the diverse agroecosystem zones of a dominant semi-arid area, ENT provinceis one of the provinces rich in cassava biodiversity. Most of the local cassava germplasmsare cultivated for food purposes and become pivotal crops in food resilience for people inmarginal environments.
As cassava can grow in a wide range of soil conditions, and with the present land usein ENT, cassava can still be developed in ENT. According to the agroecological zone (AEZ)scale of 1:250,000, the land potential for cassava was 596,468 ha or close to 20% of the landarea of ENT. This is because cassava is the most “successful” crop in marginal semi-aridregions and the last food crop harvested from croplands; cassava should be consideredto strengthen food security in rural areas. Moreover, the demand for cassava has had apositive trend over the previous 20 years, indicating that cassava can be cultivated widelyto increase smallholder farmers’ incomes.
Although it is a minor crop in the carbohydrate diet of people in ENT, cassava plays avital role as a buffer stock of food for marginal smallholder farmers in marginal semi-aridareas. In traditional farming practices, farmers have managed mixed-cropping systemsto maintain reasonably fresh root cassava production without the use of external inputs.Besides acting as a food source, cassava is also the main feed for traditional pig growth inrural areas.
The local cassava germplasm in existing ENT cassava farming is considered as havinglow productivity. However, ACIAR’s collaboration research on cassava in Sikka districtindicated that cassava productivity could be increased by more than double compared to theconventional one by introducing high-yield cultivars and improving farming management.This showed that, if cassava-related innovations can be widely implemented, ENT willhave potency as one of the major contributors of cassava production at the national level,as well as help promote rural cassava-based business.
Cassava is considered as being more tolerant of semi-arid dry climate conditions thanother food crops. Based on this characteristic, farmers cultivate more cassava in low-rainfallor drought-prone areas and have them become the main staple, particularly during the longdry season of June–December. Recent unpredictable climate changes, particularly rainfallin semi-arid regions, assert that cassava remains cultivated as a strategy to minimize risk inthe food resilience of marginal farmers.
As cassava suits a wide range of agroecosystems, is resistant to more minor pestsand diseases, and requires less care or less use of external inputs, cassava farming suitsmarginal farmers’ circumstances. Nevertheless, cassava-related innovations need to bedelivered to increase cassava productivity, markets, and rural cassava-based industries;later on, it will increase smallholder farmers’ incomes.
Supplementary Materials: The following supporting information can be downloaded at: https://www.mdpi.com/article/10.3390/su14095439/s1, Table S1: Land availability distribution for cassavain ENT.
Author Contributions: Y.N. led and oversaw the review. Y.S.M. drafted the cassava diversity inIndonesia aspects, particularly in semi-arid areas of ENT. K.N., E.I.W. and N.R.E.K. drafted theoverview of cassava research in Indonesia aspects, particularly of research conducted in ENT inaddition to pests and diseases encountered in cassava farming. T.B. and A.S. drafted the landsuitability and soils for cassava in ENT aspects. B.d. and H.d. drafted the socioeconomic aspects ofcassava. W.H.U. contributed to the institutions and cassava development policy aspects. All authorshave read and agreed to the published version of the manuscript.
Funding: The publication of this paper is partly financed by the East Nusa Tenggara (ENT) Bank.
Institutional Review Board Statement: Not applicable.
Informed Consent Statement: Not applicable.
Data Availability Statement: Not applicable.
Sustainability 2022, 14, 5439 17 of 22
Acknowledgments: We are indebted to and thank the AIAT-ENT chairman, Nusa Cendana Univer-sity, and Indonesian Legumes and Tuber Crops Research Institute (ILTCRI) for allowing the authorsto use resources from these respective institutions in writing this paper. We acknowledge ACIAR’scontribution in collaboration with CIAT, ILTCRI, and Brawijaya University to publish this paper.We thank the ENT Bank for supporting the publication of the paper. All remaining errors are theauthors’ responsibility.
Conflicts of Interest: The authors declare no conflict of interest.
References1. Basuki, T.; DeRosari, B.; Syamsuddin, M.; Hosang, E.Y.; Ngongo, Y.; Nulik, J.; Tay, Y.; Abolla, M.S.; Suek, Y.; Kotta, H.Z.; et al.
Grand Design Pembangunan Pertanian Lahan Kering Kepulauan Nusa Tenggara Timur; Dinas Pertanian Provinsi Nusa Tenggara Timurdan Balai Pengkajian Teknologi Pertanian Nusa Tenggara Timur: Kupang, Indonesia, 2018.
2. Ngongo, Y. The Political Ecology of Agricultural Development in West Timor, Indonesia; The University of Queensland:St. Lucia, QLD, Australia, 2011.
3. Parmar, A.; Sturm, B.; Hensel, O. Crops that feed the world: Production and improvement of cassava for food, feed, and industrialuses. Food Secur. 2017, 9, 907–927. [CrossRef]
4. Scott, G.J. A review of root, tuber and banana crops in developing countries: Past, present and future. Int. J. Food Sci. Technol.2021, 56, 1093–1114. [CrossRef] [PubMed]
5. Chandra, A.; Dargusch, P.; McNamara, K.E. How might adaptation to climate change by smallholder farming communitiescontribute to climate change mitigation outcomes? A case study from Timor-Leste, Southeast Asia. Sustain. Sci. 2016, 11, 477–492.[CrossRef]
6. Fuglie, K.O.; Oates, C.G.; Xie, J. Root Crops, Starch and Agro-Industrialization in Asia; International Potato Center (CIP):Lima, Peru, 2006.
7. BPS NTT. NTT Dalam Angka 2011; BPS NTT: Kupang, Indonesia, 2011.8. Abolla, N.B.C.C.; Sartohadi, J.; Utami, S.N.H.; Basuki, T. Improvement of soil quality through minimum tillage for sen cropping
pattern in Indonesia. Indian J. Agric. Res. 2020, 54, 205–210. [CrossRef]9. Basuki, T.; DeRosari, B. Pemanfaatan Kearifan Lokal dan Teknologi Pertanian Mendukung Pembangunan Pertanian Wilayah. In
Pembangunan Pertanian Wilayah Berbasis Kearifan Lokal Dan Kemitraan; Pasandaran, E., Syakir, M., Heriawan, R., Yufdy, M.P., Eds.;IAARD Press: Jakarta, Indonesia, 2017; pp. 63–88. ISBN 9780333227794.
10. BPS NTT. NTT Dalam Angka; Badan Pusat Statistik: Kupang, Indonesia, 2019.11. Mau, Y.S.; Ndiwa, A.S.; Arsa, I.G.A. Tingkat Ketahanan Klon Potensial Ubi Jalar Lokal Asal Ntt Terhadap Hama Lanas (Cylas
formicarius Fab.). J. Hama Dan Penyakit Tumbuh. Trop. 2011, 11, 139–146. [CrossRef]12. Mau, Y.S.; Ndiwa, A.S.S.; Arsa, I.G.B.A.; Oematan, S.S. Growth and yield stability of sweet potato clones across four locations in
East Nusa Tenggara. Agrivita 2013, 35, 95–102. [CrossRef]13. Mau, Y.S. Resistance response of fifteen sweet potato genotypes to scab disease (Sphaceloma batatas) in two growing sites in East
Nusa Tenggara, Indonesia. Trop. Drylands 2018, 2, 5–11. [CrossRef]14. Radjit, B.S.; Widodo, Y.; Saleh, N.; Prasetiaswati, N. Teknologi untuk meningkatkan produktivitas dan keuntungan usahatani
ubikayu di lahan kering ultisol. Iptek Tanam. Pangan 2014, 9, 51–62.15. Ritung, S.; Nugroho, K.; Mulyani, A.; Suryani, E. Petunjuk Teknis Evaluasi Lahan untuk Komoditas Pertanian (Edisi Revisi); Balai Besar
Penelitian dan Pengembangan Sumberdaya Lahan Pertanian. Badan Penelitian dan Pengembangan Pertanian: Bogor, Indonesia,2011; ISBN 1961102019880.
16. Anthonius, G.; Ufie, C.; Liubana, S. Integrasi Kearifan Lokal dalam Evaluasi Lahan bagi Budidaya Enbal (Manihot esculentaCrantz) pada Kaki Gunung Ar, Pulau Yut, Maluku Tenggara. J. Budid. Pertan. 2021, 17, 59–67. [CrossRef]
17. Steven Merumba, M.; Michael Msanya, B.; Semu, E.; Mashambo Semoka, J. Pedological Characterization and SuitabilityAssessment for Cassava Production in Bukoba, Missenyi and Biharamulo Districts, Tanzania. Am. J. Agric. For. 2020, 8, 144–166.[CrossRef]
18. Howeler, R.H. Sustainable Soil and Crop Management of Cassava in Asia: A Reference Manual; Centro Internacional de AgriculturaTropical (CIAT): Cali, Colombia, 2014; ISBN 978-958-694-125-9.
19. Utomo, W.H.; Widodo, Y.; Noerwijati, K.; Krisdiana, R.; Wisnubroto, E.; Smith, D.; Newby, J.; Cramb, R.; Yadav, L. CassavaProgram Discussion Papers: Value Chain Analysis, Household Survey and Agronomic Trial Results-Sikka; The University of Queenlands:St. Lucia, QLD, Australia, 2018; ISBN 2209-2684.
20. Howeler Lutaladio, N.; Thomas, G.R. Save and Grow: Cassava. A Guide to Sustainable Production Intensification; Food and AgricultureOrganization of the United Nations: Rome, Italy, 2013.
21. Basuki, T.; Nulik, J. Peta Agroecological Zone (AEZ) Skala Tinjau Mendalam untuk Provinsi Nusa Tenggara Timur (Edisi Kedua); BadanPenelitian dan Pengembangan Pertanian. Balai Pengkajian Teknologi Pertanian (BPTP) NTT: Kupang, Indonesia, 2007.
22. Mulyani, A.; Suriadi, A.; Subandiono, R.E. Suratman Biophysical characteristics of dry-climate upland and agriculture de-velopment challenges in West Nusa Tenggara and East Nusa Tenggara Provinces. In Proceedings of the International Soil
Sustainability 2022, 14, 5439 18 of 22
Conference, Cha Am, Thailand, 17–20 August 2015; Land Development Department Ministry of Agriculture and Cooperatives:Phetchaburi, Indonesia, 2015.
23. Mulyani, A.; Priyono, A.; Agus, F. Semiarid soils of eastern Indonesia: Soil classification and land uses. In Developments in SoilClassification, Land Use Planning and Policy Implications: Innovative Thinking of Soil Inventory for Land Use Planning and Managementof Land Resources; Springer: Dordrecht, The Netherlands, 2013; pp. 449–466.
24. Nur, M.S.M.; Arsa, I.G.B.A.; Malaipada, Y. The effect of cattle manure and mineral fertilizers on soil chemical properties andtuber yield of purple-fleshed sweet potato in the dryland region of East Nusa Tenggara, Indonesia. Trop. Drylands 2019, 3, 56–59.[CrossRef]
25. Mateus, R.; Kantur, D.; Moy, L.M. Pemanfaatan Biochar Limbah Pertanian sebagai Pembenah Tanah untuk Perbaikan KualitasTanah dan Hasil Jagung di Lahan Kering. J. Agrotrop 2017, 7, 99–108.
26. Ishaq, L.; Adu Tae, A.S.J.; Airthur, M.A.; Bako, P.O. Short communication: Abundance of Arbuscular Mycorrhiza asociated withcorn planted with traditional and more modern farming systems in Kupang, East Nusa Tenggara, Indonesia. Biodivers. J. Biol.Divers. 2017, 18, 887–892. [CrossRef]
27. Sukristiyonubowo, S.; Riyanto, D.; Widodo, S. Pengaruh Teknologi Pemupukan terhadap Kualitas Tanah, Pertumbuhan danHasil Padi Varitas Ciherang yang Ditanam pada Sawah Bukaan Baru di Dusun Kleseleon, Kabupaten Malaka, Nusa TenggaraTimur. J. Lahan Suboptimal 2019, 8, 1–10. [CrossRef]
28. Kurniawan, H.; Soenarno; Prasetiyo, N.A. Kajian Beberapa Aspek Ekologi Cendana (Santalum album Linn.) pada LahanMasyarakat di Pulau Timor. J. Penelit. Hutan Dan Konserv. Alam 2013, 10, 33–49. [CrossRef]
29. Sitorus, A.; Kotta, N.R.E.; Hosang, E.Y. Keragaan Pertumbuhan dan Produksi Jagung Hibrida pada Agroekosistem LahanKering Iklim Kering Nusa Tenggara Timur. In Proceedings of the Seminar Nasional Lahan Suboptimal, Palembang, Indonesia,20 October 2020; Penerbit & Percetakan Universitas Sriwijaya (UNSRI): Palembang, Indonesia, 2020; pp. 62–72.
30. Moata, M.R.; Meel Takalapeta, A. Short Communication: Is soil organic carbon a key-driven for sustainable agroecosystem interrestrial semi-arid, Indonesia? Int. J. Trop. Dryland 2021, 5, 1–4. [CrossRef]
31. Soetedjo, I.P. Various dosages of active powder of cassava improved sustainability of physical and chemical characteristics ofVertisol and Alfisol on dryland farming system. Trop. Drylands 2019, 3, 29–33. [CrossRef]
32. Ishaq, L.; Taea, A.S.J.A.; Airthur, M.A.; Bako, P.O. Effect of single and mixed inoculation of arbuscular mycorrhizal fungi andphosphorus fertilizer application on corn growth in calcareous soil. Biodiversitas 2021, 22, 1920–1926. [CrossRef]
33. Penelitian Tanah, B. Petunjuk Teknis Analisis Kimia Tanah, Tanaman, Air dan Pupuk, 2nd ed.; Prasetyo, B.H., Santoso, D.,Retno, L., Eds.; Balai Penelitian Tanah: Bogor, Indonesia, 2009; ISBN 9780874216561.
34. Riptanti, E.W.; Masyhuri, M.; Irham, I.; Suryantini, A.; Mujiyo, M. The development of leading food commodities based on localwisdom in food-insecure area in east Nusa Tenggara province, Indonesia. Appl. Ecol. Environ. Res. 2018, 16, 7867–7882. [CrossRef]
35. Killa, Y.M. Identification of land suitability for food plants in Ngaha Ori Anggu Sub-District, East Sumba Regency.Agrovigor: Jurnal Agroteknologi 2021, 4, 138–144. [CrossRef]
36. Banjarnahor, D.; Simanjuntak, H.; Pertanian, F.; Kristen, U.; Wacana, S. Evaluasi Kesesuaian Lahan Sumba Tengah Untuk TanamanPangan Serta Perancangan Pola Tanamnya Yang Spesifik Lokasi. J. Bumi Lestari 2016, 16, 108–118. [CrossRef]
37. Wahyuni, T.S.; Noerwijati, K.; Mejaya, M.J. The diversity of morpho-agronomic characters and identification of early maturitycassava (Manihot esculenta Crantz.) germplasm. AIP Conf. Proc. 2022, 2462, 20028.
38. Ferguson, M.E.; Shah, T.; Kulakow, P.; Ceballos, H. A global overview of cassava genetic diversity. PLoS ONE 2019, 14, e0224763.[CrossRef] [PubMed]
39. ILETRI. Laporan Tahunan 2019. Hasil Utama Penelitian Tanaman Aneka Kacang dan Umbi; Balai Penelitian Tanaman Aneka Kacangdan Umbi: Malang, Indonesia, 2020.
40. Minantyorini dan Sabda, M. Evaluasi Deteriorasi Karakter Plasma Nutfah Ubi Kayu. In Proceedings of the Prosiding SeminarHasil Penelitian Tanaman Aneka Kacang dan Umbi, Malang, Indonesia, 25 May 2016; pp. 523–529.
41. Wahyuni, T.S.; Noerwijati, K. Tuber yield, morphology, and chemical properties var-iability of sweet cassava germplasm.Ilmu Pertan. Agric. Sci. 2021, 6, 77–87.
42. Hosang, E.Y.; Kotta, N.R.E.; Basuki, T.; de Rosari, B.; Kotta, H.Z.; Dato, T.O.D.; Kapitan, O.R. Tanda Daftar Varietas Tanaman UbiKayu SBS 1 Malaka; Pusat Perlindungan Varietas Tanaman dan Perizinan Pertanian (PPVTPP): Jakarta, Indonesia, 2020.
43. Hosang, E.Y.; Kotta, N.R.E.; Basuki, T.; de Rosari, B.; Kotta, H.Z.; Dato, T.O.D.; Kapitan, O.R. Tanda Daftar Varietas Tanaman UbiKayu SBS 2 Malaka; Pusat Perlindungan Varietas Tanaman dan Perizinan Pertanian (PPVTPP): Jakarta, Indonesia, 2020.
44. Hosang, E.Y.; Kotta, N.R.E.; Ngongo, Y.; DosSantos, R.; Bitang, B.K.; Mallingara, Y.M. Tanda Daftar Varietas Tanaman Ubi kayuLuwayye Nona; Pusat Perlindungan Varietas Tanaman dan Perizinan Pertanian (PPVTPP): Jakarta, Indonesia, 2020.
45. Hosang, E.Y.; Kotta, N.R.; Syamsuddin, M.; Ngongo, Y.; Kario, N.H. Tanda Daftar Varietas Tanaman Ubi Kayu Lango Wologai; PusatPerlindungan Varietas Tanaman dan Perizinan Pertanian (PPVTPP): Jakarta, Indonesia, 2019.
46. Balitkabi. Depkripsi Varietas Unggul Ubi Kayu 1978–2016. Available online: http://balitkabi.litbang.pertanian.go.id/wp-content/uploads/2016/09/ubikayu.pdf (accessed on 28 January 2022).
47. Firdaus, N.R.; Hayati, P.D. Yusniwati Karakterisasi Fenotipik Ubi Kayu (Manihot Esculenta Crantz) Lokal Sumatera Barat.J. Agroteknol. 2016, 10, 104–116.
48. Devy, N.F.; Syarif, A.A. Aryawaita Identifikasi Penciri Morfologi dan Kualitas Plasma Nutfah Lokal Ubi Kayu (Manihot esculentaCrantz) Sumatra Barat. Bul. Plasma Nutfah 2018, 24, 53–62. [CrossRef]
Sustainability 2022, 14, 5439 19 of 22
49. Sumilah, S.; Aldi, N. Keragaman Sumber Daya Genetik Empat Varietas Ubi Kayu Lokal (Manihot Esculenta Crantz) Di LahanKering Sawahlunto (Diversity of Genetic Resources of Four Varieties of Local Wood Sweet (Manihot Esculenta Crantz) iInSawahlunto Dry Land). In Proceedings of the Prosiding Seminar Nasional Pengembangan Teknologi Pertanian, Lampung,Indonesia, 11 November 2019; Politeknik Negeri Lampung: Lampung, Indonesia, 2019; pp. 64–69.
50. Jonharnas; Lubis, H.M.; Jamil, A. Dukungan Sumber Daya Genetik Varietas Lokal Ubi Kayu Terhadap Ketahanan Pangan DiSumatera Utara. In Proceedings of the Prosiding Seminar dan Kongres Nasional Sumber Daya Genetik, Medan, Indonesia,12–14 December 2012; pp. 304–309.
51. Raharjo, S.H.T.; Hetharie, H.; Augustyn, G.H.; Pesireron, M. Keragaman ubi kayu dan ubi jalar di Seram Bagian Barat dan peluangpemanfaatannya untuk ketahanan pangan dan industri. In Percepatan Pembangunan Ekonomi Berbasis Hasil Kajian Pertanian danPerikanan di Provinsi Maluku; Penerbit Pensil Komunika: Yogyakarta, Indonesia, 2014; pp. 73–102.
52. Suwitono, B.; Hendaru, I.H.; Putri, P.H.; Utara, M.; Utara, M. Karakterisasi Agronomis Ubi Kayu Lokal Maluku Utara. InProceedings of the Prosiding Seminar Hasil Penelitian Tanaman Aneka Kacang dan Umbi, Malang, Indonesia, 26 July 2017; BalaiPenelitian Aneka Kacang dan Umbi: Malang, Indonesia, 2018; pp. 510–517.
53. Hosang, E.Y.; Bire, A.; Sendow, C.B.; Doga, H.L.; Menge, D.; Hanggongu, C. Keragaman Sumber Daya Genetik Tanaman DiTimor Barat, Provinsi Nusa Tenggara Timur, Serta Strategi Pengelolaannya. In Proceedings of the Prosiding Seminar NasionalSumber Daya Genetik Pertanian, Bogor, Indonesia, 27 May 2015; Balai Besar Pengkajian dan Pengembangan Teknologi Pertanian:Bogor, Indonesia, 2015; pp. 317–325.
54. Kementerian Pertanian Republik Indonesia. Statistik Pertanian 2019; Susanti, A.A., Astuti, T.H., Eds.; Kementerian PertanianRepublik Indonesia: Jakarta, Indonesia, 2019; ISBN 9798958659.
55. De Tafur, S.M.; El-Sharkawy, M.A.; Calle, F. Photosynthesis and yield performance of cassava in seasonally dry and semiaridenvironments. Photosynthetica 1997, 33, 249–257. [CrossRef]
56. Lanamana, W.; Supardi, P.N. Faktor-Faktor yang Mempengaruhi Pendapatan dan Prospek Usahatani Ubi Kayu Varietas LokalNuabosi di Desa Randotonda Kecamatan Ende Kabupaten Ende. J. Sosio Agribisnis 2020, 5, 94–103.
57. Dixon, J. Production and consumption of cassava in Indonesia. Bull. Indones. Econ. Stud. 1979, 15, 83–106. [CrossRef]58. Dixon, J.A. Cassava in Indonesia: Its economic role and use as food. Contemp. Southeast Asia 1982, 3, 361–373. [CrossRef]59. BPS NTT. Nusa Tenggara Timur Dalam Angka; Badan Pusat Statistik: Kupang, Indonesia, 2021.60. BPS NTT. Nusa Tenggara Timur Dalam Angka; Badan Pusat Statistik: Kupang, Indonesia, 2017.61. Badan Penelitian dan Pengembangan Pertanian Teknologi Budidaya Ubikayu Untuk Mencapai Produksi Optimal. Avail-
able online: https://www.litbang.pertanian.go.id/download/260/file/Teknologi-Budidaya-Ubikayu.pdf (accessed on31 January 2022).
62. Hanafi; Mustari, K.; Sidabalok, I.; Messa, J. Development of High Yield Potential Cassava as Food Resources and RenewableEnergy. Int. J. Sci. Technol.Res. 2020, 7, 77–81, ISSN 2277-8616-77.
63. Misganaw, C.D.; Bayou, W.D. Tuber yield and yield component performance of cassava (Manihot esculenta) varieties in FafenDistrict, Ethiopia. Int. J. Agron. 2020, 2020, 5836452. [CrossRef]
64. Asfaw, S.; Shiferaw, B.; Simtowe, F.; Hagos, M. Agricultural technology adoption, seed access constraints and commercializationin Ethiopia. J. Dev. Agric. Econ. 2011, 3, 436–477.
65. Mbanjo, E.G.N.; Rabbi, I.Y.; Ferguson, M.E.; Kayondo, S.I.; Eng, N.H.; Tripathi, L.; Kulakow, P.; Egesi, C. Technological innovationsfor improving cassava production in sub-Saharan Africa. Front. Genet. 2021, 1829. [CrossRef] [PubMed]
66. Bellotti, A.; Campo, B.V.H.; Hyman, G. Cassava Production and Pest Management: Present and Potential Threats in a ChangingEnvironment; Springer: Berlin/Heidelberg, Germany, 2012; Volume 5, ISBN 1204201190914.
67. Kapa, M.M.J. Produktivitas usahatani dalam sistem pertanian terpadu: Studi kasus di kecamatan Amarasi, kabupaten Kupang,Nusa Tenggara Timur. In Proceedings of the A Workshop to Identify Sustainable Rural Livelihoods, Kupang, Indonesia,5–7 April 2006; Volume 126, p. 132.
68. Pinton, F. Cassava and biodiversity: Looking for new partnerships. Cassava Biodivers. Look. New Partnersh. 2002, 10, 18–30.[CrossRef]
69. Saleh, N.; Widodo, Y. Profil dan peluang pengembangan ubi kayu di indonesia. Bul. Palawija 2007, 14, 69–78.70. Muslim, A. Prospek Ekonomi Ubi Kayu di Indonesia. Repos. Univ. Al Azhar Indones. Jakarta UAI. 2017. Available
online: http//repository.uai.ac.id/wpcontent/uploads/2017/10/Prospek-Ekonomi-Ubi-Kayu-di-Indonesia (accessed on31 January 2022).
71. ACIAR. Cassava Current Agronomy Practices: East Nusa Tenggara—Indonesia; ACIAR: Canberra, ACT, Australia, 2018.72. ACIAR. Penggunaan Pupuk Pada Pertanian Ubikayu Di Indonesia; Stakeholder Brief Aciar Cassava Value Chain and Livelihood
Program; ACIAR: Canberra, ACT, Australia, 2020.73. Smith, D.; Newby, J.; Utomo, W.H.; Van Nam, N.; Sến, P.T.; Le Thuy, C.T.; Malik, I.; Cramb, R. Developing Value-
Chain Linkages to Improve Smallholder Cassava Production Systems in Vietnam and Indonesia; The University of Queensland:St. Lucia, QLD, Australia, 2018.
74. Campo, B.V.H.; Hyman, G.; Bellotti, A. Threats to cassava production: Known and potential geographic distribution of four keybiotic constraints. Food Secur. 2011, 3. [CrossRef]
75. Alonso Chavez, V.; Milne, A.E.; van den Bosch, F.; Pita, J.; McQuaid, C.F. Modelling cassava production and pest managementunder biotic and abiotic constraints. Plant Mol. Biol. 2021, 2021, 1–25. [CrossRef]
Sustainability 2022, 14, 5439 20 of 22
76. Yu, X.-Y.; Yao, Y.; Hong, Y.-H.; Hou, P.-Y.; Li, C.-X.; Xia, Z.-Q.; Geng, M.-T.; Chen, Y.-H. Differential expression of the Hsf family incassava under biotic and abiotic stresses. Genome 2019, 62, 563–569. [CrossRef]
77. Calatayud, P.A.; Le Rü, B. Cassava-Mealybug Interactions; IRD Éditions: Paris, France, 2006; ISBN 9782709916141.78. Rauwane, M.E.; Odeny, D.A.; Millar, I.; Rey, C.; Rees, J. The early transcriptome response of cassava (Manihot esculenta Crantz)
to mealybug (Phenacoccus manihoti) feeding. PLoS ONE 2018, 13. [CrossRef] [PubMed]79. Koricheva, J.; Larsson, S.; Haukioja, E. Insect performance on experimentally stressed woody plants: A meta-analysis. Annu. Rev.
Entomol. 1998, 43, 195–216. [CrossRef]80. Nwanze, K.F. Relationships between cassava root yields and crop infestations by the mealybug, phenacoccus manihoti. Trop. Pest
Manag. 1982, 28. [CrossRef]81. Thancharoen, A.; Lankaew, S.; Moonjuntha, P.; Wongphanuwat, T.; Sangtongpraow, B.; Ngoenklan, R.; Kittipadakul, P.; Wyckhuys,
K.A.G. Effective biological control of an invasive mealybug pest enhances root yield in cassava. J. Pest Sci. 2018, 91. [CrossRef]82. Parsa, S.; Kondo, T.; Winotai, A. The Cassava Mealybug (Phenacoccus manihoti) in Asia: First Records, Potential Distribution, and
an Identification Key. PLoS ONE 2012, 7, 1199–1211. [CrossRef] [PubMed]83. Winotai, A.; Goergen, G.; Tamò, M.; Neuenschwander, P. Cassava mealybug has reached Asia. Biocontrol News Info. 2010,
31, 10N–11N.84. Sartiami, D.; Watson, G.W.; Mohamad Roff, M.N.; Mohd Hanifah, Y.; Idris, A.B. First record of cassava mealybug, Phenacoccus
manihoti (Hemiptera: Pseudococcidae), in Malaysia. Zootaxa 2015, 3957, 235–238. [CrossRef]85. Muniappan, R.; Shepard, B.M.; Watson, G.W.; Carner, G.R.; Rauf, A.; Sartiami, D.; Hidayat, P.; Afun, J.V.K.K.; Goergen, G.;
Rahman, A.K.M.Z.M.Z. New records of invasive insects (hemiptera: Sternorrhyncha) in Southeast Asia and West Africa. J. Agric.Urban Entomol. 2009, 26, 167–174. [CrossRef]
86. Rauf, A.; Wardani, N.; Wyckhuys, K.A.G.; Shepard, M. Infestations and management of the cassava mealybug, Phenacoccusmanihoti (Hemiptera: Pseudococcidae), a newly invasive pest in Indonesia. Res. Poster Present. Des. 2010, 20–21. Available online:https://www.researchgate.net/profile/Aunu-Rauf/publication/305792992_Infestations_and_management_of_the_cassava_mealybug_Phenacoccus_manihoti_Hemiptera_Pseudococcidae_a_newly_invasive_pest_in_Indonesia/links/5969a9500f7e9b80918e8825/Infestations-and-management-of-the-cassava-mealybug-Phenacoccus-manihoti-Hemiptera-Pseudococcidae-a-newly-invasive-pest-in-Indonesia.pdf (accessed on 9 February 2022).
87. Suparni Awas Ancaman Serangan Kutu Putih pada Ubi Kayu. Majalah Sinar Tani Edisi, 16 May 2010; 3354.88. Yonow, T.; Kriticos, D.J.; Ota, N. The potential distribution of cassava mealybug (Phenacoccus manihoti), a threat to food security
for the poor. PLoS ONE 2017, 12, 1–16. [CrossRef]89. Bellotti, A.C.; Smith, L.; Lapointe, S.L. Recent advances in cassava pest management. Annu. Rev. Entomol. 1999, 44, 343–370.
[CrossRef]90. Bellotti, A.C.; Reyes, J.A.; Varela, A.M. Observations on cassava mealybugs in the Americas; their biology, ecology and natural
enemies. In Proceedings of the 6th Symposium of the International Society for Tropical Root Crops, Lima, Peru, 21–26 February1983; pp. 339–352.
91. Bale, J.S.; Masters, G.J.; Hodkinson, I.D.; Awmack, C.; Bezemer, T.M.; Brown, V.K.; Butterfield, J.; Buse, A.; Coulson, J.C.;Farrar, J.; et al. Herbivory in global climate change research: Direct effects of rising temperature on insect herbivores. Glob. ChangeBiol. 2002, 8, 1–16. [CrossRef]
92. Puu, Y.M.S.W. Relationship between Population and Intensity of Cassava Mealybug (Phenacoccus manihoti) Attack on FloresIsland. Caraka Tani J. Sustain. Agric. 2019, 34, 61. [CrossRef]
93. Zuraida, N. Karakterisasi Beberapa Sifat Kualitatif dan Kuantitatif Plasma Nutfah Ubi Kayu (Manihot esculenta Crantz.).Bul. Plasma Nutfah 2016, 16, 49–56. [CrossRef]
94. Wardani, N. Kutu Putih Singkong, Phenacoccus Manihoti Matileferrero (Hemiptera: Pseudococcidae), Hama Invasif Baru Di Indonesia;Institut Pertanian Bogor: Bogor, Indonesia, 2015.
95. ACIAR. Hama dan Penyakit Tanaman Ubikayu di Indonesia. Available online: https://research.aciar.gov.au/cassavavaluechains/wp-content/uploads/2020/06/Indonesia-Stakeholder-Brief-4-RFS-Pest-and-Diseases_in-bahasa.pdf (accessed on9 February 2022).
96. Banjaw, D.T.; Regessa, M.D. Cassava Integrated Pest Management: Review on Cassava Mosaic Disease and Mealybug. J.Biol.Agric. Healthc. 2017, 7, 10–16. [CrossRef]
97. Fanani, M.Z.; Rauf, A.; Maryana, N.; Nurmansyah, A.; Hindayana, D. Geographic distribution of the invasive mealybugPhenacoccus manihoti and its introduced parasitoid Anagyrus lopezi in parts of Indonesia. Biodiversitas 2019, 20, 3751–3757.[CrossRef]
98. Nwanze, K.F.; Leuschner, K.; Ezumah, H.C. The cassava mealybug, Phenacoccus sp. in the Republic of Zaire. Pans 1979,25, 125–130. [CrossRef]
99. Atu, U.G.; Okeke, J.E. Effect of Insecticide Application on Cassava Yield in Control of Cassava Mealybug (Phenacoccus Manlhotl).Int. J. Pest Manag. 1981, 27, 434–435. [CrossRef]
100. Schulthess, F.; Baumgärtner, J.U.; Delucchi, V.; Gutierrez, A.P. The influence of the cassava mealybug, Phenacoccus manihotiMat.-Ferr.(Horn., Pseudococcidae) on yield formation of cassava, Manihot esculenta Crantz. J. Appl. Entomol. 1991, 111, 155–165.[CrossRef]
Sustainability 2022, 14, 5439 21 of 22
101. Barilli, D.R.; Pietrowski, V.; da Wengrat, S.A.P.G.; Gazola, D.; Ringenberg, R. Biological characteristics of the cassava mealybugPhenacoccus manihoti (Hemiptera: Pseudococcidae). Rev. Colomb. Entomol. 2014, 40, 21–24.
102. De Willink, M.C.G. Mealybugs of Central and South America; CAB International: Wallingford, UK, 1992; ISBN 0851987915.103. Cox, J.M.; Williams, D.J. An account of cassava mealybugs (Hemiptera: Pseudococcidae) with a description of a new species.
Bull. Entomol. Res. 1981, 71, 247–258. [CrossRef]104. Ouyang, J.; Tian, Y.; Jiang, C.; Yang, Q.; Wang, H.; Li, Q. Laboratory assays on the effects of a novel acaricide, SYP-9625 on
tetranychus cinnabarinus (Boisduval) and its natural enemy, neoseiulus californicus (McGregor). PLoS ONE 2018, 13, e0199269.[CrossRef] [PubMed]
105. Chen, Q.; Liang, X.; Wu, C.; Gao, J.; Chen, Q.; Zhang, Z. Density threshold-based acaricide application for the two-spotted spidermite Tetranychus urticae on cassava: From laboratory to the field. Pest Manag. Sci. 2019, 75. [CrossRef] [PubMed]
106. Yang, J.; Wang, G.Q.; Zhou, Q.; Lu, W.; Ma, J.Q.; Huang, J.H. Transcriptomic and proteomic response of Manihot esculenta toTetranychus urticae infestation at different densities. Exp. Appl. Acarol. 2019, 78, 273–293. [CrossRef] [PubMed]
107. Lal, S.; Pallai, K. The effect of tetranychid spider mites infestations on tuber yield of cassava. Indian J. Plant Prot. 1980, 8, 128–132.108. Xu, Z.; Zhu, W.; Liu, Y.; Liu, X.; Chen, Q.; Peng, M.; Wang, X.; Shen, G.; He, L. Analysis of insecticide resistance-related genes
of the carmine spider mite Tetranychus cinnabarinus based on a de novo assembled transcriptome. PLoS ONE 2014, 9, e94779.[CrossRef]
109. Lu, F.; Liang, X.; Lu, H.; Li, Q.; Chen, Q.; Zhang, P.; Li, K.; Liu, G.; Yan, W.; Song, J.; et al. Overproduction of superoxide dismutaseand catalase confers cassava resistance to Tetranychus cinnabarinus. Sci. Rep. 2017, 7, 1–13. [CrossRef]
110. Byrne, D.H.; Bellotti, A.C.; Guerrero, J.M. The cassava mites. Trop. Pest Manag. 1983, 29, 378–394. [CrossRef]111. Qing, C.; Fuping, L.; Guixiu, H.; Kaimian, L.; Jianqiu, Y.; Zhenwen, Z. General Survey and Safety Assessment of Cassava Pests.
Chin. J. Trop. Crops 2010, 31, 819–827. [CrossRef]112. Lu, H.; Ma, Q.; Chen, Q.; Lu, F.; Xu, X. Potential geographic distribution of the cassava green mite Mononychellus tanajoa in
Hainan, China. Afr. J. Agric. Res. 2012, 7, 1206–1213. [CrossRef]113. Meena, N.K.; Rampal; Barman, D.; Medhi, R. Biology and seasonal abundance of the two spotted spider mite, Tetranychus urticae,
on orchids and rose. Phytoparasitica 2013, 41, 597–609. [CrossRef]114. Zundel, C.P.; Nagel, P.; Hanna, R.; Korner, F.; Schidegger, U. Environment and host-plant genotype effects on the seasonal
dynamics of a predatory mite on cassava in sub-humid tropical Africa. Agric. For. Entomol. 2009, 11, 321–331. [CrossRef]115. Wrigh, T.R.; Seymour, R.; Higley, L.; Campbell, J. GE 1167 Spider Mite Management in Corn and Soy Beans. Available online:
https://digitalcommons.unl.edu/cgi/viewcontent.cgi?article=2107&context=extensionhist (accessed on 31 January 2022).116. Budianto, B.H.; Pratiknyo, H. Faktor Kunci Dan Strategi Pelepasan Phytoseius Crinitus Swirski Et Schebter Dalam Pengendalian
Tetranychus Urticae Pada Tanaman Singkong (Manihot Esculenta); Universitas Jenderal Soedirman: Purwokerto, Indonesia, 2009.117. Indiati, S.W. Saleh Hama Tungau Merah Tetranychus urticae pada Tanaman Ubikayu dan Upaya Pengendaliannya. Bul. Palawija
2010, 20, 72–79.118. Indiati, S.W. Waktu tanam dan perlakuan pengendalian terhadap serangan tungau merah pada ubikayu. In Proceedings of the
Prosiding Seminar Hasil Penelitian Tanaman Aneka Kacang dan Umbi, Malang, Indonesia, 23 May 2013; pp. 547–554.119. Ministry of Agriculture Perkembangan Neraca Bahan Makanan. Available online: https://aplikasi2.pertanian.go.id/konsumsi/
tampil_nbm.php (accessed on 5 January 2022).120. Simatupang, P.; Timmer, C.P. Indonesian rice production: Policies and realities. Bull. Indones. Econ. Stud. 2008, 44, 65–80.
[CrossRef]121. Agus, F.; Andrade, J.F.; Rattalino Edreira, J.I.; Deng, N.; Purwantomo, D.K.G.; Agustiani, N.; Aristya, V.E.; Batubara, S.F.;
Herniwati; Hosang, E.Y.; et al. Yield gaps in intensive rice-maize cropping sequences in the humid tropics of Indonesia. FieldCrops Res. 2019, 237, 12–22. [CrossRef]
122. Husein Sawit, M. Analysis of Rice Milling 2012 Census Results. Pangan 2014, 23, 208–219. [CrossRef]123. Mullik, M.; Basuki, T.; deRosari, B.; Indra, M.W.; Paulus, C.A. Laporan Hasil Studi Kalayakan Pendirian Pabrik Pakan di NTT Buku I;
Dinas Pertanian Provinsi Nusa Tenggara Timur: Kupang, Indonesia, 2020.124. Dinas Pertanian Provinsi Nusa Tenggara Timur. Data ATAP Dinas Pertanian NTT; Dinas Pertanian Provinsi Nusa Tenggara Timur:
Kupang, Indonesia, 2021.125. Rusono, N. Improvement of Rice Food Data forQuality Food Development Planning. Indones. J. Dev. Plan. 2019, 3, 253–265.
[CrossRef]126. Khalili, N.; Arshad, M.; Kächele, H.; Farajzadeh, Z.; Müller, K. Drought shocks and farm household consumption behaviour:
Insights from Fars province of Iran. Int. J. Disaster Risk Reduct. 2021, 66, 102625. [CrossRef]127. Arief, R.W.; Novitasari, E.; Asnawi, R. Food Diversification of Cassava as Non-Rice Based Functional Food in Lampung. Planta
Trop. J. Agrosains (J. Agro Sci.) 2018, 6, 62–69.128. Ariani, M. Pergeseran Konsumsi Pangan Lokal, Suatu Keprihatinan (Shifting Consumption of Local Foods, a Matter of Concern).
In Pangan Lokal: Budaya, Potensi dan Prospek Pengembangan (Local Food: Culture, Potential and Development Prospects); IAARD Press:Jakarta, Indonesia, 2016.
129. Anwar, K. Berdayakan Kembali Pangan Lokal (Re-empowering Local Foods). Kompas, 31 December 2018; 12.130. Zhang, H.; Xu, F.; Wu, Y.; Hu, H.; Dai, X. Progress of potato staple food research and industry development in China. J. Integr.
Agric. 2017, 16, 2924–2932. [CrossRef]
Sustainability 2022, 14, 5439 22 of 22
131. Hufnagel, J.; Reckling, M.; Ewert, F. Diverse approaches to crop diversification in agricultural research. A review. Agron. Sustain.Dev. 2020, 40, 14. [CrossRef]
132. Tuti Ermawati, J.S. Determinants of Food Consumption Behaviour in Yogyakarta (DIY) and Nusa Tenggara Timur (NTT). J. Ekon.Dan Pembang. 2017, 25, 69–87. [CrossRef]
133. Ngongo, Y.; Markus, J.E.R. Agricultural Innovations and Adaptation Strategies among Upland Communities in the StateBoundaries of Kupang District (Indonesia) and Oecusse Enclave (East Timor). Int. J. Trop. Drylands 2020, 4, 51–57. [CrossRef]