
The role of tags and image aesthetics in social image search
8
The Role of Tags and Image Aesthetics in Social Image Search Pere Obrador Xavier Anguera Rodrigo de Oliveira Nuria Oliver Telefonica Research Telefonica Research Telefonica Research Telefonica Research Via Augusta 177 Via Augusta 177 Via Augusta 177 Via Augusta 177 Barcelona, 08021, Spain Barcelona, 08021, Spain Barcelona, 08021, Spain Barcelona, 08021, Spain +34 93 3653349 +34 93 3653203 +34 93 3653366 +34 93 3653041 [email protected] [email protected] [email protected] [email protected] ABSTRACT In recent years, there has been a proliferation of consumer digital photographs taken and stored in both personal and online repositories. As the amount of user-generated digital photos increases, there is a growing need for efficient ways to search for relevant images to be shared with friends and family. Text-query based search approaches rely heavily on the similarity between the input textual query and the tags added by users to the digital content. Unfortunately, text-query based search results might include a large number of relevant photos, all of them containing very similar tags, but with varying levels of image quality and aesthetic appeal. In this paper we introduce an image re-ranking algorithm that takes into account the aesthetic appeal of the images retrieved by a consumer image sharing site search engine (Google’s Picasa Web Album). In order to do so, we extend a state-of-the-art image aesthetic appeal algorithm by incorporating a set of features aimed at consumer photographs. The results of a controlled user study with 37 participants reveal that image aesthetics play a varying role on the selected images depending on the query type and on the user preferences. Categories and Subject Descriptors H.3.1 [Information Storage and Retrieval]: Content Analysis and Indexing—Indexing methods; I.4.9 [Image Processing and Computer Vision]: Applications; H.1.2 [Human/Machine Systems]: Human factors. General Terms Algorithms, Human Factors. Keywords Consumer Image Search, Re-ranking of Search Results, Image Aesthetics. 1. INTRODUCTION AND RELATED WORK In recent years, there has been a proliferation of consumer digital photographs taken and stored in personal and online repositories. The most popular social multimedia sites (e.g. Flickr, Picasa Web Album [18], Facebook, etc.) already have billions of images in their databases [12]. Capturing and storing digital photos is cheap and easy. Therefore, users tend to keep most of the pictures taken. As the amount of user-generated digital media content increases, there is a growing need for tools to search for not only relevant but also aesthetically appealing content to be shared with friends and family [22]. Text query-based image search approaches (from now on referred to as query-based search) rely heavily on the similarity between the input textual query and the textual metadata (tags, comments or other related text) added to the images by users. This approach has been somewhat successful in image sharing sites where tags, comments and ratings are typically added on an image-by-image basis by large numbers of users (e.g. Flickr), or the image relevance is inferred from its surrounding text (e.g. Google Image search). However, image search in consumer shared social repositories is still a challenging task: users do not typically label each image individually, but tend to annotate their pictures in “batch” or “bulk” mode [14], assigning the same tags to groups of images that belong to the same event or photographic session. Moreover, the tags may not necessarily describe the content of the images [11]. In order to solve the relevance problem, image search re-ranking methods have been proposed in the literature. Most of the prior work in this area assumes –through image analysis– that there is one dominant cluster of images within each image set returned by a keyword query, and treats images inside this cluster as the desired ones [5][6][8]. In the area of consumer images, [12] presents a re-ranking method for Flickr images, that fuses tag relevance with location annotation information and visual cues, producing a ranked list of clusters representing different views of a certain location. In this paper we complement the work in [12] by proposing and evaluating the fusion of tag relevance with a visual cue: the aesthetic appeal of the image, such that images that are aesthetically more appealing would be ranked higher. Note that while Luo et al. [17] have recently proposed an image aesthetics re-ranking algorithm for Web images (queried from the MSN Live Search), we tackle the problem of social consumer image search on images queried from Picasa Web Album and propose a fusion method integrating query relevance and image aesthetics. Permission to make digital or hard copies of all or part of this work for personal or classroom use is granted without fee provided that copies are not made or distributed for profit or commercial advantage and that copies bear this notice and the full citation on the first page. To copy otherwise, or republish, to post on servers or to redistribute to lists, requires prior specific permission and/or a fee. WSM’09, October 23, 2009, Beijing, China. Copyright 2009 ACM 978-1-60558-759-2/09/10...$10.00. 65
-
Upload
independent -
Category
Documents
-
view
3 -
download
0
Transcript of The role of tags and image aesthetics in social image search
The Role of Tags and Image Aesthetics in Social Image Search
Pere Obrador Xavier Anguera Rodrigo de Oliveira Nuria Oliver Telefonica Research Telefonica Research Telefonica Research Telefonica Research Via Augusta 177 Via Augusta 177 Via Augusta 177 Via Augusta 177 Barcelona, 08021, Spain Barcelona, 08021, Spain Barcelona, 08021, Spain Barcelona, 08021, Spain +34 93 3653349 +34 93 3653203 +34 93 3653366 +34 93 3653041
[email protected] [email protected] [email protected] [email protected]
ABSTRACTIn recent years, there has been a proliferation of consumer digital photographs taken and stored in both personal and online repositories. As the amount of user-generated digital photos increases, there is a growing need for efficient ways to search for relevant images to be shared with friends and family. Text-query based search approaches rely heavily on the similarity between the input textual query and the tags added by users to the digital content. Unfortunately, text-query based search results might include a large number of relevant photos, all of them containing very similar tags, but with varying levels of image quality and aesthetic appeal. In this paper we introduce an image re-ranking algorithm that takes into account the aesthetic appeal of the images retrieved by a consumer image sharing site search engine (Google’s Picasa Web Album). In order to do so, we extend a state-of-the-art image aesthetic appeal algorithm by incorporating a set of features aimed at consumer photographs. The results of a controlled user study with 37 participants reveal that image aesthetics play a varying role on the selected images depending on the query type and on the user preferences.
Categories and Subject DescriptorsH.3.1 [Information Storage and Retrieval]: Content Analysis and Indexing—Indexing methods; I.4.9 [Image Processing and Computer Vision]: Applications; H.1.2 [Human/Machine Systems]: Human factors.
General TermsAlgorithms, Human Factors.
KeywordsConsumer Image Search, Re-ranking of Search Results, Image Aesthetics.
1. INTRODUCTION AND RELATED WORKIn recent years, there has been a proliferation of consumer digital photographs taken and stored in personal and online repositories.
The most popular social multimedia sites (e.g. Flickr, Picasa Web Album [18], Facebook, etc.) already have billions of images in their databases [12]. Capturing and storing digital photos is cheap and easy. Therefore, users tend to keep most of the pictures taken. As the amount of user-generated digital media content increases, there is a growing need for tools to search for not only relevant but also aesthetically appealing content to be shared with friends and family [22].
Text query-based image search approaches (from now on referred to as query-based search) rely heavily on the similarity between the input textual query and the textual metadata (tags, comments or other related text) added to the images by users. This approach has been somewhat successful in image sharing sites where tags, comments and ratings are typically added on an image-by-image basis by large numbers of users (e.g. Flickr), or the image relevance is inferred from its surrounding text (e.g. Google Image search). However, image search in consumer shared social repositories is still a challenging task: users do not typically label each image individually, but tend to annotate their pictures in “batch” or “bulk” mode [14], assigning the same tags to groups of images that belong to the same event or photographic session. Moreover, the tags may not necessarily describe the content of the images [11].
In order to solve the relevance problem, image search re-ranking methods have been proposed in the literature. Most of the prior work in this area assumes –through image analysis– that there is one dominant cluster of images within each image set returned by a keyword query, and treats images inside this cluster as the desired ones [5][6][8]. In the area of consumer images, [12] presents a re-ranking method for Flickr images, that fuses tag relevance with location annotation information and visual cues, producing a ranked list of clusters representing different views of a certain location. In this paper we complement the work in [12] by proposing and evaluating the fusion of tag relevance with a visual cue: the aesthetic appeal of the image, such that images that are aesthetically more appealing would be ranked higher. Note that while Luo et al. [17] have recently proposed an image aesthetics re-ranking algorithm for Web images (queried from the MSN Live Search), we tackle the problem of social consumer image search on images queried from Picasa Web Album and propose a fusion method integrating query relevance and image aesthetics.
Permission to make digital or hard copies of all or part of this work for personal or classroom use is granted without fee provided that copies are not made or distributed for profit or commercial advantage and that copies bear this notice and the full citation on the first page. To copy otherwise, or republish, to post on servers or to redistribute to lists, requires prior specific permission and/or a fee. WSM’09, October 23, 2009, Beijing, China. Copyright 2009 ACM 978-1-60558-759-2/09/10...$10.00.
65
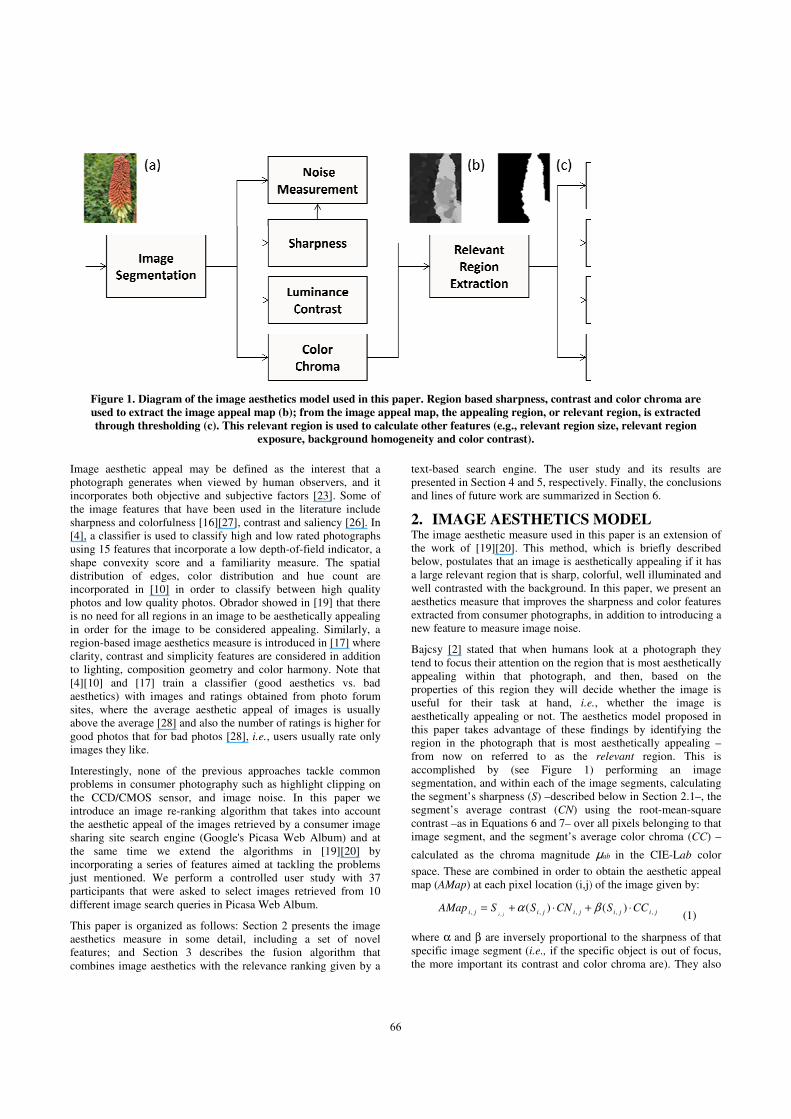
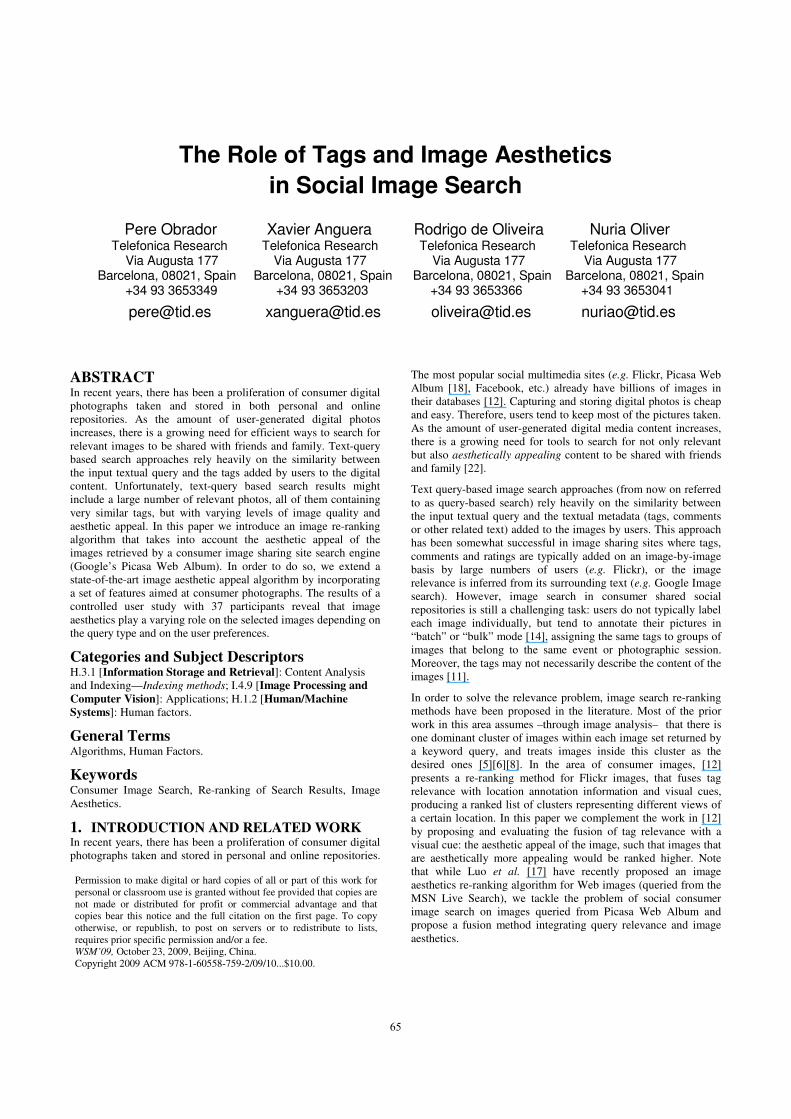
Figure 1. Diagram of the image aestheticsused to extract the image appeal map (b);through thresholding (c). This relevant r
exposur
Image aesthetic appeal may be defined as thphotograph generates when viewed by human incorporates both objective and subjective factothe image features that have been used in the sharpness and colorfulness [16][27], contrast and[4], a classifier is used to classify high and low using 15 features that incorporate a low depth-ofshape convexity score and a familiarity meadistribution of edges, color distribution andincorporated in [10] in order to classify betwphotos and low quality photos. Obrador showedis no need for all regions in an image to be aesthin order for the image to be considered appearegion-based image aesthetics measure is introduclarity, contrast and simplicity features are consto lighting, composition geometry and color ha[4][10] and [17] train a classifier (good aeaesthetics) with images and ratings obtained fsites, where the average aesthetic appeal of iabove the average [28] and also the number of ragood photos that for bad photos [28], i.e., usersimages they like.
Interestingly, none of the previous approacheproblems in consumer photography such as highthe CCD/CMOS sensor, and image noise. Iintroduce an image re-ranking algorithm that tthe aesthetic appeal of the images retrieved by asharing site search engine (Google's Picasa Wethe same time we extend the algorithms incorporating a series of features aimed at tackjust mentioned. We perform a controlled useparticipants that were asked to select images rdifferent image search queries in Picasa Web Alb
This paper is organized as follows: Section 2 paesthetics measure in some detail, includingfeatures; and Section 3 describes the fusiocombines image aesthetics with the relevance ra
s model used in this paper. Region based sharpness, contrast from the image appeal map, the appealing region, or relevaegion is used to calculate other features (e.g., relevant region
re, background homogeneity and color contrast).
he interest that a observers, and it
ors [23]. Some of literature include
d saliency [26]. In rated photographs f-field indicator, a
asure. The spatial d hue count are ween high quality d in [19] that there hetically appealing aling. Similarly, a uced in [17] where sidered in addition armony. Note that esthetics vs. bad from photo forum images is usually atings is higher for s usually rate only
s tackle common hlight clipping on In this paper we takes into account a consumer image eb Album) and at
in [19][20] by kling the problems er study with 37 retrieved from 10 bum.
presents the image g a set of novel n algorithm that anking given by a
text-based search engine. The user presented in Section 4 and 5, respectiveand lines of future work are summarize
2. IMAGE AESTHETICS The image aesthetic measure used in tthe work of [19][20]. This method, below, postulates that an image is aesta large relevant region that is sharp, cowell contrasted with the background. Iaesthetics measure that improves the sextracted from consumer photographs,new feature to measure image noise.
Bajcsy [2] stated that when humans tend to focus their attention on the regiappealing within that photograph, properties of this region they will deuseful for their task at hand, i.eaesthetically appealing or not. The aethis paper takes advantage of these fregion in the photograph that is mosfrom now on referred to as the accomplished by (see Figure 1)segmentation, and within each of the ithe segment’s sharpness (S) –describedsegment’s average contrast (CN) ucontrast –as in Equations 6 and 7– overimage segment, and the segment’s av
calculated as the chroma magnitude
space. These are combined in order tomap (AMap) at each pixel location (i,j)
jijiji CNSSAMapji ,,, )(
,+⋅+= α
where α and β are inversely proportiospecific image segment (i.e., if the spethe more important its contrast and co
and color chroma are ant region, is extracted n size, relevant region
study and its results are ely. Finally, the conclusions ed in Section 6.
MODELthis paper is an extension ofwhich is briefly described
thetically appealing if it hasolorful, well illuminated andIn this paper, we present ansharpness and color features
in addition to introducing a
look at a photograph theyion that is most aestheticallyand then, based on the
ecide whether the image is e., whether the image is esthetics model proposed infindings by identifying thest aesthetically appealing –
relevant region. This is ) performing an imageimage segments, calculatingd below in Section 2.1–, the sing the root-mean-square r all pixels belonging to thaterage color chroma (CC) –
ab in the CIE-Lab color
o obtain the aesthetic appeal) of the image given by:
jiji CCS ,, )( ⋅β (1)
onal to the sharpness of that ecific object is out of focus, olor chroma are). They also
66
(b) (b) (c) (d)
Figure 2. (a) Example of same subject with different levels of isolation from the background; (b) their appeal map; (c) appeal map thresholded at MaxAppeal/2; (d) appeal map thresholded at MaxAppeal/4. Top image taken with low depth of field and flash strobe yields homogeneous background; bottom taken with high depth of field and
available light yields less homogeneous and more distracting background.
(a) (b) (c) (d)
Figure 2. (a) Example of same subject with different levels of isolation from the background; top image taken with low depth of field and flash strobe yields homogeneous background; bottom one taken with high depth of field and available light yields less homogeneous and more
distracting background; (b) their appeal map; (c) appeal map thresholded at MaxAppeal/2; (d) appeal map
thresholded at MaxAppeal/4. Notice how the top (c) and (d) images are quite similar (i.e., homogeneous
background), while the bottom (c) and (d) images are not (i.e., less homogenous and more distracting background).
depend on how reliable the sharpness feature may be measured in that region, being inversely proportional to the amount of structure in that image segment (i.e., the less structure, the more important contrast and color chroma are). The areas of the image with a certain degree of structure are detected by an image matting algorithm so that sharpness can be accurately measured on them.
One important feature in assessing the aesthetic appeal of an image is the isolation of the relevant region from background distractions (corroborated by [17]); examples of this can be found in low depth of field photography, or portraits with a flat background, where observers can easily focus their attention on the relevant region. This background homogeneity feature is calculated as the difference between the outcome of thresholding AMap, at two different levels (see Figure 2 for an example, where the top image has a relevant region well isolated from its background, as opposed to the bottom image).
The relevant region is finally calculated by thresholding AMap to one half of its maximum value. Key features in the proposed aesthetic model are: (1) The average of AMap on the relevant region; (2) the relevant region size in order to account for good composition, such that smaller relevant regions are penalized; and (3) the average luminance and its standard deviation within the relevant region, penalizing poorly lit images.
The Color features have been modified from [20] by calculating color chroma (CC) within each region, as described above, instead of colorfulness. Note that colorfulness takes into account color contrast, which does not make sense within a specific image segment. Color contrast (CCN) is, instead, computed on the entire relevant region (
relevantRCCN ) and on the whole image
(CCNoverall). It is calculated in CIE-Lab color space as the length of the standard deviation of the a and b coordinates:
22baiCCN σσ += (2)
The final color contrast measure is given by:
),max( overallrelevantR CCNCCNCCN = (3)
accounting in this way for both a colorful relevant region and a colorful background.
As described in Section 2.3, the overall aesthetic measure is composed of a main term, and a set of penalty and reward factors, where each of these factors either increase or decrease the overall aesthetic measure of the photograph. Accordingly, a Color Contrast reward Factor (CCNF) is defined as:
⎪⎩
⎪⎨
⎧
≥
<≤−⋅
<
=
26,4.1
2614,53.01000
3314,1
CCNfor
CCNforCCN
CCNfor
CCNF
(4)
after training this measure on 200 images with varying degree of color content.
Unfortunately, the features described above do not take into account important artifacts which are common in consumer photography, such as sensor highlight saturation a.k.a. clipping,
and high image noise (often found in camera-phone images, which are very popular in social sharing sites).
We describe next the features that we designed to tackle the previously mentioned artifacts. Finally, we present the aesthetic measure that incorporates these new features.
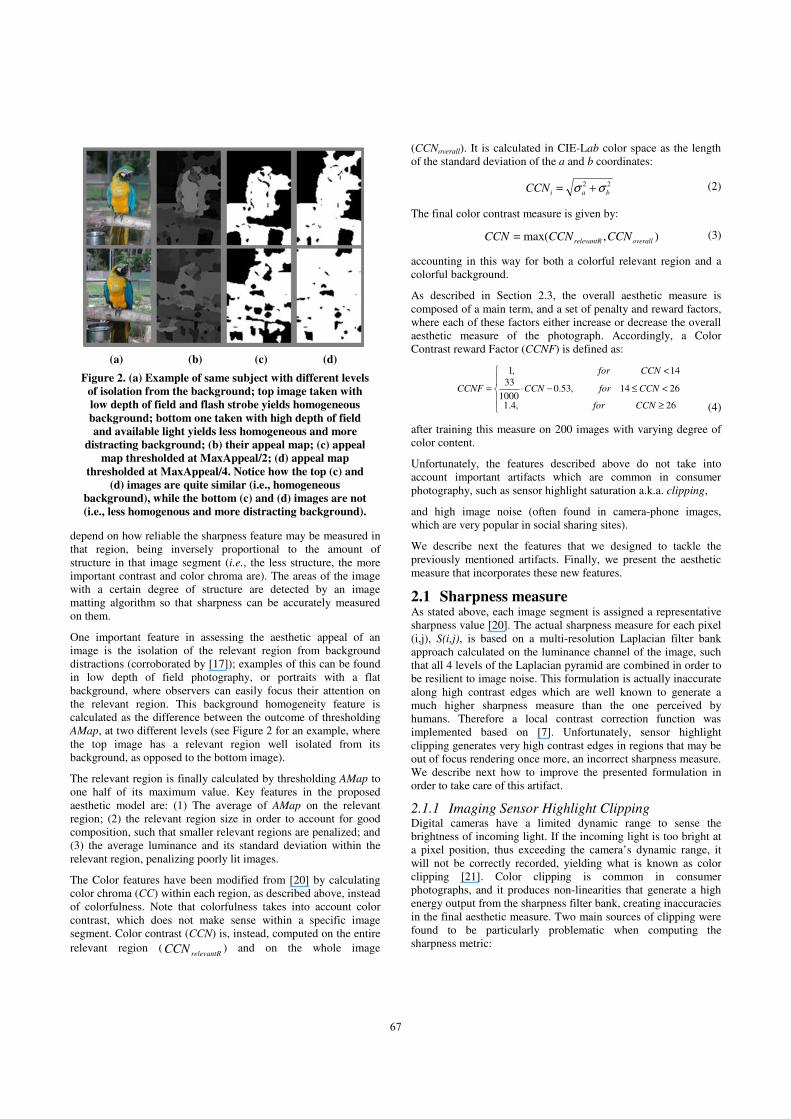
2.1 Sharpness measure As stated above, each image segment is assigned a representative sharpness value [20]. The actual sharpness measure for each pixel (i,j), S(i,j), is based on a multi-resolution Laplacian filter bank approach calculated on the luminance channel of the image, such that all 4 levels of the Laplacian pyramid are combined in order to be resilient to image noise. This formulation is actually inaccurate along high contrast edges which are well known to generate a much higher sharpness measure than the one perceived by humans. Therefore a local contrast correction function was implemented based on [7]. Unfortunately, sensor highlight clipping generates very high contrast edges in regions that may be out of focus rendering once more, an incorrect sharpness measure. We describe next how to improve the presented formulation in order to take care of this artifact.
2.1.1 Imaging Sensor Highlight Clipping Digital cameras have a limited dynamic range to sense the brightness of incoming light. If the incoming light is too bright at a pixel position, thus exceeding the camera’s dynamic range, it will not be correctly recorded, yielding what is known as color clipping [21]. Color clipping is common in consumerphotographs, and it produces non-linearities that generate a high energy output from the sharpness filter bank, creating inaccuracies in the final aesthetic measure. Two main sources of clipping were found to be particularly problematic when computing the sharpness metric:
67
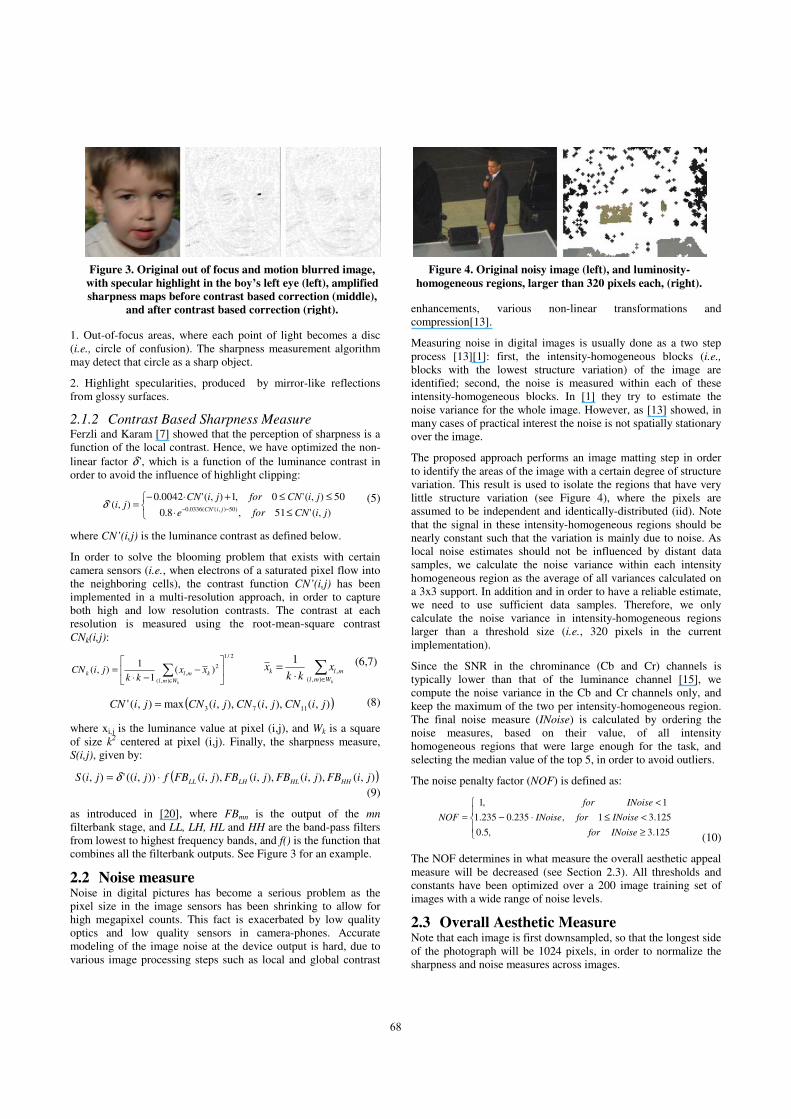
Figure 4. Original noisy image (left), and luminosity-homogeneous regions, larger than 320 pixels each, (right).
Figure 3. Original out of focus and motion blurred image, with specular highlight in the boy’s left eye (left), amplified sharpness maps before contrast based correction (middle),
and after contrast based correction (right).
1. Out-of-focus areas, where each point of light becomes a disc (i.e., circle of confusion). The sharpness measurement algorithm may detect that circle as a sharp object.
2. Highlight specularities, produced by mirror-like reflections from glossy surfaces.
2.1.2 Contrast Based Sharpness Measure Ferzli and Karam [7] showed that the perception of sharpness is a function of the local contrast. Hence, we have optimized the non-linear factor δ’, which is a function of the luminance contrast in order to avoid the influence of highlight clipping:
⎩⎨⎧
≤⋅
≤≤+⋅−=
−− ),('51,8.0
50),('0,1),('0042.0),(' )50),('(0336.0 jiCNfore
jiCNforjiCNji jiCNδ
(5)
where CN’(i,j) is the luminance contrast as defined below.
In order to solve the blooming problem that exists with certain camera sensors (i.e., when electrons of a saturated pixel flow into the neighboring cells), the contrast function CN’(i,j) has been implemented in a multi-resolution approach, in order to capture both high and low resolution contrasts. The contrast at each resolution is measured using the root-mean-square contrast CNk(i,j):
2/1
),(
2, )(
11
),( ⎥⎦
⎤⎢⎣
⎡−
−⋅= ∑
∈ kWmlkmlk xx
kkjiCN
∑∈⋅
=kWml
mlk xkk
x),(
,
1 (6,7)
( )),(),,(),,(max),(' 1173 jiCNjiCNjiCNjiCN = (8)
where xi,j is the luminance value at pixel (i,j), and Wk is a square of size k2 centered at pixel (i,j). Finally, the sharpness measure, S(i,j), given by:
( )),(),,(),,(),,()),(('),( jiFBjiFBjiFBjiFBfjijiS HHHLLHLL⋅= δ
(9)
as introduced in [20], where FBmn is the output of the mnfilterbank stage, and LL, LH, HL and HH are the band-pass filters from lowest to highest frequency bands, and f() is the function that combines all the filterbank outputs. See Figure 3 for an example.
2.2 Noise measure Noise in digital pictures has become a serious problem as the pixel size in the image sensors has been shrinking to allow for high megapixel counts. This fact is exacerbated by low quality optics and low quality sensors in camera-phones. Accurate modeling of the image noise at the device output is hard, due to various image processing steps such as local and global contrast
enhancements, various non-linear transformations and compression[13].
Measuring noise in digital images is usually done as a two step process [13][1]: first, the intensity-homogeneous blocks (i.e.,blocks with the lowest structure variation) of the image are identified; second, the noise is measured within each of these intensity-homogeneous blocks. In [1] they try to estimate the noise variance for the whole image. However, as [13] showed, in many cases of practical interest the noise is not spatially stationary over the image.
The proposed approach performs an image matting step in order to identify the areas of the image with a certain degree of structure variation. This result is used to isolate the regions that have very little structure variation (see Figure 4), where the pixels are assumed to be independent and identically-distributed (iid). Note that the signal in these intensity-homogeneous regions should be nearly constant such that the variation is mainly due to noise. As local noise estimates should not be influenced by distant data samples, we calculate the noise variance within each intensity homogeneous region as the average of all variances calculated on a 3x3 support. In addition and in order to have a reliable estimate, we need to use sufficient data samples. Therefore, we only calculate the noise variance in intensity-homogeneous regions larger than a threshold size (i.e., 320 pixels in the current implementation).
Since the SNR in the chrominance (Cb and Cr) channels is typically lower than that of the luminance channel [15], we compute the noise variance in the Cb and Cr channels only, and keep the maximum of the two per intensity-homogeneous region. The final noise measure (INoise) is calculated by ordering the noise measures, based on their value, of all intensity homogeneous regions that were large enough for the task, and selecting the median value of the top 5, in order to avoid outliers.
The noise penalty factor (NOF) is defined as:
⎪⎩
⎪⎨
⎧
≥
<≤⋅−
<
=
125.3,5.0
125.31,235.0235.1
1,1
INoisefor
INoiseforINoise
INoisefor
NOF
(10)
The NOF determines in what measure the overall aesthetic appeal measure will be decreased (see Section 2.3). All thresholds and constants have been optimized over a 200 image training set of images with a wide range of noise levels.
2.3 Overall Aesthetic Measure Note that each image is first downsampled, so that the longest side of the photograph will be 1024 pixels, in order to normalize the sharpness and noise measures across images.
68
The final Image Aesthetic Appeal measure is defined as:
NOFCCNFHESZAMapN
AMN
regionrelevantinji
ji ⋅⋅⋅⋅⋅
⎥⎥⎥
⎦
⎤
⎢⎢⎢
⎣
⎡= ∑
,,
1
(11)
where the main contribution to the measure is the first term, i.e., the average of the appeal map over the appealing region. This factor is modified by penalty and reward factors [20], where SZ is the size of relevant region factor, E and NOF are the exposure and noise factors, H is the background homogeneity factor, and CCNF is the color contrast factor. Note that SZ, E and NOF are penalty factors, i.e., SZ <1 if size of relevant region is below a threshold,E<1 if relevant region is badly exposed (either overexposed or underexposed), NOF<1 if noise is visible in image; conversely H and CCNF are reward factors, i.e., H>1 if background is homogeneous and CCNF>1 if the relevant region or the overall image present high color contrast. Note that all factors have a Max and a Min cap (see Equations 4 and 10 for examples).
3. SCORE AGGREGATION FUNCTION Given an input query k, we propose the combination of two rankings or scores by using an aggregation function [24]: relevance (Rk), provided by a standard text query-based search engine, where it corresponds to the retrieval position of a specific image (i.e., 1 for the top retrieved result, 2 for the next, etc.); and aesthetic appeal, provided by the previously described algorithm (Ak). These two measures are normalized into Rnormk() and Anormk().
We define an aggregation function, FAk(n)=f(Anormk(n), Rnormk(n)) that re-scores each item n by taking into account both the aesthetics and text-based scores. Desired properties of the aggregation function include: (a) images with highly relevant tags to the input query should receive a high score after the aggregation; (b) highly aesthetically appealing images should receive a high score after the aggregation; (c) images that are both highly relevant and aesthetically appealing should receive a higher score after the aggregation than in the 2 previous cases; and (d) the weights given to relevance and aesthetics in the final ranking would be user and task dependent. As a first approximation, we propose a simple aggregation function:
������ � ��� ��, ��� ��� � ����� ���� � �1 � ����� �������
(12)
where the optimal settings α of and m depend on the user, the particular image collection and the task at hand. In the
experimental results presented in this paper, we use =½, i.e., aesthetics are as important as relevance. Dynamic optimization of this parameter is left for future research. In preliminary experiments, we implemented and validated three different aggregation functions, corresponding to m=1, m=2 and m=3. After experimentation, it was found that the best combination of relevance and aesthetics was accomplished with m=2, which would strike a balance between images that are either relevant or aesthetically appealing, and images that are both relevant and aesthetically appealing.
4. USER STUDY A user study was conducted in order to answer the following research questions:
R1: Are users influenced by image aesthetics when searching for images in the context of shared consumer photographs?
R2: What are the factors that play a role in determining the importance of image aesthetics in consumer image search tasks?
We performed our user test on images queried from a popular consumer image sharing site: Picasa Web Album [18].
We carried out a controlled study with 37 volunteers (27 male) whose ages ranged from 23 to 49 years old (mean 30.6 years). Seven participants (19%) had one or more children. They were all computer literate and held a variety of occupations, including researchers, administrative assistants, engineers, accountants, infrastructure specialists, students, financers, people managers, front desk clerks and human resources specialists, from a diverse set of nationalities. All participants filled out an online demographic pre-study questionnaire that included questions about their digital picture taking and image search habits and expertise. Participants were audio recorded during their experiments.
Participants were shown the results of ten image search queries (see Table 1) : nine that had been generated with popular tags and one personal query that they had previously selected. The participants were presented with the top 15 results of executing the ten queries, one at a time. They were asked to inspect each image at full screen resolution, and then select the best 3 photos of the result list in response to each query; they also entered the reasons for those selections in a text box. Without their knowledge, the 15 images belonged to three different rankings (treatments): (a) the original relevance ranking provided by Picasa Web Album (Picasa); (b) the image aesthetics-based ranking (Aesthetics); and (c) the ranking resulting from applying the aggregation function (Fusion). The top five images from each treatment were presented to the user at the same time in a randomized manner, which means there was a chance to have collisions, i.e., images that appear in the top five of more than one treatment. In the case of a collision, the image was only shown once, and if selected the performance measures would take that into account (see below). Three performance measures were used for the evaluation:
Treatment winner (TM): It quantifies the number of times that the selected photos came from each of the 3 treatments, as given by Equation 13, with ∑ ��� � 1, where i is the treatment under consideration. In order to take into account collisions between treatments, a second term is added to the right of the equation, such that when there is a collision, the reward is equally split between the treatments that generated that collision. For example, if one of the selected images appeared in the top 5 of both the Picasa and Aesthetic rankings, i.e., collisions(j)=1, their corresponding TM measure would be halved.
��� � ∑ � �!�"#$%&'&(!&)�*�+ · -
(�''�$���$�*�.-*/� �!�$ ��1 &#!�&�! �
(13)
where PhotoWasSelected(j) returns 1 if photo was selected by the participant, and 0 otherwise; and collisions(j) is 0 if image appeared only in this treatment, 1 if it appeared in this treatment and another one, and 2 if it appeared in all treatments.
Re-ranking performance (RM): It quantifies how well each treatment ranked the images that were selected by the user. For instance, one of the selected images might have been ranked in
69
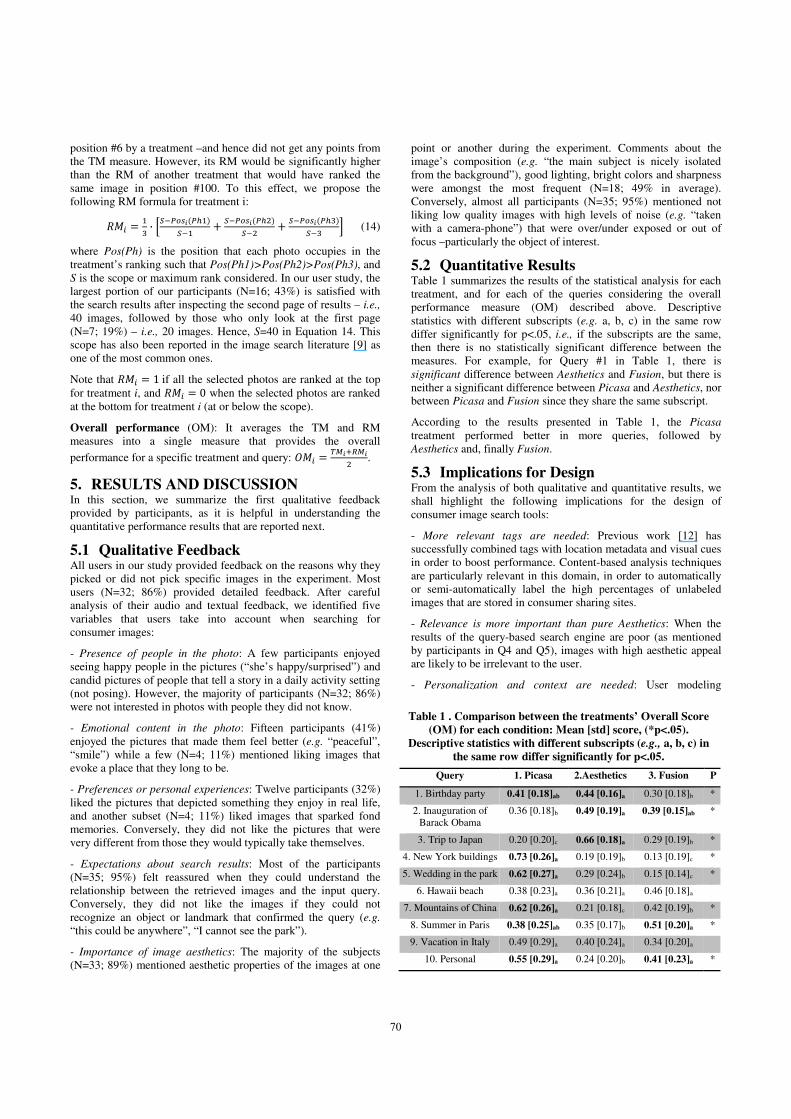
Table 1 . Comparison between the treatments’ Overall Score (OM) for each condition: Mean [std] score, (*p<.05).
Descriptive statistics with different subscripts (e.g., a, b, c) in the same row differ significantly for p<.05.
Query 1. Picasa 2.Aesthetics 3. Fusion P
1. Birthday party 0.41 [0.18]ab 0.44 [0.16]a 0.30 [0.18]b *
2. Inauguration of Barack Obama
0.36 [0.18]b 0.49 [0.19]a 0.39 [0.15]ab *
3. Trip to Japan 0.20 [0.20]c 0.66 [0.18]a 0.29 [0.19]b *
4. New York buildings 0.73 [0.26]a 0.19 [0.19]b 0.13 [0.19]c *
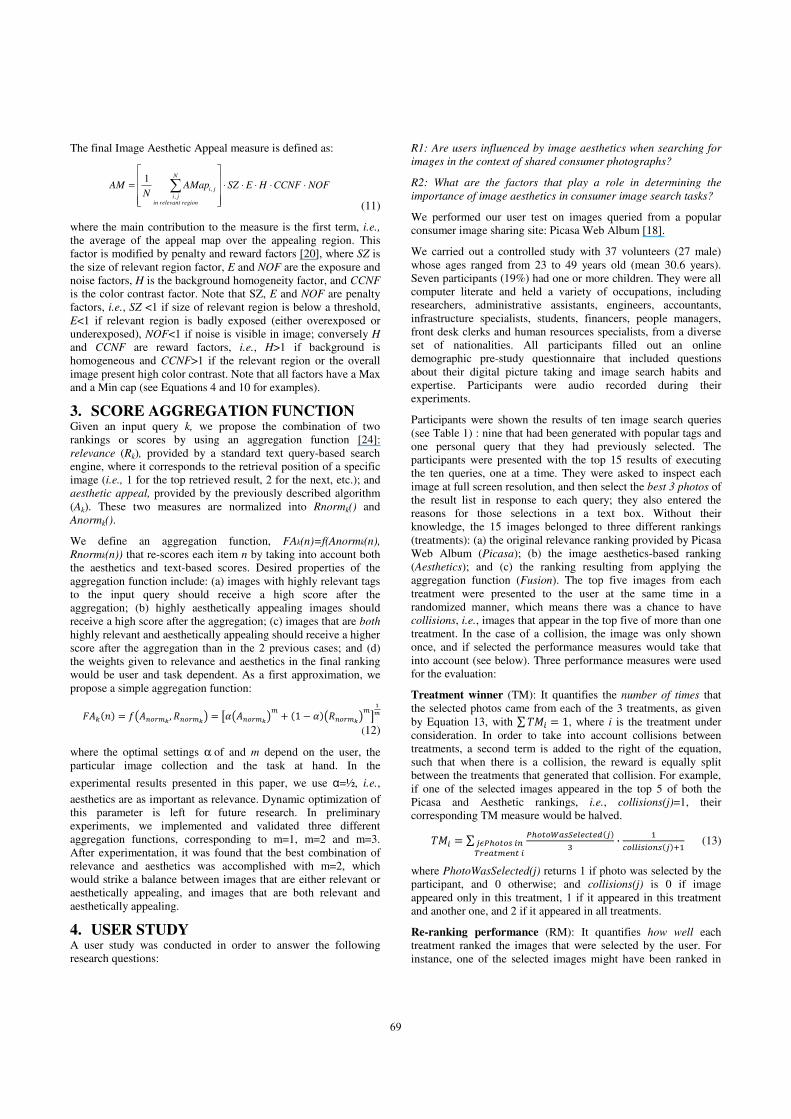
5. Wedding in the park 0.62 [0.27]a 0.29 [0.24]b 0.15 [0.14]c *
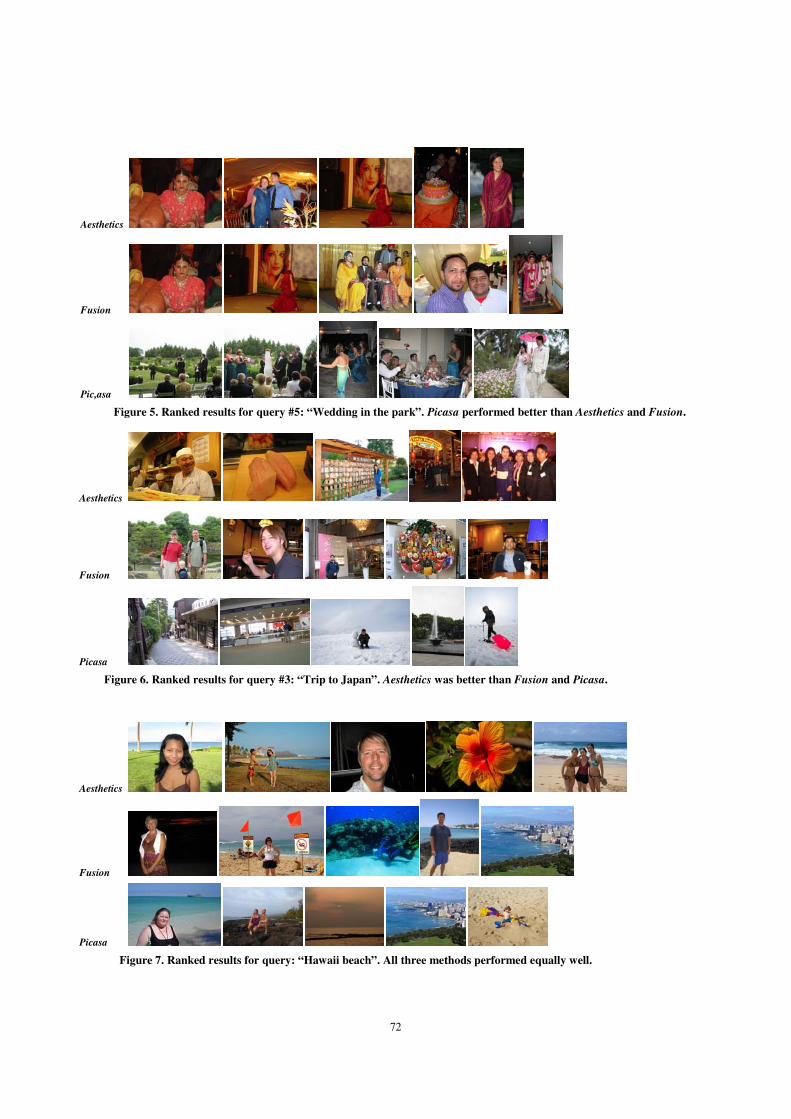
6. Hawaii beach 0.38 [0.23]a 0.36 [0.21]a 0.46 [0.18]a
7. Mountains of China 0.62 [0.26]a 0.21 [0.18]c 0.42 [0.19]b *
8. Summer in Paris 0.38 [0.25]ab 0.35 [0.17]b 0.51 [0.20]a *
9. Vacation in Italy 0.49 [0.29]a 0.40 [0.24]a 0.34 [0.20]a
10. Personal 0.55 [0.29]a 0.24 [0.20]b 0.41 [0.23]a *
position #6 by a treatment –and hence did not get any points from the TM measure. However, its RM would be significantly higher than the RM of another treatment that would have ranked the same image in position #100. To this effect, we propose the following RM formula for treatment i:
��� � -+ · 2%3��$4�� -�
%3- � %3��$4�� 5�%35 � %3��$4�� +�
%3+ 6 (14)
where Pos(Ph) is the position that each photo occupies in the treatment’s ranking such that Pos(Ph1)>Pos(Ph2)>Pos(Ph3), and S is the scope or maximum rank considered. In our user study, the largest portion of our participants (N=16; 43%) is satisfied with the search results after inspecting the second page of results – i.e., 40 images, followed by those who only look at the first page (N=7; 19%) – i.e., 20 images. Hence, S=40 in Equation 14. This scope has also been reported in the image search literature [9] as one of the most common ones.
Note that ��� � 1 if all the selected photos are ranked at the top for treatment i, and ��� � 0 when the selected photos are ranked at the bottom for treatment i (at or below the scope).
Overall performance (OM): It averages the TM and RM measures into a single measure that provides the overall
performance for a specific treatment and query: 8�� � 194.:945 .
5. RESULTS AND DISCUSSION In this section, we summarize the first qualitative feedback provided by participants, as it is helpful in understanding the quantitative performance results that are reported next.
5.1 Qualitative Feedback All users in our study provided feedback on the reasons why they picked or did not pick specific images in the experiment. Most users (N=32; 86%) provided detailed feedback. After careful analysis of their audio and textual feedback, we identified five variables that users take into account when searching for consumer images:
- Presence of people in the photo: A few participants enjoyed seeing happy people in the pictures (“she’s happy/surprised”) and candid pictures of people that tell a story in a daily activity setting (not posing). However, the majority of participants (N=32; 86%) were not interested in photos with people they did not know.
- Emotional content in the photo: Fifteen participants (41%) enjoyed the pictures that made them feel better (e.g. “peaceful”, “smile”) while a few (N=4; 11%) mentioned liking images that evoke a place that they long to be.
- Preferences or personal experiences: Twelve participants (32%) liked the pictures that depicted something they enjoy in real life, and another subset (N=4; 11%) liked images that sparked fond memories. Conversely, they did not like the pictures that were very different from those they would typically take themselves.
- Expectations about search results: Most of the participants (N=35; 95%) felt reassured when they could understand the relationship between the retrieved images and the input query. Conversely, they did not like the images if they could not recognize an object or landmark that confirmed the query (e.g.“this could be anywhere”, “I cannot see the park”).
- Importance of image aesthetics: The majority of the subjects (N=33; 89%) mentioned aesthetic properties of the images at one
point or another during the experiment. Comments about the image’s composition (e.g. “the main subject is nicely isolated from the background”), good lighting, bright colors and sharpness were amongst the most frequent (N=18; 49% in average). Conversely, almost all participants (N=35; 95%) mentioned not liking low quality images with high levels of noise (e.g. “taken with a camera-phone”) that were over/under exposed or out of focus –particularly the object of interest.
5.2 Quantitative Results Table 1 summarizes the results of the statistical analysis for each treatment, and for each of the queries considering the overall performance measure (OM) described above. Descriptive statistics with different subscripts (e.g. a, b, c) in the same row differ significantly for p<.05, i.e., if the subscripts are the same, then there is no statistically significant difference between the measures. For example, for Query #1 in Table 1, there is significant difference between Aesthetics and Fusion, but there is neither a significant difference between Picasa and Aesthetics, nor between Picasa and Fusion since they share the same subscript.
According to the results presented in Table 1, the Picasatreatment performed better in more queries, followed by Aesthetics and, finally Fusion.
5.3 Implications for Design From the analysis of both qualitative and quantitative results, we shall highlight the following implications for the design of consumer image search tools:
- More relevant tags are needed: Previous work [12] has successfully combined tags with location metadata and visual cues in order to boost performance. Content-based analysis techniques are particularly relevant in this domain, in order to automatically or semi-automatically label the high percentages of unlabeled images that are stored in consumer sharing sites.
- Relevance is more important than pure Aesthetics: When the results of the query-based search engine are poor (as mentioned by participants in Q4 and Q5), images with high aesthetic appeal are likely to be irrelevant to the user.
- Personalization and context are needed: User modeling
70

techniques would greatly help in understanding to which degree aesthetics is important for each user.
- Image aesthetic measures are not universal: Different types of topics have completely different aesthetic connotations, i.e.,buildings vs. weddings. Therefore, we believe that a general image aesthetics measure is unable to represent all parameters that might play a role in defining the aesthetic appeal of an image. Hence, we are working on a user and category-dependent aesthetic measure. The work presented here represents a first step in the characterization of image aesthetics.
- Fusion is not straight-forward: The proposed fusion algorithm performed poorly when compared to the Picasa treatment. However, our experiments suggest that Fusion may be appropriate in the cases of queries that produce highly relevant results – Fusion actually performed better than the other two treatments for RM (Re-ranking performance, see Section 4) in 2 of the queries.
- Sensitivity to the Presence of People: Finally, participants in our study vastly preferred images without unknown people. An exception is the case of travel-related queries to exotic countries, where participants preferred images that showed native people of the countries related to the queries. In the case of running the experiment on the personal collections of the participants, we would expect users to be more interested in photographs with familiar (e.g. friends) people in them [23].
Figures 5 through 7 show actual image examples for three of the queries, where images have been ranked left (highest ranked image with this treatment) to right (lowest ranked image with this treatment), for each of the treatments.
6. CONCLUSIONS AND FUTURE WORK In this paper we have introduced an image re-ranking algorithm that takes into account the aesthetic appeal of the images retrieved by a consumer image sharing site search engine (Picasa Web Album). We have also extended a state of the art image aesthetic appeal algorithm by incorporating a series of features aimed at consumer photographs. The results of a controlled user study with 37 participants have revealed that Image Aesthetic plays a varying role on image preferences depending on the query type and the user preferences. Future work includes optimizing an image aesthetic metric for specific image categories, looking into other features such as color harmony and image composition and carrying out a more comprehensive study with personal images from the participants.
7. REFERENCES [1] Amer, A., Dubois, E. and Mitiche, A. 2002. Reliable and
Fast Structure-oriented Video Noise Estimation. IEEE ICIP.
[2] Bajcsy, R. 1988. Active Perception. In Proc. of the IEEE, vol. 76, no. 8, pp. 996-1005.
[3] Choi, Y. and Rasmussen, E. M. 2002. User’s relevance criteria in image retrieval in American history. Information Processing and Management 38, 5, 695–726.
[4] Datta, R., et al. 2006. Studying aesthetics in photographic images using a computational approach. In Proc. of ECCV.
[5] Fergus, R., Perona, P., and Zisserman, A. 2004. A visual category filter for google images. In Proc. of ECCV.
[6] Fergus, R., et al. 2005. Learning object categories from google’s image search. In Proc. of ICCV.
[7] Ferzli, R. and Karam, L. J. 2006. A Human Visual System-Based Model for Blur/Sharpness Perception. 2nd Workshop on Video Processing and Quality Metrics, Scottsdale, AZ.
[8] Hsu, W. H., Kennedy, L. S., and Chang, S.-F. 2007. Novel reranking methods for visual search. IEEE Multimedia.
[9] Jing,Y. and Baluja,S., 2008. PageRank for product image search. In Proc. of WWW Conf.
[10] Ke, Y., Tang, X., and Jing, F. 2006. The design of high-level features for photo quality assessment. In Proc. of CVPR.
[11] Kennedy, L., et al. 2006. To search or to label?: predicting the performance of search-based automatic image classifiers. In Proc. of the 8th ACM Intl. workshop on Multimedia information retrieval.
[12] Kennedy, L., et al. 2007. How Flickr helps us make sense of the world: context and content in community-contributed media collections. In Proc. of ACM Multimedia.
[13] Kisilev, P., et al. 2007. Noise and signal activity maps for better imaging algorithms. Proc. of IEEE ICIP.
[14] Kuchinsky, A., et al. 1999. Fotofile: a consumer multimedia organization and retrieval system. In Proc. of SIGCHI.
[15] Lim, S. H. 2006. Characterization of noise in digital photographs for image processing. In Proc. of SPIE, vol. 6069.
[16] Luo, J., el al. 2000. On the application of bayes networks to semantic understanding of consumer photographs. In Proc. of IEEE ICIP.
[17] Luo, Y. and Tang, X. 2008. Photo and video qualityevaluation: Focusing on the subject. In ECCV, LNCS.
[18] Picasa Web Album, [online]. available:http://picasaweb.com/
[19] Obrador, P. 2008. Region Based Image Appeal Metric for Consumer Photos. In Proc of IEEE Intl. Workshop MMSP.
[20] Obrador, P. and Moroney, N. 2009. Low level features for image appeal measurement, Proc. SPIE, Vol. 7242, 72420T.
[21] Park, J. B. and Desouza, G. N. 2004. Analysis of clipping effect in color images captured by CCD cameras”, Sensors 2004 Proceedings of IEEE 24-27.
[22] Rodden, K., Wood, K.R. 2003. Searching and organizing: How do people manage their digital photographs?. In Proc. of SIGCHI.
[23] Savakis, A., Etz, S., and Loui A. 2000, Evaluation of image appeal in consumer photography, in Proc. SPIE vol. 3959.
[24] Smith, J. R. et al., 2003. Interactive search fusion methods for video database retrieval. In Proc. of IEEE ICIP.
[25] Tominaga, S. and Wandell, B.A. 2002. Natural scene-illuminant estimation using the sensor correlation. In Proc. of the IEEE, 90(1):42–56.
[26] Tong, H., et al. 2004. Classification of digital photos taken by photographers or home users. Proc. Pacific-Rim Conference on Multimedia.
[27] Winkler, S. 2001. Visual Fidelity and Perceived Quality: Towards Comprehensive Metrics, in Proc. of SPIE, vol.4299.
[28] Zhang, L., et al. 2006. Enjoyphoto—-A vertical image search engine for enjoying high-quality photos. In Proc. of ACM Multimedia.
71
Aesthetics
Fusion
Picasa
Figure 6. Ranked results for query #3: “Trip to Japan”. Aesthetics was better than Fusion and Picasa.
Aesthetics
Fusion
Pic,asa
Figure 5. Ranked results for query #5: “Wedding in the park”. Picasa performed better than Aesthetics and Fusion.
Aesthetics
Fusion
Picasa
Figure 7. Ranked results for query: “Hawaii beach”. All three methods performed equally well.
72