
The role of land cover in bioclimatic models depends on spatial resolution
9
© 2006 The Authors DOI: 10.1111/j.1466-822x.2006.00262.x 34 Journal compilation © 2006 Blackwell Publishing Ltd www.blackwellpublishing.com/geb Global Ecology and Biogeography, (Global Ecol. Biogeogr.) (2007) 16, 34–42 RESEARCH PAPER Blackwell Publishing Ltd The role of land cover in bioclimatic models depends on spatial resolution Miska Luoto*, Raimo Virkkala and Risto K. Heikkinen ABSTRACT Aim We explored the importance of climate and land cover in bird species distribution models on multiple spatial scales. In particular, we tested whether the integration of land cover data improves the performance of pure bioclimatic models. Location Finland, northern Europe. Methods The data of the bird atlas survey carried out in 1986 –89 using a 10 × 10 km uniform grid system in Finland were employed in the analyses. Land cover and climatic variables were compiled using the same grid system. The dependent and explanatory variables were resampled to 20-km, 40-km and 80-km resolutions. Generalized additive models (GAM) were constructed for each of the 88 land bird species studied in order to estimate the probability of occurrence as a function of (1) climate and (2) climate and land cover variables. Model accuracy was measured by a cross-validation approach using the area under the curve (AUC) of a receiver operating characteristic (ROC) plot. Results In general, the accuracies of the 88 bird–climate models were good at all studied resolutions. However, the inclusion of land cover increased the performance of 79 and 78 of the 88 bioclimatic models at 10-km and 20-km resolutions, respec- tively. There was no significant improvement at the 40-km resolution. In contrast to the finer resolutions, the inclusion of land cover variables decreased the model- ling accuracy at 80km resolution. Main conclusions Our results suggest that the determinants of bird species distri- butions are hierarchically structured: climatic variables are large-scale determinants, followed by land cover at finer resolutions. The majority of the land bird species in Finland are rather clearly correlated with climate, and bioclimate envelope models can provide useful tools for identifying the relationships between these species and the environment at resolutions ranging from 10 km to 80 km. However, the notable contribution of land cover to the accuracy of bioclimatic models at 10–20-km reso- lutions indicates that the integration of climate and land cover information can improve our understanding and model predictions of biogeographical patterns under global change. Keywords Bioclimatic models, bird atlas, birds, climate, distribution, Finland, land cover, modelling. *Correspondence: Miska Luoto, Finnish Environment Institute, Research Department, Research Programme for Biodiversity, P.O. Box 140, FIN-00251 Helsinki, Finland. E-mail: miska.luoto@ymparisto.fi Finnish Environment Institute, Research Department, Research Programme for Biodiversity, P.O. Box 140, FIN-00251 Helsinki, Finland INTRODUCTION Assessments of the potential effects of climate change on biodiversity and the future range shifts of species have often been based on bioclimatic envelope models (Bakkenes et al., 2002; Beaumont & Hughes, 2002; Berry et al ., 2002; Pearson & Dawson, 2003; Thuiller, 2003; Huntley et al., 2004; Thuiller et al., 2005). These modelling strategies correlate current species distributions with climate variables, and then project spatial shifts in species climatic envelopes according to the climate change scenarios (Pearson & Dawson, 2003; Thuiller, 2003, 2004).
-
Upload
independent -
Category
Documents
-
view
3 -
download
0
Transcript of The role of land cover in bioclimatic models depends on spatial resolution

© 2006 The Authors DOI: 10.1111/j.1466-822x.2006.00262.x
34
Journal compilation © 2006 Blackwell Publishing Ltd www.blackwellpublishing.com/geb
Global Ecology and Biogeography, (Global Ecol. Biogeogr.)
(2007)
16
, 34–42
RESEARCHPAPER
Blackwell Publishing Ltd
The role of land cover in bioclimatic models depends on spatial resolution
Miska Luoto*, Raimo Virkkala and Risto K. Heikkinen
ABSTRACT
Aim
We explored the importance of climate and land cover in bird species distributionmodels on multiple spatial scales. In particular, we tested whether the integration ofland cover data improves the performance of pure bioclimatic models.
Location
Finland, northern Europe.
Methods
The data of the bird atlas survey carried out in 1986–89 using a10
×
10 km uniform grid system in Finland were employed in the analyses. Landcover and climatic variables were compiled using the same grid system. The dependentand explanatory variables were resampled to 20-km, 40-km and 80-km resolutions.Generalized additive models (GAM) were constructed for each of the 88 land birdspecies studied in order to estimate the probability of occurrence as a function of(1) climate and (2) climate and land cover variables. Model accuracy was measured bya cross-validation approach using the area under the curve (AUC) of a receiver operatingcharacteristic (ROC) plot.
Results
In general, the accuracies of the 88 bird–climate models were good at allstudied resolutions. However, the inclusion of land cover increased the performanceof 79 and 78 of the 88 bioclimatic models at 10-km and 20-km resolutions, respec-tively. There was no significant improvement at the 40-km resolution. In contrastto the finer resolutions, the inclusion of land cover variables decreased the model-ling accuracy at 80km resolution.
Main conclusions
Our results suggest that the determinants of bird species distri-butions are hierarchically structured: climatic variables are large-scale determinants,followed by land cover at finer resolutions. The majority of the land bird species inFinland are rather clearly correlated with climate, and bioclimate envelope modelscan provide useful tools for identifying the relationships between these species andthe environment at resolutions ranging from 10 km to 80 km. However, the notablecontribution of land cover to the accuracy of bioclimatic models at 10–20-km reso-lutions indicates that the integration of climate and land cover information canimprove our understanding and model predictions of biogeographical patternsunder global change.
Keywords
Bioclimatic models, bird atlas, birds, climate, distribution, Finland, land cover,
modelling.
*Correspondence: Miska Luoto, Finnish Environment Institute, Research Department, Research Programme for Biodiversity, P.O. Box 140, FIN-00251 Helsinki, Finland. E-mail: [email protected]
Finnish Environment Institute, Research
Department, Research Programme for
Biodiversity, P.O. Box 140, FIN-00251 Helsinki,
Finland
INTRODUCTION
Assessments of the potential effects of climate change on
biodiversity and the future range shifts of species have often been
based on bioclimatic envelope models (Bakkenes
et al
., 2002;
Beaumont & Hughes, 2002; Berry
et al
., 2002; Pearson &
Dawson, 2003; Thuiller, 2003; Huntley
et al
., 2004; Thuiller
et al
.,
2005). These modelling strategies correlate current species
distributions with climate variables, and then project spatial
shifts in species climatic envelopes according to the climate
change scenarios (Pearson & Dawson, 2003; Thuiller, 2003,
2004).

Scale matters in bioclimatic models
© 2006 The Authors
Global Ecology and Biogeography
,
16
, 34–42, Journal compilation © 2006 Blackwell Publishing Ltd
35
It has recently been emphasized that many factors other
than climate can also significantly influence the geographical
distributions of species and the rate of changes in distribution
(Hampe, 2004). One of the potentially important factors is land
cover, although its effects have only sporadically been considered
in bioclimatic models (but see Dirnböck
et al
., 2003; Pearson
et al
., 2004; Thuiller
et al
., 2004a). The scarcity of studies
employing both climatic and land cover predictors in bioclimatic
modelling is surprising, because many papers have reported
statistically significant relationships between land cover variables
and the regional or nationwide distribution and richness
patterns of species (e.g. Fuller
et al
., 1997; Siriwardena
et al
.,
2000; Maes
et al
., 2003; Eyre
et al
., 2004; Heikkinen
et al
., 2004;
Fuller
et al
., 2005; Luoto
et al
., 2006).
The problems and impacts of scale have long been a central
issue in ecological (Wiens
et al
., 1987; Wiens, 1989; Levin, 1992;
Palmer & White, 1994) and biogeographical studies (Rahbek &
Graves, 2001; Blackburn & Gaston, 2002; Willis & Whittaker,
2002). The concept of scale consists of two important attributes:
the unit of sampling and the geographical space covered. The
first attribute is defined by ‘grain’ (or ‘resolution’) and ‘focus’,
grain being the size of the common analytical unit and focus
the area represented by each data point. The second
attribute is ‘extent’, describing the geographical area over which
comparisons are made (Wiens, 1989; Scheiner, 2003; Rahbek,
2005).
Considering the relative contributions of different explanatory
factors on species–environment relationships, the current
paradigm is that climate governs species distributions on broad
biogeographical scales (Currie, 1991; Huntley
et al
., 1995;
Parmesan, 1996) whereas land cover and spatial distribution of
suitable habitats affect species occupancy patterns, particularly
at finer spatial resolutions (Bailey
et al
., 2002; Pearson
et al
.,
2004). The limited results available from bioclimatic modelling
studies suggest that the predictive power of models at a coarse
50-km resolution are not greatly improved by the inclusion
of land cover variables (Thuiller
et al
., 2004a), whereas at finer
resolution such inclusion can significantly improve spatial
predictions for certain plant (Pearson
et al
., 2004) and butterfly
species (Hill
et al
., 1999). However, whether these trends revealed
from the rather heavily human-influenced European regions
also prevail in other biomes, such as boreal regions, requires
further studies. Moreover, there is a clear shortage of studies in
which the impact of integrating land cover data in bioclimatic
models is examined systematically across a range of spatial
resolutions (but see Thuiller
et al
., 2004b). Thus, conclusions
about the potential contributions of climate vs. land cover have
hitherto generally been based on analyses conducted at only one
spatial resolution.
Thuiller
et al
. (2004a) suggested that at the European coarse
resolution, variation in the land cover is mainly driven by
climate. In other words, due to the strong co-inertia between land
cover and climate, the climate variables can effectively account
for most of the explanatory power of land cover. However, very
little effort has been made to examine the changes in the level of
this coinertia over a range of scales.
In this study we used the distribution data of 88 bird species in
Finland and land cover and climate data at four different spatial
resolutions, ranging from 10
×
10 km to 80
×
80 km, and gener-
alized additive models (GAM) to examine whether land cover
variables can significantly improve the performance of species
distribution models based purely on climatic predictors (cf.
Thuiller
et al
., 2004a). We explored the accuracy of the different
models across the four spatial resolutions considered. We also
investigated how large a proportion of the variation of land cover
is accounted for by climatic variables (coinertia between land
cover and climate) at different spatial resolutions.
MATERIALS AND METHODS
Study area
Finland covers an area of
c
. 338,000 km
2
(land area 305,000 km
2
)
in northern Europe between latitudes 59
°
30
′
and 70
°
N. The
climate of Finland shows characteristics of both an oceanic and a
continental climate and is subject to Atlantic, Arctic and Siberian
influences, the continentality growing inland and eastwards
(Tuhkanen, 1984). The majority of the country has a boreal
climate, with a decrease in rainfall and temperature from the
south-western hemiboreal zone (mean annual temperature
c
. 5
°
C
and mean annual precipitation 600–700 mm) to the subarctic
region in northernmost Finland (
−
2
°
C and 400 mm). Biogeo-
graphically Finland is located mainly in the boreal coniferous
vegetation zone. The landscape is largely dominated by forests
and mires. Arable land and built-up areas cover about 14% of the
total land area of Finland.
Bird data
We included 88 land bird species in our analysis. All studied
species had their northern or southern range boundaries in
Finland. Species were breeding and/or foraging in all the main
terrestrial habitats: 40 species occurred primarily in forests, 18
species in agricultural and bushy habitats, 14 in mires, 9 in
marshes and coastal wetlands and 7 in mountain heaths. We
consider this sample as representative of the Finnish land bird
species because it includes the majority of the families and
species traits (such as different migratory and foraging patterns)
found among almost 200 land bird species breeding in Finland.
The information on distribution of the target species and the
level of survey activity was extracted from the second bird atlas
survey in Finland, the field work for which was carried out in
1986–89 (Väisänen
et al
., 1998). Survey activity categories and
the way survey design was conducted are presented in detail in
Väisänen (1989). The bird atlas is unusual because of its high
mapping intensity and fine-scale resolution, and because it
consists of precisely georeferenced sampling locales rather than
interpolated maps with unknown survey activity.
There are about 3800 atlas squares of 10
×
10 km in Finland
using a uniform grid. Väisänen
et al
. (1998) listed the breeding
status of bird species recorded in each of the grid squares in four
classes: 0 = not found, 1 = breeding possible (i.e. singing or

M. Luoto
et al.
© 2006 The Authors
36
Global Ecology and Biogeography
,
16
, 34–42, Journal compilation © 2006 Blackwell Publishing Ltd
displaying male observed once in typical nesting habitat),
2 = breeding probable (e.g. singing or displaying male with a
persistent territory observed, or female or pair present on more
than 1 day in the same place, or bird observed building nest) and
3 = confirmed breeding (see Väisänen, 1989). For the analysis of
this study, we combined classes 1, 2 and 3 as a species present-
variable. Bird atlas observers and organizers of the atlas survey
graded the survey activity in each square according to six
categories: 0 = no observations, 1 = occasional observations,
2 = fair survey, 3 = satisfactory survey of the square, 4 = well
surveyed and 5 = thoroughly surveyed square (Väisänen
et al
.,
1998). We used only grid squares with survey activities of 2–5 in
our analysis. Consequently, the data used in the analyses
consisted of 2861 squares, which is 75% of all the squares (Fig. 1).
The data were resampled to 20
×
20 km (
n
= 1014), 40
×
40 km
(
n
= 261) and 80
×
80 km (
n
= 82) grid squares for further analyses.
Climate data
We used climatic data produced by the Finnish Meteorological
Institute as predictor variables for the bird distribution data,
using the same 10
×
10 km grid system (Venäläinen & Heikin-
heimo, 2002). The climate data included mean values for the period
1985–89 for all climatic variables. The number of candidate
climatological explanatory variables was high and they were
clearly intercorrelated; therefore particular attention was paid
to the ecological plausibility of the relationships between the
response variable and the explanatory variables. We focused
on three bioclimate variables which affect the numbers,
reproduction and survival of breeding birds: mean tempera-
ture in April–June (MTAJ), precipitation in April–June (PREAJ)
and mean temperature of the coldest month (MTCO) (see Forsman
& Mönkkönen, 2003). As in the case of species data, climate data
were resampled to 20-km, 40-km and 80-km resolutions.
Land cover data
We utilized a new European land cover and land-use classifica-
tion CORINE (Coordination of Information on the Environ-
ment) as land cover information in the analyses (European
Commission, 1994). The classification of land cover into
CORINE classes in Finland is based on automated interpretation
of Landsat ETM+ satellite images (from the years 1999–2002)
and data integration with existing digital maps (Härmä
et al
.,
2004). The national CORINE data base for Finland is in raster
format and has a spatial resolution of 25 m, which makes it of
fine resolution compared with European CORINE land cover
data with the minimum mappable unit of 25 ha. Satellite image-
derived land cover data were combined with existing digital
land-use and soil information produced by the National Land
Survey of Finland. The proportions of land cover types were
calculated as the cover for each grain size from a digital CORINE
data base using an ArcView Spatial Analyst (version 3.2, ESRI,
Redland, CA, USA).
Land cover classes were selected to match as accurately as
possible with habitat requirements of the studied 88 bird species.
For example, marshland cover, which was included as one land
cover class in the present work, was selected in a specific study as
a significant variable for explaining the distribution of all
marsh-nesting bird species (Virkkala
et al
., 2005). The CORINE
data used in this study comprise eight classes of land cover: (1)
arable land
(ARA) includes cereal and fodder fields, (2)
low-
intensity agricultural land
(LOIA) consists of cattle grazing areas
and different meadow types, and also long-term fallow fields and
small forest patches surrounded by arable land, (3)
deciduous
forest
(DECI) includes closed forests dominated by broad-leaved
deciduous tree species, e.g. birches (
Betula pendula and Betula
pubescens
), grey alder (
Alnus incana
) and aspen (
Populus
tremula
), (4) the
coniferous forest
(CONI) class covers all other
forested areas except predominantly deciduous forests, e.g. forest
types from full-grown coniferous forests to felling areas and clear
cuttings. The most predominant tree species are Norway spruce
(
Picea abies
) or Scots pine (
Pinus sylvestris
), (5)
wetland
(WETL)
covers mires and other peat bogs, (6)
marshland
(MARSH)
includes inland and coastal marshes, (7) the
alpine
(ALP) class
consists of sparsely vegetated areas and bare ground, typically
above the tree limit in mountain areas in northern Finland,
(8)
built-up areas
(BUILT) comprise areas mainly with fabricated
or human-made surface materials (e.g. buildings, roads and
green urban areas).
Climate–land cover relationships
We used two multivariate methods to examine the correlation
and co-inertia between the three climatic and eight land cover
Figure 1 Location of Finland in northern Europe and the distribution of 10 × 10 km squares with good quality bird data available in Finland.

Scale matters in bioclimatic models
© 2006 The Authors
Global Ecology and Biogeography
,
16
, 34–42, Journal compilation © 2006 Blackwell Publishing Ltd
37
predictors included in the study: principal components analysis
(PCA) and the outlying mean index (OMI). First, following
Myklestad and Birks (1993) and Heikkinen
et al
. (1998), all cli-
matic and land cover variables were subjected simultaneously
to a correlation matrix PCA in order to investigate the cor-
relation structure between these variables (see Legendre &
Legendre, 1998) separately at four spatial resolutions. Next,
following Thuiller
et al
. (2004a), we applied the OMI
method, as implemented in ADE-4 software (Thioulouse
et al
.,
1997). OMI is a co-inertia analysis, which searches for axes
that maximize the covariance between the row coordinates
of the two tables (see Doledec
et al
., 2000). The method was
used here to examine the co-variation between the climatic
and land cover variables, with the main emphasis on analysing
how much of the variation in land cover can be captured by
the three climatic variables, indicated in the results as total
inertia. OMI was applied by performing a normalized PCA on
the climate data and then linking the land cover table to the PCA
output.
Model calibration
We used generalized additive models (GAMs) in the model
calibration. GAMs were performed using GRASP (generalized
regression analysis and spatial prediction) in S-PLUS (version 6.1
for Windows, Insightful Corp.) (Lehmann
et al
., 2002; Maggini
et al
., 2006). The GAM models were built using a stepwise
selection procedure to select relevant explanatory variables
and the level of complexity of the response shapes of the
various species to each variable. A starting model including
all continuous predictors smoothed with four degrees of free-
dom was fitted first. The variable dropping or conversion to
linear form was then tested using Akaike’s information criterion
(AIC) (Akaike, 1974). Because the response variables
represent binary data (presence or absence of species), a
binomial distribution of error via a logistic link function was
applied.
Model evaluation
The selected models were evaluated by two methods. The
first method was based on the explained deviance of the models,
i.e. how large a proportion the explained deviance was of the
total deviance in each model. This was regarded as the explana-
tory power of the model. The other method was cross-validation,
which was made with four subsets of the entire data set, each
subset containing an equal number of randomly selected
data points. Each subset was then dropped from the model, the
model was recalculated and predictions were made for the
omitted data points. Combination of the predictions from
the different subsets was then plotted against the observed data
(Lehmann
et al
., 2002). Model performance was measured
using the area under the curve (AUC) of a receiver operating
characteristic (ROC) plot (Fielding & Bell, 1997). This
evaluation method is often considered as the predictive power of
the model.
RESULTS
Climate–land cover relationships
The first three axes of the PCA based on all three climate and
eight land cover variables accounted for 60.3–76.5% of the total
variation in climate and land cover at the four spatial resolutions
(Table 1). The total amount of variation captured by PCA
increased gradually with increasing resolution (Pearson correlation
coefficient
r
= 0.975,
P
= 0.025,
n
= 4). The PCA results sug-
gested that some of the variables are clearly correlated with each
other, e.g. the area of arable land, built-up areas, mean tempera-
ture of the coldest month and mean temperature of April–June
However, variation in other land cover variables, particularly
deciduous and coniferous forests and marshland, was not
strongly related to the three climate variables. In the OMI results
the climate variables accounted for 34.1–39.8% of the total
variation in the land cover data (Table 1). There was a positive,
but statistically insignificant, relationship between the total
inertia and spatial resolution (
r =
0.836,
P
= 0.193,
n
= 4).
Explanatory power of the models
The prevalences (the ratio of presence squares to the total
sample) of the 88 bird species ranged from 0.004 to 0.792 (mean
0.248) at the 10-km resolution (Table 2). The amount of
deviance explained by the 88 bird–climate models ranged from
6.0% to 72.3% with a mean of 34.0% at the finest 10-km resolution,
whereas at the largest resolution the explanatory power varied
Table 1 Climate–land cover relationships at different spatial resolutions. Percentages of variation accounted for the first three axes of principal components analysis (PCA), including all three climate and eight land cover variables. Percentages of explained inertia based on outlying mean index analysis (OMI)
Resolution (km) PCA OMI
10 60.30 34.14
20 64.61 36.97
40 70.50 39.13
80 76.50 39.81
Table 2 Minimum and maximum values and mean and standard errors (SE) of species (n = 88) prevalence (the ratio of presence squares to the total sample) across scales. The range of prevalence values is 0–1, where 0.0 = absence in every square and 1.0 = presence in every grid square
Scale (km) Min. Max. Mean SE
10 0.004 0.792 0.248 0.025
20 0.009 0.876 0.322 0.026
40 0.031 0.946 0.463 0.029
80 0.073 0.976 0.566 0.027

M. Luoto
et al.
© 2006 The Authors
38
Global Ecology and Biogeography
,
16
, 34–42, Journal compilation © 2006 Blackwell Publishing Ltd
between 4.4% and 98.7% with a mean of 60.8% (Table 3). The
inclusion of land cover increased the explanatory power of
bioclimatic models by more than 25% at all spatial resolutions.
The increase was statistically significant (Wilcoxon signed rank
test,
P
< 0.001) at all four studied resolutions. At the 10-km,
20-km and 40-km resolutions the inclusion of land cover vari-
ables improved the explanatory power of all 88 bird species
models, whereas at the 80-km resolution the inclusion improved
only 31 models out of 88. For all the variables selected into all
88 bird species models at the four resolutions see Appendix S1 in
Supplementary Material.
Cross-validation results of the models
The model performance was assessed using AUC based on cross-
validation. In general, the accuracies of the 88 bird–climate
models were rather good at all studied resolutions (Table 3). At
the finest resolution, mean accuracies of the models varied from
low to very high (0.65–0.99), with a mean of 0.86. At the coarsest
resolution the AUC values of the bird–climate models varied
between 0.47 and 0.99, with a mean of 0.87.
The inclusion of land cover increased the accuracy of bio-
climatic models at the 10-km and 20-km resolutions (Wilcoxon
signed rank test,
P
< 0.001). There was no statistically significant
change at the 40-km resolution (
P =
0.0663), whereas at the
80-km resolution the inclusion of land cover variables decreased
the modelling accuracy with statistical significance (
P =
0.0053).
The rank test results remained the same after a Bonferroni cor-
rection for multiple tests (
n
= 8).
At the finest three resolutions of climate–land cover, 39–55 of
the 88 species had an AUC value higher than 0.90, indicating that
44–63% of our bird–climate–land cover models had an excellent
model performance (Table 4). Overall, the value of AUC was
below 0.7 in only 3.6% of all the models in all the analyses
(25/704), and could thus be regarded as poor (AUC 0.6–0.69)
or failed (AUC < 0.6) (see Swets, 1988).
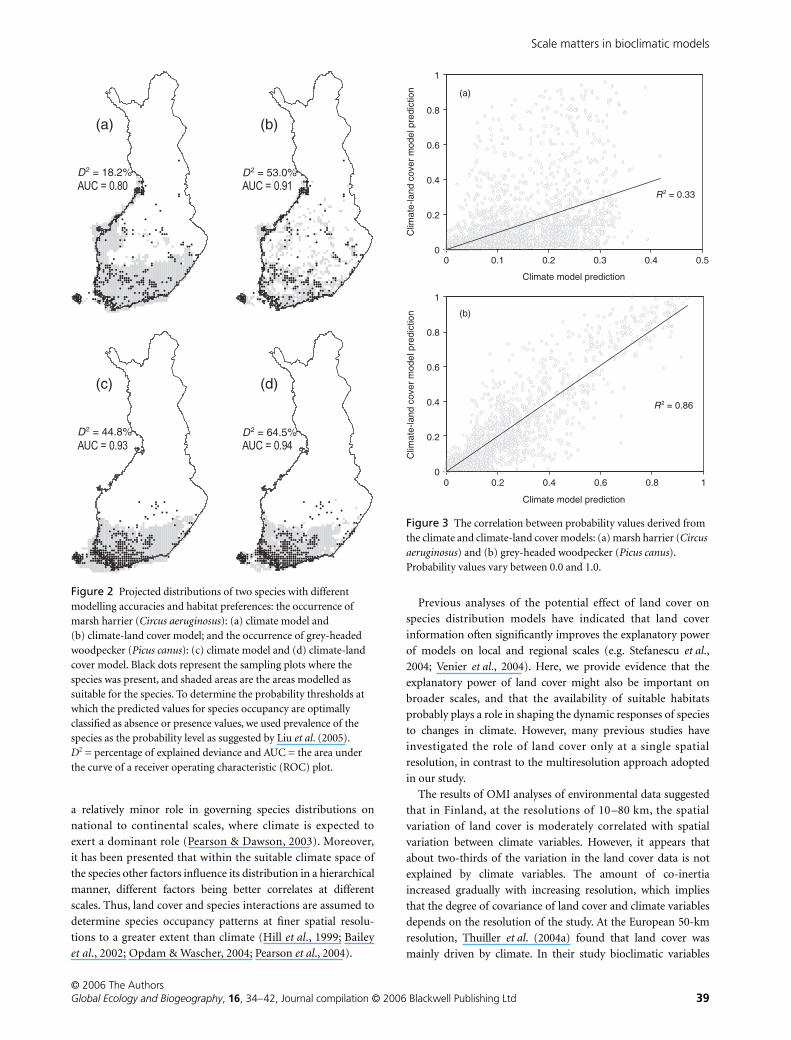
As an example, the performance of the models is presented for
two bird species, the marsh harrier,
Circus aeruginosus
, and the
grey-headed woodpecker,
Picus canus
(Fig. 2), both of which had
a prevalence of 0.1 at the 10-km resolution. For the marsh harrier
both the explained deviance and the AUC value, indicating
modelling performance, increased from the pure climate to the
climate–land cover model, whereas in the grey-headed woodpecker
the inclusion of land cover did not significantly improve the
performance of the pure climate model (Fig. 2). Furthermore, the
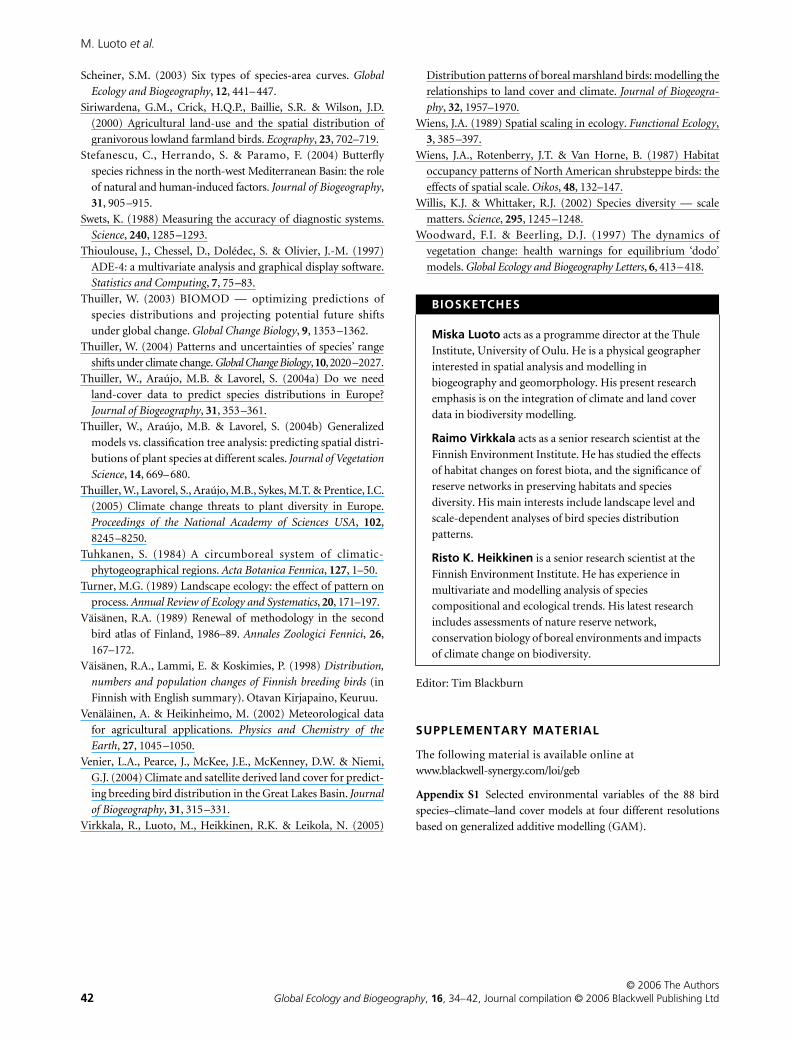
positive correlation between the predicted probabilities of occurrence
between climate and climate–land cover models was high in the
grey-headed woodpecker but low in the marsh harrier (Fig. 3).
DISCUSSION
The spatial scale on which species distribution modelling is
undertaken is of fundamental importance for the results and
inferences of ecological and biogeographical studies (Wiens,
1989; Lawler
et al
., 2004; Pearson
et al
., 2004; Rahbek, 2005). The
choice of spatial extent and resolution can directly affect the
results of any given analysis and the comparability of conclusions
between studies (Rahbek, 2005). Rahbek & Graves (2001)
presented the effect of grain size on models of avian species
richness across South America. They demonstrated that
increases in grain size resulted in increases in model fit, and that
the relative contributions of variables changed with resolution.
In the context of bioclimatic modelling, it has been proposed
that climate impacts on the distribution of species are most
apparent on macroscales with broad spatial extents and coarse
resolutions (Currie, 1991; Huntley
et al
., 1995; Pearson
et al
.,
2004). The validity of the use of bioclimate models has been
questioned (Woodward & Beerling, 1997; Hampe, 2004),
because inherently they consider climate as the only determinant
of species distributions. In response to this criticism it has been
proposed that land cover and biotic interactions may play
Table 3 Mean (± SE) values of explained deviance and AUC (the area under the curve of a receiver operating characteristic plot) of the 88 land bird species based on pure climate variables and climate and land cover variables combined at the different scales of resolution. Statistical tests by Wilcoxon signed rank test, critical significance level P = 0.05/8 = 0.0063. Ranks: negative/positive/tied. Negative or positive rank refers to pure climate variables
Scale (km) Climate variable
Climate–land
cover variables z P Ranks
Explained deviance
10 0.340 ± 0.016 0.427 ± 0.016 8.147 < 0.0001 88/0/0
20 0.410 ± 0.016 0.516 ± 0.016 8.147 < 0.0001 88/0/0
40 0.514 ± 0.017 0.690 ± 0.017 8.147 < 0.0001 88/0/0
80 0.608 ± 0.022 0.907 ± 0.010 8.134 < 0.0001 86/2/0
AUC
10 0.859 ± 0.007 0.883 ± 0.006 6.927 < 0.0001 79/8/1
20 0.878 ± 0.007 0.898 ± 0.007 6.589 < 0.0001 78/9/1
40 0.894 ± 0.007 0.900 ± 0.007 1.837 0.0663 52/34/2
80 0.868 ± 0.011 0.854 ± 0.010 2.790 0.0053 31/57/0
Scale
(km)
Climate Climate–land cover
< 0.70 0.70–0.79 0.80–0.89 0.90–1.00 < 0.70 0.70–0.79 0.80–0.89 0.90–1.00
10 2 12 50 24 2 4 43 39
20 2 10 38 38 3 4 26 55
40 2 6 27 53 3 3 30 52
80 6 7 31 44 5 14 44 25
Table 4 Number of species–climate models and species–climate–land cover models in different accuracy classes of AUC at the four different scales of resolution
Scale matters in bioclimatic models
© 2006 The Authors Global Ecology and Biogeography, 16, 34–42, Journal compilation © 2006 Blackwell Publishing Ltd 39
a relatively minor role in governing species distributions on
national to continental scales, where climate is expected to
exert a dominant role (Pearson & Dawson, 2003). Moreover,
it has been presented that within the suitable climate space of
the species other factors influence its distribution in a hierarchical
manner, different factors being better correlates at different
scales. Thus, land cover and species interactions are assumed to
determine species occupancy patterns at finer spatial resolu-
tions to a greater extent than climate (Hill et al., 1999; Bailey
et al., 2002; Opdam & Wascher, 2004; Pearson et al., 2004).
Previous analyses of the potential effect of land cover on
species distribution models have indicated that land cover
information often significantly improves the explanatory power
of models on local and regional scales (e.g. Stefanescu et al.,
2004; Venier et al., 2004). Here, we provide evidence that the
explanatory power of land cover might also be important on
broader scales, and that the availability of suitable habitats
probably plays a role in shaping the dynamic responses of species
to changes in climate. However, many previous studies have
investigated the role of land cover only at a single spatial
resolution, in contrast to the multiresolution approach adopted
in our study.
The results of OMI analyses of environmental data suggested
that in Finland, at the resolutions of 10–80 km, the spatial
variation of land cover is moderately correlated with spatial
variation between climate variables. However, it appears that
about two-thirds of the variation in the land cover data is not
explained by climate variables. The amount of co-inertia
increased gradually with increasing resolution, which implies
that the degree of covariance of land cover and climate variables
depends on the resolution of the study. At the European 50-km
resolution, Thuiller et al. (2004a) found that land cover was
mainly driven by climate. In their study bioclimatic variables
Figure 2 Projected distributions of two species with different modelling accuracies and habitat preferences: the occurrence of marsh harrier (Circus aeruginosus): (a) climate model and (b) climate-land cover model; and the occurrence of grey-headed woodpecker (Picus canus): (c) climate model and (d) climate-land cover model. Black dots represent the sampling plots where the species was present, and shaded areas are the areas modelled as suitable for the species. To determine the probability thresholds at which the predicted values for species occupancy are optimally classified as absence or presence values, we used prevalence of the species as the probability level as suggested by Liu et al. (2005). D2 = percentage of explained deviance and AUC = the area under the curve of a receiver operating characteristic (ROC) plot.
Figure 3 The correlation between probability values derived from the climate and climate-land cover models: (a) marsh harrier (Circus aeruginosus) and (b) grey-headed woodpecker (Picus canus). Probability values vary between 0.0 and 1.0.

M. Luoto et al.
© 2006 The Authors40 Global Ecology and Biogeography, 16, 34–42, Journal compilation © 2006 Blackwell Publishing Ltd
explained 96% of the land cover distribution. Our observation of
a lower correlation between climate and land cover over a smaller
geographical range, compared with the result of Thuiller et al.
(2004a), is an important outcome as it supports the idea that
including both types of variables may bring essential informa-
tion into bioclimate envelope modelling, particularly on the
national and regional scales (see Pearson et al., 2004).
Our modelling showed a relatively close fit between the three
climate variables and the distributions of different bird species at
all studied resolutions, with almost 90% of our bird–climate
models having a good or excellent model performance (Swets,
1988). This suggests that occupancy patterns of bird species in
Finland are rather clearly correlated with climate. Consequently,
bioclimate envelope models can provide useful tools for identify-
ing the relationships between these species and the environment
at resolutions ranging from 10 km to 80 km (Pearson & Dawson,
2003). However, the inclusion of land cover increased the
modelling accuracy of bioclimatic models at 10-km and 20-km
resolutions, whereas the model performance did not improve at
40–80-km resolutions. On the two finest scales, the inclusion of
land cover variables increased the cross-validation results in the
majority of the models. On the other hand, our results support
the conclusion of Thuiller et al. (2004a) that species distributions
at coarser resolutions, in our case 40 km and 80 km, are driven
mainly by climatic factors. On the coarser scales, there is an
underlying high heterogeneity of land cover in each grid cell,
which will effectively decrease the pure effect of land cover in the
species distribution models. In other words, grid cells of this size
inevitably harbour patches of most or all land cover types occur-
ring in the region, which lowers the environmental variation
between the grid cells. Employing finer resolutions has clear
advantages in species distribution modelling, particularly as it
enables researchers to identify regions with suitable climate but
unsuitable land cover for a given species (Pearson et al., 2004).
Our two species examples show the ecological basis in the
species responses in pure climate and in climate–land cover
models (Fig. 2). The prediction of grey-headed woodpecker
distribution was not greatly improved by including land cover
variables in the model, in contrast to the marsh harrier. The grey-
headed woodpecker is a resident species, which mainly utilizes
ants on the ground when foraging (Rolstad & Rolstad, 1995).
Therefore, the distribution of the grey-headed woodpecker is
restricted largely by snow depth: the species is clearly most
abundant in the south-western coast and archipelago (Väisänen
et al., 1998), where snow cover is irregular and snow depth is, on
average, low. Consequently, climatic variables predict the
distribution of the grey-headed woodpecker well and the predic-
tion of distribution is continuous in both climate and climate–
land cover models. The migratory marsh harrier is highly
dependent on the distribution of marshland areas, which occur
patchily in Finland (Virkkala et al., 2005). As a consequence, the
inclusion of land cover variables increased considerably
the predictive power of the pure climate model, and the
predicted distribution of the marsh harrier in the climate–land
cover model is scattered, in contrast to that in the pure climate
model.
CONCLUSIONS
The findings reported here have substantial implications for
biodiversity modelling studies, particularly in the context of
global change. Inclusion of land cover information into pure
bioclimatic models produced often strikingly different results at
different spatial resolutions, and the role of land cover in the
modelling accuracy varied across grain sizes. These results draw
attention to the importance of the resolution at which dependent
and response variables are recorded in the biogeographical
studies. Most importantly, if the detail with which sample
attributes are discriminated can affect the inferences of biogeo-
graphical and ecological studies, determination of the proper
resolution of any analysis should be incorporated carefully into
the study design (Turner, 1989). Until recently, very few model-
ling studies have addressed climate–land cover interactions,
although it is recognized that ignoring habitat distribution and
focusing only on climate response surfaces may result in less
accurate species distribution projections in climate change
studies (cf. Bakkenes et al., 2002). In our study, the inclusion of
land cover variables clearly improved the performance of the bird
distribution models at resolutions of 10 km and 20 km. This
suggests that the determinants of bird species distributions are
hierarchically structured, reinforcing the conclusions of Pearson
et al. (2004) and Pearson & Dawson (2003) that climatic vari-
ables are large-scale determinants, followed by land cover at finer
resolutions.
ACKNOWLEDGEMENTS
A study of this nature would not be possible without hundreds of
volunteers who contributed their data to the bird atlas. Stefan
Fronzek and Riitta Teiniranta helped in aggregating the climate
and land cover data for this study. M. Bailey helped with correc-
tion of the English text. Different parts of this research were
funded by the EC FP6 Integrated Project ALARM (GOCE-CT-
2003-506675).
REFERENCES
Akaike, H. (1974) A new look at statistical model identification.
IEEE Transactions on Automatic Control, AU-19, 716–722.
Bailey, S.-A., Haines-Young, R.H. & Watkins, C. (2002) Species
presence in fragmented landscapes: modelling of species require-
ments at the national level. Biological Conservation, 108, 307–316.
Bakkenes, M., Alkemade, J., Ihle, F., Leemans, R. & Latour, J.
(2002) Assessing the effects of forecasted climate change on the
diversity and distribution of European higher plants for 2050.
Global Change Biology, 8, 390–407.
Beaumont, L.J. & Hughes, L. (2002) Potential changes in the
distributions of latitudinally restricted Australian butterfly species
in response to climate change. Global Change Biology, 8, 954–971.
Berry, P., Dawson, T., Harrison, P. & Pearson, R. (2002) Model-
ling potential impacts of climate change on the bioclimatic
envelope of species in Britain and Ireland. Global Ecology and
Biogeography, 11, 453–462.

Scale matters in bioclimatic models
© 2006 The Authors Global Ecology and Biogeography, 16, 34–42, Journal compilation © 2006 Blackwell Publishing Ltd 41
Blackburn, T. & Gaston, K. (2002) Scale in macroecology. Global
Ecology and Biogeography, 11, 185–189.
Currie, D.J. (1991) Energy and large-scale patterns of animal-
and plant-species richness. The American Naturalist, 137, 27–49.
Dirnböck, T., Dullinger, S. & Grabherr, G. (2003) A regional
impact assessment of climate and land-use change on alpine
vegetation. Journal of Biogeography, 30, 401–417.
Doledec, S., Chessel, D. & Gimaret-Carpentier, C. (2000) Niche
separation in community analysis: a new method. Ecology, 81,
2914–2927.
European Commission (1994) EUR 12585 – CORINE land cover –
technical guide. Office for Official Publications of the European
Communities, Luxembourg.
Eyre, M., Rushton, S., Luff, M. & Telfer, M. (2004) Predicting the
distribution of ground beetle species (Coleoptera, Carabidea)
in Britain using land cover variables. Journal of Environmental
Management, 72, 163–174.
Fielding, A. & Bell, J. (1997) A review of methods for the assess-
ment of prediction errors in conservation presence/absence
models. Environmental Conservation, 24, 38–49.
Forsman, J.T. & Mönkkönen, M. (2003) The role of climate in
limiting European resident bird populations. Journal of
Biogeography, 30, 55–70.
Fuller, R.M., Devereux, B.J., Gillings, S., Amable, G.S. & Hill, R.A.
(2005) Indices of bird-habitat preference from field surveys of
birds and remote sensing of land cover: a study of south-eastern
England with wider implications for conservation and biodiversity
assessment. Global Ecology and Biogeography, 14, 223–239.
Fuller, R.J., Trevelyan, R.J. & Hudson, R.W. (1997) Landscape
composition models for breeding bird populations in lowland
English farmland over a 20 year period. Ecography, 20, 295–307.
Hampe, A. (2004) Bioclimate envelope models: what they detect
and what they hide. Global Ecology and Biogeography, 13, 469–
476.
Härmä, P., Teiniranta, R., Törmä, M., Repo, R., Järvenpää, E. &
Kallio, M. (2004) Production of CORINE2000 Land Cover
Data Using Calibrated LANDSAT 7 ETM Satellite Image
Mosaics and Digital Maps in Finland. IEEE International
Geoscience and Remote Sensing Symposium 20–24 September
2004, Vol. 4, pp. 2703–2706. IEEE, Anchorage, AK.
Heikkinen, R.K., Birks, H.J.B. & Kalliola, R.J. (1998) A numerical
analysis of the mesoscale distribution patterns of vascular
plants in the Kevo Nature Reserve, northern Finland. Journal of
Biogeography, 25, 123–146.
Heikkinen, R.K., Luoto, M., Virkkala, R. & Rainio, K. (2004)
Effects of habitat cover, landscape structure and spatial
variables on the abundance of birds in an agricultural-forest
mosaic. Journal of Applied Ecology, 41, 824–835.
Hill, J.K., Thomas, C.D. & Huntley, B. (1999) Climate and
habitat availability determine 20th century changes in a
butterfly’s range margin. Proceedings of the Royal Society of
London Series B, 266, 1197–1206.
Huntley, B., Berry, P.M., Cramer, W. & McDonald, A.P. (1995)
Modelling present and potential future ranges of some
European higher plants using climate response surfaces.
Journal of Biogeography, 22, 967–1001.
Huntley, B., Green, R.E., Collingham, Y.C., Hill, J.K., Willis, S.G.,
Bartlein, P.J., Cramer, W., Hagemeijer, W.J.M. & Thomas, C.D.
(2004) The performance of models relating species geographical
distributions to climate is independent of trophic level. Ecology
Letters, 7, 417–426.
Lawler, J., O’Connor, R., Hunsaker, C., Jones, K., Loveland, T. &
White, D. (2004) The effects of habitat resolution on models of
avian diversity and distributions: a comparison of two
land-cover classifications. Landscape Ecology, 19, 515–530.
Legendre, P. & Legendre, L. (1998) Numerical ecology, 2nd edn.
Elsevier Science, Amsterdam.
Lehmann, A., Overton, J. & Leathwick, J. (2002) GRASP:
generalized regression analysis and spatial prediction. Ecological
Modelling, 157, 189–207.
Levin, S.A. (1992) The problem of pattern and scale in ecology.
Ecology, 73, 1943–1967.
Liu, C., Berry, P.M., Dawson, T.P. & Pearson, R.G. (2005) Selecting
thresholds of occurrence in the prediction of species distributions.
Ecography, 28, 385–393.
Luoto, M., Heikkinen, R.K., Pöyry, J. & Saarinen, K. (2006)
Determinants of biogeographical distribution of butterflies in
boreal regions. Journal of Biogeography, 33, 1764–1778.
Maes, D., Gilbert, M., Titeux, N., Goffart, P. & Dennis, R.L.H.
(2003) Prediction of butterfly diversity hotspots in Belgium: a
comparison of statistically focused and land use-focused
models. Journal of Biogeography, 30, 1907–1920.
Maggini, R., Lehmann, A., Zimmerman, N.E. & Guisan, A.
(2006) Improving generalized regression analysis for spatial
predictions of forest communities. Journal of Biogeography, 33,
1729–1749.
Myklestad, Å. & Birks, H.J.B. (1993) A numerical analysis of the
distribution patterns of Salix L. species in Europe. Journal of
Biogeography, 20, 1–32.
Opdam, P. & Wascher, D. (2004) Climate change meets habitat
fragmentation: linking landscape and biogeographical scale
levels in research and conservation. Biological Conservation,
117, 285–297.
Palmer, M.W. & White, P.S. (1994) Scale dependence and the
species-area relationships. The American Naturalist, 144, 717–740.
Parmesan, C. (1996) Climate and species range. Nature, 382,
765–766.
Pearson, R. & Dawson, T. (2003) Predicting the impacts of
climate change on the distribution of species: are bioclimatic
envelope models useful? Global Ecology and Biogeography, 12,
361–371.
Pearson, R.G., Dawson, T.P. & Liu, C. (2004) Modelling species
distributions in Britain: a hierarchical integration of climate
and land-cover data. Ecography, 27, 285–298.
Rahbek, C. (2005) The role of spatial scale and the perception of
large-scale species-richness patterns. Ecology Letters, 8, 224–239.
Rahbek, C. & Graves, G.R. (2001) Multiscale assessment of
patterns of avian species richness. Proceedings of the National
Academy of Sciences USA, 98, 4534–4539.
Rolstad, J. & Rolstad, E. (1995) Seasonal patterns in home-range
and habitat use of the Grey-headed Woodpecker Picus canus as
influenced by the availability of food. Ornis Fennica, 72, 1–13.
M. Luoto et al.
© 2006 The Authors42 Global Ecology and Biogeography, 16, 34–42, Journal compilation © 2006 Blackwell Publishing Ltd
Scheiner, S.M. (2003) Six types of species-area curves. Global
Ecology and Biogeography, 12, 441–447.
Siriwardena, G.M., Crick, H.Q.P., Baillie, S.R. & Wilson, J.D.
(2000) Agricultural land-use and the spatial distribution of
granivorous lowland farmland birds. Ecography, 23, 702–719.
Stefanescu, C., Herrando, S. & Paramo, F. (2004) Butterfly
species richness in the north-west Mediterranean Basin: the role
of natural and human-induced factors. Journal of Biogeography,
31, 905–915.
Swets, K. (1988) Measuring the accuracy of diagnostic systems.
Science, 240, 1285–1293.
Thioulouse, J., Chessel, D., Dolédec, S. & Olivier, J.-M. (1997)
ADE-4: a multivariate analysis and graphical display software.
Statistics and Computing, 7, 75–83.
Thuiller, W. (2003) BIOMOD — optimizing predictions of
species distributions and projecting potential future shifts
under global change. Global Change Biology, 9, 1353–1362.
Thuiller, W. (2004) Patterns and uncertainties of species’ range
shifts under climate change. Global Change Biology, 10, 2020–2027.
Thuiller, W., Araújo, M.B. & Lavorel, S. (2004a) Do we need
land-cover data to predict species distributions in Europe?
Journal of Biogeography, 31, 353–361.
Thuiller, W., Araújo, M.B. & Lavorel, S. (2004b) Generalized
models vs. classification tree analysis: predicting spatial distri-
butions of plant species at different scales. Journal of Vegetation
Science, 14, 669–680.
Thuiller, W., Lavorel, S., Araújo, M.B., Sykes, M.T. & Prentice, I.C.
(2005) Climate change threats to plant diversity in Europe.
Proceedings of the National Academy of Sciences USA, 102,
8245–8250.
Tuhkanen, S. (1984) A circumboreal system of climatic-
phytogeographical regions. Acta Botanica Fennica, 127, 1–50.
Turner, M.G. (1989) Landscape ecology: the effect of pattern on
process. Annual Review of Ecology and Systematics, 20, 171–197.
Väisänen, R.A. (1989) Renewal of methodology in the second
bird atlas of Finland, 1986–89. Annales Zoologici Fennici, 26,
167–172.
Väisänen, R.A., Lammi, E. & Koskimies, P. (1998) Distribution,
numbers and population changes of Finnish breeding birds (in
Finnish with English summary). Otavan Kirjapaino, Keuruu.
Venäläinen, A. & Heikinheimo, M. (2002) Meteorological data
for agricultural applications. Physics and Chemistry of the
Earth, 27, 1045–1050.
Venier, L.A., Pearce, J., McKee, J.E., McKenney, D.W. & Niemi,
G.J. (2004) Climate and satellite derived land cover for predict-
ing breeding bird distribution in the Great Lakes Basin. Journal
of Biogeography, 31, 315–331.
Virkkala, R., Luoto, M., Heikkinen, R.K. & Leikola, N. (2005)
Distribution patterns of boreal marshland birds: modelling the
relationships to land cover and climate. Journal of Biogeogra-
phy, 32, 1957–1970.
Wiens, J.A. (1989) Spatial scaling in ecology. Functional Ecology,
3, 385–397.
Wiens, J.A., Rotenberry, J.T. & Van Horne, B. (1987) Habitat
occupancy patterns of North American shrubsteppe birds: the
effects of spatial scale. Oikos, 48, 132–147.
Willis, K.J. & Whittaker, R.J. (2002) Species diversity — scale
matters. Science, 295, 1245–1248.
Woodward, F.I. & Beerling, D.J. (1997) The dynamics of
vegetation change: health warnings for equilibrium ‘dodo’
models. Global Ecology and Biogeography Letters, 6, 413–418.
Editor: Tim Blackburn
SUPPLEMENTARY MATERIAL
The following material is available online at
www.blackwell-synergy.com/loi/geb
Appendix S1 Selected environmental variables of the 88 bird
species–climate–land cover models at four different resolutions
based on generalized additive modelling (GAM).
BIOSKETCHES
Miska Luoto acts as a programme director at the Thule
Institute, University of Oulu. He is a physical geographer
interested in spatial analysis and modelling in
biogeography and geomorphology. His present research
emphasis is on the integration of climate and land cover
data in biodiversity modelling.
Raimo Virkkala acts as a senior research scientist at the
Finnish Environment Institute. He has studied the effects
of habitat changes on forest biota, and the significance of
reserve networks in preserving habitats and species
diversity. His main interests include landscape level and
scale-dependent analyses of bird species distribution
patterns.
Risto K. Heikkinen is a senior research scientist at the
Finnish Environment Institute. He has experience in
multivariate and modelling analysis of species
compositional and ecological trends. His latest research
includes assessments of nature reserve network,
conservation biology of boreal environments and impacts
of climate change on biodiversity.