The Role of International Technological Spillovers in the Economic Growth of the OECD Countries
25
Working Paper no. 6/2001 The Role of International Technological Spillovers in the Economic Growth of the OECD Countries Carmela Martín Francisco J. Velázquez Jorge Crespo The European Economy Group (EEG) was formed in 1998 within the framework of a Jean Monnet Action. Since November 2000 its activities are partially financed by the Uni2-UCM Chair on European Economy. Its objective is to undertake and promote research and other academic activities about the European integration process. The EEG Working Papers Series disseminates the original and unpublished research of its members and collaborators. More information on the EEG can be obtained on the web site http://www.ucm.es/info/econeuro . Grupo de Economía Europea European Economy Group
-
Upload
independent -
Category
Documents
-
view
0 -
download
0
Transcript of The Role of International Technological Spillovers in the Economic Growth of the OECD Countries

Working Paper no. 6/2001
The Role of International TechnologicalSpillovers in the Economic Growth of the
OECD Countries
Carmela MartínFrancisco J. Velázquez
Jorge Crespo
The European Economy Group (EEG) was formed in 1998 within the frameworkof a Jean Monnet Action. Since November 2000 its activities are partiallyfinanced by the Uni2-UCM Chair on European Economy. Its objective is toundertake and promote research and other academic activities about theEuropean integration process.
The EEG Working Papers Series disseminates the original and unpublishedresearch of its members and collaborators.
More information on the EEG can be obtained on the web sitehttp://www.ucm.es/info/econeuro.
Grupo deEconomíaEuropea
EuropeanEconomyGroup
THE ROLE OF INTERNATIONAL TECHNOLOGICAL SPILLOVERSIN THE ECONOMIC GROWTH OF THE OECD COUNTRIES(*)
Carmela MartínEuropean Economy Group - UCM and FUNCAS
Francisco J. VelázquezEuropean Economy Group - UCM and FUNCAS
Jorge CrespoEuropean Economy Group - UCM and FUNCAS
Abstract
This paper explores the role of imports as a mechanism of transmission ofinternational technological spillovers and the significance of these for the growth andeconomic convergence of the OECD countries. For this purpose a growth model isestimated that includes amongst its determinants a measure of the stock of technologicalknowledge. The results reveal first that international technological spillovers transmittedthrough imports have had a favourable influence on the economic growth of the OECDcountries, Secondly, they suggest that the capacity of countries to take advantage of thosespillovers depend on their own human and R&D capital endowments.
JEL Classification: 00, F4.Key words: International Technological Spillovers, Foreign Trade, Growth, OECD.
(*) The authors gratefully acknowledge helpful comments from participants in the "IIComplutense International Seminar: European Economic Integration. Deepening andEnlargement", Madrid, 7-8 May 2001.
Carmela Martín ([email protected])Francisco J. Velázquez ([email protected])Jorge Crespo ([email protected])European Economy GroupFacultad de Ciencias Económicas y EmpresarialesUniversidad Complutense de MadridCampus de Somosaguas28223 Madrid (Spain)
1
THE ROLE OF INTERNATIONAL TECHNOLOGICAL SPILLOVERSIN THE ECONOMIC GROWTH OF THE OECD COUNTRIES
Carmela Martín, Francisco J. Velázquez and Jorge Crespo
1. Introduction
The wealth of literature that has appeared on economic growth since the mid-
eighties has brought with it renewed interest in numerous related issues1. Amongst these
we single out the one that deals with the influence of trade on the growth of the countries
and, therefore, on the possibility that convergence processes may take place in their per
capita incomes. In this respect, the models that recognise that technology differs between
countries and has an endogenous nature are the ones in particular that have emphasised the
importance of trade for growth through underlining their potential role as a channel of
transmission of international technological spillovers2.
Thus, it may be argued that trade facilitates imitation and adoption of the technical
knowledge possessed by trading partners. In spite of the recent increase in the empirical
work3 on the issue, our knowledge of the scope of technological spillovers and the nature
of the channels of transmission is still quite meagre. Thus, evidence on the extent to which
technological spillovers are transmitted through imports is rather inconclusive. In this
respect we do not know either, as would be desirable, the extent to which such
technological spillovers contribute to the growth and convergence of the income of
countries.
1 A representative sample of this literature may be found in Barro and Sala-i-Martin (1995), Aghion andHowitt (1998) and Temple (1999).2 With this, reference is made to the positive externalities of international scope that appear to take place intechnical knowledge and by which, therefore, the technical advances that occur in some countries may bepropagated to others.3 See Coe and Helpman (1995); Coe, Helpman and Hoffmaister (1997); Engelbrecht (1997a,b); Keller (1998);Lichtenberg and van Pottelsberghe de la Potterie (1998) and Funk (2001) and references there in.

2
In this sense, this research is planned with the aim of enlarging the evidence on
these matters. Specifically, its prime objective is to explore the possible contribution of the
international technological spillovers which are transmitted through imports to the growth
of the developed countries (the members of the OECD). To achieve this objective, the
paper is structured in the following way. In section 2 we discuss the model of economic
growth which is going to be estimated to assess the effect of spillovers. For this purpose
we start off from the model used in Benhabib and Spiegel (1994), in which we introduce
some modifications in order to better specify the nature of international knowledge
diffusion. In section 3 we explain the way in which the international technological
spillovers are going to be measured and we substantiate the advantages of the measure
proposed compared with others used in previous studies. In section 4 we go on to estimate
econometrically the model for a panel data set referring to the OECD countries and the
period 1988-1998 and we comment on the results obtained. Finally, in section 5 we give a
brief summary of the paper and its main conclusions, including some considerations about
the implications for economic policy.
2. Theoretical model
In this paper we start off from a Cobb-Douglas production function, which uses the
traditional productive factors, i.e.
ititititit LKAY εβα +∆⋅+∆⋅+∆=∆ loglogloglog (1)
where Y is the production level, K the stock of physical capital, L employment, A an index
of technical efficiency and the subindices i and t the references to the country and to time,
respectively. In addition, technical progress is specified initially in the way proposed by
Benhabib and Spiegel (1994):
3
−⋅⋅+⋅+=∆
it
ittititit y
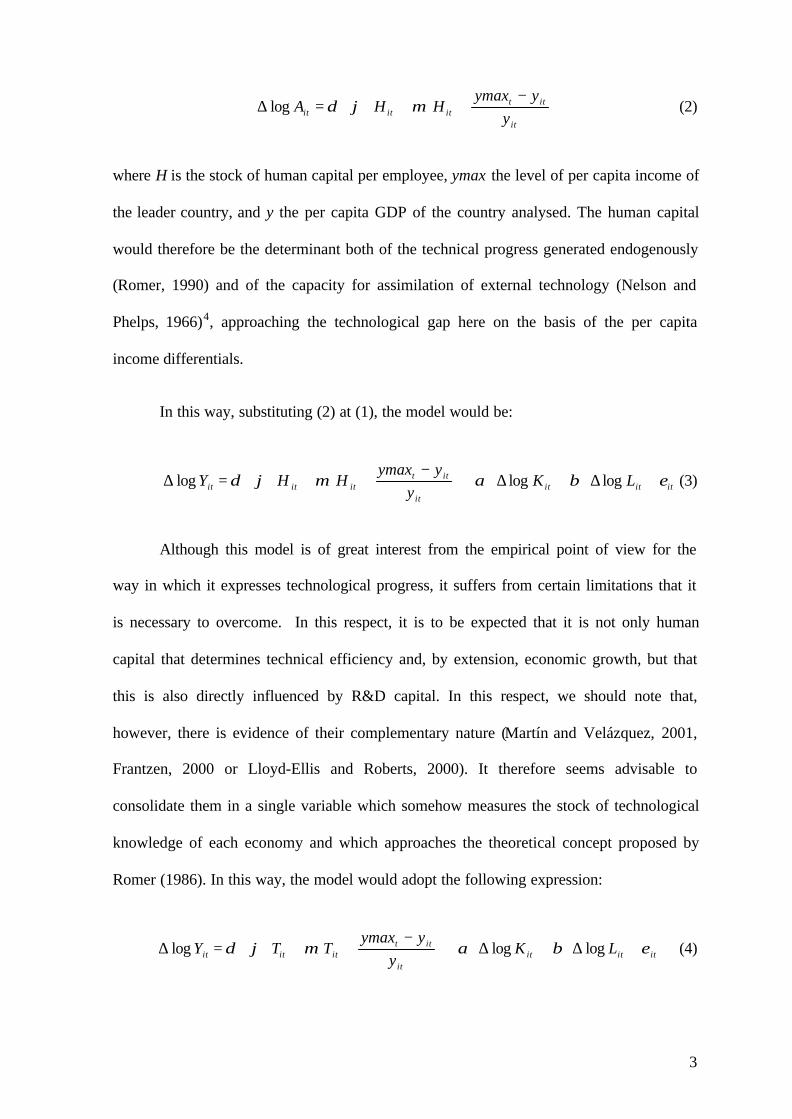
yymaxHHA µϕδlog (2)
where H is the stock of human capital per employee, ymax the level of per capita income of
the leader country, and y the per capita GDP of the country analysed. The human capital
would therefore be the determinant both of the technical progress generated endogenously
(Romer, 1990) and of the capacity for assimilation of external technology (Nelson and
Phelps, 1966)4, approaching the technological gap here on the basis of the per capita
income differentials.
In this way, substituting (2) at (1), the model would be:
itititit
ittititit LK
yyymax
HHY εβαµϕδ +∆⋅+∆⋅+
−⋅⋅+⋅+=∆ logloglog (3)
Although this model is of great interest from the empirical point of view for the
way in which it expresses technological progress, it suffers from certain limitations that it
is necessary to overcome. In this respect, it is to be expected that it is not only human
capital that determines technical efficiency and, by extension, economic growth, but that
this is also directly influenced by R&D capital. In this respect, we should note that,
however, there is evidence of their complementary nature (Martín and Velázquez, 2001,
Frantzen, 2000 or Lloyd-Ellis and Roberts, 2000). It therefore seems advisable to
consolidate them in a single variable which somehow measures the stock of technological
knowledge of each economy and which approaches the theoretical concept proposed by
Romer (1986). In this way, the model would adopt the following expression:
itititit
ittititit LK
yyymax
TTY εβαµϕδ +∆⋅+∆⋅+
−⋅⋅+⋅+=∆ logloglog (4)
4
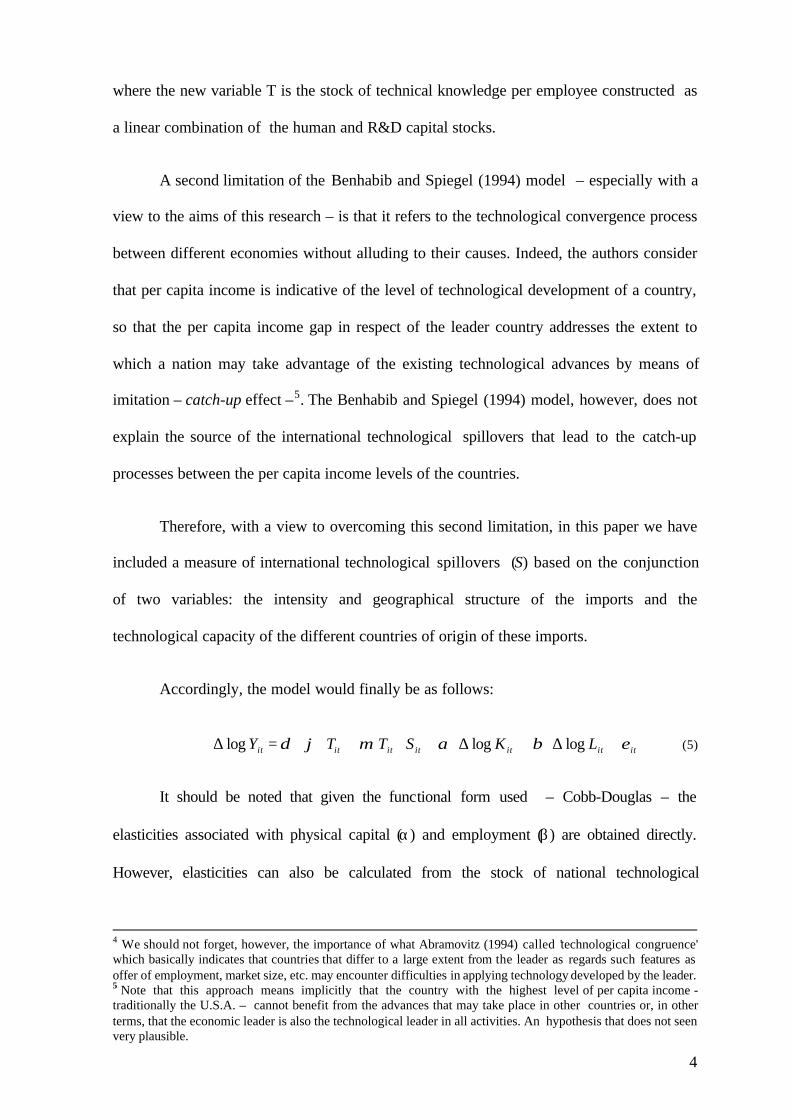
where the new variable T is the stock of technical knowledge per employee constructed as
a linear combination of the human and R&D capital stocks.
A second limitation of the Benhabib and Spiegel (1994) model – especially with a
view to the aims of this research – is that it refers to the technological convergence process
between different economies without alluding to their causes. Indeed, the authors consider
that per capita income is indicative of the level of technological development of a country,
so that the per capita income gap in respect of the leader country addresses the extent to
which a nation may take advantage of the existing technological advances by means of
imitation – catch-up effect –5. The Benhabib and Spiegel (1994) model, however, does not
explain the source of the international technological spillovers that lead to the catch-up
processes between the per capita income levels of the countries.
Therefore, with a view to overcoming this second limitation, in this paper we have
included a measure of international technological spillovers (S) based on the conjunction
of two variables: the intensity and geographical structure of the imports and the
technological capacity of the different countries of origin of these imports.
Accordingly, the model would finally be as follows:
ititititititit LKSTTY εβαµϕδ +∆⋅+∆⋅+⋅⋅+⋅+=∆ logloglog (5)
It should be noted that given the functional form used – Cobb-Douglas – the
elasticities associated with physical capital (α) and employment (β) are obtained directly.
However, elasticities can also be calculated from the stock of national technological
4 We should not forget, however, the importance of what Abramovitz (1994) called 'technological congruence'which basically indicates that countries that differ to a large extent from the leader as regards such features asoffer of employment, market size, etc. may encounter difficulties in applying technology developed by the leader.5 Note that this approach means implicitly that the country with the highest level of per capita income -traditionally the U.S.A. – cannot benefit from the advances that may take place in other countries or, in otherterms, that the economic leader is also the technological leader in all activities. An hypothesis that does not seenvery plausible.
5
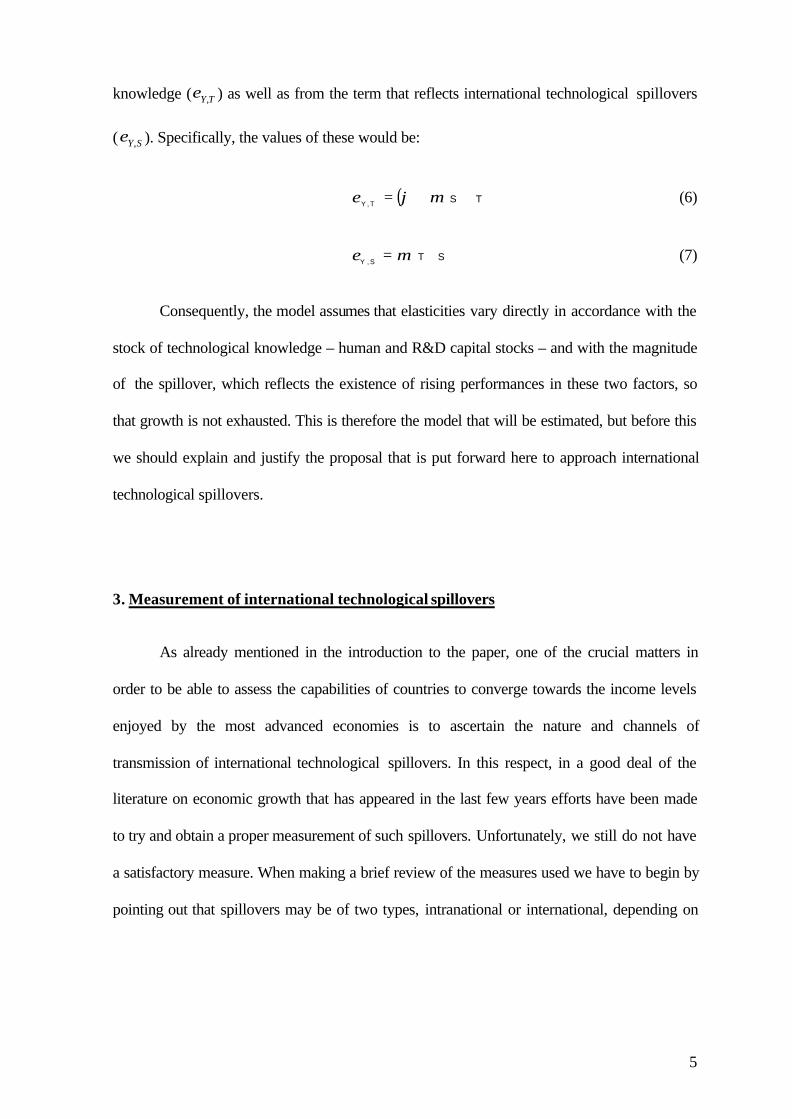
knowledge ( TY,ε ) as well as from the term that reflects international technological spillovers
( SY,ε ). Specifically, the values of these would be:
( ) TST,Y ⋅⋅+= µϕε (6)
STS,Y ⋅⋅= µε (7)
Consequently, the model assumes that elasticities vary directly in accordance with the
stock of technological knowledge – human and R&D capital stocks – and with the magnitude
of the spillover, which reflects the existence of rising performances in these two factors, so
that growth is not exhausted. This is therefore the model that will be estimated, but before this
we should explain and justify the proposal that is put forward here to approach international
technological spillovers.
3. Measurement of international technological spillovers
As already mentioned in the introduction to the paper, one of the crucial matters in
order to be able to assess the capabilities of countries to converge towards the income levels
enjoyed by the most advanced economies is to ascertain the nature and channels of
transmission of international technological spillovers. In this respect, in a good deal of the
literature on economic growth that has appeared in the last few years efforts have been made
to try and obtain a proper measurement of such spillovers. Unfortunately, we still do not have
a satisfactory measure. When making a brief review of the measures used we have to begin by
pointing out that spillovers may be of two types, intranational or international, depending on
6
the geographical context considered6. The discussion below naturally focuses on the
modelling of the latter type.
Now, international technological spillovers are usually identified with the foreign
R&D that an economy can utilise. Thus, this is the sense of the term that has been used in
some papers that have studied the effects of the existence of bilateral spillovers on growth, i.e.
the elasticities of the output of a country in respect of the R&D capital stock of another7.
Calculation of the foreign R&D capital, however, is not so immediate when, as in our case,
we are considering a larger number of countries. In fact, the specification of some sort of
weighting of the R&D capital stock of the other countries becomes unavoidable. In this
respect, Griliches (1979) suggests using some measure of what he calls 'distance' as a
weighting factor.
One way of implementing the proposal made by Griliches (1979) is that suggested
initially by Jaffe (1986), and followed by Park (1995) and Branstetter (2001). The idea that
these authors maintain is that spillovers depend on the 'technological proximity' presented by
the companies, sectors or countries analysed. Thus, they use as an indicator of this proximity
a vector where the different technological fields are represented, which is used afterwards as
weighting for calculating the stock of foreign R&D capital. This methodology, however,
suffers from the limitation of not explaining the channel of transmission of technology.
An alternative application of Griliches' (1979) proposal that does not suffer from the
afore-mentioned limitation is that used in Coe and Helpman's (1995) influential paper, who
6 Similarly, a distinction could be made between intrasectoral and intersectoral spillovers, depending on whetherthey occur between companies in the same sector or in different sectors. However, since the important thing inthis paper is to assess the aggregate role played by international spillovers in growth such a distinction isunnecessary.7 See, for instance, Bernstein and Mohnen's (1998) paper for the case of the bilateral spillovers between theU.S.A. and Japan.
7
contend that the channel of transmission of spillovers is trade8. Accordingly, they define the
foreign R&D capital stock (S) as the sum of the R&D capital stock of the supplier countries,
weighted by their share on total imports:
∑≠
⋅=ij
jtti
ijtit SKT
m
mS
.
(6)
where SKT is the stock domestic R&D capital stock, mijt the imports made by country i from
country j, mi.t the total volume of imports made by country i.
Nevertheless, in order to overcome some criticism foreign R&D capital stock obtained
in the above way has been relativized by the weight of total imports over the GDP. With this
they can capture the influence not only of the structure of imports, but also of their volume 9.
Therefore, the final proposal they put forward is, in logarithmic terms:
⋅⋅= ∑
≠ ijjt
ti
ijt
it
ijtCHit SKT
m
m
y
mS
.
log (8)
We should bear in mind, however, that this specification does not allow us to address
another very important aspect: the technological intensity of the trading partner10.
Furthermore, construction of the foreign R&D capital stock in this way has other
drawbacks that have to be considered. In this respect, Jacobs, Nahuis and Tang (1999)
point out a problem in the type of weighting used. Thus, they warn that a sudden change in
8 Another channel of transmission of technological spillovers, though rather less exploited and withoutconclusive results to date, is direct international investment. To get an idea of the current state of research into thesecond channel, the survey conducted by Blomström and Kokko (1998) and the paper by Branstetter (2000) maybe consulted.9 Similar measurements may be found in other papers, such as those by Engelbrecht (1997), Braconier andSjöholm (1998) or Keller (1999).10 To appreciate this criticism, the following example may be useful: let us suppose that country A trades withcountry B or country C only, the R&D capital stock of B being twice that of C, while the GDP of B is three timesthat of C – as a result C is technologically more intensive than B –. However, if A made the same volume ofimports from B and from C, by applying the measure put forward by Coe and Helpman (1995), the resultobtained would be that the spillover received from trading with B only is higher than that received from tradingwith C only. However, in fact, the spillover received from C is higher through having a greater degree oftechnological intensity even though the same amount is imported in both cases.
8
the structure of imports could generate a significant alteration in the foreign R&D capital.
This would be because this foreign stock is not calculated by capitalizing investments of
the country in question, i.e. by considering the past, but by weighting what other countries
possess at present. It should be borne in mind, however, that this criticism does not bear
great importance when, as happens in this case, aggregate data are used of countries in
which there is significant stability in the geographical pattern of imports.
A further problem in the measurement of foreign R&D capital proposed by Coe and
Helpman (1995) is, as pointed out by Lichtenberg and Pottelsberghe (1998), that this
measurement may be biased depending on the degree of disaggregation with which this
information is available. These authors therefore put forward an alternative formula to
minimise this bias in which the technological intensity of the exporting country is considered,
i.e.:
∑≠
⋅=ij jt
jtijtit Y
SKTmS (7)
where SKTjt is the R&D capital stock of the country j, while Yjt is the GDP of the country j.
Accordingly, in this paper we have opted for using the latter indicator as the
measure of international technological spillovers, expressed - just as the stock of
technological knowledge - in terms of employment.
9
4. Data, econometric estimation and results
The information used to estimate the model was obtained from the FUNCAS
European Studies Programme Sectoral Data Base11. This data base combines several
international statistical sources, mainly those from the OECD and EUROSTAT. The
countries that make up the sample are the 28 of the OECD – Belgium and Luxembourg are
aggregated – and the reference period is that running from 1988 to 1998.
Estimation of the different specifications of the model proposed present some
problems that have to be tackled. In the first place, it should be noted that the technical
efficiency ratio is determined by specific features of each country – legislations, cultural
aspects, etc. – which, if not taken into consideration, would create a problem of omitted
variables. However, since we have a panel data set available, it is possible to take them
into account in order to obtain consistent estimators.
The key question, however, lies – as indicated by Arellano and Bond (1990) – in
checking whether these individual effects are correlated or not with the explanatory
variables, as, if so, the within estimator should be used. To find out whether this is the
case, we have used the contrast proposed by Arellano and Bond (1990), which – unlike
Hausman's test –, is valid even if the errors are heteroscedastic and are auto-correlated12.
In addition, there may be a problem of simultaneity between the growth of output
and R&D investment – as is pointed out amongst other places in Griliches (1995) or
Crespo and Velázquez (1999) – and/or human capital – as shown by Turrión and
Velázquez (2000)–. To the extent that endogeneity biases appear in the explanatory
variables it would be better to estimate the model using the instrumental variables method.
11 The Appendix offers a detailed explanation of the original sources employed to construct the variables used inthis study.
10
Finding suitable external instruments may however prove to be difficult. A standard
solution, however, consists of using the lags of the explanatory variables as instruments
for which it is necessary to estimate the model in orthogonal deviations, i.e. subtract the
weighted value of its future mean from each variable.
Therefore, taking all these issues into account, we have proceeded first to check the
validity of the model estimated by Benhabib and Spiegel (1994) for a set of countries – the
28 forming the OECD – with smaller differences between their factorial endowments than
those arising in the sample of 78 countries that they use. The equation (3) is estimated
accordingly. Since the Arellano and Bond (1990) contrast rejects the null hypothesis of
absence of correlation between the explanatory variables and the individual effects, we
have used the within estimator. As in the case of Benhabib and Spiegel (1994), the results
obtained show a positive influence of human capital stock on economic growth, despite the
fact that the term that proxies the catch-up effect is not significant. However, as may be
appreciated, the error term is not white noise, as there is first order serial correlation,
possibly caused by the afore-mentioned problem of simultaneity.
The use of instrumental variables enables us to overcome the above-mentioned
problem, while Sargan's test validates the instruments employed. We thereby obtain –
corroborating the results of Benhabib and Spiegel (1994) – that per capita income differential
in respect of the leader has had a direct influence on the growth of the OECD countries.
12 This contrast consists of forming a system of equations combining level equations and first-differencesequations, while the equality of the level and first-differences coefficients is contrasted afterwards.
11
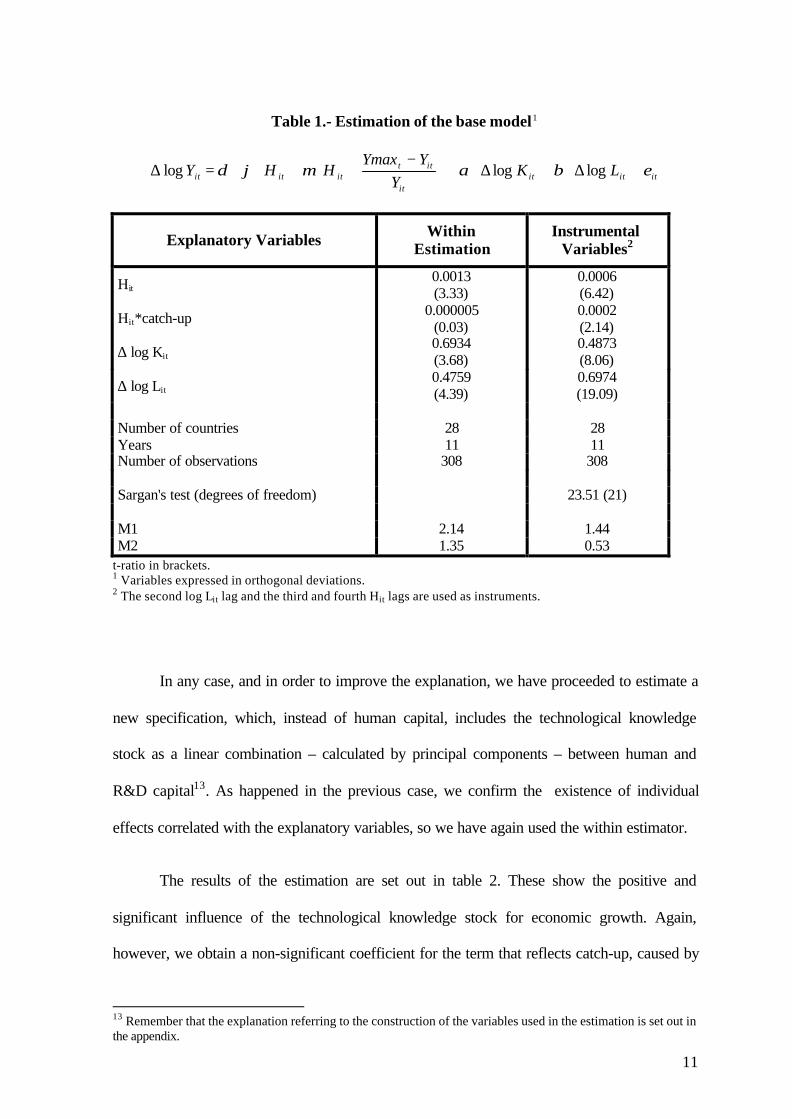
Table 1.- Estimation of the base model1
itititit
ittititit LK
YYYmax
HHY εβαµϕδ +∆⋅+∆⋅+
−⋅⋅+⋅+=∆ logloglog
Explanatory Variables WithinEstimation
InstrumentalVariables2
Hit0.0013(3.33)
0.0006(6.42)
Hit*catch-up 0.000005(0.03)
0.0002(2.14)
∆ log Kit0.6934(3.68)
0.4873(8.06)
∆ log Lit0.4759(4.39)
0.6974(19.09)
Number of countries 28 28Years 11 11Number of observations 308 308
Sargan's test (degrees of freedom) 23.51 (21)
M1 2.14 1.44M2 1.35 0.53
t-ratio in brackets.1 Variables expressed in orthogonal deviations.2 The second log Lit lag and the third and fourth Hit lags are used as instruments.
In any case, and in order to improve the explanation, we have proceeded to estimate a
new specification, which, instead of human capital, includes the technological knowledge
stock as a linear combination – calculated by principal components – between human and
R&D capital13. As happened in the previous case, we confirm the existence of individual
effects correlated with the explanatory variables, so we have again used the within estimator.
The results of the estimation are set out in table 2. These show the positive and
significant influence of the technological knowledge stock for economic growth. Again,
however, we obtain a non-significant coefficient for the term that reflects catch-up, caused by
13 Remember that the explanation referring to the construction of the variables used in the estimation is set out inthe appendix.
12
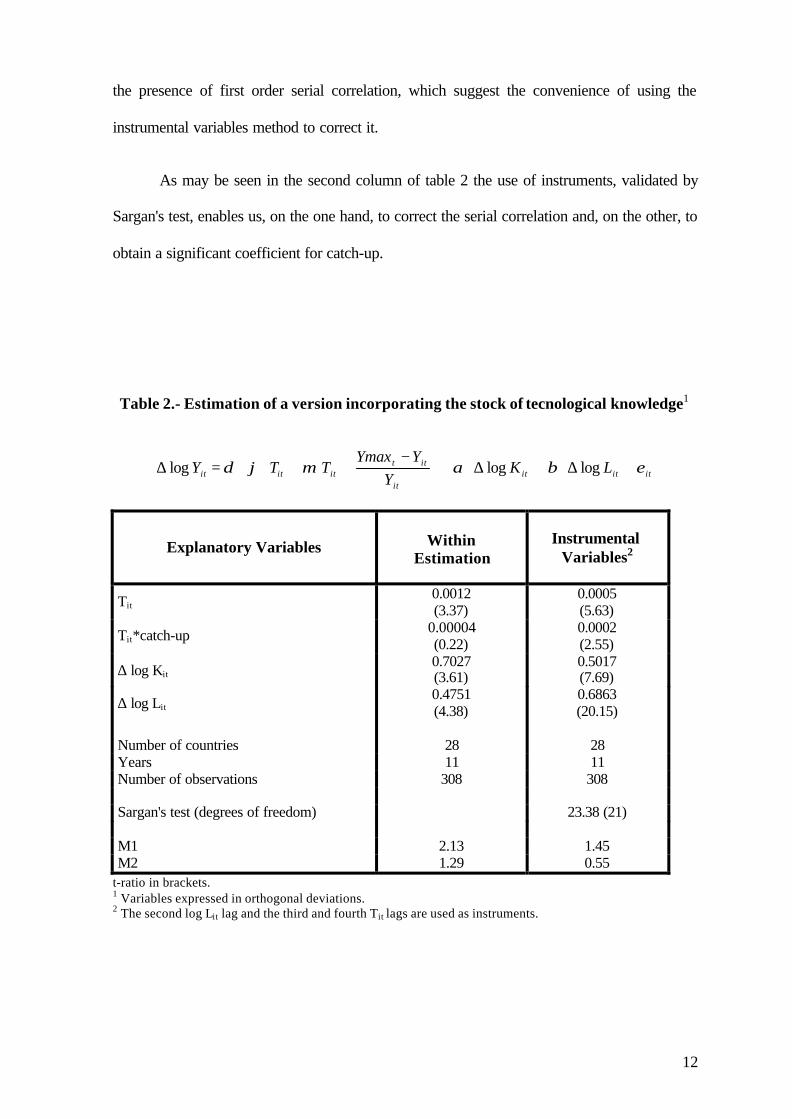
the presence of first order serial correlation, which suggest the convenience of using the
instrumental variables method to correct it.
As may be seen in the second column of table 2 the use of instruments, validated by
Sargan's test, enables us, on the one hand, to correct the serial correlation and, on the other, to
obtain a significant coefficient for catch-up.
Table 2.- Estimation of a version incorporating the stock of tecnological knowledge1
itititit
ittititit LK
YYYmax
TTY εβαµϕδ +∆⋅+∆⋅+
−⋅⋅+⋅+=∆ logloglog
Explanatory Variables WithinEstimation
InstrumentalVariables2
Tit0.0012(3.37)
0.0005(5.63)
Tit*catch-up 0.00004(0.22)
0.0002(2.55)
∆ log Kit0.7027(3.61)
0.5017(7.69)
∆ log Lit0.4751(4.38)
0.6863(20.15)
Number of countries 28 28Years 11 11Number of observations 308 308
Sargan's test (degrees of freedom) 23.38 (21)
M1 2.13 1.45M2 1.29 0.55
t-ratio in brackets.1 Variables expressed in orthogonal deviations.2 The second log Lit lag and the third and fourth Tit lags are used as instruments.
13
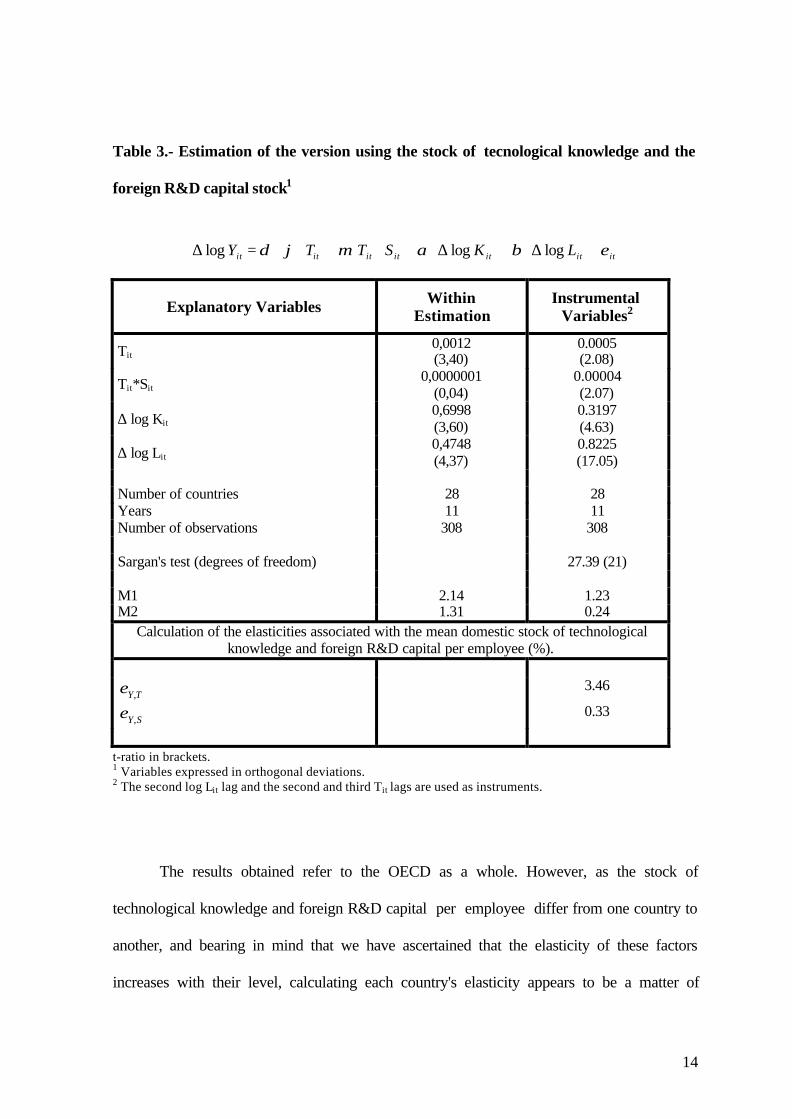
The final step has consisted of incorporating the stock of technological knowledge
along with the importance of international spillovers indicator. The results of the estimation
by instrumental variables – which may be seen in table 3 – indicate the importance that both
factors have had in the economic growth experienced by the OECD countries during the
period analysed. It is worthwhile drawing attention to the interest in this modelling, as it better
reflects, both the nature of international technological spillovers and the channel by which
they appear to be transmitted.
However, as the model estimated does not offer a direct measure of the elasticity of
output associated with stocks of technological knowledge and with spillovers, we have
proceeded to calculate it as described above. The results of this estimation are set out in table
3 and they underline a fact of great interest and significance for economic policy: the impact
of the own stock of technological knowledge, with an elasticity of 3.46%, is much greater
than that of international technological spillovers, with an elasticity of 0.33%14.
14 These results are in line with those obtained by Coe and Helpman (1995), Fagerberg and Verspagen (1999) orJacobs, Nahuis and Tang (1999), who conclude that the impact of the stock of own technological capital isgreater than that stemming from abroad. The elasticities obtained in this paper, however, are relatively lower,which may be explained by differences in the definition of certain variables, in the spectrum of countriesconsidered and in the time period.
14
Table 3.- Estimation of the version using the stock of tecnological knowledge and the
foreign R&D capital stock1
ititititititit LKSTTY εβαµϕδ +∆⋅+∆⋅+⋅⋅+⋅+=∆ logloglog
Explanatory Variables WithinEstimation
InstrumentalVariables2
Tit0,0012(3,40)
0.0005(2.08)
Tit*Sit0,0000001
(0,04)0.00004(2.07)
∆ log Kit0,6998(3,60)
0.3197(4.63)
∆ log Lit0,4748(4,37)
0.8225(17.05)
Number of countries 28 28Years 11 11Number of observations 308 308
Sargan's test (degrees of freedom) 27.39 (21)
M1 2.14 1.23M2 1.31 0.24
Calculation of the elasticities associated with the mean domestic stock of technologicalknowledge and foreign R&D capital per employee (%).
TY,ε 3.46
SY,ε 0.33
t-ratio in brackets.1 Variables expressed in orthogonal deviations.2 The second log Lit lag and the second and third Tit lags are used as instruments.
The results obtained refer to the OECD as a whole. However, as the stock of
technological knowledge and foreign R&D capital per employee differ from one country to
another, and bearing in mind that we have ascertained that the elasticity of these factors
increases with their level, calculating each country's elasticity appears to be a matter of
15
interest. For this we have used the expressions of the elasticities defined in section 2 in the
time mean of the variables for each country. The results are set out in table 4.
The values obtained corroborate the existence of increasing returns in the stock of
technological knowledge - technological and human capitals stocks-. In fact, the countries
with the lowest endowment of this type of capital -Turkey, Mexico, Portugal, Poland and
Greece - show elasticities that do not exceed 1.6%, whereas the most advanced countries -
U.S.A., Belgium-Luxembourg, Norway or Denmark, to mention a few - triple these values.
In addition, we obtain a very high correlation between import shares and the effect of
technological spillovers on growth15. This result therefore provided new evidence as to the
positive influence of imports on growth, suggesting, moreover, that the higher the
technological capacity of the trading partners, the greater this influence will be.
15 Specifically, the correlation coefficient between the relative amount of imports of each economy -Imports overGDP - and the elasticity of the technological spillovers is 0.86.

16
Table 4.- Elasticities associated with mean domestic stock of technological knowledge( TY,ε ) and foreign R&D capital per employee ( SY,ε ) for the OECD countries
(%)
Countries TY,ε SY,ε
GermanyAustraliaAustriaBelgium–LuxembourgCanadaKoreaDenmarkUSA.SpainFinlandFranceGreeceThe NetherlandsHungaryIrelandIcelandItalyJapanMexicoNorwayNew ZealandPolandPortugalUnited KingdomCzech RepublicSwedenSwitzerlandTurkey
MeanStandard deviation
4. 4543.9125.2175.9514.7671.9815.3906.1762.9573.6664.4731.5964.1991.6203.2852.6863.7024.0410.8925.4783.1821.5711.4493.6711.8664.7205.1020.452
3.5161.603
0.4460.2630.9211.8960.7170.1040.9040.2700.2280.4780.4850.0750.8590.0320.8030.3970.3190.1340.0200.8590.2410.0370.0780.3290.0280.6921.0620.003
0.4530.434
17
5. Summary and conclusions
The purpose of this paper is to advance in the knowledge of two questions of
undoubted interest with evident implications for economic policy. The former of these refers
to the importance and mechanisms of transmission of international technological spillovers
for the economic growth of the developed countries (those making up the OECD). The latter,
connected with the former, is the importance of such spillovers for economic convergence
between them.
For this purpose, we have set out from the modelling initially proposed by Benhabib
and Spiegel (1994), which is modified by means of introducing two fundamental changes.
Thus, first of all, we have included the stock of technological knowledge – constructed as a
linear combination of the R&D and human capital stocks – as a factor capable of influencing
growth, both directly and indirectly: improving the capacity of absortion of foreign
technology. Secondly, we have included an explicit measure of international technological
spillovers which combines the technological capacity of the rest of the countries and the
weight of the imports that are made from each one of them. The different specifications of the
model are estimated by means of the panel data method for the 28 countries of the OECD –
Belgium and Luxembourg are aggregated – and the period is that running between 1988 and
1998.
The results achieved reveal, first, the existence of international technological
spillovers which have had a favourable impact on the economic growth of the OECD
countries, albeit to a much lesser extent than the stock of own technological knowledge
capital. Secondly, the paper provides additional evidence that support the role of imports as a
channel of transmission of such spillovers. Finally, the most significant contribution of this
study is perhaps that of showing that the capacity of countries to take advantage of the
18
spillovers associated with the technical advances made by its trading partners largely depends
on its own human and R&D capital endowments.
From the results obtained we may therefore draw certain implications for economic
policy. Two seem to be more significant. The former is that the advisability of policies that
encourage the opening-up of trade is endorsed. The latter is that support is given to the
importance of educational and R&D policies for achieving potential improvements in
productivity and growth entailed in international technological spillovers.
19
APPENDIX:
The variables included in this paper and the sources used for their construction are set
out below:
• Real Gross Domestic Product at market prices: it is calculated on the basis of OECD
data: National Accounts. Volume I: Main Aggregates. For this purpose, we have taken
1990 as the base year and it is expressed in dollars.
• Employment : it is obtained from the OECD publication: National Accounts. Volume I:
Main Aggregates.
• Physical capital stock: it is calculated on the basis of the accumulation of investment
flows, in accordance with the perpetuary inventory method. The initial stock of capital
was estimated by means of the Harberger and Wisecarver (1977) procedure, using the
gross fixed capital formation deflator as the price index. Lastly, the depreciation rates are
taken from Beutel et al. (1992), Velázquez (1995) and EUROSTAT (1997). The Gross
Fixed Capital Formation series and their deflators are obtained from the OECD: National
Accounts. Volume I. Main Aggregates.
• R&D capital stock: it is constructed on the basis of the accumulation of R&D expenses,
using the perpetuary inventory method and assuming a depreciation rate of 10%. The use
of R&D expenses as an indicator of the degree of technological development versus the
number of patents used in other papers is due to the reasons set out in Crespo and
Velázquez (1999). The data used are taken from OECD: Research and Development
Expenditure in Industry; OECD: Basic Science and Technology Statistics; OECD: Main
Science and Technology Indicators.
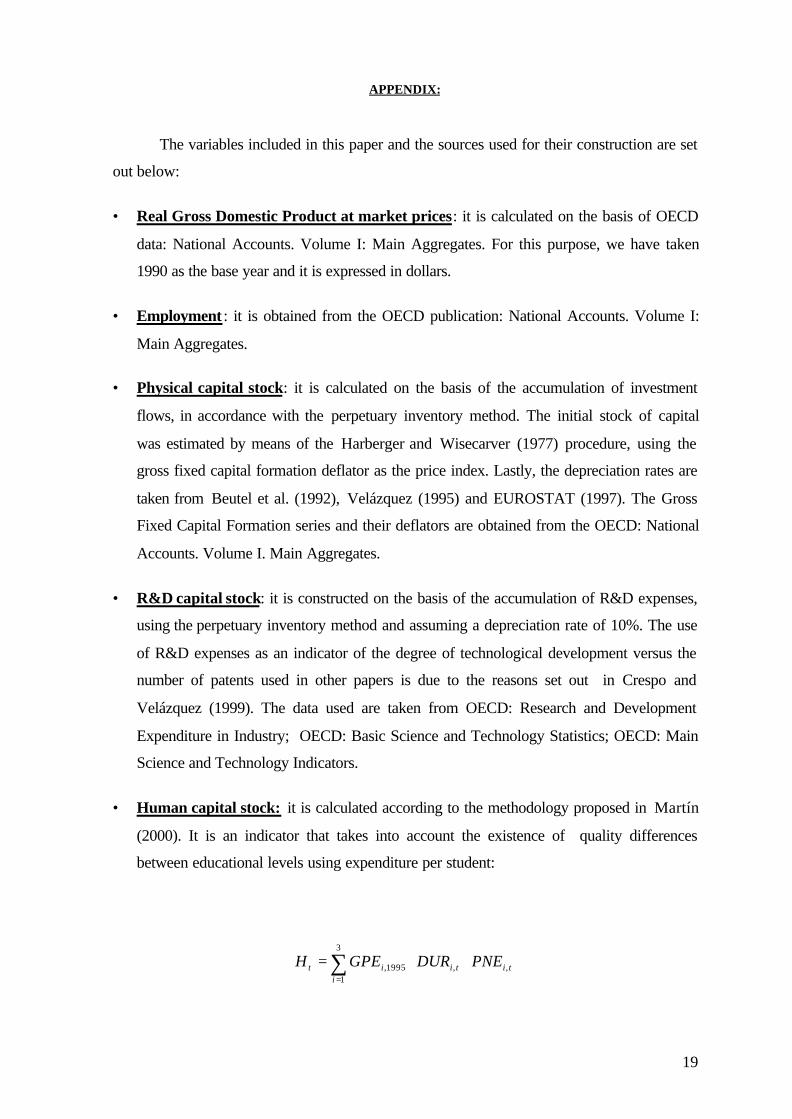
• Human capital stock: it is calculated according to the methodology proposed in Martín
(2000). It is an indicator that takes into account the existence of quality differences
between educational levels using expenditure per student:
∑=
⋅⋅=3
1,,1995,
ititiit PNEDURGPEH
20
where: GPEi,1995 is the public and private expenditure per student at educationallevel i in relation to the total education cost of a university student at theaverage for the European Union in 1995, considering all the educationallevels that he/she has had to complete to obtain his/her degree.
DURi,t is the duration pertaining to educational level i in year t.
PNEi,t is the percentage of population between the age of 25 and 64 that hascompleted educational level i in year t.
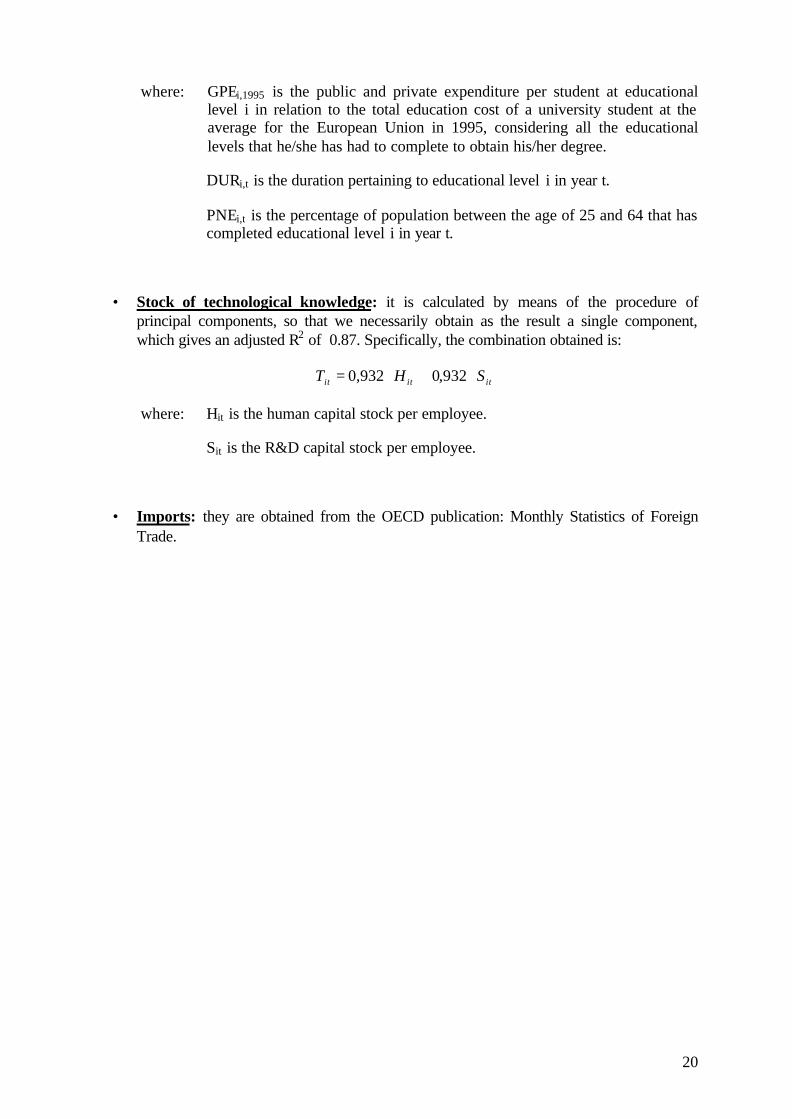
• Stock of technological knowledge: it is calculated by means of the procedure ofprincipal components, so that we necessarily obtain as the result a single component,which gives an adjusted R2 of 0.87. Specifically, the combination obtained is:
ititit SHT ⋅+⋅= 932,0932,0
where: Hit is the human capital stock per employee.
Sit is the R&D capital stock per employee.
• Imports: they are obtained from the OECD publication: Monthly Statistics of ForeignTrade.

21
REFERENCES
AGHION, P. and HOWITT, P. (1998): Endogenous growth theory, MIT Press.
ABRAMOVITZ, M.A. (1994): 'The origins of the Post-War catch-up and convergenceboom' in Fagerberg, J., Verspagen, B. and Von Tunzelmann, N. (eds.), The dynamics oftrade, technology and growth, Aldershot: Edward Elgar, pp. 21-52.
ARELLANO, M. and BOND, S. (1990): 'La econometría de datos de panel',Investigaciones Económicas (Segunda época), Vol. XIV, num. 1, pp. 3-45.
BARRO, R.J. and SALA-I-MARTIN, X. (1995): Economic growth, New York, McGraw-Hill.
BENHABIB, J. and SPIEGEL, M. (1994): 'The role of human capital in economicdevelopment. Evidence from aggregate cross-country data', Journal of MonetaryEconomics, vol. 34, pp. 143-173.
BERNSTEIN, J. and MOHNEN, P. (1998): 'International R&D spillovers between U.S.and Japanese R&D intensive sectors', Journal of International Economics, num. 44, pp.315-338.
BEUTEL, J. et al. (1992): Capital Stock Data for the European Communities. Part 1:Manual, Report to the Statistical Office of the European Communities, mimeo.
BLOMSTRÖM, M. and KOKKO, A. (1998): 'Multinational corporations and spillovers',Journal of Economic Surveys, vol. 3, num. 12, pp. 247-277.
BRACONIER, H. and SJÖHOLM, F. (1998): 'National and international spillovers fromR&D: comparing a neoclassical and an endogenous growth approach', WeltwirtschaftlichesArchiv, vol. 134, num. 4, pp. 638-663.
BRANSTETTER, L. G. (2000): Is foreign direct investment a channel of knowledgespillovers? Evidence from Japan’s FDI in the United States, Working Paper num. 8015,NBER.
BRANSTETTER, L. G. (2001): 'Are knowledge spillovers international or intranational inscope? Microeconometric evidence from the U.S. and Japan', Journal of InternationalEconomics, vol. 53, num. 1, pp. 53-79.
COE, D. and HELPMAN, E. (1995): 'International R&D spillovers', European EconomicReview, num. 39, pp. 859-887.
COE, D.; HELPMAN, E. and HOFFMAISTER, A. (1997): 'North-South R&D Spillovers',Economic Journal, vol. 107, pp. 134-149.
CRESPO, J. and VELÁZQUEZ, F.J. (1999): '¿Existen diferencias internacionales en laeficiencia del gasto en I+D?', Papeles de Economía Española, num. 81, pp. 74-85.
ENGELBRECHT, H-J (1997a): 'International R&D spillovers amongst OECD economies,Applied Economic Letters, vol. 45, pp. 315-319.
22
ENGELBRECHT, H-J (1997b): 'International R&D spillovers, human capital andproductivity in OECD countries: An empirical investigation', European Economic Review,vol. 41, num. 8, pp. 1479-1488.
EUROSTAT (1997): The Capital Stock in the European Union. Structural Diagnosis andAnalytical Aspects, EUROSTAT, Luxembourg.
FAGERBERG, J. and VERSPAGEN, B. (1999): Productivity, R&D spillovers and trade,Working Paper num. 3, TIK.
FRANTZEN, D. (2000): 'R&D, human capital and international technology spillovers: Across-country analysis', Scandinavian Journal of Economics, vol. 102, num. 1, pp. 57-75.
FUNK, M. (2001): 'Trade and International R&D Spillovers among OECD Countries',Southern Economic Journal, vol. 67, num. 3, pp. 725-736.
GRILICHES, Z. (1979): 'Issues in assessing the contribution of research and developmentto productivity growth', Bell Journal of Economics, num. 10, vol. 1, pp. 92-116.
GRILICHES, Z. (1995): 'R&D and Productivity: Econometric Results and MeasurementIssues', in Stoneman, P. (ed.), Handbook of the Economics of Innovation andTechnological Change, Blackwell, Oxford, pp. 52-89.
HARBERGER, A.C. and WISECARVER, D.L. (1977): 'Private and social rates of returnto capital in Uruguay', Economic development and cultural change, vol. 25, num. 3, April,pp. 411-446.
JACOBS, B., NAHUIS, R. and TANG, P.J.G. (1999): Sectoral productivity growth andR&D spillovers in The Netherlands, Discussion Paper num. 15, Tilburg University, Centerfor Economic Research.
JAFFE, A. B. (1986): 'Technological opportunity and spillovers of R&D: Evidence fromfirms’ patents, profits, and market value', American Economic Review, num. 76, pp. 984-1001.
KELLER, W. (1998): 'Are international R&D spillovers trade-related? Analyzingspillovers among randomly matched trade partners', European Economic Review, num.428, pp. 1469-1481.
KELLER, W. (1999): How trade patterns and technology flows affect productivity growth,Working Paper num. 6990, NBER.
LICHTENBERG, F.R. and POTTELSBERGHE DE LA POTTERIE, B. (1998):'International R&D spillovers: A comment', European Economic Review, vol. 42, num. 8,pp. 1483-1491.
LLOYD-ELLIS, H. and ROBERTS, J. (2000): Twin engines of growth, Working Papernum. 118, CREFE.
MARTIN, C. and VELÁZQUEZ, F.J. (2001): 'Determinants of net trade flows in theOECD: New evidence with special emphasis on the former communist members', Reviewof International Economics, Forthcoming.
23
MARTIN, C. (2000): The Spanish Economy in the New Europe, Macmillan Press Ltd.,UK and St. Martin's Press, Inc., USA.
NELSON, R.R. and PHELPS, E. (1966): 'Investment in humans, technological diffusion,and economic growth', American Economic Review, num. 56, pp. 69-75.
PARK, W.G. (1995): 'International R&D spillovers and OECD economic growth',Economic Inquiry, num. 33, pp. 571-591.
ROMER, P.M. (1986): 'Increasing Returns and Long-Run Growth', Journal of PoliticalEconomy, vol. 94, num. 5, October, pp. 1002-1037.
ROMER, P.M. (1990): 'Endogenous technological change', Journal of Political Economy,vol. 98, num. 5, October, pp. 71-102.
TEMPLE, J. (1999): 'The new growth evidence', Journal of Economic Literature, vol.XXXVII, pp. 112-156.
TURRIÓN, J. and VELÁZQUEZ, F.J. (2000): 'Las perspectivas de crecimiento de lademanda educativa en España y la Unión Europea', Papeles de Economía Española, num.86, pp. 225-235.
VELÁZQUEZ, F.J. (1995): Medición y evolución sectorial del stock de capital de Españay los países centrales de la Unión Europea, Working Paper num. 119/1995, FundaciónFIES, Madrid.