The Role of Green and Traditional Supplier Attributes ... - MDPI
16
sustainability Article The Role of Green and Traditional Supplier Attributes on Business Performance José Roberto Mendoza-Fong 1, *, Jorge Luis García-Alcaraz 2 ID , José Roberto Díaz-Reza 1 , Juan Carlos Sáenz Diez Muro 3 and Julio Blanco Fernández 4 ID 1 Department of Electrical Engineering and Computing, Universidad Autónoma de Ciudad Juárez, Ciudad Juárez 32310, Mexico; [email protected] 2 Department of Industrial Engineering and Manufacturing, Universidad Autónoma de Ciudad Juárez, Ciudad Juárez 32310, Mexico; [email protected] 3 Department of Electrical Engineering, Universidad de La Rioja, 26004 Logroño, Spain; [email protected] 4 Department of Mechanical Engineering, Universidad de La Rioja, 26004 Logroño, Spain; [email protected] * Correspondence: [email protected]; Tel.: +52-656-6884841 Received: 5 July 2017; Accepted: 22 August 2017; Published: 26 August 2017 Abstract: Supplier evaluation and selection are fundamental tasks since they are part of the production process and even initiate the supply chain (SC). Despite their importance in the production system, supplier evaluation and selection may be challenging activities to be performed if companies look at the wide range of available evaluation techniques and methodologies, which now seek to integrate both traditional and green attributes. In addition, companies may refuse to take into account green attributes during the supplier selection process, because they do not know their impact on commercial benefits. To overcome this limitation, this study examines the Mexican manufacturing sector and measures the impact of supplier traditional attributes and green attributes on business performance, namely production process benefits and commercial benefits. As data collection instrument, we administered a survey to 253 supplier evaluators and selectors; then, using the gathered data, we constructed a structural equation model. The model includes four variables to determine the impact of traditional and green attributes on business performance: green attributes, traditional attributes, production process benefits, and commercial benefits. The results indicate that all the latent variables have positive direct effects on one another. For instance, process benefits show the largest effects on commercial benefits, but the most significant effect is caused by traditional attributes on commercial benefits through green attributes and production process benefits. Keywords: traditional attributes; structural equations model; supplier selection; commercial benefits and green attributes 1. Introduction Supplier selection is a key to the successful development of a supply chain (SC) [1] and promotes effective buyer–supplier collaboration. To ensure this effective partnership and guarantee appropriate integration levels, companies pay careful attention to the vendors they select [2]. In addition, growing public awareness of environmental issues has favored the incorporation of green and socially responsible practices in the SC [3]. In other words, to improve their interaction with the ecosystems and reduce their ecological footprint, companies implement sustainable strategies in diverse SC activities, including materials procurement, production, consumption, and services, among others [4]. As a response to public environmental concerns and the growing use of sustainable practices along SCs, the concept of green supply chain management (GSCM) emerged as a philosophy to help Sustainability 2017, 9, 1520; doi:10.3390/su9091520 www.mdpi.com/journal/sustainability
-
Upload
khangminh22 -
Category
Documents
-
view
0 -
download
0
Transcript of The Role of Green and Traditional Supplier Attributes ... - MDPI

sustainability
Article
The Role of Green and Traditional SupplierAttributes on Business Performance
José Roberto Mendoza-Fong 1,*, Jorge Luis García-Alcaraz 2 ID , José Roberto Díaz-Reza 1,Juan Carlos Sáenz Diez Muro 3 and Julio Blanco Fernández 4 ID
1 Department of Electrical Engineering and Computing, Universidad Autónoma de Ciudad Juárez,Ciudad Juárez 32310, Mexico; [email protected]
2 Department of Industrial Engineering and Manufacturing, Universidad Autónoma de Ciudad Juárez,Ciudad Juárez 32310, Mexico; [email protected]
3 Department of Electrical Engineering, Universidad de La Rioja, 26004 Logroño, Spain;[email protected]
4 Department of Mechanical Engineering, Universidad de La Rioja, 26004 Logroño, Spain;[email protected]
* Correspondence: [email protected]; Tel.: +52-656-6884841
Received: 5 July 2017; Accepted: 22 August 2017; Published: 26 August 2017
Abstract: Supplier evaluation and selection are fundamental tasks since they are part of theproduction process and even initiate the supply chain (SC). Despite their importance in the productionsystem, supplier evaluation and selection may be challenging activities to be performed if companieslook at the wide range of available evaluation techniques and methodologies, which now seek tointegrate both traditional and green attributes. In addition, companies may refuse to take into accountgreen attributes during the supplier selection process, because they do not know their impact oncommercial benefits. To overcome this limitation, this study examines the Mexican manufacturingsector and measures the impact of supplier traditional attributes and green attributes on businessperformance, namely production process benefits and commercial benefits. As data collectioninstrument, we administered a survey to 253 supplier evaluators and selectors; then, using thegathered data, we constructed a structural equation model. The model includes four variables todetermine the impact of traditional and green attributes on business performance: green attributes,traditional attributes, production process benefits, and commercial benefits. The results indicate thatall the latent variables have positive direct effects on one another. For instance, process benefits showthe largest effects on commercial benefits, but the most significant effect is caused by traditionalattributes on commercial benefits through green attributes and production process benefits.
Keywords: traditional attributes; structural equations model; supplier selection; commercial benefitsand green attributes
1. Introduction
Supplier selection is a key to the successful development of a supply chain (SC) [1] and promoteseffective buyer–supplier collaboration. To ensure this effective partnership and guarantee appropriateintegration levels, companies pay careful attention to the vendors they select [2]. In addition,growing public awareness of environmental issues has favored the incorporation of green and sociallyresponsible practices in the SC [3]. In other words, to improve their interaction with the ecosystems andreduce their ecological footprint, companies implement sustainable strategies in diverse SC activities,including materials procurement, production, consumption, and services, among others [4].
As a response to public environmental concerns and the growing use of sustainable practicesalong SCs, the concept of green supply chain management (GSCM) emerged as a philosophy to help
Sustainability 2017, 9, 1520; doi:10.3390/su9091520 www.mdpi.com/journal/sustainability
Sustainability 2017, 9, 1520 2 of 16
organizations reduce their ecological footprint and increase environmental efficiency without failingto obtain the desired business benefits [5,6]. GSCM has had a significant and positive impact oncompanies as it allows compliance with government regulations. It contributes to a greener corporateimage and improves performance, which in turn helps to reap benefits that can later translate intogreater financial or economic benefits [7–9]. Companies integrating greening in their supply chaindiffers from others that originally concentrated their efforts exclusively on operational and economicaspects and neglected the social and environmental implications of their operations [10]. In addition,GSCM is a competitive advantage for companies [11] and thus improves the SC [12].
The supplier selection process involves a series of activities, such as supplier identification,analysis, evaluation, and selection [13]. Since the 1960s, research has strived to identify the keysupplier attributes; however, for a long time, vendors were traditionally evaluated under financialmeasures only [3]. In recent years, the rising popularity of green practices has encouraged companies tocomplement traditional supplier selection criteria, such as quality, delivery times, and costs, with greenattributes. Environmental concerns have become public concerns, and thus environmentally-friendlypractices have turned into strategic measures to select potential vendors [13]. For this reason,a successful SC is closely related to correct supplier selection [14].
The primary goal of this research is to help manufacturing industries improve their supplierevaluation and selection processes. In addition, with this work, we seek to quantitatively measurethe relationships among green supplier attributes, traditional supplier attributes, production processbenefits, and commercial benefits. In this sense, previous research works have found that consideringsupplier attributes has a positive impact on production process benefits [15], but the impact fromthose green attributes on benefits is not measured and this is the main contribution in this paper.Therefore, the second goal of this research is to determine if the consideration of both types ofattributes, traditional and green, leads to the achievement of some benefit in production processor commercial, as well as quantitatively determine the positive impacts that exist between the fourvariables, given a dependence measurement.
1.1. Supplier Evaluation Techniques
Supplier selection refers to choosing the best supplier from a set to acquire the necessary materialsto support the outputs of a company. Supplier selection can be a challenging process, since it is affectedby a broad range of factors, both predictable and unpredictable. Moreover, suppliers can be verydifferent from one another [16]. For such reasons, some studies argue that companies must take intoaccount two elements for supplier selection and evaluation: the selection and evaluation criteria andthe selection and evaluation method [17]. In order to evaluate a supplier, companies can employdistinct methods [18] and integrate a wide range of attributes related to costs, quality, delivery times,social responsibility, green certifications, and reliability, among others. Unfortunately, some of theseattributes can be in conflict with one another [19]. Among the most common approaches to evaluatingsuppliers, we find immersive analysis, interpretive structural modeling, multi-attribute deterministicmodeling, mathematical programming, analytic hierarchy process (AHP), fuzzy goal programming,TOPSIS (Technique for Order-Preference by Similarity to Ideal Solution), and VIKOR (the Serbianname is “VIšekriterijumsko KOmpromisno Rangiranje” which means multi-criteria optimizationand compromise solution) [20,21]. In addition, companies tend to monitor supplier development toidentify, measure, and improve their performance and support the continuous improvement of thetotal value of goods and services within the SC. However, studies have concluded that AHP, fuzzygoal programming, and mathematical programming stand out as the most popular supplier selectionmethods [22].
1.2. Traditional Attributes for Supplier Selection
Since the 1960s, research on supplier selection has emphasized on attributes such as quality [23,24],delivery times [25], performance history [26], and costs [27]. Then, recent works analyzed the role of
Sustainability 2017, 9, 1520 3 of 16
these criteria under modern industrial environments and concluded that supplier selection nowadaysrelies more on such indicators as supplier technological capability [28], after-sales service [11,29],e-commerce [30], and quality and costs in a global market [31]. Such findings reveal that, althoughsupplier selection has traditionally based on financial and service-related measures, recent concernsregarding the environmental and social implications of industrial activities have promoted theincorporation of both green and social attributes into traditional supplier evaluation methods [32].
1.3. Green Attributes in Supplier Selection
Recent literature and major trends in environmental management motivate the scientificcommunity to research on the inclusion of environmental, social, and economic attributes into thesupplier selection process [33,34]. This new sustainable approach to supplier selection became a trendas a result of customer demands, growing public concerns regarding environmental protection, andlegal regulations. All these factors contribute to the view of sustainability as a business challenge anda competitive advantage [35,36] requested by both the government and private institutions [37,38].
There is a large variety of green attributes to be considered in supplier selection. Although it isdifficult to rank their importance, and each company utilizes those that suit them best, some of themost common attributes include green certification [39], green image [40], green design [41], socialresponsibility [26,29], clean production [24], and green manufacturing [42]. Many experts agree thatsuch criteria play a crucial role in the supplier selection process under a green approach, yet researchhas failed to systematize, categorize, and detail a contextual framework for supplier selection thatcombines both environmental and traditional supplier attributes [43]. As a result, traditional attributesremain at the core of supplier evaluation. However, when green or environmental attributes areintegrated into the supplier selection process, many more evaluation criteria are required, especiallyto fulfill governmental and social regulations [34]. For this reason, we construct the first workinghypothesis of our study as follows:
H1: In the manufacturing industry, Traditional Supplier Attributes have a positive direct effect onGreen Supplier Attributes.
1.4. Production Process Benefits from Supplier Selection
Companies that select and evaluate suppliers through traditional criteria such as costs, quality,delivery times, and just in time (JIT) [44], among others, look for continuous improvement in processesand products to face competition. Moreover, vendors assessed by traditional attributes help companiesreach performance objectives by operating effectively and efficiently [15,45]. In addition, the modernmanufacturing industry seeks to reduce costs of raw materials, increase production efficiency, andreduce expenses [46,47]. In this sense, manufacturing companies can be sure that their productionprocess, products, and SCs will succeed as long as the suppliers selected using traditional attributes areactively involved in the different production process stages [15]. In addition, the use of high-quality rawmaterials brings manufacturers numerous benefits, including waste, defect and rework reduction. Suchbenefits in turn help an organization to make profits and improve process efficiency [48]. Followingthis discussion, we propose the second working hypothesis of our study as follows:
H2: In the manufacturing industry, Traditional Supplier Attributes have a positive direct effect onProduction Process Benefits.
Due to government regulations, customer exigencies, competitors, and the increasing popularityof environmental management, traditional supplier attributes are insufficient when choosing thebest supplier. Nowadays, modern production systems ask companies and vendors to be activelyinvolved in more environmentally-friendly practices, including green and clean production [31,45],end-of-life processing (recycling), and full compliance with local environmental regulations [49]. Inaddition, manufacturers are encouraged to increase supplier capability to modify the design andproduction processes and thus reduce their environmental impact [44,50]. All the supplier greenattributes contribute to a less polluting production process and a cheaper recycling process. Moreover,

Sustainability 2017, 9, 1520 4 of 16
they are a means to avoid legal environmental sanctions [47,50]. Thus, considering the impact of greenattributes on business performance, namely the production process, we propose the third workinghypothesis of our research as follows:
H3: In the manufacturing industry, Green Supplier Attributes have a positive direct effect onProduction Process Benefits.
1.5. Commercial Benefits Gained from Supplier Selection
Some manufacturing companies still evaluate suppliers exclusively through financial-relatedattributes (e.g., quality and costs), yet this approach may not be completely effective by itself [51].As mentioned earlier, suppliers must also be evaluated under other criteria, such as delivery times andafter-sales service, especially to solve complaints and respond to warrants [52]. For instance, if a vendorfails to deliver raw materials on time, the production process may be abruptly interrupted, and timelyproduct deliveries can be compromised [51]. This problem usually arises when manufacturing systemsurgently require materials, but the supplying company is incapable of providing them when requested.Therefore, to avoid any potential harm to the manufacturer’s production system, suppliers mustcomply with a wide range of standards. Such standards must be measured through correct attributesif companies wish to gain the expected benefits (e.g., improved corporate image, economic profits, andmarket expansion) [53]. Following this discussion, we propose the fourth working hypothesis of ourstudy below:
H4: In the manufacturing industry, Traditional Supplier Attributes have a positive direct effect onCommercial Benefits.
Current trends in environmental protection force manufacturing systems to go beyond traditionalsupplier selection methods to incorporate green attributes into a more holistic evaluation approach [31].Three of the most common green supplier attributes are green certifications, green practices,and compliance with required environmental regulations [39]. A more sustainable approachto supplier selection contributes to projecting a green corporate image for customers and SCpartners [24,40]. In addition, manufacturing companies that evaluate suppliers through green attributescan take advantage of the benefits of their environmental management practices in their productionprocesses, which are geared toward generating new environmentally-friendly products [54]. Similarly,manufacturers would enjoy the new green image they have fostered, benefit from noticeably marketexpansion, and promote a sociably responsible culture among SC partners, thereby constructing a solid,green SC [4]. Taking into account the impact of green attributes on commercial benefits, we constructthe fifth working hypothesis of our study below:
H5: In the manufacturing industry, Green Supplier Attributes have a positive direct effect onCommercial Benefits.
The production process benefits obtained from green supplier selection can be easilytransformed into commercial benefits. When manufacturing companies produce high-quality andenvironmentally-friendly products, they automatically improve their corporate image, expand market,and increase their gains [41,55]. As an example, manufacturing companies that use timely delivered,low-cost, and high-quality raw materials are acknowledged by customers, guarantee timely productdeliveries, and stand as reliable enterprises [2,56]. Additionally, if manufacturers work on buildinga green image, they can successfully stand as socially responsible organizations as well. Therefore,considering the impact of production process benefits as a result of appropriate supplier selection overcommercial benefits, we propose the last working hypothesis of our research as follows:
H6: In the manufacturing industry, the Production Process Benefits obtained from supplier selectionhave a positive direct effect on Commercial Benefits.
2. Methodology
To provide a comprehensive report of the research approach adopted in this study, we dividedthis section into five main stages, thoroughly explained in the following paragraphs.
Sustainability 2017, 9, 1520 5 of 16
2.1. Stage 1. Questionnaire Design and Administration
To know the importance of green and traditional supplier attributes to manufacturing companiesand identify the impact of such attributes on commercial and production process benefits, weinterviewed workers directly involved in the supplier selection process. To collect the necessarydata, we designed and administered a questionnaire. To design the questionnaire, we conducted aliterature review in different databases and searched for information related to the most commonlyassessed green and traditional supplier attributes and their reported benefits. This literature reviewwas the rational validation of the questionnaire.
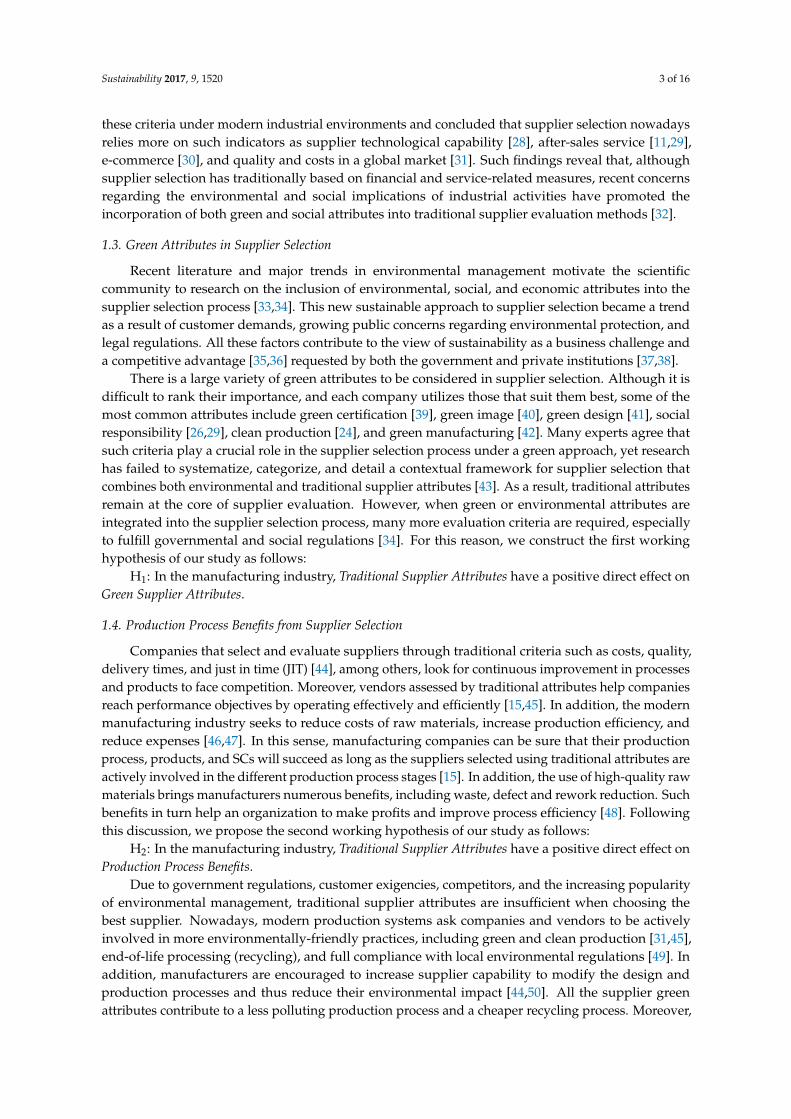
The questionnaire was composed of three sections. The first section included an introductionparagraph describing the research goal and the purpose of the survey. In addition, the section includedsociodemographic questions regarding age, genre, job position, years of work experience, companysize, and manufacturing sectors. On the other hand, the second section of the questionnaire included18 questions to assess 18 supplier attributes—green and traditional. As mentioned earlier, suchattributes were identified in the literature review and are listed in Table 1. The questions regardingthese attributes were answered using a five-point Likert scale, whose lowest value (1) indicated thatan attribute was not at all important to a company during the supplier selection process, whereasthe highest value (5) implied that the attribute was highly important. Finally, the third section of thequestionnaire was composed of 11 questions that analyzed the commercial and production processbenefits obtained from supplier selection. For this part of the questionnaire, we took the surveydeveloped by [57] as a guide. As in the second section of the questionnaire, questions in this sectionwere answered using a five-point Likert scale.
To differentiate the concepts and latent variables here analyzed, the traditional attributes in asupplier are those that serve to evaluate the performance, quality and the cost, on the process andproduct [24,40]. However, green attributes evaluate the environmental business practices, impactsof business operations associated to environment, environmental management and environmentalperformance [6,39]. The production process benefits serve companies to meet the performanceobjectives in production lines, increase efficiency and effectiveness as the quality of the products,delivery time and waste reduction [15,47]. In addition, the commercial benefits serve the companies toimprove the corporate image, expand their markets and increase economic earnings [41,53]. Table 1illustrates the list of items for every latent variable and some references justifying its integration.
Table 1. Attributes and Benefits.
Traditional Attributes Green Attributes
Economic Stability [15,58] Green Image [4,40]Green Manufacturing [42,59]
Production Process Flexibility [40,55] Green Design [7,41]Just in Time (JIT) Implementation [29,44] Recycling System [31,49]Product Cost [31,55] Green Certification [39,60]Business Experience [11,30] Environmental Costs [38,44]Previous Contracts [38,55] Control of Pollutant Emissions [40,61]
Employee Capacity Building [15,58] Social Responsibility [26,29]Clean Production [24,31]
Problem Solving Capacity [29,49] Green Process Management [4,58,61]
Production Process Benefits Commercial Benefits
Decreased Quality Problems [40,62] Market Expansion to Local Areas [15,42]
Waste Minimization [2,26]Green Corporate Image [20,63]Market Expansion to National Areas [15,26]
Shorter Delivery Times [2,15] Increased Economic Earnings [41,64]
Decreased Customer Complaints [41,65] Economic Earnings [41,66]Supply Chain Improvements [58,65]
Sustainability 2017, 9, 1520 6 of 16
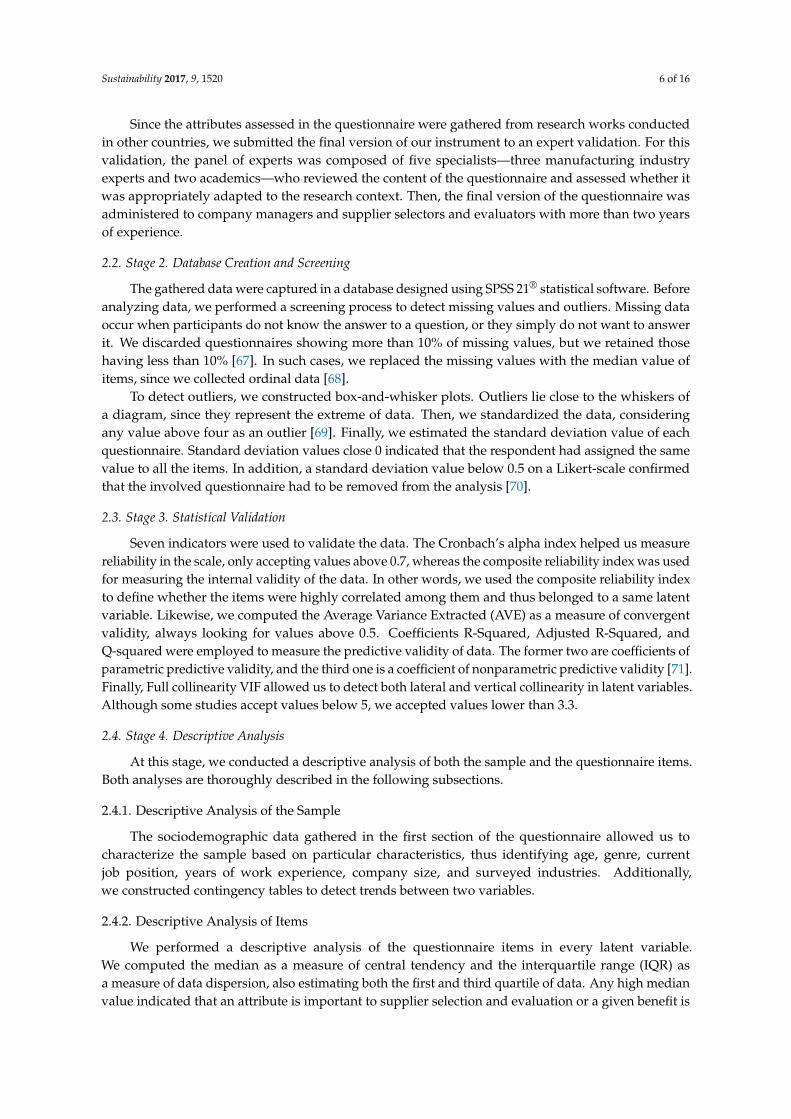
Since the attributes assessed in the questionnaire were gathered from research works conductedin other countries, we submitted the final version of our instrument to an expert validation. For thisvalidation, the panel of experts was composed of five specialists—three manufacturing industryexperts and two academics—who reviewed the content of the questionnaire and assessed whether itwas appropriately adapted to the research context. Then, the final version of the questionnaire wasadministered to company managers and supplier selectors and evaluators with more than two yearsof experience.
2.2. Stage 2. Database Creation and Screening
The gathered data were captured in a database designed using SPSS 21® statistical software. Beforeanalyzing data, we performed a screening process to detect missing values and outliers. Missing dataoccur when participants do not know the answer to a question, or they simply do not want to answerit. We discarded questionnaires showing more than 10% of missing values, but we retained thosehaving less than 10% [67]. In such cases, we replaced the missing values with the median value ofitems, since we collected ordinal data [68].
To detect outliers, we constructed box-and-whisker plots. Outliers lie close to the whiskers ofa diagram, since they represent the extreme of data. Then, we standardized the data, consideringany value above four as an outlier [69]. Finally, we estimated the standard deviation value of eachquestionnaire. Standard deviation values close 0 indicated that the respondent had assigned the samevalue to all the items. In addition, a standard deviation value below 0.5 on a Likert-scale confirmedthat the involved questionnaire had to be removed from the analysis [70].
2.3. Stage 3. Statistical Validation
Seven indicators were used to validate the data. The Cronbach’s alpha index helped us measurereliability in the scale, only accepting values above 0.7, whereas the composite reliability index was usedfor measuring the internal validity of the data. In other words, we used the composite reliability indexto define whether the items were highly correlated among them and thus belonged to a same latentvariable. Likewise, we computed the Average Variance Extracted (AVE) as a measure of convergentvalidity, always looking for values above 0.5. Coefficients R-Squared, Adjusted R-Squared, andQ-squared were employed to measure the predictive validity of data. The former two are coefficients ofparametric predictive validity, and the third one is a coefficient of nonparametric predictive validity [71].Finally, Full collinearity VIF allowed us to detect both lateral and vertical collinearity in latent variables.Although some studies accept values below 5, we accepted values lower than 3.3.
2.4. Stage 4. Descriptive Analysis
At this stage, we conducted a descriptive analysis of both the sample and the questionnaire items.Both analyses are thoroughly described in the following subsections.
2.4.1. Descriptive Analysis of the Sample
The sociodemographic data gathered in the first section of the questionnaire allowed us tocharacterize the sample based on particular characteristics, thus identifying age, genre, currentjob position, years of work experience, company size, and surveyed industries. Additionally,we constructed contingency tables to detect trends between two variables.
2.4.2. Descriptive Analysis of Items
We performed a descriptive analysis of the questionnaire items in every latent variable.We computed the median as a measure of central tendency and the interquartile range (IQR) asa measure of data dispersion, also estimating both the first and third quartile of data. Any high medianvalue indicated that an attribute is important to supplier selection and evaluation or a given benefit is
Sustainability 2017, 9, 1520 7 of 16
always obtained from supplier selection and evaluation. On the other hand, a low median value in anitem indicated that an attribute is not important to supplier selection and evaluation or a given benefitis never obtained from supplier selection and evaluation. Finally, as for the IQR, high values indicatedlow consensus among the respondents regarding the median value of an item, while low IQR valuesindicated high consensus among the participants [72].
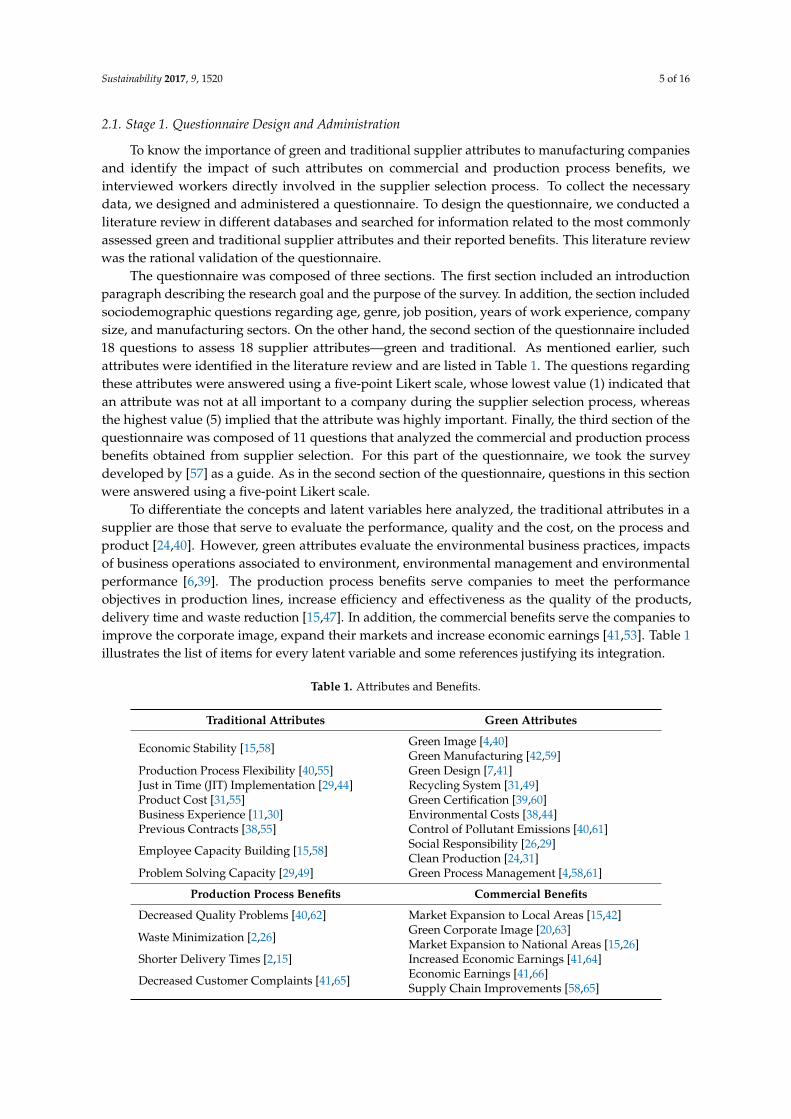
2.5. Stage 5. Structural Equations Modelling
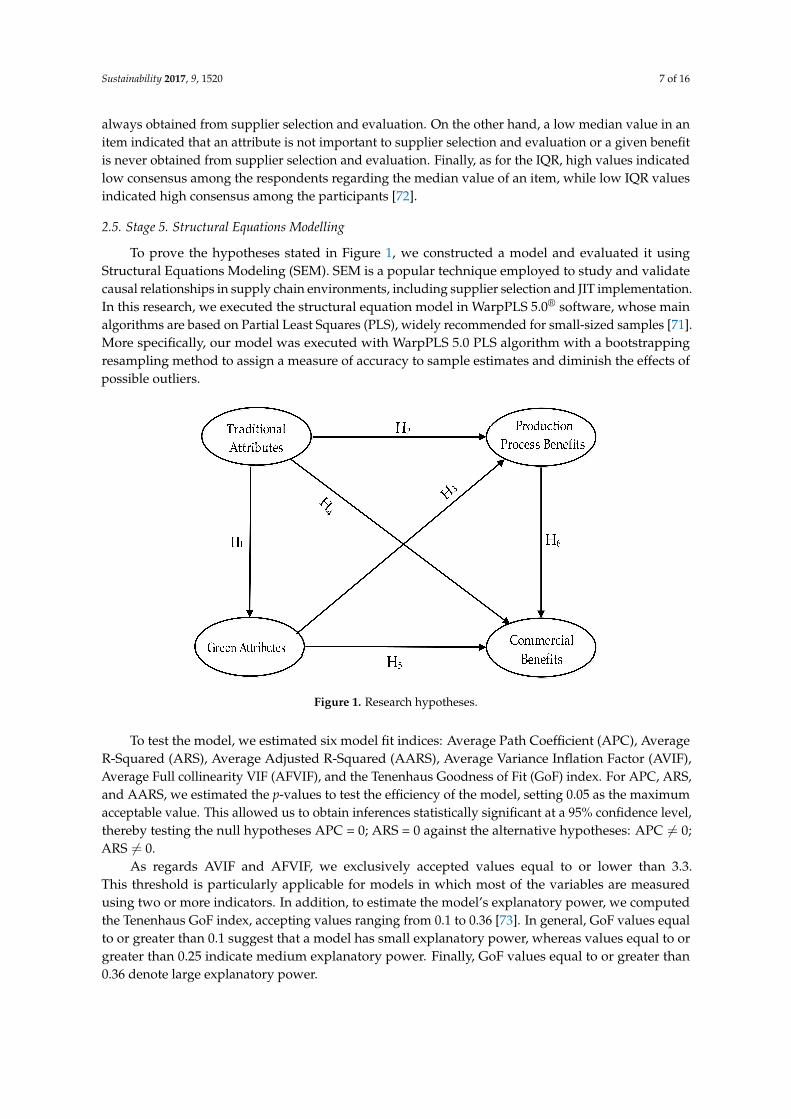
To prove the hypotheses stated in Figure 1, we constructed a model and evaluated it usingStructural Equations Modeling (SEM). SEM is a popular technique employed to study and validatecausal relationships in supply chain environments, including supplier selection and JIT implementation.In this research, we executed the structural equation model in WarpPLS 5.0® software, whose mainalgorithms are based on Partial Least Squares (PLS), widely recommended for small-sized samples [71].More specifically, our model was executed with WarpPLS 5.0 PLS algorithm with a bootstrappingresampling method to assign a measure of accuracy to sample estimates and diminish the effects ofpossible outliers.
Sustainability 2017, 9, 1520 7 of 15
indicated low consensus among the respondents regarding the median value of an item, while low IQR values indicated high consensus among the participants [72].
2.5. Stage 5. Structural Equations Modelling
To prove the hypotheses stated in Figure 1, we constructed a model and evaluated it using Structural Equations Modeling (SEM). SEM is a popular technique employed to study and validate causal relationships in supply chain environments, including supplier selection and JIT implementation. In this research, we executed the structural equation model in WarpPLS 5.0® software, whose main algorithms are based on Partial Least Squares (PLS), widely recommended for small-sized samples [71]. More specifically, our model was executed with WarpPLS 5.0 PLS algorithm with a bootstrapping resampling method to assign a measure of accuracy to sample estimates and diminish the effects of possible outliers.
Figure 1. Research hypotheses.
To test the model, we estimated six model fit indices: Average Path Coefficient (APC), Average R-Squared (ARS), Average Adjusted R-Squared (AARS), Average Variance Inflation Factor (AVIF), Average Full collinearity VIF (AFVIF), and the Tenenhaus Goodness of Fit (GoF) index. For APC, ARS, and AARS, we estimated the p-values to test the efficiency of the model, setting 0.05 as the maximum acceptable value. This allowed us to obtain inferences statistically significant at a 95% confidence level, thereby testing the null hypotheses APC = 0; ARS = 0 against the alternative hypotheses: APC ≠ 0; ARS ≠ 0.
As regards AVIF and AFVIF, we exclusively accepted values equal to or lower than 3.3. This threshold is particularly applicable for models in which most of the variables are measured using two or more indicators. In addition, to estimate the model’s explanatory power, we computed the Tenenhaus GoF index, accepting values ranging from 0.1 to 0.36 [73]. In general, GoF values equal to or greater than 0.1 suggest that a model has small explanatory power, whereas values equal to or greater than 0.25 indicate medium explanatory power. Finally, GoF values equal to or greater than 0.36 denote large explanatory power.
In addition to estimating the six model fit indices, we analyzed our structural equation model by measuring three types of effects between latent variables: direct, indirect, and total effects. Direct effects can be noted in Figure 1 as arrows directly connecting two latent variables, whereas indirect effects occur through a third latent variable using two or more paths or segments. The total effects between two latent variables are the sum of both direct and indirect effects. All the effects were associated with a p-value to determine their significance, thus considering the null hypothesis: βi = 0, versus the alternative hypothesis: βi ≠ 0.
Figure 1. Research hypotheses.
To test the model, we estimated six model fit indices: Average Path Coefficient (APC), AverageR-Squared (ARS), Average Adjusted R-Squared (AARS), Average Variance Inflation Factor (AVIF),Average Full collinearity VIF (AFVIF), and the Tenenhaus Goodness of Fit (GoF) index. For APC, ARS,and AARS, we estimated the p-values to test the efficiency of the model, setting 0.05 as the maximumacceptable value. This allowed us to obtain inferences statistically significant at a 95% confidence level,thereby testing the null hypotheses APC = 0; ARS = 0 against the alternative hypotheses: APC 6= 0;ARS 6= 0.
As regards AVIF and AFVIF, we exclusively accepted values equal to or lower than 3.3.This threshold is particularly applicable for models in which most of the variables are measuredusing two or more indicators. In addition, to estimate the model’s explanatory power, we computedthe Tenenhaus GoF index, accepting values ranging from 0.1 to 0.36 [73]. In general, GoF values equalto or greater than 0.1 suggest that a model has small explanatory power, whereas values equal to orgreater than 0.25 indicate medium explanatory power. Finally, GoF values equal to or greater than0.36 denote large explanatory power.
Sustainability 2017, 9, 1520 8 of 16
In addition to estimating the six model fit indices, we analyzed our structural equation modelby measuring three types of effects between latent variables: direct, indirect, and total effects. Directeffects can be noted in Figure 1 as arrows directly connecting two latent variables, whereas indirecteffects occur through a third latent variable using two or more paths or segments. The total effectsbetween two latent variables are the sum of both direct and indirect effects. All the effects wereassociated with a p-value to determine their significance, thus considering the null hypothesis: βi = 0,versus the alternative hypothesis: βi 6= 0.
3. Results
The results from the model analysis and evaluation are reported in the following four subsections.
3.1. Latent Variables Validation
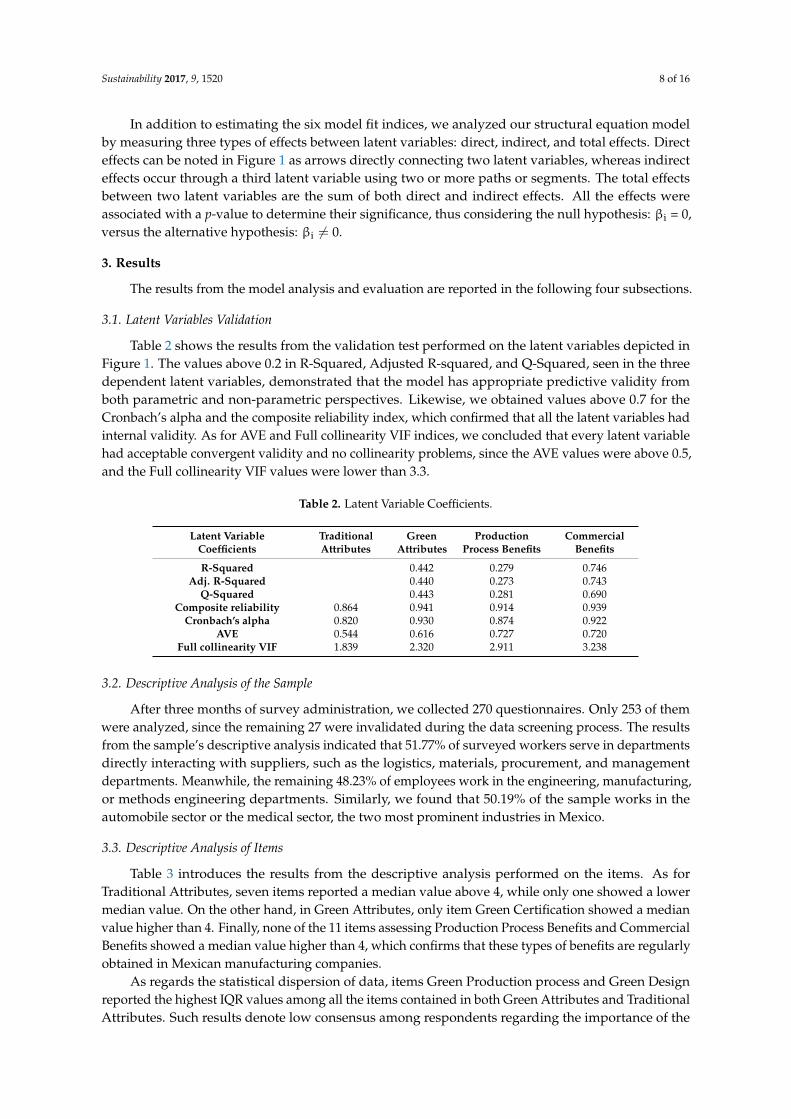
Table 2 shows the results from the validation test performed on the latent variables depicted inFigure 1. The values above 0.2 in R-Squared, Adjusted R-squared, and Q-Squared, seen in the threedependent latent variables, demonstrated that the model has appropriate predictive validity fromboth parametric and non-parametric perspectives. Likewise, we obtained values above 0.7 for theCronbach’s alpha and the composite reliability index, which confirmed that all the latent variables hadinternal validity. As for AVE and Full collinearity VIF indices, we concluded that every latent variablehad acceptable convergent validity and no collinearity problems, since the AVE values were above 0.5,and the Full collinearity VIF values were lower than 3.3.
Table 2. Latent Variable Coefficients.
Latent VariableCoefficients
TraditionalAttributes
GreenAttributes
ProductionProcess Benefits
CommercialBenefits
R-Squared 0.442 0.279 0.746Adj. R-Squared 0.440 0.273 0.743
Q-Squared 0.443 0.281 0.690Composite reliability 0.864 0.941 0.914 0.939
Cronbach’s alpha 0.820 0.930 0.874 0.922AVE 0.544 0.616 0.727 0.720
Full collinearity VIF 1.839 2.320 2.911 3.238
3.2. Descriptive Analysis of the Sample
After three months of survey administration, we collected 270 questionnaires. Only 253 of themwere analyzed, since the remaining 27 were invalidated during the data screening process. The resultsfrom the sample’s descriptive analysis indicated that 51.77% of surveyed workers serve in departmentsdirectly interacting with suppliers, such as the logistics, materials, procurement, and managementdepartments. Meanwhile, the remaining 48.23% of employees work in the engineering, manufacturing,or methods engineering departments. Similarly, we found that 50.19% of the sample works in theautomobile sector or the medical sector, the two most prominent industries in Mexico.
3.3. Descriptive Analysis of Items
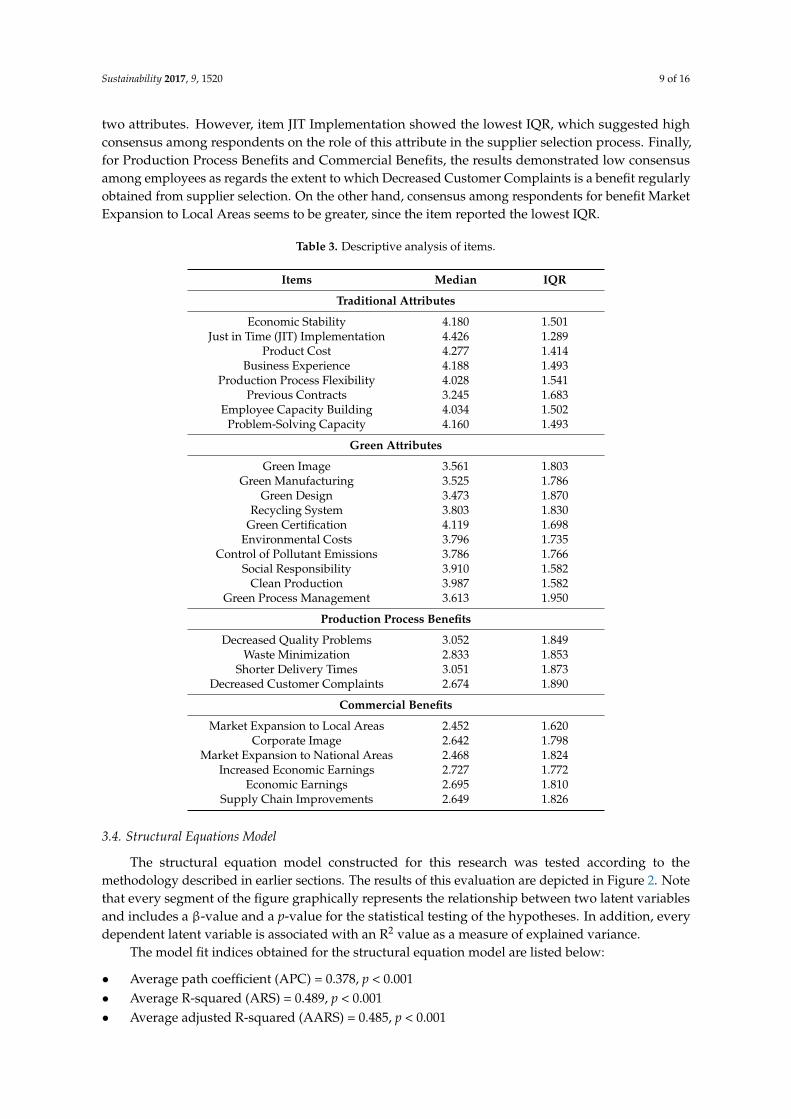
Table 3 introduces the results from the descriptive analysis performed on the items. As forTraditional Attributes, seven items reported a median value above 4, while only one showed a lowermedian value. On the other hand, in Green Attributes, only item Green Certification showed a medianvalue higher than 4. Finally, none of the 11 items assessing Production Process Benefits and CommercialBenefits showed a median value higher than 4, which confirms that these types of benefits are regularlyobtained in Mexican manufacturing companies.
As regards the statistical dispersion of data, items Green Production process and Green Designreported the highest IQR values among all the items contained in both Green Attributes and TraditionalAttributes. Such results denote low consensus among respondents regarding the importance of the
Sustainability 2017, 9, 1520 9 of 16
two attributes. However, item JIT Implementation showed the lowest IQR, which suggested highconsensus among respondents on the role of this attribute in the supplier selection process. Finally,for Production Process Benefits and Commercial Benefits, the results demonstrated low consensusamong employees as regards the extent to which Decreased Customer Complaints is a benefit regularlyobtained from supplier selection. On the other hand, consensus among respondents for benefit MarketExpansion to Local Areas seems to be greater, since the item reported the lowest IQR.
Table 3. Descriptive analysis of items.
Items Median IQR
Traditional Attributes
Economic Stability 4.180 1.501Just in Time (JIT) Implementation 4.426 1.289
Product Cost 4.277 1.414Business Experience 4.188 1.493
Production Process Flexibility 4.028 1.541Previous Contracts 3.245 1.683
Employee Capacity Building 4.034 1.502Problem-Solving Capacity 4.160 1.493
Green Attributes
Green Image 3.561 1.803Green Manufacturing 3.525 1.786
Green Design 3.473 1.870Recycling System 3.803 1.830
Green Certification 4.119 1.698Environmental Costs 3.796 1.735
Control of Pollutant Emissions 3.786 1.766Social Responsibility 3.910 1.582
Clean Production 3.987 1.582Green Process Management 3.613 1.950
Production Process Benefits
Decreased Quality Problems 3.052 1.849Waste Minimization 2.833 1.853
Shorter Delivery Times 3.051 1.873Decreased Customer Complaints 2.674 1.890
Commercial Benefits
Market Expansion to Local Areas 2.452 1.620Corporate Image 2.642 1.798
Market Expansion to National Areas 2.468 1.824Increased Economic Earnings 2.727 1.772
Economic Earnings 2.695 1.810Supply Chain Improvements 2.649 1.826
3.4. Structural Equations Model
The structural equation model constructed for this research was tested according to themethodology described in earlier sections. The results of this evaluation are depicted in Figure 2. Notethat every segment of the figure graphically represents the relationship between two latent variablesand includes a β-value and a p-value for the statistical testing of the hypotheses. In addition, everydependent latent variable is associated with an R2 value as a measure of explained variance.
The model fit indices obtained for the structural equation model are listed below:
• Average path coefficient (APC) = 0.378, p < 0.001• Average R-squared (ARS) = 0.489, p < 0.001• Average adjusted R-squared (AARS) = 0.485, p < 0.001

Sustainability 2017, 9, 1520 10 of 16
• Average block VIF (AVIF) = 1.733, acceptable if ≤5, ideally ≤3.3• Average full collinearity VIF (AFVIF) = 2.577, acceptable if ≤5, ideally ≤3.3• Tenenhaus GoF (GoF) = 0.554, small ≥ 0.1, medium ≥ 0.25, large ≥ 0.36
The results from the model’s fit and quality evaluation suggest that the model was appropriateand could be interpreted accordingly. On the one hand, the p-values of APC, ARS, and AARS allowedus to conclude that the model possessed enough predictive validity, and the dependencies betweenthe latent variables, on average, were different from 0, since they were statistically significant at a 95%confidence level. On the other hand, we discarded collinearity problems in the model, since AVIF andAFVIF values were lower than 3.3. Finally, the value of the Tenenhaus GoF index suggested acceptablefit of the model to the data.
Sustainability 2017, 9, 1520 10 of 15
95% confidence level. On the other hand, we discarded collinearity problems in the model, since AVIF and AFVIF values were lower than 3.3. Finally, the value of the Tenenhaus GoF index suggested acceptable fit of the model to the data.
Figure 2. Evaluated model.
3.5. Direct Effects
Direct effects are used to analyze the hypotheses stated early in the study and depicted in Figure 1. As previously mentioned, the results from the model evaluation are shown in Figure 2, based on which we can provide the following conclusions for the model hypotheses or direct effects found between the latent variables.
H1: There is enough statistical evidence to affirm that the Traditional Attributes considered in supplier selection have a positive direct effect on Green Attributes in the manufacturing industry, since, when the first latent variable increases its standard deviation by one unit, the standard deviation of the second latent variable increases by 0.665 units.
H2: There is enough statistical evidence to affirm that the Traditional Attributes considered in supplier selection have a positive direct effect on Production Process Benefits in the manufacturing industry, since, when the first latent variable increases its standard deviation by one unit, the standard deviation of the second latent variable increases by 0.137 units.
H3: There is enough statistical evidence to affirm that the Green Attributes considered in supplier selection have a positive direct effect on Production Process Benefits in the manufacturing industry, since, when the first latent variable increases its standard deviation by one unit, the standard deviation of the second latent variable increases by 0.428 units.
H4: There is not enough statistical evidence to affirm that the Traditional Attributes considered in supplier selection have a positive direct effect on Commercial Benefits in the manufacturing industry, since, in this hypothesis, the p-value associated with the β parameter was higher than 0.05.
H5: There is enough statistical evidence to affirm that the Green Attributes considered for supplier selection have a positive direct effect on Commercial Benefits in the manufacturing industry, since, when the first latent variable increases its standard deviation by one unit, the standard deviation of the second latent variable increases by 0.286 units.
H6: There is enough statistical evidence to affirm that the Production Process Benefits gained from supplier selection have a positive direct effect on Commercial Benefits in the manufacturing industry, since, when the first latent variable increases its standard deviation by one unit, the standard deviation of the second latent variable increases by 0.684 units.
Figure 2. Evaluated model.
3.5. Direct Effects
Direct effects are used to analyze the hypotheses stated early in the study and depicted in Figure 1.As previously mentioned, the results from the model evaluation are shown in Figure 2, based on whichwe can provide the following conclusions for the model hypotheses or direct effects found betweenthe latent variables.
H1: There is enough statistical evidence to affirm that the Traditional Attributes considered insupplier selection have a positive direct effect on Green Attributes in the manufacturing industry, since,when the first latent variable increases its standard deviation by one unit, the standard deviation of thesecond latent variable increases by 0.665 units.
H2: There is enough statistical evidence to affirm that the Traditional Attributes considered insupplier selection have a positive direct effect on Production Process Benefits in the manufacturingindustry, since, when the first latent variable increases its standard deviation by one unit, the standarddeviation of the second latent variable increases by 0.137 units.
H3: There is enough statistical evidence to affirm that the Green Attributes considered in supplierselection have a positive direct effect on Production Process Benefits in the manufacturing industry,since, when the first latent variable increases its standard deviation by one unit, the standard deviationof the second latent variable increases by 0.428 units.
H4: There is not enough statistical evidence to affirm that the Traditional Attributes considered insupplier selection have a positive direct effect on Commercial Benefits in the manufacturing industry,since, in this hypothesis, the p-value associated with the β parameter was higher than 0.05.
Sustainability 2017, 9, 1520 11 of 16
H5: There is enough statistical evidence to affirm that the Green Attributes considered for supplierselection have a positive direct effect on Commercial Benefits in the manufacturing industry, since,when the first latent variable increases its standard deviation by one unit, the standard deviation of thesecond latent variable increases by 0.286 units.
H6: There is enough statistical evidence to affirm that the Production Process Benefits gained fromsupplier selection have a positive direct effect on Commercial Benefits in the manufacturing industry,since, when the first latent variable increases its standard deviation by one unit, the standard deviationof the second latent variable increases by 0.684 units.
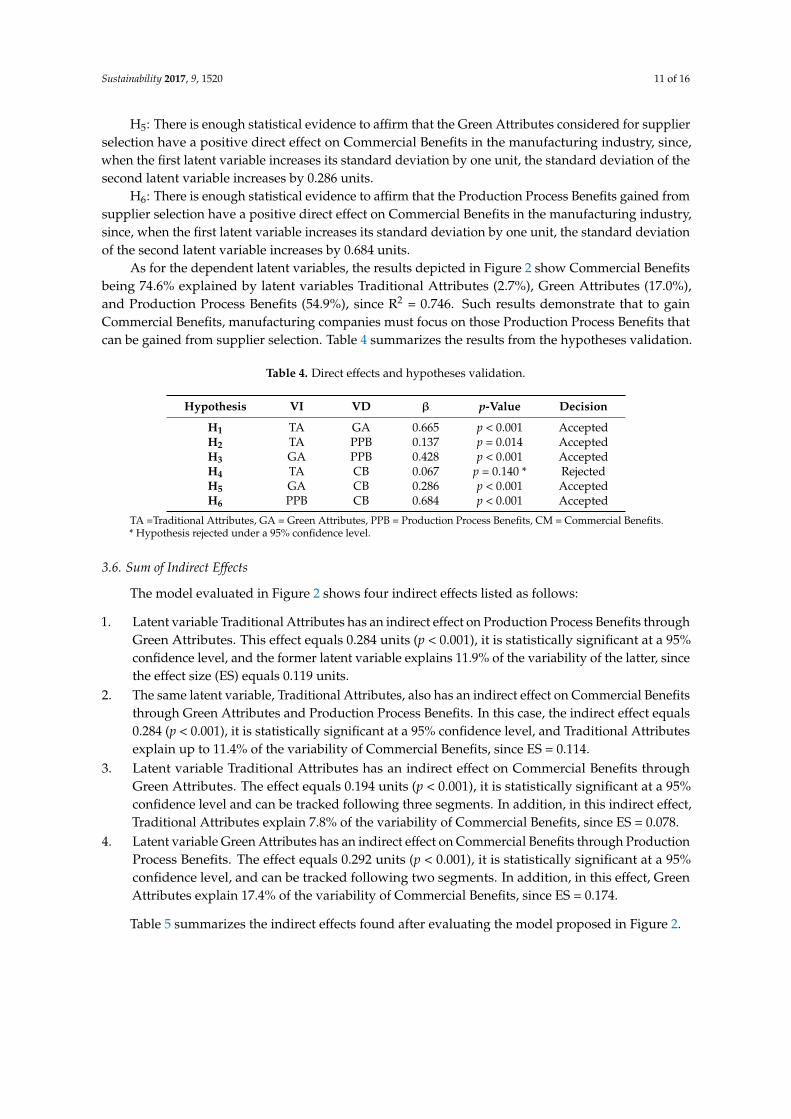
As for the dependent latent variables, the results depicted in Figure 2 show Commercial Benefitsbeing 74.6% explained by latent variables Traditional Attributes (2.7%), Green Attributes (17.0%),and Production Process Benefits (54.9%), since R2 = 0.746. Such results demonstrate that to gainCommercial Benefits, manufacturing companies must focus on those Production Process Benefits thatcan be gained from supplier selection. Table 4 summarizes the results from the hypotheses validation.
Table 4. Direct effects and hypotheses validation.
Hypothesis VI VD β p-Value Decision
H1 TA GA 0.665 p < 0.001 AcceptedH2 TA PPB 0.137 p = 0.014 AcceptedH3 GA PPB 0.428 p < 0.001 AcceptedH4 TA CB 0.067 p = 0.140 * RejectedH5 GA CB 0.286 p < 0.001 AcceptedH6 PPB CB 0.684 p < 0.001 Accepted
TA =Traditional Attributes, GA = Green Attributes, PPB = Production Process Benefits, CM = Commercial Benefits.* Hypothesis rejected under a 95% confidence level.
3.6. Sum of Indirect Effects
The model evaluated in Figure 2 shows four indirect effects listed as follows:
1. Latent variable Traditional Attributes has an indirect effect on Production Process Benefits throughGreen Attributes. This effect equals 0.284 units (p < 0.001), it is statistically significant at a 95%confidence level, and the former latent variable explains 11.9% of the variability of the latter, sincethe effect size (ES) equals 0.119 units.
2. The same latent variable, Traditional Attributes, also has an indirect effect on Commercial Benefitsthrough Green Attributes and Production Process Benefits. In this case, the indirect effect equals0.284 (p < 0.001), it is statistically significant at a 95% confidence level, and Traditional Attributesexplain up to 11.4% of the variability of Commercial Benefits, since ES = 0.114.
3. Latent variable Traditional Attributes has an indirect effect on Commercial Benefits throughGreen Attributes. The effect equals 0.194 units (p < 0.001), it is statistically significant at a 95%confidence level and can be tracked following three segments. In addition, in this indirect effect,Traditional Attributes explain 7.8% of the variability of Commercial Benefits, since ES = 0.078.
4. Latent variable Green Attributes has an indirect effect on Commercial Benefits through ProductionProcess Benefits. The effect equals 0.292 units (p < 0.001), it is statistically significant at a 95%confidence level, and can be tracked following two segments. In addition, in this effect, GreenAttributes explain 17.4% of the variability of Commercial Benefits, since ES = 0.174.
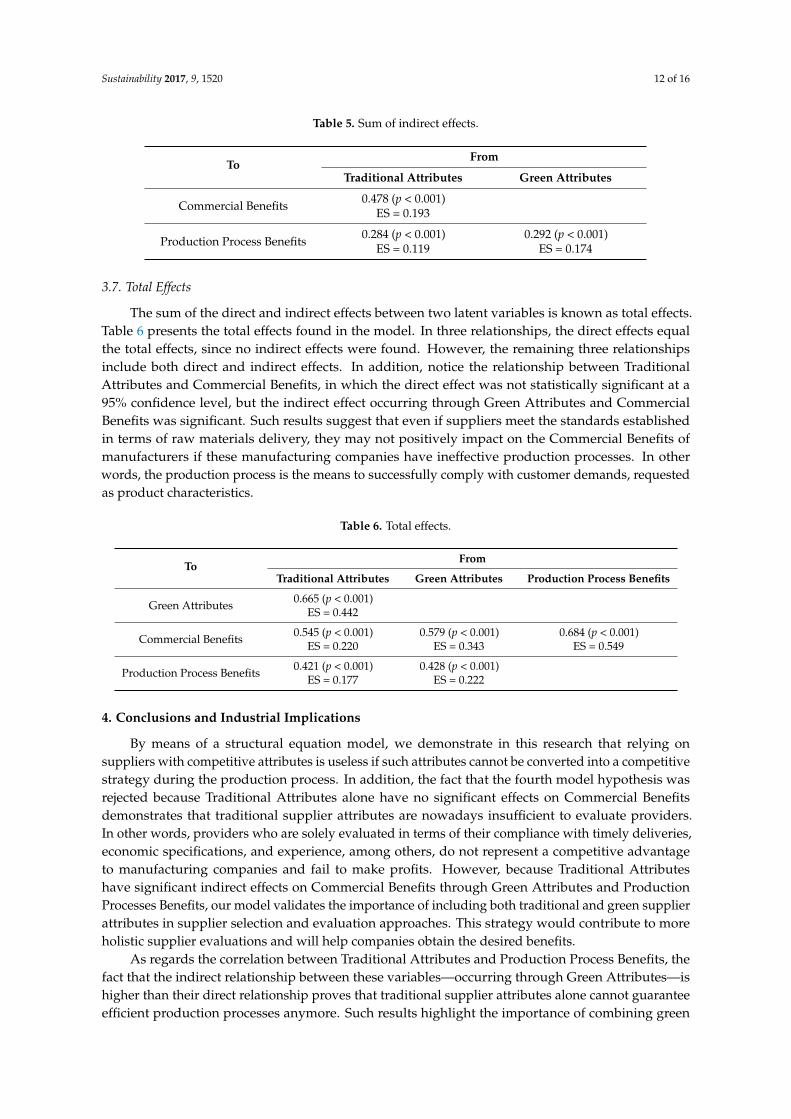
Table 5 summarizes the indirect effects found after evaluating the model proposed in Figure 2.
Sustainability 2017, 9, 1520 12 of 16
Table 5. Sum of indirect effects.
ToFrom
Traditional Attributes Green Attributes
Commercial Benefits 0.478 (p < 0.001)ES = 0.193
Production Process Benefits 0.284 (p < 0.001)ES = 0.119
0.292 (p < 0.001)ES = 0.174
3.7. Total Effects
The sum of the direct and indirect effects between two latent variables is known as total effects.Table 6 presents the total effects found in the model. In three relationships, the direct effects equalthe total effects, since no indirect effects were found. However, the remaining three relationshipsinclude both direct and indirect effects. In addition, notice the relationship between TraditionalAttributes and Commercial Benefits, in which the direct effect was not statistically significant at a95% confidence level, but the indirect effect occurring through Green Attributes and CommercialBenefits was significant. Such results suggest that even if suppliers meet the standards establishedin terms of raw materials delivery, they may not positively impact on the Commercial Benefits ofmanufacturers if these manufacturing companies have ineffective production processes. In otherwords, the production process is the means to successfully comply with customer demands, requestedas product characteristics.
Table 6. Total effects.
ToFrom
Traditional Attributes Green Attributes Production Process Benefits
Green Attributes 0.665 (p < 0.001)ES = 0.442
Commercial Benefits 0.545 (p < 0.001)ES = 0.220
0.579 (p < 0.001)ES = 0.343
0.684 (p < 0.001)ES = 0.549
Production Process Benefits 0.421 (p < 0.001)ES = 0.177
0.428 (p < 0.001)ES = 0.222
4. Conclusions and Industrial Implications
By means of a structural equation model, we demonstrate in this research that relying onsuppliers with competitive attributes is useless if such attributes cannot be converted into a competitivestrategy during the production process. In addition, the fact that the fourth model hypothesis wasrejected because Traditional Attributes alone have no significant effects on Commercial Benefitsdemonstrates that traditional supplier attributes are nowadays insufficient to evaluate providers.In other words, providers who are solely evaluated in terms of their compliance with timely deliveries,economic specifications, and experience, among others, do not represent a competitive advantageto manufacturing companies and fail to make profits. However, because Traditional Attributeshave significant indirect effects on Commercial Benefits through Green Attributes and ProductionProcesses Benefits, our model validates the importance of including both traditional and green supplierattributes in supplier selection and evaluation approaches. This strategy would contribute to moreholistic supplier evaluations and will help companies obtain the desired benefits.
As regards the correlation between Traditional Attributes and Production Process Benefits, thefact that the indirect relationship between these variables—occurring through Green Attributes—ishigher than their direct relationship proves that traditional supplier attributes alone cannot guaranteeefficient production processes anymore. Such results highlight the importance of combining green
Sustainability 2017, 9, 1520 13 of 16
supplier attributes with traditional supplier attributes, as they complement each other. Moreover,Traditional Attributes have a large impact on Green Attributes. That is, our model demonstrates theprominent role of traditional supplier attributes in supplier evaluation and selection; however, it isimportant that manufacturers equally consider and integrate green supplier attributes in the supplierselection process to gain the expected production process benefits, and as consequence, the desiredcommercial benefits.
Author Contributions: J.R. and J.L.G.-A. has designed the subject and method of research; J.D. performed thequestionnaire design and administration; J.R., J.L.G.-A. and J.B. carried out an initial data analysis and generateda first draft of the document; J.C. continue with data analysis and review the document J.R., J.L.G.-A., J.D., J.B.and J.C. wrote the results and conclusions, as well as in the edition of the whole document.
Conflicts of Interest: The authors declare no conflict of interest.
References
1. Rezaei, J.; Nispeling, T.; Sarkis, J.; Tavasszy, L. A supplier selection life cycle approach integrating traditionaland environmental criteria using the best worst method. J. Clean. Prod. 2016, 135, 577–588. [CrossRef]
2. Gurel, O.; Acar, A.Z.; Onden, I.; Gumus, I. Determinants of the green supplier selection. Procedia Soc.Behav. Sci. 2015, 181, 131–139. [CrossRef]
3. Genovese, A.; Lenny Koh, S.C.; Bruno, G.; Esposito, E. Greener supplier selection: State of the art and someempirical evidence. Int. J. Prod. Res. 2013, 51, 2868–2886. [CrossRef]
4. Shen, L.; Olfat, L.; Govindan, K.; Khodaverdi, R.; Diabat, A. A fuzzy multi criteria approach for evaluatinggreen supplier’s performance in green supply chain with linguistic preferences. Resour. Conserv. Recycl. 2013,74, 170–179. [CrossRef]
5. Cabral, I.; Grilo, A.; Cruz-Machado, V. A decision-making model for lean, agile, resilient and green supplychain management. Int. J. Prod. Res. 2012, 50, 4830–4845. [CrossRef]
6. Wang, K.-Q.; Liu, H.-C.; Liu, L.; Huang, J. Green supplier evaluation and selection using cloud model theoryand the qualiflex method. Sustainability 2017, 9, 688. [CrossRef]
7. Mendoza Fong, J.R.; García-Alcaraz, J.L.; Maldonado-Macías, A.A.; Sánchez Ramírez, C.; Martínez Loya, V.The impact of green attributes from suppliers on supply chain performance. In Green Marketing andEnvironmental Responsibility in Modern Corporations; IGI Global: Hershey, PA, USA, 2017; pp. 101–121.
8. Sharma, V.K.; Chandna, P.; Bhardwaj, A. Green supply chain management related performance indicators inagro industry: A review. J. Clean. Prod. 2017, 141, 1194–1208. [CrossRef]
9. Chin, T.A.; Tat, H.H.; Sulaiman, Z. Green supply chain management, environmental collaboration andsustainability performance. Procedia CIRP 2015, 26, 695–699. [CrossRef]
10. Fahimnia, B.; Sarkis, J.; Davarzani, H. Green supply chain management: A review and bibliometric analysis.Int. J. Prod. Econ. 2015, 162, 101–114. [CrossRef]
11. Tseng, M.-L. Green supply chain management with linguistic preferences and incomplete information.Appl. Soft Comput. 2011, 11, 4894–4903. [CrossRef]
12. Hu, Z.; Rao, C.; Zheng, Y.; Huang, D. Optimization decision of supplier selection in green procurementunder the mode of low carbon economy. Int. J. Comput. Intell. Syst. 2015, 8, 407–421. [CrossRef]
13. Akman, G. Evaluating suppliers to include green supplier development programs via fuzzy c-means andvikor methods. Comput. Ind. Eng. 2015, 86, 69–82. [CrossRef]
14. Lee, K.-H.; Wu, Y. Integrating sustainability performance measurement into logistics and supply networks:A multi-methodological approach. Br. Account. Rev. 2014, 46, 361–378. [CrossRef]
15. Mendoza Fong, J.R.; García-Alcaraz, J.L.; Sánchez Ramírez, C.; Alor-Hernández, G. The impact of supplier’sadministrative attributes on production process and marketing benefits. In Ethics and Sustainability in GlobalSupply Chain Management; IGI Global: Hershey, PA, USA, 2017; pp. 73–91.
16. Cheaitou, A.; Khan, S.A. An integrated supplier selection and procurement planning model using productpredesign and operational criteria. Int. J. Interact. Des. Manuf. 2015, 9, 213–224. [CrossRef]
17. Pitchipoo, P.; Venkumar, P.; Rajakarunakaran, S. Fuzzy hybrid decision model for supplier evaluation andselection. Int. J. Prod. Res. 2013, 51, 3903–3919. [CrossRef]
Sustainability 2017, 9, 1520 14 of 16
18. Keskin, G.A. Using integrated fuzzy dematel and fuzzy c: Means algorithm for supplier evaluation andselection. Int. J. Prod. Res. 2015, 53, 3586–3602. [CrossRef]
19. Singh, A. Supplier evaluation and demand allocation among suppliers in a supply chain. J. Purch. SupplyManag. 2014, 20, 167–176. [CrossRef]
20. Kuo, R.J.; Lin, Y.J. Supplier selection using analytic network process and data envelopment analysis. Int. J.Prod. Res. 2011, 50, 2852–2863. [CrossRef]
21. Kar, A.K. Revisiting the supplier selection problem: An integrated approach for group decision support.Expert Syst. Appl. 2014, 41, 2762–2771. [CrossRef]
22. Ho, W.; Xu, X.; Dey, P.K. Multi-criteria decision making approaches for supplier evaluation and selection:A literature review. Eur. J. Oper. Res. 2010, 202, 16–24. [CrossRef]
23. Mafakheri, F.; Breton, M.; Ghoniem, A. Supplier selection-order allocation: A two-stage multiple criteriadynamic programming approach. Int. J. Prod. Econ. 2011, 132, 52–57. [CrossRef]
24. Tseng, M.-L.; Chiu, A.S.F. Evaluating firm’s green supply chain management in linguistic preferences.J. Clean. Prod. 2013, 40, 22–31. [CrossRef]
25. Shaw, K.; Shankar, R.; Yadav, S.S.; Thakur, L.S. Supplier selection using fuzzy ahp and fuzzy multi-objectivelinear programming for developing low carbon supply chain. Expert Syst. Appl. 2012, 39, 8182–8192.[CrossRef]
26. Büyüközkan, G.; Çifçi, G. A novel hybrid mcdm approach based on fuzzy dematel, fuzzy anp and fuzzytopsis to evaluate green suppliers. Expert Syst. Appl. 2012, 39, 3000–3011. [CrossRef]
27. Yeung, K.; Lee, P.K.C.; Yeung, A.C.L.; Cheng, T.C.E. Supplier partnership and cost performance:The moderating roles of specific investments and environmental uncertainty. Int. J. Prod. Econ. 2013,144, 546–559. [CrossRef]
28. Terziovski, M. Innovation practice and its performance implications in small and medium enterprises (SMEs)in the manufacturing sector: A resource-based view. Strateg. Manag. J. 2010, 31, 892–902. [CrossRef]
29. Cao, H. The study of the suppliers evaluating and choosing strategies based on the green supply chainmanagement. In Proceedings of the 2011 International Conference on Business Management and EletronicInformation (BMEI), Guangzhou, China, 13–15 May 2011.
30. Büyüközkan, G.; Çifçi, G. A novel fuzzy multi-criteria decision framework for sustainable supplier selectionwith incomplete information. Comput. Ind. 2011, 62, 164–174. [CrossRef]
31. Kumar, P.; Singh, R.K.; Vaish, A. Suppliers’ green performance evaluation using fuzzy extended electreapproach. Clean Technol. Environ. Policy 2017, 19, 809–821. [CrossRef]
32. Bruno, G.; Esposito, E.; Genovese, A.; Simpson, M. Applying supplier selection methodologies in amulti-stakeholder environment: A case study and a critical assessment. Expert Syst. Appl. 2016, 43,271–285. [CrossRef]
33. Stefanelli, N.O.; Jabbour, C.J.C.; Jabbour, A.B.L.d.S. Green supply chain management and environmentalperformance of firms in the bioenergy sector in Brazil: An exploratory survey. Energy Policy 2014, 75, 312–315.[CrossRef]
34. Mendoza-Fong, J.R.; García-Alcaraz, J.L.; Ochoa-Domínguez, H.d.J.; Cortes-Robles, G. Green productionattributes and its impact in company’s sustainability. In New Perspectives on Applied Industrial Tools andTechniques; Garcia-Alcaraz, J.L., Alor-Hernandez, G., Maldonado-Macias, A.A., Sanchez-Ramirez, C., Eds.;Springer: Cham, Switzerland, 2017; pp. 23–46.
35. Mirhedayatian, S.M.; Azadi, M.; Farzipoor Saen, R. A novel network data envelopment analysis model forevaluating green supply chain management. Int. J. Prod. Econ. 2014, 147, 544–554. [CrossRef]
36. Guo, Z.; Liu, H.; Zhang, D.; Yang, J. Green supplier evaluation and selection in apparel manufacturing usinga fuzzy multi-criteria decision-making approach. Sustainability 2017, 9, 650.
37. Kerkhoff, G.M.C.; Schafer, D.; Jager, G.; Heidbreder, C.; Kreienbrink, O.; Penning, S.; Rüter, M. Einkaufsagenda2020; Wiley-VCH: Weinheim, Germany, 2010.
38. Winter, S.; Lasch, R. Environmental and social criteria in supplier evaluation—Lessons from the fashion andapparel industry. J. Clean. Prod. 2016, 139, 175–190. [CrossRef]
39. Azadi, M.; Jafarian, M.; Farzipoor Saen, R.; Mirhedayatian, S.M. A new fuzzy dea model for evaluation ofefficiency and effectiveness of suppliers in sustainable supply chain management context. Comput. Oper. Res.2015, 54, 274–285. [CrossRef]
Sustainability 2017, 9, 1520 15 of 16
40. Hashemi, S.H.; Karimi, A.; Tavana, M. An integrated green supplier selection approach with analytic networkprocess and improved grey relational analysis. Int. J. Prod. Econ. 2015, 159, 178–191. [CrossRef]
41. Govindan, K.; Rajendran, S.; Sarkis, J.; Murugesan, P. Multi criteria decision making approaches for greensupplier evaluation and selection: A literature review. J. Clean. Prod. 2015, 98, 66–83. [CrossRef]
42. Kannan, D.; Jabbour, A.B.L.d.S.; Jabbour, C.J.C. Selecting green suppliers based on gscm practices: Usingfuzzy topsis applied to a Brazilian electronics company. Eur. J. Oper. Res. 2014, 233, 432–447. [CrossRef]
43. Jabbour, C.J.C.; de Sousa Jabbour, A.B.L. Green human resource management and green supply chainmanagement: Linking two emerging agendas. J. Clean. Prod. 2016, 112, 1824–1833. [CrossRef]
44. Kannan, D.; Govindan, K.; Rajendran, S. Fuzzy axiomatic design approach based green supplier selection:A case study from Singapore. J. Clean. Prod. 2015, 96, 194–208. [CrossRef]
45. Dubey, R.; Gunasekaran, A.; Samar Ali, S. Exploring the relationship between leadership, operationalpractices, institutional pressures and environmental performance: A framework for green supply chain.Int. J. Prod. Econ. 2015, 160, 120–132. [CrossRef]
46. Bai, C.; Sarkis, J.; Dou, Y. Corporate sustainability development in china: Review and analysis. Ind. Manag.Data Syst. 2015, 115, 5–40. [CrossRef]
47. Charmondusit, K.; Gheewala, S.H.; Mungcharoen, T. Green and sustainable innovation for cleaner productionin the asia-pacific region. J. Clean. Prod. 2016, 134, 443–446. [CrossRef]
48. Zailani, S.; Govindan, K.; Iranmanesh, M.; Shaharudin, M.R.; Sia Chong, Y. Green innovation adoption inautomotive supply chain: The Malaysian case. J. Clean. Prod. 2015, 108, 1115–1122. [CrossRef]
49. Amindoust, A.; Ahmed, S.; Saghafinia, A.; Bahreininejad, A. Sustainable supplier selection: A ranking modelbased on fuzzy inference system. Appl. Soft Comput. 2012, 12, 1668–1677. [CrossRef]
50. Su, C.-M.; Horng, D.-J.; Tseng, M.-L.; Chiu, A.S.F.; Wu, K.-J.; Chen, H.-P. Improving sustainable supply chainmanagement using a novel hierarchical grey-dematel approach. J. Clean. Prod. 2016, 134, 469–481. [CrossRef]
51. Scott, J.; Ho, W.; Dey, P.K.; Talluri, S. A decision support system for supplier selection and order allocationin stochastic, multi-stakeholder and multi-criteria environments. Int. J. Prod. Econ. 2015, 166, 226–237.[CrossRef]
52. Agan, Y.; Kuzey, C.; Acar, M.F.; Açıkgöz, A. The relationships between corporate social responsibility,environmental supplier development, and firm performance. J. Clean. Prod. 2016, 112, 1872–1881. [CrossRef]
53. Galankashi, M.R.; Chegeni, A.; Soleimanynanadegany, A.; Memari, A.; Anjomshoae, A.; Helmi, S.A.; Dargi, A.Prioritizing green supplier selection criteria using fuzzy analytical network process. Procedia CIRP 2015, 26,689–694. [CrossRef]
54. Wu, C.; Barnes, D. An integrated model for green partner selection and supply chain construction.J. Clean. Prod. 2016, 112, 2114–2132. [CrossRef]
55. Govindan, K.; Khodaverdi, R.; Jafarian, A. A fuzzy multi criteria approach for measuring sustainabilityperformance of a supplier based on triple bottom line approach. J. Clean. Prod. 2013, 47, 345–354. [CrossRef]
56. Evans, A.; Sawyer, J.K. An investigation into the social and environmental responsibility behaviours ofregional small businesses in relation to their impact on the local community and immediate environment.Australas. J. Reg. Stud. 2010, 16, 253–265.
57. Villanueva Ponce, R.D. Encuesta de atributos en la selección de proveedores; Academic Press: Juarez, Mexico, 2014.58. Rajesh, R.; Ravi, V. Supplier selection in resilient supply chains: A grey relational analysis approach.
J. Clean. Prod. 2015, 86, 343–359. [CrossRef]59. Shang, K.-C.; Lu, C.-S.; Li, S. A taxonomy of green supply chain management capability among
electronics-related manufacturing firms in Taiwan. J. Environ. Manag. 2010, 91, 1218–1226. [CrossRef][PubMed]
60. Awasthi, A.; Chauhan, S.S.; Goyal, S.K. A fuzzy multicriteria approach for evaluating environmentalperformance of suppliers. Int. J. Prod. Econ. 2010, 126, 370–378. [CrossRef]
61. Amin, S.H.; Zhang, G. An integrated model for closed-loop supply chain configuration and supplier selection:Multi-objective approach. Expert Syst. Appl. 2012, 39, 6782–6791. [CrossRef]
62. Merschmann, U.; Thonemann, U.W. Supply chain flexibility, uncertainty and firm performance: An empiricalanalysis of german manufacturing firms. Int. J. Prod. Econ. 2011, 130, 43–53. [CrossRef]
63. Govindan, K.; Azevedo, S.G.; Carvalho, H.; Cruz-Machado, V. Impact of supply chain management practiceson sustainability. J. Clean. Prod. 2014, 85, 212–225. [CrossRef]
Sustainability 2017, 9, 1520 16 of 16
64. Villanueva-Ponce, R.; Garcia-Alcaraz, J.; Cortes-Robles, G.; Romero-Gonzalez, J.; Jiménez-Macías, E.;Blanco-Fernández, J. Impact of suppliers’ green attributes in corporate image and financial profit: Casemaquiladora industry. Int. J. Adv. Manuf. Technol. 2015, 80, 1277–1296. [CrossRef]
65. Büyüközkan, G. An integrated fuzzy multi-criteria group decision-making approach for green supplierevaluation. Int. J. Prod. Res. 2011, 50, 2892–2909. [CrossRef]
66. Caniëls, M.C.J.; Gehrsitz, M.H.; Semeijn, J. Participation of suppliers in greening supply chains: An empiricalanalysis of German automotive suppliers. J. Purch. Supply Manag. 2013, 19, 134–143. [CrossRef]
67. Hair, J.F., Jr.; Black, W.C.; Babin, B.J.; Anderson, R.E. Multivariate Data Analysis, 7th ed.; Pretince Hall: River,NJ, USA, 2013.
68. Lynch, S.M. Introduction to Applied Bayesian Statistics and Estimation for Social Scientists; Springer Science &Business Media: New York, NY, USA, 2007; pp. 1–335.
69. Kohler, M.; Müller, F.; Walk, H. Estimation of a regression function corresponding to latent variables.J. Stat. Plan. Inference 2015, 162, 88–109. [CrossRef]
70. Leys, C.; Ley, C.; Klein, O.; Bernard, P.; Licata, L. Detecting outliers: Do not use standard deviation aroundthe mean, use absolute deviation around the median. J. Exp. Soc. Psychol. 2013, 49, 764–766. [CrossRef]
71. Kock, N. Advanced mediating effects tests, multi-group analyses, and measurement model assessments inPLS-based SEM. Int. J. e-Collab. 2014, 10, 1–13. [CrossRef]
72. Green, K.W.; Inman, R.A.; Birou, L.M.; Whitten, D. Total JIT (T-JIT) and its impact on supply chain competencyand organizational performance. Int. J. Prod. Econ. 2014, 147, 125–135. [CrossRef]
73. Kock, N. Warppls 5.0 User Manual; ScriptWarp Systems: Laredo, TX, USA, 2015.
© 2017 by the authors. Licensee MDPI, Basel, Switzerland. This article is an open accessarticle distributed under the terms and conditions of the Creative Commons Attribution(CC BY) license (http://creativecommons.org/licenses/by/4.0/).