Sustainable Fiscal Policies and Institutional Framework in West African Countries
YÖNETİM VE EKONOMİ Yıl:2015 Cilt:22 Sayı:1 Celal Bayar Üniversitesi İ.İ.B.F. MANİSA
The Role Of Fiscal Policies On Human Development :
An Empirical Approach
Yrd. Doç. Dr. Oktay KIZILKAYA Ahi Evran Üniversitesi, İ.İ.B.F., İktisat Bölümü, KIRŞEHİR
Öğr. Gör. Emrah KOÇAK Ahi Evran Üniversitesi, Mucur MYO, KIRŞEHİR
Araş. Gör. Emrah SOFUOĞLU Ahi Evran Üniversitesi, İ.İ.B.F., İktisat Bölümü, KIRŞEHİR
ÖZET
Hükümetlerin öncelikli amaçlarından birisi ekonomik büyüme ile beraber insani gelişimi
sürekli kılabilmektir. Bu çerçevede çalışmanın amacı vergilerin, kamu harcamalarının, gelirin ve
altyapının (elektrik tüketimi) insani gelişimi üzerindeki etkisini 1998-2007 dönemlerinde 14 OECD
ülkesi için ampirik olarak sınamaktır. Çalışmada panel birim kök, panel eşbütünleşme, panel
FMOLS, panel DOLS ve panel vektör hata düzeltmeye dayalı nedensellik yöntemleri kullanılmıştır.
Panel FMOLS sonuçlarına göre, insani gelişim üzerinde vergilerin negatif, kamu harcamaları ve
gelirin pozitif etkisi vardır. Elektrik tüketiminin katsayısı istatistiki olarak anlamlı değildir. Panel
DOLS sonuçlarına göre, kamu harcamalarının ve elektrik tüketiminin insani gelişim üzerindeki
etkisi pozitifken, vergiler ve gelirin katsayısı istatistiki olarak anlamlı değildir. Nedensellik test
sonuçlarına göre; uzun dönemde vergiler, kamu harcamaları, elektrik tüketimi ve gelirden insani
gelişime doğru ve insani gelişme, vergiler, kamu harcamaları ve elektrik tüketiminden gelire doğru
nedensellik ilişkisi elde edilmiştir. Çalışmanın sonuç kısmında insani gelişim düzeyi yüksek
ülkelerde uygulanan kamu politikaları değerlendirilmiş ve çeşitli politika önerilerinde
bulunulmuştur.
Anahtar Kelimeler: İnsani Gelişme İndeksi, Maliye Politikaları, Panel FMOLs, Panel
DOLS.
JEL Sınıflaması: E62, H2, O15
The Role of Fiscal Policies on Human Development: An Empirical
Approach
ABSTRACT One of the primary purposes of governments is to sustain human development and
economic growth. In this context, the goal of the study is to test the impact of taxes, government
expenditures, income and infrastructure (electricity consumption) on the human development
empirically in the period of 1998-2007 for 14 OECD countries. Panel unit root, panel cointegration,
panel FMOLS, panel DOLS and panel vector error correction based causality methods have been
used in the study. According to panel FMOLS results, while taxes have a negative impact on human
development, government expenditures and income have a positive impact on it. The coefficient of
the electricity consumption is not statistically significant. We also find that government expenditures
and electricity consumption have a positive effect on human development according to panel DOLS
results, however the coefficients of income and taxes are not statistically significant. Causality test
results show that in the long term, there are causality relationships from taxes, government
expenditures, electricity consumption and income to human development and from taxes,
government expenditures, human development and electricity consumption to income. As a result of
these findings we evaluate the government policies that have been implemented in countries that
have high human development level and make some policy suggestions in the conclusion section.
Key Words: Human Development Index, Fiscal Policies, Panel FMOLs, Panel DOLS.
Jel Classification: E62, H2, O15
O. Kızılkaya & E. Koçak & E. Sofuoğlu / Maliye Politikalarının İnsani Gelişim Üzerindeki Rolü: Ampirik Bir
Yaklaşım
258
I. Introduction One of the basic subjects of economics is economic growth. Today, the
main objective of all countries, irrespective of their level of development, is
steady growth. Because, growth increases income level and the level of welfare as
well. Only referring to the economic growth of a country is not an appropriate
evaluation to accept the country as developed or less developed. Economically,
many countries, that show efficient economic growth performances, have
problems which have not been solved yet. For example, according to the data**
during 1992-2012, China showed 10.3 % growth performance on average.
Although it is an impressive performance, China’s gini coefficient was 0.426 in
2002, and in 2009, it decreased to 0.421. According to these data, income
inequality in China is continuing. Therefore, for the assessment of welfare for
countries, we need more convenient indicators except economic growth and
income. In accordance with these requirements, United Nations pressed the
Development Programme in 1990. This report was prepared under the leadership
of Pakistani economist Mahbub Ul Haq, it drew public’s attention to the
importance of human life quality and emphasized that in the center of
development programmes, human should be taken into consideration instead of
income. Because, according to Haq, high income does not mean to get rid of
poverty and high life quality. Human-centered development policy which takes
into account of the life quality of the bottom layer of society together with income
policies should be applied (Mahbub Ul Haq, 1995). In this context, the first
human development report that was published in 1990 focused on not only
income but also on education and health. According to this report, human
development is briefly a long, healthy and qualified life for people. Ensuring this
will increase the welfare, the level of education, and health of individuals, thus
individuals will make more rational decisions and choices. In other words, human
development is an optimization. Development literature led its ultimate goal to
human due to this report. According to Sen (2007), human development is the
most widely accepted measure of welfare. In addition, human development
contributes to sustainable growth by increasing individuals’ abilities and
productivity of works. According to Sen and Anand (1994), to have income and
goods is not enough for people since income and goods are just tools and do not
reveal the life expectations of individuals. For this reason, income is not a
measure of standards of living per se. According to Fergany (2003), human
development is the development of society and its all institutions. To ensure
development, not only economic conditions but also social conditions should be
developed.
An important point about the need to focus on human development is the
role of the government. In terms of human development, sanitation, health care,
fresh water usage, elementary education, adequate shelter, and clean environment
are the ultimate goals of governments (Suescun, 2007). For a comprehensive level
** The data was collected from World Bank.
Yönetim ve Ekonomi 22/1 (2015) 257-271
259
of welfare, public goods and services are evaluated as an obligation. As a result
of these services, in the long term, it is remarked economic yields together with
human development will be obtained. According to Doryan (2001), if
governments provide better education and health services for their citizens,
human capital accumulation will increase, and this will affect the economy in a
positive way in the long term. Gupta et al. (1998) mentioned that government
spending on education and health sectors could bring positive effects on human
capital, and this would cause an economy to grow and poverty to be reduced.
Lucas and Romer (1988) and Romer (1990) stated that high levels of human
capital would accelerate the technological advancement and economic
development by making the labor force more innovative.
Keynesian economics imposes important functions to governments for
economic growth and development. It is stated that without an active role of the
government, no countries can achieve economic growth and development.
Especially for a good long-term growth performance, government expenditures
on education and health improve human capital. In addition, government
expenditures cause accumulation of physical capital, and infrastructure
expenditures cause positive externalities. Within the framework of this evaluation,
it is understood that government policies, especially fiscal policies, do not only
focus on creating revenue streams. Governments should provide all kinds of
opportunities for citizens for contributing to production. It is required for
governments to use tools such as government spending and taxation in this
direction. However, in practice, the use of these policies varies according to
development levels of countries.
In this context, the main goal of this paper is to test the impact of fiscal
policy on human development empirically. For this purpose, we dealt with 14
OECD countries by utilizing annual data for the period 1998-2007. In the second
part of the paper, the method of calculation of the human development index will
be examined, and in the following part, the literature will be presented. In the
fourth part, model and data set will be given, and in the fifth part, method and
findings will be propounded. Finally, there will be a conclusion part.
II. Calculating Human Development Index
Although making quantitative measurements seems to be difficult for
human development and social welfare, it is fundamentally based on United
Nations Human Development Report (HDR). In this report, human development
index is calculated by measuring various social indicators for each country.
Indicators related to education, health, and income that are measured in various
units are converted subunits in the range of 0-1. For this conversion, minimum
and maximum values of each indicator are calculated (UNDP, 2010: 216).
Afterwards, human development index is calculated by employing subunits that
are obtained. Though the data of human development index has not been changed
since 1990, United Nations has changed some indicators related to income,
health, and education. These changes are shown in Table 1.
O. Kızılkaya & E. Koçak & E. Sofuoğlu / Maliye Politikalarının İnsani Gelişim Üzerindeki Rolü: Ampirik Bir
Yaklaşım
260
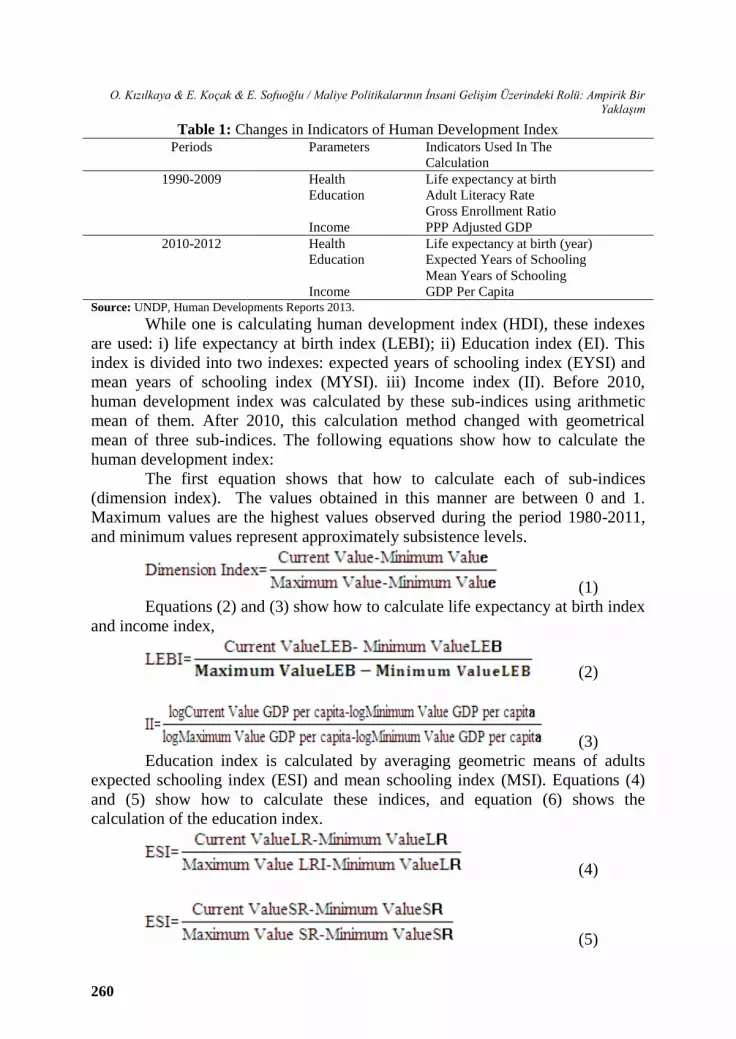
Table 1: Changes in Indicators of Human Development Index Periods Parameters Indicators Used In The
Calculation
1990-2009 Health Life expectancy at birth
Education Adult Literacy Rate
Gross Enrollment Ratio
Income PPP Adjusted GDP
2010-2012 Health Life expectancy at birth (year)
Education Expected Years of Schooling
Mean Years of Schooling
Income GDP Per Capita Source: UNDP, Human Developments Reports 2013.
While one is calculating human development index (HDI), these indexes
are used: i) life expectancy at birth index (LEBI); ii) Education index (EI). This
index is divided into two indexes: expected years of schooling index (EYSI) and
mean years of schooling index (MYSI). iii) Income index (II). Before 2010,
human development index was calculated by these sub-indices using arithmetic
mean of them. After 2010, this calculation method changed with geometrical
mean of three sub-indices. The following equations show how to calculate the
human development index:
The first equation shows that how to calculate each of sub-indices
(dimension index). The values obtained in this manner are between 0 and 1.
Maximum values are the highest values observed during the period 1980-2011,
and minimum values represent approximately subsistence levels.
(1)
Equations (2) and (3) show how to calculate life expectancy at birth index
and income index,
(2)
(3)
Education index is calculated by averaging geometric means of adults
expected schooling index (ESI) and mean schooling index (MSI). Equations (4)
and (5) show how to calculate these indices, and equation (6) shows the
calculation of the education index.
(4)
(5)
Yönetim ve Ekonomi 22/1 (2015) 257-271
261
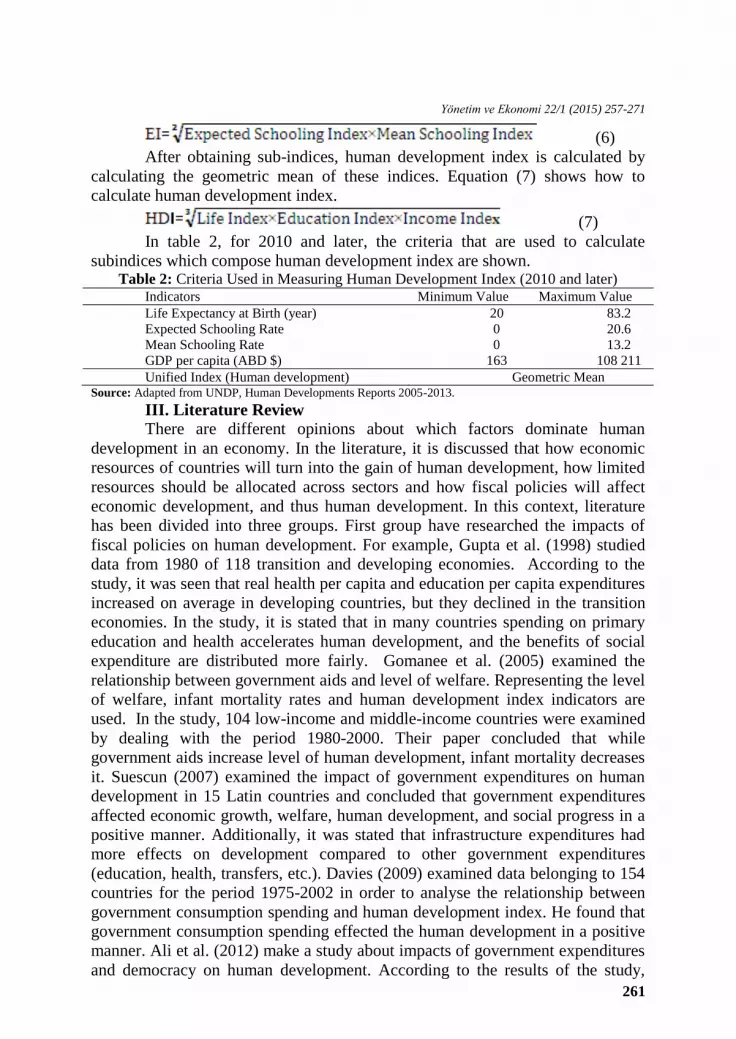
(6)
After obtaining sub-indices, human development index is calculated by
calculating the geometric mean of these indices. Equation (7) shows how to
calculate human development index.
(7)
In table 2, for 2010 and later, the criteria that are used to calculate
subindices which compose human development index are shown. Table 2: Criteria Used in Measuring Human Development Index (2010 and later)
Indicators Minimum Value Maximum Value
Life Expectancy at Birth (year) 20 83.2
Expected Schooling Rate 0 20.6
Mean Schooling Rate 0 13.2
GDP per capita (ABD $) 163 108 211
Unified Index (Human development) Geometric Mean Source: Adapted from UNDP, Human Developments Reports 2005-2013.
III. Literature Review
There are different opinions about which factors dominate human
development in an economy. In the literature, it is discussed that how economic
resources of countries will turn into the gain of human development, how limited
resources should be allocated across sectors and how fiscal policies will affect
economic development, and thus human development. In this context, literature
has been divided into three groups. First group have researched the impacts of
fiscal policies on human development. For example, Gupta et al. (1998) studied
data from 1980 of 118 transition and developing economies. According to the
study, it was seen that real health per capita and education per capita expenditures
increased on average in developing countries, but they declined in the transition
economies. In the study, it is stated that in many countries spending on primary
education and health accelerates human development, and the benefits of social
expenditure are distributed more fairly. Gomanee et al. (2005) examined the
relationship between government aids and level of welfare. Representing the level
of welfare, infant mortality rates and human development index indicators are
used. In the study, 104 low-income and middle-income countries were examined
by dealing with the period 1980-2000. Their paper concluded that while
government aids increase level of human development, infant mortality decreases
it. Suescun (2007) examined the impact of government expenditures on human
development in 15 Latin countries and concluded that government expenditures
affected economic growth, welfare, human development, and social progress in a
positive manner. Additionally, it was stated that infrastructure expenditures had
more effects on development compared to other government expenditures
(education, health, transfers, etc.). Davies (2009) examined data belonging to 154
countries for the period 1975-2002 in order to analyse the relationship between
government consumption spending and human development index. He found that
government consumption spending effected the human development in a positive
manner. Ali et al. (2012) make a study about impacts of government expenditures
and democracy on human development. According to the results of the study,
O. Kızılkaya & E. Koçak & E. Sofuoğlu / Maliye Politikalarının İnsani Gelişim Üzerindeki Rolü: Ampirik Bir
Yaklaşım
262
while an increase in income per capita and education spending has positive effects
on human development, current expenditures have negative effects. Additively,
according to the study, democratic regime has a negative impact on human
development. Nwakanma and Nnamdi (2013) examine the relevance between
taxes and human development in the period 1970-2010. According to the results
of the paper, while petroleum tax, income tax and consumption tax have positive
relationships with human development, corporate tax has a negative relationship
with it. The studies of the second group are on the relationship between public
spending and economic growth. Results of these studies differ from sample
countries, empirical methods, and periods. Barro (1991) observes the impact of
human capital, government investment, and consumption spending on growth for
85 countries for 1960-1985. As a result of the study, public consumption spending
has a negative effect, and public investment spending has a positive effect on
growth. Heitger (2001) examined 21 OECD countries and found that there was a
negative connection between total public spending and economic growth in 1960-
2000. However, a positive relationship between public spending and growth in
some studies was obtained. Alfranca and Galindo (2003) concluded that public
spending affected growth in a positive manner. Similarly, Kelly (2007) examined
the relationship between public spending and growth for 73 countries in 1970-
1989 and found a positive relation between public spending and growth. In the
literature, there are some papers that could not find any relationships between
public spending and growth. For example, Grossmann (1988) could not obtain
any relationships between public spending and growth. Studies based on the
third group are about the relationship of infrastructure and human development.
In these studies, electricity consumption is used on the behalf of infrastructure.
Thus, related literature is evaluated on the relationship between electricity
consumption and human development. Kanagawa and Nakata (2008) found a
positive relationship between electricity consumption and social-economic
variables. Martinez and Ebenhack (2008) researched the relationship between
energy consumption and human development, and they concluded that there was
a positive relationship between energy consumption and human development
index. Mazur (2011) stated in least developed countries, especially such as China
and India, electricity consumption was necessary to increase the level of welfare.
Niu et al. (2013) analyzed the causality relationships between electricity
consumption and human development for 50 countries in the period 1990-2009.
According to the results of the study, there is a long-run bidirectional causality
between electricity consumption and human development indicators.
IV. Model and Data Set
In this study, we aim at examining the relationship between fiscal policies
and human development and deal with 14 OECD countries (United States,
Austria, Australia, Germany, France, Holland, England, Sweden, Switzerland,
Spain, Italy, Canada, Norway, Greece) by using annual data for the period 1998-
2007. The primary reason for the limitation of the period is the accessibility of
Yönetim ve Ekonomi 22/1 (2015) 257-271
263
data set. The second reason is that the calculation of the human development
index changed after the year 2010.
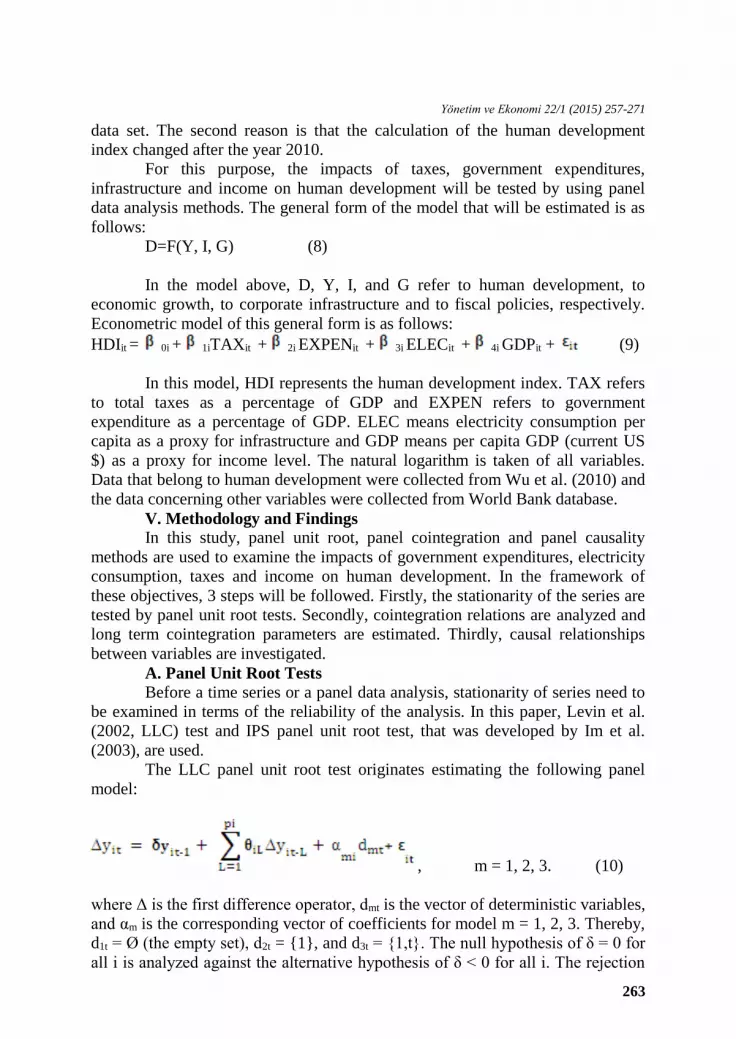
For this purpose, the impacts of taxes, government expenditures,
infrastructure and income on human development will be tested by using panel
data analysis methods. The general form of the model that will be estimated is as
follows:
D=F(Y, I, G) (8)
In the model above, D, Y, I, and G refer to human development, to
economic growth, to corporate infrastructure and to fiscal policies, respectively.
Econometric model of this general form is as follows:
HDIit = 0i + 1iTAXit + 2i EXPENit + 3i ELECit + 4i GDPit + (9)
In this model, HDI represents the human development index. TAX refers
to total taxes as a percentage of GDP and EXPEN refers to government
expenditure as a percentage of GDP. ELEC means electricity consumption per
capita as a proxy for infrastructure and GDP means per capita GDP (current US
$) as a proxy for income level. The natural logarithm is taken of all variables.
Data that belong to human development were collected from Wu et al. (2010) and
the data concerning other variables were collected from World Bank database.
V. Methodology and Findings
In this study, panel unit root, panel cointegration and panel causality
methods are used to examine the impacts of government expenditures, electricity
consumption, taxes and income on human development. In the framework of
these objectives, 3 steps will be followed. Firstly, the stationarity of the series are
tested by panel unit root tests. Secondly, cointegration relations are analyzed and
long term cointegration parameters are estimated. Thirdly, causal relationships
between variables are investigated.
A. Panel Unit Root Tests
Before a time series or a panel data analysis, stationarity of series need to
be examined in terms of the reliability of the analysis. In this paper, Levin et al.
(2002, LLC) test and IPS panel unit root test, that was developed by Im et al.
(2003), are used.
The LLC panel unit root test originates estimating the following panel
model:
, m = 1, 2, 3. (10)
where Δ is the first difference operator, dmt is the vector of deterministic variables,
and αm is the corresponding vector of coefficients for model m = 1, 2, 3. Thereby,
d1t = Ø (the empty set), d2t = {1}, and d3t = {1,t}. The null hypothesis of δ = 0 for
all i is analyzed against the alternative hypothesis of δ < 0 for all i. The rejection
O. Kızılkaya & E. Koçak & E. Sofuoğlu / Maliye Politikalarının İnsani Gelişim Üzerindeki Rolü: Ampirik Bir
Yaklaşım
264
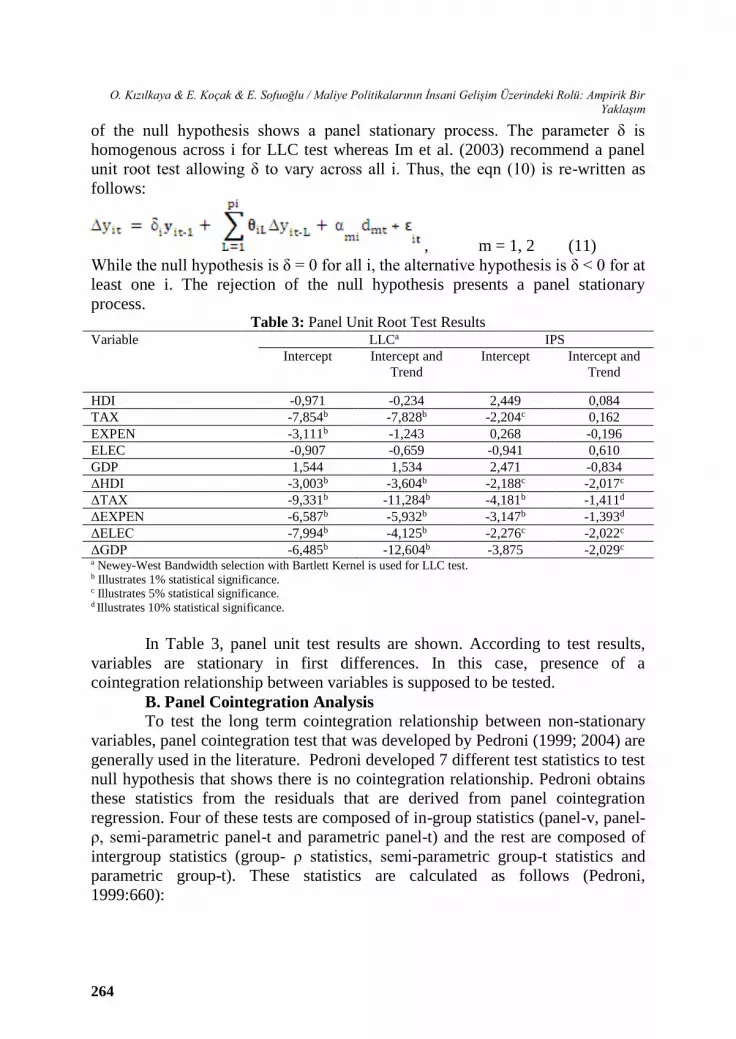
of the null hypothesis shows a panel stationary process. The parameter δ is
homogenous across i for LLC test whereas Im et al. (2003) recommend a panel
unit root test allowing δ to vary across all i. Thus, the eqn (10) is re-written as
follows:
, m = 1, 2 (11)
While the null hypothesis is δ = 0 for all i, the alternative hypothesis is δ < 0 for at
least one i. The rejection of the null hypothesis presents a panel stationary
process. Table 3: Panel Unit Root Test Results
Variable LLCa IPS
Intercept Intercept and
Trend
Intercept Intercept and
Trend
HDI -0,971 -0,234 2,449 0,084
TAX -7,854b -7,828b -2,204c 0,162
EXPEN -3,111b -1,243 0,268 -0,196
ELEC -0,907 -0,659 -0,941 0,610
GDP 1,544 1,534 2,471 -0,834
ΔHDI -3,003b -3,604b -2,188c -2,017c
ΔTAX -9,331b -11,284b -4,181b -1,411d
ΔEXPEN -6,587b -5,932b -3,147b -1,393d
ΔELEC -7,994b -4,125b -2,276c -2,022c
ΔGDP -6,485b -12,604b -3,875 -2,029c a Newey-West Bandwidth selection with Bartlett Kernel is used for LLC test. b Illustrates 1% statistical significance. c Illustrates 5% statistical significance. d Illustrates 10% statistical significance.
In Table 3, panel unit test results are shown. According to test results,
variables are stationary in first differences. In this case, presence of a
cointegration relationship between variables is supposed to be tested.
B. Panel Cointegration Analysis
To test the long term cointegration relationship between non-stationary
variables, panel cointegration test that was developed by Pedroni (1999; 2004) are
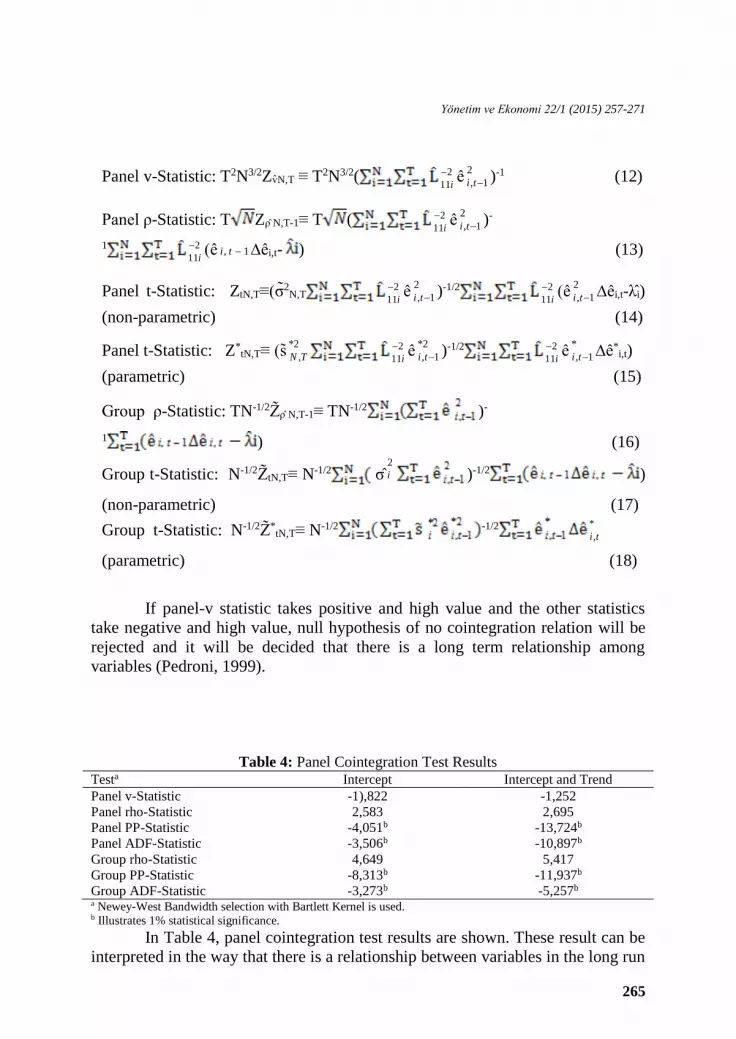
generally used in the literature. Pedroni developed 7 different test statistics to test
null hypothesis that shows there is no cointegration relationship. Pedroni obtains
these statistics from the residuals that are derived from panel cointegration
regression. Four of these tests are composed of in-group statistics (panel-v, panel-
ρ, semi-parametric panel-t and parametric panel-t) and the rest are composed of
intergroup statistics (group- ρ statistics, semi-parametric group-t statistics and
parametric group-t). These statistics are calculated as follows (Pedroni,
1999:660):
Yönetim ve Ekonomi 22/1 (2015) 257-271
265
Panel v-Statistic: T2N3/2Zv̂N,T ≡ T2N3/2( 2
11i
ê2
, 1i t )-1 (12)
Panel ρ-Statistic: T Zρ̂ N,T-1≡ T ( 2
11i
ê2
, 1i t )-
1 2
11i
(ê , 1i t ∆êi,t- ) (13)
Panel t-Statistic: ZtN,T≡(σ̃2N,T2
11i
ê2
, 1i t )-1/2 2
11i
(ê2
, 1i t ∆êi,t-λ̂i)
(non-parametric) (14)
Panel t-Statistic: Z*tN,T≡ (s͂
*2
,N T2
11i
ê*2
, 1i t )-1/2 2
11i
ê*
, 1i t Ɛ*i,t)
(parametric) (15)
Group ρ-Statistic: TN-1/2Z͂ρ̂ N,T-1≡ TN-1/2 )-
1 ) (16)
Group t-Statistic: N-1/2Z͂tN,T≡ N-1/2 σ̂2
i )-1/2 )
(non-parametric) (17)
Group t-Statistic: N-1/2Z͂*tN,T≡ N-1/2 -1/2 *
,i t
(parametric) (18)
If panel-v statistic takes positive and high value and the other statistics
take negative and high value, null hypothesis of no cointegration relation will be
rejected and it will be decided that there is a long term relationship among
variables (Pedroni, 1999).
Table 4: Panel Cointegration Test Results
Testa Intercept Intercept and Trend
Panel v-Statistic -1),822 -1,252
Panel rho-Statistic 2,583 2,695
Panel PP-Statistic -4,051b -13,724b
Panel ADF-Statistic -3,506b -10,897b
Group rho-Statistic 4,649 5,417
Group PP-Statistic -8,313b -11,937b
Group ADF-Statistic -3,273b -5,257b a Newey-West Bandwidth selection with Bartlett Kernel is used. b Illustrates 1% statistical significance.
In Table 4, panel cointegration test results are shown. These result can be
interpreted in the way that there is a relationship between variables in the long run
O. Kızılkaya & E. Koçak & E. Sofuoğlu / Maliye Politikalarının İnsani Gelişim Üzerindeki Rolü: Ampirik Bir
Yaklaşım
266
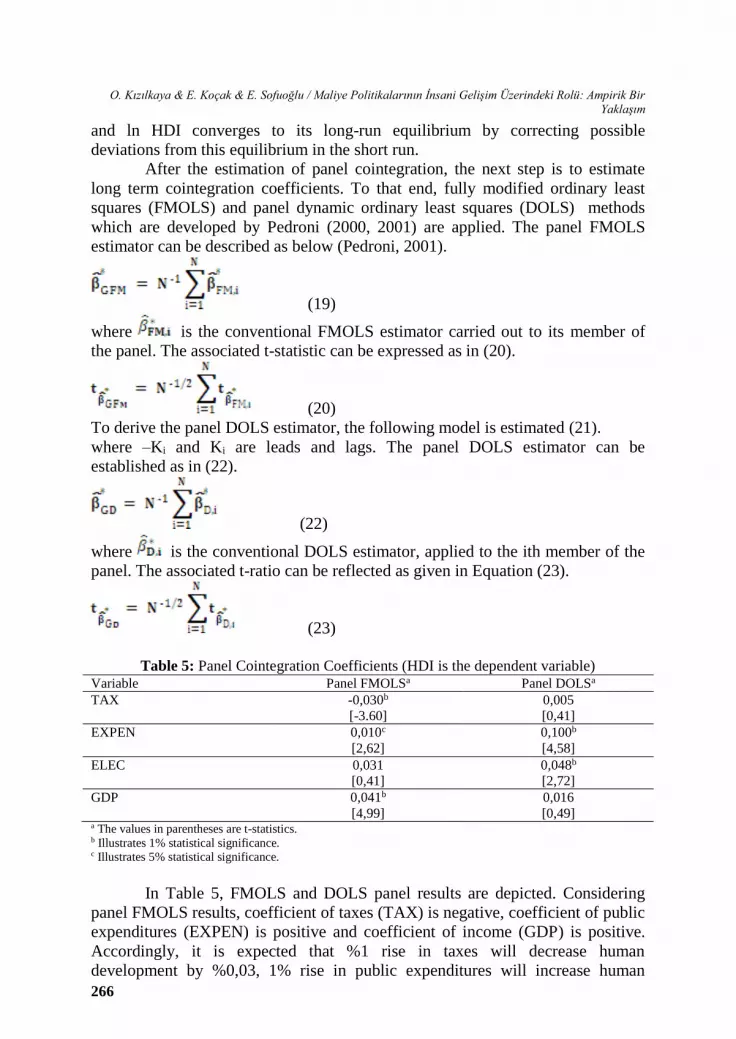
and ln HDI converges to its long-run equilibrium by correcting possible
deviations from this equilibrium in the short run.
After the estimation of panel cointegration, the next step is to estimate
long term cointegration coefficients. To that end, fully modified ordinary least
squares (FMOLS) and panel dynamic ordinary least squares (DOLS) methods
which are developed by Pedroni (2000, 2001) are applied. The panel FMOLS
estimator can be described as below (Pedroni, 2001).
(19)
where is the conventional FMOLS estimator carried out to its member of
the panel. The associated t-statistic can be expressed as in (20).
(20)
To derive the panel DOLS estimator, the following model is estimated (21).
where –Ki and Ki are leads and lags. The panel DOLS estimator can be
established as in (22).
(22)
where is the conventional DOLS estimator, applied to the ith member of the
panel. The associated t-ratio can be reflected as given in Equation (23).
(23)
Table 5: Panel Cointegration Coefficients (HDI is the dependent variable)
Variable Panel FMOLSa Panel DOLSa
TAX -0,030b
[-3.60]
0,005
[0,41]
EXPEN
0,010c
[2,62]
0,100b
[4,58]
ELEC
0,031
[0,41]
0,048b
[2,72]
GDP
0,041b
[4,99]
0,016
[0,49] a The values in parentheses are t-statistics. b Illustrates 1% statistical significance. c Illustrates 5% statistical significance.
In Table 5, FMOLS and DOLS panel results are depicted. Considering
panel FMOLS results, coefficient of taxes (TAX) is negative, coefficient of public
expenditures (EXPEN) is positive and coefficient of income (GDP) is positive.
Accordingly, it is expected that %1 rise in taxes will decrease human
development by %0,03, 1% rise in public expenditures will increase human
Yönetim ve Ekonomi 22/1 (2015) 257-271
267
development by %0,01 and %1 rise in income will increase human development
by %0,04. Coefficient of electricity consumption is not statistically significant.
With reference to results of panel DOLS, coefficients of public expenditures and
electricity consumption are positive and statistically significant. In other words,
rise that will take place 1% in public expenditures and electricity consumption, is
expected to increase human development in the rate of %0,1 and %0,04
respectively. Coefficients of income and taxes are not statistically significant.
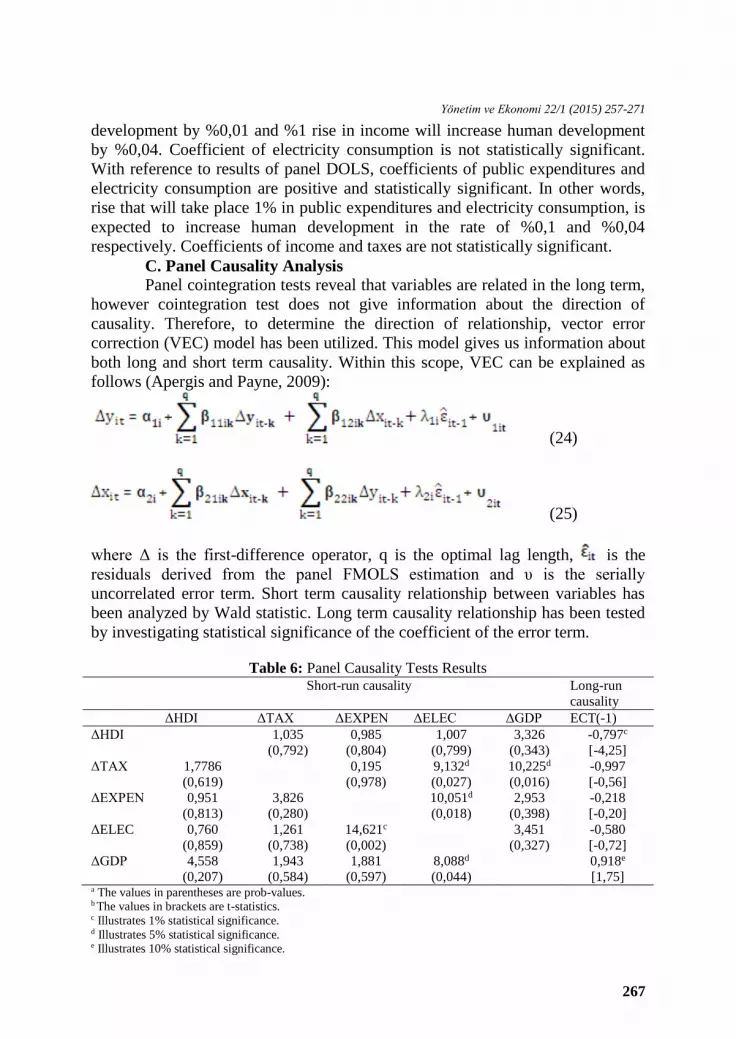
C. Panel Causality Analysis
Panel cointegration tests reveal that variables are related in the long term,
however cointegration test does not give information about the direction of
causality. Therefore, to determine the direction of relationship, vector error
correction (VEC) model has been utilized. This model gives us information about
both long and short term causality. Within this scope, VEC can be explained as
follows (Apergis and Payne, 2009):
(24)
(25)
where Δ is the first-difference operator, q is the optimal lag length, is the
residuals derived from the panel FMOLS estimation and υ is the serially
uncorrelated error term. Short term causality relationship between variables has
been analyzed by Wald statistic. Long term causality relationship has been tested
by investigating statistical significance of the coefficient of the error term.
Table 6: Panel Causality Tests Results
Short-run causality Long-run
causality
ΔHDI ΔTAX ΔEXPEN ΔELEC ΔGDP ECT(-1)
ΔHDI 1,035
(0,792)
0,985
(0,804)
1,007
(0,799)
3,326
(0,343)
-0,797c
[-4,25]
ΔTAX
1,7786
(0,619)
0,195
(0,978)
9,132d
(0,027)
10,225d
(0,016)
-0,997
[-0,56]
ΔEXPEN
0,951
(0,813)
3,826
(0,280)
10,051d
(0,018)
2,953
(0,398)
-0,218
[-0,20]
ΔELEC
0,760
(0,859)
1,261
(0,738)
14,621c
(0,002)
3,451
(0,327)
-0,580
[-0,72]
ΔGDP
4,558
(0,207)
1,943
(0,584)
1,881
(0,597)
8,088d
(0,044)
0,918e
[1,75] a The values in parentheses are prob-values. b The values in brackets are t-statistics. c Illustrates 1% statistical significance. d Illustrates 5% statistical significance. e Illustrates 10% statistical significance.
O. Kızılkaya & E. Koçak & E. Sofuoğlu / Maliye Politikalarının İnsani Gelişim Üzerindeki Rolü: Ampirik Bir
Yaklaşım
268
Granger causality test based on panel VEC results are shown in Table 6.
There is a bi-directional causal relationship between government expenditures and
electricity consumption in the short run. In addition, there is a unidirectional
causal relationship from income to taxes, from electricity consumption to taxes
and income. In the long term, there are causality relationships from taxes,
government expenditures, electricity consumption and income to human
development and from human development, taxes, government expenditures and
electricity consumption to income.
VI. Conclusion and Policy Proposal
The goal of this study is to test the impact of fiscal policies on the human
development empirically. In the context of this objective, this paper analyses the
impacts of taxes (representing fiscal policies), government expenditures,
electricity consumption (representing infrastructure) and income on human
development for 14 OECD countries in the period 1998-2007. We utilized panel
unit root and panel cointegration tests, panel FMOLS and panel DOLS estimators
and panel causality test based on panel vector error correction model in this study.
According to panel FMOLS results, while taxes have a negative impact on human
development, government expenditures and income have a positive impact on it.
The coefficient of the electricity consumption is not statistically significant. In
addition, government expenditures and electricity consumption have a positive
effect on human development according to panel DOLS results, however the
coefficients of income and taxes are not statistically significant. Causality test
results indicate that, in the long term, there are causal relationships from taxes,
government expenditures, electricity consumption and income to human
development and from taxes, government expenditures, human development and
electricity consumption to income. In the short term, there is a bidirectional
relationship between government expenditures and electricity consumption and
unidirectional relationships are from income to taxes and from electricity
consumption to both taxes and income.
Considering these results, it is seen that an effective fiscal policy can
dominate human development and offer new ideas to propose new policy targets.
In this context, to provide human development in parallel with economic level of
development, not only income policies but also human centered development
models are required for national economies. In other words, together with income
policies, development policy that takes into account the quality of life and human
centered development models are recommended to be applied. In order to ensure
social development, not only economic conditions but also social conditions are
needed to be improved. Therefore, while governments are implementing fiscal
policies, they are recommended to make a point of increasing investment on
social and cultural fields, enhancing quality of life of individuals, and giving
priority to the human dimension of development. For example, according to
United Nations Reports, which were published in the last decade, Norway,
Canada, Sweden and Switzerland are the countries with the highest level of
human development. The common feature in these countries is that there is an
Yönetim ve Ekonomi 22/1 (2015) 257-271
269
important role of the government in human development and welfare According
to Angell (2011), when government policies are evaluated as a whole in Norway,
it will be seen that these policies are on the basis of social equality. In terms of
achieving this objective, especially education system constitutes an important
institution. For this reason, governments provide considerable funds for education
institutions. In this way, investment on education system will contribute greatly
on development of children who form the future of country by enhancing their
ability. With the importance given to education, an efficient fiscal policy and dual
tax system are implemented in Norway. Karakurt and Akdemir (2010) stated that
in this system progressive tax was taken from labor income and a fixed-rate tax
was taken from capital income. Thus, capital outflow is prevented, and significant
amount of tax revenues are obtained. Thereby, for the redistribution of income
welfare programs are implemented successfully. As a consequence, the dual
income tax system in Norway is highly successful on the subject of without
undermining economic development, providing high revenue and redistributing
income (Oliver, 2012). Another sample country is Sweden. According to Thakur
et al. (2007), Sweden is utilized as a modern welfare state, and the main reason
for this situation is the policies that are implemented by the government.
Government has played an active role in redistribution of income in Sweden.
Governments develop the infrastructure by making significant investments in
numerous fields and produce positive externalities. In addition, the state gives
importance to public policy, especially to education and to health care. Today in
Sweden, government has the most important role in providing employment in
public and health fields. In other words, it appears that governments have a key
role on human development.
Kaynakça ALFRANCA, O. and M. A. GALINDO (2003), “Public Expenditure, Income Distribution, and
Growth in OECD Countries, International Advances in Economic Research, 9(2), 133-
139.
ALI, S. A. , H. RAZA and M. U. YOUSUF (2012), "The Role of Fiscal Policy in Human
Development: The Pakistan’s Perspective", The Pakistan Development Review, 51 (4),
381-396.
ANAND, S. and SEN, A (1994), “Human Development Index: Methodology and Measurement”,
Human Development Report Office Occasional Paper 12, UNDP, New York.
ANGELL, O. H. (2011), “Challenges to Equality in the Welfare State: The Norwegian Case of
Drammen”, International Beliefs and Values, 3 (1), 41-50.
APERGIS, N., PAYNE, J.E., (2009) “Energy Consumption and Economic Growth: Evidence From
the Commonwealth of Independent States”, Energy Economics, 31, 641-647.
BARRO, R. J. (1991), “Economic Growth in a Cross Section of Countries”, The Quarterly Journal
of Economics, 106(2), 407-443.
DAVIES, A. (2009), "Human Development and The Optimal Size of Government", The Journal of
Socio-Economics, 38 (2), 326-330.
DENK, O. (2012), “Tax Reform in Norway: A Focus on Capital Taxation”, OECD Economics
Department Working Papers, No. 950, OECD Publishing.
DORYAN, E. (2001), “Poverty, Human Development and Public Expenditure: Developing Actions
for Government and Civil Society, in Equity and Health: Views from the Pan American
Sanitary Bureau” Pan American Health Organization, Washington.
O. Kızılkaya & E. Koçak & E. Sofuoğlu / Maliye Politikalarının İnsani Gelişim Üzerindeki Rolü: Ampirik Bir
Yaklaşım
270
FERGANY, N. (2003), “Social Innovation for Human Development an Arab Region Perspective”,
FRIDE, Madrid.
GOMANEE, K. , O. MORRISSEY, P. MOSLE and VERSCHOO, A (2005), “Aid, Government
Expenditure and Aggregate Welfare”, World Development, 33 (3), 355–370.
GUPTA, S. , B. CLEMENTS AND E. TIONGSON, (1998), “Public Spending on Human
Development”, Finance & Development, 35 (3), 10-13.
HAQ, M. (1995), “Reflections of Human Development”, Oxford University Press, New York.
HEITGER, B. (2001), “The Scope of Government and Its Impact on Economic Growth in OECD
Countries”, (No. 1034), Kieler Arbeitspapiere.
HUMAN DEVELOPMENT REPORT 2005, “International Cooperation at a Crossroads, Aid, Trade
and Security in an Unegual World”,
http://hdr.undp.org/sites/default/files/reports/266/hdr05_complete.pdf,(15.03.2014)
HUMAN DEVELOPMENT REPORT 2010, “The Real Wealth of Nations: Pathways to Human
Development”,
http://hdr.undp.org/sites/default/files/reports/270/hdr_2010_en_complete_reprint.pdf,
(15.03.2014).
HUMAN DEVELOPMENT REPORT 2013, “The Rise of the South: Human Progress in a Diverse
World”, http://hdr.undp.org/sites/default/files/reports/14/hdr2013_en_complete.pdf,
(15.03.2014).
IM, K.S., Pesaran, M.H., SHIN, Y., (2003), “Testing For Unit Roots in Heterogeneous Panel”,
Journal of Econometrics, 115, 53-74.
KARAKURT, B. and AKDEMIR, T (2010), “Kurallı Maliye Politikası: Türkiye’de Kurallı Maliye
Politikası Örnekleri”, Maliye Dergisi, 158, 226-261.
KANAGAWA, M. and T. NAKATA (2008), “Assessment of Access to Electricity and The
Socioeconomicimpacts in Rural Areas of Developing Countries, Energy Policy, 36(6),
2016–2029.
KELLY, T. (1997), “Public Expenditures and Growth”, The Journal of Development Studies, 34(1),
60-84.
LEVIN, A., LIN, C.F., CHU, C.S.J., (2002), “Unit Root Tests in Panel Data: Asymptotic and Finite-
Sample Properties”, Journal of Econometrics, 108, 1-24.
MARTINEZ, D. and B. EBENHACK (2008), “Understanding The Role of Energy Consumption in
Human Development Through The Use of a Saturation Phenomena”, Energy Policy, 36,
1430-1435.
MAZUR, A. (2011), “Does Increasing Energy or Electricity Consumption Improve Quality of Life
in Industrial Nations?”, Energy Policy, 39(5), 2568–72.
LUCAS, R. (1988), “On The Mechanics of Economic Development”, Journal of Monetary
Economics, 22(1), 3-42.
NWAKANMA, P.C. and K.C. NNAMDI (2013), “Taxation And National Development”, Research
Journal of Finance and Accounting, 19 (4), 2222-2847.
NIU, S., Y. JIA, W. WANG, R. HE, L. HU and LIU, Y (2013), “Electricity Consumption and
Human Development Level: A Comparative Analysis Based on Panel Data for 50
Countries”, International Journal of Electrical Power & Energy Systems, 53, 338-347.
PEDRONI, P., (1999), “Critical Values for Cointegration Tests in Heterogeneous Panels With
Multiple Regressors”, Oxf. Bull. of Economics and Statistics, 61, 653-670.
PEDRONI, P., (2000) “Fully Modified OLS for Heterogeneous Cointegrated Panels”, Advances in
Econometrics, 15, 93-130.
PEDRONI, P., (2001), “Purchasing Power Parity Tests in Cointegrated Panels”, Rev. of Economics
and Statistics, 83, 727-731.
PEDRONI, P., (2004), “Panel Cointegration: Asymptotic and Finite Sample Properties of Pooled
Time Series Tests With An Application to the PPP Hypothesis”, Econometric Theory, 20,
597-625.
PRASETYO, A. D. and U. ZUHDI (2013), “The Government Expenditure Efficiency Towards The
Human Development”, Procedia Economics and Finance, 5, 615-622.
Yönetim ve Ekonomi 22/1 (2015) 257-271
271
ROMER, P. (1990), “Human Capital and Growth: Theory and Evidence”, Carnegie- Rochester
Conference Series on Public Policy, 32, 251-285.
SUESCUN, R. (2007), “The Role Of Fiscal Policy In Human Development and Growth”, LAC
Regional.
THAKUR, S., MICHAEL K., BALAZS H. AND VALERIE C. (2003), “Sweden’s Welfare State”,
International Monetary Fund.
UNITED NATIONS DEVELOPMENT PROGRAMME, HUMAN DEVELOPMET REPORTS
(UNDP),
https://data.undp.org/dataset/Table-2-Human-Development-Index-trends/efc4-gjvq (17.01.2014).
WALLACE, L. (2004). “People in Economics”, Finance and Development, 41(3), 4–5.
WORLD BANK, GDP GROWTH and GINI INDEX,
http://data.worldbank.org/indicator/NY.GDP.MKTP.KD.ZG, (02.02.2014).
http://data.worldbank.org/indicator/SI.POV.GINI, (02.02.2014).
WU, Q., MASLYUK, S., & CLULOW, V. (2010), “Energy Consumption Transition and Human
Development”, Monash University, Department of Economics, (No. 43-10).
Copyright © 2022 FDOKUMEN