The Role of Assessment Infrastructures in Crafting Project ...
254
NORTHWESTERN UNIVERSITY The Role of Assessment Infrastructures in Crafting Project-Based Science Classrooms A DISSERTATION SUBMITTED TO THE GRADUATE SCHOOL IN PARTIAL FULFILLMENT OF THE REQUIREMENTS for the degree DOCTOR OF PHILOSOPHY Field of Education and Social Policy — Learning Sciences By Laura Marie D’Amico EVANSTON, ILLINOIS June 1999
-
Upload
khangminh22 -
Category
Documents
-
view
3 -
download
0
Transcript of The Role of Assessment Infrastructures in Crafting Project ...

NORTHWESTERN UNIVERSITY
The Role of Assessment Infrastructuresin Crafting Project-Based Science Classrooms
A DISSERTATION
SUBMITTED TO THE GRADUATE SCHOOLIN PARTIAL FULFILLMENT OF THE REQUIREMENTS
for the degree
DOCTOR OF PHILOSOPHY
Field of Education and Social Policy — Learning Sciences
By
Laura Marie D’Amico
EVANSTON, ILLINOIS
June 1999
ii
© Copyright by Laura Marie D’Amico 1999All Rights Reserved
iii
ABSTRACT
The Role of Assessment Infrastructuresin Crafting Project-Based Science Classrooms
Laura Marie D’Amico
In project-based science teaching, teachers engage students in the practice of
conducting meaningful investigations and explanations of natural phenomena, often in
collaboration with fellow students or adults. Reformers suggest that this approach can
provide students with more profitable learning experiences; but for many teachers, a
shift to such instruction can be difficult to manage. As some reform-minded teachers
have discovered, classroom assessment can serve as a vital tool for meeting the
challenges associated with project science activity.
In this research, classroom assessment was viewed as an infrastructure that
both students and teachers rely upon as a mediational tool for classroom activity and
communications. The study explored the classroom assessment infrastructures created
by three teachers involved in the Learning through Collaborative Visualization
(CoVis) Project from 1993–94 to 1995–96. Each of the three teachers under study
either created a new course or radically reformulated an old one in an effort to
incorporate project-based science pedagogy and supporting technologies. Data in the
form of interviews, classroom observations, surveys, student work, and teacher records
was collected. From these data, an interpretive case study was developed for each

iv
course and its accompanying assessment infrastructure. A set of cross-case analyses
was also constructed, based upon common themes that emerged from all three cases.
These themes included: the assessment challenges based on the nature of project
activity, the role of technology in the teachers’ assessment infrastructure designs, and
the influence of the wider assessment infrastructure on their course and assessment
designs. In combination, the case studies and cross-case analyses describe the
synergistic relationship between the design of pedagogical reforms and classroom
assessment infrastructures, as well as the effectiveness of all three assessment designs.
This work contributes to research and practice associated with assessment and
pedagogical reform in three ways. First, it provides a theoretical frame for the
relationship between assessment and pedagogical reform. Second, it provides a set of
taxonomies which outline both the challenges of project-based science activity and
typical assessment strategies to meet them. Finally, it provides a set of cautions and
recommendations for designing classroom assessment infrastructures in support of
project-based science.

v
To
“Roger Wolfe,”
“Carol Patterson,”
“Gary Magi,”
and
“Melanie Ribbon”
for all that you have taught me.

vi
And identity is funny being yourself is funny as you arenever yourself to yourself except as you rememberyourself and then of course you do not believe yourself.
Gertrude SteinEverybody’s Autobiography
all which isn’t singing is mere talkingand all talking’s talking to oneself(whether that oneself be sought of seekingmaster or disciple sheep or wolf)
gush to it as deity or devil—toss in sobs and reasons threats and smilesname it cruel fair or blessed evil—it is you(né i)nobody else
drive dumb mankind dizzy with haranguing—you are deafened every mother’s son—all is merely talk which isn’t singingand all talking’s to oneself alone
but the very song of(as mountainsfeel and lovers)singing is silence
e. e. cummings#32 from 73 poems
He tore through air and light until he had to loose evenhis furious desire, like ballast, to keep his speed.
Patricia A. McKillipHarpist in the Wind

vii
ACKNOWLEDGMENTS
It is customary, and perhaps most proper, to start one’s acknowledgments by
tribute to one’s dissertation chair and committee. However, I feel a strong need to
break with that tradition and speak of my family first. I have been blessed with an
incredible set of parents and siblings. Throughout this endeavor they have supported
and guided me, provided shoulders to cry on, ears to babble at, places to hide and
relax, and money when times were tight. They have been my cheerleaders and my
biggest fans; these pages would not exist without them. My heartfelt thanks go to my
marvelous parents, Joyce and Frank Damico, the best sister and brother in the
universe, Kat Vitale and Michael D’Amico; and their most amazing spouses, Sal
Vitale and Trina D’Amico.
I have also been blessed with old, old friends who have the patience to listen
and even care about my research when it has nothing to do with their lives, who tell
me honestly when I’m either crazy or wrong, and pull me out of the pit of despair just
when I’m about to give up. I thank Cassandra Counard, Beth Brenneman, Kate
Wheeler, Claire Epley and Julianne Dalcanton for showing me how to take risks and
find joy in what I do, Lawrence Sterzinger and Melissa Naud for teaching me much
about calm and efficiency, C. C. Travers for passing on her insights on the usefulness
of appropriately applied denial and rationalization, Angela Sue Blank for showing me

viii
the benefits of never taking myself too seriously, and Page Alyce Ransom for teaching
me to sing really loudly in a red convertible with the top down on a moonlit night.
I am further lucky to have a dissertation committee composed of some of the
best minds in educational research. I thank Roy D. Pea for his vision and incisive
intellect, which both created the CoVis Project and encouraged those of us involved to
think deeply about our endeavors. I thank Brian J. Reiser for his stewardship of the
Learning Sciences Ph.D. program, his commitment to the graduate students in the
program as a whole, and his keen insights into our work. Allan Collins has always
been my inspiration, a beacon in the blackness of dissertation night. One should never
underestimate the power of inspiration. I am deeply grateful for it. Finally, I offer a
heartfelt thank you to my advisor, Louis M. Gomez, the day-to-day heart of the CoVis
team, for his warmth, good humor and patience. Without his continual encouragement
and advice from the time this study was the barest inkling of an idea, it never would
have become to the mass of paper you now have before you.
The Learning through Collaborative Visualization (CoVis) project (funded by
NSF grants RED-9454729 and MDR88-55582 and the Illinois State Board of
Education under the Eisenhower program) built a vibrant and imaginative community
of researchers and practitioners which served as the context for this study. I am
particularly grateful to the participating teachers and students who so generously
shared with me their time and thoughts for this study. I thank the entire CoVis
research team, including: Christy Aronson, Cheryl Copre, Danny Edelson, Barry

ix
Fishman, Douglas Gordin, Joey Gray, Peter Hereña, Samuel Kwon, Laura Leyva,
Linda Ortega, Pheobe Peng, Susan Rand, and Raul Zaritsky. Special thanks go to
Greg Shrader, a marvelously tolerant office mate, who gracefully endured all my
dissertation neuroses and shared wedding planning histrionics as we both planned for
our big days. I am deeply indebted to Eileen Lento, my mentor and champion,
collaborator and conspirator, who taught me the cathartic value of gratuitously violent
action movies for researchers under stress. Most importantly, undying gratitude goes
to Joe Polman, my “shadow committee member.” Joe gave me advice on everything
from how to take field notes to getting through dissertation writer’s block. He read
every chapter and provided excellent feedback along the way. I cannot express my
appreciation to him enough in words. I think I will have to send him a plant or a
cookie or something.
The Learning Sciences program at Northwestern University was just starting
its first official year in 1992 when I began graduate school in complete and utter
ignorance of what I was getting myself into. While the program had its ups and
downs, as all new endeavors do, it was blessed with an incredibly talented set of initial
students and thought provoking faculty. These fiery minds were interesting, inspiring,
refreshing, occasionally annoying, but always challenging, and the best of my thoughts
owe much to the crucible of their inspection. I thank the Learning Sciences faculty for
creating a program rich in both practical experience and theoretical grounding, and I
thank my fellow students for their continued support as we discovered what it meant to

x
be “learning scientists” together. Beyond my fellow CoVis graduate students, I extend
particular appreciation to John Everett and the Dames that Dine, especially Nichole
Pinkard, Diana Joseph and Iris Tabak. Most importantly, I thank my coffee buddy,
Brian Smith, for his wisdom and humor. I doubt I had a single worthwhile idea that
was not improved by being run past his razor-sharp mind or a single frustration that
was not laughed away on the edge of his sardonic humor.
I left Northwestern before the dissertation was complete to take a “postdoc”
position at the Learning Research and Development Center at the University of
Pittsburgh. The other researchers on the High Performance Learning Communities
(HPLC) Project have taught me much me about research and about writing which have
definitely improved my efforts to finish. I owe the entire team, particularly Mary Kay
Stein and Nancy Israel, much for their patience and support.
I thank Norean Hill, Nancy Condreva and Tuon Samahon for their assistance
with interview transcription, and Marsha Coffey for her help on the final editing of
this document.
Last, but certainly not least, I wish to thank D. Kevin O’Neill, the “nice
Canadian boy” I married, who challenges me, supports me, laughs with me, helps me
think, buys me chocolate ice-cream when I’m sick, dances with me in the kitchen for
no particular reason, and most importantly, inspires and delights me every day.

xi
TABLE OF CONTENTS
LIST OF TABLES.......................................................................................................xvi
LIST OF ILLUSTRATIONS......................................................................................xvii
Chapter
1 INTRODUCTION...................................................................................................1Project-Based Pedagogy ........................................................................................4Assessment and Reform.........................................................................................7Assessment as an Infrastructure.............................................................................9
Supporting and Constraining Activity in Socially Acceptable Ways.........10Remaining Unnoticed until Broken ............................................................11Extension and Circumvention Is Easier than Reconstruction.....................13Classroom Components of the Assessment Infrastructure .........................14Assessment Infrastructures as a Mediational Tool .....................................16
Conclusion ...........................................................................................................19
2 METHODS ..........................................................................................................25Sampling .....................................................................................................26
Teachers .............................................................................................26Class Sections ....................................................................................29Students..............................................................................................29
Data Collected.............................................................................................31Teacher Interviews and Gradebook Records .....................................34Curriculum Summaries ......................................................................38Classroom Observations and Artifacts...............................................40Student Interviews and Project Work ................................................43Student and Teacher Surveys.............................................................46Records on School and Community Demographics ..........................49
Analysis ......................................................................................................49Narrative Cases ..................................................................................50Context of the Study ..........................................................................52Courses and Their Assessment Infrastructures ..................................53Cross-Case Analysis ..........................................................................54

xii
3 THE SCHOOLS ..................................................................................................57School Community .....................................................................................58Scheduling ..................................................................................................59Security and Student Mobility ....................................................................59Grading, Tracking, and Counseling Systems..............................................60
Edgewater ..........................................................................................60Lakeside .............................................................................................64
Classroom and Technological Facilities .....................................................69Edgewater ..........................................................................................70Lakeside .............................................................................................73
Summary.....................................................................................................78
4 COURSES AND THEIR ASSESSMENT INFRASTRUCTURES....................79Earth Science at Edgewater High School ...................................................83
Course Structure and Philosophy.......................................................84The Assessment Infrastructure...........................................................92
Milestones.................................................................................93Daily Work Grade.....................................................................96Final Paper ................................................................................99Presentation.............................................................................101Post-Project Milestones ..........................................................102Non-Project Grades.................................................................103Weighting and Grade Calculation System..............................104Communicating about Grades ................................................104
Relationship between Assessment and Pedagogy............................105Environmental Science at Edgewater High School ..................................108
Course Structure and Philosophy.....................................................108The Assessment Infrastructure.........................................................117
Proposals.................................................................................117Progress Reports .....................................................................118Final Papers.............................................................................119Presentations ...........................................................................120Personal Grades ......................................................................121Non-Project Grades.................................................................124Communicating about Grades ................................................125Weighting and Grade Calculation System..............................125
Relationship between Assessment and Pedagogy............................128Science, Technology, and Society at Lakeside High School....................130
Course Structure and Philosophy.....................................................130The Assessment Infrastructure.........................................................140
Holistic Grading Scheme and Communicating aboutGrades ..................................................................................141

xiii
Weighting System...................................................................143Binders and Milestones...........................................................144Progress Reports and Binder Checks......................................146Research Passes ......................................................................147Non-Project Grades: Workshops and Journals ......................148Non-Project Grades: Other ....................................................149Personal Outcomes .................................................................150
Relationship between Assessment and Pedagogy............................150Different Infrastructures: Common Components ....................................151
5 CROSS-CASE ANALYSES .............................................................................153Assessment and the Nature of Project Activity ........................................153
The Long-term, Open-ended Nature of Project Work .....................154Providing Structure by Constraining the Project ....................155Providing Structure by Assigning Intermediate Products.......158Providing Focus and Course Correction by Conferring
with Students........................................................................163Encouraging Good Work Habits.............................................168
The Resource-Intensive Nature of Project Work.............................173Providing Students with Mobility...........................................174Avoiding Failure due to Resource Conflicts or Vacuums ......177
The Cooperative or Collaborative Nature of Project Work .............179The Iterative Nature of Project Work ..............................................181Integrated Assessment Design .........................................................184
Assessment and Technology.....................................................................185Influence of the Wider Assessment Infrastructure....................................192
The Influence of GPA on Classroom Assessment...........................193The Influence of Tracking and Sequencing on Student
Clientele ........................................................................................196Student Attitudes.......................................................................................200
Opinions on the Assessment Infrastructure .....................................200Beliefs about Course Goals..............................................................203Opinions on the Course as a Whole.................................................206
Cautions and Recommendations...............................................................212
6 CONCLUSION..................................................................................................220
REFERENCES ...........................................................................................................229
xiv
Appendix
A TEACHER INTERVIEW GUIDES .................................................................238Teacher Interview Guide for Winter 1994................................................238Interview Guide for Spring 1994 Interviews ............................................240Assessment Interview Guide: First Quarter 1994–95..............................241Assessment Interview Guide: Second Quarter 1994–95 .........................242Assessment Interview Guide: Third Quarter 1994–95 ............................245Assessment Interview Guide: Fourth Quarter 1994–95...........................247Instructional Goals Interview....................................................................249Assessment Interview Guide: First Quarter 1995–96..............................251Assessment Interview Guide: Second Quarter 1995–96 .........................253Assessment Interview Guide: Third Quarter 1995–96 ............................254
Roger Wolfe and Carol Patterson’s Version....................................254Gary Magi’s Version........................................................................255
Assessment Interview Guide: Fourth Quarter 1995–96...........................256
B STUDENT INTERVIEW GUIDES FOR 1995–96...........................................258Student Assessment Interview Guide: Winter 1996 (initial design)........258Student Assessment Interview Guide: Winter 1996 (revised).................259Student Assessment Interview Guide: Spring 1995–96 ..........................260Student Project Interview Guide: Third Quarter Project 1995–96 ..........264
C SAMPLE CURRICULUM SUMMARY CHART FROM 1994–95 ................266
D STUDENT SURVEYS......................................................................................267CoVis Fall Survey—Selected items .........................................................267CoVis Spring Survey ................................................................................273Student Beliefs about Class Goals: Spring 1996 .....................................276
E TEACHER SURVEY........................................................................................283
F GRADING SYSTEMS FOR 1995–96 ..............................................................289Roger Wolfe’s Grading System................................................................289
First Semester ..................................................................................289Second Semester ..............................................................................291Weight Given to Various Kinds of Work Each Quarter ..................293
Carol Patterson’s Grading System............................................................294First Semester ..................................................................................294Second Semester ..............................................................................295
Gary Magi’s Grading System ...................................................................296STS First Quarter Evaluation...........................................................297
xv
STS First Quarter Evaluation Criteria .............................................300STS Second Quarter Evaluation ......................................................303Netscape Project Evaluation ............................................................306STS 4th Quarter Evaluation.............................................................307
Fourth Quarter Research Paper Evaluation...............................................309
G HANDOUTS AND ARTIFACTS FROM ROGER WOLFE’S CLASS ..........310How To Do an Earth Science Project .......................................................310Project Reports..........................................................................................313
H HANDOUTS AND ARTIFACTS FROM CAROL PATTERSON’SCLASS............................................................................................................317
Global Warming: Project .........................................................................317Sample of Carol’s Written Response to a Group Project .........................321
I HANDOUTS AND ARTIFACTS FROM GARY MAGI’S CLASS................323STS 3rd Quarter Culminating Essay.........................................................323Sample Workshop Calendar for Third Quarter.........................................325STS Third Quarter Project: Energy and the Environment ........................326STS Third Quarter Project: Deadlines Handout ......................................329Sample Set of Workshop Journal Questions.............................................330STS Civic Contributions...........................................................................331
xvi
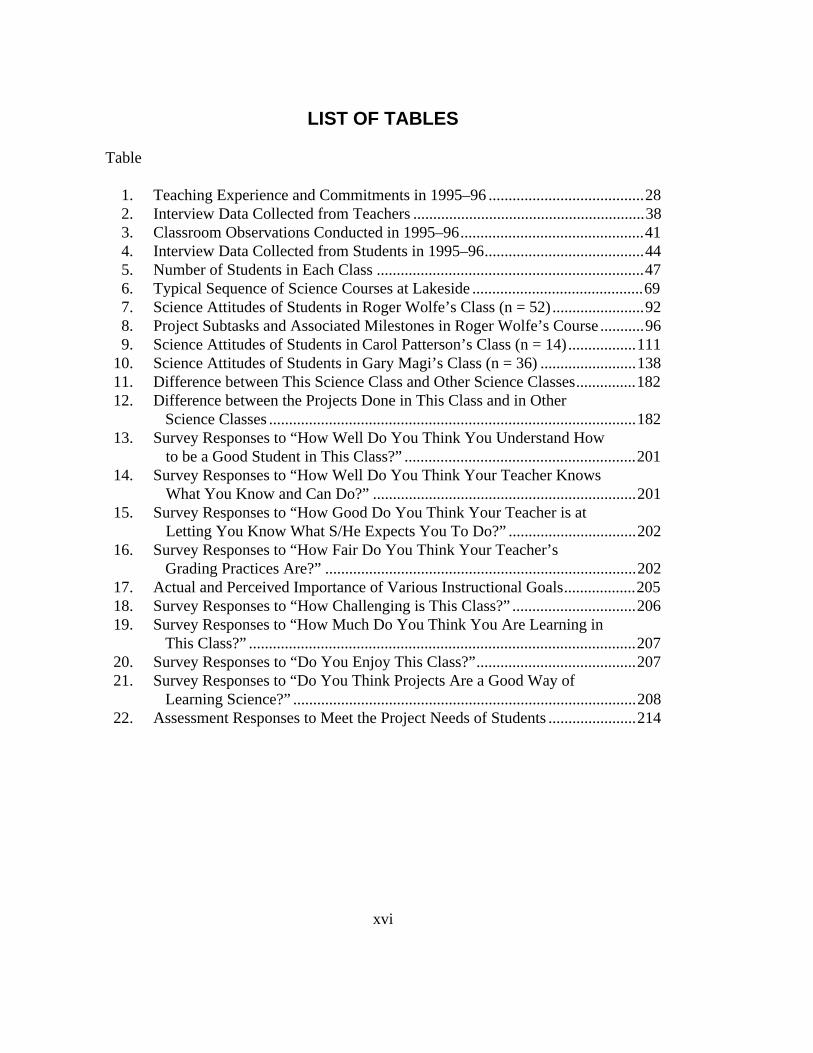
LIST OF TABLES
Table
1. Teaching Experience and Commitments in 1995–96 .......................................282. Interview Data Collected from Teachers ..........................................................383. Classroom Observations Conducted in 1995–96..............................................414. Interview Data Collected from Students in 1995–96........................................445. Number of Students in Each Class ...................................................................476. Typical Sequence of Science Courses at Lakeside ...........................................697. Science Attitudes of Students in Roger Wolfe’s Class (n = 52).......................928. Project Subtasks and Associated Milestones in Roger Wolfe’s Course...........969. Science Attitudes of Students in Carol Patterson’s Class (n = 14).................111
10. Science Attitudes of Students in Gary Magi’s Class (n = 36) ........................13811. Difference between This Science Class and Other Science Classes...............18212. Difference between the Projects Done in This Class and in Other
Science Classes ............................................................................................18213. Survey Responses to “How Well Do You Think You Understand How
to be a Good Student in This Class?” ..........................................................20114. Survey Responses to “How Well Do You Think Your Teacher Knows
What You Know and Can Do?” ..................................................................20115. Survey Responses to “How Good Do You Think Your Teacher is at
Letting You Know What S/He Expects You To Do?” ................................20216. Survey Responses to “How Fair Do You Think Your Teacher’s
Grading Practices Are?” ..............................................................................20217. Actual and Perceived Importance of Various Instructional Goals..................20518. Survey Responses to “How Challenging is This Class?” ...............................20619. Survey Responses to “How Much Do You Think You Are Learning in
This Class?” .................................................................................................20720. Survey Responses to “Do You Enjoy This Class?”........................................20721. Survey Responses to “Do You Think Projects Are a Good Way of
Learning Science?” ......................................................................................20822. Assessment Responses to Meet the Project Needs of Students ......................214
xvii
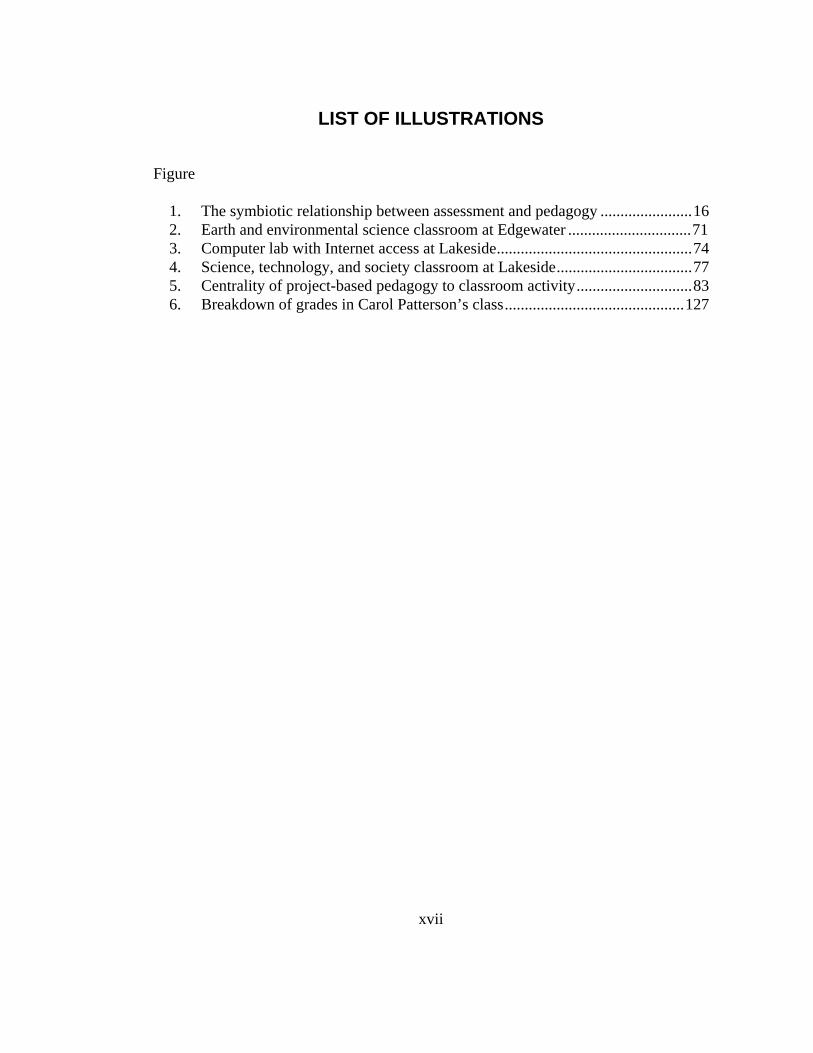
LIST OF ILLUSTRATIONS
Figure
1. The symbiotic relationship between assessment and pedagogy .......................162. Earth and environmental science classroom at Edgewater ...............................713. Computer lab with Internet access at Lakeside.................................................744. Science, technology, and society classroom at Lakeside..................................775. Centrality of project-based pedagogy to classroom activity.............................836. Breakdown of grades in Carol Patterson’s class.............................................127

1
1. INTRODUCTION
In the last decade, traditional forms of science education have come under
increasing criticism. Researchers and practitioners alike note that a reliance on
textbooks, lectures, and highly structured labs as vehicles for teaching science can lead
to the development of “inert” forms of knowledge (Whitehead, 1929) which students
are unable to apply in appropriate contexts (Collins, Brown, & Newman, 1989;
Hawkins & Pea, 1987; Lave, 1990), as well as to a misunderstanding of the socially
constructed, complex, and dynamic nature of scientific knowledge and practice
(Bazerman, 1988; Carey, Evans, Honda, Jay, & Unger, 1989; Latour & Woolgar,
1979; Lederman, 1992; Linn, Songer, & Lewis, 1991; Myers, 1990). As the American
Association for the Advancement of Science [AAAS] warns, “Students cannot learn to
think critically, analyze information, communicate scientific ideas, make logical
arguments, work as part of a team, and acquire other desirable skills unless they are
permitted and encouraged to do those things over and over in many contexts” (1990, p.
199). These concerns have led to the development of new standards and guidelines for
science education (e.g., AAAS’s Benchmarks for Science Literacy, 1993, and Science
for all Americans, 1990; and the National Research Council’s National Science
Education Standards, 1996) which emphasize the need for inquiry-based learning
2
environments where students can build their scientific understandings as they work
with others to make meaningful investigations and explanations of natural phenomena.
Classroom instruction designed along these lines often places teachers in the role of
facilitators who help students build from their current knowledge and proficiencies
toward the development of key disciplinary ideas and practices in science.
For many teachers, a shift to instruction of this kind constitutes a radical
departure from the customary teaching and learning activity of their classrooms. They
face enormous challenges as they not only reconstitute their own practices and
expectations, but also those of their students. As some reform-minded teachers have
discovered, classroom assessment can serve as one of their most vital tools for meeting
these challenges. Teachers’ assessment practices not only allow them to evaluate what
students know and can do, but also serve as a crucial tool for structuring classroom
activity and communicating expectations to students. By specifying both the shape
and the “worth” of specific intermediate and final products, as well as the behavior or
effort they expect to lead to those products, teachers indicate the kinds of work and
activity which are valued in class. In essence, assessment forms an infrastructure that
both students and teachers rely upon as a mediational tool (Wertsch, 1991) for
classroom activity and communications. Teachers construct such infrastructures with
the artifacts and behaviors they require of their students, the criteria they use to judge
them, the relative value they place on each artifact or behavior, and the rules and
customs they and students follow for exchanging assessment related artifacts and

3
information. Since both classroom activity and teacher expectations change as a result
of a switch to the kinds of pedagogical practices described above, teachers enacting
these reforms need to make concurrent shifts in their classroom assessment
infrastructures which will enable them to guide as well as evaluate new kinds of
student work. If such changes are not made, then both students and teachers may
experience difficulties negotiating the new classroom culture due to a lack of fit
between the proposed learning activities and the classroom assessment infrastructure.
The study reported here investigated the classroom assessment infrastructures
created by three experienced, reform-minded high school science teachers to meet the
challenges of the current suggested reforms in science education. All three were
involved in the NSF funded Learning through Collaborative Visualization (CoVis)
Project, a collaboration of more than 100 teachers nationwide with research staff at
Northwestern University to improve earth and environmental science education
through the use of project-based science pedagogy and supporting technologies (Pea,
1992, 1993; Pea, Gomez, & Edelson, 1995). Each of the three either created a new
course or radically reformulated an old one in their efforts to employ both project
pedagogy and supporting technologies into their curricular designs. In the process of
constructing and reformulating their courses, all three found that establishing new
regularities of assessment practice was crucial to creating the activity structures that
enabled their classrooms to function as productive social systems.
4
Project-Based Pedagogy
The use of project-based pedagogy to improve science education, or indeed
education in general, is not new. Projects have been advocated as a means of engaging
students in active learning in the United States since at least the turn of the century
(Alberty, 1927). Perhaps the most well-known and oft referred-to work on projects in
education was done by John Dewey (Archambault, 1964) and his colleagues during
the progressive period (Cremin, 1961). Since that time projects have been used by
educational practitioners in diverse ways to shape the learning experiences of students
of all ages.
That tradition continues today. In recent years, several science education
reform efforts have been designed with projects as a central feature. In addition to
CoVis, Problem-Based Learning (PBL), a curriculum development and instructional
model out of the Illinois Mathematics and Science Academy (Finkle & Torp, 1994),
Project-Based Science (PBS), run by researchers at the University of Michigan
(Blumenfeld et al., 1991; Krajcik, 1993; Marx, Blumenfeld, Krajcik, & Soloway,
1997), and LabNet, a consortium of project-based science teachers working with
TERC (Ruopp, Gal, Drayton, & Pfister, 1993), are representative of such efforts.
There are many commonalties between these and other project-based science reform
endeavors. Most build upon the work of Dewey, the tenets of constructivist education,
and cognitive and sociocultural research which stresses the strength and worth of
learning by doing in situated social contexts (Bruner, 1990; Dewey, 1897; Papert,

5
1980; Pea, 1987, 1992; Schank & Jona, 1991; Wertsch, 1985). However, each has its
own distinctive spin on project-based pedagogy, and CoVis is no exception.
The CoVis Project builds its theoretical model of project-based science
pedagogy around the concept of communities of practice (Lave & Wenger, 1991). In
essence, communities of practice are groups of people who share similar goals and
interests. In pursuit of these goals and interests, they employ common practices, work
with the same tools, and express themselves in a common language. Through such
common activity they come to hold similar beliefs and value systems. Researchers,
such as Lave and Wenger, note that engagement in the central activities of the work,
recreational, and every-day communities which compose our lives, along with
interaction with more able participants of those communities, are a major source of
learning and growth throughout our adult lives. Such modes of learning differ from
those of traditional science classrooms, where textbooks, lectures, and tightly specified
labs are used to impart science understanding to students. In these settings science
knowledge is acquired in a decontextualized fashion, divorced from the community
and its practices to which that knowledge applies and from which it emerges.
Research suggests that it is this decontextualization which can lead students to develop
inert forms of knowledge that they are then unable to apply appropriately (Brown,
Collins, & Duguid, 1989; Hawkins & Pea, 1987; Lave, 1990; Lave & Wenger, 1991;
Whitehead, 1929).

6
CoVis aims to break the cycle of decontextualized learning of inert knowledge
by employing pedagogical and technological reforms to craft science classrooms that
bring students to the periphery of the community of practice of scientists. A shift to
project-based science pedagogy is key component of these changes. Designing and
carrying out science projects engages students in the central activities of the
community of practice of scientists: asking questions about the world in which they
live; designing investigations; working with others to seek answers; collecting,
analyzing, and reasoning from data and observations; making arguments based on
evidence; evaluating the arguments of others; applying the work of others to
theoretical and practical problems; and crafting conclusions about the insights they
have gained. To support these efforts, the CoVis classrooms combine computing and
telecommunications technology to bring scientific data and analysis tools to students.
Such tools open up a wider avenue of potential project topics to the students. They
also enable students and teachers to work with one another across remote sites, and to
communicate with scientists and science experts around the world. Finally, since
many scientists use computing and telecommunications technology to accomplish
their work and communicate with colleagues, student use of such tools is an
appropriate reflection of scientists’ endeavors. The members of the CoVis community
hoped that, in combination, these technological and pedagogical changes would enable
students to come into contact with the values, goals, language, tools, practices, and
people of science (Lento, 1995). In turn, the researchers and practitioners participating

7
in CoVis believed that students with such experiences would be more likely to fit
AAAS’s profile of science-literate persons.
Assessment and Reform
Creating classroom realities to meet the goals and the technological and
pedagogical visions just described is a complex task. Science projects are long-term
in-depth investigations, sometimes designed by the students themselves to follow their
own interests, and usually done in groups. Incorporating activity of this type into the
classroom may constitute a major shift in expectations and practice for both teachers
and students. Without a clear conception of what constitutes quality project work,
students have difficulty planning their investigations and organizing their time and
resources effectively. To meet this student need, teachers need a clear vision of how
they will evaluate projects. Lack of such a vision may impede teachers’ abilities to
clearly articulate to students their expectations for quality work. It may also hamper
their efforts at creating a framework for structuring, tracking, and guiding student
efforts. For example, when each teacher in this study was asked in the winter of 1994
“What makes a good project?” several mentioned their initial difficulties
communicating what it meant to do a science project to their students. They believed
their difficulty in articulating the nature of a project stemmed in part from initial
uncertainty about grading the projects they would receive. As one teacher put it, “I’ll
know a good project when I see one, but until I see it, it’s hard to describe.” Because

8
they had difficulties communicating their expectations for quality project work, these
teachers were disappointed, but not surprised, to find that their students’ initial efforts
did not always meet their (unarticulated) expectations.
The observation that assessment and reform are tightly coupled is not new
(e.g., Kulm & Malcom, 1991); however, most of the scholarship exploring this link
has concentrated on the role of large scale assessment. Citing the powerful guiding
role assessment plays within the educational system, reformers argue that curricular
and pedagogical change is only possible with concurrent changes in educational
assessment (Frederiksen & Collins, 1989; Wiggins, 1993). Their arguments are based
on the historical effects of large-scale, high-stakes standardized tests (e.g., SATs and
Iowa Basics) on classroom instruction and student learning in which students,
teachers, and schools adapt their teaching and learning strategies to maximize test
scores (Resnick & Resnick, 1991). Proponents of assessment reform seek to mold the
existing testing system to their purposes by replacing the content of the tests (e.g.,
Frederiksen & Collins, 1989; Guskey, 1994; Lane, Parke, & Moskal, 1992; Messick,
1994; New Standards Project, 1997; Shavelson, Baxter, & Pine, 1992; Wiggins, 1993).
Teachers will still “teach to the test,” but it will be a new test, one that engenders the
desired educational reforms (e.g., Darling-Hammond, Ancess, & Falk, 1995; J.
O’Neil, 1993; Vickers, 1996).
The body of work on the relationship between classroom assessment and
reform is a smaller one. Historically, the educational assessment literature has

9
contained an overall paucity of research into classroom assessment (Stiggins &
Conklin, 1992). However, work of the past decade or so has included research on
classroom assessment practices in general (e.g., Airasian & Jones, 1993; Brookhart,
1993, 1994; Frary, Cross, & Weber, 1992; Shepard, 1997; Stiggins, Frisbie, &
Griswold, 1989) and the role or influence of school or district grading policies on them
(e.g., Austin & McCann, 1992); the development of alternative classroom assessment
techniques to better support teaching and learning (e.g., Darling-Hammond et al.,
1995; Herman, Aschbacher, & Winters, 1992; Marzano, Pickering, & McTighe, 1993;
Shepard, 1997; Wolf, 1989); and investigations into the relationship between
classroom and large-scale assessment reforms (e.g., Freedman, 1993; Sheingold,
Heller, & Paulukonis, 1995). The study described here places unique emphasis on the
use of classroom assessment as a design tool for supporting pedagogical reforms,
rather than as a reform in and of itself, or as a reaction to the larger assessment reform
movement.
Assessment as an Infrastructure
Viewing assessment as “the underlying foundation or basic framework (as of a
system or organization)” (Webster’s 9th Collegiate Dictionary, 1991) of the
educational system allows us to think of classroom assessment as a local piece of a
wider infrastructure that is both supported and constrained by that wider infrastructure
(D’Amico, 1996, 1999). Other researchers have used different terms and metaphors to

10
describe the dynamic and pervasive role assessment plays in educational systems.
Examples include Frederiksen and Collins’ systemic view of educational testing
(1989) or Stiggins and his colleagues’ description of classroom assessment as an
environment or ecology (Stiggins & Bridgeford, 1985; Stiggins & Conklin, 1992).
Thinking of assessment as an infrastructure does not contradict either of these other
useful images and frameworks. However, it is particularly evocative of some of the
traits and purposes of assessment that are salient to teachers intending to reshape the
curricular and pedagogical form of their classrooms, and to researchers trying to
understand the design decisions teachers make. Infrastructures have three
characteristics that are particularly germane to the consideration of assessment. First,
they support and constrain activity in socially acceptable ways. Second,
infrastructures are often only noticed when they are no longer functioning adequately.
Finally, while extending or circumventing infrastructures is usually fairly easy,
restructuring is often difficult, expensive, time-consuming, and sometimes requires
cultural shifts that are not easy to make.
Supporting and Constraining Activity inSocially Acceptable Ways
Infrastructures support and constrain activity, usually in socially acceptable
ways, though sometimes in unintended or unanticipated ones. For example, roads
enable those who own cars to get from place to place, thus supporting forms of both
commerce and recreation that depend on bridging distance. Roads also keep those

11
same car-owning people from driving through the flower garden in Aunt Betsy’s front
yard. Likewise, sewer and waste disposal systems enable people to deal with the
waste products of their own existence without having to visit an outhouse in the dead
of winter or creating a litter problem in the streets. Assessment infrastructures serve a
similar dual purpose.
For example, a school with a weighted grading system is able to give students
extra GPA points for engaging in more difficult course work, thus encouraging
capable students to challenge themselves. This same system also keeps those who
took four years of home-economics courses from becoming valedictorian. SAT scores
enable college admissions officers to review vast numbers of applications more easily.
At the same time the reliance the SAT places on vocabulary as an indicator of a
student’s academic achievement has had the unintended influence on any number of
high school English classes to make the decontextualized memorization of large
numbers of vocabulary words an important curricular goal.
Remaining Unnoticed until Broken
We only tend to notice the infrastructures in our lives when they stop
functioning effectively. Who hasn’t been taken aback at the utter silence that descends
upon a building when the power shuts down—the silence is almost deafening as all
those within try to remember how to function without lights, heating, electrical
appliances, computers, and connectivity to the world. So, we too usually take our
12
assessment infrastructure for granted. Tests have always existed. Grades have always
existed. They have always been in the shape and form to which we are accustomed
and serve the purposes with which we are familiar. Actually, both grading and large-
scale testing as we know them are relatively new phenomena, largely brought about by
the rise of common education (Glaser & Silver, 1994; Guskey, 1996; Kirschenbaum,
Rodney, & Simon, 1971; Lemann, 1995a, 1995b). Each has come under criticism at
various points in history when circumstances indicate the infrastructure we have in
place is no longer adequate to the needs of the educational system.
For example, when the number of students going to school began to increase
dramatically during the late 1800s and early 1900s, most high schools reconsidered
their evaluation systems and began to use percentage systems rather than written or
verbal descriptions of student performance (Kirschenbaum et al., 1971). When it was
discovered that teachers’ grading practices were highly unreliable (Starch & Elliott,
1912, 1913a, 1913b), most schools shifted to pass/fail, 3-point (excellent, average, and
poor), or 5-point (A, B, C, D, and F) grading systems (Guskey, 1996; Kirschenbaum et
al.) under the presumption that a coarser scale would be a more reliable one. Large-
scale testing for the purposes of educational selection and decision making gained
prominence after World War II (Glaser & Silver, 1994; Lemann, 1995a, 1995b), at
least partly in response to the desire of colleges for more reliable entrance criteria than
school grades. These tests, in turn, have become the source of review and reform as
their debilitating effects, such as testing bias which favors particular social or ethnic

13
groups, or their tendency to narrowly focus classroom instructional practices, have
become more obvious (Glaser & Silver; D. Resnick, 1982).
Extension and Circumvention Is Easierthan Reconstruction
Infrastructures are usually easier to extend or circumvent than they are to
completely restructure. For example, “short cuts” across the grass between one
sidewalk and another on a college campus often become regular routes that are
eventually paved. In the early 1900s, rural farmers wanted telephone service, but often
were unable to acquire it. Rogue farmers then stole phone service by using the barbed
wire fences along their fields as lines (Fischer, 1987). In the 1980s and ’90s,
numerous people stole cable service for similar reasons in analogous ways. On the
other hand, the attempt to completely restructure the entire measurement infrastructure
of the United States from the English system to metric never really succeeded, in part
because of the expense and in part because of cultural resistance. Our assessment
infrastructures can similarly be extended and circumvented, yet are resistant to
dramatic restructuring.
For example, in schools where semester grades are automatically calculated by
a regular arithmetic procedure by the central office (e.g., first quarter grade is worth
40%, second quarter grade is worth 40%, and the final exam is worth 20%), it is
difficult to reward a student for improved performance in the second academic quarter.
However, in one of the schools in this study, the teachers circumvent this restriction

14
by filing a form to retroactively change a student’s first quarter grade so that
calculated semester grade will be as desired. On the other hand, substantially
changing grading and reporting infrastructures like this one is difficult. Despite
continuing concerns about the validity, reliability, and consequences of the 5-point
grading scale, it remains the dominant one in colleges and high schools today
(Guskey, 1996; Kirschenbaum et al., 1971). Some individual schools and colleges
have experimented with alternate forms (Aiken, 1942; Darling-Hammond & Ancess,
1994) but they continue to be rare.
Classroom Components of the Assessment Infrastructure
Assessment infrastructures have many interconnected parts. Teachers have
significant control over the local (classroom) aspects of this infrastructure, but usually
no control over its widest aspects (e.g., national standardized tests), and only limited
control of the intermediate aspects (e.g., departmental exams in one’s school). The
local classroom aspects over which the teacher has control have four basic pieces: the
artifacts and behaviors they require of their students, the criteria they use to judge
them, the relative value they place on each artifact or behavior, and the rules and
customs they and students follow for exchanging assessment related artifacts and
information. In order to understand how an individual teacher uses assessment to
appropriate a pedagogy such as project-based science, the wider infrastructure must be
treated as a set of constraints and supports to the teacher’s local designs.
15
Figure 1 represents how pedagogy and assessment within a classroom are
mutually supportive activities. Like other systems, classrooms tend toward an
equilibrium. Thus, changes to one component (e.g., pedagogy) must be matched by
supporting changes in the other components (e.g., assessment) in order to create a new
equilibrium, or else the system itself will wash away those changes as it gravitates
towards its original equilibrium (Frederiksen & Collins, 1989). Project pedagogy adds
a potentially reforming influence into the classroom system. In order to create a new
equilibrium, the classroom assessment infrastructure needs to be changed so that it is
supportive of the new activity. The wider assessment infrastructure of the school or
community (e.g., grading and tracking systems or state mandated tests) provides a set
of constraints that limits teachers’ ability to radically reconstruct the way they do
assessment. For example, if the school requires a final exam, then they have to give
one. The assessment constraints, in turn, limit their pedagogical shifts. For example,
if all classroom learning is structured around students doing individual projects on
topics of their own choosing, from what common knowledge does a teacher create
exam questions?

16
Classroom Activity
Pedagogy
AssessmentProject based
pedagogy
Wider assessment infrastructure
Figure 1. The symbiotic relationship between assessment and pedagogy.
Assessment Infrastructures as a Mediational Tool
Assessment serves many purposes within the educational system as a whole
and classrooms in particular. Collins (1994) and Stiggins and Conklin (1992) both
provide accounts of these purposes. Collins focuses upon the purposes of educational
testing and notes that accountability, placement and diagnosis are the three most
widely recognized purposes. He then points out two others: “providing motivation for
students to study, and providing direction as to what is important to learn (Collins,
1994, p. 5). While Collins’ comments do not exclude classroom sting (e.g. teacher
made tests) as part of educational testing, they seem to emanate from a consideration
of large-scale testing. Moreover, they appear to be based upon testing alone and not
on other forms of assessment.

17
Stiggins and Conklin (1992), on the other hand, focus on the purpose of
classroom assessment methods employed by teachers. They consider the purposes of a
wide range of assessment methods used by teachers, including: teacher-made,
objective paper and pencil tests; tests that are embedded in or are provided as a part of
published textbook materials; oral questioning; standardized tests; and, structured and
spontaneous performance assessments.1 They outline nine different purposes for
which the teachers they studied used these various assessments within the classroom:
diagnosing the needs of individual students; diagnosing group needs of the class;
assigning grades; identifying students for special services; evaluating instruction;
controlling (motivating) student behavior; communicating achievement expectations,
and using assessment as a teaching strategy.
Both of these lists can be reduced to two overarching and interlocking
functions of assessment infrastructures which define their role as a mediational tool:
they guide effort and evaluate performance. Assessment infrastructures, including
those of the educational system as a whole as well as those local to the classroom,
guide effort in three ways. First they set for the teaching and learning tasks to be
accomplished by defining what will be evaluated. Teachers prioritize their
1 Stiggins and Conklin define performance assessments as “those assessments
in which you the teacher, observe students in e process of doing things (e.g., speakingor oral reading) or examine products created by students (e.g., writing sample or artproject). Thus most homework or classwork assessments, both daily and extended,large and small, would fall into this category.

18
instructional activities in part by the tests to which they and their students are
accountable. Likewise, students prioritize the work and studying efforts in part
through their understanding of what work and knowledge will be evaluated in order to
form their grades. Who has not heard a teacher say something to the effect of, “You
will be graded on your participation in class discussions, so speak up!” or a student
ask, “Will this be on the test?” Both of these comments reveal the role classroom
assessment infrastructures play in defining the activities expected and the learning
tasks to be accomplished in the course.
Second, assessment infrastructures guide students’ and teachers’ understanding
of what constitutes either adequate or exemplary work and learning through the
establishment of standards for evaluating performance and understanding. These
standards are embedded in the criteria used to judge the artifacts and performances
being evaluated through the assessment infrastructure. Thus, if students know their
research projects will be evaluated, in part, based upon their ability to make arguments
which are substantiated by data, then they will endeavor to have data to support their
arguments.
Finally, they guide teaching and learning activity by assigning value to each
evaluated artifact or performance. The higher the stakes attached to that which is
evaluated, the more important teaching and learning activities which will improve
performance become. Thus, teachers of an AP course are likely to spend more time on
topics for which the AP exam has many questions than those for which the AP exam
19
has few questions. Likewise, students are likely to spend less time working on a
homework assignment worth ten points than studying for a test worth one-hundred
points.
Assessment infrastructures provide support for making evaluations and
judgments about students’ comprehension and performance by providing evidence of
both which can be reviewed. Decisions for action can then be made based upon these
evaluations. Such decisions range from placement of students in particular courses to
specific feedback given to a student on how to improve a paper to changes to be made
to instructional activities which are not adequately serving students’ learning needs.
Thus, assessment infrastructures not only guide activity by setting goals for students
and teachers to attain, but also by providing the information necessary to make
educational decisions. Teachers creating new learning environments need to consider
the guidance and evaluation needs required by the curricula and pedagogy they are
employing and fashion assessment infrastructures that will provide them.
Conclusion
The central question being explored through this study is: How do teachers
design classroom assessment infrastructures to integrate project-based pedagogy and
supporting technologies into classroom activity? From this central question follow
several supporting questions. First, what do the teachers’ assessment infrastructures
look like? What are the rationales behind their infrastructure designs (i.e., how do
20
they reflect teachers’ philosophies, goals, and plans)? How do the assessment
infrastructures communicate expectations to students and structure classroom activity?
How effective are these infrastructures in the eyes of both the teachers and their
students?
Data in the form of interviews, observations, surveys, student work, and
teacher records were collected from three CoVis teachers and their students over a two
and a half year period (January of the 1993–94 school year until June of the 1995–96
school year). These three teachers had been with the CoVis project since its inception
in 1992. They were all competent, reflective, articulate teachers who at the time of the
study had stable project-based curricula and associated classroom assessment
infrastructures in place. From these data an interpretive case study was produced for
each of the assessment infrastructures created by the three teachers, accompanied by a
set of cross-case analyses based upon common themes that emerge from all three
cases.
The analysis of these data show that while technology was a strong component
in the instructional design of all three teachers, the nature of project-based pedagogy
was clearly the more dominant concern for them as they structured classroom
assessment infrastructures to support their new visions of teaching and learning. Their
efforts indicated that there are four aspects to the nature of project activity which differ
significantly from that of traditional lecture and lab based science courses. Student
work on science projects tends to be (a) long-term and open-ended, (b) cooperative

21
and/or collaborative, (c) resource intensive, and (d) iterative. Each of these aspects of
the nature of project work resulted in a cluster of support and evaluation challenges
which the teachers studied here attempted to meet in part through their assessment
infrastructure designs.
The infrastructures created by all three teachers for supporting project work
were based upon variations of four basic design components: final products or
performances, intermediate products, records of student daily work and activity, and
face-to-face meetings or conferences with students. Every project cycle in all three
classes built to the creation of a culminating presentation or artifact. These included
formats ranging from debates to videos to web pages to research reports. Intermediate
products were also seen in all four classes. These came in the form of drafts or pieces
of final products, and ancillary products such as proposals and progress reports.
During most of the project cycles, records of student daily activity and efforts were
kept by either the students, the teacher, or both. And finally, a system for face-to-face
consultation with students evolved in all three courses. Despite these commonalties,
the particular shape each of these components took in the three classrooms and the
ways in which they were combined to create each assessment infrastructure differed,
in some cases dramatically. Dimensions of variation included the amount of
systematicity used to collect data through any of these sources as well as the regularity
of their use in providing feedback to students and the centrality of their importance in
constructing students’ grades.

22
The analysis also shows that the integration of technology into the classroom
activity influenced the teachers’ assessment infrastructures in three ways. First, in
many cases the students were either required or encouraged to use the technologies
available to them in order to complete their projects. In these situations, access to
technology became a particularly salient feature of the resource intensive nature of
project work, and the effective use of technology had the capacity to seriously
influence students’ project grades. Second, in order to make certain the students had
the technological knowledge and skills necessary to complete their projects, teachers
either formally or informally assessed the students’ technological competence.
Finally, in some cases technology was used as a medium for supporting assessment
activities and communications.
Because all three of the courses in this study were elective ones not considered
part of the sequence of science courses students take to prepare them for college, and
because state-mandated testing did not intersect with their curriculum in any major
way, pressure from the wider assessment infrastructure was largely felt through the
grading system and graduate requirements of the school. All three teachers felt that
the reputation and cachet of their course, and therefore the students it attracted, was in
part determined by its standing within the school as an elective rather than a core
subject. Moreover, much of their assessment infrastructure design was explicitly
influenced and shaped by the need to provide students with grades that fit the A-B-C-
D-F model for reporting that their schools employed.

23
In the following chapters, each of these issues is explored in more depth. In
Chapter 2, “Methods,” the data sampling, collection, and analysis techniques are
described. In Chapter 3, “The Schools,” the context in which each teacher was
working, including school and student demographics, school security and student
mobility, grading, counseling and tracking systems, and finally, classroom and
technological facilities are described. Chapter 4, “Courses and their Assessment
Infrastructures,” provides a case study of each teacher’s course which outlines his or
her pedagogical and assessment philosophies and designs. Chapter 5, “Cross-Case
Analyses,” discusses in more detail the relationship between project-based pedagogy,
technology, wider assessment infrastructure, and the teachers’ classroom assessment
infrastructure designs. This chapter includes a discussion of the effectiveness of those
designs in the eyes of both the teachers and their students.
The insights from this study contribute to research and practice associated with
the relationship between assessment and educational reform in several ways. First, the
study provides a unique perspective for researchers and developers of educational
reforms to consider: that of assessment as a design tool used by teachers for crafting
and supporting instructional reforms in their classrooms. Second, it provides a
theoretical framework for considering the role assessment plays in educational reform
activities. Third, it provides a set of taxonomies which outline the challenges of
project-based science activity as well as those of incorporating technology into that
activity, and typical assessment strategies to meet these challenges. Finally, it

24
provides science educators with a set of concrete design trade-offs for consideration
when crafting their own classroom assessment infrastructures in support of project-
based science pedagogy.

25
2. METHODS
The primary subjects of this study are three veteran CoVis teachers and their
respective classroom assessment infrastructures. Data in the form of interviews,
observations, surveys, student work, and teacher records were collected from the three
teachers and their students over a 2 1/2-year period (January of the 1993–94 school
year through May of the 1995–96 school year). All data collection and analysis was
conducted by a single researcher.2 Data was collected in three stages. As is the case in
deliberate inquiry (Erickson, 1986), each stage was a more refined and focused data
collection process than the previous one. From these data a detailed, interpretive case
study was produced for each of the assessment infrastructures created by the three
teachers, accompanied by a set of cross-case analyses based upon common themes that
emerged from all three cases. The cases form the basis of the findings reported in
Chapter 3, “The Schools,” and Chapter 4, “Courses and their Assessment
Infrastructures,” while the cross-case analyses form the basis of the findings are
reported in Chapter 5, “Cross-Case Analyses.” The rest of this chapter details the data
sampling, collection, and analyses used to compile these findings.
2 The survey questions obtained through the regular CoVis fall and spring
surveys are an exception. Analysis on those items was done by the author, but thesurvey design and data collection was a group effort by the CoVis project team.

26
Sampling
Teachers
The three teachers3 chosen for this study had been with the CoVis project since
its inception in 1992 and went through a period of intensive course design between the
1992–93 and 1994–95 school years. Gary Magi4 and Carol Patterson began building
brand new courses in 1992–93: science, technology, and society (STS) and
Environmental science, respectively. Roger Wolfe, on the other hand, started with the
same class he had taught for over 20 years, earth science, dumped his entire
curriculum, and began to redesign both the purpose and structure of the course from
scratch. All three are competent teachers and so by 1995–96, the focal year of this
study, they had each built stable project-based curricula and associated classroom
assessment infrastructures for their courses.
3 The data collection initially involved all six original CoVis teachers. Midway
through the 1994–95 school year, this number was reduced to four in order to makedata collection more feasible. The four teachers included two earth science teachers,one environmental science teacher, and one science, technology, and society (STS)teacher. Due to time constraints, the data analyses and conclusions drawn here arebased on only three of these final four teachers. The most traditional of the four, oneof the earth science teachers, was removed from the final analyses. However, sincedata from her class were included throughout the data collection and initial analysisstages, her work and that of her students were an integral part of the thought that wentinto the design of the analysis structures eventually used with the three remainingteachers.
4 Pseudonyms are used for the names of all teachers, students, and schools
involved in this study.

27
Their evolutionary experiences in designing and redesigning these science
courses made them ideal cases to study. The immense and immediate challenges they
faced during their restructuring efforts brought issues of assessment strongly to the
foreground. Further, they are all inherently reflective and articulate people, making
them exemplary informants on the change processes they were experiencing. Finally,
despite their common experiences with both CoVis and the challenges of creating new
courses, they range widely in their teaching experience, styles of project-based science
implementation, grading practices, and instructional objectives. This diversity allowed
for an exploration of the forms assessment infrastructures take when mature science
teachers enact project-based pedagogy under a range of conditions and for a variety of
purposes.
The three teachers had a range of experience in the field of teaching (see Table
1). In 1995–96 Roger had been teaching at Edgewater since he left college 23 years
earlier. While he had occasionally taught chemistry, earth science was his passion and
eventually led him to obtain a master’s degree in geology. At the other extreme, by
1995–96 Carol had been teaching for just five years, during four of which she had
been involved as a member of the CoVis Project. An environmental engineer and
chemist by training, she spent five years in industry before beginning a new career in
teaching. Gary, who has an undergraduate degree in physics as well as a master’s in
mechanical engineering, also worked in industry for eight years as a mechanical
engineer specializing in energy conservation and passive solar design before becoming

28
a teacher. An experienced teacher of fourteen years in 1995–96, he had taught in
several places including Lakeside for the previous nine years, a German gymnasium
for two years, and in the Chicago Public Schools for three years. Throughout his
teaching career, he taught primarily physics, though in Germany he taught math as
well, and while with the Chicago Public Schools he taught chemistry on occasion. All
three of these teachers used their significant experience with research in science as
well as applications of science to inform their instructional designs.
Table 1. Teaching Experience and Commitments in 1995–96.
Teacher YearsTeaching
CoVis Classes Periodsper Week
Other Classes TotalClasses
GaryMagi
14 Science,Technologyand Society(STS)(2 sections)
2 periods/dayfor each of 2sections = 20
ConceptualPhysics (1section)
3
CarolPatterson
5 EnvironmentalScience(1 section)
7 periods perweek
Chemistry(3 sections)
4
RogerWolfe
23 Earth Science(3 sections)
7 periods perweek for eachsection = 21
CoVistechnicalcoordinator
3
The three teachers had relatively similar teaching loads during 1995–96 (see
Table 1). Roger taught science for 20 periods per week while Carol taught for 28
periods per week and Gary for 26 periods per week. Roger’s teaching load was
slightly smaller than the other two because he received a course concession in order to
29
serve as technology coordinator for all the CoVis classes at Edgewater. The bulk of
Roger’s and Gary’s teaching time was in courses associated with the CoVis project:
three sections of earth science for Roger and two sections of STS for Gary. Carol’s
teaching load on the other hand was predominantly in chemistry (three sections, or 21
periods a week). For Gary, 1995–96 was the first year that STS, rather than physics,
was his primary teaching obligation.
Class Sections
One class section of the CoVis course each teacher taught was chosen for
regular observation. Carol Patterson had only one section of Environmental Science,
so that was the one observed. Sections taught by Gary Magi, Roger Wolfe, and
Melanie Ribbon (the teacher dropped from the final analyses) were chosen simply on
the basis of logistics. The sections taught by Melanie, Carol, and Roger were chosen
to be back to back so that observation could happen in one fairly continuous stream.
Only one section of Gary Magi’s course did not conflict with this block and allowed
for travel between the sites.
Students
A total of 203 students were enrolled in the CoVis-related courses taught by
the three study teachers. Roger Wolfe had 85 students in three sections of earth
science during the 1995–96 school year. Carol Patterson had 20 students enrolled in
the single section of environmental science. Finally, Gary Magi had 98 students

30
enrolled in two double-period sections of science, technology, and society (STS).
Both teachers at Edgewater had fairly ethnically homogenous classrooms (78% white,
1% black, 21% other; n = 76) compared to Gary Magi’s somewhat more diverse
student population (51% white, 24.5% black, 24.5% other; n = 45). In general, the
students in all three classes came from families that valued education. The mothers of
the majority of the students had at least a bachelor’s degree (60% of Roger’s students,
80% of Carol’s students, 64% of Gary’s students), and many had graduate degrees
(21% of Roger’s students, 33% of Carol’s students, 45% of Gary’s students). A
similar pattern existed for the fathers. Very few of the parents (two mothers of
Roger’s students and three fathers of Gary’s students) had not completed high school.
With the advice and cooperation of the teachers, a small subset of these
students were chosen for close observation and study, using “stratified purposeful
sampling” (Patton, 1990). Teachers were asked to identify three students from the
section of the course being observed a strong student who was doing particularly well
in the class, a student whose work was representative of the “average” student in the
class, and a student who was struggling. On the advice of one teacher, students who
habitually missed class were not considered when selecting a representative struggling
student as they would be difficult to observe. Also, teachers were asked to choose
students in each of these categories who were fairly articulate. These nine “focus
students” were each asked individually if they were willing to be studied more closely
and informed that this closer study would include one-on-one interviews, copying
31
some of their class work, and closer observation during class. All of the original
twelve asked agreed, although one was eventually dropped from the study after being
suspended and permanently removed from Gary’s class. In each class, one to three
extra students were selected with assistance from the teacher and interviewed at least
once, and in one case twice, in order to create a broader set of perspectives than those
held by the original focus students. In all cases, these extra students had strong
feelings about the course, either negative or positive, that differed from those of the
other students being interviewed.
Data Collected
The data collection routines for this study resembled those described by
Erickson (1986) as “deliberate inquiry in a setting” (p. 140). In deliberate inquiry, the
researcher treats data collection as an act of “progressive problem solving, in which
issues of sampling, hypothesis generation, and hypothesis testing go hand in hand,”
and research choices are “guided by deliberate decisions about sampling” as well as
“intuitive reactions” to the setting (Erickson, 1986, p. 140). In this process, the study
had essentially three phases: an exploratory phase in 1993–94, a formative stage in
1994–95, and a final, comprehensive stage.
The first exploratory phase was conducted in 1993–94, the first CoVis
implementation year, and was based upon informal observations of classroom activity
as a participant researcher serving as technical assistant, working communications

32
through the ongoing meetings, conversations and correspondence of the CoVis project,
and two sets of exploratory interviews. The exploration of classroom assessment
practices was initially instigated by the needs of another study within the CoVis
research agenda in which cases of student project work were to serve as the units of
analysis. In an effort to define the artifacts and behaviors that might be needed to
constitute each case, interviews were conducted with each of the original six teachers
in which they were asked to define the characteristics of a good project and the kinds
of evidence they reviewed to evaluate students’ project work.
However, in the winter of 1994 the teachers’ assessment practices with respect
to science projects were still largely fluid and formative (D’Amico, Gomez, & McGee,
1994). Their comments and concerns led to the initial hypothesis that assessment
served as an infrastructure within their course designs, one that now needed overhaul
as they attempted to incorporate projects into those designs. It was decided that a
further exploration of assessment issues might be more fruitful than the study
originally designed. Accordingly, a second interview was schedule with each of the
six teachers to discuss the idea of assessment as an infrastructure for their course.
Interview questions explored each teacher’s beliefs about assessment and project-
based pedagogy more broadly, touching upon both the formal and informal assessment
practices they were currently using and how those differed from their previous
assessment practices.
33
During the second, formative phase in 1994–95, issues uncovered during the
exploratory phase were refined and expanded through regular, semi-structured teacher
interviews, the collection and review of teacher grading records, and teacher self-
reports of the use of class-time. At this time the number of teachers involved in the
study was reduced to four. From this early work, the basic pedagogical philosophies
and assessment infrastructure designs for each teacher were drawn. During the 1995–
96 school year, the final phase of the study, the data collection was expanded so that
assertions based on the evidence heretofore gathered largely through teacher self-
report could be triangulated against evidence gained from other sources (Erickson,
1986; Patton, 1990). The expanded data set included formal observations of
classroom activity, interviews with students, the collection of student work, student
and teacher surveys, and the collection of classroom artifacts, such as assignment
sheets and evaluation forms. These additional data allowed for greater sophistication
in the links drawn between each teacher’s instructional goals and assessment
infrastructures and the evaluation of the effectiveness of those infrastructures through
the eyes of both the teachers and their students. While data were collected from four
teachers and their students, the final analyses of those data were based on data
collected from only three.
The kinds of data collected across the full 2 1/2 years of the study are described
in detail below. This description is divided into six sections: teacher interviews and
gradebook records, curriculum summaries, classroom observations and artifacts,

34
student interviews and project work, student and teacher surveys, and records on
school and community demographics.
Teacher Interviews and Gradebook Records
A total of 33 interviews, 11 per teacher, were conducted with the three teachers
described here over the 2 1/2-year period (see Appendix A for the interview guides).
Ten of these interviews used an “interview guide approach” (Patton, 1990) in which
general questions were laid out in an interview guide, but the exact order and wording
of those questions were decided upon during the course of the interview and
interesting emergent themes were followed at the interviewer’s discretion. These ten
interviews fell into two categories. As mentioned above, the first two interviews in the
winter and spring of the 1993–94 school year were exploratory in nature and quite
unstructured. The other eight interviews were more structured and occurred after
every marking period during the 1994–95 and 1995–96 school year. They focused on
creating a detailed depiction of the grading practices used during that academic
quarter, as well as a review of classroom activity and goals for the same period.
Gradebook records were collected and reviewed at the time of the interview. A few
special questions which differed from interview to interview were also asked.
Examples included explicit discussions of the role technology played in each teacher’s
classroom assessment infrastructures, a review of the project work of particular
students who were being studied closely, and questions about the influence of the

35
wider assessment infrastructure (e.g., state and national tests, the schools grading and
reporting system, and departmental test requirements) on each teacher’s pedagogical
and assessment design decisions.
The eleventh interview was a “standardized open-ended interview” (Patton,
1990) conducted in the early fall of 1995–96 on the instructional goals of each teacher.
The emergent property of the themes and goals garnered from the previous interviews
did not allow for easy comparison of the views held by each teacher on a given issue.
Despite some commonalties based on their mutual CoVis experience, there were many
differences in both the language and structures each teacher used to think about and
describe their course. From previous interviews a list was generated of the types of
instructional goals the teachers typically mentioned. These categories were tested
through a structured interview in which the teachers were asked to rate on a scale of
one to ten how important goals in each category were to them and how effective
projects were at helping them meet goals of that type. They were also asked to explain
their reasoning behind each rating and to provide examples of their personal goals
which fit into each category. Teacher suggestions around clarifying these instructional
goal types through the process of the interview led to refining and expanding the list to
include fifteen types of instructional goals. The teachers felt, to varying degrees, that
students should learn to:
1. Understand specific scientific concepts;
2. Perform specific scientific skills;

36
3. Perform specific technological skills;
4. Understand what social scientists do;
5. Understand what natural scientists do;
6. Do what social scientists do;
7. Do what natural scientists do;
8. Understand how previous scientific findings are applied to, inform, and
contrast with new scientific findings;
9. Understand how previous scientific findings can be applied to practical
problems;
10. Understand the social, political, and economic implications of scientific
findings;
11. Apply previous scientific findings to new scientific investigations;
12. Apply previous scientific findings to practical problems;
13. Develop work habits;
14. Improve interpersonal skills; and
15. Increase personal motivation and growth.
The more structured aspect of the instructional goals interviews allowed for an
easier comparison of the differences between each teacher’s goals as opposed to
differences in their language for describing those goals. In addition, the information
collected during these interviews was used to create both teacher and student surveys
37
which were used to compare the teachers’ goals with the students’ perceptions of those
goals.5 (See the section “Student and Teacher Surveys.”)
All interviews generally lasted between 40 and 120 minutes. Most of them
were conducted on school grounds during the teachers’ free periods. A few were
conducted at either Northwestern University or the teacher’s home after school. All
were tape-recorded and written notes were taken. Usually, shortly after the interview,
impressions and thoughts that were not able to be written during the interview were
added to the notes. A subset of these interviews was transcribed: the first interview
conducted with each teacher in the winter of 1993–94, the fourth quarter assessment
interview conducted with each teacher in the spring of 1994–95, and all five
interviews conducted in 1995–96. Notes were typed up for the interviews that were
not transcribed. Portions of the audio recording for two of the interviews were poor;
transcriptions for some sections are therefore either missing or of questionable
accuracy. The handwritten notes were used to supplement the transcripts for these
5 The surveys generated through this process seem to be somewhat
idiosyncratically tied to the language developed by the four teachers involved in thisstudy through their regular conversations with the researcher and with each other. During survey administration, some of students mentioned difficulties distinguishingthe difference between some of the goal types. The teacher version of the survey wasadministered to a wider segment of the CoVis teacher community. Written commentsfrom a few of those surveyed indicated that the structure and language used forcategorizing the goals did not adequately represent the way they thought about theircourses. As a result, they did not feel they could respond sensibly.

38
sections. Transcripts and typewritten notes were all imported into QSR NUD*IST 4.0
for coding and analysis (See Table 2).
Table 2. Interview Data Collected from Teachers.
Interview Gary Magi Roger WolfeCarol
Patterson
Winter 1993–94 Transcript Transcript Transcript
Spring 1993–94 Notes Notes Notes
Q1 1994–95 Notes Notes Notes
Q2 1994–95 Notes Notes Notes
Q3 1994–95 Notes Notes Notes
Q4 1994–95 Transcript Transcript Transcript
Goals Interview Transcript Transcript Transcript
Q1 1995–96 Transcript Transcript Transcript
Q2 1995–96 Transcript Transcript Transcript*
Q3 1995–96 Transcript Transcript Transcript*
Q4 1995–96 Transcript Transcript Transcript
*Parts of audio recording are poor which limits transcription.
Curriculum Summaries
In the 1993–94 and the 1994–95 school years, each CoVis teacher submitted
daily curriculum summaries (McGee, 1996) via electronic mail which outlined the
percentage of class time devoted each day to various classroom activities: teacher-
directed projects, student-directed projects, project presentations, lecture, discussion,

39
video or demonstration, activities, labs, tests, review or preparation for tests, and do or
review homework. These data are used to demonstrate the centrality of project-related
activity in each course. In 1994–95 the teachers also added notes to the bottom of
their curriculum summaries. Sometimes these were extensive. Sometimes they were
short or nonexistent. Depending on their schedules and priorities, the teachers filled
out the summaries either daily, or in batches at the end of the week. In most cases the
summaries were received within a week of the actual classroom activity, but
occasionally there were delays of up to a month. During the 1994–95 school year, the
data provided through the curriculum summaries were reviewed during the assessment
interviews conducted with each teacher at the end of every academic quarter (see the
section “Teacher Interviews and Gradebook Records” above). A bar graph showing
how time was allocated for each day was constructed from the teachers’ curriculum
summaries for each academic quarter. Annotations about when units, topics, and
project cycles began and ended were added during the interview (see Appendix C for
an example of a bar graph). In the 1995–96 school year, the CoVis project expanded
to include over 100 teachers. At this time, e-mail was no longer a viable form of
curriculum summary data collection and so a web-based form was created. However,
only one of the teachers in this study had regular access to the web-based form during
his free periods. As a result, curriculum summary data is complete only for the 1993–
94 and 1994–95 school years.

40
The teachers were given directions about how to interpret each of these
categories. However, their understanding was clarified during a fall 1994 interview
when each was asked how they typically interpreted the categories when filling out the
forms. The original categories were then collapsed, in part due to the teachers’
interview responses, into the following: project related work, activities and labs,
lecture-video-demonstration, discussion, tests and review, homework, and other. The
number of entries received during 1994–95 were quite comprehensive: Roger Wolfe
turned in summaries for 100% of the days for all three sections of earth science he
taught that year; Gary Magi turned in summaries for 83% of the days STS met; and
Carol Patterson turned in summaries for 82% of the days environmental science met.
The data can therefore be seen as fairly representative of the teachers’ recollections of
how their class time was spent. However, since these data are based both on self-
reports and on estimates of time made from either notes or memory sometimes more
than a week old, their reliability is somewhat questionable. Nonetheless, they are
reliable enough to be used as a broad estimate of the relative amounts of time spent on
project activity in each classroom.
Classroom Observations and Artifacts
Formal classroom observations were conducted for a subset of the class
meetings in one section of the relevant CoVis class taught by each of the study

41
teachers during the 1995–96 school year. A total of 96 class sessions6 were observed
during the year, the bulk of which (72) were during the third academic quarter at each
school. The third academic quarter, which in both schools starts at the end of the first
semester and ends right before spring recess, was approximately two months: from
January 29, 1996 to March 29, 1996 at Lakeside, and from January 30, 1996 to March
22, 1996 at Edgewater. In each class, a major project cycle was begun during the third
quarter. A small number of class periods were video taped throughout the course of
this project cycle, capturing moments at its beginning, middle and end. A few pilot
observations were done in the fall and a few follow-up observations were done in the
spring, especially in those cases where the third quarter project was not completed
until sometime after spring break (see Table 3).
Table 3. Classroom Observations Conducted in 1995–96.
Observation DataGaryMagi
RogerWolfe
CarolPatterson
Total
Total number of observations 36 35 31 102
With video 10 9 7 26
Third quarter observations 23 25 24 72
6 These courses sometimes meet for one period and sometimes for two. The
term “session” is used to mean one continuous meeting of the students with the teacherin a given day, regardless of whether that meeting was for one or two periods.

42
The teachers were the primary focus of these observations, with the focus
students and their work serving as a secondary focus. Teacher movement in the
classroom, and styles and patterns of interaction were followed, with particular
attention paid to the types of feedback given to students during the course of project
work. Evidence of their assessment infrastructure that was a visible part of the room
or ingrained into routines and habits of movement, paper work, or interaction were
noted. Handouts and artifacts, including tracking and evaluation forms pertinent to the
classroom activities during the observations, were collected. An in-box was left in the
classroom for each teacher. On days when the class was not observed, the teachers put
copies of pertinent handouts in the box. In this way a significant, though incomplete,
portion of the written assignments, instructions, and explanations the teachers gave
their students was collected.
The classroom observation data were collected during a very compressed time
period by a single observer—approximately four to six hours a day of observation,
three to four times a week, during the entire third quarter. The observation sampling
did not allow sufficient time for notes to be either reflected upon and added to or
written up on a regular basis. A single day for which there was video and fairly
detailed observation notes, and which was considered representative of a typical
“project” day, was chosen for each teacher and transcribed. Analysis of the classroom
observation data is based on these transcripts and the handwritten notes for the other
days observed.
43
Student Interviews and Project Work
Initial plans included provisions to interview three focus students in each class
(one strong, one average, and one struggling student), three times each: once in the
winter (January/February), once after their third quarter project was complete
(March/April) and once again before school was over (May/June). There were some
complications with this plan. First, after postponing his initial interview several times,
the “struggling” student from Gary Magi’s class was suspended and then permanently
removed from the class. Second, the struggling students from Carol Patterson’s and
Roger Wolfe’s classes skipped one interview each. Third, seniors at Edgewater had
the option of spending the last month of school working on an in-depth “senior
project” which excused them from all their other course work for the end of the year.
In effect, they finished their academic courses at the end of April. Many of the
students in Carol Patterson’s class, including two of the focus students, availed
themselves of this opportunity. As a result, the final interviews of these two students
were held in April rather than in May or June. Finally, in all three classes, between
one and three extra students were interviewed once or twice to add breadth to the set of
opinions expressed by the initial focus students. In all cases, these additional students
were chosen with the assistance of the classroom teacher, both because they appeared
to have fairly strong opinions about the course (whether positive, negative, or both),
and because those opinions seemed to be different from the rest of the focus students.
The course work of these extra student interviewees was not collected and they did not

44
receive any particular attention during the observation data collection. Overall, 28
interviews were conducted with 13 students (see Table 4).
Table 4: Interview Data Collected from Students in 1995–96.
Student7
ReasonSelected
WinterAssessmentInterview
Third QuarterProject
Interview
SpringAssessmentInterview
Wolfe’s Students
James strong T T TPapi average T T TMolly struggle T T STweed extra T T
Patterson’s Students
April strong T T T*Jason average T N T*John struggle T T SLorena extra T
Magi’s Students
Thomas strong N T TPeggy Sue average T T TGuido extra TJae extra TJoe extra T
Total interviewsconducted
9 8 11
T = Interview conducted and transcribedN = Audio recording is missing or poor so transcript is supplemented by notesS = Interview skipped by student* Early interview due to senior project
7 Students were given the option of choosing their own pseudonyms. Where
possible, their choices were used. However, in cases where the student’s choice mightmake reading the text difficult (e.g., Lady J), they were changed slightly (e.g., Jae).

45
Two of the interviews, the winter assessment interview and the spring
assessment interview, covered essentially the same topics, although there were some
changes in the spring version based upon insights gained from the winter interviews.
In general, they asked students to explain the purpose of the course, what they thought
their teacher wanted them to learn, what it took to do well in class, how grades were
calculated, and what kind of feedback they got on their work. In the project interview,
conducted after third quarter grades were submitted, each focus student was
interviewed about his or her experience doing their third quarter project. The students
were asked to describe what their projects were about, the kind of work they did while
working on it, how much time they put into the work, and how good the project was
from both their perspective and that of their teachers. Finally, they were asked for
their opinions on how their teachers graded projects in general, and this project in
particular, and what they thought of projects as a way of learning science. All three
interviews were “standardized open-ended” ones in which the wording of each
question was planned in advance and the bulk of the questions were asked in the same
order each time (see Appendix B).
All interviews were audio-taped and transcribed. As a backup, notes were
taken as well. In the case of two of the student interviews, the audio tape was either
fully or partially damaged (see Table 4), so the notes were typed up to serve as a
replacement for the partially or completely missing transcript. Interviews were then
imported into QSR NUD*IST 4.0 for coding and analysis.
46
A sample of project work was collected for each student. Special effort was
made to collect each focus student’s work during the third academic quarter,
particularly the drafts, final products, and related work for their projects. However, it
was not always possible to procure and copy such artifacts before the students threw
them away. As a result, while there is some project work collected from each of the
eleven original focus students who were not suspended, it is not always from the third
academic quarter, nor is it always a complete record of that student’s work and his or
her teacher’s comments on it.
Student and Teacher Surveys
Survey data was collected from the students in every section of the CoVis-
related courses each teacher taught (i.e., not just the observed sections). Three surveys
were administered to the students during the year; 131 students responded to the
CoVis Fall 1995 Survey; 113 responded to the CoVis Spring 1996 survey; 102
responded to a “Student Beliefs about Class Goals” survey; and 92 students responded
to all three (see Table 5). A version of this third survey, entitled “Teacher Beliefs
about Class Goals,” was also administered to each of the teachers (see Appendices D
and E for survey items).

47
Table 5. Number of Students in Each Class.
Teacher and classFall
RostersFall
SurveySpringSurvey
GoalsSurvey
All ThreeSurveys
Roger Wolfe–Earth Science 85 67 53 44 42
Carol PattersonEnvironmental Science* 20 15 15 15 14
Gary Magi–STS 98 49 45 43 36
Total 203 131 113 102 92
(* Sections are those where class observations were done.)
The first two of these surveys were part of the data collection done in all
participating CoVis classrooms. Topics in the fall survey included questions about the
students’ demographic background, their attitudes towards and beliefs about science,
their previous experience and confidence with technology, and their attitudes towards
school. With the exception of the demographic information, most of the same
questions were asked again on the spring survey. In addition, on the spring version,
students were asked twelve likert and yes/no response questions about their attitudes
toward the class.
The third survey instrument was produced specifically for this doctoral
investigation based upon the fifteen goal types elicited from the “instructional goals”
interview conducted with each of the teachers (see the section “Teacher Interviews and
Gradebook Records,” above). For each of the fifteen goal types, the students were
asked to rate on a scale of 1 to 10 the importance of goals of this type to both

48
themselves and their teachers. Students were given the opportunity to add other
learning and teaching goals which they felt were important in the class but had not
appeared in the list of questions. They were then asked to rank order the fifteen goals
both with respect to their perceptions of their teachers’ priorities and their own
priorities. Finally, students were asked nine questions (five open-ended response and
four likert response) about how this class compared to other science classes they had
taken, how it differed from what they expected, and whether they felt they were
enjoying the class and learning from it. These questions complement the twelve likert
and yes/no response questions in the spring CoVis survey about the students’ attitudes
towards their CoVis science course and the project work within it.
Like the student version, the teacher version of this survey asked the teachers
to rank the importance of each goal, both to themselves and to their students, on a
scale of one to ten. In addition, the teachers were asked to rate how effective projects
were at helping them meet goals of each type, and whether they felt they had effective
assessment strategies for evaluating goals of each type. They were asked to give
examples of instructional goals they had which fit each category and the assessment
techniques they use to evaluate them. Then they were asked to rank order the fifteen
goals both with respect to their own priorities and their perceptions of their students’
priorities. Finally, there were nine questions, parallel to those asked of the students,
which asked the teachers to describe their perceptions of what students thought about
their course.

49
Records on School and Community Demographics
Data on the demographics of the community population for the catchment area
for each of the two schools in this study was acquired from the Sunspace Internet
Service maintained by MESA, Inc. (www.sunspace.com) in the fall of 1996.8 The
information used included median household income, the ethnicity of the catchment
population, the ethnicity of the student population, and the education level of the
adults in the catchment population. The Sunspace Internet Service includes data from
the following sources: U.S. Census Bureau, 1990 School District Special Tabulation;
National Center for Educational Statistics, U.S. Department of Education; and
administrative data from individual school systems. All data are from the 1990 census
or pertain to the 1989–90 school year.
The 1995–96 student handbook for Lakeside contained additional information
on the school demographics, such as the percentage of students who enroll in post-
secondary schools. Similar documentation for Edgewater was not acquired.
Analysis
A variety of analysis methods were used with the qualitative and quantitative
data described above to answer the basic questions of the study: What do the teachers’
assessment infrastructures look like? What are the rationales behind their designs (i.e.,
8 This on-line database provides information on school districts. However,
since both Lakeside and Edgewater are single school districts, acquiring data for thedistrict was equivalent to acquiring data for the school.

50
how do they reflect the teachers’ philosophies, goals, plans)? How do they
communicate expectations to students and structure classroom activity (or indeed, do
they)? And, finally, how effective are they in the eyes of both the teachers and their
students? These questions were explored both through integrative and interpretative
case studies of each teacher and then through analytic comparisons between them.
The case studies were constructed to show in an organic fashion how the designs of
assessment and pedagogy were mutually supportive and integrative processes, as well
as the interaction patterns between teachers and students that resulted in the iterative
redesign of both the courses and their assessment infrastructures. The cross-case
comparisons were then used to abstract important dimensions of assessment design
relevant to project pedagogy and technology integration that emerged regardless of the
role that projects and technology played within each course.
Narrative Cases
Initially, the case studies took the form of a narrative describing one day in the
class of each teacher. The observed day for which the video was transcribed was used
as the basis for each narrative. Embedded into the narrative, and emerging from
events of the day, were discussions of the teacher’s instructional philosophy and goals,
assessment philosophy and infrastructure, and personality and rapport with students, as
well as the project work and opinions of each of the focus students studied.

51
The initial drafts of these narratives were used to abstract themes and issues
particular to each teacher. The interviews, both teacher and student, were then
reviewed and sections relevant to each issue coded as such within the NUD*IST
database for easy retrieval and incorporation into the narratives.
Gradebook records and the discussions of them were used to ground the
description of the artifacts and behaviors assessed by each teacher, the criteria they
used for assessing them, and the weighting systems they used for assigning relative
value to each with respect to students’ grades. Each artifact or behavior was discussed
as it emerged through the narrative.
Observation data from 1995–96 should be considered largely as contextual
filters that inform and constrain the analysis done on the interview data, rather than as
objects of analysis themselves. Where events during the day around which the
narrative was constructed were inadequate for demonstrating key points, relevant
events from the observation data were incorporated in the form of a “flash forward” or
“flash back.” They were also used as checks on students’ and teachers’ comments
about the system of rules and customs for exchanging assessment-related artifacts and
information in each class, including each teachers’ pattern of circulating and meeting
with students.
Survey data were used to create a broader context for interpreting the student
and teacher interview data. Student responses to open-ended survey questions about
expectations for and opinions of the course and its assessment infrastructure were

52
reviewed and categorized. Categories were nonexclusive as some students cited more
than one reason for why they took the course, how it was different from what they
expected, and what they thought of the grading system. Simple descriptive statistics in
the form of frequency counts or measures of central tendency were done both on the
open-ended questions and on the likert and categorical response items from the
surveys. These results were then embedded into the narrative where appropriate to
support descriptions of the student body and their attitudes.
The cases in their most complete narrative form are not presented in full here.
Rather, they served as an intermediate data analysis and compilation tool. From them,
shorter, more concise descriptions of each course and its assessment infrastructure
were crafted for inclusion in Chapter 4, “Courses and Their Infrastructures.” In
addition, vignettes were captured from the cases to ground and illustrate the discussion
of cross-case themes in Chapter 5.
Context of the Study
Chapter 3, “Context of the Study,” includes a brief description of the school
and community context in which these teachers and their students work. School and
community demographics are summarized from the descriptive statistics provided by
the Sunspace Site on school districts as well as by school literature. The facilities for
supporting project work and students’ access to them are described for each school
based on observation and interview data. Finally, since the school assessment

53
infrastructure, including the grading, tracking, and counseling systems, can influence
the teachers’ assessment and pedagogical designs, it is described for both schools. The
descriptions are based upon the teacher interview data. Melanie Ribbon’s interview
data was included in the analysis for this section of Chapter 3 because as a student
advisor she had the most complete information about the school’s assessment
infrastructure.
Courses and Their Assessment Infrastructures
Chapter 4, which contains the abbreviated case studies of each teacher and
their courses, follows these school descriptions. The cases, based on the detailed
narratives and the data used to construct them, are divided into three sections: course
structure and philosophy, assessment infrastructure, and relationship between
assessment and pedagogy. These sections provide: a brief introduction to each
teacher as a person, an outline of their instructional goals and philosophy, a
description of the students who tend to take their class and why, a review of the
evolution and design of the course, a detailed description of the classroom assessment
infrastructure as it existed in 1995–96, and a summary of how the pedagogical and
assessment designs come together to support each teacher’s vision of project-based
science.

54
Cross-Case Analysis
The cross-case analyses discussed in Chapter 5 explore three main influences
on the teachers’ assessment infrastructure design: project-based science pedagogy,
computing and telecommunications technology, and the wider assessment
infrastructure. The chapter is divided into four main sections. The first three each
contain a discussion of one of these influences. Each section includes not only a
discussion of the challenges or opportunities provided by each of these influences, but
also a comparison of the assessment solutions and designs the teachers put into place
to respond to them, and a description of the satisfaction levels of both teachers and
students with respect to those assessment designs. The fourth section summarizes
survey data that adds to the discussion of the effectiveness of the infrastructures.
In order to draw comparisons across teachers and on each of these issues,
relevant sections of the student and teacher interview transcripts were coded on the
following topics:
(1) the four aspects of project-based science pedagogy (long-term/open-
ended, resource intensive, iterative, collaborative/cooperative) and their
influence on assessment infrastructure design;
(2) the role of technology in each course and its relationship to the
assessment infrastructure;
(3) descriptions of the wider assessment infrastructure and its influence on
the teachers’ classroom assessment designs; and
55
(4) common assessment infrastructure components (e.g., final products,
such as papers and presentations; intermediate products, such as
milestones, drafts and ancillary reports; records and grades of students’
work behaviors and attitudes; and conferring systems).
The interview responses on each topic are then summarized across teachers and
students. In addition, vignettes from the original case narratives which illustrate how
these influences come to bear in the course of daily classroom activities are
incorporated into the discussion.
As in the case studies, survey data were used to provide a broader context
within which to interpret the student and teacher interview data. Student responses to
the Instructional Goals Survey (see appendix D) were used to explore the extent to
which students in each course understood their teachers’ goals, as represented in the
teacher’s survey responses (see appendix E), and how closely those goals matched
their own expectations of what they ought to be learning in the class. These attitudes
were then compared to their beliefs about how difficult the course was, whether or not
the grading system was fair, and how much they thought they were learning. This
work was done largely through analysis of variance (ANOVA) and correlations. Most
of the calculations were done on the raw ratings data. However, before calculating the
average difference between the students’ ratings for each type of goal and that of their
teachers, z-scores were taken across goal ratings for each respondent. The z-scores
were taken so that the differences calculated would be based on the relative

56
importance placed on each type of goal rather than differences in how each survey
respondent interpreted the ratings scale. The results of these analyses were then
incorporated into the discussions of the effectiveness of the assessment infrastructures
for communicating teacher expectations as well as how satisfied students and teachers
were with the assessment infrastructure design.
In the next three chapters, the results of the data collection and analyses
described above will be discussed in depth. First, the school context in which the
three teachers worked will be described (Chapter 3), followed by a description of each
course and its assessment infrastructure (Chapter 4), and followed further by a
discussion of cross-case comparisons (Chapter 5).
57
3. THE SCHOOLS
The students and teachers involved in this study are located at one of two high
schools in the northern suburbs of a major metropolitan city in the United States:
Lakeside High School and Edgewater High School. They are large schools, in good
condition, with thousands of students each, and with wide sets of offerings in course
work and learning opportunities for their students. The availability of teaching
resources, both human and material, is strong in both schools, and teachers have a
significant amount of non-class time during the day to dedicate to planning,
development, and student consultations. All three teachers involved in this study have
either organizational latitude, support, and/or backing within the science departments
at their respective schools for making projects a significant component of their
curriculum. For example, at Lakeside, earth science teachers involved in the CoVis
project were able to schedule their science courses for seven periods as they are at
Edgewater. Likewise, at Edgewater, Roger Wolfe was able to get special dispensation
to waive the final exam requirement for his course. Moreover, teachers at both
schools were active participants in instructional improvement conversations and
activities. Both teachers at Edgewater mentioned conversations tied to a “Project for
Excellence” grant received by one of the science department teachers that was being
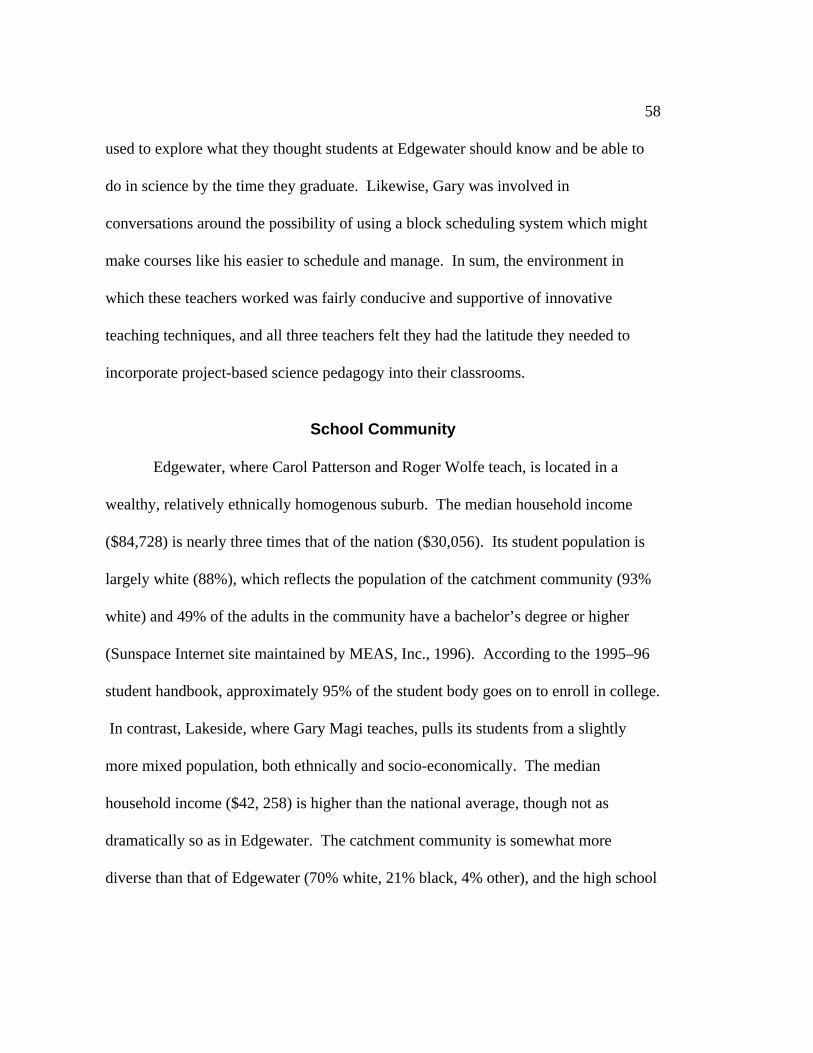
58
used to explore what they thought students at Edgewater should know and be able to
do in science by the time they graduate. Likewise, Gary was involved in
conversations around the possibility of using a block scheduling system which might
make courses like his easier to schedule and manage. In sum, the environment in
which these teachers worked was fairly conducive and supportive of innovative
teaching techniques, and all three teachers felt they had the latitude they needed to
incorporate project-based science pedagogy into their classrooms.
School Community
Edgewater, where Carol Patterson and Roger Wolfe teach, is located in a
wealthy, relatively ethnically homogenous suburb. The median household income
($84,728) is nearly three times that of the nation ($30,056). Its student population is
largely white (88%), which reflects the population of the catchment community (93%
white) and 49% of the adults in the community have a bachelor’s degree or higher
(Sunspace Internet site maintained by MEAS, Inc., 1996). According to the 1995–96
student handbook, approximately 95% of the student body goes on to enroll in college.
In contrast, Lakeside, where Gary Magi teaches, pulls its students from a slightly
more mixed population, both ethnically and socio-economically. The median
household income ($42, 258) is higher than the national average, though not as
dramatically so as in Edgewater. The catchment community is somewhat more
diverse than that of Edgewater (70% white, 21% black, 4% other), and the high school

59
student population is even more so (50% white and 42% African-American). The
percentage of adults in the school’s catchment area with bachelor’s degrees or higher,
53%, is actually larger than that of Edgewater, possibly in part because a major
university is located in this community.
Scheduling
There are nine periods a day (45 periods in a week) at both schools. At
Edgewater, science courses typically meet for seven periods a week: a single period
for three days a week and a double period “lab” session twice a week. At Lakeside on
the other hand, science courses usually meet for five periods a week, one per day. A
typical course load for a science teacher at Edgewater is four courses (28 periods a
week), and at Lakeside is five courses (25 periods a week). However, since Gary
Magi’s course is team-taught with a social studies teacher, his meets for two
continuous periods a day.
Security and Student Mobility
Differences in the security and student mobility situations at each school have
implications for how the teachers in this study oversee the student movement and
access to resources required by in-depth science projects. Security at Lakeside is
tighter than it is at Edgewater. Lakeside has a large and very visible uniformed staff of
school security officers who regularly patrol the hallways. Visitors must check in at
the office to sign in and obtain a pass. Students are not allowed in the halls between
60
classes without a pass from a teacher. During their free periods students must be in a
study hall or in supervised areas, such as the student center, library, or computer
center. In contrast, hallway supervision at Edgewater is generally conducted by a
combination of teachers and non-uniformed paraprofessionals. The campus is an open
one in that students do not need a pass to move through the halls, nor are they required
to be in a supervised study area during their free periods.
Grading, Tracking, and Counseling Systems
The grading, tracking, and counseling systems at Lakeside and Edgewater have
implications for the reputation and perceived worth of each of these courses in the
eyes of students making course selections. These perceptions have a direct influence
on the students who take each of the courses and their expectations for them. Those
expectations, in turn, create a set of pressures which influences the teachers’
instructional and assessment design activities.
Edgewater
Edgewater does not have a large staff of school counselors. Instead, teachers
volunteer to be “advisors” for a group of students.9 Each advisor takes a small group
of students in their freshman year (15–20)—male teachers have a group of boys and
9Melanie Ribbon was a student advisor; as a result, her understanding of the
grading, tracking, and counseling system of Edgewater was more comprehensive thanthe two teachers who are described in this study. Interview data from her are used tosupplement this particular discussion.
61
female teachers have a group of girls—and remains as the advisor for this same group
until the students graduate. They get to know the student’s parents and serve as both a
mentor and advocate for the student and his or her family in the school. The advisee
group meets every day for a short time before regular classes start, much like a
homeroom. Initial counseling and advising on both academic and non-academic
matters always begins with a student’s advisor. An advisor chair, whose position is
much like that of a dean of students, handles serious discipline problems and serves as
a coordinator for the advisors.
Part of the work an advisor does is to help students make course selections,
including the “level” at which they wish to take a course. Edgewater tracks the
courses available into five categories: level 1, level 2 (national average), level 3
(above national average), level 4 (honors), and Advanced Placement (AP). When
freshmen enter the school, their class levels are determined by their performance on
standardized tests in mathematics and English. Placement levels for biology and earth
science, the science courses typically taken by freshmen, are based on their English
scores. Placement levels in chemistry and physics are based on their mathematics
scores. After their freshman year, the level of course in a subject area each student
takes is based largely upon teacher recommendation. Students are not rigidly assigned
to level tracks and can request to be moved into a class categorized one level higher or
lower than that for which they were recommended. Moves are rarely, if ever, made to
a class two levels higher or lower than recommended. As one teacher explains, “You

62
know, kids will try it on. They’ll take a 4-level English class and if it’s too hard they
go down to a 3-level. So there’s a lot of moving,” (M. Ribbon, interview, May 10,
1996). Such requests are made through the student’s advisor and must be supported
by a letter from their parent(s) that acknowledge they understand the ramifications of
the change.
Part of the reason for the movement is that the school uses a weighted system
for calculating students’ grade point averages (GPA), which is based upon the level at
which a given course is taught. For example, an A in a 3-level course is worth 4.8
points whereas an A in an AP-level course is worth 7.2 points. Some courses are rated
as 9-level, which means that either 2-level or 3-level students may take them and they
all receive 3-level credit. Both Roger’s Earth Science course and Carol’s
Environmental Science course are listed for 9-level credit, which means their students
receive 4.8 points for an A, 3.6 for a B, 2.4 for a C, and 1.2 for a D.
Students who are trying to improve their grade point averages may opt to take
a course for a higher level of credit than their previous teacher in that general subject
area had recommended. On the other hand, students with fairly strong grade point
averages who are worried about an overly ambitious schedule may opt to take a course
for a lower level of credit. Either choice may have consequences for a student’s GPA,
which is why parent consent, in this largely college-bound student population, is
required for a level change. The final grade calculation of a student who takes a more
ambitious course and does not succeed may be worse than if he or she had taken the
63
recommended level. Likewise, a student who takes a lower level course than
recommended may later regret the loss of the weighted bump to their GPA.
Students’ grades are reported to their parents four times a year. However, only
semester grades go into the formal GPA calculation. It is up to the individual teacher
to decide how the first- and third-quarter markings figure into the final grades for the
fall and spring semesters. Some treat student performance in the two quarters with
equal weight. Others consider the first- and third-quarter markings to be mere
progress reports that, depending on the students’ performance in the second and fourth
quarters, may have little bearing on their final semester grades.
Officially the school requires each teacher to give a final exam at the end of
every semester. The only specific requirement for how the final exam relates to a
student’s final evaluation is that it cannot be worth more than 20% of the semester
grade. The science department further requires that the final exam may not consist
solely of multiple-choice questions, but must also contain a written portion. Carol
usually gave a final exam or specifically assigned a project to be counted instead of
one. Roger, on the other hand, negotiated for his final exam requirement to be waived.
Midway through the academic quarter, teachers are required to send to their
department chair a Low Scholarship form, commonly referred to as a “LoSco,” for
every student who is currently in danger of receiving a D or F in the course. The form
is sent from the department chair, to the advisor chair, to the student’s individual
advisor, and then home to the student’s parents. Everyone in this chain gets a copy of
64
the form. The student’s parent(s) must sign the form acknowledging they received it.
If the form is not signed and returned to the student’s advisor, the advisor must contact
the parent(s) by phone. A teacher may not give a student a D or an F unless the LoSco
has been filed. In this way, everyone in the counseling and advising system, including
the student’s parent(s), is aware of potential academic problems.
All students are required to take two sciences courses in order to graduate:
biology and a physical science. Physics, chemistry, and earth science all may be
counted toward the required physical science credit. The most typical course sequence
for science at Edgewater is “a pretty straight track of bio, chem, physics, AP” (M.
Ribbon, interview, May 10, 1996). A few students take earth science as freshman, but
most take it as their third or fourth year of science. Rarely will students take it as their
only physical science, because “a lot of colleges won’t count earth science, to be
honest with you” (M. Ribbon, interview, May 10, 1996). Because environmental
science does not count toward any of the school’s course requirements, it is taken by
students strictly as an elective, usually in their senior year as a fourth science.
Lakeside
Lakeside has a three-level tracking system: “regular” (level 2), “honors” (level
3), and a remedial level (level 1). “Technically, there’s level 1, 2, and 3, but then
advanced placement really is considered a higher track” (G. Magi, interview, April 23,
1996). “I think there’s more floating between honors and advanced placement than

65
there are between any other levels. They tend to support the same faces” (G. Magi,
interview, April 23, 1996). Tracks are supposed to be voluntary, however Gary
believed the weight of the system’s history tended to steer students into particular
tracks:
It’s a voluntary thing. Any parent can request any kid to be in anylevel. But, it doesn’t work out that way. And it is, undoubtedly, race-and class-segregated to a pretty fair extent. Level 2, the regular level,tends to be the most integrated level. But honors tends to beoverwhelmingly white. Remedial is overwhelmingly black. So, it is aform of institutional racism. It’s nobody’s intent, but the structurehelps propagate it (G. Magi, interview, April 23, 1996).
Decisions about the course levels that freshmen take are typically determined
by a combination of teacher recommendations from middle school, as well as
counselor recommendations and parental wishes. Once they are assigned a track as
freshmen, they typically stay in that track throughout their time at Lakeside. As Gary
explained:
People tend to be locked. They really are tracks. People, you know,I’ve had, in my conceptual physics class, which is a level-2 class, it’ssupposed to be a regular class, but which is seen by counselors andstudents alike as a level-1 class and it’s, you know, clientele. I’ve hadhonors students take it, because they wanted to take it for the—Theywanted to do what the course was originally designed to do, which istake physics without out doing all the math, because they wanted toknow the ideas of physics. You know, they’re going into drama or tobe English majors or whatever . . . They have to exert massive forceand have parental pressure to get the counselors to allow them to do it,because that’s not where they belong. Well why don’t they belongthere? Well, because we have a—we have a tracking system and theyare honors students, and this isn’t an honors class (G. Magi, interview,April 23, 1996).

66
Students do sometimes switch levels, but usually from honors to regular when
they “hit a wall” in their ability to handle the work.
People overshoot. . . . I know this happens in physics on a regular basis. The honors-level physics class, um, kids run into a brick wall. Theycan’t handle the math . . . and the drop, as it’s called, to [level] 2, theregular level, you know, part way into the first quarter, maybe atsemester. And that’s the largest form of migration I think you’ll see(G. Magi, interview, April 23, 1996).
The school uses a typical a 4.0 GPA system, where students receiving an “A”
are given 4 points for that course, students receiving a “B” are given 3 points, and so
forth. It has a partially weighted scale. Students in 1- and 2-level courses are on a 4.0
scale, but “for the best students, it’s really a 4.5 grade point system,” Gary explained
(interview, April 23, 1996). Students taking a course for honors credit get 0.5 points
more for their grades than do those in other courses. Hence a choice to “drop back”
from honors has significance for students’ grade point averages, just as switching
levels at Edgewater does. Students receive grades at the end of each of four academic
quarters. Students’ semester grades are calculated automatically by the school’s
central computer. The semester grade is based 40% on the first quarter, 40% on the
second quarter, and 20% on the semester final. Since Gary does not administer a final
exam, he typically gives his students the same grade for their final as they received for
the second quarter of the semester. Thus, in STS, the first quarter is worth 40% of the
semester grade and the second quarter 60%.
67
The counseling system at Lakeside was more centralized than it was at
Edgewater. It consisted of a combination of deans and counselors, both of which were
part of the central administration of the school. The deans, of which there were four in
the 1995–96 school year, dealt largely with disciplinary issues. “The norm is that the
deans are the bouncers; they are the heavies. The counselors tended to take the role of
being advocates, student advocates” (G. Magi, interview, April 23, 1996). However,
deans could on occasion be mediators. “Sometimes if students have good
relationships with the deans, they see them as authority figures to stand up to teachers,
for instance, who are, in their eyes, abusing their power” (G. Magi, interview, April
23, 1996). Teachers generally interacted with the deans when they wrote up a
behavioral referral for a student. “The dean calls for a conference with the kid and
determines what kind of consequences should be doled out, and they do the doling”
(G. Magi, interview, April 23, 1996). In contrast, the school’s counselors were
responsible for advising approximately 250 students each on the following:
Scheduling, course selection, dealing with the school in general,psychological counseling, career counseling, helping to go through theprocess of applying to schools, to colleges, . . . interacting with parents,paying attention to a kid’s overall—theoretically, they have anoverview by kid (G. Magi, interview, April 23, 1996).
Counselors were also responsible for catching patterns, such as consistently
low grades or frequent absences from class, that might signal a student was having
difficulties. Similar to the “LoSco” forms used at Edgewater, Lakeside had a
mechanism for informing counselors when students were not performing adequately in

68
their classes. Originally they had a form called the “Green Hornet” (because it was
green) which was largely a blank memo on which the teacher wrote narrative
comments about the student’s performance. “If you were going to fail somebody you
had to send a form by a certain date in a quarter to alert the parent to the grade and
specifically what the problem was” (G. Magi, interview, April 23, 1996). Recently,
the school switched to a system in which every student received a midquarter
evaluation, rather than just those at risk of failure. A new scantron form was used for
the evaluations which, while easier to fill out, was somewhat constraining: “You have
to choose between one of ten good comments and three of ten critical comments, most
of which are usually not what you want to say” (G. Magi, interview, April 23, 1996).
The forms were then tabulated by a computer so that the counselors could scan them
quickly, look for trouble areas, and communicate with the students’ parents if
necessary.
The counselors played a strong academic advising role and so did have an
effect on the kind of student clientele which might be encouraged to take any given
course. As shown in Table 6, typically students at Lakeside took one of two course
sequences in science. They started a biology-chemistry-physics sequence in either
their freshman or sophomore year. If they started the sequence as a sophomore, they
might take earth science in their freshman year. If they started the sequence in their
freshman year, they might take one or more AP science courses their senior year.
Some students took a special Chem/Phys sequence after biology which combined

69
chemistry and physics together for more than one year. Some took AP versions of
biology or chemistry as early as their junior year. However, the biology-chemistry-
physics sequence was a fairly common core of most of their programs. The course
taught by Gary Magi that was involved in this study, science, technology, and society
(STS), is not part of this main sequence. It was an elective course worth two credits
that counted toward three graduation requirements: science, history and practical arts.
Like Carol’s environmental science course, it was taken largely by seniors looking for
something different to round out their transcripts.
Table 6. Typical Sequence of Science Courses at Lakeside.
Year Typical Sequence #1 Typical Sequence #2
Freshman earth science or nothing biology
Sophomore biology chemistry
Junior chemistry physics
Senior physics AP science or nothing
Classroom and Technological Facilities
The CoVis Project supplied each of these schools with the equipment and
technological support to set up a classroom supplied with six high-end Macintosh
computers, two desktop teleconferencing stations, and direct connections to the
Internet via an ISDN line. The classroom space and technological facilities at each
school are described in detail in this section.

70
Edgewater
Edgewater is a large and rambling school with an impressive array of facilities
and a wide range of course offerings. However, at the time of this study, the
computing and networking infrastructure was not as sophisticated as that of Lakeside.
They did not have a large central computer lab, nor a core of computing support staff.
Instead, a handful of small computer labs were located within specific departments and
used for particular courses. Some facilities, including a scanner, were available in the
library. In addition, the school had a “MacWrite Lab” where students could do word
processing. However, it was clear that the computing and telecommunications
facilities available in the CoVis classroom were the most sophisticated ones in the
school at the time they were installed.
The CoVis classroom at Edgewater, unlike that of many of the other science
classes, was located in the basement of the school, right next to a large storage room
used by the science department for equipment and supplies. A part of this storage
room contained a small office within it. While all three of the CoVis teachers who
used this room had a desk in the large communal science office upstairs, both of the
earth science teachers also maintained a desk inside the supply room office. In Roger
Wolfe’s case this was his main desk.
The CoVis classroom itself was wide but not particularly deep (see Figure 2).
Windows along the wall opposite the hallway let a fair amount of light into the room.
Ringing three sides of the room were waist high, sturdy countertops designed to be

71
resistant to the messes typically created in science labs. The counters along the two
narrow sides each had sinks in them as well as drawers and cupboards for supplies
beneath them. In the corners of the room were book cases and equipment shelves.
Additional equipment, books, and supplies were stored in the office and storage room
next door. At the front of the room was a large demonstration table, complete with
chemical sink and gas outlet for Bunsen burners, which was used by all three teachers
in this room as a desk. Behind the desk was a large black board which Roger and
Carol used for lecture notes and class reminders. Above this blackboard were scrolls
with various world maps, mostly related to geology and earth science, and a projection
screen that could be pulled down as warranted. Mounted high on the wall, just to
either side of the desk, were large 27-inch television monitors (M) which were
connected to both a VCR and a laser disc as well as the internal school cable network.
EW5M M PEW6SupBk
EW3EW2
Counter/ledgeEW1tv
tvTeacher Desk/Demo Table
EW4
Figure 2. Earth and environmental science classroom at Edgewater.
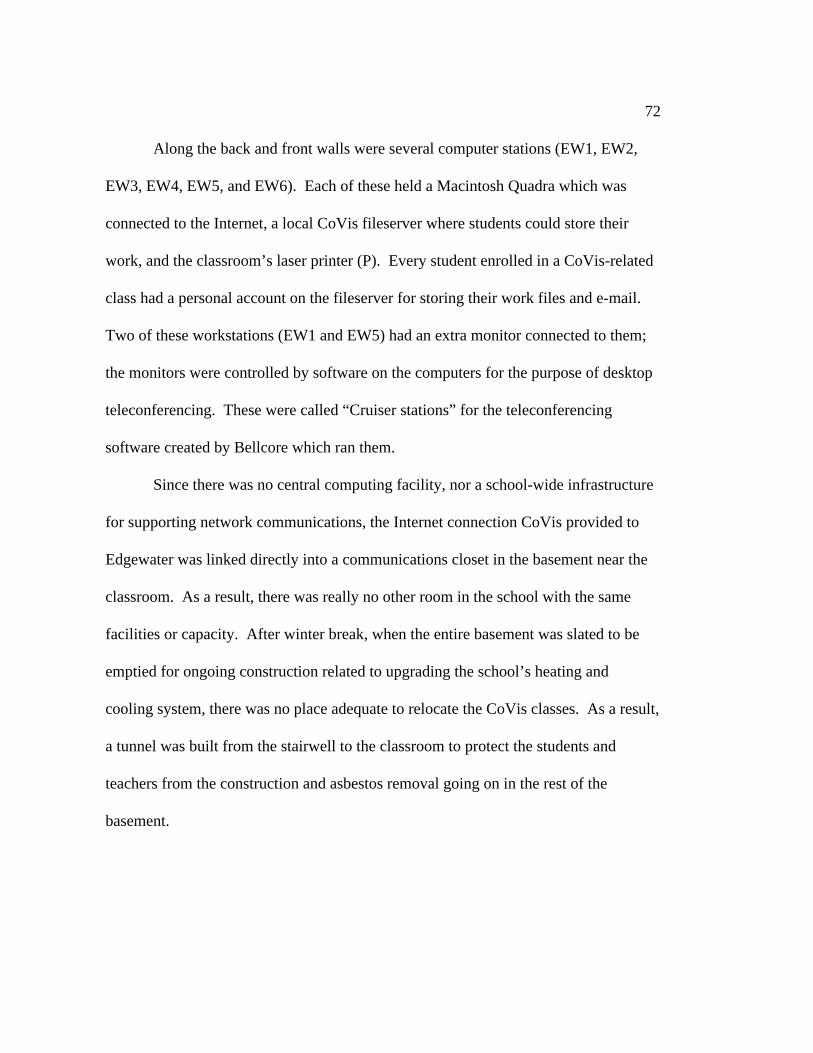
72
Along the back and front walls were several computer stations (EW1, EW2,
EW3, EW4, EW5, and EW6). Each of these held a Macintosh Quadra which was
connected to the Internet, a local CoVis fileserver where students could store their
work, and the classroom’s laser printer (P). Every student enrolled in a CoVis-related
class had a personal account on the fileserver for storing their work files and e-mail.
Two of these workstations (EW1 and EW5) had an extra monitor connected to them;
the monitors were controlled by software on the computers for the purpose of desktop
teleconferencing. These were called “Cruiser stations” for the teleconferencing
software created by Bellcore which ran them.
Since there was no central computing facility, nor a school-wide infrastructure
for supporting network communications, the Internet connection CoVis provided to
Edgewater was linked directly into a communications closet in the basement near the
classroom. As a result, there was really no other room in the school with the same
facilities or capacity. After winter break, when the entire basement was slated to be
emptied for ongoing construction related to upgrading the school’s heating and
cooling system, there was no place adequate to relocate the CoVis classes. As a result,
a tunnel was built from the stairwell to the classroom to protect the students and
teachers from the construction and asbestos removal going on in the rest of the
basement.

73
Lakeside
Lakeside is a four-story building with four large wings designed originally to
house four small “schools within a school.” Currently it operates as a single large and
rambling school. However, enrollment has been low enough in recent years such that
one entire wing has been more or less closed off. When the school decided to add a
central computer center for public use by teachers and students, a large section of the
second floor in the closed wing was redesigned to house it.
Lakeside’s computer center is a large, modern facility, with more support staff
than most schools enjoy. The core of the center is divided into several areas, or labs,
divided by half walls. Each of these labs has between 20 and 30 computers in them.
Most of the labs contain Macintosh computers of various kinds, but some contain
DOS/Windows machines. Some have specialized software installed on all the
machines just for that particular lab. One lab is connected to the Internet (see Figure
3). In the middle of the computer center is a raised hexagonal platform where the full-
time center staff work when they are on duty. From this position, they can see over
the half walls of the various labs and survey the entire center. Around the outside of
the raised platform at table level are shelves that contain printers for the computers
throughout the center. Squirreled away in the corners of the center are small work
areas containing special workstations for doing computer music and computer
graphics as well as a few offices for the center staff. Recently, they have added
computer stations to the libraries in the school as well. In 1995–96 these computers

74
were connected to the school’s local network, and plans were laid to eventually
connect them to the Internet.
Figure 3. Computer lab with Internet access at Lakeside
Teachers sign up for time in the computer center and specify which lab they
need given the work their students are going to do. Students can come to the lab
during their lunch time and study halls to do work. It is also open before class in the
morning and until 5:00 p.m. on some afternoons. Given the large number of
computers and the relatively easy access to them in the school, it is not unusual for

75
teachers to require major writing assignments to be typed onto the computer and laser
printed. Most students carry floppy disks with such work on it around with them.
However, as part of their involvement in the CoVis project, students in Gary’s class
had access to both personal and group project accounts on a dedicated fileserver
provided by the CoVis Project where they may store their work.
Gary was the only teacher in this study who did not have computers located in
his classroom in 1995–96. During the 1993–94 and 1994–95 school years he taught
STS in a classroom he shared with two earth science teachers at Lakeside who were
also involved in the CoVis project. This classroom was located directly above the
computer center so that it could be easily connected to both the school network and the
Internet. The only operating classroom in that wing, it was rather isolated from the rest
of the school. It was of average size and shape, and like the classroom at Edgewater, it
had six computers ringing its outside walls, along with two desktop teleconferencing
stations.
Due to active recruitment on Gary’s part, the enrollment in STS swelled for the
1995–96 school year and there were not enough periods in the day to house both his
course and all the sections of earth science being taught by the other two teachers in
the same room. Moreover, there was an old, unused theater classroom which was
connected to the classroom of the social studies teacher who teamed with him 1995–
96. He felt that the large space and convenience of two interconnected rooms were
more valuable to him than having computers in the room. He could usually schedule
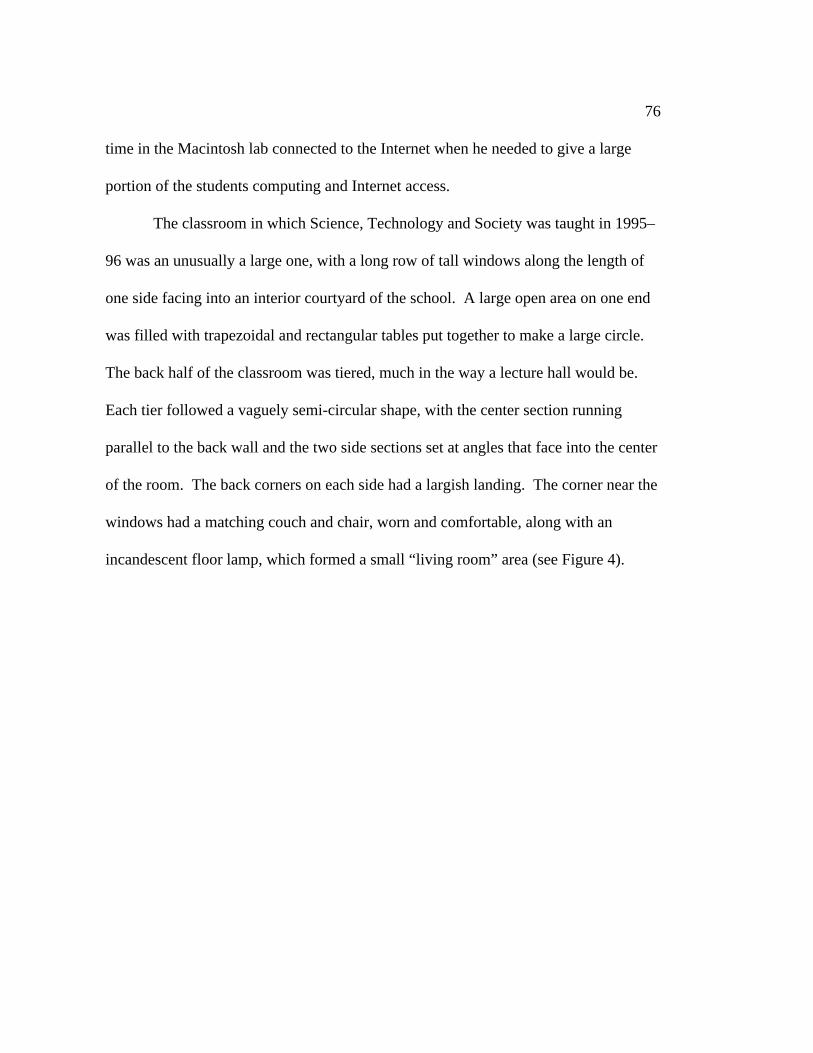
76
time in the Macintosh lab connected to the Internet when he needed to give a large
portion of the students computing and Internet access.
The classroom in which Science, Technology and Society was taught in 1995–
96 was an unusually a large one, with a long row of tall windows along the length of
one side facing into an interior courtyard of the school. A large open area on one end
was filled with trapezoidal and rectangular tables put together to make a large circle.
The back half of the classroom was tiered, much in the way a lecture hall would be.
Each tier followed a vaguely semi-circular shape, with the center section running
parallel to the back wall and the two side sections set at angles that face into the center
of the room. The back corners on each side had a largish landing. The corner near the
windows had a matching couch and chair, worn and comfortable, along with an
incandescent floor lamp, which formed a small “living room” area (see Figure 4).

77
book rackWhite board Black board
Quote board
Karen's room
Hall
Gary's desk
Wall of windows to court yard
Figure 4. Science, technology, and society classroom at Lakeside.
The front wall of the room where the “stage” would have been in previous
times, bends in the middle to create a point, turning the room into a pentagon. On one
side of the point was a blackboard, where a calendar for class schedules was often
kept. On the other wall was a large whiteboard used for announcements and notes
during lecture and discussion as well as a small whiteboard where Gary and Karen
78
Brandon put up quotations relevant to the course. Hanging above both of these boards
was a large white projection screen that could be recessed up into the ceiling when it
was not in use. Two doors flanked either side of this indented wall. Both of them led
to the next classroom, which belonged to Karen Brandon, the social studies teacher
who taught STS with Gary.
Summary
As can be seen by the descriptions above, the facilities at both of these schools
were quite generous. In addition to the space and equipment available to the teachers
in their classrooms, each school had a well-stocked library and publicly available
computing facilities. The student populations, on average, came from relatively well-
educated and economically stable families. The courses involved in this study were
likely to pull from a slightly non-average student population (for the school) due to
their elective nature and the strong college-bound mind-set of the students as a whole.
Finally, the assessment infrastructure of both schools was a fairly traditional one. It is
within this context that each of the three teachers designed or redesigned their courses
to incorporate the use of project-based pedagogy. The next chapter describes those
designs as well as the principles behind them and the assessment infrastructures built
to support and reflect them.
79
4. COURSES AND THEIR ASSESSMENTINFRASTRUCTURES
In 1995–96, the three study teachers—Carol Patterson, Gary Magi, and Roger
Wolfe—were in their fourth year of involvement with the CoVis Project and at least
their third year of project-based science teaching. All three believed in the power of
projects to create powerful learning experiences for their students. However, since
their instructional goals differed, the kinds of projects their students did and what they
were meant to learn from them differed as well. Some of these differences were based
on the differences in the subject matter they taught as well as the core purpose of each
course. Other differences were based on their beliefs about teaching and learning.
Carol Patterson and Gary Magi both taught courses that combined science
topics in the fields of ecology and environmental science with social, political, and
economic issues. In many ways, their courses felt like a combination of topics, issues,
and practices of science blended with those typically considered part of a high school
social science curriculum. Gary’s STS course was even team taught in 1995–96 with a
social studies teacher, Karen Brandon. Roger Wolfe, by contrast, taught a “straight”
science course that focused exclusively on topics in earth science.
Other differences in the instructional goals of the three teachers were based
upon their personal beliefs about the core purpose of their courses. For example,
Roger was largely concerned with helping his students to understand the practice of
80
science as well as to acquire experience doing science. As long as they learned to
conduct a scientific investigation and acquire some knowledge about the earth’s
systems and processes, he was not particularly concerned about which concepts in
earth science they learned. Both Carol and Gary, on the other hand, did have specific
concepts and ideas they wanted their students to learn. Carol, faced with many
students who were quite passionate yet somewhat naïve about environmental issues,
wanted them to become informed about the facts and data behind those issues and to
understand something of the process of science so that they could become literate and
critical consumers of scientific information. In particular, she wanted them to be able
to listen to, reason about, and integrate the evidence provided by all sides of often
heated environmental debates. Gary wanted his students to think about the
ramifications of the technological and scientific advancements of our age upon the
way we live our lives and define who we are. To do so, he believed his students
needed to be informed about the historic, current, and potential future trends in science
and technology in particular areas, such as infrastructures (e.g., heating and cooling),
computing and telecommunications, energy, and medicine. He also wanted his
students to both study and experience the various uses and ramifications of
technology. While the topics his students studied were largely related to technology
and the natural sciences, he described the research they did themselves as more like
that of social scientists.

81
Finally, some of the differences in the teachers’ instructional goals were based
upon their personal beliefs about teaching and learning. All three teachers believed in
the strength of motivating students to learn by engaging them in activities over which
they had some ownership and control. Part of their mutual attraction to project
pedagogy was its capacity to give students such agency, as well as to provide them
with authentic experience in practices related to science. However, the three teachers
differed in their beliefs about both the degree and kind of freedom their students
should have and the kind and level of support they needed. These differences led to
variations in both the level of explicit direction they provided to their students for
doing project work and the amount and kind of oversight they established for them.
Despite these differences, projects played a central role in all three courses.
During 1994–95, Roger reported approximately 85% of his classroom time was spent
on project activity, compared to 48% and 45% in Gary’s and Carol’s classes
respectively (see Figure 5). For Carol, a significant proportion of non-project time
(20%) was spent on activities and labs meant to help students analyze and consider
data related to specific concepts in environmental science, followed by discussions
(12%) that usually centered on comparing and contrasting two or more articles from
different perspectives on some environmental issue. For Gary, the next largest
proportion of class time was spent on discussions (18%), followed by lectures, video,
and demonstration (14%). These curricular patterns are consistent with the course
goals each was pursuing and the assessment infrastructures they put into place. In

82
1994–95, approximately 85% of the grade of each student in Roger’s course was based
upon their project work, in comparison to approximately 51% of each student’s grade
in Carol’s class and between one-third to two-thirds of each student’s grade in Gary’s
class.10
The structure and purpose of each course, the role projects played within
them, and the shape of their assessment infrastructures during the 1995–96 school year
are described in the sections that follow.
10
As will be described in detail in the next section, estimating the worth of anyparticular graded item in Gary’s class is difficult because he uses a holistic gradingscheme rather than a numerically calculated one.

83
45% 48% 82%
0%
10%
20%
30%
40%
50%
60%
70%
80%
90%
100%
CarolPatterson
Gary Magi Roger Wolfe
Teacher
otherhomeworktest & reviewexcursiondiscussionactivities & labslecture & videoProject related time
Figure 5. Centrality of project-based pedagogy to classroom activity
Earth Science at Edgewater High School
As mentioned above, Roger’s foremost instructional goal in 1995–96 was for
the students in his class to learn the rudiments of conducting a scientific investigation.
This had been the driving force behind both his pedagogical and assessment designs
84
since joining the CoVis project in 1992–93. Along with the five other original CoVis
teachers, Roger met with researchers from Northwestern University throughout the
1992–93 school year. In these meetings, plans were drawn for the project work that
students would do in the following year and the technological infrastructure that would
be needed to support this work. To help them in their planning, each teacher was
given a copy of Labnet: Toward a Community of Practice (Ruopp et al., 1993). This
book outlined the philosophies and experiences of a network of science teachers who
had used projects as a way to enhance learning in physics. Its message so inspired
Roger that he dumped his entire curriculum midway through the school year and spent
the rest of it struggling to implement project-based pedagogy. Since that first
experimental year, Roger structured his course so that students received one academic
quarter of introductory material and three quarters of open-ended project work.
Course Structure and Philosophy
Roger described his teaching style before CoVis as being “pretty traditional.
Pretty lecture-lab-video” (R. Wolfe, interview, June 2, 1995). He preferred labs and
videos to lecturing partially because he himself found giving lectures to be tedious. “I
get—I always used to get frustrated with lecturing because I’d have to do it, like, three
or four times. I hate saying the same things four times in a row. It’s really, really
boring,” he commented (R. Wolfe, interview, June 2, 1995). More importantly,
however, Roger came to believe that students who were not interested in the subject
85
would learn little from a lecture. He recounted an e-mail conversation he had with a
student during the short period during the 1995–96 year when he was giving lectures:
She [the student] said, “You know, I’m really getting this stuff. I knowwhat you’re talking about and I don’t get why some of the other people,just, you know, don’t get it. Maybe they’re not paying attention,” shesays. And my reply was “That’s probably true. When you’re not reallyinterested in something, you’re not gonna pay attention. If you don’tpay attention, it’s hard to learn anything about it” (R. Wolfe, interview,October 2, 1995)
Even before he started doing project-based science, Roger was constantly
looking for new ways to better show or explain the information he was trying to
convey. “There’s always this quest, quest for something better, so that the students’ll
understand how things are working” (R. Wolfe, interview, June 2, 1995). To this end,
Roger gravitated towards videos, such as animated simulations of the inner dynamics
of the earth, which might better convey the dynamics of plate tectonics than his
quickly drawn chalk board sketches, and labs, which might more easily convey the
excitement of doing science. The shift to project-based science seemed to be a natural
extension of his pedagogical predispositions. Perhaps the most exciting aspect of
open-ended science projects to Roger was their potential to provide students with the
opportunity to study something of their own choosing, to become interested, and
therefore to learn.
However, before they could become interested, they needed to know what the
possibilities for study were. “You have to have a clue to get a clue,” Roger explained
(R. Wolfe, interview, May 1, 1996). Most communities of practice contain a range of

86
expertise within their membership, and that range of expertise supports the learning of
the newer, less experienced members (Brown et al., 1989; Lave, 1990; Papert, 1980).
However, as Polman points out, high school classrooms like Roger’s are reconstituted
every year (Polman, 1996), leaving the teacher as the only one with history or
experience in the course’s purpose, activities, and culture (Wasley, 1994). As one
teacher quoted by Polman put it, “When you start out a new year you have a whole
new group of kids and they have no idea what happened last year” (Polman, 1996,
p. 474). Roger’s class was no exception. Students typically began the year knowing
little about either the concepts, questions, and issues in earth science, or the practices
of scientific inquiry. He noted that some of his students had “no idea what science
[was] all about,” and claimed, “You have to show them what science is. You have to
model it. You have to model doing it” (R. Wolfe, interview, March 10, 1994).
Moreover, he believed that students could not design reasonable investigations in earth
science unless they knew something about the major questions and issues of the field.
“You have to have some background before you can do projects,” he asserted. “You
know, kids will say ‘I don’t know—I don’t know what to do a project on’ because
they don’t know what’s there” (R. Wolfe, interview, October 2, 1995).
Polman calls this the “bootstrapping” problem and warns that teachers who
wish to construct reform-oriented classrooms based upon apprenticeship or
community of practice models must create learning environments in which students
can build the minimal competencies necessary to begin practice; they must be able to

87
“pull themselves up by their own bootstraps” (Polman, 1996, p. 474). Between 1992–
93 and 1995–96, Roger experimented with a variety of techniques for bootstrapping
his students’ science practice (Polman, 1996, 1997, in press). His tactics included
introductory lectures and videos about concepts and issues in earth science,
presentations on doing science projects and using the classroom technologies, and
“model projects.” During the model projects, Roger proposed the research questions
and outlined the procedures students were to use. The students acted as one large
project team, with Roger as the project manager and advisor, to complete the project.
He then, “[did] a presentation and [gave] them a hand out on that linked those projects
to general projects” (R. Wolfe, interview, March 10, 1994).
However, because he was unconvinced that the model projects he ran in 1993–
94 and 1994–95 were very helpful to the students, he abandoned them for the 1995–96
school year.11
During the first quarter of that year, students simply received a
whirlwind tour of the major topics and concepts in Earth Science through a series of
lectures, videos, and demonstrations, while at the same time they learned to use the
computing equipment and software available in the room. His goal for these lectures,
videos, and demonstrations was for students to become familiar with the broad
landscape that is earth science, not to learn any particular concept in depth:
It’s important to me that kids be exposed to a lot of different things, thebasic concepts of earth science, so that they know what’s out there. But
11
See Polman (1997; in press) for a more thorough discussion of Roger’sevolution and eventual abandonment of the model projects.

88
it’s not important to me that they memorize and have workingknowledge of everything that’s out there. . . . So, I’m just—you know,my content is to show them what’s there, which is hopefully gonna thenenable them to—to do their—their projects later, with at least someknowledge about how things work (R. Wolfe, interview, October 2,1995).
Having acquired some basic knowledge and skills, students then collaborated
for the other three quarters of the year in groups of two or three on long-term scientific
investigations in areas related to earth science. They could investigate any question in
earth science they wished. As long as they learned to conduct a scientific investigation
and acquired some knowledge about the earth’s systems and processes, Roger was not
particularly concerned about which concepts in earth science they learned. “When
they decide to focus on something, then yes, then they’re going to grapple with
some—some smaller subset of the whole thing in much greater detail, and I would
hope then that they become very knowledgeable about it at that time because that’s
what they want to do,” he explained (R. Wolfe, interview, October 2, 1995). In 1995–
96, the students conducted a variety of projects on a wide range of topics (though there
did appear to be a preponderance of curiosity about natural disasters, such as volcanic
explosions, hurricanes, earthquakes, and forest fires). Their projects included locally
conducted experiments, such as growing and analyzing crystals or testing the water
quality at several junctures of a nearby lagoon; the analysis of patterns in already
available datasets of disaster phenomena such as hurricane paths, volcano eruptions, or
forest fires; and conclusions drawn from historical datasets, such as describing how

89
plesiosaurs probably swam by comparing fossil evidence of their anatomy to that of
similar sea animals living now. There were also a few cases of proposals, models,
and/or designs which were based on current beliefs about how earth systems function,
such as a plan for stabilizing fault lines.
To help facilitate this broad range of project topics as well as provide an
authentic audience for the students’ work, Roger incorporated the use of telementors
into his project design. He recruited science experts via the Internet, largely through
UseNet Newsgroups, to talk to his students and give them advice on their project work
using e-mail (D. K. O’Neill, 1998; D. K. O’Neill & Gomez, 1998). He explained, “In
doing projects, I don’t have to know—I feel that I don’t have to know everything
about everything. If I can guide them to somebody else who knows more than I do,
then I’ve done a good job” (R. Wolfe, interview, March 10, 1994). All students in
Roger’s class were required to try working with a telementor—if one was available in
their topic area—for at least one project cycle. The success of these relationships
ranged widely depending, in part, on the dedication of both the students and the
volunteer telementors (D. K. O’Neill, 1998; D. K. O’Neill & Gomez, 1998).
Students were also required to work in groups of two or three on their projects.
Not all the students liked working in project teams. As one of his students, Papi,12
complained in an interview, “[Roger] was forcing us to have partners, which I talked
12
Papi was selected by Roger as representative of an average student in hiscourse.

90
to him about because I really didn’t like that idea. He basically had some
psychological reason for it. I mean, it was to get us to think critically with someone
else, to learn how to work with people” (Papi, interview, February 8, 1996). Roger
worried that letting students always do their work alone might ill-prepare them for the
future. He explained, “I just happen to think that working with people seems to be the
more common-place experience in the work day world, whether you’re working at
McDonald’s or working for McDonnell Douglas” (R. Wolfe, interview, October 2,
1995). For this reason, he generally stuck by his “you must work in teams” rule;
however, students did have the option of doing one project cycle alone if they so
desired.
While Roger did not have specific concepts in earth science that he wanted to
be certain all his students understood, he certainly had specific goals in mind for what
he wanted them to learn about the process of doing science. In order for a student’s
work to be a science project, Roger asserted, “You have to have a scientific question to
answer, and then you have to collect data to answer that question. You have to
analyze your data to see what it means, and then you come to a conclusion” (R. Wolfe,
interview, March 10, 1994). He was thus disappointed to discover that at the end of
the first project cycle in 1993–94 the vast majority of the project groups “didn’t collect
any data. They didn’t analyze any data. And they didn’t come to any conclusions
based on any data, because they didn’t have any” (R. Wolfe, interview, March 10,
1994). Over the next two years, he worked to refine his guidelines and suggestions to

91
students so that more of them would understand his belief that “if you’re not collecting
data, you’re not doing a project” (R. Wolfe, interview, March 10, 1994). He was also
disappointed to discover that a significant proportion of the students in the course had
a tendency to waste much of the eight to ten weeks of class time they were given to
work for each project. Both of these problems are related, at least in part, to the
attitudes of the students who typically enroll in his course.
Many of the students who take earth science are those who do not have a
history of strong interest or success in science. Most of Roger’s students in 1995–96
had taken biology already (n = 42, 89%). However, less than half had taken chemistry
(n = 19, 40%), and very few had taken physics (n = 8, 17%). Students were asked on a
survey whether they could see themselves becoming a scientist, majoring in science,
or using science in their careers. They were also asked whether they enjoyed their
science classes, did well in them, and considered themselves a “math” or “science”
person. The results from these questions showed a resounding lack of enthusiasm for
science as a part of their future endeavors and fairly neutral feelings about identifying
as a “math/science person.” However, on average the students did seem to both enjoy
and believe they performed well in the subject (see Table 7). When asked the open-
ended survey question, “Why did you take this course?” (n = 47), the most common
response from Roger’s students was that they were interested in the subject (n = 19,
40%). However, the next most common response was that they were avoiding another
course, such as chemistry, physics, or biology (n = 17, 36%). As one student
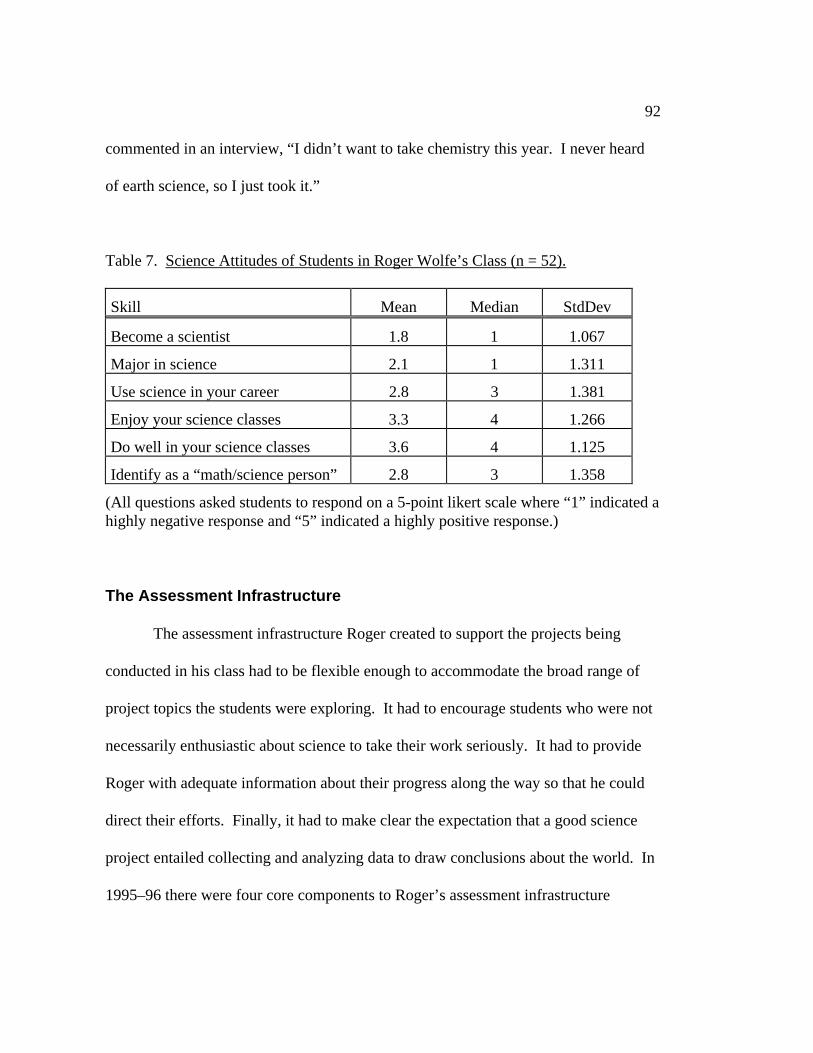
92
commented in an interview, “I didn’t want to take chemistry this year. I never heard
of earth science, so I just took it.”
Table 7. Science Attitudes of Students in Roger Wolfe’s Class (n = 52).
Skill Mean Median StdDev
Become a scientist 1.8 1 1.067
Major in science 2.1 1 1.311
Use science in your career 2.8 3 1.381
Enjoy your science classes 3.3 4 1.266
Do well in your science classes 3.6 4 1.125
Identify as a “math/science person” 2.8 3 1.358
(All questions asked students to respond on a 5-point likert scale where “1” indicated ahighly negative response and “5” indicated a highly positive response.)
The Assessment Infrastructure
The assessment infrastructure Roger created to support the projects being
conducted in his class had to be flexible enough to accommodate the broad range of
project topics the students were exploring. It had to encourage students who were not
necessarily enthusiastic about science to take their work seriously. It had to provide
Roger with adequate information about their progress along the way so that he could
direct their efforts. Finally, it had to make clear the expectation that a good science
project entailed collecting and analyzing data to draw conclusions about the world. In
1995–96 there were four core components to Roger’s assessment infrastructure
93
designed to meet these needs: project milestones, a paper grade, a presentation grade,
and a “daily work grade.” In addition, he created two key documents, a detailed two-
page description of the format students were supposed to use for their final paper, and
a set of instructions entitled “How to do an Earth Science Project” that outlined his
expectations for students’ work in the course. These documents were refined each
project cycle as needed to provide greater clarity. The guidelines outlined in the paper
format description were a direct reflection of the criteria Roger used to evaluate the
students’ papers, while those of the “How to Do a Science Project” document were
reflected in the milestone deadlines Roger set. The major components of Roger’s
assessment infrastructure are outlined in the following subsections. (For a detailed
description of what exactly he graded, the worth he assigned to each graded item, and
his calculation system for the 1995–96 school year, see Appendix F.)
Milestones
To help his students accomplish their scientific investigations, Roger divided
their work up into several chunks. Each chunk of work corresponded roughly to part
of the final paper the students would submit to him, and each had a due date associated
with it. The milestones were themselves graded; each one was worth five or ten
points. Unless they were late or very poorly done, students received full credit for
whatever they submitted. One point was taken off for each day a milestone was late,

94
and extra credit was given to students who turned them in early—one of the only ways
extra credit could be earned in the course. As one of his students, James13
, explained:
He gives you a project, or a guideline. Let’s say, in one week you haveto hand in your partners. And then the week after that you have toknow your main subject. You have to get some backgroundinformation on it. So each time there’s a deadline. You hand in yourpartner’s name, your topic a week later, and two weeks later you handin your background information. Each one of those is graded—five[or] ten points. And so that’s basically, like, the system. You justfollow it, you turn stuff in when its needed to be turned in, and you’llget the points. And after the background comes, like, your data andyour data analysis and your conclusion. And, you do this one step at atime and you hand all the things in, get graded, and then in the end itcomes together as a big project (James, interview, February 7, 1996).
The number of milestones that Roger had students turn in changed over time,
and even during the course of a single school year. Usually the first project cycle of
the year was longer than the later ones, and Roger asked for more milestones. As
James explained in the spring of 1995–96, “I think in the first project he had us do one
step at a time just to get used to it. But now that we’ve gotten accustomed to the way
things work, he feels more faith in just letting us hand it in all at once” (James,
interview, May 23, 1996).
The milestone portion of Roger’s assessment infrastructure served several
purposes. First, as shown in Table 8, it helped students break down the activity of
doing a science project into logical subtasks. Second, some of those subtasks (e.g.,
13
James, the only honors student in the observed section of Roger’s class, waschosen as an example of a strong student.

95
background information and data/analysis) resulted in written text that could be
incorporated directly into the final paper (e.g., introduction and methods/results),
which made the logic behind accomplishing them compelling to the students. These
were not “busy work” activities—they were helpful toward accomplishing their final
goal. Third, the milestones also helped students to pace their efforts, since the
intermediate deadlines prevented students from procrastinating on their project work
until just before the final deadline. Finally, each deadline served as a pressure point
that encouraged students who were having difficulty to seek advice from Roger. In
addition, Roger would usually hand back the written pieces, such as the background
information, with copious notes on them. A few students would rewrite them and turn
them in again. Roger would re-read the pieces as often as the students turned them in
to him. As a result, both the submitted artifacts and problems students faced when
producing them served as opportunities for Roger to provide students with additional
feedback, direction, and support as needed and desired.

96
Table 8: Project Subtasks and Associated Milestones in Roger Wolfe’s Course.
Project Subtask Associated Milestone
1. Assemble a project team andcollectively agree on an area or issuein earth science that you which youall want to study.
Turn in your topic and the names of yourteam members.
2. Look up background information onyour topic so that you can ask aresearchable question.
Turn in a summary of the backgroundinformation you read.
2. Decide on a research question orproposal.
Turn in a question or proposal.
3. Collect or find data to answer thatquestion and analyze it.
Turn in your data and data analysis.(These were sometimes divided into twoseparate milestones.)
4. Come to a conclusion that answersyour question based on findings fromyour data analysis and write a finalreport describing that conclusion.
Turn in your final paper.
Daily Work Grade
For several reasons, both personal and practical, it was extremely important to
Roger that his students use their class time effectively. Being able to choose their own
area of study was not sufficiently motivating for some of the students who, when
provided with lots of open time under their own control, tended to procrastinate. As
one of Roger’s students, Papi, explained:
The trouble that many people had—it’s obvious—is that they felt atfirst, being the first project and they didn’t have a teacher on their back

97
stressing them to do their assignments, that they could blow off theclass. They realized a couple nights before their project that, you know,“I got a lot of work to do!” and they crammed it (Papi, interview, February 8, 1996).
To make it clear to students that working hard was important to him, Roger
assigned a significant portion of the quarter and semester grade to what he called their
“work grade.” That proportion and the manner of its calculation changed in subtle
ways over time, but in general, Roger’s “work grade” was worth between 40% and
50% of each student’s final semester grade.
Why do I have my work grade as 45% of the grade? Because that’s animportant part to me—how much they work—and that’s going alongwith making them work in the classroom and doing things and—asopposed to sitting on their hands and not being involved—because ifyou’re going to have them, you know, in a classroom where you’redoing things, you damn well better do things! (R. Wolfe, interview,June 2, 1995).
In the 1995–96 school year, the work grade was a combination of the project
team’s points for milestones, a “daily work grade” for each individual student, and in
two of the four academic quarters, a peer evaluation which Roger called the “group
work grade.” The daily work grade was based on Roger’s written records of the
percentage of class time he observed each student using effectively. In 1993–94, he
started recording in a spiral notebook a, “+” day (working for the entire period), a “-”
day (absent or off-task for the entire period), or a “1/2+” day (working for half the
class period and off-task for half the class period) for each student. He did not take
notes on every student every day and tended to take notes more often for those

98
students who were not particularly good at managing their time. For example, during
the third quarter of 1995-96, the number of days for which he made notes for each
individual student ranged between 18 and 30, with an average of 23 days.
By 1995–96, he began making more fine-grained estimates of class time use.
He included in notes quarters or tenths of a day for which students were on-task. He
also began keeping track of the minutes of class time students missed when left the
classroom to go to the bathroom, their locker, or the cafeteria, as well as the entire
periods they missed due to absence. Time missed due to absence counted as “-” days.
Time off-task included time in which Roger could not account for students’ physical
location, such as times when they said they had gone to the library but could not be
located when he checked the library, as well as times when he could see them and they
were not working. Students could make up time missed either due to absence or poor
use of class time by coming in during their free periods to work on their science
projects. With a simple formula of �days
(�days) � (�days), Roger then calculated the
percent of time students were on task. Missed time was then subtracted from either
this percentage (i.e. one missed period was equivalent to one lost percentage point) or
that of the entire quarter.
Toward the end of the 1995–96 school year, he experimented with a design in
which students made their own estimates of how much time they were on task each
day. However, he found these estimates to be unreliable and never incorporated them

99
into his grade calculations. “They can’t at the end of the period write down how much
time that they actually spent on working. . . . Either they have no concept of time or
they lied” (R. Wolfe, interview, June 4, 1996).
The group work grade changed over the years. It was either a rating of what
percentage of the work the student believed each member of his/her team did,
including him/herself, a grade for each person on the team, or both. Roger would then
average the responses of all team members about a given student. By the end of 1995–
96 he had abandoned asking students to rate what percentage of the work each was
doing for the same reason he did not use students’ logs: “I don’t think that they—they
have good time concepts,” (R. Wolfe, interview, June 4, 1996).
Final Paper
The final project paper was the focal assignment for every quarter of the year
(except the first quarter when they were doing introductory activities) and was meant
to echo the general format used by natural scientists reporting their findings in a
journal (D. K. O’Neill, 1997). The paper was worth between 25% and 50% of any
given quarter grade. Roger created a paper evaluation form based on the same paper
subsections he described in his paper format handout: title (5 points), introduction (20
points), methods (20 points), data and analysis (20 points), conclusion (20 points),
literature cited (10 points), and structure and grammar (10 points). The form was
stapled to each group’s paper when it was returned to them, with all the point values

100
they had received for each subsection listed, as well as the overall score, a letter grade,
and copious notes. Roger always gave students the option of reading over his
comments and rewriting the paper and they usually received the higher of the two
grades. However, he never told the students ahead of time that the initial version of
the paper they turned in was a draft.
Well, it’s kind of weird because they don’t know that it’s a—it’s a draftbecause it’s—because if we tell them it’s just a draft then they don’tbother. So you just tell them, “Okay, your paper is due here,” and thenyou grade it and then say, “Okay, look, I’m going to give you theopportunity to fix the things that are wrong and turn it in again. Now,if you don’t want to fix the things that are wrong, you don’t have to. Ifyou’re happy with what you have, fine. So then your draft becomes thefinal draft” (R. Wolfe, interview, March 7, 1996).
Because of the significant role they played in Roger’s conception of science
practice, data and data analysis were a key component of Roger’s final paper
evaluations. He had a difficult time conveying to students what he meant when he
said he wanted them to do a science project. Initially, many of them wrote what he
referred to as “informational papers”:
Every time I would say data and numbers, . . . they thought backgroundinformation. “Yes, sure we’re collecting data. We’re collecting allkinds of stuff from the library. Look at all the stuff we have. We havepages and pages of stuff.” I said, “Yes, but it’s wrong.” I was neverable to communicate to them that was not what I wanted until reality hitthe fan with the grade. Then some of them got it (R. Wolfe, interview,March 10, 1994).
As a result, part of Roger’s response to students’ difficulties with data was to
become very stringent in his requirements for data and data analysis in the final paper.

101
By 1995–96, the methods section of the paper became an “all or nothing” proposition.
“If you don’t have any data you get a zero. If you didn’t write the methods the right
way, you got a zero,” he explained (R. Wolfe, interview, March 7, 1996). He also
provided them with concrete guidelines for how to demonstrate to him that they had
acquired data and done data analysis, by requiring that students include either a table
to exemplify their data and a graph to exemplify their data analysis.
Presentation
Presentations were held after the final papers had been submitted. Roger
encouraged students to use Microsoft PowerPoint or visual aides to support their
presentations and usually gave them a week after their final paper was completed to
prepare for them. As a result, presentation evaluations were often not included in the
students’ grades until the following quarter. Ranging between 10% and 25% of the
grade for any given quarter, presentations were never quite as important to the
students’ grades as their papers.
Sometimes presentation grades were based on Roger’s evaluation alone, and
sometimes they were based on both his evaluation and that of the students in the
audience. He wanted students to listen to and discuss one another’s work in class and
hoped the peer evaluation forms he provided them might focus their attention on the
salient features of a good scientific presentation. “We are trying to share part of our
research and I’m trying to get the kids . . . into thinking more critically about what is

102
going on, you know, about the other person’s research,” he explained (R. Wolfe,
interview, June 2, 1995). However, despite efforts to both model and explain the
behavior he was expecting, the kind of discussion he wanted rarely happened. “It’s so
hard to get them to buy into the game, because they just don’t care,” he lamented (R.
Wolfe, interview, June 2, 1995). He tried at one time to give students points for good
questions during presentations, but did not find that tactic particularly helpful. While
he did keep track of the kinds of questions students were asking, it never entered into
their grades in any regular or formal fashion.
Post-Project Milestones
There were two milestones that students were required to submit after their
projects had been completed. Roger had developed an evolving course archive of
project papers which students could review in order to get ideas or look up resources
used in the past. To support the continued development of this archive, each group
was required to submit an electronic copy of their paper which was added to the
archive. Printed versions of these papers were kept in binders that current students
could review.
The second post-project milestone was put into place to sustain the
telementoring system. Several of the telementors wrote to Roger explaining that in
order to feel their work with the students was worthwhile, they needed to know how
the students had used their advice and whether the final product had turned out well.

103
In order to maintain the interest of these telementors, the second post-project
milestone required students to send them an electronic copy of their paper. At one
time, students also had to provide proof that their mentor had received their paper (i.e.,
forward a mentor’s e-mail response to the paper to Roger). However, when a few
mentors failed to respond despite repeated requests from the project team, Roger
removed that requirement (D. K. O’Neill, 1998). “Since the mentors weren’t
responding, then I just figured, well, its not fair to, to punish the kids, because,
because the adults aren’t playing. The kids have done their thing. So I just didn’t
count it” (R. Wolfe, interview, May 1, 1996).
Non-Project Grades
As one might infer, there were very few grades in Roger’s class not related to
projects in some way. During the first quarter of the year, however, Roger did give the
students a “content test” on the material he was covering during lectures. He also
administered a computer skills performance test with each student. The content test
was worth 30% and the computer skills test was worth 20% of the first quarter grade.
Roger did not give his students a final exam. Since his students all studied different
topics, they did not have common learning experiences for which he could craft a
single final exam. Edgewater requires a final exam for every course, but Roger
negotiated with his science department chair for a waiver.

104
Weighting and Grade Calculation System
Every academic quarter, Roger built a spreadsheet for calculating his students’
grades. His calculation methods were somewhat idiosyncratic and could best be
described as a series of embedded relative percentages. Everything he graded initially
started out with a point value, which he then converted to a percentage. He then
weighted the percentage scores for each graded item either by combining it with other
items (e.g., adding students’ work grades to their milestone grade and dividing by two)
or by specifically adding a weight to the calculation (e.g. multiplying Roger’s grade
for each student’s work by three, adding it to the student’s grades for one another’s
work and dividing by four.). Through a series of four or five such combinations Roger
finally determined each student’s quarter or semester grade. In 1995–96, tests and
non-project related assignments accounted for 30% of the students’ first semester
grades. Otherwise grades were based on project related work and use of class time.
(See Appendix F for the full details of Roger’s grade calculation system.) A copy of
the spreadsheet, with each student identified only by their school identification
number, was available via the CoVis file server for students to access at any time. It
was updated after each milestone or final product was collected and evaluated.
Communicating about Grades
In addition to getting back their work with comments and points marked on it,
students could check their standing in the course as a whole through regular on-line
105
access to Roger’s grading spreadsheet. Students would review the spreadsheet to see
how many days of work they had to make up and whether or not Roger had records of
all their milestones being turned in on time. When they had concerns about their
grades as shown in the spreadsheet, they could either write to him about them in e-
mail or talk to him during a free moment in class when he was not consulting with
other students about their project work. Roger updated the contents of the spreadsheet
every couple of weeks, usually after he had finished grading a major milestone.
Toward the end of the quarter, he updated the spreadsheet more frequently as students
handed in work just before the quarter grading deadline.
Relationship between Assessment and Pedagogy
As the discussion above has illustrated in detail, there are two goals or
principles which underlie the entire design of Roger’s course, including its assessment
infrastructure. First and foremost, his course was designed to teach students about
science by engaging them in the practices of science. Second, his course was designed
to maximize student learning by providing students with the opportunity to study areas
of interest to them. His goal was for his students to learn deeply about the concepts
and issues in a few areas of earth science of interest to them and to understand and be
able to practice key activities in the field of science, such as analyzing data in order to
draw and report conclusions. These learning goals and pedagogical principles led to
several instructional needs. First, his students needed to learn enough about the field

106
of earth science to both develop interest in some of its issues and topics and craft
questions worthy of investigation. Second, they needed to learn enough about the
process of science to know the feasibility of investigating the question, given the data
and analysis means at their disposal, as well as to design and conduct that
investigation. Third, they needed to learn to use the scientific tools they had at their
disposal. Finally, they needed to learn enough about the language and forms of
communications in science so that they could produce reasonable written and verbal
descriptions of their work.
Roger designed the activities and assessment infrastructure of his course
explicitly to meet these needs. The introductory activities in the beginning of the year
provided students with baseline information, experience, and practice with the
concepts, practices, and tools of earth science. The tests he gave during that period
were meant both to encourage students to take the introductory activities seriously and
to ascertain which students might need further information, practice, or support. The
“How to Do a Science Project” handout added further detail and a constant reminder
of the general processes of science that Roger believed were germane to all students in
the class, regardless of their individual project designs. The milestones then served as
intermediate deadlines which both reinforced the processes described in this document
and served as the locus of conversations around which advice on the processes and
concepts in earth science applicable to a particular project could be discussed.
Similarly, the “Project Reports” handout provided students with explicit directions

107
about written communications in science and were directly tied to assessments of
those communications. The ability to rewrite their papers afforded them opportunity
to practice and refine their ability to communicate in the genre of the scientific
research article (Swales, 1990). Likewise, the presentations, and Roger’s various
attempts at using peer evaluation to guide students’ participation in them, were meant
to support practice in oral scientific communications. Finally, the work grade was
meant to support students’ efforts at pacing their work, while rewarding (and therefore
encouraging) perseverance among students who were having difficulty meeting their
project goals.
In sum, assessment in Roger’s class was closely tied to practice. “How do you
measure how somebody thinks? How well they’ve developed the capacity to think?”
he asked and then added wistfully, “If you put some sort of an electrode cap on their
heads to find out what they’re learning, while they’re doing it, that would be a thing to
have for assessment” (R. Wolfe, interview, June 2, 1995). In the absence of such a
device he felt his best alternative was to “set up the experiences and then evaluate
those” (R. Wolfe, interview, June 2, 1995).
I have this gut reaction that . . . the best thing I can do is kind of leadthem down the right path to produce the kinds of things that—or set upthe experiences for them to do activities and give them the opportunityto produce artifacts like this paper that would involve those skills thatI’m trying to get them—skills or what ever you want to call them—andthen at least grade those things (R. Wolfe, interview, June 2, 1995).
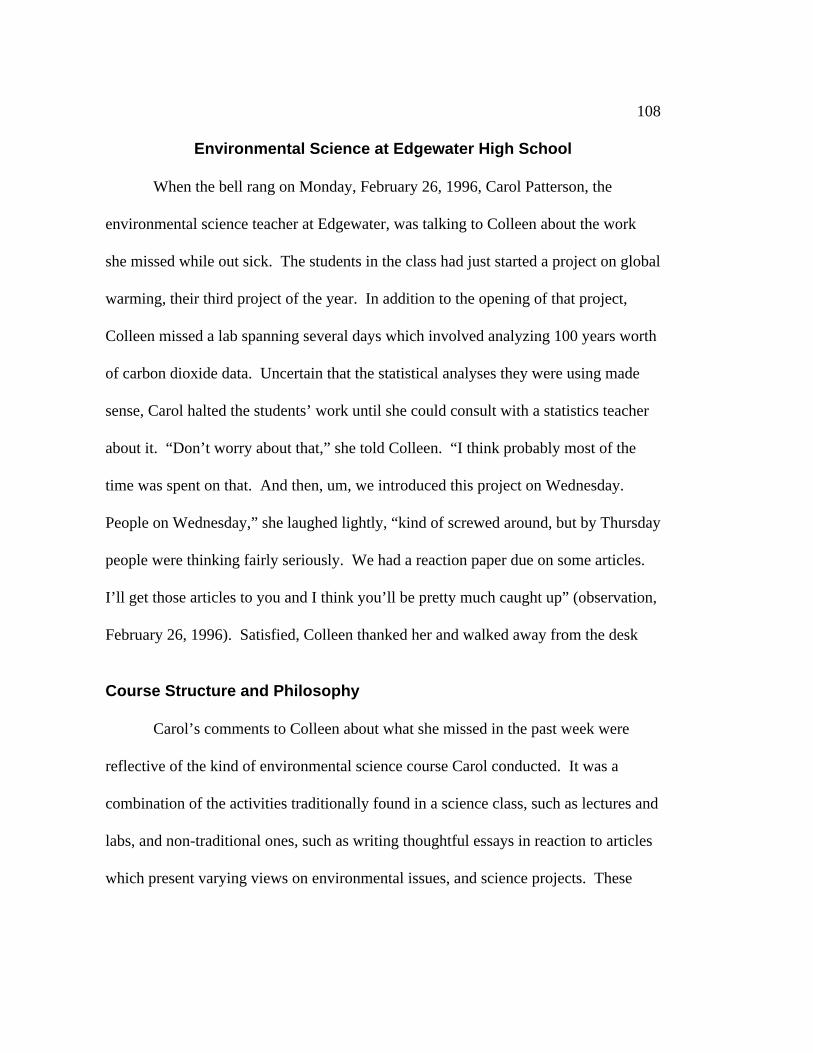
108
Environmental Science at Edgewater High School
When the bell rang on Monday, February 26, 1996, Carol Patterson, the
environmental science teacher at Edgewater, was talking to Colleen about the work
she missed while out sick. The students in the class had just started a project on global
warming, their third project of the year. In addition to the opening of that project,
Colleen missed a lab spanning several days which involved analyzing 100 years worth
of carbon dioxide data. Uncertain that the statistical analyses they were using made
sense, Carol halted the students’ work until she could consult with a statistics teacher
about it. “Don’t worry about that,” she told Colleen. “I think probably most of the
time was spent on that. And then, um, we introduced this project on Wednesday.
People on Wednesday,” she laughed lightly, “kind of screwed around, but by Thursday
people were thinking fairly seriously. We had a reaction paper due on some articles.
I’ll get those articles to you and I think you’ll be pretty much caught up” (observation,
February 26, 1996). Satisfied, Colleen thanked her and walked away from the desk
Course Structure and Philosophy
Carol’s comments to Colleen about what she missed in the past week were
reflective of the kind of environmental science course Carol conducted. It was a
combination of the activities traditionally found in a science class, such as lectures and
labs, and non-traditional ones, such as writing thoughtful essays in reaction to articles
which present varying views on environmental issues, and science projects. These

109
activities were all woven around units that focused on key environmental topics or
debates which were of concern and interest to the students and at the same time central
to the field.
Recognizing that many of her students were as interested (or more interested)
in the social and political implications of environmental issues as in the science behind
them, Carol made environmental decision making the focus of the course. Carol
wanted her students to have enough knowledge of the science behind the arguments of
environmental policy makers to make informed decisions as voters and citizens. As
she explained in an interview, “I feel like already from the beginning that the course
was created for a lot of reasons. Mainly I wanted them to be literate about
environmental issues and be able to talk from two sides of an issue and really be
rational,” (C. Patterson, interview, winter, 1993–94).
The course, which in 1995–96 had only been in existence for four years, had
evolved significantly from the shape it had in the 1992–93 school year. It promised to
evolve even more dramatically the following year when it was to shift from being an
elective course, open to average and above-average science students, to an Advanced
Placement course open only to honors and AP students. While she was already
thinking about what those changes might entail, in 1995–96 Carol was more or less
continuing to conduct class as she did the year before.
Tall, with long blond hair and a sculpted face, Carol was not what students
typically expected in a science teacher and at first they could underestimate her.

110
“When I first saw her,” one student, April,14
said while laughing, “She’s so pretty,
she’s got like blond hair and she’s—You know what I mean? . . . I didn’t think she
was going to be a stickler, you know? And she’s not a stickler, but I mean, she wants
us to do what she wants us to do” (April, interview, February 5, 1996). Another
student, Lorena,15
commented, “She gets down to the point. You know, there’s no
messing around” (Lorena, interview, May 23, 1996). Carol’s combination of warm
compassion and steely backbone created a relaxed, yet productive atmosphere in her
classroom and engendered the respect of many of her students. As April explained,
“When you find a teacher who actually does care, people work so much harder. It’s
kind of like an incentive. The grade’s not the only incentive, it’s like approval” (April,
interview, February 5, 1996). The kind of commitment expressed by April was one
Carol sought for all her students, but often found lacking in many of them. The
varying level of commitment among students who took her class was a key challenge
throughout her efforts to create a strong course in environmental science at Edgewater.
In 1995–96 only one junior was enrolled in her course. The rest were seniors.
Survey responses (n = 14) showed that nearly all of Carol’s students had already taken
both biology (n = 13, 93%) and chemistry (n = 12, 86%) and had enrolled in the class
largely because they were interested in the subject matter (n = 10, 71%). Unlike the
14
April was chosen by Carol to represent a strong student in her course.
15 Lorena was interviewed once as an extra student because of her vocal
participation in the course.

111
students in Roger’s class, very few students mentioned they were avoiding another
subject (n = 3, 21%) or felt they needed to take the course to fulfill some requirement
or improve their transcript (n = 3, 21%). Nonetheless, Carol felt that most of her
students were not particularly strong in science and needed a lot of instructional
support. Survey responses (n = 14) indicated that her students did not see themselves
as likely to become a scientist or major in science at college, and on average they were
not certain they would use science in their careers. They found science mildly
interesting and thought they did fairly well in it; however, they did not think of
themselves as “math persons” or “science persons” (see Table 9).
Table 9. Science Attitudes of Students in Carol Patterson’s Class (n = 14).
Skill Mean Median StdDev
Become a scientist 2.14 1 1.46
Major in science 2.21 1 1.53
Use science in your career 2.57 2.5 1.60
Enjoy your science classes 3.79 3.5 0.89
Do well in your science classes 3.79 4 0.58
Identify as a “math/science person” 2.29 2 1.44
(All questions asked students to respond on a five point likert scale where “1”indicated a highly negative response and “5” indicated a highly positive response.)
Carol worried that the course did not have a serious reputation. She reported
that some of the students told her that “this class has got such a reputation for being a

112
blow-off,” largely because of the strong role that projects play within it. “They think
project work is a piece of cake. And I think it’s so hard, but they just don’t take it
seriously,” she explained (C. Patterson, interview, November 22, 1995). In addition,
she felt that the rating of the course as a “9-level” course (open to 2- and 3-level
students for which they all receive 3-level credit) “scares off a lot of the very capable
3-levels” because “they perceive a 9-level course as something for dummies” (C.
Patterson, interview, March 22, 1996).
Student interviews and survey data echoed Carol’s beliefs that the course was
harder than the students had expected. On a scale of 1 (much easier) to 10 (much
harder), students indicated that the course was somewhat more difficult than they had
expected (n = 15, µ = 6.2, SD = 2.44). One student interviewed said, “I’ve done really
well in this class. I’ve had an A in all four semesters. But it was much more work
than I thought. The projects were much more detailed. . . . So, I don’t think it was a
blow-off class, as people think it is” (Lorena, interview, May 23, 1996).
Carol said that typically the students who took her class had “no tolerance for
ambiguity. They cannot stand not knowing what to do when” (C. Paterson, interview,
September 28, 1995). Carol’s course was structured more traditionally than Roger’s,
partially in response to the needs of her students who did not like ambiguity and
partially because she wanted to ensure they all learned some of the basic concepts in
environmental science. Usually, Carol introduced each major topic through a
combination of videos and assigned readings that represented widely different political

113
and scientific views on each of the central issues of the unit. Students wrote reaction
papers to them and participated in class discussions around them. Then she would
introduce several activities, some short, one- to three-day labs or thought experiments,
others long-term independent or group projects, punctuated by occasional lectures,
readings, and discussion, to explore related scientific concepts in depth. The level of
student control over the design of various long-term labs and science projects varied,
but all were constrained to major issues or topics the class was currently studying.
While some of the topics, labs, activities, project cycles, and articles have
changed over time, this basic curricular structure has remained essentially the same
since 1992–93. In the 1995–96 school year the major topics of study included water
quality, land use management, toxicology and risk assessment, the carbon cycle and
global warming, ozone depletion, plastics, and persistent and hazardous wastes. Like
Roger, Carol believed the students in her course needed background information in an
area before they could successfully engage in project work. She recalled a project on
weather conducted by a substitute teacher when she was on maternity leave in 1993–
94. “I don’t think there was a lot of background on weather. I don’t think there were
like intro lectures or intro videos or anything like that. That was one of the students’
complaints is that they went into it really too cold” (C. Patterson, interview, March 19,
1994). Thus, of the four projects Carol’s students did during the 1995–96 school year,
all but the last one emerged from a specific topical unit.

114
Each project lasted between four and eight weeks. They were conducted one
per quarter in the following order: (1) Create a land use management plan (LUMP) for
a known city (structured group project); (2) assess the risk levels in your diet due to
food additives (structured independent project); (3) explore a topic in global warming
(open group project); and, (4) explore a topic in environmental science (open
independent project). Versions of two projects from Carol’s course, LUMP and
Global Warming, were turned into CoVis Interschool Activities (CIAs), sample
project designs distributed to the more than 100 new teachers that joined CoVis in the
1995–96 school year (Lento, 1995). The CIAs described project ideas along with
other activities that might logically accompany them in a unit, as well as ways to
integrate the use of technology, cross-school collaboration, and telementors into the
project design (Lento, 1995, 1996; Lento, Dharkar, & Gomez, 1999; Lento, O’Neill, &
Gomez, 1998).
Carol’s LUMP design was adapted by the Northwestern staff to include hooks
and supports for cross-school collaboration and telementors. The Global Warming
project cycle and accompanying unit was created by Carol in coordination with
researchers at Northwestern University (Gomez, Gordin, & Carlson, 1999). The
Northwestern researchers had developed visualization software specifically designed
to support students’ investigations of data related to climate change. Carol then helped
design activities for students which would guide the exploration of the data displayed
by the software. The CIA developed from this work linked student projects in Global

115
Warming with a series of “staging” activities that included analysis of several kinds of
climate data and use of the visualization software (Edelson, in press; Gordin, Polman,
& Pea, 1994).
The CIAs were scheduled to “run” at particular times of the year so that the
Northwestern researchers could provide additional support to the teachers attempting
to implement them, broker collaborations between schools, and recruit telementors to
support the work of the students in each participating classroom (Lento et al., 1998).
While teachers could use the project designs and supporting activities during any time
of the year they wished, the extra supports were only provided during set times. Carol
did participate in the two CIAs based on work in her class. While the cross-school
collaboration aspects never seemed to come together for her, she found the use of
telementors during the LUMP project to be very exciting. This was her first
experience with telementors.
The first two projects Carol did in 1995–96 were both fairly structured. While
the students had quite a bit of room to be creative in their LUMPs, Carol did provide
them with fairly firm parameters for the issues they must address in their proposals.
Likewise, the food additives project had a set of clear procedural steps: Keep a food
diary for a week; describe your own eating habits; determine what food additives you
consume regularly; and then research what potential risk factors are involved in each
and determine your personal risk levels. The topics to be covered in the final report
were also clearly specified. Later in the year, as she felt the students had acquired

116
more of the skills necessary to conduct independent research projects, she provided
them the opportunity to do more unstructured project work where they chose their own
topics and designed their own investigations. The Global Warming project needed to
be on a topic related to issues in global warming, but both the specific focus and the
kind of study they would do were at the students’ discretion. (See the list of suggested
project topics Carol provided them in Appendix H.) For their spring independent
project they could study any topic in environmental science. During these open
projects, Carol encouraged students to do work similar to that of the students in
Roger’s class—scientific investigations in which the collection and analysis of data to
reach a conclusion served as the core activity. However, many of her students
proposed, and she accepted, projects more reflective of a literature review or policy
statement. In these projects, students typically synthesized and integrated what was
already known about a particular environmental concern, often concluding with a
proposal or plan of action. She still encouraged her students to grapple with data in
some fashion to support their arguments even if they were not doing a scientific
investigation per se. For example, her instructions for the Global Warming project
(see appendix H) state:
Whatever your topic, you must be able to show that you canrealistically collect and analyze data to support your thesis. Thisdoes not mean you have to produce a traditional science project. Aslong as you collect, organize and analyze data and draw reasonableconclusions based on research and your own findings, I will considerthat to be a scientific endeavor regardless of the topic.

117
The Assessment Infrastructure
Despite differences in each of these projects, both in their focus and the
amount of structure provided for them, there were some basic similarities in the
assessment infrastructures that supported them. For both of the open-ended projects,
Carol had students submit a proposal early on in the project cycle. Students also
submitted a written and/or formal verbal progress reports two or three times during the
project cycle. All four projects required a final written paper of some kind, and all but
one, the food additives project, required a presentation. Finally, Carol included a
“participation” grade each semester that incorporated a number of aspects of the
students’ classroom performance into their grade such as appropriate use of class time
or working relations with their project team. Likewise, she included an “individual”
or “personal” component to each of the group project grades.
Proposals
Whenever students did an open-ended project, Carol required that they submit
a written proposal early in the project cycle. Usually the proposals were short, no
more than a paragraph, and were meant to enable Carol to give the students feedback
on whether their basic question and plan were both rich enough and reasonable given
time and resource constraints. Students sent them to Carol via e-mail or handed them
to her on paper. After receiving the proposals she would write comments and then
have a substantive meeting with each group. Proposals that were inadequate were

118
passed back to the students for rewriting until they were acceptable. The fourth-
quarter open-ended project was the only one for which the proposal received an
explicit grade. For the other projects, the proposals were merely checked off as
complete and did not enter into either the quarter’s or semester’s grade calculations.
Progress Reports
During the course of each project cycle, Carol would ask students to submit a
written progress report and/or have a formal “touch-base” day where she met with
each individual or project team to discuss their progress. “It wasn’t uniform across the
board. If I had a really lengthy verbal session, I didn’t really need to see it in writing,
but that meant some other groups didn’t get quite as much time with me, so I really
wanted them to document their progress [in writing] so I would know” (C. Patterson,
interview, November 22, 1995). She was always open to providing advice and
answering questions during any of the open days scheduled for project work.
However, to make certain she knew how each group was progressing, she was careful
to schedule formal times to meet one to three times during the cycle. One student,
John,16
described the progress reports as follows:
She basically said, “All right, tomorrow I’m going to be checkingeverybody’s work.” . . . She went around to everybody and they saideither, “I’m behind,” “I’m ahead of the work,” “I’m stumped on this.” And she also had us pull out an interesting fact that we had found aboutsome of the food or the pesticides or something like that. So she’d
16
John was chosen as representative of a student who was trying hard andsucceeding in an average or just below average fashion.

119
come around and she’d check up on us and she’d take notes and seehow we were doing. So you can tell that she was thinking about us andwanted to know how the projects were coming (John, interview,February 9, 1996).
Progress reports held during the structured projects of the fall, LUMP and
Food Additives, were graded and given a weight equivalent to that of a homework
assignment or short lab in the final quarter and semester grade calculations. However,
during the open-ended project cycles of the spring, Global Warming and the
Independent Project, Carol conducted verbal progress reports with the students which
she simply checked off as having been completed rather than grading them.
Final Papers
All four of the projects required a final paper that constituted the bulk of the
student’s project grade. For the LUMP and the Food Additives projects the paper
specifications were described in detail and all the topics that students should cover in
the course of their paper were listed. The directions for the other two papers were less
specific and focused more on the form of the final paper, much in the way Roger’s
paper format description did, rather than the content of them. Students usually
received their grades broken down into points assigned to various subsections of the
paper. These differed based on the structure of the paper required for each project.
Students turned in paper drafts for the open-ended projects, for which they received
detailed comments. When the state of their drafts concerned Carol, she made time to
meet with the group. For example, after seeing their draft she told one group, “This

120
will fail.” She was frustrated with the lack of thoroughness in their work, so she “was
trying to be very firm because, you know, I was bound and determined to make them
work” (C. Patterson, interview, April 12, 1996). Students did not get their papers back
until after the presentations were completed (if there were presentations for that
project).
Presentations
Students made presentations for three of the four projects during the year. The
rest of the students were given an evaluation form to fill out while viewing the other
students projects. These forms changed throughout the year and, as in Roger’s class,
were meant to focus the attention of the students in the audience on salient features of
the presentation. Sometimes they asked students to write comments based on several
questions about the presentation (e.g., “Were topic questions researched thoroughly in
your opinion?” or “Identify at least three things you learned from this presentation.”);
at other times they asked students to circle a “yes” or “no” response to a series of
statements (e.g., “This group defined a specific question which drove their research.
Yes. No.”). Always they asked for the students to give the presenter(s) an overall
rating for the presentation as a whole on a scale of 1 to 10. While Carol reviewed the
students’ comments and sometimes summarized them for the presenting group, the
grade the group received for its presentation was based on her own assessment of it.

121
Carol was generally looking for three things in the students’ presentations.
First, she wanted to know if they defined their question and terms well. “That’s part
of why I have them give it in class rather than just to me, because I know these terms,
but their classmates don’t, so of course we need to define things,” she explained (C.
Patterson, interview, June 13, 1995). Second, she looked to see if they explained their
study logically. And finally, she looked for whether they supported their assertions
with evidence.
Personal Grades
A small portion of every student’s grade each semester, as well as a piece of
their grade for each group project, consisted of what Carol referred to as the student’s
“individual” or “personal” grade. As she explained, “I really believe in educating the
whole person. I really feel there are some things that need attention that a test doesn’t
address or even the project doesn’t address (C. Paterson, interview, March 10, 1994).”
This grade was used for a variety of sometimes conflicting purposes, so Carol often
referred to it in her interviews as a “fudge factor.” Primarily, it reflected Carol’s
beliefs about how well the student worked with others in the class, his or her attitudes
towards the class, the student’s level of effort and participation in course work and
discussion, and whether or not he or she demonstrated a significant level of creativity,
persistence, or initiative. In essence, the personal grade served as a way to reward

122
students for attitudes and modes of work that Carol valued, but which were not easily
captured through the evaluation of tests and final products such as project papers.
In addition, she used personal grades to compensate students when she felt
their poor project or class performance was due to extraneous circumstances. For
example, she explained in one interview that in addition to their group grade for the
final project, students “also [receive] an individual grade so that if there are students
that are really concerned that they’re working very hard and they’re going to get a
terrible grade because the rest of the group is just really uncooperative, they’ll get an
individual grade that’s a lot higher” (C. Patterson, interview, March 10, 1994). She
also used students’ personal grades to compensate for situations in which she believes
the instructional format did not fit the student’s learning style. For example, in one
interview Carol described a very capable student in her class who did not do well with
project work: “I’ve got one that’s in AP physics. She’s a great student. She’s very
active in environmental issues and she just totally turns off on projects. She does a
terrible job. She doesn’t care. Her attitude really stinks” (C. Patterson, interview,
March 10, 1994). Her poor attitude would usually result in a low “personal grade” for
either the project, the quarter, or both. Yet Carol actually gave this student a high
personal grade because “I feel like, in that way, I make allowances for people like that
who really hate projects. It just doesn’t fit their learning style and I don’t feel like I
should penalize them because it doesn’t fit” (C. Patterson, interview, March 10, 1994).
123
Generally, Carol’s personal grades were based upon her own observations.
Early on in the course, she attempted to have students keep a log accounting for their
use of class time, but like Roger, found such logs to be inaccurate: “I know that a lot
of what I saw was bogus on the logs because I know, and I was there every day and I
saw that most of them weren’t doing anything” (C. Patterson, interview, March 10,
1994). Thereafter, she relied upon her own subjective evaluations of how well the
students were working in class. Initially, they were based on her memory alone, but
after a while she began keeping a journal of her reflections on the course and the
students’ work. This journal took the form of a “yellow pad” of paper that she carried
everywhere with her. It became a ubiquitous part of her teaching practice by 1995–96,
such that although they were not asked about it explicitly, all the students interviewed
in her class mentioned the notes she took on her yellow pad as being part of the way
they were graded. Carol’s note-taking practice was an open one. A review of one of
these notebooks showed that it contained a rag tag set of notes on plans for the course,
observations on the progress of individual students or groups, reminders to find
particular resources for students and sidebars about tasks in her personal life that
needed attending (grocery lists, notes to call the tax preparer, etc.) Despite the lack of
systematicity, Carol found the very act of taking notes helped her become more
consistent and less swayed by personalities in her decisions about students’ personal
grades. In particular, she said the notes meant that she couldn’t let students she liked

124
get away with murder, and that they made her give credit to students she didn’t like
much, yet were doing good work (paraphrase from interview notes, May 10, 1994).
Non-Project Grades
In contrast to Roger’s assessment infrastructure, there was usually a substantial
non-project portion to Carol’s grades. The other assignments and work she graded
included reaction papers to sets of readings from different perspectives on the same
environmental issue, labs and activities done in class, homework, short presentations
on current events in the environment taken from the news, and tests and quizzes.
Carol gave a quiz or test for each topic studied during the year and usually
gave final exams each semester. In 1995–96, however, she did not give a final exam
for either semester. All four students interviewed mentioned that “her tests are real
tricky” or difficult (John, interview, February 9, 1996).
Her multiple choice tests are very difficult. They are the format thatmultiple choice are supposed to be, but because most teachers don’t dothat, you become used to the way that it is. . . . [She’ll] give you theanswer, the answer that is similar to that answer but is not the bestanswer, and the answer that is not right, and you have to choose. And Ithink a lot of kids don’t understand the exact answer, they’ll only getthe gist of the answer, its really hard. At least for me (Lorena,interview, May 23, 1996).
Students also noted that often both the multiple-choice and essay components
of her tests and quizzes were based on information that came out in discussions and
were not necessarily part of their readings or the notes she put on the board. “It’s not
like you can memorize the notes. It’s more like you have to take what you can

125
remember. So just pay attention to everything,” one student advised (April, interview,
April 10, 1996). Therefore, it is not surprising that in 1995–96 the class attempted and
succeeded in negotiating with Carol to have extra requirements added to their food
additives project instead of a first semester final. Carol did not administer a final for
the second semester because a large portion of the seniors in her class were conducting
a “senior project” for the last month of the year which meant they were not present in
their regular classes, including environmental science.
Communicating about Grades
Whenever Carol handed back tests or major assignments, she usually discussed
in general how the class performed and what some of her overall concerns or
suggestions were. For minor assignments, such as reaction papers, she simply
returned the work and let her written comments suffice. At the end of the quarter, she
gave to each student a printout of his or her performance as recorded in her grading
software. She did not provide the students with summaries of their grades until the
end of the quarter, though she may have calculated them midway through the quarter
in order to make LoSco decisions.
Weighting and Grade Calculation System
Carol, unlike Roger, uses a piece of commercial software to calculate her
grades rather than building her own spreadsheet. The software worked well with the
kind of grading Carol did—a simple and commonly used point system in which

126
students’ grades are determined by the percentage of total possible points they earned
for the various pieces of work they did during the marking period. Each artifact or
behavior Carol graded was worth a certain number of points. Instead of using Roger’s
technique of putting all graded artifacts on a single scale (100 percentage points) and
then explicitly specifying weights during the calculation process, Carol let the amount
of points given to each artifact or behavior determine its weight within the final grade.
The software Carol used added up the number of points each student had received for
every graded item and divided that sum by the total possible in order to calculate an
overall percentage for the course. The software included functions for curving grades
and for calculating extra credit. Carol did not use the curving functions, though she
did specify that some of the grades were extra credit and therefore only included in the
“total possible” if the student did the extra credit activity. Students usually received
full points for any extra credit work they did.
The software made it possible to divide the graded items into categories.
Carol’s categories typically included: homework, activities, labs, tests and quizzes,
projects, and miscellaneous nice things. Items in the “miscellaneous nice things”
category were “extra credit” work or behavior. Carol did not make much of a
distinction between the first and second quarter in her grading work. Roger always
calculated the semester grade by averaging the two quarter grades. Carol on the other
hand organized her gradebook by the semester and did not distinguish work by
quarter.

127
In 1995–96 project work accounted for 61% of the students’ first semester
grades and 48% of their second semester grades (see Figure 6). Labs and activities
accounted for 17% of the first semester grade and 23% for the second semester. Tests
and quizzes made up 15% of the first semester grade and 21% of the second semester
grades. Homework, reaction papers, and environmental news presentations accounted
for only 6% to 7% of students’ grades each semester. Class participation accounted
for 3% of the second semester grade, but was part of extra credit for the first semester
grade. (See Appendix F for a complete list of what Carol graded and how much each
item was weighted.)
0%
10%
20%30%
40%
50%
60%70%
80%
90%100%
First
semester
Second
semester
Participation
Homework, reaction
papers &
environmental news
Tests and quizes
Activities and labs
Projects
Per
cent
age
of s
emes
ter
grad
e
Figure 6. Breakdown of grades in Carol Patterson’s class
128
Relationship between Assessment and Pedagogy
As the description above has shown, the driving goal behind Carol Patterson’s
course and assessment infrastructure designs was that students become literate and
critical consumers of scientific information related to environmental issues. Her
course was designed to teach students about environmental science by engaging them
in the exploration of key environmental controversies. Her first goal was for students
to understand the essential arguments on each side of the environmental debates being
studied, the evidence used to support them, and the environmental mechanisms and
processes related to them. Her second goal was that each student learn to take a
reasoned stance on any given environmental debate and support their arguments with
scientific evidence. Carol designed her course with a mixture of traditional activities,
classroom discussion, and project work to meet these goals.
The purpose of the traditional activities and the assessment components which
supported them was to ensure that all the students in the course understood the
essential arguments on each side of the environmental debates being studied, the
evidence used to support them, and the environmental mechanisms and processes
related to them. Worksheets and write-ups completed as a part of labs and activities,
and homework in the form of reaction papers to position articles and review questions
associated with textbook chapters, were graded in part so that students would take the
completion of their associated activities seriously. Along with the tests and quizzes,
they were meant to encourage students to study the concepts and processes conveyed
129
through the lectures, discussions, readings, labs, and activities, and to evaluate their
command of those materials. When evaluations of tests, lab write-ups, reaction
papers, and homework indicated that the students’ understanding was thin, she then
introduced additional instructional activities to review, deepen or solidify their
knowledge and comprehension.
The purpose of the project activities and the assessment components which
supported them was to deepen students’ engagement in the controversies being studied
and to give them experience using scientific data to support their arguments. In order
to do so successfully, students needed to learn how to choose appropriate questions to
investigate, use data to support their arguments, and work together productively in a
project team. Despite differences in the specific purpose and shape of each project
cycle, these common needs meant that there was a consistency to the assessment
infrastructure which supported them. Proposals, “touch-base” days, and paper drafts
made it possible for Carol to provide the students with feedback on their project
designs and progress. Personal grades made it possible for her to encourage
purposeful classroom activity and reward students for active participation in classroom
discussion. Finally, papers and presentations gave students practice supporting their
position with evidence and Carol the opportunity to critique their efforts. In sum,
assessment in Carol’s class was meant to support and evaluate students’ acquisition of
central concepts in the field of environmental science as well as their ability to make
and support positions on key controversies.

130
Science, Technology, and Societyat Lakeside High School
Gary and Karen made a few announcements at the beginning of class on
Tuesday, February 27, 1996, before getting the students ready to go to the school’s
central computer lab for the rest of class. The drafts of the web pages on topics in
energy and the environment were due that day, and nearly all had some final work to
do. Gary needed to speak briefly with the handful of students who were going to take
the class’s web pages and do the HTML programming necessary to link them all
together. Gary called over the low noise of the shuffling students, “Who’s doing
Netscape programming again?” Those who were gathered near Gary and he asked,
“Has anyone had experience with HTML editors? At all? Nobody?” In the midst of
their silence, one of the female students asked, “What about tomorrow with the
workshop? Is that guy coming tomorrow?” With this student’s question, Gary
realized that for those students who both want to go to the next day’s workshop and
learn how to do HTML programming, the schedule as it currently stood contained a
conflict. Because of the class’s rather unique format of seminar style workshops
combined with open research time, such conflicts, though irritating, were not
uncommon (classroom observation, February 27, 1996).
Course Structure and Philosophy
Gary Magi’s focal instructional goal was for his students to think deeply about
the ramifications of the technological and scientific advancements of our age upon the
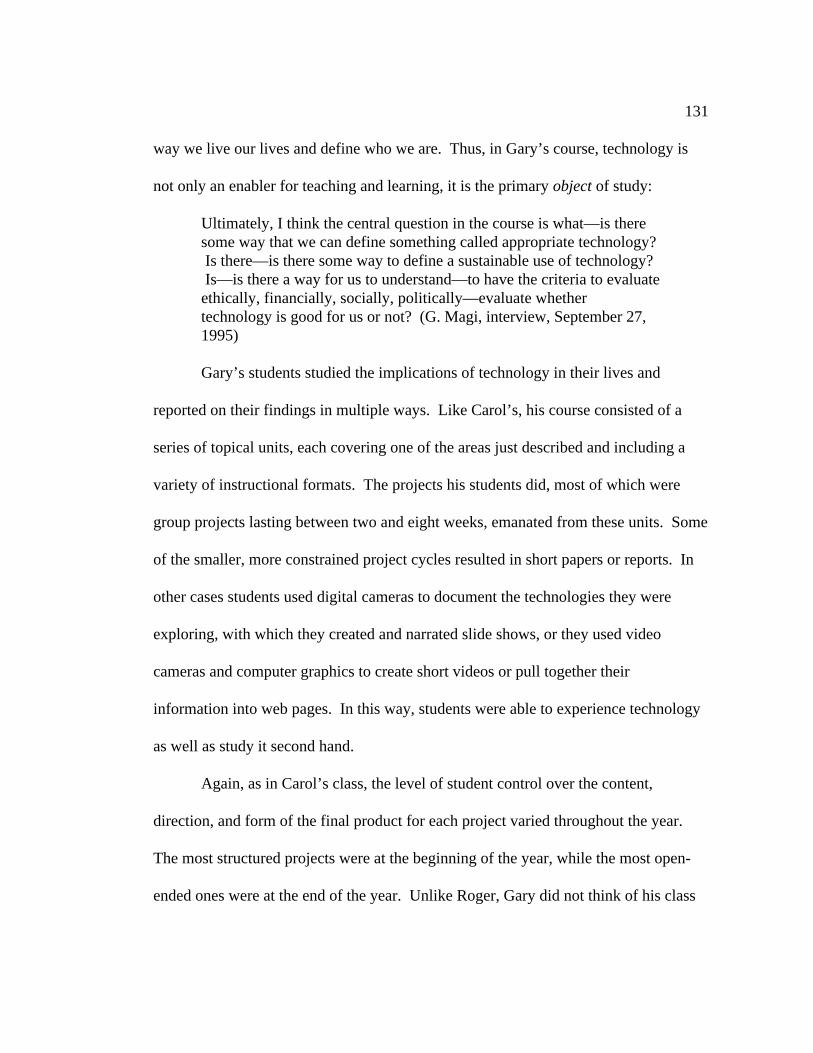
131
way we live our lives and define who we are. Thus, in Gary’s course, technology is
not only an enabler for teaching and learning, it is the primary object of study:
Ultimately, I think the central question in the course is what—is theresome way that we can define something called appropriate technology? Is there—is there some way to define a sustainable use of technology? Is—is there a way for us to understand—to have the criteria to evaluateethically, financially, socially, politically—evaluate whethertechnology is good for us or not? (G. Magi, interview, September 27,1995)
Gary’s students studied the implications of technology in their lives and
reported on their findings in multiple ways. Like Carol’s, his course consisted of a
series of topical units, each covering one of the areas just described and including a
variety of instructional formats. The projects his students did, most of which were
group projects lasting between two and eight weeks, emanated from these units. Some
of the smaller, more constrained project cycles resulted in short papers or reports. In
other cases students used digital cameras to document the technologies they were
exploring, with which they created and narrated slide shows, or they used video
cameras and computer graphics to create short videos or pull together their
information into web pages. In this way, students were able to experience technology
as well as study it second hand.
Again, as in Carol’s class, the level of student control over the content,
direction, and form of the final product for each project varied throughout the year.
The most structured projects were at the beginning of the year, while the most open-
ended ones were at the end of the year. Unlike Roger, Gary did not think of his class

132
as focusing on helping students to learn how to do science—at least not natural
science. He said, “We’re not doing much of what scientists do. If you brought in the
world of scientists to include people who study humans and what they do, and
machines and what they do, then we’re doing a lot of it” (G. Magi, interview,
September 27, 1995). He did believe learning specific scientific concepts were an
important goal in his course. However, unlike Carol, he was less interested in their
acquisition of such knowledge as an end in and of itself. Instead, he was more
concerned that students have the background knowledge that would enable them to
reflect upon and discuss the impact of science and technology on human lives. The
topics of his projects reflected this focus.
The projects in 1995–96 included: (1) a report documenting in detail the
infrastructures of each student’s home (a short, very structured, independent project);
(2) a video describing the mechanisms and functions of a major infrastructure within
the school or world at large (a long, semi-structured, group project); (3) an essay
describing how information technologies affect the life of an adult whom the students
shadowed in their work place (a short, structured, independent project); (4) a web page
summarizing an issue related to energy and the environment (a short, semi-structured,
group project); and (5) a paper, video, or web page on a topic or issue related to one of
a variety of fields in science and technology including medicine, warfare, mass media,
nanotechnology, ubiquitous computing, and the Luddite and Neo-Luddite movements
(a long, open, group/individual project).
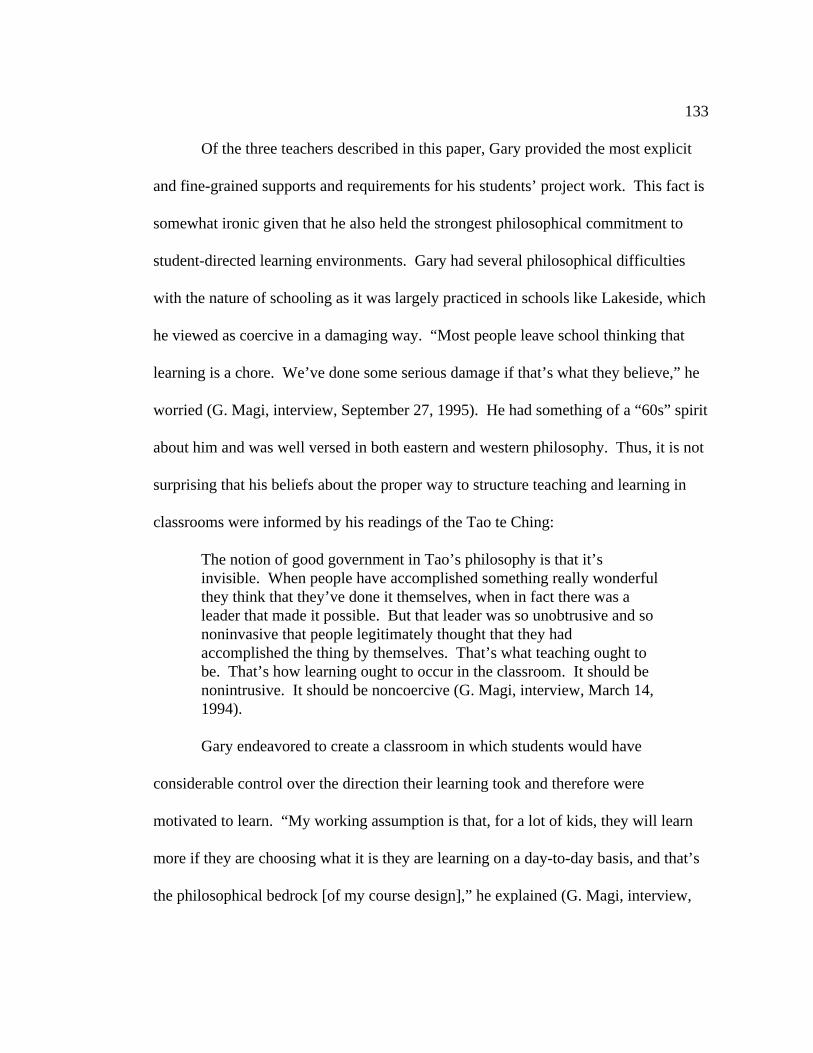
133
Of the three teachers described in this paper, Gary provided the most explicit
and fine-grained supports and requirements for his students’ project work. This fact is
somewhat ironic given that he also held the strongest philosophical commitment to
student-directed learning environments. Gary had several philosophical difficulties
with the nature of schooling as it was largely practiced in schools like Lakeside, which
he viewed as coercive in a damaging way. “Most people leave school thinking that
learning is a chore. We’ve done some serious damage if that’s what they believe,” he
worried (G. Magi, interview, September 27, 1995). He had something of a “60s” spirit
about him and was well versed in both eastern and western philosophy. Thus, it is not
surprising that his beliefs about the proper way to structure teaching and learning in
classrooms were informed by his readings of the Tao te Ching:
The notion of good government in Tao’s philosophy is that it’sinvisible. When people have accomplished something really wonderfulthey think that they’ve done it themselves, when in fact there was aleader that made it possible. But that leader was so unobtrusive and sononinvasive that people legitimately thought that they hadaccomplished the thing by themselves. That’s what teaching ought tobe. That’s how learning ought to occur in the classroom. It should benonintrusive. It should be noncoercive (G. Magi, interview, March 14,1994).
Gary endeavored to create a classroom in which students would have
considerable control over the direction their learning took and therefore were
motivated to learn. “My working assumption is that, for a lot of kids, they will learn
more if they are choosing what it is they are learning on a day-to-day basis, and that’s
the philosophical bedrock [of my course design],” he explained (G. Magi, interview,

134
June 1, 1995). He saw projects as a way of providing students with control over their
learning. However, he also recognized that many of his students were unprepared to
handle the level of autonomy he hoped to provide for them in his course. “The kind of
open-ended research that we’re talking about here, where they have to figure out how
to direct themselves, let alone define their goals—What is it that they want to do?—is
an alien experience for a lot of kids, and too much freedom, too quickly, is
paralyzing,” he explained (G. Magi, interview, June 1, 1995). By the end of the 1994–
95 school year, he had decided that he needed to provide the students with significant
structure and supports for doing their work which, depending on the project, might
include supplying guidelines or restrictions for the topic or question they were to
explore, the procedures they would use to explore it, the format of the final product,
and/or the kind of data collection and analysis they would do in the course of their
research. His challenge was to create these supports while at the same time
maintaining what he considered an appropriate relationship between the teacher and
student such that the students felt in charge of their learning and had room to explore
their own interests.
Moreover, there were specific concepts he felt all his students should
understand—basic knowledge that he felt would enable the students to be more
thoughtful in their discussions of the issues surrounding science, technology, and
society. Projects are time consuming, especially when new presentation formats, such
as video, are being used. Gary noted in early years of STS that as much as a third of
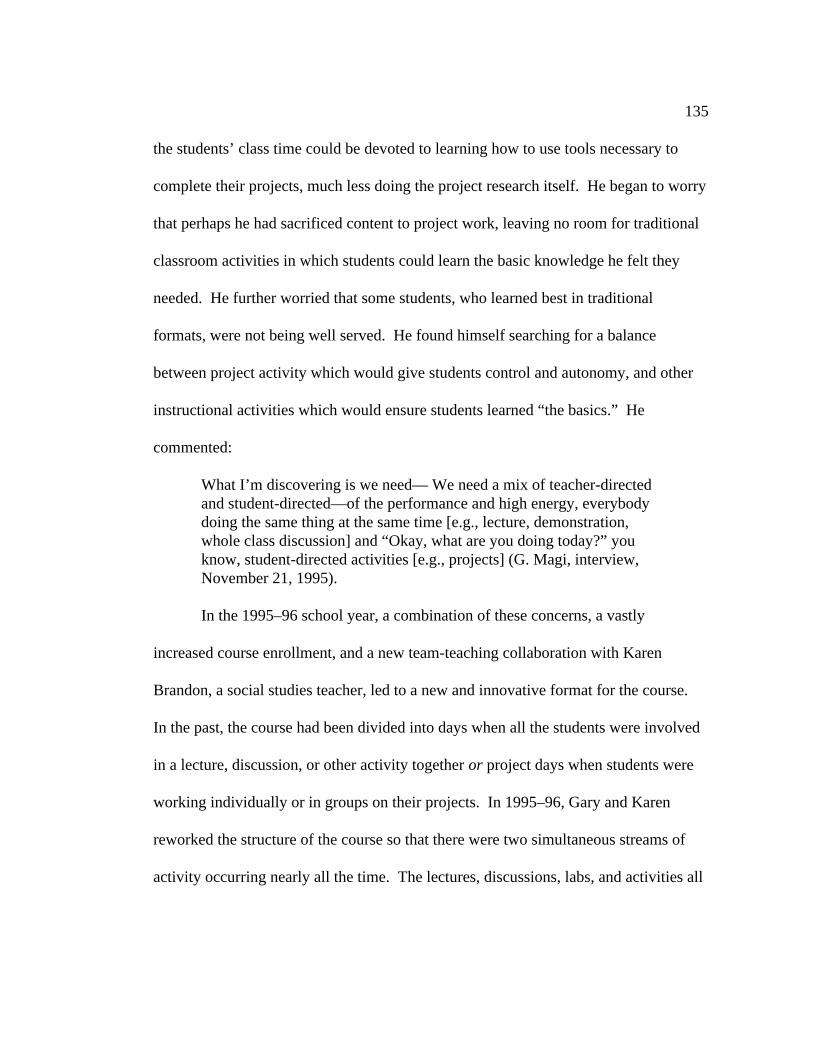
135
the students’ class time could be devoted to learning how to use tools necessary to
complete their projects, much less doing the project research itself. He began to worry
that perhaps he had sacrificed content to project work, leaving no room for traditional
classroom activities in which students could learn the basic knowledge he felt they
needed. He further worried that some students, who learned best in traditional
formats, were not being well served. He found himself searching for a balance
between project activity which would give students control and autonomy, and other
instructional activities which would ensure students learned “the basics.” He
commented:
What I’m discovering is we need— We need a mix of teacher-directedand student-directed—of the performance and high energy, everybodydoing the same thing at the same time [e.g., lecture, demonstration,whole class discussion] and “Okay, what are you doing today?” youknow, student-directed activities [e.g., projects] (G. Magi, interview,November 21, 1995).
In the 1995–96 school year, a combination of these concerns, a vastly
increased course enrollment, and a new team-teaching collaboration with Karen
Brandon, a social studies teacher, led to a new and innovative format for the course.
In the past, the course had been divided into days when all the students were involved
in a lecture, discussion, or other activity together or project days when students were
working individually or in groups on their projects. In 1995–96, Gary and Karen
reworked the structure of the course so that there were two simultaneous streams of
activity occurring nearly all the time. The lectures, discussions, labs, and activities all
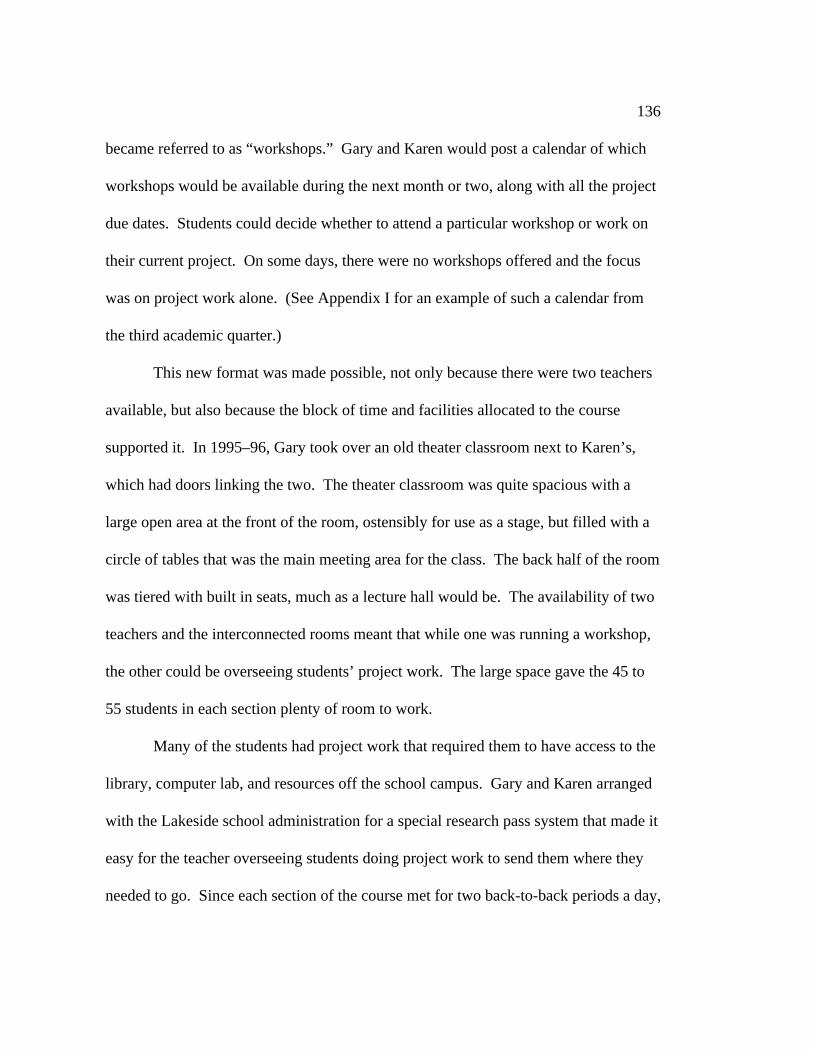
136
became referred to as “workshops.” Gary and Karen would post a calendar of which
workshops would be available during the next month or two, along with all the project
due dates. Students could decide whether to attend a particular workshop or work on
their current project. On some days, there were no workshops offered and the focus
was on project work alone. (See Appendix I for an example of such a calendar from
the third academic quarter.)
This new format was made possible, not only because there were two teachers
available, but also because the block of time and facilities allocated to the course
supported it. In 1995–96, Gary took over an old theater classroom next to Karen’s,
which had doors linking the two. The theater classroom was quite spacious with a
large open area at the front of the room, ostensibly for use as a stage, but filled with a
circle of tables that was the main meeting area for the class. The back half of the room
was tiered with built in seats, much as a lecture hall would be. The availability of two
teachers and the interconnected rooms meant that while one was running a workshop,
the other could be overseeing students’ project work. The large space gave the 45 to
55 students in each section plenty of room to work.
Many of the students had project work that required them to have access to the
library, computer lab, and resources off the school campus. Gary and Karen arranged
with the Lakeside school administration for a special research pass system that made it
easy for the teacher overseeing students doing project work to send them where they
needed to go. Since each section of the course met for two back-to-back periods a day,
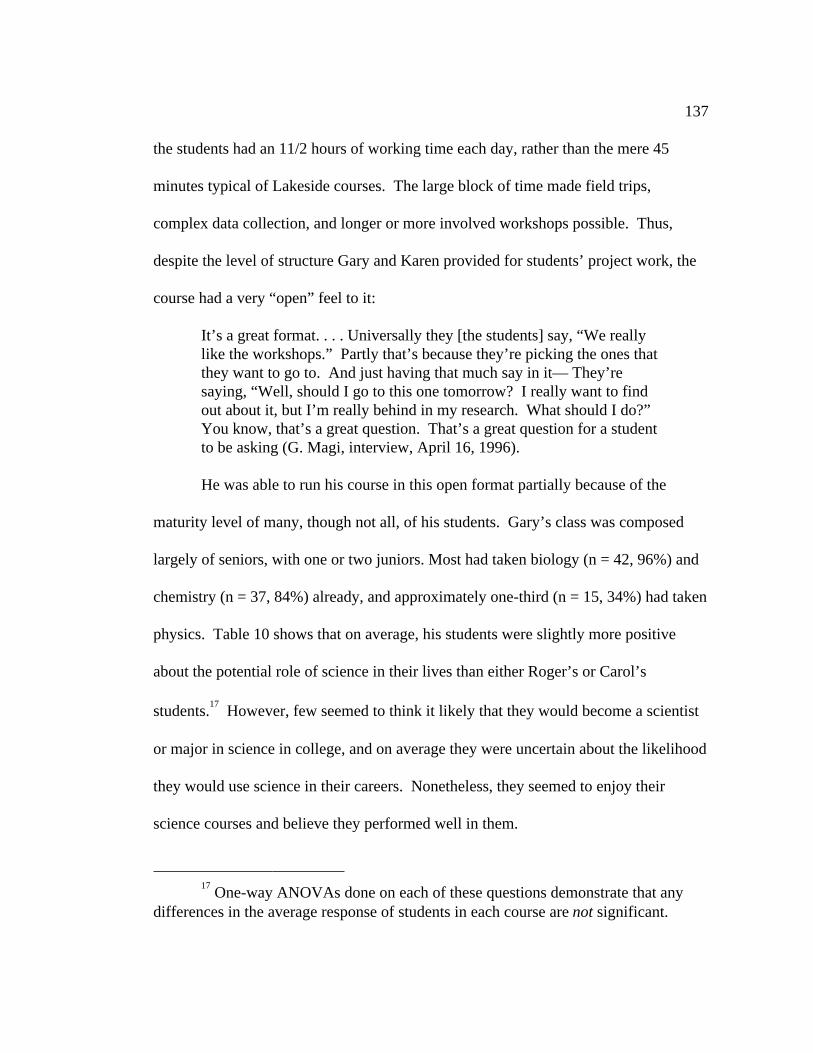
137
the students had an 11/2 hours of working time each day, rather than the mere 45
minutes typical of Lakeside courses. The large block of time made field trips,
complex data collection, and longer or more involved workshops possible. Thus,
despite the level of structure Gary and Karen provided for students’ project work, the
course had a very “open” feel to it:
It’s a great format. . . . Universally they [the students] say, “We reallylike the workshops.” Partly that’s because they’re picking the ones thatthey want to go to. And just having that much say in it— They’resaying, “Well, should I go to this one tomorrow? I really want to findout about it, but I’m really behind in my research. What should I do?” You know, that’s a great question. That’s a great question for a studentto be asking (G. Magi, interview, April 16, 1996).
He was able to run his course in this open format partially because of the
maturity level of many, though not all, of his students. Gary’s class was composed
largely of seniors, with one or two juniors. Most had taken biology (n = 42, 96%) and
chemistry (n = 37, 84%) already, and approximately one-third (n = 15, 34%) had taken
physics. Table 10 shows that on average, his students were slightly more positive
about the potential role of science in their lives than either Roger’s or Carol’s
students.17
However, few seemed to think it likely that they would become a scientist
or major in science in college, and on average they were uncertain about the likelihood
they would use science in their careers. Nonetheless, they seemed to enjoy their
science courses and believe they performed well in them.
17
One-way ANOVAs done on each of these questions demonstrate that anydifferences in the average response of students in each course are not significant.
138
Table 10. Science Attitudes of Students in Gary Magi’s Class (n = 36).
Skill Mean Median StdDev
Become a scientist 2.28 2 1.14
Major in science 2.42 2 1.56
Use science in your career 2.94 3 1.58
Enjoy your science classes 3.38 4 1.52
Do well in your science classes 3.43 4 1.54
Identify as a “math/science person” 3.22 3 1.55
(All questions asked students to respond on a five point likert scale where “1”indicated a highly negative response and “5” indicated a highly positive response.)
The enrollment in 1995–96 (98 students) was up dramatically from the
previous year (26 students) due to Gary’s own efforts at recruiting students for the
course. Survey responses (n = 47) to the open-ended question, “Why did you take this
class,” suggest that many of the students were drawn to the course by Gary’s
descriptions of its subject matter (n = 23, 52%) and its unusual instructional format
(n = 23, 52%). A few felt they “needed” to take the course to fulfill graduation
requirements18
(n = 8, 17%), thought it would be fun (n = 7, 16%), or were interested
in the opportunities it would provide to learn to use technology (n = 4, 9%).
Interviews also showed that at least some portion of the students thought that Gary’s
description of the focus on project work, use of holistic grading, and lack of formal
18
Students enrolled in STS received credit for two courses and fulfilled threegraduation requirements—science, history, and practical arts.

139
exams meant there would be no homework. One student said he took the course
because there were “no tests and no homework, but also because I needed a history
credit,” and who felt that many others took it because “It sounds like it’s going to
teach you something different. Many people went in the class with expectations of it
being easy and a blow-off class. I think that’s why most of the people took it,” (Joe,
interview, May 28, 1996).
Gary noted in his interviews that the attitudes of the students in the course
ranged between those who were dedicated and enthused to those who were
disinterested, cynical, and disenfranchised. In 1995–96, as in other years, he had a
significant number of students drop the course at the end of the semester. Some of
these students were frustrated with the unusual format or a heavier work load than they
had expected. Student responses on surveys indicated that the course was more
challenging than they had expected (µ = 7.0, SD = 2.4299, n = 44, scale of 1 to 10,
where 1 means much easier than expected and 10 means much harder than expected).
Others simply discovered that the course was not as they expected it to be (µ = 7.5,
SD = 2.214, n = 44, scale of 1 to 10, where 1 means exactly as expected and 10 means
very different than expected). As one student put it:
It sounded like a fun class. It really sounded exciting, and that’s why Itook it in the first place. It sounded like the type of class where you’dactually get to learn something, and learn it by yourself. You’d bemotivated to do the work. . . . We do everything they say in thepamphlet [Lakeside course guide], but it’s not as great as it sounds inreality” (Thomas, interview, May 17, 1996).

140
Others found it to be exactly what they had expected and hoped for. “I would
recommend taking this class. I think it’s an experience. And I—and I like learning
with projects. That’s one of the reasons why I took this class” (Peggy Sue, interview,
May 2, 1996).
The Assessment Infrastructure
Much of the confusion and anger that came from some of the students was
because they had difficulty interpreting the connection between Gary’s open and
student-centered philosophy for both pedagogy and assessment, and the structured
nature of the projects and assessment infrastructure he put into place. As one student
explained:
. . . binders counting as so much of our grades. It’s trying to teach usgood research habits. But at the same time, we end up doing theresearch and then not using it. Or doing the research just to do theresearch. And the whole point of his class—that he wanted us to dothings to actually learn. He wanted us to do things in order to haveself-directed learning. And instead we were just doing everythingbecause we knew we needed to get a good grade. And that’s not whathe wanted us to do. He grades us on motivation. And that part, itshould be the most important part of a class that’s self-directed. But itdoesn’t end up being that way, because it’s not self-directed. Mr. Magiis lying to himself (Guido, interview, May 28, 1996).
Just as he wanted to avoid coercion in teaching, Gary wanted to avoid the
coercive nature of assessment. “Just the act of assessing is coercion. ‘Have you done
this yet?’ That’s a coercive statement. And so, if I’m philosophically opposed to
coercion, that raises a very tough question about what the hell assessment is for. What
141
good is it?” (G. Magi, interview, March 14, 1994). His answer early on was to create
“a dialog between teacher and student,” one which was “as informative to the student
as it was to the teacher if it [was] done right” (G. Magi, interview, March 14, 1994).
To this end, he used a holistic form of grading which is somewhat unusual in high
school science courses. He hoped that by reducing focus on the point values and
marking systems generally associated with grades, he might be able to direct students’
attention toward consideration of the substance and quality of their work. The goal
was a not an easy one to meet. Gary’s attempts at using a holistic grading scheme to
meet this goal, while at the same time supporting and encouraging quality project
work, are explored in depth in the following subsections.
Holistic Grading Scheme and Communicating about Grades
Gary did not assign points for every piece of work students did and calculate a
grade. Rather, early in STS’s history he asked each student to rate his or her
performance in several categories on a 3-point scale (Excellent, Satisfactory, and
Unsatisfactory). Then he met with the student and discussed the student’s own ratings
in comparison to his, and in the end together they assigned a grade. He wanted to
delay the “official” grading process as long as possible in order to focus the students’
attention on what they were learning, not on their grades. “Ultimately, I have to put a
letter down on a piece of paper somewhere and fill in a little bubble that says, ‘This is

142
a C-’ or ‘this is an A,’ but that’s the least of my worries. That should be the last thing
on anybody’s mind,” he asserted (G. Magi, interview, March 14, 1994).
However, by the middle of the 1995–96 school year, he was finding this
system difficult to manage for a number of reasons. First, his team-teacher, Karen,
was more traditional than he and needed more methodical practices in order to feel
consistent about their grading. Second, with more than 40 students in a section, it
became difficult to find time for all the one-on-one conferences necessitated by his
original scheme. In addition, the more methodical he and Karen became about their
grading, the more likely it was that some of the students would treat the conferences
not as a frank and open discussion of the student’s work for the academic quarter, but
rather as an opportunity to bargain or negotiate for a higher grade. The sometimes
legalistic argument practices of students taking such a position were decidedly not the
kind of discussion for which Gary was striving. Third, with the grades on all their
work in the form of Excellent, Satisfactory, and Unsatisfactory, students were unable
to project what their final grade for the semester would be. This ambiguity made
many of them anxious and caused them to question the fairness of the grading system.
As a result of these difficulties, Gary made some changes to the system as the
1995–96 school year progressed. First, he and Karen became more refined, specific,
and methodical about the documentation they required students to maintain about their
work. Second, though he continued to use the holistic scheme, he shifted to the use of
the 5-point scale (A, B, C, D, and F) which matched that of the school as a whole:

143
I used to think that points were—you know, trying to accumulate pointswas so debilitating to a student’s motivation, that I did everything inmy power to eliminate them completely. “We’re not going to doanything that accurately, that precisely.” Right? That the precision ofgrades is—gives some validity that they shouldn’t have. And so Iintentionally went vague in my grading system. Trying to keep themconsistent, but vague . . . What I’m finding is that level of vagueness istoo vague for students. They really can’t work well with that. And thatI find myself that I—I want to have more precision. So, I’m back to A,B, C, D, and F (G. Magi, interview April 23, 1996).
Finally, instead of the students’ work being assessed by both the student and the
teacher who then discuss those assessments, Gary and Karen did all the grading.
Students had conferences with them only if they felt a need to review their work or
discuss their grade with them. For those conferences, students had to be prepared to
bring documented evidence of their learning and performance.
Weighting System
Because of its holistic nature, Gary’s assessment infrastructure did not have a
clearly defined weighting system as did Carol and Roger’s. Thus, it is difficult to
determine exactly how much any given artifact or behavior was valued in the final
grading decision. He did break down the quarter grade into several categories, each of
which he graded separately. Then, after reviewing them all, he came to a conclusion
about the student’s final grade. There was no specific articulated procedure for
combining these category grades into a quarter grade. In the fall of 1995–96, there
were four major categories to the first quarter grade, each of which was divided into
subcategories: individual work (journal work, formal essays, home inventory, portrait

144
of home report); personal outcomes (self-directed learning, collaboration / teamwork,
time management / organization of materials); project milestones (project outline,
story board outline / story boards, script and research notes, bibliography, timeliness in
meeting deadlines); and final team product (depth of content, technical quality,
entertainment value, team knowledge of subject). By the fourth quarter, this had been
reduced to three major categories: individual work, personal outcomes, and project
work. Some of the subcategories had changed as well. Most notably, ratings on team
cohesiveness (collaboration / team work and team knowledge of subject) were gone.
In addition, the subcategories for the final product became more specific and included
their own subcategories. For example, the overall grade for the “technical quality” of
the final product was now based on grades in the following subcategories: met all
formatting criteria, grammar and spelling, sufficient footnotes, and bibliography. Gary
estimated that between one-third and one-half of the students’ grades each quarter
were based on their project work. (See Appendix F for copies of the evaluation forms
Gary and Karen used.)
Binders and Milestones
Binders have been a crucial component in the organizational structure of
project activity in STS since its inception. For every project cycle, each project team
was given a three-ring binder in which they kept their preliminary work and tracked
their team’s progress during the course of the project. There were three kinds of

145
artifacts kept in the students’ binders: milestones in the form of pieces of the final
product of drafts; ancillary reports and tracking devices; and research notes. The
ancillary reports and tracking devices included progress reports, task logs, and a
continually updated bibliography. Gary and Karen provided the students with forms
for each of these. Task logs listed the work that students planned to do, who was
going to do it, and when it was completed. Progress reports kept track of students’ use
of class time. (For details see the following section, “Progress Reports and Binder
Checks.”) Gary and Karen also provided students with a form on which to keep their
research notes, one per source, which were then stored in the binder as the students did
their work. As research notes from new sources were added, the bibliography was also
updated. Unlike the ancillary reports and research notes, the milestones were only put
in the students’ binders after they had been reviewed and commented on by Gary or
Karen. The kind of milestones kept in the binder depended on the final product being
produced. For example, they might include a detailed outline for a research paper or
story boards for a video. Gary and Karen had a difficult time keeping track of all the
work being submitted for review and then integrated into the binders, especially since
students often did multiple drafts of their written work, and the number of drafts
differed between groups. To help with this problem, they put date stamps on all
student work as they received it.
The binders served two major purposes. First, they helped the project team
organize and coordinate their work. Second, they helped the project team document
146
and communicate its progress to Gary and Karen. In this sense, the binders served
many of same functions as Roger’s milestones. Binders were typically graded on the
quality of research demonstrated in them, the bibliography the students had
constructed from their research notes, and the organization and timeliness of the work
within them. Students found the maintenance of their binders both aggravating and
helpful:
It’s a pain in the butt now, but it helps us out, helps us when we need towrite our paper, when we need to look back and try to find information. And if our binders are all a mess and we don’t have rough drafts oroutlines or anything, then it would—it would be hard for us (PeggySue, interview, May 15, 1996).
Progress Reports and Binder Checks
About midway through the 1995–96 school year, Gary and Karen added an
additional form to the binder, the progress report. In their weekly progress reports,
students described the work each member of the team did, how much time they
devoted to their project work in the last week, and how intensely each member of the
team worked. In conjunction with the introduction of the progress reports, Gary and
Karen started having regular meetings with each project team about their project work.
These meetings were called “binder checks.” The team, along with either Gary or
Karen, would review the contents of the binder thus far, as well as the most recent
progress report, and discuss plans for the following week in light of upcoming project
deadlines. At the end of the conversation, the students were given a grade on both

147
their binder and their research thus far. These grades, made on an Excellent-
Satisfactory-Unsatisfactory scale, were listed on their progress report along with any
comments the teacher had.
These binder checks served much the same purpose as Carol’s progress checks.
They were in-depth conversations with the students about their project progress that
allowed the teachers to make certain that all students were receiving feedback and
obtaining course corrections when necessary. Similarly, the project reports captured
information about the use of class time and student work efforts that were reminiscent
of the daily work records kept by Roger and his students. When assigning the final
quarter grade for both the binder and the project as a whole, Gary and Karen reviewed
the ratings on each of the progress reports and the contents of the binder.
Research Passes
For some of the project cycles, students needed to be able to leave the school
building (e.g., in order to shadow an adult using computers during his or her work
day), and for nearly all of the projects, students needed periodic access to the computer
center or the school library. As mentioned earlier, Gary negotiated a special pass
system to provide his students this freedom. When students needed to leave the
classroom, they could obtain a research pass from Gary or Karen. The pass had to be
signed by an adult at the other end, such as the librarian or the outside expert they
were going to interview. The signed pass then had to be returned and checked by a

148
student acting as the research pass coordinator. Missing, forged, or otherwise
suspicious passes could lead to an unexcused absence for the student and a revocation
of research pass privileges.
Non-Project Grades: Workshops and Journals
Workshops were always accompanied by a set of readings and thought
questions linked to those readings. Students had to complete the readings and write
responses to the questions in their journal in preparation for a workshop. On the day
the workshop was conducted, the students’ journals were “stamped” with the date to
record that they had finished the required work. If an individual student’s readings
and journal entries were incomplete, he/she was not allowed to participate in the
workshop.
Workshop attendance was graded. Students were given a scale for each
academic quarter which told them how many workshops they needed to attend in order
to get an A, B, C, and so forth, for that portion of their grade. In addition, at the end of
the quarter their journals were read and a grade was given based on the quality and
thoroughness of the entries. This practice provided students with clear boundaries that
defined the “correct” way to engage in classroom activity. In keeping with his
philosophy on self-directed learning, this system of journal and workshop grading was
meant to give students choices about the learning they would do and how much effort
they would put forth, while at the same time making certain there were clear
149
consequences associated with the various decisions they made. Unexcused absences
had direct consequences for students quarter and semester grades. (See “Non-Project
Grades: Other” below for an explanation of how.)
Non-Project Grades: Other
The workshop and journal work constituted the bulk of the students’ work
outside of projects. (See Appendix I for a sample set of workshop journal questions.)
However, there were a few other graded items and activities. Every student taking the
course for honors credit had to complete a civic contribution. This contribution
usually included providing a service to the class, such as collecting and date stamping
milestones when they were submitted, or reading and commenting on early drafts of
students’ papers. It could also be a civic contribution outside the classroom but related
to the course, such as donating time to work on a house being built by Habitat for
Humanity. Honors students who did not complete a civic contribution had their
semester grades lowered by a half grade (e.g., from a B to a B-). Non-honors students
who did a civic contribution had their grades raised by a half-grade (e.g., from a B to a
B+).
In addition, at the end of each academic quarter, students were asked to write
one or two integrative essays on the topics studied during that quarter using their
journals and project binders as source data. These essays served in place of a final

150
exam and were included among the work reviewed for the students’ individual work
grades.
Finally, unexcused absences and tardies were tracked. Students had their
quarter grades reduced by one grade for every tardy over five. Their semester grade
was reduced one grade for every unexcused absence over five.
Personal Outcomes
Students were graded on the extent to which they exhibited “self-directed
learning” as well as on how well they managed their time and organization of
materials. Their project binders and journal work (including the date stamps to show
timeliness) served as part of the evidence for this grade. In addition, Gary and Karen
kept observation notes for each student in a section of a binder they kept for tracking
students’ grades. It appeared that taking notes in this binder was not an effective form
of record keeping for them. They did not take copious notes on any of the students
and for many they made none at all. Thus, the personal outcomes grade was
determined largely by their memories of classroom behavior as well as the body of
work the student created.
Relationship between Assessment and Pedagogy
Gary’s course and assessment infrastructure designs were meant to provide
students with freedom and control over their learning, as well as concrete
consequences for the choices they made in a noncoercive fashion. The holistic

151
grading scheme and associated grading conversations were meant to turn assessment
into a dialog between Gary and his students. While the final grading process might be
somewhat “mushy,” the rest of his assessment infrastructure was not. The
requirements for binders, final products, and individual work were quite specific, and
the evaluation criteria for assessing them matched those specifications. Moreover,
Gary was very proactive in his patterns of conferring with students about their work—
both the concrete aspects of it, such as the milestones and final products, and their
working habits and behaviors. Since teaching his students how to learn in an open
environment like that of his class was a key goal of his, the students’ work habits were
just as important as the completed work itself and received significant attention in his
grading scheme.
Different Infrastructures: Common Components
A review of all the assessment infrastructures crafted in all the courses shows
that despite key differences in the way each teacher conceived of and designed them,
there were several important commonalties. First, tests, homework assignments (e.g.,
reaction papers and answers to questions on readings), lab write-ups, and reflective
essays were all used to assess students’ knowledge and understanding of core concepts
learned by the student body as a whole, largely through traditional means (e.g.,
lectures, labs, discussions, assigned readings). These means were not used to assess
the students’ project work or what they had learned from their project. Second, the

152
kinds of artifacts and behaviors which were evaluated in order to assess and support
students’ project work were fairly consistent across the three classrooms. All three
required the students to produce a final product (e.g., papers, presentations, videos,
etc.) which demonstrated what was learned in the course of the project. All three
required some form of intermediate products (milestones, drafts, ancillary reports) be
submitted by the students during the course of the project. All three kept records and
graded classroom behaviors related to projects, such as use of class time, ability to
collaborate with others, or ability to work with outside adult experts. Finally, all three
found that face-to-face conferences with students were critical to their project success
and so established routines for interacting with the project teams. In the next chapter,
the way in which each of these assessment components supports the particular
challenges of project science is explored in depth.

153
5. CROSS-CASE ANALYSES
The case studies in the previous chapter outlined how the goals, course
designs, and assessment infrastructures differed in each course, creating unique
interpretations of project-based science. Despite these differences, comparisons
between the three courses demonstrated key similarities in both the challenges the
teachers faced when constructing their courses and the assessment infrastructures they
designed to meet those challenges. This chapter reviews the findings from the cross-
case analyses in four areas. First, the assessment responses to four challenging aspects
of project-based pedagogy are discussed. Second, the role of technology in each
course and its relationship to assessment is reviewed. Third, the influence of the wider
assessment infrastructure on the teachers’ classroom assessment designs is discussed.
Finally, general satisfaction levels of teachers and students with the curriculum and
assessment designs in each class are summarized.
Assessment and the Nature of Project Activity
While technology was a strong component in the instructional designs of all
three teachers, the nature of project-based pedagogy was clearly the more dominant
concern for them as they structured classroom assessment infrastructures to support
their new visions of teaching and learning. There are four aspects to the nature of

154
project activity which differ significantly from traditional science courses taught
primarily through lectures, textbooks, and labs Student work on science projects
tends to be (a) long-term and open-ended, (b) resource intensive, (c) cooperative
and/or collaborative, and (d) iterative. Each of these aspects of the nature of project
work resulted in a cluster of support and evaluation challenges which the teachers
studied attempted to meet in part through their assessment infrastructure designs.
Below, each aspect of the nature of project science, its challenges, and the assessment
infrastructure designs the teachers used to meet them, are discussed.
The Long-term, Open-ended Nature of Project Work
In these classrooms, project work was considered long-term and open-ended
when students had room to shape and/or choose their own learning goals, as well as to
use class time in their own way over periods of weeks or months. Giving students
such control over the focus of their work and management of their time created several
challenges for the teachers involved in this study. They discovered that students new
to the complex practice of science often did not know how to craft a question or issue
to investigate that was both feasible and interesting given their time and resource
constraints. Moreover, the teachers reported that many students had difficulty
determining the logical subtasks required to accomplish their projects, estimating how
long each would take, and managing their time so as to finish by the deadline. In
general, the more open-ended the project cycles were, the more difficult it was for the

155
teachers to provide a general set of expectations for the work, or guidelines that
students could use to direct their efforts. The teachers managed these challenges by
providing students with structural supports for their projects, either by creating less
open-ended (i.e., more teacher-directed) project cycles or through the design of their
assessment infrastructures. Key assessment infrastructure components used to mediate
the challenges associated with the long-term, open-ended nature of project science
were intermediate products (including milestones, drafts, and ancillary reports), face-
to-face conferences with students, and records of students’ use of class time.
Providing Structure by Constraining the Project
One way to guide students through long-term, open-ended project work is to
provide more structure to their activities. The teachers in this study created structure
by either designing more of the project activity themselves (e.g., specifying guidelines
or restrictions for the topic or issue to be studied, the procedures used to explore it, the
format of the final product, and/or the kind of data collection and analysis to be done),
or by requiring and assessing intermediate products from the students as they worked.
The first strategy enabled the teachers to provide more specific directions for doing
the work and more specific guidelines for the final product. While such specifications
are not part of the assessment infrastructure per se, they do constitute a publicly
understood set of expectations which are linked to the assessment infrastructure. For
example, the specific guidelines given for the final product usually become the

156
dimensions along which that final product is evaluated and graded. Guidelines for
how to do the work sometimes became reified as intermediate products. Carol and
Gary both made substantive use of this strategy and had several project cycles within
their courses that were fairly structured ones. As described in the previous case
studies, their directions for work and guidelines for the final products of these projects
were often quite specific.
At least part of the reason Carol and Gary used this strategy was that they
believed their students could not effectively complete projects without such supports
and constraints, especially early in the school year. For example, Carol had originally
hoped her students would do projects like those conducted in Roger’s class:
In my heart of hearts, I would like to be able to do what Roger does andgo in and say, “Pick your topic. Negotiate with me some sort of timeframe. Tell me your plan of attack. Give me a paper. You’ll need tocommunicate your results to your classmates, and go to it,” (C.Patterson, interview, March 10, 1994).
But she found that many of her students were unable to cope with such freedom. “I’ve
never gotten a project that I thought was really a high quality project where it was
research that I thought was really student-driven,” she explained (C. Patterson,
interview, July 25, 1996). Moreover, she felt that many of the students simply did not
desire much freedom:
We had a day where we just talked about if this is going to be a project-based classroom, what can we do to make things more livable so youenjoy it and get something out of it because that’s the whole point. And the more I asked what they wanted, the more I got things like,
157
“More structure,” ending up with, “Tell us what to do” (C. Patterson,interview, March 10, 1994).
Likewise, Gary discovered that his students often were not prepared in the
beginning of the school year to conduct long-term, open-ended projects. “If they come
through 11 years of being told what to do every day, I have to be careful to teach
them—that’s me teaching them—how to use freedom to learn,” (G. Magi, interview,
September 27, 1995). Thus, his structured projects in the first quarter, such as the
Home Inventory Project and the Technical Systems Project, were designed to support
students’ efforts until they had learned how to structure and pace their own work.
Then as the year went on, he provided them with more flexibility. He described his
plans for the 1995–96 as follows: “I will start with a project that everybody will do in
a format that I will prescribe tightly. . . . Then, as the year goes on, I’ll let them define
it” (G. Magi, interview, June 1, 1995). Thus, for the first project of the year, every
student did a report on the technological systems in their own homes, for which he
specified all the aspects of their homes they would consider, exactly what kinds of data
they would collect and where they would likely find them, and the format and content
of the final report they would write once those data had been collected. For the last
project of the year, the students could propose to study any topic they wished from a
wide range of STS-related areas and could chose from a range of final product
formats, including videos, papers, and web pages.
158
While constraining the project activity in various ways can make guiding,
supporting, and evaluating the students’ activities more straightforward, it does have
its drawbacks. For example, Carol said of her Food Additives project, “It was so
structured, it was very clear what the outcome should be” (C. Patterson, interview,
July 25, 1996). On the other hand, she also worried that what she gained in the quality
of students’ work, she lost in their autonomy. “That was my project really,” she said
with some concern, “and I asked them to jump through hoops” (C. Patterson,
interview, April 12, 1996). To provide structure, yet still allow students to retain
considerable control over the project activities, required a different strategy.
Providing Structure by Assigning Intermediate Products
In the second strategy, teachers provided structure by assigning intermediate
products and associated deadlines. Intermediate products in the form of project
milestones and drafts of final products helped students break down the work of
accomplishing their projects into logical subtasks. Moreover, by providing
intermediate deadlines, they helped students pace their work. Finally, as discussed
further in the next subsection (“Providing Focus and Course Correction by Conferring
with Students”), they provided an occasion for students to confer with their teachers
about their project progress, either in preparation for meeting the deadline or in
response to the teachers’ comments on their intermediate work.

159
Roger and Gary both made significant use of this technique. Each had created
sets of milestones for the projects in their courses that were either pieces of the final
product (e.g., Roger’s milestone for a written summary of the background information
on their topic became the introduction to the team’s paper) or the natural outcome of
work necessary to complete the project (e.g., Gary’s milestone of research notes from
ten sources by a particular deadline). However, with the exception of paper drafts,
Carol’s intermediate products usually took the form of ancillary reports (e.g., progress
reports) that were not a direct consequence of the students’ end goal.
When Roger started using projects as a vehicle for teaching and learning in
1993–94, he did not have the milestone system in place. The students had only one
assignment—to do a science project on some topic in earth science. The task was
completely open-ended. There were no intermediate deadlines or due dates. In fact,
initially, Roger did not even give the students a final due date. He believed that
depending on the research question they decided to explore, students’ projects might
take different amounts of time to complete and he wanted to provide them the
flexibility necessary to chose and finish a variety of explorations. He recalled, “I just
said, ‘Well, we’ll see how long it takes.’ And then when they were all sitting around, I
said, ‘This isn’t working. December 3rd is the due date’” (R. Wolfe, interview, March
10, 1994). The lack of student initiative that lead to this first deadline, along with
comments and complaints from students that they were unclear about what they were

160
supposed to be doing, became the impetus for the creation of Roger’s milestone
system:
I think then what happens is that student expectations are obviously—and this again is a no-brainer—obviously are driven by what they seeyou want them to do, and they have to understand what you want themto do otherwise they can’t do it. . . . I thought I gave them enoughdirection to go and be creative and just, like, “We’re free. Let’s run.” But they bounced off the trees. They couldn’t handle that. . . . And so Isat down and figured out when I started the second semester how longshould it take to do all these parts. So when I redid “How to Do aScience Project,” I changed it. I added on to things that I wrote the firsttime and added—figured out time lines (R. Wolfe, interview, March 10,1994).
Roger’s milestone system created a procedural structure for students by
breaking down the task of doing a science project into pieces and then creating
deadlines for each of those pieces, while still leaving much of the project design under
the students’ control.
Like Roger, Gary used his assessment infrastructure for guiding and supporting
students’ work procedurally. His binder system and the milestones required within the
binder were designed for this purpose:
They need support. They need structure. They need class time. Theyneed deadlines. They need intervention throughout the project, andespecially at the end to finish the project and do a good job at the end,you know, which requires sustained effort, even when they’re almostdone. (G. Magi, interview, April 16, 1996)
Overall, the students seemed relatively happy with the binder as a tool for
supporting their project work. In interviews, some expressed irritation over the work

161
involved in binder upkeep, but at the same time they recognized its value for guiding
and improving their work. For example, one student said that for him the binder was:
. . . definitely a great thing because I am a person who will sit downwith no actual research done and rip out a paper but a teacher can readand not check the footnotes and think it’s a great paper. I am one of thegreatest liars in the school there is. . . . Everything was there [in thebinder]. It was all together. So, if I wanted to know how I was doing, Ididn’t have to ask them, “How do you think I am doing?” I can look atmy binder and say my binder is full of research notes, my progressreport’s filled out, my task log is looking good, my bibliography isthere, I have a bunch of notes and stuff. . . . I’d definitely keep thebinder,” (Guido, interview, May 28, 1996).
Another student mentioned the importance of the intermediate deadlines
assigned to the binder contents. “I think it’s very important that people have deadlines
because in the first quarter we didn’t have any or they kind of just said, ‘It’s due now,’
and we were flying all over the place because we weren’t exactly sure how to research
and manage our time well” (Peggy Sue, interview, February 15, 1996).
However, in contrast to Roger, not all of the intermediate products required by
Gary were milestones. Interviewed students were less convinced of the usefulness of
some of the ancillary reports they were required to keep in their binders, particularly
the task logs and progress reports. These ancillary reports did not have a direct
connection to the final product, but rather were designed to help students plan their
work and foster communication between teachers and students. Students mentioned
that while task logs were supposed to be used as a planning device which helped

162
students break down what needed to be done and who was going to do it, many, if not
most, filled it out only after they had completed their work. As one student explained:
They are looking for if you are keeping your log, and this is so easy tobull because people do it all the time . . . You go into your log andwrite whatever it is you—You just make up some stuff that you didbecause [the teachers] just want to see that you are trying to dosomething (Jae, interview, May 3, 1996).
Despite this warning about the veracity and usefulness of task logs, Jae, like
Guido, felt the binder was a useful tool which pushed students to be more thorough in
their work. She said, “The binder thing is cool with me . . . Giving a set amount [of
required research sources and notes] is good because kids will try to get away with
whatever” (Jae, interview, May 3, 1996). In interviews, some of the students in
Carol’s class expressed similar skepticism about the usefulness of the progress reports
she required, while students in Roger’s class reported similar satisfaction with the
milestones as a means of guiding and pacing their work.
In sum, intermediate products were useful for providing structure to open-
ended projects while at the same time making it possible for students to retain much of
the control over their project designs. Interviews with students showed that they
approved of and appreciated the milestone and draft deadlines. Since they were
directly relevant to accomplishing their goals, the students saw them as work worth
doing. However, as will be discussed further in the next section, the students did not
see the ancillary reports as equally valuable.
163
Providing Focus and Course Correction byConferring with Students
The structure provided through either less open-ended projects or the
assignment of intermediate products gave students general guidelines for doing and
pacing their work. However, such structural supports were necessarily somewhat
generic in nature. During even the most structured projects seen in these three
classrooms, each project team had support needs specific to their project. For
example, the assessment of risk due to food additives explored by students during
Carol’s Food Additives project, was based on each individual’s diet. Differences in
their diets resulted in the need to explore risks associated with different food additives,
and information on each was not necessarily found through the same resources.
Moreover, some students studied particular kinds of risks, such as foods and food
additives linked to migraine headaches. Thus, the students needed individualized
assistance in order to solve problems they were having with their projects.
In more open-ended projects, where students had significant control over the
topic explored and the design of their study (i.e., the projects in Roger’s class, or those
towards the end of the year in Carol’s and Gary’s), the need for assistance to be
tailored to the specifics of each team’s project was even greater. Students in these
cases not only needed assistance to solve problems they encountered along the way,
they also needed help with choosing a feasible and interesting question to explore, and
with designing an effective study for answering that question. All three teachers

164
provided individualized support to the project teams through the assignment and
evaluation of intermediate products as well as through face-to-face conferences with
the students.
In addition to milestones and drafts, ancillary reports from students in Carol’s
and Gary’s classes were used to evaluate how each project team was proceeding and to
provide students with feedback on their work. Usually the teachers made significant
written comments on the milestone and draft submissions. As mentioned earlier, the
deadlines associated with milestones, as well as comments made on the completed
versions, often provided an impetus for students and teachers to confer with one
another. Ancillary reports, on the other hand, were often only discussed verbally. The
progress reports submitted to Carol by her students were tied to her “touch-base” days,
while the progress reports and task logs that Gary’s students kept in their binders were
tied to their binder checks.
Student interviews indicated that the ancillary reports were a less reliable
reflection of the project team’s work than the milestones and drafts, and therefore a
less useful focal point for conversations between teachers and students on how to
proceed. Essentially, the students saw the progress reports Gary and Carol required as
ancillary to their work. Because they did not have a direct connection to the students’
final goals, students spent little time completing them, sometimes lying about their
progress, or at least “spinning” the information they provided. One of Carol’s students
explained that he was able postpone much of the work for his project “by saying that I

165
had done stuff that I hadn’t. So that was, so she does check. But it’s not like turning
something in or actually showing her a list of twenty additives [for the Food Additives
project] and the research you’ve done, you know, stuff like that” (Jason, interview,
February 6, 1996). As a result, the purpose of the “touch base days”—to provide
feedback, course corrections, and advice specific to each student’s or team’s project—
could easily be circumvented by students. Only later might they realize the
importance of such advice, as Jason did: “I definitely put the project off which kind
of—I think I could have done a lot better if I didn’t because she didn’t get a chance to
look over it and while I’m doing it at the last second, I was kind of unclear. I had a
few questions as far as what she was looking for in the paper” (Jason, interview,
February 6, 1996).
While the intermediate products served as an impetus for face-to-face
conversations, they were not the only source. During the days devoted to project
work, students in all three classes could and did approach their teachers for assistance
and advice. Roger’s style of interacting with students was largely reactive. Polman
(1997) found that the majority of the conferences Roger had with students were
initiated by the students. In contrast, Gary was very proactive, circulating constantly
among the students and asking them about their progress. He often spoke briefly with
members of nearly every team in the class at least once during their double-period
session, and spent significant time with between one and three groups. Carol’s
conferring patterns lay somewhere between these two. She worried about “butting

166
into” students work and so was somewhat, though not completely, reactive in her
interactions. One student described her routines as being “in the middle between like
up in your face, like, you know, and totally, just, like, you always have to go to her.
She’s more toward the you have to go to her. But she’s in the middle, which is, like,
perfect, I think” (Jason, interview, April 18, 1996). Her “touch-base” days countered
any reluctance to invade students’ territory by creating a formal event that ensured she
met with every group and provided them feedback.
Students in all three classes mentioned in interviews how critical these face-to-
face conversations were to completing a successful project. For example, one of
Roger’s students, Papi, pointed out that part of the reason for talking to Roger was that
it was the only way to get specific advice about your project:
When he knows what’s going on, he can give you advice you can use,and not just advice that’s so general that you can apply it to anythingyou do, like any kind of experiment. If you keep him informed ofwhat’s going on, he can help you pinpoint your problem and help youfind, if not a solution, a way of coming to a conclusion for it. I mean itseems he knows what he’s doing (Papi, interview, February 8, 1996).
However, getting advice from Roger was not always easy. His attention was
often split between various students who needed his help and the administrative parts
of his job that commanded his attention. In addition, his personal style and brand of
humor was intimidating to some students. Tweed, who believed that “there’s a
chemistry involved in getting an A. . . . you have to have some sort of personal one-

167
on-one relationship with the teacher to be able to get an A,” felt comfortable
interacting with Roger:
Like I’m very cocky in that class and I definitely allow, like, there’steasing. There’s like, “Tweed, you’re wrong.” “Well, Roger, you’rewrong.” There’s definite—like we’re comfortable in doing that andthat allows, like, honesty (Tweed, interview, February 16, 1997).
At the same time, Tweed worried that other students might not be as
comfortable interacting with him as she was, and that they might not be getting the
help they needed to do their work well or to develop the rapport the necessary for
doing A work:
I think he’s cocky. I really think he’s cocky when he’s teaching. Whensomeone doesn’t understand something and he goes, “What don’t youunderstand?” Like what the hell, you know, they don’t understand. Meaning you need to slow down and re-say what you just said orsomehow rewrite it so they’ll understand, not act like they’re idiots. You know? These things don’t come easily to people. This is notreading and writing and arithmetic. This is different thinking than mostpeople do on a daily basis (Tweed, interview, February 16, 1997).
The interviews with students in the other two classes exhibited a similar overall
pattern of concern: Conferring with the teacher(s) is important to project success, but
a given student’s ability to have a productive conference session with the teacher(s) is
affected by the interaction between the teacher’s conferring style and personality and
the student’s personality and willingness to heed the teacher’s advice.
In sum, conversations were critical to providing students the assistance they
needed in order to design feasible projects and solve problems along the way. The
more open-ended the project, the more critical such conversations became, and the

168
more likely it was that personality conflicts between teachers and students could lead
to project failure through lack of sufficiently specific feedback and guidance.
Intermediate products such as milestones and drafts were successful both as indicators
of student progress and as an impetus for these face-to-face conversations. Ancillary
reports were less useful for these purposes as the students typically did not represent
their activities well within them.
Encouraging Good Work Habits
Teachers used their conversations with students not only to provide feedback
and advice to students but also to encourage them to use their time well. In order for
students to successfully complete their projects, they had to make effective use of class
time that was devoted to project work, which in these three classrooms was a
significant amount of time. Since each project team usually had different goals and
therefore a different set of tasks to complete, the class time teachers provided for
project work was typically very open and unstructured. Each team directed their own
activities, while the teacher served as a consultant and supervisor. Since the projects
were typically long-term ones and the amount of available class time to work on them
was large, students interviewed in all three classes noted that it was easy to
procrastinate. As one of Roger’s students said:
The two weeks before the project’s due, everybody crams, includingmyself. So, you’re pretty much screwed . . . We’re procrastinators andwe just keep putting everything off even though we’re not supposed to. And we’re stuck, like, literally working all night quite a bit. I pulled a

169
bunch of all nighters for this class . . . This would work better if wewere actual responsible, actually responsible students, but we’re not[laughs], so— (Papi, interview, May 3, 1996).
One student in Gary’s class claimed that the student body was not simply
procrastinating, rather they were explicitly manipulating Gary and Karen to reduce
their work load:
So third quarter, we got our project done, but we bulled our wholepaper. But we still got a good grade because we’re just like, “Okay,fine.” We did it like the last day, but it was such a good job becausewe’re like, “Okay,” we stayed there from like five to nine or ten but wegot it done. . . . That’s the key. Everybody knows that’s whateverybody does basically. A project can be done in like two days orone night. . . . You might need a good week to do, like, the videoprojects, you’ll need a good week. But everything else can be done,whatever. But we just complain like, “We need more time,” blah, blah,blah, “We can’t get this done, the pressure.” And they’re just like,“Okay, then maybe we need to cut out this and this and that, this andthis and that.” And they do. So, like everybody in this class just hasthis understanding that we’re just going to do whatever” (Jae,interview, May 3, 1996).
Even during the more structured projects, students sometimes had difficulty
managing their time. These time management difficulties had a negative influence on
students’ work. For example, the “good grade” Jae and her partners received for the
last minute effort described above was a C+, and their final product was a web page
filled with grammatical and spelling errors, factual inaccuracies, graphs that were
neither referenced nor explained in the text, and incomplete justifications for their
assertions.

170
Stiggins and Conklin (1992) note that many teachers, “especially high school
teachers, see their students as at least somewhat irresponsible” (p. 148). However, as
the comments of Papi and Jae above demonstrate, the teachers in these three courses
had reason to be concerned about the work habits of at least part of their student body.
They each used a combination of intermediate deadlines, face-to-face conversations
with students, and records of students’ use of class time in order to encourage and
reward strong work habits.
Because Roger was generally reactive in his interaction style with students, he
neither prodded nor cajoled them to work. Instead, he made the consequences for
wasting time clear: Students would lose points on their daily work grade for
inadequate use of class time, lose points for milestones they turned in late, and lose
points on their final paper if they failed to put in the effort needed to successfully and
convincingly complete their research. As one of his students, Tweed, put it, Roger’s
class was “an easy D.” Roger would allow students to do nothing if they chose, but
they paid a price for that choice.
Carol and Gary were less laissez faire. Carol mentioned in one interview that
even with all the project structure she provided her students, they still had difficulties
managing their time. “The ones that failed there were people who couldn’t manage
their time in class. . . . I set the structure, and they still couldn’t handle it” (C.
Patterson, interview, March 10, 1994). As mentioned earlier, both she and Gary were
more proactive in their interactions with students. In addition to their regularly
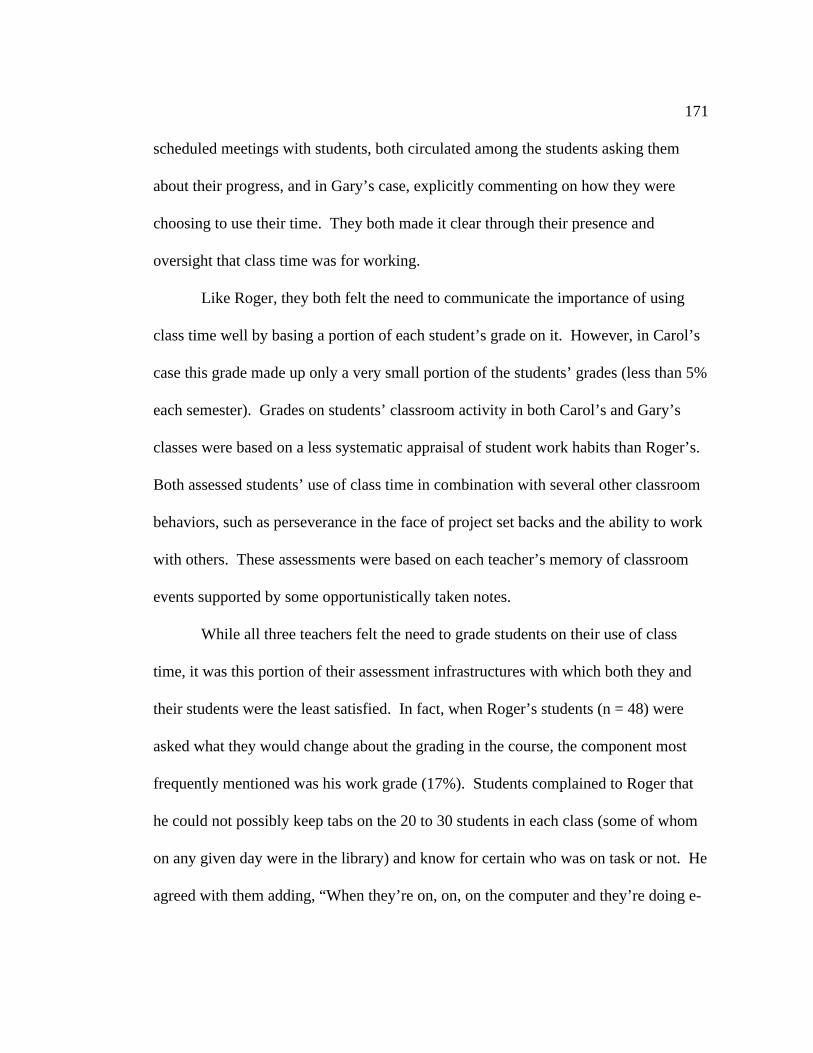
171
scheduled meetings with students, both circulated among the students asking them
about their progress, and in Gary’s case, explicitly commenting on how they were
choosing to use their time. They both made it clear through their presence and
oversight that class time was for working.
Like Roger, they both felt the need to communicate the importance of using
class time well by basing a portion of each student’s grade on it. However, in Carol’s
case this grade made up only a very small portion of the students’ grades (less than 5%
each semester). Grades on students’ classroom activity in both Carol’s and Gary’s
classes were based on a less systematic appraisal of student work habits than Roger’s.
Both assessed students’ use of class time in combination with several other classroom
behaviors, such as perseverance in the face of project set backs and the ability to work
with others. These assessments were based on each teacher’s memory of classroom
events supported by some opportunistically taken notes.
While all three teachers felt the need to grade students on their use of class
time, it was this portion of their assessment infrastructures with which both they and
their students were the least satisfied. In fact, when Roger’s students (n = 48) were
asked what they would change about the grading in the course, the component most
frequently mentioned was his work grade (17%). Students complained to Roger that
he could not possibly keep tabs on the 20 to 30 students in each class (some of whom
on any given day were in the library) and know for certain who was on task or not. He
agreed with them adding, “When they’re on, on, on the computer and they’re doing e-

172
mail, is it project-related e-mail or are they writing to their friends? If they’re on
Netscape, are they looking for, you know, music and lyrics, or are they actually
looking for volcanoes and earthquakes?” (R. Wolfe, interview, March 7, 1996).
However, although he tried using student records of class time use, he was skeptical
about their reliability, “I have very little faith in student self evaluations . . . because I
don’t think they’re honest. And it may not—and it may not be willful deceit. They
just may not have a clue as to what they’re actually doing” (R. Wolfe, interview,
March 7, 1996). Carol had similar concerns. She described one project cycle in which
she asked students to keep logs about their project work: “I had them use a log. I
know that a lot of what I saw was bogus on the logs because I know, and I was there
every day and I saw that most of them weren’t doing anything” (C. Patterson,
interview, March 10, 1994).
Gary, on the other hand, who asked students to report how hard they worked
and the number of hours they dedicated to their project work in their weekly progress
reports, did not seem particularly concerned about the veracity of the students’ self-
reports. He may have been less worried about them because they were only one of
several indicators he considered when holistically assigning students’ personal
outcomes grades and therefore did not have to credit them in any particular way.
However, he did receive complaints from students who claimed they did most of their
work at home and therefore felt Gary could not see their use of time or other important
behaviors he considered in his “Personal Outcomes” grade.

173
Of the three teachers, Carol received the fewest complains about her grades on
students’ work habits and other affective behaviors. The complaints in her class were
probably small both because the these assessments constituted a very small portion of
the students’ final quarter and semester grades and because students (rightly)
perceived that they were largely used to their benefit. In other words, Carol did not so
much penalize students for poor work habits as reward them for good ones.
Interviews with students in all three classrooms indicated that in general they
believed effort and dedication put into a project should be inconsequential if the end
result was a solid final product. However, if the final product were a poor one, despite
diligent effort on the part of the project team to overcome any problems and
extenuating circumstances they might encounter, then students felt their perseverance
and use of class time should be considered in the final grade. This response on the
part of the students may be tied to cultural norms of the school which stress academic
achievement, rather than work habits, as appropriate measures of student performance.
The Resource-Intensive Nature of Project Work
Students often had difficulties obtaining and using the resources needed to
complete the projects they proposed. Projects could and did fail because students were
unable to fulfill their resource needs. None of the teachers wanted to fail students
because of unforeseeable resource roadblocks, particularly when those students made
genuine efforts to acquire what they needed. To avoid this situation, the teachers
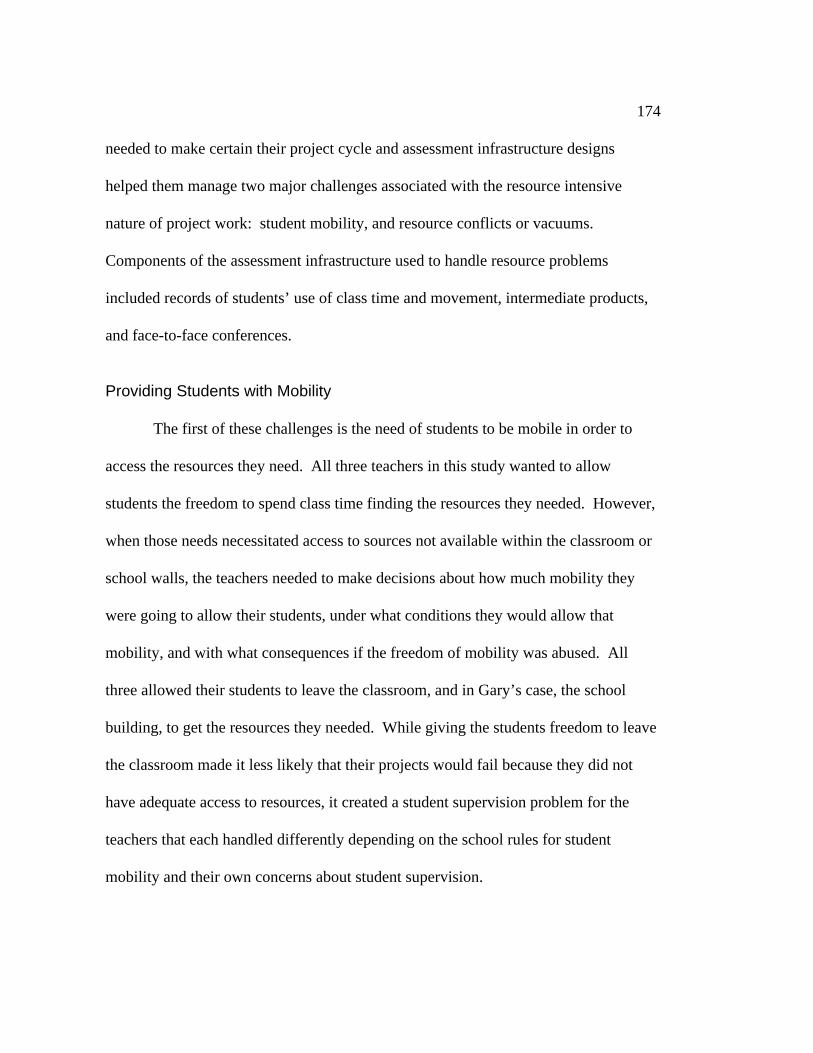
174
needed to make certain their project cycle and assessment infrastructure designs
helped them manage two major challenges associated with the resource intensive
nature of project work: student mobility, and resource conflicts or vacuums.
Components of the assessment infrastructure used to handle resource problems
included records of students’ use of class time and movement, intermediate products,
and face-to-face conferences.
Providing Students with Mobility
The first of these challenges is the need of students to be mobile in order to
access the resources they need. All three teachers in this study wanted to allow
students the freedom to spend class time finding the resources they needed. However,
when those needs necessitated access to sources not available within the classroom or
school walls, the teachers needed to make decisions about how much mobility they
were going to allow their students, under what conditions they would allow that
mobility, and with what consequences if the freedom of mobility was abused. All
three allowed their students to leave the classroom, and in Gary’s case, the school
building, to get the resources they needed. While giving the students freedom to leave
the classroom made it less likely that their projects would fail because they did not
have adequate access to resources, it created a student supervision problem for the
teachers that each handled differently depending on the school rules for student
mobility and their own concerns about student supervision.
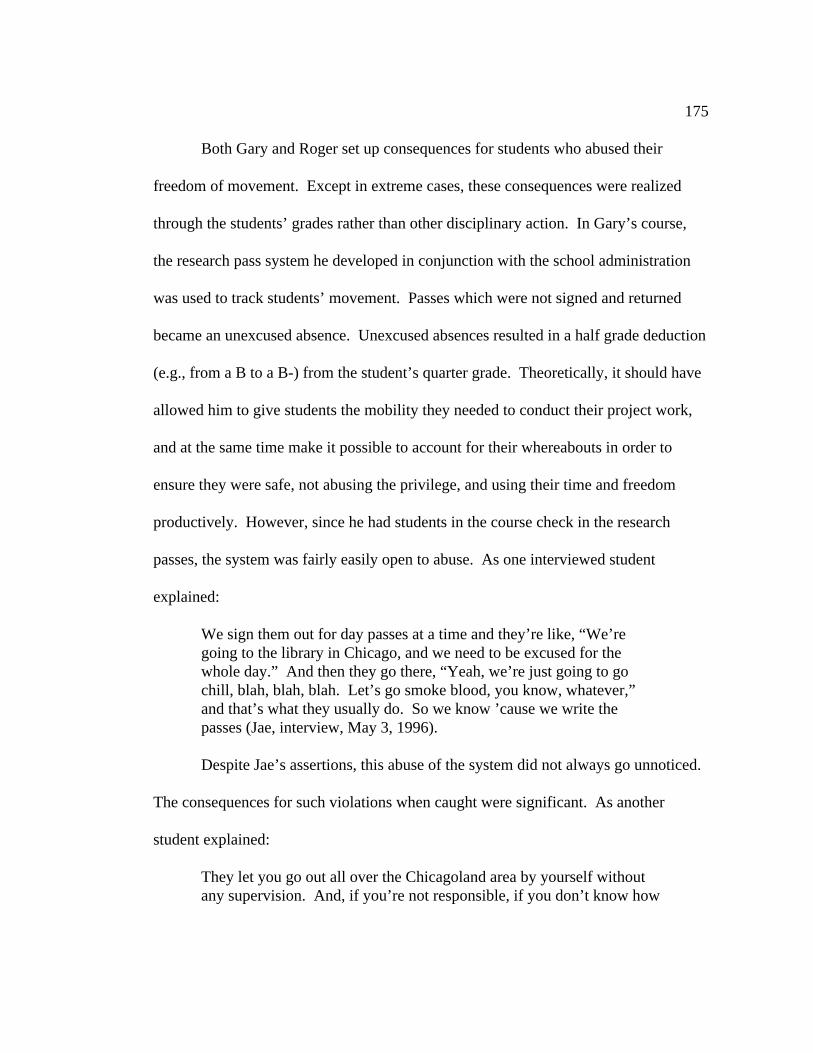
175
Both Gary and Roger set up consequences for students who abused their
freedom of movement. Except in extreme cases, these consequences were realized
through the students’ grades rather than other disciplinary action. In Gary’s course,
the research pass system he developed in conjunction with the school administration
was used to track students’ movement. Passes which were not signed and returned
became an unexcused absence. Unexcused absences resulted in a half grade deduction
(e.g., from a B to a B-) from the student’s quarter grade. Theoretically, it should have
allowed him to give students the mobility they needed to conduct their project work,
and at the same time make it possible to account for their whereabouts in order to
ensure they were safe, not abusing the privilege, and using their time and freedom
productively. However, since he had students in the course check in the research
passes, the system was fairly easily open to abuse. As one interviewed student
explained:
We sign them out for day passes at a time and they’re like, “We’regoing to the library in Chicago, and we need to be excused for thewhole day.” And then they go there, “Yeah, we’re just going to gochill, blah, blah, blah. Let’s go smoke blood, you know, whatever,”and that’s what they usually do. So we know ’cause we write thepasses (Jae, interview, May 3, 1996).
Despite Jae’s assertions, this abuse of the system did not always go unnoticed.
The consequences for such violations when caught were significant. As another
student explained:
They let you go out all over the Chicagoland area by yourself withoutany supervision. And, if you’re not responsible, if you don’t know how
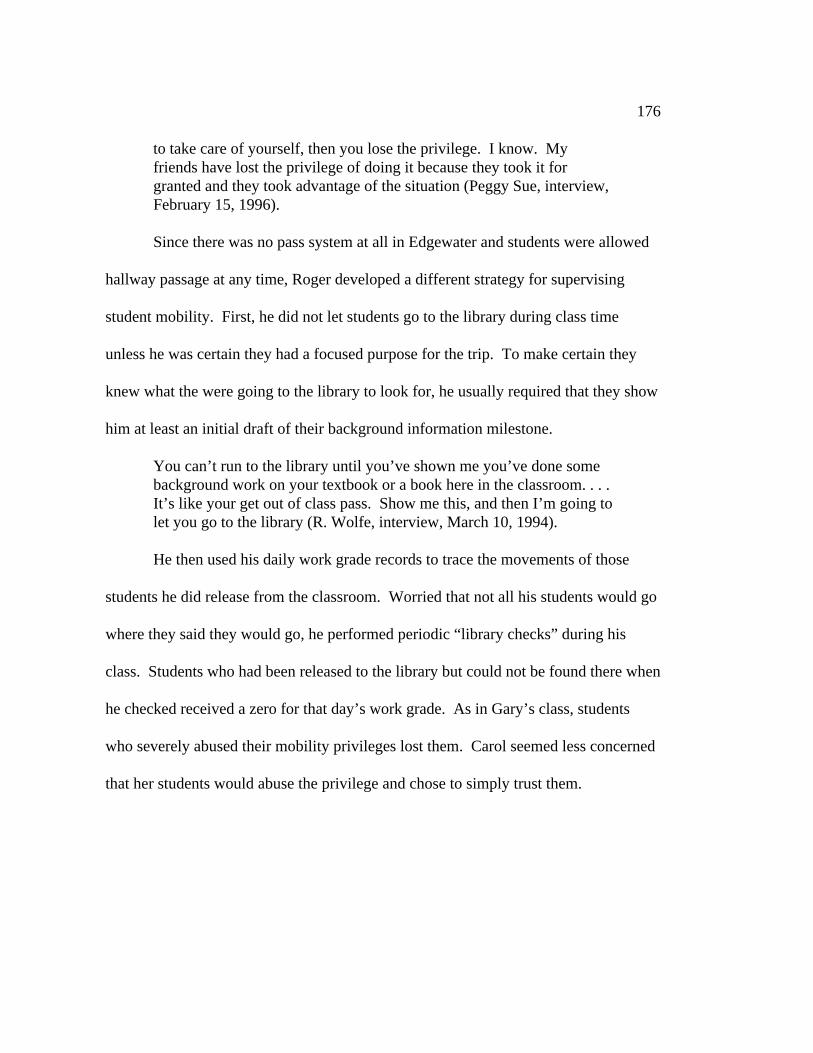
176
to take care of yourself, then you lose the privilege. I know. Myfriends have lost the privilege of doing it because they took it forgranted and they took advantage of the situation (Peggy Sue, interview,February 15, 1996).
Since there was no pass system at all in Edgewater and students were allowed
hallway passage at any time, Roger developed a different strategy for supervising
student mobility. First, he did not let students go to the library during class time
unless he was certain they had a focused purpose for the trip. To make certain they
knew what the were going to the library to look for, he usually required that they show
him at least an initial draft of their background information milestone.
You can’t run to the library until you’ve shown me you’ve done somebackground work on your textbook or a book here in the classroom. . . .It’s like your get out of class pass. Show me this, and then I’m going tolet you go to the library (R. Wolfe, interview, March 10, 1994).
He then used his daily work grade records to trace the movements of those
students he did release from the classroom. Worried that not all his students would go
where they said they would go, he performed periodic “library checks” during his
class. Students who had been released to the library but could not be found there when
he checked received a zero for that day’s work grade. As in Gary’s class, students
who severely abused their mobility privileges lost them. Carol seemed less concerned
that her students would abuse the privilege and chose to simply trust them.
177
Avoiding Failure due to Resource Conflicts or Vacuums
Determining the resources they needed to complete their projects, as well as
knowing where to find them, was often as difficult a challenge for the students as
formulating a researchable question. As Roger once said, a large part of “helping kids
do projects is just knowing where the datasets are that can be used” (R. Wolfe,
interview, March 10, 1994). Moreover, data and information which both teachers and
students might have presumed likely to exist (e.g., records of geyser eruptions at
Yellowstone National Park) might be difficult to obtain, or if found, might be in
formats that are difficult to use and interpret (e.g., records of astronomical data
retrieved from NASA). Finally, it was not unusual, even in completely open-ended
project cycles, for students to be chasing, and in some cases hoarding, the same few
key resources. For example, at Edgewater a book entitled Volcanoes of the World,
which contained a significant amount of data on volcanic activity around the world
over a large span of time, was a key resource for any team doing a project related to
volcanoes. When it was discovered missing from the school library, there was a mild
crisis among Roger’s students as those teams studying the very popular topic of
volcanoes scrambled to find alternative sources of data to explore. At the very least,
access to the classroom computers or other technologies to support their work could be
a source of conflict. As a result of these potential difficulties, all three teachers had to
mediate situations in which the students were simply unable to acquire the resources
needed to complete their projects.
178
The teachers tried to minimize the likelihood of complete project failure due to
resource difficulties in several ways. First, as already discussed, they allowed students
the freedom to leave the classroom in order to obtain what they needed. Second, they
encouraged students to use the Internet as a source of primary data they might be
unable to collect themselves (e.g., records of earthquake activity) and information not
readily available locally (e.g., environmental legislation currently under congressional
review). Third, they sometimes used scheduling to ensure equal access to the
computers and technology in the classroom or elsewhere in the school. Finally, they
used a combination of intermediate products and face-to-face conferences to determine
which students were having resource difficulties early enough in the project cycle that
a course correction could be planned before the project met with disaster.
When these strategies were insufficient, as they sometimes were, the teachers
relied on their grades of students’ work habits, and some creative grading on their final
products, to compensate. Gary’s personal outcomes and binder grades and Roger’s
work grades were both a significant proportion of each student’s grade and could thus
temper some resource problems. Similarly, Carol hoped that the opportunities
students in her course had to show what they had learned through other means (e.g.,
tests, homework, and labs) could balanced out a poor project. In addition, all three
defined subsections of the final product, so depending on the extent of the resource
difficulty, the student might still do well on some of them (e.g., introduction).
Moreover, even Carol and Roger, who assigned specific point values on each of those
179
sections, did not have firm heuristics for how to determine what kinds of deficits in the
final products led to what kinds of reduction in points. As Carol said, “I’ll say this
many points for this particular section of the paper. What does that mean? I’ll take
off three points. Well what does that mean? It doesn’t—It means nothing” (C.
Patterson, interview, March 22, 1996). As a result, they could compensate for
difficulties due to resource failures outside the students’ control through the way they
assigned grades to each portion of the final product:
I got a feeling for just the overall quality of the project and I thought,“Well . . . it feels more to me like a B than a C, because of all the otherthings that he did which were not required but he’s trying . . . Okay.” Maybe if he had not done anything extra special, then for what he didhe would have gotten a C. . . . And the points, I can’t tell you exactlyabout the points, but I’ll—I’ll work it out some way so that he ends upgetting a B (C. Patterson, interview, March 22, 1996).
The Cooperative or Collaborative Nature of Project Work
Often the work in these three classrooms was done collaboratively or
cooperatively. Students worked on project teams and often had to interact with adults
outside the classroom who were either advisors (telementors), sources of data and
information, or objects of study. Moreover, as part of their attempts to establish a
common set of shared expectations for good work, the teachers each tried to engage
the students in discussing and evaluating the work of one another. This kind of
dependence on others for the success of their work was generally uncomfortable for at
least a portion of the students in each class and sometimes created difficulties similar
180
to those created by the resource-intensive nature of project work. In particular,
students worried that their project team might successfully complete their project, but
that the labor for doing so might be unfairly distributed among the team members.
The “free riders” would then receive the same grade as those students who had
contributed significant effort to the project, a situation deemed unfair by the teachers
as well as the students. They also worried that interpersonal problems within the
group could cause such dysfunction that the final product would be either incomplete
or inadequate.
The teachers used their assessment infrastructure to compensate for these
difficulties using strategies similar to those for handling resource complications. First,
they relied on the use of face-to-face conferences both to reveal when the students
were having interpersonal difficulties and to help them resolve those difficulties before
they became fatal to the project’s success. Second, they relied on their grades of
students’ work habits to reward students who did more than their fair share of the
project work. In order to convey to students that mature and productive interpersonal
relations were a goal of the course, Carol included a rating on “group cohesiveness” as
part of the grade she gave on the final products of the group projects. Likewise, Gary
graded students’ ability to work with or lead team members and Roger asked the
students to rate one another’s contributions to the project work. In order to encourage
mature relations with outside adults, both Carol and Roger experimented with, though
never really included in their final grade calculations, evaluations of students’

181
interactions with their mentors. Finally, all three teachers had their students evaluate
the work of the other project teams in the class, usually based on their final
presentations, in order to establish a common culture of expectations and values
around the work and to build students’ capacities for looking at the work critically.
However, they only sometimes incorporated these evaluations into their final grades,
and when they did so, it was a minor component.
The Iterative Nature of Project Work
The work the teachers were asking the students to accomplish in each of these
classes was often very different from the work they had been asked to do in other
courses. When asked on surveys to rate on a scale of 0 to 10 how different this class
was from other science classes, the students in all three responded that it was very
different (see Table 11). Moreover, they found the projects were different from those
they had done in the past as well (see Table 12). Thus, the students could be expected
to have difficulties accomplishing the projects at first. They needed practice, and all
three teachers expected and hoped that the students would get better at doing them
over the course of the year. However, they never directly assessed the students’
improvement. They did not have an explicit improvement component to their grade
(though it may have been captured in Gary’s personal outcomes grade or Carol’s
participation grade), nor did they explicitly change the criteria for evaluation over the
course of the year so that what constituted good work was different in the spring than

182
in the fall. Carol and Gary did reduce the amount scaffolding they provided students
through the course of the year by giving them more control over the project design.
Therefore, an A earned in the spring was for a more complex task than that done in the
fall, and might in this way demonstrate a student’s improved capacity for doing
projects.
Table 11. Difference between This Science Class and Other Science Classes.
Respondents Mean Median StdDev
Roger’s students 51 1.78 1 1.96
Carol’s students 14 3.2 3.5 1.67
Gary’s students 45 1.89 2 1.71
(0 = completely different, 10 = very similar)
Table 12. Difference between the Projects Done in This Class and in Other ScienceClasses.
Respondents Mean Median StdDev
Roger’s students 43 2.74 3 2.30
Carol’s students 11 3.54 4 2.38
Gary’s students 39 2.85 3 2.42
(0 = completely different, 10 = very similar)
They also expected the students to run into research failures that might require
them to redo their work. The school marking periods made it difficult to give students

183
more than eight or ten weeks to work on a project, and all projects were typically due
at the same time regardless of what challenges individual groups may have faced. As
a result, while students often had the chance to rewrite their final papers, they rarely
had the chance to redo the research. Rewriting the paper would not help the students’
grades much if the research they had done was poor. All three teachers tried to avoid
the need for students to repeat their research in the same way they tried to avoid
project failures due to resource difficulties and teamwork problems: They assigned
intermediate products to help them gauge which students were having difficulties
conducting their research, and through their face-to-face conferences they attempted to
circumvent the need of students to redo work by trouble-shooting difficulties early on.
Reviewing and grading drafts was a somewhat new experience for these three
teachers, and they each handled it differently. They each needed to develop criteria for
evaluating drafts that recognized their potentially incomplete nature, which at the same
time did not abandon all standards for quality. Roger’s solution was to never tell his
students that the first version of their papers was a draft. “Because if we tell them its
just a draft, they don’t take it seriously,” he explained (R. Wolfe, interview, June 2,
1995). Instead, he had them turn in the final papers and then, after he had graded
them, gave students the opportunity to rewrite them if they so desired. He then gave
them the higher of the two grades. Carol required drafts of all her students, and while
she provided them with copious notes and feedback, she did not grade them. Gary
often had his students continuously turn in drafts until the final product was good

184
enough or he and the students gave up, whichever came first. Students in his class
were graded not only on their final product, but also on the drafting process as part of
their personal outcomes and binder grades.
Some of the milestones assigned by Gary and Roger could be considered
“partial drafts” (e.g. Roger’s background information milestone, or Gary’s script
milestone for the first quarter video project). While both Gary and Roger made verbal
and/or written judgments on the quality of these milestones, those judgments were
only sometimes included in Gary’s formal grading system and almost never in
Roger’s. These patterns indicate that withthe possible partial exception of Gary, the
three teachers tended to treat drafts and partial drafts as a means of providing feedback
to students rather than as part of the evaluations which informed their grading
decisions.
Integrated Assessment Design
As the discussion above illustrates, many of the assessment infrastructure
components used by the teachers were intended to serve more than one need. For
example, the intermediate products required were often intended to help students pace
their work (long-term, open-ended nature of project work), to enable the teacher to
make certain the resource requirements of their project were reasonable (resource-
intensive nature of project work), and to make it more likely that the teacher could
steer the students through research difficulties that might require revisions (iterative

185
nature of project work) which they did not have time to do. Notes kept by teachers
and/or students about their work activity were used to help teachers guide students in
their decision making, to track and guide their use of class time (long-term, open-
ended nature of project work), and to enable teachers to see how labor was being
divided among teammates (cooperative/collaborative nature of project work).
Participation or “effort” grades allowed teachers to give credit to students who made
reasonable plans, yet ran into unforeseeable and sometimes fatal difficulties (resource-
intensive and iterative nature of project work). They also made it possible to reward
students who helped others with their work, or contributed more than their fair share of
the labor on their project (cooperative/collaborative nature of project work). The
various pieces of the assessment infrastructures were generally designed to support
and reflect one another in this fashion.
Assessment and Technology
There have been numerous proposals, attempts, and successful uses of
technology to improve teaching and learning, and some exploration of the potential for
technology to improve our assessment infrastructure (e.g., Collins, Hawkins, &
Frederiksen, 1993). The research on the relationship between assessment and
technology in this study emphasizes the role the technologies incorporated by these
teachers into their project-based science classrooms played in their instructional
decision making and grading practices. A review of the centrality of technology in

186
each course is followed by the discussion of three ways in which technology and
assessment intersected within these classrooms: assessment of technology use and
skill; technology as a requirement to complete course work; and technology as a
vehicle for assessment communication.
Use of technology, particularly computers, was an essential component of all
three courses. The use of general purpose tools, such as electronic mail and UseNet
News clients, Internet web browsers, word processors, spreadsheets, and presentation
software, in support of students’ research activities, was prevalent in all three
classrooms. Likewise, a fileserver was available at each school with separate accounts
for each student in which to store their work and electronic communications. At
Lakeside, Gary also provided access for all members of each project team to a “team
folder” stored on the CoVis fileserver in order to facilitate their collaborative work.
When asked what they were supposed to be learning in their courses, a least one
student interviewed in each class mentioned learning to use the computers and the
Internet. For example, Papi, one of Roger’s students said, “By using the Internet and
by exercising our potential as researchers, he wants us to learn how to do research, to
help us find our answer” (Papi, interview, May 29, 1999).
There were some differences in the role of technology in each course as well.
Most notably, in Gary’s course, technology was not only a tool for doing project work,
it was also a key object of study. Gary was the only one who made significant use of
video recording and editing technology in his course. Carol was the only one of the

187
three that really tried to use any of the software specifically generated by CoVis
researchers to support the project work of teachers and students, including the
Collaboratory Notebook and the Climate Visualizer/World Watcher. Finally, Roger
made more use of the technologies available as a tool for communications than did the
other two. These differences will play out in each of the following discussions of the
relationship between technology and assessment.
First, in 1995–96, Roger was the only teacher who evaluated students’ ability
to use technology directly. He asked students to do a few introductory activities (such
as read a news thread and send him a summary of it) and to take a technology skills
test. Carol assessed her students in similar ways in previous years, though not in
1995-96. These direct assessments were never a large portion of either teachers’
grades. The skills tests served mostly to encourage students to try new technologies
and to provide the teacher with an opportunity to do some one-on-one tutoring for
students who were still struggling with them.
Second, the use of technology was either required or strongly encouraged as
part of the assignments in all three classes. Some of the required or encouraged uses
of technology in the course of project activity included using e-mail to communicate
with and send papers to telementors; using web browsers to gather data and
information on the topic being studied; using general productivity tools, such as word
processors, spreadsheets, and presentation software to do data analysis, prepare final
reports, and create presentations; working with visualization software to study data
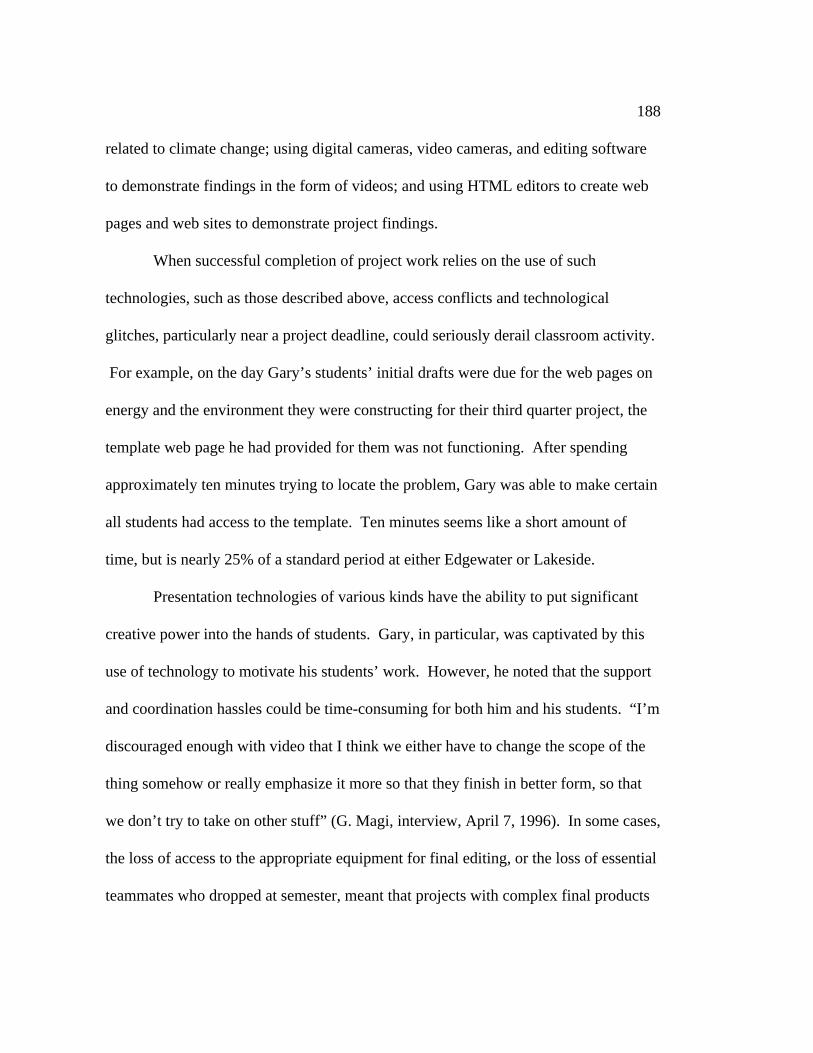
188
related to climate change; using digital cameras, video cameras, and editing software
to demonstrate findings in the form of videos; and using HTML editors to create web
pages and web sites to demonstrate project findings.
When successful completion of project work relies on the use of such
technologies, such as those described above, access conflicts and technological
glitches, particularly near a project deadline, could seriously derail classroom activity.
For example, on the day Gary’s students’ initial drafts were due for the web pages on
energy and the environment they were constructing for their third quarter project, the
template web page he had provided for them was not functioning. After spending
approximately ten minutes trying to locate the problem, Gary was able to make certain
all students had access to the template. Ten minutes seems like a short amount of
time, but is nearly 25% of a standard period at either Edgewater or Lakeside.
Presentation technologies of various kinds have the ability to put significant
creative power into the hands of students. Gary, in particular, was captivated by this
use of technology to motivate his students’ work. However, he noted that the support
and coordination hassles could be time-consuming for both him and his students. “I’m
discouraged enough with video that I think we either have to change the scope of the
thing somehow or really emphasize it more so that they finish in better form, so that
we don’t try to take on other stuff” (G. Magi, interview, April 7, 1996). In some cases,
the loss of access to the appropriate equipment for final editing, or the loss of essential
teammates who dropped at semester, meant that projects with complex final products

189
never got completed. In addition, the immense amount of work it took to produce a
quality final product in some of these formats, particularly video, meant that students
created glitzy presentations at the expense of any deep understanding of the subject
they were studying. Polished final products might even obscure the lack of
substantive content within them:
And we pulled off a really fantastic video. It actually had information. All the information we got was from one interview with a guy who ledus on a tour. And from what I knew and what Zachary knew. Wetalked about production, it was really easy to do. He did it with hisown Amiga at home and his own Macintosh at home. And it was A onthe video and a C on the binder, because we did nothing. The researchthat we did was superficial. It was unnecessary in order to presentinformation. If we would of had to do a paper, we would have done amuch better presentation. Our thing was great because it was polished. Everybody else’s when they go to edit the first time they try to do avideo, it’s choppy, it sounded bad. Ours sounded great. It was editedwell, and it flowed and you could watch it. And you couldn’t even paya lot of attention, you’re just like “Wow, this is pretty cool. Oh, thatpart’s funny.” And everybody liked it, Mr. Magi was entertained by it. And nobody learned anything. And we got an A- (Guido, interview,May 28, 1996).
Both students and teachers tended to believe that students could only be held
accountable for assignments which require electronic formats or depend upon access
to functioning technology to the extent that those technologies were both available and
stable. To some extent, an excuse such as “My disk got corrupted” is the modern
student’s version of “My dog ate my paper.” Teachers had to guard against and
prepare for these spurious complaints as well as genuine project failure based on
technology difficulties. The techniques they used were similar to those used for other

190
resource difficulties: They used intermediate products to ascertain which students
were having difficulties early on so as to avoid fatal problems and last minute excuses,
and they relied upon assessment components associated with work behaviors and
habits to compensate for students who, despite their best efforts, still had serious
difficulties.
Assessment was used to some extent in all three classes for the purpose of
exchanging assessment-related information and communicating about progress. All
three teachers occasionally used e-mail either to send assignments to or to receive
information from their students. Gary and Karen sometimes passed out assignments to
students via e-mail. Carol often had her students submit their written progress reports
to her via e-mail, and she used grading software to create an overview for every
student of his or her achievement for each quarter. Roger, however, was by far the
most consistent user of technology for assessment communications. His students
often sent him e-mail about problems they were having when the press of students
asking for his help was so deep he could not find time for them all during the course of
the period. He was conscientious about reading such e-mail requests for help and
responding to them, either by writing back or by meeting with the student the next
day.
Roger also used e-mail as a way to establish rapport with students who might
otherwise be uncomfortable approaching him in the class to ask for assistance:

191
In the beginning of the year, this kid wouldn’t say a word to me. Then,I found out that, you know, he was kind of a quiet, introverted guy and,you know, doesn’t have much rapport with his teachers. So I thought,well, cool, maybe by using e-mail, you can develop this rapport withthe teacher, you know, in a sort of a distance, where you don’t actuallyhave to go up and talk to them, things like that. Um, and then maybethat would lead to more and more conversation as the year went on. And, what I’ve noticed, is that he is more articulate—he is willing tocome up, and he’ll ask a question, or he’ll raise, or even somethingsimple like going to the library—you know, “Can I go to the library?” It’s not even just the fact that he’ll ask, but it’s the way he’s asking, youknow. The more confidence in his voice (R. Wolfe, interview, June 2,1996)
Finally, Roger used a combination of e-mail and public spaces on the fileserver
to collect assignments from students and to post their grades. Students often turned in
their papers either as an e-mail attachment or by leaving them in a particular folder in
Roger’s fileserver account. As mentioned in his case study, he also posted the
students’ grades in a publicly accessible spreadsheet on the fileserver. All four
students interviewed in his class seemed to like the ease of access to grades this
spreadsheet provided.
I think it’s great. I can’t get shit out of my other teachers. They won’tgive me my grades. I don’t know any of my grades right up until twodays before when I couldn’t have changed any of them, unlike thiswhere you can actually sit down and look at the updated grades and youknow where you can go. There’s not necessarily much you can doabout it, but at least you’re aware (Tweed, interview, February 16,1996).
In sum, while technology did not play a driving role in the assessment
infrastructure designs of any of these courses, it was certainly a factor.

192
Influence of the Wider Assessment Infrastructure
Teachers were asked explicitly about the influence of the wider assessment
infrastructure on their course and assessment infrastructure designs. (See the
interview guides for second and fourth quarters of 1995–96 in Appendix A.) All three
courses were elective courses, outside the main sequence in science for college-bound
students, and none were available for Advanced Placement credit (although Carol’s
would be in the following 1996–97 school year). None of the courses had a mandated
curriculum of any kind, and they were not influenced by any of the state tests or
college entrance exams. As Roger put it:
I always feel lucky because earth science isn’t one of your mainstreamsciences. Nobody really gives a rat’s ass what I do. . . . There’s no APearth science. . . . Colleges, you know, kind of ignore us, which, youknow, is good and bad. I feel grateful that I have the freedom to doearth science anyway I want to. . . . I’m not test driven and so I can beneed driven (R. Wolfe, interview, March 7, 1996).
As Roger notes, this state of affairs had both advantages and disadvantages.
One significant consequence was that the parts of the wider assessment infrastructure
which had the largest influence on their design decisions were all local to the school.
The most important of these were the grading and reporting system, the tracking
system, and course sequencing. These components of the school assessment
infrastructure influenced their designs of both classroom instruction and assessment by
defining the “final product” of their individual grading systems and influencing the
student clientele that typically took their courses.

193
The Influence of GPA on Classroom Assessment
As has been shown already, the assessment infrastructure in each classroom
served a multitude of purposes in the day-to-day life of each course. However, in the
end, each teacher had to report an evaluation of every student’s performance to the
school in the form around which the school’s assessment infrastructure was designed.
Both of these schools used a weighted (or semi-weighted) system for calculating the
average grade for each student across their courses based on a five point scale (A–F)
for reporting academic achievement to parents and students four times a year. As a
result, the assessment infrastructure in each classroom had to allow for the calculation
(or composition, in Gary’s case) of a single overall rating of student performance at
each of the appointed times. Assessment designs which ran counter to the customs,
culture, and language which the entire school used for discussing and assigning grades
in response to this general format ran into difficulties.
For example, Gary’s attempt to use a 3-point scale (Excellent, Satisfactory, and
Unsatisfactory) instead of the familiar 5-point scale (A–F) was not entirely successfull
because it did not articulate clearly with the meaning system with which students were
familiar in the rest of the school. Students responded to the E-S-U grades in a similar
way as U. S. residents respond to outdoor temperatures in Celsius—by trying to
establish meaning through direction translation to a more familiar scale. Similarly,
Gary and his students were constantly having to negotiate the translation between the
E-S-U scale he set up and the A–F scale in which he had to eventually report his

194
grades, a situation that caused anxiety for some of his students. As one of his students
explained:
Well, obviously19
the way the system works is an A is a 4.0 and so on. But if you get an E or an S or a U, what does that translate—’Causethen you have to break, like, an excellent into an A and then into a 4.0and on to the GPA system, and like, if you get an S, what’s an S? Isthat a B or a C, you know? What’s unsatisfactory? Is that an F or a D?. . . They should really put it in writing and say satisfactory is B-, orsomething like that, I don’t know. Something where the student couldtake it and translate it into a grade themselves (Thomas, interview, May2, 1996).
It is thus not surprising that by the fourth quarter of 1995–96 nearly all of
Gary’s grades were done on a 5-point scale. Over the years, he also found it necessary
to provide students with markers on their progress in the language of the 5-point scale
early on in each academic quarter. In the early years of STS, he tried to leave all
discussion of grades to the end of the quarter. Assessment early in the quarter
consisted of acknowledgement of work when it was complete, and written or verbal
comments on its quality. However, he found that within the culture of the school, that
practice left the students feeling insecure:
Everywhere they are being trained that if they don’t know week byweek how they’re doing grade-wise, they feel insecure and they getangry and they get frustrated and they feel lost, so there has to be moreregular feedback and there has to be—it has to have enough resolutionto it, enough precision to it to make them comfortable (G. Magi,interview, June 7, 1996).
19
Note the “obviously.” The 5-point grading system is so common that it isthe presumed and unquestioned status quo.

195
Gary’s assessment infrastructure had the most tension with that of his school.
In contrast, Carol’s was in complete accordance with that of her school, and other than
a few students complaining that her standards were too high, she had few complaints
about the structure of her grading practices. Roger’s assessment infrastructure did
differ somewhat from that of his school, but not as drastically as Gary’s. Specifically,
Roger’s habit of giving students a zero on their daily work grade for every class
session missed, including excused absences, seemed contrary to school policy to most
students. The school did require that students make up any work missed during an
excused absence, such as labs or tests. Roger argued that his course was a lab every
day and so it was reasonable to expect students to make up missed time with him.
Nonetheless, many complained vociferously about the practice. Moreover, if it was
his intention to make certain students did not skip his class, it is not clear whether this
system had an influence one way or another. Students tended to weigh their desire to
do something else with the time set aside for Roger’s class against the consequences of
receiving a zero for the day and sometimes the desire to do something else won.
Of the three teachers, Roger was the only one who seemed to mind the
periodicity of the reporting system at each school. In particular, he worried about the
inauthentic restriction the eight- to ten-week quarters placed on students’ work:
It’s more than just grades. It’s, it’s the artificial construction of theschool year that says it’s this long, and then you’re trying to, tomandate, so to speak, within that—within that time frame and the timeframes of the school—creativity. Um. You know, like I’ve got somekids who are working on a project on—what are they working on?
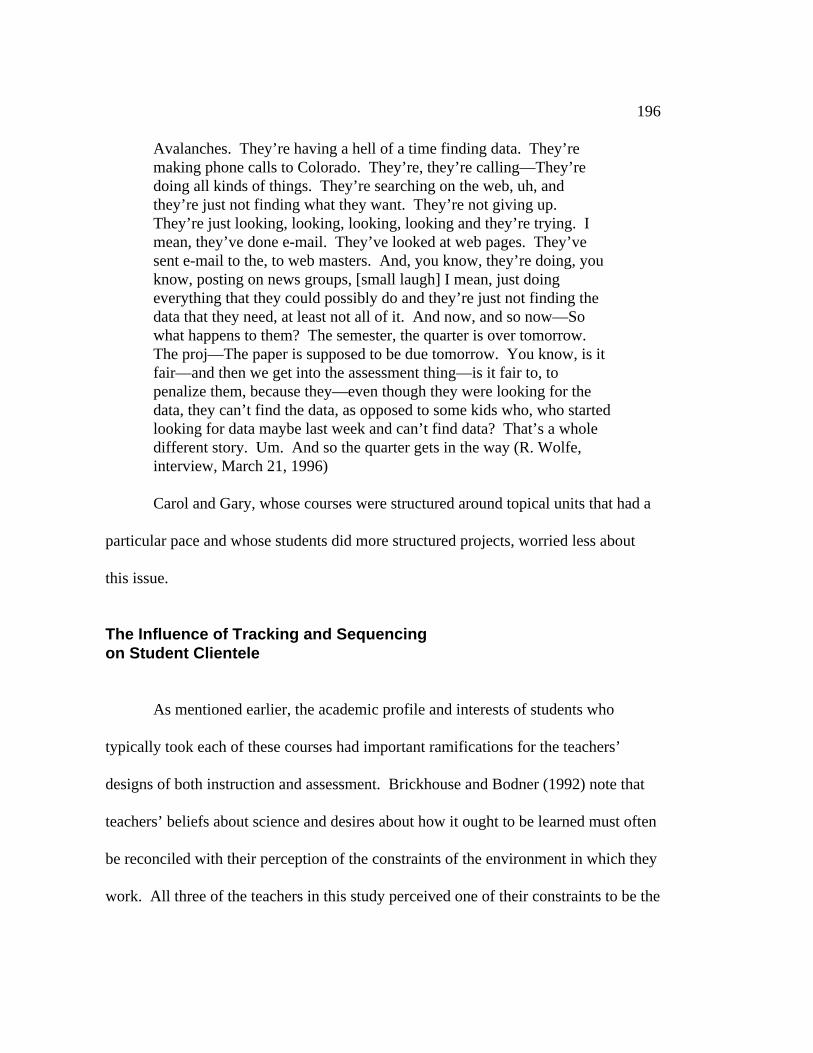
196
Avalanches. They’re having a hell of a time finding data. They’remaking phone calls to Colorado. They’re, they’re calling—They’redoing all kinds of things. They’re searching on the web, uh, andthey’re just not finding what they want. They’re not giving up. They’re just looking, looking, looking, looking and they’re trying. Imean, they’ve done e-mail. They’ve looked at web pages. They’vesent e-mail to the, to web masters. And, you know, they’re doing, youknow, posting on news groups, [small laugh] I mean, just doingeverything that they could possibly do and they’re just not finding thedata that they need, at least not all of it. And now, and so now—Sowhat happens to them? The semester, the quarter is over tomorrow. The proj—The paper is supposed to be due tomorrow. You know, is itfair—and then we get into the assessment thing—is it fair to, topenalize them, because they—even though they were looking for thedata, they can’t find the data, as opposed to some kids who, who startedlooking for data maybe last week and can’t find data? That’s a wholedifferent story. Um. And so the quarter gets in the way (R. Wolfe,interview, March 21, 1996)
Carol and Gary, whose courses were structured around topical units that had a
particular pace and whose students did more structured projects, worried less about
this issue.
The Influence of Tracking and Sequencingon Student Clientele
As mentioned earlier, the academic profile and interests of students who
typically took each of these courses had important ramifications for the teachers’
designs of both instruction and assessment. Brickhouse and Bodner (1992) note that
teachers’ beliefs about science and desires about how it ought to be learned must often
be reconciled with their perception of the constraints of the environment in which they
work. All three of the teachers in this study perceived one of their constraints to be the

197
level of dedication exhibited by the students who typically took their courses. They
link that clientele to the reputation and cachet of their course within the school system.
The perceived value of the course directly influences the students who take it.
As Roger’s statement quoted at the beginning of this section shows, these three
courses were not considered a core part of the science curriculum at either school.
Gary said of his course, “I think predominantly people think of it as fringe” (G. Magi,
interview, April 23, 1996). And Carol noted, “You know, we’re just on the periphery
here of terms of like the core curriculum. Even earth science classes now at
Edgewater are seen as the “stupid” kids’ classes, everybody knows that” (C. Patterson,
interview, July 25, 1996). Their status as elective courses outside of the biology-
chemistry-physics track expected and encouraged by colleges reviewing students’
admissions transcripts meant that they were not considered as serious science courses
for serious students among the largely college-bound student populations at these two
schools.
For example, as noted in her case study, Carol felt that her course was typically
taken by seniors who were neither serious nor particularly strong in science. She
believed that the reputation of her course as “easy, that there are low expectations” (C.
Patterson, interview, March 22, 1996), was partly due to the fact that it was an elective
course that fulfilled no graduation requirements, was not considered a serious addition
to a student’s science transcript by colleges, and was worth only 9-level credit in
Edgewater’s weighted system. She added that “The kids that are intrinsically

198
motivated about science are on the AP track. . . . So the kids that aren’t all that
motivated in pure science will take something like environmental science, which is
applied” (C. Patterson, interview, July 25, 1996). Moreover, the fact that these
uninspired science students were seniors meant that:
They aren’t the grade mongers that I’m used to having in chemistryclass. They don’t really care at that point what they get because mostof them have their applications into school, and some of them havebeen accepted already, and they know they’re probably not gonna getworse than a C which is really all that they care about, so there really isno motivation to do really high quality work (C. Patterson, interview,July 25, 1996).
She noted that these characteristics of student population had a significant
impact on her early course design work:
It made a huge impact at first, because I really wanted to do, notsophisticated things, but I wanted to do so much more that required, Idon’t know, you know, a good handle on algebra at least. People whohad thought about some of these issues fairly deeply before. I guess Ijust assumed I would get a certain level of sophistication and maturityand, um, that wasn’t the case at all (C. Patterson, interview, March 22,1996).
A simple change in the placement of the course within the school’s tracking
and sequencing system had a dramatic effect on the clientele the course was able to
draw. In the spring of 1996, the shift of Carol’s course to AP status in the following
year was announced, and as students began to select their 1996–97 courses, she noted
an increased interest in environmental science from previous years:
I’ve got a lot of activity and other kids coming in to ask me about it thatare 4-level students this year that would, again, never would haveconsidered taking it at the 9-level. So, already I’m seeing a lot more

199
activity on this course now just because we changed the numbers. Imight even have two sections next year (C. Patterson, interview, March22, 1996).
This change in the course’s cachet had the potential to attract more motivated
students, which might, in turn have allowed her to expect and encourage more
sophisticated project work from her students. However, in the spring of 1996, she was
already planning to restructure the course along very different lines due to the nature
of the topics covered on the AP exam for environmental science and believed she
might have to remove most, if not all, of the project work.
The story of Carol’s course makes the import of Roger’s statement, “Nobody
really gives a rat’s ass what I do. . . . There’s no AP earth science. . . . Colleges, you
know, kind of ignore us, which, you know, is good and bad,” clear. The periphery or
“fringe” nature of these three courses and the less academically driven student
clientele they tended to attract were exactly the reasons why the teachers had so much
flexibility in their instructional designs. However, the lack of dedication on the part of
the students lowered the expectations for quality work in the course as the teachers
adjusted their evaluation criteria somewhat to the work that students were willing to
produce. These adjusted expectations, in turn, propagated the impression that the
courses were easy ones, which perpetuated their clientele base, making it difficult for
the teachers to entirely realize the initial visions they each had of their courses. In
particular, they found it necessary to be more structured about their assessment
practices in order to encourage unmotivated students to take their work seriously.

200
When teachers did not lower their expectations for quality work, students dropped the
course, sometimes in droves. Courses that are perceived as “worth” more to the
students (e.g., an AP course) might attract a more capable and motivated student body.
On the other hand, such courses usually come with restrictions attached. They may
have mandated exams, as the AP course does, which drive the curriculum. Moreover,
official or unofficial expectations among the students, teachers, and administrators
about their content may be more rigid, making it culturally difficult to use non-
traditional forms of pedagogy.
Student Attitudes
The section above notes that the student clientele in each course had an impact
on the design of course objectives and assessment infrastructures each teacher put into
place. This section reviews student beliefs about course goals and their opinions of
the courses as a whole as well as their assessment infrastructures (D’Amico & Gomez,
1997). The data are based on likert and open-response questions asked on the
“Student Beliefs about Class Goals” survey and the “CoVis Spring Survey” taken by
students at the end of the 1995-96 school year (see Appendix D).
Opinions on the Assessment Infrastructure
Survey responses showed that students in all three courses were very confident
that they understood the means for doing well in their class, F(2, 108) = 1.2550,
p = 0.2892 (see Table 13). Likewise, they were all reasonably convinced that their

201
teachers understood what they as students knew and could do, F(2, 107) = 1.8002,
p = 0.1702 (see Table 14).
Table 13. Survey Responses to “How Well Do You ThinkYou Understand How to be a Good Student inThis Class?”
Teacher Count Mean Median StdDev
Roger 52 8.15385 9 2.09934
Gary 45 8.13333 9 2.24216
Carol 14 9.07143 9 0.730046
Note: 0 = “not at all; 10 = “very well”
Table 14. Survey Responses to “How Well Do You ThinkYour Teacher Knows What You Know and CanDo?”
Teacher Count Mean Median StdDevRoger 52 6.03846 7 2.97019Gary 44 6.81818 7.50000 2.67871Carol 14 7.42857 7.50000 2.13809
Note: 0 = “not at all; 10 = “very well”
However, they varied in their beliefs about the teachers’ abilities to let them
know what was expected in the course, F(2, 108) = 4.6466, p = 0.0116. Students in
the most open-ended course, Roger’s, were the most critical, while students in the
most traditional course, Carol’s, were the least critical (see Table 15.) They also

202
varied in the extent to which they thought the grading practices in the course were fair,
F(2, 100) = 9.3913, p = 0.0002. Roger’s students on average had fairly neutral
opinions on his grading practices, whereas Gary’s students were positive and Carol’s
were very positive (see Table 16).
Table 15. Survey Responses to “How Good Do YouThink Your Teacher is at Letting You KnowWhat S/He Expects You To Do?”
Teacher Count Mean Median StdDev
Roger 52 5.98077 6 2.57812
Gary 45 6.75556 7 2.57749
Carol 14 8.21429 9 1.67233
Note: 0 = “very bad; 10 = “very good”
Table 16. Survey Responses to “How Fair Do You ThinkYour Teacher’s Grading Practices Are?”
Teacher Count Mean Median StdDev
Roger 46 5.30435 5 2.61508
Gary 43 6.72093 7 2.43316
Carol 14 8.28571 8.50000 1.26665
Note: 1 = “extremely unfair; 10 = “extremely fair”
203
These differences in beliefs about fairness were reflected in the responses of
students to the open-ended question, “If you could change the way grading is done in
this class, is there anything you would change about it? If so, what would you
change?” 57% of 14 respondents from Carol’s class said they would change nothing,
as compared to 41% of the 44 respondents in Gary’s class and 35% of the 48
respondents in Roger’s class. The portion of the assessment infrastructure that
Roger’s students most frequently mentioned a desire to change was his daily work
grade (17%). Gary’s students most frequently mentioned a desire to change the
grading scale (11%). It seems significant that these aspects of the assessment
infrastructure are exactly those which conflict most directly with the school
assessment infrastructure. (See the earlier section entitled “The Influence of GPA on
Classroom Assessment.”)
Beliefs about Course Goals
Students were asked to rate the importance of 15 types of instructional goals on
a scale of 1 to 10, both to themselves and to their teachers. Teachers were asked to do
the same rating. These goals included:
1. Understand specific scientific concepts;
2. Perform specific scientific skills;
3. Perform specific technological skills;
4. Understand what social scientists do;
204
5. Understand what natural scientists do;
6. Do what social scientists do;
7. Do what natural scientists do;
8. Understand how previous scientific findings are applied to, inform and
contrast with new scientific findings;
9. Understand how previous scientific findings can be applied to practical
problems;
10. Understand the social, political and economic implications of scientific
findings;
11. Apply previous scientific findings to new scientific investigations;
12. Apply previous scientific findings to practical problems;
13. Develop work habits;
14. Improve interpersonal skills; and
15. Increase personal motivation and growth.
Correlations were done on these responses to determine what both teachers and
students thought were important, and how well they understood what was important to
one another. Z-scores were taken for each student and each teacher across goal types
(i.e., z-scores taken within teacher across goals, and within student across goals). The
average z-score for each question across the students for each teacher was then
calculated (n = 44 in Roger’s class; n = 14 in Carol’s class; and n = 43 in Gary’s
class). Pearson product-moment correlations were done to make the following
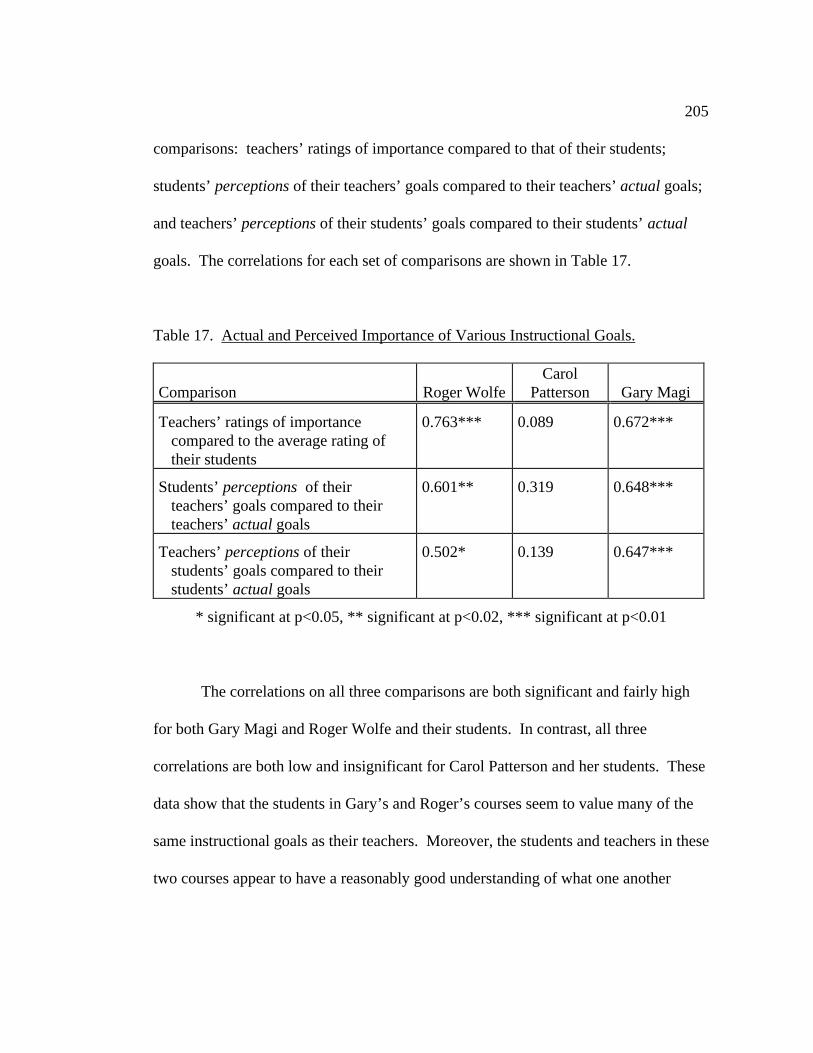
205
comparisons: teachers’ ratings of importance compared to that of their students;
students’ perceptions of their teachers’ goals compared to their teachers’ actual goals;
and teachers’ perceptions of their students’ goals compared to their students’ actual
goals. The correlations for each set of comparisons are shown in Table 17.
Table 17. Actual and Perceived Importance of Various Instructional Goals.
Comparison Roger WolfeCarol
Patterson Gary Magi
Teachers’ ratings of importancecompared to the average rating oftheir students
0.763*** 0.089 0.672***
Students’ perceptions of theirteachers’ goals compared to theirteachers’ actual goals
0.601** 0.319 0.648***
Teachers’ perceptions of theirstudents’ goals compared to theirstudents’ actual goals
0.502* 0.139 0.647***
* significant at p<0.05, ** significant at p<0.02, *** significant at p<0.01
The correlations on all three comparisons are both significant and fairly high
for both Gary Magi and Roger Wolfe and their students. In contrast, all three
correlations are both low and insignificant for Carol Patterson and her students. These
data show that the students in Gary’s and Roger’s courses seem to value many of the
same instructional goals as their teachers. Moreover, the students and teachers in these
two courses appear to have a reasonably good understanding of what one another

206
expects from the course. In contrast, Carol and her students appear to agree less over
which goals are important and to not have a good understanding what each other
considers important. This finding is interesting, particularly given the high level of
confidence about their understanding of how to be a good student in the class Carol’s
students conveyed through their survey responses (see Table 13). Hypotheses about
this difference will be explored in the following section.
Opinions on the Course as a Whole
In general, Carol’s students were on average the most positive about their
course, while Roger’s were the least positive. However, differences in the students’
average response were not statistically significant in most cases. The students found
all three courses to be somewhat challenging, F(2, 108) = 2.1816, p = 0.1178, and
thought they were learning slightly more than they did in most of their other classes,
F(2, 108) = 2.4116, p = 0.0945 (see Tables 18 and 19).
Table 18. Survey Responses to “How Challenging is ThisClass?”
Teacher Count Mean Median StdDev
Roger 52 6.15385 6 2.51571
Gary 45 6.88889 7 2.24846
Carol 14 7.42857 8 1.78516
Note: 0 = “not at all”; 10 = “very challenging”

207
Table 19: Survey Responses to “How Much Do YouThink You Are Learning in This Class?”
Teacher Count Mean Median StdDev
Roger 52 5.59615 6 2.73868
Gary 45 6.66667 7 2.96954
Carol 14 7 8 2.38586
Note: 0 = “nothing”; 10 = “much more than in most classes”
The students of each teacher differed slightly in how much they enjoyed the
class, F(2, 108) = 4.3469, p = 0.0153, and whether they thought projects were a good
way to learn science, F(2, 208) = 3.8814, p = 0.0236 (see Tables 20 and 21). In both
cases, Roger’s students felt just slightly more positive than neutral while Carol’s
students were definitely positive about both their enjoyment and their learning.
Table 20: Survey Responses to “Do You Enjoy This Class?”
Teacher Count Mean Median StdDev
Roger 52 5.98077 6 3.04535
Gary 45 6.24444 7 2.82163
Carol 14 8.42857 8.50000 1.22250
Note: 0 = “not at all;” 10 = “much more than most classes”

208
Table 21. Survey Responses to “Do You Think ProjectsAre a Good Way of Learning Science?”
Teacher Count Mean Median StdDev
Roger 52 5.80769 6 2.97070
Gary 45 7.35556 7 2.42295
Carol 14 7 8 3.21056
Note: 0 = “they’re worthless;” 10 = “they’re great”
When these results are considered in comparison to those in the two previous
sections, “Beliefs about Course Goals” and “Opinions on the Assessment
Infrastructure,” some interesting patterns and questions emerge. First, the students’
opinions about the classroom assessment infrastructure and their opinions on the
course as a whole seem to be consistent with one another. Roger’s students felt
largely neutral about both the fairness of the grading scheme and their enjoyment in
the class, whereas Carol’s were relatively positive on both counts. However,
interestingly, perceptions of enjoyment or fairness did not seem to be linked to
whether or not the teacher and students agreed about the goals of the course. Roger’s
and Gary’s students were less positive about both their courses as a whole and the
assessment infrastructures than Carol’s, yet they appeared to both understand and be in
closer agreement with their teachers about course goals than Carol’s students. This
discrepancy seems non-intuitive at first glance and deserves further comment and
hypotheses as to its cause.

209
First, it is perhaps important to remember that of the three teachers, Carol had
the most traditionally structured course. Project activity accounted for just around half
of her class time, and project work accounted for just around half of the students’
grades. Gary had similar apportionment, but due to the workshop structure of his class
and his holistic grading scheme, his non-project class time and assessment were
certainly not in a traditional format. Non-project time and assessment in Carol’s
course, however, closely corresponded to the kinds of activity and evaluations which
were probably familiar to the students from their other science classes. Moreover, as
discussed in her case study, Carol was uncomfortable failing students and gave fewer
Ds and Fs than the other two teachers. As a result, many of the students received good
grades. These factors alone may account for their positive ratings of the course and its
assessment infrastructure.
While this explanation may account for differences between Carol’s students
and the others with respect to their enjoyment of the class and their beliefs about the
fairness of the grading system, it does not account for the low correlation between
Carol and her students around the goals of the course. However, a discrepancy
between Carol’s hopes for her course and the design she eventually put into place
might. Of the three teachers, Carol made the most comments in interviews about
changes she made to her course in order to placate her students. These comments

210
conveyed a sense that she worried she was compromising her goals for the sake of
class harmony.20
For example, she said after one project cycle:
I think, I’m letting them have too much power in the class. I wouldn’tdo that in any other class except for that it’s an elective and that’salways in the back of my mind, thinking they’re here for a particularreason, and I feel badly that I’m forcing them to do something that theydidn’t bargain for. Because I lost so many kids at semester, and I justfeel like that was why (C. Patterson, interview, March 10, 1994).
Students may not have known her real goals for the course because of the
changes she made to meet their expectations. In addition, since large portions of the
course and its assessment infrastructure were fairly traditional in nature, she may not
have had to spend as much time explaining and defending its design to her students as
Roger and Gary did to theirs. She could rely to a certain extent on the established
norms of practice for activity and assessment in a science classroom at Edgewater.
Perhaps, as a result, both she and the students made unwarranted assumptions about
one another’s goals for the course.
In contrast, the ambiguity caused by students’ lack of familiarity with both the
activity and assessment infrastructures in Roger’s and Gary’s courses may have caused
them to be insecure and thus less likely to respond favorably about the course,
regardless of how much they did or did not agree with the course goals. Recall that
20
Gary had a student steering committee for his course which met once a weekto discuss plans and make recommendations. Changes to the course were made basedon those recommendations. However, Gary’s comments about such changes did notconvey the same sense of compromise that Carol’s did.

211
the components of the assessment infrastructure that Roger’s and Gary’s students
complained about most were just those that were least consistent with the assessment
norms of the school as a whole. If the difference between the norms for activity and
assessment in these two classes are so troubling, the reader might ask, why do the
students seem to be in such agreement with the teachers about what the goals of the
course ought to be? Interviews with students in Roger’s and Gary’s classes suggest
that while at least some of them agreed with the goals these teachers had for their
courses in principle, in practice they found aspects of the classes troubling. Thomas’
statement about Gary’s course in Chapter 4 is illustrative of this sentiment and so is
recalled here:
It sounded like a fun class. It really sounded exciting, and that’s why Itook it in the first place. It sounded like the type of class where you’dactually get to learn something, and learn it by yourself. You’d bemotivated to do the work. . . . We do everything they say in thepamphlet [Lakeside course guide], but it’s not as great as it sounds inreality” (Thomas, interview, May 17, 1996).
Likewise, while they may agree with the principles behind these two
assessment infrastructures, they may not like the consequences of them. For example,
when asked for his opinion on Roger’s grading system in an interview, Papi replied,
“Unfortunately, I’d have to say it’s fair, because he really judges you by what you do,”
and explained that this state of affairs was “unfortunate” because, “as a student, you
really want an A and you really want to do minimal work” (Papi, interview, May 3,
1996). Despite his disappointment that he had to work harder than he wanted in order
212
to get an A, he felt Roger’s assessment infrastructure was “honest and sincere” (Papi,
interview, May 29, 1996).
These interview data suggest that while students may like the design of these
courses in principle, the execution of them has consequences which, while
understandable, may not make them happy students. It is possible that the students
responses to the goals questions are based on their opinions of what the course should
be in principle, whereas their responses to questions about their opinions of the class
and its assessment infrastructure are based upon the course as it is actually executed.
These explanations are highly speculative in nature and require testing against
the data. A more fine-grained analysis of the student and teacher interview data with
respect to course goals than has been done so far might be helpful in this regard. (See
“Instructional Goals Interview” for teachers in Appendix A, and questions on purpose
and reputation of this class as well as their understanding of their teachers’ goals from
the winter and spring versions of the “Student Assessment Interview Guide” in
Appendix B.) In addition, a review of the observation data for frequency and depth of
conversations between teachers and students around the goals of the course and the
rationale behind the assessment design would be useful.
Cautions and Recommendations
The previous sections of this chapter have outlined the influence on teachers’
assessment designs due to the nature of project activity, the incorporation of

213
technology into classroom activity, and the norms and conventions of each school’s
assessment infrastructure. In addition, students’ reactions to the courses and their
assessment infrastructures as well as their understanding of each course’s goals were
reviewed. Based on the experiences of these teachers and students as revealed through
the above analyses, a set of cautions and recommendations can be made which may
serve as guideposts to others crafting assessment infrastructures in the service of
project-based science activity. A table summarizing the needs of students conducting
project work and the assessment strategies designed to meet them in these three
classrooms is provided, followed by a list of cautions and recommendations based
upon them.
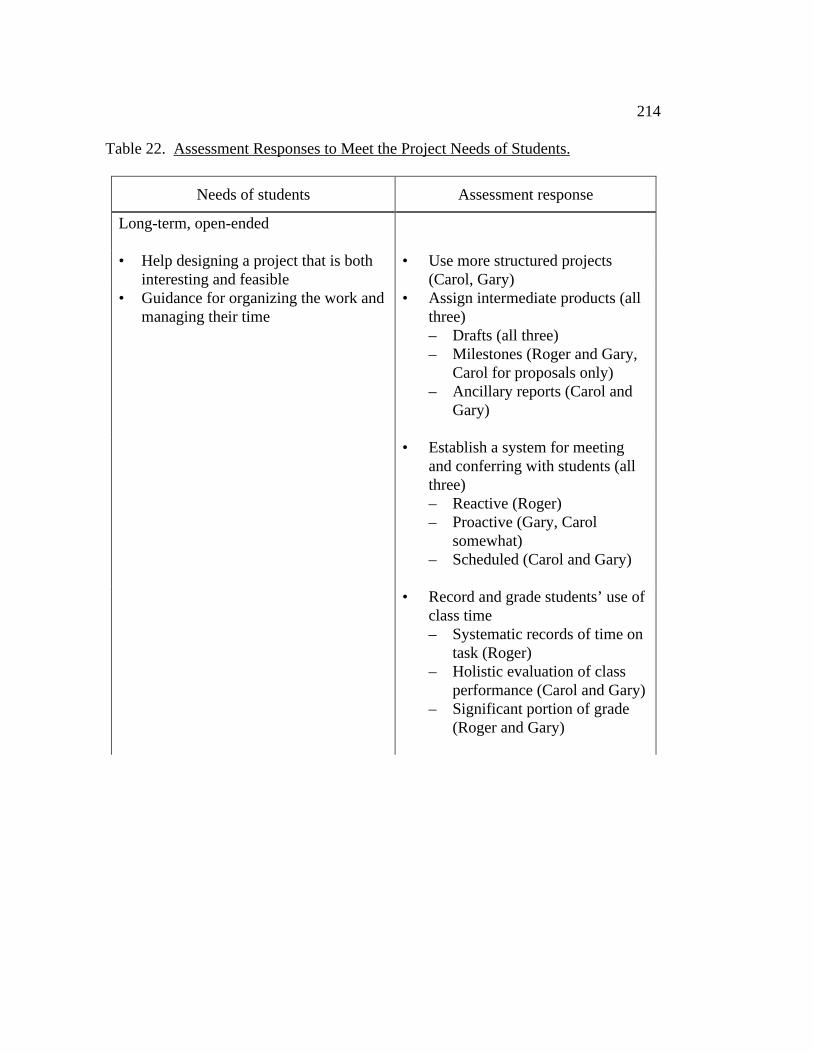
214
Table 22. Assessment Responses to Meet the Project Needs of Students.
Needs of students Assessment response
Long-term, open-ended
• Help designing a project that is bothinteresting and feasible
• Use more structured projects(Carol, Gary)
• Guidance for organizing the work andmanaging their time
• Assign intermediate products (allthree)– Drafts (all three)– Milestones (Roger and Gary,
Carol for proposals only)– Ancillary reports (Carol and
Gary)
• Establish a system for meetingand conferring with students (allthree)– Reactive (Roger)– Proactive (Gary, Carol
somewhat)– Scheduled (Carol and Gary)
• Record and grade students’ use ofclass time– Systematic records of time on
task (Roger)– Holistic evaluation of class
performance (Carol and Gary)– Significant portion of grade
(Roger and Gary)

215
Table 22. Continued.
Needs of students Assessment response
Resource intensive• Mobility for accessing resources
outside the classroom walls• Assistance finding resources
• Assign intermediate products (allthree)– Milestones (Roger and Gary,
Carol for proposals only)– Ancillary reports (Carol and
Gary)• Establish a system for meeting
and conferring with students (allthree)
• Record and grade students’ use ofclass time (all three)
• Create a pass system (Gary)Collaborative of cooperative• Advice on how to divide their labor• Interpersonal counseling when things
go wrong• Security that they won’t fail because
their partners do
• Establish a system for meetingand conferring with students (allthree)
• Record and grade students’ use ofclass time (all three)
• Record and grade students’ abilityto work in a group (all three)– Group cohesiveness grade
(Carol)– Leadership and team learning
grades (Gary)– Peer grades of contribution to
group (Roger)Iterative• Practice doing projects in order to do
them well• Second chances for improving the
work
• Assignment of intermediateproducts—drafts (all three)
• Assign more challenging projectslater in the year (Carol and Gary)
216
First, intermediate products in the form of milestones and drafts were seen as a
very useful tool by both students and teachers for guiding students work. They helped
students divide the work into its relevant subtasks and pace the accomplishment of
those subtasks, particularly with longer and more open-ended project cycles. They
provided motivation and time management supports for many students, some of whom
were neither highly dedicated to do the work, nor had particularly sharp time
management skills. Moreover, the deadlines associated with them created pressure
points that encouraged students and teachers to talk about each project team’s
progress. In contrast, intermediate products in the form of ancillary reports neither
helped the students to pace their work, nor provided adequate information to teachers
about student progress for the purposes of providing advice and feedback. These
findings suggest that teachers implementing projects, especially long-term, open-
ended ones, should incorporate intermediate products in the form of milestones and
drafts, rather than ancillary reports, into their assessment infrastructures.
Second, conferring with students during the course of their project cycles was
crucial—particularly in open-ended cycles—as it was the only way for students to get
specific assistance for their projects. The more open-ended the project, the less likely
that teachers could a priori provide guidelines that would be sufficient to the student’s
task of individual project teams. The need for conferring made interpersonal issues
between teachers and students a key consideration. Students who needed help and did
not get it, either because they did not ask or because the teacher did not know how to

217
communicate with them, were at a higher risk for project failure. These findings
suggest that teachers implementing projects, particularly open-ended ones, need to
establish a system for regular meetings with student teams and give serious thought to
how they will handle the needs of shy or interpersonally difficult students. Roger’s
experience with e-mail supports for consulting with students indicate that electronic
communications may have the potential to expand the number of students who receive
assistance from the teacher each day and provide an alternate route for obtaining
advice for some students.
Third, while students usually had the opportunity to rewrite their final reports,
the periodicity of the grade reporting system in each school did not usually allow for
sufficient time to redo the research which led to their final reports. Typically, the time
frame for the project cycles did not allow for a failed project to be redone. Therefore,
teachers had to build in assessment mechanisms that would allow them to catch
potential project failures before they happened (e.g., progress reports, conferences,
milestones). Teachers implementing project-based science in schools with similar
grading and marking routines would need to make similar provisions.
Fourth, all three teachers incorporated the evaluation of students’ work habits
and/or attitudes into their assessment infrastructures to encourage appropriate
classroom behavior, compensate students who made reasonable plans and yet ran into
unforeseen difficulties they were not able to overcome, and reward students who
contributed more than their fair share of the labor on the project. Despite the fact that

218
both teachers and students felt such assessments needed to exist, it was one of the most
frequently mentioned areas of dissatisfaction among teachers and students. Carol
Patterson’s students seemed to approve of her technique of minimizing the role of
such assessments and using them largely for compensatory purposes. Gary’s and
Roger’s techniques, on the other hand, which generated a lot of discussion about
appropriate behavior, were uncomfortable and sometimes frustrating for at least some
of the students. It is not clear whether any of the techniques used by the three teachers
actually helped students behave more appropriately in class. Thus, the findings from
this study do not suggest a clear solution to this tension.
Fifth, technology in these classrooms served as a means of expanding students’
access to the resources they needed to complete their project work, yet at the same
time was itself a resource constraint. Sometimes accessing resources or creating the
final products required in these course required sophisticated technological skills.
These findings indicate that technology is only useful for motivating student work and
for ameliorating some of the difficulties students experience with resource needs if
access and students’ ability to use it are both sufficient.
Sixth, the aspects of the teachers’ assessment infrastructures which met with
the most resistance from students were those which conflicted most with students’
cultural expectations around assessment as established by the wider assessment
infrastructure. Both Gary and Roger spent much time explaining and discussing the
aspects of their grading scheme, which seemed unusual and suspect in the students’

219
eyes. These findings suggest that teachers who wish to create assessment
infrastructures that are not easily reconciled with the school assessment infrastructure
and the norms of assessment practice it engenders, must be prepared for significant
student resistance.

220
6. CONCLUSION
“There’s a say—I can’t remember the exact saying, but—Assess whatyou value. You know? And for the student, it’s “value what you getassessed on.” . . . If they don’t know what they’re going to be assessedon, they don’t know what to value. . . . They need to know what’svaluable. . . . Especially because we’re aiming for different things inhere than in most classes, you know. It’s an alien language to beginwith” (G. Magi, interview, June 7, 1996).
Gary, described by one of his students as a “little hippie guy who’s like peace
and love and harmony” (Guido, interview, May 28, 1996), wanted more than anything
for his students to be motivated, to learn by their own desires and not by his command.
Yet even he realized that students rarely make choices based on simple desire alone.
Like the rest of us, they have obligations, commitments, and enough work that it
would be difficult to do it all well. They consider the trade-offs before them and make
choices. Those choices are based partly on desire, but also partly on expediency.
High school teachers, including Gary, know this to be true, so they place value on
what matters to them through the currency system that has the most weight within the
school culture—in this particular case, grades.
Cohen (1988) notes that the success of teachers, like other practitioners who
work in human services, is dependent upon the success of their clients, in this case, the
students. Their very dependence makes it difficult for them to choose forms of

221
teaching and learning which are complex and highly ambiguous. “When practitioners
weigh choices between more and less uncertain objectives, they also weigh how much
they are willing to depend on their client’s will and skill” (pp. 40–41 of a draft
version). Looked at in light of Cohen’s statement, the assessment infrastructure design
choices of these three teachers can be seen to a certain extent as part of a balancing act
intended to reduce the ambiguity inherent in project activity. Thus, the assessment
infrastructures created by these teachers were designed not only to evaluate kinds of
learning that could not be assessed through other means, but also to shape student
activity by communicating what was of value in this new classroom culture, using a
language with which the students were already familiar.
The case studies in Chapter 4 demonstrated the synergistic relationship
between assessment and pedagogy by outlining how each of the three teachers crafted
assessment infrastructures to support their individual interpretations of project-based
science pedagogy. The cross-case analyses in Chapter 5 explored the commonalties
and differences in their approaches in an effort to generalize about the role assessment
plays in project-based science classrooms. The findings outlined in these two chapters
focused largely on the structural aspects of classroom assessment infrastructures—
what teachers assessed, how they combined those assessments into forming a grade,
and what the customs and routines for exchanging assessment-related information and
artifacts were—and what effect they had on students’ perceptions of those goals. This

222
focus led to three key limitations in the work, all of which concerned the content that
flowed through these structures.
First, there was no systematic or deep study of the specific criteria each teacher
used when evaluating student work and performance. While general or theoretical
heuristics were discussed in interviews, the actual reasons behind the teachers’
grading decisions on particular student artifacts or activities were not reviewed.
Messages about what constituted quality work and performance in each course were
conveyed as much by what products and activities received an A as by what products
and activities were required. Insights into the messages conveyed to students through
such grading decisions are missing from the analysis. Second, there was no systematic
analysis of the content of the feedback and direction teachers gave students, neither in
the form of written handouts, in the written comments on their work, nor in the course
of conversations and meetings with students. Such feedback may be the heart of
where teaching and learning actually occurs in these classrooms. While the
assignment of intermediate products and the development of routines for meeting with
students might provide the opportunity for such teaching and learning to occur, they
do not necessarily a guarantee that it will occur, nor that it will occur in an substantive
fashion. This research is unable to answer questions about which kinds of feedback
are most productive for improving student learning and performance. Finally, there
was no evaluation of the quality of student work in each of the classes or what they
were learning through their project activity. Thus, evaluation of the “effectiveness” of

223
the classroom assessment infrastructures is confined to the perceptions that teachers
and students have about how they guided students’ priorities, activities, and
understanding of teacher expectations, and not on their ability to foster quality work or
deep understanding.
Despite these limitations, the work described here makes three contributions to
theory and practice linking assessment and educational reform. First, as indicated in
Chapter 1, there has already been considerable thought and study about the
relationship between assessment and classroom practice. This study extends and
elaborates previous theory on that relationship by providing a single conceptual
framework that encompasses all aspects of assessment at all levels of the educational
system. The model of assessment as an infrastructure enables us to consider the
complex relationships among assessment components at various levels of that system
with classroom practice. Previous work has tended to consider the influence on
practice of only one component of the assessment infrastructure at a time, such as the
systemic effects of large-scale testing, or the design of alternative classroom
assessment techniques for particular instructional purposes. However, as the
discussion of Gary’s efforts to use a 3-point grading scale in his classroom indicates,
the assessment infrastructure as a whole creates strong norms of practice. Changes to
any one piece of the infrastructure in isolation are difficult to make if they conflict
with those norms. Practitioners such as Gary must take into consideration the multiple
assessment influences that emerge from all levels of the educational system when

224
crafting classroom assessments to meet their instructional needs. Educational
researchers and designers might profit from taking a similarly integrative view.
Second, two taxonomies were provided which may assist instructional
designers to devise classroom practices, as well as supporting technologies and
assessment infrastructures, that will enable students and teachers to meet the
challenges of inquiry-based educational reforms. The first of these taxonomies lists
four major challenges inherent in project-based science: the long-term, open-ended
nature of the activity; the resource-intensive nature of the activity; the collaborative or
cooperative nature of the activity; and the iterative nature of the work. The second
describes the components the teachers included in their assessment infrastructures to
meet these challenges: final products; intermediate products (milestones, drafts, and
ancillary reports); routines for face-to-face conferences between teachers and students;
and records of students’ classroom behavior and work habits. All three teachers faced
these same challenges and used these same assessment components despite differences
in their instructional goals and interpretations of project-based pedagogy. This
commonalty suggests that the two taxonomies may be useful as a framing tool for
research or design in other inquiry contexts.
Finally, a set of specific cautions and recommendations were provided at the
end of Chapter 5. Common assessment infrastructure components and strategies used
by all three teachers were compared, and consistent successes and difficulties were

225
highlighted. These observations may be useful as guideposts to assessment
infrastructure design for those intending to implement project-based science pedagogy.
These taxonomies, cautions, and recommendations are based upon classroom
activity in fairly particular settings and may have limited explanatory power outside
them. Future research might profitably explore those limitations by examining the
role of assessment infrastructures in other settings where inquiry-based instruction is
pursued. For example, assessment can only serve to guide student activity if students
value their grades. The role of assessment infrastructures in classrooms with students
who may be less aware of, or concerned with, their grades, such as very young
students, may be quite different than it was in these classrooms where the vast
majority of the students were worried about college entrance criteria. Large-scale
testing had very little impact on the instructional and assessment design decisions of
these teachers. In other school settings, and even in other courses within these two
schools, such testing might have a more profound impact, which in turn might change
the way the teachers develop assessment infrastructures to support the project science
activity of their students. Likewise, assessment infrastructures would probably be at
least somewhat different in schools that use different forms of reporting student
performance other than the weighted GPA system in these two schools. As discussed
in Chapter 5 (“Cross-Case Analyses”), the elective and “fringe” nature of these
courses meant that they tended to attract a particular kind of student clientele, which in
turn influenced some of the assessment design choices made by the teachers. Courses

226
within the traditional sequence taken by college-bound students, such as biology,
chemistry, and physics, might attract a different clientele with whom the teachers
would use different assessment strategies.
The contextual factors to explore, as described so far, are those largely outside
the teachers’ hands—student populations and wider assessment infrastructure design.
A key contextual factor to explore within the teachers’ hands is the form of inquiry-
based curriculum being pursued. Inquiry-based approaches vary widely, and despite
their differences, these three teachers are clustered fairly close together in one area of
that space. Chapter 5 explored to some extent the interaction between structure and
assessment in project-based pedagogy design. However, all of the project cycles
discussed were open-ended ones. None of them had a particular “answer” for students
to find and none of them provided a particular data set for the students to explore as
some successful inquiry activities and learning environments do. Inquiry-based
approaches with different structural aspects than the forms of project-based pedagogy
described here may have different challenges and therefore may require different
assessment infrastructures to guide and evaluate students’ work.
Regardless of the form of inquiry being pursued, changing the practices of
teaching and learning, as well as the values which define classroom culture to support
inquiry, is not an easy task. These teachers found it to be a formidable one. Often
things did not go well, especially in their early attempts. It was an ongoing process for
all three teachers, usually based on trial and error. Each teacher experienced one to

227
two years each of radical reconstruction before settling down into small scale
tinkering. In that time, students whined a lot, often about their grades. Some even
dropped the course. Project cycles fizzled, and particular project teams failed outright.
Sometimes, the teachers would look at the work their students had produced after
much time and effort and think to themselves, as Carol did, “I just feel sick because
this is what happened in four weeks time, sometimes five weeks time . . . and I have
nothing tangible to look at and say, ‘Boy, this has really been time well spent’” (C.
Patterson, interview, July 25, 1996).
Given all the challenges associated with establishing a project-based science
classroom and its supporting assessment infrastructure, one might reasonably ask,
“Why pursue it at all?” In Chapter 1 it was argued that traditional forms of science
education do not develop adequate forms of scientific understanding or practice.
Concerns about this inadequacy have led to calls for learning activities that are
inquiry-based and engage students with the complexities of scientific knowledge and
practice. Project-based science pedagogy fits this profile. But perhaps the words of
one of Roger’s students will be more persuasive:
Because you’re going to do it for the rest of your life! I mean all thisother shit that you’re doing in school you’re never going to use again. You’re never going to have to write a five-paragraph essay and havesomeone critique it. You’re going to have to have to ask yourselfquestions and find out the information. It’s very realistic. It’s just apain in the butt after three years of specific rules and regulations to becompletely broken of that (Tweed, interview, February 16, 1996).
228
For those who wish to make the attempt, this thesis has described the
assessment infrastructures designed by three mature project-based science teachers.
Each had very different instructional goals, yet each created infrastructures based on
the same basic set of assessment components. Each design involved trade-offs, and
each was imperfect. Nonetheless, all three made very real progress toward breaking
students of the “specific rules and regulations” habit Tweed describes. This is an
essential first step toward helping students learn how to engage in the practices of
complex domains such as science.
229
REFERENCES
Aiken, W. M. (1942). The story of the eight-year study. New York: Harper &Brothers.
Airasian, P. W., & Jones, A. M. (1993). The teacher as applied measurer: Realities ofclassroom measurement and assessment. Applied Measurement in Education, 6(3),241–254.
Alberty, H. B. (1927). A study of project method in education. Columbus, OH: OhioState University Press.
American Association for the Advancement of Science (1990). Science for allAmericans. New York: Oxford University Press.
American Association for the Advancement of Science (1993). Benchmarks forscience literacy. New York: Oxford University Press.
Archambault, R. D. (Ed.). (1964). John Dewey on education: Selected writings.Chicago, IL: University of Chicago Press.
Austin, S. & McCann, R. (1992, March). "Here's another arbitrary grade for yourcollection": A statewide study of grading policies. Paper presented at the annualmeeting of the American Educational Research Association, San Francisco, April23, 1992.
Bazerman, C. (1988). Shaping written knowledge: The genre and activity of theexperimental article in science. Madison, WI: University of Wisconsin Press.
Blumenfeld, P., Soloway, E., Marx, R., Krajcik, J. S., Guzdial, M., & Palinscar, A.(1991). Motivating project-based learning. Educational Psychologist, 26(3&4),369–398.
Brickhouse, N. & Bodner, G. M. (1992). The beginning science teacher: Classroomnarratives of convictions and constraints. Journal of Research in Science Teaching,29(5), 471–485.

230
Brookhart, S. M. (1993). Teachers’ grading practices: Meaning and values. Journal ofEducational Measurement, 30(2), 123–142.
Brookhart, S. M. (1994). Teachers’ grading: Practice and theory. AppliedMeasurement in Education, 7(4), 279–301.
Brown, J. S., Collins, A., & Duguid, P. (1989). Situated cognition and the culture oflearning. Educational Researcher, 18(1), 32–42.
Bruner, J. S. (1990). Acts of Meaning. Cambridge, MA: Harvard University Press.
Carey, S., Evans, R., Honda, M., Jay, E., and Unger, C. (1989). “An experiment iswhen you try it and see if it works”: A study of grade 77 students’ understandingof the construction of scientific knowledge. International Journal of ScienceEducation, 11(special issue), 514–529.
Cohen, D. K. (1988). Teaching practice: Plus ça change . . . In P. Jackson (Ed.),Contributing to educational change: Perspectives on research and practice.Berkeley, CA: McCutchan.
Collins, A. (1994, March 28). Educational assessment. Unpublished manuscript.
Collins, A., Brown, J. S., & Newman, S. E. (1989). Cognitive apprenticeship:Teaching the crafts of reading, writing, and mathematics. In L. B. Resnick (Ed.),Knowing, learning, and instruction: Essays in honor of Robert Glaser (pp. 453–494). Hillsdale, NJ: Erlbaum.
Collins, A., Hawkins, J., & Frederiksen, J. R. (1993). Three different views ofstudents: The role of technology in assessing student performance. The Journal ofthe Learning Sciences, 3(2), 205-217.
Cremin, L. (1961). Transformation of the school. New York: Alfred A. Knopf.
Cummings, E. E. (1962). 73 Poems. New York, NY: Harcourt Brace Jovanovich,Publishers.
D’Amico, L. (1996). The role of assessment infrastructures in crafting project basedscience classrooms. In D. C. Edelson & E. A. Domeshek (Eds.), Proceedings ofthe International Conference on the Learning Sciences, July 25–27, 1996,Northwestern University, Evanston, IL. Charlottesville, VA: Association for theAdvancement of Computing in Education.
231
D’Amico, L. (1999, April). The implications of project-based pedagogy for theclassroom assessment infrastructures of science teachers. Paper presented at theAnnual Meeting of the American Educational Research Association, April 19–23,1999, Montreal, Quebec, Canada.
D’Amico, L. & Gomez, L. M. (1997, March). Student beliefs about learning in projectscience classes. Poster presented at the 1997 Annual Meeting of the AmericanEducational Research Association, Chicago, IL.
D’Amico, L., Gomez, L. M., & McGee, S. (1994). A case study of student and teacheruse of projects in a distributed multimedia learning environment. Paper presentedat the Educational Testing Service Conference on Natural Language ProcessingTechniques and Technology in Assessment and Education, Educational TestingService, Princeton, NJ.
Darling-Hammond, L., & Ancess, J. (1994). Graduation by portfolio at Central ParkEast Secondary School. New York: The National Center for RestructuringEducation, Schools, and Teaching at Teachers College, Columbia University.
Darling-Hammond, L., Ancess, J., & Falk, B. (1995). Authentic assessment in action:Studies of schools and students at work. New York, NY: Teachers College Press.
Dewey, J. (1897). The psychological aspects of the school curriculum. In J. A.Boydston (Ed.), John Dewey, The Early Works, 1882–1898: Vol. 5. 1895–1898(pp. 164–176). Carbondale, IL: Southern Illinois University Press.
Edelson, D. C. (in press). Addressing the challenges of inquiry-based learning throughtechnology and curriculum design. Journal of the Learning Sciences.
Erickson, F. (1986). Qualitative methods in research on teaching. In M. C. Wittrock(Ed.), Handbook of Research on Teaching (3rd ed., pp. 119–161). New York:MacMillan.
Finkle, S. L., & Torp, L. L. (1994). Introductory documents. Illinois Mathematics andScience Academy, Center for Problem-Based Learning.
Fischer, C. S. (1987). The revolution in rural telephony, 1900–1920. Journal of SocialHistory, 5–26.
Frary, R. B., Cross, L. H., & Weber, L. J. (1992, April). Testing and grading practicesand opinions in the nineties: 1890s or 1990s? Paper presented at the AnnualMeeting of the National Council on Measurement in Education, San Francisco.

232
Frederiksen, J. R., & Collins, A. (1989, December). A systems approach toeducational testing. Educational Researcher, 27–32.
Freedman, S. W. (1993). Linking large-scale testing and classroom portfolioassessments of student writing. Educational Assessment, 1(1), 27–52.
Glaser, R., & Silver, E. (1994). Assessment, testing, and instruction: Retrospect andprospect. In L. Darling-Hammond (Ed.), Review of Research in Education (Vol.20). Washington, D.C.: American Educational Research Association.
Gomez, L. M., Gordin, D. N., & Carlson, P. (1999). Adventurous teaching forauthentic science learning: Project science meets global warming in a technology-rich class. Manuscript in preparation.
Gordin, D. N., Polman, J. L., & Pea, R. D. (1994). The climate visualizer: Sense-making through scientific visualization. Journal of Science Education andTechnology, 3(4), 203–226.
Guskey, T. R. (Ed.). (1994). High stakes performance assessment: Perspectives onKentucky’s educational reform. Thousand Oaks, CA: Corwin Press.
Guskey, T. R. (1996). Reporting on student learning: Lessons from the past—Prescriptions from the future. In T. R. Guskey (Ed.), Communicating studentlearning: ASCD 1996 Yearbook (pp. 13–24). Alexandria, VA: Association forSupervision and Curriculum Development.
Hawkins, J., & Pea, R. D. (1987). Tools for bridging the cultures of everyday andscientific thinking. Journal of Research in Science Teaching, 24(4), 291–307.
Herman, J. L., Aschbacher, P. R., & Winters, L. (1992). A practical guide toalternative assessment. Alexandria, VA: Association for Supervision andCurriculum Development.
Kirschenbaum, H., Rodney, N., & Simon, S. B. (1971). Wad-ja-get? The gradinggame in American education. New York, NY: Hart.
Krajcik, J. S. (1993). Learning science by doing science. In R. Yager (Ed.), Whatresearch says to the science teacher: Science, society and technology. Washington,D. C.: National Science Teacher Association.
Kulm, G., & Malcom, S. M. (Eds.). (1991). Science assessment in the service ofreform. Washington, D.C.: American Association for the Advancement of Science.
233
Lane, S., Parke, C. & Moskal, B. (1992). Principles for developing performanceassessments. Paper presented at the 1992 Annual Meeting of the AmericanEducational Research Association.
Latour, B., & Woolgar, S. (1979). Laboratory life: The construction of scientific facts.Princeton, NJ: Princeton University Press.
Lave, J. (1990). The culture of acquisition and the practice of understanding. In R. S.J. Stigler, & G. Herdt (Ed.), Cultural psychology: Essays on comparative humandevelopment (pp. 309–328). New York: Cambridge University Press.
Lave, J., & Wenger, E. (1991). Situated learning: Legitimate peripheral participation.Cambridge: Cambridge University Press.
Lederman, N. G. (1992). Students’ and teachers’ conceptions of science: A review ofthe research. Journal of Research in Science Teaching, 28(4), 331–359.
Lemann, N. (1995a, September). The great sorting. The Atlantic Monthly, 276, 84–100.
Lemann, N. (1995b, August). The structure of success in America. The AtlanticMonthly, 276, 41–60.
Lento, E. M. (Ed.). (1995). CoVis teacher resource guide. Learning throughCollaborative Visualization Project, School of Education and Social Policy,Northwestern University.
Lento, E. M. (1996). CoVis Interschool Activities: An outreach aimed at building acommunity of learners. Paper presented at the Second International Conference onthe Learning Sciences, Evanston, IL.
Lento, E. M., Dharkar, A., & Gomez, L. M. (1999). It’s the practice: When and whyteachers talk on listservs. Paper presented at the Annual meeting of the AmericanEducational Research Association, Montréal, Québec, Canada.
Lento, E. M., O’Neill, D. K., & Gomez, L. M. (1998). Integrating Internet servicesinto school communities? In C. Dede (Ed.), ASCD 1998 yearbook: Learning withtechnology (pp. 141–168). Alexandria, VA: Association for Supervision andCurriculum Development.
Linn, M. C., Songer, N. B., & Lewis, E. L. (1991). Overview: Students’ models andepistemologies of science. Journal of Research in Science Teaching, 28(9), 729–732.
234
Marx, R. W., Blumenfeld, P. C., Krajcik, J. S., & Soloway, E. (1997). Enactingproject-based science: Challenges for practice and policy. Elementary SchoolJournal, 97, 341–358.
Marzano, R. J., Pickering, D., & McTighe, J. (1993). Assessing student outcomes:Performance assessment using the dimensions of learning model. Alexandria, VA:Association for Supervision and Curriculum Development.
McGee, S. M.. (1996). Designing curricula based on science communities of practice.Unpublished doctoral dissertation, Northwestern University, Evanston, IL.
McKillip, P. A. (1979). Harpist in the Wind. New York, NY: Ballantine Books.
MESA, Inc. (1996). School district detailed characteristics profile [for “Lakeside” and“Edgewater”]. In Sunspace Internet service [On-line database]. (1996). Available:http://www.sunspace.com.
Messick, S. (1994). The interplay of evidence and consequences in the validation ofperformance assessments. Educational Researcher, 23(2), 13–23.
Myers, G. (1990). Writing biology: Texts in the social construction of scientificknowledge. Madison, WI: University of Wisconsin Press.
National Research Council. (1996). National science education standards.Washington, D. C.: National Academy Press.
New Standards Project. (1997). New standards performance standards: Vol. 1.Elementary school. Harcourt Brace.
O’Neill, D. K. (1997, March). Bluffing their way into science: Analyzing students’appropriation of the Research Article genre. Paper presented at the AnnualMeeting of the American Educational Research Association, Chicago, IL.
O’Neill, D. K. (1998). Engaging science practice through science practitioners:Design experiments in K–12 telementoring. Unpublished doctoral dissertation,Northwestern University.
O’Neill, D. K., & Gomez, L. M. (1998, November). Sustaining mentoringrelationships on-line. Paper presented at the ACM Conference on Computer-Supported Cooperative Work, Seattle, WA.
O’Neil, J. (1993). On the new standards project: A conversation with Lauren Resnickand Warren Simmons. Educational Leadership, 50(5), 17–21.
235
Papert, S. (1980). Mindstorms: Children, computers, and powerful ideas. New York:Basic Books.
Patton, M. Q. (1990). Qualitative evaluation and research methods. (2nd ed.).Newbury Park, CA: Sage Publications.
Pea, R. D. (1987). Socializing the knowledge transfer problem. International Journalof Educational Research, 11, 639–663.
Pea, R. D. (1992). Practices of distributed intelligence and designs for education. In G.Salomon (Ed.), Distributed cognitions (pp. 89–132). New York: CambridgeUniversity Press.
Pea, R. D. (1993). The collaborative visualization project. Communications of theACM, 36(5), 60–63.
Pea, R. D., & Gomez, L. M. (1992). Distributed multimedia learning environments:Why and how? Interactive Learning Environments, 2(2), 73–109.
Pea, R. D., Gomez, L. M., & Edelson, D. C. (1995). Science education as a driver ofcyberspace technology development. Paper presented at the INET ’95.
Polman, J. L. (1996, July). Bootstrapping a community of practice: Learning scienceby doing projects in a high school classroom. Paper presented at the InternationalConference on the Learning Sciences, Evanston, IL.
Polman, J. L. (1997). Guiding science expeditions: The design of a learningenvironment for project-based science. Unpublished doctoral dissertation,Northwestern University, Evanston, IL.
Polman, J. L. (in press). Guiding science expeditions: The design of a learningenvironment for project-based science. New York: Teachers College Press.
Resnick, D. (1982). History of educational testing. In W. R. Garner & A. K. Wigdor(Eds.), Ability testing: Uses consequences and controversies: Part II.Documentation Section (pp. 173–194). Washington, D.C.: National AcademyPress.
Resnick, L. B., & Resnick, D. P. (1991). Assessing the thinking curriculum: New toolsfor educational reform. In B. R. Gifford & M. C. O’Connor (Eds.), Changingassessments: Alternative views of aptitude, achievement and instruction. Boston,MA: Kluwer.

236
Ruopp, R., Gal, S., Drayton, B., & Pfister, M. (Eds.). (1993). LabNet: Toward acommunity of practice. Hillsdale, NJ: Erlbaum.
Schank, R. C., & Jona, M. Y. (1991). Empowering the student: New perspectives onthe design of teaching systems. The Journal of the Learning Sciences, 1(1), 7–35.
Shavelson, R. J., Baxter, G. P. & Pine, J. (1992, May). Performance assessments:Political rhetoric and measurement reality. Educational Researcher, 22–27.
Sheingold, K., Heller, J. I., & Paulukonis, S. T. (1995). Actively Seeking Evidence:Teacher Change through Assessment Development (94–104). Princeton, NJ:Center for Performance Assessment, Educational Testing Service.
Shepard, L. A. (1997). Insights gained from a classroom-based assessment project(CSE Technical Report 451). Los Angeles, CA: Center for Research onEvaluation, Standards and Student Testing (CRESST), Graduate School ofEducation and Information Studies, University of California, Los Angeles.
Starch, D., & Elliott, E. C. (1912). Reliability of the grading of high school work inEnglish. School Review, 20, 442–457.
Starch, D., & Elliott, E. C. (1913a). Reliability of grading work in history. SchoolReview, 21, 676–681.
Starch, D., & Elliott, E. C. (1913b). Reliability of grading work in mathematics.School Review, 21, 254–295.
Stein, G. (1937). Everybody’s autobiography. Cambridge, MA: Random House.
Stiggins, R. J., & Bridgeford, N. J. (1985). The ecology of classroom assessment.Journal of Educational Measurement, 22(4), 2771–2286.
Stiggins, R. J., & Conklin, N. F. (1992). In teachers’ hands: Investigating thepractices of classroom assessment. Albany, NY: State University of New YorkPress.
Stiggins, R. J., Frisbie, D. A., & Griswold, P. A. (1989). Inside high school gradingpractices: Building a research agenda. Educational Measurement: Issues andPractice, 8(2), 5–14.
Sunspace Internet service. See MESA, Inc.

237
Swales, J. (1990). Genre analysis: English in academic and research settings. NewYork: Cambridge University Press.
Vickers, M. (1996). New directions in the assessment of high school achievement:Cross national perspectives. In L. B. Resnick & J. G. Wirt (Eds.), Linking schooland work: Roles for standards and assessment (pp. 341–380). San Francisco, CA:Jossey-Bass.
Wasley, P. A. (1994). Stirring the chalkdust: Tales of teachers changing classroompractice. New York: Teachers College Press.
Wertsch, J. V. (1985). Vygotsky and the social formation of the mind. Cambridge,MA: Harvard University Press.
Wertsch, J. V. (1991). Voices of the mind: A sociocultural approach to mediatedaction. Cambridge, MA: Harvard University Press.
Whitehead, A. N. (1929). The aims of education. New York: MacMillan.
Wiggins, G. (1993, November). Assessment: Authenticity, context and validity. PhiDelta Kappan, 200–214.
Wolf, D. P. (1989, April). Portfolio assessment: Sampling student work. EducationalLeadership, 35–39.