THE ROLE OF ACCOUNTING RATIO ANALYSIS IN ...
46
THE ROLE OF ACCOUNTING RATIO ANALYSIS IN MEASURING FINANCIAL PERFORMANCE OF A FIRM A CASE OF MUKWANO GROUP OF COMPANIES BY ALIGANYIRA JOHNSON REG NO: 1164—05014-09566 A DISSERTATION SUBMITTED TO THE COLLEGE OF ECONOMICS AN1~ MANAGEMENT IN PARTIAL FULFILLMENT OF THE REQUIREMENT FOR THE AWAR]~ OF A BACHELOR’S DEGREE OF BUSINESS ADMINISTRATION OF KAMPALA INTERNATIONAL UNIVERSITY FEBRUARY, 2019
-
Upload
khangminh22 -
Category
Documents
-
view
0 -
download
0
Transcript of THE ROLE OF ACCOUNTING RATIO ANALYSIS IN ...

THE ROLE OF ACCOUNTING RATIO ANALYSIS IN MEASURING FINANCIAL
PERFORMANCE OF A FIRM A CASE OF MUKWANO
GROUP OF COMPANIES
BY
ALIGANYIRA JOHNSON
REG NO: 1164—05014-09566
A DISSERTATION SUBMITTED TO THE COLLEGE OF ECONOMICS
AN1~ MANAGEMENT IN PARTIAL FULFILLMENT OF THE
REQUIREMENT FOR THE AWAR]~ OF A BACHELOR’S
DEGREE OF BUSINESS ADMINISTRATION OF
KAMPALA INTERNATIONAL
UNIVERSITY
FEBRUARY, 2019

DECLARATION
I ALIGANYIRA JOHNSON declare that this is my origina work and to the best of my
knowledge, it has never been submitted to any University or institution for a degree award.
Signed ~ Date..~J ?~L.2°ALIGANYIRA JOHNSON
1164—05014-09566

APPROVAL
This research report has been submitted for examination with my approval as a university
examination supervisor.
Sign Date...~~J~J~° 7’MS. TURAItIIRWt~,LOVENCE
(Supervisor)

DEDICATION
I have dedicated this work to my beloved parents Mr. Nyarubona Collins and Mrs.
Barnanyisa Eve, elder brothers Rugenyi Jean, Babyenda Timothy, Sunday Godfrey, Ruweza
Torn and Nyurnbayabo Bernard plus my sister Byaruhwenda Mary for their endless support,
up bring and care since childhood. Love you and may the almighty God reward you
abundantly.
III

ACKNOWLEDGEMENT
I acknowledge that my success is due to the Almighty God who has enabled me to produce
this work for His mercy and good will.
Sincere thanks go to my supervisor Mrs. Turabiirwe Lovence for the great support and
guidance she has given me in compiling the five chapters inside this research dissertation,
thank you very much.
Special appreciation goes to my relatives and all my friends for the moral and psychological
support they rendered to me during my stay at Kampala international university.
Lastly appreciation goes to all Business Administration students and the head of department
for the good knowledge they imparted on to me for accomplishment of this course.
iv

TABLE OF CONTENTS
DECLARATION
APPROVAL ii
DEDICATION iii
ACKNOWLEDGEMENT iv
TABLE OF CONTENTS v
LIST OF ACRONYMS viii
LIST OF FIGURES ix
LIST OF TABLES x
ABSTRACT xi
CHAPTER ONE
INTRODUCTION OF THE STUDY
1.0 Introduction I
1.1 Background of the study
1.2 Statement of the Problem 2
1.3 Purpose of the study 3
1.4 Objectives of the Study 3
1.4.1 General Objective 3
1.4.2 Specific objectives 3
1.5 Research questions 3
1.6 Scope of the study 4
1.6.1 Geographical scope 4
1.6.2 Time scope 4
1.6.3 Content scope 4
1.7 Significance of the Study 4
1.8 Conceptual framework 5
CHAPTER TWO 6
LITERATURE REVIEW 6
2.Olntroduction 6
2.1 Review of the key concepts 6
2.1.1 Financial ratio 6
2.1.2 Financial Performance 6
2.2 Forms of ratio used by organizations 6
v

2.2.1 Cash flow ratios .6
2.2.2 Leverage (debit) Financial Ratios 7
2.2.3 Liquidity (solvency) Financial Ratios 7
2.2.4 Financial Operation Ratios (Asset Efficiency) ratios 7
2.2.5 Profitability Financial Ratios 8
2.2.6 Valuation ratios (market value ratios) 8
2.3 Role of accounting ratio analysis in measuring financial performance of organizations 8
2.4 Limitations of ratio analysis in measuring performance of organizations 10
2.5 Conclusion 12
CHAPTER THREE 13
METHODOLOGY 13
3.1 Introduction 13
3.2Research design 13
3.3Study population 13
3.4Sample size 13
3.5Sampling Techniques and Procedures 14
3.5.1 Simple Random Sampling 14
3.5.2Purposive Sampling 14
3.6 Data collection methods 14
3.6.1 Primary data 15
3.6.2Secondary Data 15
3.7Data collection instruments 15
3.7.1 Self-Administered Questionnaires 15
3.8Validity and Reliability 15
3.8.1 Validity 15
3.8.2 Reliability 15
3.9 Data Collection Procedures 16
3.loDataAnalysis 16
3.11 Ethical Considerations 16
CHAPTER FOUR 17
PRESENTATION OF RESULTS! FINIMNGS 17
4.1 Introduction 17
4.2 General Findings 17
4.3 Questionnaires Distributed and Returned 17
vi

4.4 Presentation of the findings according to the objectives 20
4.5 To find out the role of accounting ratio analysis in measuring financial performance of
Mukwano Group of Companies 23
4.6 To find out whether there are limitations of ratio analysis in measuring Performance of
Mukwano Group of Companies Limited 24
CHAPTER FIVE 25
CONCLUSIONS AND RECOMMENDATIONS 25
5.1 Introduction 25
5.2 Conclusion 25
5.3 Recommendations 26
5.3.1 Forms of ratio used by Mukwano to measure performance 26
5.3.2 Role of accounting ratio analysis in measuring financial performance 26
5.3.3 Limitations of ratio analysis in measuring performance 26
5.4 Areas for further research 27
REFERENCES 28
APPEN]MXI 31
QUESTIONNAIRE SCHEDULE 31
APPENDIX II 34
Sample Size for the Given Population Sizes 34
vii

LIST OF ACRONYMS
CPA Certified Public Accountants
SAQs Self-Administered Questionnaire
UK United Kingdom
USA United States of America
VIII

LIST OF FIGURES
Figure 1.1 shows the Conceptual framework 5
Figure 4.1 shows Age of the respondents 18
ix
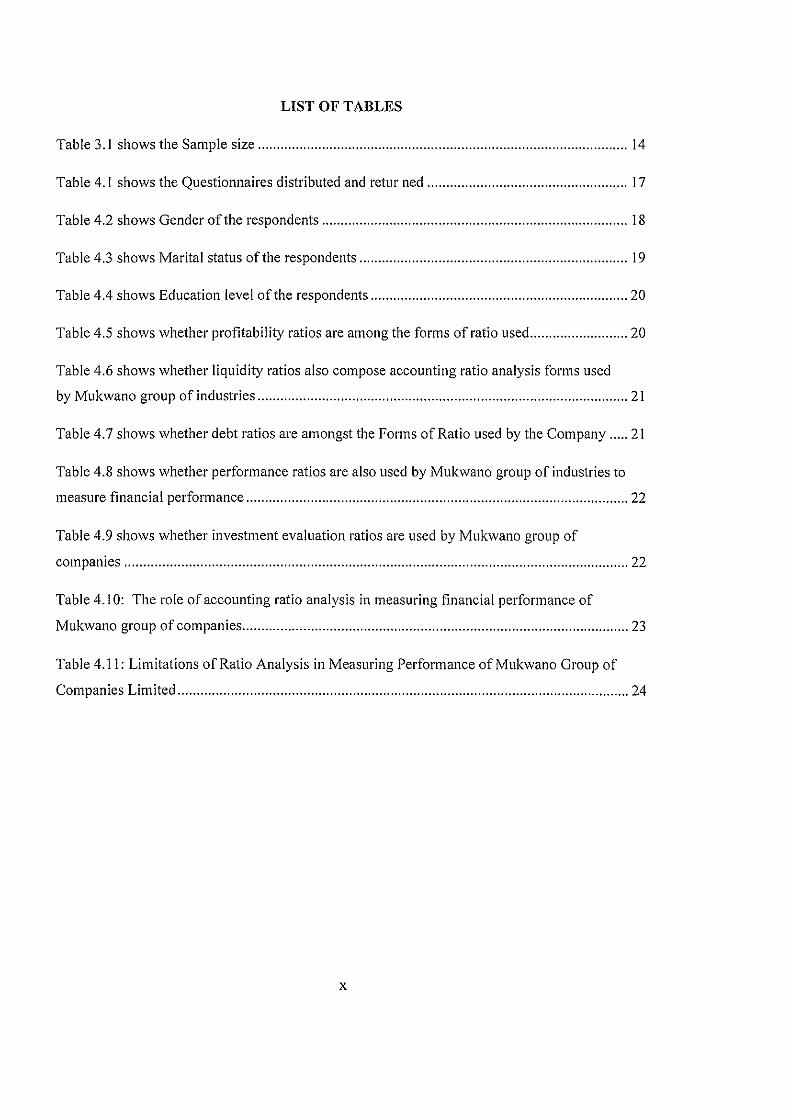
LIST OF TABLES
Table 3.1 shows the Sample size 14
Table 4.1 shows the Questionnaires distributed and retur ned 17
Table 4.2 shows Gender of the respondents 18
Table 4.3 shows Marital status of the respondents 19
Table 4.4 shows Education level of the respondents 20
Table 4.5 shows whether profitability ratios are among the forms of ratio used 20
Table 4.6 shows whether liquidity ratios also compose accounting ratio analysis forms used
by Mukwano group of industries 21
Table 4.7 shows whether debt ratios are amongst the Forms of Ratio used by the Company 21
Table 4.8 shows whether performance ratios are also used by Mukwano group of industries to
measure financial performance 22
Table 4.9 shows whether investment evaluation ratios are used by Mukwano group of
companies 22
Table 4.10: The role of accounting ratio analysis in measuring financial performance of
Mukwano group of companies 23
Table 4.11: Limitations of Ratio Analysis in Measuring Performance of Mukwano Group of
Companies Limited 24
x

ABSTRACT
The purpose of this study was to investigate the role of Accounting Ratio analysis in
measuring financial performance of Mukwano Group of Companies. The study was guided
by three research objectives specifically to identify the different forms of ratio used by
Mukwano group of companies, determine the role of accounting ratio analysis in measuring
financial performance and identi1~’ the limitations of ratio analysis in measuring performance.
The study was covered using a cross sectional and a case study research designs which
seemed applicable for the research based on Accounting Ratio Analysis. The study was based
on a Self-Administered Questionnaire (SAQs) which were used because they are the most
suitable in a survey that involves a large number of respondents. A total of 108 employees
were randomly selected, although at last only 74 were retrieved. Data was analyzed using
frequency tables and percentages and the study concluded that despite the achievements, gaps
between this accounting ratio and performance still exist for example false accounting,
comparison is not possible if different firms adopt different accounting policies, Ratio
analysis becomes less effective due to price level changes and Lack of proper standards
affects the appropriateness of ratio analysis. The study recommends the organization to
provide a good proper working condition for accomplishment of the assigned tasks which
should be backed by eenhancement of employee involvement programs and provision of
employee training and refresher programs.
xi

CHAPTER ONE
INTRODUCTION OF THE STUDY
1.0 Introduction
This chapter presents the background to the study, statement of the problem, objectives of the
study, research questions, scope and significance of the study.
1.1 Background of the study
To Altman (2008), in countries where financial instability is rife and financial intuitions are
becoming popular, when it comes to investing, the sound analysis of financial statements is
one of the most important elements in the fundamental analysis process. At the same time,
the massive amount of numbers in a company’s financial statement can be bewildering and
intimidating to many investors, creditors and those who are concern with the financial
statement.
Beaver, W. (2017), asserts that financial ratios serve a similar purpose, but you must know
what is being measured to construct a ratio and to understand the significances of the
resulting number” (Stanly 1994).The statement used for accounting ratio analysis is the
annual financial report of a firm which consists of three financial statements; the balance
sheet, income statement and cash flow statement. The analysis conducted in each of this
statement provides the vital information required regarding the financial performance of the
firm for making sound investment decisions. Analysts therefore depend on the use of the
financial statements to provide the data needed to update accounting ratios. According to
Igben (1999), “Accounting {or financial} ratio consist of the fraction, proportion or
percentage which compare the relationship between one variable item in a set financial
statements with another item in the financial statements. Consequently Accounting ratios are
vital for the analysis and interpretation of financial statements”.
Block (2009) defines accounting as the process of systematically recording, measuring, and
communicating information about financial transactions. At the heart of accounting is the
double-entry bookkeeping method. This involves making at least two recording entries for
every transaction: a debit in one account and a credit in another account. The method helps
prevent errors because the sum of the debits should equal the sum of the credits. The three
major financial statements produced by accounting are the income statement, the balance
sheet and the cash flow statement.

Bondoc M, 2013 defines accounting as the systematic and comprehensive recording of
financial transactions pertaining to a business. Accounting also refers to the process of
summarizing, analyzing and reporting these transactions to oversight agencies, regulators and
tax collection entities. The financial statements that summarize a large company’s operations,
financial position and cash flows over a particular period are a concise summary of hundreds
of thousands of financial transactions it may have entered into over this period.
To Brigham, 2008, accounting ratios are indicators of a commercial entity’s performance and
financial situation. We calculate the majority of ratios from data that the firm’s financial
statements provide. Accounting ratios, also known as financial ratios, are used to measure the
efficiency and profitability of a company based on its financial reports. They provide a way
of expressing the relationship between one accounting data point to another, and are the basis
of ratio analysis.
This was attributed to the fact that an accounting ratio compares two line items in a
company’s financial statements, namely made up of its income statement, balance sheet and
cash flow statement. These ratios can be used to evaluate a company’s fundamentals and
provide information about the performance of the company over the last quarter or fiscal
year. Examples of financial ratios include gross margin, operating margin, the debt-to-equity
ratio, the quick ratio and the payout ratio
Financial performance as argued by Brealey , 2013 is a subjective measure of how well a
firm can use assets from its primary mode of business and generate revenues. This term is
also used as a general measure of a firm’s overall financial health over a given period of time,
and can be used to compare similar firms across the same industry or to compare industries or
sectors in aggregation. There are many different ways to measure financial performance, but
all measures should be taken in aggregation. Line items such as revenue from operations,
operating income or cash flow from operations can be used as well as total unit sales.
Furthermore, the analyst or investor may wish to look deeper into financial statements and
seek out margin growth rates or any declining debt.
1.2 Statement of the Problem
Many firms, institutions and businesses have knowledge about accounting ratios, analysis and
its interpretation. Some businesses make use of these ratios but apply them wrongly, others
also use the right method but give wrong interpretations to it and most firms do not apply at
2

all. The need to determine the financial performance of the firm is crucial for making
informed decisions concerning the further deployment of resources and investment decisions.
This can only be done through accounting ratio analysis. Eventually this is not often an easy
task to unddrtake as many investors and business owners lack the understanding and skill to
perform accounting ratio analysis’ Accounting ratios facilitates the determination of the
efficiency and profitability of a firm which is fundamental for investment decisions based on
the firms financial reports. Accounting ratio facilitate the comparison of two aspects of a
financial statement .Some examples of accounting ratios include the dividend ratio, gross
margin ratio, debt-to-equity ratio and operating margin ratio. It is because of the above
problems that prompted the researcher of this study to write about the use of accounting ratio
and its interpretation, Brigham (2015).
1.3 Purpose of the study
To examine the role of accounting ratio analysis in measuring financial performance of
Mukwano group of companies.
1.4 Objectives of the Study
1.4.1 General Objective
To examine the role of accounting ratio analysis in measuring financial performance of
Mukwano group of companies.
1.4.2 Specific objectives of this study were;
i. To identi~’ the different forms of ratio used by Mukwano group of companies.
ii. To determine the role of accounting ratio analysis in measuring financial performance
of Mukwano group of companies.
iii. To identify the limitations of ratio analysis in measuring performance of Mukwano
group of industries.
1.5 Research questions
i. What are the different forms of ratio used by Mukwano group of companies?
ii. What is the role of accounting ratio analysis in measuring financial performance of
Mukwano group of companies?
iii. What are the limitations of ratio analysis in measuring performance of Mukwano
group of industries?
3

1.6 Scope of the study
1.6.1 Geographical scope
The study was conducted in Mukwano group of companies a manufacturing industry located
in Kampala city along Jinja road near industrial area. It was established in 1980 and deals in
the production of a variety of beauty products for example smearing jelly, soaps, body lotions
and creams.
1.6.2 Time scope
The study was cross sectional and covered a period of five months, from October 2018 to
early February 2019. The period was enough for the researcher to acquire necessary
information required for the study.
1.6.3 Content scope
The study was limited to the roles of accounting ratio analysis in measuring financial
performance of a firm.
1.7 Significance of the Study
The research shall proffer a structural appraisal of accounting ratio analysis for the
determination of the firm’s financial performance and investment decision.
The finding of the study may benefit academicians to enrich their knowledge and research
work; this is because the study may act as a secondary source of data to them
The study may help the policy makers in different firms to identify the loopholes in their
system and therefore lay strategies of strengthening ratio analysis in their firms.
4

1.8 Figure 1 Conceptual framework
A conceptual framework showing the relationship accounting ratio analysis and financial
performance of Mukwano group of companies
INDEPENDENT VARIABLE DEPEN1~ENT VARIABLEFinancial PerformanceAccounting financial ratios
o Profitability Ratios Profitability
o Liquidity Ratios a Sales growth
o Debt Ratios I e Efficiency
o Performance Ratios
o Investment Evaluation Ratios
EXTRANEOUS VARIABLESo False accounting data gives false ratios
o Comparison not possible
o Limited use of a Single Ratio
o Window Dressing
o Lack of proper standards
Source: (Mugaga 2006; Schubeler, 1996; Thomas, 1998; Rand & Marxen, 2000) and
modified by the researcher
From the conceptual framework above, there are many accounting ratios used in measuring
financial performance of firms and these are; profitability ratio, liquidity ratios, debt ratios,
performance ratios and investment evaluation ratios. Hence in the long run these lead to more
profits, increase in sales and efficiency when it comes to service delivery and quality
produce. However, accounting ratio towards financial performance has always come with
challenges like false accounting data which gives false ratios, at times comparisons for the
ratios becomes impossible, use of a single ratio, window dressing on addition to lack of
proper standards from accountants themselves.
5

CHAPTER TWO
LITERATURE REVIEW
2.Olntroduction
This chapter was based on documentary reviews of literature related to the study variables
aimed at enlightening the readers about the currents, gaps and how to close the gaps. The
section was organized as introduction, literature and the summary of the literature.
2.1 Review of the key concepts
2.1.1 Financial ratio
Martikainen, (2013),defines financial ratios as the numerical value created from two or more
values taken from a company’s financial statements i.e. its balance sheet, income statement or
statement of cash flow. Typically, financial ratios are presented as a quantified metric in the
form of a percentage, multiple or a ratio which aims to evaluate the financial, operational
performance and competitiveness of a company.
The financial Ratio Analysis has been developed over many years and it has become more
than a tool of evaluation. It helps tax department’s credit analysis in banks, financial market
councils and CPA Accountants to determine some critical points in theirjobs.
2.1.2 Financial Performance
In a study conducted by Collis and Jarvis (2016) on financial performance of small private
companies in the U.K., the most useful sources of information are the periodic management
account (i.e. the balance sheet and income statement), cash flow information and bank
statements (of course bank statement are another form of cash flow information but generated
externally) (Collis, 2012) suggest is critical to the success and survival ofa small business.
2.2 Forms of ratio used by organizations
2.2.1 Cash flow ratios
These can be used to answer questions on a company’s performance since debt obligations
are met with cash. Such an analysis will result in adequate lines of credit, unrestricted cash
6
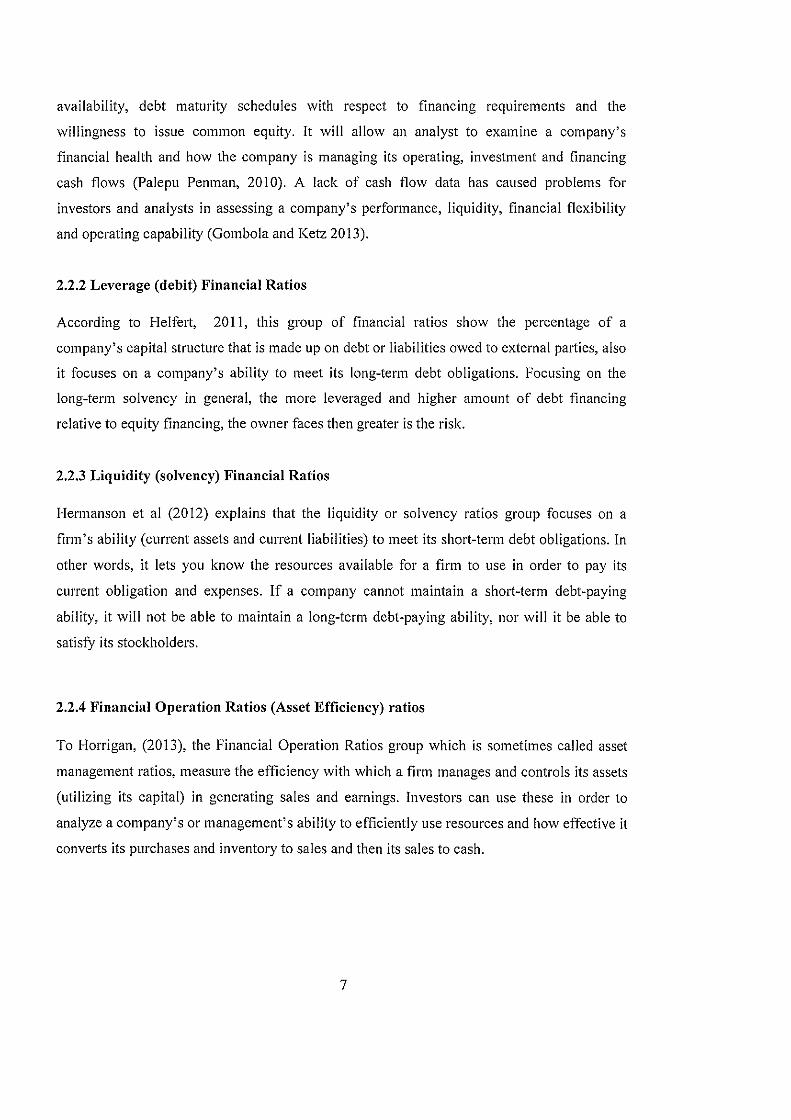
availability, debt maturity schedules with respect to financing requirements and the
willingness to issue common equity. It will allow an analyst to examine a company’s
financial health and how the company is managing its operating, investment and financing
cash flows (Palepu Penman, 2010). A lack of cash flow data has caused problems for
investors and analysts in assessing a company’s performance, liquidity, financial flexibility
and operating capability (Gombola and Ketz 2013).
2.2.2 Leverage (debit) Financial Ratios
According to Helfert, 2011, this group of financial ratios show the percentage of a
company’s capital structure that is made up on debt or liabilities owed to external parties, also
it focuses on a company’s ability to meet its long-term debt obligations. Focusing on the
long-term solvency in general, the more leveraged and higher amount of debt financing
relative to equity financing, the owner faces then greater is the risk.
2.2.3 Liquidity (solvency) Financial Ratios
Hermanson et al (2012) explains that the liquidity or solvency ratios group focuses on a
firm’s ability (current assets and current liabilities) to meet its short-term debt obligations. In
other words, it lets you know the resources available for a firm to use in order to pay its
current obligation and expenses. If a company cannot maintain a short-term debt-paying
ability, it will not be able to maintain a long-term debt-paying ability, nor will it be able to
satisfy its stockholders.
2.2.4 Financial Operation Ratios (Asset Efficiency) ratios
To Horrigan, (2013), the Financial Operation Ratios group which is sometimes called asset
management ratios, measure the efficiency with which a firm manages and controls its assets
(utilizing its capital) in generating sales and earnings. Investors can use these in order to
analyze a company’s or management’s ability to efficiently use resources and how effective it
converts its purchases and inventory to sales and then its sales to cash.
7

2.2.5 Profitability Financial Ratios
Horrigan, J.O. (2015), explains that the profitability ratios group, also known as performance
ratios, assesses the company ability to earn profits on sales, assets and equity, it measures the
return earned on a company’s capital and the financial cushion relative to each dollar of sales,
These are critical to determining the attractiveness of investing in company shares and
investors in using these ratios widely, much like the operational performance ratios, these
ratios give users a good understanding of how well the company utilized its resources(assets)
in generating profit and shareholder value.
2.2.6 Valuation ratios (market value ratios)
James, 2008, the valuation ratios group indicates to the market value of a stock in terms of
some measure of a company’s fundamentals such as EP, book value, BPS, ROE and
dividends. These ratios are the ones that investors tend to look at on a daily basis and they
change whenever the price of the stock changes. These ratios allow you to compare your
company to others in your industry.
2.3 Role of accounting ratio analysis in measuring financial performance of
organizations
Analyzing Financial Statements
To Jooste L (2016), Ratio analysis is an important technique of financial statement analysis.
Accounting ratios are useful for understanding the financial position of the company.
Different users such as investors, management, bankers and creditors use the ratios to analyze
the financial situation of the company for their decision making purpose.
Judging Efficiency
Wessels D. (2010), explains that accounting ratios are important for judging the company’s
efficiency in terms of its operations and management. They help judging how well the
company has been able to utilize its assets &earn profits using Accounting, Financial
Statements, Selection and Accountancy.
8

Locating Weakness
According to Lasher, (2017), accounting ratios can also be used in locating weakness of the
company’s operations even though its overall performance may be quite good. Management
can then pay attention to the weakness and take remedial measures to overcome them.
Formulating Plans
To Lewellen (2014), although accounting ratios are used to analyze the company’s past
financial performance, they can also be used to establish future trends of its financial
performance. As a result, they helps in formulating the company’s future plans for knowing
efficiencies, Financial position and for reaching companies goals and objectives.
Comparing Performance
For Murphy, (2009), it is essential for a company to know how well it is performing over the
years and as compared to the other firms of the similar nature. Besides, it is also important to
know how well its different divisions are performing among themselves in different years.
Ratio analysis facilitates such comparison.
Further Ohlson, (2010), explains that ratio analysis helps to reveal, compare and interpret
salient features of financial statements. When applied to a set of financial statements,
financial ratios highlight significant aspects of the financial position and operational results of
a business requiring further investigation. They help to identify the strengths and weaknesses
of a business. In fact, ratio analysis helps to evaluate the past performance, the present
condition, and the future prospects of a business.
Horrigan (2015) says ratios analysis has come into existence since early ages and the main
reason of the development of ratio analysis was its use in the analysis of the properties of
ratios in 300 B.C. in recent time it is used as a standard tool for the analysis of financial
statement. In nineteenth century main reasons of using ratio analysis are power of financial
institutions and shifting of management to professional managers.
Bird and McHugh (2017) adopt an efficient Shapiro-Wilk small-sample test for the normality
of financial ratios for an Australian sample of five ratios over six years. Like Deakin they
find in their independent study that normality is transient across financial ratios and time.
9

Richardson and Davidson (2014) used eleven ratios to examine that the successful firms has
higher ratios than unsuccessful firms. Although this study was immature but immaturity was
ignored by considering the vital contribution this study has in the evaluation of usefulness of
ratios. Security and exchange commission of America was formed in 1934. This also expands
the flow and number of financial statements and with the help of this peripheral factor
importance of ratio analysis further enhanced and realized.
2.4 Limitations of ratio analysis in measuring performance of organizations
Ratio analysis is a very important tool of financial analysis but despite it’s being
indispensable, the ratio analysis suffers from a number of limitations. These limitations
should be kept in mind while making use of the ratio analysis;
False accounting data gives false ratios
According to Ross (2009), Accounting ratios are calculated on the basis of given data given
in profit and loss account and balance sheet. Therefore, they will be only as correct as the
accounting data on which they arc based for example, if the closing stock is over-valued, not
only the profitability will be overstated but also the financial position will appear to be better.
Therefore, unless the profit and loss account and balance sheet are reliable, the ratios based
on them will not be reliable.
Comparison not possible if different firms adopt different accounting policies
Further Schrirnpf (2010), explains that there may be different accounting policies adopted by
different firms with regard to providing depreciation, creation of provision for doubtfbl debts,
method of valuation of closing stock for instance, one finn may adopt the policy of charging
depreciation on straight-Line basis, while other may charge on written-down value method.
Such differences make the accounting ratios incomparable.
Limited use of a Single Ratio
To Stanly, 2014, the analyst should not merely rely on a single ratio. He should study several
connected ratios before reaching a conclusion. For example, the Current Ratio of a firm may
be quite satisfactory, whereas the Quick Ratio may be unsatisfactory.
10

Window Dressing
Some companies in order to cover up their bad financial position resort to window dressing
i.e., showing a better position than the one, which really exists. They change their balance
sheet in such away that the important facts and truth may be concealed.
Lack of proper standards
Circumstances differ from firm to firm hence no single standard ratio can be fixed for all the
firms against which the actual ratio may be compared. Ratios alone are not adequate for
proper conclusions; ratios derived from analysis of statements are not sure indicators of good
or bad financial position and profitability of a firm. They merely indicate the probability of
favorable or unfavorable position.
Lack of Standard of Comparison
No fixed standards can be laid down for ideal ratios for example, current ratio is said to be
ideal if current assets are twice the current liabilities but this conclusion may not be
justifiable in case of those concerns which have adequate arrangements with their bankers for
providing funds when they require, it may be perfectly ideal if current assets are equal to or
slightly more than current liabilities.
Quantitative Analysis
Ratios are tools of quantitative analysis only and qualitative factors are ignored while
computing the ratios for example, a high current ratio may not necessarily mean sound liquid
position when current assets include a large inventory consisting of mostly obsolete items.
Ratios Account for one Variable
Since ratios account for only one variable, they cannot always give correct picture since
several other variables such Government policy, economic conditions, availability of
resources, should be kept in mind while interpreting ratios. Ratio analysis can be used to
compare information taken from the financial statements to gain a general understanding of
the results, financial position, and cash flows of a business. This analysis is a useful tool,
especially for an outsider such as a credit analyst, lender or stock analyst.
11

Operational changes
A company may change its underlying operational structure to such an extent that a ratio
calculated several years ago and compared to the same ratio today would yield a misleading
conclusion. For example, if you implemented a constraint analysis system, this might lead to
a reduced investment in fixed assets, whereas a ratio analysis might conclude that the
company is letting its fixed asset base become too old.
Accounting policies
Different companies may have different policies for recording the same accounting
transaction. This means that comparing the ratio results of different companies may be like
comparing apples and oranges for example, one company might use accelerated depreciation
while another company uses straight-line depreciation or one company records a sale at gross
while the other company does so at net.
Inflationary effects
Financial statements are released periodically and therefore, there are time differences
between each release. If inflation has occurred in between periods, then real prices are not
reflected in the financial statements. Thus, the numbers across different periods are not
comparable until they are adjusted for inflation.
2.5 Conclusion
Financial performance of any firm or bank can be calculated with the help of financial ratios.
Financial ratio plays an important role to check the condition of any bank or company either
is in profit or loss. By using ratios companies can determine financial strength or weaknesses
as well as opportunities in the market or industry. Ratios can provide the actual picture of the
firm’s financial position. Financial ratios assist analysts to acquired insight knowledge of
firm’s financial situation. Data from different financial statements has used to calculate the
ratios. Financial ratios can tell the investors future performance of firms by looking past
trends.
12

CHAPTER THREE
METHODOLOGY
3.1 Introduction
This chapter presents the research design, the study population, sample size, sample
techniques and procedures, data collection methods and instruments, validity and reliability,
data analysis, measurement of variables and ethical considerations.
3.2 Research design
The study adopted a cross sectional and a case study research designs. According to Amin
(2005), studies of this nature may be more productively undertaken because data can be
collected from a cross section of a population in a short time from a large number of cases for
purposes of drawing valid conclusions to represent the entire population of the study. Hence
for a research study related to accounting and measurement of financial performance, this
worked better in especially investigating performance at Mukwano group of companies.
3.3 Study population
Due to the fact that Mukwano group of companies employs more than 8000 people, a study
was based on analysis of the internal employees especially those working as human resources
and from the accounting department and if agreed the managing director hence making a total
of 150 representatives. The selection process was as follows; the managing director in charge
of performance of the company (1), workers from the accounting department (20), managers
from various department of the organization (6), employees from various departments at
Mukwano group of industries (100), company stakeholders (23) and 10 from the human
resource department of the organization (Primary data, 2018).
3.4 Sample size
Hence in accordance to the target groups of people chosen above, the sample size was
estimated through use of Morgan and Krejcie’s table (1970) of sample size determination
which estimates that if the target population is 150 the sample size becomes 108 as seen on
Appendix ii. Basing on the sample above, this study used simple random sampling for those
in the Top Management, Managers since it is good for in-depth analysis and it enables high
representation of the population, less bias, and simplifies data interpretation and analysis of
13

results (Black, 1999). While purposive sampling was used for, other key selected informants
because it allowed for probing more on examining applicability of accounting ratio analysis
and financial performance.
Table 3.1 Sample size
Category Population Sample Sampling technique
Top management 1 1 Purposive sampling
Accounts Department 20 15 Purposive sampling
Managers from different 6 6 Purposive sampling
departments
Stakeholders 23 20 Simple Random sampling
Other Employees 100 60 Simple Random sampling
Human resource department 10 6 Purposive sampling
Total 150 108
Source: Primary Data
3.5 Sampling Techniques and Procedures
3.5.1 Simple Random Sampling
The participants in the study was selected through simple random sampling method for
respondents among them administrators and Senior Accountant to have an equal chance of
being selected to be part of the study. Simple random sampling is best because it is easy to
collect data when the population members are similar to one another on important variable
(Gay, 1996).
3.5.2 Purposive Sampling
Purposive sampling was used for selecting the particular groups of people in the population
especially Managers and accounts officers. This sampling procedure was used for its cost
efficiency and effectiveness to collect specific information and allowed for probing for clarity
(Kothari, 2004).
3.6 Data collection methods
The study used both primary and secondary data collection methods as complementary.
14

3.6.1 Primary data
This is data collected from respondents in the field and for this time it was got from
Mukwano group of companies’ selected respondents.
3.6.2 Secondary Data
This is the data that was gotten from various resource centres like internet sources, libraries,
news papers and journals.
3.7 Data collection instruments
3.7.1 Self-Administered Questionnaires
The research instrument included the Self-Administered Questionnaire (SAQs). SAQs were
used because they are the most suitable in a survey that involves a large number of
respondents (Amin, 2005). In addition, (SAQs) was very suitable for the target respondents
given their high levels of English literacy. Finally, SAQs consumed less time and money
compared to other methods (Alston & Bowels, 1998)
3.8 Validity and Reliability
3.8.1 Validity
Validity is the ability of the research instrument to measure what it aims or is supposed to
measure. According to Amin (2005), the research instrument must be appropriate for the
study objectives to be achieved. The researcher will consult and discuss validity instrument
with colleagues and supervisors to limit errors as much as possible (these were judges who
were having more experience in relation to field results).
3.8.2 Reliability
Reliability of an instrument is the dependability or the trustworthiness of an instrument.
According to Amin (2005), it is the degree to which the instrument consistently measures
what it is supposed to measure. This method was picked on a single pre-test group and
showed the degree to which the items in the questionnaire are inter-correlated. To get the
reliability, the data was entered in the computer and analyzed using frequency tables and
percentages.
15

3.9 Data Collection Procedures
The researcher discussed with supervisors about the procedures of conducting research and
after he sought for approval on validity and reliability of the instruments. Then an
introductory letter was obtained from College of Economics and management for the
researcher to present in the field at Mukwano group of companies so as to create rapport with
the respondents.
3.10 Data Analysis
This is the process of bringing understanding and meaning to data collected for validity and
reliability (Sekaran, 2003). Data collected from the field was first sorted, edited, coded and
entered into in the computer using frequency tables and percentages. Qualitative data was
analyzed and presented in form of texts and interviews, impressions, words, photos; symbols
are examined and presented using descriptive or narrative method where the researcher
presented detailed literature description of the respondents’ views for the reader to make their
opinions (Bell, 1993).
3.11 Ethical Considerations
Ethically the researcher focused on infringement on the privacy and confidentiality of the
respondents, informed consent, avoiding duplication of other studies, honesty and
dissemination of the report findings to respondents. The study was not based on application
of force but sticked to reconciliation and humbleness to gather data. The different
respondents had the opportunity to respond freely with no salient intimidation or force or
promise of reward.
16

CHAPTER FOUR
PRESENTATION OF RESULTS! FINDINGS
4.1 Introduction
This chapter deals with the presentation, analysis and interpretation of the findings in relation
to the objectives of the study and the research questions. The data is presented using Tables
and figures for easy interpretation and understanding.
4.2 General Findings
The research considered a sample a sample size of 108 respondents of which one (1) was a
top manager (0,9%), fifteen (15) were from accounts department (13.8%), six (6) were
managers from different departments (5.5%), twenty (20) were stakeholders (18.5%), sixty
(60) were from other employees (55.5%), while six (6) were coming from the human
resource department (5.5%).
4.3 Questionnaires Distributed and Returned
One hundred eight (108) questionnaires were distributed to the respondents, seventy four (74)
of which were returned while thirty four (34) were not returned. This was because of the
commitments the respondents had at their places of work. This was illustrated in the Table
below:
Table 4.1: Questionnaires distributed and returned
Response Frequency Percentage (%)
Returned 74 68.5
Not Returned 34 31.5
Total 108 100
Source: Primary Data 2019
The Table illustrates that eighty (108) questionnaires were issued for the research study,
(68.5%) of which were returned and (31.5%) were not returned. This portrayed maximum
cooperation of the respondents.
17

Table 4.2: Gender of the respondents
Gender Frequency Percentage (%)
Male 48 64.9
Female 26 35.1
Total 74 100
Source: Primary Data 2019
Gender of the respondents was found necessary for consideration by the researcher so as to
ensure gender sensitivity and equality. However, of the returned seventy four (74)
questionnaires, it was discovered that forty eight (48) respondents were male while twenty six
(26) respondents were female an implication that the research also took into consideration
gender sensitivity.
Figure 4.1: Age of the respondents
Age of the Respondents
40 25.7%
2~ ~~36-45 Age of the Respondents ~ Age of the Respondents
46-55S6andabove
Source: Primary Data
This was deemed necessary for the study by the researcher so as to ensure the age limit of the
respondents to be considered for the research since the minors (respondents below the age of
l8years) were not considered liable for the study since their ideas were still believed to be
premature as opposed to the great level of mature reasoning that the research required. This
was observed in objective three of the research questionnaire which required the respondents
to fully examine the limitations of ratio analysis in measuring performance of Mukwano
group of industries. However, responses to this showed that 25.7% were at the age of 21-35,
35.1% were at the age of 36-45, while 24.3% were at the age of 46-55 and 14.9% were at the
18

age of 56 and above. Taking the age limit of 36-45, which is a simple majority figure, the
results portrayed that the company had energetic, potential, well skilled and qualified staff
which helped it enhance its smooth running and enabled the researcher to make conclusions
and recommendations for the study easily.
Marital status of the respondents
This was also put into consideration by the researcher so as to identify the responsibilities
possessed by the various respondents responses to this were however acquired using question
3 of the research questionnaire where the responses found out that 19 of the respondents were
single for both male and female with a percentage of (47.5%) while the married respondents
were 15 (37.5%), 4 of them were widowed (10%) and 2 of the respondent were divorced
(5%).
Table 4.3: Marital status of the respondents
Single 17 23.0
Divorced 10 13.5
Widowed 11 14.9
Separated 9 12.2
Total 74 100
Source: Primary Data
Considering the responses above, it was established that 36.5% of the respondents were
married, 23.0% were single, 13.5% were divorced while 14.9% were widowed and 12.2%
were separated. Taking 36.5% as a simple majority figure, this concludes that Mukwano
group of companies limited had responsible staff capable of boosting its performance.
19
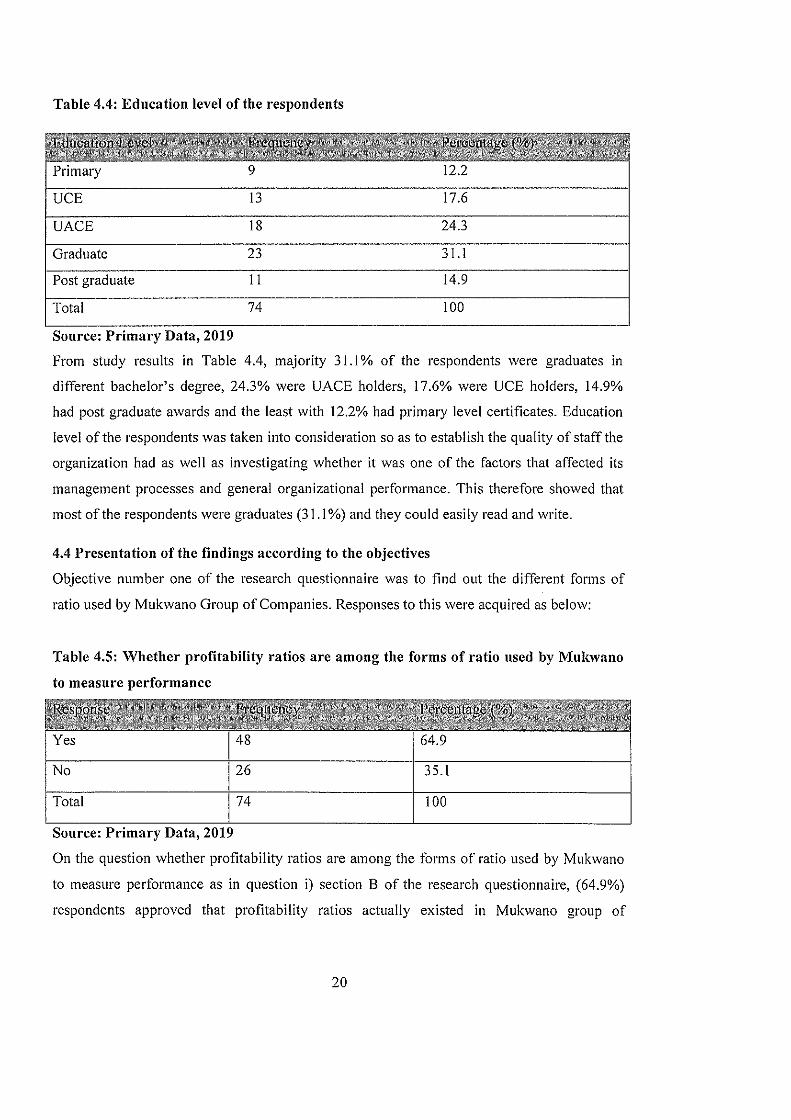
Table 4.4: Education level of the respondents
UCE 13 17.6
UACE 18 24.3
Graduate 23 31.1
Post graduate 11 14.9
Total 74 100
Source: Primary Data, 2019
From study results in Table 4.4, majority 3 1.1% of the respondents were graduates in
different bachelor’s degree, 24.3% were UACE holders, 17.6% were UCE holders, 14.9%
had post graduate awards and the least with 12.2% had primary level certificates. Education
level of the respondents was taken into consideration so as to establish the quality of staff the
organization had as well as investigating whether it was one of the factors that affected its
management processes and general organizational performance. This therefore showed that
most of the respondents were graduates (31 .1%) and they could easily read and write.
4.4 Presentation of the findings according to the objectives
Objective number one of the research questionnaire was to find out the different forms of
ratio used by Mukwano Group of Companies. Responses to this were acquired as below:
Table 4.5: Whether profitability ratios are among the forms of ratio used by Mukwano
No 26 35.1
Total 74 100
Source: Primary Data, 2019
On the question whether profitability ratios are among the forms of ratio used by Mukwano
to measure performance as in question i) section B of the research questionnaire, (64.9%)
respondents approved that profitability ratios actually existed in Mukwano group of
Primary 9 12.2
to measure performance
Yes 48 64.9
20

companies limited while 35.1% disapproved that the organization does not use profitability
ratio in its operations.
This response therefore portrayed that the organization actually uses profitability ratio in
measuring financial performance something that has facilitated its production and general
performance improvements taking 64.9% as a simple majority response figure.
Table 4.6 shows whether liquidity ratios also compose accounting ratio analysis forms
used by Mukwano group of industries
Agree 27 36.5
Disagree 16 21.6
Strongly Disagree 8 10.8
Total 74 100
Source: Primary Data 2019
From study findings in Table 4.6, 31.1%
company uses liquidity ratio to improve its
liquidly ratio is used, while 21.6% disagreed
they use accounting ratio at some issues they
broad view that accounting ratio are used
performance of its employees.
Table 4.7 shows whether debt ratios are amongst the Forms of Ratio used by the
Company
Srongly Agree
Agree 12 16.2
Disagree 24 32.4
Strongly Disagree 16 21.6
Total 74 100
Source: Primary Data 2019
Srongly Agree 23 31.1
of the respondents strongly agreed that the
performance, 36.5% agreed to the view that
to the view and 10.8% strongly disagreed that
did not disclose to the researcher. This gives a
by Mukwano group of industries to improve
21

Results in table 4.7 above indicated that Debt ratios are also applied by Mukwano group of
companies to improve its performance. This was so due to the fact that majority respondents
with 32.4% disagreed to the view that debt ratio is used by the company, 21.6% strongly
disagreed while 29.7% strongly agreed to the view and 16.2% had an agreement. This
therefore implied that debt ratio is not highly applied in the organization.
Table 4.8 shows whether performance ratios are also used by Mukwano group of
industries to measure financial performance
Agree 30 40.5
Disagree 10 13.5
Strongly Disagree 14 18.9
Total 74 100
Source: Primary Data, 2019
Table 4.8 results depicted that majority 40.5% agreed to the view that performance ratio are
also applied by Mulcwano to improve financial performance of the organization, 27.02%
strongly agreed to the view and 18.9% strongly disagreed while 13.5% had a disagreement an
indication that the organization uses performance ratio to find out whether the organization is
getting more profits out of the good performance of its employees.
Table 4.9 shows whether investment evaluation ratios
companies
are used by Mukwano group of
Srongly Agree 34 45.9
Agree 10 13.6
Disagree 18 24.3
Strongly Disagree 12 16.2
Total 74 100
Source: Primary Data 2019
22

Results from Table 4.9 depicted that majority 45.9% strongly agreed to the view that
Mukwano group of industries uses investment ratios, 13.6% agreed to the view while 24.3%
disagreed and 16.2% strongly disagreed. This therefore implied that the organization invests
in different procedures and after makes evaluations to find out which product is performing
better or worse.
4.5 To find out the role of accounting ratio analysis in measuring financial performance
of Mukwano Group of Companies
Objective number two of the research was to find out the role of accounting ratio analysis in
measuring financial performance of Mukwano Group of Companies and responses to this
were given as below:
Table 4.10: The role of accounting ratio analysis in measuring financial performance of
Mukwano group of companies
67.5
It is used by Mukwano especially when judging efficiency 3 4.05
It helps in locating weakness 11 14.8
It is used in formulating plans 7 9.4
It is used to make a comparison of performance of different 3 4.05
employees at Mukwano
Total 74 100
Source: Primary Data 2019
Results from Table 4.10 above indicated that majority 67.5% of the respondents
acknowledged that the ratio analysis is used by Mukwano to analyze its financial
performance followed by 14.8% who accepted that It helps in locating weakness, 9.4%
argued that it is used in formulating plans and the least with 4.05% had a similar argument
that it is used when judging for efficiency as well as making a comparison of performance of
different employees. This therefore implied that Mukwano mostly uses accounting ratio to
analyze financial performance.
It is used by the organization to analyze Financial
Statements
50
23

4.6 To find out whether there are limitations of ratio analysis in measuring Performance
of Mukwano Group of Companies Limited
Objective number three of the research was aimed at finding out whether there are
Limitations of ratio analysis in measuring Performance of Mukwano Group of Companies
and responses to this were therefore given as seen below:
Table 4.11: Limitations of Ratio Analysis in Measuring Performance of Mukwano
Group of Companies Limited
False accounting data which gives false ratios
At times the comparison is not possible if different firms 14 18.9
adopt different accounting policies
Ratio analysis becomes less effective due to price level 12 16.2
changes
It may be misleading in the absence of absolute data for 17 23.0
Mulcwano
Lack of proper standards affects the appropriateness of 11 14.9
ratio analysis
Total 74 100Source: Primary Data, 2019
Results further depicted that majority 27.2% stated that false accounting data which gives
false ratios, 23.0% stated that ration analysis can at times be misleading in the absence of
absolute data for Mukwano while 18.9% stressed that at times the comparison is not possible
if different firms adopt different accounting policies though 16.2% stated that ratio analysis
becomes less effective due to price level changes and 14.9% argued that lack of proper
standards affects the appropriateness of ratio analysis.
24

CHAPTER FIVE
CONCLUSIONS AND RECOMMENDATIONS
5.1 Introduction
This chapter gives a succinct summary of the major findings of the research, conclusion with
also recommendations as well as areas for further research. The recommendations are based
on the researchers’ analysis and interpretations of the findings. The summary of the research
findings outline briefly the objectives of the research.
5.2 Conclusion
In a wrap-up, the researchers observed that there are different forms of ratio used by
Mukwano group of companies. This was concluded basing on the following responses as
summarized in chapter four, 64.9% of the respondents stated that profitability ratio are among
the forms of ratio used by the organization to measure financial performance, 67.6% stated
that the organization uses liquidity ratio while 55.9% stressed that debt ratios are used by the
organization to measure for financial performance though 67.5% stated that performance
ratios are also used by the organization and 59.5% gave other options that they use
investment evaluation ratios. The results indicated that at Mukwano Group of Companies,
majority respondents agreed to the view that liquidity ratio is the mostly used ratio used.
The study also found out that accounting ratio analysis in measuring financial performance
plays roles like analysis of financial statements (67.5%) and others argued that it has helped
the organization when judging for efficiency (4.05%), others with a response rate of 14.8%
argued that it helps in locating weakness, 9.4% stated that it is used in formulating plans
while 4.05% sighted out that it is used to make a comparison of performance of different
employees at Mukwano group of companies.
Furthermore, it was discovered that there are limitations of ratio analysis in measuring
Performance of Mukwano Group of Companies Limited since 27.2% of the respondents
stated that false accounting data which gives false ratios, 18.9% stated that at times the
comparison is not possible if different firms adopt different accounting policies while 16.2%
stressed that ratio analysis becomes less effective due to price level Changes though 23.0%
stated that ratio analysis may be misleading in the absence of absolute data for Mukwano and
14.9% argued that the lack of proper standards affects the appropriateness of ratio analysis.
25
This therefore implied that majority respondents accepted that 27.2% of the respondent’s
false accounting information affects accounting ratio.
5.3 Recommendations
The research therefore provided the following recommendations for the study, chapter four of
the study:
5.3.1 Forms of ratio used by Mukwano to measure performance
From the findings of the study results depicted that profitability, liquidity, debt ratio among
others are the forms of ratio used by the company, however it is recommendable that the
organization improves on the debt ratio used by the organization to manage the budgets.
5.3.2 Role of accounting ratio analysis in measuring financial performance of Mukwano
Group of Companies
From findings in chapter four it was analyzed that ratio analysis plays roles like analysis of
finacial performnace, judging efficiency, helps in locating weakness, used in formulating
plans and it is used to make a comparison of performance of different employees at
Mukwano. It is however recommended that the organization provides good proper working
conditions for accomplishment of the assigned tasks. This should be backed by enhancement
of employee involvement programs and provision of employee training and refresher
programs.
5.3.3 Limitations of ratio analysis in measuring performance of Mukwano Group of
Companies Limited
From study results, it was indicated that ratio analysis is limited by a varierty of factors
ranging from false accounting data, comparison is not possible, ratio naalysis is ineffective
and lack of proper standards. Hence it is recommneded that Mukwano group of comapnires
enhances good recruitment procedures to eanble analysis of ratios and as well overcome
challenges related to incidents like false accounting data which gives false ratios.
26

5.4 Areas for further research
The researcher feels that due to the limited time and resources available to them during the
period of this study, enough research has not been exhausted in this study and therefore
recommends other upcoming and intending researchers to carry out a further research on the
role of employee involvement on ratio analysis of the organization and as well provide fro
mitigation measures to proper application of ratio analysis in organizations.
27

REFERENCES
Altman E.I. (2008), Financial Ratios, Discriminant Analysis and the Prediction of Corporate
Bankruptcy, “The Journal of Finance” vol. 23, no. 4.
Baruch Lev, Financial Statement Analysis: A New Approach (Englewood Cliffs, New Jersey:
Prentice-Hall, Inc., 2014).
Beaver, W. (2017), “Financial Statement Analysis”, Handbook of Modern Accounting, eds
Davidson, S. and Well, R., 2nd ed. McGraw-Hill.
Bird, R.G., and McHugh A.J. (2017), “Financial ratios - an empirical study”, Journal of
Business Finance and Accounting 4/1, 29-45.
Block S.B. (2009), A study of financial analysis: practice and theory, “Financial Analysts
Journal” vol. 55, no. 4.
Bondoc M. D., Taicu M, 2013, Expenses analysis based on information provided by the
profit and loss account company performance diagnosis stage, Annals of the University of
Petroani, Economics, 13(1), p.5-p.l4
Brealey R., Myers 8.20 13, Principles of corporate finance, The McGraw-Hill Companies.
Brigham E., Houston J.,2008, Fundamentals of financial management, South-Western
College Pub, 2008
Brigham E.F., Ehrhardt MC. (2015), Financial Management, 11 edition, USA.
Collis and Jarvis (2016) financial information and the management of small private
companies.
Collis J, Jarvis R (2012), Financial Information and the Management of Small Private
Companies, Journal of small business and Enterprise Development, vol. 9, no.2, pp 100-110.
Gombola, M.J., and Ketz, J.E. (2013), “A note on cash flow and classification patterns of
financial ratios”, Accounting Review 63/1, 105-114.
Helfert E. 2011, Financial analysis tools and techniques a guide for managers, The McGraw
Hill Companies
28

Hermanson, Roger H. James Don Edwards, & Michael W. Maher. (2012). Accounting
Principles 5th ed. Boston, MA Richard D. Irwin, Inc.
Horrigan, J.O. (2013), “Methodological implications of non-normally distributed financial
ratios: acomment”, Journal of Business Finance and Accounting 10/4, 683-689.
Horrigan, J.O. (2015), Some empirical bases of financial ratio analysis”, Accounting
Review, July 1965, 558-568.
James 0. Horrigan, 2008,”A Short History of Financial Ratio Analysis,” Accounting Review,
XLII , 284-94.
Jooste L (2016), Cash Flow ratios as a yardstick for evaluating financial performance in
Koller
T, Goedhart M, Wessels D. (2010), Valuation: Measuring and Managing the Value of
Companies, 5th ed, John Wiley & Sons, Hoboken.
Lasher, William R. (2017). Practical Financial Management St. Paul MN: West Publishing
Company.
Lewellen J. (2014), Predicting Returns with Financial Ratios, “Journal of Financial
Economics” vol. 74.
Martikainen, T. (2013), “Stock returns and classification pattern of firm-specific financial
variables: empirical evidence with Finnish data”, Journal of Business Finance and
Accounting 20/4, 537-557.
Murphy J.J. (2009), Technical Analysis of the Financial Markets: A Comprehensive Guide to
Trading Methods and Applications (New York Institute of Finance).
Ohlson J.A., (2010), Financial Ratios and the Probabilistic Prediction of Bankruptcy,
“Journal of Accounting Research” vol. 18, no. 1.
Penman S.H, (2010), Financial Statement Analysis and Security Valuation, 4th ed, McGraw
Hill, New York.
Richardson, F.M., and Davidson, L.F. (2014), “On linear discrimination with accounting
ratios”, Journal of Business Finance and Accounting 11/4, 511-525.
29

Schrirnpf A., (2010), International stock return predictability under model uncertainty,
“Journal of International Money and Finance” vol. 29.
Stanly B. Block and Geoffrey A. Hirt 2014 Financial Management, seventh edition Page
51 Stroe R., Armeanu D., Finances, ABS Publishing House
30

APPENDIX I
QUESTIONNAIRE SCHEDULE
THE ROLE OF ACCOUNTING RATION ANALYSIS IN MEASURING FINANCIAL
PERFORMANCE OF A FIRM. A CASE STUDY OF MUKWANO GROUP OF
COMPANIES
Questionnaires for key informants
Dear Respondent
I am Aliganyira Johnson a student from Kampala International University pursuing a
bachelor’s degree of business administration (finance and accounting) year three, semester
two. The questionnaire has been designed for sole purpose of collecting data on the Role of
Accounting Ratio Analysis in Measuring Financial Performance of a Firm a Case of
Mukwano Group of Companies. Thus the questionnaire below will help me gather the data
required for my topic of research, therefore you are requested to respond to the following
questions appropriately for the purposes of my academic research and I declare that the
information given shall be treated with Maximum confidentiality it deserves for academic
purpose. Tick one or write the relevant information in the space provided.
PART A: GENERAL INFORMATION
Please tick the appropriate box that suits your agreement.
1. Gender
Male EElFemale
2. Age bracket of respondents
21-35 years
36-45 years
46-Ssyears
56 and above
3. Education Background of respondents
Primary
Secondary (UCE & UACE) ~
Graduate
Post Graduate
31

4. Marital Status of respondents
Single
Married
Widowed
Divorced
Separated
PART B: The Role of Accounting Ratio Analysis in Measuring Financial Performance
of a Firm
Kindly indicate the extent to which you agree with the following statements concerning
different forms of ratio used by Mukwano group of companies
Use the scale of;
Code 1 2 3 4 5
Status Strongly Agree Strongly disagree Disagree Not sure
agree
1~2~3~4~5
Different forms of ratio used by Mukwano group of companies
Profitability Ratios are among the forms of ratio used by Mukwano to measure
performance
Liquidity Ratios also compose accounting ration analysis forms used by — — —
Mukwano group of industries
Debt Ratios are amongst the forms of ratio used by the company — — —
Performance Ratios are also used by Mukwano group of industries to measure — — —
financial performance
Investment Evaluation Ratios are among the forms of ratio used by Mukwano
to measure performance
Role of accounting ratio analysis in measuring financial performance of Mukwano group
of companies
it is used by the organization to analyze Financial Statements
it is used by Mukwano especially when judging efficiency
it helps in locating Weakness
it is used in formulating Plans
It is used to make a comparison of performance of different employees at
Mukwano
32

Ratio analysis helps to reveal, compare and interpret salient features of
financial statements
Limitations of ratio analysis in measuring performance of Mukwano group of industries
The application of ratio analysis creates false accounting data which gives
false ratios
At times the comparison is not possible if different firms adopt different — —
accounting policies
Ratio analysis becomes less effective due to price level changes
Ratios may be misleading in the absence of absolute data for organizations
like Mukwano
Limited use of a Single Ratio is a challenge for Mukwano when it uses ration
analysis in especially determining performance of distributors
Lack of proper standards affects the appropriateness of ratio analysis
33

APPENDIX II
Sample Size for the Given Population Sizes (N)
N S N S N S N S N S
10 10 100 80 280 162 800 260 2800 338
15 14 110 86 290 165 850 266 3000 341
20 19 120 92 300 169 900 269 3500 346
25 24 130 97 320 175 950 274 4000 351
30 28 140 103 340 181 1000 278 4500 354
35 32 150 108 360 186 1100 285 5000 357
40 36 160 113 380 191 1200 291 6000 361
45 40 170 118 400 196 1300 297 7000 364
50 44 180 123 420 201 1400 302 8000 367
55 48 190 127 440 205 1500 306 9000 368
60 52 200 132 460 210 1600 310 10000 370
65 56 210 136 480 214 1700 313 15000 375
70 59 220 140 500 217 1800 317 20000 377
75 63 230 144 550 226 1900 320 30000 379
80 66 240 148 600 234 2000 322 40000 380
85 70 250 152 650 242 2200 327 50000 381
90 73 260 155 700 248 2400 331 75000 382
95 76 270 159 750 254 2600 335 10000 384
SOURCE: Krejcie and Morgan (1970), determining sample size for research activities
34