Road scene analysis for determination of road traffic density
Upload
khangminh22Category
view
0download
0
RESEARCH ARTICLE
The road to sustainable use and waste management ofplastics in Portugal
Joana C. Prata (✉)1, Ana L. Patrício Silva2, Armando C. Duarte1, Teresa Rocha-Santos1
1 Centre for Environmental and Marine Studies (CESAM) & Department of Chemistry, University of Aveiro, 3810-193 Aveiro, Portugal2 Centre for Environmental and Marine Studies (CESAM) & Department of Biology, University of Aveiro, 3810-193 Aveiro, Portugal*
1 Introduction
Plastics have benefited humankind by providing a cheapand lightweight material that contributes to better medicalcare (e.g., disposable syringes) and food safety (e.g.,packaging). Plastics provide other societal benefits, such asstorage of clean water and improved shelf-lives of
packaged foods, only considered a problem due to misuseand mismanagement (Andrady and Neal, 2009). Whilehigh durability may be beneficial for some applications(e.g., in construction materials), single-use items andpackaging create problems regarding their persistence inthe environment. In 2019, of the global production of 368million ton of plastics, 39.6% were used in packaging(Plastics Europe, 2019). Most littered plastics originatefrom land-based sources (Jambeck et al., 2015). Despitepersistent in the environment, plastics fragment under theabrasive forces and sunlight forming pieces< 5 mmknown as microplastics (Andrady, 2017). Both plasticsand microplastics, directly and indirectly, affect ecosys-tems, human health, and have socioeconomic impacts
✉ Corresponding author
E-mail: [email protected]
Special Issue—Microplastic and Nanoplastic Pollution: Characteriza-
tion, Transport, Fate, and Remediation Strategies (Responsible Editors:
Wen Zhang, Melissa Pasquinelli & Yang Li)
Front. Environ. Sci. Eng. 2022, 16(1): 5https://doi.org/10.1007/s11783-021-1439-x
H I G H L I G H T S
• Portugal recycles 34% of the 40 kg/hab year ofplastic packaging waste.
•Recycling of plastics in Portugal produces a finalrevenue of 167 €/t.
•Recycling and recovery must be the priority forimported wastes.
•Beach litter must be reduced from 330 to 20items/100 m (94%) under EU goals.
•Consumption, use, and waste management ofplastics need to improve.
A R T I C L E I N F O
Article history:Received 14 May 2021Revised 10 August 2021Accepted 16 August 2021Available online 20 October 2021
Keywords:Single-use plasticsPlastic packagingPlastic wasteWaste managementWaste shipmentLightweight plastic bags
G R A P H I C A B S T R A C T
A B S T R A C T
As a European Union (EU) member, Portugal must comply with reductions in plastic waste. InPortugal, the 330 items/100 m of beach litter, comprising up to 3.9 million pieces and of which 88% isplastic, is higher than the EUmedian (149 items/100 m) and must be reduced to 20 items/100 m (94%).Integrative measures are needed to reduce littering and improve plastics’ use and disposal under thecircular economy. Of this 414 kt of plastic packaging waste, 163 kt were declared plastic packaging,140 kt subjected to recycling, and 94 kt to energy recovery. The current recycling rate of plasticpackaging (34%) should be improved to reach EU recycling averages (42%) and goals and to providewidespread benefits, considering revenues of 167 €/t. As a net importer of waste, Portugal couldbenefit from the valorization of imported waste. Besides increased recycling, pyrolysis and gasificationcould provide short-term alternatives for producing value-added substances from plastic waste, such ashydrogen, consistent with the National Plan of Hydrogen and improving ongoing regulations onsingle-use plastics. This manuscript provides an integrative view of plastics in Portugal, from use todisposal, providing specific recommendations under the circular economy.
© Higher Education Press 2021
(e.g., decreased tourism) (Prata et al., 2021). Theirreversibility and global distribution of marine plasticlitter lead to its classification as a planetary boundary threat(Villarrubia-Gómez et al., 2018).Portugal is a country with 1187 km of Atlantic coast
located in the south-western part of Europe. A review ofthe Portuguese coast’s environmental status of (micro)plastic contamination concluded that it is low to moder-ately contaminated (relative to other countries). However,animals already present plastics in their gastrointestinalsystems. Furthermore, the highest concentrations ofplastics were related to high population density areas(i.e., coastal cities) (Prata et al., 2020a). As a State Memberof the European Union (EU), Portugal must comply withmonitoring beach litter (European Commission, 2020c),reducing the consumption of single-use plastics (EuropeanParliament, 2019), and improving plastic waste manage-ment (European Parliament, 1994; European Commission,2018). Therefore, the Portuguese government is respon-sible for transposing EU Directives and recommendationsinto national laws and regulations, while the PortugueseEnvironmental Protection Agency (Agência Portuguesa doAmbiente, APA) is responsible for monitoring. This workaims to address current measures taken in Portugalregarding plastics’ consumption and waste managementof plastics, considering their success and compliance withEU objectives, and provide recommendations for improv-ing their use and waste management.
2 Waste management of plastics inPortugal
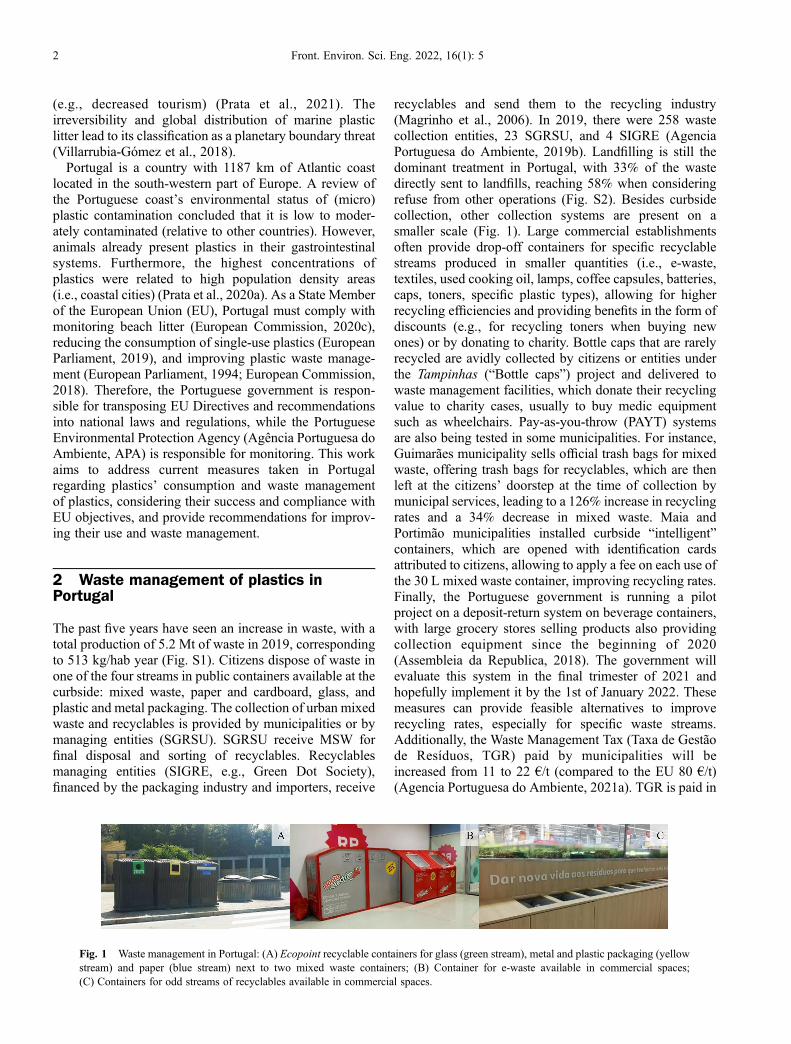
The past five years have seen an increase in waste, with atotal production of 5.2 Mt of waste in 2019, correspondingto 513 kg/hab year (Fig. S1). Citizens dispose of waste inone of the four streams in public containers available at thecurbside: mixed waste, paper and cardboard, glass, andplastic and metal packaging. The collection of urban mixedwaste and recyclables is provided by municipalities or bymanaging entities (SGRSU). SGRSU receive MSW forfinal disposal and sorting of recyclables. Recyclablesmanaging entities (SIGRE, e.g., Green Dot Society),financed by the packaging industry and importers, receive
recyclables and send them to the recycling industry(Magrinho et al., 2006). In 2019, there were 258 wastecollection entities, 23 SGRSU, and 4 SIGRE (AgenciaPortuguesa do Ambiente, 2019b). Landfilling is still thedominant treatment in Portugal, with 33% of the wastedirectly sent to landfills, reaching 58% when consideringrefuse from other operations (Fig. S2). Besides curbsidecollection, other collection systems are present on asmaller scale (Fig. 1). Large commercial establishmentsoften provide drop-off containers for specific recyclablestreams produced in smaller quantities (i.e., e-waste,textiles, used cooking oil, lamps, coffee capsules, batteries,caps, toners, specific plastic types), allowing for higherrecycling efficiencies and providing benefits in the form ofdiscounts (e.g., for recycling toners when buying newones) or by donating to charity. Bottle caps that are rarelyrecycled are avidly collected by citizens or entities underthe Tampinhas (“Bottle caps”) project and delivered towaste management facilities, which donate their recyclingvalue to charity cases, usually to buy medic equipmentsuch as wheelchairs. Pay-as-you-throw (PAYT) systemsare also being tested in some municipalities. For instance,Guimarães municipality sells official trash bags for mixedwaste, offering trash bags for recyclables, which are thenleft at the citizens’ doorstep at the time of collection bymunicipal services, leading to a 126% increase in recyclingrates and a 34% decrease in mixed waste. Maia andPortimão municipalities installed curbside “intelligent”containers, which are opened with identification cardsattributed to citizens, allowing to apply a fee on each use ofthe 30 L mixed waste container, improving recycling rates.Finally, the Portuguese government is running a pilotproject on a deposit-return system on beverage containers,with large grocery stores selling products also providingcollection equipment since the beginning of 2020(Assembleia da Republica, 2018). The government willevaluate this system in the final trimester of 2021 andhopefully implement it by the 1st of January 2022. Thesemeasures can provide feasible alternatives to improverecycling rates, especially for specific waste streams.Additionally, the Waste Management Tax (Taxa de Gestãode Resíduos, TGR) paid by municipalities will beincreased from 11 to 22 €/t (compared to the EU 80 €/t)(Agencia Portuguesa do Ambiente, 2021a). TGR is paid in
Fig. 1 Waste management in Portugal: (A) Ecopoint recyclable containers for glass (green stream), metal and plastic packaging (yellowstream) and paper (blue stream) next to two mixed waste containers; (B) Container for e-waste available in commercial spaces;(C) Containers for odd streams of recyclables available in commercial spaces.
2 Front. Environ. Sci. Eng. 2022, 16(1): 5
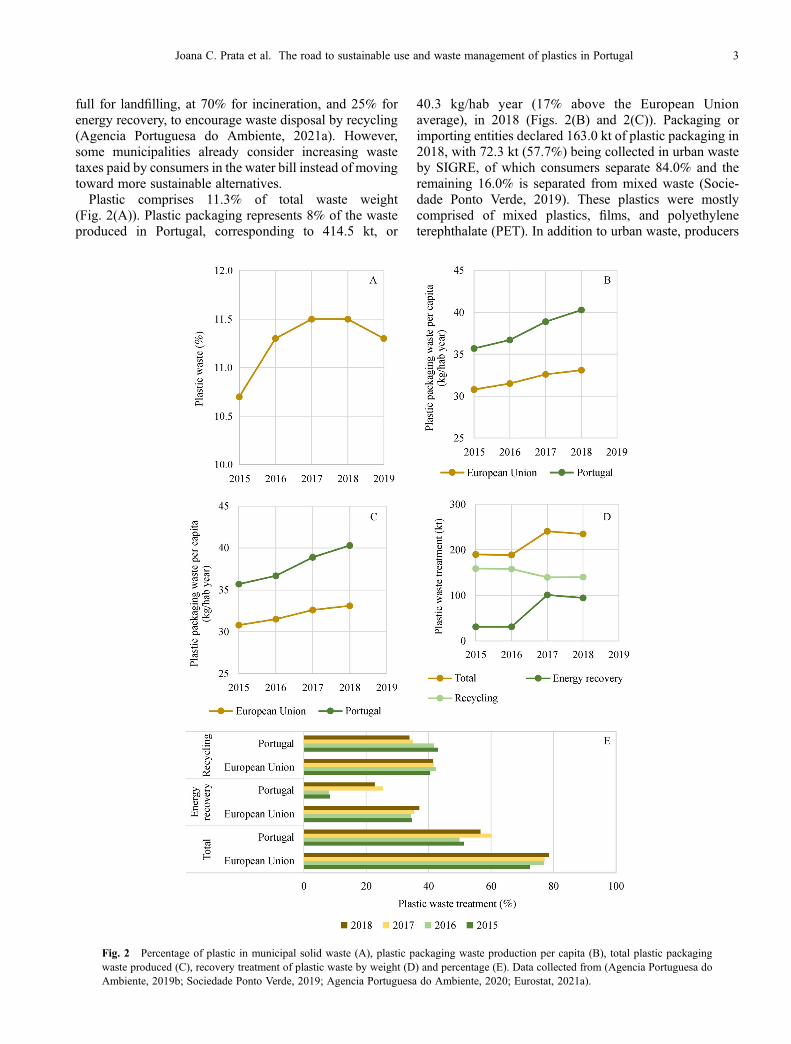
full for landfilling, at 70% for incineration, and 25% forenergy recovery, to encourage waste disposal by recycling(Agencia Portuguesa do Ambiente, 2021a). However,some municipalities already consider increasing wastetaxes paid by consumers in the water bill instead of movingtoward more sustainable alternatives.Plastic comprises 11.3% of total waste weight
(Fig. 2(A)). Plastic packaging represents 8% of the wasteproduced in Portugal, corresponding to 414.5 kt, or
40.3 kg/hab year (17% above the European Unionaverage), in 2018 (Figs. 2(B) and 2(C)). Packaging orimporting entities declared 163.0 kt of plastic packaging in2018, with 72.3 kt (57.7%) being collected in urban wasteby SIGRE, of which consumers separate 84.0% and theremaining 16.0% is separated from mixed waste (Socie-dade Ponto Verde, 2019). These plastics were mostlycomprised of mixed plastics, films, and polyethyleneterephthalate (PET). In addition to urban waste, producers
Fig. 2 Percentage of plastic in municipal solid waste (A), plastic packaging waste production per capita (B), total plastic packagingwaste produced (C), recovery treatment of plastic waste by weight (D) and percentage (E). Data collected from (Agencia Portuguesa doAmbiente, 2019b; Sociedade Ponto Verde, 2019; Agencia Portuguesa do Ambiente, 2020; Eurostat, 2021a).
Joana C. Prata et al. The road to sustainable use and waste management of plastics in Portugal 3
of non-urban waste must ensure the dispatching of waste toa licensed waste management entity. From the 414.5 kt oftotal plastic packaging collected (urban and non-urban),140.4 kt were recycled, and 94.2 kt were subjected toenergy recovery (Fig. 2(D); Agencia Portuguesa doAmbiente, 2020; Eurostat, 2021a). This corresponds torecycling of 33.9% and energy recovery of 22.7% ofplastic packaging, below the EU averages of 41.5% and37.0%, respectively (Figs. 2(E) and S3). The currentrecycling rate of 33.9% for plastic packaging in Portugal isalready above the national objective of 22.5% set inDecree-Law n. 152-D/2017 (Assembleia da Republica,2017) and above the EU targets of 25% (EuropeanParliament, 1994). EU targets increase to 50% and 55%by 2025 and 2030, respectively (European Parliament,1994). Thus, rapid investment in recycling infrastructuresis needed in the coming decade to achieve these goals.Recycling in Portugal, including recycling plastics, gen-erally benefits the environment, although differences inLife Cycle Assessment (LCA) result from differentassumptions (Table 1). In addition to environmentalbenefits, recycling is beneficial for the society andeconomy. In 2011, SIGRE created 2300 direct jobs, andfor each 1 € of value-added generated in SIGRE’s activity,1.3 € were additionally added to the economy, amountingto 391 million € in total revenue (Ferrão et al., 2014).Similarly, the high value of plastic (732 €/t) and mixedplastic (245 €/t) waste, and avoided alternative treatments(e.g., landfilling), allow offsetting costs with collection andsorting, resulting in a final revenue from the recycling of167.2 €/t or 31.7 €/hab year (Pires et al., 2017). In additionto revenues directly related to the waste managementsystem, recycling activities in Portugal also producebenefits in terms of environmental costs in the range of3.3 to 8.2 million € (Ferreira et al., 2014). While recyclingshould be prioritized considering the benefits for society(e.g., saving of raw materials, energy, environmental andsocietal benefits), energy recovery should be preferred tolandfilling of recycling refuse (e.g., degraded or contami-nated plastics) (Prata et al., 2019). Waste-to-energy, in theform of incineration, also has a beneficial environmentalimpact (Table 1), with an ecological footprint of – 0.78global m2/kg of combustible waste (i.e., saving spacerequired to provide the resources and absorb wastes of anactivity) (Herva et al., 2014) and an additional positiveoutcome in terms of ecotoxicity (freshwater: – 267�10–3
kgDCB-eq; seawater: – 26�10–3 kgDCB-eq; terrestrial:– 59�10–3 kgDCB-eq), and human toxicity potential( – 7.45 kgDCB-eq), mostly offset by resources and emis-sions saved in alternative energy production and avoidedlandfilling (Ramos et al., 2018). As for all recoveries,including waste-to-energy, the national objective for allpackaging materials is 60% (Assembleia da Republica,2017). Energy recovery is currently 22.7% for plasticpackaging, and increasing it would help achieve theobjectives, especially for plastics with low recyclability.
Energy recovery is a viable solution for plastics whenconsidering energy contents of 43.3 MJ/kg in polyethylene(Baytekin et al., 2013) or 19–28 MJ/kg in plasticsrecovered by landfill mining (Quaghebeur et al., 2013).Only two incinerators for MSW exist in Portugal (i.e., inPorto and Lisbon), requiring investment in infrastructuresto increase energy recovery from packaging waste,including plastic waste. Building incineration facilitiescan be controversial, as they are not easily accepted by thePortuguese public, requiring additional awareness cam-paigns. An alternative solution would be to producefeedstock from plastic waste- chemicals used to producefuels, lubricants, or new plastics (Prata et al., 2019).Pyrolysis produces value-added oil, gas and char, fromplastics subjected to an anaerobic thermal process(Sharuddin et al., 2016), while gasification producessynthetic gas with a lower infrastructure cost and rapidreturn of the investment (as low as 1.4 years) (Eriksenet al., 2018). Gasification and pyrolysis coupled withcatalytic steam reforming produce H2, with the latter beingable to convert over 30% of plastic weight to H2 (Lopezet al., 2018). Green hydrogen production must be increasedfollowing the National Plan of Hydrogen, one of thedecarbonization measures, including 10%–15% consump-tion by injection in natural gas systems, 1%–5%consumption in road transport, 1.5%–2% in total energyconsumption by 2030 (Assembleia da Republica, 2020).Thus, sustainable waste management for plastic contri-butes to waste management goals and green hydrogengoals (if sustainably treated). Ideally, these options shouldbe considered under an integrated waste managementsystem (IWMS). In Portugal, an existing IWMS, whichincludes recyclables, incineration, composting, and landfillof residual wastes (e.g., ashes), provided a beneficialecological footprint of – 0.49 global m2/kg of waste (i.e.,saving 0.49 m2 per kg of waste) (Herva et al., 2014).Therefore, IWMS should be expanded to all municipa-lities.
3 Waste trade in Portugal
As plastic waste contains valuable raw materials, tradingsuch wastes can have a positive impact when treated underthe circular economy. Waste transportation within andbeyond EU borders (OECD and non-OECD) is regulatedby the EU waste shipment regulation EC 1013/2006 andthe recent amendment through Delegated Regulation (EU)2020/2174 (European Commission, 2021). Such amend-ment, which entered into force on the 1st of January 2021,restricts waste trade on certain plastics. For instance, itbans the export of hazardous plastic waste (i.e., plasticsthat contain hazardous constituents or are in contact withhazardous substances such as flammable, poisonous,infectious, corrosive substances) and non-hazardous plas-tic waste hard to recycle from EU to non-OECD countries
4 Front. Environ. Sci. Eng. 2022, 16(1): 5
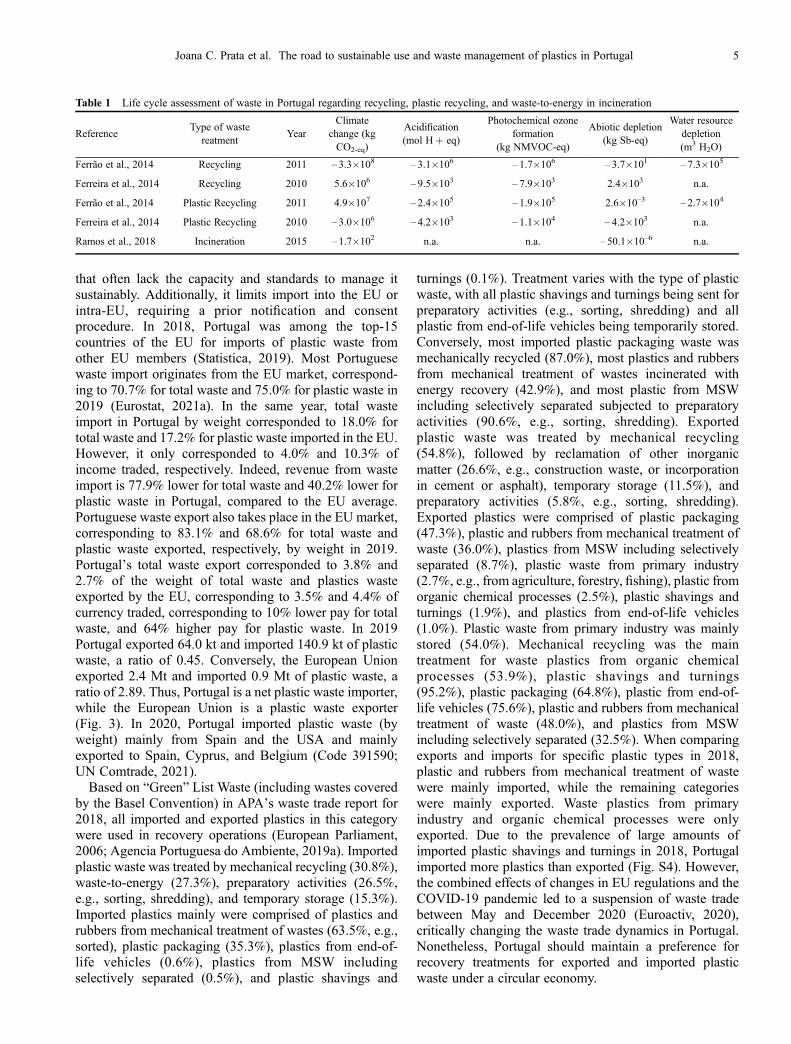
that often lack the capacity and standards to manage itsustainably. Additionally, it limits import into the EU orintra-EU, requiring a prior notification and consentprocedure. In 2018, Portugal was among the top-15countries of the EU for imports of plastic waste fromother EU members (Statistica, 2019). Most Portuguesewaste import originates from the EU market, correspond-ing to 70.7% for total waste and 75.0% for plastic waste in2019 (Eurostat, 2021a). In the same year, total wasteimport in Portugal by weight corresponded to 18.0% fortotal waste and 17.2% for plastic waste imported in the EU.However, it only corresponded to 4.0% and 10.3% ofincome traded, respectively. Indeed, revenue from wasteimport is 77.9% lower for total waste and 40.2% lower forplastic waste in Portugal, compared to the EU average.Portuguese waste export also takes place in the EU market,corresponding to 83.1% and 68.6% for total waste andplastic waste exported, respectively, by weight in 2019.Portugal’s total waste export corresponded to 3.8% and2.7% of the weight of total waste and plastics wasteexported by the EU, corresponding to 3.5% and 4.4% ofcurrency traded, corresponding to 10% lower pay for totalwaste, and 64% higher pay for plastic waste. In 2019Portugal exported 64.0 kt and imported 140.9 kt of plasticwaste, a ratio of 0.45. Conversely, the European Unionexported 2.4 Mt and imported 0.9 Mt of plastic waste, aratio of 2.89. Thus, Portugal is a net plastic waste importer,while the European Union is a plastic waste exporter(Fig. 3). In 2020, Portugal imported plastic waste (byweight) mainly from Spain and the USA and mainlyexported to Spain, Cyprus, and Belgium (Code 391590;UN Comtrade, 2021).Based on “Green” List Waste (including wastes covered
by the Basel Convention) in APA’s waste trade report for2018, all imported and exported plastics in this categorywere used in recovery operations (European Parliament,2006; Agencia Portuguesa do Ambiente, 2019a). Importedplastic waste was treated by mechanical recycling (30.8%),waste-to-energy (27.3%), preparatory activities (26.5%,e.g., sorting, shredding), and temporary storage (15.3%).Imported plastics mainly were comprised of plastics andrubbers from mechanical treatment of wastes (63.5%, e.g.,sorted), plastic packaging (35.3%), plastics from end-of-life vehicles (0.6%), plastics from MSW includingselectively separated (0.5%), and plastic shavings and
turnings (0.1%). Treatment varies with the type of plasticwaste, with all plastic shavings and turnings being sent forpreparatory activities (e.g., sorting, shredding) and allplastic from end-of-life vehicles being temporarily stored.Conversely, most imported plastic packaging waste wasmechanically recycled (87.0%), most plastics and rubbersfrom mechanical treatment of wastes incinerated withenergy recovery (42.9%), and most plastic from MSWincluding selectively separated subjected to preparatoryactivities (90.6%, e.g., sorting, shredding). Exportedplastic waste was treated by mechanical recycling(54.8%), followed by reclamation of other inorganicmatter (26.6%, e.g., construction waste, or incorporationin cement or asphalt), temporary storage (11.5%), andpreparatory activities (5.8%, e.g., sorting, shredding).Exported plastics were comprised of plastic packaging(47.3%), plastic and rubbers from mechanical treatment ofwaste (36.0%), plastics from MSW including selectivelyseparated (8.7%), plastic waste from primary industry(2.7%, e.g., from agriculture, forestry, fishing), plastic fromorganic chemical processes (2.5%), plastic shavings andturnings (1.9%), and plastics from end-of-life vehicles(1.0%). Plastic waste from primary industry was mainlystored (54.0%). Mechanical recycling was the maintreatment for waste plastics from organic chemicalprocesses (53.9%), plastic shavings and turnings(95.2%), plastic packaging (64.8%), plastic from end-of-life vehicles (75.6%), plastic and rubbers from mechanicaltreatment of waste (48.0%), and plastics from MSWincluding selectively separated (32.5%). When comparingexports and imports for specific plastic types in 2018,plastic and rubbers from mechanical treatment of wastewere mainly imported, while the remaining categorieswere mainly exported. Waste plastics from primaryindustry and organic chemical processes were onlyexported. Due to the prevalence of large amounts ofimported plastic shavings and turnings in 2018, Portugalimported more plastics than exported (Fig. S4). However,the combined effects of changes in EU regulations and theCOVID-19 pandemic led to a suspension of waste tradebetween May and December 2020 (Euroactiv, 2020),critically changing the waste trade dynamics in Portugal.Nonetheless, Portugal should maintain a preference forrecovery treatments for exported and imported plasticwaste under a circular economy.
Table 1 Life cycle assessment of waste in Portugal regarding recycling, plastic recycling, and waste-to-energy in incineration
ReferenceType of waste
reatmentYear
Climatechange (kgCO2-eq)
Acidification(mol H+ eq)
Photochemical ozoneformation
(kg NMVOC-eq)
Abiotic depletion(kg Sb-eq)
Water resourcedepletion(m3 H2O)
Ferrão et al., 2014 Recycling 2011 – 3.3�108 – 3.1�106 – 1.7�106 – 3.7�101 – 7.3�105
Ferreira et al., 2014 Recycling 2010 5.6�106 – 9.5�103 – 7.9�103 2.4�103 n.a.
Ferrão et al., 2014 Plastic Recycling 2011 4.9�107 – 2.4�105 – 1.9�105 2.6�10–3 – 2.7�104
Ferreira et al., 2014 Plastic Recycling 2010 – 3.0�106 – 4.2�103 – 1.1�104 – 4.2�103 n.a.
Ramos et al., 2018 Incineration 2015 – 1.7�102 n.a. n.a. – 50.1�10–6 n.a.
Joana C. Prata et al. The road to sustainable use and waste management of plastics in Portugal 5
4 Littered plastics in Portugal
Littered waste does not enter proper waste managementstreams. Therefore, the most common plastic items presentin the Portuguese environment across time must determinethe needed solutions. Two data sets are available online
and were used to assess littered waste- beach surveyreports from APA and citizen science entries in asmartphone app named Litterati.Litterati (Litterati, 2021) is an APP in which users
photograph and classify littered items in all types ofenvironments (e.g., urban, beach), taking advantage of
Fig. 3 Plastic waste import in Portugal (A), import percentage by total waste by weight (B), export in Portugal (C), export percentage bytotal waste by weight (D), ratio export/import (E). Data collected from Agencia Portuguesa do Ambiente, 2019b; Sociedade Ponto Verde,2019; Agencia Portuguesa do Ambiente, 2020; Eurostat, 2021a.
6 Front. Environ. Sci. Eng. 2022, 16(1): 5

citizen science. The free online database was downloadedon the 3rd of February 2021 and further formattedfollowing OSPAR classifications for marine litter, alsoused by APA, based on the description tags (OSPAR,2007). Only plastic items and cigarette butts wereclassified following the objective of the work. Limitationsin classification based on the lack of details requiredcombining some categories (e.g., small plastic bags andplastic bags, plastics and polystyrene pieces) and classify-ing ambiguous descriptions as unidentified. A total of14188 items, corresponding to 1325 plastic items (9.3%)and 2003 cigarette butts (14.1%), were reported from 2015to early February 2021. It is worth considering that manyentries did not present a description (10.2%), possiblyinfluencing results. Cigarette butts corresponded to 60.2%of classified entries. Most entries on plastics and cigarettebutts (n = 3061) were concentrated in 2020, with 65.4%corresponding to cigarette butts. For plastics, the ten mostfrequent items found were plastic and polystyrene pieces(24.6%), unidentified plastics (23.9%), crisp or sweetpackets and lollipop sticks (9.0%), other plastics/polystyr-ene items (7.9%), caps and lids (3.9%), other medicalwaste: masks (3.7%), bottles, containers, and drums:drinks (3.3%), plastic bags (3.3%), packaging (3.0%),and cutlery, trays, straws and stirrers (2.9%). If consideredtogether, pandemic related items (masks, gloves, wetwipes) contributed to 5.7% of plastic waste. It should beconsidered that these results might be influenced by thenumber of data entries and public perception of theproblem of littering some items.APA is the Portuguese entity responsible for monitoring
beach litter, following the Marine Strategies FrameworkDirective (European Commission, 2020c) recommenda-tions and classifying litter in 100 m stretches of multiplebeaches following the OSPAR system (Agencia Portu-guesa do Ambiente, 2021b). Reports are available from2013 to 2020, with varying data analysis criteria requiringuniformization (e.g., calculations of the percentage ofplastic items based on total items from 2015–2017)(Agencia Portuguesa do Ambiente, 2021b). Sampledbeaches increased from 7 to 15 in 2014 and 2020,respectively, with the highest number of campaigns (60)achieved in 2019 (Fig. S5). The number of surveys percountry should be at least 40 (European Commission,2020a), which has been achieved since 2018. The totalamount of items in beaches varied from 349 to 943 items/100 m, with a mean of 588 items/100 m from 2013 to 2020(Fig. 4(A)). The mean amount of beach litter in 1470surveys in the European Union from 2015 to 2016 was 504items/100 m, with a threshold set on a median of 20 items/100 m (European Commission, 2020a). The amount ofbeach litter in Portugal is considerably higher than theobjective and closer to the European average. It is alsoworth considering that values are reported as means, whilethe threshold value is a median. According to APA reports,for 2015–2016, a median of 330 items/100 m was
registered for Portugal, compared to 149 items/100 m inthe European Union. While all European countries are stillabove the threshold value, Portugal must take swift actionto reduce beach litter. The percentage of plastic items hasincreased, reaching 88% in 2020 (Fig. 4(B)), close to thereported 90% European value (European Commission,2020a). Although data is not always available, thepercentage of most common plastic items and cigarettebutts across years is presented in Fig. 4(C). The percentageof each category has remained relatively stable over theyears, with some exceptions (e.g., a peak of 12% in capsand lids in 2017). Harmonizing data by combiningcategories and calculating the percentages by total itemsreveal that the most common items were comparablebetween Litterati and APA for 2020 (Fig. 4(D)). It is worthconsidering that Litterati data is spread across thePortuguese territory, while APA’s monitoring is focusedon beach litter. Cigarette butts and plastic or polystyrenepieces are present in relatively similar percentages,dominating both databases. Foam sponge is morefrequently found in beaches, possibly by originatingfrom fishing or boating activities (e.g., buoys) or beingtransported and accumulating in marine environments.Drinking containers (e.g., bottles, cups), disposable table-ware (e.g., cutlery, straws), and packaging for snacks (e.g.,crisps, sweet packets, lollipop sticks) are more dominant inLitterati than in beach litter. This results from citizensbeing more aware and reporting these items morefrequently or from their predominance in urban areas.
5 Reducing the consumption of plastics inPortugal
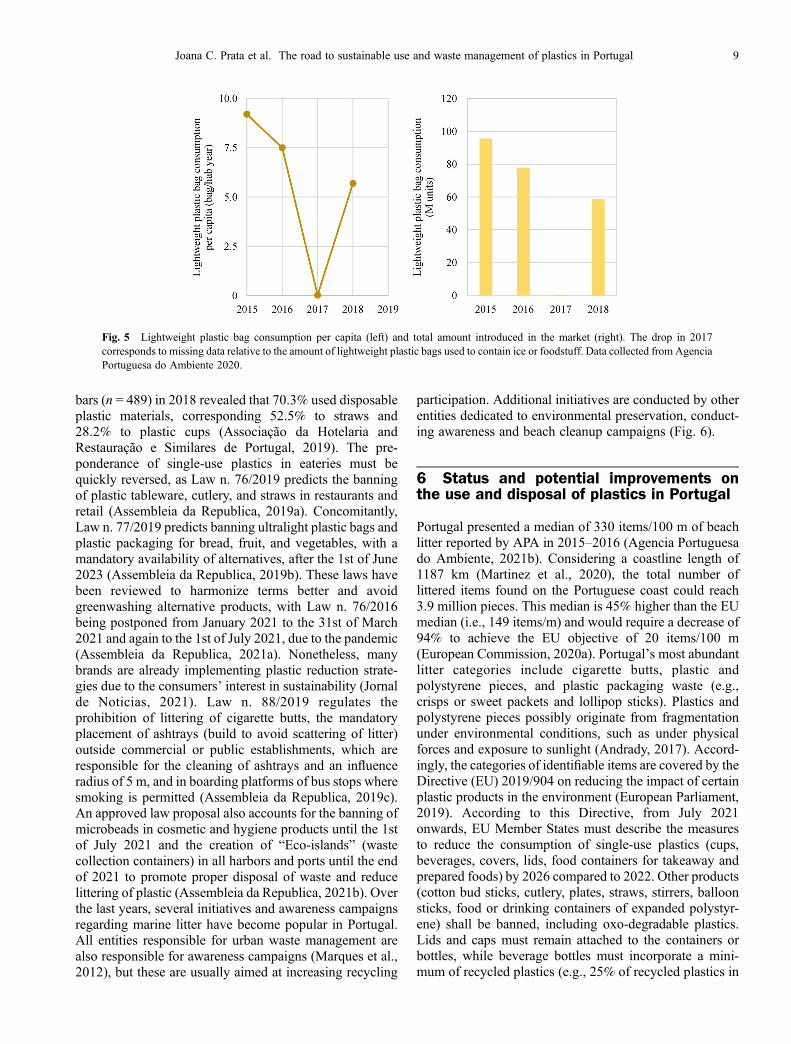
Lightweight plastic bags (thickness< 50 µm) were amongthe top ten littered items in the EU (Kasidoni et al., 2015).Thus, economic instruments (e.g., fees) or restrictions(e.g., bans) were implemented to reduce their consumptionfrom an average of 200 bags per capita (Kasidoni et al.,2015). Directive 94/62/EC (European Parliament, 1994),updated by Directive (EU) 2015/720 (European Parlia-ment, 2015), establishes that thin plastic bags should not befree of charge from the 31st of December 2018 onwards,and yearly consumption should be reduced to 90 bags percapita by the 31st of December 2019 and 40 bags by the31st of December 2025. To achieve this goal, Portugalinstituted a fee on thin plastics bags of 0.10 € (Assembleiada Republica, 2014). In 2011, thin plastic bag consumptionin Portugal was estimated at 466 bags/hab year, witharound four bags littered per capita year (corresponding to44 million plastic bags littered every year) (Kasidoni et al.,2015). In 2018, lightweight plastic bag consumption was5.7 bags/hab year, a 99% reduction and already complyingwith the EU objectives for the end of 2025 (Fig. 5; AgenciaPortuguesa do Ambiente, 2020).A survey on Portuguese restaurants, pastry shops and
Joana C. Prata et al. The road to sustainable use and waste management of plastics in Portugal 7
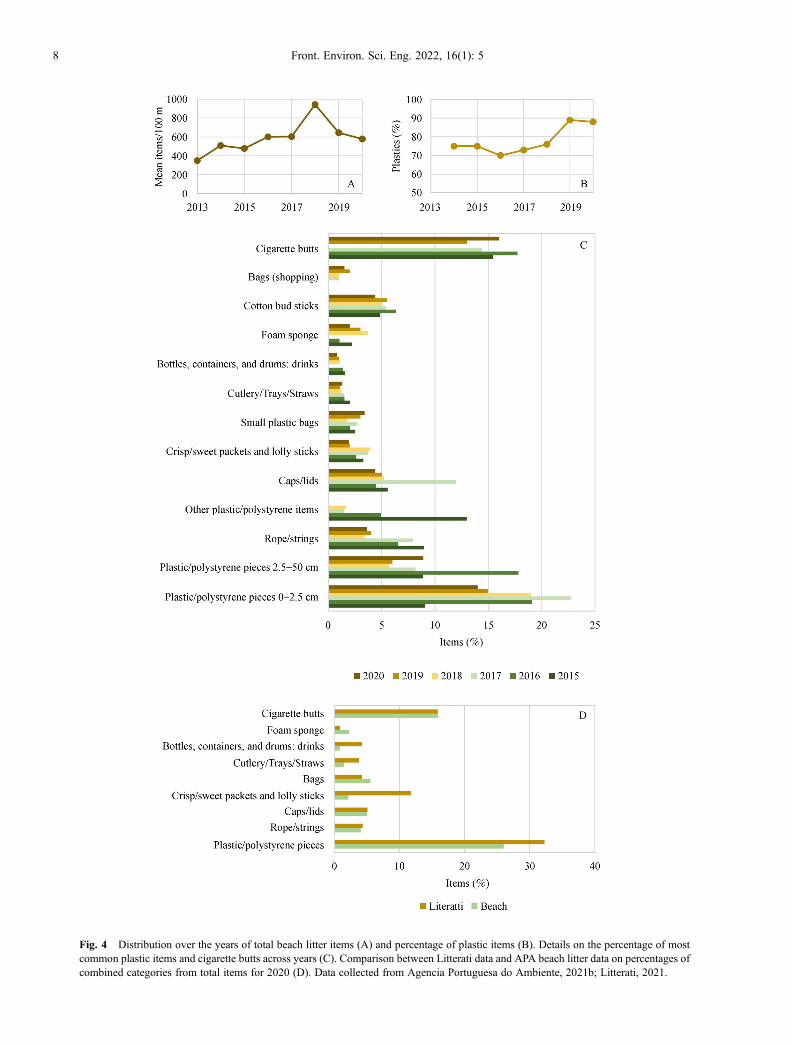
Fig. 4 Distribution over the years of total beach litter items (A) and percentage of plastic items (B). Details on the percentage of mostcommon plastic items and cigarette butts across years (C). Comparison between Litterati data and APA beach litter data on percentages ofcombined categories from total items for 2020 (D). Data collected from Agencia Portuguesa do Ambiente, 2021b; Litterati, 2021.
8 Front. Environ. Sci. Eng. 2022, 16(1): 5
bars (n = 489) in 2018 revealed that 70.3% used disposableplastic materials, corresponding 52.5% to straws and28.2% to plastic cups (Associação da Hotelaria andRestauração e Similares de Portugal, 2019). The pre-ponderance of single-use plastics in eateries must bequickly reversed, as Law n. 76/2019 predicts the banningof plastic tableware, cutlery, and straws in restaurants andretail (Assembleia da Republica, 2019a). Concomitantly,Law n. 77/2019 predicts banning ultralight plastic bags andplastic packaging for bread, fruit, and vegetables, with amandatory availability of alternatives, after the 1st of June2023 (Assembleia da Republica, 2019b). These laws havebeen reviewed to harmonize terms better and avoidgreenwashing alternative products, with Law n. 76/2016being postponed from January 2021 to the 31st of March2021 and again to the 1st of July 2021, due to the pandemic(Assembleia da Republica, 2021a). Nonetheless, manybrands are already implementing plastic reduction strate-gies due to the consumers’ interest in sustainability (Jornalde Noticias, 2021). Law n. 88/2019 regulates theprohibition of littering of cigarette butts, the mandatoryplacement of ashtrays (build to avoid scattering of litter)outside commercial or public establishments, which areresponsible for the cleaning of ashtrays and an influenceradius of 5 m, and in boarding platforms of bus stops wheresmoking is permitted (Assembleia da Republica, 2019c).An approved law proposal also accounts for the banning ofmicrobeads in cosmetic and hygiene products until the 1stof July 2021 and the creation of “Eco-islands” (wastecollection containers) in all harbors and ports until the endof 2021 to promote proper disposal of waste and reducelittering of plastic (Assembleia da Republica, 2021b). Overthe last years, several initiatives and awareness campaignsregarding marine litter have become popular in Portugal.All entities responsible for urban waste management arealso responsible for awareness campaigns (Marques et al.,2012), but these are usually aimed at increasing recycling
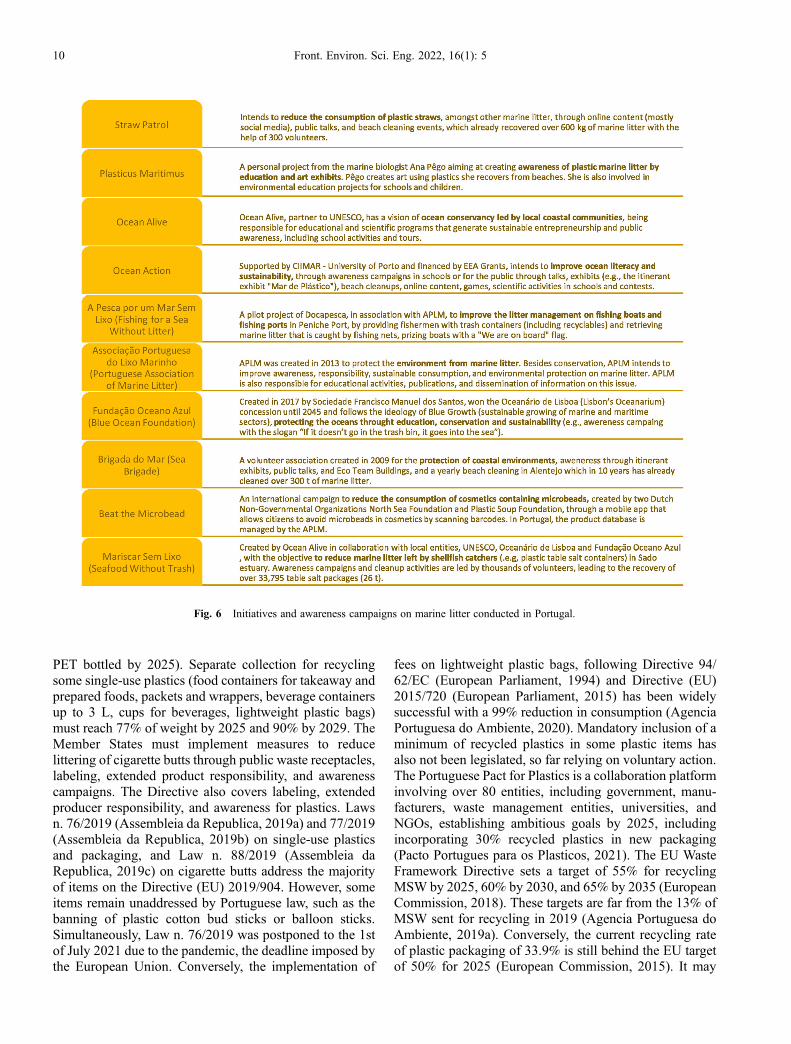
participation. Additional initiatives are conducted by otherentities dedicated to environmental preservation, conduct-ing awareness and beach cleanup campaigns (Fig. 6).
6 Status and potential improvements onthe use and disposal of plastics in Portugal
Portugal presented a median of 330 items/100 m of beachlitter reported by APA in 2015–2016 (Agencia Portuguesado Ambiente, 2021b). Considering a coastline length of1187 km (Martinez et al., 2020), the total number oflittered items found on the Portuguese coast could reach3.9 million pieces. This median is 45% higher than the EUmedian (i.e., 149 items/m) and would require a decrease of94% to achieve the EU objective of 20 items/100 m(European Commission, 2020a). Portugal’s most abundantlitter categories include cigarette butts, plastic andpolystyrene pieces, and plastic packaging waste (e.g.,crisps or sweet packets and lollipop sticks). Plastics andpolystyrene pieces possibly originate from fragmentationunder environmental conditions, such as under physicalforces and exposure to sunlight (Andrady, 2017). Accord-ingly, the categories of identifiable items are covered by theDirective (EU) 2019/904 on reducing the impact of certainplastic products in the environment (European Parliament,2019). According to this Directive, from July 2021onwards, EU Member States must describe the measuresto reduce the consumption of single-use plastics (cups,beverages, covers, lids, food containers for takeaway andprepared foods) by 2026 compared to 2022. Other products(cotton bud sticks, cutlery, plates, straws, stirrers, balloonsticks, food or drinking containers of expanded polystyr-ene) shall be banned, including oxo-degradable plastics.Lids and caps must remain attached to the containers orbottles, while beverage bottles must incorporate a mini-mum of recycled plastics (e.g., 25% of recycled plastics in
Fig. 5 Lightweight plastic bag consumption per capita (left) and total amount introduced in the market (right). The drop in 2017corresponds to missing data relative to the amount of lightweight plastic bags used to contain ice or foodstuff. Data collected from AgenciaPortuguesa do Ambiente 2020.
Joana C. Prata et al. The road to sustainable use and waste management of plastics in Portugal 9
PET bottled by 2025). Separate collection for recyclingsome single-use plastics (food containers for takeaway andprepared foods, packets and wrappers, beverage containersup to 3 L, cups for beverages, lightweight plastic bags)must reach 77% of weight by 2025 and 90% by 2029. TheMember States must implement measures to reducelittering of cigarette butts through public waste receptacles,labeling, extended product responsibility, and awarenesscampaigns. The Directive also covers labeling, extendedproducer responsibility, and awareness for plastics. Lawsn. 76/2019 (Assembleia da Republica, 2019a) and 77/2019(Assembleia da Republica, 2019b) on single-use plasticsand packaging, and Law n. 88/2019 (Assembleia daRepublica, 2019c) on cigarette butts address the majorityof items on the Directive (EU) 2019/904. However, someitems remain unaddressed by Portuguese law, such as thebanning of plastic cotton bud sticks or balloon sticks.Simultaneously, Law n. 76/2019 was postponed to the 1stof July 2021 due to the pandemic, the deadline imposed bythe European Union. Conversely, the implementation of
fees on lightweight plastic bags, following Directive 94/62/EC (European Parliament, 1994) and Directive (EU)2015/720 (European Parliament, 2015) has been widelysuccessful with a 99% reduction in consumption (AgenciaPortuguesa do Ambiente, 2020). Mandatory inclusion of aminimum of recycled plastics in some plastic items hasalso not been legislated, so far relying on voluntary action.The Portuguese Pact for Plastics is a collaboration platforminvolving over 80 entities, including government, manu-facturers, waste management entities, universities, andNGOs, establishing ambitious goals by 2025, includingincorporating 30% recycled plastics in new packaging(Pacto Portugues para os Plasticos, 2021). The EU WasteFramework Directive sets a target of 55% for recyclingMSW by 2025, 60% by 2030, and 65% by 2035 (EuropeanCommission, 2018). These targets are far from the 13% ofMSW sent for recycling in 2019 (Agencia Portuguesa doAmbiente, 2019a). Conversely, the current recycling rateof plastic packaging of 33.9% is still behind the EU targetof 50% for 2025 (European Commission, 2015). It may
Fig. 6 Initiatives and awareness campaigns on marine litter conducted in Portugal.
10 Front. Environ. Sci. Eng. 2022, 16(1): 5
also compromise the recycling of specific single-useplastics, which should reach 77% by 2025 (EuropeanParliament, 2019). In December 2020, the EU released theCouncil Decision (EU, Euratom) 202/2053 on the manage-ment of resources. This Council Decision predicts MemberStates pay 0.80 €/kg for non-recycled plastic waste, whichwill be adjusted based on the gross national income (GNI)per capita in 2017 for countries below the EU average,corresponding to a reduction of 3.8 kg per capita in 2017(European Commission, 2020b). The Portuguese GNI percapita (standardized by purchasing power standards) was22.2 k€ compared to the EU average of 29.3 k€ (Eurostat,2021b) in 2017. In the same year, Portugal presented 10.3million inhabitants (Instituto Nacional de Estatistica,2018), corresponding to an allowed reduction of 39.1 ktof non-recycled plastic waste. In 2017, 400.2 kt of totalplastic packaging were declared, with 139.6 kt beingrecycled, leaving 260.6 kt of non-recycled plastics(Agencia Portuguesa do Ambiente, 2020). With a reduc-tion of 39.1 kt, 221.5 kt should pay a fee to the EU,corresponding to 177 M€, similar to the expectedcontribution of 153 M€ in Belgium (EY, 2020). Con-versely, based on the revenue of recycling plastics (Pires etal., 2017), fully recycling 221.5 kt could generate arevenue of 4 M€ while preventing the previouslymentioned contribution to the EU (a summed benefit of181 M€), not accounting for indirect benefits (e.g.,environmental costs). Therefore, a strategy based on theprevention and recycling of plastic packaging musturgently be adopted by Portugal. This profit could beincreased through preferential recycling of importedwastes as well. Based on these needs, the followingrecommendations can be followed to improve plasticsconsumption and waste management:� Reduction of consumption of plastics and other
products is the preferred strategy in avoiding wasteproduction. Results of various bans or levies on single-use plastics taking place at a global level are encouraging(Xanthos and Walker, 2017). A market regulationapproach has been applied to lightweight plastic bagsand single-use plastics following EU Directives, despite animproved transposition into national law still beingrequired (i.e., the inclusion of plastic cotton bud sticks).In addition to being widely successful, implementing a0.10 € fee on lightweight plastic bags in Portugal did notsignificantly harm the economy and has gathered widepublic support, sympathetic with the implementation ofsimilar measures to other plastic items (Luís et al., 2020).Additional regulations are required regarding the qualitiesexpected in plastics entering the market, such as chemicalcomposition, recyclability, and inclusion of a recycledfraction. The EU already mandates the inclusion ofrecycled plastics in some items (i.e., in Directive (EU)2019/904; European Parliament, 2019), creating a marketfor recycled plastics, and is currently studying plastic
additives through the European Chemical Agency (Eur-opean Chemical Agency, 2018). An alternative is toclassify and handle certain types of problematic plastics ashazardous waste based on their potential toxicity and lowrecyclability, such as polyvinyl chloride, polystyrene,polyurethane, and polycarbonate (Rochman et al., 2013).Improvements in recycling could be achieved at the designand production level (e.g., avoiding plastic mixtures),while less demanding products could be produced fromrecycled products. Recyclability is affected by multiplefactors and should account for: 1) polymer type, recyclingof some polymer types is easier and cost-effective (e.g.,polyethylene terephthalate); 2) size, shape, color, whichcan influence if an item is identified as a recyclable byoptical sorters or manual sorting; 3) liners, labels, andcomponents which must be segregated before recycling;4) additives, which can have adverse effects on humanhealth and the environment; 5) available infrastructure,determining if the item can indeed be recycled;6) economics and markets, which determine if there isdemand for the recycled material (Consumers Interna-tional, 2021). For instance, high-density polyethylene trashbags could be fully made from recycled materials,producing solely 52% of the abiotic depletion of virginplastics (Fernández-Braña et al., 2019). Continente, one ofthe supermarkets’ chains in Portugal, is already imple-menting plastic reduction strategies. These include usingtransparent cellulose films in the packaging of bread,banning microbeads from cosmetics and plastic strawsfrom drinks (replaced by paper straws), and testingreusable containers for takeaway and charcuterie (Con-tinente, 2021). Besides Continente, many other Portuguesebrands and retailers are involved in the “Pacto Portuguêspara os Plásticos” (Portuguese Plastic Pact) focused ontransitioning plastics to a circular economy (PactoPortugues para os Plasticos, 2021). Awareness andconsumer choices are other factors shaping the consump-tion of plastics. For instance, consumers who were madeaware of microbeads (small plastic spheres used asexfoliants) in a cosmetic would choose not to purchaseor discontinue their use (Chang, 2015). In a 2010 survey,35% of Portuguese consumers were identified as highlysensitive to environmental issues, including ecofriendlyproducts and recycling (Finisterra do Paço and Raposo,2010). Therefore, consumers in Portugal may be receptiveto changes toward sustainability and the circular economy.However, effective implementation of sustainable con-sumption needs to overcome misinterpretations by con-sumers (e.g., considering a product or material moresustainable than others, despite LCA evidence on thecontrary) and misleading claims by companies (i.e.,“greenwashing”) (Boz et al., 2020). Improvements inplastics production must account for applications where itis advantageous to use biodegradable plastics (i.e., plasticscapable of breaking down under specific conditions, such
Joana C. Prata et al. The road to sustainable use and waste management of plastics in Portugal 11
as during composting) or the use of bio-based plastics (i.e.,produced from renewable resources, decoupled from theoil industry) (Patrício Silva, 2021). Portugal has a largepotential for the valorization of agroforestry residues(Gaspar et al., 2019) and marine resources (Prabha et al.,2020) through biorefineries, which could then be used inthe production of bio-based or biodegradable plastics(Patrício Silva, 2021). Therefore, Portugal could have animportant contribution to the production of more sustain-able plastics. In addition to bio-based polymers, next-generation polymers with high recyclability can providebenefits. For instance, polydiketoenamines (PDKs) arecostly to produce but are easily depolymerized in strongacids through chemical recycling at a low cost and highrecoveries (Vora et al., 2021).� Integrated Waste Management Systems (IWMS)
should be expanded to all municipalities, with a preferencefor recycling, followed by waste-to-energy or feedstockproduction in the form of incineration, gasification, orpyrolysis. These operations are known to generateenvironmental benefits and promote jobs and wealth inthe country. In France, recycling plastics can create 300 kjobs and avoid releasing 8 Mt of CO2 annually (EuropeanEnvironmental Agency, 2019). Only refuse from theseoperations should be landfilled. Landfilling of valuablewastes could be banned, as exemplified by Finland, wherelandfilling of plastics is banned, which will be extended toall recyclable wastes from 2025 onwards (EuropeanEnvironmental Agency, 2019). Products and byproductsof these operations can be used to benefit the economyfurther and contribute to national goals, such as theproduction of hydrogen from syngas in the light of theNational Plan of Hydrogen (Assembleia da Republica,2020) or value-added carbon nanotubes (Zhuo andLevendis, 2014). Considering that individualized plastictypes have a higher market value than mixed plastics (732vs 245 €/t; Pires et al., 2017), Portugal should improveplastic waste separation, such as by effectively implement-ing deposit-return systems. Having targets and contin-gency plans could help achieve these goals. For instance,deposit-return systems will be enforced in Switzerland ifpolyethylene terephthalate, aluminum, and glass recyclingfall below 75% (European Environmental Agency, 2019).Sorting and recycling losses (e.g., due to loss of materialqualities) vary with between 67%–93% (polystyrene andpolyethylene terephthalate, respectively) and should beconsidered when implementing mandatory inclusion ofrecycled materials in products, with refuse being prefer-entially used in other recovery operations (e.g., waste-to-energy) (Tallentire and Steubing, 2020). Environmentalimpacts and higher costs originate from waste collectionand separation. In Portugal, the cost of selective collectionis 117 €/t and of sorting is 72 €/t (da Cruz et al., 2012).Collection routes can be improved by optimizing thecollection frequency and using transportation based onrenewable energy (e.g., electric waste trucks). Lusagua,
responsible for waste collection in Caminha and Albufeiramunicipalities, recently implemented the “Resíduos Smart+” project, which intends to increase the efficiency ofwaste collection routes using real-time readings of theloading of waste containers using sensors (Lusagua, 2021).In Germany, improvements in the sorting or separationsystem based on technological advancements (e.g., auto-mated sorting of mixed plastics) has dramatically increasedtreatment capacity (Cimpan et al., 2015). Automated wastesorting techniques, such as based on imaging (e.g., Laser-Induced Breakdown Spectroscopy), could increase volumeand separation efficiency to comply with greater recyclinggoals, improving workers safety and productivity (Gundu-palli et al., 2017). Developments in all waste managementstages could increase benefits by reducing economic andenvironmental costs, inspiring increased incorporation ofwaste in the circular economy. These benefits could extendto other EU countries through the import and valorizationof their wastes.� The increase in TGR for non-recycled wastes from 11
€/t to 22 €/t is insufficient to motivate sustainable wastemanagement practices, as municipalities can shift costs toconsumers through water taxes. The lack of recycling ofwastes is detrimental because it does not generateeconomic and social benefits. The cost of 22 €/t forlandfilling plastic packaging poorly translates the 800 €/tof non-recycled waste to be paid to the EU, in addition tothe costs of the operation. Thus, the Portuguese govern-ment must find firmer strategies to enforce the preferentialrecycling of wastes. Strategies include reducing wasteproduction and successfully diverting residues from land-filling (e.g., by increasing recycling). For instance, overallreductions in MSW were observed in Portuguese munici-palities following pay-as-you-throw schemes. Pay-by-the-bag systems (i.e., by paying for mandatory official trashbags or stickers), curbside collection of organic waste,curbside collection of recyclables covering a wide range ofmaterials, and collection of mixed household waste everyother week, can reduce residual (mixed) household wasteto 150 kg/hab year as observed in the Flanders, Belgium(Gellynck et al., 2011). A survey in EU countries revealedthat consumers’ separation of recyclables is influenced byconvenience (e.g., accessible location of containers),awareness of environmental issues, and confidence thatwaste is effectively recycled (Minelgaitė and Liobikienė,2019). Many questions and misconceptions remain in thePortuguese public regarding the recycling process (e.g.,how to sort waste, if the waste is effectively recycled)despite the herculean effort of awareness campaigns. Oneof the most popular awareness campaigns involved ashocking television commercial featuring a chimpanzeeseparating wastes with the slogan “Gervasio [chimpanzee]has taken exactly 1 hour and 12 minutes to learn how toseparate packaging waste. And you, how much more timedo you need”? (Sociedade Ponto Verde, 2012). This adcampaign, aired in 2000, was the first promoted by the
12 Front. Environ. Sci. Eng. 2022, 16(1): 5
recently founded Portuguese Green Dot Society (aSIGRE), and the first contact of many Portuguese citizenswith the concept of separating packaging waste. Newshocking and effective awareness campaigns may berequired to clarify the need for the separation ofrecyclables. By producing high-quality materials throughthe household separation of recyclables, these can then beused more efficiently in recycling. Parameters influencingrecycling include: 1) high separation of recyclables,benefiting from combined collection systems (e.g., curb-side, drop-off); 2) implementation of Extended ProducerResponsibility (EPR), based on a sustainable financialscheme; 3) pay-as-you-throw schemes combined withcurbside collection including more than three wastestreams (i.e., to produce high-value recyclables) anddeposit-refund systems; 4) regulations such as landfill orincineration bans and non-recyclable product bans (e.g.,plastic bag bans); 5) implementation of ambitious goalsthrough Zero Waste strategies; and 6) community outreachand awareness campaigns (Xevgenos et al., 2015). In thecase of Portugal, much of the recycling of packaging wasteis supported by public money (Ferreira et al., 2017), whichcould benefit from an increasing EPR of packagingmanufacturers. Additionally, the review found that landfilltaxes generally have a weak effect on adopting sustainablewaste management options and reducing waste production(Xevgenos et al., 2015). Therefore, Portugal must imple-ment other strategies beyond a simple increase of TGR,such as stricter regulation over what types of waste can belandfilled (e.g., only residual waste from recycling or otherrecovery operations).� Portugal needs to reduce beach litter by 94% (from
330 to 20 items/100 m) to comply with EU objectives, ofwhich 88% is plastics. As a touristic country, Portugal isprone to be affected by high densities of beach litter,leading to economic losses. In Brazilian beaches, 85% ofbeach users would avoid the beach if littered by>15 items/m, which could originate loss in tourism income by 31% orUS$ 8.5 million per year (Krelling et al., 2017). Asampling of five Portuguese beaches in 2010 revealedaverage densities of 185 plastic items/m (Martins andSobral, 2011). Therefore, urgent measures must beimplemented to reduce the amount of litter present onPortuguese beaches. An extensive literature review on theeffectiveness of measures to reduce marine litter include:1) taxes and charges such as those applied to plastic bags,which can be expanded to fishing equipment and plasticfood containers at a low implementation cost; 2) pay-as-you-throw systems for MSW to support waste reduction,as well as tourism taxes to support waste managementfurther; 3) deposit-and-refund schemes which achieve highreturn rates, at a higher implementation cost; and 4)rewarding the fishing industry to return waste to shore(Oosterhuis et al., 2014). In Australia, councils thatinvested in coastal waste management presented fewerlittered items on their coastline (Willis et al., 2018).
Remediation strategies should be coupled with preventivemeasures. Beach cleaning could help maintain cleanerbeaches but can have ecological impacts if based onmechanical methods and have high costs (Zielinski et al.,2019). During the bathing season in Azores, Portugal, thecost of beach cleaning varied between 11–51 k € for eachlocal authority (Rodríguez et al., 2020). Beach cleaningshould be conducted even outside the bathing season toavoid the fragmentation and further dispersion of litter,with a frequency adapted to local necessities. For instance,a higher number of plastic items was found during the wetseason on a beach in Aveiro, Portugal, suggesting thatstorm events could cause backwashing and accumulationon shore (Prata et al., 2020b). Many of the actions neededto reduce marine litter on the Portuguese coast are alreadybeing implemented by campaigns focused on awareness,beach cleaning, and even encouraging the collection oflitter by fishermen (e.g., “A Pesca por umMar Sem Lixo”).These actions, primarily based on volunteer work, could besupported by municipalities and the government, reducingthe costs of increasing the frequency of beach cleaning.Similarly, street cleaning services could provide aremediation strategy upstream.
7 Conclusions
With waste management based on open dumps, Portugalrevolutionized its waste management system in the 1990sand early 2000s under the guidance and support of theEuropean Union, investing in controlled landfills andincinerators (Magrinho et al., 2006). The evolution of thewaste management system in Portugal is remarkabledespite being behind in many areas compared to otherEU countries. The 2020s require a similarly challengingrevolution in waste management, focusing on reducingconsumption and consequently waste production, followedby multiple recovery alternatives (e.g., recycling, waste-to-energy, feedstock production), and only landfilling ofrefuse. Plastic waste is at the core of this revolution due toits ubiquity in modern life and environmental persistence.Portugal is currently at the crossroads between resisting orembracing the circular economy. As widely presented inprevious sections, sustainable waste management (includ-ing plastic waste) produces multiple economic, societal,and environmental benefits. Portugal could be at the frontand benefit the most from this revolution by leveragingsustainability concerns of its inhabitants (e.g., supportingmarket measures), its natural resources (e.g., throughbiorefineries), its role as a net waste importer (e.g., byproducing value-added products), and the economic boostproduced by sustainable waste management strategies(e.g., revenue from plastic recycling).
CREDIT: Joana C. Prata: Conceptualization, Project administration,Visualization, Writing- original draft, Writing- review and editing. Ana Luisa
Joana C. Prata et al. The road to sustainable use and waste management of plastics in Portugal 13
Silva: Writing- original draft, Writing- review and editing. Armando C.Duarte: Supervision, Project administration, Funding acquisition, Writing-review and editing. Teresa Rocha-Santos: Conceptualization, Supervision,Project administration, Funding acquisition, Writing- review and editing.
Acknowledgements Thanks are due to FCT/MCTES for the financialsupport (UIDP/50017/2020+ UIDB/50017/2020), through national funds.This work was also funded by the Portuguese Science Foundation (FCT)through the scholarship PD/BD/135581/2018 and the research contractCEECIND/01366/2018 under POCH funds, co-financed by the EuropeanSocial Fund and Portuguese National Funds from MEC. Thanks are due toAna Luísa Martino Costa for proofreading the article.
Electronic Supplementary Material Supplementary material is availablein the online version of this article at https://doi.org/10.1007/s11783-021-1439-x and is accessible for authorized users.
References
Agencia Portuguesa do Ambiente (2019a). Transfrontier Movement of
Wastes: Reports. Lisbon: Agencia Portuguesa do Ambiente
Agencia Portuguesa do Ambiente (2019b). Urban Waste Management:
Production. Lisbon: Agencia Portuguesa do Ambiente
Agencia Portuguesa do Ambiente (2020). Packaging and Packaging
Waste. Lisbon: Agencia Portuguesa do Ambiente
Agencia Portuguesa do Ambiente (2021a). Value of TGR. Lisbon:
Agencia Portuguesa do Ambiente
Agencia Portuguesa do Ambiente (2021b). Beach Litter Monitoring
Program. Lisbon: Agencia Portuguesa do Ambiente
Andrady A L (2017). The plastic in microplastics: A review. Marine
Pollution Bulletin, 119(1): 12–22
Andrady A L, Neal M A (2009). Applications and societal benefits of
plastics. Philosophical Transactions of the Royal Society of London.
Series B, Biological Sciences, 364(1526): 1977–1984
Assembleia da Republica (2014). Law n. 82-D/2014. Lisbon: Assem-
bleia da Republica
Assembleia da Republica (2017). Decree-Law n. 152-D/2017. Lisbon:
Assembleia da Republica
Assembleia da Republica (2018). Lei n. 69/2018. Lisbon: Assembleia da
Republica
Assembleia da Republica (2019a). Law n. 76/2019. Lisbon: Assembleia
da Republica
Assembleia da Republica (2019b). Law n. 77/2019. Lisbon: Assembleia
da Republica
Assembleia da Republica (2019c). Law n. 88/2019. Lisbon: Assembleia
da Republica
Assembleia da Republica (2020). Minister Coucil Resolution n. 63/
2020. Lisbon: Assembleia da Republica
Assembleia da Republica (2021a). Decree-Law n. 22-A/2021. Lisbon:
Assembleia da Republica
Assembleia da Republica (2021b). Proposed Law n. 61/XIV/2- State
Budget for 2021. Lisbon: Assembleia da Republica
Associação da Hotelaria, Restauração e Similares de Portugal (2019).
Less Plastic, More Environment. Lisbon: Associação da Hotelaria,
Restauração e Similares de Portugal
Baytekin B, Baytekin H T, Grzybowski B A (2013). Retrieving and
converting energy from polymers: deployable technologies and
emerging concepts. Energy & Environmental Science, 6(12): 3467–
3482
Boz Z, Korhonen V, Koelsch Sand C (2020). Consumer considerations
for the implementation of sustainable packaging: A review.
Sustainability, 12(6): 2192
Chang M (2015). Reducing microplastics from facial exfoliating
cleansers in wastewater through treatment versus consumer product
decisions. Marine Pollution Bulletin, 101(1): 330–333
Cimpan C, Maul A, Jansen M, Pretz T, Wenzel H (2015). Central sorting
and recovery of MSW recyclable materials: A review of technolo-
gical state-of-the-art, cases, practice and implications for materials
recycling. Journal of Environmental Management, 156: 181–199
Comtrade U N (2021). UN Comtrade Database. New York: UN
Comtrade
Consumers International (2021). “Can I Recycle This?” A Global
Mapping and Assessment of Standards, Labels and Claims on Plastic
Packaging. London: Consumers International
Continente (2021). What Continente did in 2020? Lisbon: Continente
da Cruz N F, Simões P, Marques R C (2012). Economic cost recovery in
the recycling of packaging waste: the case of Portugal. Journal of
Cleaner Production, 37: 8–18
Eriksen M, Thiel M, Prindiville M, Kiessling T (2018). Microplastics:
What are the Solutions? In: Wagner M, Lambert S, ed. Freshwater
Microplastics. Cham: Springer, 273–298
Euroactiv (2020). Portugal Suspends Foreign Trash Imports to Cope
With Own Waste Surge. Brussels: Euractiv
European Chemical Agency (2018). Plastic Additives Initiative.
Helsinki: European Chemical Agency
European Commission (2015). Packaging Waste. Brussels: European
Commission
European Commission (2018). Waste Framework Directive. Brussels:
European Commission
European Commission (2020a). A European Threshold Value and
Assessment Method for Macro Litter on Coastlines. Brussels:
European Commission
European Commission (2020b). Council Decision (EU, Euratom) 2020/
2053 of 14 December 2020 on the System of Own Resources of the
European Union and Repealing Decision 2014/335/EU. Brussels:
European Commission
European Commission (2020c). The Marine Strategy Framework
Directive. Brussels: European Commission
European Commission (2021). Plastic Waste Shipments. Brussels:
European Commission
European Environmental Agency (2019). Resource Efficiency and the
Circular Economy in Europe 2019–Even More From Less.
København: European Environmental Agency
European Parliament (1994). Directive 94/62/EC of 20 December 1994
on Packaging and Packaging Waste. Brussels: European Parliament
European Parliament (2006). Regulation (EC) No 1013/2006 of the
European Parliament and of the Council of 14 June 2006 on
Shipments of Waste Brussels, European Commission. Brussels:
European Parliament
European Parliament (2015). Directive (EU) 2015/720 of The European
Parliament of the Council of 29 April 2015 amending Directive 94/
62/EC as Regards Reducing the Consumption of Lightweight Plastic
Carrier Bags. Brussels: European Parliament
14 Front. Environ. Sci. Eng. 2022, 16(1): 5
European Parliament (2019). Directive (EU) 2019/904 of the European
Parliament and of the Council of 5 June 2019 on the reduction of the
impact of certain plastic products on the environment. Brussels:
European Parliament
Eurostat (2021a). European Statistics Database: Waste Generation and
Waste Treatment. Luxembourg: Eurostat
Eurostat (2021b). Eurostat Database: GNI. Luxembourg: Eurostat
EY (2020). Belgium implements EU plastics tax measures. Machelen:
EY
Fernández-Braña Á, Feijoo-Costa G, Dias-Ferreira C (2019). Looking
beyond the banning of lightweight bags: analysing the role of plastic
(and fuel) impacts in waste collection at a Portuguese city.
Environmental Science and Pollution Research International,
26(35): 35629–35647
Ferrão P, Ribeiro P, Rodrigues J, Marques A, Preto M, Amaral M,
Domingos T, Lopes A, Costa I (2014). Environmental, economic and
social costs and benefits of a packaging waste management system: A
Portuguese case study. Resources, Conservation and Recycling, 85:
67–78
Ferreira S, Cabral M, da Cruz N F, Marques R C (2014). Economic and
environmental impacts of the recycling system in Portugal. Journal of
Cleaner Production, 79: 219–230
Ferreira S, Cabral M, da Cruz N F, Simões P, Marques R C (2017). The
costs and benefits of packaging waste management systems in
Europe: the perspective of local authorities. Journal of Environmental
Planning and Management, 60(5): 773–791
Finisterra do Paço A M, Raposo M L B (2010). Green consumer market
segmentation: empirical findings from Portugal. International Journal
of Consumer Studies, 34(4): 429–436
Gaspar M C, Mendes C V T, Pinela S R, Moreira R, Carvalho M G V S,
Quina M J, Braga M E M, Portugal T (2019). Assessment of
agroforestry residues: their potential within the biorefinery context.
ACS Sustainable Chemistry & Engineering, 7(20): 17154–17165
Gellynck X, Jacobsen R, Verhelst P (2011). Identifying the key factors in
increasing recycling and reducing residual household waste: a case
study of the Flemish region of Belgium. Journal of Environmental
Management, 92(10): 2683–2690
Gundupalli S P, Hait S, Thakur A (2017). A review on automated sorting
of source-separated municipal solid waste for recycling. Waste
Management (New York, N.Y.), 60: 56–74
Herva M, Neto B, Roca E (2014). Environmental assessment of the
integrated municipal solid waste management system in Porto
(Portugal). Journal of Cleaner Production, 70: 183–193
Instituto Nacional de Estatistica (2018). Demographic Statistics 2017.
Lisbon: Instituto Nacional de Estatistica
Jambeck J R, Geyer R, Wilcox C, Siegler T R, Perryman M, Andrady A,
Narayan R, Law K L (2015). Plastic waste inputs from land into the
ocean. Science, 347(6223): 768–771
Jornal de Noticias (2021). Brands Advance on Mandatory Reduction of
Plastics. Lisbon: Jornal de Noticias
Kasidoni M, Moustakas K, Malamis D (2015). The existing situation and
challenges regarding the use of plastic carrier bags in Europe. Waste
Management & Research, 33(5): 419–428
Krelling A P, Williams A T, Turra A (2017). Differences in perception
and reaction of tourist groups to beach marine debris that can
influence a loss of tourism revenue in coastal areas. Marine Policy,
85: 87–99
Litterati (2021). Litterati Open Data. Madrid: Litterati
Lopez G, Artetxe M, Amutio M, Alvarez J, Bilbao J, Olazar M
(2018). Recent advances in the gasification of waste plastics. A
critical overview. Renewable & Sustainable Energy Reviews,
82: 576–596
Luís S, Roseta-Palma C, Matos M, Lima M L, Sousa C (2020).
Psychosocial and economic impacts of a charge in lightweight plastic
carrier bags in Portugal: Keep calm and carry on? Resources,
Conservation and Recycling, 161: 104962
Lusagua (2021). SMART+ Waste is the New Sustainable Project of
Lusagua. Lisbon: Lusagua
Magrinho A, Didelet F, Semiao V (2006). Municipal solid waste
disposal in Portugal. Waste Management (New York, N.Y.), 26(12):
1477–1489
Marques R C, da Cruz N F, Carvalho P (2012). Assessing and exploring
(in)efficiency in Portuguese recycling systems using non-parametric
methods. Resources, Conservation and Recycling, 67: 34–43
Martinez G, Costas S, Ferreira Ó (2020). The role of culture for coastal
disaster risk reduction measures: Empirical evidence from northern
and southern Europe. Advances in Climate Change Research, 11(4):
297–309
Martins J, Sobral P (2011). Plastic marine debris on the Portuguese
coastline: a matter of size? Marine Pollution Bulletin, 62(12): 2649–
2653
Minelgaitė A, Liobikienė G (2019). The problem of not waste sorting
behaviour, comparison of waste sorters and non-sorters in European
Union: Cross-cultural analysis. Science of the Total Environment,
672: 174–182
Oosterhuis F, Papyrakis E, Boteler B (2014). Economic instruments and
marine litter control. Ocean and Coastal Management, 102: 47–54
OSPAR (2007). Monitoring of marine litter in the OSPAR region.
London, UK: OSPAR
Pacto Portugues para os Plasticos (2021). Portuguese Pact for Plastics.
Lisbon: Pacto Portugues para os Plasticos
Patrício Silva A L (2021). Future-proofing plastic waste management for
a circular Bio-economy. Current Opinion in Environmental Science
& Health, 22: 100263
Plastics Europe (2019). Plastics- the Facts 2019. Brussels: Plastics
Europe
Pires A, Sargedas J, Miguel M, Pina J, Martinho G (2017). A case study
of packaging waste collection systems in Portugal- Part II:
Environmental and economic analysis. Waste Management (New
York, N.Y.), 61: 108–116
Prabha S P, Nagappan S, Rathna R, Viveka R, Nakkeeran E (2020). Blue
biotechnology: a vision for future marine biorefineries. In: Kumar R
P, Dnansounou E, Raman J K, Baskar G, eds. Refining Biomass
Residues for Sustainable Energy and Bioproducts. London, UK:
Elsevier, 463–480
Prata J C, da Costa J P, Lopes I, Andrady A L, Duarte A C, Rocha-Santos
T (2021). A One Health perspective of the impacts of microplastics
on animal, human and environmental health. Science of the Total
Environment, 777: 146094
Prata J C, da Costa J P, Lopes I, Duarte A C, Rocha-Santos T (2020a).
Environmental status of (micro)plastics contamination in Portugal.
Ecotoxicology and Environmental Safety, 200: 110753
Joana C. Prata et al. The road to sustainable use and waste management of plastics in Portugal 15
Prata J C, Reis V, Paço A, Martins P, Cruz A, da Costa J P, Duarte A C,
Rocha-Santos T (2020b). Effects of spatial and seasonal factors on
the characteristics and carbonyl index of (micro)plastics in a sandy
beach in Aveiro, Portugal. Science of the Total Environment, 709:
135892
Prata J C, Silva A L P, da Costa J P, Mouneyrac C, Walker T R, Duarte A
C, Rocha-Santos T (2019). Solutions and Integrated Strategies for the
Control and Mitigation of Plastic and Microplastic Pollution.
International Journal of Environmental Research and Public Health,
16(13): 2411
Quaghebeur M, Laenen B, Geysen D, Nielsen P, Pontikes Y, Van
Gerven T, Spooren J (2013). Characterization of landfilled materials:
screening of the enhanced landfill mining potential. Journal of
Cleaner Production, 55: 72–83
Ramos A, Afonso Teixeira C, Rouboa A (2018). Environmental analysis
of waste-to-energy—a Portuguese case study. Energies, 11(3): 548
Rochman C M, Browne M A, Halpern B S, Hentschel B T, Hoh E,
Karapanagioti H K, Rios-Mendoza LM, Takada H, Teh S, Thompson
R C (2013). Policy: Classify plastic waste as hazardous. Nature,
494(7436): 169–171
Rodríguez Y, Ressurreição A, Pham C K (2020). Socio-economic
impacts of marine litter for remote oceanic islands: The case of the
Azores. Marine Pollution Bulletin, 160: 111631
Sharuddin S D A, Abnisa F, Wan Daud W M A, Aroua M K (2016). A
review on pyrolysis of plastic wastes. Energy Conversion and
Management, 115: 308–326
Sociedade Ponto Verde (2012). Commercials which changed minds.
Lisbon: Sociedade Ponto Verde
Sociedade Ponto Verde (2019). Relatório de Atividades da Sociedade
Ponto Verde 2019 [Green Dot Society Report 2019]. Lisbon:
Sociedade Ponto Verde
Statistica (2019). Top-15 countries of the European Union for imports of
plastic waste from other EU members in 2018. Hamburg: Statistica
Tallentire C W, Steubing B (2020). The environmental benefits of
improving packaging waste collection in Europe. Waste Management
(New York, N.Y.), 103: 426–436
Villarrubia-Gómez P, Cornell S E, Fabres J (2018). Marine plastic
pollution as a planetary boundary threat: The drifting piece in the
sustainability puzzle. Marine Policy, 96: 213–220
Vora N, Christensen P R, Demarteau J, Baral N R, Keasling J D, Helms
B A, Scown C D (2021). Leveling the cost and carbon footprint of
circular polymers that are chemically recycled to monomer. Science
Advances, 7(15): eabf0187
Willis K, Maureaud C, Wilcox C, Hardesty B D (2018). How successful
are waste abatement campaigns and government policies at reducing
plastic waste into the marine environment? Marine Policy, 96: 243–
249
Xanthos D, Walker T R (2017). International policies to reduce plastic
marine pollution from single-use plastics (plastic bags and microbe-
ads): A review. Marine Pollution Bulletin, 118(1–2): 17–26
Xevgenos D, Papadaskalopoulou C, Panaretou V, Moustakas K,
Malamis D (2015). Success stories for recycling of MSW at
municipal level: A review. Waste and Biomass Valorization, 6(5):
657–684
Zhuo C, Levendis Y A (2014). Upcycling waste plastics into carbon
nanomaterials: A review. Journal of Applied Polymer Science, 131:
39931–39931
Zielinski S, Botero C M, Yanes A (2019). To clean or not to clean? A
critical review of beach cleaning methods and impacts. Marine
Pollution Bulletin, 139: 390–401
16 Front. Environ. Sci. Eng. 2022, 16(1): 5
Copyright © 2022 FDOKUMEN