Rise and Fall of the Ultra Vires Doctrine in United States ...

Working Papers in Economic History
UNIVERSIDAD CARLOS III DE MADRID c/ Madrid 126 28903 Getafe (Spain) Tel: (34) 91 624 96 37Site: http://www.uc3m.es/uc3m/dpto/HISEC/working_papers/working_papers_general.html
DEPARTAMENTO DEHISTORIA ECONÓMICAE INSTITUCIONES
April 2011 WP 11-02
The Rise and Fall of Spain (1270-1850)Carlos Álvarez-Nogal and Leandro Prados de la Escosura
AbstractTwo distinctive regimes are distinguished in Spain over half-a-millennium. Afirst one (1270s-1590s) corresponds to a high land-labour ratio frontiereconomy, pastoral, trade-oriented, and led by towns. Wages and foodconsumption were relatively high. Sustained per capita growth occurred fromthe Reconquest’s end (1264) to the Black Death (1340s) and resumed fromthe 1390s only broken by late-15th century turmoil. A second regime (1600s-1810s) corresponds to a more agricultural and densely populated low-wageeconomy which grew along a lower path. Contrary to preindustrial WesternEurope, Spain achieved her highest living standards in the 1340s, not by mid-15th century. Although its population toll was lower, the Plague had a moredamaging impact on Spain and, far from releasing non-existent demographicpressure, destroyed the equilibrium between scarce population and abundantresources. Pre-1350 per capita income was reached by the late 16th centurybut only overcome after 1820.
Keywords: Preindustrial Spain, Frontier economy, Reconquest, Black Death,Rise, Decline, Western EuropeJEL Classification: E01, N13, O47
Carlos Álvarez-Nogal: Departamento de Historia Económica e Instituciones, and Researcherat Instituto Figuerola, Universidad Carlos III, Calle Madrid, 126, 28903 Getafe, Spain.E-mail: [email protected]://www.uc3m.es/portal/page/portal/instituto_figuerola/directorio/calvarez
Leandro Prados de la Escosura: Professor of Economic History, Departamento de HistoriaEconómica e Instituciones, and Researcher at Instituto Figuerola, Universidad Carlos III, CalleMadrid, 126, 28903 Getafe, Spain, and CEPR Research Associate.E-mail: [email protected]://www.uc3m.es/portal/page/portal/dpto_historia_economica_inst/profesorado/leandro_prados_escosura

The Rise and Fall of Spain (1270-1850)
Carlos Álvarez-Nogal and Leandro Prados de la Escosura
(Universidad Carlos III)

2
The Rise and Fall of Spain (1270-1850)1
Carlos Álvarez-Nogal and Leandro Prados de la Escosura(Universidad Carlos III)
AbstractTwo distinctive regimes are distinguished in Spain over half-a-millennium. A
first one (1270s-1590s) corresponds to a high land-labour ratio frontier economy,pastoral, trade-oriented, and led by towns. Wages and food consumption wererelatively high. Sustained per capita growth occurred from the Reconquest’s end(1264) to the Black Death (1340s) and resumed from the 1390s only broken by late-15th century turmoil. A second regime (1600s-1810s) corresponds to a moreagricultural and densely populated low-wage economy which grew along a lower path.Contrary to preindustrial Western Europe, Spain achieved her highest living standardsin the 1340s, not by mid-15th century. Although its population toll was lower, thePlague had a more damaging impact on Spain and, far from releasing non-existentdemographic pressure, destroyed the equilibrium between scarce population andabundant resources. Pre-1350 per capita income was reached by the late 16th centurybut only overcome after 1820.
Keywords: Preindustrial Spain, Frontier economy, Reconquest, Black Death, Rise,Decline, Western Europe
JEL Classification: E01, N13, O47
Carlos Álvarez-Nogal Leandro Prados de la EscosuraUniversidad Carlos III Universidad Carlos IIIDepartamento de Historia Económica Departamento de Historia Económicaand Instituto Figuerola and Instituto FiguerolaEdificio Foronda, Despacho 7.0.07 Edificio Foronda, Despacho 7.0.14Calle Madrid, 126 Calle Madrid, 12628903 Getafe (Madrid), Spain 28903 Getafe (Madrid), SpainTel. +34 916249621 Tel. +34 916249623
[email protected] [email protected]
1 We thank Steve Broadberry, Bruce Campbell, Hilario Casado Alonso, Greg Clark, Ulrich Pfister,Regina Grafe, Paolo Malanima, Joan Rosés, Jan de Vries, and participants at the HI-PODconference, Venice (April 2009), the 15th World Economic History Congress, Utrecht (August2009), the Economic History Society Annual Conference, University of Durham (March 2010),and the Conference on Quantifying Long Run Economic Development, Venice (March 2011) fortheir comments and suggestions. Maarten Bosker, Steve Broadberry, Joan Rosés, Bas vanLeeuwen, and Jan Luiten van Zanden kindly shared their unpublished data and José AntonioMateos Royo provided invaluable references. Financial support from the HI-POD CollaborativeProject (European Commission's Framework Programme for Research FP7 Grant agreementno. 225343), and the Spanish Ministry of Education and Sciences “Consolidating Economics”),is gratefully acknowledged.
3
The Rise and Fall of Spain (1270-1850)
When and why did Spain fall behind continues being debated since Earl
Hamilton’s (1938) seminal contribution and attempts have been made at quantifying
Spain’s relative position over time (Yun-Casalilla 1994, Carreras 2003, van Zanden
2005a, 2005b, Maddison 2006). It has been recently suggested that Spain had attained
affluence prior to her American expansion that increased throughout the 16th century
so by 1590 she was among the top countries in Europe in per capita income terms
(Álvarez-Nogal and Prados de la Escosura 2007). This finding raises the crucial question
of when, and why, did Spain achieve such an early prosperity.
This paper provides a tentative answer by examining Spain’s comparative
performance over the half-a-millennium between the end of the Reconquest (1264)
and the beginning of modern economic growth by mid-19th century. We proceed,
firstly, by estimating trends in output. Specifically, movements in agricultural output
are drawn using an indirect demand approach (Section II), while those in industry and
services are proxied through changes in urban population not living on agriculture
(section III). Thus, trends in per capita output over1280-1850 are obtained (section
IV).2 A re-examination of Spain’ relative position within Western Europe closes the
paper.
From our quantitative exercise we conclude that two distinctive regimes appear
to exist in preindustrial Spain. A first one (1270s-1590s) corresponds to a high land-
labour ratio frontier economy, largely pastoral, trade-oriented, and led by towns.
Wage and food consumption levels were relatively high. Sustained per capita growth
took place from the 1270s, after the de facto end of the Reconquest (Figure 1), until
the 1340s, when the Black Death (1348) and the Spanish phase of the Hundred Years
War (1365-89) interrupted it.3 Growth resumed, then, only broken by late-15th century
political turmoil. A second regime (1600s-1810s) corresponds to a more agricultural
and densely populated, low wage economy with growth occurring along a lower path.
2In addition to a longer time coverage, the national and continuous series approach represents a major
difference with Álvarez-Nogal and Prados de la Escosura (2007) regional output estimates at benchmarkyears over 1530-1850, from which national output figures were obtained through aggregation. Lack ofdata precludes so far a regional approach for the wider time span considered here.3
The Reconquest ended definitively with the fall of the Nasrid kingdom of Granada in 1492 butChristian-Muslim boundaries remain stable since 1264.
4
Thus, Spanish relative affluence by 1492 can be tracked down to the pre-Black
Death era. Contrary to most of Western Europe and the Eastern Mediterranean, where
the highest standards of living of the pre-industrial era were achieved after recovering
from the plague by the mid-15th century, in Spain, the peak level of output per head
was reached in the 1340s. In pre-Plague Spain, Malthusian forces were mostly absent
except, if any, for few areas along the Mediterranean coast. Sustained progress took
place after the Reconquest in the context of a frontier economy, urban expansion, and
openness to trade. Although its population toll was lower, the plague had a much
more damaging impact in Spain than in Western Europe since, far from releasing non-
existent demographic pressure on land, it destroyed the equilibrium between scarce
population and abundant resources. Pre-Black Death per capita income levels were
temporarily recovered by the late 16th century and only overcome after 1820.
Thus, the fall in output per head in the late 14th century and, again, in the early
17th century represent two major steps in Spain’s (absolute and relative) decline.
Later, in the early 19th century, although demographic expansion was paralleled by an
increase in GDP per head, paradoxically the relative decline of Spain deepened.
Output in agriculture: an indirect approach
Agricultural output for Spain as a whole has been estimated indirectly. Given
the lack of hard empirical evidence for medieval and early modern Europe, alternative
ways of deriving output trends have been put forward.4 Wrigley’s (1985) proposal
assumes that, in the long run, food consumption per head is roughly constant. This
way output in agriculture evolves as total population adjusted for the agricultural trade
balance.5 The rationale for Wrigley’s approach is that in a traditional economy workers
try to keep their food consumption per head stable (Lewis 1955). Recent research on
developing countries reveals that consumption per head of food staples remains
constant in aggregate terms even as per capita income rises (Bouis 1994). In the
absence of empirical evidence Wrigley’s approach provides useful explicit quantitative
conjectures. Wrigley’s hasty procedure has, nonetheless, some shortcomings. For
4An alternative indirect estimate on the basis of tithes is currently under construction.
5Such method has been used for late nineteenth and early twentieth century Japan (Nakamura 1965),
eighteenth century Britain (Deane and Cole 1967, Overton 1996), nineteenth century Spain (Simpson1989, 1995) and, more recently, medieval Italy (Federico and Malanima 2004).
5
example, the assumption of constant per capita food consumption can be criticised on
the grounds that the values of price and income elasticities of demand for food in
developing countries are significantly different from zero (Kaneda 1968, Crafts 1976).
An alternative to estimating agricultural output indirectly is provided by the
demand function approach.6 A recent user of this procedure, Allen (2000), derived
agricultural output for a sample of pre-industrial European countries. He firstly
estimated agricultural consumption per head that, adjusted for net food imports,
allowed him to derive output per head and, then, with population, obtained absolute
output. In the demand approach, real consumption per head of agricultural goods (C)
can be expressed as,
C = a Pε Yμ Mγ [1]
in which P and M respectively denote agricultural, and non-agricultural prices
relative to the consumer price index (CPI), Y stands for real disposable income per
head; ε, μ, and γ are the values of own price, income and cross price elasticities,
respectively; and a represents a constant.7 Taking rates of variation (denoted as low
case), we get:
c = ε p + μ y + γ m [2]
Since information on income per head (Y) for preindustrial Europe is usually
lacking, Allen’s suggestion of real wage earnings (W) per worker as a second best
alternative provides a most convenient solution. The rationale for Allen’s (1999: 214)
claim is that as proprietors comprise a small share of population and only consume,
therefore, a small fraction of total food, workers’ returns provide a relevant measure
of disposable income. Hence, changes in real wage earnings (w) are suggested to proxy
changes in real income per head (y) in equation [2]. However, the extent to which
changes in real wages are representative of changes in workers’ real earnings remains
an unsettled issue. It is commonly accepted that wages were only a part of household
incomes, especially in rural areas (García Sanz 1981) but the degree to which variations
6Crafts (1976, 1980, 1985) was the pioneer in the use of the demand approach to derive agricultural
consumption and output. The method was later used by for eighteenth century Britain (Jackson 1985,Allen 1999) and nineteenth century Spain (Prados de la Escosura 1988, 1989) and has been recentlyemployed by Álvarez-Nogal and Prados de la Escosura (2007), Pfister (2011) and Malanima (2011).7
Allen (2000) arbitrarily assigned the value of 1 to a. It is worth noting that Wrigley’s proposalrepresents a particular case of a demand function for agricultural goods in which price and incomeelasticities are zero.

6
in household income are captured by those in real wage earnings is an unknown.8
Nonetheless, identifying labour compensation with disposable income ignores ‘the
contribution of property-income growth to the overall rise of national income’
(Hoffman et al. 2002) and implies the improbable assumption that the share of labour
in national income remains stable over time.9
To complicate the situation further the available evidence on wages in early
modern Europe usually refers to wage rates (w) while what is actually needed is real
wage earnings (W), that is, wage rates (w) times the number of days or hours (h)
worked per person-year.10 Changes in work intensity affect yearly wage earnings per
economically active person. In the early modern age, workers (and their families) were
prepared to increase their work load either because of the higher opportunity cost of
leisure resulting from wider consumption choices (de Vries 1994, Voth 1998, Allen
2004), or to offset the decline in wages rates (van Zanden 1999, Malanima 2007). In
fact, a more intense use of land appears to go along declining wage rates, implying a
more intense use of labour (Boserup 1987, Malanima 2007, De Vries 2008). The
corollary is that long-run changes in real wage rates do not necessarily capture those in
real returns to wage labour.11
Given the dearth of direct estimates with contemporary data, the choice of
values for price and income elasticities to be used in the calibration of the demand for
agricultural goods presents another challenge. Studies on developing countries, not
too dissimilar in income per head from most countries in the early modern Europe
(Maddison 2006), cast values of 0.7/0.8 for the expenditure elasticity for food (and
8The fact that, in times of hardship, authorities usually tried to regulate and control nominal wages
suggests that the representativeness of wage labour is higher than commonly accepted (Bois 2000, SanzFuentes 1987, Vaca 2001).9
Moreover, if real wages are used as a proxy for real per capita GDP, deflators matter too. In the case ofnominal wages, a consumer price index is usually employed to obtain real wages, while to derive realaggregate output the GDP implicit deflator, which reflects the prices of both consumption andinvestment goods, is used. As these two price indices do not necessarily evolve alike, another potentialbias may be introduced in agricultural output estimates derived with real wages as a proxy for realdisposable income per head.10
This procedure implies that using expression (2) with the variation in wage rates as a proxy for thosein real disposable income per head provides a measure of changes in daily or weekly per capitaconsumption, so the challenge is to ascertain the extent to which working time, and, hence, yearlyconsumption per head varies in the long run.11
The improvement of housing, the acquisition of durable goods and the increasing consumption ofexotic goods has been pointed as evidence of material progress just at the time real wage rates weredeclining (Reis 2005: 199).

7
own price elasticity values of -0.5/-0.6) (Lluch et al. 1977).12 However, it has been
claimed that cross-section estimates of income elasticity tend to be upwards biased as
food transfers from high to low income groups are inaccurately recorded in food
expenditure surveys (Bouis 1994). A similar conclusion is reached for Britain during the
Industrial Revolution by Clark, Huberman and Lindert (1995) who argue that budget
studies fail to include high income consumers who, by Engel’ law, have lower income
elasticities of food demand.
A relevant caveat is that, as an economy grows, the value added of food
relative to its inputs (agricultural staple goods) increases by including services rising, in
turn, the income elasticity of demand for food.13 Thus, adopting income elasticities of
food demand for present-day developing countries in order to calibrate the demand of
agricultural staples in the past may over-exaggerate the true value of their income
elasticities.14 Interestingly, Kaneda (1968) found income elasticity values of 0.3/0.4 for
agricultural products in Japan over 1878-1940, certainly low but not implausible values
for developing countries.15 Time series estimates of income elasticity of demand for
Spain over 1850-1913 cast significantly different values for food (0.9) and for
agricultural goods (0.4) and tend to confirm our hypothesis. If, in turn, real wage rates
rather than per capita GDP are used, the income elasticity for agricultural goods falls to
0.3.16
For pre-1800 Europe Allen (2000) cautiously assumed values of 0.5 and -0.6 for
income and own price elasticities and used the Slutsky-Schultz relation to derive the
cross price elasticity of demand, while Federico and Malanima (2004) adopted values
12Moreover, direct cross-section estimates for late 1950s Spain still show high absolute values for
income (and own price) elasticity of food demand (0.9, and -0.7, respectively) (Lluch 1969).13
The income elasticity of demand for these services is higher than that for staple food products. Clarket al (1995: 234-235) point out, “the value of food and beverage consumption rises relatively to thefoodstuff supplies over the course of development”, while Kaneda (1968) uses a similar argument to theone employed here to explaining why income elasticity of food demand was higher in the 1950s than inthe previous decades.14
This does not necessarily mean that the services content of food in early modern Europe was lowerthan in today’s developing countries. Probably the difference, then and now, lies between countrysideand town, with lower services content of food in rural areas.15
Cross-section estimates of income elasticities for aggregate food staples from household surveys areoften in the 0.3/0.6 range (Bouis 1994).16
Estimates computed from data in Prados de la Escosura (2003).
8
of 0.4 and -0.5, respectively, for early modern Italy.17 Our preference for low absolute
values of income (μ = 0.3) and own price (ε = -0.4) elasticities in the Spanish case is
motivated by the fact that we are addressing the demand for agricultural staple goods,
not for food itself that incorporates higher income-elastic services. Moreover, low
values of income elasticity somehow capture the impact on the demand for food
staples resulting from variations in working time as a response to changes in real wage
rates. In other words, we are explicitly assuming that the daily wage elasticity of
demand for foodstuffs is lower than the income elasticity of the demand for food.
Let’s look now at the evidence available for our case. Real wage rates
experienced a rise between the late 13th and mid-14th century, followed by a sharp
decline until the end of this century and, then, a recovery in the early 15th century,
when the highest real wage rates of half a millennium were reached. A long-term
decline took place from mid-15th to mid-17th century followed up by a flat long-run
trend to the early 19th century. However, it was not until mid-16th century when real
wage rates fell below pre-Plague levels (Figure 2).
Yet it is unclear that wage rates capture trends in wage earnings, as incentives
to work harder increased over time. In the 18th century, for example, as population
grew and trade expanded, relative prices changed, and a more intense use of land took
place with a shift from extensive livestock rearing (sheep) to crops (cereals, vineyards,
olives) and also to cash crops (fruit trees, etc) along the Mediterranean coast (Anes
1970).18 Rising demand from an expanding population contributed to the increase in
food prices that led, in turn, to a sustained fall in real wage rates as nominal wages
were much more stable. Given the low number of days worked per economically active
population, particularly in agriculture, the supply of labour was presumably rather
elastic, and workers could make for the fall in daily real wages by increasing the
amount of days allocated to work over the year. For example, in the Kingdom of Castile
c. 1750 the Cadastre de Ensenada assigned 120 days of work per year to day-labourers
(rural and non-rural), 180 to artisans, and 250 to servants (Ringrose 1983) which
17The Slutsky-Schultz relation states that for the individual demand of any commodity, the income
elasticity, with a negative sign, is the sum of own price and cross price elasticities, so it allows one toderive the value of the cross price elasticity of demand from the assumed values for own price andincome elasticities.18
In Catalonia, the increase in trade stimulated the use of marginal, unexploited lands for vineyards andolive trees as a growing demand covered the cost of opening up new lands (Vilar 1962).

9
weighted by each sector’s share in economically active population (EAP) cast an
average of 168 days per EAP/year.19 This figure is almost identical to the one derived
by Malanima (2011) for Italy (165 days on average over 1700-1750) and significantly
lower than those suggested by Allen (2001) for early modern Europe (250 days), or by
Bairoch (1965, 1989) for the nineteenth century (196 days). Scattered evidence for the
construction industry suggests an increase in the number of days worked from the 17th
to the 18th century.20
However, there is probably some asymmetry in the suggested inverse
association between real wage rates and working time. For example, at times of high
wages it seems unclear that an increase in real wage rates would lead to a reduction in
days of work per active person. This would be a most plausible scenario for Middle Age
Spain, a frontier economy with presumably a low number of working days per EAP.
The early nineteenth century provides a new scenario in which real wage rates
went along an intensification of work as a result of wider access to property, following
liberal reforms, in particular, the desamortización –the disentailment of church and
communal lands-, and the increase in the variety of goods and services provided by the
market. Thus, by 1850, economically active population [EAP] in agriculture worked an
average of 240 days per year.21 During the first half of the nineteenth century EAP in
agriculture multiplied by 1.5 (Álvarez-Nogal and Prados de la Escosura 2007) while
according to Bringas (2000: 86), the area of cultivated land multiplied by 2.4. If we
assume that labour effort per hectare (measured in days of work per EAP/year)
remained constant over the same period, the number of working days in agriculture by
1800 would have been around 150 (=240*1.5/2.4), a figure consistent with that of 120
working days per year at the time of the Cadastre of Ensenada (c. 1750), that is, prior
19See also Vilar (1970: 129) and Santaolaya Heredero (1991). The low figure for days worked in
agriculture is confirmed by Simpson (1992) for late nineteenth century Andalusia on the basis of labourinput requirements.20
In Valladolid during the 17th
century most workers were occupied less than 150 days (Gutiérrez Alonso1989). In turn, Madrid masons only worked, on average, 3.5 days per week during winter while insummer they went up to 4.4 days/week during late 18
thcentury (Nieto Sánchez 2006: 428). Assuming,
on average, 4 days per week it represents 208 days per year. The latter figures match closely thoseprovided for Italy by Malanima (2011) for 1750-1800, 200 days on average.21
Such figure is a weighted average computed from data of labour force and days worked at provinciallevel in Spain c. 1850 (del Moral Ruiz 1979)

10
to the agricultural expansion of the late eighteenth century. However, the scant
evidence available is far from conclusive.22
Yet, before accepting changes in real wage earnings as a proxy for those in real
disposable income per head, the stability of the share of labour in national income
needs to be established. Inequality was deep in early modern Spain. For example, c.
1750, the wealthiest 10 percent outweighed the poorest 40 percent by 15 to 17 times
in Old Castile.23 These ratios are similar to those found for contemporary England (14
times), and France (17 times) (Hoffman et al. 2002).24 Nonetheless, high inequality can
be compatible with the stability of the labour share in national income. Was this the
case of pre-industrial Spain? Trends in relative factor returns provide a good test for
the stability of income distribution.25 A measure of income inequality, the land
rent/wage ratio, shows a flat long-run trend between the early 14th and 16th centuries
and, then, rises from the 1530s to the 1590s and, again, between the 1730s and the
1800s, but declines in the 17th and the early 19th centuries (Figure 3).26 Thus, it
appears, in particular, for early modern Spain, that, unless returns to property are
included in our proxy for disposable income, in phases of rising (declining) inequality
our estimates may suffer a downward (upward) bias and, hence, provide a lower
(upper) bound of the actual agricultural output.27
We have calibrated, then, the demand of agricultural goods using equation [2].
The main challenge is posed by the choice of a proxy for changes in real disposable
22Thus, conjectures about cultivated land by Garrabou and Sanz (1985) suggest that it only increased by
20 percent between 1800 and 1860 which would imply that hectares per agricultural EAP fell during theearly 19th century. Moreover, the low number of days worked per labourer in late 19th centuryAndalusia (Simpson 1992) hardly suggests any work intensification per EAP.23
Computed from Yun-Casalilla (1987).24
Gini coefficients for income distribution at different Old Castile towns c. 1750 cast values ranging from0.39 to 0.56, while similar estimates were obtained for Jerez (around 0.5) (Álvarez-Nogal and Prados dela Escosura 2007). These figures are close to the 0.52 Lindert computed for England and Wales in 1759(http://www.econ.ucdavis.edu/faculty/fzlinder/Massie1759rev.htm).25
As Hoffman, Jacks, Levin, and Lindert (2002: 325) point, real inequality was ‘caused by the interactionof population growth with concentrated land ownership and the Engel’s law’.26
Scattered evidence indicates that the incomes of the middle and upper classes were growing in earlymodern Spain, while those of the lower classes were stagnant or declining (Nader 1977).27
As a test, we have estimated per capita consumption of food for Spain over 1850-1913 with a demandfunction (and a common data set from Prados de la Escosura (2003)) using real wage rates (Bringas2000) and GDP per head, alternatively, as indicators of real per capita disposable income. The resultsconfirm the downward bias introduced when wage rates are employed as a proxy for income per head.Interestingly, when agricultural consumption per head for eighteenth century England is derived with ademand function, the use of per capita income (Crafts 1985) also shows a faster pace of growth thanwhen real wages rates are employed (Jackson 1985, Allen 1999).

11
income per head. One option, following Allen (2000), is to use the variations in real
wage rates (Estimate I).28 A second option is to assume that workers reacted to
declining real wage rates by working extra days, so real returns to labour remained
stable over time. This assumption, that seems plausible for 18th century Spain, does
imply that changes in the consumption per head of agricultural staples would only
depend on the relative price of agricultural and non-agricultural goods weighted by
their own- and cross-price elasticities (Estimate II).
A third option results from a more comprehensive proxy for disposable income
per head in which, in addition to a crude measure of labour earnings, the returns
accruing to proprietors are also taken into account. We have been able to construct a
crude proxy of real disposable income as a weighted average of real wage rates and
real land rents, in which the shares of labour (0.75) and property (0.25) in Spain’s
national income during the 1850s are used as weights (Prados de la Escosura and
Rosés 2009) (Estimate III).29 Nonetheless, this alternative estimate suffers from the
same weakness of Estimate I, since we do not allow for changes over time in the
number of days worked per EAP and in the amount of land exploited.
As regards the values of demand elasticities, we have explored alternative sets,
ranging from -0.7/-0.4 (own-price elasticity, ε) and 0.6/0.3 (income elasticity, μ) with
cross-price elasticity (γ) always equal to 0.1, but finally opted deliberately for low
absolute values: ε = -0.4; μ = 0.3; γ =0.1.30 As discussed above, the adoption of lower
values for income and own price elasticities for preindustrial Spain than those
computed for countries at similar levels of development allows for the fact that we are
addressing the demand for agricultural staple goods. Furthermore, by choosing a low
value for income (wage) elasticity we allow for the fact that the demand for
28It is worth noting that the use of unskilled wages does not alter significantly our results since most
workers were unskilled.29
Lack of long run series for interest rates precluded its inclusion in our proxy for disposable income.30
Allen (2000) and Malanima (2011) used similar values for own price (ε = -0.6 and - 0.5), income (μ =0.5 and 0.4) and cross price (γ =0.1) elasticities of demand. It is worth mentioning that elasticities shouldbe adjusted over time as income per head changes. However, since presumably per capita income inpreindustrial Spain was low and varied within narrow limits the range within which expenditure andown price elasticities would fluctuate is rather narrow, and so is the range for the output estimatesobtained using alternative elasticities.

12
agricultural food staples was affected by changes in number of days worked per
EAP/year in a response to real wage rates variations.31
In Figure 4 and Table 1 the three alternative estimates of agricultural
consumption per head are provided and implicitly compared to Wrigley’s assumption
of a constant consumption per head of agricultural goods (a constant value of 4.6
expressed in natural logs). It clearly appears that Wrigley’s approach proves
inadequate since, even when real disposable income is assumed to remain unaltered
(Estimate II), the demand for agricultural staple goods reacts to changes in relative
prices and, hence, consumption per head is far from stable. In fact, the decline in real
per capita consumption observed for the demand estimate which includes real wage
rate as a proxy for disposable income (Estimate I) is confirmed, but for a milder slope,
in Estimate II. Another interesting finding is that the inclusion of land rent as a proxy
for returns to property in our measure of disposable income (Estimate III) confirms the
declining trend in per capita consumption of food staples. Such coincidence between
these alternative estimates suggests that relative price changes drive variations in
consumption per head of agricultural goods.
Interestingly, Estimates I and II match each other closely after 1550, in
particular between mid-16th and mid-18th centuries and, then, in the early 19th century,
but not beforehand, in particular, during the 15th century, when Estimate II exhibits a
much lower level. This raises the issue of the extent to which, at a time of high wages,
people forgo food consumption in order to reduce their working time. In a high land-
labour ratio economy, with an extensive use of natural resources –mainly, livestock
rearing- it seems unlikely that peasants would cut down their already low number of
working days per year. In the urban-led repopulation of the 14th and 15th centuries it
seems also improbable that those employed in industry and services would reduce
their working effort as their wages increased, particularly since trading networks
linking towns within Spain and to the European markets catered for their demand.
Thus, it can be inferred that Estimate I offers a more plausible representation of trends
in per capita consumption of agricultural staples than Estimate II.
31The sources for real wage rates, real land rents, agricultural and non-agricultural prices, and consumer
price indices are detailed in Appendix I.

13
The close coincidence between Estimates I and III confirms the decisive role
played by relative prices in determining trends in per capita consumption as they
offset the differing behaviour of real wage rates and land rent. Nonetheless, higher
levels can be observed for Estimate III during the late 16th and 18th centuries, as land
rents partly offset the dramatic decline of real wage rates. Conversely, during the early
15th century the rise in real wage rates was mitigated by a trendless real land rent.
Given the matching of Estimates I and III, and the fact that Estimate III is more
comprehensive -in so far is derived using not just wage rates but also land rent as to
proxy disposable income-, we decided to use Estimate III in our computation of
aggregate output. However, since Estimate III only covers 1320-1845, we assumed it
evolved along Estimate I before 1320 and after 1845.
The consumption per head of food staples present two distinctive phases: up to
the 1550s, of high levels; henceforth, of significantly lower ones, which largely matches
the evolution of real wage rates. The highest food staples consumption per head
corresponds to the pre-Black Death era. The recovery in the early 15th century fell
short of the peak levels of the 1330s-1340s. The reason is that the advance of the
Reconquest in the 13th century provided large areas of land which were not matched
by demographic expansion.32 In fact, the colonization of new land was far from
complete in the eve of the Black Death and migration flows southwards from northern
Spain continued (MacKay 1977: 67-71). Consumption levels of agricultural staples
declined from mid-15th to mid-17th century –although remained still high in the early
16th century- and, then, stabilized at a low level -despite a recovery episode in the late
17th-early 18th century followed by a sharp decline- until mid-19th century.
Due to lack of data for most of the considered period, we had to assume, as
Allen (2000) did for most European countries, that agricultural trade was balanced.33
The available evidence for the late eighteenth and early nineteenth century indicates
32This occurred even though large numbers of Muslims did not migrate and stayed especially in the
east, the Valencia region, in particular. Nonetheless, in areas along the Mediterranean coast thesituation was often not too dissimilar from that in Western Europe (MacKay 1977).33
The first official computation of trade flows corresponds to 1792 (Prados de la Escosura 1982), andreconstructions of Spain’s trade with her major partners in the eighteenth century (Romano 1957,Prados de la Escosura 1984) do not provide the trade balance for agricultural goods. Nonetheless, it isnot the size of exports or imports of agricultural goods what really matters but its balance (that is, netexports) which can be easily assumed to be a small share of total consumption.

14
that trade represented a small share of agricultural output.34 Thus, output per head (q)
equals, by construction, per capita consumption (C), and total agricultural output can
be, then, derived with population figures (N) as:
(Q)agr = q N [3]
Output outside agriculture: conjectural estimates
The dearth of data from which to infer trends in industrial and services
production in preindustrial Spain is even more dramatic than for agriculture and
renders the use of crude indicators necessary. Associating urbanization, for which
reliable evidence is available, to the level of economic development is not new.35
Historical parallels are suggested between changes in urbanization rates and per capita
GDP growth. 36 In preindustrial economies increases in real per capita income have
been linked, ceteris paribus, to those in the proportion of the population living in
urban centres (Wrigley 1985). More cautiously, here we have accepted urban
population (excluding those living on agriculture) as a proxy for non-agricultural output
and, hence, assumed that trends in the rate of adjusted urbanization -that is, the share
of non-agricultural urban population over total population- capture those in per capita
output in industry and services.37
In early modern Spain, urbanization rates have usually been considered
upwardly biased as a result of the existence of ‘agro-towns’. Towns provided security
and lower transactions costs in a frontier economy during the re-population process
that followed the Reconquest and after the Black Death. After the third wave of the
Reconquest in the 13th century, Christian settlers from Aragon, Catalonia and Southern
34It can be reckoned that Spain was a net food importer in the late eighteenth century up to, at most, 5
percent of GDP and no more than 10 percent of agricultural output (Prados de la Escosura 1993: 271-73,276). By mid-nineteenth century, however, Spain was a net exporter of foodstuffs, though but no morethan 5 percent of agricultural output (Prados de la Escosura 1988, 2003). This suggests that theimprovement in consumption per head between the late 18th and the mid-19
thcentury should be raised
by around 15 percent to represent the increase in agricultural output per head. As a consequence ourestimates tend to be downward biased for the early 19
thcentury.
35Urbanization represents, according to Kuznets (1966), ‘an increasing division of labor within the
country, growing specialization, and the shift of many activities from nonmarket-oriented pursuit withinthe family or the village to specialized market-oriented business firms’. Cf. also Acemoglu, Johnson, andRobinson (2005), Reis (2005), and Temin (2006).36
Craig and Fisher (2000: 114). This approach is supported by van Zanden (2001) who claims that“differences in levels of development ... are perhaps best approached via variations in the urbanizationratio”.37
Malanima (2011) follows a procedure similar to the one used here.

15
France acquired farms but preferred to live in towns (MacKay 1977: 69). Moreover, the
Black Death favoured urban growth in Spain as (southern) towns were more secure
and provided better services attracting immigrants from the (northern) countryside
(Cuvillier 1969, Ladero Quesada 1981, MacKay 1977, Pladevall 1962, Rodríguez Molina
1978, Rubio Vela 1987, Santamaría 1969). At the same time, the formation of large
landholdings was favoured by the acceleration in the pace of the Reconquest and the
Plague (Vaca 1983, Valdeón 1966).38 Thus, “agro-towns” in southern Spain seem to be
the legacy of a highly concentrated landownership which resulted in a large proportion
of landless agricultural workers (Casado 2001, Reher 1990).39
Notwithstanding the existence of ‘agro-towns’, a large proportion of urban
economic activity was associated to industry and services. In sixteenth century Old
Castile, Yun-Casalilla (2004) reckons that agricultural employment represented, on
average, 8 percent of the urban labour force. In late eighteenth century Spain most
urban day labourers were employed outside agriculture and, according to Pérez
Moreda and Reher (2003: 129), farmers (labradores) only represented 7.6 percent of
the urban population in the 1787 population census.
Although keeping a constant threshold over time, while population grows, is
rather questionable (Wrigley 1985), we have adopted the definition of ‘urban’
population as dwellers of towns of 5,000 inhabitants or more to maintain consistency
with Bairoch, Batou and Chèvre (1988) estimates so international comparisons can be
carried out.40 We have used, following Álvarez-Nogal and Prados de la Escosura (2007),
the urban population adjusted downwards by excluding those living on agriculture (See
Appendix 1).41 Spanish ‘adjusted’ urbanization rates, at benchmark years over 1000-
38Cabrera (1989) qualifies this view and attributes the rise of latifundia to the generalization of the
seigniorial regime during the 14th
and 15th
centuries.39
It seems clear that the higher the threshold to be deemed as an urban centre, the lower theprobability of including people employed in the agricultural sector. In order to mitigate the inclusion of‘agro-towns’, in which most of the population is employed in agriculture, Malanima (1998) proposed alower limit for being considered urban, 5,000 inhabitants, for the north and centre of Italy, and a higherone, 10,000, for the south of the country.40
Such a definition is arbitrary and alternative thresholds of 10,000 (de Vries 1984) or 20,000 (Flora1981) inhabitants have been used. Bairoch, Batou, and Chèvre (1988) employed alternatively 2,000,5,000, 10,000, and 20,000 inhabitants as measures of urbanization.41
Llopis Agelán and González Mariscal (2006) introduced a more astringent definition of ‘urban’ centre:in order to qualify as ‘urban’, a population centre needs to have a) more than 5,000, and b) less thanhalf of its economically active population (EAP) occupied in agriculture. This way they estimated that, for1787, the conventional rate of urbanization (23.7 percent, according to their own computations) should

16
1857, are presented in Table 2 and their rates of variation have been accepted to proxy
those in non-agricultural output per head.
However, efficiency changes resulting from variations in the composition of
labour by economic sectors and in the dependency rate could affect our proposed
index. We have, then, carried out a sensitivity test by estimating the intersectoral shift
effect that results from changes in the shares of industry and services in non-
agricultural employment and in the productivity gap between industry and services.
Furthermore, we allowed for changes in the potentially active to total population ratio
(PAP/N) that could also affect our index. Fortunately trends in the proposed index of
output outside agriculture do not appear to be significantly altered by either
demographic or output composition changes during the early modern era.42
Before proceeding to estimate aggregate output an apparent contradiction
between a declining consumption of agricultural staples per head and a rising
urbanization (adjusted) rate, which implies, under our previous assumption, an
increasing consumption of industrial goods and services, needs to be confronted
(Tables 1 and 2 and Figure 4). How could it be solved? A possible explanation is that
the decline in the consumption of food staples per head is over-exaggerated by the use
of real unskilled wage rates as a proxy for real income per head (Estimate I) since it
introduces a downward bias in the estimates (at least when income inequality
increases and work intensifies). However, the alternative results obtained by assuming
stable real wage earnings per worker (Estimate II) and by using jointly unskilled wage
rates and land rents per unit of cultivated land as a proxy for real income per head
be cut down to almost half of it (12.7 percent, or 14.5 percent if we accept a less astringent definition ofurban population).42
Services increased relative to manufacturing in terms of output and employment in early modernSpain (García Sanz 1991a, López-Salazar 1986, Reher 1990) probably as a consequence of the Dutchdisease provoked by the inflow of American silver (Forsyth and Nicholas 1983, Drelichman 2005). Giventhe lack of national data, we arbitrarily assumed that the evolution of the internal composition of non-agricultural employment in Spain was captured by the shares in non-agricultural economically activepopulation (Li+s) of industry (Li/Li+s) and services (Ls/Li+s) in a New Castile town, Cuenca (Reher 1990). Asregards the productivity ratio between industry and services, lack of data forced us to accept a fixedratio (1.4) derived from the Cadastre de Ensenada for the Kingdom of Castile c. 1750. The resultingintersectoral shift effect [IS = (Ls/Li+s) + (1.4* (Li/Li+s)] shows a mild decline over time. If alternatively theproductivity gap for the 1850s were used (Prados de la Escosura 2003) the productivity index would riseslightly over 1750-1850. Changes in the potentially active to total population ratio (PAP/N) can alsoaffect our index of output outside agriculture. Alas, we only know the evolution of the PAP/N ratio forthe case of New Castile from 1586 onwards which does not exhibit major changes over time (Reher1991).

17
(Estimate III) do cast similar declining trends. An alternative interpretation would be,
then, that the opportunity cost of food staples consumption rose as a result of wider
consumption choices and, hence, the amount of non-agricultural goods consumed
increased at the expense of food staples. This scenario seems to be confirmed by the
steady decline in the prices of industrial goods relative to agricultural goods, in
particular, for the 16th and 18th centuries (Figure 5). Lastly, it could be argued that
such a contradiction evidences the fact that rising urbanization in preindustrial
societies fails to capture increases in economic activity outside agriculture as it simply
results from rural immigrants expecting to live on charity.43 However, even if this were
the case, feeding an increasing idle urban population would imply the existence of a
surplus to be distributed among the poor. Such a surplus could only result from either
a redistribution of income, with the consequence of an inequality decline, or from an
output increase in industry and services. Since the available evidence suggests that
inequality raised both during the 16th and 18th centuries (Figures 3 and 8) the surplus
resulted necessarily from the increase in non-agricultural production. Thus, the
contradictory trends in per capita consumption of agricultural foodstuffs and
increasing urbanization would be reconciled.
Aggregate output
To reach an estimate of aggregate output we need to combine our indicators of
agricultural output and economic activity outside agriculture. Therefore, we have
computed a Divisia index for real GDP per capita by weighting yearly variations in
output per head in agriculture (proxied by Estimate III of agricultural goods
consumption) and in industry and services (proxied by the ‘adjusted’ urbanization rate)
by the average, at adjacent years, of the shares of agriculture and non-agricultural
activities in current price GDP and, then, obtaining its exponential.44 That is,
43We owe this hypothesis to Paolo Malanima.
44Álvarez-Nogal and Prados de la Escosura (2007) derived aggregate output (O) by combining
agricultural output (q N) and the indicator of economic activity outside agriculture (namely, adjustedurbanization, N´urb-nonagr it), expressed in index form with 1857 as 100, with their shares in GDP in 1850-1859 –the earliest dates for which national accounts are available (Prados de la Escosura and Rosés2009)– as weights.O.t = Sa.1850/59 (q.t N.t) / (q.1857 N.1857) + (1– Sa.1850/59)*(N´urb-nonagr .t /N´urb-nonagr .1857) [4]Where Sa.1850/59 represents the average share of agriculture in GDP in the 1850s (0.404).

18
)]lnQi-lnQi([=lnQ-lnQ 1-ttQi1-tt [5]
Where share values are computed as:
e)agriculturnoneagricultur=(i],i+i1/2[=i tt ,1 [6]
Current price estimates of GDP have been obtained by reflating each sector’s
real output with its corresponding price index and adding them up. In the case of
agriculture, a price index was already available; and in the case of non-agricultural
activities, rates of variation for manufacturing prices, the CPI, and nominal wage rates
were arithmetically averaged and its exponential computed to obtain a non-
agricultural price index.45 This way current GDP estimates were obtained and the share
of each sector derived. A crude estimate of the share of agriculture in national income
at current price is presented in Figure 6. These conjectural results tend to confirm our
intuition of a relatively small agricultural sector -given the significant role of towns and
commerce-, in both the pre-Black Death era and the 16th century, before 17th century
‘ruralisation’ took place. Since the late 18th century, the agriculture share in GDP
declined gradually.
But to what extent do our estimates proxy GDP or just ‘market income’, leaving
aside home, non-marketed production? Our conjecture is that we fall short from
covering non-market production and that its inclusion in our output estimates would
probably have a counter-cyclical effect, moderating the intensity of both the decline
and rise of output over time that we present here.46
Trends in product per head are offered in Figure 7 and Table 3 (in which our
favoured series –derived with Estimate III of agricultural output- is confronted with
However, such an approach to derive output estimates for over half a millennium introduces an indexnumber problem, since relative prices change over time and, consequently, fixed mid-19
thcentury
weights are not representative. Furthermore, it also implies the strong and unrealistic assumption thatthe productivity differential between agricultural and non-agricultural sectors remained stable overtime. Malanima (2011) and Pfister (2011) estimates suffer from this shortcoming.45
This amounts to allocating one-third of the weight to industry (the industrial price index) and two-thirds to services (nominal wage and consumer price indices), which is a good approximation to thesectoral shares within non-agricultural output in the 1850s (Prados de la Escosura 2003).46
For agricultural output, it is unclear that this is the case in our demand approach estimates. As foroutput in industry and services, a non-negligible share was contributed by the active populationemployed in agricultural activities and we fail to capture it, although an early use of the market even forthe more remote regions of Spain has been documented (Domínguez 1994). Furthermore, the so called‘agro-towns’ tended to facilitate the production for the market.
19
those derived using Estimates I and II). Over the long run, real output per head
increased very mildly, below one-fifth, between the late 13th and mid-19th century.
Three phases of sustained expansion can be distinguished, though, each one with a
similar trend growth but along successively lower paths, separated by the late 14th and
early 17th century crisis.
Two clearly differentiated epochs can be distinguished in the economic
performance of preindustrial Spain: 1270s-1590s and 1600s-1810s.47 In the first one,
sustained progress -that can be tracked down to the 11th century- was broken by the
Black Death and, then, resumed since the 1390s. By the early 14th century, Castile and,
to a large extent, the whole of Spain, was a high land-labour ratio economy whose
primary sector had a relatively small size, repopulation was driven by urban centres,
and, helped by the relatively abundance of specie, trade networks linked towns in the
Douro valley and Camino de Santiago with Andalusia’s cities. A commercial society,
initiated with the Camino de Santiago in the 11th and 12th centuries, developed with
Castilian trade expansion and the creation of a Hansa-type network in northern Spain,
the spread of Catalan economic interests in the Mediterranean, and the opening of
Gibraltar straits to southern trade (MacKay 1977: 74-75, 127). All this resulted in a high
income society with an expanding population, which was able to defeat Islam and
extract large tributes.
The Black Death’s demographic impact seems to have differed widely from its
economic effects. The plague hit Spain in 1348 and most historians agree that its
impact was milder than elsewhere in Western Europe. The regional impact of the
Plague varied substantially (Doñate 1969, Vaca 2001). In the Kingdom of Castile,
despite recurring plague outbreaks, its effects were less devastating than in the
Kingdom of Aragon, Catalonia in particular (Verlinden 1938, Pérez Moreda 1988,
Sobrequés 1970-71). In Teruel (Aragon), the loss of population reached 35 percent,
although part of it represented plague-led emigration (Sobrequés 1970-71), while in
Navarre it would have represented between 25 and 40 percent (Monteano 2001). In
Castile, the loss of population was probably below 25 percent and is partly explained
by migration to southern Spain since it was Andalusia the most plague-ridden region of
47A third epoch of modern economic growth from the early 19
thcentury to the present is outside the
focus of this paper (See Prados de la Escosura 2007).

20
the Kingdom of Castile (Iradiel et al. 1989). However, the economic impact of the
Plague seems to have been much more dramatic than the demographic one, with real
per capita income contracting by one-fourth between the 1340s and the 1370s. It is
our hypothesis that, in a frontier economy -such as was the case of most of Spain- the
Black Death’s demographic shock destroyed commercial networks (national and
international), and isolated an already scarce population with the consequence of
reducing the ability to maintain per capita production levels.
A phase of long-term growth opened after the Black Death and the Spanish
phase of the Hundred Years’ War (1350-89) and lasted until the end of the 16th
century. Economic expansion largely happened on the basis of a staple (wool) whose
production adapted well to the relative abundance of land, and on a dynamic trade
sector which supplied not only international markets but also domestic ones as
increasing living standards stimulated the creation of an urban industry (MacKay 1977:
75). Declining relative industrial prices over 1390s-1470s (Figure 5) reinforced the
allocation of resources to livestock rearing taking advantage of the closing of European
markets to English wool during the Hundred Years War. Castilian transhumance
expanded once Extremadura and La Mancha grass lands were won and the demand for
wool grew both internationally, in the Low Countries and Italy and, then, in England
(Childs 1978), and domestically, as local textile industry rise (Iradiel Murugarren 1974).
American colonization and international trade expansion contributed to stimulate
economic activity over 1490s-1590s. Thus, by the end of the 16th century, real output
per head was close to pre-Black Death levels, while Spain had built an empire and
become an economic centre which connected Europe and the New World.
The second epoch, ranging from the 1600s to the 1800s, had significantly
different features and the foundations of growth of the previous epoch: wool, trade,
and urban activity, would be no longer in place. A sustained fall in per capita income
until mid 17th century, about one-fifth, opened it. The decline in wool exports after
1570 and the contraction in the purchasing power of American silver since the early
17th century (Flynn 1982) forced an inward-looking re-orientation of the Spanish
economy. Low productivity and competitiveness in tradable production was
apparently reinforced by the Dutch disease brought by American silver (Forsyth and
Nicholas 1983, Drelichman 2005). The rising cost of the empire fell on Castile, its
21
richest and more populated kingdom. Growing taxation since 1575 led towns to
increase their indebtedness which affected negatively urban activity, at the time of a
decline in wool exports and the disappearance of Medina del Campo fair (Ruiz Martin
1970). As a result, population fled towns. The fiscal system collapsed as cities did
(Andrés Ucendo and Lanza 2008).48 Increasing ruralisation, however, did not imply a
significant improvement in agriculture’s efficiency. Economic recovery only took place
in the late 18th century. Population pressure led to extensive cultivation of land. Crops
(cereals, in particular) took the lead over livestock. Population, who lived mostly in
interior Castile and the Guadalquivir valley in the 15th century, shifted its balance
towards the periphery where a more commercial agriculture developed. When in the
early 19th century Spain per capita income reached again the level of the 1590s, she
was no longer an empire and a link between Europe and the New World.
These two distinctive regimes also translated into significant differences in
terms of well-being. A crude inequality indicator of income distribution, the ratio of
nominal output per head to nominal wage rates, expressed in index form - known as
the Williamson index- has been computed. The rationale of such an indicator is that
while the numerator captures returns to all factors of production per occupied person
-and here we assumed that labour force evolved along total population-, the
denominator represents the returns to raw labour, so the bottom of the distribution is
compared to its average. It is worth recalling, however, that since wage rates might
underestimate wages in the long run -as an increase in working time possibly took
place in the late 18th and early 19th century-, our index could over-exaggerate
inequality for this period. Some interesting results derive from Figure 8. Firstly, In the
long run, inequality levels and lower economic inequality go together. Inequality
increased from mid-16th to mid-17th century and, again, in the second half of the 18th
century, and declined prior to the Plague and in the late 14th and 17th centuries. It
could be suggested that phases of expansion (depression) tend to be accompanied by
48Monetary alteration (fiat currency, vellón) and debt default (1635-58), together with war with France
and revolts in Catalonia (1640-53) and Portugal (1640-68) help to describe the new situation. It is worthnoting that, contrary to the experience of the late 14th and 15th centuries, fiscal revenues fell and theprimary sector gained weight while urban centres decline.

22
rising (declining) inequality, but for the early 17th century.49 This result is largely
confirmed by another inequality measure, the land rent-wage ratio (Figure 3). In the
early 19th century, when population expansion was accompanied by a sustained
increase in output per head, inequality stabilized according to the Williamson index,
while it declined in terms of the land rent-wage ratio.
Spain’s economic performance in European perspective
Half a century ago John Elliott (1961: 55-56) proposed “to compare Spanish
conditions with those of other contemporary societies, and then, if it is possible to
isolate any features which appear unique to Spain”. Since then, views of Spanish
relative performance in Early Modern Europe have been put forward with hardly any
empirical support (Kamen 1978, Cipolla 1980, Israel 1981).
The fact that a quantitative comparison is fraught with difficulties explains why
no attempts have been made to establish, even at a conjectural level, Spain’s relative
position in preindustrial Europe. Although the number of countries for which trends in
output per head can be drawn has increased lately, comparable per capita incomes at
current prices and adjusted for differences in price levels –that is, expressed in
purchasing power parity (PPP) terms- are lacking. We need, therefore, to resort to
crude, indirect methods that necessarily produce questionable results. The most
frequent one, pioneered by Angus Maddison (1995), is carrying out the comparison in
1990 international prices, that result from projecting backwards per capita GDP levels
in 1990, expressed in 1990 ‘international’ dollars (PPP), with volume indices taken
from historical national accounts. Although Maddison figures are widely used as they
represent the most convenient procedure, his approach has been seriously objected.
Perhaps, its most obvious shortcoming is the severe index number problem it
introduces, that is, the fact that the basket of goods and services produced and
consumed in 1990 becomes less and less no representative a one moves back in time,
as preferences and relative prices change as a result of modern economic growth and
technological change. However, the available datasets that attempt to provide a
solution by comparing current price per capita incomes, PPP adjusted, are also
49The different evolution of consumer price indices for lower and upper social classes constitutes an
additional source of inequality in income distribution for early modern Europe (Hoffman et al. 2002).

23
contentious due to their limited commodity and country coverage (Ward and
Devereux 2006) and to the indirect, short-cut procedure used in its construction
(Prados de la Escosura 2000). Nonetheless, a reason to favour the results from a short-
cut approach is that using a current price benchmark for 1850 mitigates -though far
from eradicates- the formidable index introduced by the use of 1990 international
dollars. Although the year 1850 is still too remote for the half a millennium considered
here, modern economic growth had not gone deep yet in many European countries, as
the available evidence (real wages, life expectancy, output per head growth) suggests.
In an eclectic exercise, Table 4 provides per capita GDP levels for a sample of
European countries, including Spain, relative to that of the UK in 1850, which have
been projected backwards to 1300 with the available national indices of real output
per head. In Panel A, the benchmark estimates for 1850 are derived through a short-
cut approach and expressed 1850 US relative prices (Prados de la Escosura 2000). In
Panel B, the 1850 benchmark is provided by Maddison (2010) estimates in Geary-
Khamis $ 1990. This way, the reader will be able to decide which set of results seem
more plausible (See Appendix 2).
Before discussing the results a word is needed about the way the national
indices of real output per head are derived.50 Estimates for Italy, Germany, and France
have been constructed with a similar method to the one for the case of Spain, namely,
a demand approach for agricultural output and economic activity outside agriculture
proxied by urbanization. Due to lack of data, the relative income level for Italy in 1850
has been projected backward with output estimates for North and Central regions
from Malanima (2011). For Germany estimates derive from Pfister (2011). As regards
France, we carried out our own estimates on the basis of Allen’s (2000) data on
population, agricultural output, and urbanization for 1400-1800, Bairoch’s (1988) for
urbanization in 1850, and Toutain’s (1997) for agricultural output estimates, 1790-
1850, and sector shares in GDP in 1850.51 Direct output estimates for Holland and the
50We opted to choose the U.K. rather than Britain or England, and the Netherlands rather than Holland
as scholars usually do (Allen 2000, van Zanden 2001) since we are looking at whole countries, notregions, and a major point in our paper is to establish trends in Spain, not just in Castile, and to compareSpain to other nations.51
As in the cases of Pfister (2011) and Malanima (2011) for Germany and Germany, this is a slightlydifferent and inferior estimate to the one for Spain, since, as it has been disccused above, the use offixed weights over such long time span creates an index number problem. In the case of Spain, though,

24
Netherlands, are provided by van Zanden and van Leeuwen (2011), and for England
and Britain, Broadberry et al. (2011). We assumed that Netherlands evolved as
Holland over 1400-1800 and the U.K.’s moved along Britain’s over 1700-1850 and,
then, England’s, over 1300-1700; and also that the. For Sweden we have used the
estimates by Schön and Krantz (2011), as reported in Broadberry et al. (2011).
Two main results emerge from placing Spain’s performance into European
perspective (Table 4). On the one hand, the existence of two distinctive phases with
1600 as a turning point. In the first one, Spain appears, according to Panel A, as part of
the top per income countries along with France but below Italy. By 1600 Spain would
have been only behind Italy and the Netherlands. Similar, though milder results are
derived from Panel B. Up to the Black Death Spain was only second to Italy and
belonged to the same per capita income range of the Low Countries, France, and
Britain during the 15th and 16th centuries. In the second phase, Spain fell gradually
behind, and the moderate recovery since the 18th century, intensified in the early 19th
century, did not suffice to stop the relative decline, so by mid-19th century Spain had
joined to laggard countries of Western Europe.
On the other, contrary to most of preindustrial Europe, an association is found
in Spain between population expansion and per capita output growth, as can be
observed in the pre-Black Death period, and during the 16th and 18th centuries.
Conversely, during phases of population decline or stagnation, namely the late 14th
and early 17th centuries, real income per head did fall.
The contrast between preindustrial patterns of development in Spain and
Western Europe can be highlighted by a comparison with Italy. Italy appears as Spain’s
mirror image (Figure 9). During phases of demographic stagnation or decline relaxing
the population pressure on resources in Italy facilitates an improvement in per capita
income levels, whereas, in Spain, sluggish or negative population growth go along with
falling output per head and vice versa. Such a different behaviour evidences the low
demographic pressure on resources that corresponds to the high land-labour ratios of
a frontier economy such as Spain up to the 16th century and, then, of an economy in
which cultivated land can expand at the expense of pasture.
the results derived from using a Divisia index are not substantially different from those obtained with afixed weighted index.
25
Concluding Remarks: Why was Spain affluent before the American expansion?
During the 14th and 15th centuries, Spain exhibited an opposite behaviour to
that of most countries in Europe and the Eastern Mediterranean, in which the recovery
from the Black Death is associated to the highest output per head of the early modern
era (Pamuk 2007, Clark 2010, Broadberry et al. 2011). Contrary to Spanish neo-
Malthusian literature (Valdeón Baruque 1969), the forces underlying economic
performance in Western Europe, namely, population pressure on increasingly scarce
resources after more than two centuries of demographic expansion, with the
consequence of diminishing returns and hunger, were not in action in Spain.52 On the
contrary, most of Spain was a frontier economy with manpower shortage and land
abundance, which implied high land-labour ratios and, most probably, increasing
returns to labour (MacKay 1977). This explains why once the Reconquest was over and
only the Nasrid kingdom of Granada remained under Islamic control, sustained
progress took place. Empty lands, as the Moorish largely escaped from Christian rule,
had to be populated and exploited in southern Spain. In achieving relatively high living
standards prior to the Black Death, a high land/labour ratio was no doubt an important
constituent. However, openness to goods and ideas from abroad also mattered as it
allowed Spain to take advantage of her privileged position at the crossroads of the
European and African economies. Its combination explains how Spain managed to
achieve a relatively affluent position in Europe prior to her expansion in the Americas.
52The Malthusian interpretation of 14
thcentury Spain has been rejected by García Sanz and Sanz
Fernández (1988) and Casado Alonso (2009).

26
References
ACEMOGLU, D., JOHNSON, S., and ROBINSON, J. (2005). The rise of Europe: Atlantictrade, institutional change and economic growth. American Economic Review 95, 3, pp.546-79.
ALLEN, R.C. (1999). Tracking the agricultural revolution in England. Economic HistoryReview 52, 2, pp. 209-35.
ALLEN, R. C. (2000). Economic structure and agricultural productivity in Europe, 1300-1800. European Review of Economic History 4, 1, pp. 1-25.
ALLEN, R. C. (2001). The great divergence in European wages and prices in Europe fromthe Middle Ages to the First World War. Explorations in Economic History 38, 4, pp.411-47.
ALLEN, R. C. (2004). Britain's economic ascendancy in a European context. In L. Pradosde la Escosura (ed). Exceptionalism and Industrialisation. Britain and its EuropeanRivals, 1688-1815. Cambridge: Cambridge University Press, 15-34.
ÁLVAREZ-NOGAL, C. and L. PRADOS DE LA ESCOSURA (2007). The decline of Spain(1500-1850): conjectural estimates. European Review of Economic History, 11, pp. 319-366.
ÁLVAREZ VÁZQUEZ, J.A. (1987). Rentas, precios y crédito en Zamora en el AntiguoRégimen. Zamora: Colegio Universitario de Zamora.
ANDRÉS UCENDO, J. I. and R. LANZA GARCÍA (2008). Estructura y evolución de losingresos de la Real Hacienda de Castilla en el siglo XVII. Studia Historica. Historiamoderna 30, pp. 147-190
ANES, G. (1970). Las crisis agrarias en la España moderna: Madrid: Taurus.
ARGILÉS i ALUJA, C. (1998).Preus i salaris a la Lleida dels segles XIV i XV segons elsllibres d'obra de la Seu. Lleida: Universitat de Lleida.
BAIROCH, P. (1965). Niveaux de développement économique de 1810 à 1910. AnnalesESC, 20, 6, pp. 1091-1117.
BAIROCH, P. (1988). Cities and Economic Development. From the Dawn of History tothe Present. Chicago: University of Chicago Press.
BAIROCH, P. (1989). Wages as an indicator of Gross National Product. In P. Scholliers(ed.). Real Wages in 19th and 20th Century Europe. Historical and ComparativePerspectives. Oxford: Berg, 51-60.
BAIROCH, P., BATOU, J., and CHÈVRE, P. (1988). La population des villes européennes.Banque de données et analyse sommaire des résultats, 800 à 1850. Genève: LibrairieDroz.

27
BOIS, G. (2000). La grande dépression médiévale: XIVe-XVe siècles: le précédent d´unecrise sustémique. Paris: Presses universitaires de France.
BOSERUP, E. (1987). Population and technology in preindustrial Europe. Populationand Development Review 13, 4, pp. 691-701.
BOSKER, M., E. BURINGH and J.L. van ZANDEN. (2008) From Baghdad to London. TheDynamics of Urban Growth in Europe and the Arab World. CEPR Discussion Paper6833.
BOUIS, H.E. (1994). The effect of income on demand for food in poor countries: Areour food consumption databases giving us reliable estimates?. Journal of DevelopmentEconomics 44, pp. 199-226.
BRINGAS GUTIÉRREZ, M.A. (2000). La productividad de los factores en la agriculturaespañola (1752-1935). Madrid: Banco de España.
BROADBERRY, S.N., B.M.S. CAMPBELL, A. KLEIN, M. OVERTON, and B. VAN LEUWEN(2011). British Economic Growth, 1270-1870. University of Warwick.
CABRERA, E. (1989). The Medieval Origins of the Great Landed Estates of theGuadalquivir Valley. Economic History Review 42, 4, pp. 465-483.
CARRERAS, A. (2003). Modern Spain. In J. Mokyr (ed.). The Oxford Encyclopedia ofEconomic History. New York: Oxford University Press, 5 vols. 4, pp. 546-53.
CASADO ALONSO, H. (1985). La construction à Burgos à la fin du Moyen-Age, prix etsalaires. Cahiers de la Méditerranée, pp.125-149.
CASADO ALONSO, H. (1987). Señores, Mercaderes y Campesinos. La comarca de Burgosa fines de la Edad Media. Valladolid: Junta de Castilla y León.
CASADO ALONSO, H. (1991). Producción agraria, precios y coyuntura económica en lasdiócesis de Burgos y Palencia a fines de la Edad Media. Stvdia Historica IX, pp. 67-107.
CASADO ALONSO, H. (2001). La economía en las Españas medievales (c.1000-c.1450).In F. Comín, E. Llopis, and M. Hernández (eds.) (2002). Historia Económica de España.Siglos X-XX, Barcelona: Crítica, pp. 13-50.
CASADO ALONSO, H. (2009). ¿Existió la crisis del siglo XIV? Consideraciones a partir delos datos de la contabilidad de la catedral de Burgos. In M.I. del Val Valdivieso and P.Martínez Sopeña (eds.). Castilla y el mundo feudal. Homenaje al profesor Julio Valdeón.3 vols. Valladolid: Universidad de Valladolid/Junta de Castilla y León, iii, pp. 9-25.
CHILDS, W.R. (1978). Anglo-Castilian Trade in the Later Middle Ages. Manchester:Manchester University Press.

28
CIPOLLA, C.M. (1980). Before the Industrial Revolution. European Society and Economy,1000-1700. New York: Norton. 2nd edition.
CLARK, G. (2010). The Macroeconomic Aggregates for England,1209-2008. Research inEconomic History 27: 51-140.
CLARK, G., M. HUBERMAN and P.H. LINDERT (1995). A British food puzzle, 1770-1850.Economic History Review 48, 2, pp. 215-237.
CORONAS VIDA, L.J. (1994). La economía agraria en tierras de Jaén 1500-1650.Granada: Universidad de Granada.
CRAFTS, N.F.R. (1976). English economic growth in the eighteenth century: A re-examination of Deane and Cole’ estimates. Economic History Review 29, 2, pp. 226-35.
CRAFTS, N.F.R. (1980). Income elasticities of demand and the release of labour byagriculture during the British Industrial Revolution. Journal of European EconomicHistory 9, 1, pp. 153-68.
CRAFTS, N.F.R. (1985). British Economic Growth during the Industrial Revolution.Oxford: Clarendon Press.
CRAIG, L. A. and FISHER, D. (2000). The European Macroeconomy. Growth, Integrationand Cycles, 1500-1913. Cheltenham, UK: Edward Elgar.
CUVILLIER, J. P. (1969). La population catalane au XIVe siècle. Comportements sociauxet niveaux de vis d´après les actes privés. Melanges de la Casa de Velázquez, 5, pp.159-187.
DE VRIES, J. (1984). European Urbanization, 1500-1800. Cambridge, Ms.: HarvardUniversity Press.
DE VRIES, J. (1994). The Industrial Revolution and the industrious revolution. Journal ofEconomic History 54, 2, pp. 249-270.
DE VRIES, J. (2008). The Industrious Revolution. Consumer Behavior and the HouseholdEconomy, 1650 to the Present. New York: Cambridge University Press.
DEANE, P. AND COLE, W.A. (1967). British Economic Growth, 1688-1959. 2nd ed.Cambridge: Cambridge University Press.
DOMÍNGUEZ MARTÍN, R. (1994). La mercantilización de factores en la agriculturaespañola, 1860-1880: un intento de estimación de los contrastes regionales. Revista deHistoria Económica 12, 1, pp. 85-109.
DOÑATE SEBASTIÁ, J. M. (1969). Datos negativos, referidos a la Plana de Castellón, enrelación con la peste negra de 1348. In La corona de Aragón en el siglo XIV, 1, pp. 27-44.
29
DRELICHMAN, M. (2005). The curse of Moctezuma: American silver and the DutchDisease. Explorations in Economic History 42, pp. 349-80.
DURAN i PUJOL, M. (1985). L’evolució de l’ingrés senyorial a Catalunya (1500-1799).Recerques 17, pp. 7-42.
ELLIOTT, J.H. (1961). The decline of Spain. Past and Present 20, pp. 52-75.
FEDERICO, G. and MALANIMA, P. (2004). Progress, decline, growth: product andproductivity in Italian agriculture, 1000-2000. Economic History Review 57, 3, pp. 437-64.
FELIU, G. (1991). Precios y salarios en la Cataluña moderna. Madrid: Banco de España.2 vols.
FELIU, G. (2004). Aproximació a un índex del cost de la vida a Barcelona, 1501-1807. InJosep Fontana. Història i projecte social. Barcelona: Crítica, 1, pp. 151-170.
FENOALTEA, S. (2005). The growth of the Italian economy, 1861-1913: Preliminarysecond-generation estimates. European Review of Economic History 9, 3, 273-312.
FLORA, P. (1981). Historical Process of Social Mobilization: Urbanization and Literacy,1850-1965. In S. N. Eisenstadt and S. Rokker (eds). Building State and Nation, pp. 213-258.
FLYNN, D.O. (1982). Fiscal Crisis and the Decline of Spain (Castile). Journal of EconomicHistory 42, 1, pp. 139-147.
FORSYTH, P. J. and NICHOLAS, S. J. (1983). The decline of Spanish industry and theprice revolution: a neoclassical analysis. Journal of European Economic History 12, 3,pp. 601-10.
GARCÍA SANZ, A. (1981). Jornales agrícolas y presupuesto familiar campesino enEspaña a mediados del siglo XIX. Anales del CUNEF (1979-80), pp. 49-71.
GARCÍA SANZ, A. (1986). Desarrollo y crisis del Antiguo Régimen en Castilla la Vieja.Economía y sociedad en tierras de Segovia, 1500-1814. Madrid: Akal.
GARCÍA SANZ, A. (1991). Población e industrial textil en una ciudad de Castilla: Segovia1530-1750. In J. Nadal Oller (ed). La evolución demográfica bajo los Austrias. Alicante:Instituto de Cultura Juan Gil-Albert, pp. 153-168.
GARCÍA SANZ, A. and J. SANZ (1988). Agricultura y ganadería. In M. Artola (ed.),Enciclopedia de Historia de España 1. Economía y sociedad, pp. 11-104.
GARRABOU, R. and J. SANZ (1985). "La agricultura española durante el siglo XIX:¿inmovilismo o cambio?", in R. Garrabou and J. Sanz (eds.) Historia agraria de laEspaña contemporánea. Vol. II. Expansión y crisis (1850-1900). Barcelona: Crítica, pp.7-191.

30
GLICK T.F. (1979). Islamic and Christian Spain in the early Middle Ages. Princeton:Princeton University Press.
GUTIÉRREZ ALONSO, A. (1989). Estudio sobre la decadencia de Castilla. La ciudad deValladolid en el siglo XVII. Valladolid: Universidad de Valladolid.
HAMILTON, E. J. (1934). American Treasure and the Price Revolution in Spain, 1501-1650. Cambridge, MA: Harvard University Press.
HAMILTON, E. J. (1936). Money, Prices and Wages in Valencia, aragon and Navarre:1351-1500. Cambridge, MA: Harvard University Press.
HAMILTON, E.J. (1938). The decline of Spain. Economic History Review 8, 2, pp. 168-179.
HAMILTON, E.J. (1947), War and Prices, 1651-1800. Cambridge, MA: HarvardUniversity Press.
HOFFMAN, P. T., JACKS, D. S., LEVIN, P. A., and LINDERT, P. H. (2002). Real inequality inEurope since 1500. Journal of Economic History 62, 2, pp. 322-55.
IRADIEL MURUGARREN, P. (1974). Evolución de la industria textil castellana en lossiglos XIII-XVI. Salamanca: Universidad de Salamanca.
IRADIEL, P., S. MORETA, S., and E. SARASA (1989). Historia medieval de la Españacristiana. Madrid: Cátedra.
ISRAEL, J.I. (1981). The decline of Spain: A historical myth? Past and Present 91, pp.170-180.
IZQUIERDO BENITO, R. (1983). Precios y salarios en Toledo durante el siglo XV (1400-1475). Toledo: Caja de Ahorro Provincial de Toledo.
JACKSON, R.V. (1985). Growth and deceleration in English agriculture, 1660-1790.Economic History Review 38, 3, pp. 333-51.
KAMEN, H. (1978). The decline of Spain: A historical myth? Past and Present 81, pp. 24-50
KANEDA, H. (1968). Long-term changes in food consumption patterns in Japan, 1878-1964. Food Research Institute Studies 8, 1, pp. 3-32.
KUZNETS, S. (1966). Modern Economic Growth : Rate, Structure, and Spread. NewHaven: Yale University Press.
LADERO QUESADA, M. A. (1981). Población, economía y sociedad, in Historia Generalde España y América, vol. 5, Madrid: Rialp, pp. 3-105.
LEWIS, W.A. (1955). Theory of Economic Growth. London: George Allen and Unwin.

31
LLOPIS AGELAN, E. and GONZÁLEZ MARISCAL, M. (2006). La tasa de urbanización enEspaña a finales del siglo XVIII: el problema de las agrociudades. AEHE Documentos deTrabajo 0602.
LLOPIS AGELÁN, E., JEREZ, M., ÁLVARO, A., AND FERNÁNDEZ, E. (2000). Índices deprecios de la zona noroccidental de Castilla y León, 1518-1650. Revista de HistoriaEconómica 18, 3, pp. 665-84.
LÓPEZ-SALAZAR, J. (1986). Estructuras agrarias y sociedad rural en la Mancha (siglosXVI-XVII). Ciudad Real: Instituto de Estudios Manchegos.
LLUCH, C. (1969). C. Elasticidades de Engel y de precios para los grandes categorías debienes de consumo en España, Moneda y Crédito 108, pp. 47-94.
LLUCH, C., POWELL, A.A., and WILLIAMS, R.A. (1977). Patterns in Household Demandand Saving. New York: Oxford University Press for the World Bank.
MACKAY, A. (1977). Spain in the Middle Ages. From Frontier to Empire, 1000-1500.Houndsmill, Basingstoke: Palgrave Macmillan.
MACKAY, A. (1981). Money, Prices and Politics in Fifteenth-century Castile. London:Royal Historical Society.
MADDISON, A. (1995). Monitoring the World Economy, 1820-1992. Paris: OECDDevelopment Centre.
MADDISON, A. (2006). The World Economy. Paris: OECD Development Centre.
MADDISON, A. (2010). Statistics on World Population, GDP and Per Capita GDP, 1-2008AD, last update: March 2010, horizontal file http://www.ggdc.net/maddison/
MALANIMA, P. (1998). Italian cities, 1300-1800. A quantitative approach. Rivista diStoria Economica, 14, 2, pp. 91-126.
MALANIMA, P. (2007). Wages, productivity and working time in Italy (1270-1913).Journal of European Economic History 36, 1, pp. 127-171
MALANIMA, P. (2011). The long decline of a leading economy: GDP in central andnorthern Italy, 1300–1913. European Review of Economic History
MALUQUER DE MOTES, J. (2005): “Consumo y precios”. In A. Carreras and X. Tafunell(eds.) Estadísticas históricas de España. Siglos XIX y XX. Bilbao: Fundación BBVA, vol. III,pp. 1247-1296.
MONTEANO, P. J. (2001). La Peste Negra en Navarra. La catástrofe demográfica de1347-1349. Príncipe de Viana, 62, 222, pp. 87-120.
MORAL RUIZ, J. del (1979). La agricultura española a mediados del s. XIX (1850-1870).Madrid: Ministerio de Agricultura

32
MORENO LÁZARO, J. (2002). ¿Fomentó el capitalismo agrario la desigualdad? Salarios yniveles de vida en Castilla la Vieja, 1751-1861. In J.M. Martínez Carrión (ed). El nivel devida en la España rural, siglos XVIII-XX. Alicante: Universidad de Alicante, pp. 75-112.
NADER, H. (1977). Noble income in sixteenth-century Castile: The case of theMarquises of Mondejar, 1480-1580. Economic History Review 30, 3, pp. 411-28.
NAKAMURA, J. (1965). Growth of Japanese agriculture, 1875-1920. In W.W. Lockwood(ed). The State and Economic Enterprise in Japan. Essays in the Political Economy ofGrowth. Princeton: Princeton University Press.
NIETO SÁNCHEZ, J.A. (2006). Artesanos y mercaderes. Una historia social y económicade Madrid 1450-1850. Madrid: Fundamentos.
OVERTON, M. (1996). Re-establishing the agricultural revolution. AgriculturalHistory Review 44, I, pp. 1-20.
PAMUK, S. (2007). The Black Death and the Origins of the 'Great Divergence' acrossEurope, 1300-1600. European Review of Economic History 11, 3: 289-317.
PÉREZ MOREDA, (1988). La población española. In M. Artola (ed.), Enciclopedia deHistoria de España 1. Economía y sociedad, pp. 345-431
PÉREZ MOREDA, V. AND REHER, D.S. (2003). Hacia una definición de la demografíaurbana: España en 1787. Revista de Demografía Histórica 21, 1, pp. 113-40
PFISTER, U. (2011). German Economic Growth, 1500-1850. Historisches Seminar,Westfälische Wilhelms-Universität Münster.
PLADEVALL, A. (1962). La disminució de poblament a la Plana de Vich a mitjans delsegle XIV, in VI Asamblea d´Estudis Comarcals, Vich, pp. 23-35.
PONSOT, P. (1986). Atlas de Historia Económica de la Baja Andalucía (Siglos XVI-XIX).Sevilla: Editoriales Andaluzas Unidas.
PRADOS DE LA ESCOSURA, L. (1982). Comercio exterior y cambio económico en España(1792-1849). In Anes, G., Artola, M., Fontana, J., and Tedde, P. (eds.), La economíaespañola al final del Antiguo Régimen. 4 vols. Madrid: Alianza, iii, pp. 171-249.
PRADOS DE LA ESCOSURA, L. (1984). El comercio hispano-británico en los siglos XVIII yXIX. I. Reconstrucción. Revista de Historia Económica 2, 2, pp. 113-162.
PRADOS DE LA ESCOSURA, L. (1988). De Imperio a nación. Crecimiento y atrasoeconómico en España (1780-1930). Madrid: Alianza.
PRADOS DE LA ESCOSURA, L. (1989). La estimación indirecta de la producción agrariaen el siglo XIX: réplica a Simpson. Revista de Historia Económica 7, 3, pp. 703-718.
PRADOS DE LA ESCOSURA, L. (1993). La pérdida del imperio y sus consecuenciaseconómicas. In L. Prados de la Escosura and S. Amaral (eds.), La independenciaamericana: consecuencias económicas. Madrid: Alianza, pp. 253-300.

33
PRADOS DE LA ESCOSURA, L. (2000). International comparisons of real output, 1820-1990: An Alternative Data Set. Explorations in Economic History 37, 1, pp. 1-41.
PRADOS DE LA ESCOSURA, L. (2003). El progreso económico de España, 1850-2000,Bilbao: Fundación BBVA.
PRADOS DE LA ESCOSURA, L. (2007). Growth and Structural Change in Spain, 1850-2000: A European Perspective. Revista de Historia Económica / Journal of Iberian andLatin American Economic History 25, 1, pp. 147-181.
PRADOS DE LA ESCOSURA, L. and ROSÉS, J.R. (2009). The Sources of Long-run Growthin Spain, 1850-2000”. Journal of Economic History 69, 4, pp. 1063-1091.
REHER, D. S. (1990). Town and Country in Pre-industrial Spain. Cambridge: CambridgeUniversity Press.
REHER, D. S. (1991). Dinámicas demográficas en Castilla la Nueva, 1550-1900: unensayo de reconstrucción. In J. Nadal Oller (ed). La evolución demográfica bajo losAustrias. Alicante: Instituto de Cultura Juan Gil-Albert, pp. 17-75.
REHER, D. S. and BALLESTEROS, E. (1993). Precios y salarios en Castilla la Nueva: laconstrucción de un índice de salarios reales, 1501-1991. Revista de Historia Económica11, 1, pp. 10151.
REIS, J. (2005). Economic growth, human capital formation and consumption inWestern Europe before 1800. In R.C. Allen, T. Bengtsson, and M. Dribe (eds). LivingStandards in the Past. New Perspectives on Well-being in Asia and Europe. Oxford:Oxford University Press, pp. 195-225.
RINGROSE, D. R. (1983). Madrid and the Spanish Economy, 1560-1850. Berkeley:University of California Press.
RODRÍGUEZ MOLINA, J. (1978). El Reino de Jaén en la Baja Edad Media: aspectosdemográficos y económicos. Granada: Universidad, Secretariado de Publicaciones.
ROMANO, R. (1957). Documenti e prime considerazioni intorno alla 'Balance duCommerce' della Francia dal 1716 al 1780. In Studi in Onore di Armando Sapori. 2 vols.Milano, i, pp. 1265-1300.
RUBIO VELA, A. (1987). Crisis agrarias y carestías en las primeras décadas del siglo XIV.El caso de Valencia, Saitabi, 37, pp. 131-147.RUIZ MARTÍN, F. (1970). La Banca en España hasta 1782. In El Banco de España: UnaHistoria Económica. Madrid: Banco de España, pp. 1-196.
ROSÉS, J.R., K.H. O'ROURKE, and J.G. WILLIAMSON (2007). Globalization, Growth andDistribution in Spain, 1501-1913. National Bureau of Economic Research WorkingPaper 13055.

34
SANTAMARÍA ARÁNDEZ, A. (1969). La peste negra en Mallorca, en La corona de Aragónen el siglo XIV, 1, pp. 65-70.
SANTOLAYA HEREDERO, L. (1991). Una ciudad del Antiguo Régimen: Toledo en el sigloXVIII. Madrid: Universidad Nacional de Educación a Distancia.
SANZ FUENTES, M. J. (1987). El ordenamiento de precios y salarios otorgado por PedroI en 1351. Cuaderno de la villa de Écija. Estudio y edición, en Homenaje al profesorJuan Torres Fontes, II, Murcia, pp. 1563-1574.
SCHÖN, L. and O. KRANTZ (2011). The Swedish economy 1571-1850 – growth orstagnation? Constructing Historical National Accounts. Lund University,
SEBASTIÁN AMARILLA, J. A. (1990). La renta de la tierra en León durante la EdadModerna. Primeros resultados y algunas reflexiones a partir de fuentes monásticas.Revista de Historia Económica 8, 1, pp. 53-80.
SIMPSON, J. (1989). La producción agraria y el consumo español en el siglo XIX. Revistade Historia Económica 7, 2, pp. 355-88.
SIMPSON, J. (1992). Technical change, labour absorption and living standards in ruralAndalucía 1886-1936. Agricultural History 66, 3, pp. 1-24.
SIMPSON, J. (1995). Spanish Agriculture: The long siesta (1765-1965). Cambridge:Cambridge University Press.
SOBREQUÉS CALLICÓ, J. (1970-71). La peste negra en la Península Ibérica. Anuario deEstudios medievales, 7, pp. 67-102
TEMIN, P. (2006). The economy of the early Roman empire. Journal of EconomicPerspectives 20, 1, pp. 133-51.
TOUTAIN, J.C. (1997). Le produit intérieur de la France de 1789 à 1994. Economies etSociétés, XXXI. Série AF Histoire quantitative de l'Economie francaise (Cahiers del'ISMEA).
VACA LORENZO, A. (1983). Una manifestación de la crisis castellana del siglo XIV: lacaída de las rentas de los señores feudales. El testimonio del monasterio de Sahagún,Studia Historica. Historia medieval, 1, pp. 157-166.
VACA LORENZO, A. (2001-2002). La peste negra en Castilla: la primera et grandepestilencia que es llamada mortandad grande, Fundación, 4, pp. 19-49.
VALDEÓN BARUQUE, J. (1966). Enrique II de Castilla: la guerra civil y la consolidacióndel régimen (1366-1371). Valladolid: Universidad de Valladolid.

35
VALDEÓN BARUQUE, J. (1969). Aspectos de la crisis castellana en la primera mitad delsiglo XIV. Hispania, 29, 111, pp. 5-24.
VAN ZANDEN, J. L. (1999). Wages and the standard of living in Europe, 1500-1800.European Review of Economic History 3, 2, pp. 175-98.
VAN ZANDEN, J. L. (2001). Early modern economic growth. A survey of the Europeaneconomy, 1500-1800. In M. Prak (ed). Early Modern Capitalism, Economic and SocialChange in Europe 1400-1800. London: Routledge, pp. 69-87.
VAN ZANDEN, J. L. (2005a). Cobb-Douglas in pre-modern Europe. Simulating earlymodern growth. International Institute for Social History Working Paper IISH.
VAN ZANDEN, J. L. (2005b). Una estimación del crecimiento económico en la EdadModerna. Investigaciones de Historia Económica 2, pp. 9-38.
VAN ZANDEN, J. L. and B. VAN LEEUWEN (2011). The character of growth before‘modern economic growth’? The GDP of Holland between 1347 and 1807. CGEHWorking Paper Series no. 4 http://www.cgeh.nl/working-paper-series/
VERLINDEN, Ch. (1938). La grande peste de 1348 en Espagne. Contribution a l´étudede sus conséquences économiques et sociales. Revue Belge de Philologie et d´HistoireXVII, 1/2, pp. 103-146
VILAR, P. (1962). La Catalogne dans l'Espagne moderne. Recherches sur lesfondements économiques des structures nationales. 3 vols. Paris: SEVPEN.
VILAR, P. (1970). Estructures de la societat espanyola cap al 1750. Recerques 1, pp. 9-32.
VOTH, H.J. (1998). Time and work in eighteenth-century London. Journal of EconomicHistory 58, 1, pp. 29-58.
WARD, M. and J. DEVEREUX (2006). New Perspectives on International Standards ofLiving in the Late 19th Century. XIV International Economic History Congress, Helsinki,Session 41
WRIGLEY, E. A. (1985). Urban growth and agricultural change: England and theContinent in the Early Modern Period. Journal of Interdisciplinary History 10, 4, pp.683-728.
YUN-CASALILLA, B. (1987). Sobre la transición al capitalismo en Castilla. Economía ysociedad en Tierra de Campos (1500-1830). Valladolid: Junta de Castilla y León.
YUN-CASALILLA, B. (1994). Proposals to quantify long-term performance in theKingdom of Castile, 1550-1800. In A. Maddison and H. van der Wee (eds.), EconomicGrowth and Structural Change. Comparative Approaches over the Long Run. Milan:Università Bocconi, pp. 97-110. (Updated version).

36
YUN-CASALILLA, B. (2004). Marte contra Minerva. El precio del Imperio Español, c.1450-1600. Barcelona: Crítica.
ZULAICA PALACIOS, F. (1994). Fluctuaciones económicas en un período de crisis. Preciosy salarios en Aragón en la Baja Edad Media. Zaragoza: Institución Fernando El Católico.

37
Appendix 1: Data sources and procedures for output estimates
All prices, wage rates, and land rents used are quoted in silver. Original regional
series have been converted into grams of silver with the silver content of coins from
Casado Alonso (1991), MacKay (1981), Hamilton (1934, 1936, 1947) and Felíu (1991).
Unweighted Divisia indices were derived for agricultural and industrial goods
and the CPI, land rent and wage rates for the Kingdoms of Castile and Aragon.
Aggregate indices for Spain were obtained by assigning weights of two-thirds and one-
third to the price indices of the Kingdoms of Castile and Aragon, respectively, as a
crude way to capture their relative size in terms of population.
The index for agricultural prices was constructed on the basis of local indices
built with original data from the following sources: for the pre-1500 era, Lérida, 1361-
1500, Argilés (1998); Aragon, 1276-1429, Zulaica (1994), and 1429-1497, Hamilton
(1936); Valencia, 1413-1501, Allen (2001); Toledo, 1401-1475, Izquierdo (1983); and
Burgos, 1352-1501, Casado Alonso (1985, 1991, 2009) and MacKay (1981). For the
period 1501-1800 price indices were constructed from the following sources: Felíu
(1991), for Catalonia; Hamilton (1934, 1947), for New Castile, Andalusia, and Valencia;
Llopis et al. (2000) and Moreno (2002), for Old Castile. Lastly, for the years 1800-1850,
Bringas (2000) index for Spain has been used.
An index of manufacturing prices for 1276-1500 was constructed on the basis
of those we previously built on the basis of original data for Aragon, 1276-1429, Zulaica
(1994) and 1429-1500, Hamilton (1936); Toledo, 1401-1475, Izquierdo (1983); Burgos,
1390-1500, MacKay (1981) and Casado Alonso (1985, 1991). For the period 1501-1860,
we used the aggregate manufacturing price index in Rosés, O’Rourke and Williamson
(2007) kindly supplied by Joan Rosés.
A CPI for 1276-1501 was constructed as weighted average of agricultural (0.75)
and industrial (0.25) Divisia price indices, except for Valencia, taken from Allen (2001).
For 1501-1860, a Divisia index was derived from regional CPIs: Catalonia, 1501-1807,
Felíu (1991), and 1830-1860, Maluquer de Motes (2005); Valencia, 1501-1785, Allen
(2001); New Castile, Reher and Ballesteros (1993); Old Castile, 1518-1650, Llopis et al.
(2001), and 1751-1860, Moreno (2002).
Divisia indices for nominal wage rates were computed from the following
sources: Aragon, 1277-1423, Zulaica (1994), and 1423-1497, Hamilton (1936); Lérida,

38
1361-1500, Argilés (1998); Valencia, 1413-1500, Allen (2001); Toledo, 1401-1475,
Izquierdo (1983); Burgos, 1390-1500, Casado Alonso (1985, 1991) and MacKay (1981).
For 1501-1860, the sources used were: Catalonia, Felíu (2004) and Maluquer de Motes
(2005); New Castile, Reher and Ballesteros (1993); Old Castile, Moreno (2002);
Valencia Allen (2001).
Unweighted Divisia indices for land rents were built from data in the following
sources: Aragon, 1318-1416, Zulaica (1994); Burgos, 1320-1520, Casado Alonso (1987,
2009); Andalusia, western, 1504-1845, Ponsot (1986), and Jaen, 1520-1672, Corona
(1994); Old Castile, Leon, 1569-1835, Sebastián Amarilla (1990); Segovia, 1651-1690,
1780-1817, García Sanz (1986); Avila, 1790-1841, Llopis (personal communication);
Zamora, 1683-1840, Álvarez Vázquez (1987); Catalonia, Gerona, 1520-1800, Duran
(1985).
Urbanization rates: Spanish urban population, adjusted to exclude population
living on agriculture, at benchmark years over 1530-1857, from Álvarez-Nogal and
Prados de la Escosura (2007), was projected backwards to 1420, 1300, and 1000 with
an estimate of urban population on the basis of the data base in Bairoch et al. (1988:
15-21), corrected for 1000 and 1300 with estimates by Glick (1979) and Bosker et al
(2008), respectively. Population estimates are taken from Pérez Moreda (1988) and
Álvarez-Nogal and Prados de la Escosura (2007). Annual ‘adjusted’ urbanization rates,
namely, the ratio of adjusted urban population to total population were, then, derived
by dividing the results from log-linear interpolation of urbanization and total
population benchmark estimates.
Appendix 2: Alternative price levels for 1850
The comparison of countries’ implicit price levels for 1850 derived from the
alternative estimates (Maddison’s 1990$ and current price estimates at US relative
prices Prados de la Escosura (2000)) is very revealing and lends support to the latter’s
estimates.
The price level [PPP/ER] -that is, the PPP exchange rate (PPP) divided by the
trading exchange rate (ER)- can be easily derived as the ratio between nominal income
per head (NY), that is, per capita income in domestic currency (DY) converted into a
common currency with the trading exchange rate (ER), [NY=DY/ER], and purchasing

39
power parity or ‘real’ per capita income (RY), namely, domestic currency income
converted into a common currency with the purchasing power parity exchange rate
(PPP), [RY=DY/PPP].
In a Balassa-Samuelson framework one should expect that the price level would
go along the level of development for similarly open economies, so the inference
would be that countries of similar development should have PPP exchange rates close
to their trading exchange rates, so their price levels would be similar. Meanwhile, for
less development countries their PPP would be lower than the ER and, hence, their
price level.
The results, obtained from data in Maddison (2010) and Prados de la Escosura
(2000), indicate that, relative to the UK (=100), the price level for Spain would have
been 109 according to Maddison estimates, and only of 79 with Prados de la Escosura
(PPP-adjusted current price estimates. A similar comparison throws levels of 99 and 75
for Italy (in 1860), and 78 and 65 for Sweden, respectively. It is our view that the
implicit price level in Maddison estimates is too high and, hence, unrealistic for Spain
and Italy. Conversely, in the case of the Netherlands, Maddison implicit price level is 60
while in the current price estimate reaches 77. It seems hard to accept that the price
level was so low in the Netherlands compared to Britain when these economies were
open and not far apart from each other in structural terms.
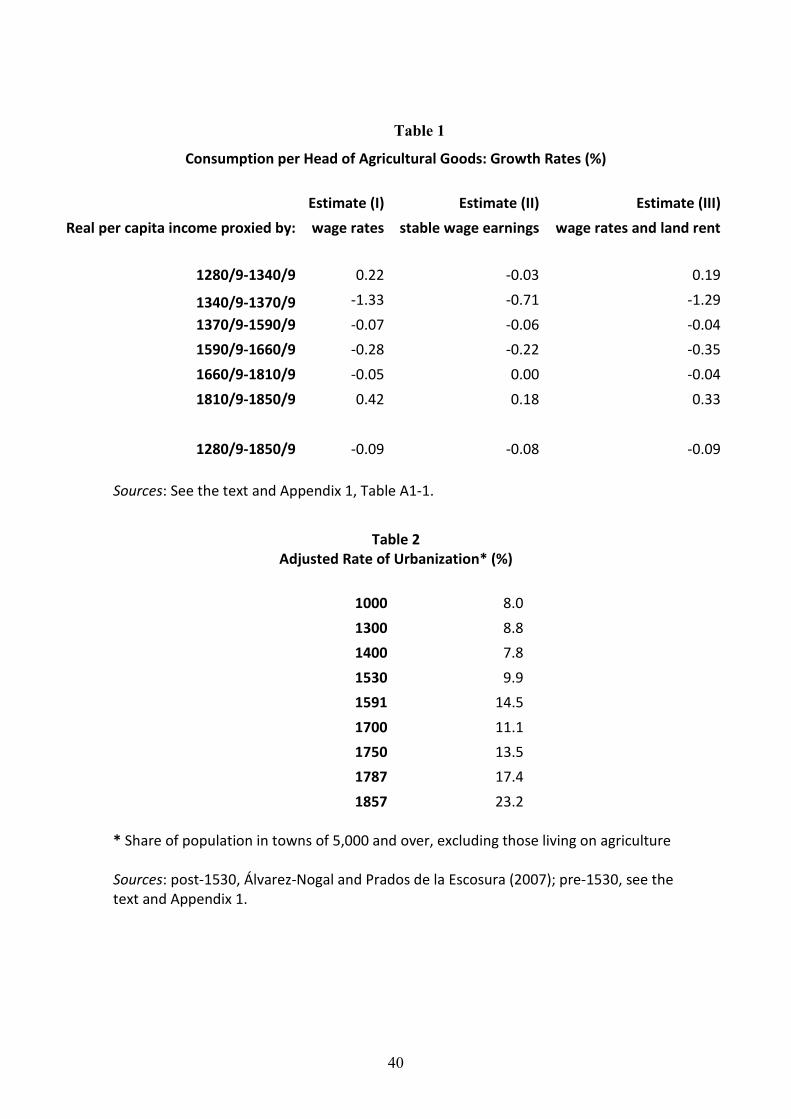
40
Table 1
Consumption per Head of Agricultural Goods: Growth Rates (%)
Estimate (I) Estimate (II) Estimate (III)
Real per capita income proxied by: wage rates stable wage earnings wage rates and land rent
1280/9-1340/9 0.22 -0.03 0.19
1340/9-1370/9 -1.33 -0.71 -1.29
1370/9-1590/9 -0.07 -0.06 -0.04
1590/9-1660/9 -0.28 -0.22 -0.35
1660/9-1810/9 -0.05 0.00 -0.04
1810/9-1850/9 0.42 0.18 0.33
1280/9-1850/9 -0.09 -0.08 -0.09
Sources: See the text and Appendix 1, Table A1-1.
Table 2Adjusted Rate of Urbanization* (%)
1000 8.0
1300 8.8
1400 7.8
1530 9.9
1591 14.5
1700 11.1
1750 13.5
1787 17.4
1857 23.2
* Share of population in towns of 5,000 and over, excluding those living on agriculture
Sources: post-1530, Álvarez-Nogal and Prados de la Escosura (2007); pre-1530, see thetext and Appendix 1.

41
Table 3Real Output per Head Growth (%)
Ag: Estimate I Ag: Estimate II Ag: Estimate III1280/9-1340/9 0.12 -0.02 0.111340/9-1370/9 -0.79 -0.48 -0.771370/9-1590/9 0.08 0.09 0.091590/9-1660/9 -0.27 -0.23 -0.311660/9-1810/9 0.13 0.16 0.131810/9-1850/9 0.44 0.31 0.39
1280/9-1850/9 0.03 0.04 0.03
Sources: See the text and Appendix 1, Table A1-2.
Table 4Output per Head in Western Europe (U.K. in 1850 = 100)
Panel A. Relative Per Capita GDP in 1850 at current US relative prices (PPP) (UK=100)UK Netherlands Germany France Italy Spain Sweden
1300 25 72 511348 26 22 67 541400 38 31 52 78 481500 39 37 49 50 68 501570 39 37 64 54 351600 37 68 34 50 60 531650 34 69 62 411700 55 54 40 54 65 481750 61 60 45 55 68 461800 75 67 42 56 60 54 411850 100 79 61 78 66 64 52
Panel B. Relative Per Capita GDP in 1850 at 1990 international prices (PPP) (UK=100)UK Netherlands Germany France Italy Spain Sweden
1300 25 66 371348 26 29 62 391400 38 39 46 72 351500 39 48 49 44 63 361570 39 47 60 39 291600 37 88 35 44 56 381650 34 89 57 291700 55 69 40 47 60 351750 61 78 45 48 63 341800 75 86 42 49 56 39 341850 100 102 61 69 61 46 44

42
Sources: Relative per capita GDP levels to the U.K. in 1850, at current US relative prices(Panel A) from Prados de la Escosura (2000), and at 1990 Geary-Khamis internationaldollars (Panel B), from Maddison (2010). In Panel A Italy’s relative level in 1850 wasassumed to be that of 1860. In Panel B, Italy’s level in 1850 was obtained by projectingMaddison (2010) estimates for 1913 with Malanima (2011) real output per head series.1850 levels were projected backwards with national real output series. For Spain, seethe text; for Italy, Malanima (2011), assuming that Italy as a whole evolved as theNorth and Central regions; for Germany, Pfister (2011). For Holland and theNetherlands, van Zanden and van Leeuwen (2011), and for England and Britain, andSweden, Broadberry et al. (2011). We assumed that Netherlands evolved as Hollandover 1400-1800 and the U.K.’s moved along Britain’s over 1700-1850 and, then,England’s, over 1300-1700. For France we carried out our own estimate on the basis ofAllen (2000) data on population, agricultural output, and urbanization for 1400-1800,Bairoch (1988), for urbanization in 1850, and Toutain (1997) for agricultural outputestimates, 1790-1850 and sector shares in GDP in 1850.

43
Figure 1 The Reconquest: Main PhasesSources: MacKay (1977)
4.0
4.2
4.4
4.6
4.8
5.0
5.2
5.4
5.6
5.8
6.0
1275
1290
1305
1320
1335
1350
1365
1380
1395
1410
1425
1440
1455
1470
1485
1500
1515
1530
1545
1560
1575
1590
1605
1620
1635
1650
1665
1680
1695
1710
1725
1740
1755
1770
1785
1800
1815
1830
1845
Figure 2 Real Wage Rates, 1277-1850 (1790/99 = 100) (logs)Sources: See Appendix
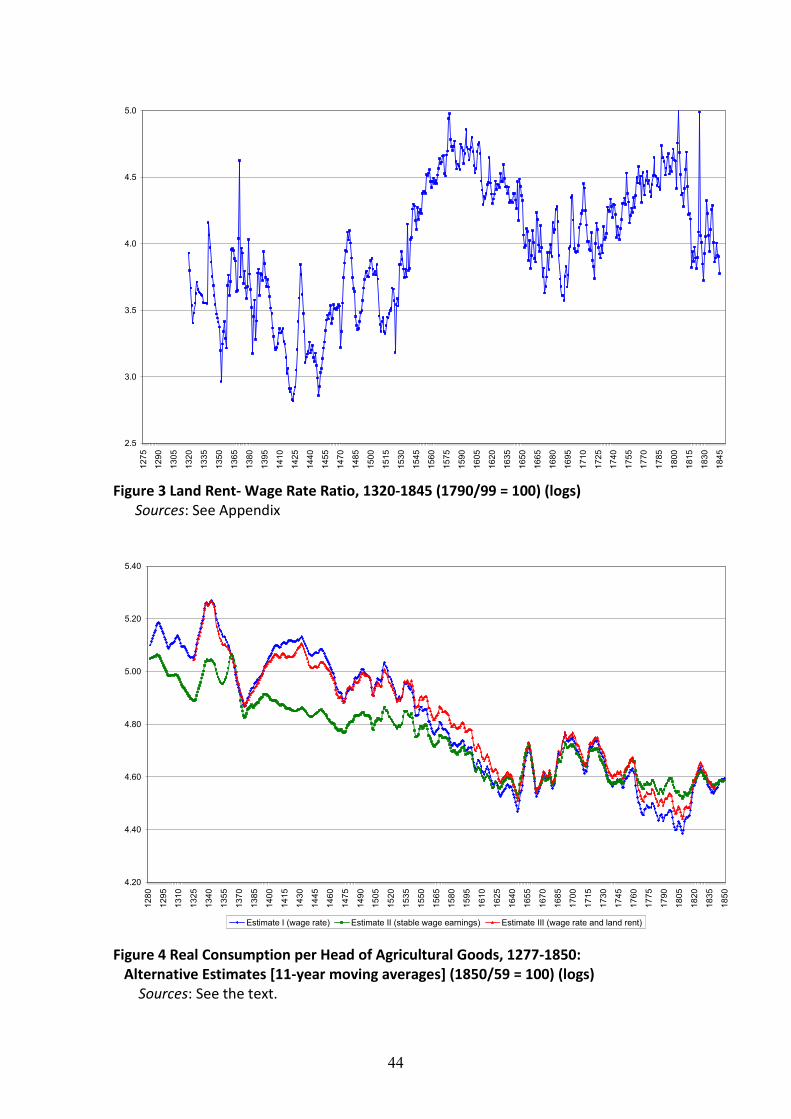
44
2.5
3.0
3.5
4.0
4.5
5.0
1275
1290
1305
1320
1335
1350
1365
1380
1395
1410
1425
1440
1455
1470
1485
1500
1515
1530
1545
1560
1575
1590
1605
1620
1635
1650
1665
1680
1695
1710
1725
1740
1755
1770
1785
1800
1815
1830
1845
Figure 3 Land Rent- Wage Rate Ratio, 1320-1845 (1790/99 = 100) (logs)Sources: See Appendix
4.20
4.40
4.60
4.80
5.00
5.20
5.40
1280
1295
1310
1325
1340
1355
1370
1385
1400
1415
1430
1445
1460
1475
1490
1505
1520
1535
1550
1565
1580
1595
1610
1625
1640
1655
1670
1685
1700
1715
1730
1745
1760
1775
1790
1805
1820
1835
1850
Estimate I (wage rate) Estimate II (stable wage earnings) Estimate III (wage rate and land rent)
Figure 4 Real Consumption per Head of Agricultural Goods, 1277-1850:Alternative Estimates [11-year moving averages] (1850/59 = 100) (logs)
Sources: See the text.

45
3.5
4
4.5
5
5.5
6
6.5
1275
1290
1305
1320
1335
1350
1365
1380
1395
1410
1425
1440
1455
1470
1485
1500
1515
1530
1545
1560
1575
1590
1605
1620
1635
1650
1665
1680
1695
1710
1725
1740
1755
1770
1785
1800
1815
1830
1845
Figure 5 Ratio Industrial to Agricultural Prices, 1277-1850 (logs)Sources: See the text
0.35
0.4
0.45
0.5
0.55
0.6
0.65
0.7
1275
1290
1305
1320
1335
1350
1365
1380
1395
1410
1425
1440
1455
1470
1485
1500
1515
1530
1545
1560
1575
1590
1605
1620
1635
1650
1665
1680
1695
1710
1725
1740
1755
1770
1785
1800
1815
1830
1845
Figure 6 Share of Agriculture in GDP, 1277-1850 (current prices) (%)Sources: See Appendix

46
4.1
4.2
4.3
4.4
4.5
4.6
4.7
128012951310132513401355137013851400141514301445146014751490150515201535155015651580159516101625164016551670168517001715173017451760177517901805182018351850
Figure 7 Real Output per Head 1280-1850 [11-year moving averages](1850/59 = 100)(logs)
Sources: See the text
3
3.2
3.4
3.6
3.8
4
4.2
4.4
4.6
4.8
128012951310132513401355137013851400141514301445146014751490150515201535155015651580159516101625164016551670168517001715173017451760177517901805182018351850
Figure 8 Inequality (Williamson Index), 1277-1850 [11-year moving averages](1850/59 = 100) (logs)
Sources: See the text

47
4.2
4.3
4.4
4.5
4.6
4.7
4.8
4.9
5
1280
1295
1310
1325
1340
1355
1370
1385
1400
1415
1430
1445
1460
1475
1490
1505
1520
1535
1550
1565
1580
1595
1610
1625
1640
1655
1670
1685
1700
1715
1730
1745
1760
1775
1790
1805
1820
1835
1850
Spain Italy
Figure 9 Real Output per Head in Spain and Italy 1280-1850 (1850/59 = 100)(11-year moving averages) (logs)
Sources: See the text

48
Appendix 1 Table A1-1
Consumption per Head of Agricultural Goods: Alternative Estimates(decadal averages) (1850/59 = 100)
Estimate I Estimate II Estimate IIIper capita income proxied by wage rate stable wage earnings wage rate and land rent
1280/9 170 157 1721290/9 173 153 1751300/9 166 147 1681310/9 164 140 1651320/9 156 133 1551330/9 182 148 1811340/9 194 154 1921350/9 169 141 1641360/9 152 158 1531370/9 130 124 1311380/9 141 130 1391390/9 150 136 1501400/9 163 133 1581410/9 165 130 1581420/9 166 127 1571430/9 166 128 1611440/9 159 126 1511450/9 158 127 1531460/9 144 121 1411470/9 132 118 1321480/9 144 125 1421490/9 147 126 1461500/9 140 122 1391510/9 151 128 1471520/9 137 121 1351530/9 142 128 1431540/9 125 115 1291550/9 130 122 1361560/9 118 113 1251570/9 119 116 1271580/9 113 109 1201590/9 111 109 1191600/9 103 102 1101610/9 103 100 1081620/9 97 97 1021630/9 96 99 1011640/9 88 93 921650/9 110 113 1121660/9 91 93 93

49
1670/9 100 99 1001680/9 105 104 1071690/9 114 111 1151700/9 112 110 1141710/9 105 106 1071720/9 114 110 1151730/9 99 98 1021740/9 99 98 1021750/9 100 104 1041760/9 91 98 951770/9 90 98 941780/9 85 94 901790/9 88 99 931800/9 83 93 881810/9 85 93 871820/9 102 101 1031830/9 95 97 971840/9 97 98 981850/9 100 100 100
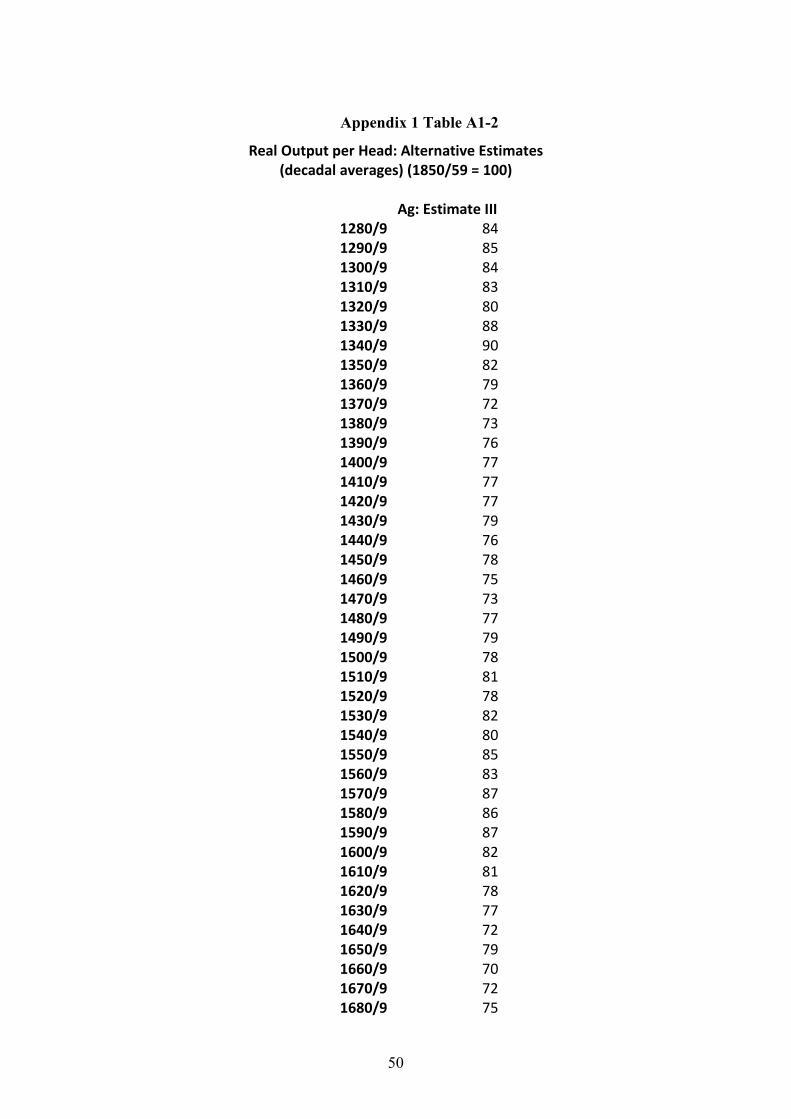
50
Appendix 1 Table A1-2
Real Output per Head: Alternative Estimates(decadal averages) (1850/59 = 100)
Ag: Estimate III1280/9 841290/9 851300/9 841310/9 831320/9 801330/9 881340/9 901350/9 821360/9 791370/9 721380/9 731390/9 761400/9 771410/9 771420/9 771430/9 791440/9 761450/9 781460/9 751470/9 731480/9 771490/9 791500/9 781510/9 811520/9 781530/9 821540/9 801550/9 851560/9 831570/9 871580/9 861590/9 871600/9 821610/9 811620/9 781630/9 771640/9 721650/9 791660/9 701670/9 721680/9 75

51
1690/9 771700/9 771710/9 761720/9 801730/9 761740/9 771750/9 801760/9 791770/9 811780/9 811790/9 851800/9 841810/9 861820/9 951830/9 941840/9 971850/9 100
Copyright © 2022 FDOKUMEN