The Response-Signal Method Reveals Age-Related Changes in Object Working Memory
27
The Response-Signal Method Reveals Age-Related Changes in Object Working Memory Arjun Kumar, Brian C. Rakitin, Rohit Nambisan, Christian Habeck, and Yaakov Stern Arjun Kumar and Rohit Nambisan, Division of Cognitive Neuroscience, Taub Institute, Columbia University; Brian C. Rakitin and Christian Habeck, Division of Cognitive Neuroscience, Taub Institute, and Department of Neurology, Columbia University; Yaakov Stern, Division of Cognitive Neuroscience, Taub Institute, and Departments of Neurology, Psychiatry, and Psychology, Columbia University. Abstract Sixteen healthy young adults (ages 18–32) and 16 healthy older adults (ages 67–81) completed a delayed response task in which they saw the following visual sequence: memory stimuli (2 abstract shapes; 3,000 ms), a blank delay (5,000 ms), a probe stimulus of variable duration (one abstract shape; 125, 250, 500, 1,000, or 2,000 ms), and a mask (500 ms). Subjects decided whether the probe stimulus matched either of the memory stimuli; they were instructed to respond during the mask, placing greater emphasis on speed than accuracy. The authors used D. L. Hintzman & T. Curran’s (1994) 3-parameter compound bounded exponential model of speed–accuracy tradeoff to describe changes in discriminability associated with total processing time. Group-level analysis revealed a higher rate parameter and a higher asymptote parameter for the young adult group, but no difference across groups in x-intercept. Proxy measures of cognitive reserve (Y. Stern et al., 2005) predicted the rate parameter value, particularly in older adults. Results suggest that in working memory, aging impairs both the maximum capacity for discriminability and the rate of information accumulation, but not the temporal threshold for discriminability. Keywords working memory; aging; speed—accuracy tradeoff; cognitive reserve Healthy aging impairs human memory in general and working memory in particular (Grady & Craik, 2000). The present study seeks to characterize the specific attributes of working memory (WM) that deteriorate with age. In a delayed-response task, we used the response- signal method to compare the tradeoff between processing time and recognition memory discriminability in young and older adults. Working memory suffers an age-related loss of both efficiency (Salthouse & Babcock, 1991) and capacity (Zacks & Hasher, 1993). Previous aging literature has extrapolated from simple measures of task performance to theorize about these broader elements of WM. Efficiency is often measured by reaction time (e.g., Anders, Fozard, & Lillyquist, 1972; Salthouse, 1992), and capacity is often described by the number of items remembered (e.g., Holtzer, Stern, & Rakitin, 2004; Oberauer, 2001). In the present study, we mathematically modeled subjects’ Copyright 2008 by the American Psychological Association Correspondence concerning this article should be addressed to Yaakov Stern, Taub Institute, Division of Cognitive Neuroscience, College of Physicians and Surgeons, Columbia University, 630 West 168th Street, P&S Box 16, New York, NY 10032. E-mail: E-mail: [email protected]. NIH Public Access Author Manuscript Psychol Aging. Author manuscript; available in PMC 2009 June 8. Published in final edited form as: Psychol Aging. 2008 June ; 23(2): 315–329. doi:10.1037/0882-7974.23.2.315. NIH-PA Author Manuscript NIH-PA Author Manuscript NIH-PA Author Manuscript
-
Upload
independent -
Category
Documents
-
view
1 -
download
0
Transcript of The Response-Signal Method Reveals Age-Related Changes in Object Working Memory
The Response-Signal Method Reveals Age-Related Changes inObject Working Memory
Arjun Kumar, Brian C. Rakitin, Rohit Nambisan, Christian Habeck, and Yaakov SternArjun Kumar and Rohit Nambisan, Division of Cognitive Neuroscience, Taub Institute, ColumbiaUniversity; Brian C. Rakitin and Christian Habeck, Division of Cognitive Neuroscience, TaubInstitute, and Department of Neurology, Columbia University; Yaakov Stern, Division of CognitiveNeuroscience, Taub Institute, and Departments of Neurology, Psychiatry, and Psychology,Columbia University.
AbstractSixteen healthy young adults (ages 18–32) and 16 healthy older adults (ages 67–81) completed adelayed response task in which they saw the following visual sequence: memory stimuli (2 abstractshapes; 3,000 ms), a blank delay (5,000 ms), a probe stimulus of variable duration (one abstractshape; 125, 250, 500, 1,000, or 2,000 ms), and a mask (500 ms). Subjects decided whether the probestimulus matched either of the memory stimuli; they were instructed to respond during the mask,placing greater emphasis on speed than accuracy. The authors used D. L. Hintzman & T. Curran’s(1994) 3-parameter compound bounded exponential model of speed–accuracy tradeoff to describechanges in discriminability associated with total processing time. Group-level analysis revealed ahigher rate parameter and a higher asymptote parameter for the young adult group, but no differenceacross groups in x-intercept. Proxy measures of cognitive reserve (Y. Stern et al., 2005) predictedthe rate parameter value, particularly in older adults. Results suggest that in working memory, agingimpairs both the maximum capacity for discriminability and the rate of information accumulation,but not the temporal threshold for discriminability.
Keywordsworking memory; aging; speed—accuracy tradeoff; cognitive reserve
Healthy aging impairs human memory in general and working memory in particular (Grady& Craik, 2000). The present study seeks to characterize the specific attributes of workingmemory (WM) that deteriorate with age. In a delayed-response task, we used the response-signal method to compare the tradeoff between processing time and recognition memorydiscriminability in young and older adults.
Working memory suffers an age-related loss of both efficiency (Salthouse & Babcock, 1991)and capacity (Zacks & Hasher, 1993). Previous aging literature has extrapolated from simplemeasures of task performance to theorize about these broader elements of WM. Efficiency isoften measured by reaction time (e.g., Anders, Fozard, & Lillyquist, 1972; Salthouse, 1992),and capacity is often described by the number of items remembered (e.g., Holtzer, Stern, &Rakitin, 2004; Oberauer, 2001). In the present study, we mathematically modeled subjects’
Copyright 2008 by the American Psychological AssociationCorrespondence concerning this article should be addressed to Yaakov Stern, Taub Institute, Division of Cognitive Neuroscience, Collegeof Physicians and Surgeons, Columbia University, 630 West 168th Street, P&S Box 16, New York, NY 10032. E-mail: E-mail:[email protected].
NIH Public AccessAuthor ManuscriptPsychol Aging. Author manuscript; available in PMC 2009 June 8.
Published in final edited form as:Psychol Aging. 2008 June ; 23(2): 315–329. doi:10.1037/0882-7974.23.2.315.
NIH
-PA Author Manuscript
NIH
-PA Author Manuscript
NIH
-PA Author Manuscript
task performance to derive quantitative measures of WM retrieval dynamics. These measurescharacterize broad components of WM and are more directly related to the ideas of efficiencyand capacity than simpler measures like reaction time. Our methodology also helps relatetheories of WM and aging to the notion of individual differences in reserve against memoryloss. Below, we discuss models of WM and how our experimental paradigm relates to thesemodels and to cognitive reserve.
WM consists of three distinct processes: encoding, rehearsal, and retrieval (Awh et al., 1996;Jonides, Lacey, & Nee, 2005). Neuroimaging studies have revealed differences between theneural substrates of these processes (e.g., J. R. Anderson, Qin, Jung, & Carter, 2007; Habecket al., 2005; Rypma, Prabhakaran, Desmond, & Gabrieli, 2001). A particularly usefulbehavioral paradigm for investigating WM along these divisions is a delayed-response task(DRT; Habeck et al., 2005; Holtzer et al., 2004; Holtzer, Stern, & Rakitin, 2005; Rypma &D’Esposito, 1999; Sternberg, 1966; Wager & Smith, 2003; Zarahn, Rakitin, Abela, Flynn, &Stern, 2005, 2006). In a DRT, subjects are presented with a set of stimuli (often visual, suchas letters, shapes, or spatial locations), followed by a delay and then a probe stimulus. Subjectsmust determine whether the probe stimulus was included in the presentation set. DRTs areadvantageous because they allow the experimental procedure to be temporally divided intoperiods of encoding, rehearsal, and retrieval (Holtzer et al., 2004; Rypma & D’Esposito,1999), reducing the overlap between ongoing processes. One can manipulate the extrinsicdifficulty of a DRT by varying presentation set size (Habeck et al., 2005; Rypma, Eldreth, &Rebbechi, 2007; Zarahn et al., 2006) or by varying the duration of the probe stimulus (Corbett& Wickelgren, 1978; Dosher, 1984; Dosher, McElree, Hood, & Rosedale, 1989; Hintzman,Caulton, & Curran, 1994; McElree & Dosher, 1993; Reed, 1973, 1976; Wickelgren, 1977).Moreover, DRTs allow manipulation of extrinsic difficulty without the use of dual-taskmethods (e.g., N. D. Anderson, Craik, & Naveh-Benjamin, 1998) and without any temporaloverlap of task elements, as in the n-back task (e.g., Jonides et al., 1997).
Previous experiments have used Rypma and D’Esposito’s (1999) variant of the DRT withletters of the Latin alphabet as stimuli (e.g., Habeck et al., 2005; Holtzer et al., 2004, 2005;Zarahn et al., 2005, 2006). These studies characterized the aural component of the Baddeleyand Hitch (1974) model of WM—the phonological loop—which was theorized to support theretention of letter stimuli. The present study addresses the analogous visual component of theBaddeley and Hitch model—the visuospatial sketchpad. We employed unfamiliar, abstract(i.e., difficult to name) shape stimuli, which we assumed would require use of the visuospatialsketchpad, to provide information about WM in aging that complements the previous studies.In a prior DRT experiment, these shape stimuli were used along with letter stimuli to comparethe parallel processing of the phonological loop and the visuospatial sketchpad (Holtzer et al.,2004, 2005).
In the present study, we manipulated the extrinsic difficulty of a DRT by varying the probeduration and eliciting the recognition response promptly after termination of the probe. Thistechnique, known as the response-signal method (RSM), varies the duration of the retrievalprocess and usually results in a speed—accuracy tradeoff (Reed, 1973). That is, as theprocessing time allowed for retrieval increases (slower speed), accuracy on a memory taskimproves, and vice versa. We assessed accuracy with the signal detection measure dL(Snodgrass & Corwin, 1988), following the example of Hintzman and Curran (1994). Previousstudies have used the RSM to investigate how subjects discriminate between semantic andepisodic associations (Dosher, 1984) and to study the dynamics of recognition memory (Dosheret al., 1989; Hintzman & Caulton, 1997; Hintzman & Curran, 1994; Reed, 1973). Boldini,Russo, and Avons (2004) used the RSM to distinguish between single- and dual-processaccounts of recognition memory via mathematical modeling similar to that used in the presentstudy. To our knowledge, this paradigm has not been used to study WM in the context of aging.
Kumar et al. Page 2
Psychol Aging. Author manuscript; available in PMC 2009 June 8.
NIH
-PA Author Manuscript
NIH
-PA Author Manuscript
NIH
-PA Author Manuscript
When processing time is systematically varied to affect recognition memory discriminability,mathematical modeling can describe the speed—accuracy tradeoff (SAT) in terms of a three-parameter compound bounded exponential curve (Hintzman & Curran, 1994). The fitparameters that define this curve quantitatively describe three characteristics of WM. Thecurve’s x-intercept represents the time at which retained information first becomes availableto guide recognition memory decisions beyond random guessing. The curve’s asymptoterepresents the maximum level of accuracy that can be attained and thus the maximum amountof mnemonic information an individual can process without time constraints. The rate ofchange of the curve’s slope represents the rate at which information becomes available fordecision making. In these ways, the x-intercept and rate parameters describe how efficientlyWM retrieves information, and the asymptote parameter describes WM capacity.
Aging is known to impair the speed of encoding new information in WM (Salthouse, 1992;Salthouse & Babcock, 1991), and older adults have longer reaction times than young adults indelayed item recognition (Anders et al., 1972; Eriksen, Hamlin, & Daye, 1973; Holtzer et al.,2004; Zarahn, Rakitin, Abela, Flynn, & Stern, 2007). We therefore predicted a more acutetradeoff for older adults than for young adults. In terms of our mathematical model, wehypothesized that older adults would show a higher x-intercept and a lower rate parameter (bothindicating slower performance) because these two measures relate specifically to the speed ofinformation processing. The asymptote parameter is not speed related; it is associated with themaximum capacity for information processing in WM, which is also known to deteriorate withage (Zacks & Hasher, 1993). Thus, we similarly predicted that older adults would have a lowerasymptote (smaller capacity) than young adults would. Because we modeled performanceusing a compound bounded exponential curve, we could predict how the resultant curves forthe two age groups would look on the basis of our various hypotheses. Figure 1 presentshypothetical resultant curves showing a group difference for each individual fit parameter, aswell as for all three. Our hypotheses predicted that the actual resultant curves would resemblethose in Figure 1D.
Previous studies have shown that individuals differ greatly in their susceptibility to age-relatedchanges in cognitive function (Gold et al., 1995; Hultsch, Hertzog, Small, & Dixon, 1999;Manly, Touradji, Tang, & Stern, 2003; Scarmeas, Levy, Tang, Manly, & Stern, 2001; Schaie,1984; Stern et al., 1994; Wilson et al., 2000, 2002). Cognitive reserve (CR) theory posits thatindividual differences in task performance give some individuals greater resilience than othersagainst age-related neural change (Stern, 2002; Stern et al., 2005). That is, if the neural networkunderlying task performance is the same in young and old, individuals can still differ in howquickly they must increase activation with the rising demands of a task (efficiency) or in themaximum level of activation they can achieve (capacity; neural reserve is the overall term fordifferential efficiency and/or capacity of a network). CR theory also posits that some olderadults develop more effective compensatory mechanisms than others against age-relatedchanges, recruiting brain networks not used by young adults (neural compensation).Differential efficiency and capacity of the same network, as well as recruitment ofcompensatory networks, have been observed in the neural activation associated with differentphases of WM tasks (Stern et al., 2008; Zarahn et al., 2006). Individual differences in the useof these networks may be reflected in behavioral measures of WM ability.
In the present study, we used estimated verbal IQ, vocabulary, and years of education as proxymeasures of CR to investigate the relationship between WM and CR. Premorbid IQ andvocabulary have proven to be strong proxies for CR, in that they are associated with slowerrates of cognitive decline in normal aging and reduced risk of developing dementia (e.g., S.M. Albert & Teresi, 1999; Alexander et al., 1997; Corral, Rodríguez, Amenedo, Sánchez, &Díaz, 2006; Solé-Padullés et al., 2007). Similarly, education has been shown to impart reserveover an individual’s lifetime (Evans et al., 1993; Mortel, Meyer, Herod, & Thornby, 1995;
Kumar et al. Page 3
Psychol Aging. Author manuscript; available in PMC 2009 June 8.
NIH
-PA Author Manuscript
NIH
-PA Author Manuscript
NIH
-PA Author Manuscript
Rocca et al., 1990; Stern et al., 1994), and individuals with higher levels of educationdemonstrate slower cognitive and functional decline during normal aging (M. S. Albert et al.,1995; Butler, Ashford, & Snowdon, 1996; Chodosh, Reuben, Albert, & Seeman, 2002;Christensen et al., 1997; Colsher & Wallace, 1991; Farmer, Kittner, Rae, Bartko, & Regier,1995; Lyketsos, Chen, & Anthony, 1999; Snowdon, Ostwald, & Kane, 1989). Moreover, wehave successfully used IQ, vocabulary, and education as proxies for CR in previous behavioraland neuroimaging studies (e.g., Habeck et al., 2005; Scarmeas et al., 2004; Stern et al., 2005,2008). Thus, we believe these measures serve as meaningful indicators of individualdifferences in susceptibility to age-related cognitive impairment.
Our statistical analysis addressed the question of whether CR mediates retrieval dynamics inobject working memory. If CR does not modulate the aspects of WM characterized by our SATmodel, our CR measures should not statistically predict the fit parameter values across agegroups. If CR does modulate WM, our CR measures should predict the fit parameter valueseither in the same way for both age groups (e.g., high IQ is associated with a higher rateparameter in young and older adults) or differently for each group (e.g., high IQ is associatedwith a higher rate parameter in older adults but not in young adults). To address the relationshipbetween CR and behavior, and to allow for these various possibilities, we included CR variablesand their interactions with age group as covariates in our statistical model.
Because CR accumulates over one’s lifetime and provides resilience against age-relatedmemory loss, we hypothesized that CR is more likely to modulate behavioral performance inolder adults. That is, we anticipated CR × Group interaction effects on the fit parameters suchthat our CR measures would predict the fit parameter values in older adults but not in youngadults.
MethodParticipants
Sixteen healthy young adults and 16 healthy older adults participated in this study. Youngadults were recruited via fliers or Internet ads, and older adults were recruited from senior daycenters located in Manhattan, New York. Table 1 provides descriptive demographics for eachgroup. All participants were right-handed, spoke English, and had normal or corrected-to-normal vision. Participants had no past or current medical, neurological, or psychiatricdisorders, were not being treated with psychoactive drugs, and were screened to ensure theabsence of dementia. Given the age range of participants, subjects had to score 133 or higheron the Mattis Dementia Rating Scale (Mattis, 1988) to be included in the study (cf. Mayo’sOlder Americans Normative Studies scaled scores; Lucas et al., 1998). All study participantsmet this criterion, and no recruits were excluded from the study. We obtained informed consentfrom all participants in accordance with the procedures of Columbia University MedicalCenter.
ApparatusParticipants completed the experiment on a Macintosh G3 iBook computer with a 12-in. LCDcolor monitor. Testing occurred in a well-lit room where the subject was approximately 25 in.from the screen. The task was programmed and run using PsyScope software (Version 1.2.5;Cohen, MacWhinney, Flatt, & Provost, 1993), and subjects entered responses on the computerkeyboard.
ProcedureParticipants completed the study in a single session. After providing informed consent, theycompleted a pretraining task, the DRT, and a brief neuropsychological battery.
Kumar et al. Page 4
Psychol Aging. Author manuscript; available in PMC 2009 June 8.
NIH
-PA Author Manuscript
NIH
-PA Author Manuscript
NIH
-PA Author Manuscript
Pretraining was administered to ensure that subjects could meet the demands of the RSMexperiment. Pretraining consisted of a two-alternative forced-choice (2-AFC) objectdiscrimination task, divided into 10-trial blocks. Participants completed at least 5 blocks of the2-AFC task and continued until they were able to respond accurately during the mask on atleast 9 out of 10 trials within a block. Subjects who could not meet this criterion after 50 blockswould have been excluded from the study. However, all participants met criteria; youngparticipants completed an average of 5.56 ± 0.22 blocks of pretraining, and older participantscompleted an average of 14.00 ± 2.60 blocks.
The DRT consisted of 11 blocks of 30 trials each, divided into three training phases and 1 testphase. In Training Phase 1 (2 blocks), subjects received feedback after each trial about theirspeed and their accuracy. At the end of each block, a summary displayed the number of trialson which the subject responded both correctly and on time, as well as the number of trials whenthe response was on time (regardless of choice accuracy). Training Phase 2 (3 blocks) providedonly speed feedback after each trial, and the summary for each block displayed only the numberof on-time responses. In Training Phase 3 (1 block), no feedback was provided. Participantsthen completed 5 test blocks with no feedback, the results of which we used for statisticalanalysis.
Participants were administered the Mattis Dementia Rating Scale test (DRS; Mattis, 1988) forneuropsychological screening. With the exception of two subjects, young and older participantsalso completed the vocabulary subtest of the revised Wechsler Adult Intelligence Scale(Wechsler, 1981) and the National Adult Reading Test (NART; Grober & Sliwinsky, 1991)as proxy measures of CR.
The entire protocol lasted about 2.5 hr: 70 min for pretraining and training, 50 min for testing,and 30 min for the neuropsychological evaluation.
TasksIn each trial of the pretraining 2-AFC task, participants were presented with one out of a fixedset of two abstract shapes (described below), followed by the same mask used in the DRT. Toreduce the task’s memory demands, the same set of two shapes was used across all thepretraining trials and blocks. The single shape was presented for a variable duration (similarto the DRT probe item, described below), and during the mask, subjects had to identify whichof the two shapes they saw via computer key-press (the X key or the period key, depending onthe stimulus). After each response, they received speed and accuracy feedback. If theparticipant responded before or after the mask, the feedback read, “Sorry, response made toosoon …” or “Sorry, time ran out …,” respectively. If the subject responded during the mask,the feedback read either “Correct!” or “Fast enough, but wrong,” depending on responseaccuracy. At the end of each block, a summary displayed the number of trials on which thesubject responded both on time and correctly.
Each DRT trial consisted of encoding, retention, and probe phases. The encoding phasepresented two shape stimuli (visual angle for the two-shape stimulus = 4° vertical × 26°horizontal) for 3 s, followed by a 5-s retention interval during which the computer screen wasblank. Subjects then saw a single probe item (visual angle = 4° ± 4°) that either matched oneof the stimuli from the study set (true positive) or was completely different from both of them(true negative). The probe item was presented for either 125, 250, 500, 1,000, or 2,000 ms andwas followed immediately by a 500-ms mask (gray square, visual angle = 4° × 4°), duringwhich subjects were instructed to respond. The current task differs from previousimplementations of the response-signal method in its use of a relatively long response windowfollowing the removal of the probe stimulus. Our mask was 500 ms in duration, compared tomore typical values around 300 ms (Hintzman & Curran, 1994; Reed, 1973). On the basis of
Kumar et al. Page 5
Psychol Aging. Author manuscript; available in PMC 2009 June 8.
NIH
-PA Author Manuscript
NIH
-PA Author Manuscript
NIH
-PA Author Manuscript
extensive pilot data, we made this modification to accommodate slower reaction times in olderadults.
Subjects responded during the mask by indicating whether the probe stimulus matched eitherof the memory stimuli via computer key-press (X key or period key). Assignment of responsekeys to the true positive and true negative conditions was counterbalanced across participantswithin each age group. Participants were instructed to place greater emphasis on speed thanaccuracy in responding and to guess rather than delay their response on trials when they feltunsure. In training, the mask was followed by a 250-ms delay and a 1,750-ms feedback display.Training Phase 1 provided speed and accuracy feedback identical to the feedback in the 2-AFCtask. Training Phase 2 provided only speed feedback, so the display for any on-time responseread ON TIME regardless of choice accuracy; the display for early or late responses was thesame as in the 2-AFC task. Figure 2 illustrates the visual sequence for a single test phase trial.
Each DRT block consisted of 30 trials. The crossing of two probe types (positive or negative)and five probe durations yielded 10 conditions, which were repeated three times within a block.Analyses included five testing phase blocks, so that from each participant we obtained a totalof 15 trials for each of the 10 conditions.
Within each block of 30 trials, there were 70 blank, 2,000-ms intervals, randomly interspersed.When added to the minimum 3-s intertrial interval (ITI) preceding each trial, these intervalsresulted in a mean ITI of 9,119 ms (SD = 5,265 ms). This design element staggered the timingof trial presentation so that subjects could not anticipate the onset of the next trial. The exactduration of the ITI was determined to maximize statistical power in an ongoing functionalneuroimaging study.
Visual stimuli were selected from a set of 420 computer-generated closed-curve shapes(Holtzer et al., 2004). These shapes were abstract and did not correspond to or intuitively relateto real words or objects (see Figure 3). The mean pixel ratio of the shapes (white) to thebackground (black) provided an estimate of their complexity, which was comparable amongencoding and probe stimuli within a single trial. Positive and negative trials were also matchedfor complexity, and the overall complexity of the shapes was counterbalanced across all fiveprobe durations. At most, each individual shape appeared once across the three training phasesand once within the testing phase. Within training 228 shapes appeared twice, and in testing120 shapes appeared twice. However, each combination of 3 shapes within a single trial (twoencoding stimuli plus one probe stimulus) was unique across the entire experiment.Additionally, no shape occupied the same position (e.g., left side of the encoding stimulus)more than once.
Statistical AnalysisWe used a repeated-measures analysis of variance (ANOVA) to analyze reaction time (RT;measured from the onset of the mask) with probe duration (five-level) as the within-subjectsvariable and age group (two-level) as the between-subjects factor. We conducted a similaranalysis for the proportion of time-out trials (pTO), defined as the number of trials on whichsubjects did not respond during the mask, divided by 15 (the total number of trials percondition). CR covariates were not included in either of these models.
Proficiency at the task was calculated in terms of the discriminability measure dL, given by theformula dL = ln{[H(1 - FA)]/[(1 – H) FA)]} where H = hits (correct true-positive probe trials),FA = false alarms (incorrect true-positive probe trials), and ln is the natural logarithm function.Response bias was calculated as CL, given by the formula CL = 0.5[ln{[(1 - FA)(1 - H)]/[(H)(FA)]}] (Snodgrass & Corwin, 1988). With the same design used for RT, we conductedrepeated-measures ANOVAs to analyze both signal detection parameters. CR covariates were
Kumar et al. Page 6
Psychol Aging. Author manuscript; available in PMC 2009 June 8.
NIH
-PA Author Manuscript
NIH
-PA Author Manuscript
NIH
-PA Author Manuscript
not included in these models. Planned comparisons between levels of the probe duration wereconducted using polynomial contrasts with one degree of freedom.
Last, to determine whether RT or pTO account for any of the variability in signal detectionmeasures, we conducted separate repeated-measure ANCOVAs on dL and CL with probeduration as a five-level within-subjects variable and age group as a two-level between-subjectsfactor. We included RT and pTO as covariates, and we included the interactions between thesecontinuous variables and the fixed effects as tests of homogenous slopes across fixed-effectslevels.
For all standard parametric tests involving probe duration, we report the actual degrees offreedom, measuring statistical significance at the p = .05 level after Huynh-Feldt epsiloncorrection for violations of the assumptions of the ANOVA.
We modeled the SAT between discriminability and total processing time (probe duration plusreaction time) using a three-parameter bounded exponential curve (Hintzman & Curran,1994). Each such curve is defined in terms of its x-intercept, asymptote, and slope, using thecompound equation: For x ≤ x-intercept, dL = 0; for x > x-intercept, dL = asymptote × {1 - exp[-slope × (probe duration - intercept)]}, where x is the total processing time.
We derived best-fit curves for each individual’s performance in three steps: First, for each agegroup and at each probe duration, we calculated the between-subject mean dL and the between-subject mean total processing time, generating a SAT function for each age group. Second, wefitted a three-parameter best-fit curve to these group-average SAT functions. We completedthis step simultaneously for both age groups to identify a set of fit parameters that optimizesboth best-fit curves at once (six parameters altogether, three for each group curve). Third, wefitted similar curves to each individual’s SAT function: Using the intercepts, asymptotes, andslopes of the group-average best-fit curves (from Step 2) as starting points, we carried out asimple gradient descent procedure to estimate the parameter values for each individual’s best-fit curve (Step 3), minimizing the residual to each subject’s data for each fit parameter. Eachsubject’s unique parameter values served as the dependent variables in our statistical analysis.
For each of the three fit parameters (intercept, asymptote, and rate), we built a general linearmodel (GLM) that proceeded in stages (method of heterogeneous slopes; Siegel, 1956). In thefirst stage (full model), the following independent variables were used as predictors: age group,years of education, NART IQ estimate, and age-scaled vocabulary score. We also addedinteraction terms by multiplying the group-membership predictor with each of the subject-specific predictors. Thus, the full model comprised seven predictors: group, education, NARTIQ, vocabulary, Group × Education, Group × NART IQ, and Group × Vocabulary. Includingthese interaction terms allowed for formal tests of group heterogeneity of the slope of therelation between the CR measures and the model fit parameters. After performing the full-model analysis, we retained the covariate main effects and only those interaction terms thatyielded statistically significant regression weights. The results of the linear regression with thereduced set of predictors are reported as the reduced model. The simple model contains onlythe fixed effect and is relevant when none of the covariate terms are significant in the reducedmodel.
Because we used group-average fit parameters to begin to estimate each individual’s fitparameters in Step 3, our GLMs violated the assumption of independent errors, and so we couldnot rely on standard parametric assumptions to determine the probabilities associated with teststatistics. Instead, we employed a nonparametric permutation procedure to generate the null-hypothesis distribution of regression weights from the data itself. This was achieved byrandomly sampling from the data 10,000 times without replacement, destroying the subject-to-group assignment. For each such permuted data set, we performed our fitting routine to
Kumar et al. Page 7
Psychol Aging. Author manuscript; available in PMC 2009 June 8.
NIH
-PA Author Manuscript
NIH
-PA Author Manuscript
NIH
-PA Author Manuscript
generate the three fit parameters anew. The fit parameters obtained from the permuted datasets were then used as dependent variables for general linear modeling (see above), while thesubject-to-group assignment for the independent variables was left intact. This generated anull-hypothesis distribution for each regression weight. This process was repeated as neededfor the full, reduced, and simple GLMs.
To assess statistical significance, we empirically estimated the percentile location of theunpermuted data set’s regression weight in relation to the computed null-hypothesisdistribution. Our significance test was two-tailed: the p level equaled the fraction of absolutevalues in the null-hypothesis distribution that lay beyond the absolute value of the unpermuteddata set’s regression weight. Therefore, a p level of 0.05 meant the absolute value of theunpermuted data set’s regression weight was larger than at least 95% of the absolute-valuedregression weights produced by the permutation procedure. Although we derived p values fromtwo-tailed t distributions, our hypotheses about the effects of age group on the fit parametersare unidirectional (see Introduction). So for main effects of age group, we present one-tailedp values derived by halving the permutation test p levels. For the effects of CR covariates,about which we do not offer directional hypotheses, we report two-tailed p values.
For comparison, we used standard parametric methods to test the same statistical modelssubmitted to permutation testing. Univariate ANCOVA was performed for each of theindividual fit parameters—intercept, asymptote, and rate—with age group (two-level) as thebetween-subjects factor and with proxy measures of CR—education, NART IQ, andvocabulary—as covariates. As in our nonparametric reduced model, we retained only thoseinteraction terms that yielded statistically significant regression weights.
ResultsNeuropsychological Measures
Table 1 shows participant demographics and neuropsychological test results for each agegroup. Young and older adults performed comparably on the DRS, vocabulary, and NARTtests; they had equal (and high) levels of education; and they were equivalent in terms of sexdistribution.
Analysis of Reaction Time and Proportion of Time-Out TrialsThe analysis of SAT using the RSM is predicated on controlling a participant’s total time forprocessing the probe item. The response window in the current task is longer than in previousimplementations of the RSM (Hintzman & Curran, 1994; Reed, 1973), allowing for greaterwithin- and between-group variability in processing time that could complicate theinterpretation of the SAT analyses. Thus, we analyzed reaction time from the mask onset as afunction of age group and probe duration to determine, for example, whether young adults hadmore processing time than older adults had and whether this difference was comparable acrossprobe duration levels. For the same reasons, we also analyzed the proportion of trials on whichsubjects timed out (pTO), defining time-outs as trials with no response recorded during themask. Figures 4A and 4B show the relationships between RT and probe duration and betweenpTO and probe duration, respectively.
Results of the RT analysis indicated no effect of age group on RT, F(1, 30) = 0.04, ns, nor anyinteraction between age group and probe duration, F(4, 120) = 0.636, ns. However, RT didvary as a function of probe duration, F(4, 120) = 56.22, p < .001, such that subjects had longerRTs for shorter probes. This variability in RT across conditions indicates that we did not controlperfectly for total processing time, so there may be a bias in analysis of the discriminabilitymeasures. For this reason, we include RT as a covariate in the dL analyses reported in the next
Kumar et al. Page 8
Psychol Aging. Author manuscript; available in PMC 2009 June 8.
NIH
-PA Author Manuscript
NIH
-PA Author Manuscript
NIH
-PA Author Manuscript
section. The inverse relationship between RT and probe duration may indicate that the probewas serving as a warning signal for the presentation of the mask, much like the warning signaleffect on RT shown in variable foreperiod experiments (e.g., Niemi & Naatanen, 1981).Because our SAT model is fit to functions of dL with respect to total processing time (probeduration + RT), analysis of the fit parameters accounts for the differences in RT acrossconditions.
ANOVA of pTO showed an effect of age group such that older adults failed to respond onmore trials than younger adults, F(1, 30) = 13.56, p < .001, and both age groups’ pTO variedas a function of probe duration, F(4, 120) = 17.20, p < .001. The effects of group and probeduration on pTO also demonstrate the experiment’s imperfect control of processing time,motivating inclusion of pTO as a covariate in the dL analyses reported in the next section. Posthoc review of the data found responses recorded on TO trials during the ITIs following thesetrials. That is, older participants rarely failed to respond but rather made the occasional responsewith latency greater than the mask duration. These responses did not contribute to the meanRT, explaining the absence of an age group difference in RT. Overall, it appears that olderparticipants have an RT distribution similar to that of the young participants but with a longerright tail.
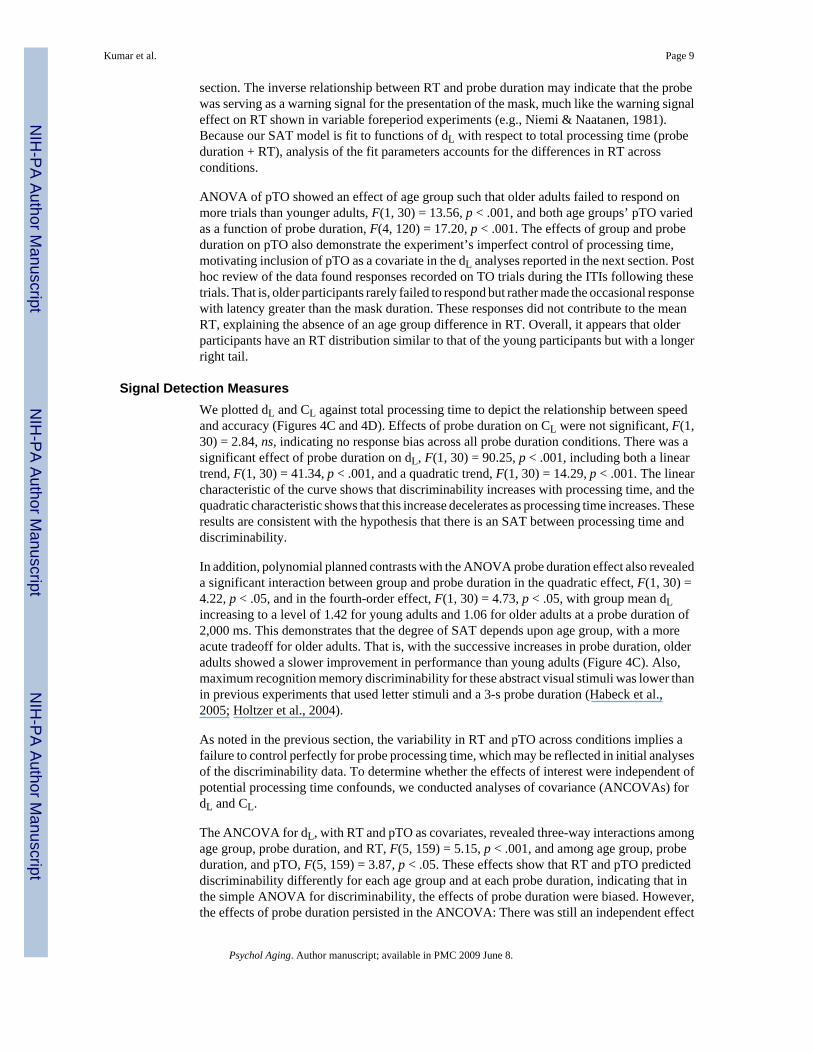
Signal Detection MeasuresWe plotted dL and CL against total processing time to depict the relationship between speedand accuracy (Figures 4C and 4D). Effects of probe duration on CL were not significant, F(1,30) = 2.84, ns, indicating no response bias across all probe duration conditions. There was asignificant effect of probe duration on dL, F(1, 30) = 90.25, p < .001, including both a lineartrend, F(1, 30) = 41.34, p < .001, and a quadratic trend, F(1, 30) = 14.29, p < .001. The linearcharacteristic of the curve shows that discriminability increases with processing time, and thequadratic characteristic shows that this increase decelerates as processing time increases. Theseresults are consistent with the hypothesis that there is an SAT between processing time anddiscriminability.
In addition, polynomial planned contrasts with the ANOVA probe duration effect also revealeda significant interaction between group and probe duration in the quadratic effect, F(1, 30) =4.22, p < .05, and in the fourth-order effect, F(1, 30) = 4.73, p < .05, with group mean dLincreasing to a level of 1.42 for young adults and 1.06 for older adults at a probe duration of2,000 ms. This demonstrates that the degree of SAT depends upon age group, with a moreacute tradeoff for older adults. That is, with the successive increases in probe duration, olderadults showed a slower improvement in performance than young adults (Figure 4C). Also,maximum recognition memory discriminability for these abstract visual stimuli was lower thanin previous experiments that used letter stimuli and a 3-s probe duration (Habeck et al.,2005; Holtzer et al., 2004).
As noted in the previous section, the variability in RT and pTO across conditions implies afailure to control perfectly for probe processing time, which may be reflected in initial analysesof the discriminability data. To determine whether the effects of interest were independent ofpotential processing time confounds, we conducted analyses of covariance (ANCOVAs) fordL and CL.
The ANCOVA for dL, with RT and pTO as covariates, revealed three-way interactions amongage group, probe duration, and RT, F(5, 159) = 5.15, p < .001, and among age group, probeduration, and pTO, F(5, 159) = 3.87, p < .05. These effects show that RT and pTO predicteddiscriminability differently for each age group and at each probe duration, indicating that inthe simple ANOVA for discriminability, the effects of probe duration were biased. However,the effects of probe duration persisted in the ANCOVA: There was still an independent effect
Kumar et al. Page 9
Psychol Aging. Author manuscript; available in PMC 2009 June 8.
NIH
-PA Author Manuscript
NIH
-PA Author Manuscript
NIH
-PA Author Manuscript
of probe duration on dL, F(4,159) = 21.15, p < .001, and there was still an independentinteraction between probe duration and group, F(4, 159) = 3.18, p < .05. Thus, the ANCOVAcorroborated the results of the ANOVA, and also like the ANOVA, it yielded no significanteffects of age group alone.
The ANCOVA for CL, with RT and pTO as covariates, yielded similar results for RT. A three-way interaction among group, probe duration, and RT, F(5, 159) = 4.75, p < .001, shows thatRT predicted response bias differently for each age group and at each probe duration, indicatinga bias in the simple ANOVA for CL. Nonetheless, the ANCOVA for CL, like the ANOVA forCL, showed neither an effect of group, F(1, 159) = 0.12, ns, nor an effect of probe duration, F(4, 159) = 0.62, ns, on response bias.
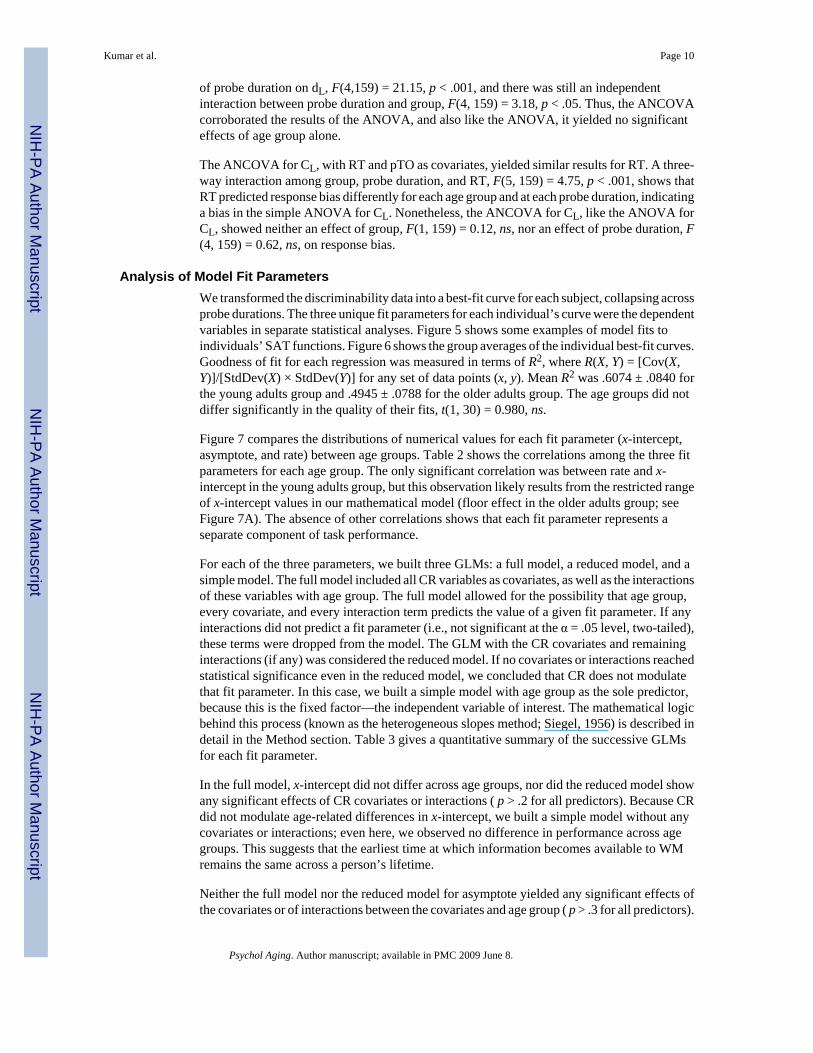
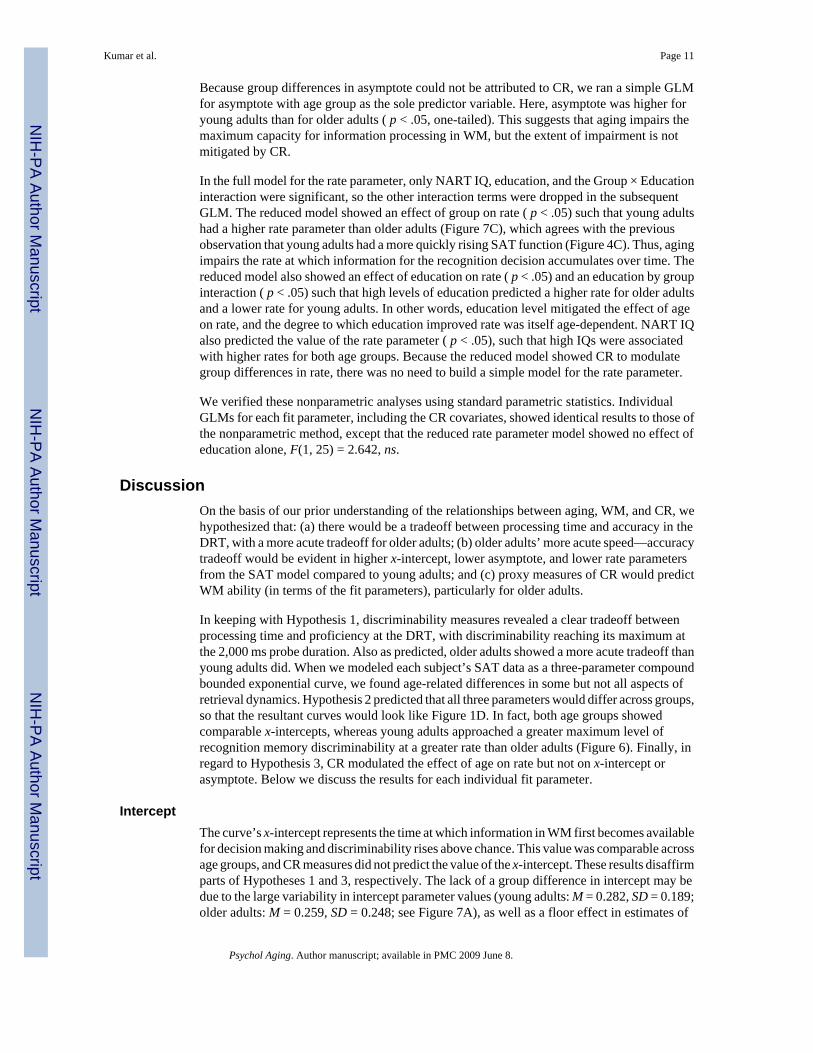
Analysis of Model Fit ParametersWe transformed the discriminability data into a best-fit curve for each subject, collapsing acrossprobe durations. The three unique fit parameters for each individual’s curve were the dependentvariables in separate statistical analyses. Figure 5 shows some examples of model fits toindividuals’ SAT functions. Figure 6 shows the group averages of the individual best-fit curves.Goodness of fit for each regression was measured in terms of R2, where R(X, Y) = [Cov(X,Y)]/[StdDev(X) × StdDev(Y)] for any set of data points (x, y). Mean R2 was .6074 ± .0840 forthe young adults group and .4945 ± .0788 for the older adults group. The age groups did notdiffer significantly in the quality of their fits, t(1, 30) = 0.980, ns.
Figure 7 compares the distributions of numerical values for each fit parameter (x-intercept,asymptote, and rate) between age groups. Table 2 shows the correlations among the three fitparameters for each age group. The only significant correlation was between rate and x-intercept in the young adults group, but this observation likely results from the restricted rangeof x-intercept values in our mathematical model (floor effect in the older adults group; seeFigure 7A). The absence of other correlations shows that each fit parameter represents aseparate component of task performance.
For each of the three parameters, we built three GLMs: a full model, a reduced model, and asimple model. The full model included all CR variables as covariates, as well as the interactionsof these variables with age group. The full model allowed for the possibility that age group,every covariate, and every interaction term predicts the value of a given fit parameter. If anyinteractions did not predict a fit parameter (i.e., not significant at the α = .05 level, two-tailed),these terms were dropped from the model. The GLM with the CR covariates and remaininginteractions (if any) was considered the reduced model. If no covariates or interactions reachedstatistical significance even in the reduced model, we concluded that CR does not modulatethat fit parameter. In this case, we built a simple model with age group as the sole predictor,because this is the fixed factor—the independent variable of interest. The mathematical logicbehind this process (known as the heterogeneous slopes method; Siegel, 1956) is described indetail in the Method section. Table 3 gives a quantitative summary of the successive GLMsfor each fit parameter.
In the full model, x-intercept did not differ across age groups, nor did the reduced model showany significant effects of CR covariates or interactions ( p > .2 for all predictors). Because CRdid not modulate age-related differences in x-intercept, we built a simple model without anycovariates or interactions; even here, we observed no difference in performance across agegroups. This suggests that the earliest time at which information becomes available to WMremains the same across a person’s lifetime.
Neither the full model nor the reduced model for asymptote yielded any significant effects ofthe covariates or of interactions between the covariates and age group ( p > .3 for all predictors).
Kumar et al. Page 10
Psychol Aging. Author manuscript; available in PMC 2009 June 8.
NIH
-PA Author Manuscript
NIH
-PA Author Manuscript
NIH
-PA Author Manuscript
Because group differences in asymptote could not be attributed to CR, we ran a simple GLMfor asymptote with age group as the sole predictor variable. Here, asymptote was higher foryoung adults than for older adults ( p < .05, one-tailed). This suggests that aging impairs themaximum capacity for information processing in WM, but the extent of impairment is notmitigated by CR.
In the full model for the rate parameter, only NART IQ, education, and the Group × Educationinteraction were significant, so the other interaction terms were dropped in the subsequentGLM. The reduced model showed an effect of group on rate ( p < .05) such that young adultshad a higher rate parameter than older adults (Figure 7C), which agrees with the previousobservation that young adults had a more quickly rising SAT function (Figure 4C). Thus, agingimpairs the rate at which information for the recognition decision accumulates over time. Thereduced model also showed an effect of education on rate ( p < .05) and an education by groupinteraction ( p < .05) such that high levels of education predicted a higher rate for older adultsand a lower rate for young adults. In other words, education level mitigated the effect of ageon rate, and the degree to which education improved rate was itself age-dependent. NART IQalso predicted the value of the rate parameter ( p < .05), such that high IQs were associatedwith higher rates for both age groups. Because the reduced model showed CR to modulategroup differences in rate, there was no need to build a simple model for the rate parameter.
We verified these nonparametric analyses using standard parametric statistics. IndividualGLMs for each fit parameter, including the CR covariates, showed identical results to those ofthe nonparametric method, except that the reduced rate parameter model showed no effect ofeducation alone, F(1, 25) = 2.642, ns.
DiscussionOn the basis of our prior understanding of the relationships between aging, WM, and CR, wehypothesized that: (a) there would be a tradeoff between processing time and accuracy in theDRT, with a more acute tradeoff for older adults; (b) older adults’ more acute speed—accuracytradeoff would be evident in higher x-intercept, lower asymptote, and lower rate parametersfrom the SAT model compared to young adults; and (c) proxy measures of CR would predictWM ability (in terms of the fit parameters), particularly for older adults.
In keeping with Hypothesis 1, discriminability measures revealed a clear tradeoff betweenprocessing time and proficiency at the DRT, with discriminability reaching its maximum atthe 2,000 ms probe duration. Also as predicted, older adults showed a more acute tradeoff thanyoung adults did. When we modeled each subject’s SAT data as a three-parameter compoundbounded exponential curve, we found age-related differences in some but not all aspects ofretrieval dynamics. Hypothesis 2 predicted that all three parameters would differ across groups,so that the resultant curves would look like Figure 1D. In fact, both age groups showedcomparable x-intercepts, whereas young adults approached a greater maximum level ofrecognition memory discriminability at a greater rate than older adults (Figure 6). Finally, inregard to Hypothesis 3, CR modulated the effect of age on rate but not on x-intercept orasymptote. Below we discuss the results for each individual fit parameter.
InterceptThe curve’s x-intercept represents the time at which information in WM first becomes availablefor decision making and discriminability rises above chance. This value was comparable acrossage groups, and CR measures did not predict the value of the x-intercept. These results disaffirmparts of Hypotheses 1 and 3, respectively. The lack of a group difference in intercept may bedue to the large variability in intercept parameter values (young adults: M = 0.282, SD = 0.189;older adults: M = 0.259, SD = 0.248; see Figure 7A), as well as a floor effect in estimates of
Kumar et al. Page 11
Psychol Aging. Author manuscript; available in PMC 2009 June 8.
NIH
-PA Author Manuscript
NIH
-PA Author Manuscript
NIH
-PA Author Manuscript
the x-intercepts for the older group. Both the variability and the floor effect indicate that thex-intercept term was underdetermined, most likely because discriminability was not zero at theshortest probe duration (see Figure 4C). It is possible that our data obscure a real age-relateddifference in the temporal threshold for discriminability; but from the present analyses we mustconclude that intercept does not vary, either with age or with CR. A future experiment usingthe RSM should include a shorter probe duration or increase the overall difficulty of the task,so that the obtained SAT functions actually reach floor at the shortest processing times.
AsymptoteThe maximum value at which the curve tapers off represents the maximum level ofdiscriminability that can be attained in WM. Our results support Hypothesis 2 that young adultshave a higher asymptote than older adults do and that aging impairs maximum discriminability.Because the broader statistical model including measures of CR showed no significant effects,we further conclude that CR does not mediate this age-related impairment, partiallydisaffirming Hypothesis 3.
RateThe rate of change of the exponential curve represents the rate at which information becomesavailable for decision making. Young adults had higher rates than older adults did, showingthat aging impairs the rate of information accumulation in WM. With respect to the CRmeasures, high IQ predicted a higher rate for all participants, and high levels of educationpredicted a higher rate for older adults only. The interaction of age and education in predictingthe rate parameter is largely due to an association between education and rate in the older adultsand the absence of such an association in the young adults, who have little variability ineducation. Overall, the rate parameter differs from intercept and asymptote in that it changeswith CR variables, which are known to predict behavioral resistance to age-related pathology(Stern, 2002). Below we discuss some of the limitations of this experiment and then theimplications of our findings for theories of WM and CR.
A methodological limitation of the current study is that the long time course of our delayed-response task (DRT; 8–10-s trials with a 5-s delay) may have resulted in a temporal overlapbetween short-term and long-term memory processes. Given the assumption that WM isdivided into encoding, rehearsal, and retrieval phases, and given the additional assumptions ofthe compound bounded exponential model, we could not avoid this overlap in our experimentalparadigm. Additionally, DRTs of comparable length, with delay periods ranging from 6.5–10s, have been used reliably in previous studies of WM (e.g., Gazzaley, Sheridan, Cooney, &D’Esposito, 2007; Holtzer et al., 2004).
A further theoretical limitation of this experiment concerns the model from which we derivedthe fit parameters. We based our approach on a model used to characterize retrieval in verbalepisodic memory for a single age group (Hintzman & Curran, 1994), but the present studyfocuses on object working memory across two different age groups. Moreover, ourexperimental design is quite different from that of Hintzman and Curran’s (1994) study. Oursubjects received significantly less training (hours as opposed to days), and their window forresponding in the task was larger (500 ms as opposed to 300 ms). Nevertheless, the compoundbounded exponential model is a rather general model of the threshold for use and the exhaustionof a limited resource over time because it makes only three assumptions: first, that accuracy isat chance until a certain minimum level of information accumulates; second, that memory hasa limited capacity; and third, that this capacity is reached with decreasing efficiency over time.We believe our assumptions are as valid for working memory as for long-term verbal episodicmemory, and that young and older adults differ only quantitatively in their WM dynamics.Thus, given the model’s formulation, its use here is appropriate.
Kumar et al. Page 12
Psychol Aging. Author manuscript; available in PMC 2009 June 8.
NIH
-PA Author Manuscript
NIH
-PA Author Manuscript
NIH
-PA Author Manuscript
Although our mathematical model is a general one, we focused on a very specific memoryprocess, manipulating only the retrieval phase of WM for two abstract objects in a visualparadigm. This limits the generalizability of our findings in that we cannot extrapolate ourresults either to memory for verbal or semantic information or to other sense modalities besidesvision. It is also difficult to relate our conclusions to the encoding and rehearsal processes inWM. However, it may be possible to apply our methodology to encoding and rehearsaldynamics (see below). Our methodology can also be easily adapted to study memory for heavierand smaller workloads and perhaps to study different sense modalities.
The present study is important because it successfully applies the RSM in the context of healthyaging. The RSM, together with Hintzman and Curran’s (1994) modeling method, providesquantitative measures of components of WM that, until now, have been discussed in mainlyqualitative terms as they relate to aging. Previous experiments have used simple measures(reaction time, number of items retained, etc.) to describe age-related differences in retrievalability, allowing for only qualitative discussions of concepts like WM efficiency and capacity.The fit parameters derived from our mathematical model provide quantitative measures thatrelate directly to these concepts: x-intercept and rate characterize the efficiency of WM retrieval(how soon information can be accessed and how quickly it accumulates), whereas asymptotecharacterizes capacity (how much information can accumulate) in units of discriminability.Below we discuss how the rate and asymptote parameters inform past research.
The rate parameter may be a better measure of WM speed than reaction time because it avoidsthe conflation of efficiency and capacity. For example, Holtzer et al. (2004) measured retrievalefficiency in terms of reaction time and found that when the memory set size gets large (e.g.,six letters), response accuracy drops in older adults but not in young adults. This finding revealsa difference in WM capacity that complicates estimates of WM efficiency in terms of speed(Stern et al., 2008; Zarahn et al., 2005). The rate parameter derived in the present studyexplicitly accounts for SAT, encompassing the relationship between the duration and theeffectiveness of the retrieval process. Moreover, this parameter is computed simultaneouslywith estimates of the fastest effective memory processing (x-intercept) and the maximumefficacy of WM (asymptote). So the process for estimating the rate parameter takes into accountthe important distinction between the amount of information that is immediately available toWM and the amount of information that can be recalled at all (cf. Sternberg, 1966). In additionto providing a good quantitative measure of WM efficiency, the age-related impairment of rateaffirms previous studies that have shown aging to specifically impair the speed of WM retrieval(e.g., Holtzer et al., 2004; Salthouse, 1992; Salthouse & Babcock, 1991).
The asymptote effect affirms previous assertions that aging limits the capacity of WM (e.g.,Zacks & Hasher, 1993); and like rate, the asymptote parameter provides an improvedcharacterization of capacity. Although previous aging research has commonly measuredcapacity as the quantity of information (e.g., number of items) that can be processed beforememory failure occurs (e.g., Anders et al., 1972; Holtzer et al., 2004), asymptote measuresone’s maximum ability to use available information. Age-related impairment may involvesimilar mechanisms for both concepts of capacity. That is, if aging impairs a cognitive functionthat is relevant to a variety of tasks, such as attention (e.g., Greenwood & Parasuraman,2004; West, 2004), this could result in decreased WM capacity regardless of how capacity ismeasured. But because asymptote quantifies the accuracy of WM, it is more broadly applicableto theoretical assertions about capacity.
In these ways, characterizing the retrieval process with the SAT model parameters hasconceptual advantages over previous approaches that have used individual, direct measures ofperformance. The present method for modeling SAT may also prove useful in manipulationsof the encoding and rehearsal processes. For example, an experiment similar to the current
Kumar et al. Page 13
Psychol Aging. Author manuscript; available in PMC 2009 June 8.
NIH
-PA Author Manuscript
NIH
-PA Author Manuscript
NIH
-PA Author Manuscript
study in which the timing of the presentation stimulus is manipulated instead of the probe couldprovide similarly meaningful measures of WM encoding dynamics, demonstrating the specificeffects of aging on encoding ability.
A quantitative characterization of WM efficiency and capacity also provides a useful bridgeto understanding cognitive reserve. CR insulates aging individuals from the cognitiveconsequences of degenerative neuropathology (Stern, 2002; Stern et al., 2005). We testedproxies of CR as predictors for our fit parameters, and we found that CR provides resistanceagainst age-related impairments in WM efficiency (rate) but not WM capacity (asymptote).To whatever extent the efficiency of WM retrieval decreases over one’s lifetime, individualdifferences in IQ, vocabulary, and education modulate the degree of natural memory loss. Otherfactors that have been shown to impart reserve, such as occupational attainment and leisureactivity (Evans et al., 1993; Stern et al., 1994), are likely to temper the loss of efficiency aswell. On the other hand, the extent to which aging impairs the capacity of WM retrieval isindependent of these reserve-related factors.
Prior research has shown a relationship between measures of CR and the activation ofindividual brain regions or brain-wide networks (Habeck et al., 2005; Stern et al., 2003,2005). Stern (2002) has hypothesized that one aspect of the implementation of CR is neuralreserve, which involves individual differences in unimpaired cognitive networks (those usedby young, healthy individuals), particularly with respect to the efficiency and capacity offunctional memory networks. The modulating effect of CR on WM retrieval efficiencyobserved in the present study may also extend to neural efficiency, in that individuals withgreater CR can ramp up neural activation more quickly as task demands increase. Similarly,the absence of a CR effect on WM retrieval capacity may also extend to neural capacity, inthat the degree of neural activation an individual can achieve is only a function of age and notof CR. We cannot definitively address these issues in a behavioral paradigm. Futureneuroimaging studies that employ the RSM along with CR measures will clarify how reservemodulates neural activation associated with WM, while providing a quantitativecharacterization of WM retrieval dynamics.
AcknowledgmentsThis work was supported by Grant R01-AG26158 from the National Institute on Aging.
ReferencesAlbert MS, Jones K, Savage CR, Berkman L, Seeman T, Blazer D, Rowe JW. Predictors of cognitive
change in older persons: MacArthur studies of successful aging. Psychology and Aging 1995;10:578–589. [PubMed: 8749585]
Albert SM, Teresi JA. Reading ability, education, and cognitive status assessment among older adults inHarlem, New York City. American Journal of Public Health 1999;89:95–97. [PubMed: 9987476]
Alexander GE, Furey ML, Grady CL, Pietrini P, Brady DR, Mentis MJ, Schapiro MB. Association ofpremorbid intellectual function with cerebral metabolism in Alzheimer’s disease: Implications for thecognitive reserve hypothesis. American Journal of Psychiatry 1997;154:165–172. [PubMed: 9016263]
Anders T, Fozard J, Lillyquist T. Effects of age upon retrieval from short-term memory. DevelopmentalPsychology 1972;6:214–217.
Anderson JR, Qin Y, Jung KJ, Carter CS. Information-processing modules and their relative modalityspecificity. Cognitive Psychology 2007;54:185–217. [PubMed: 16919255]
Anderson ND, Craik FIM, Naveh-Benjamin M. The attentional demands of encoding and retrieval inyounger and older adults: Evidence from divided attention costs. Psychology and Aging 1998;13:405–423. [PubMed: 9793117]
Kumar et al. Page 14
Psychol Aging. Author manuscript; available in PMC 2009 June 8.
NIH
-PA Author Manuscript
NIH
-PA Author Manuscript
NIH
-PA Author Manuscript
Awh E, Jonides J, Smith EE, Schumacher E, Koeppe R, Katz S. Dissociation of storage and rehearsal inworking memory: Evidence from positron emission tomography. Psychological Science 1996;7:25–31.
Baddeley, AD.; Hitch, G. Working memory. In: Bower, GH., editor. The psychology of learning andmotivation: Advances in research and theory. Vol. Vol. 8. Academic Press; New York: 1974. p. 47-89.
Boldini A, Russo R, Avons SE. One process is not enough! A speed—accuracy tradeoff study ofrecognition memory. Psychonomic Bulletin and Review 2004;11:353–361. [PubMed: 15260205]
Butler SM, Ashford JW, Snowdon DA. Age, education, and changes in the Mini-Mental State Examscores of older women: Findings from the Nun Study. Journal of the American Geriatric Society1996;44:675–681.
Chodosh J, Reuben DB, Albert MS, Seeman TE. Predicting cognitive impairment in high-functioningcommunity-dwelling older persons: MacArthur Studies of Successful Aging. Journal of the AmericanGeriatric Society 2002;50:1051–1060.
Christensen H, Korten AE, Jorm AF, Henderson AS, Jacomb PA, Rodgers B, Mackinnon AJ. Educationand decline in cognitive performance: Compensatory but not protective. International Journal ofGeriatric Psychiatry 1997;12:323–330. [PubMed: 9152716]
Cohen J, MacWhinney B, Flatt M, Provost J. PsyScope: An interactive graphic system for designing andcontrolling experiments in the psychology laboratory using Macintosh computers. Behavior ResearchMethods, Instruments, & Computers 1993;25:257–271.
Colsher PL, Wallace RB. Longitudinal application of cognitive function measures in a defined populationof community-dwelling elders. Annals of Epidemiology 1991;1:215–230. [PubMed: 1669503]
Corbett AT, Wickelgren WA. Semantic memory retrieval: Analysis by speed—accuracy tradeofffunctions. Quarterly Journal of Experimental Psychology 1978;30:1–15. [PubMed: 635098]
Corral M, Rodríguez M, Amenedo E, Sánchez JL, Díaz F. Cognitive reserve, age, and neuropsychologicalperformance in healthy participants. Developmental Neuropsychology 2006;29:479–491. [PubMed:16671863]
Dosher BA. Discriminating preexperimental (semantic) from learned (episodic) associations: A speed—accuracy study. Cognitive Psychology 1984;16:519–555.
Dosher BA, McElree B, Hood RM, Rosedale G. Retrieval dynamics of priming in recognition memory:Bias and discrimination analysis. Journal of Experimental Psychology: Learning, Memory, andCognition 1989;15:868–886.
Eriksen CW, Hamlin RM, Daye C. Aging adults and rate of memory scan. Bulletin of the PsychonomicSociety 1973;1:259–260.
Evans DA, Beckett LA, Albert MS, Hebert LE, Scherr PA, Funkenstein HH, Taylor JO. Level ofeducation and change in cognitive function in a community population of older persons. Annals ofEpidemiology 1993;3:71–77. [PubMed: 8287159]
Farmer ME, Kittner SJ, Rae DS, Bartko JJ, Regier DA. Education and change in cognitive function—The Epidemiologic Catchment Area Study. Annals of Epidemiology 1995;5:1–7. [PubMed:7728280]
Gazzaley A, Sheridan MA, Cooney JW, D’Esposito M. Age-related deficits in component processes ofworking memory. Neuropsychology 2007;21:532–539. [PubMed: 17784801]
Gold DP, Andres D, Etezadi J, Arbuckle T, Schwartzman A, Chaikelson J. Structural equation model ofintellectual change and continuity and predictors of intelligence in older men. Psychology and Aging1995;10:294–303. [PubMed: 7662188]
Grady CL, Craik FIM. Changes in memory processing with age. Current Opinions in Neurobiology2000;10:224–231.
Greenwood PM, Parasuraman R. The scaling of spatial attention in visual search and its modification inhealthy aging. Perception & Psychophysics 2004;66:3–22. [PubMed: 15095936]
Grober E, Sliwinsky M. Development and validation of a model for estimating premorbid verbalintelligence in the elderly. Journal of Clinical and Experimental Neuropsychology 1991;27:618–623.
Habeck C, Rakitin BC, Moeller J, Scarmeas N, Zarahn E, Brown T, Stern Y. An event-related fMRIstudy of the neural networks underlying the encoding, maintenance, and retrieval phase in a delayed-match-to-sample task. Cognitive Brain Research 2005;18:306–321. [PubMed: 14741317]
Kumar et al. Page 15
Psychol Aging. Author manuscript; available in PMC 2009 June 8.
NIH
-PA Author Manuscript
NIH
-PA Author Manuscript
NIH
-PA Author Manuscript
Hintzman DL, Caulton DA. Recognition memory and modality judgments: A comparison of retrievaldynamics. Journal of Memory and Language 1997;37:1–23.
Hintzman DL, Caulton DA, Curran T. Retrieval constraints and the mirror effect. Journal of ExperimentalPsychology: Learning, Memory, and Cognition 1994;20:275–289.
Hintzman DL, Curran T. Retrieval dynamics of recognition and frequency judgments: Evidence forseparate processes of familiarity and recall. Journal of Memory and Language 1994;33:1–18.
Holtzer R, Stern Y, Rakitin BC. Age-related differences in executive control of working memory.Memory & Cognition 2004;32:1333–1345.
Holtzer R, Stern Y, Rakitin BC. Predicting age related dual task effects with individual differences onneuropsychological tests. Neuropsychology 2005;19:18–27. [PubMed: 15656759]
Hultsch DF, Hertzog C, Small GW, Dixon RA. Use it or lose it: Engaged lifestyle as a buffer of cognitivedecline in aging? Psychology & Aging 1999;14:245–263. [PubMed: 10403712]
Jonides J, Lacey SC, Nee DE. Processes of working memory in mind and brain. Current Directions inPsychological Science 2005;14:2–5.
Jonides J, Schumacher EH, Smith EE, Lauber EJ, Awh E, Minoshima S, Koeppe RA. Verbal workingmemory load affects regional brain activation as Measured by PET. Journal of CognitiveNeuroscience 1997;9:462–475.
Lucas JA, Icnick RJ, Smith GE, Bohac DL, Tangalos EG, Kokmen E, Graff-Radford NR, Petersen RC.Normative data for the Mattis Dementia Rating Scale. Journal of Clinical and ExperimentalNeuropsychology 1998;20:536–547. [PubMed: 9892057]
Lyketsos CG, Chen LS, Anthony JC. Cognitive decline in adulthood: An 11.5-year follow-up of theBaltimore Epidemiologic Catchment Area study. American Journal of Psychiatry 1999;156:58–65.[PubMed: 9892298]
Manly JJ, Touradji P, Tang M-X, Stern Y. Literacy and memory decline among ethnically diverse elders.Journal of Clinical Experimental Neuropsychology 2003;5:680–690.
Mattis, S. Dementia Rating Scale: Professional manual. Psychological Assessment Resources; Odessa,FL: 1988.
McElree B, Dosher BA. Serial retrieval processes in the recovery of order information. Journal ofExperimental Psychology: General 1993;122:291–315.
Mortel KF, Meyer JS, Herod B, Thornby J. Education and occupation as risk factors for dementias of theAlzheimer and ischemic vascular types. Dementia 1995;6:55–62. [PubMed: 7728220]
Niemi P, Naatanen R. Foreperiod and simple reaction time. Psychological Bulletin 1981;89:133–162.Oberauer K. Removing irrelevant information from working memory. A cognitive aging study with the
modified Sternberg task. Journal of Experimental Psychology: Learning, Memory, and Cognition2001;27:948–957.
Reed AV. Speed-accuracy tradeoff in recognition memory. Science 1973;181:574–576. [PubMed:17777808]
Reed AV. The time course of recognition in human memory. Memory & Cognition 1976;4:16–30.Rocca WA, Bonaiuto S, Lippi A, Luciani P, Turtù F, Cavarzeran F, Amaducci L. Prevalence of clinically
diagnosed Alzheimer’s disease and other dementing disorders: A door-to-door survey in Appignano,Macerata Province, Italy. Neurology 1990;40:626–631. [PubMed: 2320236]
Rypma B, D’Esposito M. The roles of prefrontal brain regions in components of working memory: Effectsof memory load and individual differences. Proceedings of the National Academy of Sciences of theUSA 1999;96:6558–6563. [PubMed: 10339627]
Rypma B, Eldreth DA, Rebbechi D. Age-related differences in activation-performance relations indelayed-response tasks: A multiple component analysis. Cortex 2007;43:65–76. [PubMed:17334208]
Rypma B, Prabhakaran V, Desmond JE, Gabrieli JDE. Age differences in prefrontal cortical activity inworking memory. Psychology and Aging 2001;16:371–384. [PubMed: 11554517]
Salthouse TA. Influence of processing speed on adult age differences in working memory. ActaPsychologica 1992;79:155–170. [PubMed: 1598844]
Salthouse TA, Babcock RL. Decomposing adult age differences in working memory. DevelopmentalPsychology 1991;27:763–776.
Kumar et al. Page 16
Psychol Aging. Author manuscript; available in PMC 2009 June 8.
NIH
-PA Author Manuscript
NIH
-PA Author Manuscript
NIH
-PA Author Manuscript
Scarmeas N, Levy G, Tang MX, Manly J, Stern Y. Influence of leisure activity on the incidence ofAlzheimer’s disease. Neurology 2001;57:2236–2242. [PubMed: 11756603]
Scarmeas N, Zarahn E, Anderson KE, Honig LS, Park A, Hilton J, Flynn J, Sackeim H, Stern Y. Cognitivereserve mediated modulation of PET activations during memory tasks in Alzheimer’s disease.Archives of Neurology 2004;61:73–78. [PubMed: 14732623]
Schaie KW. Midlife influences upon intellectual functioning in old age. International Journal of Behavior& Development 1984;7:463–478.
Siegel, S. Nonparametric statistics for the behavioral sciences. McGraw-Hill; New York: 1956.Snodgrass JG, Corwin J. Pragmatics of measuring recognition memory: Applications to dementia and
amnesia. Journal of Experimental Psychology: General 1988;117:34–50. [PubMed: 2966230]Snowdon DA, Ostwald SK, Kane RL. Education, survival, and independence in elderly Catholic sisters,
1936–1988. American Journal of Epidemiology 1989;130:999–1012. [PubMed: 2816907]Solé-Padullés C, Bartrés-Faz D, Junqué C, Vendrell P, Rami L, Clemente IC, et al. Brain structure and
function related to cognitive reserve variables in normal aging, mild cognitive impairment andAlzheimer’s disease. Neurobiology of Aging. 2007Epub ahead of print. doi:10.1016/j.neurobiolaging.2007.10.008
Stern Y. What is cognitive reserve? Theory and research application of the reserve concept. Journal ofthe International Neuropsychological Society 2002;8:448–460. [PubMed: 11939702]
Stern Y, Gurland B, Tatemichi TK, Tang M-X, Wilder D, Mayeux R. Influence of education andoccupation on the incidence of Alzheimer’s disease. Journal of the American Medical Association1994;271:1004–1010. [PubMed: 8139057]
Stern Y, Habeck C, Moeller J, Scarmeas N, Anderson KE, Hilton HJ, et al. Brain networks associatedwith cognitive reserve in healthy young and old adults. Cerebral Cortex 2005;15:394–402. [PubMed:15749983]
Stern Y, Zarahn E, Habeck C, Holtzer R, Rakitin BC, Kumar A, et al. A common neural network forcognitive reserve in verbal and object working memory in young but not old. Cerebral Cortex2008;18:959–967. [PubMed: 17675368]
Stern Y, Zarahn E, Hilton HJ, Flynn J, DeLaPaz R, Rakitin B. Exploring the neural basis of cognitivereserve. Journal of Clinical and Experimental Neuropsychology 2003;5:691–701. [PubMed:12815506]
Sternberg S. High-speed scanning in human memory. Science 1966;153:652–654. [PubMed: 5939936]Wager TD, Smith EE. Neuroimaging studies of working memory: A meta-analysis. Cognitive, Affective,
and Behavioral Neuroscience 2003;3:255–274.Wechsler, D. Wechsler Adult Intelligence Scale—Revised. Psychological Corp; New York: 1981.West R. The effects of aging on controlled attention and conflict processing in the Stroop task. Journal
of Cognitive Neuroscience 2004;16:103–113. [PubMed: 15006040]Wickelgren W. Speed—accuracy tradeoff and information processing dynamics. Acta Psychologica
1977;41:67–85.Wilson RS, Bennett DA, Gilley DW, Beckett LA, Barnes LL, Evans DA. Premorbid reading activity and
patterns of cognitive decline in Alzheimer disease. Archives of Neurology 2000;57:1718–1723.[PubMed: 11115237]
Wilson RS, de Leon C. F. Mendes, Barnes LL, Schneider JA, Bienias JL, Evans DA, Bennett DA.Participation in cognitively stimulating activities and risk of incident Alzheimer disease. Journal ofthe American Medical Association 2002;287:742–748. [PubMed: 11851541]
Zacks, RT.; Hasher, L. Capacity theory and the processing of inferences. In: Light, L.; Burke, DM.,editors. Language, memory, and aging. Cambridge University Press; New York: 1993. p. 154-170.
Zarahn E, Rakitin B, Abela D, Flynn J, Stern Y. Positive evidence against human hippocampalinvolvement in working memory maintenance of familiar stimuli. Cerebral Cortex 2005;15:303–316.[PubMed: 15342440]
Zarahn E, Rakitin BC, Abela D, Flynn J, Stern Y. Distinct spatial patterns of brain activity associatedwith memory storage and search. NeuroImage 2006;33:794–804. [PubMed: 16962794]
Zarahn E, Rakitin B, Abela D, Flynn J, Stern Y. Age-related changes in brain activation during a delayeditem recognition task. Neurobiology of Aging 2007;28:784–798. [PubMed: 16621168]
Kumar et al. Page 17
Psychol Aging. Author manuscript; available in PMC 2009 June 8.
NIH
-PA Author Manuscript
NIH
-PA Author Manuscript
NIH
-PA Author Manuscript
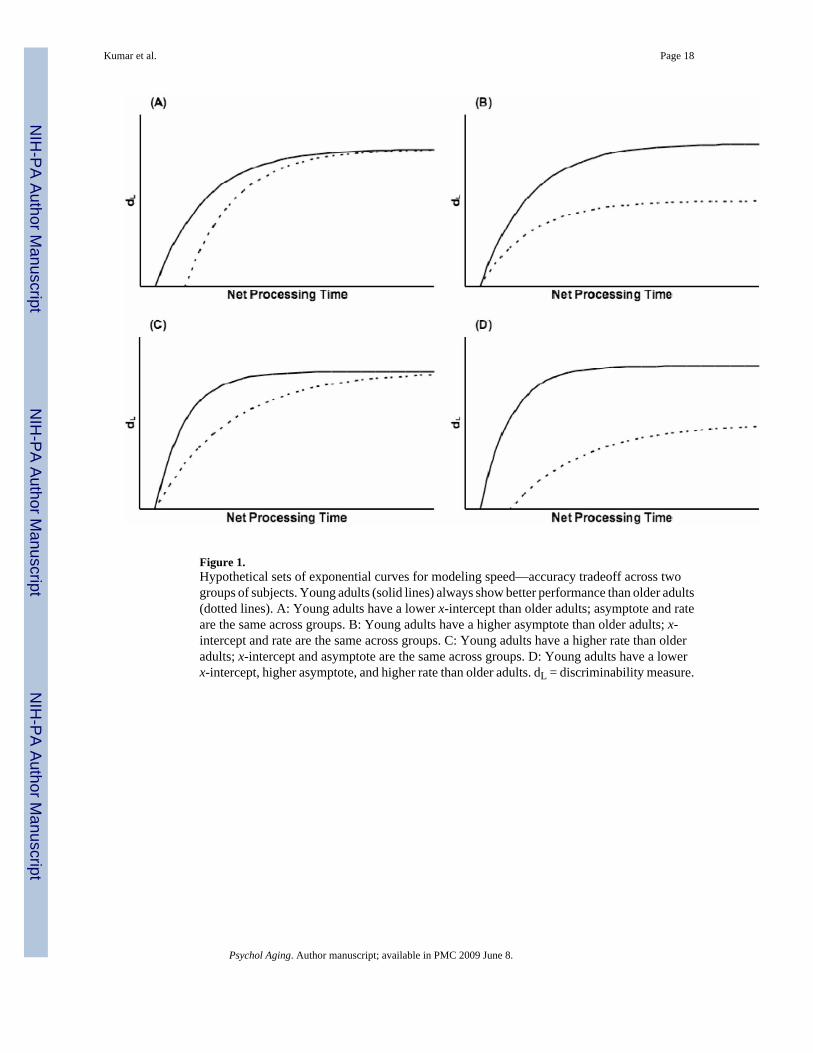
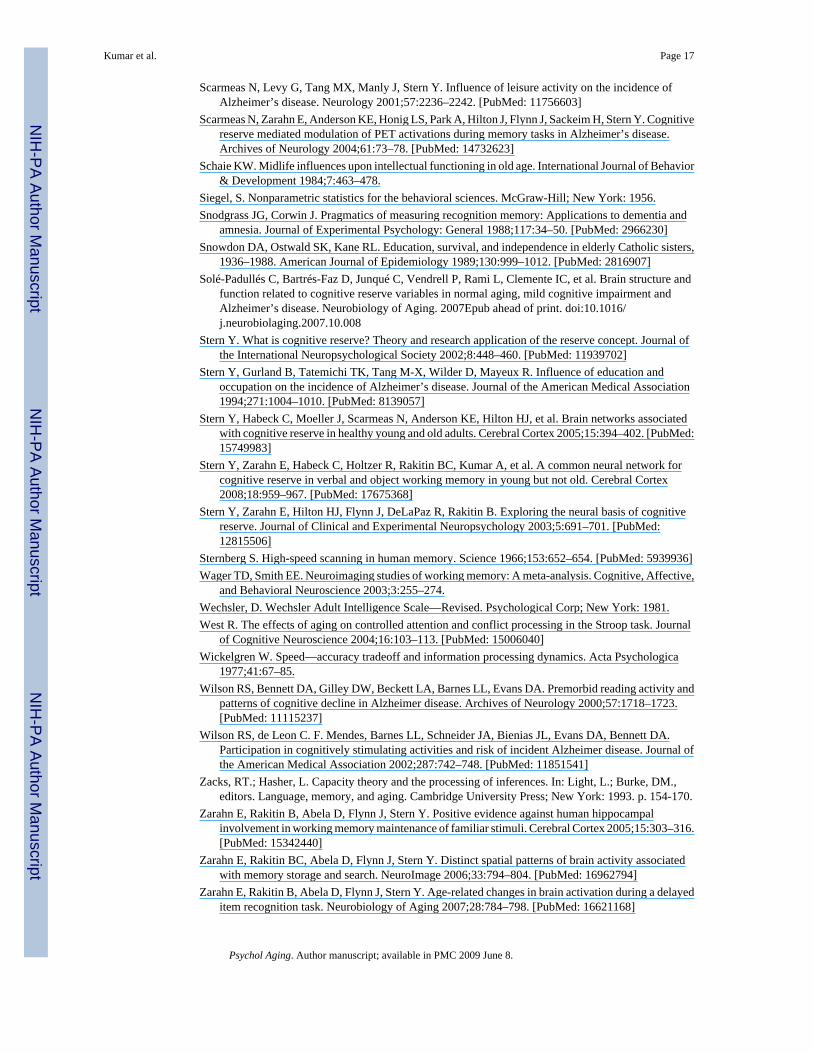
Figure 1.Hypothetical sets of exponential curves for modeling speed—accuracy tradeoff across twogroups of subjects. Young adults (solid lines) always show better performance than older adults(dotted lines). A: Young adults have a lower x-intercept than older adults; asymptote and rateare the same across groups. B: Young adults have a higher asymptote than older adults; x-intercept and rate are the same across groups. C: Young adults have a higher rate than olderadults; x-intercept and asymptote are the same across groups. D: Young adults have a lowerx-intercept, higher asymptote, and higher rate than older adults. dL = discriminability measure.
Kumar et al. Page 18
Psychol Aging. Author manuscript; available in PMC 2009 June 8.
NIH
-PA Author Manuscript
NIH
-PA Author Manuscript
NIH
-PA Author Manuscript
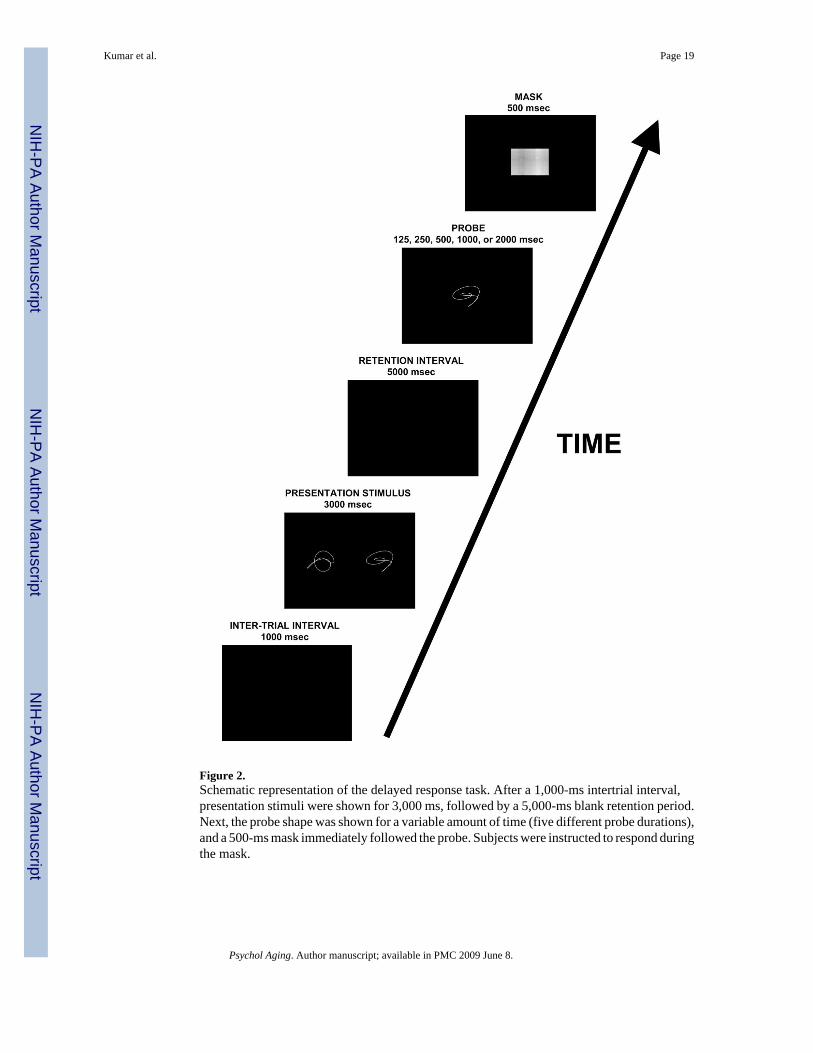
Figure 2.Schematic representation of the delayed response task. After a 1,000-ms intertrial interval,presentation stimuli were shown for 3,000 ms, followed by a 5,000-ms blank retention period.Next, the probe shape was shown for a variable amount of time (five different probe durations),and a 500-ms mask immediately followed the probe. Subjects were instructed to respond duringthe mask.
Kumar et al. Page 19
Psychol Aging. Author manuscript; available in PMC 2009 June 8.
NIH
-PA Author Manuscript
NIH
-PA Author Manuscript
NIH
-PA Author Manuscript
Figure 3.Examples of the experimental shapes. Each row is a given trial: The first two columns are thepresentation shapes, and the last column is the probe shape. The three shapes of each trial (row)are matched for complexity by mean pixel ratio. True negative trials are represented in Rows1 and 3. True positive trials are represented in Rows 2 and 4. From “Age-related differencesin executive control of working memory,” R. Holtzer, Y. Stern, and B. C. Rakitin, 2004,Memory & Cognition, 32, Appendix, p. 1345. Copyright 2004 by the Psychonomic Society.
Kumar et al. Page 20
Psychol Aging. Author manuscript; available in PMC 2009 June 8.
NIH
-PA Author Manuscript
NIH
-PA Author Manuscript
NIH
-PA Author Manuscript
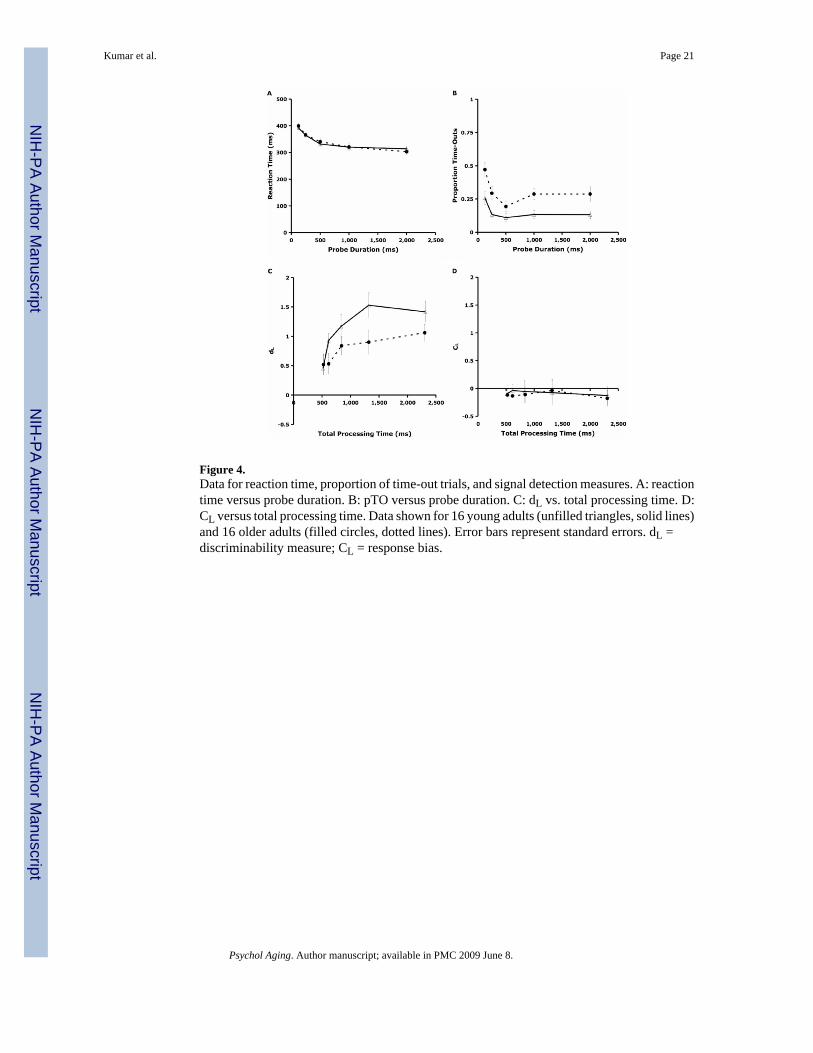
Figure 4.Data for reaction time, proportion of time-out trials, and signal detection measures. A: reactiontime versus probe duration. B: pTO versus probe duration. C: dL vs. total processing time. D:CL versus total processing time. Data shown for 16 young adults (unfilled triangles, solid lines)and 16 older adults (filled circles, dotted lines). Error bars represent standard errors. dL =discriminability measure; CL = response bias.
Kumar et al. Page 21
Psychol Aging. Author manuscript; available in PMC 2009 June 8.
NIH
-PA Author Manuscript
NIH
-PA Author Manuscript
NIH
-PA Author Manuscript
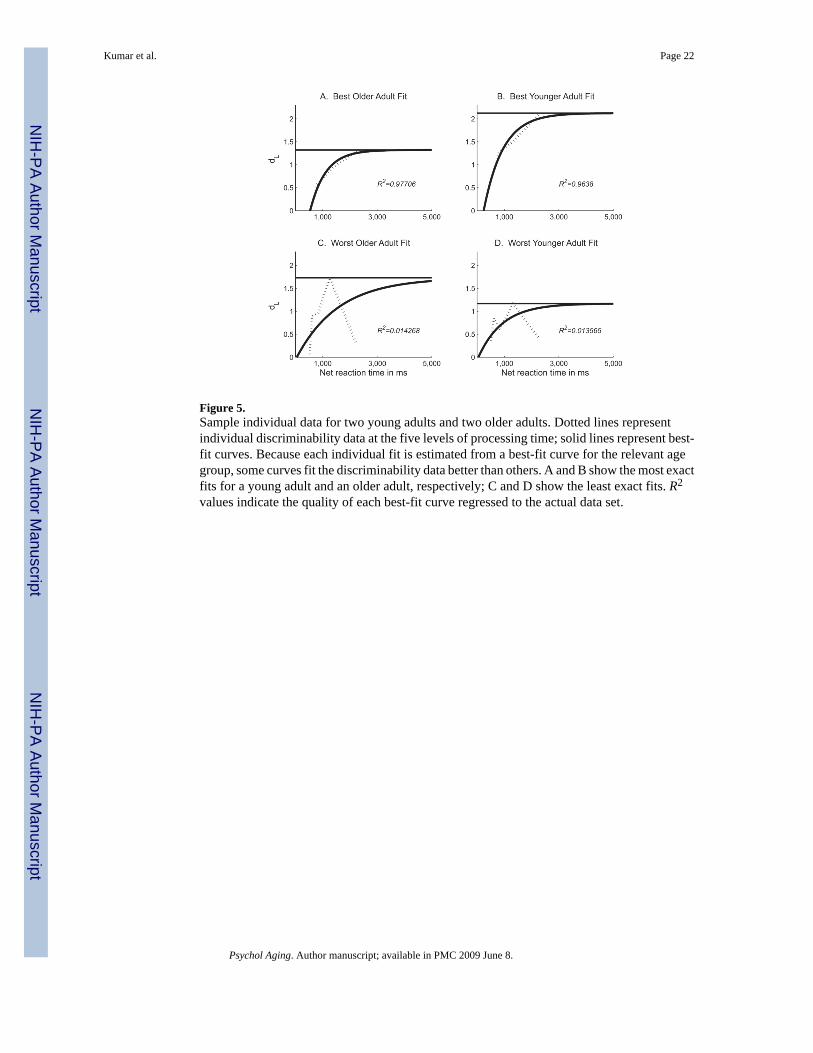
Figure 5.Sample individual data for two young adults and two older adults. Dotted lines representindividual discriminability data at the five levels of processing time; solid lines represent best-fit curves. Because each individual fit is estimated from a best-fit curve for the relevant agegroup, some curves fit the discriminability data better than others. A and B show the most exactfits for a young adult and an older adult, respectively; C and D show the least exact fits. R2
values indicate the quality of each best-fit curve regressed to the actual data set.
Kumar et al. Page 22
Psychol Aging. Author manuscript; available in PMC 2009 June 8.
NIH
-PA Author Manuscript
NIH
-PA Author Manuscript
NIH
-PA Author Manuscript
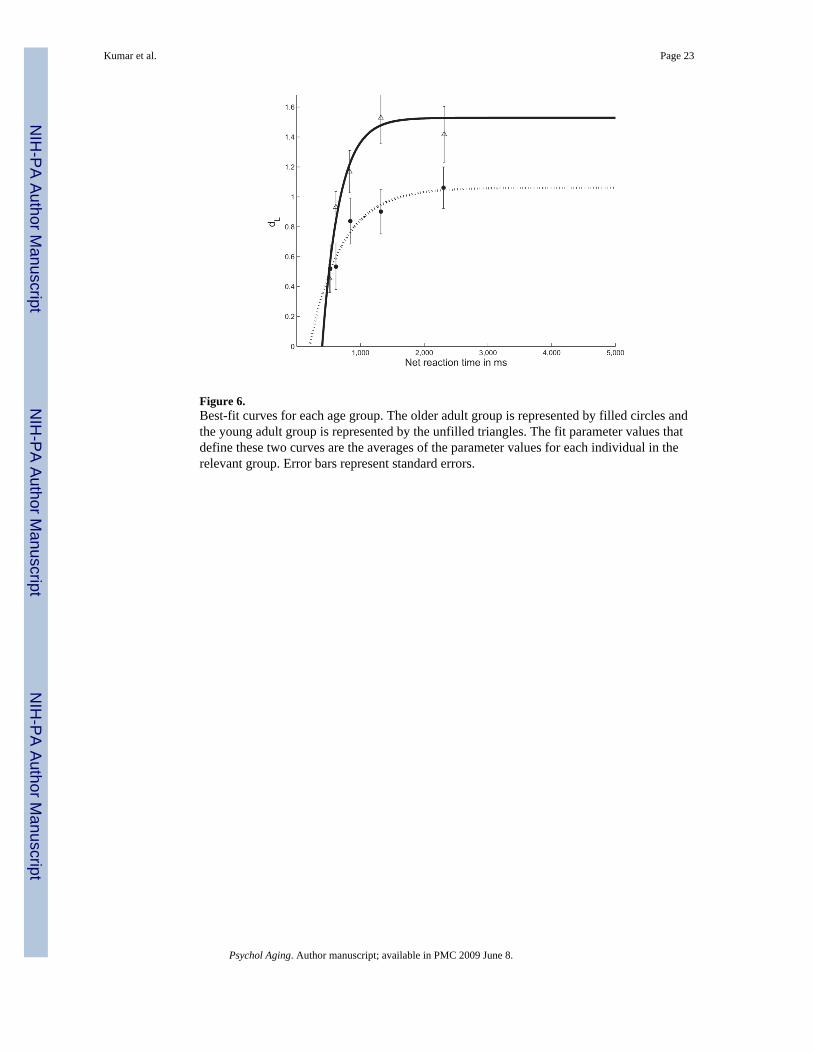
Figure 6.Best-fit curves for each age group. The older adult group is represented by filled circles andthe young adult group is represented by the unfilled triangles. The fit parameter values thatdefine these two curves are the averages of the parameter values for each individual in therelevant group. Error bars represent standard errors.
Kumar et al. Page 23
Psychol Aging. Author manuscript; available in PMC 2009 June 8.
NIH
-PA Author Manuscript
NIH
-PA Author Manuscript
NIH
-PA Author Manuscript
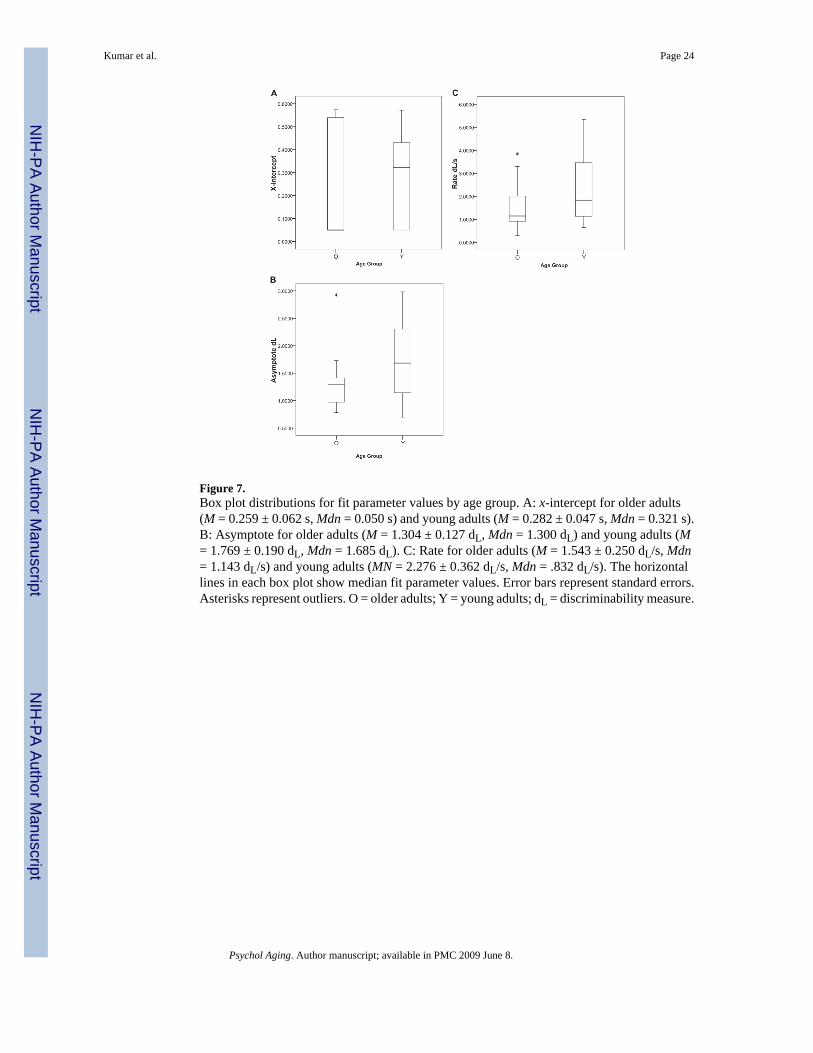
Figure 7.Box plot distributions for fit parameter values by age group. A: x-intercept for older adults(M = 0.259 ± 0.062 s, Mdn = 0.050 s) and young adults (M = 0.282 ± 0.047 s, Mdn = 0.321 s).B: Asymptote for older adults (M = 1.304 ± 0.127 dL, Mdn = 1.300 dL) and young adults (M= 1.769 ± 0.190 dL, Mdn = 1.685 dL). C: Rate for older adults (M = 1.543 ± 0.250 dL/s, Mdn= 1.143 dL/s) and young adults (MN = 2.276 ± 0.362 dL/s, Mdn = .832 dL/s). The horizontallines in each box plot show median fit parameter values. Error bars represent standard errors.Asterisks represent outliers. O = older adults; Y = young adults; dL = discriminability measure.
Kumar et al. Page 24
Psychol Aging. Author manuscript; available in PMC 2009 June 8.
NIH
-PA Author Manuscript
NIH
-PA Author Manuscript
NIH
-PA Author Manuscript
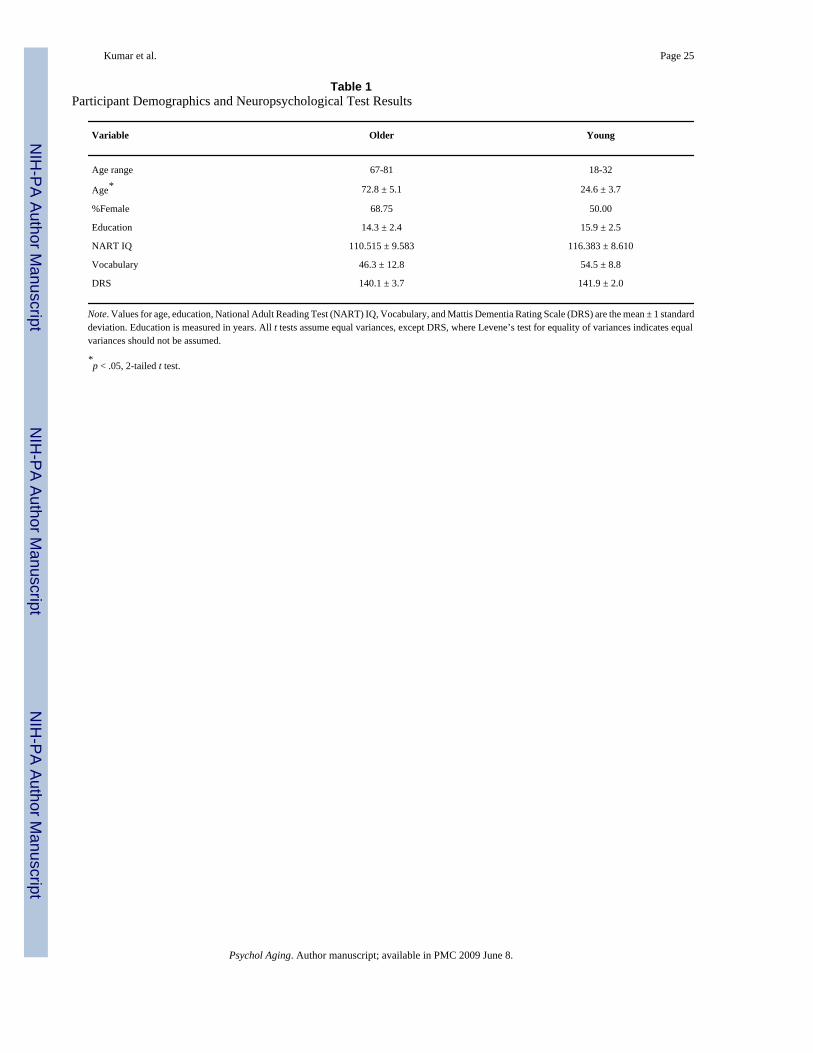
NIH
-PA Author Manuscript
NIH
-PA Author Manuscript
NIH
-PA Author Manuscript
Kumar et al. Page 25
Table 1Participant Demographics and Neuropsychological Test Results
Variable Older Young
Age range 67-81 18-32
Age* 72.8 ± 5.1 24.6 ± 3.7
%Female 68.75 50.00
Education 14.3 ± 2.4 15.9 ± 2.5
NART IQ 110.515 ± 9.583 116.383 ± 8.610
Vocabulary 46.3 ± 12.8 54.5 ± 8.8
DRS 140.1 ± 3.7 141.9 ± 2.0
Note. Values for age, education, National Adult Reading Test (NART) IQ, Vocabulary, and Mattis Dementia Rating Scale (DRS) are the mean ± 1 standarddeviation. Education is measured in years. All t tests assume equal variances, except DRS, where Levene’s test for equality of variances indicates equalvariances should not be assumed.
*p < .05, 2-tailed t test.
Psychol Aging. Author manuscript; available in PMC 2009 June 8.

NIH
-PA Author Manuscript
NIH
-PA Author Manuscript
NIH
-PA Author Manuscript
Kumar et al. Page 26
Table 2Correlations Among the Three Fit Parameters
Variable x-intercept Asymptote Rate
Young adult group
x-intercept 1.000 0.086 0.771*
Asymptote 0.086 1.000 0.019
Rate 0.771* 0.019 1.000
Older adult group
x-intercept 1.000 -0.124 0.308
Asymptote -0.124 1.000 0.622
Rate 0.308 0.622 1.000
Note. Table shows Pearson correlation values.
*p < .05.
Psychol Aging. Author manuscript; available in PMC 2009 June 8.
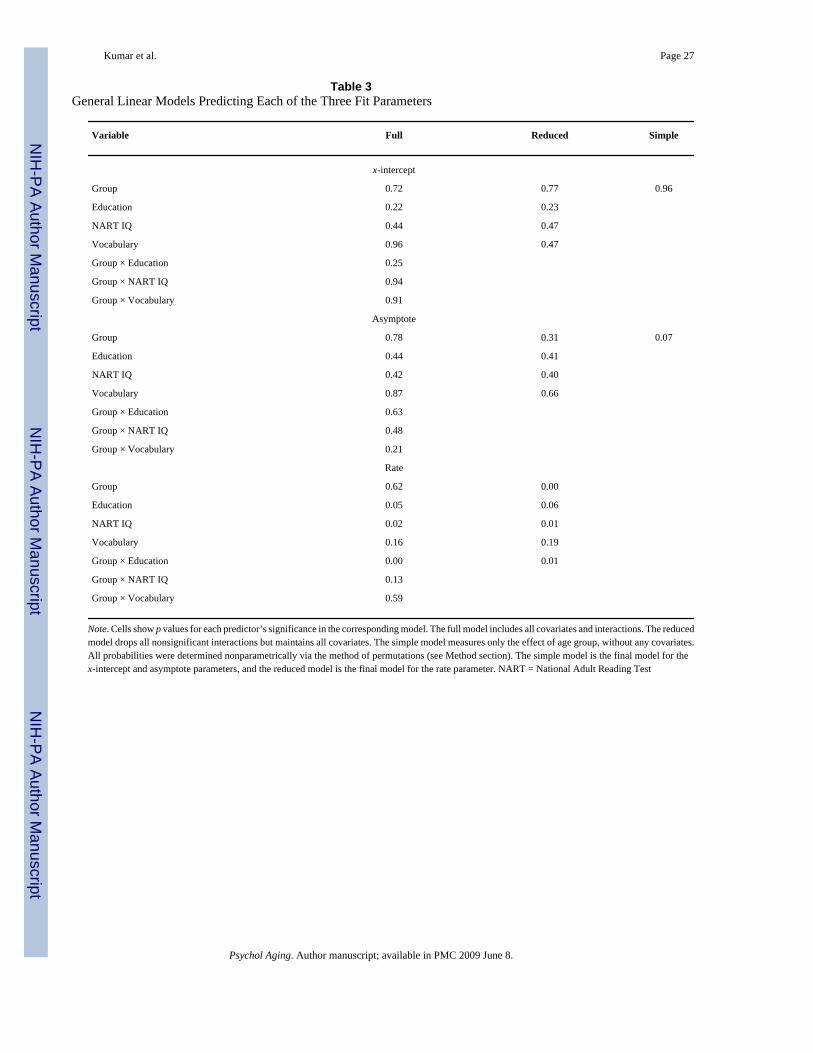
NIH
-PA Author Manuscript
NIH
-PA Author Manuscript
NIH
-PA Author Manuscript
Kumar et al. Page 27
Table 3General Linear Models Predicting Each of the Three Fit Parameters
Variable Full Reduced Simple
x-intercept
Group 0.72 0.77 0.96
Education 0.22 0.23
NART IQ 0.44 0.47
Vocabulary 0.96 0.47
Group × Education 0.25
Group × NART IQ 0.94
Group × Vocabulary 0.91
Asymptote
Group 0.78 0.31 0.07
Education 0.44 0.41
NART IQ 0.42 0.40
Vocabulary 0.87 0.66
Group × Education 0.63
Group × NART IQ 0.48
Group × Vocabulary 0.21
Rate
Group 0.62 0.00
Education 0.05 0.06
NART IQ 0.02 0.01
Vocabulary 0.16 0.19
Group × Education 0.00 0.01
Group × NART IQ 0.13
Group × Vocabulary 0.59
Note. Cells show p values for each predictor’s significance in the corresponding model. The full model includes all covariates and interactions. The reducedmodel drops all nonsignificant interactions but maintains all covariates. The simple model measures only the effect of age group, without any covariates.All probabilities were determined nonparametrically via the method of permutations (see Method section). The simple model is the final model for thex-intercept and asymptote parameters, and the reduced model is the final model for the rate parameter. NART = National Adult Reading Test
Psychol Aging. Author manuscript; available in PMC 2009 June 8.