Viguiera Kunth (Asteraceae, Heliantheae) na América do Sul ...
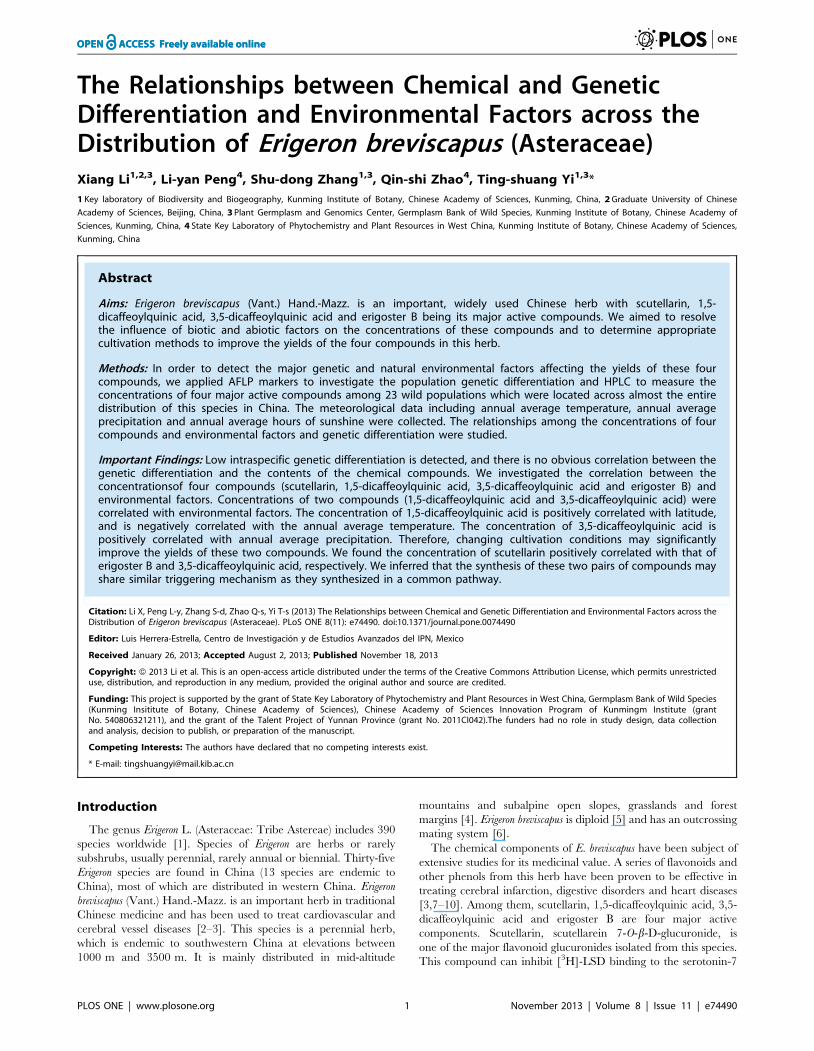
The Relationships between Chemical and GeneticDifferentiation and Environmental Factors across theDistribution of Erigeron breviscapus (Asteraceae)Xiang Li1,2,3, Li-yan Peng4, Shu-dong Zhang1,3, Qin-shi Zhao4, Ting-shuang Yi1,3*
1 Key laboratory of Biodiversity and Biogeography, Kunming Institute of Botany, Chinese Academy of Sciences, Kunming, China, 2 Graduate University of Chinese
Academy of Sciences, Beijing, China, 3 Plant Germplasm and Genomics Center, Germplasm Bank of Wild Species, Kunming Institute of Botany, Chinese Academy of
Sciences, Kunming, China, 4 State Key Laboratory of Phytochemistry and Plant Resources in West China, Kunming Institute of Botany, Chinese Academy of Sciences,
Kunming, China
Abstract
Aims: Erigeron breviscapus (Vant.) Hand.-Mazz. is an important, widely used Chinese herb with scutellarin, 1,5-dicaffeoylquinic acid, 3,5-dicaffeoylquinic acid and erigoster B being its major active compounds. We aimed to resolvethe influence of biotic and abiotic factors on the concentrations of these compounds and to determine appropriatecultivation methods to improve the yields of the four compounds in this herb.
Methods: In order to detect the major genetic and natural environmental factors affecting the yields of these fourcompounds, we applied AFLP markers to investigate the population genetic differentiation and HPLC to measure theconcentrations of four major active compounds among 23 wild populations which were located across almost the entiredistribution of this species in China. The meteorological data including annual average temperature, annual averageprecipitation and annual average hours of sunshine were collected. The relationships among the concentrations of fourcompounds and environmental factors and genetic differentiation were studied.
Important Findings: Low intraspecific genetic differentiation is detected, and there is no obvious correlation between thegenetic differentiation and the contents of the chemical compounds. We investigated the correlation between theconcentrationsof four compounds (scutellarin, 1,5-dicaffeoylquinic acid, 3,5-dicaffeoylquinic acid and erigoster B) andenvironmental factors. Concentrations of two compounds (1,5-dicaffeoylquinic acid and 3,5-dicaffeoylquinic acid) werecorrelated with environmental factors. The concentration of 1,5-dicaffeoylquinic acid is positively correlated with latitude,and is negatively correlated with the annual average temperature. The concentration of 3,5-dicaffeoylquinic acid ispositively correlated with annual average precipitation. Therefore, changing cultivation conditions may significantlyimprove the yields of these two compounds. We found the concentration of scutellarin positively correlated with that oferigoster B and 3,5-dicaffeoylquinic acid, respectively. We inferred that the synthesis of these two pairs of compounds mayshare similar triggering mechanism as they synthesized in a common pathway.
Citation: Li X, Peng L-y, Zhang S-d, Zhao Q-s, Yi T-s (2013) The Relationships between Chemical and Genetic Differentiation and Environmental Factors across theDistribution of Erigeron breviscapus (Asteraceae). PLoS ONE 8(11): e74490. doi:10.1371/journal.pone.0074490
Editor: Luis Herrera-Estrella, Centro de Investigacion y de Estudios Avanzados del IPN, Mexico
Received January 26, 2013; Accepted August 2, 2013; Published November 18, 2013
Copyright: � 2013 Li et al. This is an open-access article distributed under the terms of the Creative Commons Attribution License, which permits unrestricteduse, distribution, and reproduction in any medium, provided the original author and source are credited.
Funding: This project is supported by the grant of State Key Laboratory of Phytochemistry and Plant Resources in West China, Germplasm Bank of Wild Species(Kunming Insititute of Botany, Chinese Academy of Sciences), Chinese Academy of Sciences Innovation Program of Kunmingm Institute (grantNo. 540806321211), and the grant of the Talent Project of Yunnan Province (grant No. 2011CI042).The funders had no role in study design, data collectionand analysis, decision to publish, or preparation of the manuscript.
Competing Interests: The authors have declared that no competing interests exist.
* E-mail: [email protected]
Introduction
The genus Erigeron L. (Asteraceae: Tribe Astereae) includes 390
species worldwide [1]. Species of Erigeron are herbs or rarely
subshrubs, usually perennial, rarely annual or biennial. Thirty-five
Erigeron species are found in China (13 species are endemic to
China), most of which are distributed in western China. Erigeron
breviscapus (Vant.) Hand.-Mazz. is an important herb in traditional
Chinese medicine and has been used to treat cardiovascular and
cerebral vessel diseases [2–3]. This species is a perennial herb,
which is endemic to southwestern China at elevations between
1000 m and 3500 m. It is mainly distributed in mid-altitude
mountains and subalpine open slopes, grasslands and forest
margins [4]. Erigeron breviscapus is diploid [5] and has an outcrossing
mating system [6].
The chemical components of E. breviscapus have been subject of
extensive studies for its medicinal value. A series of flavonoids and
other phenols from this herb have been proven to be effective in
treating cerebral infarction, digestive disorders and heart diseases
[3,7–10]. Among them, scutellarin, 1,5-dicaffeoylquinic acid, 3,5-
dicaffeoylquinic acid and erigoster B are four major active
components. Scutellarin, scutellarein 7-O-b-D-glucuronide, is
one of the major flavonoid glucuronides isolated from this species.
This compound can inhibit [3H]-LSD binding to the serotonin-7
PLOS ONE | www.plosone.org 1 November 2013 | Volume 8 | Issue 11 | e74490
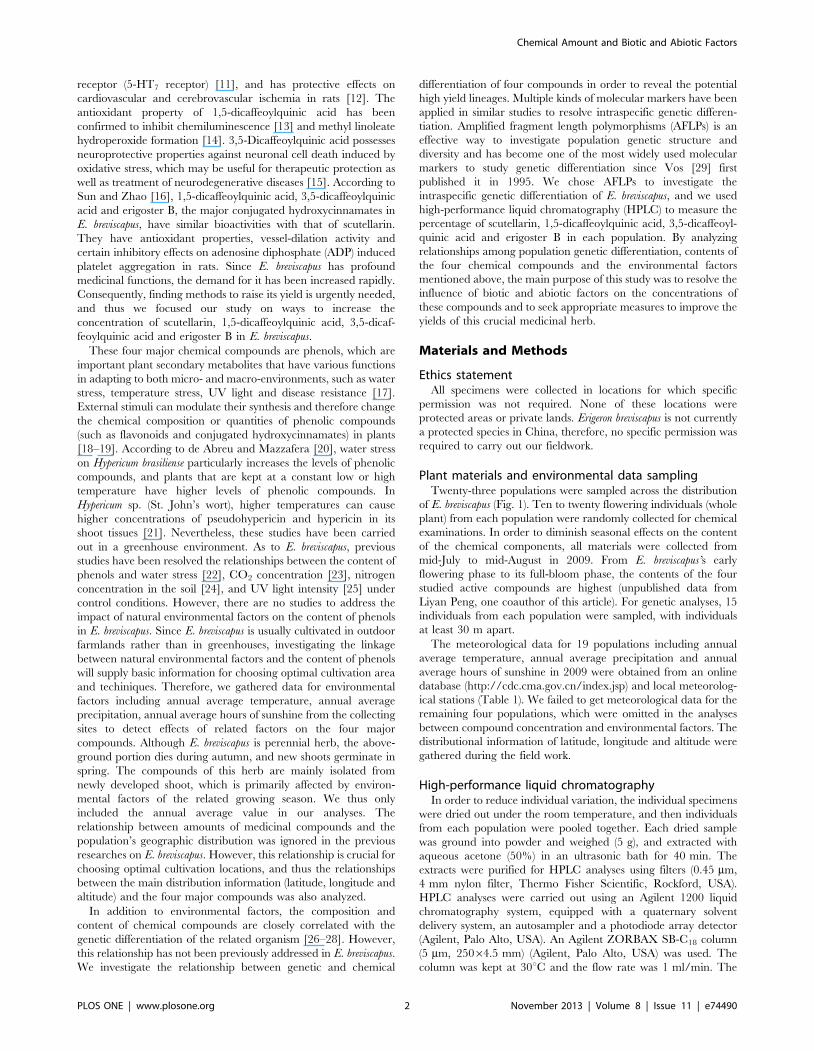
receptor (5-HT7 receptor) [11], and has protective effects on
cardiovascular and cerebrovascular ischemia in rats [12]. The
antioxidant property of 1,5-dicaffeoylquinic acid has been
confirmed to inhibit chemiluminescence [13] and methyl linoleate
hydroperoxide formation [14]. 3,5-Dicaffeoylquinic acid possesses
neuroprotective properties against neuronal cell death induced by
oxidative stress, which may be useful for therapeutic protection as
well as treatment of neurodegenerative diseases [15]. According to
Sun and Zhao [16], 1,5-dicaffeoylquinic acid, 3,5-dicaffeoylquinic
acid and erigoster B, the major conjugated hydroxycinnamates in
E. breviscapus, have similar bioactivities with that of scutellarin.
They have antioxidant properties, vessel-dilation activity and
certain inhibitory effects on adenosine diphosphate (ADP) induced
platelet aggregation in rats. Since E. breviscapus has profound
medicinal functions, the demand for it has been increased rapidly.
Consequently, finding methods to raise its yield is urgently needed,
and thus we focused our study on ways to increase the
concentration of scutellarin, 1,5-dicaffeoylquinic acid, 3,5-dicaf-
feoylquinic acid and erigoster B in E. breviscapus.
These four major chemical compounds are phenols, which are
important plant secondary metabolites that have various functions
in adapting to both micro- and macro-environments, such as water
stress, temperature stress, UV light and disease resistance [17].
External stimuli can modulate their synthesis and therefore change
the chemical composition or quantities of phenolic compounds
(such as flavonoids and conjugated hydroxycinnamates) in plants
[18–19]. According to de Abreu and Mazzafera [20], water stress
on Hypericum brasiliense particularly increases the levels of phenolic
compounds, and plants that are kept at a constant low or high
temperature have higher levels of phenolic compounds. In
Hypericum sp. (St. John’s wort), higher temperatures can cause
higher concentrations of pseudohypericin and hypericin in its
shoot tissues [21]. Nevertheless, these studies have been carried
out in a greenhouse environment. As to E. breviscapus, previous
studies have been resolved the relationships between the content of
phenols and water stress [22], CO2 concentration [23], nitrogen
concentration in the soil [24], and UV light intensity [25] under
control conditions. However, there are no studies to address the
impact of natural environmental factors on the content of phenols
in E. breviscapus. Since E. breviscapus is usually cultivated in outdoor
farmlands rather than in greenhouses, investigating the linkage
between natural environmental factors and the content of phenols
will supply basic information for choosing optimal cultivation area
and techiniques. Therefore, we gathered data for environmental
factors including annual average temperature, annual average
precipitation, annual average hours of sunshine from the collecting
sites to detect effects of related factors on the four major
compounds. Although E. breviscapus is perennial herb, the above-
ground portion dies during autumn, and new shoots germinate in
spring. The compounds of this herb are mainly isolated from
newly developed shoot, which is primarily affected by environ-
mental factors of the related growing season. We thus only
included the annual average value in our analyses. The
relationship between amounts of medicinal compounds and the
population’s geographic distribution was ignored in the previous
researches on E. breviscapus. However, this relationship is crucial for
choosing optimal cultivation locations, and thus the relationships
between the main distribution information (latitude, longitude and
altitude) and the four major compounds was also analyzed.
In addition to environmental factors, the composition and
content of chemical compounds are closely correlated with the
genetic differentiation of the related organism [26–28]. However,
this relationship has not been previously addressed in E. breviscapus.
We investigate the relationship between genetic and chemical
differentiation of four compounds in order to reveal the potential
high yield lineages. Multiple kinds of molecular markers have been
applied in similar studies to resolve intraspecific genetic differen-
tiation. Amplified fragment length polymorphisms (AFLPs) is an
effective way to investigate population genetic structure and
diversity and has become one of the most widely used molecular
markers to study genetic differentiation since Vos [29] first
published it in 1995. We chose AFLPs to investigate the
intraspecific genetic differentiation of E. breviscapus, and we used
high-performance liquid chromatography (HPLC) to measure the
percentage of scutellarin, 1,5-dicaffeoylquinic acid, 3,5-dicaffeoyl-
quinic acid and erigoster B in each population. By analyzing
relationships among population genetic differentiation, contents of
the four chemical compounds and the environmental factors
mentioned above, the main purpose of this study was to resolve the
influence of biotic and abiotic factors on the concentrations of
these compounds and to seek appropriate measures to improve the
yields of this crucial medicinal herb.
Materials and Methods
Ethics statementAll specimens were collected in locations for which specific
permission was not required. None of these locations were
protected areas or private lands. Erigeron breviscapus is not currently
a protected species in China, therefore, no specific permission was
required to carry out our fieldwork.
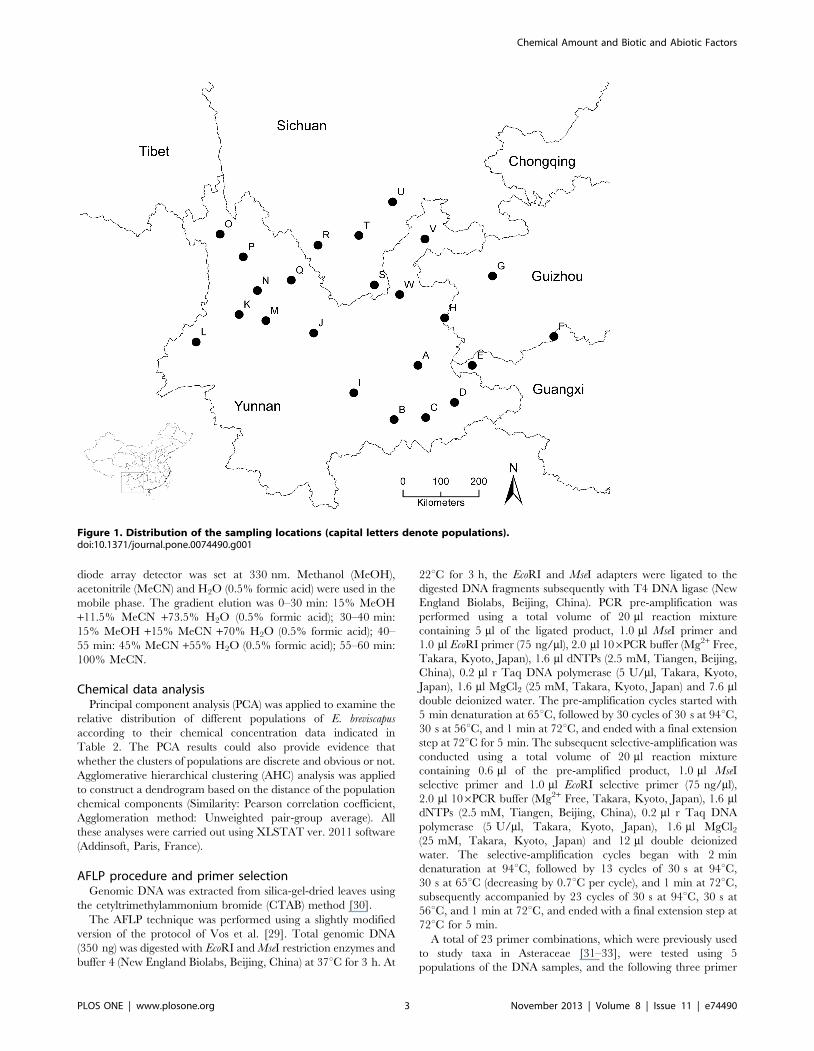
Plant materials and environmental data samplingTwenty-three populations were sampled across the distribution
of E. breviscapus (Fig. 1). Ten to twenty flowering individuals (whole
plant) from each population were randomly collected for chemical
examinations. In order to diminish seasonal effects on the content
of the chemical components, all materials were collected from
mid-July to mid-August in 2009. From E. breviscapus’s early
flowering phase to its full-bloom phase, the contents of the four
studied active compounds are highest (unpublished data from
Liyan Peng, one coauthor of this article). For genetic analyses, 15
individuals from each population were sampled, with individuals
at least 30 m apart.
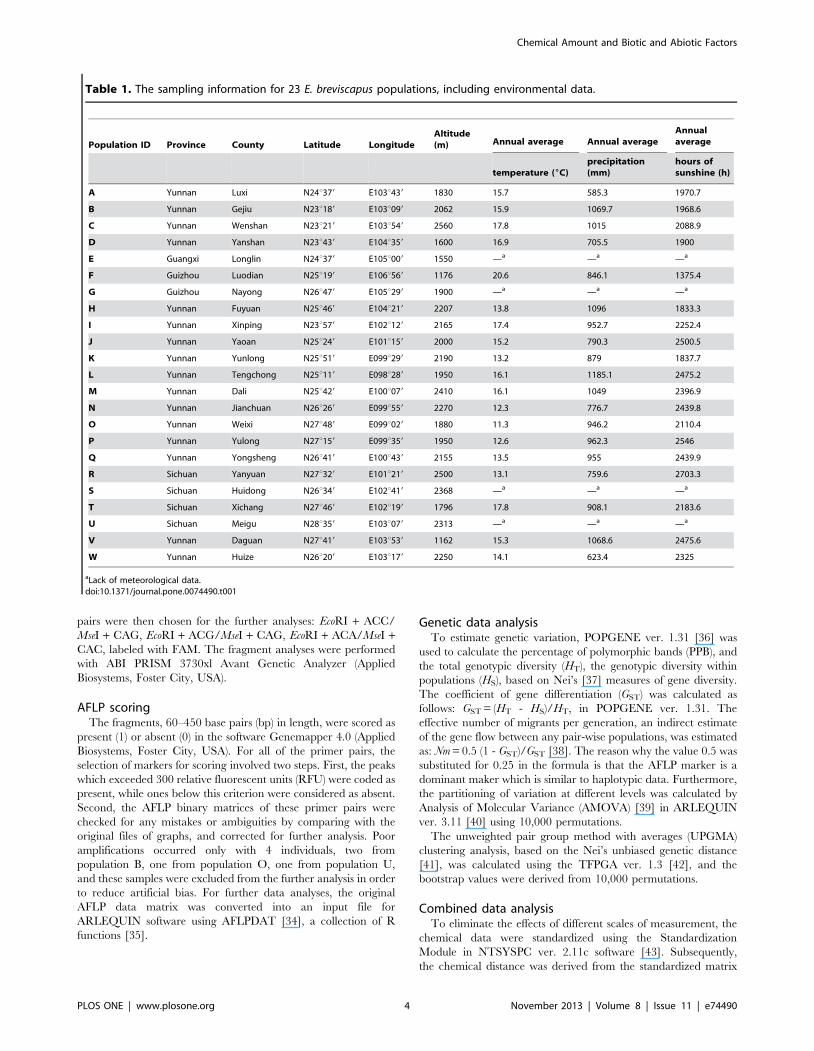
The meteorological data for 19 populations including annual
average temperature, annual average precipitation and annual
average hours of sunshine in 2009 were obtained from an online
database (http://cdc.cma.gov.cn/index.jsp) and local meteorolog-
ical stations (Table 1). We failed to get meteorological data for the
remaining four populations, which were omitted in the analyses
between compound concentration and environmental factors. The
distributional information of latitude, longitude and altitude were
gathered during the field work.
High-performance liquid chromatographyIn order to reduce individual variation, the individual specimens
were dried out under the room temperature, and then individuals
from each population were pooled together. Each dried sample
was ground into powder and weighed (5 g), and extracted with
aqueous acetone (50%) in an ultrasonic bath for 40 min. The
extracts were purified for HPLC analyses using filters (0.45 mm,
4 mm nylon filter, Thermo Fisher Scientific, Rockford, USA).
HPLC analyses were carried out using an Agilent 1200 liquid
chromatography system, equipped with a quaternary solvent
delivery system, an autosampler and a photodiode array detector
(Agilent, Palo Alto, USA). An Agilent ZORBAX SB-C18 column
(5 mm, 25064.5 mm) (Agilent, Palo Alto, USA) was used. The
column was kept at 30uC and the flow rate was 1 ml/min. The
Chemical Amount and Biotic and Abiotic Factors
PLOS ONE | www.plosone.org 2 November 2013 | Volume 8 | Issue 11 | e74490
diode array detector was set at 330 nm. Methanol (MeOH),
acetonitrile (MeCN) and H2O (0.5% formic acid) were used in the
mobile phase. The gradient elution was 0–30 min: 15% MeOH
+11.5% MeCN +73.5% H2O (0.5% formic acid); 30–40 min:
15% MeOH +15% MeCN +70% H2O (0.5% formic acid); 40–
55 min: 45% MeCN +55% H2O (0.5% formic acid); 55–60 min:
100% MeCN.
Chemical data analysisPrincipal component analysis (PCA) was applied to examine the
relative distribution of different populations of E. breviscapus
according to their chemical concentration data indicated in
Table 2. The PCA results could also provide evidence that
whether the clusters of populations are discrete and obvious or not.
Agglomerative hierarchical clustering (AHC) analysis was applied
to construct a dendrogram based on the distance of the population
chemical components (Similarity: Pearson correlation coefficient,
Agglomeration method: Unweighted pair-group average). All
these analyses were carried out using XLSTAT ver. 2011 software
(Addinsoft, Paris, France).
AFLP procedure and primer selectionGenomic DNA was extracted from silica-gel-dried leaves using
the cetyltrimethylammonium bromide (CTAB) method [30].
The AFLP technique was performed using a slightly modified
version of the protocol of Vos et al. [29]. Total genomic DNA
(350 ng) was digested with EcoRI and MseI restriction enzymes and
buffer 4 (New England Biolabs, Beijing, China) at 37uC for 3 h. At
22uC for 3 h, the EcoRI and MseI adapters were ligated to the
digested DNA fragments subsequently with T4 DNA ligase (New
England Biolabs, Beijing, China). PCR pre-amplification was
performed using a total volume of 20 ml reaction mixture
containing 5 ml of the ligated product, 1.0 ml MseI primer and
1.0 ml EcoRI primer (75 ng/ml), 2.0 ml 106PCR buffer (Mg2+ Free,
Takara, Kyoto, Japan), 1.6 ml dNTPs (2.5 mM, Tiangen, Beijing,
China), 0.2 ml r Taq DNA polymerase (5 U/ml, Takara, Kyoto,
Japan), 1.6 ml MgCl2 (25 mM, Takara, Kyoto, Japan) and 7.6 ml
double deionized water. The pre-amplification cycles started with
5 min denaturation at 65uC, followed by 30 cycles of 30 s at 94uC,
30 s at 56uC, and 1 min at 72uC, and ended with a final extension
step at 72uC for 5 min. The subsequent selective-amplification was
conducted using a total volume of 20 ml reaction mixture
containing 0.6 ml of the pre-amplified product, 1.0 ml MseI
selective primer and 1.0 ml EcoRI selective primer (75 ng/ml),
2.0 ml 106PCR buffer (Mg2+ Free, Takara, Kyoto, Japan), 1.6 ml
dNTPs (2.5 mM, Tiangen, Beijing, China), 0.2 ml r Taq DNA
polymerase (5 U/ml, Takara, Kyoto, Japan), 1.6 ml MgCl2(25 mM, Takara, Kyoto, Japan) and 12 ml double deionized
water. The selective-amplification cycles began with 2 min
denaturation at 94uC, followed by 13 cycles of 30 s at 94uC,
30 s at 65uC (decreasing by 0.7uC per cycle), and 1 min at 72uC,
subsequently accompanied by 23 cycles of 30 s at 94uC, 30 s at
56uC, and 1 min at 72uC, and ended with a final extension step at
72uC for 5 min.
A total of 23 primer combinations, which were previously used
to study taxa in Asteraceae [31–33], were tested using 5
populations of the DNA samples, and the following three primer
Figure 1. Distribution of the sampling locations (capital letters denote populations).doi:10.1371/journal.pone.0074490.g001
Chemical Amount and Biotic and Abiotic Factors
PLOS ONE | www.plosone.org 3 November 2013 | Volume 8 | Issue 11 | e74490
pairs were then chosen for the further analyses: EcoRI + ACC/
MseI + CAG, EcoRI + ACG/MseI + CAG, EcoRI + ACA/MseI +CAC, labeled with FAM. The fragment analyses were performed
with ABI PRISM 3730xl Avant Genetic Analyzer (Applied
Biosystems, Foster City, USA).
AFLP scoringThe fragments, 60–450 base pairs (bp) in length, were scored as
present (1) or absent (0) in the software Genemapper 4.0 (Applied
Biosystems, Foster City, USA). For all of the primer pairs, the
selection of markers for scoring involved two steps. First, the peaks
which exceeded 300 relative fluorescent units (RFU) were coded as
present, while ones below this criterion were considered as absent.
Second, the AFLP binary matrices of these primer pairs were
checked for any mistakes or ambiguities by comparing with the
original files of graphs, and corrected for further analysis. Poor
amplifications occurred only with 4 individuals, two from
population B, one from population O, one from population U,
and these samples were excluded from the further analysis in order
to reduce artificial bias. For further data analyses, the original
AFLP data matrix was converted into an input file for
ARLEQUIN software using AFLPDAT [34], a collection of R
functions [35].
Genetic data analysisTo estimate genetic variation, POPGENE ver. 1.31 [36] was
used to calculate the percentage of polymorphic bands (PPB), and
the total genotypic diversity (HT), the genotypic diversity within
populations (HS), based on Nei’s [37] measures of gene diversity.
The coefficient of gene differentiation (GST) was calculated as
follows: GST = (HT - HS)/HT, in POPGENE ver. 1.31. The
effective number of migrants per generation, an indirect estimate
of the gene flow between any pair-wise populations, was estimated
as: Nm = 0.5 (1 - GST)/GST [38]. The reason why the value 0.5 was
substituted for 0.25 in the formula is that the AFLP marker is a
dominant maker which is similar to haplotypic data. Furthermore,
the partitioning of variation at different levels was calculated by
Analysis of Molecular Variance (AMOVA) [39] in ARLEQUIN
ver. 3.11 [40] using 10,000 permutations.
The unweighted pair group method with averages (UPGMA)
clustering analysis, based on the Nei’s unbiased genetic distance
[41], was calculated using the TFPGA ver. 1.3 [42], and the
bootstrap values were derived from 10,000 permutations.
Combined data analysisTo eliminate the effects of different scales of measurement, the
chemical data were standardized using the Standardization
Module in NTSYSPC ver. 2.11c software [43]. Subsequently,
the chemical distance was derived from the standardized matrix
Table 1. The sampling information for 23 E. breviscapus populations, including environmental data.
Population ID Province County Latitude LongitudeAltitude(m) Annual average Annual average
Annualaverage
temperature (6C)precipitation(mm)
hours ofsunshine (h)
A Yunnan Luxi N24u379 E103u439 1830 15.7 585.3 1970.7
B Yunnan Gejiu N23u189 E103u099 2062 15.9 1069.7 1968.6
C Yunnan Wenshan N23u219 E103u549 2560 17.8 1015 2088.9
D Yunnan Yanshan N23u439 E104u359 1600 16.9 705.5 1900
E Guangxi Longlin N24u379 E105u009 1550 —a —a —a
F Guizhou Luodian N25u199 E106u569 1176 20.6 846.1 1375.4
G Guizhou Nayong N26u479 E105u299 1900 —a —a —a
H Yunnan Fuyuan N25u469 E104u219 2207 13.8 1096 1833.3
I Yunnan Xinping N23u579 E102u129 2165 17.4 952.7 2252.4
J Yunnan Yaoan N25u249 E101u159 2000 15.2 790.3 2500.5
K Yunnan Yunlong N25u519 E099u299 2190 13.2 879 1837.7
L Yunnan Tengchong N25u119 E098u289 1950 16.1 1185.1 2475.2
M Yunnan Dali N25u429 E100u079 2410 16.1 1049 2396.9
N Yunnan Jianchuan N26u269 E099u559 2270 12.3 776.7 2439.8
O Yunnan Weixi N27u489 E099u029 1880 11.3 946.2 2110.4
P Yunnan Yulong N27u159 E099u359 1950 12.6 962.3 2546
Q Yunnan Yongsheng N26u419 E100u439 2155 13.5 955 2439.9
R Sichuan Yanyuan N27u329 E101u219 2500 13.1 759.6 2703.3
S Sichuan Huidong N26u349 E102u419 2368 —a —a —a
T Sichuan Xichang N27u469 E102u199 1796 17.8 908.1 2183.6
U Sichuan Meigu N28u359 E103u079 2313 —a —a —a
V Yunnan Daguan N27u419 E103u539 1162 15.3 1068.6 2475.6
W Yunnan Huize N26u209 E103u179 2250 14.1 623.4 2325
aLack of meteorological data.doi:10.1371/journal.pone.0074490.t001
Chemical Amount and Biotic and Abiotic Factors
PLOS ONE | www.plosone.org 4 November 2013 | Volume 8 | Issue 11 | e74490
gained from the previous calculation using the Interval Data
Module and Euclidean Distances Method in NTSYSPC ver. 2.11c
software. Then, this triangle matrix was used as one matrix in the
input file for Mantel Test [44]. The population genetic pairwise
distance (FST) matrix was calculated as the other matrix. Then, the
relationship between the population genetic pairwise distance (FST)
matrix and the population chemical pairwise distance matrix was
computed using a Mantel test with 10,000 permutations in
ARLEQUIN ver. 3.11. We used the same methods mentioned
above to calculate the relationship between chemical pairwise
distance and geographic distance (calculated using latitudes and
longitudes of sampling locations). We also tested the relationship
between the population genetic pairwise distance (FST) and the
geographic distance (calculated using latitudes and longitudes of
sampling locations) using Mantel test.
The concentrations of the four chemical components measured
by HPLC and the environmental data gathered from meteoro-
logical stations and field work were combined together and
analyzed by correlation test in XLSTAT ver. 2011 software, in
order to detect the correlation among them.
Results and Discussion
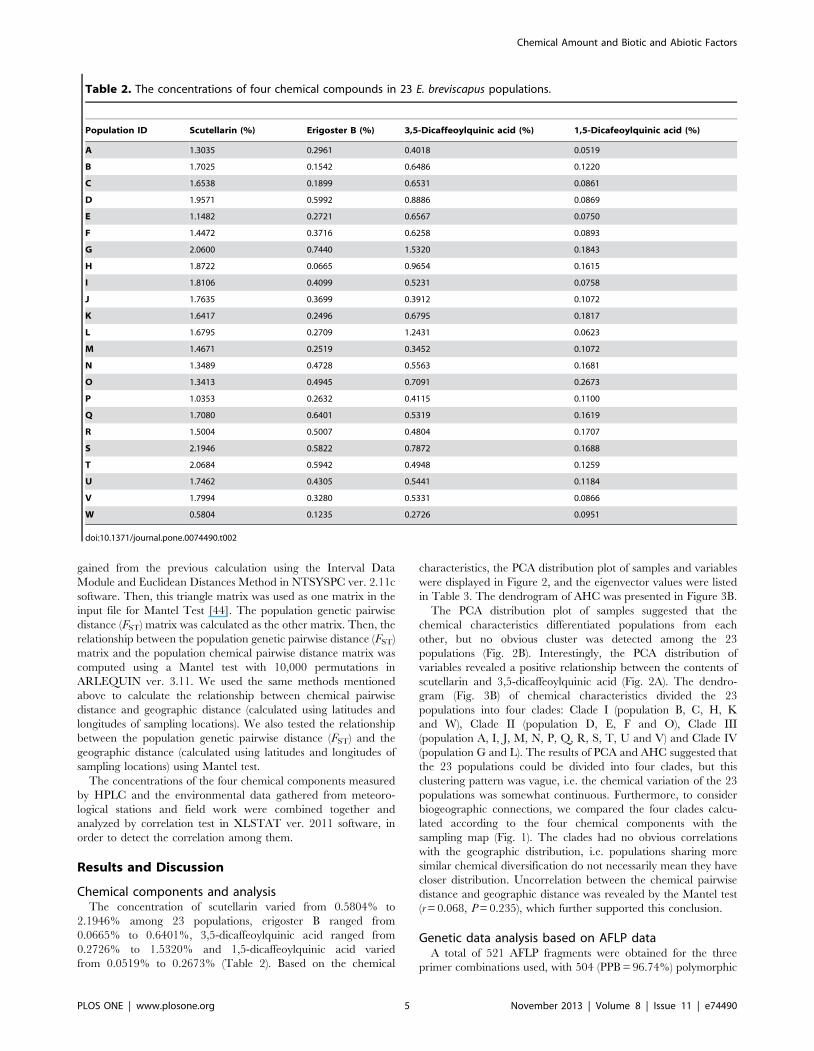
Chemical components and analysisThe concentration of scutellarin varied from 0.5804% to
2.1946% among 23 populations, erigoster B ranged from
0.0665% to 0.6401%, 3,5-dicaffeoylquinic acid ranged from
0.2726% to 1.5320% and 1,5-dicaffeoylquinic acid varied
from 0.0519% to 0.2673% (Table 2). Based on the chemical
characteristics, the PCA distribution plot of samples and variables
were displayed in Figure 2, and the eigenvector values were listed
in Table 3. The dendrogram of AHC was presented in Figure 3B.
The PCA distribution plot of samples suggested that the
chemical characteristics differentiated populations from each
other, but no obvious cluster was detected among the 23
populations (Fig. 2B). Interestingly, the PCA distribution of
variables revealed a positive relationship between the contents of
scutellarin and 3,5-dicaffeoylquinic acid (Fig. 2A). The dendro-
gram (Fig. 3B) of chemical characteristics divided the 23
populations into four clades: Clade I (population B, C, H, K
and W), Clade II (population D, E, F and O), Clade III
(population A, I, J, M, N, P, Q, R, S, T, U and V) and Clade IV
(population G and L). The results of PCA and AHC suggested that
the 23 populations could be divided into four clades, but this
clustering pattern was vague, i.e. the chemical variation of the 23
populations was somewhat continuous. Furthermore, to consider
biogeographic connections, we compared the four clades calcu-
lated according to the four chemical components with the
sampling map (Fig. 1). The clades had no obvious correlations
with the geographic distribution, i.e. populations sharing more
similar chemical diversification do not necessarily mean they have
closer distribution. Uncorrelation between the chemical pairwise
distance and geographic distance was revealed by the Mantel test
(r = 0.068, P = 0.235), which further supported this conclusion.
Genetic data analysis based on AFLP dataA total of 521 AFLP fragments were obtained for the three
primer combinations used, with 504 (PPB = 96.74%) polymorphic
Table 2. The concentrations of four chemical compounds in 23 E. breviscapus populations.
Population ID Scutellarin (%) Erigoster B (%) 3,5-Dicaffeoylquinic acid (%) 1,5-Dicafeoylquinic acid (%)
A 1.3035 0.2961 0.4018 0.0519
B 1.7025 0.1542 0.6486 0.1220
C 1.6538 0.1899 0.6531 0.0861
D 1.9571 0.5992 0.8886 0.0869
E 1.1482 0.2721 0.6567 0.0750
F 1.4472 0.3716 0.6258 0.0893
G 2.0600 0.7440 1.5320 0.1843
H 1.8722 0.0665 0.9654 0.1615
I 1.8106 0.4099 0.5231 0.0758
J 1.7635 0.3699 0.3912 0.1072
K 1.6417 0.2496 0.6795 0.1817
L 1.6795 0.2709 1.2431 0.0623
M 1.4671 0.2519 0.3452 0.1072
N 1.3489 0.4728 0.5563 0.1681
O 1.3413 0.4945 0.7091 0.2673
P 1.0353 0.2632 0.4115 0.1100
Q 1.7080 0.6401 0.5319 0.1619
R 1.5004 0.5007 0.4804 0.1707
S 2.1946 0.5822 0.7872 0.1688
T 2.0684 0.5942 0.4948 0.1259
U 1.7462 0.4305 0.5441 0.1184
V 1.7994 0.3280 0.5331 0.0866
W 0.5804 0.1235 0.2726 0.0951
doi:10.1371/journal.pone.0074490.t002
Chemical Amount and Biotic and Abiotic Factors
PLOS ONE | www.plosone.org 5 November 2013 | Volume 8 | Issue 11 | e74490
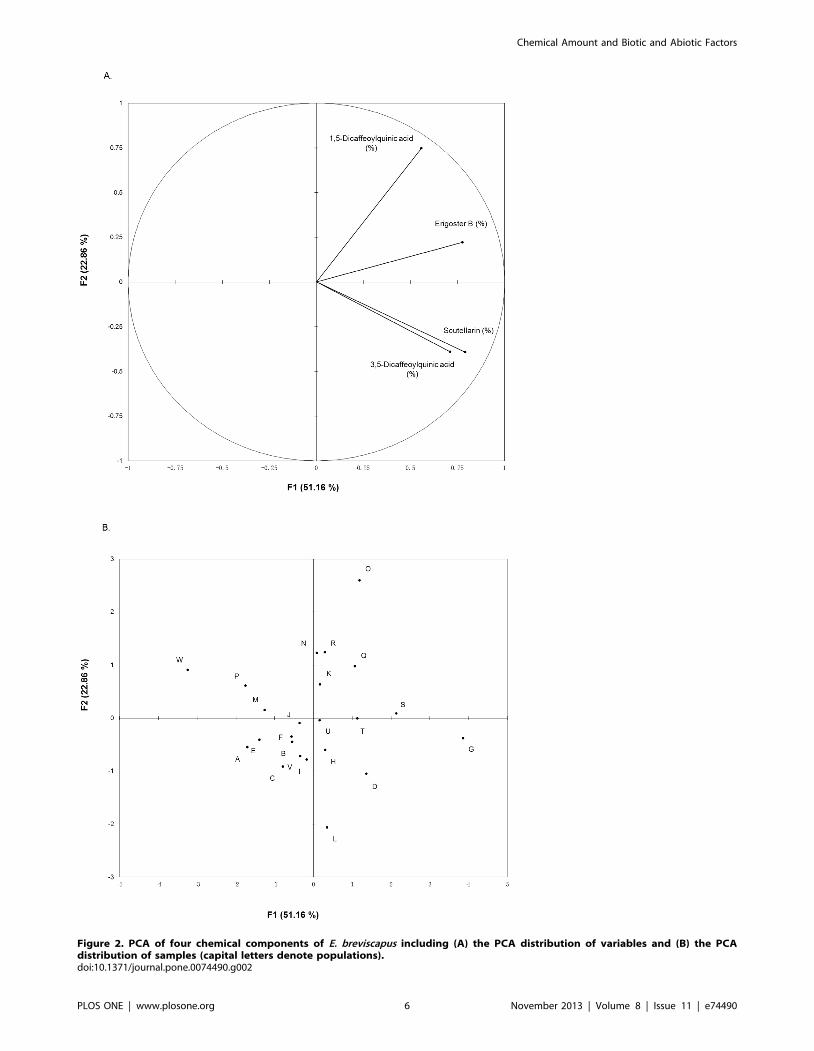
Figure 2. PCA of four chemical components of E. breviscapus including (A) the PCA distribution of variables and (B) the PCAdistribution of samples (capital letters denote populations).doi:10.1371/journal.pone.0074490.g002
Chemical Amount and Biotic and Abiotic Factors
PLOS ONE | www.plosone.org 6 November 2013 | Volume 8 | Issue 11 | e74490
bands. With the assumption of Hardy-Weinberg equilibrium, the
total Nei’s genetic diversity [37] of the species (HT) was 0.134,
while the average Nei’s genetic diversity within population (HS)
was 0.102. Analysis of Molecular Variance (AMOVA) based on all
populations as one group indicated that majority of genetic
variation (76.78%; P = 0.000) occurred within populations, while
the variation among populations was 23.22% (P = 0.000). The
coefficient of gene differentiation (GST) was 0.241, which was
similar to the result obtained with the AMOVA. These results
indicated more genetic variation was within populations, which
suggested the differentiation among populations was not signifi-
cant.
The result of Nm suggested a high level of inter-population gene
flow (Nm = 1.575), which means there were 1.575 migrants per
generation. According to Wright [45], if Nm ,1, local populations
tend to differentiate, whereas there will be little differentiation
among populations and migration is more important than genetic
drift, if Nm $1. The high value of Nm in this species indicated that
gene flow among populations is quite frequent, which caused low
intraspecific differentiations.
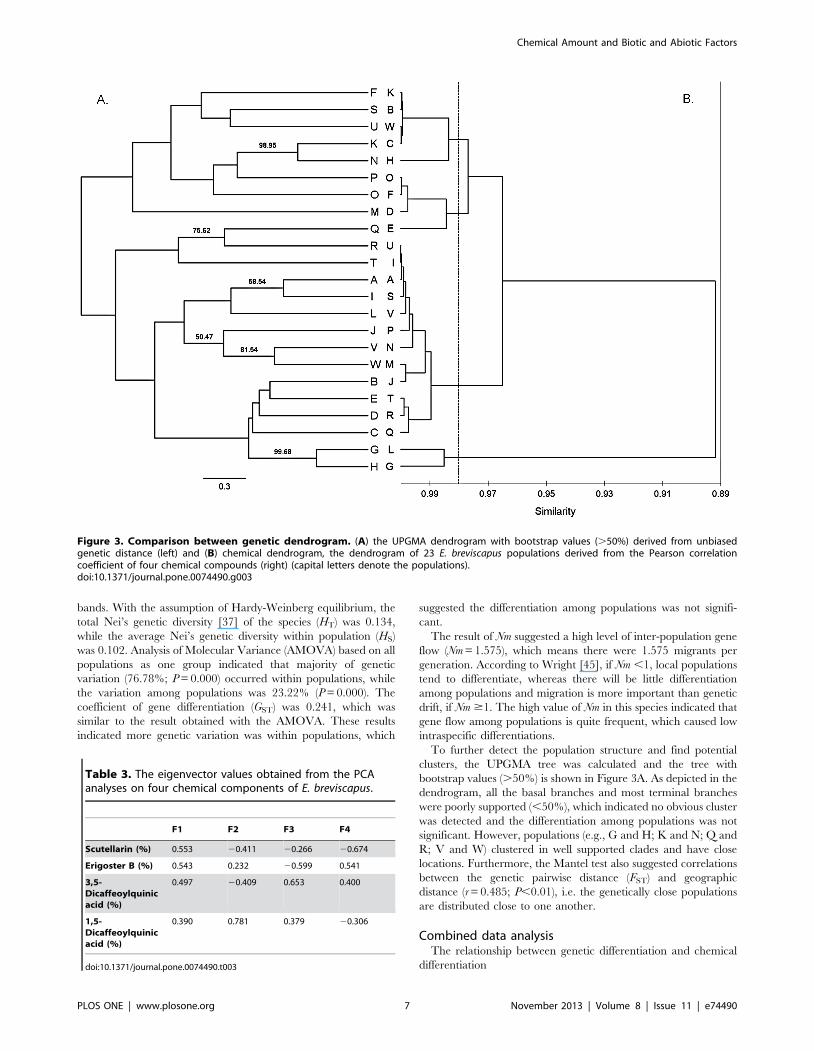
To further detect the population structure and find potential
clusters, the UPGMA tree was calculated and the tree with
bootstrap values (.50%) is shown in Figure 3A. As depicted in the
dendrogram, all the basal branches and most terminal branches
were poorly supported (,50%), which indicated no obvious cluster
was detected and the differentiation among populations was not
significant. However, populations (e.g., G and H; K and N; Q and
R; V and W) clustered in well supported clades and have close
locations. Furthermore, the Mantel test also suggested correlations
between the genetic pairwise distance (FST) and geographic
distance (r = 0.485; P,0.01), i.e. the genetically close populations
are distributed close to one another.
Combined data analysisThe relationship between genetic differentiation and chemical
differentiation
Figure 3. Comparison between genetic dendrogram. (A) the UPGMA dendrogram with bootstrap values (.50%) derived from unbiasedgenetic distance (left) and (B) chemical dendrogram, the dendrogram of 23 E. breviscapus populations derived from the Pearson correlationcoefficient of four chemical compounds (right) (capital letters denote the populations).doi:10.1371/journal.pone.0074490.g003
Table 3. The eigenvector values obtained from the PCAanalyses on four chemical components of E. breviscapus.
F1 F2 F3 F4
Scutellarin (%) 0.553 20.411 20.266 20.674
Erigoster B (%) 0.543 0.232 20.599 0.541
3,5-Dicaffeoylquinicacid (%)
0.497 20.409 0.653 0.400
1,5-Dicaffeoylquinicacid (%)
0.390 0.781 0.379 20.306
doi:10.1371/journal.pone.0074490.t003
Chemical Amount and Biotic and Abiotic Factors
PLOS ONE | www.plosone.org 7 November 2013 | Volume 8 | Issue 11 | e74490
The comparison of the genetic UPGMA tree and the
dendrogram of chemical characteristics (Fig. 3), which produced
by same clustering methods, revealed no obvious correlation
between genetic differentiation and chemical differentiation. The
populations belonging to four clades in the chemical dendrogram
were almost randomly distributed through the genetic UPGMA
tree. Furthermore, the Mantel test of the relationship between the
population genetic pairwise distance (FST) and chemical pairwise
distance (r = 20.0497; P = 0.6636) showed that population genetic
differentiation did not correlate with the concentration of the
chemical components. However, the molecular markers indicated
weak genetic differentiation among E. breviscapus populations.
Meanwhile, the PCA plot suggested no obvious clusters based on
the four chemical components, which indicated that the chemical
differentiation among populations had no clear clustering pattern
(Fig. 2). The insignificant genetic differentiation and continuous
chemical differentiation might weaken the correlation between
them. The weak genetic differentiation among populations may
cause the indistinct chemical clustering pattern. The low genetic
differentiation may be attributable to its outcrossing mating system
[4] and tiny wind-dispersed fruits, which caused high gene flow
among populations. Furthermore, pooling samples according to
population without considering the intra-population differentia-
tion may also result in the insignificant correlation mentioned
above.
The relationship between the environmental factors andchemical differentiation
Because of the missing meteorological data (Table 1), four
populations (E, G, S and U) were omitted in the following analyses
related to meteorological data.
According to correlation test results (Table 4 and 5), there was a
positive relationship between the concentration of 1,5-dicaffeoyl-
quinic acid and latitude. However, the correlation between the
content of 1,5-dicaffeoylquinic acid and annual average temper-
ature was negative. These two results are not paradoxical, since
high latitude largely correspond to a lower temperature across the
distribution of E. breviscapus. 1,5-dicaffeoylquinic acid may have
functions in adapting to relatively low temperature in E. breviscapus.
It is the first time that positive correlations between the
concentrations of phenols in E. breviscapus and environmental
temperature as well as latitude is detected, which could be used to
improve the content of related phenols by choosing a cooler area
to cultivate E. breviscapus. Within the natural distribution of E.
breviscapus, relatively higher locations will be more ideal for
cultivating E. breviscapus, especially to generate higher concentra-
tion of 1,5-dicaffeoylquinic acid.
The concentration of 3,5-dicaffeoylquinic acid was positively
correlated with annual average precipitation, which means that a
moist environment may enhance the synthesis of 3,5-dicaffeoyl-
quinic acid. This result is consistent with the research on the effect
of water stress on E. breviscapus, which suggested waterlogging and
drought can raise the content of phenols in E. breviscapus [22].
Hence, soil moisture can be increased to augment the yield of 3,5-
dicaffeoylquinic acid.
As to the concentrations of scutellarin and erigoster B, they had
no relationship with any of the environmental factors listed in
Table 1. Therefore, according to this study, the cultivation
modifications mentioned above should not reduce the concentra-
tions of scutellarin and erigoster B.
Table 4. Results of correlation test based on 23 E. breviscapus populations (without meteorological data).
VariablesScutellarin(%)
Erigoster B(%)
3,5-Dicaffeoylquinicacid (%)
1,5-Dicafeoylquinicacid (%) Altitude Latitude Longitude
Scutellarin (%) **** 0.016 0.015 0.467 0.968 0.948 0.472
Erigoster B (%) 0.495 **** 0.181 0.069 0.617 0.078 0.947
3,5-Dicaffeoylquinic acid (%) 0.500 0.289 **** 0.309 0.570 0.661 0.414
1,5-Dicafeoylquinic acid (%) 0.160 0.386 0.222 **** 0.185 0.012 0.117
Altitude 20.009 20.110 20.125 0.287 **** 0.952 0.044
Latitude 20.015 0.375 20.097 0.515 0.013 **** 0.202
Longitude 0.158 0.015 0.179 20.336 20.424 20.276 ****
Values in bold are different from 0 with a significant level, alpha = 0.05.Correlation matrix (Pearson) is listed below the diagonal, while the P-values are listed above the diagonal.doi:10.1371/journal.pone.0074490.t004
Table 5. Results of correlation test between chemical compounds and meteorological data in 19 E. breviscapus populations(excluding population E, G, S and U).
Variables Scutellarin (%) Erigoster B (%)3,5-Dicaffeoylquinicacid (%)
1,5-Dicafeoylquinicacid (%)
Annual average temperature (6C) 0.370 (0.119) 20.013 (0.958) 0.087 (0.724) 20.690 (0.001)
Annual average precipitation (mm) 0.419 (0.074) 20.267 (0.269) 0.495 (0.031) 0.065 (0.790)
Annual average hours of sunshine (h) 20.164 (0.501) 0.187 (0.444) 20.290 (0.229) 0.032 (0.895)
Values in bold are different from 0 with a significant level, alpha = 0.05.P-values are listed in parentheses.doi:10.1371/journal.pone.0074490.t005
Chemical Amount and Biotic and Abiotic Factors
PLOS ONE | www.plosone.org 8 November 2013 | Volume 8 | Issue 11 | e74490
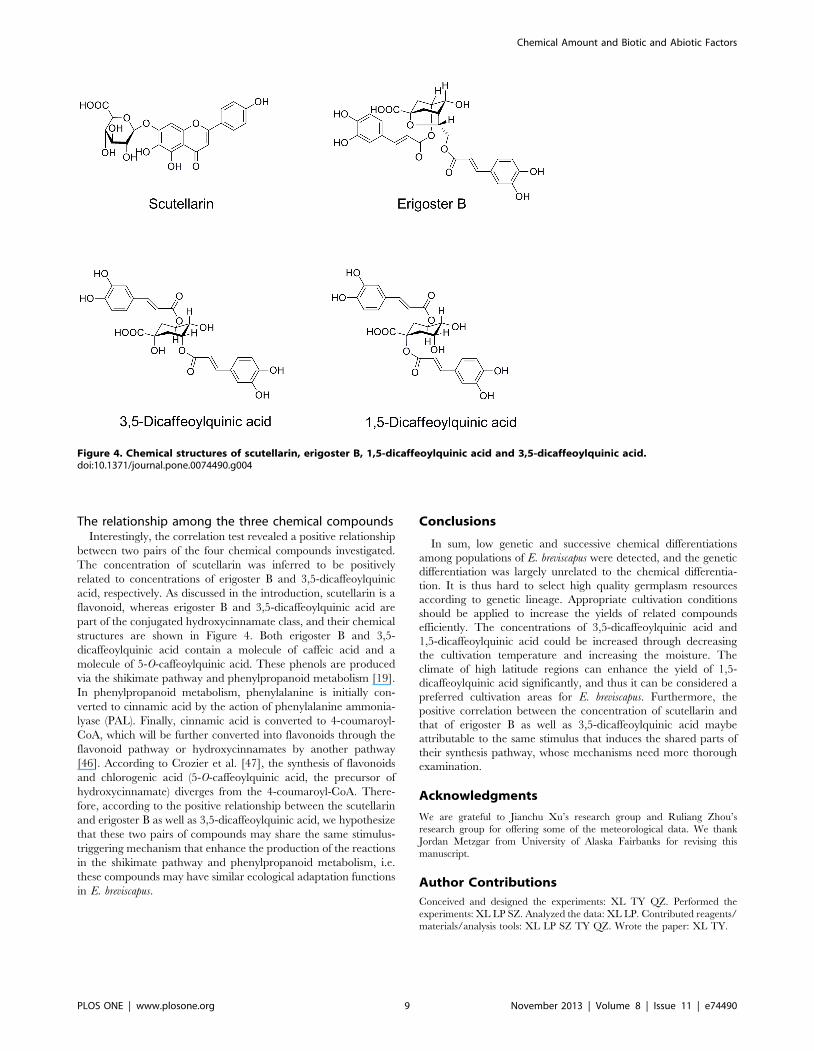
The relationship among the three chemical compoundsInterestingly, the correlation test revealed a positive relationship
between two pairs of the four chemical compounds investigated.
The concentration of scutellarin was inferred to be positively
related to concentrations of erigoster B and 3,5-dicaffeoylquinic
acid, respectively. As discussed in the introduction, scutellarin is a
flavonoid, whereas erigoster B and 3,5-dicaffeoylquinic acid are
part of the conjugated hydroxycinnamate class, and their chemical
structures are shown in Figure 4. Both erigoster B and 3,5-
dicaffeoylquinic acid contain a molecule of caffeic acid and a
molecule of 5-O-caffeoylquinic acid. These phenols are produced
via the shikimate pathway and phenylpropanoid metabolism [19].
In phenylpropanoid metabolism, phenylalanine is initially con-
verted to cinnamic acid by the action of phenylalanine ammonia-
lyase (PAL). Finally, cinnamic acid is converted to 4-coumaroyl-
CoA, which will be further converted into flavonoids through the
flavonoid pathway or hydroxycinnamates by another pathway
[46]. According to Crozier et al. [47], the synthesis of flavonoids
and chlorogenic acid (5-O-caffeoylquinic acid, the precursor of
hydroxycinnamate) diverges from the 4-coumaroyl-CoA. There-
fore, according to the positive relationship between the scutellarin
and erigoster B as well as 3,5-dicaffeoylquinic acid, we hypothesize
that these two pairs of compounds may share the same stimulus-
triggering mechanism that enhance the production of the reactions
in the shikimate pathway and phenylpropanoid metabolism, i.e.
these compounds may have similar ecological adaptation functions
in E. breviscapus.
Conclusions
In sum, low genetic and successive chemical differentiations
among populations of E. breviscapus were detected, and the genetic
differentiation was largely unrelated to the chemical differentia-
tion. It is thus hard to select high quality germplasm resources
according to genetic lineage. Appropriate cultivation conditions
should be applied to increase the yields of related compounds
efficiently. The concentrations of 3,5-dicaffeoylquinic acid and
1,5-dicaffeoylquinic acid could be increased through decreasing
the cultivation temperature and increasing the moisture. The
climate of high latitude regions can enhance the yield of 1,5-
dicaffeoylquinic acid significantly, and thus it can be considered a
preferred cultivation areas for E. breviscapus. Furthermore, the
positive correlation between the concentration of scutellarin and
that of erigoster B as well as 3,5-dicaffeoylquinic acid maybe
attributable to the same stimulus that induces the shared parts of
their synthesis pathway, whose mechanisms need more thorough
examination.
Acknowledgments
We are grateful to Jianchu Xu’s research group and Ruliang Zhou’s
research group for offering some of the meteorological data. We thank
Jordan Metzgar from University of Alaska Fairbanks for revising this
manuscript.
Author Contributions
Conceived and designed the experiments: XL TY QZ. Performed the
experiments: XL LP SZ. Analyzed the data: XL LP. Contributed reagents/
materials/analysis tools: XL LP SZ TY QZ. Wrote the paper: XL TY.
Figure 4. Chemical structures of scutellarin, erigoster B, 1,5-dicaffeoylquinic acid and 3,5-dicaffeoylquinic acid.doi:10.1371/journal.pone.0074490.g004
Chemical Amount and Biotic and Abiotic Factors
PLOS ONE | www.plosone.org 9 November 2013 | Volume 8 | Issue 11 | e74490
References
1. Mabberley DJ (2008) Mabberley’s Plant-book. A Portable Dictionary of Plants,
Their Classifications and Uses. New York: Cambridge University Press.2. Li NG, Liang FZ, Zhang JR, Xu SX, Mao XC, et al. (1998) Effect of Erigeron
breviscapus hand on hemorheology and microcirculation of acute cerebralinfarction. Chin J Hemorh 8: 42–44.
3. Li XL, Li YQ, Yan WM, Li HY, Xu H, et al. (2004) A study of the
cardioprotective effect of breviscapine during hypoxia of cardiomyocytes in vitroand during myocardial infarction in vivo. Planta Med 70: 1039–1044.
4. Lin R, Chen YL, Shi Z (1985) Flora Reipublicae Popularis Sinicae, Volume 74.Beijing: Science Press. pp. 308–309.
5. Song KX, Wang YH, Yi TS, Yang ZY (2010) Karyological studies of Erigeron
breviscapus and related species. Caryologia 63: 176–183.6. Li L, Dang CL (2007) Flora syndrome and breeding system of Erigeron breviscapus.
Acta Ecologica Sinica 27: 571–578.7. Zhu BH, Guan YY, He H, Lin MJ (1999) Erigeron breviscapus prevents defective
endothelium-dependent relaxation in diabetic rat aorta. Life Sci 65: 1553–1559.8. Liu H, Yang XL, Ren T, Feng YD, Xu HB (2005) Effects of Erigeron breviscapus
ethanol extract on neuronal oxidative injury induced by superoxide radical.
Fitoterapia 76: 666–670.9. Tao YH, Jiang DY, Xu HB, Yang XL (2008) Inhibitory effect of Erigeron
breviscapus extract and its flavonoid components on GABA shunt enzymes.Phytomedicine 15: 92–97.
10. Liu H, Yang XL, Ding JY, Feng YD, Xu HB (2003) Antibacterial and antifungal
activity of Erigeron breviscapus. Fitoterapia 74: 387–389.11. Gafner S, Bergeron C, Batcha LL, Reich J, Arnason JT, et al. (2003) Inhibition
of [3H]-LSD binding to 5-HT7 receptors by flavonoids from Scutellaria lateriflora.J Nat Prod 66: 535–537.
12. Lin LL, Liu AJ, Liu JG, Yu XH, Qin LP, et al. (2007) Protective effects ofscutellarin and breviscapine on brain and heart ischemia in rats. J Cardiovasc
Pharm 50: 327–332.
13. Heilmann J, Merfort I, Weiss M (1995) Radical scavenger activity of different39,49-dihydroxyflavonols and 1,5-dicaffeoylquinic acid studied by inhibition of
chemiluminescence. Planta Med 61: 435–438.14. Maruta Y, Kawabata J, Niki R (1995) Antioxidative caffeoylquinic acid-
derivatives in the roots of burdock (Arctium lappa L.). J Agr Food Chem 43: 2592–
2595.15. Kim SS, Park RY, Jeon HJ, Kwon YS, Chun W (2005) Neuroprotective effects
of 3,5-dicaffeoylquinic acid on hydrogen peroxide-induced cell death in SH-SY5Y cells. Phytother Res 19: 243–245.
16. Sun HD, Zhao QS (2009) A drug for treating cardio-cerebrovascular diseases-phenolic compounds of Erigeron breviscapus. Prog Chem 21: 77–83.
17. Shirley BW (1996) Flavonoid biosynthesis: ‘New’ functions for an ‘old’ pathway.
Trends Plant Sci 1: 377–382.18. Daniel O, Meier MS, Schlatter J, Frischknecht P (1999) Selected phenolic
compounds in cultivated plants: Ecologic functions, health implications, andmodulation by pesticides. Environ Health Persp 107: 109–114.
19. Robards K, Antolovich M (1997) Analytical chemistry of fruit bioflavonoids - A
review. Analyst 122: R11–R34.20. De Abreu IN, Mazzafera P (2005) Effect of water and temperature stress on the
content of active constituents of Hypericum brasiliense Choisy. Plant Physiol Bioch43: 241–248.
21. Zobayed SMA, Afreen F, Kozai T (2005) Temperature stress can alter thephotosynthetic efficiency and secondary metabolite concentrations in St. John’s
wort. Plant Physiol Bioch 43: 977–984.
22. Zhang YN, Su WH, Zhang GF (2009) Effect of water stress on content of activeconstituents in Erigeron breviscapus. China J Chinese Materia Med 34: 1191–1194.
23. Li XH, Su WH, Zhou H, Zhang GF (2009) Effects of doubled CO2
concentration on Erigeron breviscapus growth and its active constituent accumu-
lation. Chin J Appl Ecol 20: 1852–1856.
24. Su WH, Zhang GF, Zhou H, Zhang YN (2009) Effects of nitrogen availability insoil on the contents of flavonoids and caffeates in a medicinal plant, Erigeron
breviscapus. Chin J plant Ecol 33: 885–892.
25. Wang MJ, Liu CS, Li Y, He YM, Ji J (2011) Effects of UV-B radiation and
nitrogen interaction on physiological and growth indicators of Erigeron breviscapus.J Yunnan Agricultural University 26: 369–375.
26. Djabou N, Battesti MJ, Allali H, Desjobert JM, Varesi L, et al. (2011) Chemicaland genetic differentiation of Corsican subspecies of Teucrium flavum L.
Phytochemistry 72: 1390–1399.
27. Paolini J, Falchi A, Quilichini Y, Desjobert JM, De Cian MC, et al. (2009)Morphological, chemical and genetic differentiation of two subspecies of Cistus
creticus L. (C. creticus subsp eriocephalus and C. creticus subsp corsicus). Phytochemistry70: 1146–1160.
28. Tori M, Nakamizo H, Mihara K, Sato M, Okamoto Y, et al. (2008) Chemical
and genetic diversity of Ligularia vellerea in Yunnan, China. Phytochemistry 69:1158–1165.
29. Vos P, Hogers R, Bleeker M, Reijans M, Vandelee T, et al. (1995) AFLP - a newtechnique for DNA-fingerprinting. Nucleic Acids Res 23: 4407–4414.
30. Doyle JJ, Dickson EE (1987) Preservation of plant samples for DNA restrictionendonuclease analysis. Taxon 36: 715–722.
31. Guo YP, Saukel J, Mittermayr R, Ehrendorfer F (2005) AFLP analyses
demonstrate genetic divergence, hybridization, and multiple polyploidization inthe evolution of Achillea (Asteraceae-Anthemideae). New Phytol 166: 273–289.
32. Koopman WJM, Zevenbergen MJ, Van den Berg RG (2001) Speciesrelationships in Lactuca SL (Lactuceae, Asteraceae) inferred from AFLP
fingerprints. Am J Bot 88: 1881–1887.
33. Tremetsberger K, Stuessy TF, Kadlec G, Urtubey E, Baeza CM, et al. (2006)AFLP phylogeny of South American species of Hypochaeris (Asteraceae,
Lactuceae). Syst Bot 31: 610–626.34. Ehrich D (2006) AFLPDAT: A collection of R functions for convenient handling
of AFLP data. Mol Ecol Notes 6: 603–604.35. R Development Core Team (2008) R: A language and environment for
statistical computing R foundation for statistical computing. Vienna, Austria.
Available: http://www.r-project.org/.36. Yeh FC, Yang RC, Boyle T (1999) POPGENE: A Microsoft Windows based
freeware for population genetic analysis. Version 1.31, University of Alberta,Center for International Forestry Research, Alberta, Canada.
37. Nei M (1973) Analysis of gene diversity in subdivided populations. P Natl Acad
Sci USA 70: 3321–3323.38. Mcdermott JM, Mcdonald BA (1993) Gene flow in plant pathosystems. Annu
Rev Phytopathol 31: 353–373.39. Excoffier L, Smouse PE, Quattro JM (1992) Analysis of molecular variance
inferred from metric distances among DNA haplotypes - application to humanmitochondrial-DNA restriction data. Genetics 131: 479–491.
40. Excoffier L, Laval G, Schneider S (2006) ARLEQUIN: An integrated software
package for population genetics data analysis. Version 3.11, University of Bern,Computational and Molecular Population Genetics Lab, Institute of Zoology,
Switzerland.41. Nei M (1978) Estimation of average heterozygosity and genetic distance from a
small number of individuals. Genetics 89: 583–590.
42. Miller MP (1997) Tools for population genetic analyses (TFPGA): A Windowsprogram for the analysis of allozyme and molecular population genetic data.
Version 1.3.43. Rohlf FJ (2000) NTSYSpc: Numerical taxonomy and multivariate analysis
system. Applied Bioststistics Inc., New York, USA.44. Mantel N (1967) The detection of disease clustering and a generalized regression
approach. Cancer Res 27: 209–220.
45. Wright S (1951) The genetical structure of populations. Ann Eugenic 15: 323–354.
46. Hahlbrock K, Scheel D (1989) Physiology and molecular-biology of phenylpro-panoid metabolism. Annu Rev Plant Phys 40: 347–369.
47. Crozier A, Jaganath IB, Clifford MN (2007) Phenols, polyphenols and tannins.
In: Crozier A, Clifford MN, Ashihara H, editors. An Overview, in PlantSecondary Metabolites: Occurrence, Structure and Role in the Human Diet.
Oxford: Blackwell Publishing Ltd. pp. 2–22.
Chemical Amount and Biotic and Abiotic Factors
PLOS ONE | www.plosone.org 10 November 2013 | Volume 8 | Issue 11 | e74490
Copyright © 2022 FDOKUMEN