The relationships between biodiversity and ecosystem ...
11
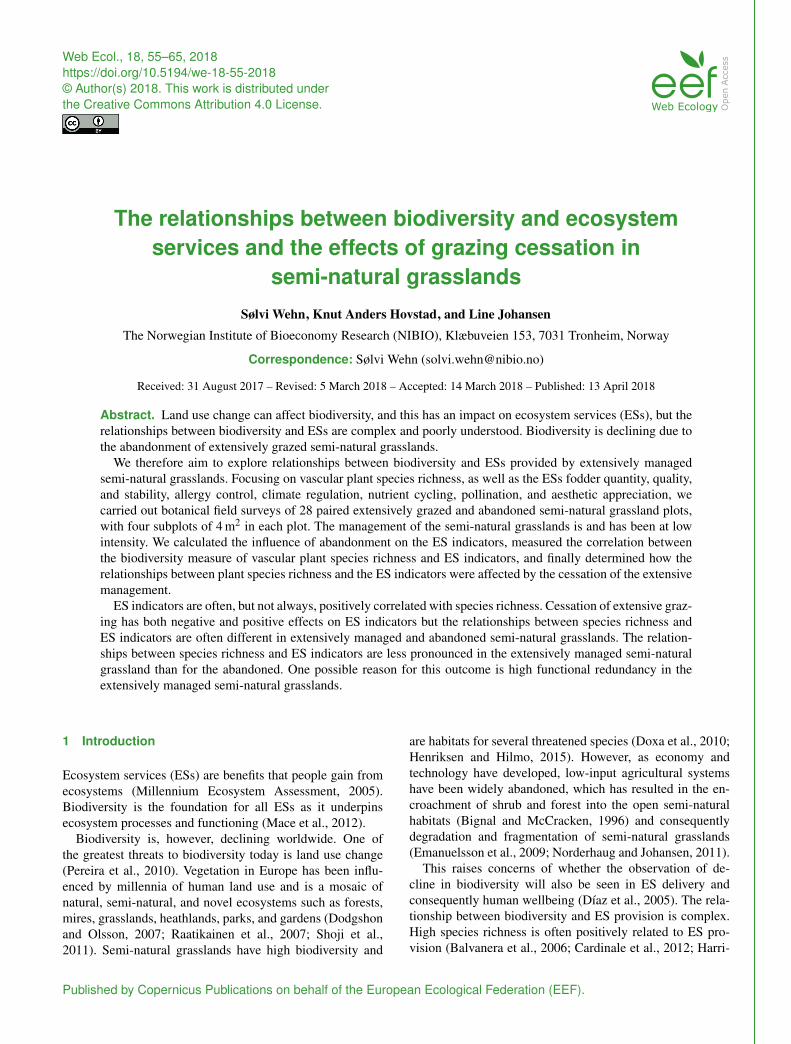
Web Ecol., 18, 55–65, 2018 https://doi.org/10.5194/we-18-55-2018 © Author(s) 2018. This work is distributed under the Creative Commons Attribution 4.0 License. The relationships between biodiversity and ecosystem services and the effects of grazing cessation in semi-natural grasslands Sølvi Wehn, Knut Anders Hovstad, and Line Johansen The Norwegian Institute of Bioeconomy Research (NIBIO), Klæbuveien 153, 7031 Tronheim, Norway Correspondence: Sølvi Wehn ([email protected]) Received: 31 August 2017 – Revised: 5 March 2018 – Accepted: 14 March 2018 – Published: 13 April 2018 Abstract. Land use change can affect biodiversity, and this has an impact on ecosystem services (ESs), but the relationships between biodiversity and ESs are complex and poorly understood. Biodiversity is declining due to the abandonment of extensively grazed semi-natural grasslands. We therefore aim to explore relationships between biodiversity and ESs provided by extensively managed semi-natural grasslands. Focusing on vascular plant species richness, as well as the ESs fodder quantity, quality, and stability, allergy control, climate regulation, nutrient cycling, pollination, and aesthetic appreciation, we carried out botanical field surveys of 28 paired extensively grazed and abandoned semi-natural grassland plots, with four subplots of 4 m 2 in each plot. The management of the semi-natural grasslands is and has been at low intensity. We calculated the influence of abandonment on the ES indicators, measured the correlation between the biodiversity measure of vascular plant species richness and ES indicators, and finally determined how the relationships between plant species richness and the ES indicators were affected by the cessation of the extensive management. ES indicators are often, but not always, positively correlated with species richness. Cessation of extensive graz- ing has both negative and positive effects on ES indicators but the relationships between species richness and ES indicators are often different in extensively managed and abandoned semi-natural grasslands. The relation- ships between species richness and ES indicators are less pronounced in the extensively managed semi-natural grassland than for the abandoned. One possible reason for this outcome is high functional redundancy in the extensively managed semi-natural grasslands. 1 Introduction Ecosystem services (ESs) are benefits that people gain from ecosystems (Millennium Ecosystem Assessment, 2005). Biodiversity is the foundation for all ESs as it underpins ecosystem processes and functioning (Mace et al., 2012). Biodiversity is, however, declining worldwide. One of the greatest threats to biodiversity today is land use change (Pereira et al., 2010). Vegetation in Europe has been influ- enced by millennia of human land use and is a mosaic of natural, semi-natural, and novel ecosystems such as forests, mires, grasslands, heathlands, parks, and gardens (Dodgshon and Olsson, 2007; Raatikainen et al., 2007; Shoji et al., 2011). Semi-natural grasslands have high biodiversity and are habitats for several threatened species (Doxa et al., 2010; Henriksen and Hilmo, 2015). However, as economy and technology have developed, low-input agricultural systems have been widely abandoned, which has resulted in the en- croachment of shrub and forest into the open semi-natural habitats (Bignal and McCracken, 1996) and consequently degradation and fragmentation of semi-natural grasslands (Emanuelsson et al., 2009; Norderhaug and Johansen, 2011). This raises concerns of whether the observation of de- cline in biodiversity will also be seen in ES delivery and consequently human wellbeing (Díaz et al., 2005). The rela- tionship between biodiversity and ES provision is complex. High species richness is often positively related to ES pro- vision (Balvanera et al., 2006; Cardinale et al., 2012; Harri- Published by Copernicus Publications on behalf of the European Ecological Federation (EEF).
-
Upload
khangminh22 -
Category
Documents
-
view
1 -
download
0
Transcript of The relationships between biodiversity and ecosystem ...
Web Ecol., 18, 55–65, 2018https://doi.org/10.5194/we-18-55-2018© Author(s) 2018. This work is distributed underthe Creative Commons Attribution 4.0 License.
The relationships between biodiversity and ecosystemservices and the effects of grazing cessation in
semi-natural grasslands
Sølvi Wehn, Knut Anders Hovstad, and Line JohansenThe Norwegian Institute of Bioeconomy Research (NIBIO), Klæbuveien 153, 7031 Tronheim, Norway
Correspondence: Sølvi Wehn ([email protected])
Received: 31 August 2017 – Revised: 5 March 2018 – Accepted: 14 March 2018 – Published: 13 April 2018
Abstract. Land use change can affect biodiversity, and this has an impact on ecosystem services (ESs), but therelationships between biodiversity and ESs are complex and poorly understood. Biodiversity is declining due tothe abandonment of extensively grazed semi-natural grasslands.
We therefore aim to explore relationships between biodiversity and ESs provided by extensively managedsemi-natural grasslands. Focusing on vascular plant species richness, as well as the ESs fodder quantity, quality,and stability, allergy control, climate regulation, nutrient cycling, pollination, and aesthetic appreciation, wecarried out botanical field surveys of 28 paired extensively grazed and abandoned semi-natural grassland plots,with four subplots of 4 m2 in each plot. The management of the semi-natural grasslands is and has been at lowintensity. We calculated the influence of abandonment on the ES indicators, measured the correlation betweenthe biodiversity measure of vascular plant species richness and ES indicators, and finally determined how therelationships between plant species richness and the ES indicators were affected by the cessation of the extensivemanagement.
ES indicators are often, but not always, positively correlated with species richness. Cessation of extensive graz-ing has both negative and positive effects on ES indicators but the relationships between species richness andES indicators are often different in extensively managed and abandoned semi-natural grasslands. The relation-ships between species richness and ES indicators are less pronounced in the extensively managed semi-naturalgrassland than for the abandoned. One possible reason for this outcome is high functional redundancy in theextensively managed semi-natural grasslands.
1 Introduction
Ecosystem services (ESs) are benefits that people gain fromecosystems (Millennium Ecosystem Assessment, 2005).Biodiversity is the foundation for all ESs as it underpinsecosystem processes and functioning (Mace et al., 2012).
Biodiversity is, however, declining worldwide. One ofthe greatest threats to biodiversity today is land use change(Pereira et al., 2010). Vegetation in Europe has been influ-enced by millennia of human land use and is a mosaic ofnatural, semi-natural, and novel ecosystems such as forests,mires, grasslands, heathlands, parks, and gardens (Dodgshonand Olsson, 2007; Raatikainen et al., 2007; Shoji et al.,2011). Semi-natural grasslands have high biodiversity and
are habitats for several threatened species (Doxa et al., 2010;Henriksen and Hilmo, 2015). However, as economy andtechnology have developed, low-input agricultural systemshave been widely abandoned, which has resulted in the en-croachment of shrub and forest into the open semi-naturalhabitats (Bignal and McCracken, 1996) and consequentlydegradation and fragmentation of semi-natural grasslands(Emanuelsson et al., 2009; Norderhaug and Johansen, 2011).
This raises concerns of whether the observation of de-cline in biodiversity will also be seen in ES delivery andconsequently human wellbeing (Díaz et al., 2005). The rela-tionship between biodiversity and ES provision is complex.High species richness is often positively related to ES pro-vision (Balvanera et al., 2006; Cardinale et al., 2012; Harri-
Published by Copernicus Publications on behalf of the European Ecological Federation (EEF).
56 S. Wehn et al.: Relationships between biodiversity and ecosystem services
son et al., 2014; Isbell et al., 2011; Lindemann-Matthies etal., 2010), but not always (Balvanera et al., 2006; Bullock etal., 2011; Haines-Young and Potschin, 2010; Mayfield et al.,2010). Several potential relationships between biodiversityand ESs have been proposed (Cardinale et al., 2006; Haines-Young and Potschin, 2010), but there is a need for knowledgeabout how to maintain or even optimize the delivery of ESs,identify and manage ES trade-offs, and conserve biodiversity(Harrison et al., 2014; Deng et al., 2016). We lack evidenceabout how cessation of extensive land use management influ-ences ESs as well as sufficient understanding of how changesin biodiversity due to land use changes relate to both ESs andecosystem functioning (Nagendra et al., 2013).
The main service provided by semi-natural grasslands isfodder production (quantity, quality, stability), but a rangeof other important ESs such as nutrient cycling, climate reg-ulation, allergy control, pollination, and aesthetic apprecia-tion are also provided (Anderson-Teixeira et al., 2012; Betts,2000; Bullock et al., 2011; de Bello et al., 2010a; Duru et al.,2012; Ford et al., 2012; Lavorel et al., 2011; Pakeman, 2014;Totland et al., 2013; Vinge and Flø, 2015). Nutrient cyclingprovides maintenance of fertility and supports food, timber,and fuel production as well as important ecological processesimportant for all aspects of life (Lavelle et al., 2005). Carbonsequestration in plants and absorption of incoming solar radi-ation (albedo) will buffer local climate warming and thus reg-ulate climate. Abundance of allergy-inducing pollen produc-ers regulates pollen emissions in the air and thus also allergycontrol. High diversity and abundance of insects provide highdelivery of pollination (Bullock et al., 2011) and pollinationis an ecosystem service of vital importance for human well-being because of its importance for global food production(Potts et al., 2016). Cultural benefits from ecosystems as asource of wellbeing are also important. One of the sources ofwellbeing is the aesthetical appreciation of the landscape andthe vegetation characteristics within the landscape (de Belloet al., 2010a; Ford et al., 2012; Vinge and Flø, 2015).
In this study, the overall objective is to study the relation-ships between biodiversity and ESs and how such relation-ships are affected by grazing cessation. We aim to contributeempirical evidence about effects of ceased land use on indi-cators of eight ESs relevant for semi-natural grasslands andtheir relationships with plant species richness. We addressthe following questions: (1) how does abandonment of exten-sive sheep grazing management influence the ES indicators,if at all? (2) Are there any relationships between vascularplant species richness and, if so, how are the relationshipsaffected by abandonment of extensive sheep grazing man-agement?
2 Materials and methods
2.1 Study area and design
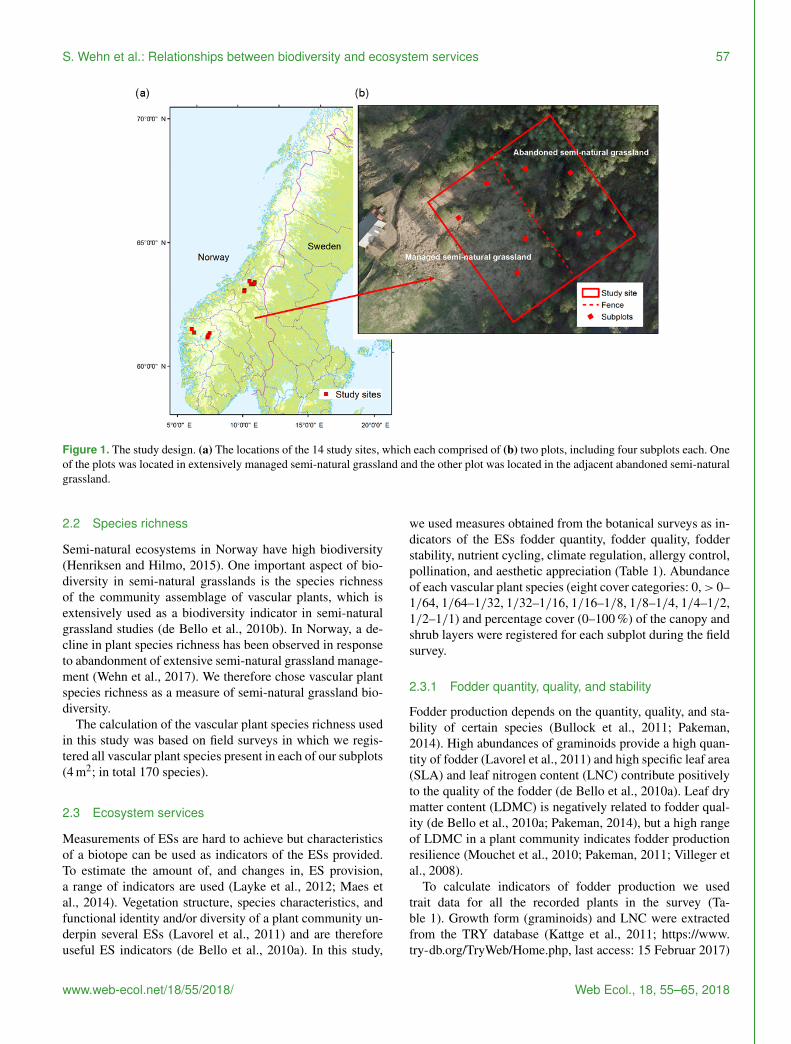
The study took place in boreal ecosystems in western(seven sites; 5◦33′50′′–7◦21′18′′ E, 61◦11′51′′–61◦33′50′′ N)and central Norway (seven sites; 10◦16′35′′–11◦16′52′′ E,63◦09′24′′–63◦32′32′′ N). The study has a “space for time”design approach: 14 sites with paired plots (nplots = 28), onein extensively managed semi-natural grassland and the otherin abandoned semi-natural grassland (Fig. 1). The managedsemi-natural grasslands were enclosed by fences and the ar-eas ranged from 1 to 10.5 ha. In each site, the paired plotswere located on either side of a fence (see Fig. 1), whichwas approximately perpendicular to the contour lines in theterrain. The maximum “vertical” lengths of the plots alongthe fences were 100 m and each of the plots extended a max-imum of 50 m away from the fence. The size of the plotsvaried due to the varying sizes of the extensively managedsemi-natural grasslands and ranged from 0.08 to 0.5 ha (meansize= 0.26 ha). Each plot contained four subplots (2 m× 2 m;n= 110). Two of the subplots were randomly located in thelower part of the plot and the other two in the upper part.In the extensively managed semi-natural grassland, locationsof the subplots were rejected when less than 10 m from thefence to avoid effects of the canopy in the neighbouring aban-doned plot. The sites were selected on the basis of havinga sheep pasture, representative of Norwegian semi-naturalgrasslands, with an abandoned area outside its fences.
The vegetation structure of the semi-natural grasslandswas similar and none were overgrazed but the grazing man-agement was a result of the farmer’s practice and not set bythe study.
Information about the management of the grasslands wasgained through semi-structured interviews with the farmers(nfarmers = 12). The farming system was the same for allfarms in the study and represents typical Norwegian sheephusbandry. The sheep were held in sheds during winter andkept on semi-natural grasslands in the lowland only dur-ing spring and autumn. These semi-natural grasslands hadnot been ploughed, reseeded, or fertilized during the lastfew decades. During the summer from early June to mid-September, the sheep were let free to range and graze onalpine pastures. Differences in time of lambing, snow cover,and availability of forage in the mountain pastures createvariation among years in the grazing period. We were there-fore unable to define the total grazing pressure for severalyears on the semi-natural grasslands. However, due to thesimilar structure of the pastures we assumed the total graz-ing pressure during the last decade to be comparable amongthe sites. In some of the extensively managed semi-naturalgrasslands, shrubs and trees were cleared by the farmers toincrease pasture quality. The abandoned semi-natural grass-lands were at different successional stages moving towardsforest. Time since abandonment ranged from 5 to 70 years.
Web Ecol., 18, 55–65, 2018 www.web-ecol.net/18/55/2018/
S. Wehn et al.: Relationships between biodiversity and ecosystem services 57
Figure 1. The study design. (a) The locations of the 14 study sites, which each comprised of (b) two plots, including four subplots each. Oneof the plots was located in extensively managed semi-natural grassland and the other plot was located in the adjacent abandoned semi-naturalgrassland.
2.2 Species richness
Semi-natural ecosystems in Norway have high biodiversity(Henriksen and Hilmo, 2015). One important aspect of bio-diversity in semi-natural grasslands is the species richnessof the community assemblage of vascular plants, which isextensively used as a biodiversity indicator in semi-naturalgrassland studies (de Bello et al., 2010b). In Norway, a de-cline in plant species richness has been observed in responseto abandonment of extensive semi-natural grassland manage-ment (Wehn et al., 2017). We therefore chose vascular plantspecies richness as a measure of semi-natural grassland bio-diversity.
The calculation of the vascular plant species richness usedin this study was based on field surveys in which we regis-tered all vascular plant species present in each of our subplots(4 m2; in total 170 species).
2.3 Ecosystem services
Measurements of ESs are hard to achieve but characteristicsof a biotope can be used as indicators of the ESs provided.To estimate the amount of, and changes in, ES provision,a range of indicators are used (Layke et al., 2012; Maes etal., 2014). Vegetation structure, species characteristics, andfunctional identity and/or diversity of a plant community un-derpin several ESs (Lavorel et al., 2011) and are thereforeuseful ES indicators (de Bello et al., 2010a). In this study,
we used measures obtained from the botanical surveys as in-dicators of the ESs fodder quantity, fodder quality, fodderstability, nutrient cycling, climate regulation, allergy control,pollination, and aesthetic appreciation (Table 1). Abundanceof each vascular plant species (eight cover categories: 0,> 0–1/64, 1/64–1/32, 1/32–1/16, 1/16–1/8, 1/8–1/4, 1/4–1/2,1/2–1/1) and percentage cover (0–100 %) of the canopy andshrub layers were registered for each subplot during the fieldsurvey.
2.3.1 Fodder quantity, quality, and stability
Fodder production depends on the quantity, quality, and sta-bility of certain species (Bullock et al., 2011; Pakeman,2014). High abundances of graminoids provide a high quan-tity of fodder (Lavorel et al., 2011) and high specific leaf area(SLA) and leaf nitrogen content (LNC) contribute positivelyto the quality of the fodder (de Bello et al., 2010a). Leaf drymatter content (LDMC) is negatively related to fodder qual-ity (de Bello et al., 2010a; Pakeman, 2014), but a high rangeof LDMC in a plant community indicates fodder productionresilience (Mouchet et al., 2010; Pakeman, 2011; Villeger etal., 2008).
To calculate indicators of fodder production we usedtrait data for all the recorded plants in the survey (Ta-ble 1). Growth form (graminoids) and LNC were extractedfrom the TRY database (Kattge et al., 2011; https://www.try-db.org/TryWeb/Home.php, last access: 15 Februar 2017)
www.web-ecol.net/18/55/2018/ Web Ecol., 18, 55–65, 2018
58 S. Wehn et al.: Relationships between biodiversity and ecosystem services
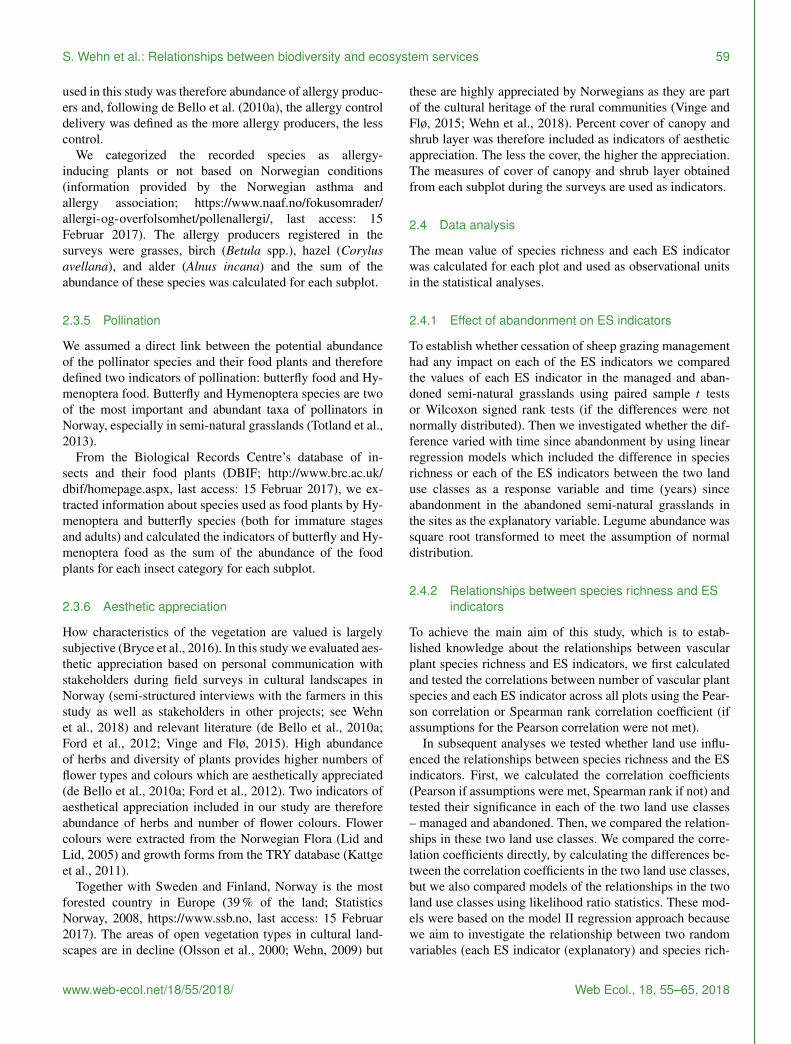
Table 1. Ecosystem services (ES) provided by semi-natural grasslands. Vegetation characteristics (indicators) and measures used to indicatethe ESs, the processes they affect, and the nature of the relationship (positive (+) or negative (−)) between the process.
Ecosystem service Process Indicator Measure Relationship
Fodder stability Resilience of production LDMCdiversity FR +
Fodder quantity Accumulation of green biomass Graminoids Abundance +
SLA CWM +
LDMC CWM −
Fodder quality Consumption and health LNC CWM +
Nutrient cycling Decomposition and mineralization Legumes Abundance +
LNC CWM +
SLA CWM +
LDMC CWM −
Pollination Pollination provision Butterfly food Abundance +
Hymenoptera food Abundance +
Climate Carbon sequestration in plants Shrubs and trees Abundance +
regulation Albedo effect Canopy Cover −
Shrub layer Cover −
Aesthetics Accumulation of standing biomass Canopy Cover −
Shrub layer Cover −
Species coexistence Flower colours Number +
Herbs Abundance +
Allergy control Allergy-inducing pollen production Allergy producers Abundance −
SLA is specific leaf area (in mm2 mg−1); LDMC is leaf dry matter content (in mg g−1); LNC is leaf nitrogen content (in mg g−1); CWM iscommunity weighted mean; FR is functional richness.
and SLA and LDMC from the LEDA database (Kleyer etal., 2008; http://www.uni-oldenburg.de/en/biology/landeco/research/projects/leda/, last access: 15 Februar 2017). Thepercentages of missing data of LDMC, SLA, and LNC were8, 3, and 27 %, respectively. We replaced these missing datawith values estimated based on other traits (such as LDMC,SLA, and/or LNC) with values present for that particularspecies using imputation methods as described by Taugour-deau et al. (2014). We then calculated community weightedmeans (CWMs) as suggested by Garnier et al. (2004), whichis a commonly used approach to summarize the functionalcomposition of single traits in a community, i.e. the func-tional identities of the semi-natural grasslands. CWM ofSLA, LDMC, and LNC and functional richness (range of thetrait values in the plant assemblages; Villeger et al., 2008) ofLDMC (LDMCdiversity) were calculated for each subplot us-ing the R package FD version 1.0-12 (Laliberté and Shipley,2011). Total abundance of graminoids was calculated as thesum of the abundance for each graminoid in each subplot.
2.3.2 Nutrient cycling
We selected the vegetation characteristics CWM of SLA,LNC, and LDMC and abundance of legumes as indicatorsof decomposition and mineralization because these measureshave been shown to impact the rate of nutrient cycling ingrasslands. High abundance of legumes and high SLA andLNC but low LDMC have been shown to positively affect nu-trient cycling rates (de Bello et al., 2010a; Duru et al., 2012).
To calculate abundance of legumes we classed the plantspecies registered according to whether they were legumes ornot using information provided by the TRY database (Kattgeet al., 2011) and summed the abundance of all legumes foreach subplot.
2.3.3 Climate regulation
Carbon storage through carbon sequestration is larger inforested areas compared to in grasslands (Anderson-Teixeiraet al., 2012) as carbon sequestration in shrub and tree speciesis high (de Bello et al., 2010a). However, forests absorb moreenergy compared to more “open” vegetation (Anderson-Teixeira et al., 2012; Betts, 2000); hence the more trees, thewarmer it is at the earth surface (the albedo effect).
An indicator of carbon sequestration was calculated basedon the eight cover classes of trunks of shrubs and trees inthe subplots. We classed the plant species registered accord-ing to whether they were shrubs, trees, or not using informa-tion provided by the TRY database (Kattge et al., 2011) andsummed the cover of the trunks of all shrubs and trees foreach subplot. An indicator of albedo was calculated based onthe information obtained through the surveys on the cover ofthe canopy and shrub layer.
2.3.4 Allergy control
A biotope’s lack of allergy-inducing plants is here referredto as total allergy control. The indicator of allergy control
Web Ecol., 18, 55–65, 2018 www.web-ecol.net/18/55/2018/
S. Wehn et al.: Relationships between biodiversity and ecosystem services 59
used in this study was therefore abundance of allergy produc-ers and, following de Bello et al. (2010a), the allergy controldelivery was defined as the more allergy producers, the lesscontrol.
We categorized the recorded species as allergy-inducing plants or not based on Norwegian conditions(information provided by the Norwegian asthma andallergy association; https://www.naaf.no/fokusomrader/allergi-og-overfolsomhet/pollenallergi/, last access: 15Februar 2017). The allergy producers registered in thesurveys were grasses, birch (Betula spp.), hazel (Corylusavellana), and alder (Alnus incana) and the sum of theabundance of these species was calculated for each subplot.
2.3.5 Pollination
We assumed a direct link between the potential abundanceof the pollinator species and their food plants and thereforedefined two indicators of pollination: butterfly food and Hy-menoptera food. Butterfly and Hymenoptera species are twoof the most important and abundant taxa of pollinators inNorway, especially in semi-natural grasslands (Totland et al.,2013).
From the Biological Records Centre’s database of in-sects and their food plants (DBIF; http://www.brc.ac.uk/dbif/homepage.aspx, last access: 15 Februar 2017), we ex-tracted information about species used as food plants by Hy-menoptera and butterfly species (both for immature stagesand adults) and calculated the indicators of butterfly and Hy-menoptera food as the sum of the abundance of the foodplants for each insect category for each subplot.
2.3.6 Aesthetic appreciation
How characteristics of the vegetation are valued is largelysubjective (Bryce et al., 2016). In this study we evaluated aes-thetic appreciation based on personal communication withstakeholders during field surveys in cultural landscapes inNorway (semi-structured interviews with the farmers in thisstudy as well as stakeholders in other projects; see Wehnet al., 2018) and relevant literature (de Bello et al., 2010a;Ford et al., 2012; Vinge and Flø, 2015). High abundanceof herbs and diversity of plants provides higher numbers offlower types and colours which are aesthetically appreciated(de Bello et al., 2010a; Ford et al., 2012). Two indicators ofaesthetical appreciation included in our study are thereforeabundance of herbs and number of flower colours. Flowercolours were extracted from the Norwegian Flora (Lid andLid, 2005) and growth forms from the TRY database (Kattgeet al., 2011).
Together with Sweden and Finland, Norway is the mostforested country in Europe (39 % of the land; StatisticsNorway, 2008, https://www.ssb.no, last access: 15 Februar2017). The areas of open vegetation types in cultural land-scapes are in decline (Olsson et al., 2000; Wehn, 2009) but
these are highly appreciated by Norwegians as they are partof the cultural heritage of the rural communities (Vinge andFlø, 2015; Wehn et al., 2018). Percent cover of canopy andshrub layer was therefore included as indicators of aestheticappreciation. The less the cover, the higher the appreciation.The measures of cover of canopy and shrub layer obtainedfrom each subplot during the surveys are used as indicators.
2.4 Data analysis
The mean value of species richness and each ES indicatorwas calculated for each plot and used as observational unitsin the statistical analyses.
2.4.1 Effect of abandonment on ES indicators
To establish whether cessation of sheep grazing managementhad any impact on each of the ES indicators we comparedthe values of each ES indicator in the managed and aban-doned semi-natural grasslands using paired sample t testsor Wilcoxon signed rank tests (if the differences were notnormally distributed). Then we investigated whether the dif-ference varied with time since abandonment by using linearregression models which included the difference in speciesrichness or each of the ES indicators between the two landuse classes as a response variable and time (years) sinceabandonment in the abandoned semi-natural grasslands inthe sites as the explanatory variable. Legume abundance wassquare root transformed to meet the assumption of normaldistribution.
2.4.2 Relationships between species richness and ESindicators
To achieve the main aim of this study, which is to estab-lished knowledge about the relationships between vascularplant species richness and ES indicators, we first calculatedand tested the correlations between number of vascular plantspecies and each ES indicator across all plots using the Pear-son correlation or Spearman rank correlation coefficient (ifassumptions for the Pearson correlation were not met).
In subsequent analyses we tested whether land use influ-enced the relationships between species richness and the ESindicators. First, we calculated the correlation coefficients(Pearson if assumptions were met, Spearman rank if not) andtested their significance in each of the two land use classes– managed and abandoned. Then, we compared the relation-ships in these two land use classes. We compared the corre-lation coefficients directly, by calculating the differences be-tween the correlation coefficients in the two land use classes,but we also compared models of the relationships in the twoland use classes using likelihood ratio statistics. These mod-els were based on the model II regression approach becausewe aim to investigate the relationship between two randomvariables (each ES indicator (explanatory) and species rich-
www.web-ecol.net/18/55/2018/ Web Ecol., 18, 55–65, 2018
60 S. Wehn et al.: Relationships between biodiversity and ecosystem services
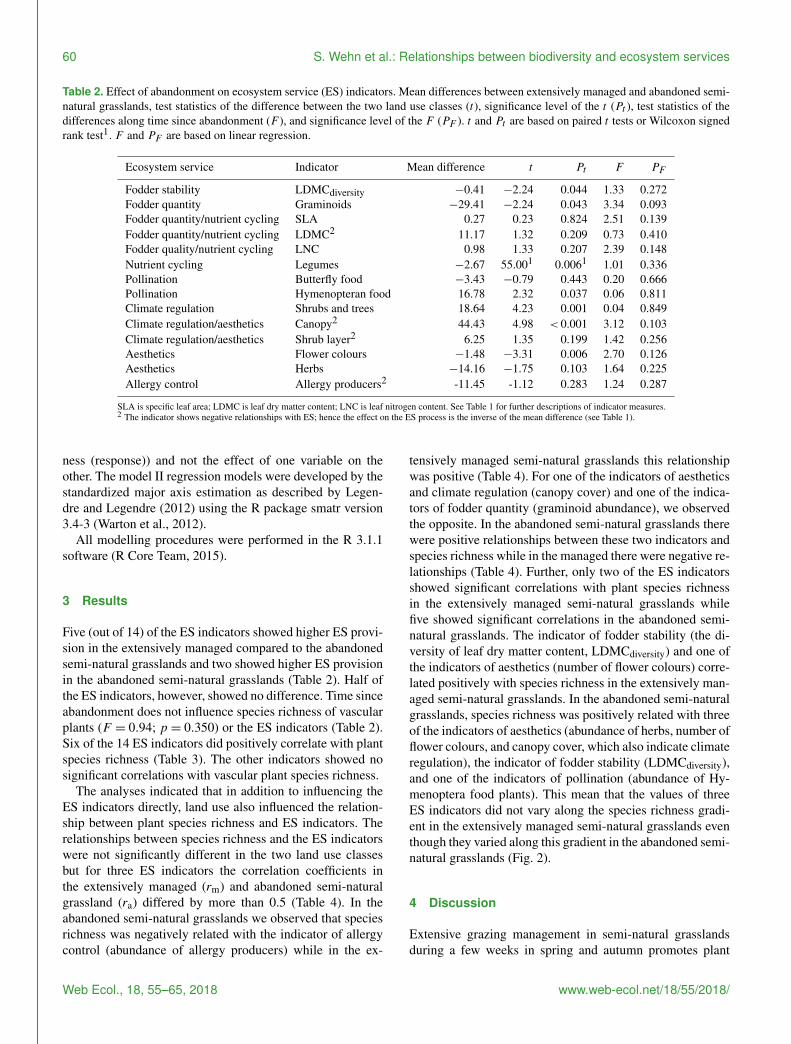
Table 2. Effect of abandonment on ecosystem service (ES) indicators. Mean differences between extensively managed and abandoned semi-natural grasslands, test statistics of the difference between the two land use classes (t), significance level of the t (Pt ), test statistics of thedifferences along time since abandonment (F ), and significance level of the F (PF ). t and Pt are based on paired t tests or Wilcoxon signedrank test1. F and PF are based on linear regression.
Ecosystem service Indicator Mean difference t Pt F PF
Fodder stability LDMCdiversity −0.41 −2.24 0.044 1.33 0.272Fodder quantity Graminoids −29.41 −2.24 0.043 3.34 0.093Fodder quantity/nutrient cycling SLA 0.27 0.23 0.824 2.51 0.139Fodder quantity/nutrient cycling LDMC2 11.17 1.32 0.209 0.73 0.410Fodder quality/nutrient cycling LNC 0.98 1.33 0.207 2.39 0.148Nutrient cycling Legumes −2.67 55.001 0.0061 1.01 0.336Pollination Butterfly food −3.43 −0.79 0.443 0.20 0.666Pollination Hymenopteran food 16.78 2.32 0.037 0.06 0.811Climate regulation Shrubs and trees 18.64 4.23 0.001 0.04 0.849Climate regulation/aesthetics Canopy2 44.43 4.98 < 0.001 3.12 0.103Climate regulation/aesthetics Shrub layer2 6.25 1.35 0.199 1.42 0.256Aesthetics Flower colours −1.48 −3.31 0.006 2.70 0.126Aesthetics Herbs −14.16 −1.75 0.103 1.64 0.225Allergy control Allergy producers2 -11.45 -1.12 0.283 1.24 0.287
SLA is specific leaf area; LDMC is leaf dry matter content; LNC is leaf nitrogen content. See Table 1 for further descriptions of indicator measures.2 The indicator shows negative relationships with ES; hence the effect on the ES process is the inverse of the mean difference (see Table 1).
ness (response)) and not the effect of one variable on theother. The model II regression models were developed by thestandardized major axis estimation as described by Legen-dre and Legendre (2012) using the R package smatr version3.4-3 (Warton et al., 2012).
All modelling procedures were performed in the R 3.1.1software (R Core Team, 2015).
3 Results
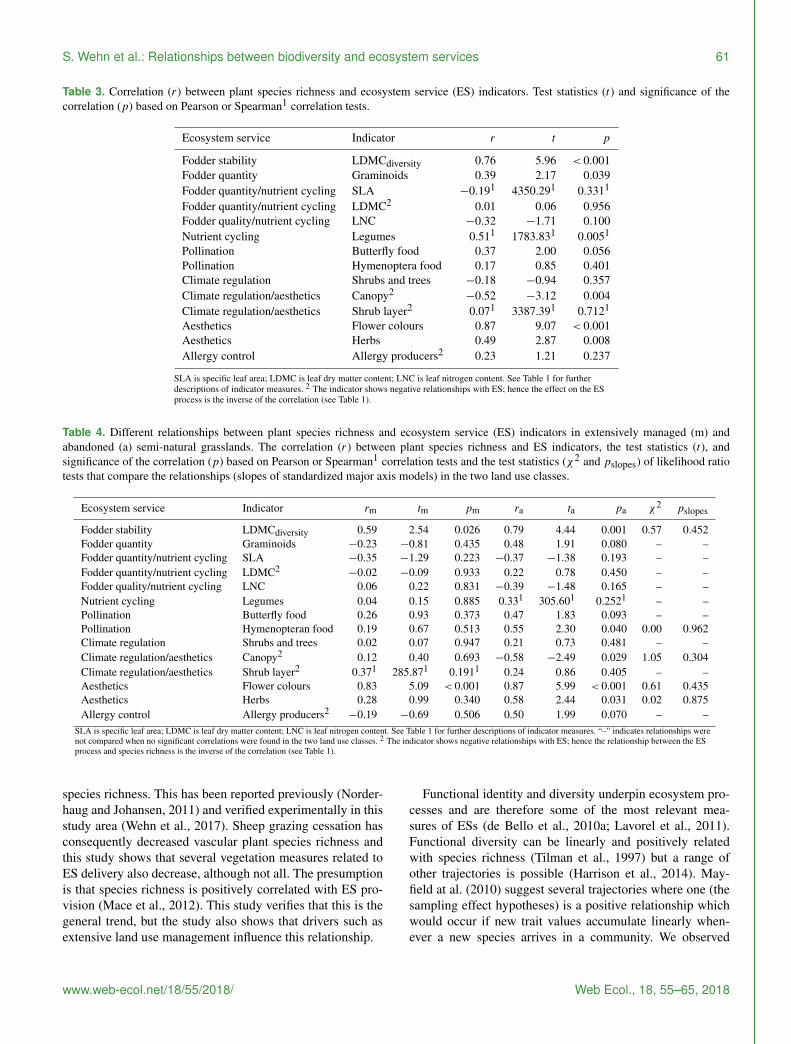
Five (out of 14) of the ES indicators showed higher ES provi-sion in the extensively managed compared to the abandonedsemi-natural grasslands and two showed higher ES provisionin the abandoned semi-natural grasslands (Table 2). Half ofthe ES indicators, however, showed no difference. Time sinceabandonment does not influence species richness of vascularplants (F = 0.94; p = 0.350) or the ES indicators (Table 2).Six of the 14 ES indicators did positively correlate with plantspecies richness (Table 3). The other indicators showed nosignificant correlations with vascular plant species richness.
The analyses indicated that in addition to influencing theES indicators directly, land use also influenced the relation-ship between plant species richness and ES indicators. Therelationships between species richness and the ES indicatorswere not significantly different in the two land use classesbut for three ES indicators the correlation coefficients inthe extensively managed (rm) and abandoned semi-naturalgrassland (ra) differed by more than 0.5 (Table 4). In theabandoned semi-natural grasslands we observed that speciesrichness was negatively related with the indicator of allergycontrol (abundance of allergy producers) while in the ex-
tensively managed semi-natural grasslands this relationshipwas positive (Table 4). For one of the indicators of aestheticsand climate regulation (canopy cover) and one of the indica-tors of fodder quantity (graminoid abundance), we observedthe opposite. In the abandoned semi-natural grasslands therewere positive relationships between these two indicators andspecies richness while in the managed there were negative re-lationships (Table 4). Further, only two of the ES indicatorsshowed significant correlations with plant species richnessin the extensively managed semi-natural grasslands whilefive showed significant correlations in the abandoned semi-natural grasslands. The indicator of fodder stability (the di-versity of leaf dry matter content, LDMCdiversity) and one ofthe indicators of aesthetics (number of flower colours) corre-lated positively with species richness in the extensively man-aged semi-natural grasslands. In the abandoned semi-naturalgrasslands, species richness was positively related with threeof the indicators of aesthetics (abundance of herbs, number offlower colours, and canopy cover, which also indicate climateregulation), the indicator of fodder stability (LDMCdiversity),and one of the indicators of pollination (abundance of Hy-menoptera food plants). This mean that the values of threeES indicators did not vary along the species richness gradi-ent in the extensively managed semi-natural grasslands eventhough they varied along this gradient in the abandoned semi-natural grasslands (Fig. 2).
4 Discussion
Extensive grazing management in semi-natural grasslandsduring a few weeks in spring and autumn promotes plant
Web Ecol., 18, 55–65, 2018 www.web-ecol.net/18/55/2018/
S. Wehn et al.: Relationships between biodiversity and ecosystem services 61
Table 3. Correlation (r) between plant species richness and ecosystem service (ES) indicators. Test statistics (t) and significance of thecorrelation (p) based on Pearson or Spearman1 correlation tests.
Ecosystem service Indicator r t p
Fodder stability LDMCdiversity 0.76 5.96 < 0.001Fodder quantity Graminoids 0.39 2.17 0.039Fodder quantity/nutrient cycling SLA −0.191 4350.291 0.3311
Fodder quantity/nutrient cycling LDMC2 0.01 0.06 0.956Fodder quality/nutrient cycling LNC −0.32 −1.71 0.100Nutrient cycling Legumes 0.511 1783.831 0.0051
Pollination Butterfly food 0.37 2.00 0.056Pollination Hymenoptera food 0.17 0.85 0.401Climate regulation Shrubs and trees −0.18 −0.94 0.357Climate regulation/aesthetics Canopy2
−0.52 −3.12 0.004Climate regulation/aesthetics Shrub layer2 0.071 3387.391 0.7121
Aesthetics Flower colours 0.87 9.07 < 0.001Aesthetics Herbs 0.49 2.87 0.008Allergy control Allergy producers2 0.23 1.21 0.237
SLA is specific leaf area; LDMC is leaf dry matter content; LNC is leaf nitrogen content. See Table 1 for furtherdescriptions of indicator measures. 2 The indicator shows negative relationships with ES; hence the effect on the ESprocess is the inverse of the correlation (see Table 1).
Table 4. Different relationships between plant species richness and ecosystem service (ES) indicators in extensively managed (m) andabandoned (a) semi-natural grasslands. The correlation (r) between plant species richness and ES indicators, the test statistics (t), andsignificance of the correlation (p) based on Pearson or Spearman1 correlation tests and the test statistics (χ2 and pslopes) of likelihood ratiotests that compare the relationships (slopes of standardized major axis models) in the two land use classes.
Ecosystem service Indicator rm tm pm ra ta pa χ2 pslopes
Fodder stability LDMCdiversity 0.59 2.54 0.026 0.79 4.44 0.001 0.57 0.452Fodder quantity Graminoids −0.23 −0.81 0.435 0.48 1.91 0.080 – –Fodder quantity/nutrient cycling SLA −0.35 −1.29 0.223 −0.37 −1.38 0.193 – –Fodder quantity/nutrient cycling LDMC2
−0.02 −0.09 0.933 0.22 0.78 0.450 – –Fodder quality/nutrient cycling LNC 0.06 0.22 0.831 −0.39 −1.48 0.165 – –Nutrient cycling Legumes 0.04 0.15 0.885 0.331 305.601 0.2521 – –Pollination Butterfly food 0.26 0.93 0.373 0.47 1.83 0.093 – –Pollination Hymenopteran food 0.19 0.67 0.513 0.55 2.30 0.040 0.00 0.962Climate regulation Shrubs and trees 0.02 0.07 0.947 0.21 0.73 0.481 – –Climate regulation/aesthetics Canopy2 0.12 0.40 0.693 −0.58 −2.49 0.029 1.05 0.304Climate regulation/aesthetics Shrub layer2 0.371 285.871 0.1911 0.24 0.86 0.405 – –Aesthetics Flower colours 0.83 5.09 < 0.001 0.87 5.99 < 0.001 0.61 0.435Aesthetics Herbs 0.28 0.99 0.340 0.58 2.44 0.031 0.02 0.875Allergy control Allergy producers2
−0.19 −0.69 0.506 0.50 1.99 0.070 – –SLA is specific leaf area; LDMC is leaf dry matter content; LNC is leaf nitrogen content. See Table 1 for further descriptions of indicator measures. “–” indicates relationships werenot compared when no significant correlations were found in the two land use classes. 2 The indicator shows negative relationships with ES; hence the relationship between the ESprocess and species richness is the inverse of the correlation (see Table 1).
species richness. This has been reported previously (Norder-haug and Johansen, 2011) and verified experimentally in thisstudy area (Wehn et al., 2017). Sheep grazing cessation hasconsequently decreased vascular plant species richness andthis study shows that several vegetation measures related toES delivery also decrease, although not all. The presumptionis that species richness is positively correlated with ES pro-vision (Mace et al., 2012). This study verifies that this is thegeneral trend, but the study also shows that drivers such asextensive land use management influence this relationship.
Functional identity and diversity underpin ecosystem pro-cesses and are therefore some of the most relevant mea-sures of ESs (de Bello et al., 2010a; Lavorel et al., 2011).Functional diversity can be linearly and positively relatedwith species richness (Tilman et al., 1997) but a range ofother trajectories is possible (Harrison et al., 2014). May-field at al. (2010) suggest several trajectories where one (thesampling effect hypotheses) is a positive relationship whichwould occur if new trait values accumulate linearly when-ever a new species arrives in a community. We observed
www.web-ecol.net/18/55/2018/ Web Ecol., 18, 55–65, 2018
62 S. Wehn et al.: Relationships between biodiversity and ecosystem services
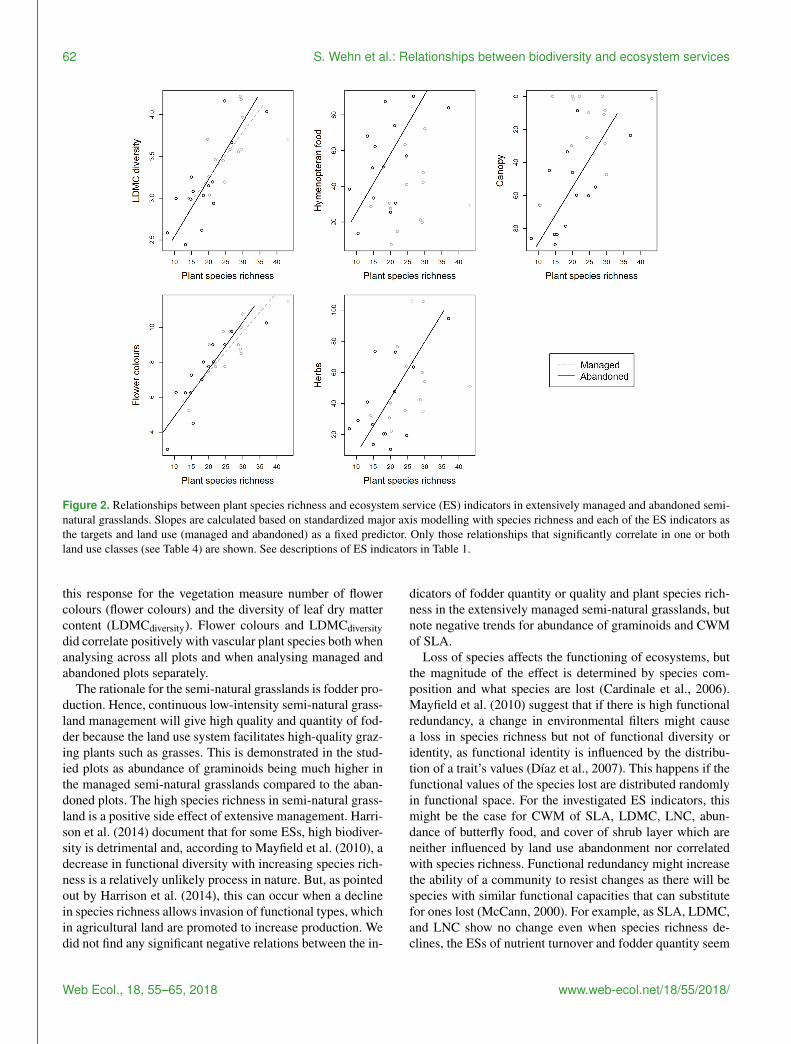
Figure 2. Relationships between plant species richness and ecosystem service (ES) indicators in extensively managed and abandoned semi-natural grasslands. Slopes are calculated based on standardized major axis modelling with species richness and each of the ES indicators asthe targets and land use (managed and abandoned) as a fixed predictor. Only those relationships that significantly correlate in one or bothland use classes (see Table 4) are shown. See descriptions of ES indicators in Table 1.
this response for the vegetation measure number of flowercolours (flower colours) and the diversity of leaf dry mattercontent (LDMCdiversity). Flower colours and LDMCdiversitydid correlate positively with vascular plant species both whenanalysing across all plots and when analysing managed andabandoned plots separately.
The rationale for the semi-natural grasslands is fodder pro-duction. Hence, continuous low-intensity semi-natural grass-land management will give high quality and quantity of fod-der because the land use system facilitates high-quality graz-ing plants such as grasses. This is demonstrated in the stud-ied plots as abundance of graminoids being much higher inthe managed semi-natural grasslands compared to the aban-doned plots. The high species richness in semi-natural grass-land is a positive side effect of extensive management. Harri-son et al. (2014) document that for some ESs, high biodiver-sity is detrimental and, according to Mayfield et al. (2010), adecrease in functional diversity with increasing species rich-ness is a relatively unlikely process in nature. But, as pointedout by Harrison et al. (2014), this can occur when a declinein species richness allows invasion of functional types, whichin agricultural land are promoted to increase production. Wedid not find any significant negative relations between the in-
dicators of fodder quantity or quality and plant species rich-ness in the extensively managed semi-natural grasslands, butnote negative trends for abundance of graminoids and CWMof SLA.
Loss of species affects the functioning of ecosystems, butthe magnitude of the effect is determined by species com-position and what species are lost (Cardinale et al., 2006).Mayfield et al. (2010) suggest that if there is high functionalredundancy, a change in environmental filters might causea loss in species richness but not of functional diversity oridentity, as functional identity is influenced by the distribu-tion of a trait’s values (Díaz et al., 2007). This happens if thefunctional values of the species lost are distributed randomlyin functional space. For the investigated ES indicators, thismight be the case for CWM of SLA, LDMC, LNC, abun-dance of butterfly food, and cover of shrub layer which areneither influenced by land use abandonment nor correlatedwith species richness. Functional redundancy might increasethe ability of a community to resist changes as there will bespecies with similar functional capacities that can substitutefor ones lost (McCann, 2000). For example, as SLA, LDMC,and LNC show no change even when species richness de-clines, the ESs of nutrient turnover and fodder quantity seem
Web Ecol., 18, 55–65, 2018 www.web-ecol.net/18/55/2018/
S. Wehn et al.: Relationships between biodiversity and ecosystem services 63
to be robust in our study sites regardless of changes in landuse.
Generally, across all plots, the relationships between ESindicators and plant species richness were positive. How-ever, the ES indicators’ abundance of herbs, cover of canopy,and abundance of Hymenoptera food were not significantlycorrelated with species richness in the extensively managedsemi-natural grasslands, only in the abandoned semi-naturalgrasslands. The extensive management might thus contributeto the functional redundancy (no change in ES delivery alongthe species richness gradient) because this low-intensity dis-turbance limit potential dominating species (Grime, 2006).Most species in the extensive semi-natural grasslands areherbs and grasses that have similar ecological effects and ourresult is consistent with other studies that state that functionalredundancy in and among semi-natural grasslands is high(Kahmen, 2009). In addition, as similar grazing manage-ment is practiced across all semi-natural grasslands to opti-mize fodder production, other environmental factors such asmicroclimate potentially vary more between the abandonedsemi-natural grasslands compared to between the extensivelymanaged semi-natural grasslands. The difference in func-tional redundancy between the managed and the abandonedsemi-natural grassland could therefore also be explained bysmall variation within environmental factors that have the po-tential to filter the functional measures between the exten-sively semi-natural grasslands.
5 Conclusions
Abandonment of extensive management imposes a negativeeffect on both species richness and some ESs. The resultsof this study document that as provision of some ecosys-tem services are high in abandoned and forested areas, semi-natural grasslands managed by extensive land use practicessuch as sheep grazing during spring and autumn deliver otherecosystem services such as fodder quantity and stability,nutrient cycling, climate regulation through the albedo ef-fect, and aesthetics, which are impaired when managementis abandoned. Biodiversity is often positively correlated withecosystem service provision, but not always. Cessation of ex-tensive sheep grazing management influences not only plantspecies richness and ES indicators directly but also the rela-tionships between species richness and ES indicators. Therelationships between vascular plant species richness andES indicators are less pronounced in the extensively man-aged semi-natural grasslands than for the abandoned semi-natural grasslands. One explanation of this is high levels offunctional redundancy in extensively managed semi-naturalgrasslands.
Data availability. The data are not publicly accessible in theirpresent form, but can be shared by the authors upon request.
Author contributions. SW prepared the concept of the study, de-veloped the ES indicators, performed the statistical analyses, wrotethe manuscript, prepared the images, and checked the final version.KAH prepared the concept of the study, provided input to the statis-tical analysis, participated in the writing process, and checked thefinal version. LJ prepared the concept of the study, developed theES indicators, provided input to the statistical analysis, participatedin the writing process, and checked the final version.
Competing interests. The authors declare that they have no con-flict of interest.
Acknowledgements. This study was part of project no.208036/010 funded by the Norwegian Research Council. Theauthors thank the landowners for granting them access to the fieldsites, Synnøve Nordal Grenne, Per Vesterbukt, Liv Guri Velle,Sigrun Aune, and På Thorvaldsen for field assistance, SimonTaugourdeau for help during data curation and Cathy Jenks,Jan Bengtsson, and an anonymous reviewer for helpful comments.
Edited by: Jutta StadlerReviewed by: Jan Bengtsson and one anonymous referee
References
Anderson-Teixeira, K. J., Snyder, P. K., Twine, T. E., Cuadra, S. V.,Costa, M. H., and DeLucia, E. H.: Climate-regulation services ofnatural and agricultural ecoregions of the Americas, Nat. Clim.Change, 2, 177–181, 2012.
Balvanera, P., Pfisterer, A. B., Buchmann, N., He, J.-S.,Nakashizuka, T., Raffaelli, D., and Schmid, B.: Quantifying theevidence for biodiversity effects on ecosystem functioning andservices, Ecol. Lett., 9, 1146–1156, 2006.
Betts, R. A.: Offset of the potential carbon sink from boreal foresta-tion by decreases in surface albedo, Nature, 408, 187–190, 2000.
Bignal, E. M. and McCracken, D. I.: Low-intensity farming systemsin the conservation of the countryside, J. Appl. Ecol., 33, 413–424, 1996.
Bryce, R., Irvine, K. N., Church, A., Fish, R., Ranger, S., and Ken-ter, J. O.: Subjective well-being indicators for large-scale assess-ment of cultural ecosystem services, Ecosyst. Serv., 21, 258–269,2016.
Bullock, J. M., Jefferson, R. G., Blackstock, T. H., Pakeman, R.J., Emmett, B. A., Pywell, R. J., Grime, J. P., and Silvertown, J.:Semi-natural Grasslands in UK National Ecosystem Assessment,chap. 6, in: The UK National Ecosystem Assessment TechnicalReport, UNEP-WCMC, Cambridge, 2011.
Cardinale, B. J., Srivastava, D. S., Duffy, J. E., Wright, J. P., Down-ing, A. L., Sankaran, M., and Jouseau, C.: Effects of biodiver-sity on the functioning of trophic groups and ecosystems, Nature,443, 989–992, 2006.
Cardinale, B. J., Duffy, J. E., Gonzalez, A., Hooper, D. U., Perrings,C., Venail, P., Narwani, A., Mace, G. M., Tilman, D., and Wardle,D. A.: Biodiversity loss and its impact on humanity, Nature, 486,59–67, 2012.
www.web-ecol.net/18/55/2018/ Web Ecol., 18, 55–65, 2018
64 S. Wehn et al.: Relationships between biodiversity and ecosystem services
de Bello, F., Lavorel, S., Diaz, S., Harrington, R., Cornelissen, J. H.C., Bardgett, R. D., Berg, M. P., Cipriotti, P., Feld, C. K., Hering,D., da Silva, P. M., Potts, S. G., Sandin, L., Sousa, J. P., Storkey,J., Wardle, D. A., and Harrison, P. A.: Towards an assessment ofmultiple ecosystem processes and services via functional traits,Biodivers. Conserv., 19, 2873–2893, 2010a.
de Bello, F., Lavorel, S., Gerhold, P., Reier, Ü., and Pärtel, M.: Abiodiversity monitoring framework for practical conservation ofgrasslands and shrublands, Biol. Conserv., 143, 9–17, 2010b.
Deng, X., Li, Z., and Gibson, J.: A review on trade-off analysisof ecosystem services for sustainable land-use management, J.Geogr. Sci., 26, 953–968, 2016.
Díaz, S., Tilman, D., Fargione, J., Chapin III, F. S., Dirzo, R.,and Ktzberber, T.: Biodiversity regulation of ecosystem services,Trends and conditions, in: Ecosystems and Human Well-being;Current State & Trends, edited by: Hassan, R., Scholes, R., andAsh, N., Island Press, Washington, DC, 297–329, 2005.
Díaz, S., Lavorel, S., de Bello, F., Quétier, F., Grigulis, K., andRobson, T. M.: Incorporating plant functional diversity effectsin ecosystem service assessments, P. Natl. Acad. Sci. USA, 104,20684–20689, 2007.
Dodgshon, R. A. and Olsson, E. G. A.: Seasonality in Europeanmountain areas: a study in human ecology, in: Seasonal land-scapes, Springer, 85–101, 2007.
Doxa, A., Bas, Y., Paracchini, M. L., Pointereau, P., Terres, J. M.,and Jiguet, F.: Low-intensity agriculture increases farmland birdabundances in France, J. Appl. Ecol., 47, 1348–1356, 2010.
Duru, M., Theau, J. P., and Cruz, P.: Functional diversity of species-rich managed grasslands in response to fertility, defoliation andtemperature, Basic Appl. Ecol., 13, 20–31, 2012.
Emanuelsson, U., Arding, M., and Petersson, M.: The Rural Land-scapes of Europe: How Man has Shaped European Nature, For-mas, Stockholm, 2009.
Ford, H., Garbutt, A., Jones, D. L., and Jones, L.: Impacts of grazingabandonment on ecosystem service provision: Coastal grasslandas a model system, Agr. Ecosyst. Environ., 162, 108–115, 2012.
Garnier, E., Cortez, J., Billes, G., Navas, M. L., Roumet, C., De-bussche, M., Laurent, G., Blanchard, A., Aubry, D., Bellmann,A., Neill, C., and Toussaint, J. P.: Plant functional markers cap-ture ecosystem properties during secondary succession, Ecology,85, 2630–2637, 2004.
Grime, J. P.: Plant Strategies, Vegetation Processes, and EcosystemProperties, John Wiley & Sons, 2006.
Haines-Young, R. and Potschin, M.: The links between biodiversity,ecosystem services and human well-being, in: Ecosystem Ecol-ogy: a new synthesis, Ecological Reviews, Cambridge UniversityPress, 110–139, 2010.
Harrison, P., Berry, P., Simpson, G., Haslett, J., Blicharska, M.,Bucur, M., Dunford, R., Egoh, B., Garcia-Llorente, M., andGeamana, N.: Linkages between biodiversity attributes andecosystem services: a systematic review, Ecosyst. Serv., 9, 191–203, 2014.
Henriksen, S. and Hilmo, O.: Norsk rødliste for arter 2015 (Norwe-gian Red List for Species), The Norwegian Biodiversity Infor-mation Centre, Norway, 2015.
Isbell, F., Calcagno, V., Hector, A., Connolly, J., Harpole, W. S.,Reich, P. B., Scherer-Lorenzen, M., Schmid, B., Tilman, D.,van Ruijven, J., Weigelt, A., Wilsey, B. J., Zavaleta, E. S., and
Loreau, M.: High plant diversity is needed to maintain ecosys-tem services, Nature, 477, 199–202, 2011.
Kahmen, A.: Biodiversity and Ecosystem Functioning of SelectedTerrestrial Ecosystems: Grasslands, in: Biodiversity: Structureand Function, Volume 1: Encyclopedia of Life Support Sys-tems (EOLSS), edited by: Barthlott, W., Linsenmair, K. E., andPorembski, S., UNESCO, 117–128. 2009.
Kattge, J., Diaz, S., Lavorel, S., Prentice, I., Leadley, P., Bönisch,G., Garnier, E., Westoby, M., Reich, P. B., and Wright, I.: TRY–aglobal database of plant traits, Glob. Change Biol., 17, 2905–2935, 2011.
Kleyer, M., Bekker, R., Knevel, I., Bakker, J., Thompson, K., Son-nenschein, M., Poschlod, P., Van Groenendael, J., Klimeš, L., andKlimešová, J.: The LEDA Traitbase: a database of life-historytraits of the Northwest European flora, J. Ecol., 96, 1266–1274,2008.
Laliberté, E. and Shipley, B.: FD: measuring functional diversityfrom multiple traits, and other tools for functional ecology, Rpackage version 1.0-12, available at: http://CRAN.R-project.org/package=FD (last access: 4 May 2016), 2011.
Lavelle, P., Dugdale, R., and Scholes, R.: Nutrient cycling, in:Ecosystems and Human Well-being: Current State & Trends,edited by: Hassan, R., Scholes, R., and Ash, N., Island Press,2005.
Lavorel, S., Grigulis, K., Lamarque, P., Colace, M. P., Garden, D.,Girel, J., Pellet, G., and Douzet, R.: Using plant functional traitsto understand the landscape distribution of multiple ecosystemservices, J. Ecol., 99, 135–147, 2011.
Layke, C., Mapendembe, A., Brown, C., Walpole, M., and Winn, J.:Indicators from the global and sub-global Millennium EcosystemAssessments: An analysis and next steps, Ecol. Indic., 17, 77–87,2012.
Legendre, P. and Legendre, L. F.: Numerical ecology, Elsevier,2012.
Lid, J. and Lid, D.: Norsk flora, 7 utgåve ved R, Elven, Det NorskeSamlaget, Oslo, Norway, 2005.
Lindemann-Matthies, P., Junge, X., and Matthies, D.: The influenceof plant diversity on people’s perception and aesthetic apprecia-tion of grassland vegetation, Biol. Conserv., 143, 195–202, 2010.
Mace, G. M., Norris, K., and Fitter, A. H.: Biodiversity and ecosys-tem services: a multilayered relationship, Trends Ecol. Evol., 27,19–26, 2012.
Maes, J., Teller, A., Erhard, M., Murphy, P., Paracchini, M. L.,Barredo, J. I., Meiner, A., Grizzetti, B, Cardoso, A., Somma F.,Petersen, J.-E., Meiner, A., Gelabert, E. R., Zal, N., Kristensen,P., Bastrup-Birk, A., Biala, K., Romao, C., Piroddi, C., Egoh, B.,Fiorina, C., Santos, F., Naruševicius, V., Verboven, J., Pereira,H., Bengtsson, J., Gocheva, K., Marta-Pedroso, C., Snäll, T., Es-treguil, C., San Miguel, J., Braat, L., Grêt-Regamey, A., Perez-Soba, M., Degeorges, P., Beaufaron4, G. Lillebø, A., Malak, D.A., Liquete, C., Condé, S, Moen, J., Östergård, H., Czúcz, B.,Drakou, E. G., Zulian, G., Lavalle, C., Meiner, A.:: Mappingand assessment of ecosystems and their services indicators forecosystem assessments under action 5 of the EU biodiversitystrategy to 2020: 2nd report-final, European Commission, Febru-ary 2014.
Mayfield, M. M., Bonser, S. P., Morgan, J. W., Aubin, I., Mc-Namara, S., and Vesk, P. A.: What does species richness tellus about functional trait diversity? Predictions and evidence for
Web Ecol., 18, 55–65, 2018 www.web-ecol.net/18/55/2018/
S. Wehn et al.: Relationships between biodiversity and ecosystem services 65
responses of species and functional trait diversity to land-usechange, Global Ecol. Biogeogr., 19, 423–431, 2010.
McCann, K. S.: The diversity–stability debate, Nature, 405, 228–233, 2000.
Millennium Ecosystem Assessment: Ecosystems and human well-being: desertification synthesis, World Resources Institute, 2005.
Mouchet, M. A., Villeger, S., Mason, N. W. H., and Mouillot,D.: Functional diversity measures: an overview of their redun-dancy and their ability to discriminate community assemblyrules, Funct. Ecol., 24, 867–876, 2010.
Nagendra, H., Reyers, B., and Lavorel, S.: Impacts of land changeon biodiversity: making the link to ecosystem services, Curr.Opin. Env. Sust., 5, 503–508, 2013.
Norderhaug, A. and Johansen, L.: Semi-natural sites and borealheaths, in: The 2011 Norwegian Red List for Ecosystems andHabitat Types, edited by: Lindgaard, A. and Henriksen, S., Nor-wegian Biodiversity Information Centre, Trondheim, Norway,2011.
Olsson, E. G. A., Austrheim, G., and Grenne, S. N.: Landscapechange patterns in mountains, land use and environmental di-versity, Mid-Norway 1960–1993, Landscape Ecol., 15, 155–170,2000.
Pakeman, R. J.: Multivariate identification of plant functional re-sponse and effect traits in an agricultural landscape, Ecology, 92,1353–1365, 2011.
Pakeman, R. J.: Leaf dry matter content predicts herbivoreproductivity, but its functional diversity is positively re-lated to resilience in grasslands, PLoS ONE, 9, e101876,https://doi.org/10.1371/journal.pone.0101876, 2014.
Pereira, H. M., Leadley, P. W., Proença, V., Alkemade, R., Scharle-mann, J. P., Fernandez-Manjarrés, J. F., Araújo, M. B., Balvan-era, P., Biggs, R., and Cheung, W. W.: Scenarios for global bio-diversity in the 21st century, Science, 330, 1496–1501, 2010.
Potts, S. G., Imperatriz-Fonseca, V., Ngo, H., Biesmeijer, J., Breeze,T. D., Dicks, L., Garibaldi, L., Hill, R., Settele, J., and Vanbergen,A.: Summary for policymakers of the assessment report of theIntergovernmental Science-Policy Platform on Biodiversity andEcosystem Services on pollinators, pollination and food produc-tion, Intergovernmental Science-Policy Platform on Biodiversityand Ecosystem Services, Bonn, Germany, 2016.
Raatikainen, K. M., Heikkinen, R. K., and Pykälä, J.: Impacts oflocal and regional factors on vegetation of boreal semi-naturalgrasslands, Plant Ecology, 189, 155–173, 2007.
R Core Team: R: A Language and Environment for Statistical Com-puting, R Foundation for Statistical Computing, Vienna, Austria,https://www.R-project.org/ (last access: 15 Februar 2017), 2015.
Shoji, A., Hayashi, H., Kohyama, K., and Sasaki, H.: Effects ofhorse grazing on plant species richness and abundance of Irissetosa in a boreal semi-natural grassland, Japan, Grassl. Sci., 57,1–8, 2011.
Taugourdeau, S., Villerd, J., Plantureux, S., Huguenin-Elie, O., andAmiaud, B.: Filling the gap in functional trait databases: use ofecological hypotheses to replace missing data, Ecol. Evol., 4,944–958, 2014.
Tilman, D., Knops, J., Wedin, D., Reich, P., Ritchie, M., and Sie-mann, E.: The influence of functional diversity and compositionon ecosystem processes, Science, 277, 1300–1302, 1997.
Totland, Ø., Hovstad, K. A., Ødegaard, F., and Åström, J.: Stateof knowledge regarding insect pollination in Norway – the im-portance of the complex interaction between plants and insects,Norwegian Biodiversity Information Centre, Trondheim, Nor-way, 2013.
Villeger, S., Mason, N. W. H., and Mouillot, D.: New multidimen-sional functional diversity indices for a multifaceted frameworkin functional ecology, Ecology, 89, 2290–2301, 2008.
Vinge, H. and Flø, B. E.: Landscapes lost? Tourist understandingsof changing Norwegian rural landscapes, Scand. J. Hosp. Tour.,15, 29–47, 2015.
Warton, D. I., Duursma, R. A., Falster, D. S., and Taskinen, S.: smatr3–an R package for estimation and inference about allometriclines, Methods Ecol. Evol., 3, 257–259, 2012.
Wehn, S.: A map-based method for exploring responses to differentlevels of grazing pressure at the landscape scale, Agr. Ecosyst.Environ., 129, 177–181, 2009.
Wehn, S., Taugourdeau, S., Johansen, L., and Hovstad, K. A.: Ef-fects of abandonment on plant diversity along environmental gra-dients, J. Veg. Sci., 28, 838–847, 2017.
Wehn, S., Burton, R., Riley, M., Johansen, L., Hovstad, K. A.,and Rønningen, K.: Adaptive biodiversity management of semi-natural hay meadows: The case of West-Norway, Land Use Pol-icy, 72, 259–269, 2018.
www.web-ecol.net/18/55/2018/ Web Ecol., 18, 55–65, 2018