Quantifying the evidence for biodiversity effects on ecosystem functioning and services
11
REVIEW AND SYNTHESIS Quantifying the evidence for biodiversity effects on ecosystem functioning and services Patricia Balvanera, 1 * Andrea B. Pfisterer, 2 Nina Buchmann, 3 Jing-Shen He, 4 Tohru Nakashizuka, 5 David Raffaelli 6 and Bernhard Schmid 2 1 Centro de Investigaciones en Ecosistemas, UNAM, Morelia, Mexico 2 Institute of Environmental Sciences, Universita ¨t Zu ¨ rich, Zu ¨ rich, Switzerland 3 Institute of Plant Sciences, ETH Zurich, Zurich, Switzerland 4 Department of Ecology, Peking University, Peking, China 5 Research Institute for Humanity and Nature, Kyoto, Japan 6 Environment Department, University of York, York, UK *Correspondence: E-mail: [email protected] Abstract Concern is growing about the consequences of biodiversity loss for ecosystem functioning, for the provision of ecosystem services, and for human well being. Experimental evidence for a relationship between biodiversity and ecosystem process rates is compelling, but the issue remains contentious. Here, we present the first rigorous quantitative assessment of this relationship through meta-analysis of experimental work spanning 50 years to June 2004. We analysed 446 measures of biodiversity effects (252 in grasslands), 319 of which involved primary producer manipulations or measurements. Our analyses show that: biodiversity effects are weaker if biodiversity manipulations are less well controlled; effects of biodiversity change on processes are weaker at the ecosystem compared with the community level and are negative at the population level; productivity-related effects decline with increasing number of trophic links between those elements manipulated and those measured; biodiversity effects on stability measures (ÔinsuranceÕ effects) are not stronger than biodiversity effects on performance measures. For those ecosystem services which could be assessed here, there is clear evidence that biodiversity has positive effects on most. Whilst such patterns should be further confirmed, a precautionary approach to biodiversity management would seem prudent in the meantime. Keywords Biodiversity–ecosystem functioning, diversity manipulations, ecosystem property, ecosystem services, ecosystem type, experimental design, meta-analysis, stability, trophic level. Ecology Letters (2006) 9: 1146–1156 INTRODUCTION Human needs have been, and continue to be, satisfied at the expense of altered land use, climate, biogeochemical cycles and species distributions (MA 2005). As a result, biodiversity is declining a thousand times faster now than at rates found in the fossil record (MA 2005), raising concerns about consequences of such loss for ecosystem functioning, the provision of ecosystem services and human well being (Schla ¨pfer & Schmid 1999; Chapin et al. 2000; Loreau et al. 2001; Kinzig et al. 2002; Dı ´az et al. 2005; Hooper et al. 2005; MA 2005; Srivastava & Vellend 2005). Such concerns have moved beyond the science community to the global stakeholder and policy community with the publication of the Millennium Assessment (Dı ´az et al. 2005; MA 2005). That analysis acknowledges that biodiversity probably plays a significant role in directly providing goods and services as well as regulating and modulating ecosystem properties (this term is used here to include ÔprocessesÕ and ÔfunctioningÕ) that underpin the delivery of ecosystem services. Considerable research has gone into teasing out the linkages between biodiversity, functioning and services (Naeem & Wright 2003), and experimental approaches now account for 40% of the publications in this area (Fig. 1). Most experiments have manipulated diversity or have assembled different diversities as a treatment variable and documented the response of ecosystem properties and processes, including modifying effects of environmental factors on such relation- ships (Naeem et al. 1994; Tilman 1996; McGrady-Steed et al. 1997; Hector et al. 1999). The experimental designs used, results obtained and interpretations made, have not been consistent and the field has been contentious and lively Ecology Letters, (2006) 9: 1146–1156 doi: 10.1111/j.1461-0248.2006.00963.x Ó 2006 Blackwell Publishing Ltd/CNRS
Transcript of Quantifying the evidence for biodiversity effects on ecosystem functioning and services

REV I EW ANDSYNTHES I S Quantifying the evidence for biodiversity effects on
ecosystem functioning and services
Patricia Balvanera,1* Andrea B.
Pfisterer,2 Nina Buchmann,3
Jing-Shen He,4 Tohru
Nakashizuka,5 David Raffaelli6
and Bernhard Schmid2
1Centro de Investigaciones en
Ecosistemas, UNAM, Morelia,
Mexico2Institute of Environmental
Sciences, Universitat Zurich,
Zurich, Switzerland3Institute of Plant Sciences, ETH
Zurich, Zurich, Switzerland4Department of Ecology, Peking
University, Peking, China5Research Institute for
Humanity and Nature, Kyoto,
Japan6Environment Department,
University of York, York, UK
*Correspondence: E-mail:
AbstractConcern is growing about the consequences of biodiversity loss for ecosystem
functioning, for the provision of ecosystem services, and for human well being.
Experimental evidence for a relationship between biodiversity and ecosystem process
rates is compelling, but the issue remains contentious. Here, we present the first rigorous
quantitative assessment of this relationship through meta-analysis of experimental work
spanning 50 years to June 2004. We analysed 446 measures of biodiversity effects (252 in
grasslands), 319 of which involved primary producer manipulations or measurements.
Our analyses show that: biodiversity effects are weaker if biodiversity manipulations are
less well controlled; effects of biodiversity change on processes are weaker at the
ecosystem compared with the community level and are negative at the population level;
productivity-related effects decline with increasing number of trophic links between
those elements manipulated and those measured; biodiversity effects on stability
measures (!insurance" effects) are not stronger than biodiversity effects on performance
measures. For those ecosystem services which could be assessed here, there is clear
evidence that biodiversity has positive effects on most. Whilst such patterns should be
further confirmed, a precautionary approach to biodiversity management would seem
prudent in the meantime.
KeywordsBiodiversity–ecosystem functioning, diversity manipulations, ecosystem property,
ecosystem services, ecosystem type, experimental design, meta-analysis, stability, trophic
level.
Ecology Letters (2006) 9: 1146–1156
I N TRODUCT ION
Human needs have been, and continue to be, satisfied at theexpense of altered land use, climate, biogeochemical cyclesand species distributions (MA 2005). As a result, biodiversityis declining a thousand times faster now than at rates foundin the fossil record (MA 2005), raising concerns aboutconsequences of such loss for ecosystem functioning, theprovision of ecosystem services and human well being(Schlapfer & Schmid 1999; Chapin et al. 2000; Loreau et al.2001; Kinzig et al. 2002; Dıaz et al. 2005; Hooper et al. 2005;MA 2005; Srivastava & Vellend 2005). Such concerns havemoved beyond the science community to the globalstakeholder and policy community with the publication ofthe Millennium Assessment (Dıaz et al. 2005; MA 2005).That analysis acknowledges that biodiversity probably plays
a significant role in directly providing goods and services aswell as regulating and modulating ecosystem properties (thisterm is used here to include !processes" and !functioning")that underpin the delivery of ecosystem services.
Considerable research has gone into teasing out thelinkages between biodiversity, functioning and services(Naeem & Wright 2003), and experimental approaches nowaccount for 40% of the publications in this area (Fig. 1). Mostexperiments have manipulated diversity or have assembleddifferent diversities as a treatment variable and documentedthe response of ecosystemproperties and processes, includingmodifying effects of environmental factors on such relation-ships (Naeem et al. 1994; Tilman 1996; McGrady-Steed et al.1997; Hector et al. 1999). The experimental designs used,results obtained and interpretations made, have not beenconsistent and the field has been contentious and lively
Ecology Letters, (2006) 9: 1146–1156 doi: 10.1111/j.1461-0248.2006.00963.x
! 2006 Blackwell Publishing Ltd/CNRS

(Grime 1997; Wardle et al. 1997; Huston et al. 2000; Leps2004). Attempts have been made to provide commonframeworks, identify areas of consensus or future challenges,as well as potential management and policy implications(Schlapfer & Schmid 1999; Loreau et al. 2001; Kinzig et al.2002; Schmid et al. 2002; Dıaz et al. 2005; Hooper et al. 2005),but these syntheses have taken the form of largely subjectiveassessments through qualitative literature reviews. Suchreviews provided an important foundation (in particularSchmid et al. 2002) for us to construct a more completedatabase using strict selection criteria (Schlapfer & Schmid1999) for the formal meta-analysis presented here. Specifi-cally, we pose the following questions: (i) what are the mostcommonly addressed relationships between biodiversity andecosystem properties? (ii) How do the experimental designsused and the ecosystem properties measured affect theoutcomes and interpretation of biodiversity–ecosystem func-tioning relationships? (iii) What can be learnt about biodiver-sity–ecosystem service relationships that could be useful fordecision makers?
METHODS
Data collection
One hundred and three publications were included in ourdatabase, representing 446 ecosystem propertymeasurementsfrom 1954 to June 2004 (see Appendix S1 and Table S1).These publications were identified from the ISI Web ofScience and Biological Abstracts database using criteriapreviously using the following search terms (Schlapfer &Schmid 1999): biodiversity or species richness and stability or ecosystemfunction or productivity or yield or food web. Where appropriate, wecontacted authors of publications to obtain additionalinformation and additional publications. Information about
specifics of experimental designs, the ecosystem propertiesmeasured and the significance and size of reported effectswere entered into our database. We did not include duplicaterecords, for example, the same experiment and samemeasurement reported in a different publication or measuredin a different year (repeated measures). If, however, therepeated measures were used to derive a new variable such astemporal variation in the ecosystem property, these data wereincluded. We did not include studies that compared mono-cultures with mixtures of a single higher diversity level orsingle-species removal experiments. We used all records thatreported effect sizes, allowing us to calculate correlationcoefficients for the relationship between biodiversity andecosystem property, but we excluded studies from ourdatabase, which reported only significance.
Data analyses
Biodiversity effects were measured as simple or multiplecorrelation coefficients, r. Using r instead of r2 (thecoefficient of determination) had the advantage that wecould assign negative and positive signs to effects. Main-taining negative and positive effects and using aZ-transformation (see below) allowed us to test the overalldistribution for normality and to obtain normally distributederror terms after fitting explanatory terms.
Simple correlation coefficients (365 records) were onlyavailable where biodiversity was treated as an independentcontinuous variable or where a linear or log-linear contrastwas made for the factor biodiversity. When biodiversity wasanalysed as a factor with more than one level (or as apolynomial), we calculated multiple correlation coefficientsfrom the entries in the analysis of variance tables (81records). We used adjusted r2 values to derive correlationcoefficients because these correct for the degrees offreedom used to fit a model (Sokal & Rohlf 1995). Whenthe relationship between the levels of the biodiversity factorand the response variable was generally negative, we gavethe multiple correlation coefficient a minus sign. In additionto the sign, we also noted the shape of the relationship (seebelow). To simultaneously analyse simple and multiplecorrelation coefficients we normalized them using Fisher’sz-algorithm (Rosenberg et al. 2000)
Zr ! 0:5" ln1# r
1$ r
! "%1&
and analysed these Zr-values as a new dependent variable. Wedid all analysis with all 446 correlation coefficients and withthe subset of the 365 simple coefficients. Because the resultswere the same, we only present those from the full analysis.
The common, normalized effects measure allowed us toanalyse all data together with a single general-linearmodelling framework, despite the overwhelming heterogen-
0
20
40
60
80
100
1995
1996
1997
1998
1999
2000
2001
2002
2003
2004
Year of publication
Num
ber
of p
ublic
atio
ns
Figure 1 The number of biodiversity–ecosystem functioningarticles published during the last decade is steadily growing (ISIWeb of Science). Experimental work (filled section) has contribu-ted around 40% of the total number of articles (total bar) since thebeginning of this century.
Review and Synthesis Biodiversity and ecosystem functioning/services 1147
! 2006 Blackwell Publishing Ltd/CNRS

eity of studies. Based on major controversies as well as areasof consensus identified in previous qualitative synthesis(Schlapfer & Schmid 1999; Loreau et al. 2001; Kinzig et al.2002; Schmid et al. 2002; Dıaz et al. 2005; Hooper et al.2005), a set of hypothesis were constructed about possibleeffects of the specifics of experimental designs and theecosystem properties measured on the biodiversity effectsobserved (Table 1). The studies were classified into groupsusing a separate explanatory factor for each of thehypotheses (Table 1). The significance and explanatorypower of these factors and of interactions was then assessedin mixed-model analyses of variance (ANOVA). Study site andreference were random terms in the model.
We compared a small number of alternative models forthe fixed terms using adjusted r2 values (which gave thesame model ranking as Akaike and Bayesian informationcriteria). The selected final model contained only maineffects but no interactions of fixed terms. Due tocorrelations between fixed terms, we assessed their explan-atory power in two ways if they were entered: (i) first intothe model or (ii) in a sequence of decreasing order of theirF-values when entered first. The random effects were addedafter the fixed effects in the sequence study site/reference,imposing a nesting of these terms. In one case, a singlepublication reported results from two study sites and in
another case, a single publication reported results from twoseparate experiments. In these two cases, we gave eachpublication two reference IDs to ensure full nesting. Toavoid weak pseudo-replication due to measurements ofmultiple ecosystem properties in single experiments, termsreferring to specifics of experimental design and study sitecould be tested against the reference ID instead of theresidual mean square as error term. We used this very stricttest but list the mean squares in the ANOVA table so thatreaders can calculate the more liberal F-test as well. Thereciprocal of the variance in the individual Zr values, basedon the individual study sizes, was used as a weighting factorin the ANOVA (Crawley 1993). This ensured that studies withsmall sample sizes were not over-rated in comparison withstudies with large sample sizes. Throughout the paper, wereport result in terms of these weighted average normalizedeffect sizes Zr and their standard errors.
Ecosystem properties that could unequivocally be relatedto ecosystem services (MA 2003; Dıaz et al. 2005), and thusthat could be assigned a positive (or negative) value forhuman well being, were further analysed based on meanvalues and standard errors of effect sizes. Some judgment isinvolved in the assignment of positive or negative value,because a particular ecosystem property may not be seen asthe same benefit by all stakeholders of biodiversity
Table 1 Hypotheses tested in the meta-analysis and corresponding explanatory terms in ANOVA
Explanatory term Null hypothesis
Type of diversity measure H1, biodiversity effects are independent of type of diversity measure used to estimaterelationship (e.g. species vs. functional diversity)
Type of experimental system H2, biodiversity effects are independent of type of experimental system (e.g. bottle, field)Ecosystem type H3, biodiversity effects are independent of ecosystem type (e.g. grassland, forest)Main cause of diversity changes H4, biodiversity effects are independent of main cause of diversity changes (direct vs. indirect
manipulation of diversity)Design for direct species diversitymanipulations
H5, biodiversity effects are the same whether total density is held constant (substitutivedesigns) or not (additive or designs without control of total density)
Type of indirect species diversity gradients H6, biodiversity effects are independent of the type of indirect species diversity gradients[natural variation vs. gradient (e.g. nitrogen addition)]
Maximum species number H7, biodiversity effects are independent of maximum species number in most diversetreatment
Trophic-level manipulated H8, biodiversity effects are independent of trophic level manipulatedTrophic level measured H9, biodiversity effects are independent of trophic level measuredNumber of trophic links between them H10, biodiversity effects are independent of number of trophic links between level mani-
pulated and level measuredEcosystem property H11, biodiversity effects are independent of the ecosystem property measuredOrganization level of ecosystem property H12, biodiversity effects are independent of the level of organization at which the ecosystem
property was measured (population- vs. community- vs. ecosystem-level)Biotic vs. abiotic ecosystem properties H13, biodiversity effects are independent of whether ecosystem property is biotic or abioticDominant cycle to which ecosystemproperty belongs
H14, biodiversity effects are independent of whether ecosystem property is associated towater, nutrient, energy or biotic dynamics
Nature of ecosystem property H15, biodiversity effects are independent of whether ecosystem property is a stock or a rateStudy site H16, biodiversity effects are independent of location of study site
Listed are the null hypotheses we tried to reject.
1148 P. Balvanera et al. Review and Synthesis
! 2006 Blackwell Publishing Ltd/CNRS

(Srivastava & Vellend 2005). Only those ecosystem prop-erties for which at least five effect size measurements wereavailable were included in the analysis.
Groupings for specifics of experimental design andecosystem properties (number of records in parentheses)
Type of diversity measureThese included species richness (393), functional grouprichness (23), evenness (11) and diversity indices (19).Although we aimed to include diversity effects in thebroadest sense of the word, the majority of studiesexamined species richness effects only. Some studiesreported effects of functional group richness, but only afew of these were intentionally designed from the start toexamine effects of varying functional diversity.
Type of experimental systemSystem types were bottle (microcosm studies) or pot (111),greenhouse, including climate chambers (62) and field (273).Pot and greenhouse systems differ from field systems in thatthe latter experience natural climate and light regimes. Fieldsystems included studies that directly and indirectly mani-pulated species diversity.
Main cause of diversity changeDirect manipulations (398) of diversity were distinguishedfrom indirect ones (48). Indirect manipulations were foundonly in field studies and were further categorized as follows.
Type of indirect species diversity gradientsIndirect manipulations of diversity were divided intonatural variation (39) and gradient (9). In the first category,naturally varying diversity levels were constructed. In thesecond category, a natural (succession) or experimentalgradient in environmental conditions (nutrient applicationor multiple factors) generated the differences in diversitylevels.
Design of direct species diversity manipulation experimentsDirect manipulations of diversity were subdivided into thosewhich were set up so that total density remained constant,i.e. substitutive experiments (357), and others, mostlyadditive experiments (41).
Maximum species numberThree levels of maximum diversity were recognized: low(£10 species, n ! 211), intermediate (11–20 species, n !104) and high (>20 species, n ! 131).
Ecosystem typeThese encompassed forest (43), grassland (258), marine (32),freshwater (68), bacterial microcosm (seven), soil commu-
nity (15), crop/successional (10) and ruderal/salt marsh(13).
Trophic level manipulated and trophic level measuredStudies that manipulated diversity and/or measureddiversity effects at different trophic levels were categor-ized into: primary producer (319 manipulated and 241measured), primary consumer (30 and 91), secondaryconsumer (four and 13), detritivores (15 and 38),mycorrhiza (47 and 15), multitrophic (31 and five) andecosystem level (0 and 43). !Multitrophic" refers to studieswhere diversity was manipulated on more than onetrophic level or where the ecosystem property involvesmore than one trophic level (e.g. total macrofaunalbiomass). Ecosystem level refers to properties measuredin the entire ecosystem within the abiotic compartment(e.g. nutrient loss from the system).
Number of trophic linksWe counted the number of trophic links between thetrophic level manipulated and the level at which theproperty was measured (Fig. 2).
Effect formThe shapes of the biodiversity–ecosystem property relation-ships were classified into negative (40), negative linear (92),negative log-linear (41), idiosyncratic (113), positive (70),positive linear (56), positive log-linear (34). This classifica-tion was performed independently of significance or size ofbiodiversity effects simply by inspecting results presented inthe text and figures of the publications analysed. Thisvariable is similar to the effect size itself and could be usedas an alternative dependent variable in log-linear analysis ofdeviance. We include this variable in the supplementaryonline material but except for a single case (see below) theonly reported dependent variable in the present paper iseffect size per se.
Ecosystem properties measuredWe included any physical characteristics of the ecosystems,including process rates of energy and nutrient flow. Tosimplify comparisons, we grouped similar ecosystem pro-perties (EP), which resulted in 28 groups; an additionalgroup was used to collect those measures that could not beassigned. We distinguished between properties of theecosystem and those of an invader (defined as any speciesadded after the establishment of a community) and we alsodistinguished between effects on means of propertiesmeasured and those that relate to their variances.
Organizational level of the ecosystem property measuredWe distinguished between population-level properties,recorded for individual target species, such as density, cover
Review and Synthesis Biodiversity and ecosystem functioning/services 1149
! 2006 Blackwell Publishing Ltd/CNRS

or biomass, and their temporal variance; community-levelproperties, recorded for multispecies assemblages, such asdensity, biomass, consumption, diversity and their temporalvariance; and ecosystem-level properties, recorded forabiotic components, such as nutrient, water or CO2 andtheir temporal variance.
Dominant dynamic of ecosystem propertyProperties were assigned to the ecosystem cycle in which theypredominate: water, nutrient, energy or biotic dynamics.
Nature of ecosystem propertyStock vs. rate measurements of ecosystem properties weredistinguished.
Ecosystem serviceEcosystem services are the benefits people obtain fromecosystems. Our classification followed that of the Millen-nium Ecosystem Assessment (MA 2003; Dıaz et al. 2005). Alist of ecosystem properties considered to underpin eachecosystem service, as well as the directionality of expectedbenefits to human well being, is provided below in theResults section.
Groupings according to place of study and identity ofexperiment (number of groups in parentheses)
Location of study site (60)Site location of an experiment ranged from a preciseplace to a broad region, depending on the extent of thestudy.
Study site (75)Generally equivalent to location, this term was used todistinguish different studies within a single location. Studysite reflects a set of environmental conditions particular tothat experiment.
Reference ID (105)This corresponded to individual publications, except wherea single publication reported results from more than onestudy, in which case this publication received two referenceIDs. This ID is used to distinguish between groups ofpotentially non-independent measurements in order toavoid pseudo-replication.
RESUL T S
The overall mean of the standardized effect sizes Zr(weighted by the reciprocal of the variance of the individualZr-values) was significantly positive ( !X ! 0.101 ± 0.028,t ! 3.57, d.f. ! 445, P < 0.001), indicating that negativeresponses of ecosystem properties to biodiversity manipula-tions are less frequent or less strong than positive ones.Nevertheless, the reported effect sizes varied greatly,ranging from )2.71 to 2.39. In the following sections, weexplore the sources of this variation.
Effects of specifics of experimental design and study site
Some specifics of the experimental design which weoriginally expected to have an influence on effect sizes infact could not be included in the final analysis model,
411
34
12
16
9
2°Consumer
1°Consumer
1°ProducerMycorrhiza
Detritivores
Multitrophic
5
5
1
2
5
25
3
7
27
4
232
Ecosystem
25134
1
1
Figure 2 Number of measurements in pub-lished biodiversity–ecosystem functioningexperiments for different trophic levelsmanipulated (base of arrow) and trophiclevels measured (end of arrow). A domin-ance of measurements and manipulations ofprimary producers was observed.
1150 P. Balvanera et al. Review and Synthesis
! 2006 Blackwell Publishing Ltd/CNRS

suggesting that they need not be a concern when designingfuture biodiversity experiments. For instance, there was onlya weak influence of the type of diversity measure onmeasured effect sizes (Table 2). Of particular note is thateffect sizes were only slightly larger when functional-grouprather than species richness was manipulated (adjusted meanvalues ± SE of Zr-values: 0.191 ± 0.103 vs. 0.116 ± 0.030).
In contrast, the type of experimental system employed(bottle vs. greenhouse vs. field) strongly modified biodiver-sity effects (Table 2). More positive effects were foundwhere environmental variables could be controlled best,such as in greenhouses and climate chambers(0.467 ± 0.084) compared with bottle/pot experiments(0.100 ± 0.051) or field experiments (0.007 ± 0.033).
Effect sizes also varied markedly between different typesof ecosystem (Table 2). For the four ecosystem types whichwere represented most frequently in the data set, average
effect sizes were close to zero (grassland 0.039 ± 0.038,freshwater )0.010 ± 0.065, marine )0.006 ± 0.109, forest)0.116 ± 0.076), whereas average effect sizes were largerand positive for the ecosystem types with fewer records(ruderal/salt marsh, 1.058 ± 0.154; bacterial, 0.317 ± 0.095;crop/successional, 0.245 ± 0.052; soil, 0.094 ± 0.086). Thiscould imply that the research community’s perception of themagnitude and direction of biodiversity effects may bebiased by the focus to date on relatively few ecosystem typesthat included measures of negative impacts on properties.There was considerable variation among study sites, but thiswas not significant in the multiway ANOVA using the strictF-test with reference ID as error term (Table 2). In otherwords, effect sizes varied as much between referenceswithin study sites as between study sites.
Although average effect sizes were practically identical forstudies that manipulated biodiversity directly or indirectly
Table 2 Results from one-way analyses of variance (ANOVA)s in the sequence of decreasing F-values and multiway ANOVA using this sequencefor fitting the corresponding fixed terms (see Methods for details)
H no. Variable d.f. Sum of squares Mean squares F P-value % Explained variance
One-way ANOVA
12 Organization level EP 2 2031.7 1015.9 40.27 <0.001 15.45 Type direct manipulations* 2 1802.5 901.2 35.00 <0.001 13.67 Maximum species number 2 1319.0 659.3 24.57 <0.001 10.02 Experimental system 2 1071.0 535.3 19.54 <0.001 8.13 Ecosystem type 7 2255.8 322.3 12.89 <0.001 17.111 Ecosystem property 28 3241.7 115.8 4.83 <0.001 24.516 Study site 74 6168.6 83.4 4.39 <0.001 46.71 Type diversity measure 3 377.2 125.7 4.33 0.005 2.915 Nature of EP 1 86.5 86.5 2.92 n.s. 0.78 Trophic-level manipulated 5 305.1 61.0 2.08 n.s. 2.39 Trophic-level measured 6 295.2 49.2 1.67 n.s. 2.210 Number of links 1 37.4 37.4 1.28 n.s. 0.314 Cycle type EP 4 143.9 36.0 1.21 n.s. 1.113 Biotic vs. abiotic EP 1 27.3 27.3 0.93 n.s. 0.26 Type indirect gradient* 2 14.1 7.1 0.24 n.s. 0.14 Direct vs. indirect 1 2.2 2.2 0.07 n.s. 0.0
ANOVA for selected model12 Organization level EP 2 2031.9 1016.0 83.69 <0.001 15.385 Type direct manipulations# 2 1295.5 647.4 18.19 <0.001$ 9.817 Maximum species number 2 349.3 174.7 4.91 <0.05$ 2.642 Experimental system 2 485.0 242.5 6.81 <0.01$ 3.673 Ecosystem type 7 660.3 94.3 2.65 <0.05$ 5.0011 Ecosystem property 28 1196.6 42.7 3.52 <0.001 9.0616 Study site 65 2501.7 38.5 1.08 n.s.$ 18.94
Reference (within study site) 26 925.5 35.6 2.93 <0.001 7.01Residual 337 3762.4 12.0 28.49
Total 444 13208.1 29.8 100.00
H no., hypothesis number (see Table 1); n.s., not significant (P > 0.05).*These two terms include the last term (direct vs. indirect) as a category !none".#This term includes the term !direct vs. indirect" as a category !none".$F-test using reference ID as error term.
Review and Synthesis Biodiversity and ecosystem functioning/services 1151
! 2006 Blackwell Publishing Ltd/CNRS
(hypothesis 4), and between versions of indirect manipula-tions (hypothesis 6), average effect sizes were smaller ifdirect manipulations maintained total density constant(substitutive designs, 0.031 ± 0.030) than if they did not(0.868 ± 0.102) (Table 2). This confirms something whichhas long been known to agricultural scientists and plantecologists using substitutive designs (Harper 1977), theimportance of not confounding increasing species richnessand total density in experiments.
Average effect sizes were positive if the maximum speciesrichness was larger than 20 species (0.344 ± 0.052) andclose to zero for the other two categories (two to 10 species:)0.049 ± 0.030; 11–20 species: )0.034 ± 0.081) (Table 2).Yet only 33 of 105 experiments (reference IDs) employedmore than 20 species at the highest diversity level. Withrespect to effect form there was an indication that the oddsratio between linear and log-linear-negative or -positiverelationships was greatest in experiments where maximumspecies richness was lowest (P < 0.05), but even wheremaximum species richness was high, this ratio was > 1.
There were no overall effects of trophic level manipu-lated, trophic level measured or number of trophic linksbetween manipulated and response trophic levels (Table 2).Nevertheless, productivity-related effect sizes did signifi-cantly decline with increasing number of trophic links(F1,140 ! 5.74, P < 0.05).
Effects of ecosystem properties measured
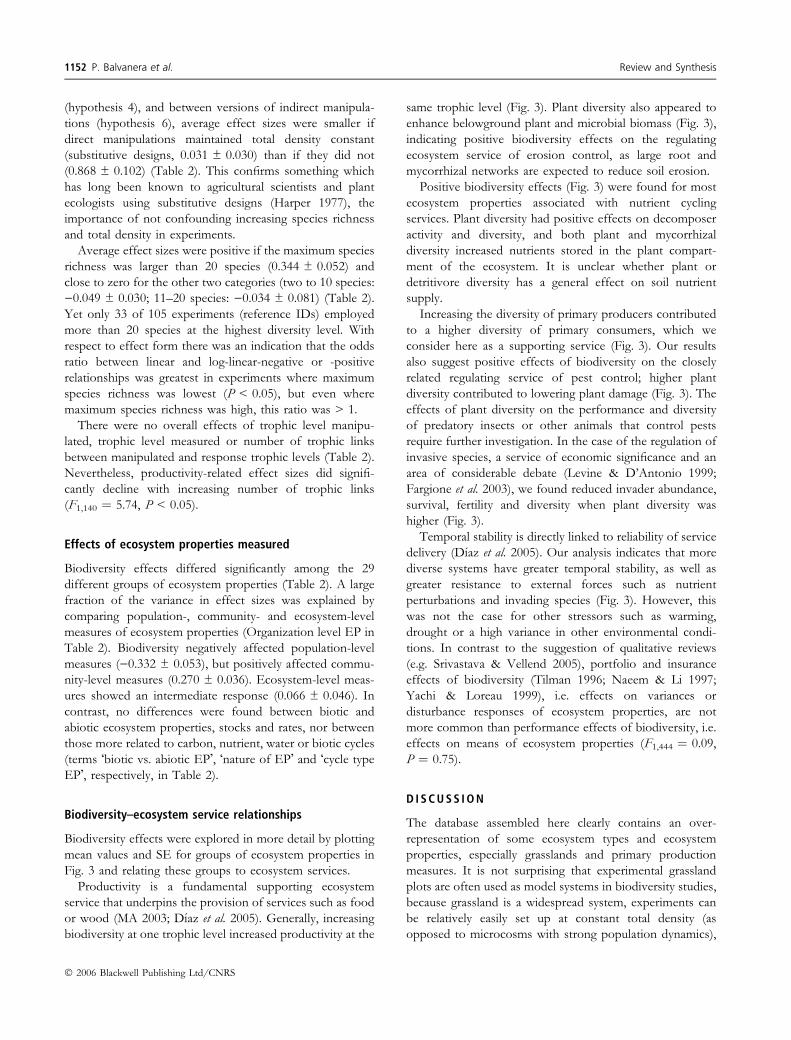
Biodiversity effects differed significantly among the 29different groups of ecosystem properties (Table 2). A largefraction of the variance in effect sizes was explained bycomparing population-, community- and ecosystem-levelmeasures of ecosystem properties (Organization level EP inTable 2). Biodiversity negatively affected population-levelmeasures ()0.332 ± 0.053), but positively affected commu-nity-level measures (0.270 ± 0.036). Ecosystem-level meas-ures showed an intermediate response (0.066 ± 0.046). Incontrast, no differences were found between biotic andabiotic ecosystem properties, stocks and rates, nor betweenthose more related to carbon, nutrient, water or biotic cycles(terms !biotic vs. abiotic EP", !nature of EP" and !cycle typeEP", respectively, in Table 2).
Biodiversity–ecosystem service relationships
Biodiversity effects were explored in more detail by plottingmean values and SE for groups of ecosystem properties inFig. 3 and relating these groups to ecosystem services.
Productivity is a fundamental supporting ecosystemservice that underpins the provision of services such as foodor wood (MA 2003; Dıaz et al. 2005). Generally, increasingbiodiversity at one trophic level increased productivity at the
same trophic level (Fig. 3). Plant diversity also appeared toenhance belowground plant and microbial biomass (Fig. 3),indicating positive biodiversity effects on the regulatingecosystem service of erosion control, as large root andmycorrhizal networks are expected to reduce soil erosion.
Positive biodiversity effects (Fig. 3) were found for mostecosystem properties associated with nutrient cyclingservices. Plant diversity had positive effects on decomposeractivity and diversity, and both plant and mycorrhizaldiversity increased nutrients stored in the plant compart-ment of the ecosystem. It is unclear whether plant ordetritivore diversity has a general effect on soil nutrientsupply.
Increasing the diversity of primary producers contributedto a higher diversity of primary consumers, which weconsider here as a supporting service (Fig. 3). Our resultsalso suggest positive effects of biodiversity on the closelyrelated regulating service of pest control; higher plantdiversity contributed to lowering plant damage (Fig. 3). Theeffects of plant diversity on the performance and diversityof predatory insects or other animals that control pestsrequire further investigation. In the case of the regulation ofinvasive species, a service of economic significance and anarea of considerable debate (Levine & D’Antonio 1999;Fargione et al. 2003), we found reduced invader abundance,survival, fertility and diversity when plant diversity washigher (Fig. 3).
Temporal stability is directly linked to reliability of servicedelivery (Dıaz et al. 2005). Our analysis indicates that morediverse systems have greater temporal stability, as well asgreater resistance to external forces such as nutrientperturbations and invading species (Fig. 3). However, thiswas not the case for other stressors such as warming,drought or a high variance in other environmental condi-tions. In contrast to the suggestion of qualitative reviews(e.g. Srivastava & Vellend 2005), portfolio and insuranceeffects of biodiversity (Tilman 1996; Naeem & Li 1997;Yachi & Loreau 1999), i.e. effects on variances ordisturbance responses of ecosystem properties, are notmore common than performance effects of biodiversity, i.e.effects on means of ecosystem properties (F1,444 ! 0.09,P ! 0.75).
D I SCUSS ION
The database assembled here clearly contains an over-representation of some ecosystem types and ecosystemproperties, especially grasslands and primary productionmeasures. It is not surprising that experimental grasslandplots are often used as model systems in biodiversity studies,because grassland is a widespread system, experiments canbe relatively easily set up at constant total density (asopposed to microcosms with strong population dynamics),
1152 P. Balvanera et al. Review and Synthesis
! 2006 Blackwell Publishing Ltd/CNRS

yet they do not require very large areas (as opposed toforests). In addition, primary productivity plays a major rolein delivering a wide range of ecosystem services. Neverthe-less, future biodiversity experiments should embrace abroader range of systems, properties and trophic levels if thegenerality of these relationships is to be established. Inparticular, a recent experiment that came to light after ouranalysis was carried out (Bell et al. 2005), suggests thatbacterial systems hold great promise for future research ofbiodiversity effects on ecosystem functioning.
Notwithstanding this heterogeneity in the database, ouranalyses indicate an overall significant positive effect ofbiodiversity on ecosystem processes. We do not believe thatthis represents a publication bias towards positive effects,
because finding a significantly negative effect would be justas interesting and just as likely to be reported. Nevertheless,there was significant variation between studies in themagnitude and direction of biodiversity effects, attributablemainly to specifics of experimental design and the ecosys-tem properties measured, as also argued in qualitativereviews (Hooper et al. 2005).
Specifics of experimental design and ecosystem properties
A large number of negative effects were associated withpopulation-level measures, whilst positive effects wereassociated with community-level measures. This resultprovides perhaps the strongest empirical evidence to date
–1 0 1 0 40 80
Responses of ecosystem propertyto increasing biodiversity
Number ofmeasurements
1° Producerabundance
1° Consumerabundance
2° Consumerabundance
1º Consumer
1ºConsumers:
Resistance vs.other disturbances
Natural variation
Pri
mar
y /s
econ
d ary
/te
rtia
ry p
rodu
ctiv
ityR
egul
atio
n of
biol
ogic
al d
iver
sity
Sta
bilit
y
Ecosystemproperty
Mycorrhizaabundance
Plant root biomass
Decomposer
activity
Plant nutrient
concentration
Nutrient supplyfrom soil
1º Consumer diversity
1º
(Invader fitness)
(Invader diversity)
Invasion resistance
Drought resistance
Resistance vs.other disturbances
Natural variation
Ecosystemservice
Nut
rien
t cyc
ling
Decomposer diversity
Reg
ulat
ion
ofbi
olog
ical
div
ersi
tyS
tabi
lity
Ero
sion
cont
rol
(Plant disease severity)
Consumption resistance
Figure 3 Magnitude and direction of biodi-versity effects (shown are mean values andSE of normalized effect sizes Zr, weightedby the reciprocal of the variance of theindividual Zr-values) and number of meas-urements available for ecosystem propertiesorganized into ecosystem services. Colouredbars show differential effects of trophic levelmanipulated: green, primary producers; blue,primary consumers; pink, mycorrhiza;brown, decomposer; grey, multitrophic(multiple levels simultaneously manipulated).Ecosystem properties shown in parentheseswere considered of negative value for humanwell being, and thus opposite of effect sizesare shown.
Review and Synthesis Biodiversity and ecosystem functioning/services 1153
! 2006 Blackwell Publishing Ltd/CNRS

for the prediction that individual populations are expectedto fluctuate more with increasing biodiversity, but thecommunity stability and productivity should be enhanced(May 1981; Tilman 1996).
In contrast to the outcomes of qualitative reviews(Hooper et al. 2005), we could not find a simple dependenceof biodiversity effects on the trophic levels manipulated ormeasured. However, we did find productivity-related biodi-versity effects that declined with increasing number oftrophic links between those trophic levels which weremanipulated and those at which the property was measured.This intuitively compelling result has never been reportedbefore. It is clear that experiments need to be extendedbeyond the single trophic level approach to better under-stand such variations in biodiversity effects across anecosystem (Petchey et al. 2002; Raffaelli et al. 2002).
Variation in biodiversity effects among study sites andreferences suggest that local environmental or specific unrec-ognized experimental factors may either increase or decreasebiodiversity effects. Previous work (Hector et al. 1999) hadalready indicated important influences of location on biodi-versity effects. The additional variation among referenceswithin study sites, which actually made the variation betweensites non-significant, is reported here for the first time.
Sufficient information is not available to permit analysisof biodiversity-modifying factors, such as nutrient levels orelevated CO2 (Hooper et al. 2005), but it is clear thatbiodiversity effects are significantly weaker in less-controlledexperimental systems. Indeed, it is much more difficult tomaintain diversity treatments on open field plots than inclosed bottles; environmental heterogeneity, unpredictablebiotic and abiotic environmental fluctuations and samplingvariances are greater in the former. Thus, while our resultswould suggest that further research under controlledconditions is needed to improve our understanding ofbiodiversity effects on ecosystem functioning, extrapolationof those results to the larger landscape scale is likely to behindered by the greater environmental heterogeneity and itseffects on ecosystem functioning (Loreau et al. 2001;Hooper et al. 2005). In this respect, field experiments arelikely to be more meaningful for extrapolation to thelandscape scales at which humans impact on biodiversityand hence service delivery. On the other hand, in a recentlyconstructed grassland experiment in Jena, Germany, Rosheret al. (2005) found a similar plant diversity–productivityrelationship in small plots of 12.25 m2 and in plots morethan 30 times larger (400 m2).
The effect on our understanding of the relationshipbetween biodiversity and ecosystem functioning of differ-ences in the way biodiversity is manipulated, how experi-ments are set up, and how response variables are measuredin such experiments has been much debated (Schmid et al.2002; Leps 2004). Different experimental designs and setups
are acknowledged to have their own advantages andshortcomings; but the present analysis has allowed a formalassessment of the degree to which these really are important.Surprisingly, we found no significant differences betweenthose experiments where diversity was manipulated directlyand those involving indirect manipulations by alteringenvironmental conditions. However, there was clear evi-dence in favour of substitutive designs with control forconstant total density of individuals at the start of anexperiment. If total density is allowed to vary, in most casesin parallel with species richness, larger effects are seen, butone cannot unequivocally attribute them to biodiversity ordensity. In other words, such experiments are confounded.
Using a large number of species at the highest diversitylevels of an experiment increases the chances of detectingbiodiversity effects, although this must be weighed upagainst the increased work involved in setting up such anexperiment. Nevertheless, there is a clear need to includehigher levels of species richness in experiments. Unfortu-nately, interesting new simulation and empirical studieswhich used non-random extinction scenarios (Raffaelli2004; Solan et al. 2004; Zavaleta & Hulvey 2004; Bunkeret al. 2005; Schlapfer et al. 2005; Srivastava & Vellend 2005)could not be included in our analysis because they werepublished after our analyses were complete.
An important question when designing a biodiversity–ecosystem functioning experiment is what expression ofdiversity to manipulate: richness, evenness or functionalgroups? The literature is somewhat divided on this issue (Dıaz& Cabido 2001; Loreau et al. 2001; Hooper et al. 2005;Petchey & Gaston 2006; Wright et al. 2006), but the predom-inant view is that functional groups may be more importantthan species richness, consistent with our own findings.
Biodiversity–ecosystem service relationships
Where ecosystem properties could be related to ecosystemservices (Srivastava & Vellend 2005), clear positive effects ofbiodiversity were found, for both regulating and supportingservices. Nevertheless, our ability to make these linkages atspatial (landscape) scales relevant to the human enterprise islimited at present (Kremen 2005). There is an urgent need toextend experimental, observational and theoretical work onbiodiversity effects for an array of ecosystem functions thatcan be linked to ecosystem services, such as water quantityand quality, pollination, regulation of pests and humandiseases, carbon storage and climate regulation, wastemanagement and cultural services, and to evaluate biodi-versity–ecosystem service relationships at the larger spatialscales relevant to management (Kremen et al. 2004; Balva-nera et al. 2005).
The role of biodiversity in buffering environmentalvariation and thus providing consistent service delivery
1154 P. Balvanera et al. Review and Synthesis
! 2006 Blackwell Publishing Ltd/CNRS

has received extensive theoretical treatment (Tilman 1996;Yachi & Loreau 1999; Hooper et al. 2005). In general, apositive effect of biodiversity is expected on the stability ofecosystem properties (Tilman 1996; Naeem & Li 1997;Yachi & Loreau 1999; Hooper et al. 2005), and qualitativereviews have suggested that such effects on the variance inprocesses (stability) may be stronger than the effects onmeans (stocks and fluxes; Srivastava & Vellend 2005). Thequantitative results from our meta-analysis do not supportthis view, rather indicating that biodiversity effects ondisturbance buffering are dependent on the nature of thedisturbance. Thus, while biodiversity effects on buffering ofnutrient perturbations and invading species were positive,biodiversity effects on buffering influences of warming,drought or high environmental variance were neutral orslightly negative.
CONCLUS IONS
Whilst there are many qualitative reviews and positionstatements about the effects of biodiversity on ecosystemproperties and services, our analysis provides the firstextensive quantitative meta-analysis of this relationship. Thisanalysis suggests that simple generalizations among ecosys-tem types, ecosystem properties or trophic level manipula-ted or measured will be difficult to sustain. Considerationsof the way in which biodiversity is defined and manipulated,and disentangling the many separate effects and theinteractions between them, as well as those with environ-mental heterogeneity, will be a major challenge for the nextgeneration of experiments. We offer our database (Supple-mentary material) as a building block for continued synthesisattempts. The advantages of a formal meta-analysis areillustrated by the following novel contributions we havebeen able to bring to the synthesis: (i) biodiversity effects areweaker if biodiversity manipulations are less well controlled(e.g. field vs. greenhouse or climate chamber); (ii) bio-diversity effects are weaker if the highest diversity levelsin an experiment are lower (e.g. £ 10 vs. > 10 species);(iii) biodiversity experiments should avoid confoundingdiversity and total density (they should use a substitutivedesign); (iv) biodiversity effects are weaker at the ecosystemthan the community level and negative at the populationlevel; (v) productivity-related biodiversity effects declinewith increasing number of trophic links between levelmanipulated and level measured; (vi) biodiversity effects onstability measures are not obviously stronger than biodiver-sity effects on performance measures.
There are clear messages for policy makers from theseanalyses. First, for those ecosystem services that could beassessed in the present study, there is clear evidence thatbiodiversity has positive effects on the provision of thoseservices and that further biodiversity loss can only be
expected to compromise service delivery. Secondly, whilstfurther research is needed to confirm such linkages, inparticular to extend the work to a broader range of systemsand properties, society in the meantime should proceed in aprecautionary manner in its use and management ofbiodiversity.
ACKNOWLEDGEMENTS
We thank the Swiss Biodiversity Forum for administrativesupport and guidance and SCOPE, with Chris Field, CarloHeip and Osvaldo Sala for suggestions about the projectdesign. We acknowledge helpful comments from threeanonymous referees and S. Naeem which improved themanuscript. We thank the Swiss Agency for the Environ-ment, Forests and Landscape (SAEFL) and the Universityof Zurich for financial support. We thank Manuel Maass forsuggestions and Alberto Valencia and Heberto Ferreira fortechnical support.
RE F ERENCES
Balvanera, P., Kremen, C. & Martınez-Ramos, M. (2005). Applyingcommunity structure analysis to ecosystem function: examplesfrom pollination and carbon storage. Ecol. Appl., 15, 360–375.
Bell, T., Newman, J.A., Silverman, B.W., Turner, S.L. & Liley, A.K.(2005). The contribution of species richness and composition tobacterial services. Nature, 436, 1157–1160.
Bunker, D.E., DeClerck, F., Bradford, J.C., Colwell, R.K., Perfecto,I., Phillips, O.L. et al. (2005). Species loss and abovegroundcarbon storage in a tropical forest. Science, 310, 1029–1031.
Chapin, F.S., Zavaleta, E.S., Eviner, V.T., Naylor, R.L., Vitousek,P.M., Reynolds, H.L. et al. (2000). Consequences of changingbiodiversity. Nature, 405, 234–242.
Crawley, M.J. (1993). Glim for Ecologists. Blackwell, Oxford.Dıaz, S. & Cabido, M. (2001). Vive la difference: plant functionaldiversity matters to ecosystem functioning (review article). TrendsEcol. Evol., 16, 646–655.
Dıaz, S., Tilman, D., Fargione, J., Chapin, F.S. III, Dirzo, R.,Ktzberber, T. et al. (2005). Biodiversity regulation of ecosystemservices. In: Trends and Conditions (ed. MA). Island Press,Washington, DC, pp. 279–329.
Fargione, J., Brown, C.S. & Tilman, D. (2003). Communityassembly and invasion: an experimental test of neutral versusniche processes. Proc. Natl Acad. Sci. USA, 100, 8916–8920.
Grime, J.P. (1997). Biodiversity and ecosystem function: the debatedeepens. Science, 277, 1260–1261.
Harper, J.L. (1977). Plant Population Biology. Academic Press, Lon-don.
Hector, A., Schmid, B., Beierkuhnlein, C., Caldeira, M.C., Diemer,M., Dimitrakopoulos, P.G. et al. (1999). Plant diversity andproductivity experiments in European grasslands. Science, 286,1123–1127.
Hooper, D.U., Chapin, F.S., Ewell, J.J., Hector, A., Inchausti, P.,Lavorel, S. et al. (2005). Effects of biodiversity on ecosystemfunctioning: a consensus of current knowledge. Ecol. Monogr., 75,3–35.
Review and Synthesis Biodiversity and ecosystem functioning/services 1155
! 2006 Blackwell Publishing Ltd/CNRS

Huston, M.A., Aarssen, L.W., Austin, M.P., Cade, B.S., Fridley,J.D., Garnier, E. et al. (2000). No consistent effect of plantdiversity on productivity. Science, 289, 1255.
Kinzig, A., Pacala, S.W. & Tilman, D. (2002). Functional Consequencesof Biodiversity: Empirical Progress and Theoretical Extensions. PrincetonUniversity Press, Princeton, NJ.
Kremen, C. (2005). Managing ecosystem services: what do we needto know about their ecology? Ecol. Lett., 8, 468–479.
Kremen, C., Williams, N.M., Bugg, R.L., Fay, J.P. & Thorp, R.W.(2004). The area requirements of an ecosystem service: croppollination by native bee communities in California. Ecol. Lett., 7,1109–1119.
Leps, J. (2004). Diversity and ecosystem function. In: VegetationEcology (ed. Maarel, E.v.d.). Blackwell, Oxford, pp. 199–237.
Levine, J.M. & D’Antonio, C.M. (1999). Elton revisited: a review ofevidence linking diversity and invasibility. Oikos, 87, 15–26.
Loreau, M., Naeem, S., Inchausti, P., Bengtsson, J., Grime, J.P.,Hector, A. et al. (2001). Biodiversity and ecosystem functioning:current knowledge and future challenges. Science, 294, 804–808.
MA (2003). Ecosystems and Human Well-being: A Framework forAssessment. Island Press, Washington, DC.
MA (2005). Ecosystems and Human Well-Being: Synthesis. Island Press,Washington, DC.
May, R.M. (1981). Theoretical Ecology: Principles and Applications, 2ndedn. Blackwell Scientific Publications, Oxford.
McGrady-Steed, J., Harris, P.M. & Morin, P.J. (1997). Biodiversityregulates ecosystem predictability. Nature, 390, 162–163.
Naeem, S. & Li, S. (1997). Biodiversity enhances ecosystem relia-bility. Nature, 390, 507–509.
Naeem, S. & Wright, J.P. (2003). Disentangling biodiversity effectson ecosystem functioning: deriving solutions to a seeminglyinsurmountable problem. Ecol. Lett., 6, 567–579.
Naeem, S., Thompson, L.J., Lawler, S.P., Lawton, J.H. & Woodfin,R.M. (1994). Declining biodiversity can alter the performance ofecosystems. Nature, 368, 734–736.
Petchey, O.L. & Gaston, K.J. (2006). Functional diversity: back tobasics and looking forward. Ecol. Lett., 9, 741–758.
Petchey, O., Morin, P.J., Hulot, F.D., Loreau, M., McGrady-Steed,J. & Naeem, S. (2002). Contributions of aquatic model systemsto our understanding of biodiversity and ecosystem functioning.In: Biodiversity and Ecosystem Functioning. Synthesis and Perspectives(eds Loreau, M., Naeem, S. & Inchausti, P.). Oxford UniversityPress, Oxford, pp. 127–138.
Raffaelli, D. (2004). How extinction pattern affect ecosystems.Science, 306, 1141–1142.
Raffaelli, D., van der Putten, W.H., Persson, L., Wardle, D.A.,Petchey, O., Koricheva, J. et al. (2002). Multi-trophic dynamicsand ecosystem processes. In: Biodiversity and Ecosystem Functioning:Synthesis and Perspectives (eds Loreau, M., Naeem, S. & Inchausti,P.). Oxford University Press, Oxford, pp. 147–154.
Rosenberg, M.J., Adams, D.C. & Gurevitch, J. (2000). Metawin 2.0User’s Manual: Statistical Software for Meta-Analysis. Sinauer Asso-ciates, Sunderland, MA.
Rosher, C., Temperton, V.M., Scherer-Lorenzen, M., Schmitz, M.,Schumacher, J., Schmid, B. et al. (2005). Overyielding inexperimental grassland communities- irrespective of species poolor spatial scale. Ecol. Lett., 8, 419–429.
Schlapfer, F. & Schmid, B. (1999). Ecosystem effects of biodi-versity – a classification of hypotheses and exploration ofempirical results. Ecol. Appl., 9, 893–912.
Schlapfer, F., Pfisterer, A.B. & Schmid, B. (2005). Non-randomspecies extinction and plant production: implications for eco-system functioning. J. Appl. Ecol., 42, 13–24.
Schmid, B., Joshi, J. & Schlapfer, F. (2002). Empirical evidence forbiodiversity–ecosystem functioning relationships. In: FunctionalConsequences of Biodiversity: Experimental Progress and TheoreticalExtensions (eds Kinzig, A., Tilman, D. & Pacala, P.). PrincetonUniversity Press, Princeton, NJ, pp. 120–150.
Sokal, R.R. & Rohlf, F.J. (1995). Biometry. The Principles and Practice ofStatistics in Biological Research. Freeman, New York.
Solan, M., Cardinale, B.J., Downing, A.L., Engelhardt, K.A.M.,Ruesink, J.L. & Srivastava, D.S. (2004). Extinction and eco-system function in the marine benthos. Science, 306, 1177–1180.
Srivastava, D.S. & Vellend, M. (2005). Biodiversity–ecosystemfunction research: is it relevant to conservation? Annu. Rev. Ecol.Evol. Syst., 36, 267–294.
Tilman, D. (1996). Biodiversity: population versus ecosystemstability. Ecology, 77, 350–363.
Wardle, D.A., Booner, K.I. & Nicholson, K.S. (1997). Biodiversityand plant litter: experimental evidence which does not supportthe view that enhanced species richness improves ecosystemfunction. Oikos, 79, 247–258.
Wright, J.P., Naeem, S., Hector, A., Lehman, C., Reich, P.B.,Schmid, B. et al. (2006). Conventional functional classificationschemes underestimate the relationship with ecosystem func-tioning. Ecol. Lett., 9, 111–120.
Yachi, S. & Loreau, M. (1999). Biodiversity and ecosystemfunctioning in a fluctuating environment: the insurancehypothesis. Proc. Natl Acad. Sci. USA, 96, 1463–1468.
Zavaleta, E.S. & Hulvey, K.B. (2004). Realistic species lossesdisproportionately reduce grassland resistance to biologicalinvaders. Proc. Natl Acad. Sci. USA, 306, 1175–1177.
SUPP L EMENTARY MATER IA L
The following supplementary material is available for thisarticle:
Appendix S1 Literature used for the meta-analysis.
Table S1 Database used in the meta-analysis.
This material is available as part of the online article from:http://www.blackwell-synergy.com/doi/full/10.1111/j.1461-0248.2006.00963.x
Please note: Blackwell Publishing are not responsible for thecontent or functionally of any supplementary materialssupplied by the authors. Any queries (other than missingmaterial) should be directed to the corresponding author forthe article.
Editor, Shahid NaeemManuscript received 22 March 2006First decision made 15 May 2006Manuscript accepted 3 July 2006
1156 P. Balvanera et al. Review and Synthesis
! 2006 Blackwell Publishing Ltd/CNRS