Ultraviolet, Infrared & Fluorescence Photography - CiteSeerX
Limnol. Oceanogr., 41(8), 1996, 1697-1710 0 1996, by the American Society of Limnology and Oceanography, Inc.
The relationship of solar-stimulated natural fluorescence and primary productivity in Mexican Pacific waters
Ernest0 Garcia-Mendoza and Helmut Maske’ Ecology Department, Centro de Investigation Cientifica y de Education Superior de Ensenada, CICESE, Ensenada, Baja California, Mexico
Abstract Solar-stimulated natural chlorophyll a fluorescence measured by upwelling radiance in the red spectral
band could be a fast and noninvasivc method to estimate primary production in aquatic environments if the relationship of primary production to natural fluorescence can be described as a function of easily measured environmental variables, We compared data of natural fluorescence and primary production (14C incubation for 2 h) from the California Current and the Gulf of California. The data confirm that the quantum yield ratio of fluorescence to primary production (4, : $f) is a function of in situ irradiance, but not of nutrient concentration or temperature, as has been reported in the literature. Published data from the subtropics and tropics and our data yield empirical constants that define the irradiance function of the quantum yield ratio, but variability results from ambiguity of the constant determination caused by high variance of the data. Data from the Antarctic are significantly different from the low latitude data. Below a photosynthetic rate of 300 nmol C m-3 s-l, our natural fluorescence data arc useful as a proxy of primary production with a correlation coefficient, r*, of 0.85. Of the unexplained variance (15%), a major portion is due to the C.V. of the primary production method (9.2%). The r2 value of predicted primary production is similar to other published results, which suggests that without further information about the physiology of the phytoplankton it will be difficult to improve the quality of the primary production estimate.
Chlorophyll a in photosynthetic organisms fluoresces under excitation in a well-defined narrow spectral band. Natural (daylight-induced) fluorescence contributes to in situ upwelling radiance and can be conveniently mea- sured as water-leaving radiance in air (Gower and Borstad 198 1) or in situ upwelling radiance (Kishino et al. 1984a,b) if the background upwelling radiance from elastic or in- elastic scattering (fluorescence of color-cd dissolved or- ganic matter and Raman scattering) can be accounted for. Natural fluorescence has been proposed as an in situ proxy for primary production. The interpretation ofnatural flu- orescence is based on the close coupling between CO2 reduction and fluorescence (Fig. 1). If charge separation were proportional to carbon reduction and if the quantum yield ratio of charge separation to fluorescence emission were known, then carbon assimilation could be calculated from fluorescence.
A primary productivity method based on natural flu- orescence can provide significant advantages over the common primary productivity method because it avoids the use of radioactive inorganic carbon, it is faster and
1 Corresponding author.
Acknowledgments We are grateful for the assistance in the field by R. Cajal, R.
Cervantes, C. Diaz, M. Diaz, and J. Sidon. The constructive criticism of the CHORS group (J. Cleveland, J. Mueller, and C. Trees), Z. Kolber, and an anonymous reviewer is greatly ap- preciated.
E. Garcia-Mendoza was supported by a scholarship from CONACyT; H. Maskc was partially supported by the German Academic Exchange Program (DAAD); the research costs were covered by CICESE. The cruise MOCE2 was financed by CONACyT grant 11 l T-920 1.
noninvasive, and the simple detector uses little energy and is relatively easy to calibrate. The errors of the natural fluorescence method must be balanced against the meth- odological artifacts of the 14C primary productivity meth- od (cf. Peterson 1980; Fitzwater et al. 1982; Maske and Garcia-Mendoza 1994), which can produce considerable differences in intercalibration excrciscs (Richardson 199 1). Recently, simple one-channel upwelling radiance sensors of the same model (PNF-300, Biospherical Instr.) have been compared to concomitant primary production mea- surements in a wide variety of environments while eval- uating natural fluorescence as a proxy for primary pro- duction (e.g. Kiefer et al. 1989; Lizotte and Priscu 1994). Published data show that the relationship between natural fluorescence and photosynthesis is strongly dependent on daylight irradiance (Chambcrlin et al. 1990), on temper- ature (Chamberlin and Marra 1992), and on nutrient con- centrations (Lizotte and Priscu 1994). Some published field data (figure 10 of Stegmann et al. 1992) fall com- pletely outside the irradiance function of the quantum yield ratio, 4, : C/Q- (see list of notation), proposed by Cham- berlin et al. (1990). In general, the quantum efficiency of charge separation is decreased and the quantum yield of fluorescence is increased in conditions of nutrient limi- tation (Kiefer 1973; Falkowski and Kolber 1993; Kolber and Falkowski 1993). If natural fluorescence is to be used as a proxy for primary production without additional information on the physiology of phytoplankton, then the assumption must be made that in nature the phytoplank- ton physiology is forced by only a small margin by nu- trients, so that the average irradiance function of & : @ is not significantly changed.
A flow diagram (Fig. 1) shows that in vivo fluorescence and CO2 reduction are relatively closely linked in the
1697
1698 Garcia-Mendoza and Maske
absorption by antenna pigments 4..
photoprotective pigments
i e-----J
pigment composition, cellular geometry
. * and internal . . ’ pigment concentration .
7 (* achl Chl)
photosynthetic pigments (peripheral antenna) 1 * . .
nonphotochemical quenching
/ . . core antenna .
) Reaction Center 2 1. * * *
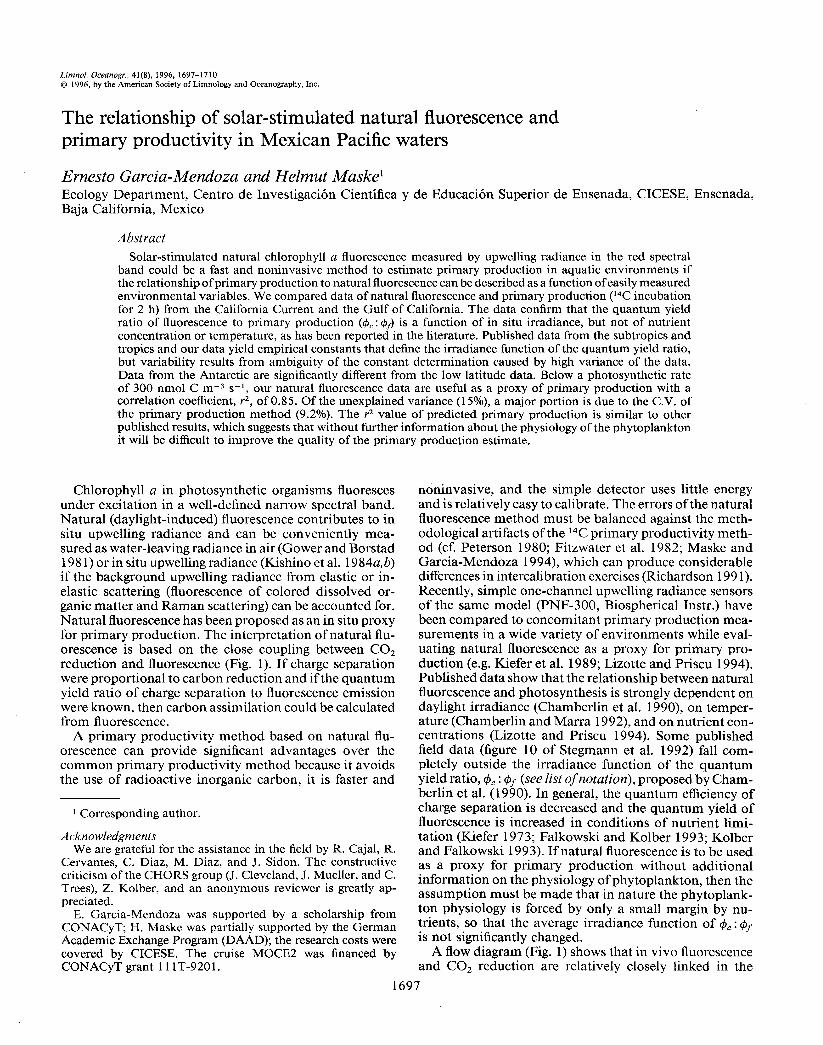
Fig. 1. Energy flow (solid and dashed lines) and functional relationships (dotted lines) in the photosynthetic system.
photosynthetic system. This relationship is determined mainly by the photochemical quenching of fluorescence, the quantum efficiency of charge separation, and the pho- tosynthetic dark reaction (CO2 reduction-loss in reducing power and energy). This relationship should not be dis- turbed by the specific pigment absorption coefficient or by the energy drain from photoprotective pigments and other acclimation processes, subsumed in Fig. 1 as non- photochemical quenching. Here we evaluate natural flu- orescence as an estimator for primary production in Mex- ican Pacific waters during different seasons at sample sites that are characteristic of mesotrophic to oligotrophic wa- ters. We did not investigate data of natural fluorescence from <5-m depth because at that depth interval two ad- ditional sources of errors have to be dealt with: elastic backscatter of downwelling irradiance and photoinhibi- tion.
Materials and methods
Nine time points were sampled between April 1992 and January 1994 in the California Current near Ensen- ada Bay (3 1”50’N, 116’53’W). Eight time points were sampled in the northern Gulf of California (30”13’N, 114” 14.5’W) between October 1992 and December 1994.
Notation
Chl a concn, mg Chl a m-3 Rate of photosynthesis, mol C rn3 s-l Rate of natural fluoresccncc emission, mol
quanta m-3 s-l Quantum yield of photosynthesis, mol C
(mol quanta absorbed)-l Quantum yield of fluorescence, quanta cmit-
ted (quanta absorbed)- 1 Max quantum yield ratio, mol C (mol quanta
fluorescence)- l Irradiance at half of (4, : $J)maX, mol quanta
m-2 s-l Chl a-specific absorption coefficient, m* (mg
Chl a)-’ Absorption coeffkient of water, m-l Absorption coefficient for tluorcscencc, m-l Attenuation coefficient for E,, m-l Upwelling radiance, mol quanta m-* s-l
str-’ Scalar irradiance, mol quanta m-* s-l Depth interval above which half of Ff origi-
nates, m Spectral quantum response of the natural
fluorescence sensor, signal (measured true)- 1
Other samples were taken from difierent locations in the Gulf of California in April 1993 during cruise MOCE2. Primary productivity, natural fluorescence, temperature and salinity (CTD; SeaBird Inc.), stimulated fluorescence (Sea Tech), ant. beam attenuation (25 cm, Sea Tech) were measured at ea.ch station. Water samples were taken for chlorophyll and nutrient concentration measurements. The samples were taken near a drifter buoy, type Holy Sock (Sybrandy and Niiler 199 I), with the drifter set be- tween lo- and 20-m depth. The Chl a was extracted for 12 h with 1009/o acetone (then adjusted to 90% acetone), and after a short period the concentration was determined both spectrophotometrically with the trichromatic meth- od (Jeffrey and Humphrey 1975) and fluorometrically with acidification to calculate pheopigments (Holm-Han- sen et al. 1965). For some samples the fluorometric meth- od yielded estimates of phcopigments above 10% of the Chl a and therefore we used the trichromatic Chl a es- timates. Nutrient [N03-, NOz-, POd3-, and Si(OH),] concentrations were measured with an autoanalyzer ac- cording to T. E,. Whitledge et al. (unpubl. rept.).
Primary proa’uctivity method- Samples were taken with Niskin bottles with an external metal spring or with in- ternal silicon rubber tubing and gaskets. The bottles were lowered on a polypropylene line or a Kevlar line and the messenger was enclosed in PVC. Water samples were taken at the de:Dths equivalent to 100, 33, 10, 3, and 1% of subsurface PAR (photosynthetic active radiation) ir- radiance. PAR irradiance was measured with the scalar irradiance sensor of the natural fluorescence profiler (PNF- 300, Biospherical Instr.). Samples were incubated in 250- ml polycarbonate bottles with 0.3 ml ofNa14C03 solution

Natural jluorescence a nd primary production 1699
(approx act, 0.15 MBq; Steemann Nielsen 1952). During the in situ incubation the sample bottles were held in acrylic tubes that were attached to a line suspended from a buoy. In general, two clear bottles and two dark bottles were incubated at their depths of origin. The incubations took place around local noon and lasted -2 h. At the end of the incubation, the samples were kept in the dark at -0OC until they were filtered in the laboratory. Filtration was performed < 3 h after the end of the incubation at a differential pressure of 20 kPa on 0.45-pm membrane filters (Gelman GN-6). Subsequently, the filters were placed in scintillation vials with 0.5 ml of 10% HCl. The vials were left to stand for 12 h and then 10 ml of liquid scintillation cocktail (Universol, ICN Radiochem.) was added. Radioactive label was counted in a Beckman LS5000 liquid scintillation counter. The counting effi- ciency was determined with an external standard and a quench curve established in advance. Primary produc- tivity was calculated according to Strickland and Parsons (1972). Total inorganic carbon concentration was 2.528 mg C m -3 for the California Current and 2.644 for the Gulf of California. These concentration were calculated (Harrison 19 8 8) assuming a salinity concentration of 3 3.5 PSU for the California Current and 35.5 PSU for the Gulf of California. The 14C total activity added to the samples was assayed by adding 0.2 ml of the Na14C03 solution directly to a vial with 0.2 ml of ethanolaminc, 10 ml of Universol cocktail, and 0.8 ml of distilled water with 0.3 g dm-3 Na12C03. The data reported here represent av- erage results from duplicate standard incubations.
The standard 14C method was varied to determine if the primary productivity data were biased by our meth- odology. Duplicate samples were incubated after adding 100 ~1 of EDTA solution (1 PM final concn.). EDTA was expected to sequester potentially inhibitory heavy metals (Barber 1973). A difference in primary productivity with and without EDTA would have indicated the probability of contamination. The retention of 14C organics on cel- lulose acetate membrane filters (Gelman GN-6; 0.45 pm) and glass-fiber filters (Whatman GF/F; effective pore size, -0.7 pm) were compared (Maske and Garcia-Mendoza 1994).
Natural jluorescence - Natural fluorescence was mea- sured with an upwelling radiance (L,) sensor that had a nominal field of view of 13” full angle (PNF-300, Bio- spherical Instr.). The instrument included a scalar PAR irradiance sensor (400-700 nm) and temperature and pressure sensors. The L, sensor and the PAR irradiance sensor were calibrated before and after the period during which the present data were taken. The calibration for the L, sensor did not change during this period, but the PAR irradiance sensor decreased in sensitivity by 207~. The decreased sensitivity was due to a broken light pipe between the photoelectric detector and the light-collecting Teflon sphere. No sudden shift was detected in the re- lationship of the in situ scalar irradiance and the reference light measurements on deck. We applied the initial cal- ibration factors in our data conversion of the scalar ir- radiance.
Table 1. Normalized fluorescence emission, water absorp- tion (a,), specific in vivo chlorophyll absorption (*achl), and relative quantum response of the upwelling radiance sensor for natural fluorescence (see text). Fluorescence emission is nor- malized to the maximum at 683 nm and the sensor response is normalized to the calibration wavelength at 680 nm.
x Emission (nm) (rel. units)
R, sensor quantum
a, *achl response (m-l) [m2 (mg Chl a)-l] (rel. units)
650 0.008 0.34 0.0007341 0.008 660 0.109 0.40 0.006457 0.239 670 0.541 0.41 0.0181835 0.730 680 0.993 0.43 0.0163932 1 .ooo 690 0.706 0.48 0.00473 14 1.131 700 0.284 0.60 0.0004372 1.147 710 0.171 0.80 0 1.202 720 0.141 1.20 0 1.170 730 0.125 1.90 0 1.250 740 0.102 2.60 0 0.825 750 0.067 2.70 0 0.090 760 0.034 2.70 0 0.007 770 0.013 2.60 0 0.003
We measured the spectral band of dctcction of the L, sensor with a monochromatic light source from a spec- trofluorometer (RF-540, Shimadzu). The excitation beam was diffusely deflected at 45” by a Teflon plate. The Teflon showed no measurable fluorescence. The monochromatic irradiance deflected from the Teflon plate was measured with a silicon detector (11 XE, Photodyne Inc.) with known spectral energy response. The results were recalculated to provide the quantum spectral response [R(X), see notation list] of the natural fluorescence sensor (Table 1). Another natural fluorometer of the same model gave similar re- sults.
A profile of natural fluorescence was measured at the beginning and end of the primary production incubation. Data were averaged for comparison of natural fluores- cence measurement with primary productivity determi- nations. Because the incubation was brief, the nonlinear time-course of the solar irradiance during this period was considered negligble.
Results
Primary productivity - Primary productivity at the Cal- ifornia Current station showed seasonal variation with a maximum photosynthetic rate of 22 mg C me3 h-l in summer (July 1993). In winter, the maximum photosyn- thetic rate was - 3 mg C m-3 h-l. The Chl a concentration had a seasonal pattern similar to that of primary pro- ductivity. The higher concentration values were mea- sured in spring and summer (-4 mg Chl m-3 for July 1993) and the lower values in autumn and winter (0.5 mg Chl m-3).
In the northern gulf station the primary productivity rate and the Chl a concentration did not show large vari- ations over the year, except in November and the begin-

1700 Garcia-Mendoza and .Maske
ning of December when the photosynthetic rate increased to a maximum of 9 mg C mm3 h-l and the Chl a con- centration to 3 mg Chl me3. During the rest of the year, the photosynthetic rate was - 3 mg C mm3 h-l and Chl a concentration - 1 mg Chl me3.
The Wilcoxon nonparametric test was used to compare results of the different treatments used in the primary productivity method. The photosynthetic rates of the samples incubated with EDTA were not different (P > 0.05; n = 45) from those incubated without EDTA. The glass-fiber filter retained - 6% more radioactive organics (Maske and Garcia-Mendoza 1994). This increase may have been caused by the adsorption of 14C-dissolved or- ganics to the GF/F filters. Here, the data from the mem- brane filters are used because these filters are more com- mon in current oceanographic research. Dark-bottle val- ues were subtracted to account for light contamination during manipulation of the samples before and after the incubation and for carbon incorporation caused by p car- boxylation. For five data points, the dark-bottle values from incubations at neighboring depth were interpolated because the original dark bottle showed excessively high values. Two data points obtained with membrane filters that were lost were replaced with data obtained from glass-fiber filters and corrected by a Factor of l/ 1.06 (Maske and Garcia-Mendoza 1994).
The reproducibility of the primary production method was estimated from results of the parallel measurements with the EDTA added and other duplicate samples where the incubation bottle was suspended outside the acrylic tube-bottle holders. These data were treated as true rep- licates because no significant difference to the standard method could be found (cf. above). There were 4-6 rep- licates per depth that could be used to calculate the C.V. The C.V.s from 54 depths were averaged, and a C.V. of 9.2% was calculated from a total of 219 samples.
Natural fluorescence- We used the relationship de- rived by Kiefer et al. (1989) to calculate the volume nat- ural fluorescence emission (mol quanta rnA3 s-l) from the L, signal (mol quanta m-2 s-l str-I) (symbols from Kiefer et al. 1989; Chamberlin et al. 1990; cf. notation list):
k? = 4nL,(k + a&. (1) k is the diffuse attenuation coefficient for downward ir- radiance, alYis the attenuation coefficient for the fluores- cence emission on the path to the sensor, and 4a is a geometric constant to convert the radiance to volume emission. In Eq. 1, k was calculated from depth profiles of the measured scalar irradiance (PAR); aFfand the signal depth of the natural fluorescence were calculated from published data of water absorption and the chlorophyll absorption cross sections in the red spectral band (see Table 1).
The attenuation coefficient for the natural fluorescence signal has so far been calculated for the peak wavelength of fluorescence emission at 683 nm (Kiefer ct al. 1989; Cham- berlin et al. 1990). We calculated aU(Eq. 2) accounting for the complete fluorescence emission spectra between 650 and 770 nm with the spectral values in Table 1:
aFf(Chl) = -&v-l
I
s
770
J>(X, z - dz)R(X) dX exp[-a()\, Chl) dz] 650
*In - (3770 1 ,
J &(k &NV dX 650
(2) where z indicates depth. We measured the spectral quan- tum response of the natural fluorescence sensor, R(X) (see methods); the in vivo fluorescence quantum emission spectrum (Haardt and Maske 1986, figure 2) was calcu- lated from the sum of three Gaussian curves with the main component having 75% of the total emission of fluorescence at 68 1 nm and a half-maximum bandwidth (HMBW) of 24 nm, a second component with a maxi- mum at 708 nm (HMBW of 24 nm) having 6.5% of the total emission, and a third component with a maximum at 730 nm (H.MBW of 59 nm) having 18.5% of the total fluorescence emission (Ff in Fig. 2). The absorption co- efficient, a@, Chl) in Eq. 2, is calculated as the sum of water absorption and absorption due to chlorophyll. The water absorption (a,) (cf. Fig. 2 and Table 1) was cal- culated from the spectral values measured by H. Haardt (unpubl. data) and corresponds approximately to the val- ues given by Pegau and Zaneveld (1993). The absorption due to chlorophyll (Chl *achl) was calculated with a Gaussian-shaped absorption band of Chl a taken from Hoepffner anti Sathyendranath (199 1) with a maximum at 674 nm and a HMBW of 21.87 nm (Fig. 2, Table 1). The relative spectral shape of the fluorescence changes with distance from its source depth and the chlorophyll concentration; therefore, no single value of aFf can be given. We calculated the effective attenuation for the path between the sl:nsor and 1 m distance and used this for our estimate of aFf (Eq. 3). This approach is justified because at this distance - 50% of the source fluorescence originates from the water in the light path toward the sensor (see be,‘ow). aFf was calculated by numeric simu- lation of the fluorescence emission in a lo-m-deep water column with different Chl a concentrations (see below):
aFf = 0.49 + 0.012 Chl. (3)
The upwelling radiance signal detected by the sensor is an integration of the natural fluorescence emitted by the phytoplanlcton over depth. Kiefer et al. (1989) cal- culated volume fluorescence at the depth of the sensor; therefore, measurements at the depth of primary produc- tion incubation can be directly compared to the estimated volume fluorescence. In the case of a rapidly changing chlorophyll profile, the interpretation by Kiefer et al. may lead to an err’3r because the upwelling radiance signal might be biased by the phytoplankton biomass farther below the sensor. To avoid this problem, we defined a representative depth interval-z50%-above which 50% of the integrated fluorescence signal originated. We sim- ulated the distance from the sensor with a two-stream spectrally resolved (10 nm) model run over a 1 O-m depth

Natural fluorescence and primary production 1701
a~ r 1.5
660 680 700 720 740 760 780
Wavelength (nm) Fig. 2. Spectral distribution of fluorescence emission (Q)),
specific absorption of Chl a (*achl), water absorption (a,,,), and the spectral quantum response of the natural fluorescence up- welling radiance sensor (broken line, right ordinate) (cf. Table 0
interval (depth resolution, dz = 0.02 m). The downwelling quantum irradiance of PAR decreases with depth (z, posi- tive with depth) according to the Lambert-Beer’s law:
E O,(z+dz) = E,,,exp[ - k(z) dz]. (4) E,(z) is the downward irradiance at depth z. k(z) was taken from our data (see Fig. 6) to be 0.08 + 0.03 Chl(z). The fluorescence quanta, Ff(X, z), emitted are a product of E,(z), the Chl a concentration in z, and the quantum yield (considered constant). F,(X, z) is attenuated expo- nentially on its path toward the sensor:
F,(l, z - dz) = Ff(l, z)exp{ [ -a,,, - *achl~z~Chl] dz}.
The values from Table 1 were used in the simulation. The fluorescence quantum flux at z = 0 (sensor depth) was weighed by the sensor quantum response and com- pared to a simulation where the fluorescence emission between z = 0 and ~50% was set at zero. These calcula- tions were repeated for different chlorophyll concentra- tions, yielding
~50% = 0.35 + exp(-0.2 - 0.09 Chl). (5)
In the simulation, the shadowing of the source irradi- ance by the sensor body was not considered; therefore, the estimated signal distance is slightly underestimated. The shadowing effect depends on the sun angle and the average cosine of the radiance distribution. Here we as- sume a constant ~50% of 0.8 m in all cases to compare the primary production data with the natural fluorescence signal. We therefore used the upwelling radiance mea- sured 0.8 m above the nominal depth to calculate volume emission [Ff(Z-o.lJ. The estimate of the volume emission at the depth of the sensor was recalculated for the primary production depth (0.8 m deeper) by assuming exponential attenuation of the irradiance:
Ff(z) = 4~L(z-0.8)Mz) + +&NvW.~k(41. (6)
In the calculation it was assumed that the volume natural fluorescence was proportional to E,. The E. was recorded at the same time as L,; therefore, it was also measured 0.8 m above the primary production depth (note that the E. sensor was 0.3 m above the L, sensor). Consequently, E. was recalculated for the primary production at depth z:
Eo,z = Eo,(z-l.+x~[- 1. W)l. (7)
Comparison of primary production measurements and natural jluorescence- We compared 7 1 simultaneous measurements of 14C incorporation (F,) and natural flu- orescence (F,). For the 14C data we used the average values from the replicate samples. Chambcrlin et al. (1990) showed that the quantum yield ratio (4, : 4) and therefore the ratio of carbon assimilation to fluorescence emission is a function of irradiance:
The two empirical constants (4, : 4&ax and lccf are the maximum quantum yield ratio and the irradiance at a half-maximum quantum yield ratio, respectively. In Eq. 8, there constants can be adjusted to our data by iterative minimization of the squared errors (Marquardt and Leuenberg algorithm, Sigma Plot for Windows, vers. 1.02) resulting in a (4, : +f),,X of 1.90 C photon-l, a k,, of 187 pmol quanta m-2 s-’ (Fig. 3), and a correlation coefficient (r2) of 0.73. When the data of the three sampling zones were analyzed separately, no significant difIerences of pa- rameter values could be obtained for the different zones (t-test; P > 0.05). When Eq. 8 is solved for F,, the carbon assimilation can be calculated from natural fluorescence (Chamberlin et al. 1990):
(9)
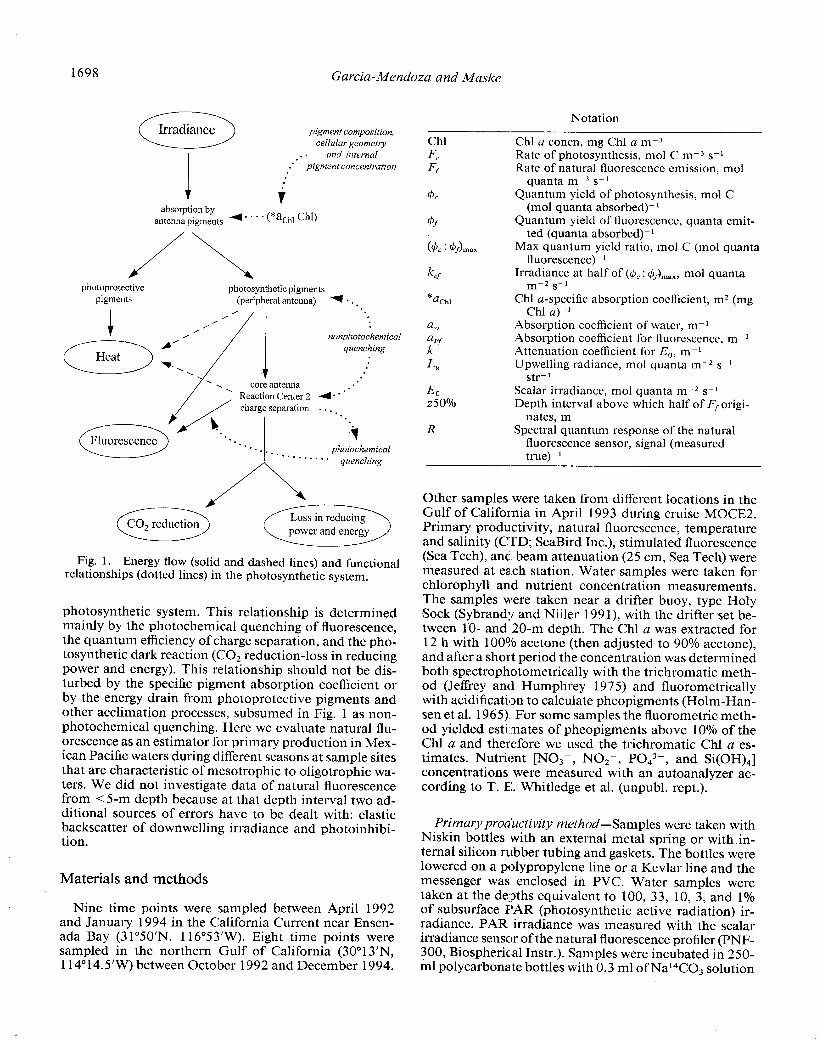
In Fig. 4A the calculated and measured primary produc- tion, F,, are compared. In the inset graph, three outliers are evident at high measured primary production values. Two of these outliers were measured in a red tide in the Gulf of California. The r2 is 0.8 5 (n = 68), calculated without the outliers and forcing the slope through zero. The slope (0.95) is significantly different from 1.0 (t-test; C.I. 95%, P < 0.12). With these primary production data normalized to chlorophyll [nmol C s-l (mg Chl)-‘] (Fig. 4B), a regression of all the data yielded a r2 of 0.7 1 (n = 7 l)-neither slope nor intercept being significantly dif- ferent from 1 and 0. The outliers in Fig. 4B do not seem to deviate from the rest of the data as strongly as they do in Fig. 4A, but without the three outliers the r2 improves to 0.784 (n = 68) and the intercept and slope are not significantly different from 0 and 1.
The quantum yield ratio vs. irradiance function cal- culated from our data is considered to represent the func- tional response of nutrient-replete phytoplankton or phy-
1702 Garcia-Mendoza and Maske
2.5 - - + I ;a 2 2.0 -
z o+
2 1.5
-2 -1 Irradiance (pmol quanta m s )
Fig. 3. Quantum yield ratio vs. in situ quantum irradiance. Solid line represents the best-fit with Eq. 8 (see lext). Dashed line is the best-fit by Chambcrlin et al. (1990).
toplankton only slightly limited by inorganic nutrients. The relative deviation of the measured quantum yield ratio from the function [(measured - calculated)/calcu- lated] was compared to environmental variables to find a forcing variable. These normalized residuals showed no significant relationship (Fig. 5) with either chlorophyll, nitrate, or temperature. In Fig. 5 the three outliers from Fig. 4 are included. Nitrate was chosen here as an indi- cator of potential nutrient limitation because a compar- ison of phosphate, silicate, and nitrate concentrations in our samples showed that nitrate would be the first nutrient to become limiting (data not shown). A multiple regres- sion analysis of the relative residuals vs. temperature, Chl a concentration, and nitrate yielded no significant (P < 0.05) relationship between the residuals. A dependence of the relative residuals on nitrate concentration (Fig. 5C) is expected to manifest itself only below 1 PM N03-. Therefore, we specifically looked for a significant change in the residuals at low nitrate concentrations. The resid- uals in Fig. 5C were divided according to nitrate concen- tration into sequential groups of nine data points each and the median for each group was calculated. We found no trend in the data. The first median was not significantly different from the last median, nor were the medians from the first three groups and the last three groups significantly different.
Discussion
Our data show a generally reproducible relationship between primary production and natural fluorescence. The ratio between both variables is equivalent to the ratio of the quantum yields of photosynthesis and fluorescence. This ratio has been found empirically to follow a hyper- bolic function of irradiance (Chamberlin ct al. 1990). A key aspect ofthe natural fluorescence method as a primary production proxy is the reproducibility of this function.
F c measured (nmol C mm3 s-l)
100 200 300
Fc rneasured [nmol C (mg Chl a)-l s-l] Fig. 4. A. Primary production, calculated from the best-fit
curve in Fig. 3 vs. measured primary production. The inset shows underestimation of predicted production above 400 nmol C m-3 s-l of measured production. Solid dots represent the three data points not used in the correlation analysis. B. Primary production normalized to chlorophyll, estimated vs. measured values. The primary production data in panel B were divided by indepcndentl:, measured Chl a. Solid dots as in panel A.
The difference:; between published data and a global quantum yield ratio-irradiance function arc due to both methodological noise and physiological variability.
Methodological variability of the 14C primary produc- tion method-The primary production data are consid- ered accurate because the addition of EDTA did not result in a significant change in the rate of carbon incorporation. Different types of filters do result in a 6% difference in the primary production estimate. A likely explanation for

NaturalJluorescence and primary production 1703
this difference is that the glass-fiber filters adsorb dis- solved organics and thus not only collect the radioactivity of the particles but also the radioactive, dissolved organics formed during incubation (Maskc and Garcia-Mendoza 1994). Use of the membrane filter data led to a under- estimation of -6% of the rate of photosynthesis and of the quantum yield ratio because the exudates produced during the incubation were not retained by the filter. The accuracy of the primary production data may be slightly compromised because the total dissolved inorganic car- bon was calculated (assuming equilibrium with air) from salinity and temperature instead of having been mea- sured. This error should be small, but it would propor- tionately affect the estimate of the quantum yield ratio in Fig. 3.
The C.V. of the 14C method was 9.2%. This value is lower than the C.V. of 10.6% reported by Lignell (1992) and 10% reported by Cassie (1962) and is within the range reported during an intercalibration experiment of differ- ent laboratories (avg C.V.: 6.8O/o, range: 1.9-26.7%, Rich- ardson 199 1).
In Mexican waters, as in most open ocean areas, chlo- rophyll develops a pronounced subsurface maximum. The difference in chlorophyll concentration at the natural flu- orescence sensor and where the natural fluorescence signal originates might lead to a small error in the analysis of point depth values. WC routinely used a depth correction of 0.8 m for all our samples (see results), although this distance depends on the chlorophyll concentration (Eq. 5) and the vertical structure of chlorophyll. This depth correction is necessary only in the cast of a strong vertical gradient in the Chl a concentration. In a water column where chlorophyll does not change with depth, the vol- ume fluorescence calculated from the upwelling radiance at the nominal depth (Eq. 1) will yield the same results as the calculation from the upwelling radiance 0.8 m above the nominal depth (Eq. 7).
The volume fluorescence emission calculated from up- welling radiance is proportional to the sum of k (the dif- fuse attenuation of daylight) and aFf. (the absorption of the emitted fluorescence) (Eq. 1 and 6). In this work, k was calculated from in situ irradiance (cf. Table 2) and was not calculated from chlorophyll, because at low chlo- rophyll concentrations the measured k shows consider- able variability (Fig. 6). The marked high values in Fig. 6 were taken in the northern Gulf of California at a depth of only 30 m, and WC assume that these values were high because of resuspension of the sediment. The variability of k at low chlorophyll concentrations would limit quan- tification of natural fluorescence on a mooring if only one instrument were deployed.
The autoabsorption of fluorescence by Chl a, aFf, was estimated to be similar to icvels found in previous pub- lications (Table 2), even though the measured spectral quantum response curve of the natural fluorescence sen- sor differed considerably from the spectrum assumed by previous investigations. For the calculation of aFf, the in vitro Chl a data were used; however, the chlorophyll con- centration need not necessarily be measured, as it can be
‘.*l A 0
0.6 4 o 0 0 0
$ 0.6
% El
0.0 in i! -0.6
8 2 -1.2
2 a .A !z ? 1.2
‘3 cd 73 0.6
cd 0.0
-0.6
0 0
0 1 2 3 4 5 6
Chlorophyll a (mg Chl a rne3)
L---r---r---T-----l IO 15 20 25 30
Temperature (‘C)
-1.2 c -/Arm 0.0 0.5 2.0 4.0 6.0 8.010.012.014.016.0
Nitrate (pm01 kg-‘) Fig. 5. Relative residuals of the quantum yield ratio vs.
irradiance relationship [(measured - calculated)/calculated] from all stations. A. Chl a concentration. B. Temperature. C. Nitrate concentration; note break in abscissa.
cstimatcd from the ratio of natural fluorescence to day- light irradiance (Kicfer et al. 1989). This estimate of chlo- rophyll can be applied iteratively to yield aFf and then chlorophyll, thus minimizing the error. In oligotrophic waters the chlorophyll correction of a,.would be of minor importance, changing the estimate of volume fluorescence only - 2% per mg Chl a mm3.
The colored dissolved organic matter fluorescence and Raman scattering of the water can emit photons at the same wavelength as chlorophyll fluorescence. We as- sumed with Waters and Smith (1994) that the contri- bution of colored dissolved organic matter fluorescence to the light emission wavcband of chlorophyll fluores- cence is negligible. Waters and Smith calculated that in oligotrophic waters (Sargasso Sea) at 33-m depth the Ra- man scattering contributed from 3% of the light emission at 683 nm during a phytoplankton bloom to - 10% during

1704 Garcia-Mendoza and Maske
Table 2. Comparison of published data. Conditions during the primary production measurement (duration of the incubation and type of incubation), the constants (k, a& used in the calculation of volume fluorescence from upwelling radiance measurement (Eq. l), the constants [I?,,, (4, : $Jm,,] for a best-fit rectangular hyperbolic function of the quantum yield ratio vs. irradiance, and correlation coefficients between measured and calculated primary production. (Calculated from in situ data-meas.; not available- na.)
References
This work Kiefer et al. 19897 Chamberlin et al. 1990 Chamberlin and Marra 1992
Kiefer and Reynolds 1992 Stegmann et al. 1992JyJf Lizotte and Priscu 1994 This work
Cot@ and Platt 1984 Kiefer and Reynolds 1992 Kolber and Falkowski 1993
k d Prim. prod.*
(4, : 4Jmax
(m”-I) %f (nm01 (C pho-
(h)/method (m-7 m-2 s-l 1 ton-‘) r2t r2$ 2/in situ Meas. 0.49+0.012 Chl 187 1.9 0.858 0.79 11 Modeled Meas. 0.46+0.01 Chl 0.84 0.5-l 2/in situ Meas. 0.5 1% 2”.“3 0.84# 0.5-l 4/in situ Meas. 0.5 150-220 0.8-2.0 0.90# P/I** 0.2** na/in situ Meas. 0.46+0.015 Chl na -5 0.74 1 /P/I Meas. 0.465 0.2-0.4 3-5/P/Z na na _n7ag 1.5 x0.58
Comparison with a model based on measured Chl 0.71 and PAR
Comparison of PII and in situ data 0.79 na/in situ Calculation based on pump-asnd-probe fluorometer 0.86 4/sim. in situ Calculation based on pump-,md-probe fluorometer 0.74
* Primary production measurement by 14C incorporation, duration of incubation, and the type of incubation. Artificially attenuated daylight: sim. in situ- in situ photosynthesis calculated from irradiance and P-I ~:urves obtained under artificial light.
T Correlation coefficient comparing the rates of primary production (F,, mol C m-3 s-l) calculated and measured. $I Correlation coefficient of the calculated and measured rates of primary production after normalization to the independently
measured Chl a concentration [r;, Chl-l, mol C m-3 s-l (mg Chl a)-‘]. 0 Three outliers were excluded, slope was forced through 0; n = 68. 11 Three outliers were excluded; rz = 68. ll A factor of 27 was used to convert the radiometer reading (for 683 nm) to the complete fluorescence emission spectrum. Primary
production was compared to natural fluorescence with the help of a model that included an irradiance function without explicit reference to quantum ratios.
# Correlation coefficient based on log-transformed data. ** Method and r2 obtained in Antarctic waters. Tt A factor of 25 was used to convert the radiometer reading (at 683 nm) to the complete fluorescence emission spectrum. Natural
fluorescence was calculated after correction with a hypothetical backscatter reflectance.
0.00 -I+---~~---- , I I 0 1 2 3 4 5 6
Chl (mg Chl a rnm3) Fig. 6. Measured diffuse attenuation coefficient, k vs. Chl a
concentration. Broken line gives the estimate of Kiefer et al. (1989); solid line is a linear regression calculated from the data (k = 0.08 + 0.03 Chl; n = 67, r2 = 0.73). Solid dots were not included in the calculation of the linear regression.
a postbloom. Their estimate was based on measured in situ irradiance at 550 nm, which is close to the excitation wavelength of the Raman emission at 683 nm. Waters and Smith did. not correct their estimate of natural flu- orescence for the Raman emission, but they suggested that this potertial error should be taken into considera- tion. Because ‘we did not have irradiance data for calcu- lation of the Raman emission, we did not correct our natural fluorescence data for such emission.
Quantum yL?ld ratio and the prediction ofprimary pro- duction from natural fluorescence-The most simple analysis of biomass-normalized primary production is based on a constant irradiance response of primary pro- duction (PB-E’ curve); therefore, primary production models based on Chl a can act as baselines for judging the performance of natural fluorescence or other proxies. In biological oceanography, Chl a is the most common proxy for phytoplankton biomass. As shown in Fig. 1, there are various processes that modify the relationship between potential primary production, P/E, and Chl a, including the specific absorption coefficient *aChl, or the
Natural jluorescence and primary production 1705
energy drain by photoprotective pigments, and other non- photochemical quenching processes. Natural fluorescence should improve the above estimate of primary produc- tion because the relationship between fluorescence and primary production is modified little by the above pro- cesses, but it is changed by photochemical quenching.
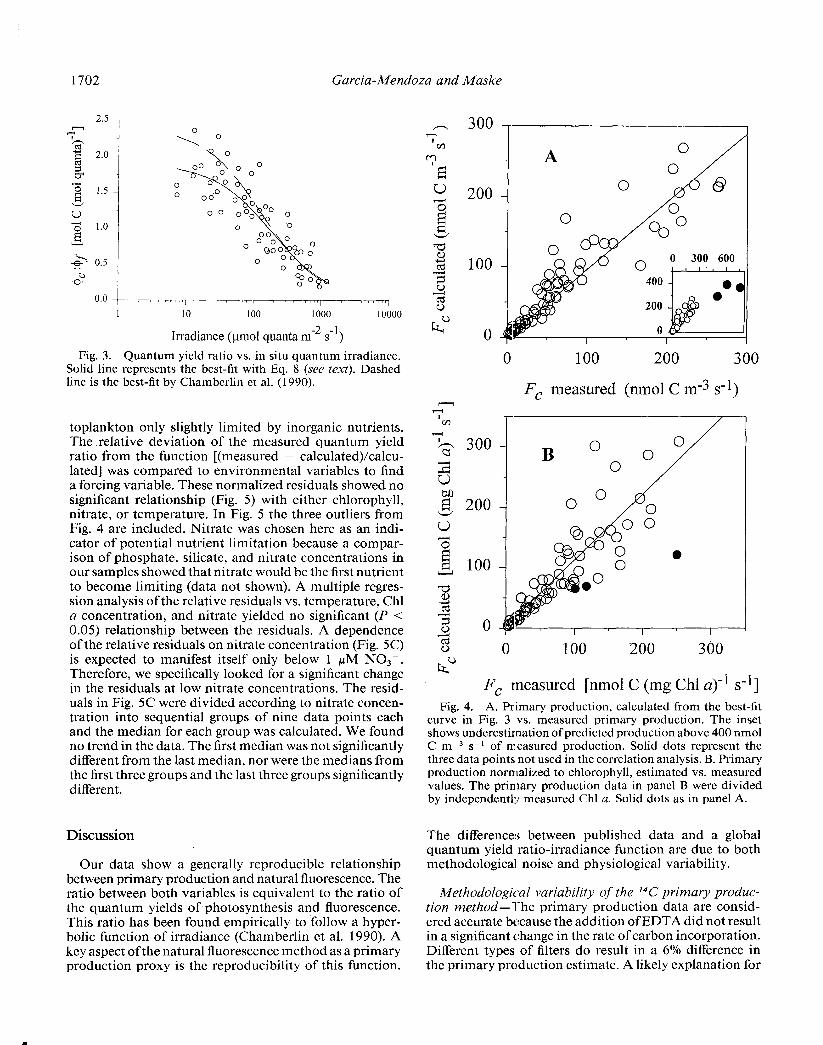
We tested the prediction of primary production from Chl a data. First, a hyperbolic tangent P”IE curve (Geider and Osborne 1992) was adjusted to the data below 5-m depth (Fig. 7). The primary production estimate (F,) based on this curve was compared to the measured primary production and found to yield a higher r2 than that be- tween measured and estimated rates normalized to chlo- rophyll (F,Chl- l). In Table 2 in general, the r2 for F,Chl- l is lower than it is for F,. F, can be interpreted as a product of two independent factors-the normalized rate and the phytoplankton biomass [i.e. F, = Chl (F,Chl-I)]. In a correlation of the estimated and measured F,, the differ- ence lies in the normalized rates, but the factor Chl is numerically the same for both correlation variables. Therefore, the correlation of both values of F, is really a cross-product correlation that will yield a r2 between one factor pair (F,Chl-l) and the other (Chl), The latter would yield an r2 of 1.0; hence, the r2 of the product, F,, is expected to be higher, and the increase will depend on the range of the chlorophyll values in the data set. In Fig. 7 the data above 5-m depth are included together with a best-fit curve including photoinhibition. The r2 of mea- sured and calculated data for this curve is 0.7 1 -slightly higher than the best-fit for data below 5-m depth. The curve that represents all data allowed a better comparison with published data that included samples close to the surface (Cot6 and Platt 1984; Kolber and Falkowski 1993).
In Table 2 the primary production estimate based on chlorophyll and irradiance is lower than our estimate based on natural fluorescence, although chlorophyll and pri- mary production were subsampled from the water bottle, whereas the natural fluorescence was typically measured - 1 h after the water samples were taken. The capability of natural fluorescence to predict primary production rests on a reproducible irradiance function of the quantum yield ratio (Eq. 8). The correlation bctwcen measured and calculated primary production yielded a r2 of 0.85 (Fig. 4A), with r2 reduced to 0.79 when the data were nor- malized to chlorophyll.
A major part of the variance between our measured and calculated primary production could be due to the imprecision of the primary production method, with ad- ditional variance being caused by the time difference bc- tween taking the samples and measuring the natural flu- orescence. Another source of variance could result from inherent differences between the methods: fluorescence is an instantaneous measurement related to gross photo- synthesis, whereas the 2-h carbon incorporation method measures a mixture of gross and net photosynthesis. Nev- ertheless, given the similarity of r2 between predicted and measured primary production in our data and those of others (Table 2), it will be difficult to improve the pre- diction without significantly improving the precision and
350 -
‘m 3 300
k 8 250
2 200
; 150
8 u 100
5 50 . . 9 0
I 4
0
4
---r-- T----
1200 y
1000 k
8 800
3
600 ii z-
400 '-d
g
200
0" . .
0 c 0 500 1000 1500 2000 2500
Irradiance (pmol quanta mm2 s-‘)
Fig. 7. Primary production (0) and fluorescence (a) nor- malized to chlorophyll vs. irradiance. The continuous line is a best-fit to the primary production data below 5-m depth using a hyperbolic tangent model (Geider and Osborne 1992): PB = P max tanh(olE/P,,,), where Pm,, = 178 mmol C (mg Chl a)-’ s-l and a = 0.472. Broken line is a best-fit of all the data based on an exponential model including photoinhibition (Platt et al. 1980): PB = P, [I - exp(--E)cxp(-bE)], where P, = 16.17, a = a/P,,, LY = 0.0243, b = /3/P,, and p = 0.00951.
Platt 1984 in Table 2). The estimate of primary produc- tion based on pump-and-probe fluorcscencc (Kiefer and Reynolds 1992; Kolber and Falkowski 1993) yields r2s with measured primary production that are similar to those of the natural fluorescence method (Table 2). Im- provement in the estimate of primary production might come from combining natural fluorescence with the phys- iological information provided by the pump-and-probe fluorometer.
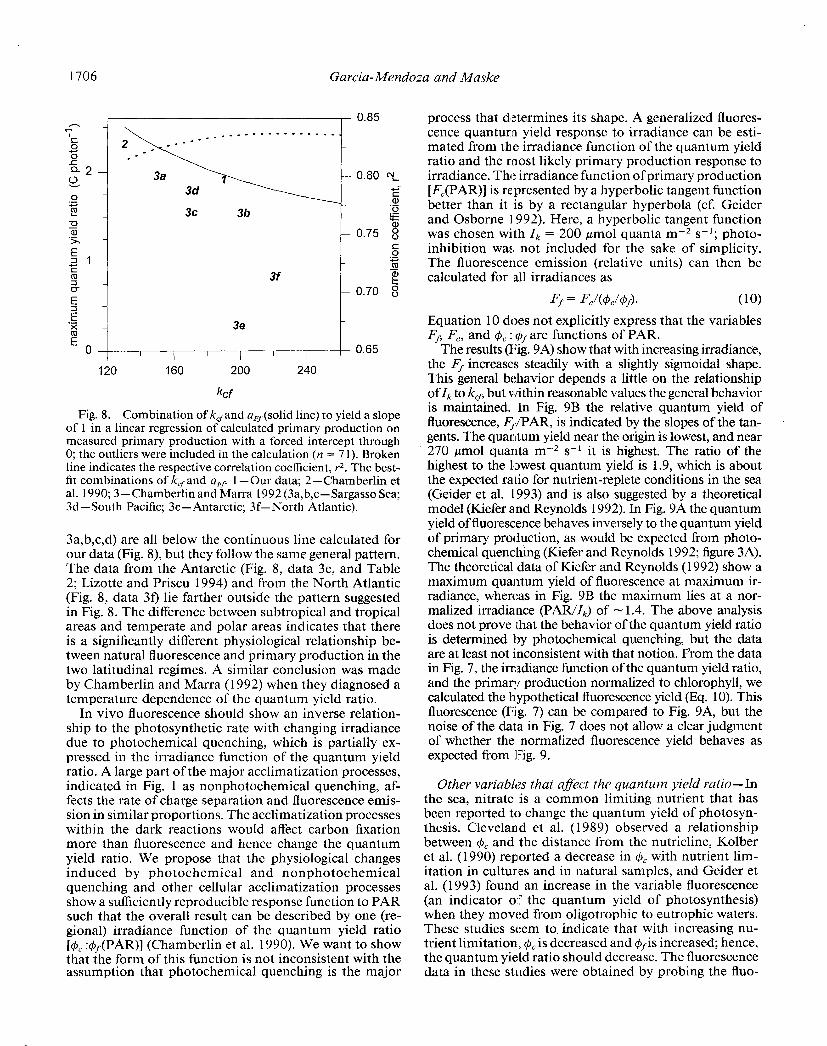
For our data, the inverse rectangular hyperbola func- tion suggested by Chamberlin et al. (1990) clearly better represents the irradiance dependence of the quantum yield ratio than do other curves we tried (e.g. an inverse hy- perbolic tangent function). The inverse rectangular hy- perbola is characterized by k,sand 4, : & a best-fit of both parameters was obtained by minimizing the squared er- rors in Eq. 8. In Fig. 8, we adjusted the parameters so that a linear regression of the calculated to measured primary production (intercept forced through 0) yielded a slope of 1. Given the r2 in Fig. 8, it is clear that the parameter combination is somewhat ambiguous because the r2 changed little over a range of k,fvalues. The max- imum r2 in Fig. 8 is slightly below that given in Table 2 because in Fig. 8 the three outliers were included (n = 7 1). The two approaches to optimize the parameter com- bination (Eq. 8 and Fig. 7) are not necessarily compatible because in Eq. 8 the low irradiance values contribute more to the parameter determination (cf. Fig. 3) and in Fig. 8 the high primary production values arc more decisive.
In Fig. 8 the empirical parameter combination given by different investigators is indicated (Table 2). The com- bination of kC. and ($, : +&,x from Lizotte and Priscu (1994) is not included in Fig. 8 because it was too far outside the general pattern. The parameter combinations
accuracy of the primary production method (cf. C&e and from tropical and subtropical areas (Fig. 8, data 1, 2,
1706 Garcia-Mendoza and Maske
I , 0.85
I- 0.80 N,
3f
120 160 200 240
kf
Fig. 8. Combination of kcfand a&solid line) to yield a slope of 1 in a linear regression of calculated primary production on measured primary production with a forced intercept through 0; the outliers were included in the calculation (n = 7 1). Broken line indicates the respective correlation coefficient, r2. The best- fit combinations of k,,and a,? 1 -Our data; 2-Chamberlin et al. 1990; 3-Chamberlin and Marra 1992 (3a,b,c-Sargasso Sea; 3d-South Pacific; 3e-Antarctic; 3f-North Atlantic).
3a,b,c,d) are all below the continuous line calculated for our data (Fig. 8), but they follow the same general pattern. The data from the Antarctic (Fig. 8, data 3e, and Table 2; Lizotte and Priscu 1994) and from the North Atlantic (Fig. 8, data 3f) lie farther outside the pattern suggested in Fig. 8. The difference between subtropical and tropical areas and temperate and polar areas indicates that there is a significantly different physiological relationship be- tween natural fluorescence and primary production in the two latitudinal regimes. A similar conclusion was made by Chamberlin and Marra (1992) when they diagnosed a temperature dependence of the quantum yield ratio.
In vivo fluorescence should show an inverse relation- ship to the photosynthetic rate with changing irradiance due to photochemical quenching, which is partially ex- pressed in the irradiance function of the quantum yield ratio. A large part of the major acclimatization processes, indicated in Fig. 1 as nonphotochemical quenching, af- fects the rate of charge separation and fluorescence emis- sion in similar proportions. The acclimatization processes within the dark reactions would affect carbon fixation more than fluorescence and hence change the quantum yield ratio. We propose that the physiological changes induced by photochemical and nonphotochemical quenching and other cellular acclimatization processes show a sufficiently reproducible response function to PAR such that the overall result can be described by one (re- gional) irradiance function of the quantum yield ratio [@, :&(PAR)] (Chamberlin et al. 1990). We want to show that the form of this function is not inconsistent with the assumption that photochemical quenching is the major
process that d#:termines its shape. A generalized fluores- cence quantum yield response to irradiance can be esti- mated from the irradiance function of the quantum yield ratio and the most likely primary production response to irradiance. The irradiance function of primary production [FJPAR)] is represented by a hyperbolic tangent function better than it is by a rectangular hyperbola (cf. Geider and Osborne 1992). Here, a hyperbolic tangent function was chosen with Zk = 200 pmol quanta m-2 s-l; photo- inhibition was, not included for the sake of simplicity. The fluorescence emission (relative units) can then be calculated for all irradiances as
FJ = WW4$. (10) Equation 10 does not explicitly express that the variables Ff, F,, and +, : @are functions of PAR.
The results (Fig. 9A) show that with increasing irradiance, the Ff increases steadily with a slightly sigmoidal shape. This general behavior depends a little on the relationship of Zk to kCf, but within reasonable values the general behavior is maintained. In Fig. 9B the relative quantum yield of fluorescence, Q/PAR, is indicated by the slopes of the tan- gents. The quantum yield near the origin is lowest, and near 270 pmol quanta m-2 s-l it is highest. The ratio of the highest to the 1lBwest quantum yield is 1.9, which is about the expected ratio for nutrient-replete conditions in the sea (Geider et al. 1993) and is also suggested by a theoretical model (Kiefer and Reynolds 1992). In Fig. 9A the quantum yield of fluorescence behaves inversely to the quantum yield of primary production, as would be expected from photo- chemical quenching (Kiefer and Reynolds 1992; figure 3A). The theoretical data of Kiefer and Reynolds (1992) show a maximum quantum yield of fluorescence at maximum ir- radiance, whereas in Fig. 9B the maximum lies at a nor- malized irradiance (PAR/Z,) of - 1.4. The above analysis does not prove that the behavior of the quantum yield ratio is determined by photochcmical quenching, but the data are at least not inconsistent with that notion. From the data in Fig. 7, the irradiance function of the quantum yield ratio, and the primaq, production normalized to chlorophyll, we calculated the hypothetical fluorescence yield (Eq. 10). This fluorescence (Fig. 7) can be compared to Fig. 9A, but the noise of the data in Fig. 7 does not allow a clear judgment of whether the normalized fluorescence yield behaves as expected from Fig. 9.
Other variables that afleet the quantum yield ratio-In the sea, nitrate is a common limiting nutrient that has been reported to change the quantum yield of photosyn- thesis. Cleveland et al. (1989) observed a relationship between 4, and the distance from the nutricline, Kolber et al. (1990) reported a decrease in (b, with nutrient lim- itation in cultures and in natural samples, and Gcider et al. (1993) found an increase in the variable fluorescence (an indicator 0:; the quantum yield of photosynthesis) when they moved from oligotrophic to eutrophic waters. These studies seem to indicate that with increasing nu- trient limitation, 4, is decreased and &is increased; hence, the quantum yield ratio should decrease. The fluorescence data in these studies were obtained by probing the fluo-

Natural fluorescence and primary production 1707
rescence properties of natural phytoplankton with chem- ical or light treatment. Some publications based on nat- ural fluorescence (in situ under steady-state conditions) have reported a dependence of the quantum yield ratio on temperature (Chamberlin and Marra 1992) and on nutrient concentrations (Lizottc and Priscu 1994). Lizotte and Priscu (1994) directly related the quantum yield ratio of their data to the respective environmental parameter. We think that this approach leads to erroneous conclu- sions because temperature and nutrients often covary with irradiance in the euphotic zone.
Chamberlin and Marra (1992) modified their irradi- ance curve of quantum yield ratios with a temperature- dependent factor. This factor was calculated from the average quantum yield ratio of the regional data set, which could lead to a biased estimate because the average quan- tum yield will depend on the average irradiance to which the samples were exposed. A better approach would be to look exclusively at the low irradiance quantum yields. In Chamberlin and Marra (1992, figure 2) the quantum yields below 100 pmol quanta m-2 s-l showed increasing values from the Antarctic, North Atlantic to the South Pacific, and the Sargasso Sea. According to Chamberlin and Marra, the reduced maximum quantum yield ratio at low temperatures is responsible for this behavior. Li- zotte and Priscu (1994) did find a reasonably high max- imum quantum yield ratio in the Antarctic (Table 2), which would argue against this interpretation.
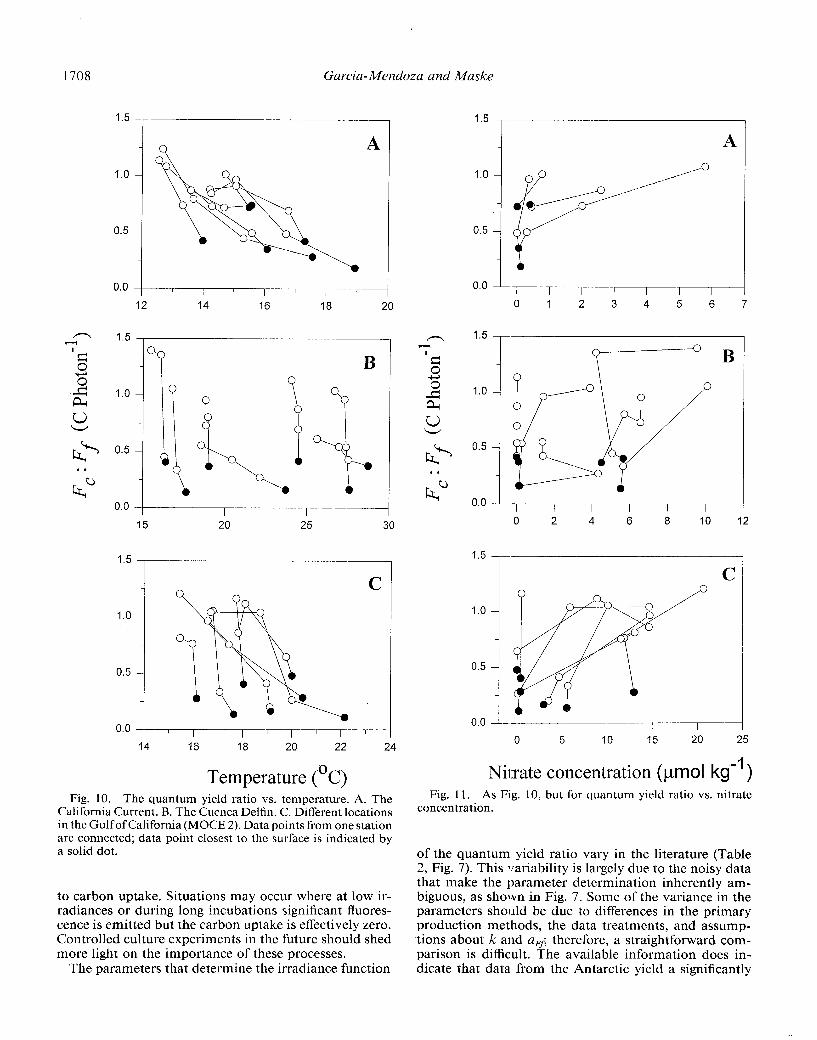
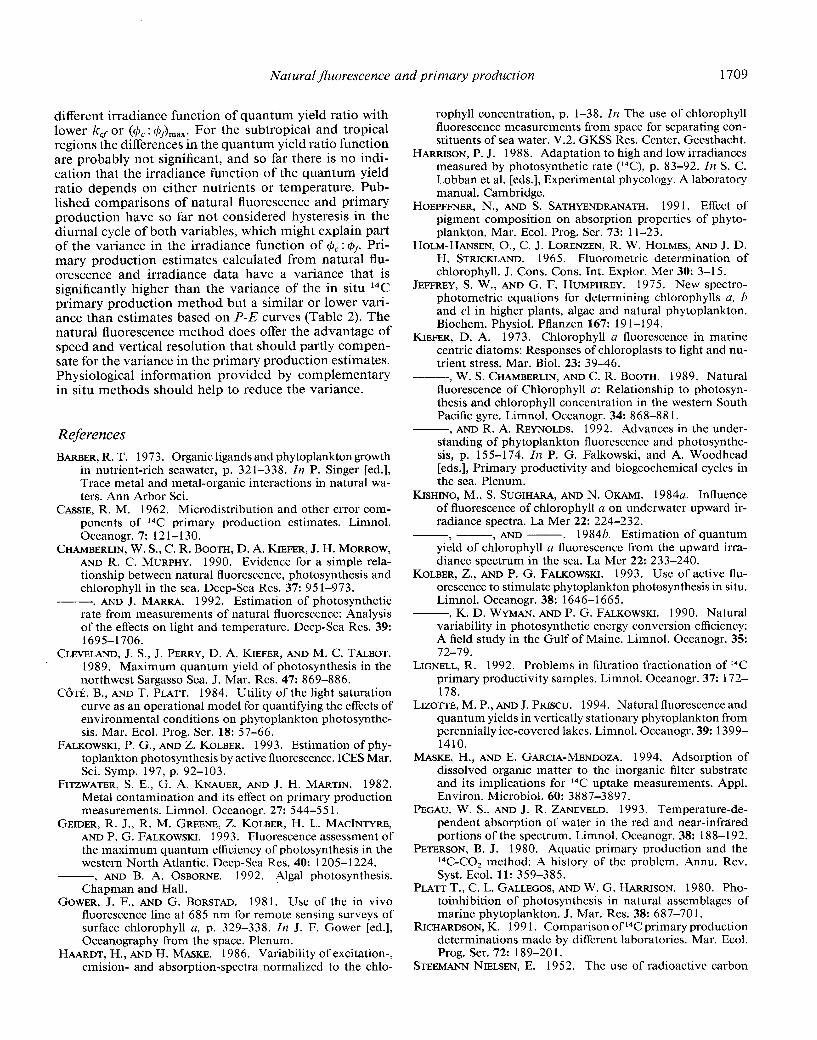
The effect of nutrients or temperature can be easily misinterpreted if the irradiance effect is not eliminated beforehand. To demonstrate this, we plotted the quantum yield ratios vs. the environmental variables for different regions (Figs. 10, 11). Although in some of the graphs (Figs. 1 OA, 11A) the complete data ensemble seems to indicate a significant trend, in most graphs such ensem- bles do not. In the graphs, the data points from one hy- drocast are interconnected and the data point closest to the surface is indicted by a solid dot. Closer examination shows that in all casts the solid dots represent the lowest quantum yield ratio indcpcndent of the values of the environmental variable. The graphs that seem to indicate a significant relationship do so because the irradiance covaries over the season with the environmental variable (temperature, nitrate, silicate) in a reproducible manner. When this covariation breaks down, as in the other fig- ures, the significant trend between the quantum yield ratio and the environmental variable fails. We conclude from Figs. 10 and 11 that there is no indication that the quan- tum yield ratio in our data was driven by any other vari- able than irradiance. The influence of other environmen- tal variables can be investigated with normalized resid- uals (Fig. 5, see above). For our data set the normalized residuals did not show a significant relationship to the in situ values of chlorophyll, temperature, and nitrate (e.g. the temperature effect suggested by Chamberlin and Mar- ra 1992 would change the relative residuals in Fig. 5B from about - 0.44 at 10°C to + 0.39 at 30°C which is not the case). Actually, 68% the normalized residuals in Fig. 5 lie within a SD of kO.28, thus demonstrating that our primary production estimates are, on average, closer to
2.0 , i- - - -- r 2.5
1.5
1.0
0.5
0.0 0 200 400 600
PAR (urn01 quanta mm2 s-l)
0.0
E 0.5 -g
0.0 s
0 200 400
PAR (pm01 quanta mm2 s-l)
Fig. 9. Fluorescence emission vs. irradiance. A. Continuous line- quantum yield ratio [($, : 4Jrnax = 1.9, kCf = 1871; dashed line- hypothetical primary production function (rectangular hy- perbola, Ik = 200 pmol quanta m-2 s-l, PB,,, = I); dotted line- fluorescence emission. B. Maximum and minimum quantum yields of the fluorescence emission (dotted line) is indicated by the upper and lower tangents (continuous lines).
the measured values than are the estimates by Cham- bcrlin and Marra (1992), despite their correction for tem- perature.
Natural fluorescence is largely emitted from photosys- tern 2 and its antenna and therefore is functionally linked to charge separation and photosynthetic oxygen produc- tion (cf. Fig. 1). Part of the photosynthetic energy and reducing power will be deviated to metabolic functions such as nitrate or sulfate reduction, and part of the carbon assimilated is reduced by excretion or respiration. The relationship of oxygen production, carbon assimilation, and 14C label measured in the particulate fraction does not depend only on environmental conditions but also on the duration of the incubation. The relative impact of the abovementioned processes is variable; hence, they will add noise to the relationship of natural fluorescence
1708 Garcia-Mendoza and Maske
0.0
12 14 16 18 20
1.5
1.0
0.5
0.0 i
-i---- l -____
15 20 25 30
1.5
0.5
0.0 --1
14 16 18 20 22 24
Temperature (‘C) Fig. 10. The quantum yield ratio vs. temperature. A. The
California Current. B. The Cucnca Delfin. C. Different locations in the Gulf of California (MOCE 2). Data points from one station are connected; data point closest to the surface is indicated by a solid dot.
to carbon uptake. Situations may occur where at low ir- radiances or during long incubations significant fluores- cence is emitted but the carbon uptake is effectively zero. Controlled culture cxperimcnts in the future should shed more light on the importance of these processes.
The parameters that determine the irradiance function
A
J -
I 0 12 3 4 5 6 7
I I 0 2 4 6 8 10 12
C
0.0 -L- , I 0 5 10 15 20 25
Nilrate concentration (pmol kg-’ ) Fig. 11. As Fig. 10, but for quantum yield ratio vs. nitrate
concentration.
of the quantum yield ratio vary in the literature (Table 2, Fig. 7). This variability is largely due to the noisy data that make the parameter determination inherently am- biguous, as shown in Fig. 7. Some of the variance in the parameters should be due to differences in the primary production methods, the data treatments, and assump- tions about k and a,. therefore, a straightforward com- parison is difficult. The available information does in- dicate that data from the Antarctic yield a significantly
Natural fluorescence 2nd primary production
different irradiance function of quantum yield ratio with lower kc, or (4, : d&-,,,. For the subtropical and tropical regions the differences in the quantum yield ratio function are probably not significant, and so far there is no indi- cation that the irradiance function of the quantum yield ratio depends on either nutrients or temperature. Pub- lished comparisons of natural fluorescence and primary production have so far not considered hysteresis in the diurnal cycle of both variables, which might explain part of the variance in the irradiance function of 4, : &. Pri- mary production estimates calculated from natural flu- orescence and irradiance data have a variance that is significantly higher than the variance of the in situ 14C primary production method but a similar or lower vari- ance than estimates based on P-E curves (Table 2). The natural fluorescence method does offer the advantage of speed and vertical resolution that should partly compen- sate for the variance in the primary production estimates. Physiological information provided by complementary in situ methods should help to reduce the variance.
rophyll concentration, p. l-38. In The use of chlorophyll Auorescencc measurements from space for separating con- stituents of sea water. V.2. GKSS Res. Center, Gcesthacht.
HARRISON, P. J. 1988. Adaptation to high and low irradiances measured by photosynthetic rate (‘“C), p. 83-92. Zn S. C. Lobban et al. [eds.], Experimental phycology. A laboratory manual. Cambridge.
References BARBER, R. T. 1973. Organic ligands and phytoplankton growth
in nutrient-rich seawater, p. 321-338. In P. Singer [ed.], Trace metal and metal-organic interactions in natural wa- ters. Ann Arbor Sci.
HOEPFFNER, N., AND S. SATHYENDRANATH. 1991. Effect of pigment composition on absorption properties of phyto- plankton. Mar. Ecol. Prog. Ser. 73: 1 l-23.
HOLM-HANSEN, O.,C.J. LORENZEN, R. W. HOLMES, AND J.D. H. STRICKLAND. 196 5. Fluoromctric determination of chlorophyll. J. Cons. Cons. Int. Explor. Mer 30: 3-l 5.
JEFFREY, S. W., AND G. F. HUMPHREY. 1975. New spcctro- photometric equations for determining chlorophylls a, b and cl in higher plants, algae and natural phytoplankton. Biochem. Physiol. Pflanzen 167: 19 l-l 94.
KIEFER, D. A. 1973. Chlorophyll a fluorescence in marine centric diatoms: Responses of chloroplasts to light and nu- trient stress. Mar. Biol. 23: 39-46.
-, W. S. CHAMBERLIN, AND C. R. BOOTH. 1989. Natural fluorescence of Chlorophyll a: Relationship to photosyn- thesis and chlorophyll concentration in the western South Pacific gyre. Limnol. Oceanogr. 34: 868-88 1.
-, AND R. A. REYNOLDS. 1992. Advances in the under- standing of phytoplankton fluorescence and photosynthe- sis, p. 155-174. In P. G. Falkowski, and A. Woodhead [eds.], Primary productivity and biogeochemical cycles in the sea. Plenum.
CASSIE, R. M. 1962. Microdistribution and other error com- ponents of 14C primary production estimates. Limnol. Oceanogr. 7: 12 l-l 30.
CHAMBERLIN, W.S.,C.R. BOOTH, D.A. KIEFER, J.H.MoRRow, AND R. C. MURPHY. 1990. Evidence for a simple rela- tionship between natural fluorescence, photosynthesis and chlorophyll in the sea. Deep-Sea Res. 37: 95 l-973.
-,AND J. MARFU. 1992. Estimation of photosynthetic rate from measurements of natural fluorescence: Analysis of the effects on light and temperature. Deep-Sea Res. 39: 1695-l 706.
CLEVELAND, J. S.,J. PERRY, D. A. KIEFER, AND M. C. TALBOT. 1989. Maximum quantum yield of photosynthesis in the northwest Sargasso Sea. J. Mar. Rcs. 47: 869-886.
C~TB, B., AND T. PLATT. 1984. Utility of the light saturation curve as an operational model for quantifying the effects of environmental conditions on phytoplankton photosynthe- sis. Mar. Ecol. Prog. Ser. 18: 57-66.
FALKOWSKI, P. G., AND Z. KOLBER. 1993. Estimation of phy- toplankton photosynthesis by active fluorescence. ICES Mar. Sci. Symp. 197, p. 92-103.
KISHINO, M., S. SUGIHARA, AND N. OKAMI. 1984a. Influence of fluorescence of chlorophyll a on underwater upward ir- radiance spectra. La Mer 22: 224-232.
-,AND- . 1984b. Estimation of quantum yield of chlorophyll a fluorescence from the upward irra- diance spectrum in the sea. La Mcr 22: 233-240.
KOLBER, Z., AND P. G. FALKOWSKI. 1993. Use of active flu- orescence to stimulate phytoplankton photosynthesis in situ. Limnol. Oceanogr. 38: 1646- 166 5.
-, K.D. WYMAN,AND P.G. FALKOWSKI. 1990. Natural variability in photosynthetic energy conversion efficiency: A held study in the Gulf of Maine. Limnol. Oceanogr. 35: 72-79.
LIGNELL, R. 1992. Problems in filtration fractionation of r4C primary productivity samples. Limnol. Oceanogr. 37: 172- 178.
LIZOTTE, M. P., AND J. PRISCU. 1994. Natural fluorescence and quantum yields in vertically stationary phytoplankton from perennially ice-covered lakes. Limnol. Oceanogr. 39: 1399- 1410.
FITZWATER, S. E., G. A. KNAUER, AND J. H. MARTIN. 1982. Metal contamination and its effect on primary production measurements. Limnol. Oceanogr. 27: 544-55 1.
GEIDER, R. J., R. M. GREENE, Z. KOLBER, H. L. MACINTYRE, AND P. G. FALKOWSKI. 1993. Fluorescence assessment of the maximum quantum efficiency of photosynthesis in the western North Atlantic. Deep-Sea Res. 40: 1205-1224.
-, AND B. A. OSBORNE. 1992. Algal photosynthesis. Chapman and Hall.
MASKE, H., AND E. GARCIA-MENDOZA. 1994. Adsorption of dissolved organic matter to the inorganic filter substrate and its implications for r4C uptake measurements. Appl. Environ. Microbial. 60: 3887-3897.
PEGAU, W. S., AND J. R. ZANEVELD. 1993. Tcmperature-de- pendent absorption of water in the red and near-infrared portions of the spectrum. Limnol. Oceanogr. 38: 188-l 92.
PETERSON, B. J. 1980. Aquatic primary production and the 14C-C02 method: A history of the problem. Annu. Rev. Syst. Ecol. 11: 359-385.
GOWER, J. F., AND G. BORSTAD. 198 1. Use of the in vivo fluorescence line at 685 nm for remote sensing surveys of surface chlorophyll a, p. 329-338. In J. F. Cower [cd.], Oceanography from the space. Plenum.
HAARDT, H., AND H. MASKE. 1986. Variability of excitation-, emision- and absorption-spectra normalized to the chlo-
PLATT T. ,C. L. GALLEGOS,AND W .G.HARRISON. 1980. Pho- toinhibition of photosynthesis in natural assemblages of marine phytoplankton. J. Mar. Res. 38: 687-701.
RICHARDSON, K. 199 1. Comparison of 14C primary production determinations made by different laboratories. Mar. Ecol. Prog. Ser. 72: 189-201.
STEEMANN NIELSEN, E. 1952. The use of radioactive carbon
1709

1710 Garcia-Mendoza and Maske
(C14) for measuring organic production in the sea. J. Cons. Cons. Int. Explor. Mer 18: 117-140.
STEGMANN, P.M.,M.R. LEWIS,C.O.DAVIS,AND J.J. CULLEN. 1992. Primary production estimates from recordings of solar-stimulates fluorescence in the equatorial Pacific at 15O”W. J. Geophys. Res. 97: 627-638.
STRICKLAND, J. D. H., AND T. R. PARSONS. 1972. A practical handbook of seawater analysis, 2nd cd. Bull. Fish. Rcs. Bd. Can. 167.
SYBRANDY, A. L., AND P. P. NIILER. 199 1. The WOCE/TOGA
SUP Lagrangian Driffter construction manual. Univ. Calif. Scripps Inst. Oceanogr. Ref. 9 l/6.
WATERS, K. J., AND R. C. SMITH. 1994. Phytoplankton pro- duction in the Sargasso Sea as determined using optical mooring data. J. Gcophys. Res. 99: 18,385-18,402.
Submitted: 22 May 1995 Accepted: 2 July 1996
Amended: 21 October 1996
Copyright © 2022 FDOKUMEN