The relationship between training status, blood pressure and uric acid in adults and elderly
7
RESEARCH ARTICLE Open Access The relationship between training status, blood pressure and uric acid in adults and elderly Atila Alexandre Trapé 1† , André Mourão Jacomini 1† , Jaqueline Jóice Muniz 1† , Jonas Tadeu Cau Sertorio 1† , José Eduardo Tanus-Santos 1† , Sandra Lia do Amaral 2† and Anderson Saranz Zago 2*† Abstract Background: Hypertension can be generated by a great number of mechanisms including elevated uric acid (UA) that contribute to the anion superoxide production. However, physical exercise is recommended to prevent and/or control high blood pressure (BP). The purpose of this study was to investigate the relationship between BP and UA and whether this relationship may be mediated by the functional fitness index. Methods: All participants (n = 123) performed the following tests: indirect maximal oxygen uptake (VO 2 max), AAHPERD Functional Fitness Battery Test to determine the general fitness functional index (GFFI), systolic and diastolic blood pressure (SBP and DBP), body mass index (BMI) and blood sample collection to evaluate the total- cholesterol (CHOL), LDL-cholesterol (LDL-c), HDL-cholesterol (HDL-c), triglycerides (TG), uric acid (UA), nitrite (NO2) and thiobarbituric acid reactive substances (T-BARS). After the physical, hemodynamic and metabolic evaluations, all participants were allocated into three groups according to their GFFI: G1 (regular), G2 (good) and G3 (very good). Results: Baseline blood pressure was higher in G1 when compared to G3 (+12% and +11%, for SBP and DBP, respectively, p<0.05) and the subjects who had higher values of BP also presented higher values of UA. Although UA was not different among GFFI groups, it presented a significant correlation with GFFI and VO 2 max. Also, nitrite concentration was elevated in G3 compared to G1 (140±29 μM vs 111± 29 μM, for G3 and G1, respectively, p<0.0001). As far as the lipid profile, participants in G3 presented better values of CHOL and TG when compared to those in G1. Conclusions: Taking together the findings that subjects with higher BP had elevated values of UA and lower values of nitrite, it can be suggested that the relationship between blood pressure and the oxidative stress produced by acid uric may be mediated by training status. Keywords: Blood pressure, Uric acid, Training status, Elderly, Oxidative stress, Nitric oxide Background The growing number of the elderly population and their complex health problems reveal the necessity of creating adequate health care programs. Among the elderly, the prevalence of hypertension reaches about 50% and has been considered the main risk factor for cardiovascular diseases. Therefore, the comprehension of the different mechanisms that generate hypertension is fundamental for creating strategies to control high blood pressure (BP). It has been shown that elevated uric acid (UA) can be one of the mechanisms responsible for hypertension. It is the final enzymatic and product of purine degradation in the human body and it is catalyzed by xanthine oxi- dase [1]. Some authors have shown that low mitochon- drial capacity can increase xanthine oxidase activity which will further induce UA formation, thus favouring anion superoxide (O 2 -. ) production [2] which can lead to endothelial dysfunction and vascular damage [3,4]. Elevated levels of UA can be associated with NO- scavenging, lower vasodilator response [5] and higher BP levels [6]. Accordingly, Zharikov et al. [7] showed that almost 80% of patients with pulmonary hyperten- sion had hyperuricemia. However, regular physical * Correspondence: [email protected] † Equal contributors 2 Department of Physical Education Unesp, São Paulo State University, BauruSP, Brazil Full list of author information is available at the end of the article © 2013 Trapé et al.; licensee BioMed Central Ltd. This is an Open Access article distributed under the terms of the Creative Commons Attribution License (http://creativecommons.org/licenses/by/2.0), which permits unrestricted use, distribution, and reproduction in any medium, provided the original work is properly cited. Trapé et al. BMC Cardiovascular Disorders 2013, 13:44 http://www.biomedcentral.com/1471-2261/13/44
-
Upload
independent -
Category
Documents
-
view
0 -
download
0
Transcript of The relationship between training status, blood pressure and uric acid in adults and elderly
Trapé et al. BMC Cardiovascular Disorders 2013, 13:44http://www.biomedcentral.com/1471-2261/13/44
RESEARCH ARTICLE Open Access
The relationship between training status, bloodpressure and uric acid in adults and elderlyAtila Alexandre Trapé1†, André Mourão Jacomini1†, Jaqueline Jóice Muniz1†, Jonas Tadeu Cau Sertorio1†,José Eduardo Tanus-Santos1†, Sandra Lia do Amaral2† and Anderson Saranz Zago2*†
Abstract
Background: Hypertension can be generated by a great number of mechanisms including elevated uric acid (UA)that contribute to the anion superoxide production. However, physical exercise is recommended to prevent and/orcontrol high blood pressure (BP). The purpose of this study was to investigate the relationship between BP and UAand whether this relationship may be mediated by the functional fitness index.
Methods: All participants (n = 123) performed the following tests: indirect maximal oxygen uptake (VO2max),AAHPERD Functional Fitness Battery Test to determine the general fitness functional index (GFFI), systolic anddiastolic blood pressure (SBP and DBP), body mass index (BMI) and blood sample collection to evaluate the total-cholesterol (CHOL), LDL-cholesterol (LDL-c), HDL-cholesterol (HDL-c), triglycerides (TG), uric acid (UA), nitrite (NO2)and thiobarbituric acid reactive substances (T-BARS). After the physical, hemodynamic and metabolic evaluations, allparticipants were allocated into three groups according to their GFFI: G1 (regular), G2 (good) and G3 (very good).
Results: Baseline blood pressure was higher in G1 when compared to G3 (+12% and +11%, for SBP and DBP,respectively, p<0.05) and the subjects who had higher values of BP also presented higher values of UA. AlthoughUA was not different among GFFI groups, it presented a significant correlation with GFFI and VO2max. Also, nitriteconcentration was elevated in G3 compared to G1 (140±29 μM vs 111± 29 μM, for G3 and G1, respectively,p<0.0001). As far as the lipid profile, participants in G3 presented better values of CHOL and TG when compared tothose in G1.
Conclusions: Taking together the findings that subjects with higher BP had elevated values of UA and lower valuesof nitrite, it can be suggested that the relationship between blood pressure and the oxidative stress produced byacid uric may be mediated by training status.
Keywords: Blood pressure, Uric acid, Training status, Elderly, Oxidative stress, Nitric oxide
BackgroundThe growing number of the elderly population and theircomplex health problems reveal the necessity of creatingadequate health care programs. Among the elderly, theprevalence of hypertension reaches about 50% and hasbeen considered the main risk factor for cardiovasculardiseases. Therefore, the comprehension of the differentmechanisms that generate hypertension is fundamentalfor creating strategies to control high blood pressure (BP).
* Correspondence: [email protected]†Equal contributors2Department of Physical Education Unesp, São Paulo State University,BauruSP, BrazilFull list of author information is available at the end of the article
© 2013 Trapé et al.; licensee BioMed Central LCommons Attribution License (http://creativecreproduction in any medium, provided the or
It has been shown that elevated uric acid (UA) can beone of the mechanisms responsible for hypertension. Itis the final enzymatic and product of purine degradationin the human body and it is catalyzed by xanthine oxi-dase [1]. Some authors have shown that low mitochon-drial capacity can increase xanthine oxidase activitywhich will further induce UA formation, thus favouringanion superoxide (O2
-.) production [2] which can leadto endothelial dysfunction and vascular damage [3,4].Elevated levels of UA can be associated with NO-scavenging, lower vasodilator response [5] and higherBP levels [6]. Accordingly, Zharikov et al. [7] showedthat almost 80% of patients with pulmonary hyperten-sion had hyperuricemia. However, regular physical
td. This is an Open Access article distributed under the terms of the Creativeommons.org/licenses/by/2.0), which permits unrestricted use, distribution, andiginal work is properly cited.
Trapé et al. BMC Cardiovascular Disorders 2013, 13:44 Page 2 of 7http://www.biomedcentral.com/1471-2261/13/44
exercise has been considered the major stimulus toprevent and/or control high BP [8,9]. Briefly, physicalexercise promotes an improvement in metabolic syn-drome [10], autonomic modulation (heart-rate vari-ability) [11], nitric oxide concentration and oxidativestress [4,9], lipid profile [12] and other disorders.Nevertheless, the effectiveness of regular exercise onUA content and its relationship with hypertension isstill controversial, mainly because of the differencesamong type, intensity, frequency and duration of theexercise programs found in the literature [13-15], espe-cially those related to elderly [5,14,16].In addition, the current recommendation for elderly
people has been recognized as a combination of differenttypes of exercise for maintaining physical functional fit-ness [14]. Both the American College of Sports Medicine[14] and the American Heart Association (AHA) [15,16]recommend that the exercise prescription for adultsand elderly people should include endurance, musclestrengthening as well as balance and flexibility exercise(also called multicomponent exercises).Following these recommendations, some studies com-
pared the effects of a multicomponent exercise programwith a strength exercise program [12] and with a walkingprogram [13]. These studies suggested that better resultson lipid profile can be found after a multicomponent exer-cise program compared to others. Therefore, it seems rea-sonable to suggest that results from a multicomponentfunctional fitness test are more appropriate to define train-ing status instead of the evaluation of only one componentof physical fitness, like cardiovascular capacity [12,17].Although it has been suggested that people with sed-
entary lifestyle exhibit lower mitochondrial capacity [18],there is limited evidence about the relationship amongtraining status, BP and UA. Thus, the hypothesis of thisstudy was that people with better training status couldhave lower BP and UA levels. Therefore, the purpose ofthis study was to investigate the relationship between BPand UA and whether this relationship may be mediatedby the training status.
MethodsScreeningAll the procedures were previously approved by Institu-tional Review Board of University of São Paulo / Brazil(CEP/FCFRP n°.172) and all the subjects provided writtenconsent before the beginning of experiments.The sampling plan was probabilistic and obtained in
two steps: the first one was obtained by random selectionof clusters (associations of retirees and programs linked touniversities and City Hall of Ribeirão Preto / SP) that con-stitute and reflect the heterogeneous characteristics of thewhole population. In the second, all individuals of eachcluster were invited to participate in this study, with the
same chance to be included once they met the followinginclusion criteria: subjects should be non-smoking, non-alcoholic (<3 drinks/beers per day), age between 55–70years old, non-diabetic (fasting glucose level < 100 mg/dL), should not have cardiovascular (angina, vascular dis-ease, etc.), peripheral, cerebrovascular, neurologic or psy-chiatric diseases, should have a body mass index <35,should not be under treatment with medications knownto affect glucose metabolism or renal hemodynamics, nothave maximal systolic blood pressure (SBP) > 160 mmHgand maximal diastolic blood pressure (DBP) > 100 mmHgor other medical or orthopedic conditions which couldaffect their ability to successfully participate in a physicalexercise battery test. The subject medical history and allassessments were reviewed on their first visit.Blood samples were drawn after a 12-h overnight
fasting for further analysis of lipid profile and uric acidcontent. All participants were informed to avoid fattyand hypercaloric food in the last meal before the 12-hfasting prior to blood collection.All subjects underwent a physical examination to as-
sess the body mass index (BMI) and blood pressure(BP). After that, training status was evaluated by bothindirect maximal oxygen uptake test ( _VO2 max) and a“Battery Test” proposed by the “American Alliance forHealth, Physical Education, Recreation and Dance”(AAHPERD) in order to assess the functional fitness.Baseline Testing (performed at least 24h after the last
exercise session):
a) Blood samples were used to evaluate the total-cholesterol (CHOL), low-density lipoproteincholesterol (LDL-c), high-density lipoproteincholesterol (HDL-c), triglycerides (TG) and uric acid(UA) by enzymatic-colorimetric methods (Laborlabcommercial kits, Guarulhos, São Paulo, Brazil).Whole-blood nitrite concentration (NO2) wasanalyzed with ozone-based chemiluminescence(Sievers Model 280 NO Analyzer, Sievers, Boulder,CO, USA), as previously described [19]. Plasma lipidperoxide levels were determined by measuringthiobarbituric acid reactive substances (T-BARS)using a fluorimetric method as previously described[20]. The lipoperoxide levels were expressed interms of malondialdehyde (nmol/mL).
b) Blood pressure (BP) was measured after 5 min ofrest between 7–8 am on three separate daysaccording to the VI Brazilian HypertensionGuidelines (SBH, 2010), using an aneroidsphygmomanometer adequate to the circumferenceof the arm and a stethoscope placed over thebrachial artery. The average of the three separatelyrecorded BP measurements was used as theoutcome variable on data analysis.
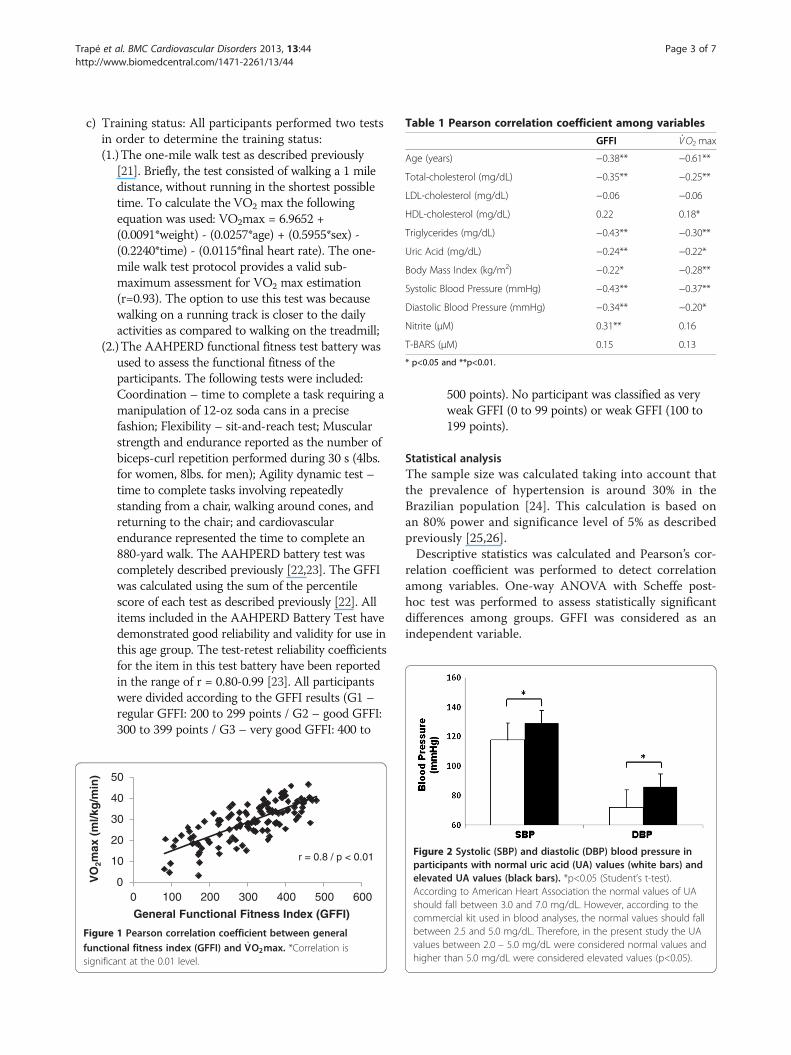
Table 1 Pearson correlation coefficient among variables
GFFI _VO2 max
Age (years) −0.38** −0.61**
Total-cholesterol (mg/dL) −0.35** −0.25**
LDL-cholesterol (mg/dL) −0.06 −0.06
HDL-cholesterol (mg/dL) 0.22 0.18*
Triglycerides (mg/dL) −0.43** −0.30**
Uric Acid (mg/dL) −0.24** −0.22*
Body Mass Index (kg/m2) −0.22* −0.28**
Systolic Blood Pressure (mmHg) −0.43** −0.37**
Diastolic Blood Pressure (mmHg) −0.34** −0.20*
Nitrite (μM) 0.31** 0.16
T-BARS (μM) 0.15 0.13
* p<0.05 and **p<0.01.
Trapé et al. BMC Cardiovascular Disorders 2013, 13:44 Page 3 of 7http://www.biomedcentral.com/1471-2261/13/44
c) Training status: All participants performed two testsin order to determine the training status:(1.)The one-mile walk test as described previously
[21]. Briefly, the test consisted of walking a 1 miledistance, without running in the shortest possibletime. To calculate the VO2 max the followingequation was used: VO2max = 6.9652 +(0.0091*weight) - (0.0257*age) + (0.5955*sex) -(0.2240*time) - (0.0115*final heart rate). The one-mile walk test protocol provides a valid sub-maximum assessment for VO2 max estimation(r=0.93). The option to use this test was becausewalking on a running track is closer to the dailyactivities as compared to walking on the treadmill;
(2.)The AAHPERD functional fitness test battery wasused to assess the functional fitness of theparticipants. The following tests were included:Coordination – time to complete a task requiring amanipulation of 12-oz soda cans in a precisefashion; Flexibility – sit-and-reach test; Muscularstrength and endurance reported as the number ofbiceps-curl repetition performed during 30 s (4lbs.for women, 8lbs. for men); Agility dynamic test –time to complete tasks involving repeatedlystanding from a chair, walking around cones, andreturning to the chair; and cardiovascularendurance represented the time to complete an880-yard walk. The AAHPERD battery test wascompletely described previously [22,23]. The GFFIwas calculated using the sum of the percentilescore of each test as described previously [22]. Allitems included in the AAHPERD Battery Test havedemonstrated good reliability and validity for use inthis age group. The test-retest reliability coefficientsfor the item in this test battery have been reportedin the range of r = 0.80-0.99 [23]. All participantswere divided according to the GFFI results (G1 –regular GFFI: 200 to 299 points / G2 – good GFFI:300 to 399 points / G3 – very good GFFI: 400 to
0
10
20
30
40
50
0 100 200 300 400 500 600
VO
2max
(m
l/kg
/min
)
General Functional Fitness Index (GFFI)
r = 0.8 / p < 0.01
Figure 1 Pearson correlation coefficient between generalfunctional fitness index (GFFI) and _VO2max. *Correlation issignificant at the 0.01 level.
FiguparelevAccshocombetwvaluhigh
500 points). No participant was classified as veryweak GFFI (0 to 99 points) or weak GFFI (100 to199 points).
Statistical analysisThe sample size was calculated taking into account thatthe prevalence of hypertension is around 30% in theBrazilian population [24]. This calculation is based onan 80% power and significance level of 5% as describedpreviously [25,26].Descriptive statistics was calculated and Pearson’s cor-
relation coefficient was performed to detect correlationamong variables. One-way ANOVA with Scheffe post-hoc test was performed to assess statistically significantdifferences among groups. GFFI was considered as anindependent variable.
re 2 Systolic (SBP) and diastolic (DBP) blood pressure inticipants with normal uric acid (UA) values (white bars) andated UA values (black bars). *p<0.05 (Student’s t-test).ording to American Heart Association the normal values of UAuld fall between 3.0 and 7.0 mg/dL. However, according to themercial kit used in blood analyses, the normal values should falleen 2.5 and 5.0 mg/dL. Therefore, in the present study the UAes between 2.0 – 5.0 mg/dL were considered normal values ander than 5.0 mg/dL were considered elevated values (p<0.05).
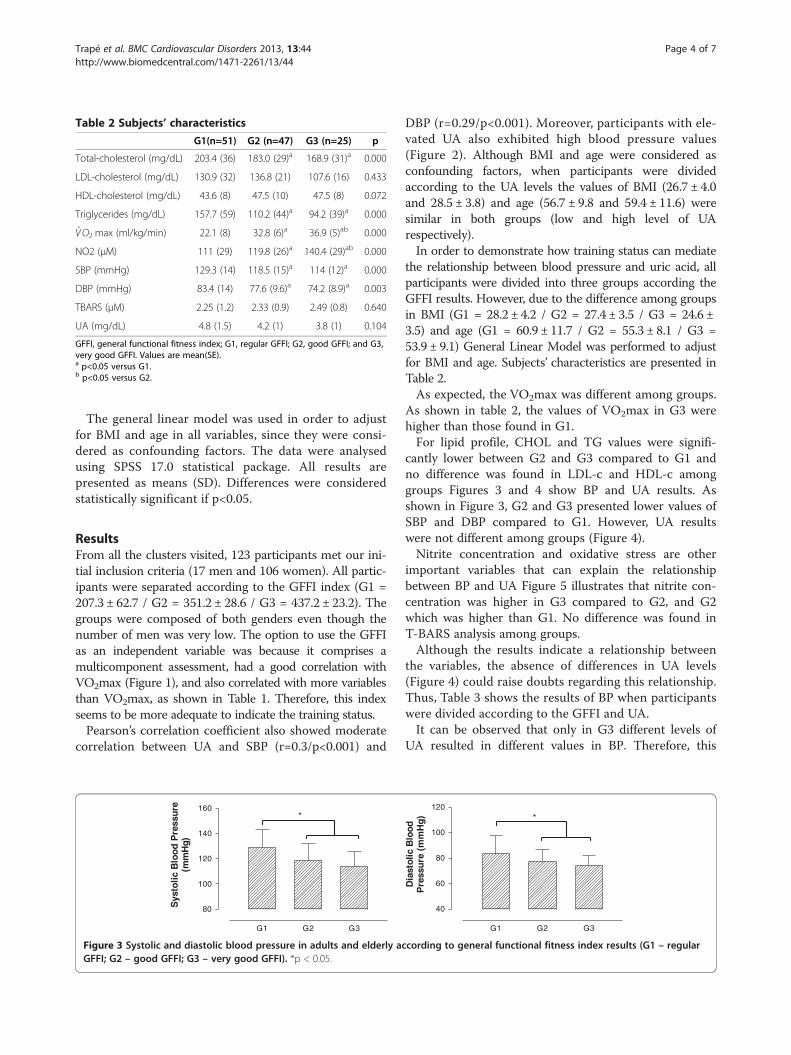
Table 2 Subjects’ characteristics
G1(n=51) G2 (n=47) G3 (n=25) p
Total-cholesterol (mg/dL) 203.4 (36) 183.0 (29)a 168.9 (31)a 0.000
LDL-cholesterol (mg/dL) 130.9 (32) 136.8 (21) 107.6 (16) 0.433
HDL-cholesterol (mg/dL) 43.6 (8) 47.5 (10) 47.5 (8) 0.072
Triglycerides (mg/dL) 157.7 (59) 110.2 (44)a 94.2 (39)a 0.000
_VO2 max (ml/kg/min) 22.1 (8) 32.8 (6)a 36.9 (5)ab 0.000
NO2 (μM) 111 (29) 119.8 (26)a 140.4 (29)ab 0.000
SBP (mmHg) 129.3 (14) 118.5 (15)a 114 (12)a 0.000
DBP (mmHg) 83.4 (14) 77.6 (9.6)a 74.2 (8.9)a 0.003
TBARS (μM) 2.25 (1.2) 2.33 (0.9) 2.49 (0.8) 0.640
UA (mg/dL) 4.8 (1.5) 4.2 (1) 3.8 (1) 0.104
GFFI, general functional fitness index; G1, regular GFFI; G2, good GFFI; and G3,very good GFFI. Values are mean(SE).a p<0.05 versus G1.b p<0.05 versus G2.
Trapé et al. BMC Cardiovascular Disorders 2013, 13:44 Page 4 of 7http://www.biomedcentral.com/1471-2261/13/44
The general linear model was used in order to adjustfor BMI and age in all variables, since they were consi-dered as confounding factors. The data were analysedusing SPSS 17.0 statistical package. All results arepresented as means (SD). Differences were consideredstatistically significant if p<0.05.
ResultsFrom all the clusters visited, 123 participants met our ini-tial inclusion criteria (17 men and 106 women). All partic-ipants were separated according to the GFFI index (G1 =207.3 ± 62.7 / G2 = 351.2 ± 28.6 / G3 = 437.2 ± 23.2). Thegroups were composed of both genders even though thenumber of men was very low. The option to use the GFFIas an independent variable was because it comprises amulticomponent assessment, had a good correlation withVO2max (Figure 1), and also correlated with more variablesthan VO2max, as shown in Table 1. Therefore, this indexseems to be more adequate to indicate the training status.Pearson’s correlation coefficient also showed moderate
correlation between UA and SBP (r=0.3/p<0.001) and
G1 G2 G3
80
100
120
140
160*
Sys
tolic
Blo
od P
ress
ure
(mm
Hg)
Figure 3 Systolic and diastolic blood pressure in adults and elderly acGFFI; G2 – good GFFI; G3 – very good GFFI). *p < 0.05.
DBP (r=0.29/p<0.001). Moreover, participants with ele-vated UA also exhibited high blood pressure values(Figure 2). Although BMI and age were considered asconfounding factors, when participants were dividedaccording to the UA levels the values of BMI (26.7 ± 4.0and 28.5 ± 3.8) and age (56.7 ± 9.8 and 59.4 ± 11.6) weresimilar in both groups (low and high level of UArespectively).In order to demonstrate how training status can mediate
the relationship between blood pressure and uric acid, allparticipants were divided into three groups according theGFFI results. However, due to the difference among groupsin BMI (G1 = 28.2 ± 4.2 / G2 = 27.4 ± 3.5 / G3 = 24.6 ±3.5) and age (G1 = 60.9 ± 11.7 / G2 = 55.3 ± 8.1 / G3 =53.9 ± 9.1) General Linear Model was performed to adjustfor BMI and age. Subjects’ characteristics are presented inTable 2.As expected, the VO2max was different among groups.
As shown in table 2, the values of VO2max in G3 werehigher than those found in G1.For lipid profile, CHOL and TG values were signifi-
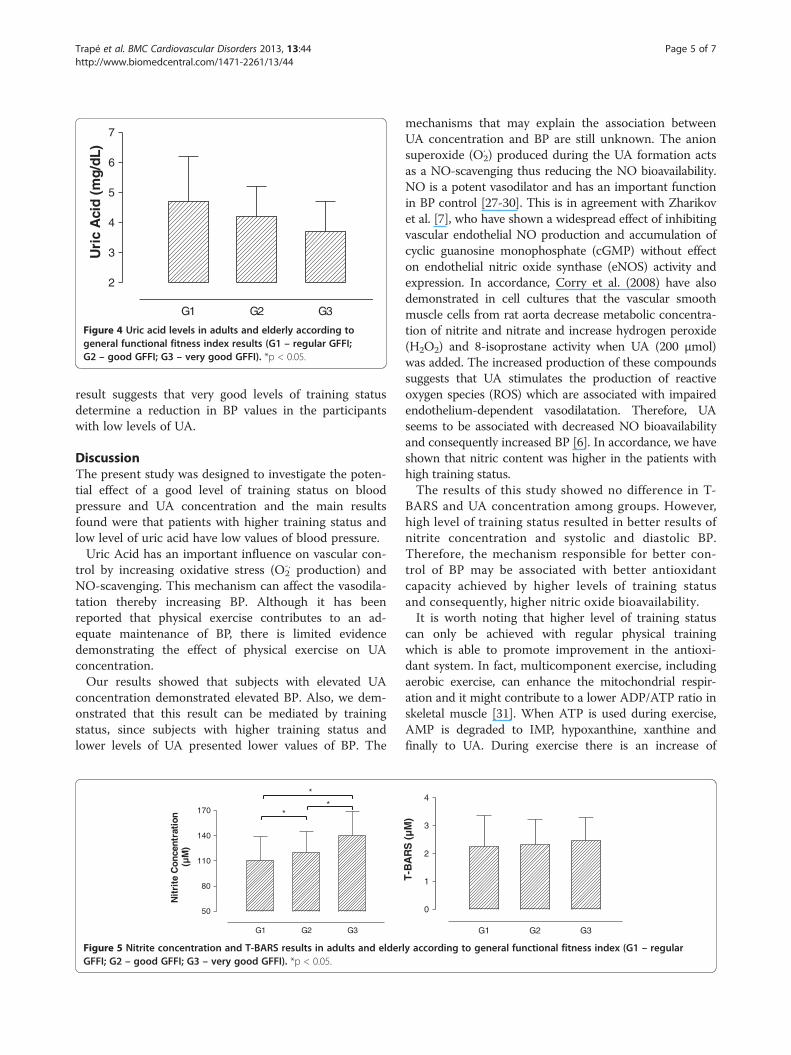
cantly lower between G2 and G3 compared to G1 andno difference was found in LDL-c and HDL-c amonggroups Figures 3 and 4 show BP and UA results. Asshown in Figure 3, G2 and G3 presented lower values ofSBP and DBP compared to G1. However, UA resultswere not different among groups (Figure 4).Nitrite concentration and oxidative stress are other
important variables that can explain the relationshipbetween BP and UA Figure 5 illustrates that nitrite con-centration was higher in G3 compared to G2, and G2which was higher than G1. No difference was found inT-BARS analysis among groups.Although the results indicate a relationship between
the variables, the absence of differences in UA levels(Figure 4) could raise doubts regarding this relationship.Thus, Table 3 shows the results of BP when participantswere divided according to the GFFI and UA.It can be observed that only in G3 different levels of
UA resulted in different values in BP. Therefore, this
G1 G2 G3
40
60
80
100
120*
Dia
stol
ic B
lood
Pre
ssu
re (
mm
Hg)
cording to general functional fitness index results (G1 – regular
G1 G2 G3
2
3
4
5
6
7
Uri
c A
cid
(mg/
dL)
Figure 4 Uric acid levels in adults and elderly according togeneral functional fitness index results (G1 – regular GFFI;G2 – good GFFI; G3 – very good GFFI). *p < 0.05.
Trapé et al. BMC Cardiovascular Disorders 2013, 13:44 Page 5 of 7http://www.biomedcentral.com/1471-2261/13/44
result suggests that very good levels of training statusdetermine a reduction in BP values in the participantswith low levels of UA.
DiscussionThe present study was designed to investigate the poten-tial effect of a good level of training status on bloodpressure and UA concentration and the main resultsfound were that patients with higher training status andlow level of uric acid have low values of blood pressure.Uric Acid has an important influence on vascular con-
trol by increasing oxidative stress (O2-. production) and
NO-scavenging. This mechanism can affect the vasodila-tation thereby increasing BP. Although it has beenreported that physical exercise contributes to an ad-equate maintenance of BP, there is limited evidencedemonstrating the effect of physical exercise on UAconcentration.Our results showed that subjects with elevated UA
concentration demonstrated elevated BP. Also, we dem-onstrated that this result can be mediated by trainingstatus, since subjects with higher training status andlower levels of UA presented lower values of BP. The
G1 G2 G3
50
80
110
140
170
*
**
Nit
rite
Con
cent
rati
on(µ
M)
Figure 5 Nitrite concentration and T-BARS results in adults and elderGFFI; G2 – good GFFI; G3 – very good GFFI). *p < 0.05.
mechanisms that may explain the association betweenUA concentration and BP are still unknown. The anionsuperoxide (O2
· ) produced during the UA formation actsas a NO-scavenging thus reducing the NO bioavailability.NO is a potent vasodilator and has an important functionin BP control [27-30]. This is in agreement with Zharikovet al. [7], who have shown a widespread effect of inhibitingvascular endothelial NO production and accumulation ofcyclic guanosine monophosphate (cGMP) without effecton endothelial nitric oxide synthase (eNOS) activity andexpression. In accordance, Corry et al. (2008) have alsodemonstrated in cell cultures that the vascular smoothmuscle cells from rat aorta decrease metabolic concentra-tion of nitrite and nitrate and increase hydrogen peroxide(H2O2) and 8-isoprostane activity when UA (200 μmol)was added. The increased production of these compoundssuggests that UA stimulates the production of reactiveoxygen species (ROS) which are associated with impairedendothelium-dependent vasodilatation. Therefore, UAseems to be associated with decreased NO bioavailabilityand consequently increased BP [6]. In accordance, we haveshown that nitric content was higher in the patients withhigh training status.The results of this study showed no difference in T-
BARS and UA concentration among groups. However,high level of training status resulted in better results ofnitrite concentration and systolic and diastolic BP.Therefore, the mechanism responsible for better con-trol of BP may be associated with better antioxidantcapacity achieved by higher levels of training statusand consequently, higher nitric oxide bioavailability.It is worth noting that higher level of training status
can only be achieved with regular physical trainingwhich is able to promote improvement in the antioxi-dant system. In fact, multicomponent exercise, includingaerobic exercise, can enhance the mitochondrial respir-ation and it might contribute to a lower ADP/ATP ratio inskeletal muscle [31]. When ATP is used during exercise,AMP is degraded to IMP, hypoxanthine, xanthine andfinally to UA. During exercise there is an increase of
G1 G2 G3
0
1
2
3
4
T-B
AR
S (
µM
)
ly according to general functional fitness index (G1 – regular
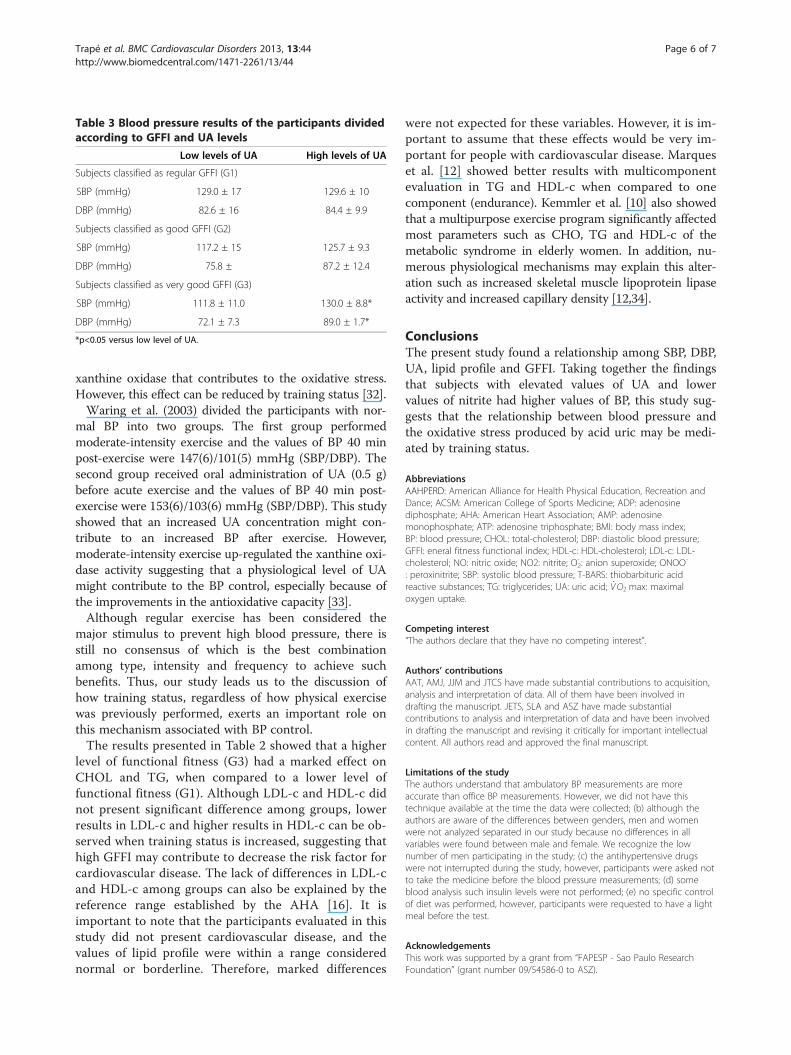
Table 3 Blood pressure results of the participants dividedaccording to GFFI and UA levels
Low levels of UA High levels of UA
Subjects classified as regular GFFI (G1)
SBP (mmHg) 129.0 ± 17 129.6 ± 10
DBP (mmHg) 82.6 ± 16 84.4 ± 9.9
Subjects classified as good GFFI (G2)
SBP (mmHg) 117.2 ± 15 125.7 ± 9.3
DBP (mmHg) 75.8 ± 87.2 ± 12.4
Subjects classified as very good GFFI (G3)
SBP (mmHg) 111.8 ± 11.0 130.0 ± 8.8*
DBP (mmHg) 72.1 ± 7.3 89.0 ± 1.7*
*p<0.05 versus low level of UA.
Trapé et al. BMC Cardiovascular Disorders 2013, 13:44 Page 6 of 7http://www.biomedcentral.com/1471-2261/13/44
xanthine oxidase that contributes to the oxidative stress.However, this effect can be reduced by training status [32].Waring et al. (2003) divided the participants with nor-
mal BP into two groups. The first group performedmoderate-intensity exercise and the values of BP 40 minpost-exercise were 147(6)/101(5) mmHg (SBP/DBP). Thesecond group received oral administration of UA (0.5 g)before acute exercise and the values of BP 40 min post-exercise were 153(6)/103(6) mmHg (SBP/DBP). This studyshowed that an increased UA concentration might con-tribute to an increased BP after exercise. However,moderate-intensity exercise up-regulated the xanthine oxi-dase activity suggesting that a physiological level of UAmight contribute to the BP control, especially because ofthe improvements in the antioxidative capacity [33].Although regular exercise has been considered the
major stimulus to prevent high blood pressure, there isstill no consensus of which is the best combinationamong type, intensity and frequency to achieve suchbenefits. Thus, our study leads us to the discussion ofhow training status, regardless of how physical exercisewas previously performed, exerts an important role onthis mechanism associated with BP control.The results presented in Table 2 showed that a higher
level of functional fitness (G3) had a marked effect onCHOL and TG, when compared to a lower level offunctional fitness (G1). Although LDL-c and HDL-c didnot present significant difference among groups, lowerresults in LDL-c and higher results in HDL-c can be ob-served when training status is increased, suggesting thathigh GFFI may contribute to decrease the risk factor forcardiovascular disease. The lack of differences in LDL-cand HDL-c among groups can also be explained by thereference range established by the AHA [16]. It isimportant to note that the participants evaluated in thisstudy did not present cardiovascular disease, and thevalues of lipid profile were within a range considerednormal or borderline. Therefore, marked differences
were not expected for these variables. However, it is im-portant to assume that these effects would be very im-portant for people with cardiovascular disease. Marqueset al. [12] showed better results with multicomponentevaluation in TG and HDL-c when compared to onecomponent (endurance). Kemmler et al. [10] also showedthat a multipurpose exercise program significantly affectedmost parameters such as CHO, TG and HDL-c of themetabolic syndrome in elderly women. In addition, nu-merous physiological mechanisms may explain this alter-ation such as increased skeletal muscle lipoprotein lipaseactivity and increased capillary density [12,34].
ConclusionsThe present study found a relationship among SBP, DBP,UA, lipid profile and GFFI. Taking together the findingsthat subjects with elevated values of UA and lowervalues of nitrite had higher values of BP, this study sug-gests that the relationship between blood pressure andthe oxidative stress produced by acid uric may be medi-ated by training status.
AbbreviationsAAHPERD: American Alliance for Health Physical Education, Recreation andDance; ACSM: American College of Sports Medicine; ADP: adenosinediphosphate; AHA: American Heart Association; AMP: adenosinemonophosphate; ATP: adenosine triphosphate; BMI: body mass index;BP: blood pressure; CHOL: total-cholesterol; DBP: diastolic blood pressure;GFFI: eneral fitness functional index; HDL-c: HDL-cholesterol; LDL-c: LDL-cholesterol; NO: nitric oxide; NO2: nitrite; O2
- : anion superoxide; ONOO-
: peroxinitrite; SBP: systolic blood pressure; T-BARS: thiobarbituric acidreactive substances; TG: triglycerides; UA: uric acid; _VO2 max: maximaloxygen uptake.
Competing interest“The authors declare that they have no competing interest”.
Authors’ contributionsAAT, AMJ, JJM and JTCS have made substantial contributions to acquisition,analysis and interpretation of data. All of them have been involved indrafting the manuscript. JETS, SLA and ASZ have made substantialcontributions to analysis and interpretation of data and have been involvedin drafting the manuscript and revising it critically for important intellectualcontent. All authors read and approved the final manuscript.
Limitations of the studyThe authors understand that ambulatory BP measurements are moreaccurate than office BP measurements. However, we did not have thistechnique available at the time the data were collected; (b) although theauthors are aware of the differences between genders, men and womenwere not analyzed separated in our study because no differences in allvariables were found between male and female. We recognize the lownumber of men participating in the study; (c) the antihypertensive drugswere not interrupted during the study, however, participants were asked notto take the medicine before the blood pressure measurements; (d) someblood analysis such insulin levels were not performed; (e) no specific controlof diet was performed, however, participants were requested to have a lightmeal before the test.
AcknowledgementsThis work was supported by a grant from “FAPESP - Sao Paulo ResearchFoundation” (grant number 09/54586-0 to ASZ).
Trapé et al. BMC Cardiovascular Disorders 2013, 13:44 Page 7 of 7http://www.biomedcentral.com/1471-2261/13/44
Author details1Faculty of Medicine, University of São Paulo, Ribeirão Preto, SP, Brazil.2Department of Physical Education Unesp, São Paulo State University,BauruSP, Brazil.
Received: 2 October 2012 Accepted: 17 June 2013Published: 21 June 2013
References1. Mitsuhashi H, Yatsuya H, Matsushita K, Zhang H, Otsuka R, Muramatsu T,
Takefuji S, Hotta Y, Kondo T, Murohara T, et al: Uric acid and left ventricularhypertrophy in Japanese men. Circ J 2009, 73(4):667–672.
2. Sjodin B, Hellsten Westing Y, Apple FS: Biochemical mechanisms foroxygen free radical formation during exercise. Sports Med 1990,10(4):236–254.
3. Rush JW, Green HJ, Maclean DA, Code LM: Oxidative stress and nitricoxide synthase in skeletal muscles of rats with post-infarction,compensated chronic heart failure. Acta Physiol Scand 2005,185(3):211–218.
4. Touyz RM, Schiffrin EL: Reactive oxygen species in vascular biology:implications in hypertension. Histochem Cell Biol 2004, 122(4):339–352.
5. Balda CA, Plavnik FL, Tavares A: Uric acid and systemic arterialhypertension: evidences and controversies. J Bras Nefrol 2002,24(3):147–152.
6. Corry DB, Eslami P, Yamamoto K, Nyby MD, Makino H, Tuck ML: Uric acidstimulates vascular smooth muscle cell proliferation and oxidative stressvia the vascular renin-angiotensin system. J Hypertens 2008,26(2):269–275.
7. Zharikov S, Krotova K, Hu H, Baylis C, Johnson RJ, Block ER, Patel J: Uric aciddecreases NO production and increases arginase activity in culturedpulmonary artery endothelial cells. Am J Physiol Cell Physiol 2008,295(5):C1183–C1190.
8. Sassen B, Kok G, Schaalma H, Kiers H, Vanhees L: Cardiovascular risk profile:cross-sectional analysis of motivational determinants, physical fitnessand physical activity. BMC Public Health 2010, 10:592.
9. Zago AS, Park JY, Fenty-Stewart N, Kokubun E, Brown MD: Effects ofaerobic exercise on the blood pressure, oxidative stress and eNOS genepolymorphism in pre-hypertensive older people. Eur J Appl Physiol 2010,110(4):825–832.
10. Kemmler W, Von Stengel S, Engelke K, Kalender WA: Exercise decreases therisk of metabolic syndrome in elderly females. Med Sci Sports Exerc 2009,41(2):297–305.
11. Cornelissen VA, Verheyden B, Aubert AE, Fagard RH: Effects of aerobictraining intensity on resting, exercise and post-exercise blood pressure,heart rate and heart-rate variability. J Hum Hypertens 2009, 24(3):82–175.
12. Marques E, Carvalho J, Soares JM, Marques F, Mota J: Effects of resistanceand multicomponent exercise on lipid profiles of older women. Maturitas2009, 63(1):84–88.
13. Aidar FJ, de Oliveira RJ, Silva AJ, de Matos DG, Carneiro AL, Garrido N,Hickner RC, Reis VM: The influence of the level of physical activity andhuman development in the quality of life in survivors of stroke.Health Qual Life Outcomes 2011, 9:89.
14. Chodzko-Zajko WJ, Proctor DN, Fiatarone Singh MA, Minson CT, Nigg CR,Salem GJ, Skinner JS: American College of Sports Medicine position stand.Exercise and physical activity for older adults. Med Sci Sports Exerc 2009,41(7):1510–1530.
15. Haskell WL, Lee IM, Pate RR, Powell KE, Blair SN, Franklin BA, Macera CA,Heath GW, Thompson PD, Bauman A: Physical activity and public health:updated recommendation for adults from the American College ofSports Medicine and the American Heart Association. Circulation 2007,116(9):1081–1093.
16. AHA: Detection, Evaluation, and Treatment of High Blood, Cholesterol inAdults (Adult Treatment Panel III), Third Report of the NationalCholesterol Education Program (NCEP). Circulation 2002, 106:3143–3421.
17. Carvalho MJ, Marques E, Mota J: Training and detraining effects onfunctional fitness after a multicomponent training in older women.Gerontology 2009, 55(1):41–48.
18. Maughan R, Gleeson M, Greenhaff PL: Biochemistry of exercise and training,1a edn. São Paulo /. Manole: Brazil; 2000.
19. Metzger IF, Sertorio JT, Tanus-Santos JE: Modulation of nitric oxideformation by endothelial nitric oxide synthase gene haplotypes.Free Radic Biol Med 2007, 43(6):987–992.
20. Gomes VA, Casella-Filho A, Chagas AC, Tanus-Santos JE: Enhancedconcentrations of relevant markers of nitric oxide formation afterexercise training in patients with metabolic syndrome. Nitric Oxide 2008,19(4):345–350.
21. Kline GM, Porcari JP, Hintermeister R, Freedson PS, Ward A, McCarron RF,Ross J, Rippe JM: Estimation of VO2max from a one-mile track walk,gender, age, and body weight. Med Sci Sports Exerc 1987, 19(3):253–259.
22. Zago AS, Gobbi S: Valores Normativos da aptidão funcional de mulheresde 60 a 70 anos. Revista Brasileira de Ciênicas e Movimento 2003,11(2):77–86.
23. Osness WH: The AAHPERD Fitness Task Force: History and Phylosophy.JOPERD 1989, 60(3):64–65.
24. SBH SBdH: Diretrizes Brasileiras de Hipertensão V. Hipertensão 2010,13(1):1–66.
25. Hsieh FY, Bloch DA, Larsen MD: A simple method of sample sizecalculation for linear and logistic regression. Stat Med 1998,17(14):1623–1634.
26. Singer J: Estimating sample size for continuous outcomes, comparingmore than two parallel groups with unequal sizes. Stat Med 1997,16(24):2805–2811.
27. Moncada S, Palmer RM, Higgs EA: Nitric oxide: physiology,pathophysiology, and pharmacology. Pharmacol Rev 1991, 43(2):109–142.
28. Schulz R, Triggle CR: Role of NO in vascular smooth muscle and cardiacmuscle function. Trends Pharmacol Sci 1994, 15(7):255–259.
29. Darley-Usmar V, Wiseman H, Halliwell B: Nitric oxide and oxygen radicals: aquestion of balance. FEBS Lett 1995, 369(2–3):131–135.
30. Moncada S: Nitric oxide in the vasculature: physiology andpathophysiology. Ann N Y Acad Sci 1997, 811:60–67. discussion 67–69.
31. Silveira LR, Fiamoncini J, Hirabara SM, Procopio J, Cambiaghi TD, PinheiroCH, Lopes LR, Curi R: Updating the effects of fatty acids on skeletalmuscle. J Cell Physiol 2008, 217(1):1–12.
32. Hellsten Y: The role of xanthine oxidase in exercise. Amsterdan Elsevier:Elsevier; 2000.
33. Waring WS, Convery A, Mishra V, Shenkin A, Webb DJ, Maxwell SR: Uric acidreduces exercise-induced oxidative stress in healthy adults. Clin Sci (Lond)2003, 105(4):425–430.
34. Durstine JL, Grandjean PW, Davis PG, Ferguson MA, Alderson NL, DuBoseKD: Blood lipid and lipoprotein adaptations to exercise: a quantitativeanalysis. Sports Med 2001, 31(15):1033–1062.
doi:10.1186/1471-2261-13-44Cite this article as: Trapé et al.: The relationship between training status,blood pressure and uric acid in adults and elderly. BMC CardiovascularDisorders 2013 13:44.
Submit your next manuscript to BioMed Centraland take full advantage of:
• Convenient online submission
• Thorough peer review
• No space constraints or color figure charges
• Immediate publication on acceptance
• Inclusion in PubMed, CAS, Scopus and Google Scholar
• Research which is freely available for redistribution
Submit your manuscript at www.biomedcentral.com/submit