The Relationship Between Labor Market Structure and Clergy Compensation in Protestant Denominations
11
The Relationship Between Labor Market Structure and Clergy Compensation in Protestant Denominations Becky Roselius Haney Published online: 28 November 2007 # International Atlantic Economic Society 2007 Abstract Many recent economic studies have shown that traditional economic theory applies to nontraditional settings such as religious organizations. This paper contrasts two labor markets for clergy that result from different denominational polities to examine the impact of labor market structure on clergy compensation in Protestant denominations. Many Protestant churches operate autonomously and clergy and congregations negotiate contracts in a free market. However, in a distinct sub-group of Protestant denominations there is involvement by denominational hierarchy in order to raise the level of clergy compensation and benefits. Regression analysis using a unique, random sample of US clergy suggests that different labor market structures result in economically important and statistically significant differences in the distributions of clergy salaries and benefits. Keywords Labor markets . Economic analysis of religion . Economic justice JEL Classification I30 . J31 . J42 . L14 . L22 . Z12 Introduction Many recent economic studies have shown direct application of economic theory to non-traditional settings such as religious organizations. Anderson (1988) examines individual religious behavior and applies the economic theory of the firm to church organizations, in particular their monopoly power and franchise structure. Ekelund et al. (1996) views the operation of the Catholic Church in the medieval period through an economic lens and explains some of its behavior, including their selling of indulgences, as a response to economic incentives. Iannacconne (1998) provides Atl Econ J (2008) 36:65–75 DOI 10.1007/s11293-007-9090-x B. R. Haney (*) Oklahoma City University, Meinders School of Business, Oklahoma City, OK 73106, USA e-mail: [email protected]
Transcript of The Relationship Between Labor Market Structure and Clergy Compensation in Protestant Denominations
The Relationship Between Labor Market Structureand Clergy Compensation in Protestant Denominations
Becky Roselius Haney
Published online: 28 November 2007# International Atlantic Economic Society 2007
Abstract Many recent economic studies have shown that traditional economictheory applies to nontraditional settings such as religious organizations. This papercontrasts two labor markets for clergy that result from different denominationalpolities to examine the impact of labor market structure on clergy compensation inProtestant denominations. Many Protestant churches operate autonomously andclergy and congregations negotiate contracts in a free market. However, in a distinctsub-group of Protestant denominations there is involvement by denominationalhierarchy in order to raise the level of clergy compensation and benefits. Regressionanalysis using a unique, random sample of US clergy suggests that different labormarket structures result in economically important and statistically significantdifferences in the distributions of clergy salaries and benefits.
Keywords Labor markets . Economic analysis of religion . Economic justice
JEL Classification I30 . J31 . J42 . L14 . L22 . Z12
Introduction
Many recent economic studies have shown direct application of economic theory tonon-traditional settings such as religious organizations. Anderson (1988) examinesindividual religious behavior and applies the economic theory of the firm to churchorganizations, in particular their monopoly power and franchise structure. Ekelund etal. (1996) views the operation of the Catholic Church in the medieval period throughan economic lens and explains some of its behavior, including their selling ofindulgences, as a response to economic incentives. Iannacconne (1998) provides
Atl Econ J (2008) 36:65–75DOI 10.1007/s11293-007-9090-x
B. R. Haney (*)Oklahoma City University, Meinders School of Business, Oklahoma City, OK 73106, USAe-mail: [email protected]
perhaps the most comprehensive review of the application of economic theory toexplain a wide spectrum of religious behavior, including the behavior of churchesand the operation of religious markets.
Additionally, economists, as well as sociologists and theologians have questionedhow appropriate it is for religious institutions to utilize a free market withoutreflection, citing the potential for negative distributional consequences (Paul 1964;Carroll and Wilson 1980; DeLeers 1991; Blank 1992; Halteman 1995; Zech et al.1996; National Conference of Catholic Bishops 1997; Daly 1999; Sedgwick 1999;Hicks 2000; Strandjord 2000; Long 2000; Price 2001; Hotchkiss 2002; McMillan2002; McMillan and Price 2003). One particular area of concern is clergycompensation. A great disparity often exists between the highest and lowest salariesof pastors with the same education and experience. This may be due to unobservabledifferences in quality of performance, differences in context, or other reasons.However, it may reflect market failure due to the presence of monopsony in theclergy labor market.
Chang (2005, p. 10) points out the “grave asymmetry” to which pastors aresubject. Pastors are specially trained, often ordained, to serve congregations of aparticular denomination, with few, if any, alternative vocations related to their trainingavailable to them. At the same time, the congregations within their denominationhave no obligation to employ or support them. The free market for clergy leavespastors vulnerable because of the nature of their narrowly defined employmentoptions. The resulting salaries appear to reflect the asymmetrical bargaining power ofthe pastor and the congregations. Clergy salaries when determined in the free marketare typically quite low, and few clergy are provided health or retirement benefits,although a handful of clergy at the top of the distribution command much highersalaries.
While most Protestant denominations might agree that there should be concern ifthe distribution of clergy salaries that result from a free market is inherently unfair,only denominations with a centralized hierarchy are in the position to intervene inthe market in response to perceived underpayment in or unfair distribution of clergysalaries. The result is a free clergy labor market among some Protestantdenominations and a clergy labor market with hierarchical intervention in others.This paper examines the relationship between these two contrasting labor marketsand the resulting compensation outcomes of the clergy.
Background
Allen (1995) demonstrates that a spectrum of theological doctrine exists amongProtestant denominations, and that those doctrinal differences result in differentorganizational structures, or “polity”. An examination of Protestant denominationsreveals that two general categories of polities exist (National Council of theChurches of Christ in the USA 2001). Autonomous denominations have only weakties or relationships among individual congregations and no official hierarchy toanswer to. The various Baptist and Pentecostal denominations, as well as non-denominational congregations and others, reflect this polity. “Autonomy of the local
66 B.R. Haney
church” is in fact one of the tenets of traditional Baptist doctrine.1 Hierarchicaldenominations operate more as one body, with significant presence of centralizedcoordinating entities. Congregations belonging to the various Methodist, Lutheran,Episcopalian, and Presbyterian denominations as well as others reflect this polity.For the purposes of this paper, a denomination will be considered either autonomousor hierarchical.
Whether a denomination is autonomous or hierarchical affects the type of labormarket that their clergy experience. Little or no intervention into the clergy labormarket occurs in autonomous denominations. Similar to the way that the USA wasformed by independent-minded colonists pulling away from the centralized governingstructure of England, many if not most of the autonomous denominations began bypulling away from a centralized religious body and forming a denomination of looselyrelated independent congregations, with an inherent aversion toward centralizedauthority. Autonomous denominations may add central coordinating bodies, butremain reluctant to give them any power beyond informational or consultativecapacities, particularly when it comes to how much to pay the pastor (Gonzalez 1985).
Conversely, centralized coordination of the formation and deployment of clergyand clergy compensation is a key characteristic of hierarchical denominations. If acongregation belongs to a hierarchical denomination, they may not have free reignover how they pay their pastor. The central leadership of hierarchical denominationsoften attempts to influence the workings of the clergy labor market by ensuringadequate pay and benefits for pastors. Denominational hierarchies have varyingdegrees of influence over compensation, benefits, and determining where a pastorcan serve. The United Methodist Church is the largest hierarchical denomination andits clergy labor market is perhaps the most controlled of any of the Protestantdenominations. They have a strong hierarchical structure and strong sense of“connectionalism,” that is, sharing of leadership and resources among geographi-cally related local churches. The United Methodist denomination has a well-documented history of having mandated minimum clergy compensation levels,although there is continuous refinement of the process. Lawrence and Froelich(1999) describe the long and continued debate within Methodism over the trade-offbetween providing economic incentives (that is, allowing pay to vary withperformance) and providing a compensation that guarantees basic necessities.
Few other hierarchical denominations have as centralized a labor market as foundin United Methodism. However, nearly all hierarchical denominations have in placeclergy compensation guidelines or mandates that could impact the clergy labormarket. At the other end of the spectrum, autonomous Protestant denominations aredistinct from even the least interventionist of the hierarchical denominations. Thereare few if any centralized bodies or methods by which a centralized body couldintervene in the clergy labor market in autonomous denominations. The labor marketis virtually a free market and provides a natural counter-factual to the hierarchicallabor market.
1 There is a difference between “denomination” and “convention.” The Southern Baptist Convention, forexample, is notorious for attempting to influence congregations’ decisions, particularly related toordaining and hiring female clergy. However, a church can be Southern Baptist in denomination, but notbelong to the Southern Baptist Convention.
Labor market structure and clergy compensation relationship 67

The clergy labor market in the Protestant denominations in the United Statesprovides a “natural experiment” for the comparison of two different labor marketstructures. The comparison sheds valuable light on questions regarding approachesto the clergy labor market. One advantage to the free market is that congregationsand pastors have complete freedom to choose the salary and benefits that best suitseach others’ needs. Churches are free to allocate their limited funds in the ways theybest see fit. A second advantage to the free market is that there is a built-in financialincentive for pastors to perform at their best so that they can command highersalaries. This phenomenon is particularly visible among large and very largechurches, as proven administrative skill commands a high premium. One downsideto the free market is that it may distort incentives for the pastors’ work. As Zech(2001, p. 328) points out, pastors may overemphasize elements of leadership thatlead to outcomes that are easily quantifiable and visible (e.g. growth in numbers andin budget) rather than the mission of the church in order to signal their marketabilityto other churches.
The following sections of this paper will examine whether the different labormarket structures that arise from the two categories of Protestant polities result indifferent compensation profiles for clergy. One would expect to see a flatter andhigher distribution of compensation for clergy and greater provision of health andretirement benefits within hierarchical denominations than within autonomousdenominations, given their stated concerns of potential negative distributionalconsequences of a free market. The following analysis will use descriptive statisticsand regression analyses of unique survey data from a random sample of US clergyand their congregations to examine whether the expected differences in clergy labormarket outcomes do exist. The results will show that pastors serving in hierarchicaldenominations receive higher salaries on average, have greater provision of healthand retirement benefits, and experience smaller differentials between the lowest andhighest paid clergy.
Data and Methodology
The data for this analysis are unique in that they are a truly random sample of pastorsfrom across the USA and that they are linked with data on the individual attendees oftheir churches. The results of this analysis, unlike most clergy salary studies whichrely on data provided by select denominations, can be used to examine aspects of theentire clergy labor market. The data come from the 2001 National Pastoral LeaderSurvey, which was conducted as part of the research for Pulpit & Pew: Excellence inPastoral Leadership project, at the Divinity School at Duke University. A randomsample of 883 clergy participated in the survey. These clergy represent nearly 100distinct faith traditions and come from all regions of the country.
The sampling frame for the survey uses the hyper-network sampling method,which allows a random sample of organizations, such as congregations, to beidentified from a random sample of individuals. (Chaves et al. 1999) To generate thepastoral leaders sample, all persons who indicated they attended religious serviceswere extracted from the random sample of individuals who participated in the 1998General Social Survey conducted by the National Opinion Research Center
68 B.R. Haney
(NORC). These church attendees were then asked to provide information on thereligious organization to which they belonged. The pastoral leaders of thesecongregations were then identified and surveyed. NORC conducted the phoneinterviews during the data collection phase of the project. Due in great part to theirpersistent and committed interviewers, as well as the endorsement from leaders inseveral of the denominations, the response rate was high, 73%. Non-response biasappears limited, although southern very large churches and Baptists appeared to bemoderately under-responsive. Following standard statistical methods for hyper-network samples, the data were weighted by the inverse of congregation size in allcalculations, unless otherwise indicated (Chaves et al. 1999).
During the time that the leader data were collected for the Pulpit & Pew NationalPastoral Leader Survey, Presbyterian Research Services surveyed all attendees on theweekend of April 29, 2001 at the morning worship service at those same leaders’churches. Their survey included questions on income levels and giving of attendeeswhich we have linked to the salary data for the pastor. The response rate for churchesselected for the attendees’ survey was roughly 30%, thus only a sub-sample of thedata contains these additional data items. Some non-response bias is present in thefollowing analysis due to the lack of very large churches. However, there are uniquedata on 425 congregations and parishes and the effects of non-response bias appearsmall (Woolever and Bruce 2002).
Results
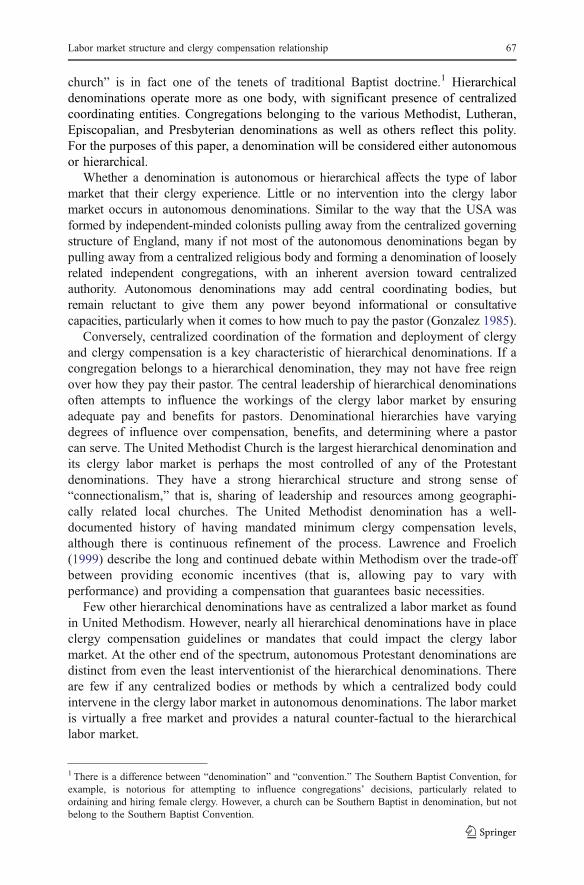
An initial examination of median salaries and percent of pastors provided retirementor health benefits suggests that the intervention by denominational hierarchies in theclergy labor markets raises salary and benefits levels. Table 1 compares thedistribution of clergy compensation and benefits across congregation size forautonomous and hierarchical denominations.
Hierarchical Protestant denominations make an effort to set minimum compen-sation levels and provision of healthcare and retirement benefits to ensure even smallor poor churches provide a reasonable compensation package for pastors. Nearly
Table 1 Distribution of pastor’s compensation in 2001
Autonomous Denominations Hierarchical Denominations
Average WeeklyAttendance
Percentof Clergy
MedianSalarya
% ProvidedBenefits
Percentof Clergy
MedianSalarya
% ProvidedBenefits
Small (<100) 63 $22,300 30 56 $36,000 80Medium (101–350) 32 $41,051 60 38 $49,835 95Large (351–1000) 5 $59,315 85 6 $66,003 98Very large (1000+)b 0.5 $85,518 76 n/a n/a n/a
a Estimated values for parsonage or housing allowances are considered by the IRS as part of clergy salaryand are included in salary for the purposes of this paper.b Some non-response bias in the very large category of churches suggests these figures on compensationand benefits may be low.
Labor market structure and clergy compensation relationship 69
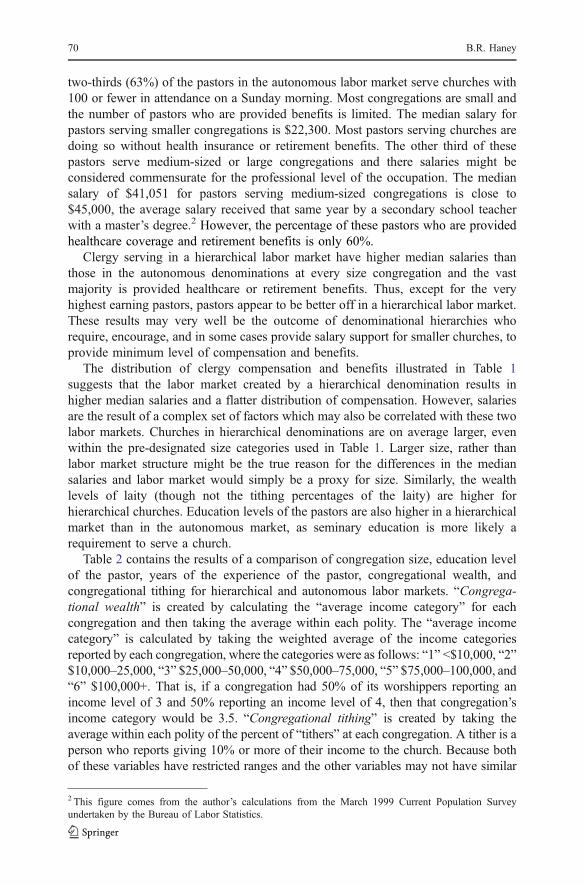
two-thirds (63%) of the pastors in the autonomous labor market serve churches with100 or fewer in attendance on a Sunday morning. Most congregations are small andthe number of pastors who are provided benefits is limited. The median salary forpastors serving smaller congregations is $22,300. Most pastors serving churches aredoing so without health insurance or retirement benefits. The other third of thesepastors serve medium-sized or large congregations and there salaries might beconsidered commensurate for the professional level of the occupation. The mediansalary of $41,051 for pastors serving medium-sized congregations is close to$45,000, the average salary received that same year by a secondary school teacherwith a master’s degree.2 However, the percentage of these pastors who are providedhealthcare coverage and retirement benefits is only 60%.
Clergy serving in a hierarchical labor market have higher median salaries thanthose in the autonomous denominations at every size congregation and the vastmajority is provided healthcare or retirement benefits. Thus, except for the veryhighest earning pastors, pastors appear to be better off in a hierarchical labor market.These results may very well be the outcome of denominational hierarchies whorequire, encourage, and in some cases provide salary support for smaller churches, toprovide minimum level of compensation and benefits.
The distribution of clergy compensation and benefits illustrated in Table 1suggests that the labor market created by a hierarchical denomination results inhigher median salaries and a flatter distribution of compensation. However, salariesare the result of a complex set of factors which may also be correlated with these twolabor markets. Churches in hierarchical denominations are on average larger, evenwithin the pre-designated size categories used in Table 1. Larger size, rather thanlabor market structure might be the true reason for the differences in the mediansalaries and labor market would simply be a proxy for size. Similarly, the wealthlevels of laity (though not the tithing percentages of the laity) are higher forhierarchical churches. Education levels of the pastors are also higher in a hierarchicalmarket than in the autonomous market, as seminary education is more likely arequirement to serve a church.
Table 2 contains the results of a comparison of congregation size, education levelof the pastor, years of the experience of the pastor, congregational wealth, andcongregational tithing for hierarchical and autonomous labor markets. “Congrega-tional wealth” is created by calculating the “average income category” for eachcongregation and then taking the average within each polity. The “average incomecategory” is calculated by taking the weighted average of the income categoriesreported by each congregation, where the categories were as follows: “1” <$10,000, “2”$10,000–25,000, “3” $25,000–50,000, “4” $50,000–75,000, “5” $75,000–100,000, and“6” $100,000+. That is, if a congregation had 50% of its worshippers reporting anincome level of 3 and 50% reporting an income level of 4, then that congregation’sincome category would be 3.5. “Congregational tithing” is created by taking theaverage within each polity of the percent of “tithers” at each congregation. A tither is aperson who reports giving 10% or more of their income to the church. Because bothof these variables have restricted ranges and the other variables may not have similar
2 This figure comes from the author’s calculations from the March 1999 Current Population Surveyundertaken by the Bureau of Labor Statistics.
70 B.R. Haney

underlying distributions across the two polities, a two-sided robust rank-order test isused to test for differences across polity for all variables except Percent with MDiv.Degree or above. (Siegel and Castellan 1988, p. 137) A two-sided Z-test ofproportions is used to test for different Percent of Pastors with MDiv. degree or above.
The strongly significant differences in the background characteristics of pastoralleaders and congregations across polity suggests that the higher salaries inhierarchical labor markets could easily be attributed simply to the larger churchsizes, higher income of laity, and the higher education of the pastors. Differences inthe two labor markets could have no effect. The only factor that might provide acounterweight to these factors is that (self-reported) giving levels are lower withinhierarchical churches, thus leaving churches with potentially smaller budgets andthus lower clergy salaries to offer. However, while the giving percentage may belower, the absolute total giving in a particular church may be higher because of thehigher income levels in the churches.
Thus, churches within hierarchical labor markets are also on average larger andricher and hire clergy with higher education. This could explain all of the differencein compensation that results from the two different labor market models. However, ifafter holding constant these factors there remains a difference in salary levels andgrowth, it would suggest that labor market model does have an impact on clergycompensation and the differences across polity are not simply due to selectivedifferences between pastors and congregations.
Regression analysis is used to test whether differences across polity in clergycompensation exist after holding constant background characteristics of the pastoralleader and the congregation. Another way to state the question would be to askwhether a pastor with the same education and experience serving a congregation ofthe same size and wealth would receive the same compensation. If not, then therewould be evidence that the two different labor markets result in different distributionsof clergy compensation.
The following regression models are used to predict clergy compensation. Thesemodels allow the intercepts and the slopes to vary across the two labor markets,where slope is the increase in compensation as church size increases. By allowingthe intercepts and slopes to vary across polity, differences in levels and growth incompensation as church size changes can be discerned. Given that the denomina-tions in the autonomous polity, such as Baptist, are more likely to be located in
Table 2 Differences in characteristics of congregations and Pastors
Hierarchical Autonomous Test Statistic p-value
Percent of Pastors with MDiv.Degree or Above
94% 72% 4.71 .000
Median Number in Worship Attendance 200 151 8.15 .000Median Years in Ministry for Pastors 22 22 -1.09 .276Median Income Category of Laitya 3.58 3.18 38.22 .000Median Percent of Laity that Tithe(Give 10%+of Net Income)
15% 52% -105.44 .000
a Income categories are: “1” <$10,000, “2” $10,000–25,000, “3” $25,000–50,000, “4” $50,000–75,000,“5” $75,000–100,000, “6” $100,000+.
Labor market structure and clergy compensation relationship 71
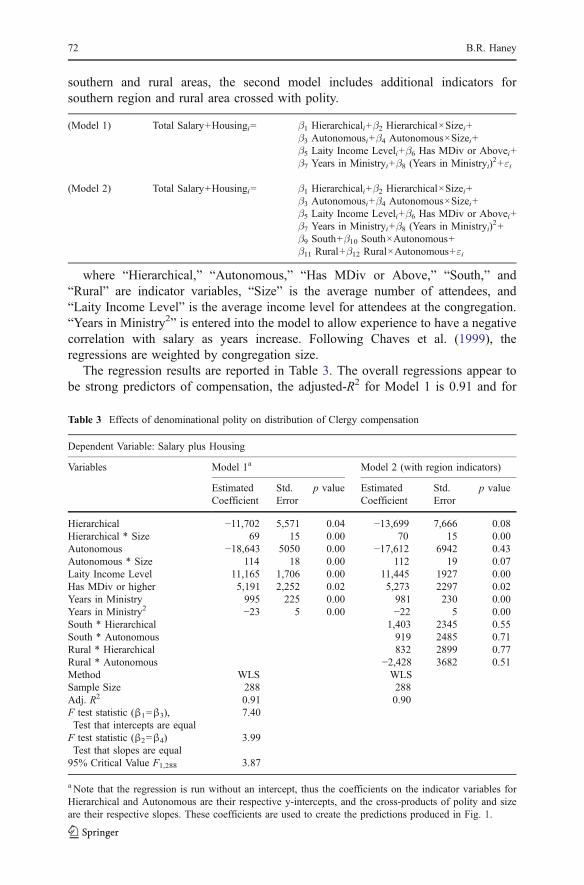
southern and rural areas, the second model includes additional indicators forsouthern region and rural area crossed with polity.
(Model 1) Total Salary+Housingi= β1 Hierarchicali+β2 Hierarchical×Sizei+β3 Autonomousi+β4 Autonomous×Sizei+β5 Laity Income Leveli+β6 Has MDiv or Abovei+β7 Years in Ministryi+β8 (Years in Ministryi)
2+εi
(Model 2) Total Salary+Housingi= β1 Hierarchicali+β2 Hierarchical×Sizei+β3 Autonomousi+β4 Autonomous×Sizei+β5 Laity Income Leveli+β6 Has MDiv or Abovei+β7 Years in Ministryi+β8 (Years in Ministryi)
2+β9 South+β10 South×Autonomous+β11 Rural+β12 Rural×Autonomous+εi
where “Hierarchical,” “Autonomous,” “Has MDiv or Above,” “South,” and“Rural” are indicator variables, “Size” is the average number of attendees, and“Laity Income Level” is the average income level for attendees at the congregation.“Years in Ministry2” is entered into the model to allow experience to have a negativecorrelation with salary as years increase. Following Chaves et al. (1999), theregressions are weighted by congregation size.
The regression results are reported in Table 3. The overall regressions appear tobe strong predictors of compensation, the adjusted-R2 for Model 1 is 0.91 and for
Table 3 Effects of denominational polity on distribution of Clergy compensation
Dependent Variable: Salary plus Housing
Variables Model 1a Model 2 (with region indicators)
EstimatedCoefficient
Std.Error
p value EstimatedCoefficient
Std.Error
p value
Hierarchical −11,702 5,571 0.04 −13,699 7,666 0.08Hierarchical * Size 69 15 0.00 70 15 0.00Autonomous −18,643 5050 0.00 −17,612 6942 0.43Autonomous * Size 114 18 0.00 112 19 0.07Laity Income Level 11,165 1,706 0.00 11,445 1927 0.00Has MDiv or higher 5,191 2,252 0.02 5,273 2297 0.02Years in Ministry 995 225 0.00 981 230 0.00Years in Ministry2 −23 5 0.00 −22 5 0.00South * Hierarchical 1,403 2345 0.55South * Autonomous 919 2485 0.71Rural * Hierarchical 832 2899 0.77Rural * Autonomous −2,428 3682 0.51Method WLS WLSSample Size 288 288Adj. R2 0.91 0.90F test statistic (β1=β3),Test that intercepts are equal
7.40
F test statistic (β2=β4)Test that slopes are equal
3.99
95% Critical Value F1,288 3.87
a Note that the regression is run without an intercept, thus the coefficients on the indicator variables forHierarchical and Autonomous are their respective y-intercepts, and the cross-products of polity and sizeare their respective slopes. These coefficients are used to create the predictions produced in Fig. 1.
72 B.R. Haney

Model 2 is 0.90. The estimated coefficients from Model 1 are robust to inclusion ofother explanatory variables. Model 2 adds indicators for southern census region,rural, and both southern and rural crossed with polity and the original coefficientestimates remain robust to model specification, although the standard errors increase.None of the added explanatory variables were statistically significant and theirinclusion reduced the precision on the estimates of the other variables. Other modelswith other explanatory variables were explored, including those with tenure, gender,race, and ordination status. As with geographic region, none of the estimatedcoefficients were statistically significant and their inclusion reduced the precision onthe estimates of the other variables. Because the addition of geographic indicators inModel 2 does not add to the predictive quality of the model, and the statistical precisionof the estimated coefficients of interest is decreased due to multicollinearity, the resultsfrom Model 1 will be the focus of the paper.
In Model 1 all of the coefficients are statistically significant at α=.05 and mostare significant at α=.01. Of particular interest are coefficients for the termsinteracted with polity. The intercept and slope for autonomous is −8,643 and 14,while the intercept and slope for hierarchical is −1,702 and 69. Two additionalrestricted regression models were also run to test for significant differences inintercepts and slopes between the two labor markets. The 95% critical value for onerestriction with 288 degrees of freedom is 3.87. The test statistics for the test ofdifferences in intercepts and slopes, as reported in Table 3, were 7.40 and 3.99,respectively. The differences in the average salary level (the intercepts) and salarygrowth by size of church (the slopes) between the two polities are large and statisticallysignificant.
Thus, the regression model suggests that pastors’ salaries in autonomous politiesare lower on average, but grow at a faster rate as church size increases. Pastorsserving in hierarchical polities have a flatter, but on average higher, compensationacross church size. Figure 1 compares these compensation profiles for a typicalpastor. In the graph, the lines are the predictions of the typical pastor’s salary in theautonomous and the hierarchical labor market. The typical pastor in this sample has20 years ministerial experience, an MDiv degree or higher, and serves a church withaverage income of approximately $25,000–50,000. These lines are created forillustrative purpose and not statistically significantly different from each other, butthe F-tests reported above provide strong evidence that the differences in the twolabor market outcomes are real and statistically significant overall.
The markers on the lines are predictions for the actual church sizes from thesample of churches in each of the two labor markets. At smaller churches wheremost pastors serve, compensation is higher in the hierarchical polity. Pastors servingin the autonomous polity will have higher compensation at larger-sized churches.Recall from Table 1, however, that the relative proportion of large- or very large-sized churches (more than 350 attendees) in either polity is around 5%.
At the smaller churches, the average pastor is better off financially in thehierarchical labor market. It provides a higher salary – on average, about $7,000more for the typical pastor at the smallest size church. The difference diminishes assize of church gets larger until the autonomous salaries surpass the higher startinglevel for hierarchical churches. At around 180 attendees the average pastor wouldmake $52,000 under either labor market. Above 180 attendees, he would make a
Labor market structure and clergy compensation relationship 73

higher salary in an autonomous church. The distribution of salaries is flatter inhierarchical polities, which suggests that the hierarchical religious institutions impactthe clergy labor market by providing on average higher compensation, but a morecompressed salary structure.
Conclusion
This paper contributes to the ongoing application of economic analysis to the studyof non-traditional labor markets by examining the impact of denominational polityon the clergy compensation decisions made by local churches. The results suggestthat clergy labor market outcomes are shaped by the polity to which the churchbelongs. Local churches belonging to hierarchical denominations are shown to havehigher average compensation and nearly universal healthcare coverage, even whencontrolling for clergy and congregational background characteristics that would leadto higher average compensation levels on their own. Conversely, autonomous localchurches, which operate within a virtually free market for clergy labor, provide lowlevels of average compensation and benefits for the majority of pastors. These resultsdo not suggest that the enforced higher compensation in hierarchical denominationshas no negative consequences for other labor market outcomes, such as theperformance of the clergy or the welfare of the congregations. Further research onthe impact of these decisions on pulpit vacancies, as well as on clergy performanceincentives in the midst of moral hazard is an important next step.
0
10000
20000
30000
40000
50000
60000
70000
80000
90000
100000
110000
120000
130000
140000
150000
0 100 200 300 400 500 600 700 800 900 1000
Number of Attendees
Ave
rage
Sal
ary
and
Hou
sing
Hierarchical
Autonomous
Lines cross at approximately180 Attendees, $52,000
Salary-Church Size Profiles ForAverage Pastor in Sample:
Years of Experience……20With an M. Div. degree
Average Laity IncomeCategory…………………3.2
Fig. 1 Predicted average salaries in hierchical vs autonomous clergy labor market controlling for wealth,experience and education
74 B.R. Haney

Acknowledgement The author gratefully acknowledges the funding for the research underlying thispaper by Lilly Endowment, Inc., the assistance of Cynthia Woolever, Deborah Bruce, and Ida Smith-Williams at the Presbyterian Research Services in Louisville, KY. The comments provided by ananonymous reviewer added greatly to the clarity and rigor of the paper. Earlier versions of this researchwere greatly improved by comments from Jackson W. Carroll, Matthew J. Price, Jeffrey A. Smith, BarbaraG. Wheeler, members of the Economics working group of the Society of Christian Ethics, and themembers of the Core Seminar and Church Leaders Group of the Pulpit & Pew project, Duke University,and participants at the Society for the Scientific Study of Religion Academic Proceedings, October 2002.
References
Allen, D. W. (1995). Order in the church: A property rights approach. Journal of Economic Behavior andOrganization, 27(1), 97–117.
Anderson, G. M. (1988). Mr. Smith and the preachers: The economics of religion in the wealth of nations.Journal of Political Economy, 96(5), 1066–1088.
Blank, R. M. (1992). Do justice: Linking Christian faith and modern economic life. Cleveland, OH:United Church.
Carroll, J. W., & Wilson, R. L. (1980). Too many pastors?. New York: Pilgrim.Chang, P. M. Y. (2005). Factors shaping clergy careers: A wakeup call for protestant denominations and
pastors. Durham, NC: The Divinity School at Duke University Pulpit & Pew Report Series.Chaves, M., Konieczny, M. E., & Beyerlien, K. (1999). The national congregations study: Background,
methods, and selected results. Journal for the Scientific Study of Religion, 38(4), 458–476.Daly, W. P. (1999). The laborer is worthy of his hire. Chicago, IL: National Federation of Priests’ Councils.DeLeers, S. V. (1991). The payment of clergy: a symbol of changing self-images of the church. Chicago,
IL: National Federation of Priests’ Councils.Ekelund, R. B., Hebert, R. F., Tollison, R. D., Anderson, G. M., & Davidson, A. B. (1996). Sacred trust:
The medieval church as an economic firm. Oxford: Oxford University Press.Gonzalez, J. L. (1985). The story of christianity: Volume two - the reformation to the present day. New
York, NY: HarperCollins.Halteman, J. (1995). The clashing worlds of economics and faith. Scottsdale, PA: Herald.Hicks, D. (2000). Inequality & christian ethics. Cambridge: Cambridge University Press.Hotchkiss, D. (2002). Ministry and money. Bethesda, MD: The Alban Institute.Iannaconne, L. (1998). Introduction to the economics of religion. Journal of Economic Literature, 36,
1465–1496.Lawrence, W. B., & Froechlich, M. (1999). What defines clergy compensation: Mission or market? In
R. E. Richey, W. B. Lawrence, & D. M. Campbell (Eds.) Questions for the twenty-first centurychurch. Nashville: Abingdon Press.
Long, S. (2000). Divine economy: Theology and the market. London: Routledge.McMillan, B. R. (2002). How church polity affects pastoral salaries. Congregations Magazine, September/
October Issue, The Alban Institute.McMillan, B. R., & Price, M. J. (2003). How much should we pay the pastor? A fresh look at clergy salaries in
the 21st Century. Durham, NC: The Divinity School at Duke University Pulpit & Pew Report Series.National Conference of Catholic Bishops (1997). Economic justice for all. Washington, DC: United States
Catholic Conference, Inc.National Council of the Churches of Christ in the USA (2001). Yearbook of American & Canadian
churches 2001. In E. W. Lindner (Ed.). Nashville, TN: Abingdon Press.Paul, L. (1964). The deployment and payment of the clergy. Chatham, Great Britain: Mackay.Price, M. J. (2001). Fear of falling: Male clergy in financial crisis. The Christian Century, August, 15–22.Sedgwick, P. (1999). The market economy & christian ethics. Cambridge: Cambridge University Press.Siegal, S., & Castellan, J. (1988). Nonparametric statistics for the behavioral sciences. New York:
McGraw-Hill.Strandjord, J. (2000). Ordained ministers in the evangelical Lutheran church in America: Needs and re-
sources in the 21st century. Chicago: Division for Ministry, Evangelical Lutheran Church in America.Woolever, C., & Bruce, D. (2002). A field guide to U.S. congregations. Louisville, KY: Westminster John Knox.Zech, C., McNamara, P., Donahue, M., & Hoge, D. R. (1996). Money matters: Personal giving in
American churches. Louisville, Kentucky: Westminster John Knox.Zech, C. (2001). An agency analysis of church-pastor relations. Managerial and Decision Economics, 22
(6), 327–332.
Labor market structure and clergy compensation relationship 75
![[Amharic Version] UNAIDS Orthodox Clergy Pocket Book](https://static.fdokumen.com/doc/165x107/631ae490bb40f9952b023621/amharic-version-unaids-orthodox-clergy-pocket-book.jpg)