Study on Spatio- Economic Relationship of Industries in Greater Nagpur Area
Upload
khangminh22Category
view
4download
0
Doctoral Thesis
THE RELATIONSHIP BETWEEN
ECONOMIC FREEDOM AND ECONOMIC
GROWTH IN EU COUNTRIES
AUTHOR:
Ivana Brkić
DIRECTOR:
Javier Sánchez Garcia
Castellón de la Plana, June 2020

Programa de Doctorado en Economía y Empresa
Escuela de doctorado de la Universitat Jaume I
LA RELACIÓN ENTRE LA LIBERTAD ECONÓMICA Y EL
CRECIMIENTO ECONÓMICO EN LOS PAÍSES DE LA EU
Memoria presentada por Ivana Brkić
para optar al grado de doctor de la Universitat Jaume
El doctorando El director
Ivana Brkić Javier Sánchez Garcia
Castellón de la Plana, Junio de 2020

Contents
SECTION 1. THEORETICAL FRAMEWORK .................................................................................... 1
CHAPTER 1: INTRODUCTION ...................................................................................................... 2
1.1. RESEARCH JUSTIFICATION .............................................................................................. 2
1.2. OBJECTIVES OF THE RESEARCH .................................................................................... 3
1.3. TEORETICAL PERSPECTIVES ........................................................................................... 5
1.4. STRUCTURE OF THE DISSERTATION ............................................................................. 5
SECTION 1. THEORETICAL FRAMEWORK ................................................................................ 7
CHAPTER 2: THEORETICAL ASSUMPTIONS ............................................................................. 8
INTRODUCTION .............................................................................................................................. 8
2.1. THEORETICAL ASSUMPTIONS ABOUT ECONOMIC FREEDOM .................................. 10
2.1.1. THE DIRECTIONS OF DEVELOPMENT OF ECONOMIC THOUGHT FROM THE
ASPECT OF ECONOMIC FREEDOM ....................................................................................... 10
2.1.2. ON THE DEGREE OF MARKET REGULATION ........................................................... 12
2.1.3. ECONOMIC INSTITUTIONS AS DETERMINANTS OF ECONOMIC GROWTH ...... 14
2.1.4. DEFINING ECONOMIC FREEDOM ............................................................................... 19
2.1.5. MEASURING ECONOMIC FREEDOM........................................................................... 22
2.1.6. CHAPTER SUMMARY ..................................................................................................... 33
2.2. CONCEPT OF THE ECONOMIC FREEDOM INDEX OF THE HERITAGE FOUNDATION
.......................................................................................................................................................... 34
2.2.1. INTRODUCTION .............................................................................................................. 34
2.2.2. THEORETICAL INTERPRETATION OF THE ECONOMIC FREEDOM INDEX ........ 34
2.2.3. THEORETICAL INTERPRETATION OF THE ECONOMIC FREEDOM SUBINDICES
...................................................................................................................................................... 35
2.2.4. CHAPTER SUMMARY ..................................................................................................... 43
2.3. ECONOMIC FREEDOM AS A SUBJECT OF SCIENTIFIC RESEARCH ............................ 44
2.3.1. INTRODUCTION .............................................................................................................. 44
2.3.2. EXAMINING THE RELATIONSHIP BETWEEN ECONOMIC FREEDOM AND
ECONOMIC GROWTH ............................................................................................................... 45
2.3.3. EXAMINING THE RELATIONSHIP BETWEEN DIFFERENT COMPONENTS OF
ECONOMIC FREEDOM AND ECONOMIC GROWTH ........................................................... 48
2.3.4. EXAMINING THE RELATIONSHIP BETWEEN LEVEL VS. CHANGE IN THE
LEVEL OF ECONOMIC FREEDOM AND ECONOMIC GROWTH ....................................... 55
2.3.5. EXAMINING THE CAUSALITY IN THE RELATIONSHIP BETWEEN ECONOMIC
FREEDOM AND ECONOMIC GROWTH ................................................................................. 64
2.3.6. EXAMINING THE RELATIONSHIP BETWEEN POLITICAL FREEDOM,
ECONOMIC FREEDOM AND ECONOMIC GROWTH ........................................................... 72
2.3.7. EXAMINING THE STATE AND IMPACT OF ECONOMIC FREEDOM WITHIN
DIFFERENT GROUPS OF COUNTRIES ................................................................................... 76
2.3.8. EXAMINING THE STATE AND CHANGES OF ECONOMIC FREEDOM OF
CERTAIN COUNTRIES .............................................................................................................. 96
SECTION SUMMARY .................................................................................................................. 100
SECTION 2. EMPIRICAL FRAMEWORK ...................................................................................... 102
CHAPTER 3: THE EMPIRICAL RESEARCH METHODOLOGY ................................................. 103
3.1. INTRODUCTION ............................................................................................................... 103
3.2. DEFINIING HYPOTHESES ............................................................................................... 103
3.3. DEFINING THE RESEARCH VARIABLE ....................................................................... 105
3.4. DATA COLLECTION ........................................................................................................ 108
3.5. SELECTION METHOD, SIZE AND CONSTRUCTION OF THE SAMPLE .................. 108
3.6. STATISTICAL PROCEDURE ............................................................................................ 110
3.7. CHAPTER SUMMARY ...................................................................................................... 113
CHAPTER 4: RESULTS OF THE EMPIRICAL RESEARCH ......................................................... 114
4.1. INTRODUCTION ............................................................................................................... 114
4.2. RESULTS OF THE PANEL ANALYSIS ON THE IMPACT OF ECONOMIC FREEDOM
ON ECONOMIC GROWTH IN THE EU COUNTRIES .......................................................... 115
4.4. RESULTS OF THE PANEL ANALYSIS ON THE IMPACT OF ELEMENTS OF
ECONOMIC FREEDOM ON ECONOMIC GROWTH IN THE EU COUNTRIES ................ 126
4.5. RESULTS OF THE PANEL ANALYSIS ON THE IMPACT OF CHANGE OF
ECONOMIC FREEDOM ON ECONOMIC GROWTH IN THE EU COUNTRIES ................ 141
4.6. CHAPTER SUMMARY ...................................................................................................... 148
CHAPTER 5: DISCUSSION, CONCLUSIONS, LIMITATIONS AND FUTURE LINE OF
RESEARCH ........................................................................................................................................ 149
5.1. INTRODUCTION ............................................................................................................... 149
5.2. DISCUSSION OF THE RESULTS OF PANEL ANALYSIS ON THE IMPACT OF
ECONOMIC FREEDOM ON ECONOMIC GROWTH IN THE EU COUNTRIES ................ 150
5.3. DISCUSSION OF THE RESULTS OF PANEL ANALYSIS ON THE IMPACT OF
ELEMENTS OF ECONOMIC FREEDOM ON ECONOMIC GROWTH IN THE EU
COUNTRIES .............................................................................................................................. 151
5.4. DISCUSSION OF THE RESULTS OF PANEL ANALYSIS ON THE IMPACT OF
CHANGE OF ECONOMIC FREEDOM ON ECONOMIC GROWTH IN THE EU
COUNTRIES .............................................................................................................................. 158
5.5. MAIN CONCLUSIONS OF THE RESEARCH ................................................................. 159
5.6. LIMITATIONS AND FUTURE LINE OF RESEARCH .................................................... 162
REFERENCES ................................................................................................................................... 165
List of tables
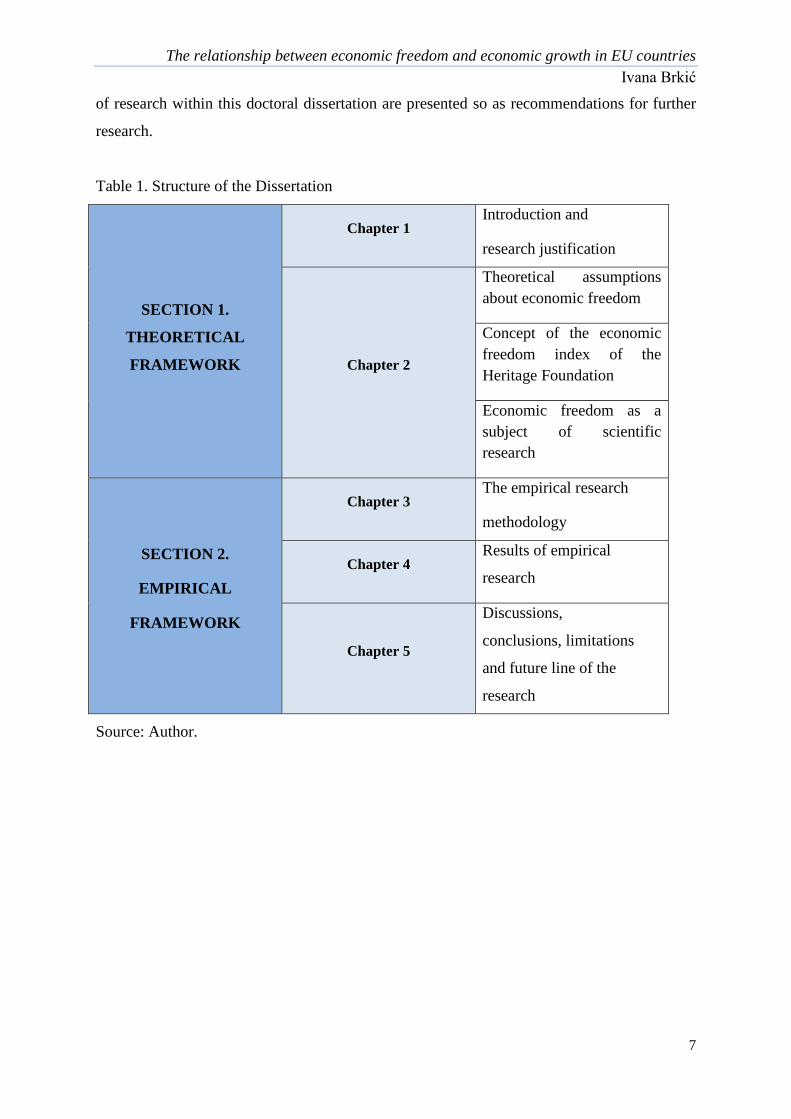
Table 1. Structure of the Dissertation ........................................................................................ 7
Table 2. Categories of Fraser Institute Economic Freedom .................................................... 24
Table 3. Categories of the Heritage Foundation economic freedom ....................................... 26
Table 4. Categories of the Economic Freedom Index of the Heritage Foundation that have
been in use since 2017 ............................................................................................................. 27
Table 5. Comparison of the Economic Freedom Index of the Fraser Institute and the Heritage
Foundation ............................................................................................................................... 29
Table 6. Similarities and differences in the interpretation of categories of economic freedom
.................................................................................................................................................. 32
Table 7. Tabular overview of conducted research on the relationship between (change of)
economic freedom and economic level and/or growth ............................................................ 61
Table 8. Overview of the interconnections between economic freedom, political freedom and
economic growth in the studies presented ............................................................................... 75
Table 9. Tabular overview of conducted research on the relationship between (change of)
economic freedom and economic level and/or growth within different group of countries .... 89
Table 10. Tabular presentation of the results of the examinations so far of the situation and
changes of the economic freedom of individual countries ...................................................... 99
Table 11. General, specific and individual hypotheses of group 1 ........................................ 104
Table 12. General and alternative hypothesis 2 ..................................................................... 104
Table 13. Description and labels of dependent, independent and control variables .............. 106
Table 14. Descriptive statistics of dependent, independent, and control variables ............... 115
Table 15. Correlation between variables of panel data .......................................................... 122
Table 16. Fixed effects model - the impact of economic freedom on economic growth in
European Union countries...................................................................................................... 123
Table 17. Random effects model - the impact of economic freedom on economic growth in
European Union countries...................................................................................................... 124
Table 18. Final fixed effects model - the impact of economic freedom on economic growth in
European Union countries...................................................................................................... 125
Table 19. Descriptive statistics of the dependent, independent and control variables .......... 126
Table 20. Correlation between variables of panel data .......................................................... 133
Table 21. Fixed effects model - the impact of subindices of economic freedom on economic
growth in the European Union countries ............................................................................... 134

Table 22. Random effects model - the impact of subindices of economic freedom on
economic growth in the European Union countries ............................................................... 134
Table 23. Improved fixed effects model - the impact of subindices of economic freedom on
economic growth in European Union countries ..................................................................... 137
Table 24. Reduced fixed effects model - the impact of subindices of economic freedom on
economic growth in European Union countries ..................................................................... 137
Table 25. Reduced random effects model - the impact of subindices of economic freedom on
economic growth in European Union countries ..................................................................... 138
Table 26. Final fixed effects model - the impact of subindices of economic freedom on
economic growth in European Union countries ..................................................................... 140
Table 27. Correlation between variables of panel data .......................................................... 144
Table 28. Fixed effects model - the impact of change of economic freedom on economic
growth in the European Union countries ............................................................................... 145
Table 29. Random effects model - the impact of change of economic freedom on economic
growth in the European Union countries ............................................................................... 145
Table 30. Final fixed effects model - impact of change of economic freedom on economic
growth in European Union countries ..................................................................................... 147
Table 31. Comparison of findings of the research on the impact of elements of economic
freedom with those of other authors ...................................................................................... 155

List of graphs
Graph 1. Changes in Growth per country (1994 – 2018) ...................................................... 116
Graph 2. Heterogeneity in economic growth across years in selected sample ...................... 117
Graph 3. Heterogeneity in economic growth across countries in the selected sample .......... 117
Graph 4. Relationship between independent and dependent variable in each country .......... 119
Graph 5. Correlation between Index of economic freedom and Economic growth for each
country ................................................................................................................................... 120
Graph 6. Correlation between control variable Gross capital formation (% of GDP) and
dependent variable Economic growth .................................................................................... 120
Graph 7. Correlation between Foreign direct investment, net inflows (% of GDP) and GDP
per capita growth (annual %) ................................................................................................. 121
Graph 8. Correlation between Trade (% of GDP) and GDP per capita growth (annual %) .. 121
Graph 9. Plot of the dependent variable GDP per capita growth (annual %) over time for the
selected sample ...................................................................................................................... 123
Graph 10. Correlation between subindex Property rights and GDP per capita growth (annual
%) ........................................................................................................................................... 127
Graph 11. Correlation between subindex Government integrity and GDP per capita growth
(annual %) .............................................................................................................................. 127
Graph 12. Correlation between subindex Tax burden and GDP per capita growth (annual %)
................................................................................................................................................ 128
Graph 13. Correlation between subindex Government spending and GDP per capita growth
(annual %) .............................................................................................................................. 128
Graph 14. Correlation between subindex Business freedom and GDP per capita growth
(annual %) .............................................................................................................................. 129
Graph 15. Correlation between subindex Labor freedom and GDP per capita growth (annual
%) ........................................................................................................................................... 129
Graph 16. Correlation between subindex Monetary freedom and GDP per capita growth
(annual %) .............................................................................................................................. 130
Graph 17. Correlation between subindex Trade freedom and GDP per capita growth (annual
%) ........................................................................................................................................... 130
Graph 18. Correlation between subindex Investment freedom and GDP per capita growth
(annual %) .............................................................................................................................. 131
Graph 19. Correlation between subindex Financial freedom and GDP per capita growth
(annual %) .............................................................................................................................. 131
Graph 20. Relationship between independent and dependent variable in each country ........ 142
Graph 21. Correlation between Change of index of economic freedom and GDP per capita
growth (annual %).................................................................................................................. 143
List of figures
Figure 1. Correlation between variables of panel data .......................................................... 122
Figure 2. Correlation between variables of panel data .......................................................... 132
Figure 3. Correlation between variables of panel data .......................................................... 144

1
SECTION 1. THEORETICAL FRAMEWORK

2
CHAPTER 1: INTRODUCTION
1.1. RESEARCH JUSTIFICATION
Economic freedom is the right of every individual to work, to have their labor and
property at their disposal and to control them. It implies minimal intervention by the state,
which is reflected primarily in the protection of fundamental property rights, as well as the
implementation and efficiency of the law in enforcing contracts. All other segments of
economic flows need to be relieved of state interference and left to actions on the market. In
order to substantiate with solid empirical evidence the theoretical view that economic
liberalization is useful for achieving economic growth, it is necessary to quantify the given
qualitative category and make it measurable and comparable. For more than two decades, the
Heritage Foundation has been following the level of economic liberalism in almost every
country in the world and based on it, in cooperation with the Wall Street Journal, it publishes
a report on the state of economic freedom in the world every year based on the Index of
Economic Freedom. The Economic Freedom Index is composed of ten elements grouped into
four basic pillars of economic freedom: 1) Rule of Law, which consists of sub-indices
Protection of Property Rights and Freedom from Corruption used to analyze judicial
independence, the efficiency of law and contract enforcement, and the presence of corruption
in all segments of society; 2) Limited Government, monitors the state of Fiscal Freedom
through the extent of tax burden and Public Spending in the observed countries; 3)
Regulatory Efficiency is a pillar of economic freedom dedicated to aspects of Business
Freedom, Labor Freedom and Monetary Freedom, which measure the extent of bureaucratic
restrictions in the process of business processes, the degree of regulations in the labor market
and the stability of prices formed in the market; 4) Market Openness Pillar, expressed by
Trade Freedom, Investment Freedom and Financial Freedom, is dedicated to examining the
openness and presence of international trade in goods, services and money, as well as the
presence of foreign and domestic investors and financial institutions, operating independently
of state control. The given index and its categories will be applied in this thesis so as to
determine the impact of economic freedom on economic growth within 28 EU Member
States observed from 1995 to 2018.

The relationship between economic freedom and economic growth in EU countries
Ivana Brkić
3
Previous research has found that aggregate index of economic freedom does not
necessarily have to be a precise indicator of the economic growth of certain countries, and
that it is often necessary to specify those aspects of economic freedom that determine the
extent of economic activity achieved in the countries observed. Our aspirations were to
determine whether equal, harmonized, balanced application of all aspects of economic
freedom leads to economic expansion in the countries of the European Union, or it is about
certain segments which are more determinative of the chosen area.
Although the criteria for entry and membership of the European Union are the same
and binding for all Member States, there are nevertheless certain specificities and differences
among the countries concerned. As the foundations of the European Union are based on the
so-called four freedoms: freedom of movement of goods, freedom to provide services,
freedom of movement of capital and freedom of movement of people (Medović, 2018), the
aim of this research is to examine how much these (and other freedoms) contribute to
economic growth in member states of the European Union.
As contemporary theories of economic growth have singled out economic freedom as
a significant factor in the country's economic development and prosperity, the core
contribution of this doctoral thesis is reflected in the examination of this claim on a sample of
European Union (EU) countries. Further scientific contribution can be observed in identifying
those elements of economic freedom that contribute most to economic growth in EU Member
States, which will be achieved through empirical research. It will serve to provide evidence
that support the theory of the relationship between economic freedom, its change, its
components and economic growth, in a sample of EU Member States.
Given the great importance and impact of economic freedom on the prosperity of
individuals and entire nations, it is considered relevant and necessary to deal with this topic in
order to advance the global economic progress of society.
1.2. OBJECTIVES OF THE RESEARCH
The objective of this doctoral thesis is to examine the impact of economic freedom
expressed through the Economic Freedom Index of the Heritage Foundation on the economic
growth of European Union countries. The research will also examine the impact of the
elements (sub-indices) of economic freedom on the percentage growth of gross domestic

The relationship between economic freedom and economic growth in EU countries
Ivana Brkić
4
product per capita in order to determine which of the segments contributes most significantly
to the expansion of the economies of the European Union.
The thesis will use the Heritage Foundation’s Economic Freedom Index data to define
and measure the impact of economic freedom on the overall production of goods and
services, expressed as gross domestic product percentage growth per capita.
Since the Index of Economic Freedom is composed of ten categories or areas that
equally define the state of economic freedom, it will be determined with great precision
which of the given segments contributes most to the economic growth of the EU Member
States. Protection of property rights, corruption, fiscal burden, public spending, ease of doing
business, working conditions, international openness as regards trade, investment and
financial flows and other aspects in the economic sphere of the selected countries, expressed
through elements of the Heritage Foundation’s Economic Freedom Index will be the subject
of this research in the narrow sense in terms of determining their impact on economic growth.
In order to stimulate the economic growth of the European Union, the thesis raises
key questions with the aspirations of answering some of the following questions through
empirical and theoretical research:
Does economic freedom contribute to the economic growth of the European Union?
Is the European Union characterized and defined by economic freedom in general, or
are only some of its aspects determinant of defining the economic growth of this area?
Can the promotion of the rule of law manifested in stronger protection of property
rights and reduction of corruption encourage economic growth in the European
Union?
Can government restrictions on fiscal levies and restrictions on public spending have
a decisive influence on the economic growth of EU countries?
Does the low level of efficient regulation, hampered by slow bureaucracy in the
business process, rigid laws and a high degree of protection of labor rights, as well as
pronounced price controls, or high inflation rates, significantly diminish the chances
of economic growth of EU countries?
Why can market openness, freedom of investment and the manifestation of
international financial flows lead to the advancement of global economic growth in
European Union countries?
The primary objective of the research is to determine the impact of economic
freedom on the percentage growth of GDP per capita in a sample of EU Member States.

The relationship between economic freedom and economic growth in EU countries
Ivana Brkić
5
The specific objective of the research is to examine the complexity of the
relationship between the elements of economic freedom and the growth of GDP in a defined
area of the European Union.
The scientific objective of the research is reflected in the contribution of scarce
theoretical knowledge in the field of the impact of economic freedom on the most important
economic indicator - economic growth. The stated objective is planned to be achieved
through an empirical research process, by confirming or refuting the hypotheses set out in the
thesis on the given impact in the relations between economic freedom, its components and
economic growth in a sample of EU countries.
The social objective is to determine which aspect of economic freedom is particularly
conducive (or detrimental) to economic growth from the perspective of the observed EU
Member States, and using that knowledge to create and conduct macroeconomic policies in
order to strengthen an integrated and economically strong geopolitical area.
The practical objective is closely linked to the social objective, since the focus of the
research is a macroeconomic topic, and therefore these results may be valuable to
macroeconomic policy makers for the purpose of defining the direction and determinants of
European Union development.
1.3. TEORETICAL PERSPECTIVES
Although there is no single definition of economic freedom, there is a widely held
view that economic freedom is the right of every person to have their labor and property at
their disposal and to control them.
1.4. STRUCTURE OF THE DISSERTATION
The concept of the doctoral dissertation is determined by the methodology of writing
a scientific paper, which consists of the following:
In the introductory part - Chapter 1, the justification of the research is elaborated,
the subject of the research specified and the primary, specific, scientific, social and practical
objective of the research determined; at the same time - the content that will be processed and
presented within the dissertation is outlined.

The relationship between economic freedom and economic growth in EU countries
Ivana Brkić
6
Chapter 2 gives an overview of theoretical assumptions that narrowly define the field
of research: the directions of development of economic thought from the point of view of
economic freedom are historically and chronologically interpreted, it is debated about the
optimal degree of market regulation, and on the basis of previous research the importance of
economic institutions as determinants of economic growth and development is pointed out.
Attention is further devoted to defining the concept of economic freedom, the procedures for
its quantification by certain institutions, after which the focus is placed on the theoretical
interpretation of the Economic Freedom Index and its components constructed by the
Heritage Foundation, which publishes a report on the state of economic freedom in the world
every year.
Below is an overview of the scientific findings to date on the topic covered.
Numerous authors have examined the relationship between economic freedom, its elements
and economic growth, the findings of which are presented first. Other authors have analyzed
the change (as opposed to level) of economic freedom and such impact on the economic
(welfare) state and progress, whose contributions are also made explicit. Studies that dealt
with the causal relationship between economic freedom and growth are then presented. As
the aim of the research was to examine relations within one economic and political community-
the European Union, the subject of further interest and presentation was also the insights of
other authors who were exploring the same or another geo-economic area.
The third part is entirely devoted to the empirical research conducted for the need of
the dissertation. After presenting the methods and means of data collection and processing, a
brief review of econometric methods that will be applied within the empirical part of the
research, and defining the variables, the concrete process of quantitative research is begun.
In the fourth part, with the help of descriptive statistics, basic characteristics of all
variables are presented, on the basis of which further selection of research methods could be
made. A correlation analysis was also performed to establish the basic relationships between
the dependent, independent, and control variables. Panel analysis, as the central analysis for
determining the impact of (change of) economic freedom and its elements on economic
growth in the sample of European Union countries, was performed below and the results
obtained are presented in tables and graphs.
The fifth part is devoted to the discussion of the given results, commented on and
compared with the results of other authors on this or a related topic. Based on this analysis,
certain hypotheses were accepted or rejected. In the end, concluding remarks on the subject
The relationship between economic freedom and economic growth in EU countries
Ivana Brkić
7
of research within this doctoral dissertation are presented so as recommendations for further
research.
Table 1. Structure of the Dissertation
SECTION 1.
THEORETICAL
FRAMEWORK
Chapter 1 Introduction and
research justification
Chapter 2
Theoretical assumptions
about economic freedom
Concept of the economic
freedom index of the
Heritage Foundation
Economic freedom as a
subject of scientific
research
SECTION 2.
EMPIRICAL
FRAMEWORK
Chapter 3 The empirical research
methodology
Chapter 4 Results of empirical
research
Chapter 5
Discussions,
conclusions, limitations
and future line of the
research
Source: Author.
The relationship between economic freedom and economic growth in EU countries
Ivana Brkić
8
CHAPTER 2: THEORETICAL ASSUMPTIONS
INTRODUCTION
Within the theoretical framework in the dissertation, the basic terms that are the subject
of the research (and) in its empirical part are defined. The focus of the qualitative analysis was
the very concept of economic freedom, an overview of its history and chronology of presence in
economic theory and practice, as well as ways of quantifying it using various indices that
measure economic freedom in countries around the world. As the empirical part of the research
analyzes the relationship between economic freedom and economic growth with the help of the
Heritage Foundation’s Index of Economic Freedom, the methodology of constructing the index
itself is given a special significance in the theoretical part as well as a more extensive
interpretation of each of its segments.
Economic freedom has been the subject of numerous scientific studies, and within the
theoretical framework, the most relevant scientific results obtained in the previous period have
been highlighted. Relations that have been established between economic freedom and economic
growth have been discussed, as well as relationships between individual segments (sub-indices)
of economic freedom and economic growth, given that numerous studies have found different
contributions of individual elements of economic freedom to economic prosperity. The results of
the research that dealt with causality (in Granger's sense) in the relations between economic
freedom (or some of its parts) and economic growth are included and presented. Since a
considerable number of authors have analyzed the relations between economic freedom and
economic growth within a particular socio-economic-geographical group of countries, a detailed
review of such studies and the results obtained is made so that a later comparison with the results
of the empirical research within the dissertation could be made, given that the selected sample of
countries also belongs to one such formation - the economic and political community - the
European Union.
For the purpose of qualitative analysis of the identified research problem, adequate
groups of methods, predetermined by such scientific approaches, were applied:
The relationship between economic freedom and economic growth in EU countries
Ivana Brkić
9
Generic analysis and historical method were applied in the analysis of the concept of
economic freedom and its understanding in economic theory. The same methods were
applied for the analysis of the methodology of the economic freedom index itself, as well
as for the presentation of its application as a factor of economic development.
Methods of analysis and synthesis were used to anatomize and consolidate views and
conclusions on the impact of economic freedom on the economies of different (groups of)
countries, in order to identify, discover and study facts, laws and truths on a given topic.
Content analysis was applied in a qualitative analysis of available and contemporary,
mostly foreign, scientific and professional literature on the importance and impact of
economic freedom on key indicators of economic growth and development.
Methods of induction and deduction, abstraction and concretization, as well as
methods of generalization and specialization were used in the process of preparation of
the entire dissertation, although their greatest contribution is seen in drawing conclusions
about the impact of economic freedom on the economies of countries by interpreting the
results obtained on the basis of the selected sample, as well as conducted secondary
research.
Descriptive and explicit analysis is used to interpret the results of the research on the
relationship between the Index of Economic Freedom and its subcategories with
traditional economic indicators, and in particular the percentage growth of GDP per
capita.
Structural analysis and classification method is used in defining, explaining and
interpreting the subcategories of the Economic Freedom Index, while reproductive
synthesis explains how the index elements are grouped into a comprehensive Economic
Freedom Index of the Heritage Foundation.
The method of comparison was applied in comparing the Economic Freedom Index of
the Heritage Foundation with other indices, which also aim to monitor a certain degree of
economic (and/or other type of social) freedom in order to draw conclusions about the
similarities and differences of the indices. The method of comparison was also used to
compare the impact of economic freedoms on different economic and other indicators in
different countries and regions. Comparison of the obtained results on the basis of
empirical analysis with the results of other authors with the help of this method was done

The relationship between economic freedom and economic growth in EU countries
Ivana Brkić
10
to discover similarities and differences on the impact of economic freedom on growth in
different geo-economic areas.
The method of proving and refuting was applied in determining the truthfulness of the
thesis and assumptions set out in the dissertation.
The given methods are intended to form the basis of reliable quantitative research in
order to empirically answer the questions and issues raised within the research subject.
2.1. THEORETICAL ASSUMPTIONS ABOUT ECONOMIC FREEDOM
2.1.1. THE DIRECTIONS OF DEVELOPMENT OF ECONOMIC THOUGHT FROM
THE ASPECT OF ECONOMIC FREEDOM
In his capital work “The Wealth of Nations”, philosopher and founder of modern
economics, Adam Smith raised the simple but essential question: "Why do some countries
prosper and others do not?" (Smith, 2010). According to Borović (2014 a), Smith (2010) found
that economic growth depends on two types of factors: production (especially technological
development and human capital) and institutional (creating an environment that will stimulate
growth). He believed in a system of spontaneous order, guided by natural human selfishness,
without the need for intervention and control by political authorities. Nevertheless, he expressed
the need for state interaction in securing contracts, private property and joint defense (Borović,
2014 a). As the father of economic liberalism, a theory that supports capitalism, Smith (2010)
advocated the freedom of the individual to make economic decisions independently in a fully
competitive, free market. Emerged from the need to protect against abuse of political power, this
economic system has survived and governs the economy of the 21st century. Yet there have been
periods in history that have shaken liberal ideology and demanded, instead of the invisible, the
hand of salvation from the state. Until the Great Economic Crisis of 1929, the theoretical views
of neoclassical theory were in line with the real social movements of the time (Marjanović,
2010). By working for their own interest, in an environment of free competition, individuals
received a fair reward for personal effort and at the same time contributed to the general interest.
There was a widespread view that society is a collection of individuals who seek to pursue their
The relationship between economic freedom and economic growth in EU countries
Ivana Brkić
11
private interests (without set social goals), while the government is formed to protect the
individual rights established by the constitution (Clark, 1998). The state had legislative and
executive power, and its primary task was to prevent any type and form of distortion of free
competition. Then, in 1929, the world's largest financial crisis hit, which slowed economic
growth, lowered the standard of living, formed armies of the unemployed, and grew into an
economic and social crisis, causing the collapse of the capitalist system. Based on the ideas of
John Maynard Keynes, for the sake of economic recovery, Theodore Roosevelt, the president of
the United States of America (USA), turned to state interventionism in the economy. The state
became the saviour of the economy and the guarantor of social security, which gave birth to the
welfare state. Its main features were protection and equality (instead of freedom).
After the Second World War, there was a reconstruction of the Western economic system
with the goals set at the International Conference in Bretton Woods. The objectives are the
implementation of the international monetary system for the purpose of maintaining economic
stability, strengthening global economic growth and promoting trade between countries. In order
to achieve the objectives, institutions the International Monetary Fund and the International Bank
for Reconstruction and Development were created.
Until the next crisis of the 1970s, the Keynesian interventionist approach was the
dominant economic doctrine. With the advent of a new economic phenomenon - stagflation
(inflation accompanied by recession), a new economic paradigm emerged - monetarism, a return
to the market and neoliberalism. Formerly an alternative understanding of monetary theory by
Friedrich Hayek now experienced a renaissance. Hayek's book “The Road to Serfdom” is the
backbone of neoliberalism, according to which economic intervention by the state means the
oppression of freedom, while freedom itself is the main driver of development (Hayek, 1943).
The explicit opponents of state interventionism, especially in the field of monetary policy -
monetarists, advocated complete liberalization, free movement of goods, people and money in
international flows, reduction of taxes for the wealthy and tax relief for the poor, as well as
privatization of the public sector (Marjanović, 2010). All of the above, along with fiscal
discipline, freedom to form interest rates and the exchange rate, general market deregulation,
protection of private property, liberalization of foreign direct investment constitute the attributes
The relationship between economic freedom and economic growth in EU countries
Ivana Brkić
12
of the Washington Consensus on Economic Policy in force in most countries of the world. The
global economy has led to globalization, the most important phenomenon of neoliberal theory,
which integrates economies around the world, through trade, communications, financial flows,
movement of people (work) and knowledge transfer (technology).
2.1.2. ON THE DEGREE OF MARKET REGULATION
"A society that puts equality before freedom will get neither;
A society that puts freedom before equality will get a high degree of both."
Milton and Rose Friedman, Freedom to choose, 1980
Economic theory discusses the issue of state involvement in economic and other flows of
socio-economic life of citizens. Liberals believe that eradicating socialism from life and practice
in all countries of the world, cutting bureaucracy, abolishing subsidies and opening borders will
lead to faster and more sustainable development. Another current argues that state interaction,
intelligently applied, may produce better results (De Haan & Sturm, 2000). Stiglitz (2009) points
out numerous examples that balanced government involvement in economic flows results in
economic growth and poverty reduction (East Asian, Scandinavian countries, and even the initial
success of the United States may be attributed to government involvement in economic flows).
Despite the opposing views, the idea of a free market is widely present and supported.
De Haan & Sturm (2000) point out that the debate on the degree of market regulation is
burdened by two things: the lack of a precise definition of the meaning and manner of measuring
economic freedom, and the lack of data over a long period of time for a large number of
countries. All this makes it difficult to analyze the link between economic freedom and
prosperity.
As Samuelson & Nordhaus (2009) conclude, by weighing the importance of relative
achievement between the state and the market, scientific and other public often simplify the
complex choices faced by a society. The market can be very stimulating, but without the right
legal structure that encourages private initiative, investment and mutual trade, markets can be the

The relationship between economic freedom and economic growth in EU countries
Ivana Brkić
13
ones that distort capitalism embodied in growing inequality and poverty. The role of the state in
the modern economy is to ensure market efficiency, reduce inequalities and foster economic
growth and stability.
The progress of real production marked the twentieth century. Countries with the highest
economic growth, such as Great Britain in the 19th and the USA in the 20th century, were role
models to many countries striving for greater prosperity. The fall of the Berlin Wall in 1989
triggered the process of transition from socialism to capitalism. This implied a change in the
economic system, and before the eyes of many contemporaries, an experiment was conducted in
the world laboratory on the advantages or disadvantages of one compared to the other. Former
socialist countries needed to prove that economic liberalization leads to economic growth. Poor
economic performance is closely linked to institutional deficiencies, while good government-led
economic policy is crucial to the economic development process (Frye & Shleifer, 1996). The
goal of transformation was to establish democracy and introduce market economy. This meant
the need to end the monopoly power of the Communist Party and move towards political
pluralism. In the domain of economics, this change entailed a reorientation from centrally
planned economy to market economy, which implies the extension of economic freedom (Piątek,
Szarzec & Pilc, 2013).
As Ayal & Karras (1998) explain, there are many examples which show that countries
which reduced government direct involvement in economic activity demonstrate positive growth
rates. Economic progress is linked to privatization policy, changes in laws that liberalize internal
and external trade, and other measures that allow citizens to enjoy the fruits of their labor. The
degree of implementation of such a policy varies from country to country, mainly due to the
influence of the inherited and adopted social, cultural and institutional forms. There is still no
consensus in scientific circles about whether there is a link between the political (economic)
system and economic growth, or about the direction of causality if such a link is established.
In an economically free system, individuals are the basic economic actors, and the state
assumes responsibility only for controlling the smooth functioning of the market. This creates the
environment and builds the foundation for economic growth and development. Complete
The relationship between economic freedom and economic growth in EU countries
Ivana Brkić
14
freedom and a real opportunity to enter and exit the market create competition that encourages
companies to thrive. Companies are making greater efforts to satisfy the demand and desires of
the consumer for fear of being taken over by rival, which indirectly affects the well-being and
prosperity of the entire society (Erdal & Yenipazarli, 2013).
Individuals in a free society are believed to benefit from the growth of freedom, while its
decline distorts the social and economic order (Sen, 1999). In this context, North (1990) analyzes
the link between institutions and economic performance. He finds that the absence of institutions
and rules results in a lack of trust in the enforcement of contracts, the protection of private
property, the rule of law and the independence of the judiciary. Institutions that promote
economic freedom are those that increase productivity (Dawson, 1998) and investment
opportunities (Besley, 1995). North (1990) argues that high tax rates limit reaping the benefits of
one's labor. High inflation also diminishes the intrinsic value of money, changes the terms of
long-term contracts, and makes it difficult for individuals and companies to rationally plan the
future. Restricting trade freedom and controlling capital flows neutralize exchange profits,
reducing the yields of economic activities and productivity, which impedes investment
incentives. Certainly, large government spending, as well as large-scale state-led production, can
have the effect of reducing opportunities for individual production activities.
2.1.3. ECONOMIC INSTITUTIONS AS DETERMINANTS OF ECONOMIC GROWTH
Economic growth means increasing total production of goods and services in the long run. In
other words, economic growth is an expansion of potential gross domestic product (Samuelson &
Nordhaus, 2009).
Economic growth is the most powerful mechanism for maintaining a high standard of
living, which also implies a long-term increase in per capita income. In addition to achieving the
specific economic and social goals of society, economic growth is one of the most important
issues and aspirations of governments of all countries.

The relationship between economic freedom and economic growth in EU countries
Ivana Brkić
15
Although each country has its own specificities that can affect economic growth,
regardless of the wealth of a country, there are four main wheels of economic growth
(Samuelson & Nordhaus, 2009):
1. Human resources (labor supply, education, discipline, motivation)
2. Natural resources (land, minerals, fuels, environmental quality)
3. Capital formation (machinery, factories, roads)
4. Technology (science, entrepreneurship, management).
Their relations are represented by the aggregate function of production:
Q = AF (K, L, R) (1)
where Q = output, K = productive services of capital, L = labor inputs, R = natural resource-
inputs, A = level of technology, F = production function.
However, there is no unique combination by which these four factors lead to prosperity.
The United States, Europe, Asian countries have taken different paths to economic success.
According to Wu (2011), more recent theorists believe that greater economic growth requires
several of these factors. He points out that the problem of underdeveloped countries is not the
lack of potential, but the inability to exploit them.
In order to understand why a certain country records a more dynamic rate of economic
growth compared to others, the determinants of growth need to be established. Despite the
numerous theories of economic growth distinguished by economic science, the specification of
all variables that have an impact on economic growth has not yet been made. The dissertation
raises the question of whether economic freedom is one of them. Owning physical resources is
not in itself a guarantee of economic well-being. More often, they require the implementation of
appropriate policies and the creation of institutions that will serve growth.
Gwartney, Holcombe & Lawson (2006) provide a brief chronology of the development of
theories of economic growth and its factors. According to them, neoclassical theory, based on the
theory of growth constructed by Solow (1956) and developed by other authors (primarily Lucas,
1988; Romer, 1986, 1990), focused on the key aspects of growth, on physical and human
resources, as inputs in the production process, as well as on technological advantages as

The relationship between economic freedom and economic growth in EU countries
Ivana Brkić
16
determinants of economic progress. In the theory of growth formulated by Solow (1956), the
influence of government or institutions has not played a significant role (Carlsson & Lundström,
2002).
Another wave of theories is based on the geographical/location aspect of growth. Thus,
Sachs (2001), Gallup, Sachs & Mellinger (1999) and Diamond (1997) argue that temperature
climate and market accessibility are essential for achieving high levels of income and economic
growth. Tropical areas, on the other hand, aggravate conditions and reduce worker productivity.
An institutional approach to growth theory, whose main supporters are Scully (1988,
2014), North (1990), Barro (1996), Landes (1998), Knack (1996, 2003), Hall & Jones (1999) and
Acemoglu, Johnson &Robinson (2001) emphasizes the importance of creating an institutional
environment conducive to market development. These are, first and foremost, protection of
property rights, obligations to fulfill contractual obligations, freedom of exchange and market-
based pricing.
According to representatives of neoclassical growth theory, successful economies are
those with a high capacity to accumulate human and physical capital, as well as those with
advanced technology. However, the political and social environment, which also includes
economic freedom, affects a country's ability to perform such accumulation. Thus, Solow (1956),
Cass (1965) and Koopmans (1965) explained that differences in income are due to different
savings rates and preferences while institutions were not mentioned in the context of the
determining variables of economic growth. Subsequent followers Romer (1986) and Lucas
(1988) discussed external factors that may affect growth but remained in the spirit of neoclassical
theory. Only North & Thomas (1973) interpreted the comparative growth through differences in
institutions. According to them, institutions are rules of the game in a society or designed
constraints that govern human interactions. According to Acemoglu, Johnson & Robinson
(2005), the most significant form of economic institutions are the protection of property rights
and the existence of a (perfect) market, which shape social incentives, affect investment, physical
and human capital, technology and the organization of production. Without protection of
property rights, individuals will not be motivated to invest in physical and human capital, as well
The relationship between economic freedom and economic growth in EU countries
Ivana Brkić
17
as in the development of technology, while the absence of a free market will lead to
misallocation of resources and profit from trade. Therefore, it is argued that institutions are
endogenous variables of economic growth, and there is no doubt that their presence affects the
greater wealth of a society (relative to others).
Until recently, there have been hardly any empirical works on examining the
determination of economic growth by economic freedom. As Ayal & Karra (1998) state, this is
somewhat surprising, given that the idea of freeing economic flows from government
intervention as a recommendation for economic growth dates back to the founders of modern
economics (Smith, 2010), and many other great scholars (Locke, 1690 (1942); Malthus, 1820
(1986); Lewis, 1955 (2013); Mill, 1956; Friedman, 1962; North, 1988) spoke of the importance
of institutions for economic growth. True, this can be explained by the lack of data to study the
above-mentioned relations, but also by the fact that macroeconomics and the phenomenon of
economic growth has mentally stood out in the recent past. Even as Smith (2010) defined,
economic growth is determined by two groups of factors: production (especially technological
development and human capital), which is in the spirit of neoclassical theory of growth and
institutional factor (Borović, 2014 a). Adequate institutional framework implies a stimulating
environment, a favourable investment climate and a functional legal system that protects
property rights, all of which form the basis of economic prosperity. On the other hand, corruption
and poor protection of property rights decrease the incentive to invest (Mauro, 1995). Moreover,
technological innovations and their application through investment can be hampered by rigorous
bureaucratic procedures, which themselves represent a suitable ground for corruption.
Contributions to the theory of economic growth by scholars Romer (1986) and Lucas (1988)
have made it possible to overcome the neoclassical models that put technology at the heart of
explaining growth. Even North (1990) focused on economic institutions that regulate economic
relations and thus can (de)stimulate economic agents to productivity. Subsequently, studies that
attempted to measure the impact of institutions on economic growth began to be published (e.g.
Barro 1991; Sachs & Warner 1997). Many studies questioned whether institutions lead to
prosperity directly by increasing factor productivity or indirectly through investment. Dawson
(1998) proved that in both cases the institutional factor influences economic growth. The first
empirical studies on the impact of economic institutions on economic growth were published by
The relationship between economic freedom and economic growth in EU countries
Ivana Brkić
18
Knack & Keefer (1995), followed by Hall & Jones (1999) and Acemoglu, Johnson & Robinson
(2001, 2002), using the only available and insufficiently accurate indicators on the presence of
institutions covering property rights protection and protection against risk expropriation, in the
period between 1985 and 1995. By looking at the bivariate relationship, scientists found that
countries with stronger property rights, that is, better economic institutions, have higher average
incomes. Other types of institutions, such as political and civil liberties have also been examined
eg. Kormendi & Meguire (1985), Barro (1991, 1996), but their results were diverse. Hall &
Jones (1997) defined economic infrastructure as a collection of laws, institutions, and
government policies that make up the economic environment. The institutional infrastructure in a
coalition with standard constraints on economic theory determines production performances and
economic opportunities. An efficient government that provides a strong justice system and
implements a policy of protecting property rights is the embodiment of a well-defined economic
structure. Economic institutions create economic performances and (perhaps more importantly)
influence the distribution of resources. They are determined by the collective choice of society
that determines their economic consequences. The possibility of choice can turn into a problem,
since a different set of economic institutions makes different distribution of resources and thus
satisfy different interest groups. The political power of some may thus take precedence over a
more effective choice.
The starting point is that the difference in institutions leads to different degrees of
economic growth, based on the idea that people organize their societies in a way that either leads
to progress or to stagnation and decline. One way of organizing will direct and encourage people
to innovate, take risks, have an equal chance of success and thus achieve economic growth
together. The other one, constrained by system, bureaucracy, control and corruption, will slow
down the economy and create poverty.

The relationship between economic freedom and economic growth in EU countries
Ivana Brkić
19
2.1.4. DEFINING ECONOMIC FREEDOM
There is no universally accepted definition of the concept of economic freedom, although
most recognized scholars agree that economic freedom is the fundamental right of every person
to have their work and property at their disposal and to control them.
As defined by Gwartney & Lawson (1997), representing the Fraser Institute, the
economic freedom of an individual is reflected in the ability to acquire property without the use
of force, fraud or theft, and to have it protected from physical invasion by others; they are free to
use, exchange or donate the acquired property, as long as their actions do not jeopardize the
identical rights of others.
O'Driscoll, Feulner & O'Grady (2003), representing the Heritage Foundation, define the
economic freedom as a condition in which individuals are free to work, produce, spend, invest as
they wish. Their security and protection are thus enabled by the state, which at the same time
undertakes not to violate the said rights of economic agents. In an economically free society, the
role of the state comes down to the protection of property and enforcement of contracts
(Gwartney, Holcombe & Lawson, 2004). An economically free state allows for an unhindered
flow of labor, capital and goods, and refrains from coercion and restraints except in the case of
defense and protection of freedom as such (Wu, 2011). The absence of governmental corrections
or constructions in the area of production, distribution and consumption of goods and services,
except in the case of applying the necessary measures to protect and maintain freedom as a
concept, characterizes economic freedom (O'Driscoll et al., 2003). If a state fails to protect
private property, engages in confiscation of property without full compensation and restricts
voluntary exchange, it is the one that disrupts the economic freedom of its citizens. In practice,
the government constructs negative incentives by such actions, in terms of entrepreneurship and
productivity, creating skepticism in people about making profits based on their productive efforts
(Panahi, Assadzadeh & Refaei, 2014).
Miller & Kim (2016) interpret the restriction of economic freedom through excessive
government intervention in the field of economic activities, which thus obstruct the autonomy of

The relationship between economic freedom and economic growth in EU countries
Ivana Brkić
20
individuals in pursuit of a better standard of living. The dualism of economic freedom goals is
reflected in the following: minimize government coercion or constraints, and create and maintain
a shared sense of freedom for all citizens (Miller & Kim, 2016). Governmental actions are often
necessary to form the unity of the people. As the power of authorities is difficult to contain, it
can easily cross the line of the necessary. Often, in the name of equality or to meet some
seemingly noble social needs, restrictions are imposed that put the few in a privileged position
(Miller & Kim, 2016).
Excessive government presence in economic flows increases the costs of the entire
society. As understood by De Haan, Lundström& Sturm (2006) economic freedom is a major
component of a market economy. At its core are protection of private property, freedom of
choice and voluntary exchange (De Haan et al., 2006). Substituting market mechanisms with
government decisions, entrepreneurial energy is distorted into so-called 'rent seeking', which
inevitably decreases the wealth of a nation (Miller & Kim, 2016).
In its range, economic freedom means freedom and right at all stages of social
reproduction: production, exchange, distribution and consumption. Decentralized decision-
making, as a characteristic of the spirit of an economically free society, implies that individuals
are free to work, produce, consume and invest the way they want. In the report of the Heritage
Foundation, Miller & Kim (2013) elaborate on and thoroughly define economic freedom. They
explain that in an economically free society, every person controls the fruits of their labor,
individuals succeed or fail on the basis of their effort and ability, while the government promotes
equal conditions in terms of engaging resources for production and consumption. It goes without
saying that some government action is necessary for the peaceful development of a society. That
way, the population pays taxes that would ensure public safety, property protection, common
defense, maintaining the stability of money, etc. There are also "public goods" that the
government provides more efficiently than the private sector could.
Economic freedom does not mean anarchy as stated by Miller, Holmes & Feulner (2013).
Individuals who enjoy the benefits of economic freedom have a responsibility to respect the
The relationship between economic freedom and economic growth in EU countries
Ivana Brkić
21
economic rights and freedom of others within the rule of law, while the state is established to
provide the basics of protecting positive economic rights such as property and contracts.
Gwartney, Lawson & Block (1996) distinguish between economic, political, and civil
liberties. Political liberty is reflected in the fairness of elections and the existence of a political
alternative, as well as the freedom of citizens to participate in political elections, lobby and select
candidates. Civil liberty encompasses freedom of the press, as well as the right of individuals to
gather and express different religious beliefs and express views without fear of physical or any
other violence. Therefore, Gwartney et al. (1996) emphasize that a country can be very liberal in
political terms, and that at the head of the country is a democratically elected party which
protects civil liberties but still adopts policies that are contrary to economic freedom.
While Gwartney et al. (1996) distinguish between political, economic, and civil liberties,
De Haan & Sturm (2000) distinguish between individual and collective freedom. Individual
freedom means the right to undertake and conduct economic activities that are protected from
arbitrary control and interference by state and other authorities and individuals. Collective
freedom is an indicator of the extent to which the economic system is free and the result of the
expressed will of the majority of citizens as opposed to the domination of the will of the ruling
few.
Kešeljević (2013) views economic (and divides) freedom as a subjective and objective
category. The levels of economic freedom (at different historical and political economic
moments) can be interpreted separately. Thus, equal level of economic freedom may be
perceived differently by individuals (subjective aspect). The objectivity of economic freedom is
created when a certain level of economic freedom is a reflection of the general consensus in a
society.
Berlin (1992) clarifies the concepts of negative versus positive freedom. Negative
freedom is characterized by the absence of any constraints whereas positive freedom implements
restrictions in order to achieve the common good. In the context of economic freedom, negative
The relationship between economic freedom and economic growth in EU countries
Ivana Brkić
22
freedom implies the smooth operation of individuals (within the legal framework), while positive
freedom implies a controlling and active role by the government over individuals.
2.1.5. MEASURING ECONOMIC FREEDOM
In order to define the impact of economic freedom on economic growth, economic
freedom needs to be a measurable category. The complexity of "calculating" the level of
economic freedom lies in its qualitative rather than quantitative feature. Consequently, a certain
extent of subjectivity and imprecision is an inevitable element of any attempt to measure it
(Hanke & Walters, 1997). According to Kešeljević (2013) it is clear that economic freedom is
more present in capitalist than in socialist countries, and that nowadays the degree of economic
freedom in some countries is higher than it used to be, but that these observations are not
accurate enough suitable for scientific analysis and proof. In order to specify these differences
and formulate an objective criterion for ranking economic freedom, it is necessary (a) to identify
key elements of economic freedom (b) to quantify these elements (c) to assess the importance, or
the weight, of these elements (Hanke & Walters, 1997).
Several institutions and individuals have been compiling indices of economic freedom so as to
identify its level of presence and rank countries based on the given criteria. The most
sophisticated indices of economic freedom that have been devised and used in scientific circles
are:
1. Freedom House Index
2. Scully and Slottje Index (1991)
3. Fraser Institute Economic Freedom Index
4. Economic Freedom Index of the Heritage Foundation
Freedom House Index
Although there had been earlier attempts, it can be said that the first attempt to systematically
measure economic freedom was made in 1983 by Gastil and Wright (Gastil, 1984) under the
cloak of Freedom House. The process of calculating political and civil liberty was upgraded with
The relationship between economic freedom and economic growth in EU countries
Ivana Brkić
23
data on the economic system, after which the countries were ranked. Such an index contained the
protection of property rights, freedom of doing business and freedom from corruption. Friedman
(1988) then carried out the first research on the correlation of the given index with gross
domestic product per capita and found that index growth by one unit led to a significant 49%
increase in GDP per capita.
Over time, this indicator progressed and in 1996 evolved into the index of economic
freedom, the results of which were published in the World Survey of Economic Freedom
(Messick, 1996). The ranking of the economic freedom of 82 countries was carried out on the
basis of six categories of freedom: possession of property, earning a living, running a business,
investing one's own earnings, foreign trade, participating in the economic market. Each category
was scored from 0 to 2 or 3, and the sum of all individual categories represented the total index.
There are several reasons why this index found less application in scientific studies. Although it
was planned to continuously monitor the state of economic freedom, so far only one publication
has been published for the period 1995-1996. More specifically, initially this index was not
created to indicate the importance of economic freedom in the context of economic growth, but
rather to emphasize the connection with the primary areas of research of Freedom House -
political rights and civil liberty. At the same time, taxation measures were not included in the
calculation, and government spending is taken into account and treated as crucial only in the
borderline cases of the categories of "mostly unfree" and "unfree" countries. Subjectivity in
measurement, a small range in ranking, and the opacity of data sources have contributed to the
index not becoming/remaining present in scientific circles.
Scully and Slottje Index (1991)
The authors who were among the first to devote themselves to monitoring economic
freedom and studying its relation to economic growth are Scully & Slottje (1991). These authors
developed a 15-element index covering 144 countries. The categories that were monitored were
freedoms of: foreign currency, property, movement, information, civil rights, classification of the
economic system, print media, broadcast media, domestic and international travel, peacetime
gathering, as well as freedom from work permits, from search without a warrant, from arbitrary

The relationship between economic freedom and economic growth in EU countries
Ivana Brkić
24
seizure of property and from military recruitment. The index covered only the year of 1980, and
the results showed a positive link between economic freedom and prosperity.
Fraser Institute Economic Freedom Index
As explained by Hanke & Walters (1997), many scholars and contemporaries agreed that
the approach taken by Gastil & Wright (Gastil, 1984) overestimates the political and civil
freedom (at the expense of economic freedom). This is why many worked hard to develop an
alternative indicator. The most prominent results were obtained by Gwartney et al. (1996), who
published the survey Economic freedom of the world, 1975-1995in 1996. A particular
contribution of this study is the wide time span due to the fact that economic freedom exerts
beneficial effects on the economic well-being of the country after some time. Since 2000, the
Fraser Institute has been publishing the annual report "Economic Freedom of the World", which
reports on political and institutional support for economic freedom on the basis of the Economic
Freedom Index. Economic Freedom Index of the Fraser Institute (EFW) currently ranks 157
countries (data for about 100 nations and territories are available from 1980 and for some
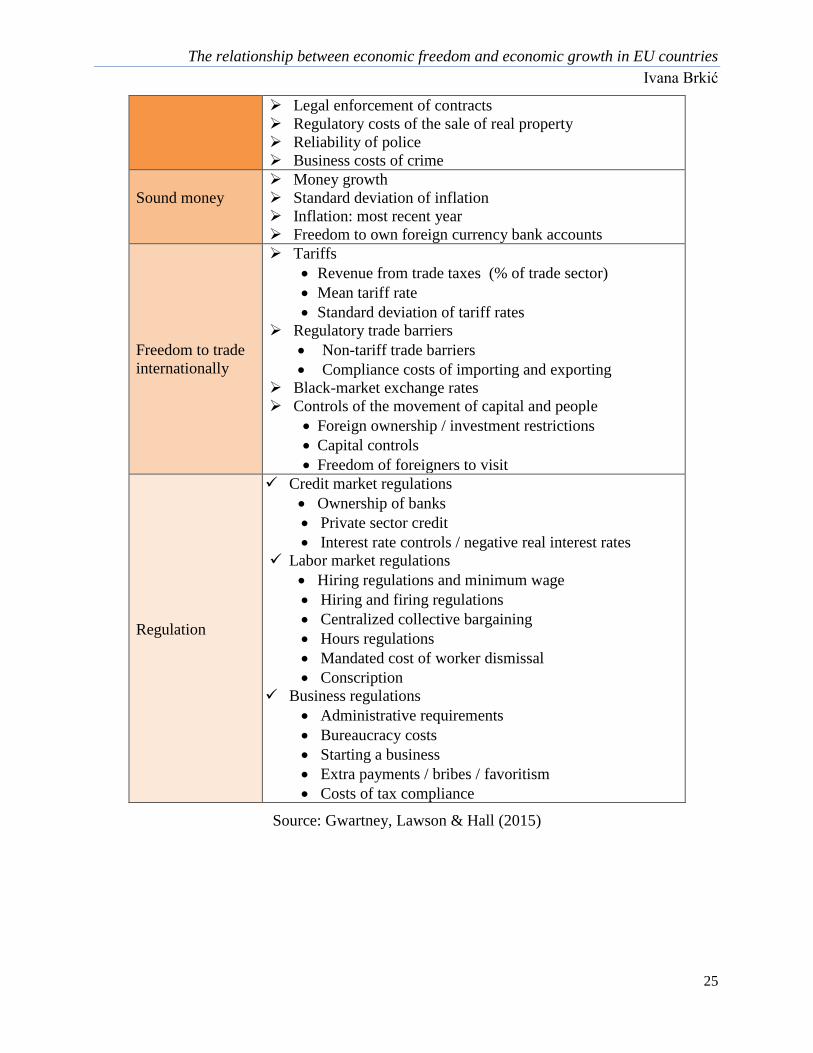
countries as early as 1970). Forty-two data processed into twenty-four categories are used to
construct the aggregate index, after which economic freedom was divided into five larger areas1
(Gwartney, Lawson & Hall, 2015). Each of the indicators is ranked on a scale from 0 (no
freedom) to 10 (complete freedom).
Table 2. Categories of Fraser Institute Economic Freedom
Size of
government
Government spending
Transfers and subsidies
Government enterprises and investment
Top marginal tax rate
Top marginal income tax rate
Top marginal income and payroll tax rate
Legal system and
property rights
Judicial independence
Impartial courts
Protection of property rights
Military interference in rule of law and politics
Integrity of the legal system
1During the development of the index, the names and numbers of the areas were changed, and care should be taken
when analyzing reports and papers from different periods.
The relationship between economic freedom and economic growth in EU countries
Ivana Brkić
25
Legal enforcement of contracts
Regulatory costs of the sale of real property
Reliability of police
Business costs of crime
Sound money
Money growth
Standard deviation of inflation
Inflation: most recent year
Freedom to own foreign currency bank accounts
Freedom to trade
internationally
Tariffs
Revenue from trade taxes (% of trade sector)
Mean tariff rate
Standard deviation of tariff rates
Regulatory trade barriers
Non-tariff trade barriers
Compliance costs of importing and exporting
Black-market exchange rates
Controls of the movement of capital and people
Foreign ownership / investment restrictions
Capital controls
Freedom of foreigners to visit
Regulation
Credit market regulations
Ownership of banks
Private sector credit
Interest rate controls / negative real interest rates
Labor market regulations
Hiring regulations and minimum wage
Hiring and firing regulations
Centralized collective bargaining
Hours regulations
Mandated cost of worker dismissal
Conscription
Business regulations
Administrative requirements
Bureaucracy costs
Starting a business
Extra payments / bribes / favoritism
Costs of tax compliance
Source: Gwartney, Lawson & Hall (2015)
The relationship between economic freedom and economic growth in EU countries
Ivana Brkić
26
Economic Freedom Index of the Heritage Foundation
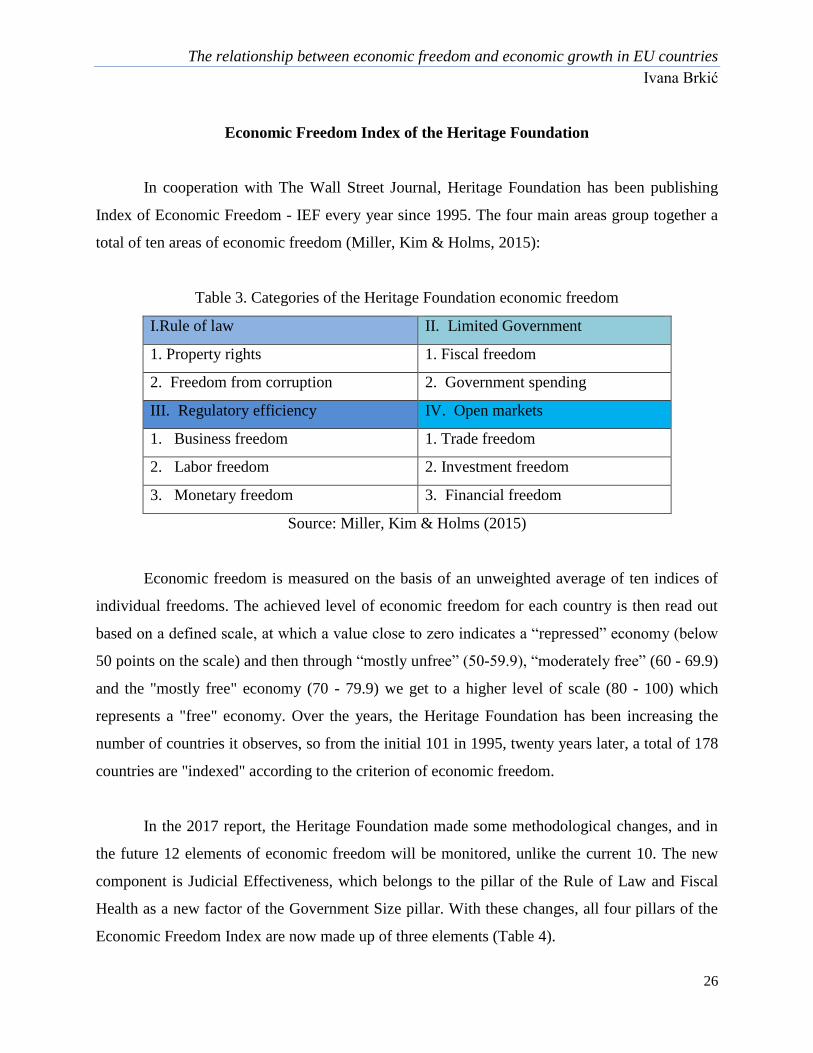
In cooperation with The Wall Street Journal, Heritage Foundation has been publishing
Index of Economic Freedom - IEF every year since 1995. The four main areas group together a
total of ten areas of economic freedom (Miller, Kim & Holms, 2015):
Table 3. Categories of the Heritage Foundation economic freedom
I.Rule of law II. Limited Government
1. Property rights 1. Fiscal freedom
2. Freedom from corruption 2. Government spending
III. Regulatory efficiency IV. Open markets
1. Business freedom 1. Trade freedom
2. Labor freedom 2. Investment freedom
3. Monetary freedom 3. Financial freedom
Source: Miller, Kim & Holms (2015)
Economic freedom is measured on the basis of an unweighted average of ten indices of
individual freedoms. The achieved level of economic freedom for each country is then read out
based on a defined scale, at which a value close to zero indicates a “repressed” economy (below
50 points on the scale) and then through “mostly unfree” (50-59.9), “moderately free” (60 - 69.9)
and the "mostly free" economy (70 - 79.9) we get to a higher level of scale (80 - 100) which
represents a "free" economy. Over the years, the Heritage Foundation has been increasing the
number of countries it observes, so from the initial 101 in 1995, twenty years later, a total of 178
countries are "indexed" according to the criterion of economic freedom.
In the 2017 report, the Heritage Foundation made some methodological changes, and in
the future 12 elements of economic freedom will be monitored, unlike the current 10. The new
component is Judicial Effectiveness, which belongs to the pillar of the Rule of Law and Fiscal
Health as a new factor of the Government Size pillar. With these changes, all four pillars of the
Economic Freedom Index are now made up of three elements (Table 4).

The relationship between economic freedom and economic growth in EU countries
Ivana Brkić
27
Table 4. Categories of the Economic Freedom Index of the Heritage Foundation that have been
in use since 2017
I.Rule of law II. Government size
1. Property rights 1. Tax burden
2. Government integrity 2. Government spending
3. Judicial effectiveness 3. Fiscal health
III. Regulatory efficiency IV. Open markets
1. Business freedom 1. Trade freedom
2. Labor freedom 2. Investment freedom
3. Monetary freedom 3. Financial freedom
Source: Miller & Kim (2017)
The former component Freedom from Corruption was refined and enriched with
additional sub-factors and more thorough data sources that are much more extensive, and
subsequently renamed to "Government Integrity". Fiscal freedom also underwent a cosmetic
change and is now called "Tax Burden", to make it more explicit about what this component is
and what it measures.
Of these four Indices of Economic Freedom, applied by scholars, policy makers as well
as international organizations, the most prominent are the two, the Index of the Fraser Institute
and The Index of the Heritage Foundation/the Wall Street Journal, primarily due to the
continuity of monitoring the state and promptness in publishing the index.
Heckelman (2000) points out that the greatest advantage of the Economic Freedom Index
of the Heritage Foundation is reflected in the institutional measures for the formation of the
index, i.e. monitoring the effectiveness of certain policies, which may signal to authorities
whether the given policies are appropriate and in the service of increasing economic freedom. On
the other hand, the Fraser Institute predominantly uses macroeconomic indicators to construct its
index, which is a consequence, not a cause, and therefore cannot directly serve economic policy
makers.
Although they have data longer than the Heritage Foundation, the Fraser Institute has
only been publishing annual reports on the state of economic freedom since 2000 (previous
indices were presented for an interval of five years), which is why the Heritage Foundation is
now at an advantage. On the other hand, this advantage may take the form of a disadvantage
The relationship between economic freedom and economic growth in EU countries
Ivana Brkić
28
when considering the effects common to business cycles that have no relation to economic
freedom. Heckelman (2000) also praises the consistency in the ranking system of the Heritage
Foundation, which the Fraser Institute has somewhat lost in its desire to improve the index itself,
and some data are inconsistent and therefore unusable for long-term analysis. Today, it can be
said that the Index of the Heritage Foundation also underwent minor changes, but a clear parallel
can be drawn with respect to the earlier construction. Thus, Fiscal freedom originates from
"Taxation" but kept an analysis of the same area - the amount of corporate and income taxes.
“State interventions in the economy” turned into Government spending sub-index, still tracking
the share of state ownership and the size of government spending. "Regulations" are expressed
through Business freedom dimension, for the formation of which data are taken from the World
Bank's annual report “Doing Business”. Labor freedom, which has been included in reports since
2005, was analyzed in the “Wage-Price Control” sector, where the focus was on analyzing the
existence of minimum wage laws, as well as government subsidies and the presence of price
controls, which is today with an analysis of “Monetary Policy”, the domain of Monetary
freedom. Financial freedom was expressed by "Banking", and formed on the basis of regulations
and share of state ownership in the banking sector. Investment freedom had the form of "Flows of
capital and foreign investment", while the focus remains on monitoring and enhancing the equal
treatment of foreign and domestic investors. Trade freedom or the former "Trade Policy" deals
with comparing the level of tariff and (non)existence of non-tariff barriers. The new dimension
was given to Freedom from corruption instead of the previous “Black Market”, so now its status
in the world is monitored based on the Corruption Perception Index, while the size of the black
market is the domain of some other research. The scale according to which economic freedom
was measured ranged from the first to the fifth level, with lower values implying less economic
freedom, but for more precise definition since 2007 the scale has been expanded from zero to
one hundredth value of the index.
As further stated by Heckelman (2000), data for the Fraser Institute index are often
missing, which further obstructs the consistency of the database through monitoring different
categories for different countries. The situation is similar with the Heritage Foundation index,
but to a much lesser extent - their data are missing only for individual countries in the first years

The relationship between economic freedom and economic growth in EU countries
Ivana Brkić
29
of measurement, while later omissions were only observed in countries where there is a current
state of war or certain political and national problems.
While some authors (Ram, 2014; Pérez-Moreno & Angulo-Guerrero, 2015) find
differences in the country ratings of these two indices, the leading, relevant authors (De Haan
&Sturm, 2000; De Haan, 2003; Hanke & Walters, 1997) point to the similarities of the Economic
Freedom Index of the Heritage Foundation and the Fraser Institute. These authors prove this by
the high level of the Kendall and Spearman’s correlation coefficient between the two indices.
The complementarity of these two parameters of economic freedom is also reflected in the equal
importance they attach to institutions securing property rights, contract enforcement, support for
the freedom of international exchange of goods and capital (Kešeljević, 2013), but also to other
areas of economic liberalization. Thus, both indices negatively assess barriers to entry into the
product and labor market, and the value on the scales also declines when price and wage control
is observed (Hanke & Walters, 1997). Finally, the focus of interest of both institutions is both
fiscal and monetary policy: both indices negatively interpret large government spending and
positively the measures taken to control inflation.
Table 5. Comparison of the Economic Freedom Index of the Fraser Institute and the Heritage
Foundation
Fraser Institute Heritage Foundation/Wall Street Journal
Size of Government Limited Government
Government spending
Transfers and subsidies
Government enterprises and investment
Top marginal tax rate
Top marginal income tax rate
Top marginal income and payroll
tax rate
Government spending
Fiscal freedom
Top marginal individual income
tax rate
Top marginal corporate tax rate
The overall tax burden as a
percentage of gross domestic
product
Legal System and Property Rights
Rule of Law
(Property Rights and Freedom from
Corruption)
Judicial independence
Impartial courts
Protection of property rights
Judicial independence
Judicial effectiveness
Protection of property rights

The relationship between economic freedom and economic growth in EU countries
Ivana Brkić
30
Military interference in rule of law and
politics
Integrity of the legal system
Legal enforcement of contracts
Regulatory costs of the sale of real
property
Reliability of police
Business costs of crime
Expropriation of private property
Judicial corruption
Enforcement of contracts
State-owned enterprises
Corruption perception index
Sound Money Monetary Freedom
Money growth
Standard deviation of inflation
Inflation: most recent year
Freedom to own foreign currency bank
accounts
The weighted average inflation rate
for the most recent three years
Price controls
Freedom to Trade Internationally Trade Freedom
Tariffs
Revenue from trade taxes (% of
trade sector)
Mean tariff rate
Standard deviation of tariff rates
Regulatory trade barriers
Non-tariff trade barriers
Compliance costs of importing and
exporting
Black-market exchange rates
Controls of the movement of capital and
people
Foreign ownership/investment
restrictions
Capital controls
Freedom of foreigners to visit
Tariffs
The trade-weighted average tariff
rate
Trade barriers
Non-tariff barriers
Restrictions on the
movement of capital and
people
Investment freedom
Regulation
Financial Freedom
Labor Freedom
Business Freedom
Credit market regulations
Ownership of banks
Private sector credit
Interest rate controls / negative real
estate rates
Labor market regulations
Financial freedom
The extent of government
regulation of financial services
The degree of state intervention
in banksand other financial firms
through direct and indirect
ownership
The extent of financial and capital
market development
Government influence on the
allocation of credit
Openness to foreign competition
Labor freedom
Ratio of minimum wage to the

The relationship between economic freedom and economic growth in EU countries
Ivana Brkić
31
Hiring regulations and minimum
wage
Hiring and firing regulations
Centralized collective bargaining
Hours regulations
Mandated cost of worker dismissal
Conscription
Business regulations
Administrative requirements
Bureaucracy costs
Starting a business
Extra payments / bribes / favoritism
Cost of tax compliance
average value added per worker
Hindrance to hiring additional
workers
Difficulty of firing redundant
employees
Rigidity of hours
Legally mandated notice period
Mandatory severance pay
Business freedom
Starting a business – procedures
(number)
Starting a business – time (days)
Starting a business – cost (% of
income per capita)
Starting a business – minimum
capital (% of income per capita)
Obtaining a license – procedures
(number)
Obtaining a license – time (days)
Obtaining a license – cost (% of
income per capita)
Closing a business – time (years)
Closing a business – cost (% of
estate)
Closing a business – recovery rate
(cents on the dollar)
Source: Author, adapted from Gwartney, Lawson & Hall (2015) and Miller, Kim&Holms (2015)
Kešeljević (2007, 2013) distinguishes between economic freedom as a subjective and
objective category. If it represents a personal experience (whether the tax of 20% is high or low),
it is subjective, while the objective one is defined by society. Without objective freedom,
subjective freedom is not possible. The very act of determining the degree of satisfaction with a
certain level of freedom implies the existence of freedom in itself as an objectively given
category.
Kešeljević (2007, 2013) regards the absolute economic freedom of the individual as the
absence of any obstacles, which is certainly not possible. Just as absolute freedom is actually
shaped by education, public opinion, culture and values that govern one society, so is the
restriction (and relativism) of economic freedom actually in the interest of preserving the
freedom itself.

The relationship between economic freedom and economic growth in EU countries
Ivana Brkić
32
Individual freedom accepts the framework of collective freedom only in the case of
society in the function of protecting the property rights of individuals. Collective economic
freedom shows the extent to which the system reflects the will of the majority to create the form
of political and economic system best suited to society (Kešeljević, 2013).
If we were to decide whether economic freedom is a negative (which implies the absence
of any restriction) or a positive category (where individual control is visible, which requires a
more active role of the state), we would have to admit that it is more characterized by the latter.
It is the legal framework that limits the concrete and uncontrolled actions of individuals, thereby
giving economic freedom a positive character (Kešeljević, 2013).
Finally, Kešeljević (2013) classifies different views and interpretations of economic
freedom by institutions (Table 6).
Table 6. Similarities and differences in the interpretation of categories of economic freedom
Economic freedom Index of economic freedom
Fraser Heritage Freedom House
Subjective
Objective √ √ √
Absolute √ √ √
Relative
Collective √
Individual √ √
Positive
Negative √ √ √
Source: Kešeljević (2013)
From the perspective of the subject of research of this doctoral dissertation, the
arguments about the high similarity between the leading two indices of the Fraser Institute and
the Heritage Foundation speak in favour of the fact that the results of the study on the impact of
economic freedom on economic growth are not dependent on the choice of indicators (indices) of
economic freedom. The selection of the Economic Freedom Index of the Heritage Foundation for
the purpose of the research into the impact on the economic growth of a European group of
countries was made partly because of the methodology, the availability of a wealth of data and
the wide application in previous research.
The relationship between economic freedom and economic growth in EU countries
Ivana Brkić
33
2.1.6. CHAPTER SUMMARY
In order to follow the chronology of the development of economic thought from the
aspect of economic freedom, the previous chapter analyzes the concept of economic freedom,
dating back to the time of Adam Smith, who already came to the conclusion in 1776 that an
institutional environment deprived of excessive control by countries is a determinant of
economic growth. On the other hand, history tells us that in the past there have been periods
when instead of the invisible, the hand of salvation was sought from the state. Therefore, it was
discussed whether economic freedom is the cause of economic growth but also of economic
crises, or whether crises just arose because of the lack of complete liberalization in all domains
of the economy. In order to understand this, we have analyzed various scientific approaches to
the optimal degree of market regulation, the role of the state and the importance of a free market
and a competitive environment for stimulating economic growth. Undoubtedly, appropriate
policy and economic institutions liberalizing the market are at the service of a positive growth
rate. Although there is no general definition and unique view, it is clear that economic freedom,
that is, the freedom of people to work and freely manage their property - without compromising
the rights of others is a defining determinant of economic growth. In this context, the role of the
state is "reduced" to the protection of property and the enforcement of contracts, without which
economic freedom would be practically impossible. In order to quantify economic freedom and
thus more precisely determine its impact on economic growth, several economic freedom indices
were created, best-known of which are the Freedom House Index, the Scully and Slottje Index
(1991) constructed by the Fraser Institute and the Heritage Foundation Economic Freedom
Index, whose structures were briefly presented and explained in this chapter. As the Heritage
Foundation's Freedom Index data were used in the empirical part of the dissertation, the
following chapter gives a detailed theoretical interpretation, outlines its concept and explains in
detail the components of the said index.

The relationship between economic freedom and economic growth in EU countries
Ivana Brkić
34
2.2. CONCEPT OF THE ECONOMIC FREEDOM INDEX OF THE HERITAGE
FOUNDATION
2.2.1. INTRODUCTION
This chapter presents the Economic Freedom Index, published by the Heritage
Foundation in collaboration with the Wall Street Journal for the past 25 years, or since 1995. Its
structure is shaped by four pillars that group a total of ten areas of economic freedom (Miller,
Kim & Holms, 2015). The first pillar is Rule of Law, which is constructed by the sub-indices
Protection of Property Rights and Freedom from Corruption, within which judicial
independence, effectiveness of enforcement of laws and contracts, and the presence of corruption
in all segments of society are analyzed. The second pillar –Limited Government, monitors the
state of Fiscal Freedom through the extent of tax burden and Government Spending in the
observed countries. Regulatory efficiency is the third pillar of economic freedom dedicated to the
aspects of Business Freedom, Labor Freedom and Monetary Freedom, used to measure the
extent of bureaucratic constraints in the business process, the degree of regulation in the labor
market and the stability of prices formed in the market. The fourth pillar of Market Openness,
expressed through Trade Freedom, Investment Freedom and Financial Freedom, is dedicated to
examining the openness and presence of international trade in goods, services and money, as
well as the presence of foreign and domestic investors and financial institutions, operating
independently of state control. A detailed methodology for constructing each sub-index and their
aggregation into a single index of economic freedom will be presented further in this chapter.
2.2.2. THEORETICAL INTERPRETATION OF THE ECONOMIC FREEDOM INDEX
According to Cole (2003), Index of Economic Freedom of the Hermitage Foundation
highlights a broad set of variables in the domain of economic policy, known to affect economic
efficiency: inflation rate, taxes, public spending, public enterprises, government investment,
tariff rates, trade barriers, price controls, distortions in the labor and capital markets, etc. The
negative effects of these policies induce disruptions that have a chain effect on the entire

The relationship between economic freedom and economic growth in EU countries
Ivana Brkić
35
economy. There is also a high level of correlation (countries with bad policies tend to be
consistently bad in many domains of economic policy), so it is difficult to define separate effects.
However, one thing is for sure: bad policies have a negative impact on economic growth, and
improving them can significantly improve growth. The Economic Freedom Index is a report on a
country's overall economic policy (with recommendations for better assessment). Economic
policy makers should certainly keep in mind the forecasts of these indices.
2.2.3. THEORETICAL INTERPRETATION OF THE ECONOMIC FREEDOM
SUBINDICES
Economic freedom, as defined by the Heritage Foundation, implies rule of law, limited
government, regulatory efficiency and market openness. These are also the four basic pillars of
the Index of Economic Freedoms, each grouping sub-indices that follow specific aspects of
economic freedom in their domain. The following is an overview of the methodology for
calculating the value of each economic freedom sub-index as stated on the Heritage Foundation
website (http://www.heritage.org/index/). During 25 years how long this Index is producing, its
methodology has been improved in scope and scientific rigor (Miller, Kim & Roberts, 2019).
I. Rule of Law
1. Property rights
Legal protection of property is an important requirement for the business environment,
which supports innovation, entrepreneurship and therefore economic growth. For this reason, the
sub-index property rights monitors how much the laws of a state protect private property and the
extent to which the government enforces the enacted laws. The sub-index analyzes the
independence of the judiciary, the existence of corruption in the judiciary and the ability of
individuals and businesses to enforce contracts.
Each country is rated on a scale from 0 to 100, where a higher number reflects a country where
private ownership is guaranteed by the government, the judicial system promptly and effectively

The relationship between economic freedom and economic growth in EU countries
Ivana Brkić
36
enforces contracts and penalizes those who illegally seize private property, where there is no
corruption or expropriation. The lower scores represent a country where most property belongs
to the state, expropriation is commonplace, the judiciary so corrupt that private property is poorly
protected, and property rights are difficult to enforce.
2. Freedom from corruption / Government Integrity
Although no society is immune to corruption, there are significant differences in its
extent. In some countries, the rule of law minimizes corruption, while in others it is incorporated
into the bureaucratic and political system. Freedom from corruption is therefore the aspiration of
each economically free state. The formation of the sub-index "freedom from corruption" is based
on Transparency International’s Corruption Perceptions Index (CPI). The Corruption Perceptions
Index is based on a 10-point scale where 0 represents a highly corrupt government. For the
formation of the Freedom from Corruption sub-index, the resulting index is multiplied by 10, so
that a country whose corruption perceptions index is 8.5 will have "freedom from corruption" 85.
The renaming of the Freedom from Corruption subindex into Government Integrity also led to a
methodological change in the calculation of this element of economic freedom (although we
insisted that we provide an interpretation for the formation of the former subindex, since most of
the data in the survey sample was created in this way). In other words, the newly created
subindex of Government Integrity primarily expanded the list of sources on the basis of which it
is formed and thus complexify the formula for calculating it, and it now reads:
Sub-factor Score i = 100 x (Sub-factorMax–Sub-factor i)/(Sub-factorMax–Sub-factorMin) (2)
where Sub-factor i represents the original data for country i; Sub-factorMax and Sub-factorMin
represent the upper and lower bounds for the corresponding data set; and Sub-factor Score i
represents the computed sub-factor score for country i.
What the above data from different sources cover (a detailed list of sources can be found in the
methodology section Miller, Kim & Roberts (2019)) is equally weighted following subfactors:
Transparency of government policymaking, Public trust in politicians, Perceptions of corruption,

The relationship between economic freedom and economic growth in EU countries
Ivana Brkić
37
Irregular payments and bribe, Governmental and civil service transparency and Absence of
corruption.
II. Limited Government
3. Fiscal Freedom / Tax Burden
Limited government is monitored in terms of revenue and expenditure of a state. Thus,
government constraints in terms of revenue are viewed through fiscal burden it imposes on its
citizens and the economy. Fiscal freedom is viewed through three equally valued factors: the top
marginal tax rates on individual income, the top marginal tax rates on corporate income, and the
total tax burden as a percentage of gross domestic product. Index creators use the quadratic cost
function in formula (2) to calculate fiscal freedom so as to express the declining tax revenue
caused by rising tax rates.
Tax burden ij = 100 - α (Factorij)2
(2)
Fiscal freedomij is fiscal freedom in countryi for factor j, while Factorij is the value of factor in
country i for factor j. α is coefficient set equal to 0.03. The score for each factor is individually
obtained on a scale of 100 points, after which the average for obtaining the fiscal freedom
subindices is calculated.
Although this indicator does not measure relative tax burden, that is, how much government
provides benefits to taxpayers through public spending, fiscal freedom is an important aspect of a
free, market economy, according to index creators.
4. Government spending
Government spending is measured through the amount of public expenditure and transfers,
expressed as a percentage of gross domestic product. In the scientific literature, there is no
consensus on whether a reduction in government spending leads to progress or an even deeper
crisis. In analyzing the impact of economic freedom, from the point of view of government
spending, certain authors (eg Altman, 2008) suggest efficient, not necessarily reduced,
government spending to achieve good results.
The relationship between economic freedom and economic growth in EU countries
Ivana Brkić
38
The creators of the Economic Freedom Index have not defined the optimal level of public
spending and do not necessarily proclaim low government spending, but guided by the results of
numerous studies, they came to a conclusion that excessive public spending leads to chronic
budget deficits, rising public debt and declining economic activity. Because of this, they treat
zero public spending as a benchmark that should be aspired to. This way they make an
intentional methodological omission as a result of which economically underdeveloped
countries, without the financial capacity for large public spending, are positively assessed. The
authors of the index justify the idea with lower ratings in other categories of freedom that these
countries will "certainly" record.
The equation for obtaining the sub-index government spending is non-linear to achieve
the effect that countries with zero public spending are “penalized” less than those with spending
in excess of 30% of gross domestic product.
The sub-index Government expenditure(GEi) is calculated using Equation (3).
GEi = 100 - α (Expendituresi)2
(3)
Expenditure of country i represents the total government spending of the country at all levels
(federal, state, local) as part of the gross domestic product (between 0 and 100), while α is a
coefficient to control the variation among scores and is set at 0.03.
III. Regulatory efficiency
5. Business freedom
Perhaps the most obvious proof of the existence of a free economy is the efficiency of the
business environment, that is, a short period of time and quick procedures to set up, operate and
close a business. It is the embodiment of entrepreneurship and pace that the modern world
dictates. This way, through the sub-index “business freedom”, the government’s regulatory
efficiency is confirmed. The sub-index is obtained on the basis of ten equally valued sub-factors:
the number of procedures and the number of days required to start a business, the cost of starting
a business in relation per capita income, and the minimum capital required to start a business
viewed as a percentage of income per capita; number of days, procedures and costs relative to
per capita income for obtaining a license; number of years to close a business, costs of closing a

The relationship between economic freedom and economic growth in EU countries
Ivana Brkić
39
business(as a percentage of estate) and recovery rate (cents on the dollar) upon closing a
business. Each of these sub-factors is converted to a value on a scale from 0 to 100, after which
the average value of the newly obtained values is calculated based on formula (4).
Sub-factor scorei = 50 × Sub-factoraverage / Sub-factori (4)
The score of the converted factor for a given country is based on the ratio of the country factors
based on World Bank data relative to the world average multiplied by fifty. Finally, a final
assessment of business freedom is obtained by calculating the average of all ten factors. If a
country is not covered by the World Bank’s Doing Business report, relevant qualitative data from
reliable and internationally recognized sources are used.
6. Labor Freedom
Labor Freedom category is a measure that considers various aspects of the legal and
regulatory framework of a country's labor market. The sub-index includes six components: the
ratio of the minimum wage to the average value added per worker, hindrance to hiring additional
employment, rigidity of hours, difficulty of redundant employees, legally mandated notice period
and mandatory severance pay. This sub-index was included in the index calculation in 2005 due
to the unavailability of qualitative data before that time. Since 2009, the components of labor
freedom have included six instead of the previous four factors.
Similar to the business freedom category, each of these segments is converted to a scale of 0 to
100 using an equation where that country data are calculated relative to the world average and
then multiplied by fifty.
Sub-factor scorei = 50 × Sub-factoraverage / Sub-factori (5)
The average of the six values converted gives the overall labor freedom score. This can be both
an advantage and a disadvantage: although a country has the worst conditions considering one of
the criteria, it could still have a high score based on the remaining five factors.
7. Monetary Freedom
Monetary freedom is used to measure price stability and the absence of price controls by the
state. These are some of the main prerequisites for business stability and the functioning of the

The relationship between economic freedom and economic growth in EU countries
Ivana Brkić
40
free market. Although there is no consensus on the choice of monetary policy that will ensure a
free and economically prosperous society, there is widespread opinion about the benefits of low
inflation and central bank independence, as well as the negative effects of price controls leading
to market surpluses or shortages (Miller & Kim, 2013).
Sub-index monetary freedom is obtained on the basis of two sub-factors: the average weighted
average inflation rate for the most recent three years and the qualitative price control measures,
which is a negative score, and is subtracted from the result obtained. The average weighted
inflation rate for the most recent three years is the base, from which "penalty points" are later
deducted in the range of 0 to 20. Monetary freedom base is derived based on the formula (6):
Weighted average inflationi = θ1Inflationit + θ2Inflationit-1 + θ3Inflationit-2 (6)
In formula (6), θ1, θ2, θ3 represent three numbers that sum to 1and are exponentially smaller in
sequence (e.g. 0.665, 0.245, 0.090 respectively), thus giving greater importance to the newer
inflation rate. Inflationit represents the annual rate of inflation in the country i and in year t, as
measured by the Consumer Price Index.
Formula (7) is then used to calculate the final subindex:
Monetary freedomi = 100 - α √ Weighted average inflationi - PC penaltyi (7)
In formula (7), α = 6.333 represents the coefficient for stabilizing the variance of results (i.e.it
converts the percentage of inflation into the value of sub-index on a scale from 0 to 100. For
greater accuracy, the square root of the weighted average inflation rate is used. PC penaltyi
represents penalties for price control by the state, which range from 0 to 20 and are subtracted
from the monetary freedom sub-index base to obtain the final score.
IV. Open Markets
Open markets are achieved through free trade, financial freedom and freedom of investment.
8. Trade Freedom
Trade freedom is achieved through the absence of tariff and non-tariff barriers, which
affect the export and import of goods and services, which reduces costs, increases efficiency and
the comparative advantage of all countries.

The relationship between economic freedom and economic growth in EU countries
Ivana Brkić
41
Trade freedom is assessed on the basis of the trade-weighted average tariff rate and non-tariff
barriers. As different goods are burdened with different tariff rates, the importance of each
individual rate is determined on the basis of the share of imports of individual goods in total
imports.
Thus, the sub-index trade freedom is obtained by the formula (8).
Trade Freedomi= (((Tariffmax – Tariffi) / (Tariffmax – Tariffmin)) * 100) - NTBi (8)
where Trade Freedomi represents the sub-index trade freedom in country i, Tariffmax and Tariffmin
represent the upper and lower bounds for tariff rates (expressed in %) and Tariffi represents the
weighted average tariff rate in countryi. The lower limit is the rate of 0% and the upper 50% of
the value of imported goods. NTBi represents the non-tariff barrier of the country i and is
subtracted from the base score in the form of a penalty to obtain the final score. The penalty may
be 0, 5, 10, 15 or 20 points, depending on the frequency of use of non-tariff barriers (20 for
barriers that completely impede international trade due to extensive use across most goods and
services). Determination of the number of points that will be deducted on account of non-tariff
barriers depends on qualitative and quantitative information on the types of restrictions, the most
important of which are: quantity restrictions, price restrictions, regulatory restrictions,
investment and customs restrictions as well as direct government intervention.
9. Investment Freedom
In an economically free country, which would receive a score of 100 on the Investment
Freedom component, there would be free flow of investment capital, that is, free movement of
resources of individuals and companies, both internally and across the country’s borders. In
practice, however there are different restrictions on investment: different treatment of foreign in
relation to domestic investment, legal and bureaucratic difficulties for foreign investors,
restrictions considering land ownership, investment restrictions for certain sectors, expropriation
of investment without fair compensation, foreign currency control, capital control. For different
levels of these restrictions, 5, 10, 15, 20 or 25 points are deducted from the ideal score depending
The relationship between economic freedom and economic growth in EU countries
Ivana Brkić
42
on the extent and intensity of the restrictions. In addition to these restrictions, up to 20 additional
penalty points may be deducted for security problems, a lack of basic investment infrastructure,
corruption, or other government policies that burden the investment process and limit investment
freedom.
10. Financial Freedom
Financial freedom is a measure of banking efficiency and independence from state
control and interference in the financial sector. The role of the state should be reduced to the
implementation of contractual obligations and the prevention of fraud. The state should not own
financial institutions (since that way it leads to reduced competition), and foreign institutions of
this type should act equally in the market with the domestic ones. Five broad areas are followed
for the formation of the sub-index financial freedom: the extent of government regulation of
financial services, the degree of state intervention in banks and other financial firms through
direct and indirect ownership, the extent of financial and capital market development,
government influence on the allocation of credit and openness to foreign competition.
Full financial freedom is achieved in a situation where the financial sector of a country has
minimal state influence and prices for various financial services are formed on the basis of
market conditions. This should enable the population and the economy to have easy and effective
access to funding opportunities.
The 100-point index value reflects an independent financial sector with minimal government
influence. By increasing the government's influence on financial institutions, the result drops by
10 points. The minimal score that a country can achieve is zero and reflects a repressive
government whose financial policy is formulated to prevent or completely ban private financial
institutions.
The relationship between economic freedom and economic growth in EU countries
Ivana Brkić
43
2.2.4. CHAPTER SUMMARY
This chapter presents a way of constructing the Economic Freedom Index of the
Hermitage Foundation to give a clear picture of what it covers, given that its data were used in
the empirical part of the paper as an independent variable whose impact on economic growth
was sought to be examined. The Economic Freedom Index covers all areas that are known to
affect the economic prosperity of a country / area. The Economic Freedom Index is used to
analyze the protection of property rights, the extent of corruption, the fiscal system in terms of
tax burden but also the amount of public spending, ease of doing business and work, inflation
rate, the burden of international trade with tariffs and taxes, the functioning of the investment
and financial sectors.
Quantifying the elements of economic freedom is important in order to determine the
impact that such a form of organization of economy and society has on economic prosperity, as
well as many other segments of life. The next chapter will be devoted to reviewing the scientific
literature, which has broadly and narrowly addressed the study of the relationship between
economic freedom as well as its components and economic growth in different groups of
countries.

The relationship between economic freedom and economic growth in EU countries
Ivana Brkić
44
2.3. ECONOMIC FREEDOM AS A SUBJECT OF SCIENTIFIC RESEARCH
2.3.1. INTRODUCTION
For a long time it had been a problem how to identify and measure economic freedom so
that it could be correlated with various economic contributions. In this context, many studies
could be challenged as regards their scientific contribution, as scholars have been so far
handicapped by insufficient and incomplete data on the state of economic freedom. This
opportunity has been increasing year by year, so today it is possible to measure economic reality
and test different hypotheses. According to the authors and creators of indicators of economic
freedom, the indices themselves do not aspire to determine which level of economic freedom is
optimal. It is the task of scholars to address whether a greater or increasing level of economic
freedom contributes to economic growth.
Although this is a relatively new topic and area for exploration, by 2011, a total of 402
scientific papers had been published in 211 reputable international journals on economic
freedom, as stated by the authors of the Index of Economic Freedom of the Fraser Institute, Hall
& Lawson (2014). These works have been cited over 4,000 times. A total of 737 scientists have
dealt with this problem, while 9 out of 15 scientists who published works are from the European
area. In almost all studies, the economic freedom index is used as an independent variable. The
influence of the economic freedom index on various macroeconomic variables was dominantly
studied: level and growth of GDP, income level, poverty, productivity and investment, but wars,
human rights, gender equality, number of supermarkets, performance at the level of company,
etc. were also the dependent variables. Two thirds of these studies concluded that the index of
economic freedom correlated with “good” dependent variables (GDP growth, investment growth,
peace, human rights); 28% received indeterminate results, and in only 4% of the studies the
index correlated with "bad" indicators. The negative consequences of the growth (index value) of
economic freedom relate mainly to the growth of economic inequality, which comes as the price
of economic freedom. Concerning controversial or not clearly defined results when analyzing
individual parts of economic freedom, Hall & Lawson (2014) state that “the whole is greater than
the sum of its parts” in terms of the index and that its overall contribution should be considered.

The relationship between economic freedom and economic growth in EU countries
Ivana Brkić
45
Many studies sought to unravel the nature of the link between economic freedom and
economic growth. Using various econometric methods as well as different indicators of
economic freedom, everyone tried to answer the same question: does economic freedom lead to
economic growth? Some found a positive relationship, others negative, and for some the
relationship showed no statistically significant results. There have been numerous studies that
have sought to determine which segment of economic freedom is most conducive to growth in
order to create an appropriate economic policy that would improve the area and thus contribute
to economic prosperity. Two scientific currents were also grouped together in an attempt to
discern whether the level or change in the level of economic freedom was responsible for
growth. The subject of the research was also to discover the nature of the relations between the
degree of democracy, political, civil and economic freedom, and their direct or indirect influence
on growth. There were different groups of countries, as well as the criteria and reasons for
grouping, while certain scholars focused only on one country trying to determine its specificities
in terms of economic freedom and its contribution to growth.
Below is an overview of the most important scientific breakthroughs in the study of the
relationship between economic freedom and economic growth.
2.3.2. EXAMINING THE RELATIONSHIP BETWEEN ECONOMIC FREEDOM AND
ECONOMIC GROWTH
Among the first authors to investigate the link between economic freedom and growth
was Islam (1996). Based on a report by the Fraser Institute (Easton & Walker, 1992), the author
conducted research on a sample of 94 countries, of which 28 were low, 43 middle and 23 high-
income countries, covering the period 1980-1992. He observed how economic freedom affects
the formation of the level of gross national product as well as its growth (two dependent
variables). He noted that high-income countries have a high degree of economic freedom
whereas low-income countries are characterized by a low level of free economy. Nevertheless,
regression showed that lower levels of economic freedom have the effect of reducing per capita
The relationship between economic freedom and economic growth in EU countries
Ivana Brkić
46
income levels in low-income countries, while this is not the case in high and middle-income
countries (the results are not statistically significant). The unified set of countries is characterized
by a positive link between economic freedom and the level of gross national product (GNP).
Contrary to the previous calculation, a decrease in the degree of economic freedom in high-
income countries has the effect of slowing down economic growth, while this is not reflected in
middle and low-income countries. Similar to the previous result, a sample in which all countries
were covered shows a positive impact of economic freedom on economic growth. The author
also concludes that the growth of income levels in all countries, especially those with low levels,
leads to the increase in the degree of economic freedom. Islam (1996) opens the possibility of
different results when more appropriate methods of analysis such as panel based analysis are
applied, but justifies his choice of the so-called cross section analysis with the unavailability of
time data. Ten years later, Islam & Salimullah (2006) conducted a panel analysis and confirmed
that in countries with low per capita income, economic freedom has positive effects on economic
growth.
A large number of published studies gave different, sometimes contradictory or
inconsistent conclusions on the relationship between economic freedom and economic growth.
Some studies show that there is no robust link, while others prove the link between economic
growth and only certain aspects of economic freedom. Therefore, it is very difficult to determine
the quality and credibility of each study. As a result, Doucouliagos & Ulubasoglu (2006) sought
to prove the hypothesis of the link between economic growth and economic freedom using meta-
analysis as a quantitative synthesis of empirical research based on available literature. The
analysis covers the processing of 48 studies examining the relationship between economic
freedom and economic growth (as well as the impact of freedom on investment, as an indirect
initiator of growth). Authors of all studies used regression and published correlation coefficients,
T-statistics, and standard error, and these were therefore selected as suitable for the application
of meta-analysis in order to find possible regularities in the relationship between economic
freedom and growth. The authors processed three sets of data. The first group includes one
calculation from each study (within which all papers are statistically independent, which means
that different authors did not analyze the same set of data, nor did the same authors use different
set of data when making their average), thus the analysis included45 observations. The second

The relationship between economic freedom and economic growth in EU countries
Ivana Brkić
47
group takes more calculations that were published in the same paper (if the analysis was done for
two groups of countries, etc.), hence a total of 62 observations were included. The third group
includes 111 calculations whose models include subcomponents of the index as separate entities.
The results of the meta-analysis confirm a positive direct link between economic freedom and
economic growth, as well as a positive indirect effect on economic growth through stimulation of
physical investment. Yet, the results also show shortcomings of these studies, which are reflected
in the following. The presence of poor specifications of models that are applied in the regressions
is clear. The selection of an appropriate production function, which will encompass both human
and physical capital, which equally affect the growth (as demonstrated by Mankiw, Romer, &
Weil, 1992) is the author's recommendation for future research. This way the disadvantages of
sensitivity analysis can be overcome in many studies (Sturm & De Haan, 2001). The so-called
publication bias was also noticed. This refers to the publication of (only those) results of studies
that confirm a statistically significant link between growth and economic freedom (as opposed to
studies that find such a link insignificant or negative). In order to meet the set theoretical
expectations, scientists change models and/or use different statistical techniques, which distorts
the picture of the real impact of economic freedom on economic growth.
In the subsequent paper, which included 52 studies using the same method, Doucouliagos
(2005) concludes that there is less publication bias in the research group that analyzes the impact
of components of the economic freedom index on economic growth. He also points to a larger
publication of those papers that do not produce theoretically desirable results, in order to give the
public a real insight into the nature of the relationship economic freedom - growth. Other than
the positive, economic freedom may be likely to have a negative or statistically insignificant
correlation coefficient with growth, as demonstrated in the case of the correlation between
democracy and economic growth, according to Doucouliagos (2005).

The relationship between economic freedom and economic growth in EU countries
Ivana Brkić
48
2.3.3. EXAMINING THE RELATIONSHIP BETWEEN DIFFERENT COMPONENTS
OF ECONOMIC FREEDOM AND ECONOMIC GROWTH
The first published paper that analyzed the link between different dimensions of
economic freedom and economic growth was published by Ayal & Karras (1998). The authors
made a significant contribution by decomposing the unique Fraser Institute index and noting the
relationship between certain aspects of economic freedom and growth. This for the first time
enabled economic policy makers to deduce which segments in particular to put emphasis on in
formulating a strategy for advancing economic growth. The authors applied a neoclassical
growth model (which includes the initial level of gross domestic product, share of investment in
GDP and population growth rate) in a sample of 58 countries, within a time span of fifteen years
(1975-1990). They concluded that growth was reflected by an increase in overall factor
productivity and an increase in capital accumulation. They observed that all thirteen components
of the Fraser Institute Economic Freedom Index show a positive correlation coefficient with
growth, but six of them are statistically significant. They state that growth is achieved when (1)
there is a low rate of growth of money and inflation, (2) when the role of state-owned enterprises
is reduced, (3) when negative interest rates are rare, (4) when there is less difference between the
official exchange rate and that of the black market (5) when trade occupies a significant part of
the economy and (6) when citizens are free to engage in capital transactions with foreigners.
Contrary to the authors' expectation, the level of tax rates, military service and tariff rate did not
show a statistically significant effect on economic growth.
In view of the contradictory conclusions reached by earlier studies, Heckelman & Stroup
(2000) wish to contribute to finding and illuminating those aspects of economic freedom that do
not affect economic growth as opposed to those that exhibit such a relationship. The authors
prove that the total level of economic freedom of 1980 does not have a statistically significant
relationship with economic progress from 1980 to 1990, and emphasize that this finding should
not lead to the premature conclusion that economic freedom is not related to economic growth.
Thus, using bivariate regression first, the authors investigate the impact on the economic growth
of each individual element of economic freedom according to the Fraser Institute design at the
time (Gwartney et al., 1996) to determine which aspects contribute to growth and which obstruct
The relationship between economic freedom and economic growth in EU countries
Ivana Brkić
49
it. Following the first results obtained, the authors apply multivariate regression to avoid
multicorrelation between segments of economic freedom within the same group and to determine
which aspect of freedom in a group of the similar contributes most to growth. They do this by
retaining the constant values of the other subindices in the group. Based on the calculation, they
conclude that only three out of the fourteen components have an independent impact on
economic growth.
Thus, Group I (Money and Inflation: Protecting money as a medium of exchange and preserving
value) and Group III (Levies and discriminatory taxes: Freedom to keep what is earned) show a
negative link to growth, while Group II (Government Regulation: Freedom to decide about what
to produce and buy) and Group IV (Restrictions on international exchange: Freedom of exchange
with foreign countries) have a positive relationship with growth, according to authors Heckelman
and Stroup (2000) based on the results of bivariate regression analysis. Group IV makes the
strongest contribution to growth, with the most important aspect being the "Difference between
the official and black market exchange rates" within the same group. After initiating multivariate
regression, only this aspect retains a positive and significant impact on growth, which means that
the other segments in Group IV are highly correlated with the former (and it is the one that
actually has the greatest impact on economic growth). The marginal tax rate maintains a
negative, statistically significant relationship with economic growth, and Transfers and subsidies
gain statistical significance after a multivariate regression. Both of the aforementioned
components of economic freedom are within Group III.
Following the results, the authors compiled their ranking list of countries based on new findings
from the previous calculation that highlight the importance of each component for growth. They
also found that their construction of an aggregate index based on the importance of each aspect
of freedom was not highly correlated with the rank traditionally constructed by Fraser led by
Gwartney et al. (1996). They launched a new bivariate regression and found that the newly
constructed index showed a significant link to economic growth.
Supporting the arguments and criticisms made by Heckelman & Stroup (2000) regarding
the Fraser Institute index aggregation (Gwartney et al. 1996), but also challenging the new
methodology used by the mentioned authors in the process of constructing their own index,
Sturm, Leertouwer & Haan (2002) make some efforts to advance indicators of economic

The relationship between economic freedom and economic growth in EU countries
Ivana Brkić
50
freedom of certain countries. Using Principal component analysis, the authors conduct their own
index aggregation. They find that their index is significantly correlated with the index of
Gwartney et al. (1996) and in a very weak relationship with the constructed index of Heckelman
& Stroup (2000). Another objection to Heckelman & Stroup (2000) was made concerning
omitting the control variables in the model when examining the impact of the newly constructed
index of economic freedom on economic growth, which leads to the sensitivity of results in
relation to the selection of countries. Therefore, Sturm et al. (2002) carry out the analysis
established by Levine & Renelt (1992) for robustness testing. They conclude that only the index
constructed by Heckelman & Stroup (2000) has a weak positive relationship with economic
growth, whereas the freedom expressed by the Fraser Institute index (Gwartney et al., 1996), as
well as the indicator made by the authors themselves in the paper in question, does not show
robustness in the relation “level of economic freedom - economic growth".
Carlsson & Lundström (2002) also point out that a comprehensive index of economic
freedoms is not a sufficiently precise guideline as it cannot signal to economic policy makers
which segment needs to be improved in order to stimulate economic growth. By decomposing
the index given by the Fraser Institute in its report (Gwartney, Lawson & Samida, 2000) and
applying the so-called Extreme Bound Analysis (EBA) to determine the robustness of the
linkages of the impact of individual aspects of economic freedom on growth, they obtain diverse
results. Although they found that overall economic freedom has a positive (and robust) impact on
growth, they caution that some of its components have no significant link ("monetary policy and
price stability"), but also that some have a negative impact on growth. Thus, an increase in the
"size of government" by one unit reduces economic growth by 0.5% and "freedom of trade with
foreigners" by 0.48%. The previous findings that larger government stimulates growth, as well as
that greater international exchange has a negative impact, are contrary to the results of earlier
studies. While "economic structure and market availability" do not have a robust link to growth,
"freedom to use alternative currencies", "freedom to trade in the capital market" and "legal
structure and protection of property rights" do not only have a positive but also (more or less) a
robust link to growth.

The relationship between economic freedom and economic growth in EU countries
Ivana Brkić
51
Focusing on corruption in their analysis of the impact of particular categories of
economic freedom, us Swaleheen & Stansel (2007) concluded that in countries with a low level
of economic freedom, where individuals face limited choices, corruption reduces economic
growth. Contradictory and contrary to well-founded views in the professional literature, their
results show that in countries with a higher degree of economic freedom, reducing corruption
will slow economic growth. The authors interpret such findings by the view recognized in
scientific circles (Osterfeld, 1992) that in countries with a high level of economic freedom,
where there is a minimum of necessary restrictions, bribery of employees not to do their jobs
leads to greater economic activity and economic growth. Yet, in countries with a high level of
corruption, the growth of economic freedom, increases economic growth, as argued by us
Swaleheen & Stansel (2007).
Cebula (2011; Cebula, Clark & Mixon, 2013; Cebula & Clark 2014; Cebula & Mixon,
2012, 2014) conducted several studies independently or in collaboration with other authors in
which he studied the relationship between economic freedom and the state of the economies of
30 member countries of the Organizations for Economic Co-operation and Development
(OECD), mainly covering the period 2003-2007. Thus, in his first works on this topic, the author
Cebula (2011) conducted a panel analysis and came to the conclusion that economic freedom has
a positive effect on the level of GDP per capita. This was particularly true of aspects of monetary
and fiscal freedom, freedom of business, investment, labor, freedom from corruption and
protection of property rights. The author obtained these results using the Heritage Foundation
Index, but confirmed the robustness of the conclusion about the positive impact of economic
freedom on the economy level by using the Fraser Institute index (Gwartney and Lawson, 2008).
Cebula, Clark & Mixon (2013) later conducted a study within 30 OECD member
countries from 2003 to 2006 in order to investigate whether a higher level of economic freedom
encourages a higher level of economic activity (ceteris paribus) and therefore a higher level of
real GDP per capita. The authors then found that business freedom, freedom from corruption,
investment freedom, monetary freedom, government spending, trade freedom and protection of
property rights are a growing function of real per capita income. Their calculations show that
one-unit growth of the said categories of economic freedom increases real GDP per capita by
The relationship between economic freedom and economic growth in EU countries
Ivana Brkić
52
$165, $142, $297, $717, $170, $377 and $317, respectively. Therefore, the greatest impact on
GDP per capita is brought in the following order: by monetary freedom, trade freedom,
protection of property rights and investment freedom. On the other hand, labor, financial and
fiscal freedom do not show statistical significance, while the first two have a negative
coefficient. Cebula (2013) proves that the same elements of economic freedom have a positive
effect on GDP levels. Compared to his previous studies, in this paper, some aspects show
different results, but most categories confirmed the nature of their relationship with the level of
real income.
Modifying the Heritage Foundation Economic Freedom Index by omitting Fiscal
Freedom and Business Freedom, Cebula & Clark (2014) again sought to check the impact of the
liberalization of economic activities on the attained level and size of GDP of OECD member
countries. They obtained the expected positive impact, and robustness was checked by omitting
the Group of Eight leading industrial countries (G8) from the sample. They also noted that higher
levels of regulatory policy quality and lower tax burden have a positive impact on GDP per
capita
In their next study, Cebula & Mixon (2014) examined the impact of economic freedom
(this time) on GDP growth, emphasizing the direct and indirect impact that such a relationship
can have on the energy sector and infrastructure development. This time, too, the authors come
to positive results, whose robustness was confirmed by different model specifications but also by
applying the Fraser Institute's alternative Index of Economic Freedom.
An empirical study by Cebula & Mixon (2012) examined the impact of fiscal freedom
and freedom from excessive public spending on a sample of OECD member countries from 2004
to 2007. The authors concluded that lower levels of all taxes, i.e. greater fiscal freedom and
lower levels of public spending, lead to economic growth. The robustness of the results was
tested by a different model specification that included both trade freedom and the aspect of
economic freedom relating to the protection of property rights. Both of these categories showed a
positive impact on economic growth, while fiscal freedom and freedom from (too) much public
spending confirmed and strengthened their influence.
The relationship between economic freedom and economic growth in EU countries
Ivana Brkić
53
The authors Akin, Aytun &Aktakas (2014) aimed to investigate the impact of economic
freedom on economic growth within countries with varying levels of income. They conducted a
panel analysis on a sample of 94 countries, categorizing high-income countries which are
members of the Organization for Economic Co-operation and Development and those which are
not, into upper-middle and lower-middle-income countries as well as low-income countries.
They concluded that in all countries, regardless of income level, the level of economic freedom
is in a positive, statistically significant relation to economic growth. An additional aspect of this
finding is also the conclusion that the most significant contribution to the growth of economic
freedom comes from lower middle income countries (Bolivia, Republic of Congo, Egypt, India,
Pakistan, Indonesia, Paraguay, Sri Lanka, Syria, Ukraine, Zambia, El Salvador, Guatemala,
Honduras, Senegal). Thus, the growth of economic freedom by 1% leads to economic growth of
0.482% in OECD member countries, 0.422%in high-income non-member countries, 0.266%in
countries with upper-middle income level and in lower-middle income countries and low-income
countries by 0.555% and 0.331%, respectively.
In the second phase of the analysis, the authors set out to investigate the impact of the
economic freedom components expressed by the Fraser Institute's Economic Freedom Index
(Gwartney, Lawson& Hall, 2012) and examine their individual contribution to growth in
countries with varying levels of income. They obtained different answers. Thus, (1) government
size has a positive and statistically significant effect on growth in the middle-income group of
countries. They note that (2) the efficiency of the courts and the protection of property rights
have a positive impact on growth in OECD non-member countries and at the same time achieve
high levels of income as well as in middle (upper and lower) income countries. As the level of
income decreases, so does the significance of this factor. Strong currency, price stability, ability
to own foreign currency (3) in the context of economic freedom are significant drivers of growth,
not only in OECD countries but also in the lower-middle income group. While freedom in
international trade (4) in OECD countries has a negative effect on the economy, with declining
revenues, this aspect becomes positive. Regulations (5), the last pillar of economic freedom,
which implies the responsibility of the state and its involvement in the process of promoting
freedom, proved to be significant and positive in OECD countries, both with higher and lower
levels of income.
The relationship between economic freedom and economic growth in EU countries
Ivana Brkić
54
Levente (2015) focused his attention on examining one important aspect of economic
freedom: the size of government spending. Many papers explored the link between government
size and economic growth and found both a positive and a negative link. Due to the very fact that
it is difficult to determine the true sign that characterizes this relationship, Levente (2015) tried
to define the variables that construct such a relationship. The author found, in accordance with
previous results in the scientific literature, that there is a form of the reversed Latin letter "u"
between public spending and economic growth. Excessive and too low public spending do not
encourage economic growth. Unlike Tanzi (2005), who advocates 30% of public spending
relative to GDP, Levente (2015) argues that there is no single optimum of public spending, but it
depends on the level of development of the country, which depends on economic freedom. Thus,
according to his calculations, developed countries have a significantly higher level of public
spending that maximizes economic growth compared to underdeveloped countries.
Subsequently, the growth of public spending will slow economic growth, as claimed by the
author. The optimal relationship between public spending and economic growth was written
about by Armey (1995), constructing the so-called Armey curve, coined by Vedder & Gallaway
(1998).
Levente (2015) divided countries into 64 free and 57 less free countries according to the
Fraser Institute criterion. Free economies had five times higher GDP in 1995 than less free ones
and since then their growth rate was far faster than the in the other ones. The authors conclude
that less free countries have little chance of catching up with the freer ones because their
institutional system does not allow for faster growth. Freer countries have higher public
expenditures because they can afford it. Levente (2015) analyzed the structure of expenditures
and found that the money earmarked for health is higher but the costs for education and defense
are lower in developed than in less developed countries. The author noted the same when he
divided the countries into groups with good and bad legal system and protection of property
rights. Well-regulated countries have a high GDP and a high growth rate. This also allows them
to distribute their revenues, which means higher public expenditures. As regards corruption
control, the conclusions are even more significant: less corrupt countries achieved nine times
GDP in 1995, while the growth rate for both groups of countries, more and less corrupt, is about
the same.
The relationship between economic freedom and economic growth in EU countries
Ivana Brkić
55
There is no consensus among scholars on the question of prioritizing the examination of
the impact of index components or their aggregate level on economic growth. There are
numerous views that the aggregate index of economic freedom is not really a relevant indicator
as it does not give macroeconomic policy makers a clear signal of what should be applied
specifically in order to promote growth (Heckelman & Stroup, 2000). Nevertheless, the role and
contribution of the overall index of economic freedom must be acknowledged. Lawson (2006) on
this topic draws an analogy in weighing the significance of the total index as opposed to the
significance of its parts, looking for the most important ingredient in a cherry cake, pointing out
that all elements are just as important if you want to have a delicious cake, which can also be
passed on to the index of economic freedom. De Haan & Sturm (2006), on the other hand,
remind that many scholars found that some elements have a low correlation both with other
components and with the overall index, and therefore conclude that not all dimensions are
equally significant or responsible for growth. At the same time, they propose the use of factor
analysis for grouping index elements into pillars (groups) since they believe that the grouping of
individual subcategories of the Fraser Institute index was done arbitrarily at that time.
The fact is that the measure of economic freedom is too rough and that there are still no
satisfactory econometric calculations that could absorb all the problems that arise in this process.
2.3.4. EXAMINING THE RELATIONSHIP BETWEEN LEVEL VS. CHANGE IN THE
LEVEL OF ECONOMIC FREEDOM AND ECONOMIC GROWTH
There were two trends in scientific circles that stood out in terms of determining the
relation "economic freedom - growth". While most studies put economic growth rate and level of
economic freedom in regression, some scholars criticized such a methodological decision and
suggested that changing economic freedom (and not its level) is robustly related to growth (De
Haan & Siermann, 1998; De Haan & Sturm, 2000, 2001; Pitlik, 2002; Sturm, Leertouwer &
Haan, 2002; Doucouliagos & Ulubasoglu, 2006; Wu, 2011).
The relationship between economic freedom and economic growth in EU countries
Ivana Brkić
56
De Haan & Sturm (2000) were among the first in this context to examine the relationship
between economic freedom and economic growth. In addition to this contribution, the authors
also compared two most significant indicators of economic freedom: of the Fraser Institute and
of the Heritage Foundation, concluding that, with some differences in individual areas, the
ranking of countries based on economic freedom category is fairly uniform. Later, they followed
developments in the level of economic freedom and economic growth in 80 countries. They used
the level of economic freedom from 1975 and its change from 1975 to 1990 as an independent
variable. They came to the conclusion that the level of economic freedom (from 1975) was not
related to economic growth, but that the change of economic freedom was strongly linked to
growth. With this finding, they pointed to the conclusion that the growth of economic freedom
encourages economic growth for aspiring countries that have not yet achieved a steady growth
trend. On the other hand, in countries that have a stable (high) level of economic growth,
economic freedom does not affect their economic progress, as summed up by De Haan & Sturm
(2000).
In their subsequent work, Sturm & De Haan (2001) continued to address the issue of
examining robustness in the relationship between growth and economic freedom. As they found
in previous work that even by specifying the growth model in terms of including control
variables (the initial GDP level, average investment rate expressed as % of GDP, high school
enrollment in 1975as well as average population growth, average level of public spending,
expressed as % of GDP, average inflation rate and average export-import ratio relative to GDP),
the link between the level of economic freedom and growth does not become robust, this time
they used the Least Median of Squares – LMS regression model to strengthen or refute their
evidence. Again, the authors concluded that a change of economic freedom is strongly linked to
growth, which cannot be claimed for its level.
Like many authors before him, Pitlik (2002) studied the impact of economic
liberalization on economic growth, assuming that such an impact is positive. Pitlik (2002)
focused on examining the long-term impact of economic liberalization on economic progress. He
examined the effects of a stable as opposed to indecisive economic liberalization policy, which
not only negatively contributes to economic growth, but also adversely affects the credibility of
The relationship between economic freedom and economic growth in EU countries
Ivana Brkić
57
the government, the attractiveness of foreign direct investment, etc. In a sample of 80 countries,
covering the period between 1975 and 1995, the author applied the Ordinary Least Squares
(OLS) model to investigate the long-term impact of institutional changes on economic growth.
He proved that the movement of the economic freedom index up one notch contributes to annual
GDP growth by 0.9%, while the volatility of a given policy leads to an economic decline by
2.3%. The analysis proved that instability in the path of liberalization leads to a decline in
economic activity, even in situations where countries experience growth in economic freedom in
the long run. This way he indicated that the reform strategy needs to be implemented gradually
and consistently, which can lead to greater long-term economic growth. By adding control
variables and applying EBA, Pitlik (2002) proved robustness of results, confirming the thesis
that regardless of model specification, change of economic freedom is positively and statistically
significantly related to economic growth.
To assess the effect of economic freedom in the context of growth regression, Cole
(2003) applied two completely different approaches to test the robustness of the relation
freedom-growth. The results he obtained can be contrasted with standard growth models, which
predict slower growth in countries with higher levels of development, due to reduced return on
capital. The truth is that, as the neoclassical model predicts, higher-income countries will have an
initial slower growth, while lower-income countries will initially have a more intense growth.
The assumptions he started with in both models to satisfy the convergence effects are: (1) if two
countries are at the same level of economic freedom, the country with a higher initial income
will tend to grow more slowly under the influence of convergence effect and (2) if two countries
start with the same income level, the country with more pronounced economic freedom will tend
to grow faster. The author sets up a neoclassical-model based regression which assumes the
inclusion of an economic freedom index in a growth regression based on an extended model set
up by Solow (Mankiw et al., 1992; Knight, Loayza & Villanueva, 1993). This model includes
initial income (from 1980), investment as a percentage of GDP (average for the period 1980-
1999), population increase (average fertility rate for the period 1980-99) and average change in
years of education in the period 1980-1995 as a measure of human capital. The economic
freedom included in the model is derived from the average value of the economic freedom index
provided by the Fraser Institute for 1980, 1985, 1990, and 1995 for each country. Based on this

The relationship between economic freedom and economic growth in EU countries
Ivana Brkić
58
model, the variables presented account for 69.5% of the variable, and the coefficient for the
freedom index is positive and significant. A change of the index of economic freedom, which has
a significant and positive impact on growth and increases the explanatory power of the variable
to 74.1% was added in the next regression. The results from this model further indicate that any
given level of investment will have a greater impact on growth in countries with greater degrees
of economic freedom.
The second model includes the economic freedom index in the model proposed by Gallup, Sachs
& Mellinger (1999). Such a model studies the relationship between the geographical position of
countries and their economic development and is based on the following empirical observations:
(1) countries in the tropics are predisposed to be poor, while countries in temperate climates tend
to be richer (Sachs, 2000) and (2) countries with maritime traffic tend to be richer than
continental countries. Based on all of the above, in addition to the initial income (due to the
convergence effect), the given model includes the location of the country in relation to the
tropics, the proportion of the population living in a country with 100 kilometers of sea coast, and
the distance from one of the three key centers of the world economy (New York, Rotterdam,
Tokyo). Adding the level of the freedom index as well as its change over a given period
increases the explanatory power of the variable (GDP per capita growth rate) from 23.9% to
54.3%. It is important to note that the latter growth model estimates the impact of economic
freedom on economic growth even stronger than the neoclassical model.
The aim of this study was to compare different theories of economic growth, as well as to assess
the impact of economic freedom on economic growth in alternative theoretical frameworks. A
significant finding is that both the level and growth of economic freedom, expressed by the
Fraser Institute's index of economic freedom, are highly correlated with per capita GDP growth,
regardless of the set theoretical framework for economic growth.
Giving a very detailed tabular overview of scientific papers dealing with discovering the
link between economic freedom and economic growth, De Haan, Lundström &Sturm (2006)
conclude that most researchers found a positive correlation between these variables, although
they dispute the specific methodology used in them. The biggest criticism seems to be directed at
the use of both level and change in the level of index in the same regression, pointing to
statistical issues (endogeneity, reversed causality, multicollinearity) and they suggest including

The relationship between economic freedom and economic growth in EU countries
Ivana Brkić
59
exclusively a change in the level of economic freedom in the regression models. In response to
the above remark, Lawson (2006) points out that the application of both forms of economic
freedom (both level and growth) is more adequate to conduct research. He supports such an
attitude by comparing economically developed Hong Kong (which is always at the top of the
world list of economic freedom and has no room for further growth) and e.g. Nicaragua, which is
improving its position year after year but still has a relatively low ranking (and low level of
economic growth). By omitting the level of economic freedom from the specification of the
econometric model, Lawson (2006) states, Hong Kong would be of no interest as a country with
a pronounced link between economic freedom and growth. Only by using both forms of freedom,
Lawson (2006) concludes, will we be able to see how economic freedom affects economic
growth in the case of developed and less developed countries. In the ensuing debate (De Haan &
Sturm, 2006; Cole & Lawson, 2007; De Haan & Sturm, 2007), there was no scientific consensus
on this and other topics regarding the choice of method or form of economic freedom (in terms
of level, change, aggregate index vs. index components), therefore it is the task of further and
other research to provide new evidence and arguments.
There is (eternal) debate in society as to whether competition and liberalization are
always good. There are views that intelligently managed and implemented state control can lead
to positive economic results. The problem with any empirical study is that an economic policy
variable cannot be quantified and thus included in the econometric model (Wu, 2011). In the
context of intellectual nonuniformity on the unique path of economic growth, China is certainly a
specific case. This country recorded an economic growth of 10% per year in the previous decade,
but also a rather low rating on the economic freedom index scale, with no upward trend.
According to Wu (2011), a relatively underdeveloped legal and financial system in China, as
well as high level of corruption, certainly do not favour economic freedom. However, limited
freedom in the financial market and cross-border capital in China, this time protected China from
the global economic crisis that has been recorded in the past decade. In order to examine in his
own way the impact of economic freedom on growth, Wu (2011) conducted an analysis of the
relationship between economic growth and the level, but also the change, of economic freedom.
The results suggest that the level of economic freedom is not statistically significant, while the
change of economic freedoms shows a positive and statistically significant relationship with

The relationship between economic freedom and economic growth in EU countries
Ivana Brkić
60
economic growth. However, the author distances himself from the unequivocal conclusion,
pointing out that the causality of the given relationship has not been examined (whether
economic growth can lead to the improvement of economic freedom, the so-called reverse
causality), and that both variables are actually influenced by a third factor (endogeneity).
Below are a detailed tabular overview of the studies described above and the summary of
their conclusions regarding the relationship between (change of) economic freedom and
economic level and/or growth (Table 7).

The relationship between economic freedom and economic growth in EU countries
Ivana Brkić
61
Table 7. Tabular overview of conducted research on the relationship between (change of) economic freedom and economic level
and/or growth
AUTHOR(S) SAMPLE RESEARCH
PERIOD METHOD
DEPENDENT
VARIABLE INDEPENDENT VARIABLE EFFECTS
Islam (1996)
94countries:
28 low-income
43 middle-income
23 high-income
1980 - 1992 Ordinary least squares
Cross- section analysis
GNP per capita
(1992) IEF of the Fraser Institute
(Easton &Walker, 1992) Positive. Average GNP
per capita
growth rate
The decline in economic freedom leads to a fall in per capita income in low-income countries and in all sample countries.
The decline in economic freedom leads to a slowdown in economic growth in high-income countries, as well as in all the sample countries.
Growth in per capita income leads increase in economic freedom in all countries and in low-income countries.
Ayal& Karras (1998) 58countries 1975 - 1990 Multivariate regression
Average GDP
per capita
growth rate
13 components of IEF of the
Fraser Institute
(Gwartney et al., 1996)
----------------------------------------
- Initial GDP per capita
- Investment (% of GDP)
- Population growth rate
Positive.
All thirteen components of economic freedom show a positive correlation coefficient with growth, but six of them are statistically significant.
Heckelman&Stroup
(2000) 49countries
Growth: 1980 –
1990 IEF: from
1980
Bivariate regression
Multivariate regression
Ordinary least squares
Average GDP
per capita
growth rate
IEF of the Fraser Institute
(Gwartney et al., 1996) Positive.
The overall level of economic freedom is not related to growth but some of its elements are in statistically significant relation to economic growth:
Marginal tax rate, negative relationship; Transfers and subsidies (% of GDP), positive relationship; Difference between the official and black market exchange rates, positive
relationship. The new index that the authors construct based on the importance of each component for growth is related to growth.
Carlsson &
Lundström (2002) 74countries
Growth: 1975 –
1995
IEF: 1970 – 1990
ЕBA
Average GDP
per capita
growth rate
IEF of the Fraser Institute
(Gwartney et al., 2000)
----------------------------------------
- Initial GDP per capita
- Investment (% of GDP)
Positive.
The overall index of economic freedom - positive, robust. Government size - negative, robust. Economy structure and market use - positive, not robust. Monetary policy and price
stability - insignificant, not robust. Freedom to use alternative currencies - positive, almost robust. Legal structure and protection of property rights - positive, robust. International
trade - negative, almost robust. Trade freedom in the capital market - positive, almost robust.
Akin, Aytun &
Aktakas (2014) 94countries 2000 - 2010 Panel analysis GDP
IEF of the Fraser Institute
(Gwartney et al., 2012)
----------------------------------------
Gross national formations
Human capital index
Population
Positive.
In all countries, regardless of income level, the level of economic freedom is in a positive, statistically significant relation to economic growth.
1) Government size - the coefficient is positive and statistically significant for upper and lower-middle income countries, while it is not significant for high and low-income

The relationship between economic freedom and economic growth in EU countries
Ivana Brkić
62
AUTHOR(S) SAMPLE
RESEARCH
PERIOD METHOD
DEPENDENT
VARIABLE INDEPENDENT VARIABLE EFFECTS
countries.
2) Judicial system and protection of property rights - the efficiency of the courts and the protection of property rights have a positive impact on growth in non-OECD countries and
have a high level of income, as well as in middle (upper and lower) income countries. The decrease in income increases the significance of this factor.
3) Money stability - a significant driver of growth, not only in OECD countries, but also in the group of lower middle income countries.
4) International trade - in OECD countries it has a negative effect on the economy, with the decrease in income, this aspect becomes positive.
5) Regulations - a significant and positive coefficient in OECD countries, with both higher and lower levels of income.
Cebula (2011) 30
OECD countries 2003 – 2007 Panel analysis
GDP per capita
IEF of the Heritage Foundation
IEF of the Fraser Institute
------------------------------
Political Stability Index
Long-term nominal interest rate
Positive.
Monetary and fiscal freedom, business, investment, labor freedom, freedom from corruption and protection of property rights have a positive and statistically significant impact on
the level of GDP per capita. Political stability has a positive and statistically significant impact on GDP per capita. High nominal interest rates have a negative and statistically
significant impact on GDP per capita.
Cebula & Mixon
(2012)
30
ОЕCDcountries 2004 – 2007 Panel analysis
GDP growth
per capita
IEF of the Heritage Foundation:
Fiscal freedom
Government spending
Protection of property rights
Trade freedom
------------------------------
Net exports (% of GDP)
Budget deficits (% of GDP)
Long-term nominal interest rate
Binary variable for G8 countries
Positive.
Fiscal freedom, reduced public spending, protected property rights and free trade have a positive and statistically significant impact on GDP growth per capita.
Cebula, Clark &
Mixon (2013)
30
ОЕCDcountries 2003 - 2006
Panel analysis
(fixed effects model) GDP per capita
IEF of the Heritage Foundation
----------------------------------------
- % unemployment
- long-term interest rate (expost)
Positive.
Positive, statistically significant coefficient: business freedom, freedom from corruption, investment freedom, monetary freedom, government spending, trade freedom, protection
of property rights. Not statistically significant: fiscal freedom, labor freedom (-), financial freedom (-).
Cebula (2013)
30
ОЕCDcountries 2003 - 2006 Panel analysis GDP per capita IEFof the Heritage Foundation Positive.
Business freedom, monetary freedom, freedom from corruption, investment freedom, public spending, trade freedom and protection of property rights all have a positive and
statistically significant impact on GDP level. Fiscal freedom, financial freedom and labor freedom do not have a statistically significant impact.
Cebula & Mixon
(2014) 29countries 2004 - 2007 Panel analysis
Annual GDP
per capita
growth rate
Modified IEF of the Heritage
Foundation without business
freedom
IEF of the Fraser Institute
--------------------------------
Positive.
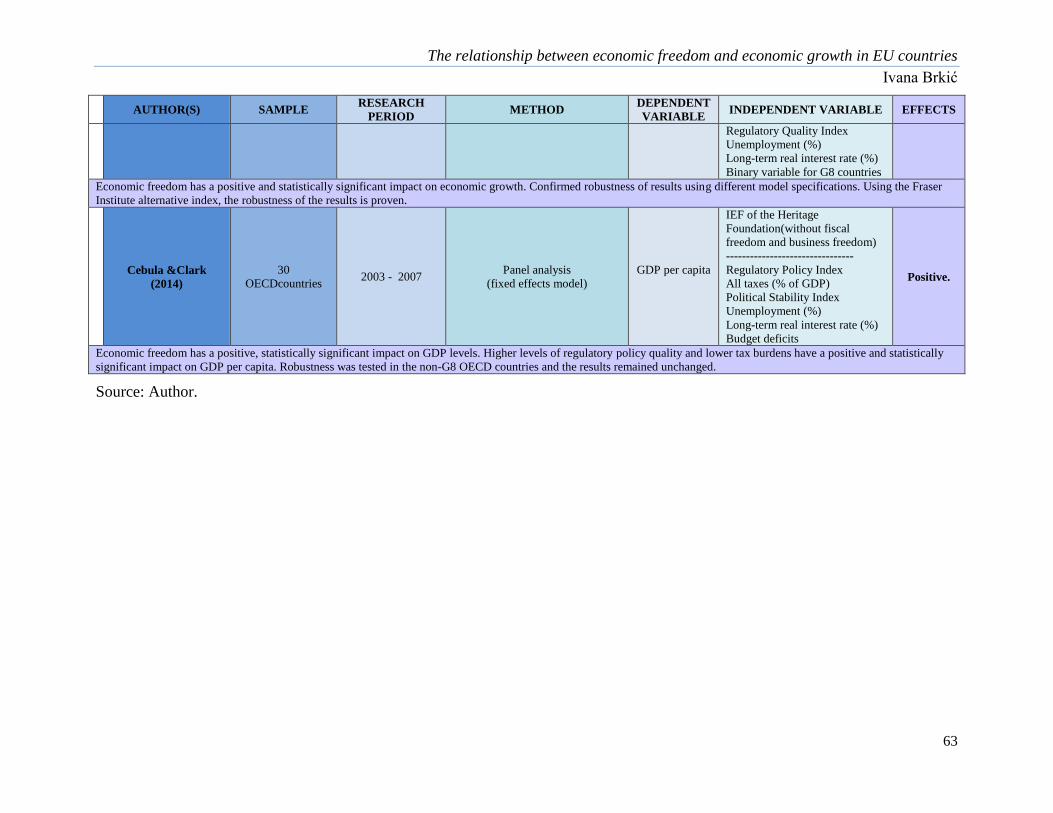
The relationship between economic freedom and economic growth in EU countries
Ivana Brkić
63
AUTHOR(S) SAMPLE
RESEARCH
PERIOD METHOD
DEPENDENT
VARIABLE INDEPENDENT VARIABLE EFFECTS
Regulatory Quality Index
Unemployment (%)
Long-term real interest rate (%)
Binary variable for G8 countries
Economic freedom has a positive and statistically significant impact on economic growth. Confirmed robustness of results using different model specifications. Using the Fraser
Institute alternative index, the robustness of the results is proven.
Cebula &Clark
(2014)
30
ОЕCDcountries 2003 - 2007
Panel analysis
(fixed effects model)
GDP per capita
IEF of the Heritage
Foundation(without fiscal
freedom and business freedom)
--------------------------------
Regulatory Policy Index
All taxes (% of GDP)
Political Stability Index
Unemployment (%)
Long-term real interest rate (%)
Budget deficits
Positive.
Economic freedom has a positive, statistically significant impact on GDP levels. Higher levels of regulatory policy quality and lower tax burdens have a positive and statistically
significant impact on GDP per capita. Robustness was tested in the non-G8 OECD countries and the results remained unchanged.
Source: Author.
The relationship between economic freedom and economic growth in EU countries
Ivana Brkić
64
2.3.5. EXAMINING THE CAUSALITY IN THE RELATIONSHIP BETWEEN ECONOMIC FREEDOM AND ECONOMIC GROWTH
A large number of empirical studies have proven a positive relationship between the
various measures of economic freedom and the rate of economic growth worldwide. Starting
from the founders of modern economics (Smith, 2010) until recent work, scientists have
emphasized the importance of the role of institutions in achieving economic results. Dawson
(1998) and Gwartney, Lawson & Holcombe (1999) first identified the (positive) link between
economic freedom and economic growth, while Ayal & Karras (1998) and Carlsson &
Lundström (2002) later studied components of economic freedom that more or less influence
growth. The aforementioned studies indicate a correlation between different measures of
economic freedom and growth, but do not address the causality of these categories. In other
words, up to some point in recent history, it has not been studied whether economic freedom
is the cause of economic growth, or is a more developed society, supported by government,
becoming economically freer. Certainly, there is a possibility that their relationship was
influenced by some third factor.
Although earlier studies focused on exogenous factors in discovering the causes of
economic growth, more recent studies suggest the importance of endogenous variables for
growth. Although it is difficult to define the factors that influence economic growth, it can be
assumed that a higher level of economic (and political) freedom encourages growth. It can
also be assumed that economic progress influences the progress of economic and political
freedom.
Although most research supports the thesis that political freedom contributes to
growth, there are conflicting opinions which propagate that political freedom has a negative
impact on growth, especially in countries with lower levels of economic and political
development. Therefore, authors Farr, Lord & Wolfenbarger (1998) sought to establish a
causal link between economic, political freedom, and economic status of countries of
different levels of development. In a group of 20 industrial and 78 non-industrial countries,
within the available data on the level of economic freedom of the Fraser Institute (1975,
1980, 1985, 1990), as well as based on summarized indicators of political rights and civil
liberty of Freedom House, Farr et al. (1998) were among the first to conduct a test of

The relationship between economic freedom and economic growth in EU countries
Ivana Brkić
65
causality in Granger's sense - whether one occurrence precedes the other (Granger, 1969).
The results for both groups of countries show that economic freedom (in the past) is
significantly related to GDP per capita (in the present), while political freedom is not.
Reversing the relations shows that the level of GDP per capita in the past is significantly
linked to both economic and political freedom in the present, for both groups of countries.
From the point of view of the significance of the impact, the higher prediction strength is
recorded by gross domestic product over economic freedom (1%), while the "preceding"
power of freedom in opposition to gross domestic product is expressed by statistical
significance of 5%. Interestingly, political and economic freedom do not have a statistically
significant relationship, in any direction (economic freedom does not cause political, or vice
versa). Following these findings, it can be concluded that the level of economic development
connects the two freedoms in the following way: greater economic freedom causes higher
GDP (in Granger’s sense), which in turn causes greater political freedom. In other words,
economic freedom indirectly causes political freedom, affecting economic growth. This bears
out the thought written by Milton Friedman in his book Capitalism and Freedom (Friedman,
1962), where he states: "The relation between political and economic freedom is complex and
by no means unilateral."
Heckelman (2000) analyzes the causality between growth and economic freedom
whereby for the dependent variable (unlike Farr et al. (1998)) he chooses average GDP
growth rate. Following the methodology used by Heckelman & Stroup (2000), the author
examines the relationships with economic growth of not only the comprehensive index but
also of its individual components. Another difference and advantage of this author's research
is the application of the Heritage Foundation index, which, as the author states, is based on
measuring policies rather than macroeconomic outcomes as opposed to the Fraser Institute
index. To prevent eliminating the effect of business cycles due to the implementation of
annual data published by the Heritage Foundation on the state of economic freedom,
Heckelman (2000) uses lag length of up to three years between indicators of economic
freedom and growth. He concluded that economic freedom leads to growth by making a gap
of one, two or three years. This is especially true of the element of Monetary Policy (which
estimates the average inflation rate over the last 10 years). As this research was conducted
over a period of just four years, the message to policy makers is that the short-term effects of
freedom can have an impact on growth, especially if inflation is kept low. The contribution to
(short-term) economic growth is also made by segments related to Capital flows and Foreign
The relationship between economic freedom and economic growth in EU countries
Ivana Brkić
66
investment (counterpart of today's Investment freedom), Price and wage control (equivalent
to Monetary freedom related to price control and Labor freedom), Property rights and
Regulations (Business freedom), which are manifested after two or three years. Less
robustness was found in the analysis of Granger causality whereby the Banking and Black
market segments cause growth only after three years. The results showed no robustness even
when it comes to causing (in Granger's sense) economic freedom by growth, where only one
segment (State interventions) is a consequence of growth, which is manifested only after two
years.
Studies published by Farr et al. (1998) and Heckelman (2000) previously discussed
dealt with the relationship between economic freedom and economic growth, but the
conclusions remain unclear. Thus, Farr et al. (1998) examined the causality of economic
freedom and standard of living, expressed by a level of GDP, instead of the rate of GDP
growth, which turned out to be a poor choice. Likewise, the above authors did not examine
individual aspects of economic freedom and their impact on economic growth. Therefore,
such research was done by Heckelman (2000) who found that the level of economic freedom,
as well as many of its components, causes economic growth. Likewise, economic growth
affects some of the aspects of the overall index of economic freedoms compiled by the
Heritage Foundation. The lack of analysis conducted by Heckelman (2000) is a small number
of years of observation, as is the inability to completely eliminate the effects caused by
business cycles due to the use of annual data. Both previous analyses did not take into
account the third variable that could have influenced the construction of the freedom - growth
relationship. In all studies where the focus is on economic freedom and economic growth, the
question of sensitivity of results to sample changes (which countries are included in the so-
called cross-country analysis and which are not) as well as to changes in the variables
included in the regression model (Levine & Renelt, 1992)always remain open. Another
methodological issue in calculating the link between economic freedom and economic
growth is the use of average values. Many authors (e.g., Ayal & Karras, 1998; Carlsson
&Lundström, 2002) use the average level of economic freedom to explain growth over a
given period. By comparing these means, it is difficult to distinguish between correlation and
causality. Also, the growth of freedom in one period may cause the growth of freedom in
another period, which obscures the selection of the indicator presented in such a way. For this
reason, each author individually, makes a specification, explains why he chose the countries
(transitional, members of a certain organization, etc.) and just for a certain period of time

The relationship between economic freedom and economic growth in EU countries
Ivana Brkić
67
(absence of consequences of the financial crisis of 2008, oil crisis in the mid and late 70s
after the period of the wars), because all these aspects can distort the picture of the "freedom -
growth" relationship due to the unfulfilled ceteris paribus conditions.
Following a long-run series of data from 1970 to 2000, Dawson (2003) concluded that
the overall level of economic freedom, as measured by the Gwartney & Lawson (2001)
index, causes growth in Granger's sense of causality. This result strengthens the link that had
been proven many times in the literature, suggesting that economic freedom actually causes
economic growth. As for the individual components of freedom, causality was established,
but their direction is different. Thus, "market use" and "property rights" cause growth, while
economic growth is what causes "government size". This conclusion on higher consumption
by a developed country was confirmed by Levente (2015) later in his work. Although earlier
works found a correlation between "international trade" and economic growth (eg. Carlsson
& Lundström, 2002; Ayal & Karras, 1998), Dawson (2003) does not find Granger’s causality
in a given relationship (in either direction). Freedom in terms of "monetary policy and price
stability" is endogenously determined by growth, while "use of alternative currencies" and
"international finance" are sensitive to specification, which makes it difficult to assess the
direction of causality. Dawson (2003) also observed how changes in the level of economic
freedom affect growth, and noted the endogenous relationship between changes in freedom
and growth, while changes in individual aspects of freedom do not cause growth. Moreover,
changes in some categories, such as "market size" and "international finance", are caused by
growth.
Dawson (2003) came to very significant conclusions regarding the long-term effects
in the relationship between freedom and growth. Specifically, economic freedom was found
to cause growth in the short run, while in the long run, this relation does not show any
significance. This lack of significance was also noted for certain categories of economic
freedom. These results on long-term effects are certainly contrary to previous scientific
findings on the importance of institutions for economic growth. The author explains his
research by the fact that it covers only the aspect of economic freedom and encourages the
development of indicators of economic freedom.
Dawson (2003) also examines the relationship between economic freedom, as
measured by the Gwartney & Lawson (2001) index and investment (% of GDP). He noted
that the general level of economic freedom causes investment, as does freedom in the field of

The relationship between economic freedom and economic growth in EU countries
Ivana Brkić
68
"international finance". "Government size" and the "international market" in the context of
economic freedom are also strongly linked to investment, but they are caused by investment.
The recommendation, in the light of this knowledge, is that a policy of stimulating the
international flow of capital would be crucial for promoting investment. The author provides
evidence that a change in the general level of economic freedom promotes investment, which
implies that a change in "international finances" causes the same. Changes in "government
size" and "international market" are the reverse, the consequence of investment. There is no
evidence of causality for the other categories. The long-term effects of the general level of
economic freedom (as well as the subcategory "international finance") are of no significance
for the volume of investment. A change of economic freedom, on the other hand, has a
positive effect on investment. Thus, the growth of freedom by 1%, over a period of 15 years,
affects the growth of investment (% of GDP) by 8.5%, while the growth of freedom in the
"international finance" segment increases investment by 5.5%.
Dawson (2003) paid attention to determining the causality between economic,
political, and civil freedom. He noted that the level of economic freedom causes growth and
is at the same time determined by the level of political and civil freedom (with the exception
of "international trade" and "international finance", where the results suggest an endogenous
relationship with political freedom), while the change of economic freedom is determined by
growth.
De Haan & Sturm (2003) obtained the same results when they present that the growth
of economic freedom is driven by the level of political and civil freedom in the example of
developed countries. The long-term effects of increase in political/civil liberty by 1% cause a
0.05% increase in economic freedom. They have the most significant impact on the growth of
freedom in the area of "the use of foreign currency" and the least on the "market use"
segment.
A general summary of this significant study (Dawson, 2003) is that institutions thrive
together and that political/civil freedoms take precedence in evolution. Friedman (1962)
argued for the connection between political and economic freedom, but Dawson (2003) shed
light on a new dimension - what is the cause and what is the consequence.
Vega & Alvarez (2003) also examine causality in the relationship between economic
freedom, political freedom, and economic growth. They do so in a sample of 45 countries,

The relationship between economic freedom and economic growth in EU countries
Ivana Brkić
69
between 1975 and 1995. The analysis shows that economic and political freedom have a
positive impact on economic growth. This could be interpreted as meaning that total freedom
has beneficial effects on a country's economy. Moreover, the impact of economic freedom on
economic growth almost doubles the effects of political freedom. In other words, institutions
that function for the purpose of market liberalization stimulate economic growth more
strongly than democracy does, as claimed by Vega & Alvarez (2003). There is a reciprocal
relationship between economic and political freedom: economic freedom increases political
freedom, and democratic institutions give a better basis for greater economic freedom. While
greater economic growth has a positive and significant impact on political freedom, such
growth is not significant for economic freedom, as calculated by Vega and Alvarez (2003). In
summary, the results of these authors indicate that intensified democracy can lead to faster
growth and greater economic freedom.
Being interested in the topic of causality, Justesen (2008) very thoroughly examined
its presence between economic freedom (measured by the Fraser Institute index, Gwartney &
Lawson, 2007) and the average rate of GDP growth per capita at six intervals of five years
between 1970 and 1999. By conducting a panel analysis for different groups of countries
using the Granger test to examine the direction of causality between economic freedom and
economic growth, the author indisputably proved such a relationship (where only one point of
growth on the freedom scale brings economic growth of 1.1% to 1.6%). Moreover, a positive
relationship was also found between some components of economic freedom and economic
growth. This primarily refers to the "size of government" and "regulatory policies" that, in
addition to economic growth, have a strong impact on investment. Low public spending,
lower taxes and liberalization in the business sphere are key determinants of economic
growth, according to the study. The author also paid attention to discovering the causes of
economic growth from the standpoint of change of economic freedom, where he also drew
positive conclusions. The segment related to “business, market and credit regulation” also
proved to be significant, and apart from the aspect of level, its change also shows a
significant impact on both economic growth and investment.
Analyzing a specific group of countries of the South African Development
Community, Gorlach (2011) demonstrated the existence of a causal link between economic
freedom and economic growth based on a sample of six member countries. The
methodological shortcoming of this study is seen in the use of GDP levels to present

The relationship between economic freedom and economic growth in EU countries
Ivana Brkić
70
economic growth, which may be reflected in the conclusions drawn. The second group of
countries from the territory of Africa was examined in terms of causality by Ossono (2012).
The author also concludes that the group of six countries of Central African Economic and
Monetary Community is characterized by a causal link between economic freedom and GDP
level.
Based on the structure of the study applied by Heckelman (2000), the first to examine
the causality with the Granger test using the Heritage Foundation index, Hristova (2012),
twelve years later, sought to determine whether the views about causality between economic
freedom and economic growth solidified and/or changed. In a sample of 91 countries from
1994 to 2011, she found that there had been an improvement in the statistical significance of
the results on causality between economic freedom and growth compared to the results with
10% of statistical significance observed by Heckelman (2000). According to her calculations,
economic freedom causes economic growth in Granger’s sense for (all) three lags at levels of
significance of 1%, 5% and 10%. In order to determine which dimension most influences
these results, a causality analysis was conducted between each category of economic
freedom, as defined by the Heritage Foundation and economic growth. The robustness of
results concerning causality in Granger’s sense was found in the categories of Fiscal freedom,
Monetary freedom and Freedom from corruption, which show a causal link with economic
growth at all levels of significance for all three lags. The consistency of the "monetary
freedom" link, but only at the 10% significance threshold, was also established by Heckelman
(2000) on a four-year database. Freedom from corruption did not prove to cause growth in the
research conducted by Hristova (2012), while other results are not robust. This study further
shows that growth causes economic freedom for all three lags with 10% statistical
significance. Property rights and Business freedom show the same characteristics as the
overall index in the context of following growth. Financial freedom and Labor freedom show
certain structures whereby it may be established that they are preceded by growth, but
robustness cannot be claimed for these relationships.
Aixalá & Fabro (2009) explored causality in the relations of economic freedom, civil
liberty and political rights as two dimensions of political freedom and economic growth.
Although there are different perspectives on the mentioned relationship that prevails in
scientific circles (that democracy obstructs, encourages, or does not guarantee growth),
hypothesizing Aixalá & Fabro (2009), by their sound logic, conclude that a free economy and
The relationship between economic freedom and economic growth in EU countries
Ivana Brkić
71
democracy must be in a strong relationship. The independence of the judicial system as one
of the basic characteristics of a democratically organized society is essential to an efficient,
economically free society. Likewise, protection of property rights is only possible in societies
dominated by civil liberties and political rights. In their empirical research, observing the
period from 1976 to 2000 in a group of 187 countries, Aixalá & Fabro (2009) conducted a
panel analysis and a Granger causality test. The authors noted that the level of economic
freedom establishes a bilateral causal link with growth, with present significance in the long
run. These results correspond with the results of the research conducted by Heckelman (2000)
and Dawson (2003). Change in the level of economic freedom establishes the same type and
strength of link with growth, in line with the scientific contributions of De Haan & Sturm
(2000, 2001), Pitlik (2002) and Sturm et al. (2002). While political rights precede growth,
civil liberties establish bilateral causality in a given relationship. Yet, change of these
freedoms does not have a causal link with economic growth. Studying the indirect link to
growth, Aixalá & Fabro (2009) explored the relationship between economic freedom and
investments in physical and human capital. They found that the level and change in the level
of economic freedom had significant long-term effects on investments in both physical and
human capital. On the other hand, in the case of civil and political freedom, causality exists
only in relation to investment in human capital. Only in the case of economic freedoms does
such an indirect driver of economic growth show long-term significance. In the
interrelationship of institutional variables in the study conducted by Aixalá and Fabro (2009),
the following relations were observed: civil freedom and political rights cause economic
freedom, and in the case of political rights, the relationship is bilateral; political rights
precede civil freedom.
Since numerous studies had not come to a single conclusion about whether democracy
precedes, follows or goes hand in hand with growth in well-being, or whether it has a
positive, negative, or any influence at all on economic growth, Piątek, Szarzec & Pilc (2013)
tried to contribute to this topic. The authors examined the causality of the relationship
between political, economic freedom and economic growth in 25 transition countries, from
1990 to 2008. The research concluded that political freedom is not the cause (based on
Granger's interpretation of causality) of economic growth, but there is reverse causality, that
is, economic growth precedes political freedom. More significant conclusions for our field of
interest were made by the authors regarding the causality of economic growth and economic
freedom. There is strong evidence that economic freedom causes economic growth
The relationship between economic freedom and economic growth in EU countries
Ivana Brkić
72
(according to the Granger causality test), and such effect is especially caused by the
following sub-indices: Public spending, Monetary freedom, Investment freedom, Freedom
from corruption. For public spending and investment freedom, the reverse is also true - they
can be caused by economic growth. To sum up, Piątek et al. (2013) concluded that economic
freedom has a strong impact on economic growth in transition economies (the same as in
developed countries) and, considering the whole period since the introduction of transition,
on average, economic freedom has a positive impact on the pace of economic growth.
2.3.6. EXAMINING THE RELATIONSHIP BETWEEN POLITICAL FREEDOM,
ECONOMIC FREEDOM AND ECONOMIC GROWTH
Not by addressing issues of causality (in statistical terms), but by considering
theoretical notions, Gwartney et al. (1996) distinguish between economic, political and civil
freedom. They interpret that political freedom refers to the right of all adult citizens to
participate in the political process, elect government officials who will make decisions on
important political issues. In the case of political freedom, elections are fair and competitive
and alternative parties have the right to vote. Civil freedom, they explain, is reflected in
freedom of the press, freedom of speech, religion and assembly, the right to life, self-defense
and fair trial. Based on all of the above, Gwartney et al. (1996) conclude that a country may
have a significant level of political and civil freedom but still adopt and implement policies
that are contrary to economic freedom. Political freedom can coexist with low levels of
economic freedom (eg India), just as economic freedom can exist in the absence of political
freedom (eg Singapore), as stated by Swaleheen & Stansel (2007).
Ali & Crain (2001) also argue that even very democratic countries, with a high degree
of political and civil freedom, can adopt economic policy that will lead to reduction in
investment and distortion of resources, while autocratic regimes can implement an effective
economic policy which encourages private initiative and investment, thus accelerating the
pace of economic growth. This is explained by the fact that dictatorial regimes, due to the
absence of a process of confrontation with political opposition, are able to implement market
reforms faster than democratic countries. By empirical analysis on a sample of 119 countries
in the period between 1975 and 1989, Ali & Crain (2001) came to the conclusion that
political regime and civil freedom, unlike economic freedom, are not key determinants of
The relationship between economic freedom and economic growth in EU countries
Ivana Brkić
73
economic growth. They also concluded that the quality of economic infrastructure is not
necessarily linked to the political regime or level of civil freedom, and that the effects of
economic freedom on growth do not depend on the level of political and civil freedom.
Guided by the model developed by Gwartney et al. (2006), Chu & Kong (2009) made
a regression model of independent variables of neoclassical growth theory and
geographic/location variables, after which they added representatives of institutional
variables: economic freedom of the Fraser Institute and political freedom of the Freedom
House, as well as the mutual relationship between them. The authors also divided the group
of 92 countries into more developed and less developed ones. Looking at them in the period
between 1970 and 2000, the authors find that the impact of economic freedom is more
significant than political freedom, and that it is more pronounced in less developed countries.
Thus, while the growth by one unit on the economic freedom scale leads to economic growth
of 0.83% in all countries, in the less developed ones it is 1.31%. Combining the impact of
political and economic freedom on economic growth, Chu & Kong (2009) arrive at the
following results. The impact of political freedoms on growth is statistically significant only
in the group of countries that do not have economic freedom. This essentially means that in
countries that reach a certain (or high) level of economic freedom, the growth of political
freedom does not contribute to economic growth. This statement is supported by evidence
that no matter what the level of political freedom in a country is, economic freedom is one
that will have effects on economic growth, although that growth is more pronounced in
politically freer countries.
Since free markets and democracy are compatible in most of the world, it was
expected that former socialist countries would transition to both capitalism and democracy.
This has not happened in all countries. Out of a desire to compare whether countries which,
with the fall of socialism, embraced democratic political order or, like China and Singapore
which retained dictatorship and opened markets, achieved faster economic growth, Peev &
Mueller (2012) conducted a study. They started with an assumption that democracy would
lead to an increase in economic freedom, resulting in faster economic growth. Democracy
can also lead to a large public sector and large public expenditure, which slows economic
growth. Therefore, they explored the link between democracy, economic liberalization and
growth, as well as democracy, public expenditure and economic growth. The result was that
the democratic system did not follow the process of economic liberalization in the countries

The relationship between economic freedom and economic growth in EU countries
Ivana Brkić
74
of the former Soviet Union of the Socialist Republics (USSR), except for the three Baltic
States (Estonia, Latvia and Lithuania). Scientists even attribute the success of the Baltic
countries to the geographical proximity to the European Union, although they do not rule out
the possibility of credit for growth to some other more favorable conditions that these
countries have compared to the rest of the former USSR. The authors established a strong
link between economic freedom and democracy, in the sense that economic freedom is
greater and corruption less in more democratic countries. This result could also be attributed
to the conditions for accession to the European Union (reduction of corruption and greater
economic freedom). Yet Bulgaria and Romania, although EU member states, have low levels
of economic freedom, weak democratic institutions and are in the grip of corruption, which
confirms the thesis that it is the democratic system itself that has a stake in creating a more
economically free society. This link between democracy and economic freedom leads to a
link between democracy and economic growth, because economic liberalization, as proved
by the authors, produces faster economic growth.
Conducting an analysis in twenty-four transition countries from 1994 to 2007, Peev &
Mueller (2012) find that economic growth is driven most by monetary and trade freedom, as
well as by freedom from corruption, while others have little or no effect on economic growth.
These categories of economic freedom stimulate investment, after which they represent
growth generators.
Analyzing the impact of economic freedoms on GDP growth in transition countries
after the financial crisis (2008-2009), the same authors (Peev & Mueller, 2012) conclude that
countries that were trade and monetary freer paid a higher price for liberalization through
more dynamic decline in growth rates. In other words, economic liberalization and a small
public sector lead to greater economic growth in normal times, while transition countries are
more vulnerable in times of crisis, leading to higher government spending to mitigate the
effects of the crisis. Peev & Mueller (2012), in a simplified overview, make a conclusion that
the former communist countries, which are at a higher level of democracy, achieve greater
economic growth, while on the other hand, democracy contains elements that lead to its
slowdown.

The relationship between economic freedom and economic growth in EU countries
Ivana Brkić
75
Table 8 provides a concise and symbolic overview of the interconnections between
economic freedom, political freedom, and economic growth, according to the scientific
contributions of the authors whose work is analyzed in this dissertation.
Table 8. Overview of the interconnections between economic freedom, political freedom and
economic growth in the studies presented
Source: Author
Authors The interconnections between economic freedom, political
freedom and economic growth
Farr, Lord &
Wolfenbarger (1998) economic freedom ↔ GDP → political freedom
Vega & Alvarez (2003) economic freedom → ∆GDP ↔ political freedom
Aixalá & Fabro (2009)
(∆)economic freedom ↔ ∆ GDP ↔ civil freedom
↕ ↑ ↑
political rights
Peev&Mueller (2012) political freedom →economic freedom → ∆GDP
Piątek, Szarzec & Pilc
(2013) economic freedom → ∆GDP → political freedom

The relationship between economic freedom and economic growth in EU countries
Ivana Brkić
76
2.3.7. EXAMINING THE STATE AND IMPACT OF ECONOMIC FREEDOM
WITHIN DIFFERENT GROUPS OF COUNTRIES
Analyzing the impact of economic freedom on the situation or changes in the
economy, some authors have chosen to test such relations in specific areas, socio - political -
economic groups of countries or in particular geographical regions. As this was the aspiration
of the author of the dissertation to establish links between economic freedom and economic
growth within a geopolitical as well as socio-economic area - member states of the European
Union, special attention was paid to scientific studies that also dealt with this topic within the
same or another area whose knowledge is presented below in the dissertation (Table 9).
2.3.7.1. IMPACT OF ECONOMIC FREEDOM IN EUROPEAN COUNTRIES
Few studies have paid attention to examining the impact of economic freedom in the
European area as a whole, but certain groups within the given area (European Union
countries, European transition countries, etc.) have been the focus. Below is an overview of
the results of studies on the achieved relationship between economic freedom and various
economic indicators within Europe.
Rajasalu (2003) examined what are the determinants of economic growth in 28 EU
Member States, some of which were candidates at the time of the study. Panel analysis
showed that economic freedom had a statistically significant and positive effect on economic
growth, regardless of model specification, but that the explanation of the variability of the
dependent variable was very small in all regression models. This suggests that there are other
factors not covered by this analysis that affect economic growth. Fiscal freedom showed that
it would contribute most to economic growth, increasing it by 1.87% if the value of a given
component moved up one notch. Monetary and Financial freedom would have a similar
impact on economic growth, while other aspects of freedom according to the division of the
Heritage Foundation did not show statistical significance.
The European Union means a free trade zone, a customs union and, for sixteen
countries, a monetary union. Likewise, the common agrarian policy that involves
interventionism in the form of subsidies to producers, as well as some aspects related to the

The relationship between economic freedom and economic growth in EU countries
Ivana Brkić
77
harmonization of labor market standards, are not in line with the paradigm of economic
freedom. For this reason, Hall, Lawson & Wogsland (2011) wanted to investigate whether
joining the European Union had the effect of increasing economic freedom, and consequently
economic growth. This panel analysis showed that membership of the European Union has an
effect of increasing economic freedom, but that this effect is (econometrically) small.
Altay & Çelebioğlu (2011) considered the influence of geographical location on the
development of countries. They concluded that there is a development gap between the
countries of Eastern and Western Europe. The authors also find that a country's geographical
position affects its GDP per capita, economic freedom index and democracy index. So they
found that the least developed countries are countries of Eastern Europe, namely: Albania,
Moldova, Montenegro, Serbia and Ukraine, and the most developed are Belgium, Denmark,
France, Germany and the Netherlands. According to the authors' analysis, these countries of
Western Europe, especially France and Germany, are the drivers of economic development.
It has been proven repeatedly that economic freedom can stimulate economic growth,
which also benefits lower-income population, thereby indirectly reducing economic
inequality within society. Yet, there is evidence of the opposite (negative) consequences of
the growth of economic freedom on the area of economic inequality. Because of such uneven
attitudes to this issue, Pérez-Moreno & Angulo-Guerrero (2016) decided to make their
scientific contribution, and they established a positive relationship between economic
freedom and inequality, in the sense that greater economic freedom implies greater economic
inequality. For research purposes, they used panel data, and presented economic freedom
with the help of both major measures of economic freedom - the Hermitage Foundation and
the Fraser Institute, while also analyzing the impact of five separate components of economic
freedom according to the Fraser Institute. The sample included 28 EU Member States, while
the sample observation period was from 2000 to 2010. In accordance with the above, the
authors came to the following results. Although both indices of economic freedom exhibit a
positive link to inequality, certain aspects of economic freedom act differently. Thus,
economic inequality and the aspect of government spending whose minimization symbolizes
greater economic freedom are in a negative relationship. This sheds light on the claim that
large public spending, based on transfer payments and services (health care, education, social
assistance to the disadvantaged) has positive effects on reducing inequality. In line with
Ang’s conclusion (2010) that the development of the financial market reduces inequality,

The relationship between economic freedom and economic growth in EU countries
Ivana Brkić
78
whereas its liberalization increases it, Pérez-Moreno & Angulo-Guerrero (2016) find that less
regulation of the goods, money and labor markets (in the context of greater economic
freedom) leads to greater inequality. As this sector covers a wide range of regulations
regarding labor market regulation, such as dismissal policy, the amount of minimum rents,
the result of a positive correlation with inequality is not surprising. While a greater level of
economic freedom leads to greater stability of money, this phenomenon, according to the
authors' calculation, albeit disproportionately (and unexpectedly) leads to an intensification of
economic inequality. The justification for such results can be found in changes in the
monetary policy area in order to achieve price stability, while these changes may lead to
increased inequality. Although significant segments of the EU's core values - the legal system
and property rights, as well as freedom in international trade, these aspects of economic
freedom did not emphasize statistical significance in relation to economic inequality.
Although these results are significant and among the first to address the issue of the
relationship between economic freedom and economic inequality within the EU, it should be
borne in mind that they can be neither generalized nor applied individually to each country.
Furthermore, given relationships were studied in the short run, which certainly distorts the
final picture of the true nature and importance of the link (in the long run) between economic
freedom and economic inequality, since both variables are linked to economic growth. In
addition, Europe was hit by the recession at the end of the first decade of the 21st century,
which resulted in a decline in economic activity, increased unemployment and rising public
debt in most countries, and thus indirectly in a shift in distribution and redistribution.
2.3.7.2. IMPACT OF ECONOMIC FREEDOM IN COUNTRIES IN TRANSITION
The transition period proved to be suitable for examining the impact of economic
liberalization on economic flows. The process of transition from a planned economy to a free
market, from social/state ownership to predominantly private ownership, should ensure more
efficient business operations, the absence of corruption and, overall, a more economically
liberal society that has positive effects on the economy. With this idea in mind, many authors
have observed changes in countries in transition, in order to see the importance of such
transformation on the economic situation of the countries mentioned.

The relationship between economic freedom and economic growth in EU countries
Ivana Brkić
79
A high level of correlation between economic freedom and numerous macroeconomic
indicators for each of the analyzed countries in transition in South East Europe was noted by
Vukotić & Baćović (2006). Ten Central and Eastern European countries showed a strong
correlation between economic freedom and economic growth in the study by Próchniak
(2011). Subsequent regression confirmed this relationship and showed a positive, statistically
significant impact of economic freedom on economic growth for the mentioned group of
countries in transition.
Pääkkönen (2009) investigated how economic freedom influenced the growth of GDP
per worker in a sample of 25 transition countries by analyzing the period 1998-2005. Over
the set of panel data, the author formed a regression model rich in control variables and came
to the conclusion that economic freedom has a positive effect on economic growth. The
robustness of these results was also confirmed when countries rich in natural resources - oil -
were excluded from the analysis. Public spending proved to have a positive effect on
productivity growth, but also to reduce the positive impact of economic freedom when they
interact. The contribution to productivity growth is weaker when economic freedom interacts
with investment. In order to test robustness, the author later set real GDP growth per capita as
a dependent variable, but the results he obtained were very similar to previous ones.
In the study of the impact of economic freedom on economic performance in centrally
dominated economies conducted by Kovačević & Borović (2014), the authors came up with
some interesting results. The countries examined were countries of former socialism, namely
Bulgaria, Croatia, the Czech Republic, Estonia, Hungary, Latvia, Lithuania, Poland,
Romania, the Slovak Republic and Slovenia, today all full members of the European Union.
The research covered the period between 2000 and 2013. The results show a positive impact
of economic freedom on GDP, which is not statistically significant. The same results were
obtained in the analysis of the impact on GDP per capita. A more detailed analysis of the
structure of economic freedom revealed the different impact of index components on the
economic performance of the given countries.
Analyzing the pillars of economic freedom as seen by the Heritage Foundation, the
authors concluded that Rule of Law (property rights, freedom from corruption) and
Regulatory Efficiency (business freedom, labor freedom, monetary freedom) have a negative
impact on economic performance, with the first pillar not expressing statistical significance.
The relationship between economic freedom and economic growth in EU countries
Ivana Brkić
80
These results are strange, so the authors announce the continuation of research in
order to find acceptable interpretations. Pillars Limited Government (fiscal freedom and
public spending) and Open Markets (investment freedom, trade freedom and financial
freedom) show a positive and statistically significant impact on economic performance.
Bayar (2016) also examined the impact of economic freedom on economic growth in
countries undergoing the transition process. Based on data from 1996 to 2012, he observed 11
such countries, which are also members of the European Union. Bayar (2016) reaffirmed his
assumption that economically freer countries and countries with greater international
exchange have higher economic growth. He also noted that financial openness has an adverse
effect on the economic growth of countries in transition.
We remind that Piątek et al. (2013) established a causal link between economic
freedom and economic growth in a group of 25 transition countries observed from 1990 to
2008. The authors singled out Public Spending, Monetary Freedom, Investment Freedom and
Freedom from Corruption as segments of economic freedom that stand out especially in the
causal link with economic growth in the countries observed.
2.3.7.3. IMPACT OF ECONOMIC FREEDOM IN THE SOUTH AMERICAN REGION
There is (not only) a scientific dilemma as to whether implementing policies that
liberalize the economy helps South American countries reach North American development
levels. Some countries, such as Chile, Bahamas, Colombia, rank very high on economic
freedom lists, while other countries are highly repressive (eg Cuba, Venezuela, Argentina,
Bolivia, Equador). This makes this area very interesting to research and analyze whether
economic freedom really affects the intensity of growth. More important than this question is
the question of which policy has an impact and in what way, as it has been repeatedly proven
that not all aspects of economic freedom are equally deserving of economic growth, nor can it
be uniformly claimed for all countries and regions. Attempts to answer these questions were
made by Bengo & Sanchez-Robles (2003) and Alexandrakis & Livanis (2013).
Bengoa & Sanchez-Robles (2003) were among the first to investigate the impact of
economic freedom on economic growth, both directly and through the impact on foreign
The relationship between economic freedom and economic growth in EU countries
Ivana Brkić
81
direct investment. They concluded that in both cases economic freedom contributes to
economic growth. They also confirmed the well-known findings that foreign direct
investment has a favorable impact on the economy. Through a panel analysis, they observed
the movements of the described relationships in 18 Latin American countries from 1970 to
1999.
Alexandrakis & Livanis (2013) examined whether a more liberal policy would lead to
higher labor productivity expressed by total factor productivity, human capital, and capital
intensity. Such testing was performed using panel analysis in Latin American and Caribbean
countries and OECD countries. They came to the conclusion that economic freedom
expressed by the Fraser Institute chain index would lead to economic growth through total
factor productivity in OECD countries and through human capital in Latin American
countries. Reduced government spending would drive productivity in Latin America, but not
in OECD countries. Low, stable inflation showed a positive, statistically significant impact
on the output per worker. Both aspects of freedom will form a greater output per worker by
improving the total factor productivity. International trade showed positive results in OECD
countries, but not in Latin America. Previously, there had also been theoretical and empirical
evidence that openness in terms of international trade had positive effects in developed but
negative in underdeveloped countries (e.g. Kim, Lin & Suen, 2011). Expressed property
rights had positive effects on the productivity of workers in both regions. The study showed
that deregulation of the labor market, capital and business raise the intensity of capital but
reduce the total factor productivity in both sets of countries.
2.3.7.4. IMPACT OF ECONOMIC FREEDOM IN ISLAMIC COUNTRIES
Most Islamic countries are characterized by marked traditionalism and conservatism,
high natural growth, large reserves of oil and gas, and largely undemocratic political system,
accompanied by relatively volatile socio-political circumstances. The authors who studied the
status and impact of the economic freedom of this group believed that these characteristics
could have determinative effects on the state of economic freedom and, indirectly, on the
level of economic development of those countries.
The relationship between economic freedom and economic growth in EU countries
Ivana Brkić
82
A comparative analysis of 103 countries grouped into five sets of countries based on
the Economic Freedom Index of the Heritage Institute was performed by Peláez (2009). The
comparison was made against the reference group of most free countries: Hong Kong,
Singapore, Australia, USA, New Zealand, United Kingdom and Ireland. Other groups
included "mostly free" countries (23), Latin American countries (19), Islamic countries (43)
and EU member states which are below the level of "mostly free" countries (13 countries,
most of which were part of the former USSR).
The reference group recorded the highest values in the area of business freedom and
property rights, while the lowest ranked segment is related to public spending which is a
characteristic of both Islamic and Latin American countries. In terms of overall degree of
freedom, all countries showed lower values than the reference values. Countries from the
"mostly free" group have lower values in the area of labor freedom, investment freedom and
public spending. Latin American countries and those in which Islam is the dominant religion
do not only differ from the leading group of countries in terms of fiscal freedom and public
spending. Newer member states of the European Union follow the reference countries as
regards trade freedom and fiscal freedom. The Islamic group of countries is less free
compared to Latin American countries and "newer" EU member states. Peláez (2009)
explains the low level of freedom of the Islamic and Latin American group of countries by
historical and socio-political circumstances. The author noted that there is a very large
difference between countries with a high score on the economic freedom scale and Islamic
countries in the segments related to property rights protection and corruption. As Peláez
(2009) explains, in Islamic countries, according to the Quran, Allah is the absolute owner of
everything on earth and gives individuals conditional property rights in respect of possession,
enjoyment and transfer. Moreover, property must serve a higher social purpose, not for profit,
which is a secular concept and at the heart of a capitalist laissez faire society. With high
levels of corruption, these beliefs influenced the continued decline in economic freedom in
Islamic countries, as interpreted by Peláez (2009).
Economic freedom in Islamic countries was also addressed by Türedi (2013). He
studied the impact of both dominant indicators of economic freedom on per capita GDP by
applying a panel method on a sample of 12 Islamic countries from 1995 to 2010. He came to
the conclusion that both indices show a positive and statistically significant impact.

The relationship between economic freedom and economic growth in EU countries
Ivana Brkić
83
2.3.7.5. IMPACT OF ECONOMIC FREEDOM IN AFRICAN COUNTRIES
Bearing in mind that during most of the 20th century African countries were under the
colonial rule of different European countries, that is, during that period their economic and
other development were permanently hampered, they are still characterized by low levels of
economic development and living standards, but also by unstable political-social
circumstances and limited human rights and freedoms. Also, the characteristics of the
mentioned countries are related to the absence of significant natural resources, as well as to
the pronounced ethnic and religious diversity accompanied by frequent tribal conflicts. Their
attributes and efforts towards economic development inspired certain authors to study the
state of economic freedom in these countries and to identify the effects of economic
liberalization on the development of their economies.
N'Zue (2011) studied the former colonies of England and France that today belong to
the Economic Community of West African States (ECOWAS). The author concluded that
economic freedom has a positive but not statistically significant impact on the economic
performance of former colonial countries. Moreover, the author found that the level of
economic activity is the one that affects the level of economic freedom of the countries
observed. However, some elements of economic freedom show a positive and statistically
significant impact on the level of GDP within this economic community. Thus, the level of
public spending, as well as monetary and fiscal freedom, have more effect on the economies
of the countries that were British colonies than in the French-speaking countries. The author
also found that colonialism cannot be blamed for the low level of GDP per capita in these
countries. The process ended in the 1960s and was not proved to have affected economic
performance in the observed period from 1995 to 2008.
In a sample of 6 countries of the Central African Economic and Monetary Community
(CEMAC), Ossono (2012) confirmed that in this group of countries of the African region,
economic freedom has a positive, statistically significant impact on GDP per capita.
By performing a panel analysis on a sample of seven selected member countries of the
Organization of the Petroleum Exporting Countries (OPEC), looking at the period from 2000
to 2009, Ahmadpour, JafariSamimi & Refaei (2013) conclude that economic freedom
influences (positively and statistically significantly) economic growth. However, in line with

The relationship between economic freedom and economic growth in EU countries
Ivana Brkić
84
many other scientific findings, the authors recognize that not all elements have equal
(statistical) significance. Out of the seven aspects of economic freedom unified by the Fraser
Institute within its index, the authors examine five of them. They find that "government size"
has a positive but not statistically significant impact on growth. "Legal system and property
rights", as well as "sound money", but also "regulation of credit, labor and business" have a
positive and statistically significant impact. Only "freedom to trade internationally" in this
study has a negative (statistically significant) relationship with growth, reducing it by 0.12%
with the growth of index by one unit. These results are surprising given the formal name and
preference of countries within the organization which base their economies on oil exports.
Observing the period from 2000 to 2009 and a specific group of countries, Panahi et
al. (2014) found that growth by one index point on the economic freedom scale leads to
economic growth by 1.22%. The research was conducted in 13 Middle East and North Africa
(MENA) countries. By decomposing the components of the economic freedom index created
by the Fraser Institute, scientists obtain results somewhat contradictory to those found so far
in the literature. They noted that the size of government shows no significance while the
value of the coefficient is positive. Legal structure and property rights are in a significant,
negative relationship, and the results indicate that one unit increase of the index reduces the
growth rate by 0.07%. This result was somewhat surprising to the authors, as most of the
previous studies showed a positive or independent relationship. Sound money and freedom to
trade internationally are in a positive, statistically significant correlation with growth, as is
the regulation of credit, labor and business, whose growth in freedom by one unit affects the
economic growth by 0.63%.
In a group of 12 countries in the Southern African Development Community (SADC)
in addition to the causal link between the Fraser Institute's aggregate economic freedom index
and per capita GDP, Gorlach & Le Roux (2015) found a positive and statistically significant
impact of all five components of the given index.
Recently, Zghidi, Mohamed Sghaier & Abida (2016) have examined the impact of
foreign direct investment and economic freedom on economic growth in a group of four
North African countries (Tunisia, Morocco, Algeria, Egypt). Covering the period from 1980
to 2013, using the Generalized Method of Moments (GMM), they concluded that foreign
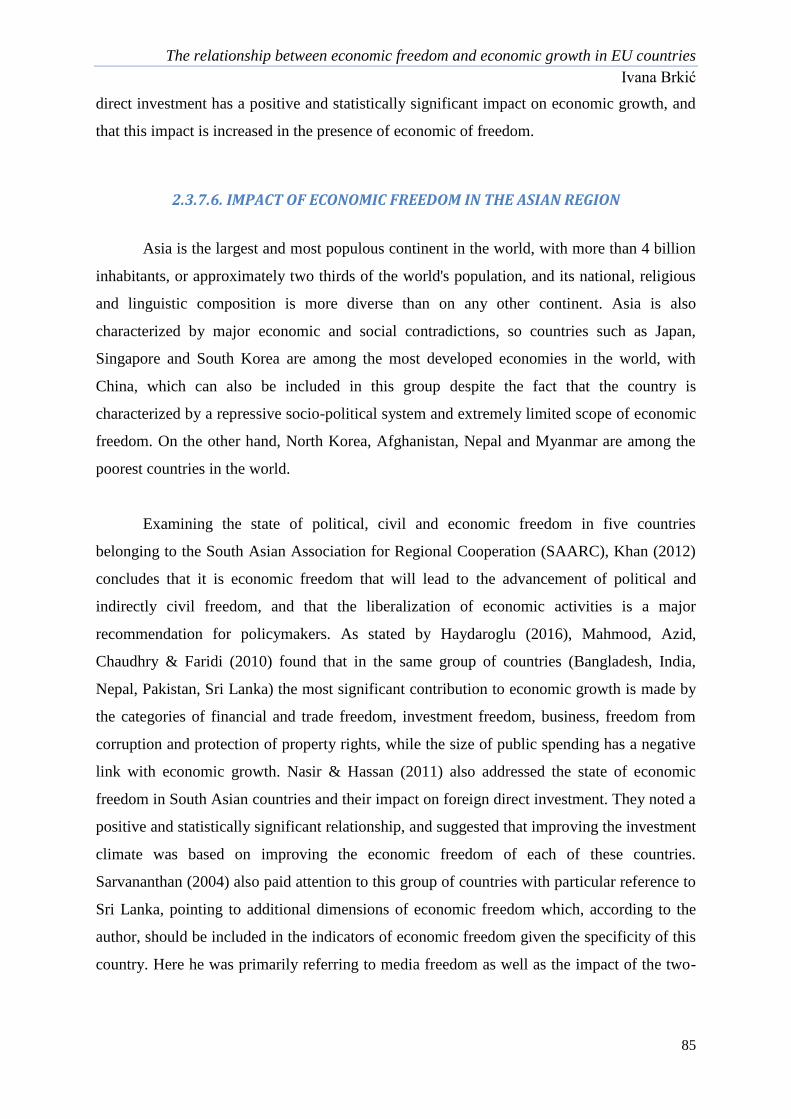
The relationship between economic freedom and economic growth in EU countries
Ivana Brkić
85
direct investment has a positive and statistically significant impact on economic growth, and
that this impact is increased in the presence of economic of freedom.
2.3.7.6. IMPACT OF ECONOMIC FREEDOM IN THE ASIAN REGION
Asia is the largest and most populous continent in the world, with more than 4 billion
inhabitants, or approximately two thirds of the world's population, and its national, religious
and linguistic composition is more diverse than on any other continent. Asia is also
characterized by major economic and social contradictions, so countries such as Japan,
Singapore and South Korea are among the most developed economies in the world, with
China, which can also be included in this group despite the fact that the country is
characterized by a repressive socio-political system and extremely limited scope of economic
freedom. On the other hand, North Korea, Afghanistan, Nepal and Myanmar are among the
poorest countries in the world.
Examining the state of political, civil and economic freedom in five countries
belonging to the South Asian Association for Regional Cooperation (SAARC), Khan (2012)
concludes that it is economic freedom that will lead to the advancement of political and
indirectly civil freedom, and that the liberalization of economic activities is a major
recommendation for policymakers. As stated by Haydaroglu (2016), Mahmood, Azid,
Chaudhry & Faridi (2010) found that in the same group of countries (Bangladesh, India,
Nepal, Pakistan, Sri Lanka) the most significant contribution to economic growth is made by
the categories of financial and trade freedom, investment freedom, business, freedom from
corruption and protection of property rights, while the size of public spending has a negative
link with economic growth. Nasir & Hassan (2011) also addressed the state of economic
freedom in South Asian countries and their impact on foreign direct investment. They noted a
positive and statistically significant relationship, and suggested that improving the investment
climate was based on improving the economic freedom of each of these countries.
Sarvananthan (2004) also paid attention to this group of countries with particular reference to
Sri Lanka, pointing to additional dimensions of economic freedom which, according to the
author, should be included in the indicators of economic freedom given the specificity of this
country. Here he was primarily referring to media freedom as well as the impact of the two-

The relationship between economic freedom and economic growth in EU countries
Ivana Brkić
86
decade civil war, which undoubtedly had consequences for the economic situation in the
country.
Tiwari (2011) studied the impact of certain components of economic freedom, foreign
aid and foreign direct investment on economic growth within 28 Asian countries. He came to
the conclusion that there is a positive and statistically significant relationship between fiscal
as well as financial freedom and economic growth. Negative impact was observed in freedom
from corruption, as well as in foreign direct investment and foreign aid received by these
countries. For the latter, a particularly negative impact was observed when it comes to the
high inflow of economic assistance.
A very specific group of countries is the so-called Asian Tigers, including Hong
Kong, Singapore, Taiwan, South Korea, and Japan, whose cause of rapid economic growth in
the last four decades was particularly studied by Paldam (2003). These countries are
characterized by low levels of public spending, equal distribution of income and high savings
rates. The author noted that the two cities - states (Hong Kong and Singapore) are primarily
trade nations with distinct property rights, in terms of the laissez-faire concept most similar to
the United States. South Korea and Taiwan, on the other hand, are more similar to European
countries (eg France and the Scandinavian countries), which have a slightly lower level of
economic freedom.
Economic freedom proved to be a positive and statistically significant determinant of
GDP attained in five emerging economies: Brazil, Russia, India, China and South Africa (the
so-called BRICS). Looking at the given impact as well as the impact of foreign direct
investment on economic growth, Haydaroglu (2016) found that only public spending has a
negative (statistically significant) impact, while other aspects of economic freedom
(monetary, business, trade freedom and protection of property rights) have a positive impact
on the level of economic output.
2.3.7.7. IMPACT OF ECONOMIC FREEDOM IN NORTH AMERICA
North America includes the second and third largest countries in the world, i.e.
Canada and the United States of America. For several decades, the United States has been a
The relationship between economic freedom and economic growth in EU countries
Ivana Brkić
87
leading global power, especially in economic and military terms, while Canada, despite its
significantly smaller population and far scarcer natural resources than its southern neighbor,
has also positioned itself among the most developed economies on the planet, with extremely
high standards of living. In addition, the United States and Canada are characterized by high
degrees of economic freedom, with the level of the same being slightly lower in Canada,
primarily due to higher levels of public spending and less flexible labor market.
Compton, Giedeman & Hoover (2011) investigated the impact of level as well as
change in the level of a five-year average of economic freedom over a long period between
1981–2004 on a sample of five U.S. states. They found that the change in level had an impact
on the level of total production in the countries, while the level of economic freedom did not
show robust results by applying different methods of analysis (least squares method and
generalized method of moments). The authors also investigated the impact of certain
segments on the size of economic activity. Government size, embodied in public spending,
transfers, subsidies and social security (as % of GDP), showed a significant impact on GDP
size. This confirmed the view that, in addition to government spending, it is necessary to
ensure the functioning of the basic functions of the state (defense and the legal system for the
protection of property rights, as well as the provision of public goods), excessive public
spending impairs economic freedom and threatens economic progress. Although economic
freedom entails lower taxes in order to preserve personal choices, this component did not
prove statistically significant in observing its impact on the level of total production in the
presented sample of countries. Some aspects of labor freedom, such as absence of minimum
wage regulations, showed an impact on the economy in five US countries, while other aspects
(union strength and number of employees in public sector) did not show statistical
significance. The overall conclusion of this study is that the aggregate index needs not be a
precise indicator of the economic growth of certain countries and that it is necessary to
specify those aspects of economic freedom that determine the achieved scope of economic
activity in the countries observed.
Karabegovic, Samida, Schlegel & McMahon (2003) observed how the level and
growth of economic freedom affect the level and growth of GDP in 10 Canadian provinces
and 50 US states. They came to the conclusion that in all combinations the positive and
statistically significant impact of economic freedom on the level and growth of economic
activity in the observed area of North America was expressed. They found that Canada had a
The relationship between economic freedom and economic growth in EU countries
Ivana Brkić
88
lower level of economic freedom, manifested in higher taxes, higher public spending and a
more rigid labor market than America. The authors believe that lowered economic freedom,
according to the results, determines the lower standard of living of the citizens of the
Canadian provinces relative to the inhabitants of America.
Bennett (2016) analysed the same area of North America between 1981 and 1997 and
also concluded that economic freedom had a positive and statistically significant impact on
GDP per capita. This was particularly true of segments of government size restrictions and of
labor market-oriented freedom. He also found that economic freedom negatively was related
to unemployment in these territories, but also that the growth of economic freedom led to an
increase in unequal distribution of income, especially in the United States.
Bayar & Aytemiz (2015) conducted an interesting study examining the impact of
economic freedom in the US on the economic growth of 7 Asian countries. The authors found
a positive, statistically significant impact, although the authors' work lacked a deeper
interpretation of the results obtained and the link between economic freedom in one part and
the economic growth of another part of the world, although the concept of globalization is a
logical explanation for this outcome.
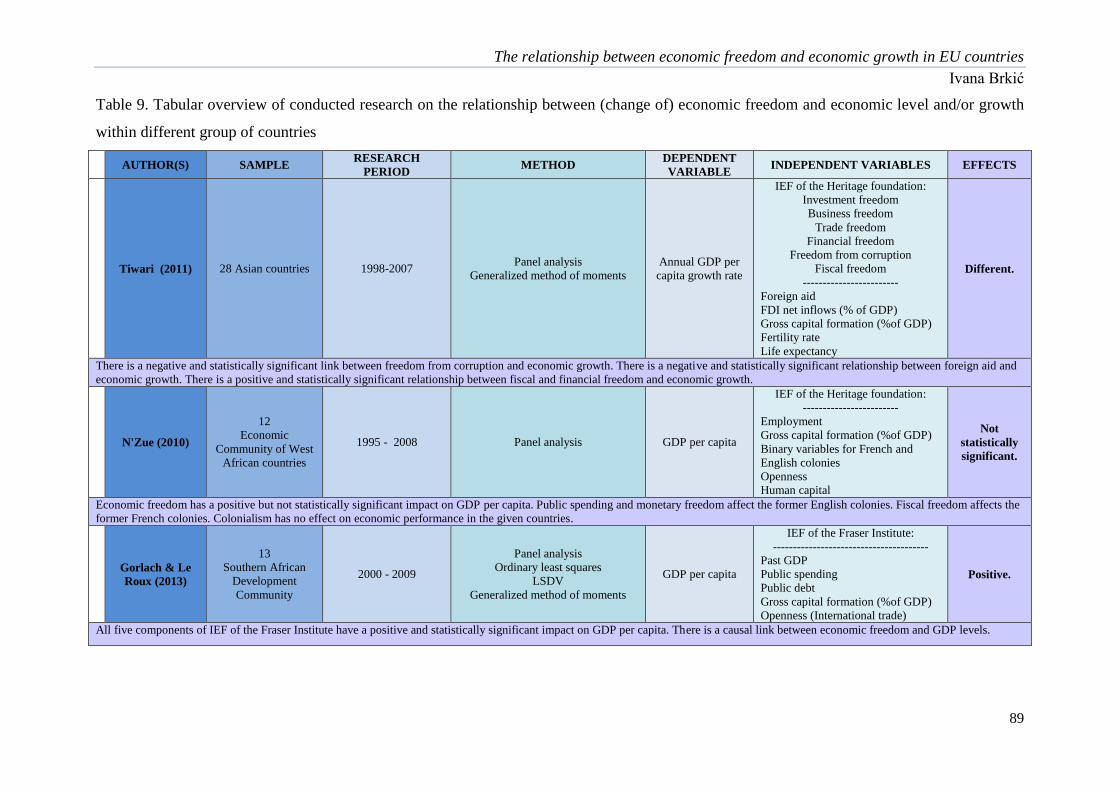
The relationship between economic freedom and economic growth in EU countries
Ivana Brkić
89
Table 9. Tabular overview of conducted research on the relationship between (change of) economic freedom and economic level and/or growth
within different group of countries
AUTHOR(S) SAMPLE
RESEARCH
PERIOD METHOD
DEPENDENT
VARIABLE INDEPENDENT VARIABLES EFFECTS
Tiwari (2011) 28 Asian countries 1998-2007 Panel analysis
Generalized method of moments
Annual GDP per
capita growth rate
IEF of the Heritage foundation:
Investment freedom
Business freedom
Trade freedom
Financial freedom
Freedom from corruption
Fiscal freedom
------------------------
Foreign aid
FDI net inflows (% of GDP)
Gross capital formation (%of GDP)
Fertility rate
Life expectancy
Different.
There is a negative and statistically significant link between freedom from corruption and economic growth. There is a negative and statistically significant relationship between foreign aid and
economic growth. There is a positive and statistically significant relationship between fiscal and financial freedom and economic growth.
N'Zue (2010)
12
Economic
Community of West
African countries
1995 - 2008 Panel analysis GDP per capita
IEF of the Heritage foundation:
------------------------
Employment
Gross capital formation (%of GDP)
Binary variables for French and
English colonies
Openness
Human capital
Not
statistically
significant.
Economic freedom has a positive but not statistically significant impact on GDP per capita. Public spending and monetary freedom affect the former English colonies. Fiscal freedom affects the
former French colonies. Colonialism has no effect on economic performance in the given countries.
Gorlach & Le
Roux (2013)
13
Southern African
Development
Community
2000 - 2009
Panel analysis
Ordinary least squares
LSDV
Generalized method of moments
GDP per capita
IEF of the Fraser Institute:
---------------------------------------
Past GDP
Public spending
Public debt
Gross capital formation (%of GDP)
Openness (International trade)
Positive.
All five components of IEF of the Fraser Institute have a positive and statistically significant impact on GDP per capita. There is a causal link between economic freedom and GDP levels.

The relationship between economic freedom and economic growth in EU countries
Ivana Brkić
90
AUTHOR(S) SAMPLE
RESEARCH
PERIOD METHOD
DEPENDENT
VARIABLE INDEPENDENT VARIABLES EFFECTS
Ossono (2012)
6
Central African
Economic and
Monetary
Communities
1995 - 2008
Panel analysis
Ordinary least squares
(fixed effects model)
Generalized method of moments
GDP per capita
IEF of the Heritage foundation
---------------------------------------
Foreign direct investment
Gross capital formation (%of GDP)
Inflation
GDP growth rate
Population growth
Foreign development aid
Interest rate
Positive.
Economic freedom expressed by IEF of the Heritage Foundation has a positive and statistically significant impact on GDP per capita. There is a causal link between economic freedom and GDP
levels.
Ahmadpour,
JafariSamimi &
Refaei (2013)
7 OPEC countries 2000 - 2009 Panel analysis
(fixed effects model)
GDP per capita
growth
IEF of the Fraser Institute
(Gwartney et al 2010)
----------------------------------------
- Number of students enrolled in
high school
- Workforce
- International trade (openness)
- Investment (% of GDP)
Positive.
Total IEF, positive, statistically significant impact on GDP growth. Size of Government - a positive but not statistically significant impact on GDP growth. Legal system and protection of
property rights - a positive, statistically significant impact on GDP growth. Sound money - a positive, statistically significant impact on GDP growth. International trade - a negative, statistically
significant impact on GDP growth. Credit market regulations, labor market regulations and business regulations - a positive, statistically significant impact on GDP growth.
Zghidi,
Mohamed
Sghaier & Abida
(2016)
4
North African
countries
1980 - 2013 Panel analysis
Generalized method of moments
GDP per capita
growth
IEF of the Fraser Institute
(Gwartney et al.2015)
Foreign direct investment
---------------------------------------
Initial GDP
Gross capital formation (%of GDP)
Number of students enrolled in high
school
Population growth
Openness (international trade)
Positive.
Impact of FDI on economic growth is positive and statistically significant, but such impact is amplified by the presence of economic freedom.
Haydaroglu
(2016)
5
Brazil, Russia, India,
China, South Africa
1995 - 2013 Panel analysis GDP per capita
IEF of the Heritage foundation
Public spending; Monetary freedom;
Property rights; Trade freedom;
Business freedom
--------------------
Positive.

The relationship between economic freedom and economic growth in EU countries
Ivana Brkić
91
AUTHOR(S) SAMPLE
RESEARCH
PERIOD METHOD
DEPENDENT
VARIABLE INDEPENDENT VARIABLES EFFECTS
FDI
Openness (International trade)
Money supply (% of GDP)
Electricity consumption per capita
Gross capital formation (%of GDP)
The Economic Freedom Index has a positive, statistically significant impact on GDP per capita. Monetary, business, trade freedom and protection of property rights have a positive and public
spending a negative, statistically significant impact on GDP per capita.
Rajasalu (2003)
28
member states of EU
and its candidates at
the time of
publication of the
paper
1994-2001 Panel analysis Annual GDP
growth rate
IEF of the Heritage foundation
---------------------------------------
Initial level of GDP
---------------------------------------
Export (% of GDP)
Inflation (%)
Foreign direct investment (% of
GDP)
Gross capital formation (%of GDP)
Export of high technology
Number of computers per 100
inhabitants
Internet users per 100 inhabitants
Positive.
Economic freedom has a positive and statistically significant impact on economic growth (regardless of model specification), but the explanation for the variance in economic growth across all
models is small. Fiscal freedom, Monetary freedom, and Investment freedom affect economic growth.
Bengoa &
Sanchez-Robles
(2003)
18 Latin American
countries 1970 – 1999 Panel analysis
Investment (% of
GDP)
----------------
GDP
IEF of the Fraser Institute
--------------------------------
Inflation
GDP
Public debt (% of GDP)
Public investment (rail)
Binary variable 1980–1985 (debt
crisis)
Binary variable 1990–1995 (Mexican
peso crisis)
--------------------------------
Number of students enrolled in high
school
Inflation
Public spending (% of GDP)
Binary variable 1980–1985 (debt
crisis)
Positive.
Economic freedom has a positive and statistically significant impact on foreign direct investment and economic growth.

The relationship between economic freedom and economic growth in EU countries
Ivana Brkić
92
AUTHOR(S) SAMPLE
RESEARCH
PERIOD METHOD
DEPENDENT
VARIABLE INDEPENDENT VARIABLES EFFECTS
Alexandrakis &
Livanis (2013)
23 Latin American
countries and
23 ОЕCD countries
1984 - 2007 Panel analysis GDP per worker
Chain-linked IEF of the Fraser
Institute
(Gwartney et al., 2010)
Economic freedom has a positive impact on productivity in both regions. This is achieved more through overall factor productivity in OECD countries, while in Latin America this is achieved
through human capital. Size of Government - positive, statistically significant in OECD countries, but not in LA countries. Legal system and protection of property rights and Sound money -
positive, statistically significant in both sets of countries. International trade - positive, statistically significant in OECD; negative, statistically significant in LA. Credit market, Labor market,
and Business regulation - raises capital intensity but decreases overall factor productivity in both sets of countries.
Peláez (2009)
103
Five group of
countries: Freedoms,
Mostly free, Islamic,
Latin American,
certain EU countries
2007 Ordinary least squares
IEF of The
Heritage
Foundation
Binary variables for each group of
countries -
Islamic countries are the lowest ranked and show the strongest downward trend, while LA countries are stagnant. Somewhat better ranked countries are those that later joined the EU.
Türedi (2013) 12
Islamic countries 1995 - 2010
Panel analysis
(fixed effects model) GDP per capita
IEF of the Heritage foundation
IEF of the Fraser Institute
------------------------------
Gross capital formation per capita
Human development index
Number of Internet users per 100
inhabitants
Domestic credit to private sector (%
of GDP)
Inflation (%)
Openness (international trade)
Positive.
Economic freedom has a positive and statistically significant impact on economic growth.
Hall, Lawson &
Wogsland (2011) 35EU countries 1970 - 2007 Panel analysis
IEF of The Fraser
Institute
Binary variable for EU member
states.
Binary variable for member states of
EU and Monetary union
Positive.
EU membership has a positive and statistically significant impact on the level of economic freedom, but such impact is small.
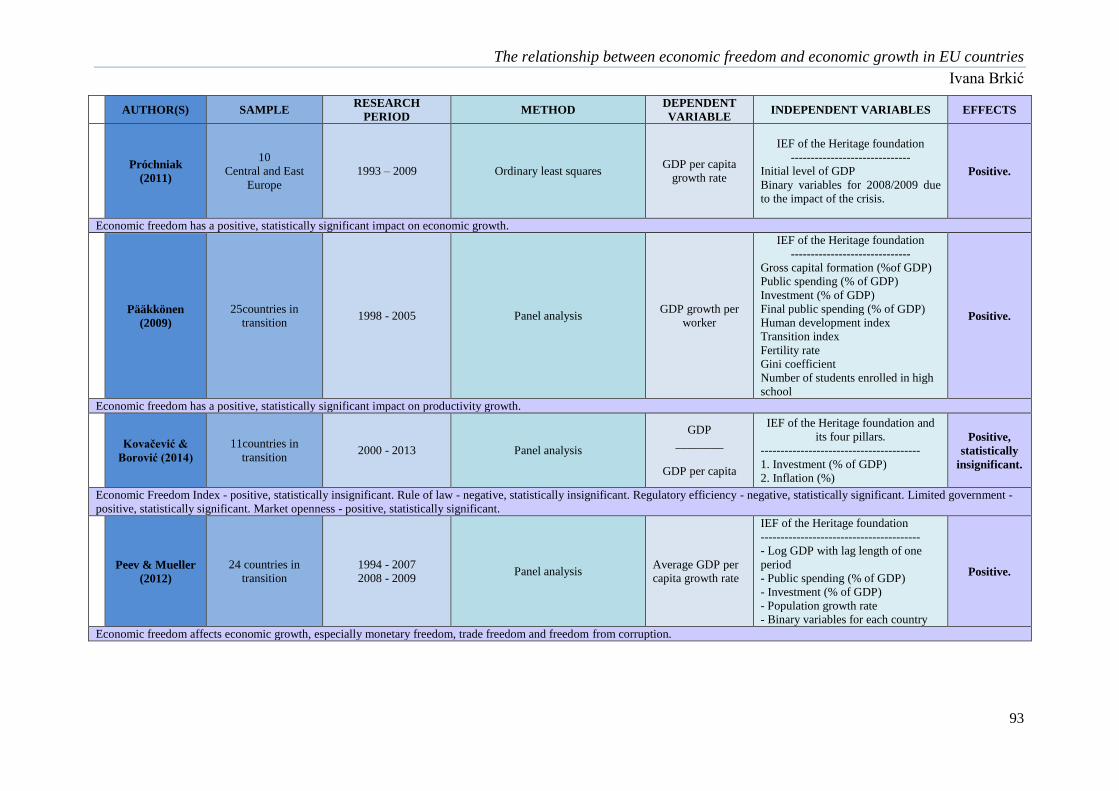
The relationship between economic freedom and economic growth in EU countries
Ivana Brkić
93
AUTHOR(S) SAMPLE
RESEARCH
PERIOD METHOD
DEPENDENT
VARIABLE INDEPENDENT VARIABLES EFFECTS
Próchniak
(2011)
10
Central and East
Europe
1993 – 2009 Ordinary least squares GDP per capita
growth rate
IEF of the Heritage foundation
------------------------------
Initial level of GDP
Binary variables for 2008/2009 due
to the impact of the crisis.
Positive.
Economic freedom has a positive, statistically significant impact on economic growth.
Pääkkönen
(2009)
25countries in
transition 1998 - 2005 Panel analysis
GDP growth per
worker
IEF of the Heritage foundation
------------------------------
Gross capital formation (%of GDP)
Public spending (% of GDP)
Investment (% of GDP)
Final public spending (% of GDP)
Human development index
Transition index
Fertility rate
Gini coefficient
Number of students enrolled in high
school
Positive.
Economic freedom has a positive, statistically significant impact on productivity growth.
Kovačević &
Borović (2014)
11countries in
transition 2000 - 2013 Panel analysis
GDP
________
GDP per capita
IEF of the Heritage foundation and
its four pillars.
----------------------------------------
1. Investment (% of GDP)
2. Inflation (%)
Positive,
statistically
insignificant.
Economic Freedom Index - positive, statistically insignificant. Rule of law - negative, statistically insignificant. Regulatory efficiency - negative, statistically significant. Limited government -
positive, statistically significant. Market openness - positive, statistically significant.
Peev & Mueller
(2012)
24 countries in
transition
1994 - 2007
2008 - 2009 Panel analysis
Average GDP per
capita growth rate
IEF of the Heritage foundation
----------------------------------------
- Log GDP with lag length of one
period
- Public spending (% of GDP)
- Investment (% of GDP)
- Population growth rate
- Binary variables for each country
Positive.
Economic freedom affects economic growth, especially monetary freedom, trade freedom and freedom from corruption.
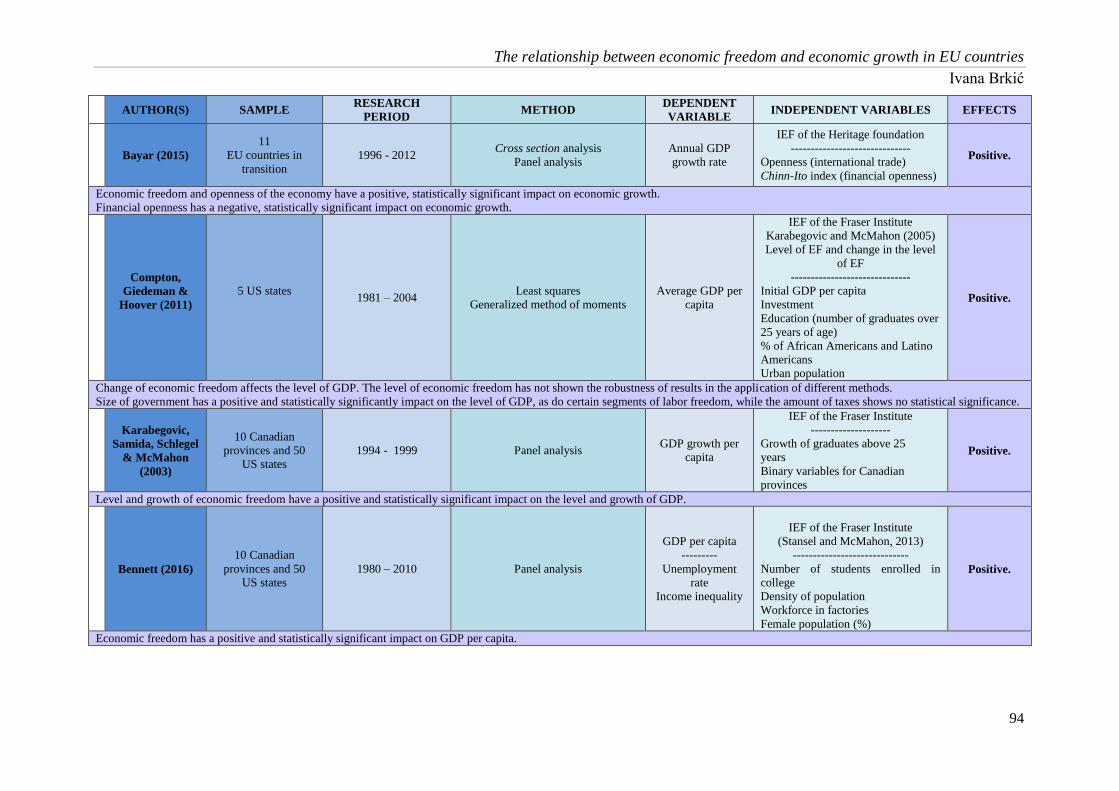
The relationship between economic freedom and economic growth in EU countries
Ivana Brkić
94
AUTHOR(S) SAMPLE
RESEARCH
PERIOD METHOD
DEPENDENT
VARIABLE INDEPENDENT VARIABLES EFFECTS
Bayar (2015)
11
EU countries in
transition
1996 - 2012 Cross section analysis
Panel analysis
Annual GDP
growth rate
IEF of the Heritage foundation
------------------------------
Openness (international trade)
Chinn-Ito index (financial openness)
Positive.
Economic freedom and openness of the economy have a positive, statistically significant impact on economic growth.
Financial openness has a negative, statistically significant impact on economic growth.
Compton,
Giedeman &
Hoover (2011)
5 US states
1981 – 2004
Least squares
Generalized method of moments
Average GDP per
capita
IEF of the Fraser Institute
Karabegovic and McMahon (2005)
Level of ЕF and change in the level
of EF
------------------------------
Initial GDP per capita
Investment
Education (number of graduates over
25 years of age)
% of African Americans and Latino
Americans
Urban population
Positive.
Change of economic freedom affects the level of GDP. The level of economic freedom has not shown the robustness of results in the application of different methods.
Size of government has a positive and statistically significantly impact on the level of GDP, as do certain segments of labor freedom, while the amount of taxes shows no statistical significance.
Karabegovic,
Samida, Schlegel
& McMahon
(2003)
10 Canadian
provinces and 50
US states
1994 - 1999 Panel analysis GDP growth per
capita
IEF of the Fraser Institute
--------------------
Growth of graduates above 25
years
Binary variables for Canadian
provinces
Positive.
Level and growth of economic freedom have a positive and statistically significant impact on the level and growth of GDP.
Bennett (2016)
10 Canadian
provinces and 50
US states
1980 – 2010 Panel analysis
GDP per capita
---------
Unemployment
rate
Income inequality
IEF of the Fraser Institute
(Stansel and McMahon, 2013)
-----------------------------
Number of students enrolled in
college
Density of population
Workforce in factories
Female population (%)
Positive.
Economic freedom has a positive and statistically significant impact on GDP per capita.
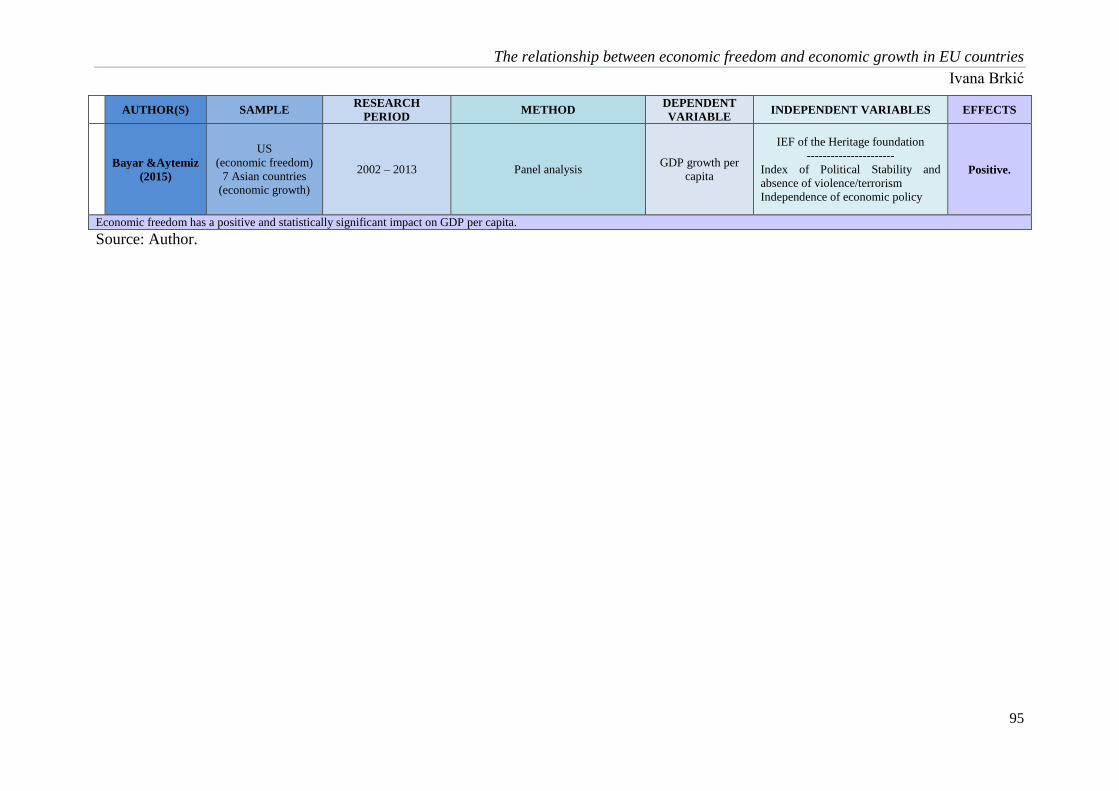
The relationship between economic freedom and economic growth in EU countries
Ivana Brkić
95
AUTHOR(S) SAMPLE
RESEARCH
PERIOD METHOD
DEPENDENT
VARIABLE INDEPENDENT VARIABLES EFFECTS
Bayar &Aytemiz
(2015)
US
(economic freedom)
7 Asian countries
(economic growth)
2002 – 2013 Panel analysis GDP growth per
capita
IEF of the Heritage foundation
----------------------
Index of Political Stability and
absence of violence/terrorism
Independence of economic policy
Positive.
Economic freedom has a positive and statistically significant impact on GDP per capita.
Source: Author.

The relationship between economic freedom and economic growth in EU countries
Ivana Brkić
96
2.3.8. EXAMINING THE STATE AND CHANGES OF ECONOMIC FREEDOM OF
CERTAIN COUNTRIES
Some authors addressed the question of what impact economic liberalization had had
on selected countries, what had brought them positive, what negative, and how such policies
and practices had affected the economic situation and changes in those countries. Below are
the results of studies that examined the effects of economic freedom in Ireland, today a highly
economically free country, Italy and Turkey, moderately free, and Croatia and Bosnia and
Herzegovina as still not sufficiently economically free countries. Summarized specific
research results are presented in Table 14.
According to Powell (2003), the rapid growth of Ireland's economy is due to an
institutional effort to liberalize the economy. Although some aspects of economic freedom
had long been present in Irish society, only a balanced, intensive and simultaneous
application of all aspects of economic freedom led to economic expansion. The period of
protection, typical of the fifth decade of the twentieth century, reflected an economic growth
of only two percent. The liberalization of the 1960s contributed to an improvement in
economic growth of 4.2%. The liberalization of trade continued in the 1970s, but Keynesian
interventionism led to stagnation. High levels of inflation, fiscal instability, high levels of
public spending and taxes resulted in economic growth of just 1.9%, as explained by Powell
(2003). Influenced by the fiscal crisis, public spending and, subsequently, taxes were
reduced, which led to an increase in economic freedom and, indirectly, to economic progress.
"Celtic Tiger" as the author calls it, experienced economic boom in the late 1990s with the
synergistic effect of all aspects of economic freedom.
In an effort to examine the contribution of economic freedom to Italy's economic
growth, Erdal (2004) performed an analysis, constructing his own index of economic
freedom. Covering the period from 1960 to 2000, the author concluded that economic
freedom had a positive and statistically significant impact on economic growth, proving the
robustness of such results by placing different variants of the economic freedom index in the
regression model. The analysis of the partial components of the index showed that the
minimization of public spending, a stable legal system and protected property rights, as well
as the reduced state intervention in the private sector (taxes, etc.) have a positive impact on

The relationship between economic freedom and economic growth in EU countries
Ivana Brkić
97
economic growth. The monetary stability and international trade aspects show positive but
not statistically significant results. A feature of the Italian economy is the inefficient
collection of taxes, the unproductive use of public resources and the gray economy, although
these indicators showed a negative coefficient in relation to economic growth. Another
illogicality emerged in examining the impact of the freedom of the capital and investment
markets, which showed a negative (not statistically significant) coefficient, although Italy has
had a large inflow of capital in recent decades. The author also examined the causality of the
relation between economic freedom and economic growth in the example of Italy (in
Granger's sense) and proved that economic freedom causes economic growth, while such a
relation was not observed in the reverse direction.
Erdal & Yenipazarli (2013) tried to overcome some of the reasons for the different
signs and strengths of the relationship between economic freedom and growth. The three
most common causes of diverse results in the authors’ view are: the nature of country
selection and/or the use of panel analysis, the application of certain indicators (indices) of
economic freedom, and the application of the assessment method. Therefore, Erdal &
Yenipazarli (2013) performed a time series analysis between 1970 and 2006 that concerned
only one country - Turkey. Moreover, the authors constructed a new index consisting of
twenty-eight indicators of economic freedom grouped into six components: government size,
interventions in the market, stability of money and banking system, freedom of trade in the
capital market, trade freedom, institutional structures. The given components are formed on
the basis of the existing economic freedom indices (Heritage Foundation and Fraser Institute)
and according to the data available for Turkey. The index thus formed showed a strong,
positive and statistically significant link to economic growth. Its individual components are in
different relations with economic prosperity. Freedom of the capital market, as well as the
stability of money and the banking system show the strongest link. Government size, trade
freedom and institutional structures show different relationships depending on the model by
which the assessment is made. This is a problem that has been encountered in many studies
and raises doubts about the validity of the results. Low levels of market intervention
(measured mainly by low taxes and loans) showed a negative but insignificant effect on per
capita income, regardless of the assessment method used by the authors - the Autoregressive
Distributed Lag (ARDL) model and the method proposed by Johansen (1988).
The relationship between economic freedom and economic growth in EU countries
Ivana Brkić
98
Borović (2014, a) paid attention to determining the impact of economic freedom on
two Balkan countries: Croatia and Bosnia and Herzegovina. The results he obtained are
different for the observed countries. While the positive impact of economic freedom on
growth was shown in Bosnia and Herzegovina, such an impact is markedly negative in
Croatia. The author finds the explanation for such results in the economic crisis that has
undoubtedly affected (also) this transition country, but much more in the process of adapting
to the new rules, especially with regard to the judicial system that Croatia is facing regarding
accession to the European Union. The author explains that it takes some time for the
institutional changes to be impregnated into society and expects that economic freedom will
then have a positive impact on economic growth. Borović (2014, b) also wanted to examine
which of the pillars of economic freedom is determining in terms of the positive impact on
economic growth as demonstrated in the previous study. Thus, after eliminating one of the
pillars of freedom from the model due to the high correlation, he came to the conclusion that
only the pillar of Limited government is positively related to economic growth, while Rule of
Law and Market Openness are in a negative relationship. The specificity of the post-war
environment, as well as the irregularities in the privatization process, resulted in a high level
of corruption and a low level of protection of property rights, which was reflected in the
results obtained. The large government involvement in economic and financial flows is also a
reason for the negative correlation between Market openness and economic growth. Despite
the results, the author advocates reduced government interventions, reduced bureaucracy, and
increased rule of law in order to promote economic freedom and, indirectly, economic growth
in this country.
Table 10: A tabular presentation of the results of the examinations so far of the situation and
changes in the economic freedom of individual countries

The relationship between economic freedom and economic growth in EU countries
Ivana Brkić
99
Table 10. Tabular presentation of the results of the examinations so far of the situation and changes of the economic freedom of individual
countries
AUTHOR(S) SAMPLE
RESEARCH
PERIOD METHOD
DEPENDENT
VARIABLE INDEPENDENT VARIABLES EFFECTS
Erdal (2004) Italy 1960 - 2000 Ordinary least squares
Granger causality test
Annual real GDP
growth rate
His own index of economic freedom
---------------------------------------
Gross fixed capital (% of GDP)
Growth of the working
population(15-64 years of age)
Growth of number of students
enrolled in high school (15-19 years
of age)
Positive.
Parts
different.
Economic freedom has a positive impact on economic growth. Some aspects affect economic growth differently. Economic freedom causes economic growth.
Erdal and
Yenipazarli
(2013)
Turkey 1970 – 2006
ARDL
GDP per unit of
work, calculated as
total GDP by total
employees
Their own index of economic
freedom
----------------------------------------
Primary school enrollment rate
Net capital per unit of labor
Binary variables for the effects of the
financial and economic crisis in
1980, 1994, 1999 and 2001.
Positive.
Parts
different.
The overall index has a positive and statistically significant impact on economic growth. The stability of money and the banking system, the freedom of trade in the capital market have a
positive and statistically significant impact on economic growth. The impact of other categories of freedom depends on the method used.
Borović (2014, а) Croatia and Bosnia
and Herzegovina 2001 - 2012 Ordinary least squares GDP growth rate
IEF of the Heritage Foundation
---------------------------------------
Initial GDP level
Investment (% of GDP)
Public spending (% of GDP)
Average investment rate (%)
Export-import ratio (% of GDP)
Negative.
Positive.
Croatia - negative impact. Bosnia and Herzegovina - positive impact.
Borović (2014, b) Bosnia and
Herzegovina 2000 - 2013 -
Average GDP
growth rate
IEF of the Heritage Foundation
---------------------------------------
Investment (% of GDP)
Positive.
Parts
different.
Significant impact of the overall economic freedom index on economic growth. Two of the three pillars observed are negatively related to economic growth: Rule of Law and Market Openness;
Limited Government is positively related to growth.
Source: Author.

The relationship between economic freedom and economic growth in EU countries
Ivana Brkić
100
SECTION SUMMARY
The first part of the dissertation presents the theoretical background on the relationship
between economic freedom and economic growth, which is the basis for subsequently conducted
empirical research on a sample of EU Member States.
The first chapter defines the concept of economic freedom and gives a chronological
account of the development of economic thought from the aspect of economic freedom. Different
currents of opinion were analyzed regarding the optimal level of regulation of the market. In
order to accurately determine whether economic institutions are determinants of economic
growth, the qualification of economic freedom had to be performed, which reputable
organizations have done - measured, monitored and published results in the form of the
Economic Freedom Index -. The most famous indices of economic freedom are those constructed
by the Freedom House, Scully & Slottje (1991), the Fraser Institute and the Heritage Foundation,
whose indices are briefly presented in the first chapter.
As the empirical part of the dissertation used the data of the Economic Freedom Index of
the Heritage Foundation, the second chapter provides a detailed theoretical interpretation of the
given index as well as the methodology for calculating the subindices. This was important to
present in order to have a clear picture of what the Economic Freedom Index actually
encompasses and represents.
The third chapter of the theoretical part was devoted to a review of scientific
achievements on the topic of the relation between economic freedom and economic growth. The
most important scientific findings on the nature of the relationship between economic freedom as
a whole and some of its parts (sub-indices) with economic growth are presented. Also, particular
attention within the subchapters was paid to scientific research that examined the relationship
between change (as opposed to level) of economic freedom and economic growth. A review of
scientific views on the causality in the relationship between economic freedom and economic
growth was also conducted, where causality was defined in Granger's sense (Granger, 1969).
The relationship between economic freedom and economic growth in EU countries
Ivana Brkić
101
As some authors have established the link between economic, political and civil freedom
and economic growth - the most representative studies which have come to some knowledge of
the causal links given are presented.
Considering that the subject of the dissertation is the analysis of the impact of (change of)
economic freedom on the economy within a specific geopolitical and socio-economic area - the
European Union, an analysis of the scientific literature was carried out, which also examined
these relations in the same or other groups of countries. Thus the authors, who analyzed the
relations between economic freedom and economic growth in groups of countries in the
territories of Europe, North and South America, Africa, Asia, among Islamic countries and
countries in transition, stood out. Likewise, certain authors focused on specific countries to
determine how much economic freedom contributes to the economic prosperity of the countries
whose observations are presented in a separate chapter.
As the detailed theoretical basis for empirical research has been made, the second part of
the dissertation is fully devoted to the concrete exploration of the impact and causal relationship
between economic freedom and economic growth on a sample of EU member states.
The relationship between economic freedom and economic growth in EU countries
Ivana Brkić
102
SECTION 2. EMPIRICAL FRAMEWORK

The relationship between economic freedom and economic growth in EU countries
Ivana Brkić
103
CHAPTER 3: THE EMPIRICAL RESEARCH METHODOLOGY
3.1. INTRODUCTION
The centerpiece of the dissertation is empirical research aimed at testing the hypotheses
based on the results of previous studies on the relationship between economic freedom and
growth. In this way, a deductive approach was used in order to attempt to answer the question of
whether a panel analysis can determine the existence of a positive link between (change of)
economic freedom, its subcomponents and economic growth in the example of European Union
countries, as has been proven in most other areas analyzed.
After defining general, specific and individual hypotheses - null and alternative, we
describe and create labels of dependent, independent and control variables. Below is presented
the method of collecting electronic data as well as their sources, while the method of selection,
size and construction of the sample is discussed in detail in the fifth subchapter of this segment.
The main statistical procedures are described in the sixth segment of this chapter. A brief
description of the descriptive statistical method, correlation analysis and panel analysis as well as
the purpose and place of their application within our research are determined here. Particular
emphasis was put on panel analysis since it is the main method which was used to try to establish
the impact of (change of) economic freedom and its elements on economic growth in the
countries of the European Union. The final section summarizes the chapter devoted to setting the
methodology for empirical research.
3.2. DEFINIING HYPOTHESES
In accordance with the previously set research objectives, the groups of hypotheses listed
in the following Tables 15 and 16 are formulated. Table 15 presents null and alternative
hypotheses from Group 1, which is dedicated to discovering the impact of economic freedom
and its categories on economic growth, while Table 16 presents null and alternative hypotheses
examining the impact of the change in the economic freedom index on the economic growth of
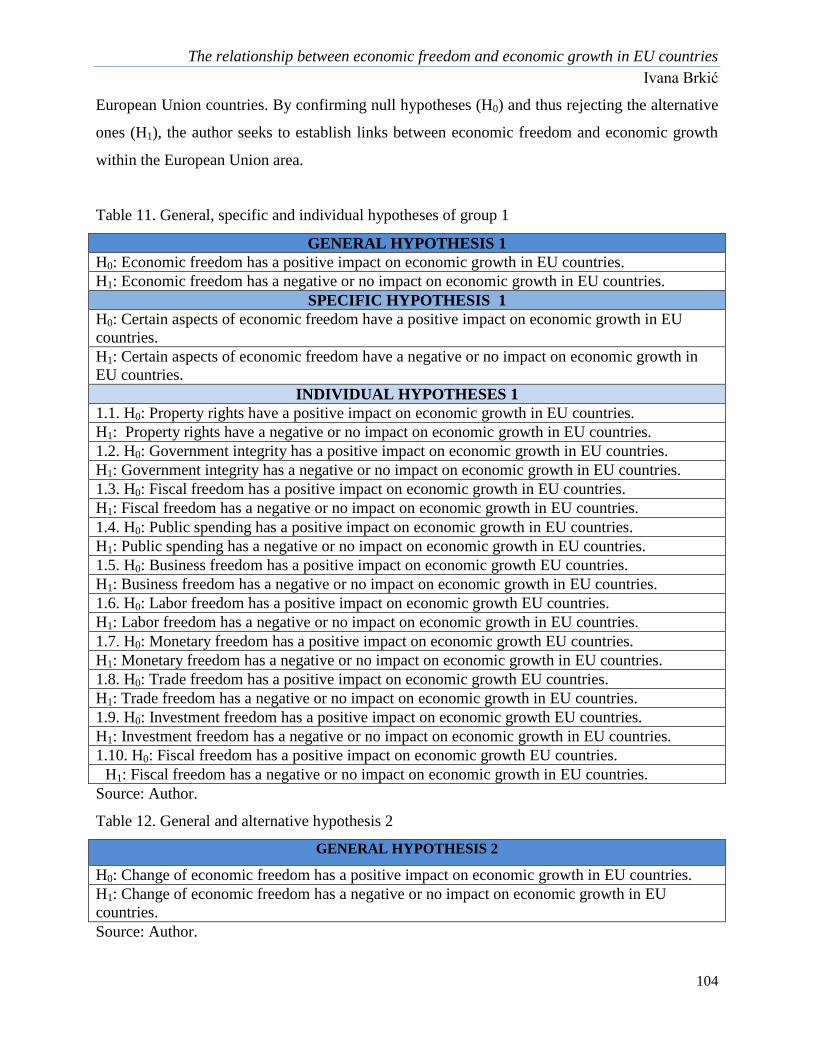
The relationship between economic freedom and economic growth in EU countries
Ivana Brkić
104
European Union countries. By confirming null hypotheses (H0) and thus rejecting the alternative
ones (H1), the author seeks to establish links between economic freedom and economic growth
within the European Union area.
Table 11. General, specific and individual hypotheses of group 1
GENERAL HYPOTHESIS 1
H0: Economic freedom has a positive impact on economic growth in EU countries.
H1: Economic freedom has a negative or no impact on economic growth in EU countries.
SPECIFIC HYPOTHESIS 1
H0: Certain aspects of economic freedom have a positive impact on economic growth in EU
countries.
H1: Certain aspects of economic freedom have a negative or no impact on economic growth in
EU countries.
INDIVIDUAL HYPOTHESES 1
1.1. H0: Property rights have a positive impact on economic growth in EU countries.
H1: Property rights have a negative or no impact on economic growth in EU countries.
1.2. H0: Government integrity has a positive impact on economic growth in EU countries.
H1: Government integrity has a negative or no impact on economic growth in EU countries.
1.3. H0: Fiscal freedom has a positive impact on economic growth in EU countries.
H1: Fiscal freedom has a negative or no impact on economic growth in EU countries.
1.4. H0: Public spending has a positive impact on economic growth in EU countries.
H1: Public spending has a negative or no impact on economic growth in EU countries.
1.5. H0: Business freedom has a positive impact on economic growth EU countries.
H1: Business freedom has a negative or no impact on economic growth in EU countries.
1.6. H0: Labor freedom has a positive impact on economic growth EU countries.
H1: Labor freedom has a negative or no impact on economic growth in EU countries.
1.7. H0: Monetary freedom has a positive impact on economic growth EU countries.
H1: Monetary freedom has a negative or no impact on economic growth in EU countries.
1.8. H0: Trade freedom has a positive impact on economic growth EU countries.
H1: Trade freedom has a negative or no impact on economic growth in EU countries.
1.9. H0: Investment freedom has a positive impact on economic growth EU countries.
H1: Investment freedom has a negative or no impact on economic growth in EU countries.
1.10. H0: Fiscal freedom has a positive impact on economic growth EU countries.
H1: Fiscal freedom has a negative or no impact on economic growth in EU countries.
Source: Author.
Table 12. General and alternative hypothesis 2
GENERAL HYPOTHESIS 2
H0: Change of economic freedom has a positive impact on economic growth in EU countries.
H1: Change of economic freedom has a negative or no impact on economic growth in EU
countries.
Source: Author.
The relationship between economic freedom and economic growth in EU countries
Ivana Brkić
105
3.3. DEFINING THE RESEARCH VARIABLE
Within the conducted quantitative analysis in the dissertation, we distinguish between
dependent, independent and control variables.
Dependent variable represents Economic growth in the EU countries whose impact
factors we seek to examine. Most authors who have conducted and published studies examining
the impact of economic freedom on the economies of particular groups of countries have chosen
this economic indicator, while some authors have examined the impact of economic freedom on
GDP, as well as some other (macro)economic indicators (inequality, productivity, investment,
etc.).
Independent variables represent the Index of Economic Freedom formulated by the
Heritage Foundation as well as its constituent elements. In order to act methodologically in a
proper way, its sub-indices were not included in the analysis of the impact of the overall Index of
Economic Freedom on Economic Growth. Consequently, when the impact of the elements of the
Economic Freedom Index was examined, the overall index was omitted from the analysis.
Control variables in the analysis were included on the basis of evidence from a number of
studies on the impact of different variables on economic growth conducted earlier. Determinants
within our model were selected based on the ones used by researchers who conducted similar
research on the impact of economic freedom on economic growth, data availability, and the
significance of the selected variables.
Table 13 presents all the variables, their symbols that will later be used in the
dissertation, as well as the definitions and sources from which the data were taken.
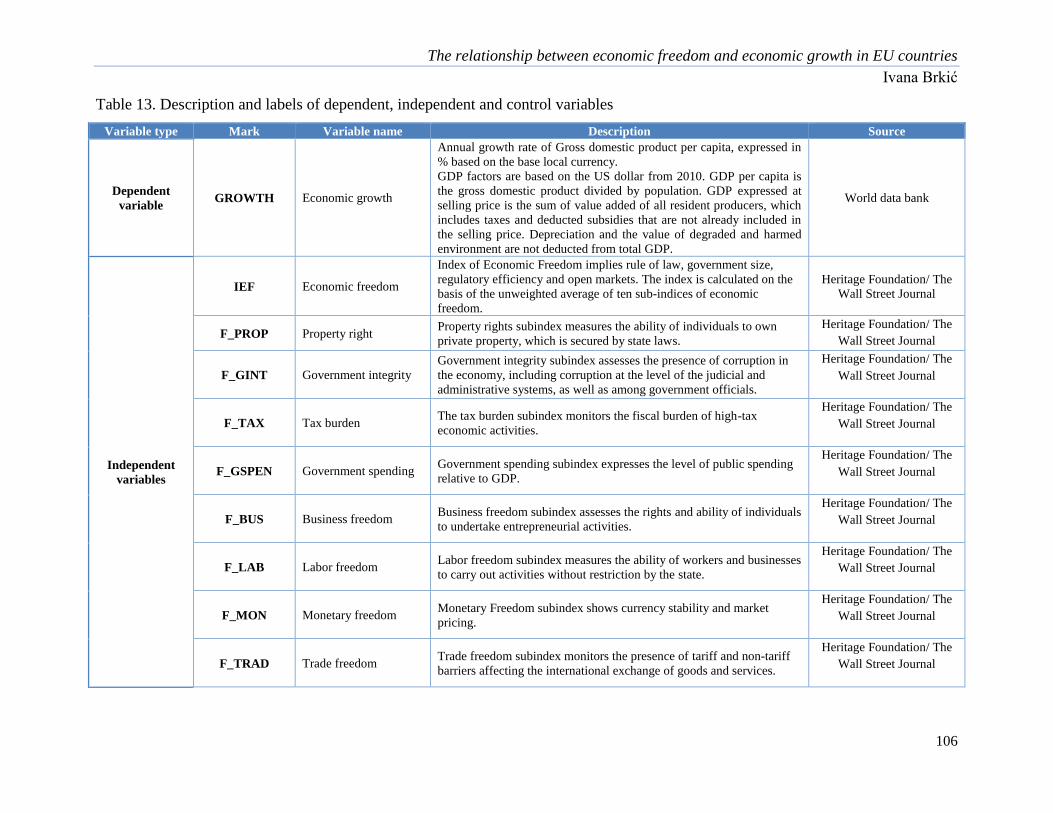
The relationship between economic freedom and economic growth in EU countries
Ivana Brkić
106
Table 13. Description and labels of dependent, independent and control variables
Variable type Mark Variable name Description Source
Dependent
variable GROWTH Economic growth
Annual growth rate of Gross domestic product per capita, expressed in
% based on the base local currency.
GDP factors are based on the US dollar from 2010. GDP per capita is
the gross domestic product divided by population. GDP expressed at
selling price is the sum of value added of all resident producers, which
includes taxes and deducted subsidies that are not already included in
the selling price. Depreciation and the value of degraded and harmed
environment are not deducted from total GDP.
World data bank
Independent
variables
IEF Economic freedom
Index of Economic Freedom implies rule of law, government size,
regulatory efficiency and open markets. The index is calculated on the
basis of the unweighted average of ten sub-indices of economic
freedom.
Heritage Foundation/ The
Wall Street Journal
F_PROP Property right Property rights subindex measures the ability of individuals to own
private property, which is secured by state laws.
Heritage Foundation/ The
Wall Street Journal
F_GINT Government integrity
Government integrity subindex assesses the presence of corruption in
the economy, including corruption at the level of the judicial and
administrative systems, as well as among government officials.
Heritage Foundation/ The
Wall Street Journal
F_TAX Tax burden The tax burden subindex monitors the fiscal burden of high-tax
economic activities.
Heritage Foundation/ The
Wall Street Journal
F_GSPEN Government spending Government spending subindex expresses the level of public spending
relative to GDP.
Heritage Foundation/ The
Wall Street Journal
F_BUS Business freedom Business freedom subindex assesses the rights and ability of individuals
to undertake entrepreneurial activities.
Heritage Foundation/ The
Wall Street Journal
F_LAB Labor freedom Labor freedom subindex measures the ability of workers and businesses
to carry out activities without restriction by the state.
Heritage Foundation/ The
Wall Street Journal
F_MON Monetary freedom Monetary Freedom subindex shows currency stability and market
pricing.
Heritage Foundation/ The
Wall Street Journal
F_TRAD Trade freedom Trade freedom subindex monitors the presence of tariff and non-tariff
barriers affecting the international exchange of goods and services.
Heritage Foundation/ The
Wall Street Journal
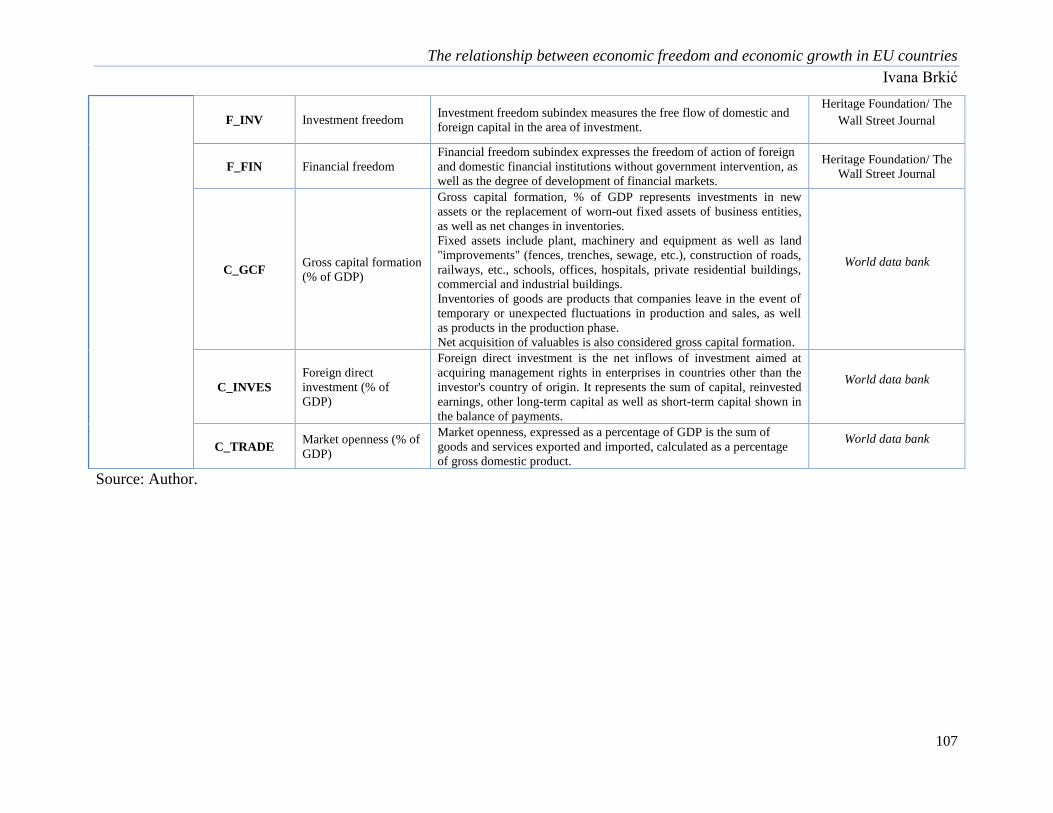
The relationship between economic freedom and economic growth in EU countries
Ivana Brkić
107
Source: Author.
F_INV Investment freedom Investment freedom subindex measures the free flow of domestic and
foreign capital in the area of investment.
Heritage Foundation/ The
Wall Street Journal
F_FIN Financial freedom
Financial freedom subindex expresses the freedom of action of foreign
and domestic financial institutions without government intervention, as
well as the degree of development of financial markets.
Heritage Foundation/ The
Wall Street Journal
C_GCF Gross capital formation
(% of GDP)
Gross capital formation, % of GDP represents investments in new
assets or the replacement of worn-out fixed assets of business entities,
as well as net changes in inventories.
Fixed assets include plant, machinery and equipment as well as land
"improvements" (fences, trenches, sewage, etc.), construction of roads,
railways, etc., schools, offices, hospitals, private residential buildings,
commercial and industrial buildings.
Inventories of goods are products that companies leave in the event of
temporary or unexpected fluctuations in production and sales, as well
as products in the production phase.
Net acquisition of valuables is also considered gross capital formation.
World data bank
C_INVES
Foreign direct
investment (% of
GDP)
Foreign direct investment is the net inflows of investment aimed at
acquiring management rights in enterprises in countries other than the
investor's country of origin. It represents the sum of capital, reinvested
earnings, other long-term capital as well as short-term capital shown in
the balance of payments.
World data bank
C_TRADE Market openness (% of
GDP)
Market openness, expressed as a percentage of GDP is the sum of
goods and services exported and imported, calculated as a percentage
of gross domestic product.
World data bank

The relationship between economic freedom and economic growth in EU countries
Ivana Brkić
108
3.4. DATA COLLECTION
The study is conducted on electronically collected data on the state of economic freedom
and economic growth of European Union countries. The aforementioned data on the state of
economic freedom were collected on the basis of annual reports published by the Heritage
Foundation in collaboration with the Wall Street Journal, while a comprehensive database can be
found on their website http://www.heritage.org/index/explore. Collecting data on economic
growth as well as other macroeconomic indicators that acted as control variables in the research
were taken from the World databank http://data.worldbank.org/.
3.5. SELECTION METHOD, SIZE AND CONSTRUCTION OF THE SAMPLE
The study includes the following indicators: The Heritage Foundation Index of Economic
Freedom and the annual percentage growth of gross domestic product per capita observed in a
sample of EU member states: Austria, Belgium, Bulgaria, Cyprus, Croatia, the Czech Republic,
Denmark, Estonia, Finland, France, Germany, Greece, Hungary, Ireland, Italy, Latvia, Lithuania,
Luxembourg, Malta, the Netherlands, Poland, Portugal, Romania, Slovakia, Slovenia, Spain,
Sweden, and the United Kingdom.
Although not all of these countries were current EU members in each year of observation
within the study, their data were included in the analysis because they are currently members of
the EU, ie the assumption is that with the very process of preparation for full membership they
have already acquired (or were acquiring) the necessary characteristics that would make them
equal members of the EU.
Likewise, although the United Kingdom withdrew from the European Union on January
31, 2020, it was part of the EU in the observed period and therefore forms an integral part of the
sample.
The relationship between economic freedom and economic growth in EU countries
Ivana Brkić
109
The selected group of countries includes countries of different levels of economic
development, countries of the former socialist system, countries that are in the transition process,
those that have completed this process for better or worse, as well as traditionally capitalist
countries. The breadth and variety of the sample is an advantage when performing statistical
calculations and enables obtaining statistically significant results. At the same time, all the above
countries are gathered and driven by the same goal, members of one of the leading political and
economic communities in the world, which is the basis for grouping its (macroeconomic) data
for conducting research through panel analysis.
The scientific contribution of selecting this sample is reflected in the absence of studies
(available to author) that observed the given group from the aspect of analyzing the impact of
economic freedom on economic growth, which may be considered relevant and current given the
geopolitical and geo-economic division of the world.
According to the criterion of time span of the observed phenomenon, panel data were
used with which at different time intervals the same phenomenon was observed - the state of
economic freedom based on the Heritage Foundation Index of Economic Freedom as well as
economic growth, presented by the percentage annual increase of GDP per capita for the
observed EU member states, as well as other traditional macroeconomic indicators acting as
control variables. These phenomena were covered from 1994 to 2018, that is, a total of 25 years,
which is considered to be an appropriate sample size necessary for conducting panel analysis for
the purpose of obtaining relevant and reliable results.
It should be noted that every year the Heritage Foundation publishes a report on the state
of economic freedom in the world, constructed on the basis of data from the second half of the
year before last to the middle of the previous year. So, for example 2019 Index covers the second
half of 2017 through the first half of 2018 and the like. Accordingly, the data from the report of
the current year were related to the percentage growth of GDP per capita from the previous year,
explaining that the state of economic freedom reflected on the economic growth in that year. For
example, data on the state of economic freedom from the 2019 report (which actually refer to the
The relationship between economic freedom and economic growth in EU countries
Ivana Brkić
110
state of economic freedom from the second half of 2017 to mid-2018) were compared with the
data on the percentage growth of GDP per capita of 2018.
3.6. STATISTICAL PROCEDURE
For the purpose of testing the defined hypotheses, based on the formulated goals and within
the subject of the research, a methodological approach was constructed, which formed the
framework for conducting the empirical part of the research within the dissertation.
The following statistical methods and techniques were applied in the empirical research:
Descriptive statistical methods - for calculating, displaying and describing the basic
characteristics of statistical series;
Correlation analysis - to determine whether there is a link between (change of) economic
freedom, its elements and the percentage growth of GDP per capita in EU countries;
Panel analysis – to determine the impact of economic freedom and its elements, as well as
the impact of the change in the Index of Economic Freedom on the percentage growth of
GDP per capita in EU countries;
As the decisive method for determining the impact of economic freedom on economic
growth in the EU countries used in the research within the dissertation is panel method, we
provide below a concise overview of its basic characteristics.
As regards causal inference, fixed-effects (FE) regression method proved to be particularly
useful (Gangl, 2010). Standard regression models yield biased estimates of causal effects if there
are unobserved confounders whereas FE regression can (provided certain assumptions are valid)
yield unbiased estimates. FE regression has become a default method for estimating causal
effects from panel data. However, it can be applied with any kind of multi-level data. FE models
identify the causal effect under weaker assumptions which is why they are used by social
researchers undertaking causal analysis. It has been argued that panel data are particularly

The relationship between economic freedom and economic growth in EU countries
Ivana Brkić
111
beneficial for using FE models since, due to their richness, they make it possible to investigate
numerous important social science questions.
Estimation of FE is based on the error components model:
yit = xitβ + αi +εit (9)
yit represents the observed outcome of person i at time t, xit is the (1 x K) vector of covariates of
the person measured during the same period of time, and β is the corresponding (K x 1) vector of
parameters that need to be estimated. The error term of this model is dividied into two
components. The αi are stable person-specific characteristics that are rarely observed by the
researcher (e.g. cognitive ability, genetic disposition, personality) and frequently associated with
the covariates. Therefore, the αi are unobserved effects capturing time-constant individual
heterogeneity. The second component ε it is an idiosyncratic error that varies across subjects and
over time.
According to (Best & Wolf, 2015), the easiest way to estimate the parameters of the
model is by pooling the data and running ordinary least squares (pooled OLS, POLS).
Consistency of POLS requires exogeneity of time-constant individual heterogeneity and
idiosyncratic errors. POLS estimation does not distinguish between the two error components,
which are replaced by the composite error
vit = αi + ε it (10)
The key assumption for consistency of the FE estimator is the strict exogeneity condition
imposed due to the idiosyncratic errors. This excludes not only simultaneous correlation of
regressors and the idiosyncratic errors, but also correlation of past and future values of covariates
and errors. This is the reason why the assumption is termed ‘strict’ exogeneity. Apparently, this
assumption is stronger to some degree than the contemporaneous exogeneity assumption
required for POLS. The key advantage, however, of the FE framework is that no assumption is
needed regarding the relationship between stable characteristics and regressors. Therefore, FE
estimation applies POLS to transformed data where the transformation (called ‘demeaning’ or
‘within transformation’) extracts the variation within subjects over time, but discards variation

The relationship between economic freedom and economic growth in EU countries
Ivana Brkić
112
across units. The conventional FE estimator is the POLS estimator applied to these demeaned
data. As mentioned above and shown in the statistical framework section below, the strict
exogeneity assumption is sufficient for consistency of the FE estimator. Hence, with panel data
and the FE estimator, a causal effect can be identified under weaker assumptions (compared to
cross-sectional OLS or POLS).
Another class of panel estimators is based on the random-effects (RE) model. The
conventional RE model starts from the error components model given in (9). RE requires the
same strict exogeneity assumption as FE. However, as regards POLS, the assumption about
stable unobserved characteristics is required. The orthogonality condition E (αi│xi) = E(αi) = 0
indicates that stable unobserved confounders may not be related to any of the regressors. Due to
the fact that this assumption is so restrictive, RE often fails to identify the causal effect of
interest. Provided both conditions hold and the conditional mean is modeled properly, the RE
estimator is consistent because E(vit│xit ) = 0. This model can be written as follows:
yi = xiβ + vi (11)
where vi = αi jT + εi and jT is a (T x 1) vector of ones
RE has an advantage over POLS in terms of greater efficiency at the price of a stronger
exogeneity assumption. The advantage of RE over FE is also greater efficiency given the
orthogonality condition holds. Provided that it does not hold, RE is inconsistent and priority
should be given to FE.
Descriptive statistical and panel analysis were carried out using the statistical program
"R", with the help of which a graphical presentation of the obtained results was made.
The results obtained from empirical research are presented in tables and graphs for the
purpose of reviewing the research results, which will then be analyzed in relation to the set
hypotheses, in order to draw appropriate conclusions.
The relationship between economic freedom and economic growth in EU countries
Ivana Brkić
113
3.7. CHAPTER SUMMARY
This chapter explicates the methods of empirical research. In this regard, general, specific
and individual hypotheses were defined first. After that, dependent, independent, and control
variables were described and finally methods of collection and sources of the variables were
presented. The construction, size and selection of the sample were dealt with in detail the fifth
subchapter, and the sixth section provided an overview of the statistical methods conducted in
the empirical research, with particular attention to panel analysis, as crucial for determining the
relationships or impact of (change of) economic freedom and its elements on economic growth in
EU countries.
The next chapter is devoted to the analysis of electronically collected data, which were
processed with the help of the mentioned statistical methods (descriptive, correlation and panel)
in order to test the set hypotheses and make conclusions regarding the subject of the research.

The relationship between economic freedom and economic growth in EU countries
Ivana Brkić
114
CHAPTER 4: RESULTS OF THE EMPIRICAL RESEARCH
4.1. INTRODUCTION
This chapter presents the results obtained by statistical analysis over panel data. In the
second, third and fourth subchapters a panel analysis of the impact of economic freedom, its
elements and change of economic freedom on economic growth was conducted in EU countries,
covering a period of twenty-five years. First, descriptive analysis and “familiarization” with the
variables (dependent, independent and control) were carried out through mean values, standard
deviations, minimum and maximum, while heterogeneity across countries and years was
presented graphically. The graph also shows the relationship between the independent and
dependent variable in each country. This was followed by determining the correlation between
dependent and independent variables for each country, on the basis of which the nature of the
relationship as well as its statistical significance can be established. Tests were performed that
determined the type of panel analysis that is appropriate for conducting given our data.
Subsequent tests were also performed in order to validate the data or adjust our data in order to
implement the Fixed-Effects (FE) model: cross-sectional dependence, autocorrelation,
stationarity, heteroskedasticity. Finally, panel models were presented and the impact of the
independent (and control) variables on the dependent variable in fixed-effects regressions was
determined.
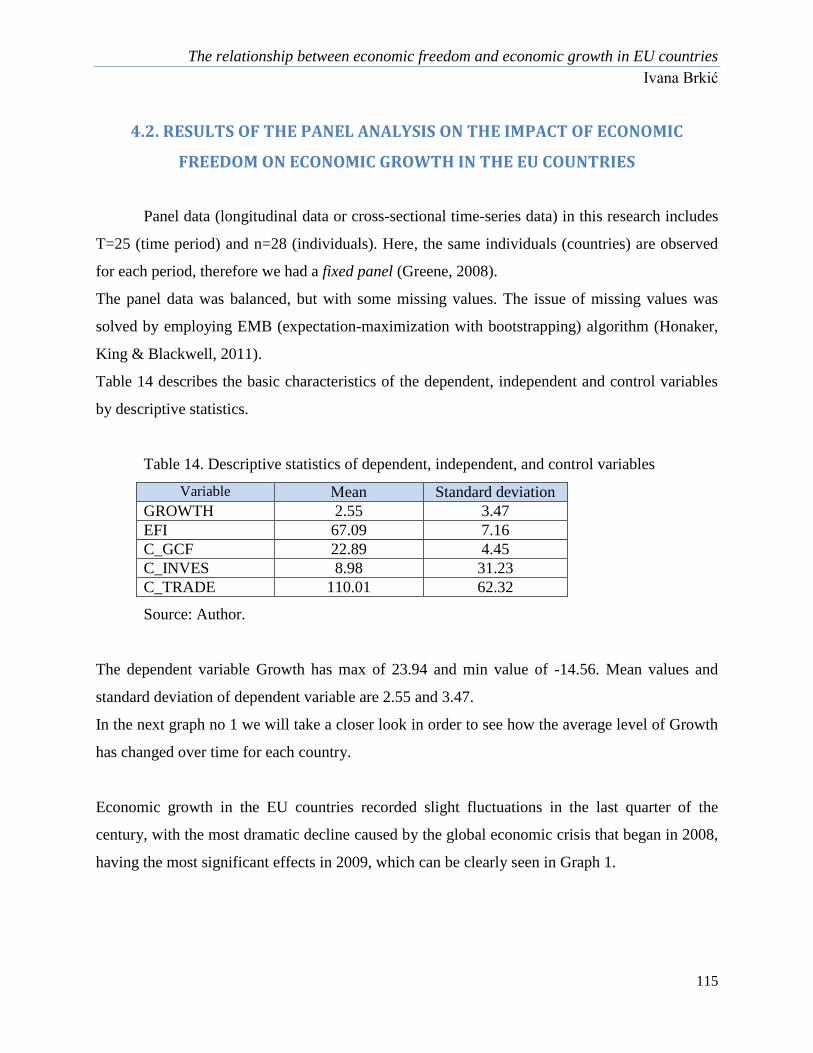
The relationship between economic freedom and economic growth in EU countries
Ivana Brkić
115
4.2. RESULTS OF THE PANEL ANALYSIS ON THE IMPACT OF ECONOMIC
FREEDOM ON ECONOMIC GROWTH IN THE EU COUNTRIES
Panel data (longitudinal data or cross-sectional time-series data) in this research includes
T=25 (time period) and n=28 (individuals). Here, the same individuals (countries) are observed
for each period, therefore we had a fixed panel (Greene, 2008).
The panel data was balanced, but with some missing values. The issue of missing values was
solved by employing EMB (expectation-maximization with bootstrapping) algorithm (Honaker,
King & Blackwell, 2011).
Table 14 describes the basic characteristics of the dependent, independent and control variables
by descriptive statistics.
Table 14. Descriptive statistics of dependent, independent, and control variables
Variable Мean Standard deviation
GROWTH 2.55 3.47
EFI 67.09 7.16
C_GCF 22.89 4.45
C_INVES 8.98 31.23
C_TRADE 110.01 62.32
Source: Author.
The dependent variable Growth has max of 23.94 and min value of -14.56. Mean values and
standard deviation of dependent variable are 2.55 and 3.47.
In the next graph no 1 we will take a closer look in order to see how the average level of Growth
has changed over time for each country.
Economic growth in the EU countries recorded slight fluctuations in the last quarter of the
century, with the most dramatic decline caused by the global economic crisis that began in 2008,
having the most significant effects in 2009, which can be clearly seen in Graph 1.

The relationship between economic freedom and economic growth in EU countries
Ivana Brkić
116
Graph 1. Changes in Growth per country (1994 – 2018)
Source: Author.
From the picture above we can see that in 2015 Ireland had the highest growth (23.94), followed by Estonia 1997 (13.08), Latvia 2006
(12.92) and Lithuania 2007 (12.41). Estonia had the lowest growth in 2009 (-15.56) followed by Lithuania 2009 (-13.86), Latvia (-
12.97), Greece 2011 (-8.99) and Finland 2009 (-8.71).
Therefore, we can conclude that in 2009 most countries had a negative growth with the exception of Poland which achieved a positive
growth in 2015 (2.75). The highest growth was achieved in 2015 (Ireland – 23.94). In the same year, Austria had the lowest growth
(0.02).

The relationship between economic freedom and economic growth in EU countries
Ivana Brkić
117
In the next graphs 2 and 3, heterogeneity across countries and years are presented.
Graph 2. Heterogeneity in economic growth across years in selected sample
Source: Author.
From the graph above we can see a drastic change of the dependent variable in 2009 so the mean
values of dependent variable across countries are in range from 0.5 to 4.5.
Graph 3. Heterogeneity in economic growth across countries in the selected sample
The relationship between economic freedom and economic growth in EU countries
Ivana Brkić
118
The above graph presents the within-country variances. Within-subject variation refers to
the variation seen in a group of subjects which are all treated the same way. Between-subject
variation is the difference between different groups exposed to different factors. In panel data,
fixed effects estimator (within estimator) is used to refer to an estimator for the coefficients in
the regression model. In panel data, random effects model is used when one assumes no fixed
effects. The random effects model is a special case of the fixed effects model. The picture below
presents a visualization of the scatterplots between Growth and EFI by countries.
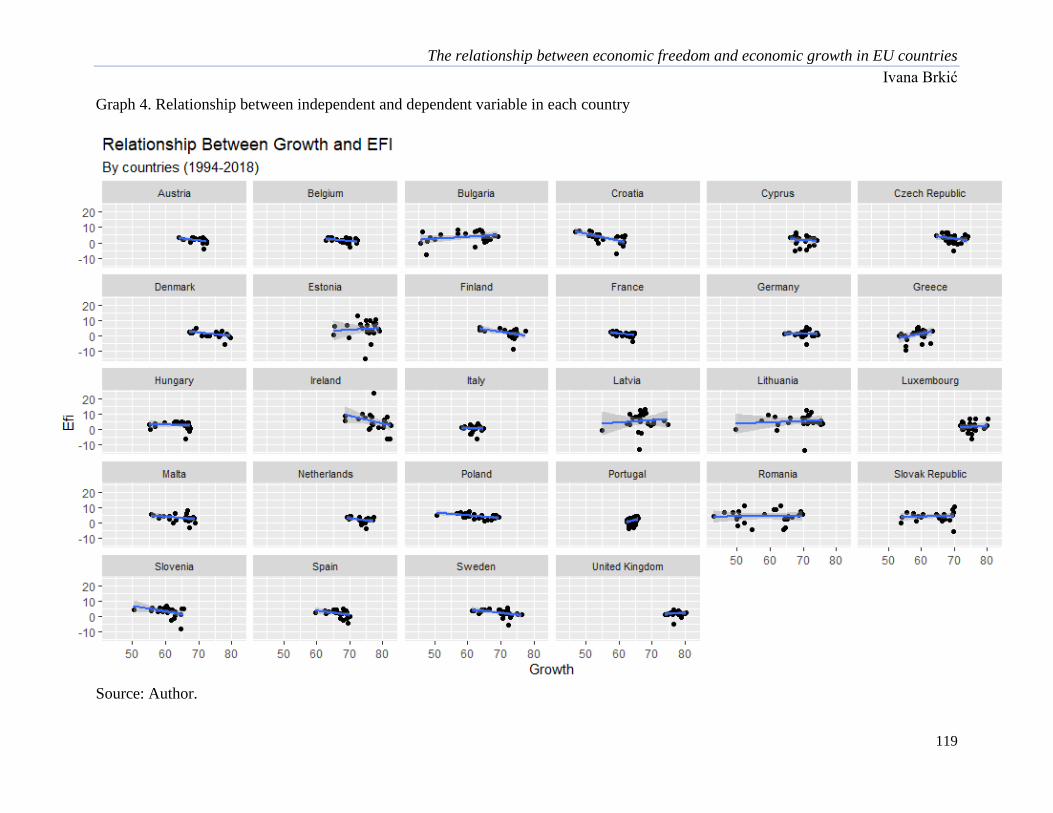
The relationship between economic freedom and economic growth in EU countries
Ivana Brkić
119
Graph 4. Relationship between independent and dependent variable in each country
Source: Author.
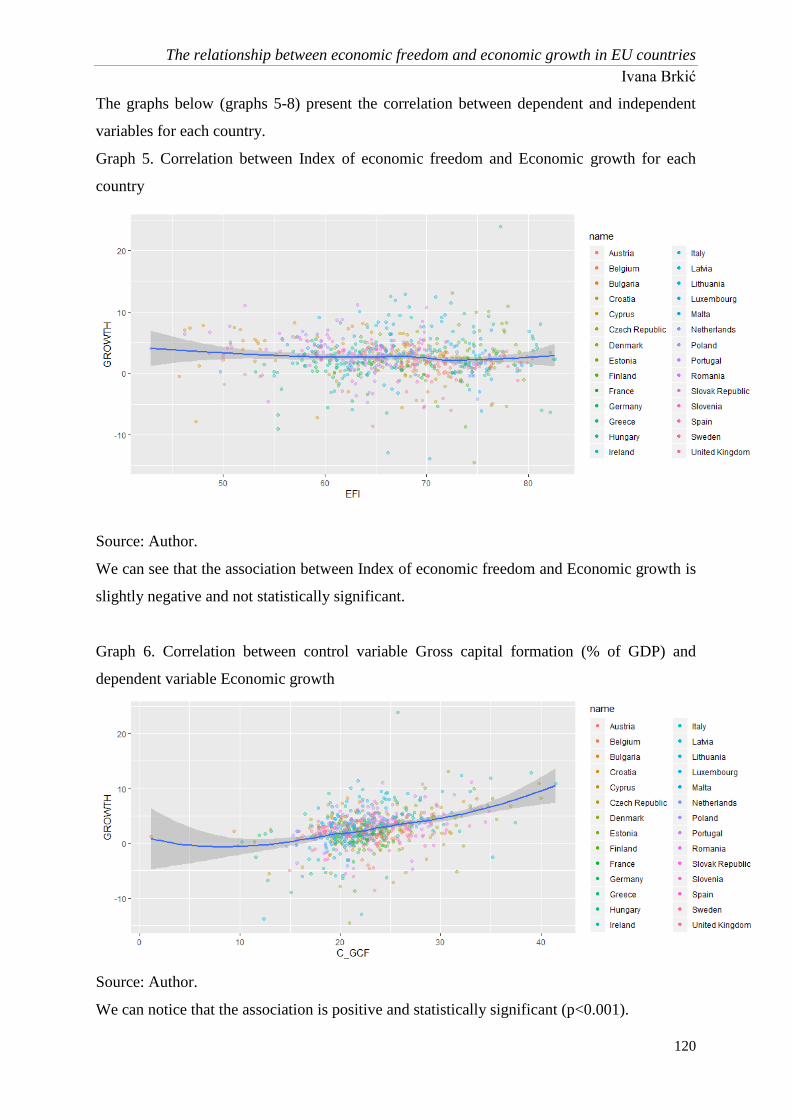
The relationship between economic freedom and economic growth in EU countries
Ivana Brkić
120
The graphs below (graphs 5-8) present the correlation between dependent and independent
variables for each country.
Graph 5. Correlation between Index of economic freedom and Economic growth for each
country
Source: Author.
We can see that the association between Index of economic freedom and Economic growth is
slightly negative and not statistically significant.
Graph 6. Correlation between control variable Gross capital formation (% of GDP) and
dependent variable Economic growth
Source: Author.
We can notice that the association is positive and statistically significant (p<0.001).

The relationship between economic freedom and economic growth in EU countries
Ivana Brkić
121
Next, we sought to examine the correlation between control variable Foreign direct
investment, net inflows (% of GDP) and dependent variable GDP per capita growth (annual
%) and we can conclude there is no linear association (Graph 7).
Graph 7. Correlation between Foreign direct investment, net inflows (% of GDP) and GDP
per capita growth (annual %)
Source: Author.
The (next) graph 8 presents the correlation between control variable Trade (% of GDP) and
dependent variable Economic growth in the observed sample. This is a very mild type of
Preston curve (Preston, 1975). While the association does not look linear, it still is
statistically significant (p=0.049).
Graph 8. Correlation between Trade (% of GDP) and GDP per capita growth (annual %)
Source: Author.

The relationship between economic freedom and economic growth in EU countries
Ivana Brkić
122
In Figure 1 and Table 15 correlation between variables of this panel data is presented.
Apparently, there is no strong correlation between variables. We detected significant
correlation between Growth and C_inves (r = 0.17, p<0.001), Growth and Efi (r=-0.12,
p=0.001), Growth and C_trade (r=-0.16, p<0.001), Growth and C_GCF (r=0.37, p<0.001),
EFI and C_inves (r = 0.24, p<0.001), Efi and C_trade (r=0.39, p<0.001), C_GCF and
C_inves (r = 0.13, p<0.001), C_GCF and C_trade (r=0.13, p<0.001) and between C_inves
and C_Trade (r=0.36, p<0.001).
Figure 1. Correlation between variables of panel data
Source: Author.
Table 15. Correlation between variables of panel data
r GROWTH EFI C_GCF C_inves C_trade
GROWTH 1 -0.06908 0.392047 0.000549 0.077037
EFI -0.1201 1 0.053324 0.085985 0.33281
C_GCF 0.365831 -0.03218 1 -0.04097 0.015072
C_inves 0.172403 0.240793 0.131556 1 0.359274
C_trade 0.159992 0.388565 0.127574 0.408037 1
p GROWTH EFI C_GCF C_inves C_trade
GROWTH 1 0.067777 <0.001 0.988607 0.042181
EFI 0.001455 1 0.159948 0.025161 <0.001
C_GCF <0.001 0.396581 1 0.287068 0.69142
C_inves <0.001 <0.001 0.0006 1 <0.001
C_trade <0.001 <0.001 0.000742 <0.001 1
Source: Author.

The relationship between economic freedom and economic growth in EU countries
Ivana Brkić
123
Multicolinearity between independent variables was not detected (VIF(Efi) = 1.13;
VIF(C_GCF) = 1.01; VIF(C_inves) = 1.16 and VIF(C_trade) = 1.27).
Finally, let us see what it looks like when we plot dependent variable over time (Graph 9).
This looks like a stable common time trend for most countries.
Graph 9. Plot of the dependent variable GDP per capita growth (annual %) over time for the
selected sample
Source: Author.
In the next segment, we conduct a panel analysis, more precisely the Fixed Effects
model. With this model we are controlling for the average differences across countries in any
unobservable predictors. The fixed effects model discards the between-variation and infers
the causal effect from the within-variation (Best & Wolf, 2015). We started with fixed effects
model where effect was one-way and accorded to individuals i.e. countries and did not
include time effects. The results are presented in the Table 16.
Table 16. Fixed effects model - the impact of economic freedom on economic growth in
European Union countries
Variable Estimate SE t value p
EFI -0.196 0.033 -5.89 <0.001
C GCF 0.37 0.032 11.61 <0.001
C inves 0.0006 0.004 0.141 0.888
C trade 0.026 0.006 3.956 <0.001
F-statistic: 36.3 on 4 and 645 DF, p-value: <0.001 R2: 28.4% Adjusted R
2: 24.4
Source: Author.
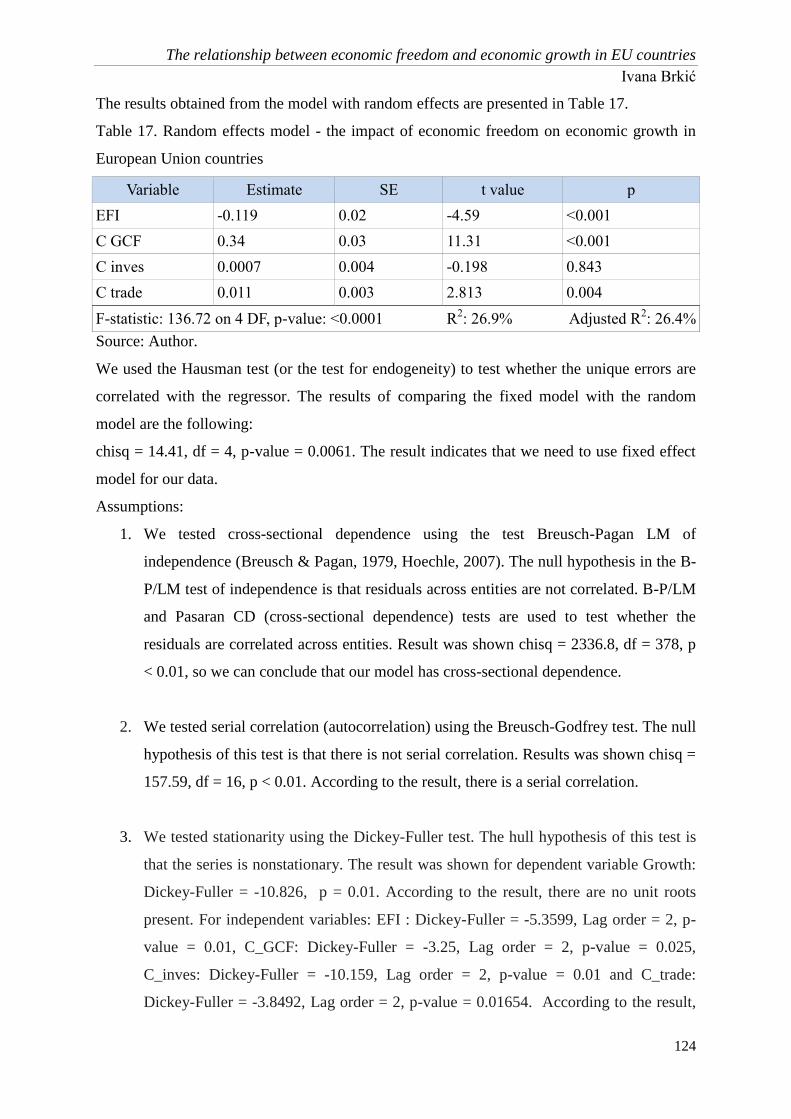
The relationship between economic freedom and economic growth in EU countries
Ivana Brkić
124
The results obtained from the model with random effects are presented in Table 17.
Table 17. Random effects model - the impact of economic freedom on economic growth in
European Union countries
Variable Estimate SE t value p
EFI -0.119 0.02 -4.59 <0.001
C GCF 0.34 0.03 11.31 <0.001
C inves 0.0007 0.004 -0.198 0.843
C trade 0.011 0.003 2.813 0.004
F-statistic: 136.72 on 4 DF, p-value: <0.0001 R2: 26.9% Adjusted R
2: 26.4%
Source: Author.
We used the Hausman test (or the test for endogeneity) to test whether the unique errors are
correlated with the regressor. The results of comparing the fixed model with the random
model are the following:
chisq = 14.41, df = 4, p-value = 0.0061. The result indicates that we need to use fixed effect
model for our data.
Assumptions:
1. We tested cross-sectional dependence using the test Breusch-Pagan LM of
independence (Breusch & Pagan, 1979, Hoechle, 2007). The null hypothesis in the B-
P/LM test of independence is that residuals across entities are not correlated. B-P/LM
and Pasaran CD (cross-sectional dependence) tests are used to test whether the
residuals are correlated across entities. Result was shown chisq = 2336.8, df = 378, p
< 0.01, so we can conclude that our model has cross-sectional dependence.
2. We tested serial correlation (autocorrelation) using the Breusch-Godfrey test. The null
hypothesis of this test is that there is not serial correlation. Results was shown chisq =
157.59, df = 16, p < 0.01. According to the result, there is a serial correlation.
3. We tested stationarity using the Dickey-Fuller test. The hull hypothesis of this test is
that the series is nonstationary. The result was shown for dependent variable Growth:
Dickey-Fuller = -10.826, p = 0.01. According to the result, there are no unit roots
present. For independent variables: EFI : Dickey-Fuller = -5.3599, Lag order = 2, p-
value = 0.01, C_GCF: Dickey-Fuller = -3.25, Lag order = 2, p-value = 0.025,
C_inves: Dickey-Fuller = -10.159, Lag order = 2, p-value = 0.01 and C_trade:
Dickey-Fuller = -3.8492, Lag order = 2, p-value = 0.01654. According to the result,

The relationship between economic freedom and economic growth in EU countries
Ivana Brkić
125
there are no unit roots present in independent variables.
4. We tested heteroskedasticity using the Breusch-Pagan test. The null hypothesis of this
test is that there is homoskedasticity. The result was shown BP = 9.343, df = 4,
p=0.054. According to the result, there is no heteroskedasticity.
The problem with cross-sectional dependence we solved by including time effects in our
model. We tested statistical difference between fixed effects model without time effects and
with time effects by F test for individual effects and obtained the next results F = 19.362, df1
= 24, df2 = 621, p <0.01. According to these results, we can conclude that it is better to use
time-fixed effects.
The problem of heteroskedasticity was solved by using the robust covariance matrix
estimator HAC (Andrews, 1991).
The results of our model with above improving are presented in Table 18.
Table 18. Final fixed effects model - the impact of economic freedom on economic growth in
European Union countries
Variable Estimate SE t value p
EFI 0.04 0.043 -0.89 0.37
C GCF 0.252 0.042 5.92 <0.001
C inves 0.001 0.003 -1.14 0.885
C trade 0.031 0.012 2.65 0.008
F-statistic: 25.115 on 4 and 621 DF, p-value: 0.0001 R2: 35.4% Adjusted R
2: 36.9%
Source: Author.
These are the results of the model with fixed group and time effect. This is known as a “fixed
effects” regression because it holds constant (fixes) the average effects of each country.
Statistically significant independent variable is C GCF (p<0.001) and independent variable C
trade (p=0.091). It means that each 1 unit increase of C GCF cause increases Growth by
0.252 and also each 1 unit increase of C trade cause increases Growth by 0.031.
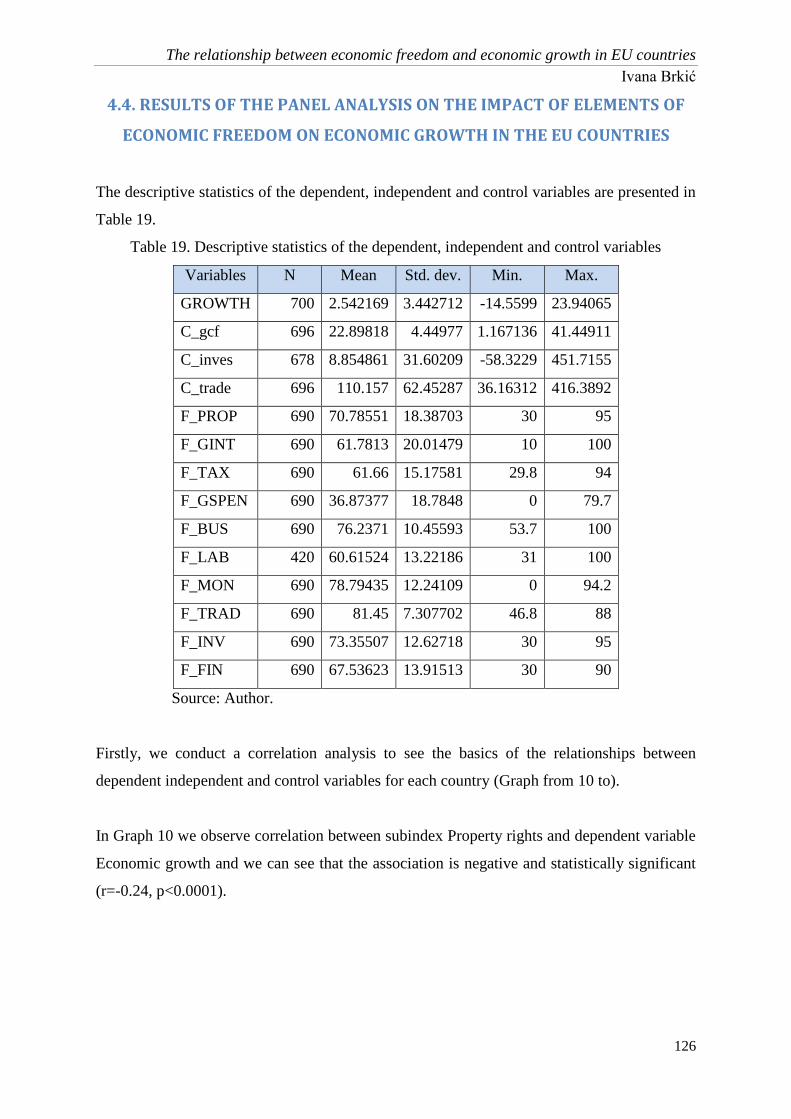
The relationship between economic freedom and economic growth in EU countries
Ivana Brkić
126
4.4. RESULTS OF THE PANEL ANALYSIS ON THE IMPACT OF ELEMENTS OF
ECONOMIC FREEDOM ON ECONOMIC GROWTH IN THE EU COUNTRIES
The descriptive statistics of the dependent, independent and control variables are presented in
Table 19.
Table 19. Descriptive statistics of the dependent, independent and control variables
Variables N Mean Std. dev. Min. Max.
GROWTH 700 2.542169 3.442712 -14.5599 23.94065
C_gcf 696 22.89818 4.44977 1.167136 41.44911
C_inves 678 8.854861 31.60209 -58.3229 451.7155
C_trade 696 110.157 62.45287 36.16312 416.3892
F_PROP 690 70.78551 18.38703 30 95
F_GINT 690 61.7813 20.01479 10 100
F_TAX 690 61.66 15.17581 29.8 94
F_GSPEN 690 36.87377 18.7848 0 79.7
F_BUS 690 76.2371 10.45593 53.7 100
F_LAB 420 60.61524 13.22186 31 100
F_MON 690 78.79435 12.24109 0 94.2
F_TRAD 690 81.45 7.307702 46.8 88
F_INV 690 73.35507 12.62718 30 95
F_FIN 690 67.53623 13.91513 30 90
Source: Author.
Firstly, we conduct a correlation analysis to see the basics of the relationships between
dependent independent and control variables for each country (Graph from 10 to).
In Graph 10 we observe correlation between subindex Property rights and dependent variable
Economic growth and we can see that the association is negative and statistically significant
(r=-0.24, p<0.0001).
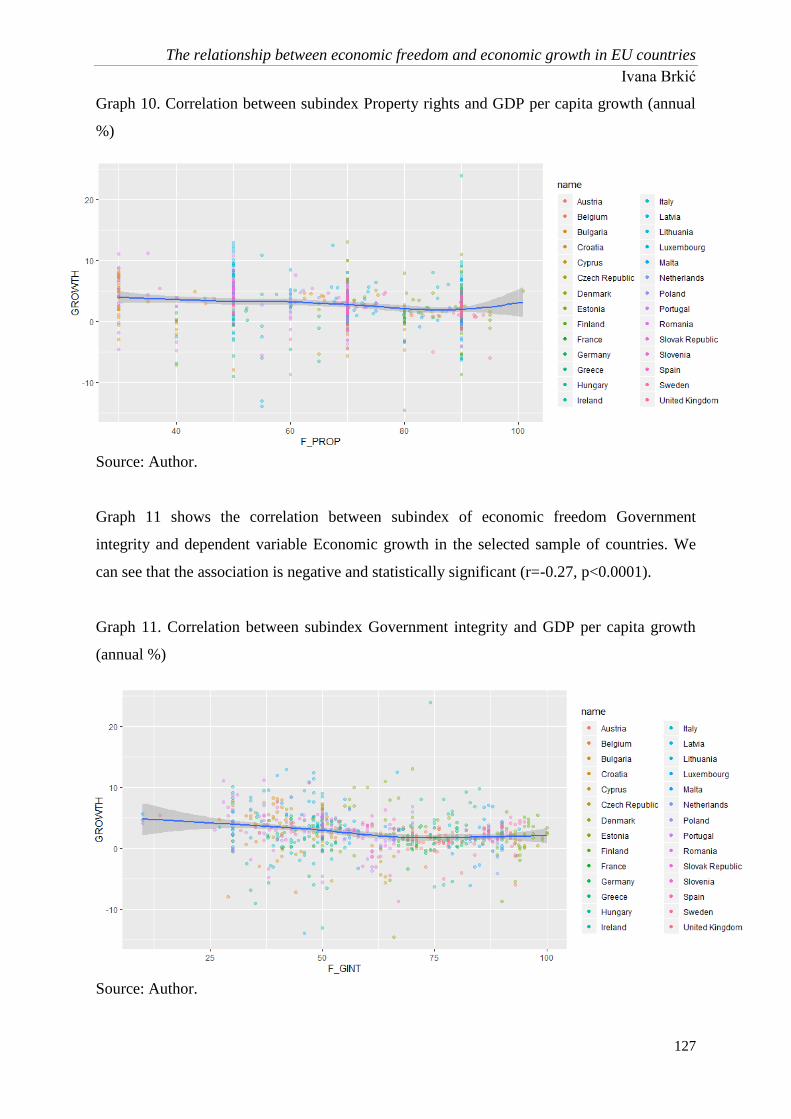
The relationship between economic freedom and economic growth in EU countries
Ivana Brkić
127
Graph 10. Correlation between subindex Property rights and GDP per capita growth (annual
%)
Source: Author.
Graph 11 shows the correlation between subindex of economic freedom Government
integrity and dependent variable Economic growth in the selected sample of countries. We
can see that the association is negative and statistically significant (r=-0.27, p<0.0001).
Graph 11. Correlation between subindex Government integrity and GDP per capita growth
(annual %)
Source: Author.

The relationship between economic freedom and economic growth in EU countries
Ivana Brkić
128
The relationship between Economic growth and subindex Tax burden is positive and
statistically significant (r=0.28, p<0.0001) as can be seen in Graph 12.
Graph 12. Correlation between subindex Tax burden and GDP per capita growth (annual %)
Source: Author.
Graph 13 shows that the association between dependent variable and (one of) the independent
variable - subindex Government spending is positive and statistically significant (r=0.31,
p<0.0001).
Graph 13. Correlation between subindex Government spending and GDP per capita growth
(annual %)
Source: Author.

The relationship between economic freedom and economic growth in EU countries
Ivana Brkić
129
If we observe the relationship between Economic growth and subindex Business freedom in
the selected sample (Graph 14), we can notice that the association is negative and statistically
significant (r=-0.26, p<0.0001).
Graph 14. Correlation between subindex Business freedom and GDP per capita growth
(annual %)
Source: Author.
There is no statistically significant relationship between Economic growth and subindex
Labor freedom (r=0.12, p=0.01) - Graph 15, which also applies to the relationship between
Economic growth and subindex Monetary freedom presented in Graph 16 (r=-0.003,
p=0.919).
Graph 15. Correlation between subindex Labor freedom and GDP per capita growth (annual
%)
Source: Author.

The relationship between economic freedom and economic growth in EU countries
Ivana Brkić
130
Graph 16. Correlation between subindex Monetary freedom and GDP per capita growth
(annual %)
Source: Author.
A negative, statistically significant relationship is established between the economic freedom
subindices Trade freedom (r=-0.27, p<0.0001) and Economic growth (Graph 17), as well as
between Investment freedom (r=-0.21, p<0.0001) and Economic growth (Graph 18).
Graph 17. Correlation between subindex Trade freedom and GDP per capita growth (annual
%)
Source: Author.
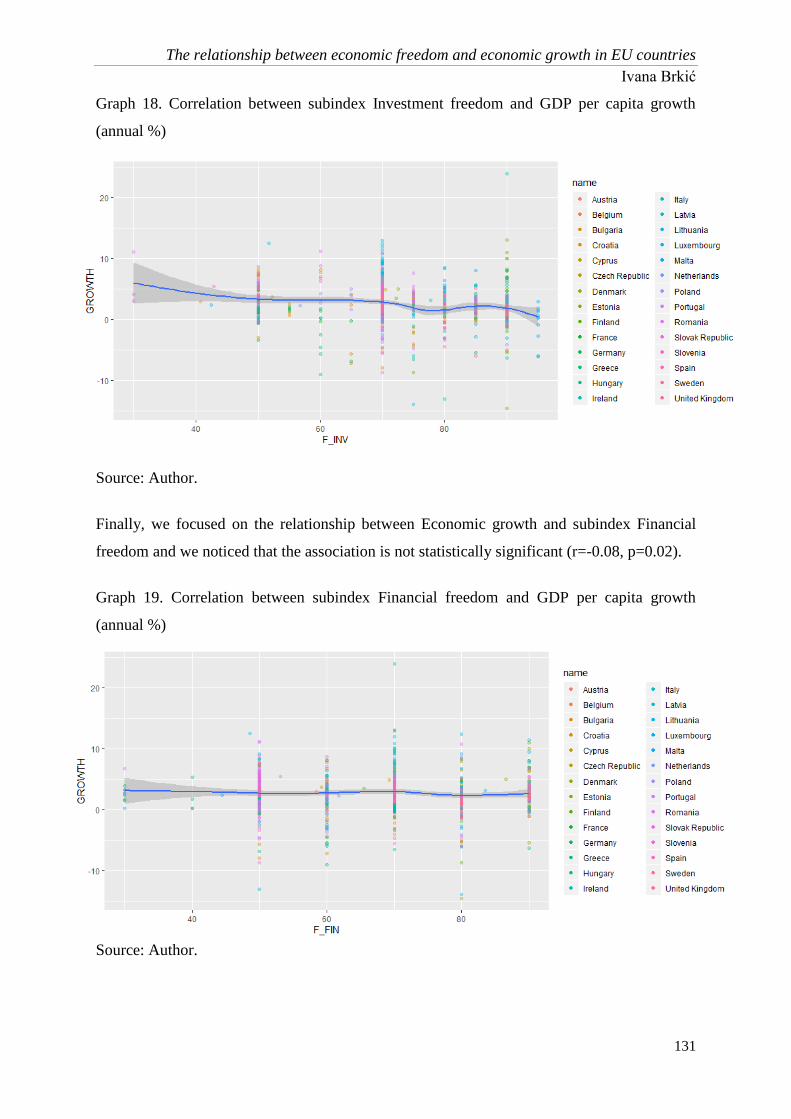
The relationship between economic freedom and economic growth in EU countries
Ivana Brkić
131
Graph 18. Correlation between subindex Investment freedom and GDP per capita growth
(annual %)
Source: Author.
Finally, we focused on the relationship between Economic growth and subindex Financial
freedom and we noticed that the association is not statistically significant (r=-0.08, p=0.02).
Graph 19. Correlation between subindex Financial freedom and GDP per capita growth
(annual %)
Source: Author.
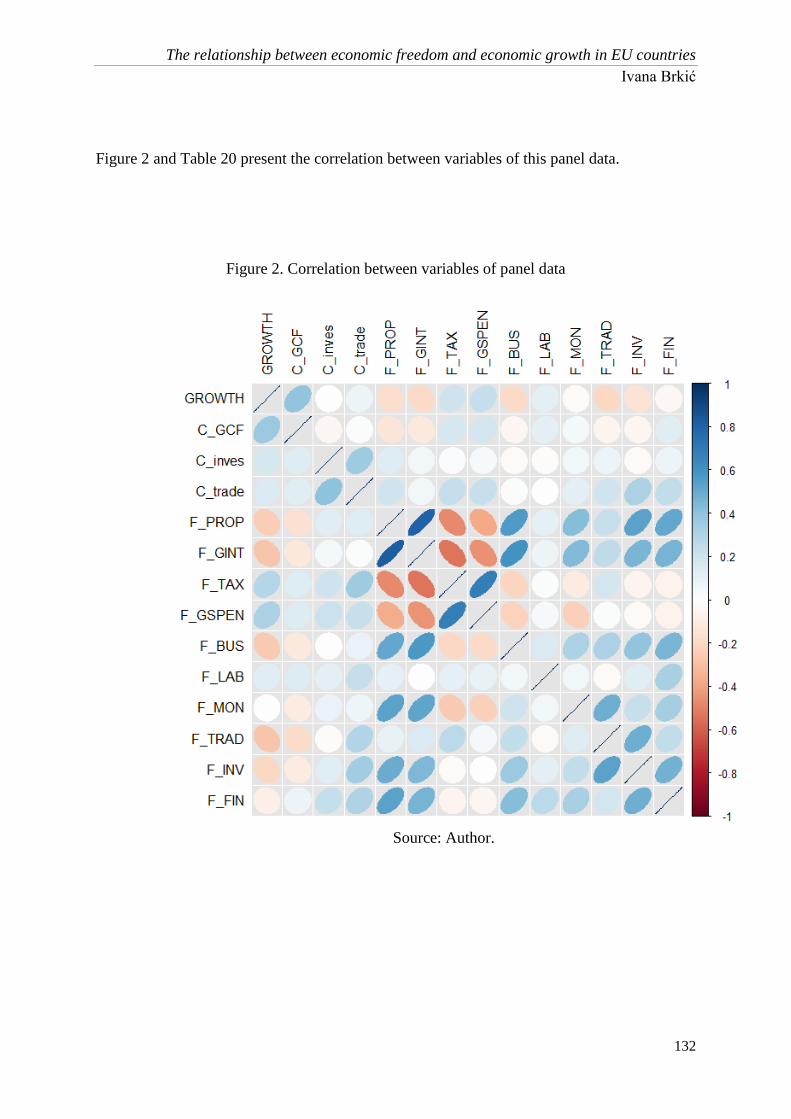
The relationship between economic freedom and economic growth in EU countries
Ivana Brkić
132
Figure 2 and Table 20 present the correlation between variables of this panel data.
Figure 2. Correlation between variables of panel data
Source: Author.

The relationship between economic freedom and economic growth in EU countries
Ivana Brkić
133
Table 20. Correlation between variables of panel data
GROWTH C_gcf C_inves C_trade F_PROP F_GINT F_TAX F_GSPEN F_BUS F_LAB F_MON F_TRAD F_INV F_FIN
r GROWTH 1 0.392047 0.000549 0.077037 -0.17518 -0.19959896 0.208824 0.234674 -0.19382 0.116103 -0.02083 -0.20011 -0.14989 -0.03567
C_GCF 0.365831 1 -0.04097 0.015072 -0.1305 -0.11751425 0.176822 0.189575 -0.04708 0.11599 0.048873 -0.05961 -0.04827 0.121499
C_inves 0.172403 0.131556 1 0.359274 0.13556 0.058743621 0.028659 0.030075 -0.02044 -0.0182 0.053264 0.073794 -0.0253 0.074555
C_trade 0.159992 0.127574 0.408037 1 0.195467 0.052111995 0.236398 0.222421 0.019826 0.008835 0.110853 0.196311 0.319114 0.244255
F_PROP -0.24088 -0.15688 0.129007 0.134108 1 0.805480869 -0.47267 -0.37602 0.563481 0.109241 0.427708 0.228409 0.532333 0.513259
F_GINT -0.27208 -0.12506 0.048075 0.010445 0.827427 1 -0.53611 -0.45742 0.599348 0.073409 0.434647 0.259394 0.459865 0.466935
F_TAX 0.285685 0.130985 0.207103 0.35205 -0.47282 -0.5385514 1 0.685562 -0.21693 0.011434 -0.10837 0.183005 -0.05951 -0.06696
F_GSPEN 0.31643 0.144427 0.216705 0.225508 -0.36727 -0.44733446 0.681883 1 -0.22132 0.036747 -0.23579 0.018623 -0.02413 -0.064
F_BUS -0.25517 -0.11244 -0.00872 0.086983 0.517887 0.573479323 -0.20007 -0.19209 1 0.156715 0.316047 0.314671 0.394135 0.455887
F_LAB 0.122194 0.147872 0.111864 0.236964 0.103209 0.009562117 0.109118 0.095146 0.052408 1 0.054273 -0.02565 0.126086 0.325256
F_MON -0.00388 -0.10606 0.086316 0.064159 0.535914 0.527133847 -0.25712 -0.23379 0.207659 0.052056 1 0.483932 0.220918 0.335249
F_TRAD -0.27087 -0.18277 -0.01421 0.293389 0.091395 0.151358658 0.266903 0.044839 0.243584 -0.02113 0.130978 1 0.487256 0.245908
F_INV -0.20926 -0.10441 0.128561 0.347969 0.492067 0.444648528 -0.02958 0.002656 0.367911 0.118376 0.248891 0.530416 1 0.477053
F_FIN -0.08536 0.072726 0.238965 0.301464 0.534397 0.467335963 -0.05446 -0.04551 0.42732 0.266661 0.320543 0.186403 0.489965 1
p GROWTH 1 <0.001 0.988607 0.042181 <0.001 <0.001 <0.001 <0.001 <0.001 0.017296 0.584967 <0.001 <0.001 0.349518
C_gcf <0.001 1 0.287068 0.69142 0.000595 0.002003454 <0.001 <0.001 0.217094 0.017405 0.200088 0.118005 0.205694 0.001397
C_inves <0.001 0.0006 1 <0.001 0.000421 0.127903055 0.457943 0.436013 0.596626 0.710554 0.167529 0.055693 0.512386 0.053208
C_trade <0.001 0.000742 <0.001 1 <0.001 0.171837731 <0.001 <0.001 0.603399 0.85674 0.003574 <0.001 <0.001 <0.001
F_PROP <0.001 <0.001 0.000795 0.000416 1 <0.001 <0.002 <0.002 <0.001 0.025168 <0.001 <0.001 <0.001 <0.001
F_GINT <0.001 0.001003 0.212919 0.784337 <0.001 1 <0.003 <0.003 <0.002 0.133102 <0.001 <0.001 <0.001 <0.001
F_TAX <0.001 0.000567 <0.001 <0.001 <0.001 <0.001 1 <0.004 <0.003 0.815261 0.004375 <0.001 0.11836 0.07882
F_GSPEN <0.001 0.000142 <0.001 <0.001 <0.001 <0.002 <0.001 1 <0.004 0.452596 <0.001 0.625309 0.526957 0.092987
F_BUS <0.001 0.003123 0.821374 0.022408 <0.001 <0.003 <0.002 <0.001 1 0.001273 <0.001 <0.001 <0.001 1.03E-36
F_LAB 0.012205 0.00238 0.022172 <0.001 0.034472 <0.004 0.025335 0.051353 0.283907 1 0.267102 0.600134 0.009692 <0.001
F_MON 0.919057 0.005323 0.025139 0.092419 <0.001 <0.005 <0.001 <0.001 <0.001 0.287155 1 <0.001 <0.001 <0.001
F_TRAD <0.001 <0.001 0.712919 <0.001 0.016331 <0.006 <0.002 0.23948 <0.002 0.66596 0.000562 1 <0.001 <0.001
F_INV <0.002 0.006087 0.000829 <0.001 <0.001 <0.007 0.437949 0.944477 <0.003 0.015212 <0.001 <0.001 1 <0.001
F_FIN 0.024938 0.056387 <0.001 <0.001 <0.001 <0.008 0.152999 0.232507 <0.004 <0.001 <0.001 <0.001 <0.001 1
Source: Author.
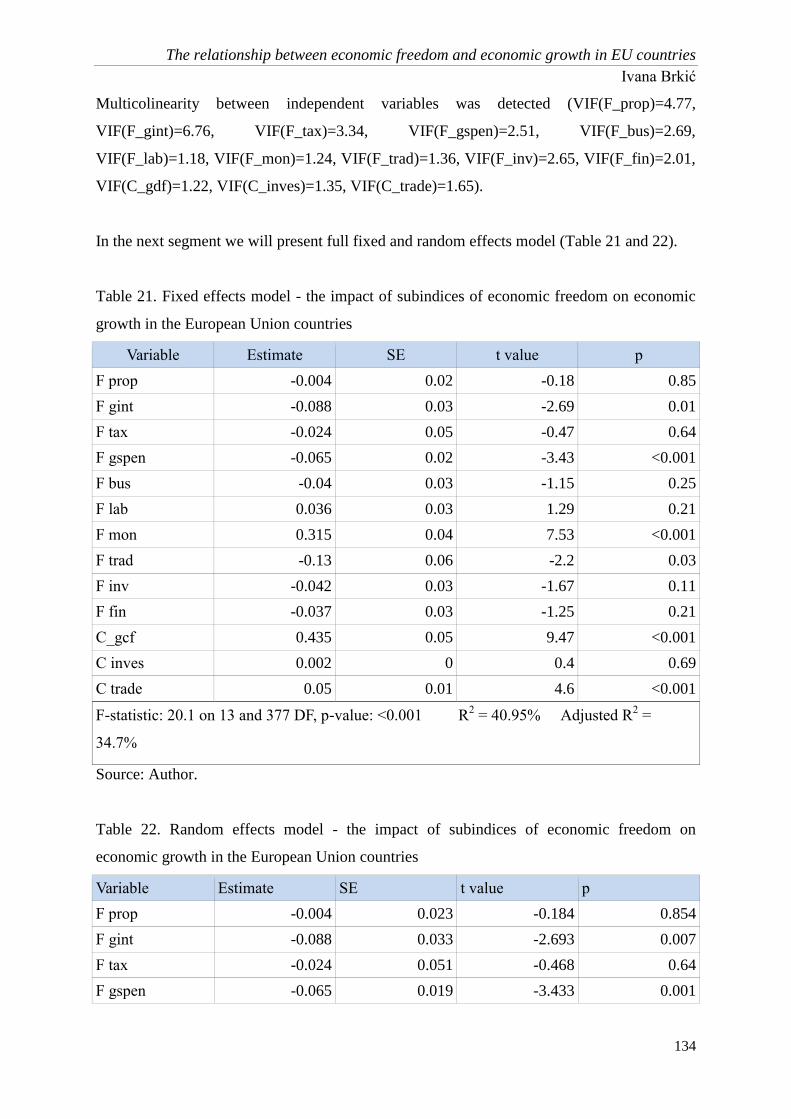
The relationship between economic freedom and economic growth in EU countries
Ivana Brkić
134
Multicolinearity between independent variables was detected (VIF(F_prop)=4.77,
VIF(F_gint)=6.76, VIF(F_tax)=3.34, VIF(F_gspen)=2.51, VIF(F_bus)=2.69,
VIF(F_lab)=1.18, VIF(F_mon)=1.24, VIF(F_trad)=1.36, VIF(F_inv)=2.65, VIF(F_fin)=2.01,
VIF(C_gdf)=1.22, VIF(C_inves)=1.35, VIF(C_trade)=1.65).
In the next segment we will present full fixed and random effects model (Table 21 and 22).
Table 21. Fixed effects model - the impact of subindices of economic freedom on economic
growth in the European Union countries
Variable Estimate SE t value p
F prop -0.004 0.02 -0.18 0.85
F gint -0.088 0.03 -2.69 0.01
F tax -0.024 0.05 -0.47 0.64
F gspen -0.065 0.02 -3.43 <0.001
F bus -0.04 0.03 -1.15 0.25
F lab 0.036 0.03 1.29 0.21
F mon 0.315 0.04 7.53 <0.001
F trad -0.13 0.06 -2.2 0.03
F inv -0.042 0.03 -1.67 0.11
F fin -0.037 0.03 -1.25 0.21
C_gcf 0.435 0.05 9.47 <0.001
C inves 0.002 0 0.4 0.69
C trade 0.05 0.01 4.6 <0.001
F-statistic: 20.1 on 13 and 377 DF, p-value: <0.001 R2 = 40.95% Adjusted R
2 =
34.7%
Source: Author.
Table 22. Random effects model - the impact of subindices of economic freedom on
economic growth in the European Union countries
Variable Estimate SE t value p
F prop -0.004 0.023 -0.184 0.854
F gint -0.088 0.033 -2.693 0.007
F tax -0.024 0.051 -0.468 0.64
F gspen -0.065 0.019 -3.433 0.001
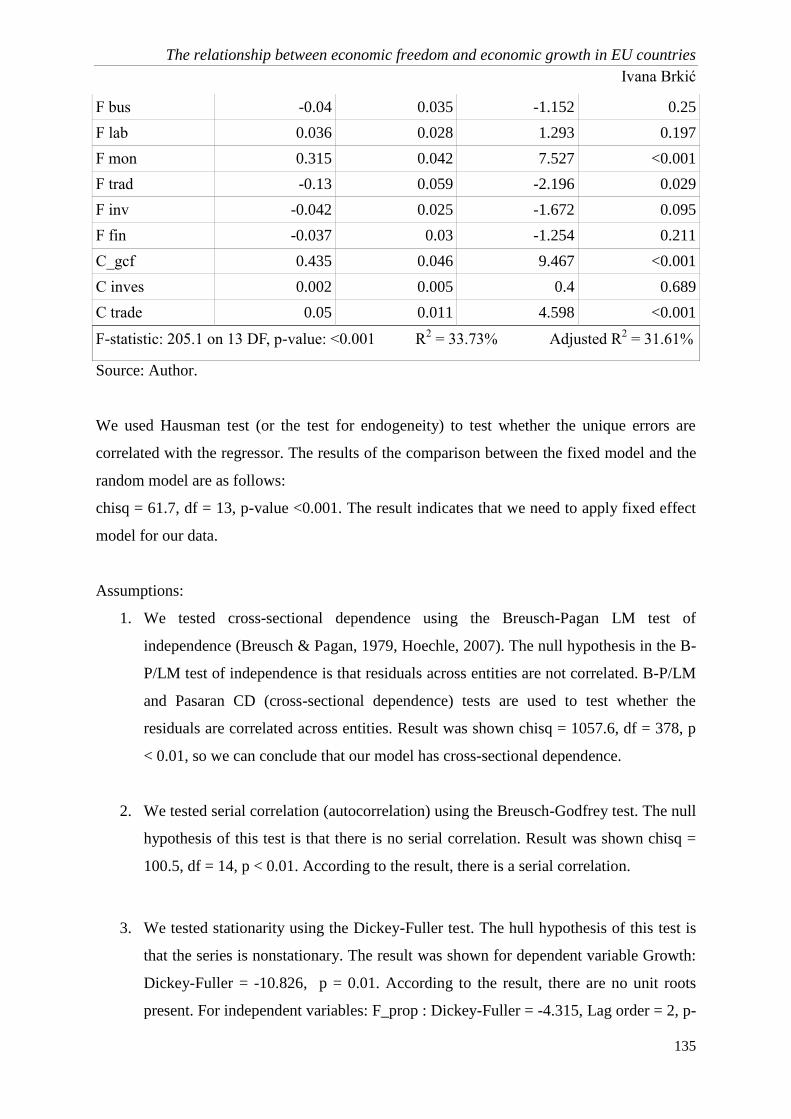
The relationship between economic freedom and economic growth in EU countries
Ivana Brkić
135
F bus -0.04 0.035 -1.152 0.25
F lab 0.036 0.028 1.293 0.197
F mon 0.315 0.042 7.527 <0.001
F trad -0.13 0.059 -2.196 0.029
F inv -0.042 0.025 -1.672 0.095
F fin -0.037 0.03 -1.254 0.211
C_gcf 0.435 0.046 9.467 <0.001
C inves 0.002 0.005 0.4 0.689
C trade 0.05 0.011 4.598 <0.001
F-statistic: 205.1 on 13 DF, p-value: <0.001 R2 = 33.73% Adjusted R
2 = 31.61%
Source: Author.
We used Hausman test (or the test for endogeneity) to test whether the unique errors are
correlated with the regressor. The results of the comparison between the fixed model and the
random model are as follows:
chisq = 61.7, df = 13, p-value <0.001. The result indicates that we need to apply fixed effect
model for our data.
Assumptions:
1. We tested cross-sectional dependence using the Breusch-Pagan LM test of
independence (Breusch & Pagan, 1979, Hoechle, 2007). The null hypothesis in the B-
P/LM test of independence is that residuals across entities are not correlated. B-P/LM
and Pasaran CD (cross-sectional dependence) tests are used to test whether the
residuals are correlated across entities. Result was shown chisq = 1057.6, df = 378, p
< 0.01, so we can conclude that our model has cross-sectional dependence.
2. We tested serial correlation (autocorrelation) using the Breusch-Godfrey test. The null
hypothesis of this test is that there is no serial correlation. Result was shown chisq =
100.5, df = 14, p < 0.01. According to the result, there is a serial correlation.
3. We tested stationarity using the Dickey-Fuller test. The hull hypothesis of this test is
that the series is nonstationary. The result was shown for dependent variable Growth:
Dickey-Fuller = -10.826, p = 0.01. According to the result, there are no unit roots
present. For independent variables: F_prop : Dickey-Fuller = -4.315, Lag order = 2, p-
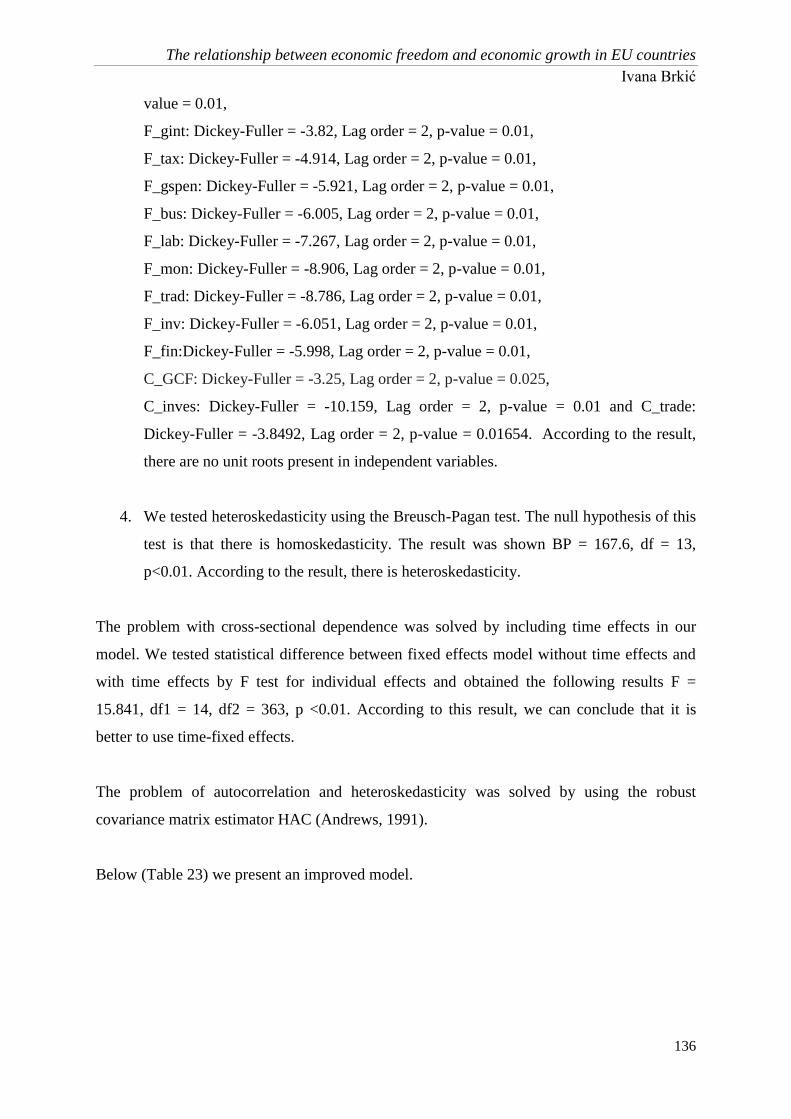
The relationship between economic freedom and economic growth in EU countries
Ivana Brkić
136
value = 0.01,
F_gint: Dickey-Fuller = -3.82, Lag order = 2, p-value = 0.01,
F_tax: Dickey-Fuller = -4.914, Lag order = 2, p-value = 0.01,
F_gspen: Dickey-Fuller = -5.921, Lag order = 2, p-value = 0.01,
F_bus: Dickey-Fuller = -6.005, Lag order = 2, p-value = 0.01,
F_lab: Dickey-Fuller = -7.267, Lag order = 2, p-value = 0.01,
F_mon: Dickey-Fuller = -8.906, Lag order = 2, p-value = 0.01,
F_trad: Dickey-Fuller = -8.786, Lag order = 2, p-value = 0.01,
F_inv: Dickey-Fuller = -6.051, Lag order = 2, p-value = 0.01,
F_fin:Dickey-Fuller = -5.998, Lag order = 2, p-value = 0.01,
C_GCF: Dickey-Fuller = -3.25, Lag order = 2, p-value = 0.025,
C_inves: Dickey-Fuller = -10.159, Lag order = 2, p-value = 0.01 and C_trade:
Dickey-Fuller = -3.8492, Lag order = 2, p-value = 0.01654. According to the result,
there are no unit roots present in independent variables.
4. We tested heteroskedasticity using the Breusch-Pagan test. The null hypothesis of this
test is that there is homoskedasticity. The result was shown BP = 167.6, df = 13,
p<0.01. According to the result, there is heteroskedasticity.
The problem with cross-sectional dependence was solved by including time effects in our
model. We tested statistical difference between fixed effects model without time effects and
with time effects by F test for individual effects and obtained the following results F =
15.841, df1 = 14, df2 = 363, p <0.01. According to this result, we can conclude that it is
better to use time-fixed effects.
The problem of autocorrelation and heteroskedasticity was solved by using the robust
covariance matrix estimator HAC (Andrews, 1991).
Below (Table 23) we present an improved model.

The relationship between economic freedom and economic growth in EU countries
Ivana Brkić
137
Table 23. Improved fixed effects model - the impact of subindices of economic freedom on
economic growth in European Union countries
Variable Estimate SE t value p
F prop 0.017 0.019 0.897 0.371
F gint -0.076 0.031 -2.41 0.016*
F tax -0.015 0.057 -0.271 0.786
F gspen -0.018 0.022 -0.799 0.425
F bus -0.022 0.033 -0.68 0.497
F lab 0.02 0.032 0.636 0.525
F mon 0.098 0.061 1.624 0.105
F trad -0.024 0.058 -0.407 0.685
F inv -0.053 0.032 -1.628 0.104
F fin -0.033 0.033 -1.017 0.31
C_gcf 0.327 0.068 4.809 <0.001
C inves -0.002 0.006 -0.312 0.755
C trade 0.028 0.027 1.021 0.308
F-statistic: 7.2 on 13 and 636 DF, p-value: <0.001 R2 =30.5 % Adjusted R
2 =28.7
%
Source: Author.
Statistically significant independent variable is F gin (p=0.016) and variable C gcf (p<0.001).
It means that each 1 unit increase of F gin causes decrease in Growth by 0.076 and each 1
unit increase of C_GCF causes increase in Growth by 0.327.
We can see that variables F pro and F gint are in multicolinearity with other independent
variables (VIF(F_prop)=4.77, VIF(F_gint)=6.76). Below we present the model without them
(Table 24 and 25).
Table 24. Reduced fixed effects model - the impact of subindices of economic freedom on
economic growth in European Union countries
Variable Estimate SE t value p
F tax -0.03 0.051 -0.59 0.556
F gspen -0.072 0.019 -3.848 <0.001
F bus -0.057 0.034 -1.686 0.093
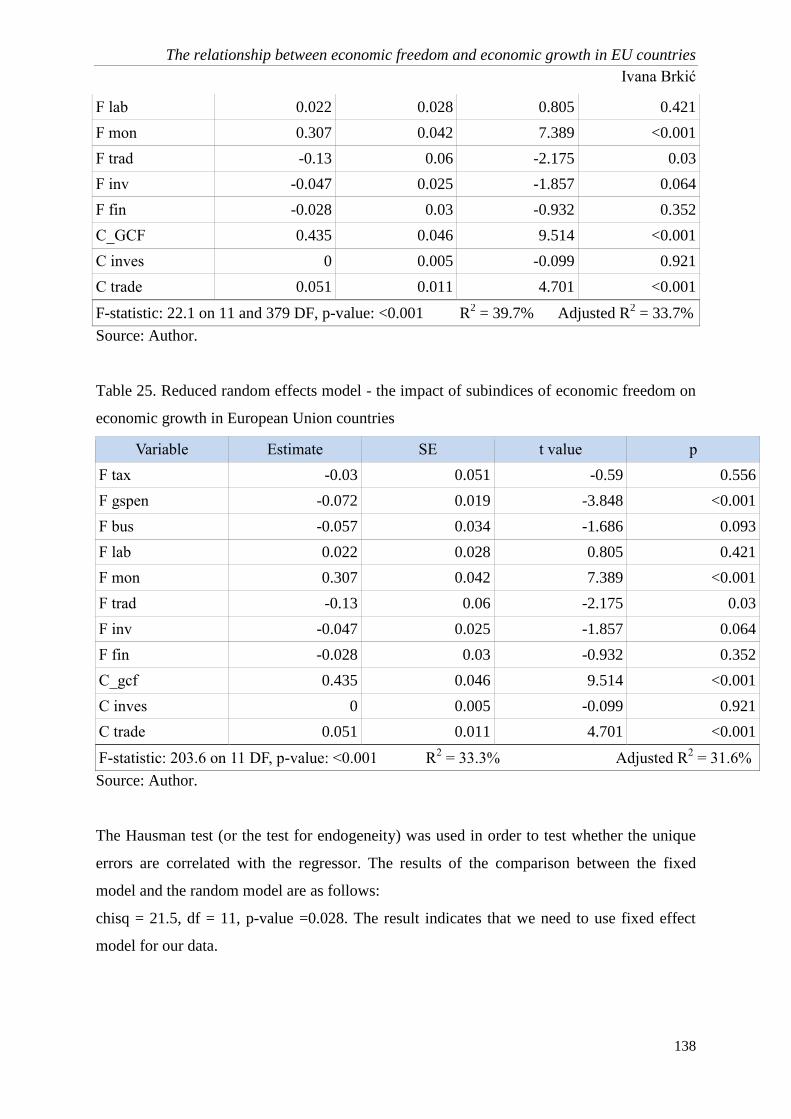
The relationship between economic freedom and economic growth in EU countries
Ivana Brkić
138
F lab 0.022 0.028 0.805 0.421
F mon 0.307 0.042 7.389 <0.001
F trad -0.13 0.06 -2.175 0.03
F inv -0.047 0.025 -1.857 0.064
F fin -0.028 0.03 -0.932 0.352
C_GCF 0.435 0.046 9.514 <0.001
C inves 0 0.005 -0.099 0.921
C trade 0.051 0.011 4.701 <0.001
F-statistic: 22.1 on 11 and 379 DF, p-value: <0.001 R2 = 39.7% Adjusted R
2 = 33.7%
Source: Author.
Table 25. Reduced random effects model - the impact of subindices of economic freedom on
economic growth in European Union countries
Variable Estimate SE t value p
F tax -0.03 0.051 -0.59 0.556
F gspen -0.072 0.019 -3.848 <0.001
F bus -0.057 0.034 -1.686 0.093
F lab 0.022 0.028 0.805 0.421
F mon 0.307 0.042 7.389 <0.001
F trad -0.13 0.06 -2.175 0.03
F inv -0.047 0.025 -1.857 0.064
F fin -0.028 0.03 -0.932 0.352
C_gcf 0.435 0.046 9.514 <0.001
C inves 0 0.005 -0.099 0.921
C trade 0.051 0.011 4.701 <0.001
F-statistic: 203.6 on 11 DF, p-value: <0.001 R2 = 33.3% Adjusted R
2 = 31.6%
Source: Author.
The Hausman test (or the test for endogeneity) was used in order to test whether the unique
errors are correlated with the regressor. The results of the comparison between the fixed
model and the random model are as follows:
chisq = 21.5, df = 11, p-value =0.028. The result indicates that we need to use fixed effect
model for our data.
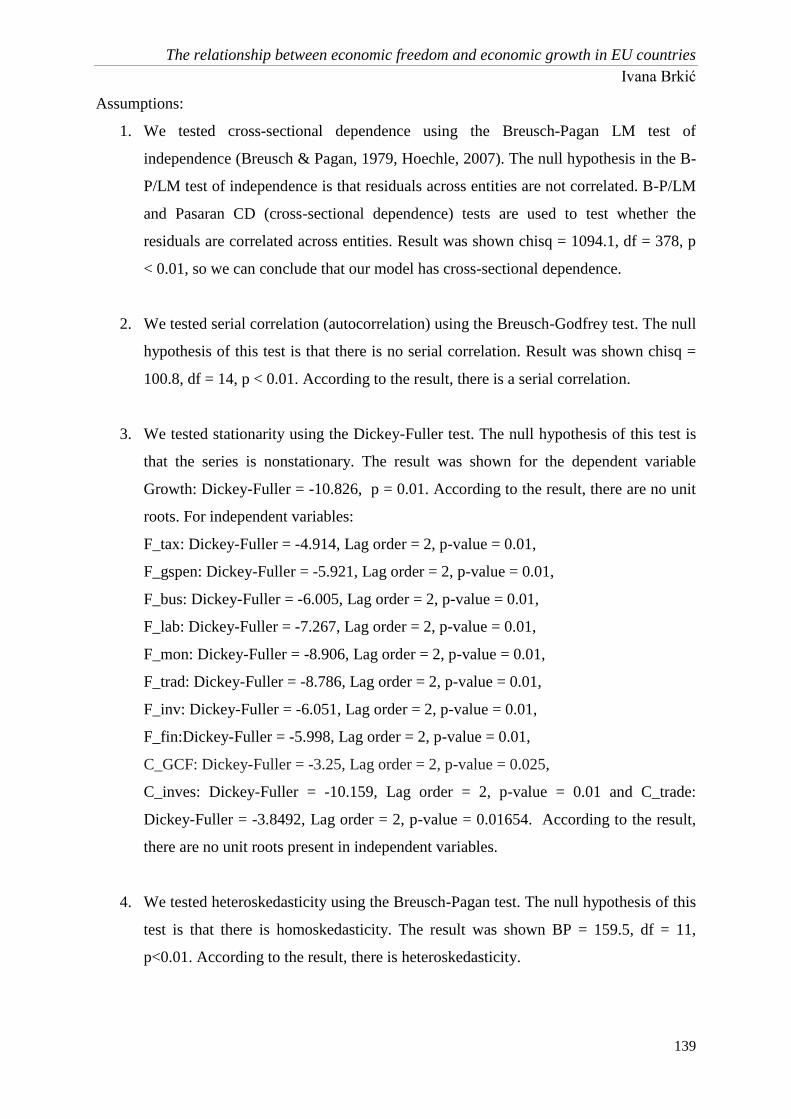
The relationship between economic freedom and economic growth in EU countries
Ivana Brkić
139
Assumptions:
1. We tested cross-sectional dependence using the Breusch-Pagan LM test of
independence (Breusch & Pagan, 1979, Hoechle, 2007). The null hypothesis in the B-
P/LM test of independence is that residuals across entities are not correlated. B-P/LM
and Pasaran CD (cross-sectional dependence) tests are used to test whether the
residuals are correlated across entities. Result was shown chisq = 1094.1, df = 378, p
< 0.01, so we can conclude that our model has cross-sectional dependence.
2. We tested serial correlation (autocorrelation) using the Breusch-Godfrey test. The null
hypothesis of this test is that there is no serial correlation. Result was shown chisq =
100.8, df = 14, p < 0.01. According to the result, there is a serial correlation.
3. We tested stationarity using the Dickey-Fuller test. The null hypothesis of this test is
that the series is nonstationary. The result was shown for the dependent variable
Growth: Dickey-Fuller = -10.826, p = 0.01. According to the result, there are no unit
roots. For independent variables:
F_tax: Dickey-Fuller = -4.914, Lag order = 2, p-value = 0.01,
F_gspen: Dickey-Fuller = -5.921, Lag order = 2, p-value = 0.01,
F_bus: Dickey-Fuller = -6.005, Lag order = 2, p-value = 0.01,
F_lab: Dickey-Fuller = -7.267, Lag order = 2, p-value = 0.01,
F_mon: Dickey-Fuller = -8.906, Lag order = 2, p-value = 0.01,
F_trad: Dickey-Fuller = -8.786, Lag order = 2, p-value = 0.01,
F_inv: Dickey-Fuller = -6.051, Lag order = 2, p-value = 0.01,
F_fin:Dickey-Fuller = -5.998, Lag order = 2, p-value = 0.01,
C_GCF: Dickey-Fuller = -3.25, Lag order = 2, p-value = 0.025,
C_inves: Dickey-Fuller = -10.159, Lag order = 2, p-value = 0.01 and C_trade:
Dickey-Fuller = -3.8492, Lag order = 2, p-value = 0.01654. According to the result,
there are no unit roots present in independent variables.
4. We tested heteroskedasticity using the Breusch-Pagan test. The null hypothesis of this
test is that there is homoskedasticity. The result was shown BP = 159.5, df = 11,
p<0.01. According to the result, there is heteroskedasticity.

The relationship between economic freedom and economic growth in EU countries
Ivana Brkić
140
The problem with cross-sectional dependence we solved by including time effects in our
model. We tested statistical difference between fixed effects model without time effects and
with time effects by F test for individual effects and obtained the following results F =
15.941, df1 = 14, df2 = 365, p <0.01.
According to these results, we can conclude that it is better to use time-fixed effects.
The problem of autocorrelation and heteroskedasticity was solved by using the robust
covariance matrix estimator HAC (Andrews, 1991).
Table 26. Final fixed effects model - the impact of subindices of economic freedom on
economic growth in European Union countries
Variable Estimate SE t value p
F tax -0.029 0.045 -0.66 0.51
F gspen -0.024 0.017 -1.407 0.16
F bus -0.036 0.03 -1.212 0.226
F lab 0.012 0.023 0.509 0.611
F mon 0.092 0.043 2.153 0.032
F trad -0.013 0.065 -0.193 0.847
F inv -0.056 0.021 -2.597 0.01
F fin -0.022 0.024 -0.892 0.373
C_gcf 0.326 0.045 7.176 <0.001
C inves -0.003 0.004 -0.845 0.399
C trade 0.027 0.011 2.489 0.013
F-statistic: 7.7 on 11 and 636 DF, p-value: <0.001 R2 = 28.9% Adjusted R
2 =27.3 %
Source: Author.
Statistically significant independent variable is F mon (p=0.032), F inv (p=0.01), C gcf
(p<0.001) and variable C trade (p=0,013). It means that each 1 unit increase of F mon causes
increase in Growth by 0.09 and also each 1 unit increase of F inv causes decrease in Growth
by 0.056 and each 1 unit increase of C_gcf causes increase in Growth by 0.326 and each 1
unit increase of C trade causes increase in Growth by 0.027.
We can see that independent variable F mon is not in linear relationship with dependent
variable Growth but it is a statistically significant predictor. This variable is called
“suppressor variable” (Maassen & Bakker, 2001).

The relationship between economic freedom and economic growth in EU countries
Ivana Brkić
141
4.5. RESULTS OF THE PANEL ANALYSIS ON THE IMPACT OF CHANGE OF
ECONOMIC FREEDOM ON ECONOMIC GROWTH IN THE EU COUNTRIES
In this segment we seek to explore the relationship between the change of economic freedom
and economic growth in the selected sample of EU countries. Graph 20 presents a
visualization of the scatterplots between Growth and Change Efi by countries.
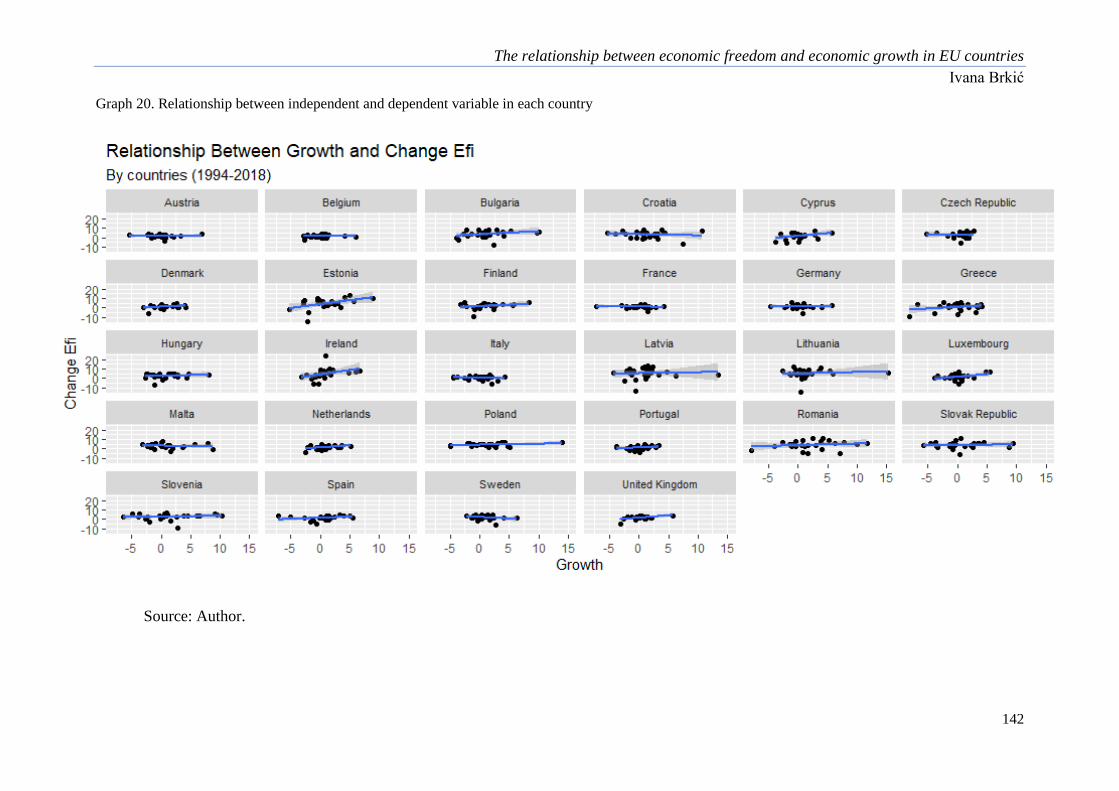
The relationship between economic freedom and economic growth in EU countries
Ivana Brkić
142
Graph 20. Relationship between independent and dependent variable in each country
Source: Author.

The relationship between economic freedom and economic growth in EU countries
Ivana Brkić
143
Graph 21 shows the correlation between Change of index of economic freedom and
Economic growth in the observed sample of countries. We can see that the association is
positive and statistically significant (r=0.185, p<0.0001).
Graph 21. Correlation between Change of index of economic freedom and GDP per capita
growth (annual %)
Source: Author.
Figure 3 and Table 27 present the correlation between variables of these panel data.
Obviously, there is no strong correlation between variables. We detected significant
correlation between Growth and Change Efi (r=0.19, p<0.001), Growth and C_GCF
(r=0.365, p<0.001), Growth and C_Inves (r=0.17, p<0.001) and Growth and C_trade(r=0.16,
p<0.001), between Change Efi and C_GCF (r=0.09, p=0.01), between C_GCF and
C_inves(r=0.13, p<0.001 (and C_GCF and C_trade (r=0.127, p<0.001) and also between
C_inves and C_trade (r=0.359, p<0.001).
Multicolinearity between dependent variables was not detected (VIF(Change Efi) = 1.007;
VIF(C_GDF) = 1.009; VIF(C_inves) = 1.152 and VIF(C_trade) = 1.151).
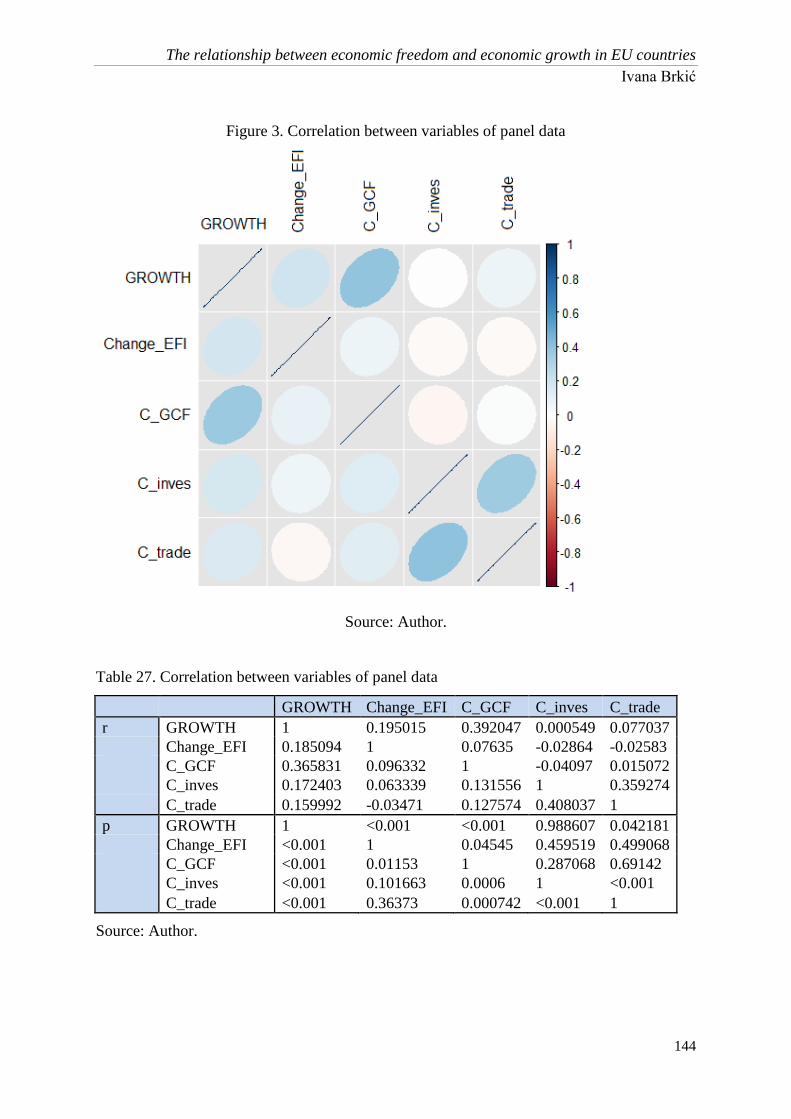
The relationship between economic freedom and economic growth in EU countries
Ivana Brkić
144
Figure 3. Correlation between variables of panel data
Source: Author.
Table 27. Correlation between variables of panel data
GROWTH Change_EFI C_GCF C_inves C_trade
r GROWTH 1 0.195015 0.392047 0.000549 0.077037
Change_EFI 0.185094 1 0.07635 -0.02864 -0.02583
C_GCF 0.365831 0.096332 1 -0.04097 0.015072
C_inves 0.172403 0.063339 0.131556 1 0.359274
C_trade 0.159992 -0.03471 0.127574 0.408037 1
p GROWTH 1 <0.001 <0.001 0.988607 0.042181
Change_EFI <0.001 1 0.04545 0.459519 0.499068
C_GCF <0.001 0.01153 1 0.287068 0.69142
C_inves <0.001 0.101663 0.0006 1 <0.001
C_trade <0.001 0.36373 0.000742 <0.001 1
Source: Author.
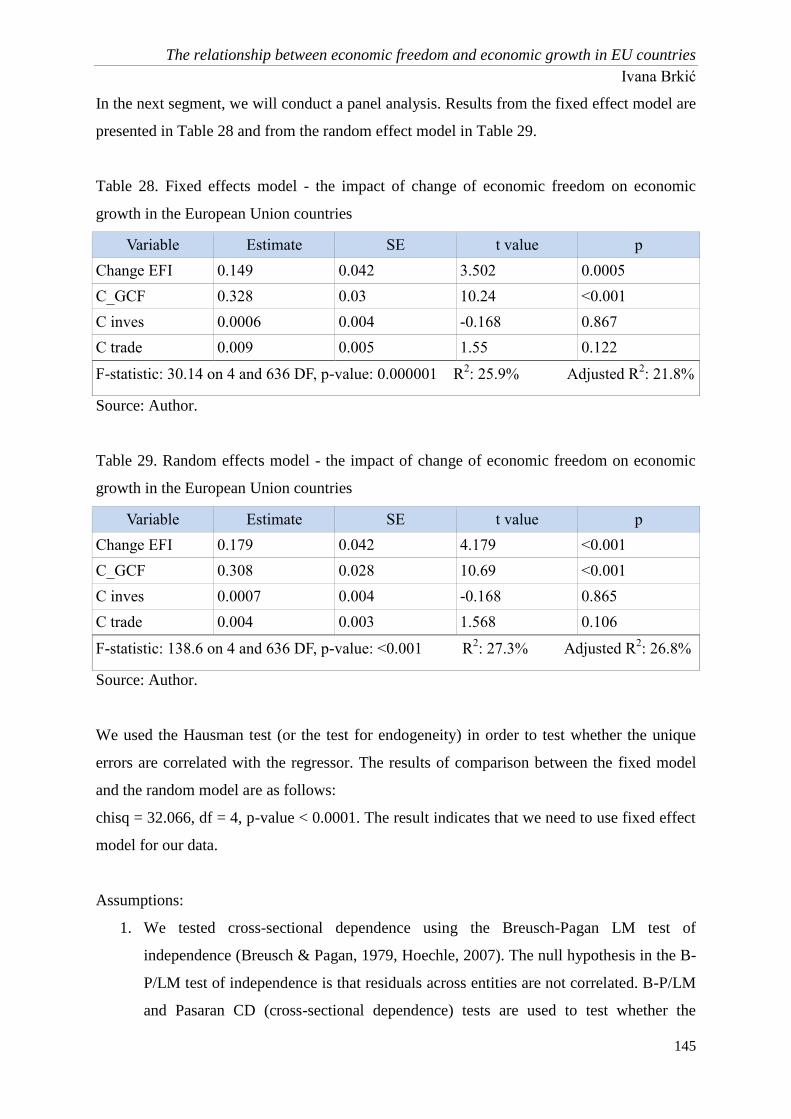
The relationship between economic freedom and economic growth in EU countries
Ivana Brkić
145
In the next segment, we will conduct a panel analysis. Results from the fixed effect model are
presented in Table 28 and from the random effect model in Table 29.
Table 28. Fixed effects model - the impact of change of economic freedom on economic
growth in the European Union countries
Variable Estimate SE t value p
Change EFI 0.149 0.042 3.502 0.0005
C_GCF 0.328 0.03 10.24 <0.001
C inves 0.0006 0.004 -0.168 0.867
C trade 0.009 0.005 1.55 0.122
F-statistic: 30.14 on 4 and 636 DF, p-value: 0.000001 R2: 25.9% Adjusted R
2: 21.8%
Source: Author.
Table 29. Random effects model - the impact of change of economic freedom on economic
growth in the European Union countries
Variable Estimate SE t value p
Change EFI 0.179 0.042 4.179 <0.001
C_GCF 0.308 0.028 10.69 <0.001
C inves 0.0007 0.004 -0.168 0.865
C trade 0.004 0.003 1.568 0.106
F-statistic: 138.6 on 4 and 636 DF, p-value: <0.001 R2: 27.3% Adjusted R
2: 26.8%
Source: Author.
We used the Hausman test (or the test for endogeneity) in order to test whether the unique
errors are correlated with the regressor. The results of comparison between the fixed model
and the random model are as follows:
chisq = 32.066, df = 4, p-value < 0.0001. The result indicates that we need to use fixed effect
model for our data.
Assumptions:
1. We tested cross-sectional dependence using the Breusch-Pagan LM test of
independence (Breusch & Pagan, 1979, Hoechle, 2007). The null hypothesis in the B-
P/LM test of independence is that residuals across entities are not correlated. B-P/LM
and Pasaran CD (cross-sectional dependence) tests are used to test whether the

The relationship between economic freedom and economic growth in EU countries
Ivana Brkić
146
residuals are correlated across entities. Result was shown chisq = 2520.6, df = 378, p
< 0.01, so we can conclude that our model has cross-sectional dependence.
2. We tested serial correlation (autocorrelation) using the Breusch-Godfrey test. The null
hypothesis of this test is that there is no serial correlation. Result was shown chisq =
161.94, df = 16, p < 0.01. According to the result, there is a serial correlation.
3. We tested heteroskedasticity using the Breusch-Pagan test. The null hypothesis of this
test is that there is homoskedasticity. The result was shown BP = 5.813, df = 4,
p=0.2135. According to the result, there is no heteroskedasticity.
4. We tested stationarity using the Dickey-Fuller test. The null hypothesis of this test is
that the series is nonstationary. The result was shown for dependent variable Growth:
Dickey-Fuller = -10.826, p = 0.01. According to the result, there are no unit roots.
For independent variables: Change EFI : Dickey-Fuller = -14.65, Lag order = 2, p-
value = 0.01, C_GCF: Dickey-Fuller = -3.25, Lag order = 2, p-value = 0.025,
C_inves: Dickey-Fuller = -10.159, Lag order = 2, p-value = 0.01 and C_trade:
Dickey-Fuller = -3.8492, Lag order = 2, p-value = 0.01654. According to the result,
there are no unit roots present in independent variables.
The problem with cross-sectional dependence we solved by including time effects in our
model. We tested statistical difference between fixed effects model without time effects and
with time effects by F test for individual effects and obtained the following results F =
21.276, df1 = 24, df2 = 612, p <0.01. According to this result, we can conclude that it is
better to use time-fixed effects. The problem of autocorrelation was solved by using the
robust covariance matrix estimator HAC (Andrews, 1991). In Table 30 we present final fixed
effects model that shows the impact of change of economic freedom on economic growth in
the European Union countries

The relationship between economic freedom and economic growth in EU countries
Ivana Brkić
147
Table 30. Final fixed effects model - impact of change of economic freedom on economic
growth in European Union countries
Variable Estimate SE t value p
Change EFI 0.092 0.038 2.396 0.017
C_gcf 0.124 0.042 5.776 <0.001
C inves 0.002 0.003 -0.071 0.923
C trade 0.031 0.012 2.655 0.008
F-statistic: 27.443 on 4 and 612 DF, p-value: 0.000001 R2: 33.7% Adjusted R
2: 32.8%
Source: Author.
Statistically significant independent variable is Change EFI (p=0.017), independent variable
C_GCF (p<0.001) and C_trade (p=0.008). It means that each 1 unit increase of Change Efi
causes increase in Growth by 0.092; each 1 unit increase of C_gcf causes increase in Growth
by 0.124 and also each 1 unit increase of C trade causes increase in Growth by 0.031.

The relationship between economic freedom and economic growth in EU countries
Ivana Brkić
148
4.6. CHAPTER SUMMARY
Chapter 4 presents the results of an empirical study on determining the impact of
economic freedom on economic growth. After the descriptive analysis of the dependent and
independent variables, as well as the conducted correlation analysis, the second, third and
fourth subchapters present the results of a panel analysis of the impact of economic freedom,
its elements, as well as change of economic freedom on economic growth in the sample of
European Union countries covering a period of twenty-five years. Prior to each analysis,
appropriate tests were carried out which enabled the quality of the concrete panel analysis.
The results are presented in graphs and tables.
The subsequent fifth chapter will discuss the results of the research based on the
above analyses, which will confirm or challenge the hypotheses, we will compare the results
with the views/results of other authors, as well as draw a general conclusion regarding the
subject of the research. In the final part, we will give indications and directions for further
research.
The relationship between economic freedom and economic growth in EU countries
Ivana Brkić
149
CHAPTER 5: DISCUSSION, CONCLUSIONS, LIMITATIONS AND
FUTURE LINE OF RESEARCH
5.1. INTRODUCTION
If we make a retrospective, we can see that the concept of the dissertation is logical
and gradual. The introductory part discusses the justification of the research, sets the research
goals, briefly constructs a theoretical perspective on the set problems, and presents the
following structure of the dissertation. The second chapter of the dissertation is entirely
devoted to the theoretical basis for subsequently conducted empirical research. It defines the
basic concepts that are the subject of research in the dissertation and reviews the results of
previous research available in the scientific literature on the relationship between economic
freedom and economic growth. The empirical part contains the results of the research and
focuses on testing the hypotheses.
Over the past decades, the notion of economic freedom has attracted considerable
attention. Since the creation and publication of numerous indexes of economic freedom, the
ability of researchers to draw conclusions about the impact of economic freedom on
economic performance and other indicators of human well-being has increased. It can be said
that two indicators that read the state of economic freedom in many countries are dominant
and accepted: the Economic Freedom of the World Index (constructed by the Fraser Institute)
and the Index of Economic Freedom (developed by the Heritage Foundation jointly with the
Wall Street Journal), and that they similarly view phenomena that contribute to economic
freedom in a positive/negative way (Kapás & Czeglédi, 2007). In the numerous scientific
literatures reviewed in the preceding chapters, answers to three questions were essentially
sought: (1) What is the relationship between economic freedom and growth? (2) What is it
that drives the given relation? (3) Which component of economic freedom contributes most
to economic growth?. In scientific studies and empirical research, particular attention was
paid to the dilemma of whether the level or change in the level of economic freedom is
determinative regarding the impact on economic growth. Furthermore, what is equally
present in the study of the relationship between economic freedom and growth is the
examination of causality as well as effect. A significant number of authors have devoted

The relationship between economic freedom and economic growth in EU countries
Ivana Brkić
150
themselves to decomposing one of the aforementioned indices and researching which aspect
of economic freedom contributes most to improving economic performance. In this context,
the tendency of the research conducted in the dissertation is to make a scientific contribution
to the given topics and dilemmas, and to investigate the given relations on a sample of
countries that is specific in its economic and political connotation.
The first three segments of this chapter analyze the results of the panel analysis
conducted within the framework of the dissertation on the impact of economic freedom,
elements of economic freedom, as well as change of economic freedom on economic growth
in the EU countries, and at the same time confirm or refute the hypotheses. In the fourth part,
a synthesis of all the considerations on the given topics is conducted and the overall
conclusion of the whole research is given. Some limitations of the conducted research with
special emphasis on the directions of further research inspired by the results obtained in the
dissertation are presented in the last segment of the chapter.
5.2. DISCUSSION OF THE RESULTS OF PANEL ANALYSIS ON THE IMPACT OF
ECONOMIC FREEDOM ON ECONOMIC GROWTH IN THE EU COUNTRIES
Based on the results of the research on the positive but not statistically significant
impact of economic freedom on economic growth in EU countries, we conclude that General
Hypothesis 1 (H0): Economic freedom has a positive impact on economic growth in EU
countries – is REFUTED, whereas alternative hypothesis (H1) holds: Economic freedom
has a negative or no impact on economic growth in European Union countries.
It is not uncommon to obtain negative results. Similarly, conducting the research, De
Haan & Sturm (2000) and Sturm & De Haan (2001) concluded that the overall level of
economic freedom is not related to economic growth, while some of its elements and change
of economic freedom are. In this direction and with the given idea, the continuation of
research within this dissertation was done. Heckelman and Stroup (2000) also concluded that
the overall level of economic freedom is not related to economic growth, while some
elements are. By relating the level of economic freedom to the level of GDP (per capita) in a
sample of selected EU member states, Kovačević & Borović (2014) found a positive but not
statistically significant relationship. The absence of statistical significance in the relationship

The relationship between economic freedom and economic growth in EU countries
Ivana Brkić
151
between economic freedom and economic growth was also noted by Wu (2011) in his
research. Dawson (2003) did not find a statistically significant relationship in examining the
sampling of economic growth with economic freedom in the long run.
On the other hand, it is possible to obtain different results using different methods of
quantitative analysis, as well as a different model specification in terms of changing control
variables to prove the robustness of the results, which is the basis for future tests aimed at
proving or refuting the findings in this dissertation. Likewise, it would be useful to examine
whether the level of economic freedom in a given sample of countries affects other economic
indicators (eg investment), as was proved in studies by Dawson (2003), Justesen (2008),
Aixalá & Fabro (2009) and thus indirectly economic growth.
5.3. DISCUSSION OF THE RESULTS OF PANEL ANALYSIS ON THE IMPACT OF
ELEMENTS OF ECONOMIC FREEDOM ON ECONOMIC GROWTH IN THE EU
COUNTRIES
The results of the panel analysis on the impact of elements of economic freedom on
economic growth in EU countries show that out of eight observed components of economic
freedom (two variables were removed from the final model due to the issues with
multicollinearity), two subindices had statistically significant impact on the dependent
variable Economic growth, while six did not show such significance. Thus, Monetary
Freedom has a positive impact on economic growth in the countries of the European Union in
the sense that the growth of the Monetary Freedom subindex by one unit causes a percentage
change in economic growth by 0.09 units. On the other hand, the growth of Investment
Freedom by one unit leads to an economic decline by 0.056 units.
The results obtained indicate that "Certain aspects of economic freedom have a
positive impact on economic growth in EU countries", hence Special Hypothesis 1 (H0) is
CONFIRMED.
Using individual hypotheses, it will be clearly defined which aspects of economic
freedom have a positive impact and which negative, that is, which do not have any
(statistically significant) impact on economic growth.
The relationship between economic freedom and economic growth in EU countries
Ivana Brkić
152
As the first two indices were removed from the final model due to multicollinearity
issues, neither Individual Hypothesis 1.1. (H0) –Property rights have a positive impact on
economic growth in the countries of the European Union, nor Individual Hypothesis 1.2. (H0)
– Government Integrity has a positive impact on economic growth in European Union
countries - can be confirmed or refuted.
Tax burden did not show a statistically significant impact on the dependent variable
Economic Growth, hence Individual Hypothesis 1.3. (H0) –Tax burden has a positive
impact on economic growth in EU countries – is REFUTED and alternative hypothesis
(H1) - Tax burden has a negative or no impact on economic growth in European Union
countries is supported.
The panel analysis did not establish a positive, statistically significant relationship
between the Public Expenditure aspect of the Index of Economic Freedom of the Heritage
Foundation and economic growth in the sample of European Union countries, hence
Individual Hypothesis 1.4. Public spending has a positive impact on economic growth in
EU countries – is REJECTED, while the alternative hypothesis (H1) - Public spending has a
negative or no impact on economic growth in EU countries is confirmed.
Business freedom showed no statistically significant relationship with the dependent
variable Economic growth in the European Union, hence Individual Hypothesis 1.5.
Business freedom has a positive impact on economic growth in EU countries – is
REFUTED, whereas the alternative hypothesis (H1) - Business freedom has a negative or no
impact on economic growth in EU countries is valid.
Aspect of economic freedom dedicated to labor market liberalization – Labor
Freedom - did not, at this point, show statistically significant impacts on Economic Growth,
hence Individual Hypothesis 1.6. Labor freedom has a positive impact on economic
growth in EU countries – is REFUTED. As this aspect of economic freedom was formed
within the Index of Economic Freedom of the Heritage Foundation only in later years, it is
possible that the lack of the required amount of data contributed to this result.

The relationship between economic freedom and economic growth in EU countries
Ivana Brkić
153
Monetary freedom showed a POSITIVE, STATISTICALLY SIGNIFICANT impact
on Economic Growth within our analysis, hence Individual Hypothesis 1.7. Monetary
freedom has a positive impact on economic growth in EU countries – is CONFIRMED.
A statistically significant relationship between the aspect of free trade and economic
growth within the European region was not shown by the conducted research hence
Individual Hypothesis 1.8. Trade freedom has a positive impact on economic growth in
EU countries– is REFUTED.
Investment freedom showed a NEGATIVE STATISTICALLY SIGNIFICANT
impact on the dependent variable Economic growth in the observed sample of countries,
hence Individual Hypothesis 1.9 Investment freedom has a positive impact on economic
growth in EU countries – is REFUTED.
Individual Hypothesis 1.10.Financial freedom has a positive impact on economic
growth in EU countries - is REFUTED because the analysis did not establish a statistically
significant impact of the economic freedom subindex - Financial freedom on the variable
Economic growth.
The results obtained in the dissertation were compared with those obtained by authors
who used the same (panel) or other method for the purpose of conducting their research
(Table 58). Also, as no other study that covered the same sample of countries or the study
period was conducted, the results obtained in the dissertation were compared with the results
of other authors who investigated the impact of economic freedom on economic growth (or
some other form of economic progress2) on different sample of countries, in the presence of
the same or different control variables. As the theoretical part draws a parallel between the
Index of Economic Freedom published by the Heritage Foundation and the Fraser Institute,
the comparison of the results obtained in the dissertation with the results of other authors also
used the findings obtained by other authors using the Fraser Institute's Index of Economic
Freedom in investigating the impact of economic freedom on economic growth, which are
presented in Table 58 in the so-called italic letters. Some of the research that was dealt with
in the theoretical part of the dissertation was not covered by the comparison, either because of
2 Akin et al. (2014)– GDP level; Alexandrakis and Livanis (2013) – GDP per worker; Cebula (2011); Cebula et al. (2013) -
GDP per capita;

The relationship between economic freedom and economic growth in EU countries
Ivana Brkić
154
the lack of exact information in the research itself or for other objective reasons, that is, the
inability of meaningful comparability of the results.
The results obtained in our study are specific to the selected sample of countries,
observed over a defined period of time and processed based on one type of quantitative
analysis. In this respect, neither can it be expected that they fully coincide with the results
obtained from other authors, nor that the findings are consistent with the general scientific
view. The conclusion to be drawn from the comparison is which aspect of economic freedom
is equally important for the observed groups of countries, and what is characteristic of the
sample of countries in our study.

The relationship between economic freedom and economic growth in EU countries
Ivana Brkić
155
Table 31. Comparison of findings of the research on the impact of elements of economic freedom with those of other authors
POSITIVE NEGATIVE NOT STATISTICALLY
SIGNIFICANT
PROPERTY RIGHTS
Ahmadpour et al. (2013) - OPEC
Akin et al. (2014)
Alexandrakis and Livanis (2013) – Latin America and ОЕCD
Carlsson and Lundström (2002)
Cebula and Mixon (2012) - ОЕCD
Gorlach and Le Roux (2013) – SADC
Mahmood et al. (2010) – SAARC
Cebula (2011) – OECD
Cebula et al. (2013) – OECD
Justesen (2008) +
Kovačević and Borović (2014)
GOVERNMENT INTEGRITY /
FREEDOM FROM CORRUPTION
Mahmood et al. (2010) - SAARC
Peev and Mueller (2012) - transition economies
Cebula (2011) – OECD
Cebula et al. (2013) – OECD
Tiwari (2011) – Asian countries
Kovačević and Borović (2014)
TAX BURDEN/ FISCAL FREEDOM
Cebula and Mixon (2012) - ОЕCD
Kovačević and Borović (2014)
Rajasalu (2003) - EU
Tiwari (2011) – Asian countries
Cebula (2011) - OECD
Heckelman and Stroup (2000) Cebula, Clark and Mixon (2013)
Cebula et al. (2013) – OECD
PUBLIC SPENDING
Ahmadpour et al. (2013) - OPEC
Akin et al. (2014) – middle income level
Alexandrakis and Livanis (2013) –
Reduced public spending affects LA countries, but not OECD
Ayal and Karras (1998)
Cebula and Mixon (2012) - ОЕCD
Cebula et al. (2013) – OECD
Gorlach and Le Roux (2013) – SADC
Heckelman and Stroup (2000)
Justesen (2008)
Kovačević and Borović (2014)
Carlsson and Lundström (2002)
Mahmood et al. (2010) - SAARC
Akin et al. (2014) – high and low
income
BUSINESS FREEDOM
Ahmadpour et al. (2013) - OPEC
Gorlach and Le Roux (2013) – SADC
Justesen (2008)
Mahmood et al. (2010) – SAARC
Cebula (2011) – OECD
Cebula et al. (2013) – OECD
Kovačević and Borović (2014)
LABOR FREEDOM
Ahmadpour et al. (2013) - OPEC
Gorlach and Le Roux (2013) - SADC
Justesen (2008)
Cebula (2011) - OECD
Kovačević and Borović (2014)
Cebula et al. (2013) – OECD (-)
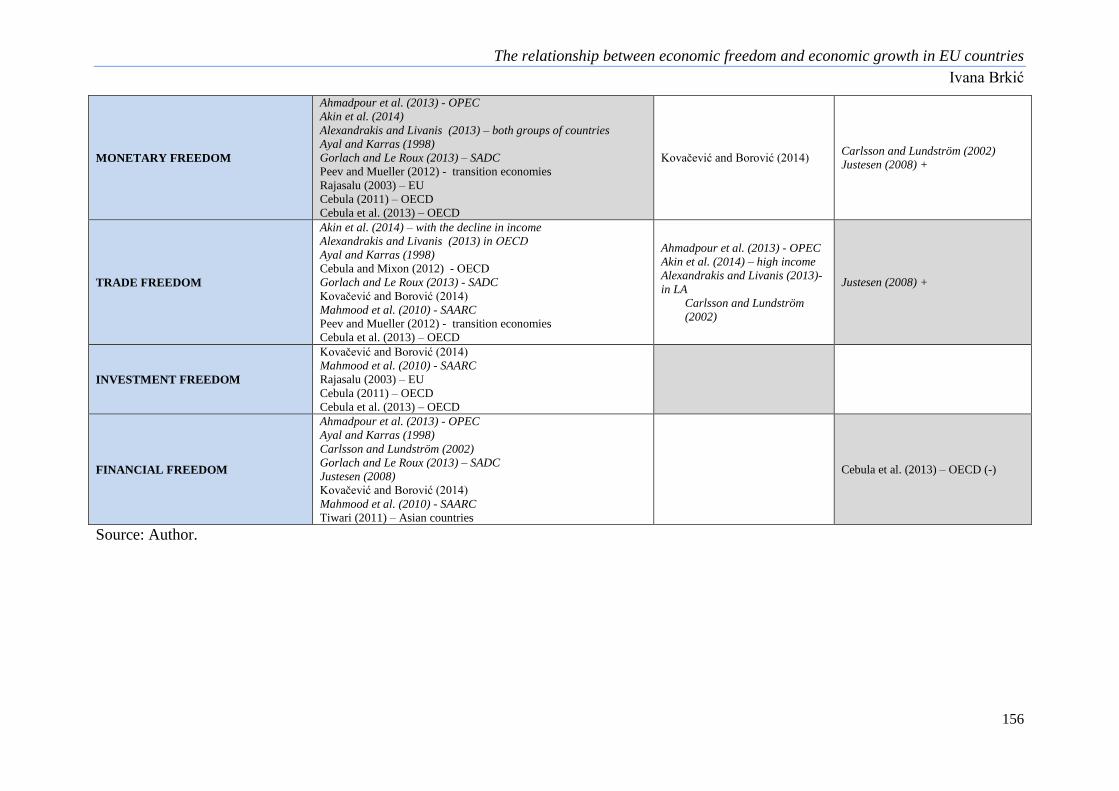
The relationship between economic freedom and economic growth in EU countries
Ivana Brkić
156
MONETARY FREEDOM
Ahmadpour et al. (2013) - OPEC
Akin et al. (2014)
Alexandrakis and Livanis (2013) – both groups of countries
Ayal and Karras (1998)
Gorlach and Le Roux (2013) – SADC
Peev and Mueller (2012) - transition economies
Rajasalu (2003) – EU
Cebula (2011) – OECD
Cebula et al. (2013) – OECD
Kovačević and Borović (2014) Carlsson and Lundström (2002)
Justesen (2008) +
TRADE FREEDOM
Akin et al. (2014) – with the decline in income
Alexandrakis and Livanis (2013) in ОЕCD
Ayal and Karras (1998)
Cebula and Mixon (2012) - ОЕCD
Gorlach and Le Roux (2013) - SADC
Kovačević and Borović (2014)
Mahmood et al. (2010) - SAARC
Peev and Mueller (2012) - transition economies
Cebula et al. (2013) – OECD
Ahmadpour et al. (2013) - OPEC
Akin et al. (2014) – high income
Alexandrakis and Livanis (2013)-
in LA
Carlsson and Lundström
(2002)
Justesen (2008) +
INVESTMENT FREEDOM
Kovačević and Borović (2014)
Mahmood et al. (2010) - SAARC
Rajasalu (2003) – EU
Cebula (2011) – OECD
Cebula et al. (2013) – OECD
FINANCIAL FREEDOM
Ahmadpour et al. (2013) - OPEC
Ayal and Karras (1998)
Carlsson and Lundström (2002)
Gorlach and Le Roux (2013) – SADC
Justesen (2008)
Kovačević and Borović (2014)
Mahmood et al. (2010) - SAARC
Tiwari (2011) – Asian countries
Cebula et al. (2013) – OECD (-)
Source: Author.
The relationship between economic freedom and economic growth in EU countries
Ivana Brkić
157
Based on the comparison of the results of our research, which are shaded in Table 58,
most coincidence with the results of other authors is observed in the Monetary freedom sub-
index. We conclude that the given aspect of economic freedom is equally significant and
common to most regions or groups of countries that were the subject of different surveys, and
that other aspects have more or less impact in specific groupings of countries.
As monetary freedom actually implies price stability, i.e. the absence of inflation but also
price control by the state (which necessarily leads to the emergence of market surpluses and/or
shortage), we conclude that this aspect of economic freedom is crucial for economic prosperity
and free market. Price stability and its role in achieving economic growth and development, that
is, the negative impact of inflation on economic progress, has been confirmed in numerous
theoretical and empirical literature (Fischer, 1993; Barro, 1995; Gomme, 1993; Gylfason &
Herbertsson, 2001). In order to achieve this objective, the European Union is striving to form a
monetary union of all Member States and to implement a single monetary policy by the
European Central Bank. Although there are conflicting opinions about the justification for the
existence of European Monetary Union (eg Soros, 1996; Jossa, 1996; Dornbusch, 1996), our
research supports the benefits provided by such an economic space. However, we emphasize that
the above conclusions about the impact of monetary freedom on economic growth are relevant
solely in the context of all other elements of economic freedom, as well as other traditional
macroeconomic factors in the model. In other words, our study did not establish a correlation
between economic growth and monetary freedom in a selected sample of countries when looking
at their direct relationship, that is, only in the panel analysis conducted, in the presence of all
other factors that ensure the existence of economic freedom in general, as well as factors
important for economic growth, this aspect contributes to economic prosperity.
A negative sign is recorded in the relationship between Investment freedom and
economic growth. Such a sign does not mean that investments reflect negatively on GDP growth,
but what constitutes Investment freedom, according to the view of the Heritage Foundation,
contributes negatively to economic growth in a selected sample of countries. Not only is equal
treatment of foreign and domestic investments often present, but foreign investors get higher
benefits than domestic ones. This creates large expenditures in the budget for the purpose of
The relationship between economic freedom and economic growth in EU countries
Ivana Brkić
158
attracting foreign investors (subsidizing jobs, etc.), which can neutralize or surpass the positive
effects of foreign investment on economic growth. The fact is that foreign capital looks for low
costs, which means exploitation of labor and natural resources in countries where laws are not
clearly defined in order to protect them, which also has negative effects on the economic
situation of the host country. It is also the practice that most foreign capital transfers its profits
made in the country to its parent companies, thus eliminating the most significant contribution to
economic growth.
Other components of economic freedom in the sample of observed countries did not
show statistically significant results on the examined link with economic growth. These results
were also reported by some of the other authors shown in Table 31. The robustness of the results
obtained should be tested using a different research method and/or in the presence of other
control variables, which is planned for future research.
5.4. DISCUSSION OF THE RESULTS OF PANEL ANALYSIS ON THE IMPACT OF
CHANGE OF ECONOMIC FREEDOM ON ECONOMIC GROWTH IN THE EU
COUNTRIES
According to the results of the survey, it was shown that a change of economic freedom
has a statistically significant impact on economic growth in EU countries. With this knowledge,
General Hypothesis 2 - Change of economic freedom has a positive impact on economic
growth in EU countries – is CONFIRMED.
Although numerous studies have proved the positive impact of the level of economic
freedom on economic growth (most notable among them being Carlsson and Lundström (2002),
Cole (2003), Justesen (2008) and others), the results of the research that show that change of the
level of economic freedom is significantly related to growth (while the level is not) have also
been noted. Among the most relevant authors who have presented such scientific contributions
are De Haan & Siermann (1998), Gwartney, Lawson & Holcombe (1999), De Haan & Sturm
(2000, 2001), Pitlik (2002) and Sturm et al. (2002), Doucouliagos & Ulubasoglu (2006), Aixalá
& Fabro (2009), Adkins et al. (2002) and Wu (2011).
The relationship between economic freedom and economic growth in EU countries
Ivana Brkić
159
What may be one of the explanations of the results obtained is that both sizes are of
dynamic character (as opposed to comparing the relation between the level of economic freedom
and change - economic growth), and that based on that the recognized relationship is a linear,
statistically significant, positive relationship. In future research, the aim is to validate the results
obtained by constructing a different one and to establish the robustness of the results obtained.
We can also agree with the views of other authors who have come to the conclusion that earlier
changes have significant effects on the growth rate precisely due to the fact that it takes some
time for changes in institutional structures to lead to changes in economic indicators (Gwartney
at all. 1999; Gwartney & Lawson, 2004).
5.5. MAIN CONCLUSIONS OF THE RESEARCH
In the context of survival on the world market, the European Union needs to find an
economic model that will keep it competitive. The European standard of living expressed as a
per capita gross domestic product is still lower than that of the United States (Balcerowicz,
Łaszk, Rzońca & Kalina, 2013). The Chinese economy has been experiencing explosive growth
over the last three decades. The global economic crisis, the rising unemployment rates, the "euro
crisis", migration, Brexit, are all challenges the European Union must find the answer to and take
appropriate action. Although there is no social consensus as to which direction and which
instruments should be used to address these issues, in the dissertation we have asked whether
economic freedom is a factor that can stimulate growth and development of an economy in a
particular geo-economic area - specifically the European Union as well as whether the indicator
of the presence of economic freedom is also an indicator of economic progress of a particular
area. The research was conducted in order to determine whether policies and institutions that
favor and promote economic freedom have justification and evidence for that on the example of
economic growth. Specifically, in the dissertation we addressed the question of whether
economic freedom and exactly which of its components affect the enlargement of the European
Union economy, providing empirical evidence through a panel analysis, looking at data on
economic freedom and economic growth over the past twenty-five years (from 1994 to 2018).
For this purpose, the dissertation uses an indicator of economic freedom, created by the Heritage
Foundation, which publishes a report on the state of economic freedom in the world every year
The relationship between economic freedom and economic growth in EU countries
Ivana Brkić
160
in collaboration with the Wall Street Journal. Their index is made up of ten (or twelve) equal
components that make up the global index. Elements of economic freedom observe the
protection of property rights within individual countries, the presence of corruption in all sectors
of society, the size of public spending, the tax burden on the economy and citizens, ease of doing
business in the country concerned, as well as flexibility in the labor market, price stability,
international trade, the presence of foreign investment, development of financial markets and
many other parameters of economic liberalism of the categories described.
Numerous studies have dealt with this and related matter, that is, identifying economic
freedom as a factor of economic growth. Although many of the authors of these studies have
come to the conclusion that all or some forms of economic freedom have a stake in stimulating
economic growth and/or other parameters of economic progress, such views are not unified. In
this respect, we wanted to contribute to science and investigate whether and what components of
economic freedom represent, cause and/or influence economic progress.
Consistent with the current knowledge on this topic presented within the theoretical part
of the dissertation, we have found that the level of economic freedom is not, but that the change
in the level is an indicator of economic growth, and thus confirmed certain hypotheses raised in
the dissertation. Yet, no study is capable of resolving theoretical debates on a topic, nor can it in
itself provide compelling empirical evidence on research questions. Thus, the obtained evidence
in our research should be interpreted taking into account the sample, methods and availability of
data, which may have influenced the results obtained.
The panel analysis proved the positive impact of the change of economic freedom on
economic growth in the countries of the European Union, thus confirming general hypothesis 2.
The panel model identified those and elements of economic freedom that contribute most to
economic growth (which confirmed special hypothesis 1). This primarily refers to the element of
Monetary freedom. However, this aspect of economic freedom showed the given influence only
in the context/presence of all other elements of economic freedom. Since economic freedom is a
comprehensive indicator, as a display of the synergy of all its constituent elements, the
importance in macroeconomic policy making must be attributed to other categories as well. The
The relationship between economic freedom and economic growth in EU countries
Ivana Brkić
161
efficiency of the justice system forms the platform of every regulated society. It is crucial for the
functioning of the economy because it enables the protection of basic property rights as the
foundation of capitalist society. If private property is secured from all forms of abuse, individuals
have interests and motives to fight for their property and make a profit on that basis, thus causing
economic growth. Heavy bureaucracy and extensive procedures in all aspects of business are a
source of corruption. They stifle the entrepreneurial spirit, curb business ventures and risks, and
dull the economy. The ease of doing business is also reflected in the labor market. Effective
management of public finances and fiscal discipline is a compulsory task for the creators and
implementers of economic policy of governments of all EU countries. Trade freedom had to find
a place in the factors that explain economic growth. The very membership in the European
Union implies the existence of a customs union and ensures the existence of free trade. Money
creates money, so the imperative of economic growth in the EU is Financial freedom embodied
in a diversified financial market, with a myriad of models and tools to finance business
opportunities. Without fiscal discipline, there is no rational public spending, without the rule of
law and the ease of conducting business processes, it is impossible to make and realize
investments, and price stability, formed by the market, is an attribute of any economically sound
society.
Regardless of the specification of the model, the control variables show the expected
results in the sense that Gross capital formation has a positive, statistically significant impact on
economic growth, as well as the aspect of Trade (% of GDP). Surprisingly, foreign direct
investment did not document the significance to growth in our sample of countries, although
there is research to substantiate these results (e.g. Ericsson & Irandoust, 2001; Azman-Saini,
Baharumshah & Law, 2010).
Finally, we conclude that economic freedom does not show statistical significance in
relation to economic growth (percentage change in GDP per capita) in EU countries, but that
change of economic freedom does have impact, thus concluding that economic liberalization, as
the main motive and goal of the European Union as a political - economic community, serves to
achieve better economic well - being of its population and that the macroeconomic course should
be pursued in that direction. In addition to the above, it is important to point out that the aspect of
The relationship between economic freedom and economic growth in EU countries
Ivana Brkić
162
Monetary freedom, like in numerous other studies, has a significant positive impact on economic
growth in our sample of countries, and that achieving price stability and the absence of inflation
as well as price control (through the formation of a monetary union of all EU Member States) is
recommended if economic progress is to be made.
Although all of these results represent an original contribution to science and practice, as
they are among the first to show the relationship between economic freedom and economic
growth within the European Union, their interpretation should take into account the fact that they
cannot be applied universally or in every Member State of the European Union.
Economic freedom implies perfection for it to exist. As part of the research, we tried to
determine if it is also a way to achieve a prototype of general economic well-being. We have
explored the question of whether economic freedom is an ideology that favors economic growth,
or there is real evidence to propagate it. On the basis of all the above, we believe that the
decision on economic liberalization as opposed to state intervention should not be exclusive.
Dogma for or against state intervention versus economic freedom is not appropriate. Ideal
economic governance should not be judged based on the level of the presence of state
intervention, but on the basis of its effectiveness reflected in economic prosperity and growth in
the quality of life of all individuals. The decision on whether to “liberate” the market or place
things under the patronage of the state should be made on the basis of the universal well-being of
all citizens, which is reflected not only in economic growth but also in other parameters of social
well-being, which will be the focus of the author's attention in future research.
5.6. LIMITATIONS AND FUTURE LINE OF RESEARCH
The results obtained in the dissertation are certainly significant, but they also raise new
questions that need to be raised and dilemmas that need to be addressed in future research.
According to the conclusions in the dissertation, the following areas of study are suggested for
further research:

The relationship between economic freedom and economic growth in EU countries
Ivana Brkić
163
In order to determine the value of the results obtained in this research, it is necessary to
repeat the study on the same sample after a certain period of time, and include a longer
period of time and to make comparisons in order to establish or refute the consistency of
the observed relationships.
It is recommended to carry out the same research (with the same time period and sample
of countries) but with the help of other quantitative methods of analysis, and to compare
and determine the robustness of the results obtained.
It would be important to analyze the same characteristics (sample, period, method) but
apply different control variables, or perform a different specification of the model.
It is also of interest to investigate the link between economic freedom and economic
growth within clusters within EU countries.
It would be useful to repeat the research using another leading indicator of economic
freedom produced by the Fraser Institute and, on that basis, to test the hypotheses given
and confirmed/refuted in this dissertation.
As the subject of the research was to determine the relationship between economic
freedom and the economic progress of the European Union, it would be advantageous to
examine such relations within other economic and political groups of countries. Based on
the obtained results, it would be possible to find similarities and differences between
these regions, and to identify which area with its specificities is most determined by
economic freedom and its impact on economic growth.
Since numerous studies have dealt with the analysis of the impact of economic freedom
on economic inequality across different country samples (Scully, 2002; Madan, 2002;
Graeff & Mehlkop, 2006; Carter, 2007; Ashby & Sobel, 2008; Bergh & Nilsson, 2008).
2010; Bennett & Vedder, 2012; Apergis, Dincer & Payne, 2014; Pérez-Moreno &
Angulo-Guerrero, 2016; Bennett & Nikolaev, 2016), it would be advisable to do the same

The relationship between economic freedom and economic growth in EU countries
Ivana Brkić
164
research on a sample of European Union countries, or on its particular cluster and to
compare the results with the findings from the above studies.
Many studies have addressed the relationship and impact of economic freedom on other
macroeconomic indicators - investment (among others Dawson, 2003; Justesen, 2008;
Aixalá & Fabro, 2009; Ali & Crain, 2001; Bengoa & Sanchez-Robles, 2003; Nasir &
Hassan, 2011), productivity (e.g., Pääkkönen, 2009; Alexandrakis & Livanis, 2013; Erdal
& Yenipazarli, 2013), GDP level (Islam, 1996; Akin et al., 2014; Cebula, 2011, 2013;
Cebula et al., 2013; Cebula & Clark, 2014; N'Zue, 2010; Gorlach & Le Roux, 2013;
Ossono, 2012; Haydaroglu, 2016; Türedi, 2013), unemployment (Grubel, 1998; Bennett,
2016) and others. Accordingly, it is important to perform analysis of the given relations
on the sample of the countries of the European Union or its selected area, in the future
modeled on the studies mentioned above.
Some authors have put economic freedom in relation to other indices – the Human
Development Index (Madan, 2002; Grubel; 1998; Vukotić & Baćović, 2006, and others),
the Lifetime Index (Esposto & Zaleski, 1999; Madan, 2002; Norton. 2003), the Poverty
Index (Norton, 2003) and others. The suggestion for the future research is to determine
the relationships between the Index of Economic Freedom of the Heritage Foundation
with these and other indices that measure human and social development within the EU
Member States.
The most important research for Spain, as well as the makers of its macroeconomic
policy, would be to identify the elements of economic freedom that contribute to Spain's
economic growth and development as a member state of the European Union.

The relationship between economic freedom and economic growth in EU countries
Ivana Brkić
165
REFERENCES
1. Acemoglu, D., Johnson, S., & Robinson, J. A. (2001). The Colonial Origins of Comparative
Development: An Empirical Investigation. The American Economic Review 91(5), 1369-
1401.
2. Acemoglu, D., Johnson, S., & Robinson, J. A. (2002). Reversal of fortune: Geography and
institutions in the making of the modern world income distribution. The Quarterly journal of
economics, 117(4), 1231-1294.
3. Acemoglu, D., Johnson, S. & Robinson, J.A. (2005). Institutions as the Fundamental Cause
of Long-Run Growth. In Philippe Aghion and Steven N. Durlauf, eds, Handbook of
Economic Growth: Volume Ia (Elsevier): 385–472.
4. Ahmadpour, М., JafariSamimi, А. & Refaei, Р. (2013). Economic freedom and economic
growth: the case of OPEC. Journal of Human and Social Science Research. 1(1), 63-71.
5. Aixalá, J., & Fabro, G. (2009). Economic freedom, civil liberties, political rights and
growth: a causality analysis. Spanish Economic Review, 11(3), 165-178.
6. Akin, C. S., Aytun, C., & Aktakas, B. G. (2014). The impact of economic freedom upon
economic growth: an application on different income groups. Asian Economic and Financial
Review, 4(8), 1024 -1039.
7. Alexandrakis, C., & Livanis, G. (2013). Economic Freedom and Economic Performance in
Latin America: A Panel Data Analysis. Review of Development Economics, 17(1), 34-48.
8. Ali, A. M., & Crain, W. M. (2002). Institutional distortions, economic freedom, and growth.
The Cato Journal, 21(3), 415-427.
9. Altay, A. P. D. H., & Çelebioğlu, A. P. D. F. (2011). Spatial Analysis of Relations Among
Democracy, Economic Freedom and Economik Growth: A Research On The European
Countries. Süleyman Demirel Üniversitesi İktisadi ve İdari Bilimler Fakültesi Dergisi, 16(2),
199-234.
10. Andrews, D. W. K. (1991). Heteroskedasticity and Autocorrelation Consistent Covariance
Matrix Estimation. Econometrica, 59(3), 817-858.
11. Ang, J.B. (2010). Finance and inequality: the case of India. South Econ J 76(3): 738–761.
The relationship between economic freedom and economic growth in EU countries
Ivana Brkić
166
12. Apergis, N., Dincer, O., & Payne, J. E. (2014). Economic freedom and income inequality
revisited: Evidence from a panel error correction model. Contemporary Economic Policy,
32(1), 67-75.
13. Armey, R. K. (1995). The Freedom Revolution: The New Republican House Majority
Leader Tells Why Big Government Failed, Why Freedom Works, and How We Will Rebuild
America. Washington: Regnery Publishing.
14. Ashby, N. J., & Sobel, R. S. (2008). Income inequality and economic freedom in the US
states. Public Choice, 134(3-4), 329-346.
15. Ayal, E. B., & Karras, G. (1998). Components of economic freedom and growth: an
empirical study. The Journal of Developing Areas, 32(3), 327-338.
16. Azman-Saini, W. N. W., Baharumshah, A. Z., & Law, S. H. (2010). Foreign direct
investment, economic freedom and economic growth: International evidence. Economic
Modelling, 27(5), 1079-1089.
17. Balcerowicz, L., Łaszk, A., Rzońca, A., & Kalina, L. (2013). Economic growth in the
European Union. Brussels: Lisbon Council.
18. Barro, R. J. (1991). Economic growth in a cross section of countries. Quarterly Journal of
Economics, 106(2), 407–443.
19. Barro, R. J. (1996). Democracy and growth. Journal of economic growth, 1(1), 1-27.
20. Barro, R. Ј. (1995). Inflation and economic growth (NBER Working Paper No:5326),
Cambridge MA, National Bureau of Economic Research.
21. Bayar, Y. (2016). Impact of Openness and Economic Freedom on Economic Growth in the
Transition Economies of the European Union. South-Eastern Europe Journal of Economics,
14(1), 7-19.
22. Bayar, Y., & Aytemiz, L. (2015). Impact of economic freedom, political stability and
economic growth in the USA on emerging Asian economies. Actual problems of economics,
6 (168), 62-73.
23. Bengoa, M., & Sanchez-Robles, B. (2003). Foreign direct investment, economic freedom
and growth: new evidence from Latin America. European journal of political economy,
19(3), 529-545.
24. Bennet, D. L. (2016). Subnational Economic Freedom and Performance in the United States
and Canada. Cato Journal, 36(1), 165-185.
The relationship between economic freedom and economic growth in EU countries
Ivana Brkić
167
25. Bennett, D. L., & Nikolaev, B. (2017). On the ambiguous economic freedom–inequality
relationship. Empirical Economics, 53(2), 717-754.
26. Bennett, D. L., & Vedder, R. K. (2013). A dynamic analysis of economic freedom and
income inequality in the 50 US states: Empirical evidence of a parabolic relationship.
Journal of Regional Analysis & Policy, 43(1), 42-55.
27. Bergh, A., & Nilsson, T. (2010). Do liberalization and globalization increase income
inequality?. European Journal of political economy, 26(4), 488-505.
28. Berlin, I. (1992). Dva koncepta svobode. In Rosanvallon Pierre, (ed.): Zbornik sodobni
liberalizem, Ljubljana: Studia Humanitatis, 69-89.
29. Besley, T. (1995). Property rights and investment incentives: Theory and evidence from
Ghana. Journal of political Economy, 103(5), 903-937.
30. Best, H., & Wolf, C. (2015). The Sage handbook of regression analysis and causal inference.
31. Borović, Z. (2014, b). Does economic freedom impact economic growth: Evidence from two
Western Balkan countries. Industrija, 42(2), 57-70.
32. Borović, Z. (2014, а). Does Economic Freedom impact Economic growth: Decomposing the
Effects for Bosnia and Herzegovina. Acta Economica, 12 (21), 9-20.
33. Breusch, T. S. & Pagan, A. R. (1979). A simple test for heteroscedasticity and random
coefficient variation. Econometrica: Journal of the Econometric Society, 1287-1294.
34. Carlsson, F., & Lundström, S. (2002). Economic freedom and growth: Decomposing the
effects. Public choice, 112 (3-4), 335-344.
35. Carter, J. R. (2007). An empirical note on economic freedom and income inequality. Public
Choice, 130(1-2), 163-177.
36. Cass, D. (1965). Optimum growth in an aggregative model of capital accumulation. The
Review of economic studies, 32(3), 233-240.
37. Cebula, R. J. (2011). Economic growth, ten forms of economic freedom, and political
stability: An empirical study using panel data, 2003-2007. Journal of Private Enterprise,
26(2), 61-81.
38. Cebula, R. J. (2013). Which economic freedoms influence per capita real income?. Applied
Economics Letters, 20(4), 368-372.
The relationship between economic freedom and economic growth in EU countries
Ivana Brkić
168
39. Cebula, R. J., & Clark, J. R. (2014). The effects of economic freedom, regulatory quality and
taxation on the level of per capita real income: a preliminary analysis for OECD nations and
non-G8 OECD nations. Applied Economics, 46(31), 3836-3848.
40. Cebula, R. J., & Mixon Jr, F. G. (2012). The impact of fiscal and other economic freedoms
on economic growth: An empirical analysis. International Advances in Economic Research,
18(2), 139-149.
41. Cebula, R. J., & Mixon, F. G. (2014). The roles of economic freedom and regulatory quality
in creating a favorable environment for investment in energy R&D, infrastructure, and
capacity. American Journal of Economics and Sociology, 73(2), 299-324.
42. Cebula, R. J., Clark, J. R., & Mixon Jr, F. G. (2013). The Impact of Economic Freedom on
Per Capita Real GDP: A Study of OECD Nations. Journal of Regional Analysis and Policy,
43(1100-2016-90109), 34-41.
43. Chu, Y. P., & Kong, T. Y. (2009). The impact of the political liberalization-economic
freedom nexus on economic growth, 1970-2000. Applied Econometrics and International
Development, 9(2), 21-30.
44. Clark, B. S. (1998). Political Economy: A Comparative Approach. Greenwood Publishing
Group.
45. Cole, J. H. (2003). The contribution of economic freedom to world economic growth, 1980-
99. The Cato Journal, 23(2), 189-199.
46. Cole, J. H., & Lawson, R. A. (2007). Handling economic freedom in growth regressions:
Suggestions for clarification. Econ Journal Watch, 4(1), 71-78.
47. Compton, R. A., Giedeman, D. C., & Hoover, G. A. (2011). Panel evidence on economic
freedom and growth in the United States. European Journal of Political Economy, 27(3),
423-435.
48. Dawson, J. W. (1998). Institutions, Investment, and Growth: New Cross‐country and Panel
Data Evidence. Economic inquiry, 36(4), 603-619.
49. Dawson, J.W. (2003). Causality in the freedom-growth relationship. European Journal of
Political Economy, 19(3), 479-495.
50. De Haan, J. (2003). Economic freedom: editor's introduction. European Journal of Political
Economy, 19(3), 395-403.

The relationship between economic freedom and economic growth in EU countries
Ivana Brkić
169
51. De Haan, J., & Siermann, C. L. (1998). Further evidence on the relationship between
economic freedom and economic growth. Public choice, 95(3-4), 363-380.
52. De Haan, J., & Sturm, J. E. (2000). On the relationship between economic freedom and
economic growth. European Journal of Political Economy, 16(2), 215-241.
53. De Haan, J., & Sturm, J. E. (2006). How to handle economic freedom: Reply to Lawson.
Econ Journal Watch, 3(3), 407-411.
54. De Haan, J., & Sturm, J. E. (2007). Handling economic freedom in growth regressions: A
reply to Cole and Lawson. Economic Journal Watch, 4(1), 79-82.
55. De Haan, J., & Sturm, J.E. (2003). Does more democracy lead to greater economic freedom?
New evidence for developing countries. European Journal of Political Economy, 19(3),
547–563.
56. De Haan, J., Lundström, S., & Sturm, J. E. (2006). Market‐oriented institutions and policies
and economic growth: A critical survey. Journal of Economic Surveys, 20(2), 157-191.
57. Diamond, J. (1997). Guns, Germs, and Steel. New York: W.W. Norton.
58. Dornbusch, R. (1996). Euro fantasies. Foreign Affairs, 75(5), 110-124.
59. Doucouliagos, C. (2005). Publication bias in the economic freedom and economic growth
literature. Journal of Economic Surveys, 19(3), 367-387.
60. Doucouliagos, C., & Ulubasoglu, M. A. (2006). Economic freedom and economic growth:
Does specification make a difference?. European Journal of Political Economy, 22 (1), 60-
81.
61. Easton, S. T., & Walker, M. (1992). Rating global economic freedom. Vancouver: The
Fraser Institute.
62. Erdal, F. (2004). Economic Freedom and Economic Growth: A time series evidence from
Italian economy. Available at: https://www.etsg.org/ETSG2004/Papers/erdal.pdf
[04.06.2019.].
63. Erdal, F., & Yenipazarli, A. (2013). Which economic freedoms contribute income per capita?
Are results sensitive to the indicators and the estimation methods?. Emerging Markets
Finance and Trade, 49(5), 130-147.
64. Ericsson, J. & Irandoust, J. E. M. (2001). On the causality between foreign direct investment
and output: a comparative study. The International Trade Journal, 15(1), 1-26.
The relationship between economic freedom and economic growth in EU countries
Ivana Brkić
170
65. Esposto, A. G., & Zaleski, P. A. (1999). Economic freedom and the quality of life: an
empirical analysis. Constitutional political economy, 10(2), 185-197.
66. Farr, W., Lord, R. A., & Wolfenbarger, J. L. (1998). Economic freedom, political freedom,
and economic well-being: a causality analysis. Cato Јоurnal, 18(2), 247- 262.
67. Fischer, S. (1993). The role of macroeconomic factors in growth. Journal of monetary
economics, 32(3), 485-512.
68. Friedman, M. (1962). Capitalism and freedom. University of Chicago press.
69. Friedman, M. (1988). A Statistical Note on the Gastil-Wright Survey of Freedom. In M.A.
Walker (ed.) Freedom, Democracy and Economic Welfare. Vancouver: The Fraser Institute.
70. Friedman, M., Friedman R. (1980). Free to choose. Harcourt, San Diego, California, USA.
71. Frye, T., & Shleifer, A. (1996). The invisible hand and the grabbing hand (No. w5856).
National Bureau of Economic Research.
72. Gallup, J. L., Sachs, J. D., & Mellinger, A. D. (1999). Geography and economic
development. International regional science review, 22(2), 179-232.
73. Gangl, M. (2010). Causal Inference in Sociological Research. Annual Review of Sociology,
36, 21-47.
74. Gastil, R.D. (1984). Freedom in the World: Political Rights and Civil Liberties, 1983-1984.
New York: Freedom House.
75. Gomme, P. (1993). Money and growth revisited: Measuring the costs of inflation in an
endogenous growth model. Journal of Monetary economics, 32(1), 51-77.
76. Gorlach, V. (2011). An econometric analysis of the impact of economic freedom on economic
growth in the SADC. Doctoral dissertation, Sciences of the Nelson Mandela Metropolitan
University.
77. Gorlach, V. I., & Le Roux, P. (2015) The impact of economic freedom on economic growth
in the SADC: an individual component analysis. Studies in Economics and Econometrics,
39(2), 41-61.
78. Graeff, P., & Mehlkop, G. (2006). Excavating a Force that Drives Income Inequality–
Rethinking and Analyzing the Link between Military Participation Ratio and Inequality.
Journal of Political and Military Sociology, 34(2), 257-279.
79. Granger, C. W. (1969). Investigating causal relations by econometric models and cross-
spectral methods. Econometrica: Journal of the Econometric Society, 37(3), 424-438.
The relationship between economic freedom and economic growth in EU countries
Ivana Brkić
171
80. Greene, W. H. (2008). Econometric Analysis, 6th ed. Upper Saddle River, NJ: Prentice Hall.
81. Grubel, H. (1998). Economic freedom and human welfare: Some empirical evidence. Cato
Journal, 18(2), 287–304.
82. Gwartney, J. & Lawson, R. (2001). Economic Freedom of theWorld: 2001 Annual Report.
Vancouver: The Fraser Institute.
83. Gwartney, J. & Lawson, R. (2004). Economic Freedom of the World. Annual Report 2004.
Vancouver: The Fraser Institute.
84. Gwartney, J. & Lawson, R. (2007). Economic Freedom of theWorld: 2007 Annual Report.
Vancouver: The Fraser Institute.
85. Gwartney, J. & Lawson, R., Hall, J. (2012). Economic freedom of the world 2012 annual
report. Vancouver: The Fraser Institute.
86. Gwartney, J. Hall, J. & Lawson. (2010). Economic freedom of the world 2010 annual report.
Vancouver: The Fraser Institute..
87. Gwartney, J., Holcombe, R. G., & Lawson, R. A. (2004). Economic freedom, institutional
quality, and cross-country differences in income and growth. Cato Journal, 24, 205–233.
88. Gwartney, J., Holcombe, R. G., & Lawson, R. A. (2006). Institutions and the Impact of
Investment on Growth. Kyklos, 59(2), 255-273.
89. Gwartney, J., Lawson R. & Samida, D. (2000). Economic Freedom of the World: 2000
Annual Report. Vancouver: The Fraser Institute.
90. Gwartney, J., Lawson, R. A., & Holcombe, R. G. (1999). Economic Freedom and the
Environment for Economic Growth. Journal of Institutional and Theoretical Economics
(JITE), 155(4), 643-643.
91. Gwartney, J., Lawson, R., & Block, W. (1996). Economic freedom of the world, 1975-1995.
Vancouver: The Fraser Institute.
92. Gwartney, J., Lawson, R., & Hall, J. (2015). 2015 Economic Freedom Dataset, published in
Economic Freedom of the World: 2015 Annual Report. Vancouver: The Fraser Institute.
93. Gwartney, J., Lawson, R., & Norton, S. (2008). Economic freedom of the world 2008 annual
report. Vancouver: The Fraser Institute.
94. Gylfason, T., & Herbertsson, T. T. (2001). Does inflation matter for growth?. Japan and the
world economy, 13(4), 405-428.

The relationship between economic freedom and economic growth in EU countries
Ivana Brkić
172
95. Hall, J. C., & Lawson, R. A. (2014). Economic freedom of the world: An accounting of the
literature. Contemporary Economic Policy, 32(1), 1-19.
96. Hall, J., Lawson, R., & Wogsland, R. (2011). The European Union and economic freedom.
Global Economy Journal, 11(3), 1-14.
97. Hall, R. E., & Jones, C. I. (1997). Levels of Economic Activity Across Countries. American
Economic Review 87 (2), 173–77.
98. Hall, R. E., & Jones, C. I. (1999). Why do some countries produce so much more output per
worker than others?. The quarterly journal of economics, 114(1), 83-116.
99. Hanke, S. H., & Walters, S. J. (1997). Economic freedom, prosperity, and equality: A survey.
Cato Journal, 17(2), 117-146.
100. Haydaroglu, C. (2016). The Effect of Foreign Direct Investment and Economic Freedom
on Economic Growth: The Case of BRICS Countries. Research in World Economy, 7(1), 1-
10.
101. Hayek, F. (1943). The Road to Serfdom, Chicago: University of Chicago Press.
102. Heckelman, J. C. (2000). Economic freedom and economic growth: A short-run causal
investigation. Journal of Applied Economics, 3(1), 71-91.
103. Heckelman, J. C., & Stroup, M. D. (2000). Whcich Economic Freedoms Contribute to
Growth?. Kyklos, 53(4), 527-544.
104. Ho, C. S. (2020). Economic freedom, macroeconomic fundamentals and foreign direct
investment in fast emerging BRICS and Malaysia. International Journal of Banking and
Finance, 10(1), 57-73.
105. Hoechle, D. (2007). Robust standard errors for panel regressions with cross-sectional
dependence. The stata journal, 7(3), 281-312.
106. Honaker, J., King, G., & Blackwell, M. (2011). Amelia II: A program for missing data.
Journal of statistical software, 45(7), 1-47.
107. Hristova, K. D. (2012). Does economic freedom determine economic growth? A
discussion of the Heritage Foundation’s Index of Economic Freedom. Doctoral dissertation,
Mount Holyoke College.
108. Islam, S. & Salimullah, A. (2006). Effects of Private Investment, Economic Freedom and
Openness on Economic Growth: LDC Experience. Asian Affairs, 28(1), 46-68.

The relationship between economic freedom and economic growth in EU countries
Ivana Brkić
173
109. Islam, S. (1996). Economic freedom, per capita income and economic growth. Applied
Economics Letters, 3(9), 595-597.
110. Johansen, S. (1988). Statistical analysis of cointegration vectors. Journal of economic
dynamics and control, 12(2), 231-254.
111. Jossa, B. (1996). Is European Monetary Union Impossible?. Review of Economic
Conditions in Italy, 7(1), 251-265.
112. Justesen, M. K. (2008). The effect of economic freedom on growth revisited: New
evidence on causality from a panel of countries 1970–1999. European Journal of Political
Economy, 24(3), 642-660.
113. Kapás, J., & Czeglédi, P. (2007). Economic freedom: theory first, empiricism after.
International Centre for Economic Research, 1-26.
114. Karabegović, A., & McMahon, F. (2005). Economic Freedom of North America. 2005
Annual Report, The Frasier Institute, Vancouver.
115. Karabegovic, A., Samida, D., Schlegel, C. M., & McMahon, F. (2003). North American
economic freedom: an index of 10 Canadian provinces and 50 US states. European Journal
of Political Economy, 19(3), 431-452.
116. Keefer, P., & Knack, S. (1997). Why don't poor countries catch up? A cross‐national test
of an institutional explanation. Economic inquiry, 35(3), 590-602.
117. Kešeljević, A. (2007). Indexes of economic freedom–An outline and open issues.
Proceedings of Rijeka Faculty of Economics: Journal of Economics and Business, 25(2),
223-243.
118. Kešeljević, A. (2013). Global distribution and dynamics of economic freedom: Non-
parametric approach. Economic Modelling, 100 (33), 560-571.
119. Khan, M. Z. S. (2012). Examining Friedman hypothesis on political, civil and economic
freedom for SAARC countries: a dynamic panel data analysis. Journal of Economic
Development, 37(3), 107-127.
120. Kim, D. H., Lin, S. C., & Suen, Y. B. (2011). Nonlinearity between trade openness and
economic development. Review of Development Economics, 15(2), 279-292.
121. Knack, S. (1996). Institutions and the convergence hypothesis: The cross-national
evidence. Public Choice, 87(3-4), 207-228.
122. Knack, S. F. (2003). Democracy, governance, and growth. University of Michigan Press.
The relationship between economic freedom and economic growth in EU countries
Ivana Brkić
174
123. Knack, S., & Keefer, P. (1995). Institutions and economic performance: cross‐country
tests using alternative institutional measures. Economics & Politics, 7(3), 207-227.
124. Knight, M., Loayza, N., & Villanueva, D. (1993). Testing the neoclassical theory of
economic growth: a panel data approach. Staff papers, 40(3), 512-541.
125. Koopmans, T. (1965). On the concept of optimal growth, The Econometric Approach to
Development Planning. Econometric approach to development planning, 1st edn. North
Holland, Amsterdam, 225-287.
126. Kormendi, R.C. & Meguire, P.G. (1985). Macroeconomic determinants of growth: cross-
country evidence. Journal of Monetary Economics, 16(2), 141–163.
127. Kovačević, S., & Borović, Z. (2014). Economic freedom and economic performance in
former socialist countries-panel approach. Proceedings of the Faculty of
Economics in East Sarajevo, 1(9), 19-26.
128. Landes, D. S. (1998). The Wealth and Poverty of Nations: Why Some Are So Rich, and
Some So Poor. New York: W.W. Norton.
129. Lawson, R. A. (2006). On testing the connection between economic freedom and growth.
Econ Journal Watch, 3(3), 398-406.
130. Levente, N. (2015). How Does Economic Freedom Influence The Relationship Between
Government Size And Convergence?. Annals of Faculty of Economics, 1(1), 623-630.
131. Levine, R., & Renelt, D. (1992). A sensitivity analysis of cross-country growth
regressions. The American economic review, 82(4), 942-963.
132. Lewis, W. A. (1955). Theory of economic growth. NY: Routledge, (2013).
133. Locke, J. (1690). Of Civil Government. NY: E. P. Dutton, (1942).
134. Lucas, R. E. (1988). On the mechanics of economic development. Journal of monetary
economics, 22(1), 3-42.
135. Maassen, G. H., & Bakker, A. B. (2001). Suppressor variables in path models:
Definitions and interpretations. Sociological Methods & Research, 30(2), 241-270.
136. Madan, A. (2002). The Relationship between Economic Freedom and Socio-Economic
Development. University Avenue Undergraduate Journal of Economics, 7(1), 1-59.
137. Mahmood, K., Azid, T., Chaudhry, I. S., & Faridi, M. Z. (2010). Impact of economic
freedom on economic growth: the case of some selected SAARC member countries.
International Research Journal of Finance and Economics, 52(1), 7-16.
The relationship between economic freedom and economic growth in EU countries
Ivana Brkić
175
138. Malthus, T. R. (1820). Principles of Political and the political processes accountable for
their Economy, New York: W. Pickering, (1986).
139. Mankiw, N. G., Romer, D., & Weil, D. N. (1992). A contribution to the empirics of
economic growth. The quarterly journal of economics, 107(2), 407-437.
140. Marjanović, G. (2010). Uticaj ekonomske krize na glavni tok ekonomske misli.
Ekonomski horizonti, 12(2), 5-20.
141. Mauro, P. (1995). Corruption and growth. The quarterly journal of economics, 110 (3),
681-712.
142. Medović, V. (2018). Pojmovnik EU. Beograd: Delegacija Evropske unije u Republici
Srbiji.
143. Messick, R.E., ed. (1996). World Survey of Economic Freedom, 1995-1996. New
Brunswick: Freedom House and Transaction Publishers.
144. Mill, Ј.С. (1956). On liberty. NY: Macmillan Publishing Company.
145. Miller, T. & Kim, B. A. (2016). 2016 Index of Economic Freedom. Washington: The
Heritage Foundation and Dow Jones & Company, Inc.
146. Miller, T., & Kim, A. B. (2013). Defining economic freedom. In Miller, T., Holmes, K.
R., Feulner, E. J., (eds). 2013 Index of Economic Freedom, 87-94, New York: Heritage
Foundation, Washington, DC and Wall Street Journal.
147. Miller, T., & Kim, A. B. (2017). 2017 Index of Economic Freedom. Washington: The
Heritage Foundation.
148. Miller, T., Kim, A. B, & Holmes, K. (2015). Index of Economic Freedom: Promoting
economic opportunity and prosperity. Washington: The Heritage Foundation and Dow Jones
& Company, Inc.
149. Miller, T., Kim, A. B. & Roberts, J. M. (2019). 2019 Index of Economic Freedom.
Washington: The Heritage Foundation.
150. N’Zue, F. F. (2011). Economic freedom and performance in ECOWAS countries: A
dynamic panel data approach. Africa Journal of Economic Policy, 18(2), 28-53.
151. Nasir, Z., & Hassan, A. (2011). Economic Freedom, Exchange Rates Stability and FDI in
South Asia. The Pakistan Development Review, 50(4), 423-433.
152. North D.C. (1988). Institution, Economic Growth and Freedom: An Historical
Introduction, Freedom, Democracy and Economic Welfare, Vancouver: Fraser Institute.

The relationship between economic freedom and economic growth in EU countries
Ivana Brkić
176
153. North, D. C. & Thomas, R. P. (1973). The rise of the western world: A new economic
history. Cambridge University Press.
154. North, D.C. (1990) Institutions, Institutional Change, and Economic Performance.
Cambridge, U.K.: Cambridge University Press.
155. Norton, S. W. (2003). Economic institutions and human well-being: a cross-national
analysis. Eastern Economic Journal, 29(1), 23-40.
156. O’Driscoll, G.P. Jr, Feulner, E.J. & O’Grady M.A. (2003). 2003 Index of Economic
Freedom. Washington, DC: Heritage Foundation and Dow Jones and Company.
157. Ossono, Е. (2012). Impact of economic freedom on CEMAC countries, Маgister
dissertation Sciences of the Nelson Mandela Metropolitan University.
158. Osterfeld, D. (1992). Prosperity versus Planning: How Government Stifles Economic
Growth. New York: Oxford University Press.
159. Pääkkönen, J. (2009). Economic freedom as driver of growth in transition. Economic
Systems, 34(4), 469-479.
160. Paldam, M. (2003). Economic freedom and the success of the Asian tigers: an essay on
controversy. European Journal of Political Economy, 19(3), 453-477.
161. Panahi, H., Assadzadeh, A., & Refaei, R. (2014). Economic Freedom and Economic
Growth in Mena Countries. Asian Economic and Financial Review, 4(1), 105-116.
162. Peev, E., & Mueller, D. C. (2012). Democracy, economic freedom and growth in
transition economies. Kyklos, 65(3), 371-407.
163. Peláez, R. F. (2009). Economic freedom: a comparative study. Journal of Economics and
Finance, 33(3), 246-258.
164. Pérez-Moreno, S., & Angulo-Guerrero, M. J. (2016). Does economic freedom increase
income inequality? Evidence from the EU countries. Journal of Economic Policy Reform,
19(4), 327-347.
165. Piątek, D., Szarzec, K., & Pilc, M. (2013). Economic freedom, democracy and economic
growth: a causal investigation in transition countries. Post-Communist Economies, 25(3),
267-288.
166. Pitlik, H. (2002). The path of liberalization and economic growth. Kyklos, 55(1), 57-80.
167. Powell, B. (2003). Economic freedom and growth: the case of the Celtic tiger. The Cato
Journal, 22(3), 431-449.
The relationship between economic freedom and economic growth in EU countries
Ivana Brkić
177
168. Próchniak, M. (2011). Determinants of economic growth in Central and Eastern Europe:
the global crisis perspective. Post-communist economies, 23(4), 449-468.
169. Rajasalu, T. (2003). Indicators of economic freedom and economic structure as
determinants of growth and convergence in enlarging EU and priorities for Estonia. Essays in
Estonian Transformation Economics. Edited by Ü. Ennuste and L. Wilder, Tallinn, 7-32.
170. Ram, R. (2014). Measuring economic freedom: a comparison of two major sources.
Applied Economics Letters, 21(12), 852-856.
171. Romer, P. M. (1986). Increasing returns and long-run growth. Journal of political
economy, 94(5), 1002-1037.
172. Romer, P. M. (1990). Endogenous Technological Change, Journal of Political Economy.
98(5): S71–S102.
173. Sachs, J. & Warner, A. (1997). Fundamental sources of long-run growth. Recent
Empirical Growth Research, Area Papers and Proceedings, 87 (2), 184–88.
174. Sachs, J. D. (2001). Tropical Underdevelopment. NBER Working Paper No. W8119
(February). New York: National Bureau of Economic Research.
SAD: Sage publications.
175. Samuelson, P. A., & Nordhaus, W. D. (2009). Economics. Economics (19th
Edition).
New York. McGraw-Hill/Irwin.
176. Sarvananthan, M. (2004). Economic freedom in South Asia with special reference to Sri
Lanka: Research Note. Contemporary South Asia, 13(1), 71-77.
177. Scully, G. W. (1988). The institutional framework and economic development. Journal of
Political Economy, 96(3), 652-662.
178. Scully, G. W. (2002). Economic freedom, government policy and the trade-off between
equity and economic growth. Public choice, 113(1-2), 77-96.
179. Scully, G. W. (2014). Constitutional environments and economic growth. Princeton
University Press.
180. Scully, G. W., & Slottje, D. J. (1991). Ranking economic liberty across countries. Public
Choice, 69(2), 121-152.
181. Sen, A. (1999). Development as Freedom. New York: Alfred A.
182. Smith, A. (2010). The Wealth of Nations: An inquiry into the nature and causes of the
Wealth of Nations. Harriman House Limited.
The relationship between economic freedom and economic growth in EU countries
Ivana Brkić
178
183. Solow, R. M. (1956). A contribution to the theory of economic growth. The quarterly
journal of economics, 70(1), 65-94.
184. Soros, G. (1996). Can Europe work? A plan to rescue the union. Foreign Affairs, 75(5),
8-14.
185. Stansel, D., & McMahon, F. (2013). Economic Freedom of North America 2013 Annual
Report. Vancouver: Frasier Institute.
186. Stiglitz, J.E. (2009). Moving beyond market fundamentalism to a more balanced
economy. Annals of Public and Cooperative Economics, 80 (3), 345-360.
187. Sturm, J. E., & De Haan, J. (2001). How robust is the relationship between economic
freedom and economic growth?. Applied Economics, 33(7), 839-844.
188. Sturm, J. E., Leertouwer, E., & Haan, J. D. (2002). Which economic freedoms contribute
to growth? A comment. Kyklos, 55(3), 403-416.
189. Tanzi, V. (2005). The Economic Role of the State in the 21st Century, Cato Journal,
25(3), 617-638.
190. Tiwari, A. (2011). Foreign Aid, FDI, Economic Freedom and Economic Growth in Asian
Countries. Global Economy Journal, 11(3), 1-28.
191. Türedi, S. (2013). The effect of economic freedom on economic growth: A panel data
analysis for 12 Islamic countries. International Research Journal of Finance and Economics,
107(2), 154-162.
192. us Swaleheen, M., & Stansel, D. (2007). Economic freedom, corruption, and growth.
Cato Journal, 27(3), 18-25.
193. Vedder, R. K., & Gallaway, L. E. (1998). Government size and economic growth.
Washington: Joint Economic Committee.
194. Vega, G.M. & L. Alvarez (2003). Economic growth and freedom: A causality study.
Cato Journal, 23(2), 199-215.
195. Vukotić, V. & Baćović, M. (2006). Economic freedom and economic growth in South
East Europe. Transition Studies Review, 13(1), 81-91.
196. Wu, C. (2011). Economic freedom, economic growth, and China. Chinese economy,
44(5), 104-119.

The relationship between economic freedom and economic growth in EU countries
Ivana Brkić
179
197. Zghidi, N., Mohamed Sghaier, I., & Abida, Z. (2016). Does economic freedom enhance
the impact of foreign direct investment on economic growth in North African countries? A
panel data analysis. African Development Review, 28(1), 64-74.
Copyright © 2022 FDOKUMEN