
Study on Spatio- Economic Relationship of Industries in Greater Nagpur Area
10
Bonfring International Journal of Industrial Engineering and Management Science, Vol. 2, No. 4, December 2012 102 ISSN 2277-5056 | © 2012 Bonfring Abstract--- This paper is an attempt to address the spatio- economic relationship of the industries and the general theory and challenges relating to the industrial location. The existing industrial performance of the region, the top performing and lagging industries of the region along with the spatial analysis were ascertained, using tools like shift share analysis, location quotients and delineation tools such as land and economic suitability matrix. Nagpur is becoming one of the major nuclei for Industrial Growth in the State of Maharashtra and the country in a larger perspective. Thus, this paper tries to represents the regional industrial environment through proper industrial mix where the enterprises can make profit by determining spatial margin to profitability. It can be used as the foundation for enterprises to select locations and type of industries in the overall scope of industry allocation. Keywords--- Industry Allocation, Inter Industrial Linkages, Location Quotients, Shift and Share Analysis, Spatio- Economic Relationship PREAMBLE -“WHAT ARE THE REASONS FOR THE LOCATION OF A PARTICULAR ENTERPRISES OR INDUSTRY IN A SPECIFIC AREA? IS IT JUST A SNAP DECISION OR IS THERE MORE OF A SCIENCE TO THE DECISION?” BY ALFRED WEBER [1] I. INTRODUCTION MONGST the policies for overall economic development industries plays an important role. Industrialization is one of the major solutions for raising the level of economy and providing employment opportunities. It focuses both on the region and the people’s creativity, skill and talent (Issard, 1960). Economic factors play a vital role in the growth of the industries such as availability of land, raw materials, labour, transport and infrastructure. The industrial development is primarily linked with increasing investment, generating employment and socio-economic development of the region. For the sustainable industrial growth, there is a need to develop the industries in all the three aspects (i.e. economic, environment and social) and positioned in a spatial location allocation framework. Nagpur remains a city with tremendous economic potential. Today, due to the combination of changed political will and history of cordial industrial relations Nagpur is on the brink of rapid economic development. Being uniquely situated at the geographical centre of India, it is becoming one of the Rashmi S. Waghmare, Deputy Planner in Mumbai Metropolitan Region Development Authority (MMRDA), Bandra Kurla Complex, Bandra East, Mumbai, India-400051. E-mail:[email protected] DOI: 10.9756/BIJIEMS.1733 major nuclei for Industrial Growth in the State of Maharashtra and the country in a larger perspective. Currently, industrial growth is more concentrated to the Butibori industrial zone which lies close to the NH-7. Butibori industrial area is serving as one of the major venues for a large number of industries and is getting itself established as a five star industrial zone. A group of constantly developing industries located around the Nagpur urban areas has induced the further concentration of industries and thus affecting the surroundings. Hence, there is a need to avoid excessive concentration and haphazard development of industries for the sustainable industrial growth. Thus, this paper puts up the study on the spatio- economic relationship of the industries in Greater Nagpur area to identify the constantly developing industries in and around Nagpur region, thereby enhancing inter-industrial linkages, spatial distribution of industries and hence developing the investment scenario by representing the regional industrial environment for the sustainable industrial growth. II. IDENTIFICATION OF MAJOR ISSUES Industrial progress cannot be achieved easily as it is preconditioned by several factors. The important ones being availability of land, capital, industrial enterprises, labour, availability of raw materials and good markets, speedy and efficient means of transportation. To understand the present scenario of the industrial development in Nagpur region certain studies were done. Based on the study some of the major issues are identified both at the regional and local level (Table 1). Table 1: Issues of Concern Issues Description Sectoral issue Contribution of per capita income to Gross Domestic Product (GDP) in Maharashtra state is more in service sector as compared to manufacturing sector. [2] Category mix/ Imbalance issue In the Nagpur region almost all industrial area fall under the D or D+ category which reflects a very low level of industrial development. [3] Environment issue From the pollution control board report it is found out that maximum Large Scale industries are red in nature in the Nagpur Region. [4] Composition Issue Nagpur region has mainly SSI (Small Scale Industries) which constitutes 96% of total industries, while MSI (Medium Scale Industries) and LSI (Large Scale Industries) contribute only 2% each. [4] Location issue Impact of the newly proposed industrial belt Study on Spatio- Economic Relationship of Industries in Greater Nagpur Area Rashmi S. Waghmare A
-
Upload
independent -
Category
Documents
-
view
0 -
download
0
Transcript of Study on Spatio- Economic Relationship of Industries in Greater Nagpur Area
Bonfring International Journal of Industrial Engineering and Management Science, Vol. 2, No. 4, December 2012 102
ISSN 2277-5056 | © 2012 Bonfring
Abstract--- This paper is an attempt to address the spatio-
economic relationship of the industries and the general theory
and challenges relating to the industrial location. The existing
industrial performance of the region, the top performing and
lagging industries of the region along with the spatial analysis
were ascertained, using tools like shift share analysis, location
quotients and delineation tools such as land and economic
suitability matrix. Nagpur is becoming one of the major nuclei
for Industrial Growth in the State of Maharashtra and the
country in a larger perspective. Thus, this paper tries to
represents the regional industrial environment through proper
industrial mix where the enterprises can make profit by
determining spatial margin to profitability. It can be used as
the foundation for enterprises to select locations and type of
industries in the overall scope of industry allocation.
Keywords--- Industry Allocation, Inter Industrial Linkages,
Location Quotients, Shift and Share Analysis, Spatio-
Economic Relationship
PREAMBLE -“WHAT ARE THE REASONS FOR THE LOCATION OF
A PARTICULAR ENTERPRISES OR INDUSTRY IN A SPECIFIC AREA? IS
IT JUST A SNAP DECISION OR IS THERE MORE OF A SCIENCE TO THE
DECISION?” BY ALFRED WEBER [1]
I. INTRODUCTION
MONGST the policies for overall economic development
industries plays an important role. Industrialization is one
of the major solutions for raising the level of economy and
providing employment opportunities. It focuses both on the
region and the people’s creativity, skill and talent (Issard,
1960). Economic factors play a vital role in the growth of the
industries such as availability of land, raw materials, labour,
transport and infrastructure. The industrial development is
primarily linked with increasing investment, generating
employment and socio-economic development of the region.
For the sustainable industrial growth, there is a need to
develop the industries in all the three aspects (i.e. economic,
environment and social) and positioned in a spatial location
allocation framework.
Nagpur remains a city with tremendous economic
potential. Today, due to the combination of changed political
will and history of cordial industrial relations Nagpur is on the
brink of rapid economic development. Being uniquely situated
at the geographical centre of India, it is becoming one of the
Rashmi S. Waghmare, Deputy Planner in Mumbai Metropolitan Region
Development Authority (MMRDA), Bandra Kurla Complex, Bandra East,
Mumbai, India-400051. E-mail:[email protected]
DOI: 10.9756/BIJIEMS.1733
major nuclei for Industrial Growth in the State of Maharashtra
and the country in a larger perspective. Currently, industrial
growth is more concentrated to the Butibori industrial zone
which lies close to the NH-7. Butibori industrial area is
serving as one of the major venues for a large number of
industries and is getting itself established as a five star
industrial zone.
A group of constantly developing industries located around
the Nagpur urban areas has induced the further concentration
of industries and thus affecting the surroundings. Hence, there
is a need to avoid excessive concentration and haphazard
development of industries for the sustainable industrial
growth. Thus, this paper puts up the study on the spatio-
economic relationship of the industries in Greater Nagpur area
to identify the constantly developing industries in and around
Nagpur region, thereby enhancing inter-industrial linkages,
spatial distribution of industries and hence developing the
investment scenario by representing the regional industrial
environment for the sustainable industrial growth.
II. IDENTIFICATION OF MAJOR ISSUES
Industrial progress cannot be achieved easily as it is
preconditioned by several factors. The important ones being
availability of land, capital, industrial enterprises, labour,
availability of raw materials and good markets, speedy and
efficient means of transportation. To understand the present
scenario of the industrial development in Nagpur region
certain studies were done. Based on the study some of the
major issues are identified both at the regional and local level
(Table 1).
Table 1: Issues of Concern
Issues Description
Sectoral issue Contribution of per capita income to Gross
Domestic Product (GDP) in Maharashtra state
is more in service sector as compared to
manufacturing sector. [2]
Category mix/
Imbalance issue
In the Nagpur region almost all industrial area
fall under the D or D+ category which
reflects a very low level of industrial
development. [3]
Environment
issue
From the pollution control board report it is
found out that maximum Large Scale
industries are red in nature in the Nagpur
Region. [4]
Composition
Issue
Nagpur region has mainly SSI (Small Scale
Industries) which constitutes 96% of total
industries, while MSI (Medium Scale
Industries) and LSI (Large Scale Industries)
contribute only 2% each. [4]
Location issue Impact of the newly proposed industrial belt
Study on Spatio- Economic Relationship of
Industries in Greater Nagpur Area Rashmi S. Waghmare
A
Bonfring International Journal of Industrial Engineering and Management Science, Vol. 2, No. 4, December 2012 103
ISSN 2277-5056 | © 2012 Bonfring
in Butibori area.
The distance from Butibori industrial area to
the Nagpur city which is the major urban
center with 20.52 Lakhs population (i.e 50%
of Nagpur district) is approx. 30 Km and
hence, it results in increased trip length for
the major commuter.
So, in a bid to build a competitive environment; industries
& their ancillaries have to be promoted in clusters, based on
the availability of raw materials, skilled labour, and market
potential and through proper industrial mix.
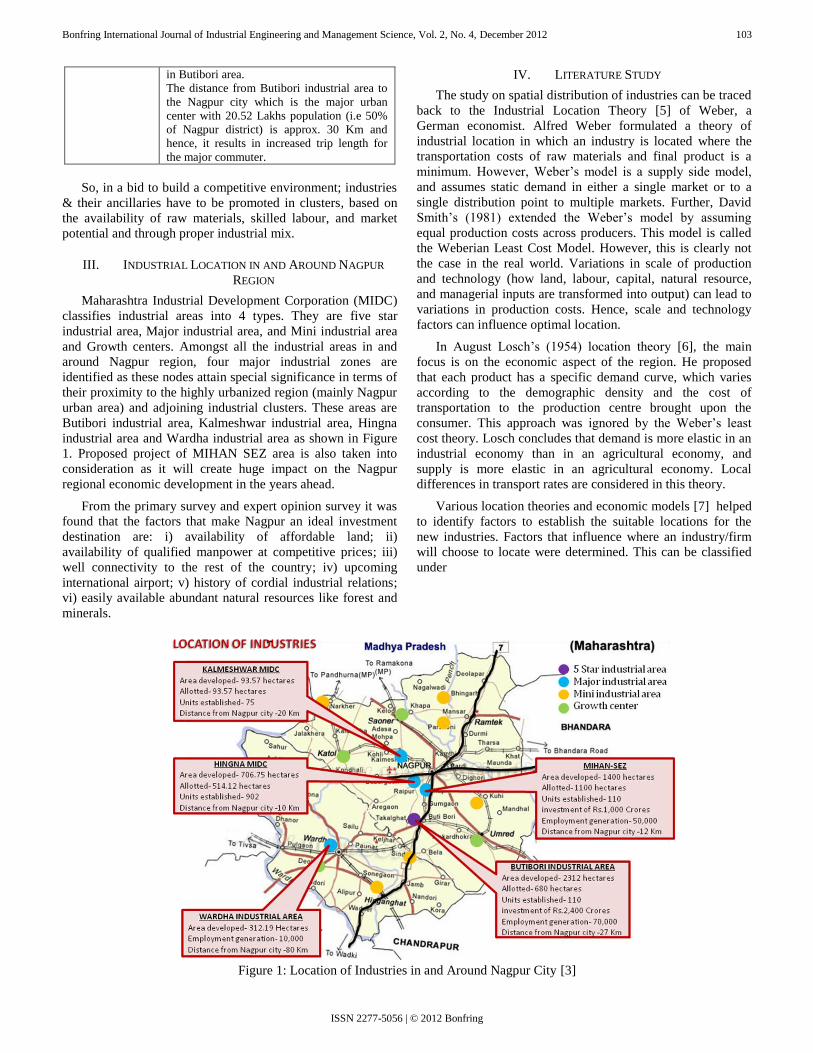
III. INDUSTRIAL LOCATION IN AND AROUND NAGPUR
REGION
Maharashtra Industrial Development Corporation (MIDC)
classifies industrial areas into 4 types. They are five star
industrial area, Major industrial area, and Mini industrial area
and Growth centers. Amongst all the industrial areas in and
around Nagpur region, four major industrial zones are
identified as these nodes attain special significance in terms of
their proximity to the highly urbanized region (mainly Nagpur
urban area) and adjoining industrial clusters. These areas are
Butibori industrial area, Kalmeshwar industrial area, Hingna
industrial area and Wardha industrial area as shown in Figure
1. Proposed project of MIHAN SEZ area is also taken into
consideration as it will create huge impact on the Nagpur
regional economic development in the years ahead.
From the primary survey and expert opinion survey it was
found that the factors that make Nagpur an ideal investment
destination are: i) availability of affordable land; ii)
availability of qualified manpower at competitive prices; iii)
well connectivity to the rest of the country; iv) upcoming
international airport; v) history of cordial industrial relations;
vi) easily available abundant natural resources like forest and
minerals.
IV. LITERATURE STUDY
The study on spatial distribution of industries can be traced
back to the Industrial Location Theory [5] of Weber, a
German economist. Alfred Weber formulated a theory of
industrial location in which an industry is located where the
transportation costs of raw materials and final product is a
minimum. However, Weber’s model is a supply side model,
and assumes static demand in either a single market or to a
single distribution point to multiple markets. Further, David
Smith’s (1981) extended the Weber’s model by assuming
equal production costs across producers. This model is called
the Weberian Least Cost Model. However, this is clearly not
the case in the real world. Variations in scale of production
and technology (how land, labour, capital, natural resource,
and managerial inputs are transformed into output) can lead to
variations in production costs. Hence, scale and technology
factors can influence optimal location.
In August Losch’s (1954) location theory [6], the main
focus is on the economic aspect of the region. He proposed
that each product has a specific demand curve, which varies
according to the demographic density and the cost of
transportation to the production centre brought upon the
consumer. This approach was ignored by the Weber’s least
cost theory. Losch concludes that demand is more elastic in an
industrial economy than in an agricultural economy, and
supply is more elastic in an agricultural economy. Local
differences in transport rates are considered in this theory.
Various location theories and economic models [7] helped
to identify factors to establish the suitable locations for the
new industries. Factors that influence where an industry/firm
will choose to locate were determined. This can be classified
under
Figure 1: Location of Industries in and Around Nagpur City [3]
Bonfring International Journal of Industrial Engineering and Management Science, Vol. 2, No. 4, December 2012 104
ISSN 2277-5056 | © 2012 Bonfring
two levels. One is spatial level and other is strategic level as
shown in table 2. The following could all be considered as
important but for some industry/firm, some of the factors will
be more important than others.
Table 2: Factors Affecting Location Decisions
V. SCENARIO ANALYSES
In order to emphasize on the scenario analysis of the
Nagpur region, models were used like shift and share analysis,
location Quotients and land and economic suitability matrix.
The aim of this approach is to know the potential location for
the industrial setup, sectoral and spatial share of the industries
and competitiveness of industries within the region. The
spacio- economic relationship of the industrial area in the
Greater Nagpur area is also determined. The two major criteria
for analysis are taken as the total no. of establishment and total
no. of employment.
5.1 At District Level
The quotients for industrial location of the 6 districts in
Nagpur region were obtained by determining the relationship
between the employments and establishments with the
population of the district. Location quotient indicates the
concentration of employments or industries in a particular
zone or location. Graph shows (Fig. 2) Nagpur, Bhandara and
Gondia have high concentration of establishment and
employment in accordance with its share at the region.
Figure 2: Graph Showing Location Quotients for Employment
and Establishment
When these three districts were compared (Table 3) with
respect to population, no. of employment & no. of
stablishment over the Nagpur region, it is observed that
Nagpur District contributes the highest percentage of
population along with the highest percentage share of
employment and establishment.
Table 3: Table Showing the Total Population, Employment
and Establishment in 3 Districts
Districts
% over Nagpur Region
Population Employment Establishment
Nagpur 4346000 39% 545338 46% 211049 44%
Bhandara 1154000 10% 133924 11% 59050 12%
Gondia 1218000 11% 126700 11% 55162 11%
Under shift and share analysis, the data from fourth and
fifth economic Census, Maharashtra State were analyzed [8].
From these data a distinction between the top performing and
lagging industries were made. Shift-share analysis is one way
to account for the competitiveness of a region's industries and
to analyze the local economic base. It shows how well the
region's current industries are performing by systematically
examining the national, regional and local industrial
components [9]. The formula used for the calculation of shift
and share [10] is as follows:
Differential Shift
Dj ={[∆Xij/ Xij(t) ] – [∆XN / XN (t) ]} * X ij (t)
Proportional Shift
Pj ={[∆XiN/ XiN(t) ] – [∆XN / XN (t) ]} * X ij (t)
Total Shift
Sij = [∆Xij – ∆/ XN (t)] * X ij (t)
Where,
Xij(t)- Employment or no of establishment in 1998 at
District level
XiN(t)- Employment or no of establishment in 1998 at
Regional level
XN(t)- Employment or no of establishment in 1998 at
State level
∆Xij = Xij(t+r) - Xij(t) Where, ∆Xij is change in the no. of
employment or in no. of establishment from year 1998 to 2005
at district level.
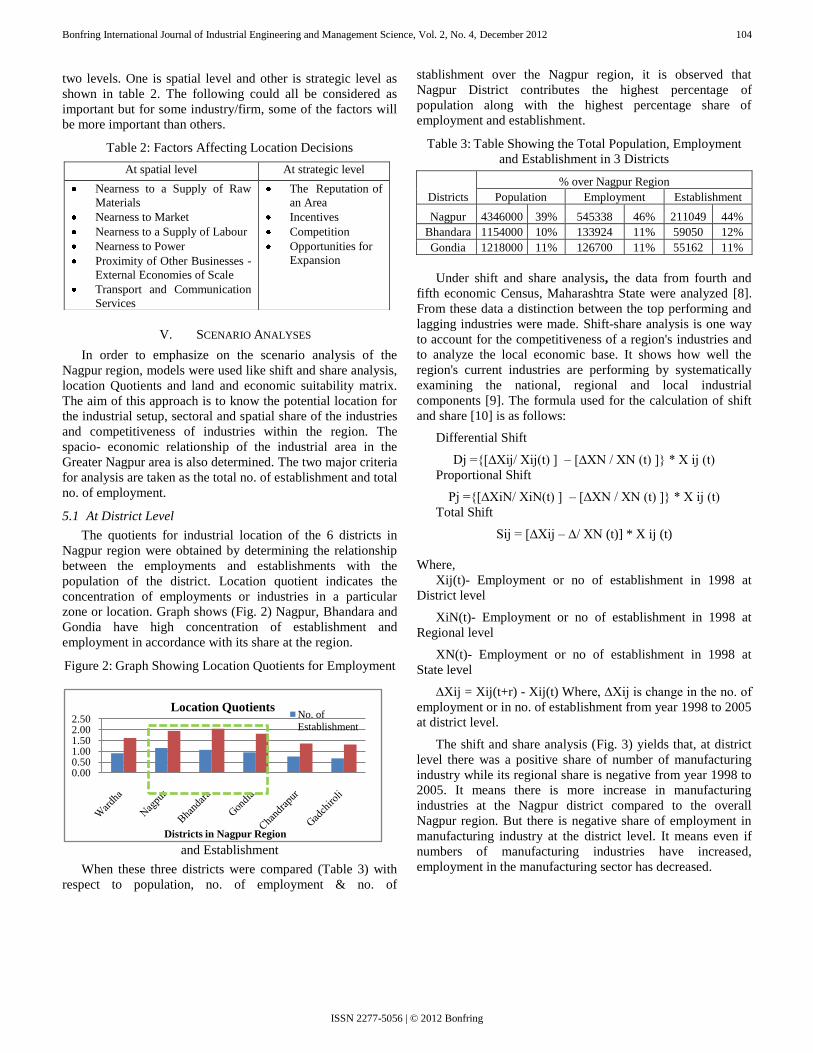
The shift and share analysis (Fig. 3) yields that, at district
level there was a positive share of number of manufacturing
industry while its regional share is negative from year 1998 to
2005. It means there is more increase in manufacturing
industries at the Nagpur district compared to the overall
Nagpur region. But there is negative share of employment in
manufacturing industry at the district level. It means even if
numbers of manufacturing industries have increased,
employment in the manufacturing sector has decreased.
At spatial level At strategic level
Nearness to a Supply of Raw
Materials
Nearness to Market
Nearness to a Supply of Labour
Nearness to Power
Proximity of Other Businesses -
External Economies of Scale
Transport and Communication
Services
The Reputation of
an Area
Incentives
Competition
Opportunities for
Expansion
0.000.501.001.502.002.50
Districts in Nagpur Region
Location QuotientsNo. of
Establishment
Bonfring International Journal of Industrial Engineering and Management Science, Vol. 2, No. 4, December 2012 105
ISSN 2277-5056 | © 2012 Bonfring
Figure 3: Economic Census Results- Industry Employment Mix at District Level (1998-2005) [11]
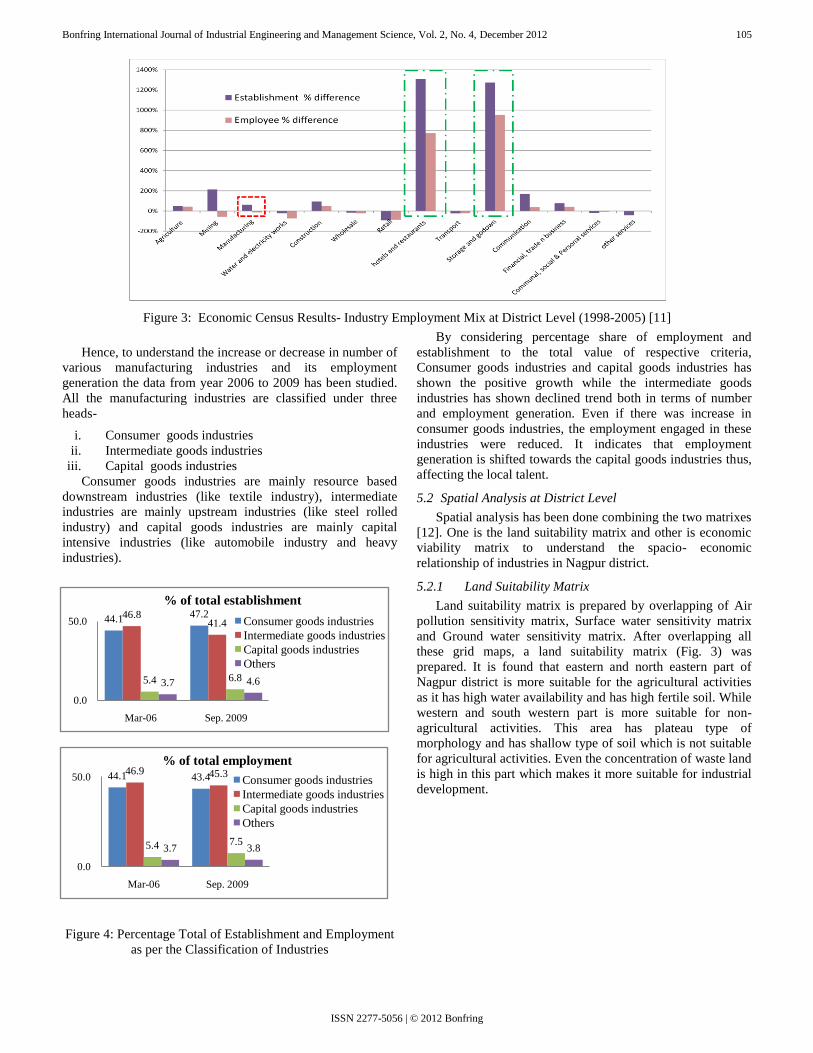
Hence, to understand the increase or decrease in number of
various manufacturing industries and its employment
generation the data from year 2006 to 2009 has been studied.
All the manufacturing industries are classified under three
heads-
i. Consumer goods industries
ii. Intermediate goods industries
iii. Capital goods industries
Consumer goods industries are mainly resource based
downstream industries (like textile industry), intermediate
industries are mainly upstream industries (like steel rolled
industry) and capital goods industries are mainly capital
intensive industries (like automobile industry and heavy
industries).
Figure 4: Percentage Total of Establishment and Employment
as per the Classification of Industries
By considering percentage share of employment and
establishment to the total value of respective criteria,
Consumer goods industries and capital goods industries has
shown the positive growth while the intermediate goods
industries has shown declined trend both in terms of number
and employment generation. Even if there was increase in
consumer goods industries, the employment engaged in these
industries were reduced. It indicates that employment
generation is shifted towards the capital goods industries thus,
affecting the local talent.
5.2 Spatial Analysis at District Level
Spatial analysis has been done combining the two matrixes
[12]. One is the land suitability matrix and other is economic
viability matrix to understand the spacio- economic
relationship of industries in Nagpur district.
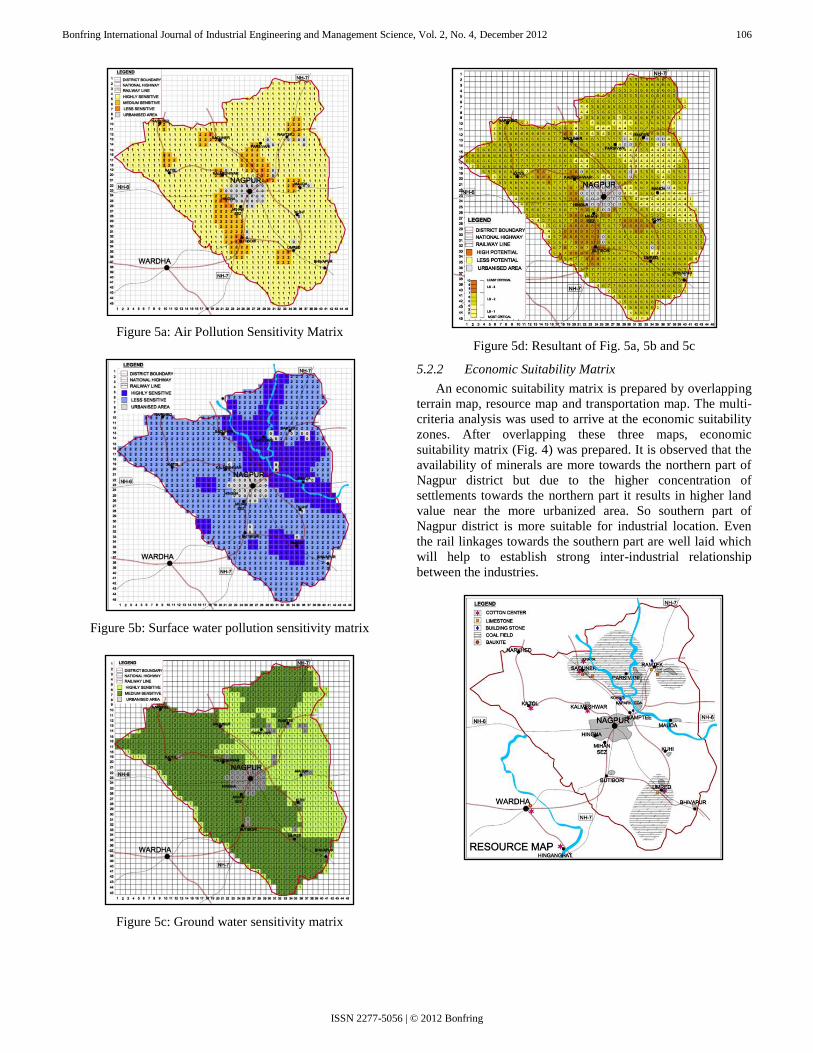
5.2.1 Land Suitability Matrix
Land suitability matrix is prepared by overlapping of Air
pollution sensitivity matrix, Surface water sensitivity matrix
and Ground water sensitivity matrix. After overlapping all
these grid maps, a land suitability matrix (Fig. 3) was
prepared. It is found that eastern and north eastern part of
Nagpur district is more suitable for the agricultural activities
as it has high water availability and has high fertile soil. While
western and south western part is more suitable for non-
agricultural activities. This area has plateau type of
morphology and has shallow type of soil which is not suitable
for agricultural activities. Even the concentration of waste land
is high in this part which makes it more suitable for industrial
development.
44.1 43.446.9 45.3
5.4 7.53.7 3.8
0.0
50.0
Mar-06 Sep. 2009
Consumer goods industries
Intermediate goods industries
Capital goods industries
Others
% of total employment
44.147.246.8
41.4
5.4 6.83.7 4.6
0.0
50.0
Mar-06 Sep. 2009
Consumer goods industries
Intermediate goods industries
Capital goods industries
Others
% of total establishment
Bonfring International Journal of Industrial Engineering and Management Science, Vol. 2, No. 4, December 2012 106
ISSN 2277-5056 | © 2012 Bonfring
Figure 5a: Air Pollution Sensitivity Matrix
Figure 5b: Surface water pollution sensitivity matrix
Figure 5c: Ground water sensitivity matrix
Figure 5d: Resultant of Fig. 5a, 5b and 5c
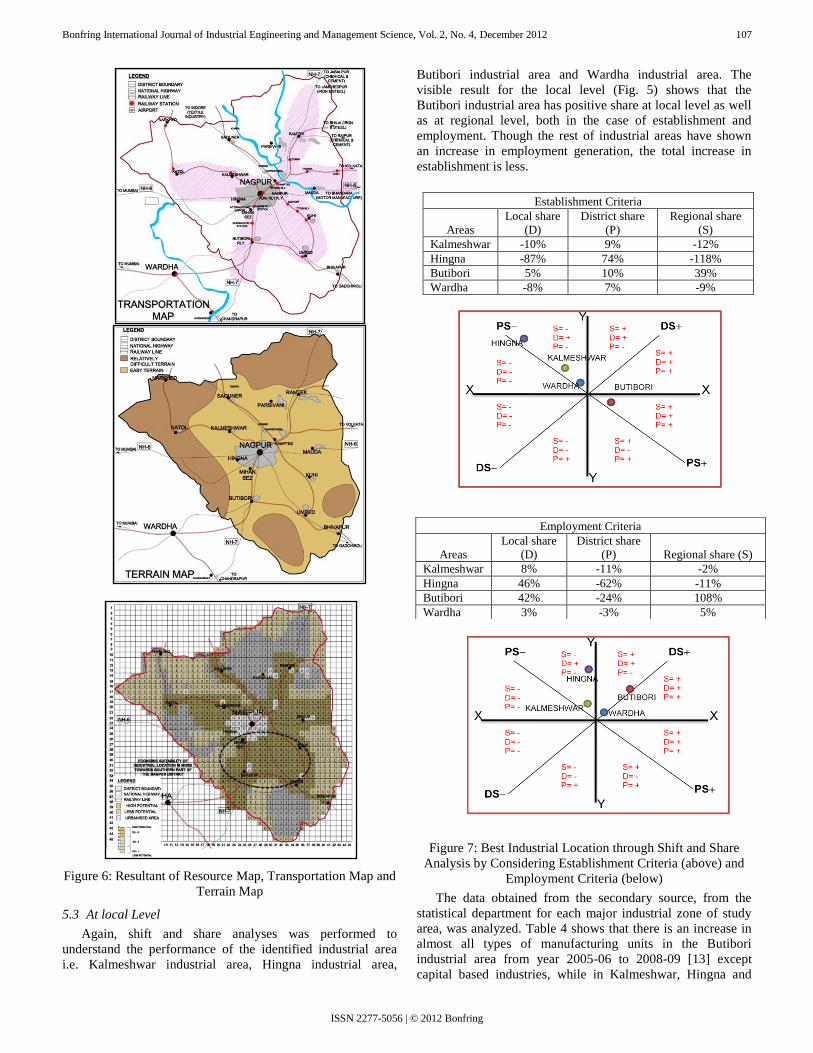
5.2.2 Economic Suitability Matrix
An economic suitability matrix is prepared by overlapping
terrain map, resource map and transportation map. The multi-
criteria analysis was used to arrive at the economic suitability
zones. After overlapping these three maps, economic
suitability matrix (Fig. 4) was prepared. It is observed that the
availability of minerals are more towards the northern part of
Nagpur district but due to the higher concentration of
settlements towards the northern part it results in higher land
value near the more urbanized area. So southern part of
Nagpur district is more suitable for industrial location. Even
the rail linkages towards the southern part are well laid which
will help to establish strong inter-industrial relationship
between the industries.
Bonfring International Journal of Industrial Engineering and Management Science, Vol. 2, No. 4, December 2012 107
ISSN 2277-5056 | © 2012 Bonfring
Figure 6: Resultant of Resource Map, Transportation Map and
Terrain Map
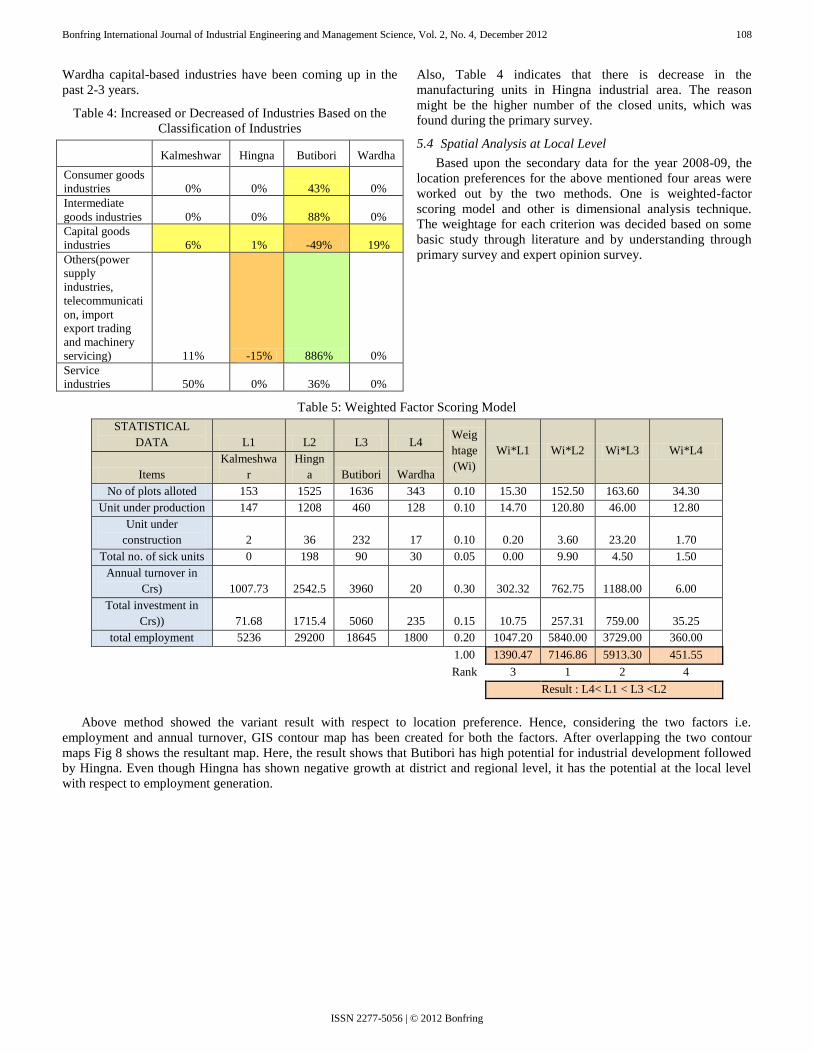
5.3 At local Level
Again, shift and share analyses was performed to
understand the performance of the identified industrial area
i.e. Kalmeshwar industrial area, Hingna industrial area,
Butibori industrial area and Wardha industrial area. The
visible result for the local level (Fig. 5) shows that the
Butibori industrial area has positive share at local level as well
as at regional level, both in the case of establishment and
employment. Though the rest of industrial areas have shown
an increase in employment generation, the total increase in
establishment is less.
Figure 7: Best Industrial Location through Shift and Share
Analysis by Considering Establishment Criteria (above) and
Employment Criteria (below)
The data obtained from the secondary source, from the
statistical department for each major industrial zone of study
area, was analyzed. Table 4 shows that there is an increase in
almost all types of manufacturing units in the Butibori
industrial area from year 2005-06 to 2008-09 [13] except
capital based industries, while in Kalmeshwar, Hingna and
Establishment Criteria
Areas
Local share
(D)
District share
(P)
Regional share
(S)
Kalmeshwar -10% 9% -12%
Hingna -87% 74% -118%
Butibori 5% 10% 39%
Wardha -8% 7% -9%
Employment Criteria
Areas
Local share
(D)
District share
(P) Regional share (S)
Kalmeshwar 8% -11% -2%
Hingna 46% -62% -11%
Butibori 42% -24% 108%
Wardha 3% -3% 5%
Bonfring International Journal of Industrial Engineering and Management Science, Vol. 2, No. 4, December 2012 108
ISSN 2277-5056 | © 2012 Bonfring
Wardha capital-based industries have been coming up in the
past 2-3 years.
Table 4: Increased or Decreased of Industries Based on the
Classification of Industries
Kalmeshwar Hingna Butibori Wardha
Consumer goods
industries 0% 0% 43% 0%
Intermediate
goods industries 0% 0% 88% 0%
Capital goods
industries 6% 1% -49% 19%
Others(power
supply
industries,
telecommunicati
on, import
export trading
and machinery
servicing) 11% -15% 886% 0%
Service
industries 50% 0% 36% 0%
Also, Table 4 indicates that there is decrease in the
manufacturing units in Hingna industrial area. The reason
might be the higher number of the closed units, which was
found during the primary survey.
5.4 Spatial Analysis at Local Level
Based upon the secondary data for the year 2008-09, the
location preferences for the above mentioned four areas were
worked out by the two methods. One is weighted-factor
scoring model and other is dimensional analysis technique.
The weightage for each criterion was decided based on some
basic study through literature and by understanding through
primary survey and expert opinion survey.
Table 5: Weighted Factor Scoring Model
STATISTICAL
DATA L1 L2 L3 L4 Weig
htage
(Wi)
Wi*L1 Wi*L2 Wi*L3 Wi*L4
Items
Kalmeshwa
r
Hingn
a Butibori Wardha
No of plots alloted 153 1525 1636 343 0.10 15.30 152.50 163.60 34.30
Unit under production 147 1208 460 128 0.10 14.70 120.80 46.00 12.80
Unit under
construction 2 36 232 17 0.10 0.20 3.60 23.20 1.70
Total no. of sick units 0 198 90 30 0.05 0.00 9.90 4.50 1.50
Annual turnover in
Crs) 1007.73 2542.5 3960 20 0.30 302.32 762.75 1188.00 6.00
Total investment in
Crs)) 71.68 1715.4 5060 235 0.15 10.75 257.31 759.00 35.25
total employment 5236 29200 18645 1800 0.20 1047.20 5840.00 3729.00 360.00
1.00 1390.47 7146.86 5913.30 451.55
Rank 3 1 2 4
Result : L4< L1 < L3 <L2
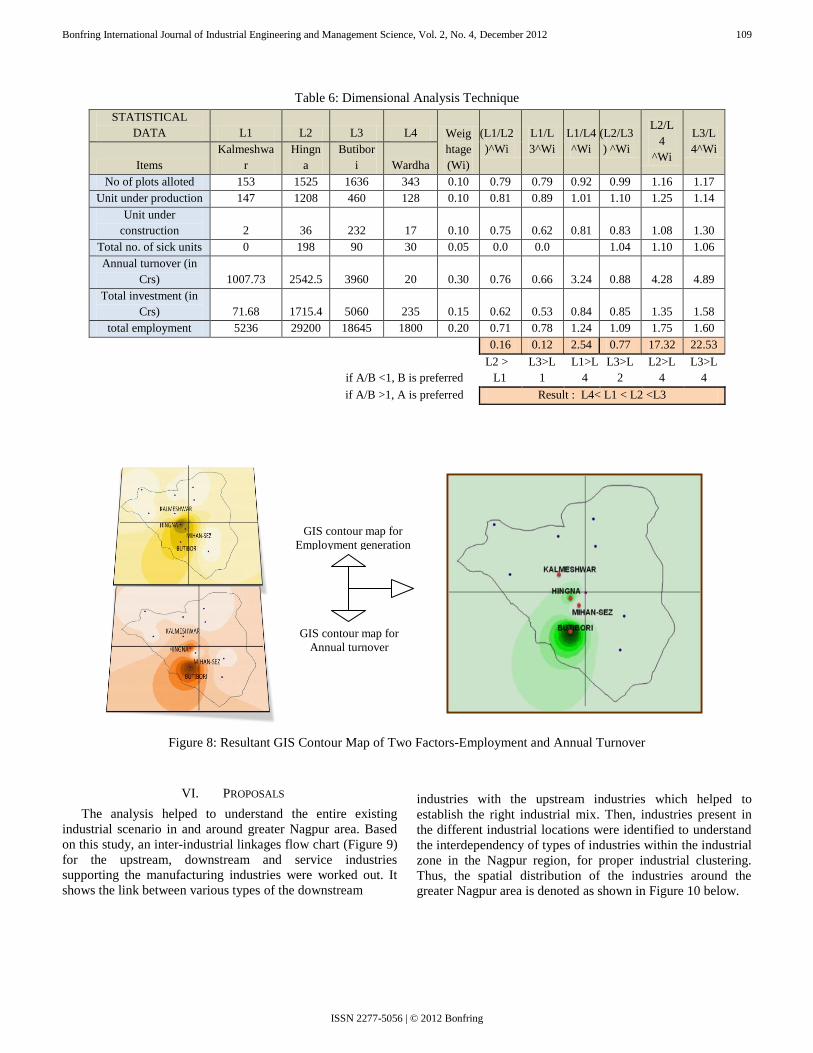
Above method showed the variant result with respect to location preference. Hence, considering the two factors i.e.
employment and annual turnover, GIS contour map has been created for both the factors. After overlapping the two contour
maps Fig 8 shows the resultant map. Here, the result shows that Butibori has high potential for industrial development followed
by Hingna. Even though Hingna has shown negative growth at district and regional level, it has the potential at the local level
with respect to employment generation.
Bonfring International Journal of Industrial Engineering and Management Science, Vol. 2, No. 4, December 2012 109
ISSN 2277-5056 | © 2012 Bonfring
GIS contour map for
Employment generation
GIS contour map for
Annual turnover
Table 6: Dimensional Analysis Technique
STATISTICAL
DATA L1 L2 L3 L4 Weig
htage
(Wi)
(L1/L2
)^Wi
L1/L
3^Wi
L1/L4
^Wi
(L2/L3
) ^Wi
L2/L
4
^Wi
L3/L
4^Wi
Items
Kalmeshwa
r
Hingn
a
Butibor
i Wardha
No of plots alloted 153 1525 1636 343 0.10 0.79 0.79 0.92 0.99 1.16 1.17
Unit under production 147 1208 460 128 0.10 0.81 0.89 1.01 1.10 1.25 1.14
Unit under
construction 2 36 232 17 0.10 0.75 0.62 0.81 0.83 1.08 1.30
Total no. of sick units 0 198 90 30 0.05 0.0 0.0 1.04 1.10 1.06
Annual turnover (in
Crs) 1007.73 2542.5 3960 20 0.30 0.76 0.66 3.24 0.88 4.28 4.89
Total investment (in
Crs) 71.68 1715.4 5060 235 0.15 0.62 0.53 0.84 0.85 1.35 1.58
total employment 5236 29200 18645 1800 0.20 0.71 0.78 1.24 1.09 1.75 1.60
0.16 0.12 2.54 0.77 17.32 22.53
if A/B <1, B is preferred
L2 >
L1
L3>L
1
L1>L
4
L3>L
2
L2>L
4
L3>L
4
if A/B >1, A is preferred Result : L4< L1 < L2 <L3
Figure 8: Resultant GIS Contour Map of Two Factors-Employment and Annual Turnover
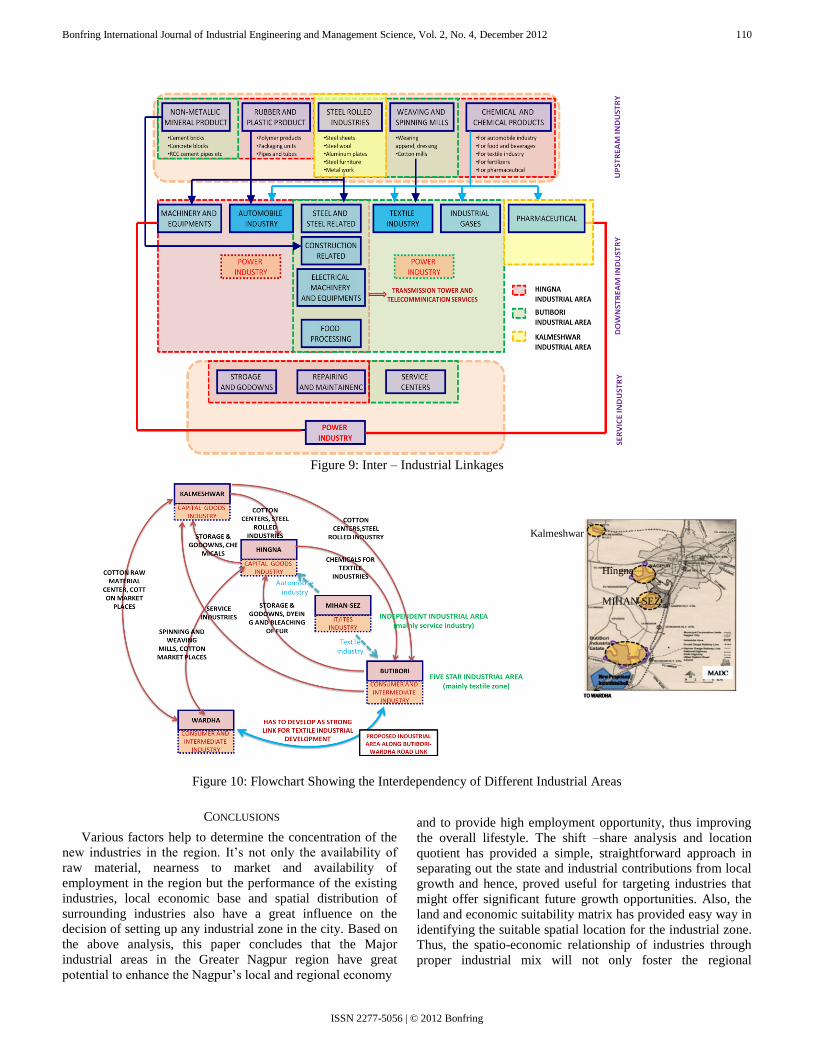
VI. PROPOSALS
The analysis helped to understand the entire existing
industrial scenario in and around greater Nagpur area. Based
on this study, an inter-industrial linkages flow chart (Figure 9)
for the upstream, downstream and service industries
supporting the manufacturing industries were worked out. It
shows the link between various types of the downstream
industries with the upstream industries which helped to
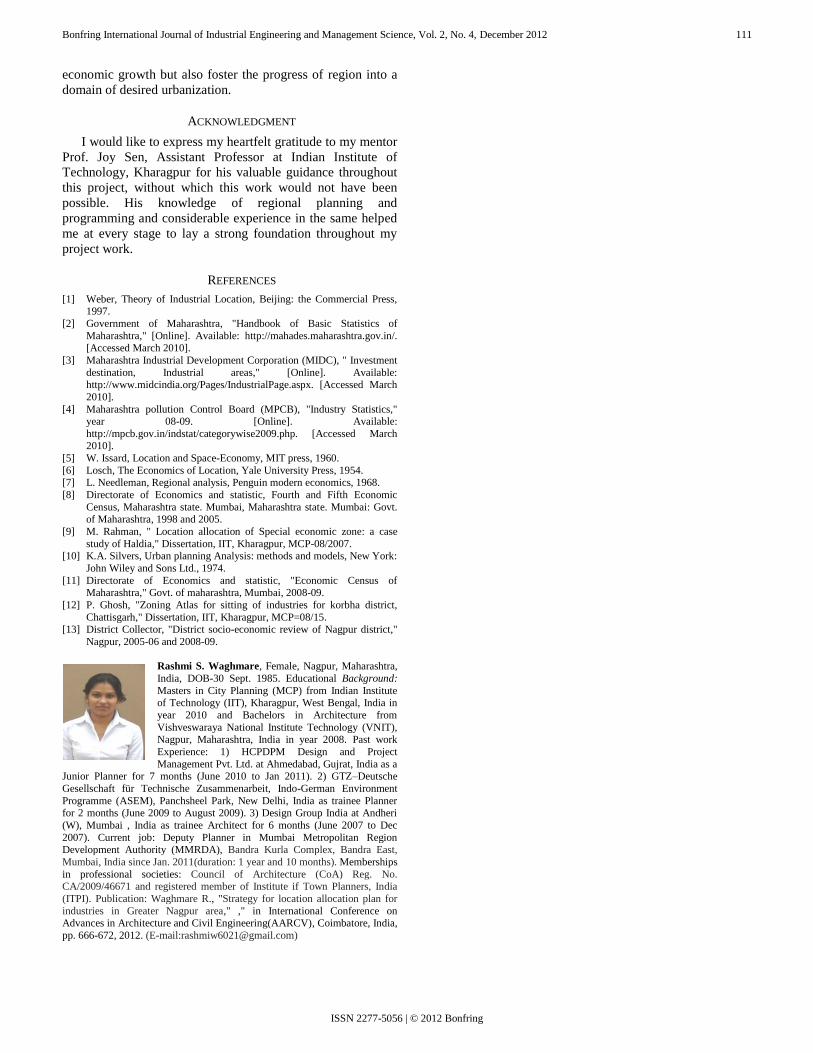
establish the right industrial mix. Then, industries present in
the different industrial locations were identified to understand
the interdependency of types of industries within the industrial
zone in the Nagpur region, for proper industrial clustering.
Thus, the spatial distribution of the industries around the
greater Nagpur area is denoted as shown in Figure 10 below.
Bonfring International Journal of Industrial Engineering and Management Science, Vol. 2, No. 4, December 2012 110
ISSN 2277-5056 | © 2012 Bonfring
Figure 9: Inter – Industrial Linkages
Figure 10: Flowchart Showing the Interdependency of Different Industrial Areas
CONCLUSIONS
Various factors help to determine the concentration of the
new industries in the region. It’s not only the availability of
raw material, nearness to market and availability of
employment in the region but the performance of the existing
industries, local economic base and spatial distribution of
surrounding industries also have a great influence on the
decision of setting up any industrial zone in the city. Based on
the above analysis, this paper concludes that the Major
industrial areas in the Greater Nagpur region have great
potential to enhance the Nagpur’s local and regional economy
and to provide high employment opportunity, thus improving
the overall lifestyle. The shift –share analysis and location
quotient has provided a simple, straightforward approach in
separating out the state and industrial contributions from local
growth and hence, proved useful for targeting industries that
might offer significant future growth opportunities. Also, the
land and economic suitability matrix has provided easy way in
identifying the suitable spatial location for the industrial zone.
Thus, the spatio-economic relationship of industries through
proper industrial mix will not only foster the regional
Kalmeshwar
Hingna
MIHAN-SEZ
Bonfring International Journal of Industrial Engineering and Management Science, Vol. 2, No. 4, December 2012 111
ISSN 2277-5056 | © 2012 Bonfring
economic growth but also foster the progress of region into a
domain of desired urbanization.
ACKNOWLEDGMENT
I would like to express my heartfelt gratitude to my mentor
Prof. Joy Sen, Assistant Professor at Indian Institute of
Technology, Kharagpur for his valuable guidance throughout
this project, without which this work would not have been
possible. His knowledge of regional planning and
programming and considerable experience in the same helped
me at every stage to lay a strong foundation throughout my
project work.
REFERENCES
[1] Weber, Theory of Industrial Location, Beijing: the Commercial Press, 1997.
[2] Government of Maharashtra, "Handbook of Basic Statistics of
Maharashtra," [Online]. Available: http://mahades.maharashtra.gov.in/.
[Accessed March 2010].
[3] Maharashtra Industrial Development Corporation (MIDC), " Investment
destination, Industrial areas," [Online]. Available: http://www.midcindia.org/Pages/IndustrialPage.aspx. [Accessed March
2010].
[4] Maharashtra pollution Control Board (MPCB), "Industry Statistics," year 08-09. [Online]. Available:
http://mpcb.gov.in/indstat/categorywise2009.php. [Accessed March 2010].
[5] W. Issard, Location and Space-Economy, MIT press, 1960.
[6] Losch, The Economics of Location, Yale University Press, 1954. [7] L. Needleman, Regional analysis, Penguin modern economics, 1968.
[8] Directorate of Economics and statistic, Fourth and Fifth Economic
Census, Maharashtra state. Mumbai, Maharashtra state. Mumbai: Govt. of Maharashtra, 1998 and 2005.
[9] M. Rahman, " Location allocation of Special economic zone: a case
study of Haldia," Dissertation, IIT, Kharagpur, MCP-08/2007. [10] K.A. Silvers, Urban planning Analysis: methods and models, New York:
John Wiley and Sons Ltd., 1974.
[11] Directorate of Economics and statistic, "Economic Census of Maharashtra," Govt. of maharashtra, Mumbai, 2008-09.
[12] P. Ghosh, "Zoning Atlas for sitting of industries for korbha district,
Chattisgarh," Dissertation, IIT, Kharagpur, MCP=08/15. [13] District Collector, "District socio-economic review of Nagpur district,"
Nagpur, 2005-06 and 2008-09.
Rashmi S. Waghmare, Female, Nagpur, Maharashtra,
India, DOB-30 Sept. 1985. Educational Background:
Masters in City Planning (MCP) from Indian Institute of Technology (IIT), Kharagpur, West Bengal, India in
year 2010 and Bachelors in Architecture from
Vishveswaraya National Institute Technology (VNIT), Nagpur, Maharashtra, India in year 2008. Past work
Experience: 1) HCPDPM Design and Project
Management Pvt. Ltd. at Ahmedabad, Gujrat, India as a Junior Planner for 7 months (June 2010 to Jan 2011). 2) GTZ–Deutsche
Gesellschaft für Technische Zusammenarbeit, Indo-German Environment
Programme (ASEM), Panchsheel Park, New Delhi, India as trainee Planner for 2 months (June 2009 to August 2009). 3) Design Group India at Andheri
(W), Mumbai , India as trainee Architect for 6 months (June 2007 to Dec
2007). Current job: Deputy Planner in Mumbai Metropolitan Region Development Authority (MMRDA), Bandra Kurla Complex, Bandra East,
Mumbai, India since Jan. 2011(duration: 1 year and 10 months). Memberships
in professional societies: Council of Architecture (CoA) Reg. No. CA/2009/46671 and registered member of Institute if Town Planners, India
(ITPI). Publication: Waghmare R., "Strategy for location allocation plan for
industries in Greater Nagpur area," ," in International Conference on Advances in Architecture and Civil Engineering(AARCV), Coimbatore, India,
pp. 666-672, 2012. (E-mail:[email protected])