Foreign Direct Investment, Institutional Quality, Economic Freedom and Entrepreneurship in Emerging...
65
No. 13-36 2013 Foreign Direct Investment, Institutional Quality, Economic Freedom and Entrepreneurship in Emerging Markets Herrera, Hernán; Haar, Jerry; Estevéz, Juan B.
Transcript of Foreign Direct Investment, Institutional Quality, Economic Freedom and Entrepreneurship in Emerging...

No. 13-36 2013
Foreign Direct Investment, Institutional Quality, Economic Freedom and Entrepreneurship in Emerging Markets Herrera, Hernán; Haar, Jerry; Estevéz, Juan B.

Foreign Direct Investment, Institutional Quality, Economic
Freedom and Entrepreneurship in Emerging Markets
Hernan Herrera Echeverry*
Jerry Haar†
Juan Benavides Estévez-Bretón§
May, 2013
Abstract
This study investigates the relationship between foreign direct investment, institutional
quality, economic freedom, and entrepreneurship in emerging markets. The research
compares the capacity and appetite for business creation among high-income, low-income
and emerging countries. The results are based on a panel study of data, from 2004 to 2009
for 87 countries, using as its source “The World Bank Entrepreneurship Snapshots” to look
at the connection between business creation, institutional quality, market freedom and
foreign direct investment (FDI). The findings reveal a strong positive relationship between
institutional quality and business generation in all three of the above categories.
Meanwhile, institutional quality and how this develops remains significant to business
creation at least two years after a business is incubated, underscoring its importance as a
contributory factor for creating an environment conducive to entrepreneurship. The
freedom to create businesses and invest has a marked impact on business generation in
emerging countries, while the influence of international trade appears more important as a
spur to the genesis of business in low-income countries. Results also show that regulation
of the free market has a short-term effect on business creation. Finally, there is a direct and
significant relationship between FDI and business development in emerging countries. The
effect of FDI is also felt for at least two years after the foreign investment. This result is
consistent with “the spillover theory of entrepreneurship” (Acs et al, 2009; Görg and Strobl,
2002; Ayyagari et al, 2010).
Keywords: Foreign Direct Investment; Institutional Quality; Economic Freedom;
Entrepreneurship
JEL classification: F21, G18, G24
* Professor, Department of Finance, School of Economics and Finance, Center for Research in Economics and
Finance (CIEF), Universidad EAFIT, Carrera 49 Número 7 Sur 50, Medellín, Colombia, e-mail:
[email protected] † Florida International University, Florida, U.S.A., email: [email protected]
§ Universidad de los Andes, Bogotá, Colombia, email: [email protected]

1. Introduction
The consensus within recent research on economic development has shown how
institutions play a large part in fostering a free market and thus, in turn, spurring economic
growth. Meanwhile, further studies chart the relationship between business creation and
entrepreneurship and how this impacts economic growth and social development. This has
spurred interest to investigate the relationship between institutions, a free market and
business creation. However, little research has been undertaken into the relationship
between entrepreneurship and factors ancillary to a free market (including freedom to trade
and to invest). And, in the research that has been conducted to date, the results are
inconclusive and do not allow for a consensus on whether these factors, in fact, stimulate
business development.
The majority of studies have looked at the relationship between institutions and
entrepreneurship and whether institutional quality spurs would-be entrepreneurs to create
businesses (Knack et al, 1995, Desai et al, 2003, Aidis et al, 2008) and, therefore, whether
there is a direct relationship between entrepreneurship and institutions. However, findings
are not yet exhaustive or conclusive in this area, making the correlation between institutions
and entrepreneurship difficult to assess, particularly in relation to emerging countries. By
way of example, there is still scope to investigate further the influence of the timing of
institutional change and how institutional quality interacts with the free market and FDI to
promote business creation.
This article is based on a panel study of data for the six years from 2004 to 2009 for 87
countries. Using data from the registry of new companies on “The World Bank
Entrepreneurship Snapshots”, we seek to track the relationship between company creation,
institutional quality, a free market and FDI. To allow for comparative analysis, the 87
countries were split into three groups. The first group comprises countries of high and
middle income; the second group comprises countries of low income (both groups selected
according to the proposed classifications by the Atlas method of The World Bank); and, the
third group comprises emerging or frontier emerging countries (these countries did not
figure in previous groups and are grouped according to classifications from The Financial

Times and The London Stock Exchange (FTSE) Index).
This study makes four contributions to the canon of work on the subject. First, it analyses
the relationship between institutional strength and business creation in emerging countries,
shedding light on the impact of institutional quality in business creation and how outside
influences affect institutional quality which, in turn, can provide incentives for business
creation. As part of this dynamic, the study considers whether the greater perception of risk
in emerging countries, manifested in government instability, corruption and poor legal
quality, serves to stymie entrepreneurship or whether entrepreneurs devise strategies to
overcome these adverse institutional factors. Second, it evaluates the relationship between
entrepreneurship and aspects of the free market (in particular relative aspects such as
financial matters, foreign trade, flow of capital and conditions for starting up, running and
winding down a business over the lifespan of an enterprise), while considering which factor
has the greatest influence and how gradations in the factors impact business creation. Third,
the study examines the impact of FDI in assisting business development in emerging
countries. This work considers whether FDI compels business creation in the hosting
country or, actually, deters domestic company development. This aides in determining how
external factors that impact on the domestic economy and, in turn, affect business creation.
Fourth, the study looks at the interplay between FDI, institutional quality and the free
market and how they combine to lay the groundwork for business development in emerging
countries.
This article continues as follows: the second section reviews recent literature and considers
the rationale for the study; the third section shows how the chosen econometric model has
been developed; the fourth section details the data and sources used in this study while in
the fifth section, we consider the results and how they stand up to testing. In the last
section, we present our conclusions, consider limitations to research, and ponder
opportunities for further research.
2. Literature Review
2.1 Business creation and institutional quality
There is a consensus among economists of the importance institutions play in economic
development. It is believed that healthy institutions encourage investment and stimulate
economic growth. Recent studies show that countries with solid institutions have the
potential for greater economic growth than countries that do not (Barro, 1991; Knack and
Keefer, 1995; Johnson et al: 1997). Other studies have acknowledged that institutional
quality affects whether would be entrepreneurs decide to start a business (Leibenstein,
1968; Baumol, 1990) and that there is an underlying correlation between institutions and
entrepreneurship (Sautet, 2005; Coyne and Leeson, 2004). In this section, our objective is
to review recent findings on the subject. In doing so, it first summarizes the institution’s
purpose, how it is rated and how it impacts entrepreneurial activity. It then records the
results of recent studies to conclude.
North (1990) defines institution as the formal and informal restrictions created by man to
structure human interaction. These rules exist to facilitate the exchange, increase
confidence between economic players and reduce transactional cost. Williamson (2000)
expands this definition and includes the existence of organized entities, decisive procedures
and regulatory structures as defining parameters within each society. The World
Development Report: Building Institutions for Markets (World Bank, 2002)1, states that the
country’s institutional quality depends upon the quality of its rules, what enforcement
procedures it has in place to encourage society to observe these rules, and performance and
guidance available for organizations. Kaufmann et al (2010) measures institutional quality
and its relationship to other factors that lay the groundwork for effective regulation in three
categories: (1) how governments are elected, monitored and replaced if necessary; the
government’s capacity to devise and implement good policy; and (3) a citizen’s regard and
the government’s regard for institutions that manage social and economic interaction.
Some conditions highlight the relationship between institutional quality and business
creation. First, there is no consistency in how the rules operate across cultures, stimulating
some groups while disadvantaging others, depending upon the size and power of the
economy in question. Cultural customs or the influence of some interest groups can serve
1 http://publications.worldbank.org/index.php?main_page=product_info&cPath=0&products_id=22407

to preserve institutions, even those that are inefficient. Then there is the symbiotic
relationship between organizations and institutions in the sense that institutions tend to
mirror the organization’s actions; and these organizations evolve within structure devised
by the institutions. Also, changes to institutions can be slow, incremental and show
dependency patterns (DiMaggio and Powell, 1983; North, 1990). So, where institutions are
not functioning well--for example in developing economies--institutional quality will not
be sufficient to reverse this trend and promote entrepreneurial activity. This is likely to
deter potential entrepreneurs from setting up a business as they weigh the perceived risks.
To measure how the quality of institutions impacts startups, researchers aim to show the
impact on entrepreneurs, of property rights protection, the quality of legal services, law
enforcement and corruption control. Studies charting the relationship between property
rights and business creation have already established how significant a factor property
rights have been in promoting economic development. It is no surprise, then, that weak
property rights, in turn, impede economic growth (Mauro, 1995; Svensson, 1998).
Strong property rights protection prompts economic growth as businesses consider and take
advantage of the significant benefits. Meanwhile, not surprisingly, it has been shown that
weak property rights protection increases the perception of risk for would be entrepreneurs,
deters individuals from starting up a business and reduces their involvement in future
development projects (Besley, 1995; Frye and Shleifer, 1997; Shleifer, 1997; La Porta et
al., 1997; Demirgüç-Kunt and Vojislav, 1998; Johnson et al., 2002; Kumar et al., 2002;
Claessens and Laeven, 2003). Fears over poor property protection rights tend to stifle the
creation of businesses. (Parker, 2007). One of the obvious strengths of a society which
places value upon the protection of property rights is that it creates an environment in
which a business owner has the luxury of acquiring and protecting assets; and it creates a
landscape in which would- be entrepreneurs perceive advantages. Protection of property
rights is, therefore, fundamental to the entrepreneurial process because it allows
entrepreneurs to enjoy the fruits of their labor and, at the same time avoid losing out to a
rogue state or another opportunistic entity (Hodler, 2009). The guarantee of secure property
protection rights is even more critical to the relationship between investor and entrepreneur
as the risks they shoulder and fears of losing out are reciprocal. On one hand, investors

may have a legitimate fear they may not recover anything if an entrepreneur acts
opportunistically. On the other hand, the entrepreneur may fear that their idea could be
stolen by an investor, who may have the financial means and motivation to develop the
concept without their participation. Without adequate property rights protection, not only
do many potential entrepreneurs see no motivation to start businesses, but potential
investors will be more leery about providing financial support to progress their ideas. To
conclude, then, an inadequate property rights protection system is likely to deter
participation from entrepreneurs and investors alike. A further upshot of poor property
rights, as noted by Gonzalez (2005), is that it spawns several types of predatory
entrepreneurship (greedy entrepreneurship) while reducing an investment´s return in
productive entrepreneurship (constructive entrepreneurship).
Researchers have also shown how entrepreneurship fails to flourish where inadequate legal
quality, poor law enforcement and high levels of corruption proliferate. This phenomenon
disadvantages entrepreneurial activity in several ways. First, where there is low legal
quality and high corruption, entrepreneurs have found political support is crucial to their
survival and entrepreneurial development. Consequently, there is no incentive to the honest
entrepreneur--- who is not open to corruption (Wei, 2000; Aidt, 2009; Aidis and Adachi,
2007; Aidis, et al., 2008). Second, an environment that fosters those kind of designs does
not promote loyalty and encourages dishonest practices, which acts as a deterrent to new
entrants to the business arena (Barkhatova, 2000; Aidis y Mickiewicz, 2006). Third, where
law enforcement falters and there is a lot of corruption, this can taint the entrepreneurial
experience (Glaeser et al., 2003; Johnson et al., 1997; Hodler, 2009) and, in turn, create
prejudicial views of entrepreneurial activity.
Country studies (for example, in Russia, Djankov et al., 2005 and Russia and China, Puffer
et al., 2010) show reduced corruption levels in conjunction with favorable governmental
attitudes towards entrepreneurship foster an environment conducive to producing
entrepreneurs. Meanwhile, corrupt environments restrict entrepreneurial opportunities,
diminish potential economic gains and discourage would be entrepreneurs from starting
new businesses. In addition, the behavior of entrepreneurs who are so intent on pursuing
their aims that they are willing to participate in a dishonest system serve only to bolster

corrupt practices which impede access to the market from more honest entrepreneurs which
stifles entrepreneurial activity in general (Aidis et al., 2010).
To conclude, the scope of entrepreneurial activity is influenced by how much confidence
stakeholders have in institutions and how willing they are to abide by the law. What also
matters are the police, courts and government are and how they promote laws to help the
private sector develop and create conditions in which contracts are honored and corruption
is not allowed to thrive. This study contributes to a body of research which analyzes the
relationship between institutions and entrepreneurship in emerging countries, specifically
highlighting how and when institutional quality impacts business creation and determining
how changes in institutional quality affect business creation, and discerns how institutional
quality, economic freedom and FDI impact the creation of businesses.
Research shows that these forces work synergistically particularly in less developed
economies where major institutional quality problems exist. It begs the question whether,
in this type of economy, the largest perceived risks of government instability, corruption
and an impoverished legal system combine to impede entrepreneurial behavior or whether
entrepreneurs act dynamically developing strategies to surmount those adverse institutional
factors.
2.2 Business creation and free market economies
Kirzner (1992) considers a free market as the legal, political, constitutional and economic
principle most likely to encourage entrepreneurship. Economic theory, in general,
underscores the importance of a free market to development (Smith: 1776; Ricardo: 1821)
while a number of studies show that a free market contributes propensity for an economy to
grow and eradicate income inequality (Scully and Slottje, 1991; Gwartney et al., 1999;
Doucouliagos and Ulubasoglu, 2006; Berggren 1999, 2003; Carter, 2007). This research
attempts to extend that relationship on a microeconomic level and analyze the connection
between a free market and entrepreneurship. There have been a number of studies on this
subject (Bjørnskov and Foss, 2008; Sobel et al., 2007) but only one of them reviews data
over the course of several years (Nyström, 2008) and none focuses on emerging markets. In
this section, we develop the free market concept used in this study, analyze the factors that

contribute to a free market and then summarize findings from recent research on the
relationship between those factors and business creation. To conclude, we consider
questions that will form the basis for investigation in this study.
As is well-known, in a free market economy, supply and demand will determine which
goods and services must be produced and the price for which they will be sold. Although
an entirely free market is but an ideal, the degree of freedom can be measured through
reference to existing intervention mechanisms. The most common among these are: price
controls; taxes; import and export tariffs; monetary control; subsidies and state monopolies.
Four of these have been considered by this study, drawing from previous research that
regarded them as being instrumental to entrepreneurial activity: fiscal intervention;
impediments to the free movement of goods and services; the regulatory framework
governing the ease with which one can form or close a business; and restrictions on
investment.
2.2.1 Freedom to start and close business
The extent and complexity of regulations together with the costs associated with the
formalities of setting up and closing down a business will determine how effective a free
market is and how well new businesses can perform. Tight control and high costs may be
perceived as barriers to a free market which, in turn, would stifle business creation. There
are two views among researchers on how the relationship between entrepreneurship and the
regulatory framework operates in practice. The first belief posits that tight regulatory
control acts to impede chaos within the marketplace and undermines confidence in the
market, thereby engendering entrepreneurship. The counterargument is that too stringent a
regulatory system goes hand-in-hand with higher levels of bureaucracy, paves the way for
corruption, and impedes new business creation and expansion of existing ones.
Among the researchers that favor the former view that tight regulatory control has a
positive impact on entrepreneurial behavior are Glaeser and Shleifer (2003), who conclude
that regulation is the price paid to eradicate the unfairness that may be regarded as part of
the existing order. Meanwhile, DiTella and McCulloch (2006) and Landier et al (2008)
take the view that a tighter regulatory framework is borne from the need to control
corruption; while Pinotti (2008) concludes that it is a lack of confidence in the market
which spawns increased regulation. Finally, the work of Djankov et al (2003) indicates that
regulation is a natural response to the demand by the public to counter disorder, real or
perceived, within the marketplace.
Equally, many studies support the notion that regulation favors fledgling businesses
(Stigler, 1971) and the regulators themselves (Krueger, 1974; Shleifer and Vishny, 1998).
The evidence in studies including Djankov et al (2002) shows that in countries where
regulation inhibits entry to new businesses, there also happens to be higher levels of
corruption. From this flows the theory that there is a relationship between strong regulation
and private interest protection, which acts to the detriment of the spirit of the common
good. Studies by Klapper et al (2006), Desai et al (2003) and Parker (2007) have found
that industries that are generally attractive to would-be entrepreneurs across the board, will
be less appealing in countries where the system is more bureaucratic and the regulatory
costs more significant.
However, Rajan and Zingales (2003) showed that even though excessive regulation may act
in the interest of private individuals, insufficient or non-existent regulation is as likely to
deter entrepreneurial activity. Regulation paves the way for investment, ensures property
rights and spurs entrepreneurial activity, even though the framework has the capacity for
manipulation by malevolent forces for personal gain. In countries where there is high
corruption, the regulatory framework may be either lax or excessive. Either way,
authorities would be foolish to ignore regulation, as a reasonable amount of regulation can
smooth operations and oil the wheels of industry.
2.2.2 Fiscal freedom
Fiscal freedom is another factor critical to a free market. In economies where there are high
taxes, the levies can be seen as a deterrent to investor and entrepreneurial participation
within the marketplace. The findings in McMullen et al (2008) indicate tax hikes have a
direct impact upon entrepreneurial activity, as potential entrepreneurs weigh the risks they
will assume in setting up a business and regard this as a further impediment.

Research has considered whether a country’s tax framework impedes entrepreneurial
activity. Levels of taxation can have a positive or negative impact upon the appeal of self-
employment over salaried jobs which inform decisions made by would be-entrepreneurs.
This correlation impacts the risk-to-profit ratio, determining the relative merits of being an
employer as opposed to being employed. For example, complex tax structures deter
entrepreneurial activity even for those who are risk-averse as they will eventually feel the
effect of continuing tax hikes (Kanbur, 1980; Gentry and Hubbard, 2000).
Another way in which fiscal freedom impacts entrepreneurial activity is the situation in
which high tax rates prompt individuals to look for tax-efficient ways of making a living,
perceiving self-employment as a pathway for tax evasion (Robson and Wren, 1999;
Schuetze, 2000). Where such choices are limited, entrepreneurship is unable to flourish
(Blau: 1987; Parker, 1996; Long, 1982a; Long, 1982b; and Moore, 1983). Another way in
which fiscal freedom determines entrepreneurial potential is how low levels of financial
freedom, in tandem with low levels of risk aversion, can foster an appetite for investment in
risk-assets under certain conditions. For example, profit forecasts suggesting a wealth
reduction spurred by tax hikes are more likely to increase the entrepreneur’s appetite for
accepting the risk and starting a business (Mossin, 1968; Stiglitz, 1969).
It bears note that studies focusing on developed countries have not supported this
acknowledged relationship. Parker (2003) and Bruce and Mohsin (2003) found no evidence
in these conditions that he self-employment option could provide taxation avoidance and
evasion opportunities. They reported that previous studies did not detail relative incomes
of the self-employed and wage earners as a variable that could establish the significance of
the effects of the tax rate. Feldstein and Slemrod (1980), Gordon (1998), and Cullen and
Gordon (2002), highlighted that financial systems are complex and their interrelationships
cannot be easily predicted; and for that reason, the relationship between fiscal freedom and
entrepreneurship can vary depending on existing factors such as capital gains tax, income
tax and corporate tax.
2.2.3 International trade freedom
Trade freedom is another key element of a free market with its attendant absence of

regulation and barriers that impede the free movement of goods and services. Research
shows that government support for the development of domestic industry at the expense of
imports can distort international commerce and add restrictions (Prebisch, 1959; Singer,
1999; Krugman, 1995). The logical extrapolation is that large barriers to international trade
can stimulate internal entrepreneurial rates. In that sense, it could be argued that growing
globalization presents a hostile environment for small businesses. The consensus is that
success in international markets is the preserve of larger companies while smaller
companies are disadvantaged by fixed costs, their limited knowledge of international
markets and limited skills and wherewithal to negotiate with other governments (Vernon,
1970; Gomez-Caceres, 1997).
Other studies contend the message is that business creation and free international trade
enjoy a symbiotic relationship. Bartlett and Ghoshal (1999) conclude that globalization has
created interesting opportunities for small businesses while big businesses benefit from the
fast pace of globalization (because scope and scale allow them to exploit the opportunities),
small businesses benefit from the advantages of the trickledown effect and marginal
opportunism. The research of Sobel et al (2007) shows a negative relationship between
international trade barriers and entrepreneurship. This result supports the World Bank’s
thesis2 indicating that protectionist limitations to international trade impede specialization
and free participation, favor known products over innovation, and limit entrepreneurship
activity because new opportunities to make money are excluded from local entrepreneurs’
alternatives.
Finally it is important to note that research has established a significant relationship
between free international trade and entrepreneurship. Bjørnskov and Foss (2008), Nyström
(2008) and McMullen et al (2008) bear out this theory.
2.2.4 Freedom to Invest
An economy that aims to trade freely will be characterized by few restrictions to the free
2World Bank. (2005). Doing Business in 2005: Removing Obstacles to Growth. Washington, DC: World Bank,
the International Finance Corporation, and Oxford University Press. http://rru.worldbank.org/Documents/DoingBusiness/DB-2005-Overview.pdf
flow of capital investments. The importance of sourcing capital as a prerequisite to starting
a business is no secret. Many researchers have suggested that restrictions on the flow of
capital inhibit the growth rate in business formation (Wetzel, 1983; Blanchflower and
Oswald, 1998; Holtz-Eakin et al., 1994; Di Patti and Dell’Ariccia, 2004). There is also
extensive research establishing that the availability of financial resources, especially
venture capital, is vital to entrepreneurial development (Gompers and Lerner, 2001;
Henderson, 2002). Investment freedom provides fertile ground for the creation of a variety
of instruments and mechanisms that finance entrepreneurship, paving the way for
investment from at home and abroad. The research which investigates more closely that
relationship between investment freedom, FDI and business creation shall be analyzed in
the next section.
Our recapitulation of research already undertaken, in this section, demonstrates that the free
market economy is a source and precondition for entrepreneurship to flourish. The
consensus among researchers seems to be that a free market spurs would be entrepreneurs
to look for opportunities and this unfettered approach imbues the entrepreneur with
confidence which is critical to their success since they depend on themselves. Free market
conditions allow participants to pursue their own plans and make their own decisions
making entrepreneurs more eager to use their own abilities and knowledge to pursue their
economic goals. The aim of this study is to contribute to the existing body of research on
the subject by analyzing the interconnectivity of various factors focusing on emerging
countries. It aims to consider particular aspects of market freedom, particularly relating to
financial issues, international trade, free capital flows and the freedom to start, run and
close a business. The objective is to establish which of those factors has the greatest
influence, how changes in those factors affect them and how the factors interact with
institutional quality and FDI to influence business creation in emerging countries.
2.3 Business Creation and Foreign Direct Investment
Most research thus far has focused exclusively on domestic factors that influence business
creation. It is only recently that researchers have shown some interest in how external
factors such as FDI impact business creation on the local front. The studies have attempted
to deduce whether the presence or absence of FDI encourages or discourages

entrepreneurial activity.
The first raft of research suggests that entrepreneurs benefit from the presence of FDI in
three main ways. The first, to which this paper alluded above, is that in undeveloped and
developing countries financial sources fill the risk capital gap financing innovative ideas
while foreign investors, pursuing greater gains, assume greater risk (White and Fan: 2006).
Meanwhile other studies, Alfaro et al. (2009) and Alfaro and Charlton (2008) have
indicated that economic activity flourishes where there is international financial investment
in those industries that have a greater dependency on foreign financial investment.
Furthermore, entrepreneurs benefit because FDI promotes improvements to infrastructure,
regardless of whether this stems from the domestic government’s bid to look more
attractive to potential investors or whether some of the proceeds from FDI are earmarked
for specific infrastructure projects). The third factor is referred to as the spillover
phenomenon, which has been identified by several researchers (Acs et al., 2009, Görg and
Strobl, 2002; Ayyagari et al., 2010). These studies revealed cumulative positive effects of
FDI upon business creation in Ireland, Belgium and the Czech Republic. Their research
revealed that FDI can have an exponential effect stimulating multiple business entries
within the same industry (“horizontal spillovers”) and within related industries up and
down in the same production chain (“vertical spillovers”).
A second body of research, focusing on occupational decision models claims that FDI can
expedite an entrepreneur’s exit through product and market labor selection (Grossman:
1984)3. Some studies (Aitken and Harrison, 1999 in Venezuela; and Konings, 2001 in
Bulgaria, Romania and Poland) conclude that, at best, the positive impact of FDI is
minimal and the benefits limited to firms that have the highest foreign investment and
dependency. Barbosa and Eiriz (2009) show that, in the case of Portugal, the impact of FDI
is at first, positive; but long-term it has a negative impact upon business creation. Finally,
De Backer and Sleuwaegen (2003) established that, in Belgium, the presence of FDI
discouraged new entrepreneurs from setting up and hastened the demise of existing ones.
3Grossman (1984) demonstrated that competition between companies with imported products and
companies with direct foreign investment forced some entrepreneurs to quit as prices for products dropped and, with them, the entrepreneurs’ earnings compared to what they would earn in salaries.

However, the result can be less severe or even helpful if local and foreign companies can
learn from the experience.
The existing body of research invites further inquiry into the impact of FDI on the business
creation in emerging countries. Data have yet to be collected for several countries over the
course of several years. Specifically, an investigation into whether FDI encourages business
creation in the host country or whether it creates barriers which impede business
development is required. There is also scope for considering how changes in the degree and
flow of FDI can impact business creation and how FDI, the quality of institutions and free
market conditions interact to facilitate an environment, within emerging countries, that is
either conducive or hostile to business creation.
3. Challenges in estimating the effects of FDI, the quality of institutions and a free
market upon business formation: Model development
The objective of this research is to measure how the quality of institutions, FDI and a free
market interact to promote business creation and to compare how the behavior of these
variables changes among emerging, high-income and low-income countries. We then
proceed to build three different models, one for each data set. To this end, we use the data
panel technique as it provides the benefit of using an approach that combines cross-
sectional analysis and time series comparisons. In addition, it offers the benefit of allowing
us to control individual heterogeneity by using a specific range of spatial and temporal
characteristics, not observable or used in the specified variables in the models used in this
study.
In each regression, the test of Wald (Baltagi, 2001) was applied to establish the significance
of variables that control temporal and spatial effects. The results indicate the significance of
temporal effects alone for high-income countries. The purpose of the Hausman
Specification Test is to establish if unseen characteristics have to be assumed as fixed or
random. Test results have indicated random effects, which is consistent with observations
extracted randomly from a greater sample of each class of countries (Baltagi, 2001).
Breusch and Pagan’s Test (the Lagrange multiplier to prove random effects) confirmed the
models used which appear in equation (1) for countries of high-income and in equation (2)
for low-income and emerging countries:

ittititititiit yY '4321 (1)
itititititiitY 4321 (2)
ii (3)
Where itYdenotes a Business creation measure in an i country and during a year t. it
, it , it
and itdenote the associated variables to institutional quality, free market, FDI and control
variables respectively to each country in a year. t It’s a “dummies” yearly dimension
vector t X 1. Equation 3 allows us to control the “individual” characteristics for each
country, i is a random order variable with a median value and a random deviation i .
The challenge is to find consistent values for the coefficients , but this can prompt
problems for three reasons: (1) because the errors of a country can also be correlated to
previous errors in research for that nation, it is probable that new firm registration in a
country at moment t is associate with new firm registration in t-1 (serial correlation); (2)
because the errors for each country in this model can have a non-constant variance
(heteroscedasticity); and (3) because countries’ errors can be correlated during the same
year (contemporary correlation) due to unseen characteristics in certain countries that can
be related to unseen characteristics of other countries. For example, a strong regional crisis
can affect the macroeconomic variables of Latin America emerging countries and,
therefore, the creation of companies in this region, although it does not affect the emerging
countries of Asia and Africa.
In order to analyze serial correlation problems in each regression, the test by Wooldridge
was used (2002). The results in all three groups of countries reject the null hypothesis of
serial non-correlation; therefore, the errors within each country are correlated temporally.
The heteroscedasticity problems were analyzed by means of the Modified Wald Test, in
agreement with Green (2000). This works even though the normal error distribution
assumption is violated. The test failed in rejecting the null hypothesis; therefore it leads to
assume that problem of heteroscedasticity for the three groups of countries exist. Finally,
the Pasaran CD test (cross-sectional dependence) was used to detect whether the errors
between countries were correlated (Hoechle, 2007). The null hypothesis of this test is that

the residues are not correlated and it was only ineffective for the group of high-income
countries.
Beck and Katz (1995) demonstrated that the errors standard of models, Panel Corrected
Standard Errors (PCSE), are more concise than Feasible Generalized Least Squares (FGLS)
models when used to tackle issues with contemporary correlation, heteroscedasticity and
auto-correlation. Since then, many studies have used PCSE in their panel’s models. Here,
the same solution is also used to construct the model for high-income countries given the
problems and dichotomizing variables are introduced to include the significance detected in
temporal effects. However, since there was little temporal observation, PCSE may not be a
valid method of correction (Beck: 2001).
On the other hand, Hoechle (2007) indicates that one may relax the assumption of
independently distributed errors and the estimator of random effects producing consistent
standard errors, if residuals are not correlated between “clusters”. If the variable used to
perform “clusters” is the panel’s identifier (in this case the countries), then the standard
errors are consistent by heteroscedasticity and auto-correlation. Therefore, in the case of
emerging and low-income countries, we used the random effects GLS regression robust
standard error clusters in countries model.
Finally, to mitigate endogenous problems between FDI and the indicators of economic
freedom or FDI and the quality of institutions, we distinguished the differences in time of
the variables. Therefore, in the model used, it is FDI and the amount of goods traded in t-1
with the quality of institutions, the free market and the creation of companies in t.
4. The Data
4.1 Variables Justification, chosen measures and empirical implications:
4.1.1 Degree of business creation, dependent variable.
Entrepreneurship levels can be measured in terms of self employment (approach of the
labor market, used among others by: Acs et al., 1994; Blanchflower, 2000; Blau, 1987;
Bruce, 2000, 2002; Dunn et al., 2000; Gentry and Hubbart, 2004; Parker, 1996; Parker and

Robson, 2004) or in terms of the number of companies created (ecological approach, used
among others by: Armington and Acs, 2002; Bartelsman et al., 2004, Klapper, Leaven and
Rajan, 2006; Klapper et al.. 2007, Klapper and Love, 2010; Verheul, 2009). This
investigation forces us to consider entrepreneurship in relation to creation of an
incorporated economic unit formed legally and publicly registered to execute transactions
with other organizations. We have decided, for that reason, to use an ecological approach
to the rate of entry of new companies (entry density) as a dependent variable. Entry density
is calculated as the number of new companies registered by each 1,000 people of working
age (using a standard range of 15 to 64 years of age).
Data on new business registration in 87 countries from 2004 to 2009 came from the World
Bank Entrepreneurship Snapshots (Table 1). In order to conduct a comparative analysis, we
classified the 87 countries into three separate groups according to their respective levels of
prosperity. The first group comprises high- and medium-income countries; the second
consists of countries which command low incomes. These two groups were categorized
according to the proposed classification outlined in the Atlas of the World Bank4. A third
group comprising emerging countries or frontier emerging countries, was identified with
reference to The Financial Times and the London Stock Exchange (FTSE) Index5. Table 2
shows the countries included in each group.
4.1.2 Limitations of entry density like dependent variable
There are some problems with the dependent variable that can distort the research. First,
entry density is defined in legal terms more than economic terms; the fact that a company is
registered does not necessarily mean that it is an active company. Take companies that are
created solely as financial vehicles – these obviously are not a reflection of entrepreneurial
activity. For this reason, the decision was taken to exclude data from tax havens from the
research.
Also, researchers recommend using indicators for the rate of entry and exit of companies in
4 The definition of the method atlas of qualification of the World Bank can be at this
address:http://data.worldbank.org/about/country-classifications/world-bank-atlas-method. 5 Definition methods from The Financial Times and the London Stock Exchange (FTSE) Index can be found at
this address: http://www.ftse.com/Indices/Country_Classification/index.jsp
this kind of research, because although many new companies may fail, existing companies
can also be liquidated for a variety of reasons from failure to acquisition. The theoretical
model for entry and exit was developed by Joyanovich (1982) and Hopenhayen (1992).
They emphasized the importance of using the entry-exit dynamic but factoring in failure
rates for businesses that lose competitiveness in the market or are outmaneuvered by the
advantages of potential competitors. These studies tend to disregard normal industrial
dynamics except for FDI, the quality of governance and free market conditions upon
business creation. Although industrial dynamics can influence business creation as
companies flourish in sectors which are more productive and where resources are greater,
institutional variables and a free market affect all economy sectors in a country. The
difference in economic dynamics between countries is controlled economic growth and the
amount of goods traded, more of which later.
Research is also thwarted by how registries operate and store data in some countries for
example how or whether ownership or company name changes are recorded. Company
registration can also be affected by economic or legal reforms that may prompt existing
businesses to formalize their activities. To counter this, we individualized countries, and
when the phenomenon occurred we used dummy variables or, in some cases, removed the
countries from the sample.
Also, our focus has been on formalized businesses although it is accepted that other studies
have indicated that entrepreneurs are more inclined to operate informally to evade
bureaucracy and corruption. It is also the case that too stringent a regulatory framework or
increased governance may encourage entrepreneurs to set up informal business models
(Johnson et al., 1998, and Friedman et al., 1999). This work focuses on which factors spur
entrepreneurs to set us businesses formally because of factors that support their enterprises
such as legal protection, access to credit from reputable sources and access to legal sources
of labor and external markets (Schneider and Enste, 2000).
4.1.3 Institutional quality
The quality of institutions is determined according to the most recent version of
“Worldwide Governance Indicators (WGI)” (Kaufmann et al: 2010). These indicators are

available for 212 countries and record six dimensions of institutional quality, for the years
from 1996 to 2009: Voice and Accountability (Voi_Acc); Political Stability and Absence of
Violence/Terrorism (Pol_Sta); Government Effectiveness (Gov_Eff); Regulatory Quality
(Reg_Qual); Rule of Law (Rule_Law); and Control of Corruption (Ctrl_Cor); the
definitions and sources for the calculation of each one is in Table 1. Each indicator is
calculated from 35 sources such as non-governmental organizations and specialized
international organizations on the subject, for developed and developing countries. The
scale ranges from -2.5 to 2.5; the highest values corresponding to greater institutional
quality for each factor where a positive impact on Entry-Density is expected.
The WGI have been used for several years in some groundbreaking studies (Wernick et al.;
2009; Dollar and Kraay, 2002; Asterly and Levine, 2003; Faccio, 2006; Gupta et al., 2002,
Demirguc-Kunt et al., 2004; Pande and Udri., 2006). The WGI also reflect the importance
of good governance and a sound political system consolidating economic growth as set
forth in the New Institutionalism Theory (North, 1990, Hayek, 1960; Williamson, 2000)
and The New Theory of Economic Growth (Knack and Keefer, 1995; Olson, 2000; Knack,
2003; Azfar and Cadwell, 2003).
When analyzing bivaried correlations between indicators of each dimension of the WGI, it
was established that they are high in countries of high income (0.7997 up to 0.9862), less
high in emerging countries (0.5019 up to 0.8796) and more dispersed in low-income
countries (- 0.3074 up to 0.8092). In the first and second examples, this behavior
demonstrates relationship to common dimension dependency. In order to establish if there
was dependency of a common dimension, principal components analysis was made
(Ledesma and Bullet mold-Moor: 2007). The analysis revealed that one factor attracted the
values of 90.84%, 70.16%, 46.11% from six indicators for high- income, emerging and
low-income countries, respectively. The dependency is confirmed for our study focus (the
emerging countries). It creates a new variable measuring the quality of institutions quality
(Inst_Qual), being the mean of six factors in one year. The use of averages to measure the
institutional influences on entrepreneurship has already been adopted by Wennekers et al.
(2005), Van Stel et al. (2007) and McMullen et al. (2008).

4.1.4 Free markets and foreign direct investment
There is no universally accepted method of measuring the propensity for a free market. For
our part, we use the measures included in The Index of Economic Freedom (IEF) of the
Heritage Foundation (Beach and Kane, 2007). The index offers independent indicators
associated with different categories relating to a free market. In this work, the indicators
are: freedom to establish companies (Bus_Free); freedom to trade internationally
(Tra_Free); fiscal freedom (Fiscal_Free); and freedom to invest (Inv_Free). Definitions and
sources are in Table 1. These indicators are designed so that together they measure the main
aspects of a free market in a country by reference to how the players respond to changing
market conditions. Other studies that used this methodology using IEF indicators are
(Claessens and Laeven, 2003; Klapper et al., 2006; McMullen et al., 2008; Aidis et al.,
2010; Doucouliagos and Ulubasoglu, 2006; Heckelman, 2000; Han and Sturm, 2000).
The bivaried correlations between the indicators of the four IEF dimensions included in this
work, in countries of high-income range from -0.6049 up to 0.6865, in emerging countries
from -0.0502 up to 0.4047 and in the countries of low-income from -0.1779 up to 0.5045.
Principal Component analysis was used to review multicolinear conformity. “Eigenvalues”
for the first four factors were 2.47796, 1.10683, 0.86338 and 0.73072, respectively. In
accord with standard practice the first two factors are retained. However, four variables to
measure a free market were used in the model as two factors alone were insufficient to
explain the existing relationship conclusively. This approach is justified for three reasons:
(1) a steep fall in the magnitude of “eigenvalues” is not observed; (2) to retain two factors
would imply high costs of singularity for indicators like Bus_Free and Tra_Free (values of
singularity of 0.6113 and 0.4219, respectively); and (3) Costello and Osborne (2005)
mention that the orthogonal rotation does not use all the information available in these
cases. Actually other investigators have identified the independent effects of Bus_Free
(Claessens and Laeven, 2003; Klapper et al., 2006; Desai et al., 2003), Fiscal_free
(Kanbur,, 1980; Gentry and Hubbard, 2000; Parker, 2003) and Trade_Free (Horst, 1972;
Bartlett and Ghoshal, 1999) on business creation. For these reasons, we consider each
indicator separately in our model.
Finally, FDI is measured by the net flow of foreign investment divided by the gross

domestic product, with data based on the World Development Indicators compiled by the
World Bank. This variable can be related to Inv_Free, but analysis of the variables (Table 4)
shows the values are low in low-income and emerging countries. One theory is that while
FDI measures investment inflow, Inv_Free is related to existing regulation. As
demonstrated, entrepreneur-friendly regulation is essential though not, of itself, enough to
attract FDI. As discussed, to mitigate endogenous problems between FDI and any free
market indicator or between FDI and measurements of institutional quality, temporal
differences in the variables is introduced.
4.1.5. Control Variables
The historical perspective would seem to suggest that the relationship between FDI, the
quality of governance and a free market will work together in favor of budding
entrepreneurs in emerging countries. Even so, a series of control variables were included to
ensure that the relationship between the explanatory variables and dependent variables
could be authenticated. Five control variables were included (See Table 1 for a detailed
description of each variable). The first variable is the amount of domestic credit available to
the private sector, represented as a percentage of GDP, since many investigators have
suggested poor cash flow will inhibit the rate of business formation (Blanchflower and
Oswald, 1998; Holtz-Eakin et al., 1994; Di Patti and Dell'Ariccia, 2003).
The second variable is GDP per capita (GDP_PCU), expressed in dollars and at current
prices and exchange rates obtained from data from the United Nations (UNCTADstat).
Some authors have found robust influences of this variable on entrepreneurial behavior, for
example Lucas (1978), Acs et al., (1994) and Klapper et al., (2010). The third variable is
the percentage of unemployed people in the total labor force (Unemployed), information
obtained courtesy of the International Monetary Fund: World Economic Outlook Database.
A number of studies link this factor to business creation (Blanchflower, 2000), (Staber and
Bogenhold, 1993) and (Cowling and Peter, 1997).
The fourth control variable is the rate of inflation, gleaned from the International Monetary
Fund: World Economic Outlook Database which represents the economic atmosphere for
each country. It would tend to suggest that unstable economies discourage formal business

creation. The final control variable introduced is a trade of goods and services index,
represented as percentage of GDP (Trade), showing the volumes of imports and exports to
and from a particular country in a specific year. The expectation here is that amount of
compromised goods will have an impact on the number of businesses created in any given
period.
4.2 Data Description
In Figure 1, the y axis is the number of new companies registered per 1,000 people of
working age (using the standard measure of adults between 15 and 64 years) while the x
axis is a measure of the quality of governance calculated according to the average of the
World Wide Governance Indicators (Kaufmann et al., 2010), the net flow of foreign
investment divided by GDP, and the index of freedom to make businesses (Beach and
Kane, 2007). Governance is at its best in countries with high incomes, less impressive in
the emerging countries and much smaller in the low-income countries though the trend is
for the relationship to be positive in all three groups of countries.
The correlation between FDI and entry density is also positive for all three groups of
countries though it is at its most pronounced in emerging countries and falls significantly in
low-income countries. This is because FDI is measured as a percentage of the GDP,
therefore, in low-income countries, smaller amounts of FDI account for a greater
percentage of GDP. The objective of this study is to demonstrate that FDI in an economy
can stimulate business creation and, for that reason FDI is measured, not in absolute values
but as a percentage of GDP. In low-income countries, data show that, even though for
some of those beneficiaries of funding, FDI can be a high percentage of GDP, it does not
always follow it will always lead to high levels business creation. Fundamentally, this is
because much of this investment is directed to the operation of natural resources, as is the
case of poor Africa countries (Asiedu, 2005) or Latin American countries (ECLAC, 2008).
This would seem to suggest that, in emerging countries, FDI is more important a stimulus
to business creation than in the other two groups of countries examined in this study.
The behavior of indicators to measure the extent of the free market is different from the two
previous indicators. Minor differences are observed between the values of averages and

ranges for the three groups of countries (Table 3). The graph plots the index for the
freedom to create businesses against that for entry density for new businesses – the
relationship in low-income countries being strongest. This would tend to indicate that in
countries where the regulatory system is more flexible, the landscape is more conducive to
new business creation than in other countries. As Table 3 shows, the data for all variables is
not complete and in the case of low-income and emerging countries, we work with non-
balanced panels.
5. Results Analysis
5.1 New business registration determinants
Table 5 illustrates the correlation between each of the independent variables and the
dependent variable, for each group of countries. The variable that measures the strength of
governance is significant and positive in all the cases. This leads one to conclude that the
quality of institutions can explain the differences in rates of new business creation across
the three groups of countries. The results of the equations (1), (2) and (3) show that the size
of the associated coefficient to institutional strength is greatest in high-income countries,
lower in emerging economies and smallest in low-income countries. It could be that, in
high-income countries, there is greater institutional quality leading to increased entry
density. However, upon analysis of the relative size of the coefficient measuring
institutional quality against the size of other, this could be done to what DiMaggio and
Powell (1983), and North (1990) observed were institutional changes that are slow,
incremental, continuous and show dependency patterns. Consequently, the variable reflects
a cumulative effect most notable in high-income countries. This is borne out by contrasting
these results with other indicators for institutional quality. Our research showed that, when
contrasting four of the five countries that saw the largest number of new business
formations on average per year over the past four years (the United Kingdom, 385,600;
Canada, 194,750; France, 137,018; and, Japan, 122,816), they have consistently been in the
top 25 countries in the world in terms of institutional quality rankings (Krause, 2010).
The freedom to form businesses is significant and positive in all three groups of countries.
This is consistent with the view that rigid and expensive barriers to starting up businesses
can impede entry density and deter entrepreneurs from formalizing existing businesses,
across all three groups of countries. Take the example of Latin America. Based on the
Economic Commission for Latin America and the Enterprise Solutions Network Project
(ECLAC - FUDES), 2006 was a bad year with submittals at 88%, concurrently reducing
52% of the requested requirements, a 67% reduction in the number of inscriptions process
steps for the companies and 53% fewer entrepreneur visits to the institutions, particularly in
low-income countries such as Bolivia and Guatemala. However, moving forward, these two
countries saw rises of 24% and 120% in new business formations, from 2007 to 2009,
respectively.
Fiscal freedom has a positive impact but it is only significant in high-income countries. In
this group, complex tax regimes discourage would be entrepreneurs. One reason their fiscal
freedom does not seem to be as important in lower income countries is that their smaller
companies cannot benefit from tax breaks or subsidies and are more susceptible than larger
companies to the costs of bureaucracy cost, as the report “Doing Business: How to Reform”
of the World Bank (2007)6 indicates.
Freedom to invest also has a positive impact only to a significant extent in emerging
countries. Emerging markets are also, by definition, undergoing accelerated growth and
industrialization. Investment freedom is, therefore, a motor driving the industrialization
process because it promotes multiple instruments and financing mechanisms, diminishing
obstacles to cash flow and paving the way for local and foreign investors. The emerging
countries in our list which registered the largest numbers of business formations over the
period have been those that have been making reforms for years that support foreign
investment. These include Indonesia7 and Romania
8 which have since the 1970s and 1990s,
respectively, introduced regulations specifically designed to open doors to foreign
investment”. In Brazil, Resolution No. 2689 of 26 January 2000, from the National
Monetary Council, allowed foreign organizations to use all investment mechanisms
6 http://www.doingbusiness.org/~/media/fpdkm/doing%20business/documents/annual-
reports/english/db07-fullreport.pdf 7Zahri, A. (1971). “Open Door Policy and Foreign Investment”. Intereconomics. 6(4): 117-20
8 Helmenstain, C. y Voicu, I. (1995).”An exploratory Analysis of Joint Venture Performance in Romania”.
Institute for Advanced Studies Vienna, East European Series 17. http://www.ihs.ac.at/publications/eco/east/ro-17.pdf

available to Brazilian investors in Brazil financial markets. Meanwhile, in Colombia, since
the 1990s pension fund (AFPs) regulation has evolved permitting foreign investment in the
private capital fund. In this regard, this development outshines other reforms in Latin
America9.
Freedom to trade internationally is important for both high- and low-income countries. In
the former, the coefficient shows negative impact; in the latter, it is positive. This indicates
that a lack of regulation and the absence of barriers impeding free movement of goods and
services have a negative impact on new business formation in high income countries but,
conversely, a positive one on the same process in low-income countries, according to the
Organization for Economic Co-operation and Development (OECD)10
. Companies in
industrialized countries have been operating for decades in a largely globalized economy.
Supply chains in industries have been globalized in a bid to reduce costs and increase
productivity in order to be more competitive at a national and international level. One way
of achieving this is to produce goods more efficiently and to use supplies from the most
effective producers, national or internationally. This has led to fragmentation in several
countries as businesses offshore processes. Offshoring allows businesses to buy goods or
services from foreign suppliers or move parts of the process abroad.
In terms of business creation, this phenomenon can be detrimental to high-income
economies but positive for low-income economies. That is because offshoring has resulted
in the partial relocation of activities that have led to shrinkage in production in high-income
countries as work moves to countries where wages are lower and public services or raw
material cheaper. The study by the OECD shows the rate of imports over domestic
production of intermediate goods has risen in all countries considered in this study, between
1995 and 2000.
Second, thanks to the relaxation of regulatory barriers to international trade and large
increases in FDI, foreign branches of multinational companies have become more
9Official newsletter of the Latin American Venture Capital Association, March 27/2011.
http://lavca.org/2011/01/27/executive-briefing-latam-governments-open-the-door-to-global-pevc/ 10
OECD (2007). “Moving Up the Value Chain: Staying Competitive in the Global Economy: Main Findings”.:
http://www.oecd.org/dataoecd/24/35/38558080.pdf

important to low-income countries where they represent increasing volume of businesses,
jobs, and research and development. The aforementioned OECD study11
shows a 24%
increase in labour forces for foreign subsidiaries from 1995 to 2001, in countries within its
remit. The corollary is that multinational companies in developed countries have a
competitive advantage derived from intellectual capital so they can take advantage of
business opportunities by creating subsidiaries and affiliated companies abroad. Affiliated
ones not only serve local markets but become essential links in the multinational’s global
supply chain. The OECD report has shown that exchange within the corporations has risen
over recent years, affecting the interpretation of commercial deficits between countries.
Part of the commercial deficit between the United States and China relates to imports that
North American companies bring subsidiaries in China. For developed countries,
competing in traditional industries based on low costs, is no longer an option but businesses
have moved up the supply chain, focusing on specialist areas of expertise. This process has
led to “de-industrialization” accounting for a drop of between 5% and 20% in
manufacturing jobs in all OECD countries, except Portugal, with those activities
transferring to other countries.
All the previous issues have generated challenges for small companies in high-income
countries. Expanding activities internationally can be a difficult step for small companies.
There is then a trend towards mergers and acquisitions to manage the volumes required to
support the cost of research and development, training and business administration lower
down the supply chain, allowing enterprises to maintain productivity and retain high
standards of quality.
Finally, FDI has a positive impact on business creation in all groups of countries but is only
significant in emerging countries. This activity supports the hypothesis that FDI encourages
entrepreneurial activity in emerging countries. There is a lot of evidence supporting this
assertion. For example, the Offshore Location Index of A.T. Kearney11
, shows that of 25
best performing countries in 2004, 19 are classified as developing economies, 14 of them in
11
A.T. Kearney since 2004 produces an index that analyzes and classifies the first 50 countries worldwide like the best host countries to offer offshore activities, including IT and support services, contact centers and back-office support. Report series about the index was consulted on April 14/2011 from: http://www.atkearney.com/images/global/pdf/Making_offshore_s.pdf

the top quartile of countries with the greatest entry density levels among emerging
countries.
Similarly, worldwide reports of foreign investment from the United Nations12
have, since
2005, shown that developing and emerging economies have received the largest proportion
of worldwide FDI. Of the top 33 countries, targeted for research and development funds
from overseas in 2005, 17 are considered developing economies and 14 of them are in the
mid-high segment of emerging countries, in terms of their rates of entry density over this
period. This would suggest that FDI has not only has boosted business creation through
offshoring of products and services in emerging countries but qualified functions such as
research and development are also outsourced to companies in emerging markets.
The OECD report shows how internationalizing I+D in developing countries has flourished
as some countries offer a combination of low wages and good educational standards (one of
the characteristics of emerging countries). The presence of multinational companies has
affected productivity in emerging economies. Although that prompts competition among
domestic businesses, it also moves the technology and know-how to countries that can
benefit from it. The trickledown effect of technology and knowledge from multinational
companies to domestic ones creates training and supply chains so that local entrepreneurs
create domestic businesses within the same sectors and related sectors, up and down the
supply chain.
5.2. The impact of timing of changes to the quality of governance, FDI and free
market regulation in relation to business creation
Another important stage is establishing for how long independent variables have an impact
on business creation. The equations in table 6 illustrate this correlation. In Equations (4)
and (5) for emerging countries, and (6) and (7) for low-income countries13
, it appears that
12
The surveys series about FDI in the world was emitted by United Nations since 1991. It was consulted in April 14/2011 from: http://www.unctad.org/Templates/Page.asp?intItemID=1485&lang=1 13
The numbers of observations were incremented for low income countries due to historic data availability with dom cre variable.

entry density is dependent upon conditions that prevailed a year or two years before the
creation of a particular business. The result shows how significant perceptions about the
quality of governance over the past two years are to the rate of business creation in present
times for both groups of countries. This indicates that in countries where the governance
improves gradually and is sustained, conditions will be more conducive to business
creation.
Variables that measure a free market do not behave the same way as those that measure
standards of governance. Previous values for the variables are not sufficient to explain its
effects. This would indicate free market regulation is significant in the year in business
creation and that an entrepreneur’s decision to set up a business is informed by current
regulation. It is possible entrepreneurs consider prevailing stability and sustainability of
regulation over the standards of governance before embarking on particular projects. The
only exception is the variable measuring openness to international trade for low-income
countries, a relationship which is relevant until the year before the entrepreneur sets up
operations.
Finally it is possible to see in equations (4) and (5) that the FDI effect on the creation of
companies conserves its importance for both previous periods in the case of the emerging
countries. The coefficient shows the significance of FDI received two to three years before
the formation of businesses, in the current year, showing that emerging countries work hard
to attract quality FDI (which produces economic, technological and social development)
and not only great FDI amounts has had effect at least in the period of studied time.
5.3. FDI Productivity in the creation of companies at emerging countries
Tables 5 and 6 show the influence of good governance and FDI on business creation in
emerging countries while good governance can also, in turn, be a catalyst determining how
effective FDI is for business creation. Table 7 looks at this relationship. To avoid endogeny
between variables the equations consider the amount of FDI at moment t-1 with the
strength of institutions at moment t and the dependent variable Entry Density at moment t.
Equation (8) orders the 35 emerging markets examined as part of this study, based on their
institutional quality. The first independent variable measures institutional quality showing

a direct and significant correlation with the dependent variable. The following independent
variable multiplies FDI by one if the country’s institutional quality is in the lowest quartile
or zero if it is the reverse. The third independent variable does the same for the countries
whose institutional quality is ranked in the first to the third quartiles. The fourth
independent variable repeats the previous process with countries whose institutional quality
is in the top quartile of emerging countries.
The main characteristic of this regression is the significance and size of coefficients used to
represent the independent variables, identified above. The size of the coefficients for
countries with institutional quality that is better than that of those in the first quartile is
greater than the size of the coefficients of the countries located below the first quartile
(0.064 is greater than 0.057 and 0.007). In addition, the coefficient for countries in the top
quartile loses its significance. The conclusion is that size and significance of FDI
coefficients depend on institutional quality. It should be then that FDI has a positive impact
on business creation in emerging countries with better institutional quality.
In order to test the strength of the result in equation (8) equation (9) divides the 35
emerging countries into two groups and repeats the process in equation (8) for both groups
of countries. The first independent variable that measures institutional quality continues to
show a direct and significant correlation to the dependent variable. The second independent
variable, which multiplies FDI by one if that country’s institutional quality is mid-to-high
or by zero if the reverse, shows a significant coefficient with more than five times the third
coefficient’s variable and does the same for those countries whose institutional quality is
mid-to-low (0.65 as opposed to 0.012). Also, the coefficient associated with countries
whose institutional quality is mid-inferior loses significance. Again, it is shown that FDI is
only effective in spurring business creation in emerging countries with better governance
and FDI is most effective in this regard in countries with high institutional quality.
Previous studies have shown that countries with better governance attract more FDI14
.
Tables 5 and 6 show better governance and FDI contribute to greater business creation. But
table 7 is more detailed showing how institutional quality and FDI combine to spur
14
A complete review of empirical determinats of FDI can be found in: Blonigen, B. (2005). “A Review of the Empirical Literature on FDI Determinants”. Atlantic Economic Journal. 33(4): 383-403

business creation in emerging countries. It has been shown that once FDI reaches a certain
level, it is more productive and only significant in emerging countries with greater
institutional quality. Thus, good institutions are key to attracting FDI flows to a country
and, once it has arrived, influence the flow of FDI, maximizing its potential and ensuring it
has the greatest impact on business creation in the emerging countries.
This result shows how the characteristics of good governance – included in the indicator
used in this work to measure it – interact with FDI to promote business creation in
emerging countries. On one hand, the measure for institutional quality used in this study
factors in political stability, corruption control, protection for the property rights and lower
crime rates. These factors determine where FDI may wind up in emerging countries,
limiting the likelihood that the funding misplaced and reducing costs for those setting up
businesses. They also increase the expected return for investors. On the other hand, the
institutional quality measurement used in this study also includes factors such as
representation and political control; and the effectiveness of government and regulatory
quality. This last group of factors measures an individual’s capacity to vote in a new or back
an existing government, depending on their ability and commitment to developing and
implementing politics and rules that favour the development of private sector development.
The factors, associated with good governance, determine how FDI can produce economic,
technological and social development, and well-being through the creation new businesses
and, in turn, new jobs. So, the quality of institutions can make a difference, ensuring that
FDI becomes a source of financing to assist new businesses and funding improvements to
infrastructure that benefit local entrepreneurs and lead to horizontal or vertical spillovers.
Unless this is so, FDI will not foster much business creation in the donee country.
5.4. The strength of the results
5.4.1. Variation in the creation of companies and changes in the institutional quality,
FDI and the free market in emerging countries
The results obtained thus far have focused on how the extent to which a free market
operates and good governance and how they inter with FDI from each country can explain
the differences in levels of firm creation in the emerging countries. However, if the
relationship between these three factors really mattered, the changes in these variables
would have to show a measurable impact on the rate of entry density for the emerging
countries.
Table 8 shows the impact to entry density variation (of t-1 to t) of changes in several
variables. Institutional quality (t-1 to t), FDI (t-2 to t-1) and free market variables (of t-1 to
t) that have demonstrated their impact in the previous regressions (the freedom to start
businesses and to invest). In equation (10), all the variables behave as expected. Variations
in institutional quality, the freedom to start a business and to invest changes are significant
with a confidence level of 95%. Meanwhile, the fluctuation in FDI is highly significant,
recording a confidence level of 99%. Note that equation (10) explains nearly 40% of the
variations in entry density for emerging countries. This result is consistent with those
recorded in the foregoing tables together with evidence that changes to a free market and
standards of governance affect the rate of new business creation in emerging countries,
even in the short-term.
This does not go against the fact that investors and entrepreneurs monitor for patterns that
favour institutional quality and a free market. As can be seen at table 6, the perception of
institutional quality for the previous two years impact, impacts the capacity for business
creation in the current year. This shows institutional quality for the previous two years is
important because it informs the entrepreneur’s perception of whether the changes are
temporary or permanent and how stable a system it is. If a country has a history of
institutions that have shown low quality, doubts will persist about the impact of recent
reforms and their longevity. That may be because the influence of political leaders and the
decisions that they made while power can be felt for some time after they have left office
while social customs can impede the effectiveness of any reforms.
There are several methods for testing these results against reality. First, an alternate source
that measures institutional quality and the free market in several countries around the world
is “the Economic Freedom of the World Index”15
. We used the results obtained by the
countries in this index from 2005 to 2009 to determine the degree of improvement
15
Gwartney, James and Robert Lawson with Herbert Grubel, Jakob de Haan, Jan-Egbert Sturm, and Eelco Zandberg (2009). Economic Freedom of the World: 2009 Annual Report. Vancouver, BC: The Fraser Institute. Taken April 17/ 2011 from: www.freetheworld.com

(variation) to institutional quality and the openness of the free market over this period. We
divided the countries into quartiles and analyzed the results for the 10 best performing
countries in terms of entry density for the emerging markets reviewed in this study. Apart
from Hungary, the other nine (Bulgaria, Macedonian, Romania, Latvia, Slovenia, Slovakia,
Russia, Croatia and the Czech Republic) are in the second quartile.
The report of “Doing Business: How to Reform” from the World Bank (2007), ob cit,
explains, using specific examples, how these countries have adopted reforms that improve
the quality of governance and lay the groundwork for a free market. For example Bulgaria
has simplified the process of company registration and taken steps to better protect
investors; Romania has streamlined the amount of paperwork required to gain permits and
licences and has increased disclosure requirements for the benefit of investors; Macedonia,
has also reduced the backlog of cases in its courts of first instance thereby increasing their
capacity to adjudicate on contractual matters that will benefit the business community.
5.4.2 Entry density variations and FDI Changes. Emerging and frontier emerging
countries comparison.
“The Financial Times and the London Stock Exchange, FTSE Index”16
separates emerging
markets intop two groups, emerging and frontier emerging markets. Frontier emerging
markets have a tendency to be smaller, less developed and less sound among the group of
emerging countries. According to the FTSE, frontier emerging markets are typically
attractive to investors who look for high long-term returns, independence and low
dependency upon other markets. Typical of a frontier emerging market is that, as the time
goes by, it will become a market which is similar in character, in terms of risk and return, to
a more developed emerging country. The distinction between emerging and frontier
emerging markets is important to our work, as the latter tend to demonstrate a greater
openness to FDI and are not subject to extreme economic and political instability in which
case, if our results to date are representative, in frontier emerging market, the value of FDI
would have to greater than that for the rest of emerging countries. This would be another
method of corroborating existing results.
16
Method definition of the “Financial Times and the London Stock Exchange, FTSE Index” can be found at: http://www.ftse.com/Indices/Country_Classification/index.jsp
In equation (11) of table 8, impact is analyzed by the variation that has (of t-1 to t) in entry
density changes in several variables. They are institutional quality (of t-1 to t), FDI (of t-2
to t-1) and free market variables (of t-1 to t) which have shown significance in previous
regressions (freedom to form businesses and to invest). As in equation (10), all the variables
behave as expected and changes in standards of institutional quality, the freedom to form
businesses and to invest are significant, as together they can lead to a confidence level of
95%. The difference in this case is that the FDI variation was distributed in two mutually
exclusive variables. The countries were classified as frontier emerging and emerging. In
one, FDI is multiplied by one if the country is frontier emerging or by zero if it is not. In the
other variable, it is a constant for the remaining emerging markets that are not classified as
frontier markets. As can be seen, equation (11) is more illuminating in this regard than
equation (10). In addition, although the two variables for FDI are still significant in
explaining the variation in entry density in emerging countries, the coefficient for frontier
emerging markets is the double and shows greater levels of confidence (99%) than in the
remaining markets within the group (90%). This result is consistent with the hypothesis
raised at the beginning of this section and with the results of the previous tables.
6. Summary of Results
Results show a strong positive correlation between institutional quality and the rate of
business creation in all three groups of countries. They also demonstrate that the quality of
institutions and fluctuations in this quality can continue to have an influence on the creation
of new businesses for up to two years from the date at which that quality is measured,
compounding the importance of the relationship. The relationship between the freedom to
create businesses and the availability of investment has the most significant positive impact
on company development in emerging countries. Likewise, access to international trade has
the greatest impact in low-income countries. Previous studies have not indicated that these
factors are significant or that they have had an effect on latest levels of business
development. This tends to indicate that the regulation of the free market has a short-term
impact on business creation and that it is the current prevailing regulatory climate that
determines whether an entrepreneur decides to start a business. However, entrepreneurs
also pay heed to the stability and longevity of rules in terms of how they have contributed
to the quality of institutions.

Finally, the study has recorded a strong direct impact for FDI upon business creation in
emerging countries. Furthermore, where institutional quality is concerned, FDI remains an
influential factor for at least two years from the date that quality is measured. The study
also indicates that the quality of institutions multiplies the effectiveness of FDI’s
contribution to business creation. The strength of the relationship is verified by: (1)
controlling the possible endogenous relationship between FDI and institutional quality; (2)
establishing the significance between variations in FDI and business development; and (3)
observing that the FDI coefficient is largest in the frontier emerging countries as opposed to
other emerging countries. This last result is consistent with “the spillover theory of
entrepreneurship” (Acs et al., 2009, Görg and Strobl, 2002; Ayyagari et al., 2010).
7. Study limitations and further investigation
In this study, the relationship between the strength of governance, a free market, FDI and
business creation is investigated. Although there have been some obstacles that future
research should be able to surmount, evidence exists that some regions with strong existing
manufacturing industries, make room for some business creation but to a lesser extent
(Audrestsch and Fritsch: 1994). To illustrate this, in Klapper et al. (2007), it is shown that
businesses in financial services and retail are as important in developing countries as in
developed countries, while manufacturing and services businesses are half as important.
This would seem to invite inquiry of a greater depth to determine why entrepreneurs in
certain sectors are more likely to flourish in certain sectors in developing countries and not
others.
The relatively small sample of emerging countries and limited duration of the analysis in
this study, as foregrounded, limit the number of variables that can be included in the model.
Therefore other variables, that have already been identified by research as being cogent,
could not be included. By extending the number of countries and studying them for longer,
socio-cultural variables could be factored in which shed more light on the model and how it
works and to illuminate the results. Also entry density figures are available only for a few
emerging countries so it is critical to develop models that combine economic and socio-
cultural variables to explain how entrepreneurship works in developing countries.
Another challenge has been measuring the relationship between a free market and the
strength of institutional quality. The correlation is a complex matrix of factors. Averaging
several factors associated with the strength of institutional quality supposes that those
factors have equal weight, which is not necessarily so, but begs the question how else can
the relationship be evaluated?
A next step may be to determine whether the factors that facilitate opportunities for
business creation are the same as those that are needed to see businesses survive.
Establishing determinants can assist nascent companies reach maturity and fulfill their
social and economic potential. Also, it would be opportune to determine how these
environmental factors can affect particular industrial sectors differently to determine how
policy is devised and the landscape for would be entrepreneurs to create a level playing
field. Finally, how the political and economic landscape influences entrepreneurial activity
is ripe for further investigation.
8. Conclusions and the implications of public policy
This work contributes to a body of research on what sparks company creation in emerging
markets. First it investigates the relationship between institutions and business creation,
analyzes the impact of the timing of the degree of institutional quality and establishes how
changes in the institutional quality affect business creation. Second, it reveals the
relationship between entrepreneurship and aspects of a free market in terms of those
particularly those relevant to the subject of the study such as foreign trade, flows of capital
and the ease with which individuals may start, run and close a business) and how changes
in these factors affect business creation. Third, it analyzes how FDI affects business
creation. It also determines how external participation affects the internal economy in how
fertile an environment the countries become for business creation. Finally, it analyzes the
interaction between FDI, the quality of institutions and the role of a free market in business
creation in emerging countries.
Data for the six years from 2004 to 2009 and for 87 countries from the registry of new
companies database of the “The World Bank Entrepreneurship Snapshots” formed the basis
for this research. To recap, in order to conduct comparative analysis, the 87 countries were
divided into three groups. The first group comprises countries of high- and mid-high
income; the second group consist of low- income countries, both of which groups were
selected according to the Atlas of the World Bank. Meanwhile, a third group of emerging
and frontier emerging countries was formed with reference to “The Financial Times and
The London Stock Exchange: the FTSE index”.
The results suggest that those who devise public policy must consider FDI as a catalyst to
business creation, its impact compounded by the strength of governance. Good institutions,
besides attracting FDI also create regulatory frameworks to attract desirable types of FDI.
Emerging countries must make efforts to attract FDI that produces economic, technological
and social gains and not only great amounts of FDI. Additional indicators must be used so
efforts are channeled in such a way as to maximize the effectiveness of FDI, creating
businesses that last. These include job creation; value added and change of value added by
worker; capital expenses by employee; the use of local suppliers and other forms of
relationship with the local economy. However, of supreme importance are those factors
related to investment in training and technology. This is because, in this sector, there is a
greater multiplying effect prompting domestic companies within the same industry to cross-
pollinate (horizontal spillovers) and, within related industries, to have a positive effect on
other businesses up and down the production line (vertical spillovers). To illustrate this, a
technology company may require qualified workers who are better paid thus creating
demand within the local market which other technology companies create demand for
services of greater value, making room for healthy competitive from other local companies.
As a side note, the author recognizes that the study is but a first step into what promises to
be a rich vein of investigation into how public policy can be devised so as to attract foreign
investment, promote a free market and create and maintain institutions that allow new
businesses to enter the market and to succeed.
Bibliography
Acs, Z., Audretsch, D. & D. Evans (1994). “Why Does the Self-employment Rate Vary
Across Countries and Over Time?”. CEPR Discussion Paper 871, C.E.P.R. Discussion
Papers..
Acs, Z., Braunerhjelm, P., Audretsch, D. & B. Carlsson (2009). "The Knowledge Spillover
Theory of Entrepreneurship". Small Business Economics. Springer. 32(1): 15-30.
Aidis, R. & T. Mickiewicz (2006). “Entrepreneurs, Expectations and Business Expansion:
Lessons from Lithuania”. Europe Asia Studies. 58(6): 855-880.
Aidis, R. & Y. Adachi (2007). “ Russia: Firm Entry and Survival Barriers”. Economic
Systems. 31(4): 391-41.
Aidis, R., Estrin, S. & T.Mickiewicz (2008). “Institutions and Entrepreneurship
Development in Russia: A Comparative Perspective”. Journal of Business Venturing. 23:
656-672.
Aidis, R., Estrin, S. and T. Mickiewicz, (2010). “Size matters: entrepreneurial entry and
government”. Small Business Economics. On Line FirstTM. PP. 1-21. Taken January 22 /
2011 from: http://www.springerlink.com/content/t8034l00p0vt0030/fulltext.pdf.
Aidt,T. (2009). “Corruption, Institutions and Economic Development”. Oxford Review of
Economic Policy. 25(2): 271-291.
Aitken, B. & A. Harrison (1999). "Do Domestic Firms Benefit from Direct Foreign
Investment? Evidence from Venezuela." American Economic Review. 89(3): 605–18.
Alfaro, L. and A. Charlton (2008). “International Financial Integration and Entrepreneurial
Firm Activity”. Harvard Business School Working Paper 07-012. Taken en february 22 /
2011 de: http://www.hbs.edu/research/pdf/07-012.pdf
Alfaro, L., Kalemli-Ozcan, S. & S. Sayek (2009). “FDI, Productivity and Financial
Development”. World Economy. 32(1): 111-35
Armington, C. & Z. Acs (2002). “The Determinants of Regional Variation in New Firm
Formation”. Regional Studies. 36(1): 33-45.
Asiedu, E. (2005). “Foreign Direct Investment in Africa: The Role of Natural Resources,
Market Size, Government Policy, Institutions and Political Instability". World Institute for
Development Economic Research (UNU-WIDER). Working Papers RP2005/24. Taken
February 27/2011 from: http://www.wider.unu.edu/stc/repec/pdfs/rp2005/rp2005-24.pdf
Asterly, W. & R. Levine (2003). “Tropics, Germs, and Crops: How EndowmentsIinfluence
Economic Development”. Journal of Monetary Economics. 50(1): 3-39.
Ayyagari, M. & R. Kosová (2010) “Does FDI Facilitate Domestic Entry? Evidence from
the Czech Republic”. Review of International Economics. 18(1): 14–29.
Azfar, O., & C. Cadwell, eds. (2003). Market-Augmenting Government: The Institutional
Foundations for Prosperity. Ann Arbor: University of Michigan Press
Baltagi, B. H. (2001). Econometric analysis of panel data. New York: Wiley.

Barbosa, N. & V. Eiriz (2009). “The Role of Inward Foreign Direct Investment on
Entrepreneurship”. International Entrepreneurship and Management Journal. 5:319–39
Barkhatova, N. (2000). “Russian Small Business, Authorities and the State”. Europe-Asia
Studies. 52: 657-676.
Bartelsman, E., Haltiwanger, J. and S. Scarpetta (2004). “Microeconomic Evidence of
Creative Destruction in Industrial and Developing Countries”. The World Bank Policy
Research Working Paper 3464.
Bartlett, C. & S. Ghoshal (1999). Transnational Management: Text, Cases and Readings in
Cross Border Management. New York: McGraw-Hill.
Barro, R. (1991). “Economic Growth in a Cross Section of Countries”. The Quarterly
Journal of Economics. 106: 407-443.
Baumol, W. (1990). “Entrepreneurship: Productive, Unproductive, and Destructive”.
Journal of Political Economy. 98: 893-921.
Beach, W. & T. Kane (2007). “Methodology: Measuring the 10 Economic Freedoms”. En
Miller, T., Holmes, K., O’Grady, M. y A. Kim (Eds.). (2008) Index of Economic Freedom:
The link between Economic opportunity and prosperity (p.39-55).Washington: The
Heritage Foundation.
Beck, N. and J. Katz (1995). “What to Do (and Not to Do) With Time-Series Cross-Section
Data”. American Political Science Review. 89(3): 634-47.
Beck, N. (2001). “Time-Series Cross-Section Data: What Have We Learned in the Past Few
Years”. American Political Science Review. 4: 271-95.
Berggren, N. (1999). “Economic Freedom and Equality: Friends or Foes?”. Public Choice.
100: 203–223
Berggren, N. (2003). “The Benefits of Economic Freedom: A Survey”. The Independent
Review. 8: 193–211
Bjørnskov, C. & N. Foss (2008). “Economic Freedom and Entrepreneurial Ativity: Some
Cross Country Evidence”. Public Choice. 134: 307–328.
Blanchflower, D. & A. Oswald (1998) “What Makes an Entrepreneur?” Journal of Labor
Economics. 16(1):26-60.
Blanchflower, D. (2000). “Self-employment in OECD Countries”. Labor Economics.
7:471-505.
Blau, D. (1987). “A Time-Series Analysis of Self-Employment in the United States”.
Journal of Political Economy. 95(3):445–467.
Blonigen, B. (2005). “A Review of the Empirical Literature on FDI Determinants”. Atlantic

Economic Journal. 33(4): 383-403
Bruce, D. & M. Mohsin (2003). “Tax Policy and Entrepreneurship: New Time Series
Evidence”. Small Business Economics. 26: 409–425
Carter, J. (2007). “An Empirical Note on Economic Freedom and Income Inequality”.
Public Choice. 130: 163–177
Claessens, S., & L. Laeven (2003). “Financial Development, Property Rights, and Growth”.
Journal of Finance. 58(6): 2401-2436.
Costello, A. & J. Osborne (2005). “Best Practices in Exploratory Factor Analysis”.
Practical Assessment, Research & Evaluation. 10(7). Taken January 10/2011 from
http://pareonline.net/pdf/v12n2.pdf
Coyne, C. & P. Leeson (2004). “The Plight of Underdeveloped Countries”. Cato Journal.
24(3): 235-49
Cowling, M. & P. Mitchell (1997).“The Evolution of U.K. Self-Employment: A Study of
Government Policy and the Role of the Macroeconomy”. The Manchester School of
Economic and Social Studies. 65(4): 427-42
Cullen, J. & R. Gordon (2002). “Taxes and Entrepreneurial Activity: Theory and Evidence
for the U.S”. National Bureau of Economic Research. NBER Working Paper 9015
De Backer, K & L. Sleuwaegen (2003).”Does Foreign Direct Investment Crowd Out
Domestic Entrepreneurship?”. Review of Industrial Organization. 22(1): 67-84
Demirguc-Kunt, A., Laeven, L. & R. Levine (2004). “Regulations, Market Structure,
Institutions, and the Cost of Financial Intermediation”. Journal of Money, Credit and Banking. 36(3): 593-622
Djankov, S., Glaeser, E., La Porta, R., Lopez-de-Silanes, F. & A. Shleifer (2003). “The
New Comparative Economics”. Journal of Comparative Economics. 31(4): 595-619.
Di Patti, E., & G. Dell'Ariccia (2004). “Bank Competition and Firm Creation”. Journal of
Money, Credit and Banking. 36(2): 225-251
DiTella, R. & R. McCulloch. (2006). “Why Doesn’t Capitalism Flow to Poor
Countries?”.National Bureau of Economic Research. Nber Working Paper Series. Working
Paper 13164.
Dollar, D. & A. Kraay (2002). “Growth is Good for the Poor”. Journal of Economic
Growth. 7(3). 195-225
Doucouliagos, C. & M. Ulubasoglu (2006). “Economic Freedom and Economic Growth:
Does Specification Make a Difference?”. Journal of Political Economy. 22: 60 - 81.

Dunn, T. & D. Holtz-Eakin(2000). “Financial Capital, Human Capital, and the Transition to
Self-Employment: Evidence from Intergenerational Links”. Journal of Labor Economics,
18(2): 282-305.
De Soto, H. (1989). The Other Path: The Invisible Revolution in the Third World. New
York: Harper and Row.
Desai, M., Gompers, P. y J. Lerner (2003). “Institutions, capital constraints and
entrepreneurial firm dynamics: Evidence from Europe”. National Bureau of Economic
Research. NBER Working Paper 10165.
DiMaggio, P. & W. Powell (1983). “The Iron Cage Revisited: Institutional Isomorphism
and Collective Rationality in Organizational Fields”. American Sociological Review. 48:
147–160.
Djankov, S., La Porta, R. Lopez-de-Silanes, F. & A. Shleifer (2002). “The Regulation of
Entry”. Quarterly Journal of Economics. 117: 1-35.
Djankov, S., Miguel, E., Qian, Y., Roland, G. & E. Zhuravskaya (2005). “Who are Russia's
Entrepreneurs?”. Journal of European Economics. 3(2-3): 587-597.
ECLAC (2008).”Foreign Direct Investment in Latin America and Caribbean”. Taken March
1 / 2010 de: http://www.eclac.org/publicaciones/xml/4/36094/LCG2406i.pdf
Faccio, M. (2006). “Politically Connected Firms”. The American Economic Review. 96(1):
369-386
Feldstein, M. & J. Slemrod (1980). “Personal Taxation, Portfolio Choice, and the Effect of
the Corporate Income Tax”. Journal of Political Economy. 88: 854–66
Friedman, E., Johnson, S., Kauffmann, D. & P. Zoido-Lobaton (1999).”Dodging the
grabbing hand: The determinants of unofficial activity in 69 countries”. Conference Paper,
The Nobel Symposium in Economics - The Economics of Transition, Stockholm,
September 1999. Available at SSRN: http://ssrn.com/abstract=194628 or
doi:10.2139/ssrn.194628
Frye, T. & A. Shleifer (1997). “The Invisible Hand and the Grabbing Hand”. American
Economic Review. Papers and Proceedings 87: 354-358.
Gentry, W. & R. Hubbard (2000). “Tax Policy and Entrepreneurial Entry”. American
Economic Review.90: 283–287
Gentry, W. & R. Hubbard (2004). “Entrepreneurship and Household Saving”. Journal of
Advances in Economic Analysis & Policy. 4(1), Article 8.
Glaeser, E., J. Scheinkman, & A. Shleifer (2003). “Injustice of inequality”. Journal of

Monetary Economics. 50: 199-222
Glaeser, E. and A. Shleifer (2003). “The Rise of the Regulatory State”. Journal of
Economic Literature. 41(2): 401-425.
Gomez-Casseres, B. ( 1997). “Alliance Strategies of Small Firms”. Small Business
Economics. 9: 33–44.
Gompers, P. & J. Lerner. (2001). “The Venture Capital Revolution”. Journal of Economic
Perspectives. 15(2): 145-168
Gonzalez, F. (2005). “Insecure Property and Technological Backwardness”. Economic
Journal. 115(505): 703-721.
Gordon, R. (1998).”Can High Personal Tax Rates Encourage Entrepreneurial Activity?”.
International Monetary Fund Staff Papers. 45(1): 49–60
Görg, H. & E. Strobl (2002). Multinational Companies and Indigenous Development: An
Empirical Analysis. European Economic Review. 46: 1305-22.
Greene, W. (2000). Econometric Analysis. Upper Saddle River, NJ: Prentice Hall
Gupta, S., Davoodi, H. & R. Alonso-Terme (2002). ”Does Corruption Affect Income
Inequality and Poverty?. Economics of Governance. 3(1): 23-45
Grossman, G. (1984). “International Trade, Foreign Investment, and the Formation of the
Entrepreneurial Class”. American Economic Review. 74(4): 605-14
Gwarty, J., Lawson, R. & R. Helcombe (1999). “Economic Freedom and the Environment
for Economic Growth”. Journal of Institutional and Theoretical Economics.155(4): 643-
663.
Hayek, F. (1960). The Constitution of Liberty. Chicago: University of Chicago Press.
Henderson, J. (2002) “Building the Rural Economy with High-Growth Entrepreneurs.”
Federal Reserve Bank of Kansas City Economic Review. 87(3): 45–70
Hodler, R. (2009). “Industrial Policy in an imperfect world”. Journal of Development
Economics. 90: 85-93.
Hoechle, D. (2007). “XTSCC: Stata module to calculate robust standard errors for panels
with cross-sectional dependence”. Statistical Software Components, Boston College
Department of Economics. Taken February 22 / 2011 from:
http://econpapers.repec.org/RePEc:boc:bocode:s456787.
Holtz-Eakin, D., Joulfaian, D. & H. Rosen (1994). “Sticking It Out: Entrepreneurial
Survival and Liquidity Constraints”. The Journal of Political Economy. 102(1): 53-75.
Hopenhayn, H. (1992): “Entry, Exit and Firm Dynamics in Long Run Equilibrium”.

Econometrica. 60(5): 1127-1150
Horst, T. (1972). “Firm and Industry Determinants of the Decision to Invest Abroad: An
Empirical Study”. Review of Economics and Statistics. 54: 258-66.
Johnson, S., Kaufmann, D. & A. Shleifer (1997). “Politics and Entrepreneurship in
Transition Economies”. Tomado el 12 de enero de 2011 de SSRN:
http://ssrn.com/abstract=1117620
Johnson, S., McMillan, J., & C. Woodruff (2002). “Property Rights and Finance”,
American Economic Review. 95: 1335-1356
Johnson, S., Kaufmann, D. & y P. Zoido-Lobaton. (1998). “Regulatory Discretion and the
Unofficial Economy”. American Economic Review. 88(2): 387-92.
Joyanovic, B. (1982). “Selection and the Evolution of Industry”. Econometrica. 50(3): 649-
670
Kanbur, R. (1980). “Risk Taking and Taxation: An Alternative Perspective”. Journal of
Public Economics. 15(2): 163-184
Kaufmann, D., Kraay, A. and M. Mastruzzi (2010). “Governance Matters VIII: Aggregate
and Individual Governance Indicators, 1996-2008”. World Bank Policy Research Working
Paper 5430
Kirzner, L. (1992). The Meaning of Market Process: Essays in the Development of Modern
Austrian Economics. London: Routledge.
Knack, S., ed. (2003) Democracy, Governance, and Growth. Ann Arbor: University of
Michigan Press.
Knack, S., & P. Keefer (1995). “Institutions and Economic Performance: Cross-Country
Tests Using Alternative Institutional Measures.” Economics and Politics. 7: 207–27.
Klapper, L., Laeven, L. & R. Rajan. (2006). “Entry Regulation as a Barrier to
Entrepreneurship”. Journal of Financial Economics. 82: 591-652.
Klapper, L., Amit, R., Guillen, M. and J, Quesada (2007). “Entrepreneurship and Firm
Formation Across Countries”. World Bank Policy Research Working Paper 4313.
Klapper, L. and I, Love (2010). “The Impact of the Financial Crisis on New Firm
Registration”. World Bank Policy Research Working Paper 5444.
Konings, J. (2001). “The Effects of Foreign Direct Investment on Domestic Firms:
Evidence from Firm Level Panel Data in Emerging Economies”. Economics of Transition.
9(3): 619–33.
Krause, M. (2010). “Indice de Calidad Institucional 2010”. International Policy Network.
Taken April 20 / 2011 from:
http://works.bepress.com/cgi/viewcontent.cgi?article=1041&context=martin_krause
Krueger, A. (1974). “The political economy of the rent-seeking society”. American
Economic Review. 64(3): 291-303.
Krugman, P. (1995). “Cycles of Conventional Wisdom on Economic Development”.
International Affairs. 71(4): 717-32
La Porta, R., Lopez-De-Silanes, F., Shleifer, A. & R. Vishny (1997). “Legal Determinants
of External Finance”. The Journal of Finance. 52 (3): 1131-1150
Landier, A., Thesmar, D. & M. Thoenig. (2008). “Investigating Capitalism-Aversion”.
Economic Policy. 55: 3-42.
Ledesma, R. & P. Valero-Mora (2007). “Determining the Number of Factors to Retain in
EFA: An easy-to-use computer program for carrying out Parallel Analysis”. Practical
Assessment Research & Evaluation. 12(2). Taken January 10/ 2011 from
http://pareonline.net/pdf/v12n2.pdf
Leibenstein, H. (1968). “Entrepreneurship and Development”. The American Economic
Review. 58(2): 72-83
Lucas, R. (1978). “On the Size Distribution of Business Firms”. Bell Journal of Economics.
9(2): 508-523.
Long, J. (1982a). “Income Taxation and the Allocation of Market Labor”. Journal of Labor
Research. 3(3):259–76
Long, J. (1982b). “The Income Tax and Self-Employment”. National Tax Journal. 35:31–
42
Mauro, P. (1995). “Corruption and Growth”. Quarterly Journal of Economics. 110 (3): 681-
712.
McMullen, J., Bagby, D. & L. Palich (2008). “Economic Freedom and the Motivation to
Engage in Entrepreneurial Action”. Entrepreneurship Theory and Practice. 32(5): 875-895.
Moore, R. (1983) “Self-Employment and the Incidence of the Payroll Tax”. National Tax
Journal. 36:491–501
Mossin, .J (1968). “Taxation and Risk-Taking: An Expected Utility Approach”. Economics.
35:74–82
North, D. (1990). Institutions, Institutional Change, and Economic Performance.
Cambridge: Cambridge University Press.
Nyström, K. (2008). “The Institutions of Economic Freedom and Entrepreneurship:
Evidence from Panel Data”. Public Choice. 136: 269–282
Olson, M. (2000). Power and Prosperity: Outgrowing Communist and Capitalist
Dictatorships. New York: Basic Books.
Pande, R. & C. Udri (2006). “Institutions and Development: A View from Below”. En
Blundell, R., Newey, W. y T. Persson, “Advances in economics and econometrics: theory
and applications, ninth World Congress”.PP. 339-444. New York: Cambridge University
Press.
Parker, S. (1996). “A Time Series Model of Self-employment under Uncertainty”.
Economica. 63:459–75.
Parker, S. (2003). “Does Tax Evasion Affect Occupational Choice?”. Oxford Bulletin of
Economics and Statistics. 65(3):379–394.
Parker, S. (2007). “Law and the Economics of Entrepreneurship”. Comparative Labor Law
andPolicy Journal. 28:695-716.
Parker, S. & M. Robson (2004).”Explaining International Variations in Self-Employment:
Evidence from a Panel of OECD Countries”. Southern Economic Journal. 71(2): 287-301
Pinotti, P. (2008). “Trust, Honesty and Regulations”. Bank of Italy and Universitat Pompeu
Fabra. MPRA paper 7740. Taken November 8 / 2010 from:
http://www.eief.it/it/files/2008/04/trustreg_apr08.pdf
Prebisch, P. (1959). “Commercial policy in the Underdevelopment Countries”. The
American Economic Riview. 49(2): 252-73
Puffer, S., McCarthy, D. & M. Boisot (2010). “Entrepreneurship in Russia and China: The
Impact of Formal Institutional Voids”. Entrepreneurship Theory and Practice. 34(3): 441-
67
Sautet, F. (2005). “The Role of Institutions in Entrepreneurship: Implications for
Development Policy”. Mercatus Policy Primer No. 1. Tomado en Febrero 17 de 2011 de
SSRN: http://ssrn.com/abstract=1264033
Rajan, R. and L. Zingales (2003). “The great reversal: The Politics of Financial
Development in the 20th Century”. Journal of Financial Economics. 69(1): 5-50.
Ricardo, D. (1821[1996]). Principles of political economy and taxation. Amherst, N.Y.:
Prometheus Books.
Robson, M. & C. Wren. (1999). “Marginal and Average Tax Rates and the Incentive for
Self-Employment”. Southern Economic Journal. 65(4): 757-773
Schneider, F. & D. Enste (2000). ”Shadow Economies: Size, Causes and Consequences”.
Journal of Economic Literature. 38(1): 77-114.

Scully, G. & D. Slottje (1991). “Ranking Economic Liberty across Countries”. Public
Choice. 69(2): 149-164
Shleifer, A. & R. Vishny. (1998) The Grabbing Hand: Government Pathologies and their
Cures. Cambridge: Harvard University Press.
Schuetze, H. (2000). “Taxes, Economic Conditions and Recent Trends in Male Self-
Employment: A Canada-U.S. Comparison”. Labour Economics. 7(5):507–544
Singer, H. (1999). “Beyond Terms of Trade-Convenience and Divergence”. Journal of
International Development. 11(6): 911-16.
Smith, A. (1776[1976]). An Inquiry into the Nature and Causes of the Wealth of Nations.
Chicago: University of Chicago Press.
Sobel, R., Clark, J. and D. Lee (2007). “Freedom, Barriers to Entry, Entrepreneurship and
Economic Progress”. The Austrian Review of Economics. 20: 221–236.
Staber, U. & D. Bogenhold (1993). ”Self-employment: A study of Seventeen OECD
Countries”. Industrial Relations Journal. 24:126-37.
Stigler, G. (1971) “The Theory of Economic Regulation”. Bell Journal of Economics. 2 (1):
3-21.
Stiglitz, J. (1969). “The Effects of Income, Wealth, and Capital Gains Taxation on Risk-
Taking”. The Quarterly Journal of Economics. 83(2):263–283
Svensson, J. (1998). “Investment, Property Rights and Political Instability: Theory and
Evidence”. European Economic Review. 42: 1317-1341.
Van Stel, A., Storey, D., & R. Thurik (2007). “The Effect of Business Regulations on
Nascent and Young Business Entrepreneurship”. Small Business Economics. 28, 171 – 186
Verheul, I. (2009). “Regional Opportunities and Policy Initiatives for New Venture
Creation”. International Small Business Journal. 27(5): 608–625
Vernon, R. (1970). “Organization as a Scale Factor in the Growth of Firms”, en Ribeiro, D.
y S, Roig (2009). “Linking globalization of entrepreneurship in small organizations”. Small
Business Economics. 32: 233-239
Wei, S. (2000). “Bribery in the Economies: Grease or Sand?”. Brookings Institute Working
Paper. Taken in november 21/ 2010 from:
http://www.brookings.edu/~/media/Files/rc/papers/2000/0115globalization_wei/20000115.pdf
Wennekers, S., Van Stel, A., Thurik, R., & P. Reynolds (2005).”Nascent Entrepreneurship
and the Level of Economic Development”. Small Business Economics. 24, 293 – 309
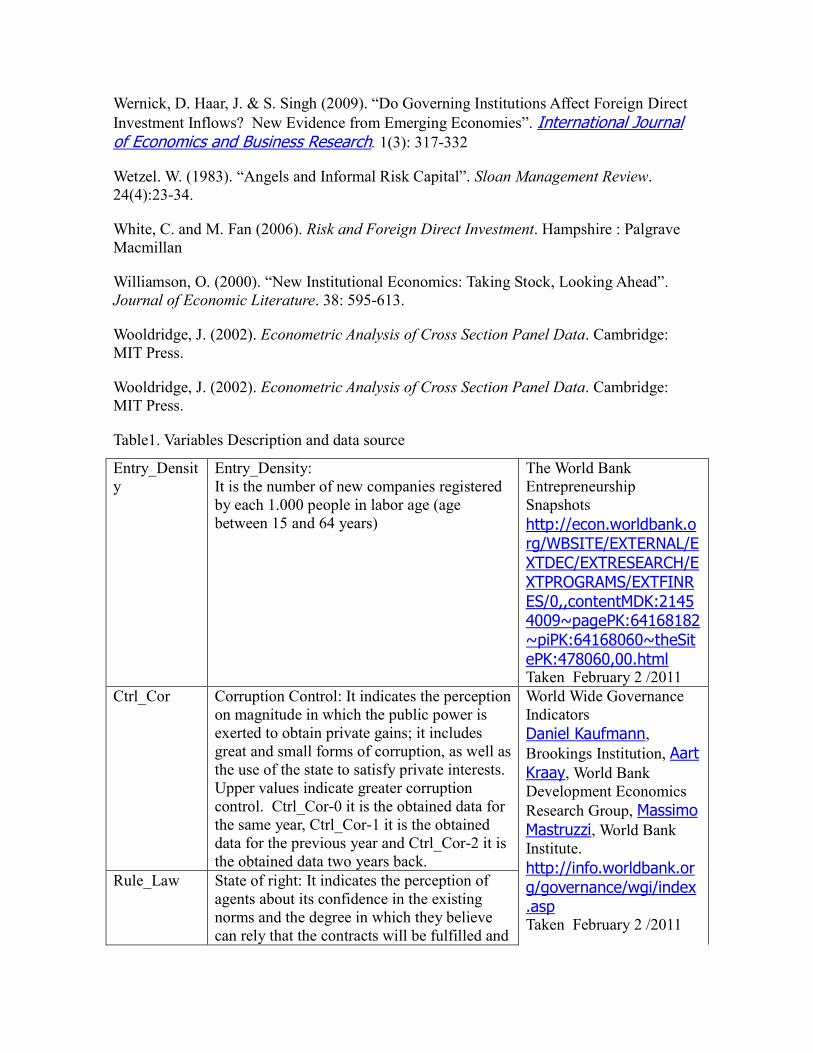
Wernick, D. Haar, J. & S. Singh (2009). “Do Governing Institutions Affect Foreign Direct
Investment Inflows? New Evidence from Emerging Economies”. International Journal of Economics and Business Research. 1(3): 317-332
Wetzel. W. (1983). “Angels and Informal Risk Capital”. Sloan Management Review.
24(4):23-34.
White, C. and M. Fan (2006). Risk and Foreign Direct Investment. Hampshire : Palgrave
Macmillan
Williamson, O. (2000). “New Institutional Economics: Taking Stock, Looking Ahead”.
Journal of Economic Literature. 38: 595-613.
Wooldridge, J. (2002). Econometric Analysis of Cross Section Panel Data. Cambridge:
MIT Press.
Wooldridge, J. (2002). Econometric Analysis of Cross Section Panel Data. Cambridge:
MIT Press.
Table1. Variables Description and data source
Entry_Densit
y
Entry_Density:
It is the number of new companies registered
by each 1.000 people in labor age (age
between 15 and 64 years)
The World Bank
Entrepreneurship
Snapshots
http://econ.worldbank.org/WBSITE/EXTERNAL/EXTDEC/EXTRESEARCH/EXTPROGRAMS/EXTFINRES/0,,contentMDK:21454009~pagePK:64168182~piPK:64168060~theSitePK:478060,00.html Taken February 2 /2011
Ctrl_Cor
Corruption Control: It indicates the perception
on magnitude in which the public power is
exerted to obtain private gains; it includes
great and small forms of corruption, as well as
the use of the state to satisfy private interests.
Upper values indicate greater corruption
control. Ctrl_Cor-0 it is the obtained data for
the same year, Ctrl_Cor-1 it is the obtained
data for the previous year and Ctrl_Cor-2 it is
the obtained data two years back.
World Wide Governance
Indicators
Daniel Kaufmann,
Brookings Institution, Aart
Kraay, World Bank
Development Economics
Research Group, Massimo
Mastruzzi, World Bank
Institute.
http://info.worldbank.org/governance/wgi/index.asp Taken February 2 /2011
Rule_Law State of right: It indicates the perception of
agents about its confidence in the existing
norms and the degree in which they believe
can rely that the contracts will be fulfilled and

the property rights will be protect by the
courts. Rule_Law-0 it is the obtained data for
the same year, Rule_Law-1 is the data
obtained for the previous year and Rule_Law-
2 is the data obtained for two years back.
The methodology for
calculation of these
indicators is available in:
Kaufmann, Daniel, Kraay,
Aart and Mastruzzi,
Massimo, The Worldwide
Governance Indicators:
Methodology and
Analytical Issues
(September 2010). World
Bank Policy Research
Working Paper No. 5430.
Available at SSRN:
http://ssrn.com/abstract=1682130 Taken February 2 /2011
Reg_Qual Regulatory quality: It indicates the perception
ability of a government to formulate and to
implement politically regulations that allow
promoting development of the private sector.
Reg_Qual-0 it is the obtained data for the
same year, Reg_Qual-1 it is the obtained data
for the previous year and Reg_Qual-2 it is the
obtained data two years back.
Gov_Eff Effectiveness of the government: It indicates
the perception of quality of public and
civilians services and its independence degree
of political pressure. It measures the quality in
formulation and implementation and the
commitment of the government with related
policies. Gov_Eff-0 it is the obtained data for
the same year, Gov_Eff-1 it is the obtained
data for the previous year and Gov_Eff-2 it is
the obtained data two years back.
Pol_Sta
Political stability: It captures the perception of
probability that the government is destabilized
or overthrown by nonviolent or non-
constitutional means. Pol_Sta-0 it is the
obtained data for the same year, Pol_Sta-1 it
is the obtained data for the previous year and
Pol_Sta-2 it is the obtained data two years
back.
Voi_Acc Voice and Accountability: It captures the
perception level in which the citizens of a
country can also participate in the government
selection. It reflects expression and
association freedom. Voi_Acc-0 it is the
obtained data for the same year, Voi_Acc-1 it
is the obtained data for the previous year and
Voi_Acc-2 it is the obtained data two years
back.

Dom_Cre Domestic credit to the private sector (% of the
GDP): it refers to financial resources provided
to private sector, such as credits, bonds and
other receivable accounts that establish a right
of reimbursement of principal. Dom_Cre-0 it
is the obtained data for the same year,
Dom_Cre-1 it is the obtained data for the
previous year and Dom_Cre-2 it is the
obtained data two years back.
International Monetary
Fund, International
Financial Statistics and
data files, and World Bank
and OECD GDP estimates
http://data.worldbank.org/indicator/FS.AST.PRVT.GD.ZS Taken February 9 /2011
Bus_Free Freedom to make businesses: it is a
quantitative measurement of the ability to
begin, to operate and to close a business, the
score goes from 0 to 100, 100 is equivalent to
a country with a businesses atmosphere of
Maximum ability. The indicator is obtained
from the weighting of quantitative measures
taken from the “World Bank' s Doing
Business study”, within which they are
included: 1. Number of procedures, the
required time, the cost and the required
minimum capita17
to register a business; 2.
Number of procedures, the required time and
the cost as percentage of the entrance per
capita obtaining a license; and, 3. The
required time, the cost (like percentage of the
assets) and the rate of recovery (cents by
dollar) when a business is closed). Bus_Free-
0 it is the obtained data for the same year,
Bus_Free-1 it is the obtained data for the
previous year and Bus_Free-2 it is the
obtained data two years back.
The Heritage foundation,
index of economic
freedom.
http://www.heritage.org/index/explore?view=by-region-country-year Taken February 9 /2011La
metodología de
construcción de cada
índice se encuentra
disponible en
http://www.heritage.org/index/PDF/2011/Index2011_Methodology.pdf Taken February 9 /2011
Tra_Free Trade freedom: it is a measurement composed
of the absence of tariff and non-tariffs 18
barriers that affect the imports and exports of
goods and services in each country. Tra_Free-
0 it is the obtained data for the same year,
Tra_Free-1 it is the obtained data for the
previous year and Tra_Free-2 it is the
obtained data two years back.
17 the cost and the minimum capital required to register a business calculated as percentage of earnings per
capita 18
The barriers that do not include tariffs can be amount restrictions, like quotas of import or export; price restrictions, for example the antidumping charges; regulatory restrictions, that imply obtaining licenses; restrictions to the currency change and other financial controls; or the governmental monopolies, among others.

Fiscal_Free Fiscal freedom: It is a measurement of the tax
barriers imposed by the government. It is
calculated by carefully examining the
Maximum rate of taxes on earnings
(corporative and individual) and the total
amount of taxes collected as percentage of the
GIP of each country. Fiscal_Free-0 it is the
obtained data for the same year, Fiscal_Free-1
it is the obtained data for the previous year
and Fiscal_Free-2 it is the obtained data two
years back.
Inv_Free Freedom of investment: It is a measurement
of the existent restrictions to the flow of
capital of investment in a certain country.
Inv_Free-0 it is the obtained data for the same
year, Inv_Free-1 it is the obtained data for the
previous year and Inv_Free-2 it is the
obtained data two years back.
GDP_PCU
LGDP_PCU
Gross domestic product per capita in dollars
to prices and current rates of change.
GDP_PCU-0 it is the obtained data for the
same year, GDP_PCU-1 it is the obtained data
for the previous year and GDP_PCU-2 it is
the obtained data two years back.
LGDP_PCU it is the logarithm of GDP_PCU
United Nations: UNCTAD,
UNCTADstat.
http://unctadstat.unctad.org/ReportFolders/reportFolders.aspx Taken February 15 /2011
Inflation Inflation: Percentage change of prices to the
consumer at the end of the period. Inflation-0
it is the obtained data for the same year,
Inflation-1 it is the obtained data for the
previous year and Inflation-2 it is the
obtained data two years back.
International Monetary
Fund: World Economic
and Financial Surveys,
World Economic Outlook
Database
http://www.imf.org/external/pubs/ft/weo/2010/02/weodata/index.aspx Taken February 16 /2011
Unemploy Rate of unemployment: percentage of
unemployed people of the total of the labor
force available. Unemploy-0 it is the obtained
data for the same year, Unemploy-1 it is the
obtained data for the previous year and
Unemploy-2 it is the obtained data two years
back.
Trade
Ltrade
Merchandise traded as percentage of the
GDP: it is the sum of the exports and imports
divided by the value of the gross internal
product in current dollars. Trade-0 it is the
obtained data for the same year, Trade-1 it is
The World Bank, World
Development Indicators
http://search.worldbank.org/data?qterm=trade%20in%20goods&languag
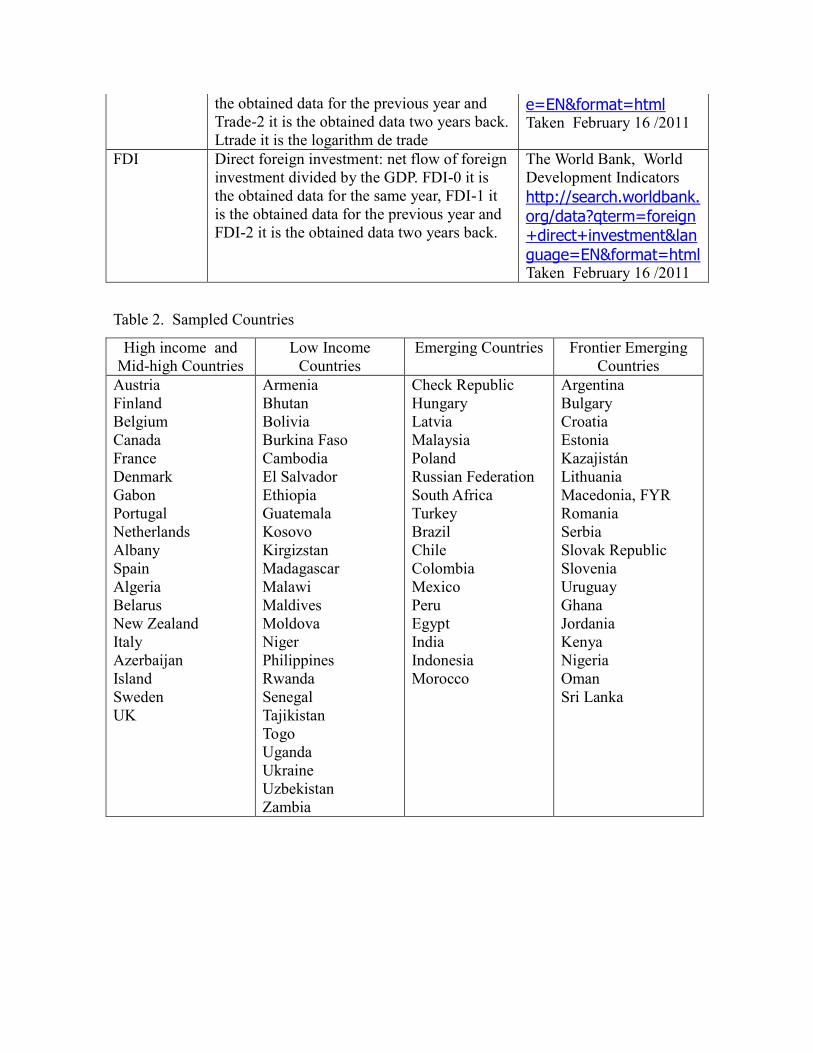
the obtained data for the previous year and
Trade-2 it is the obtained data two years back.
Ltrade it is the logarithm de trade
e=EN&format=html Taken February 16 /2011
FDI Direct foreign investment: net flow of foreign
investment divided by the GDP. FDI-0 it is
the obtained data for the same year, FDI-1 it
is the obtained data for the previous year and
FDI-2 it is the obtained data two years back.
The World Bank, World
Development Indicators
http://search.worldbank.org/data?qterm=foreign+direct+investment&language=EN&format=html Taken February 16 /2011
Table 2. Sampled Countries
High income and
Mid-high Countries
Low Income
Countries
Emerging Countries Frontier Emerging
Countries
Austria
Finland
Belgium
Canada
France
Denmark
Gabon
Portugal
Netherlands
Albany
Spain
Algeria
Belarus
New Zealand
Italy
Azerbaijan
Island
Sweden
UK
Armenia
Bhutan
Bolivia
Burkina Faso
Cambodia
El Salvador
Ethiopia
Guatemala
Kosovo
Kirgizstan
Madagascar
Malawi
Maldives
Moldova
Niger
Philippines
Rwanda
Senegal
Tajikistan
Togo
Uganda
Ukraine
Uzbekistan
Zambia
Check Republic
Hungary
Latvia
Malaysia
Poland
Russian Federation
South Africa
Turkey
Brazil
Chile
Colombia
Mexico
Peru
Egypt
India
Indonesia
Morocco
Argentina
Bulgary
Croatia
Estonia
Kazajistán
Lithuania
Macedonia, FYR
Romania
Serbia
Slovak Republic
Slovenia
Uruguay
Ghana
Jordania
Kenya
Nigeria
Oman
Sri Lanka

Figure 1. Institutional Quality (Inst_Qual), Foreign Direct Investment (FDI), Freedom To
make Businesses (Bus_Free) and entry density (Entry_Density). The graphs show in the
axis “and” the number of new companies registered by each 1.000 people in labor age (age
between 15 and 64 years) and in axis “X” the calculated Institutional Quality like the
average of the “World Wide Governance Indicators” (Kaufmann et al.: 2010), the net flow
of foreign investment divided by the gross internal product, the index of freedom To make
Businesses (Beach and Kane: 2007). It is shown the behavior of variables in countries of
high income, emerging and low income in the left, center and right column, respectively.
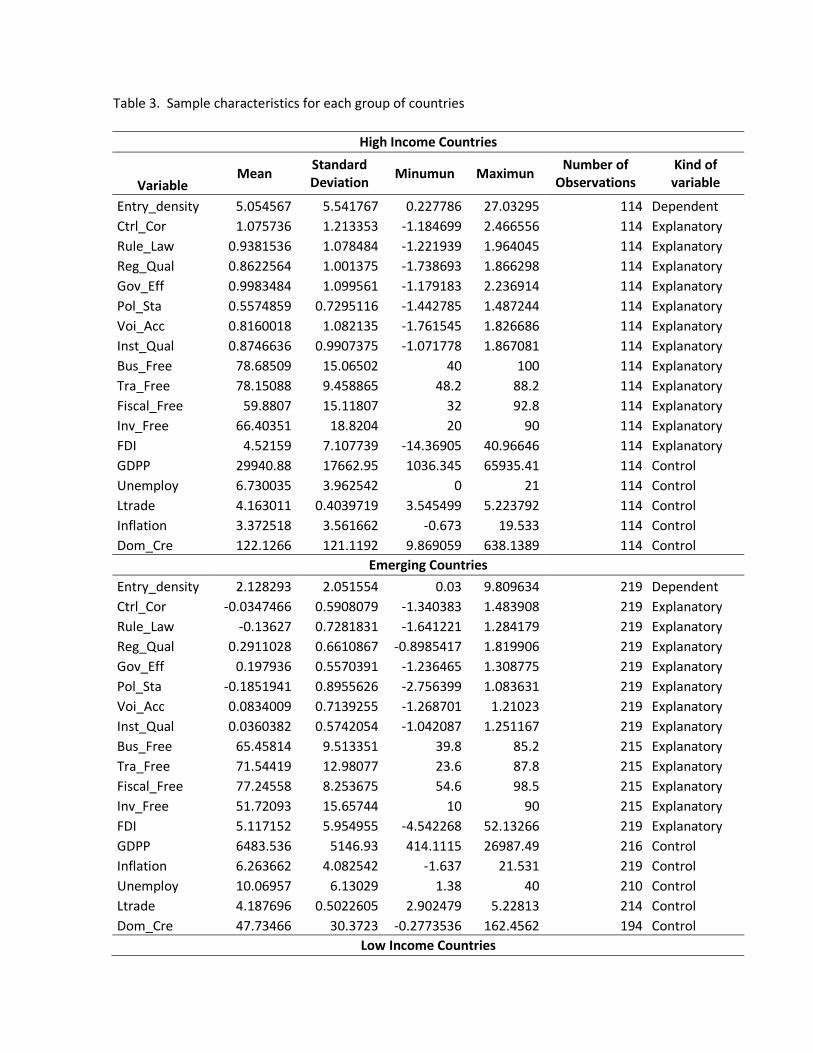
Table 3. Sample characteristics for each group of countries
High Income Countries
Variable Mean
Standard Deviation
Minumun Maximun Number of
Observations Kind of variable
Entry_density 5.054567 5.541767 0.227786 27.03295 114 Dependent Ctrl_Cor 1.075736 1.213353 -1.184699 2.466556 114 Explanatory Rule_Law 0.9381536 1.078484 -1.221939 1.964045 114 Explanatory Reg_Qual 0.8622564 1.001375 -1.738693 1.866298 114 Explanatory Gov_Eff 0.9983484 1.099561 -1.179183 2.236914 114 Explanatory
Pol_Sta 0.5574859 0.7295116 -1.442785 1.487244 114 Explanatory Voi_Acc 0.8160018 1.082135 -1.761545 1.826686 114 Explanatory Inst_Qual 0.8746636 0.9907375 -1.071778 1.867081 114 Explanatory Bus_Free 78.68509 15.06502 40 100 114 Explanatory Tra_Free 78.15088 9.458865 48.2 88.2 114 Explanatory Fiscal_Free 59.8807 15.11807 32 92.8 114 Explanatory Inv_Free 66.40351 18.8204 20 90 114 Explanatory FDI 4.52159 7.107739 -14.36905 40.96646 114 Explanatory GDPP 29940.88 17662.95 1036.345 65935.41 114 Control Unemploy 6.730035 3.962542 0 21 114 Control
Ltrade 4.163011 0.4039719 3.545499 5.223792 114 Control Inflation 3.372518 3.561662 -0.673 19.533 114 Control Dom_Cre 122.1266 121.1192 9.869059 638.1389 114 Control
Emerging Countries
Entry_density 2.128293 2.051554 0.03 9.809634 219 Dependent Ctrl_Cor -0.0347466 0.5908079 -1.340383 1.483908 219 Explanatory Rule_Law -0.13627 0.7281831 -1.641221 1.284179 219 Explanatory Reg_Qual 0.2911028 0.6610867 -0.8985417 1.819906 219 Explanatory Gov_Eff 0.197936 0.5570391 -1.236465 1.308775 219 Explanatory
Pol_Sta -0.1851941 0.8955626 -2.756399 1.083631 219 Explanatory Voi_Acc 0.0834009 0.7139255 -1.268701 1.21023 219 Explanatory Inst_Qual 0.0360382 0.5742054 -1.042087 1.251167 219 Explanatory Bus_Free 65.45814 9.513351 39.8 85.2 215 Explanatory Tra_Free 71.54419 12.98077 23.6 87.8 215 Explanatory Fiscal_Free 77.24558 8.253675 54.6 98.5 215 Explanatory Inv_Free 51.72093 15.65744 10 90 215 Explanatory FDI 5.117152 5.954955 -4.542268 52.13266 219 Explanatory GDPP 6483.536 5146.93 414.1115 26987.49 216 Control Inflation 6.263662 4.082542 -1.637 21.531 219 Control
Unemploy 10.06957 6.13029 1.38 40 210 Control Ltrade 4.187696 0.5022605 2.902479 5.22813 214 Control Dom_Cre 47.73466 30.3723 -0.2773536 162.4562 194 Control
Low Income Countries
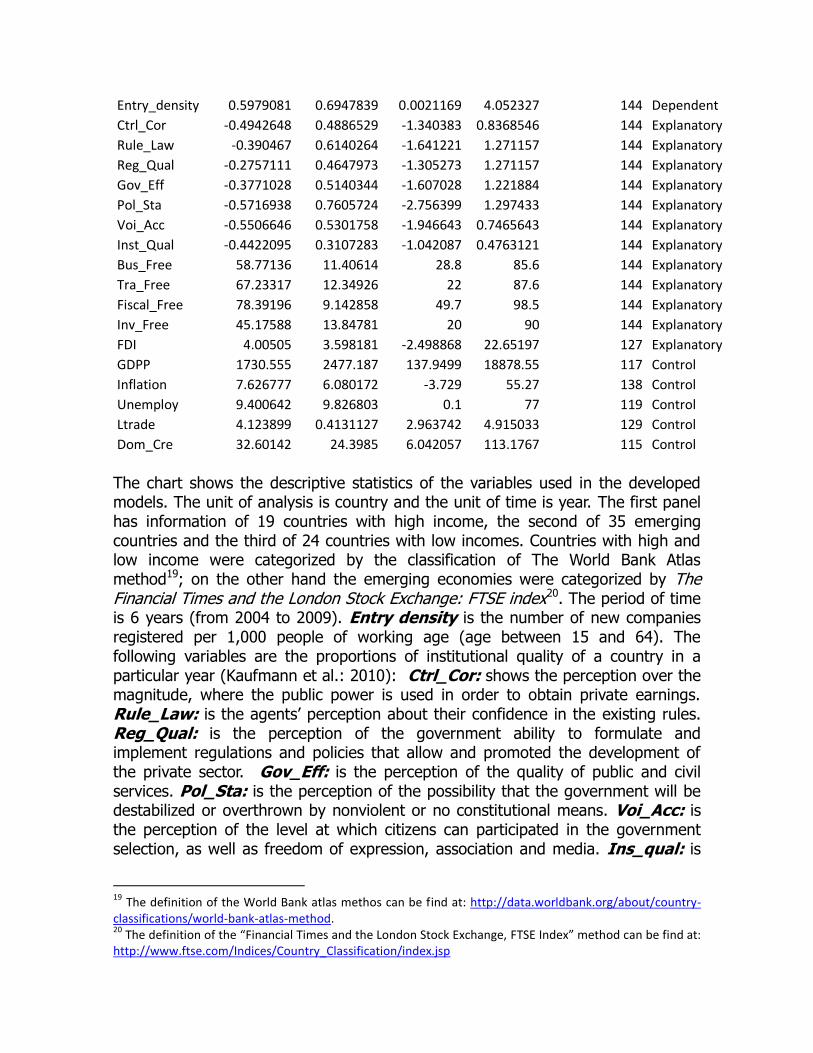
Entry_density 0.5979081 0.6947839 0.0021169 4.052327 144 Dependent Ctrl_Cor -0.4942648 0.4886529 -1.340383 0.8368546 144 Explanatory Rule_Law -0.390467 0.6140264 -1.641221 1.271157 144 Explanatory Reg_Qual -0.2757111 0.4647973 -1.305273 1.271157 144 Explanatory Gov_Eff -0.3771028 0.5140344 -1.607028 1.221884 144 Explanatory Pol_Sta -0.5716938 0.7605724 -2.756399 1.297433 144 Explanatory Voi_Acc -0.5506646 0.5301758 -1.946643 0.7465643 144 Explanatory Inst_Qual -0.4422095 0.3107283 -1.042087 0.4763121 144 Explanatory Bus_Free 58.77136 11.40614 28.8 85.6 144 Explanatory Tra_Free 67.23317 12.34926 22 87.6 144 Explanatory
Fiscal_Free 78.39196 9.142858 49.7 98.5 144 Explanatory Inv_Free 45.17588 13.84781 20 90 144 Explanatory FDI 4.00505 3.598181 -2.498868 22.65197 127 Explanatory GDPP 1730.555 2477.187 137.9499 18878.55 117 Control
Inflation 7.626777 6.080172 -3.729 55.27 138 Control Unemploy 9.400642 9.826803 0.1 77 119 Control Ltrade 4.123899 0.4131127 2.963742 4.915033 129 Control Dom_Cre 32.60142 24.3985 6.042057 113.1767 115 Control
The chart shows the descriptive statistics of the variables used in the developed models. The unit of analysis is country and the unit of time is year. The first panel has information of 19 countries with high income, the second of 35 emerging countries and the third of 24 countries with low incomes. Countries with high and low income were categorized by the classification of The World Bank Atlas method19; on the other hand the emerging economies were categorized by The Financial Times and the London Stock Exchange: FTSE index20. The period of time is 6 years (from 2004 to 2009). Entry density is the number of new companies registered per 1,000 people of working age (age between 15 and 64). The following variables are the proportions of institutional quality of a country in a particular year (Kaufmann et al.: 2010): Ctrl_Cor: shows the perception over the magnitude, where the public power is used in order to obtain private earnings. Rule_Law: is the agents’ perception about their confidence in the existing rules. Reg_Qual: is the perception of the government ability to formulate and implement regulations and policies that allow and promoted the development of the private sector. Gov_Eff: is the perception of the quality of public and civil services. Pol_Sta: is the perception of the possibility that the government will be destabilized or overthrown by nonviolent or no constitutional means. Voi_Acc: is the perception of the level at which citizens can participated in the government selection, as well as freedom of expression, association and media. Ins_qual: is
19
The definition of the World Bank atlas methos can be find at: http://data.worldbank.org/about/country-classifications/world-bank-atlas-method. 20
The definition of the “Financial Times and the London Stock Exchange, FTSE Index” method can be find at: http://www.ftse.com/Indices/Country_Classification/index.jsp

the average of all the institutional quality dimensions proposed by Kaufmann et al. (2010). The followings are measures oriented to determine the freedom of market (Beach y Kane: 2007): Bus_free: is the quantitative measure of the facility to start, operate and close a business. Tra_free: is a measure composed of the absence of tariff barriers and nontariff barriers, which affect the importations and exports of goods and services in each country. Fiscal_Free: is a measure of the tax barriers imposed by the government. Inv_Free is a measure for the existing restrictions to the flow of capital investment on a specific country. Fdi: is the net flow of foreign investment divided by the gross domestic product. GDPP: is the gross domestic product per capita in dollars in power parity values. Inflation: is the percentage change of the consumer prices at the end of the period. Unemploy: is the percentage of unemployed people of the total available workforce. Ltrade: is the logarithm of the sum of all the exportations and importations divided by the current value of the gross domestic product in current dollars. Dom_Cre: is the domestic credit of the private sector as percentage of the gross domestic product Table 4. co-variances Matrix for each group of countries

High Income Countries
Entry_density Ctrl_Cor Rule_Law Reg_Qual Gov_Eff Pol_Sta Voi_Acc Inst_Qual Bus_Free Tra_Free Fiscal_Free Inv_Free GDPP Inflation Unemploy FDI Ltrade Dom_Cre
Entry_density 1
Ctrl_Cor 0.5142 1
Rule_Law 0.4894 0.9862 1
Reg_Qual 0.4683 0.8676 0.8968 1
Gov_Eff 0.4525 0.9771 0.9853 0.8952 1
Pol_Sta 0.4572 0.8492 0.8416 0.6937 0.8231 1
Voi_Acc 0.434 0.9256 0.9482 0.9222 0.9583 0.7997 1
Inst_Qual 0.4909 0.9814 0.9905 0.9243 0.9879 0.8644 0.9719 1
Bus_Free 0.5359 0.8336 0.8165 0.7605 0.7907 0.6081 0.7588 0.8035 1
Tra_Free 0.2879 0.7712 0.8034 0.7809 0.7934 0.6583 0.8033 0.8069 0.6865 1
Fiscal_Free 0.0106 -0.5744 -0.6049 -0.4661 -0.6237 -0.5232 -0.5934 -0.5926 -0.3849 -0.4387 1
Inv_Free 0.2795 0.6666 0.6737 0.659 0.7008 0.5137 0.7711 0.7004 0.5223 0.5156 -0.6049 1
GDPP 0.3445 0.8767 0.8867 0.7873 0.8666 0.7634 0.8372 0.8777 0.8164 0.7683 -0.603 0.6007 1
Inflation -0.0916 -0.4428 -0.4666 -0.4971 -0.4884 -0.2962 -0.5495 -0.4836 -0.3812 -0.2173 0.4167 -0.5967 -0.3362 1
Unemploy -0.3349 -0.3011 -0.2883 -0.1569 -0.2195 -0.515 -0.1443 -0.2724 -0.1675 -0.2243 0.1649 0.0635 -0.3539 -0.2422 1
FDI 0.0733 0.0209 0.0555 0.0604 0.0268 -0.0468 0.0397 0.0303 0.0547 0.0853 0.0455 0.0071 0.143 -0.0235 -0.0557 1
Ltrade -0.3323 -0.1168 -0.1282 -0.2265 -0.1293 0.0161 -0.2207 -0.1456 -0.1736 -0.0635 -0.154 -0.0796 0.0029 0.2734 -0.2635 0.2408 1
Dom_Cre 0.5267 0.5161 0.5229 0.5625 0.5003 0.3903 0.4869 0.5226 0.4901 0.4211 -0.0483 0.3782 0.5438 -0.1208 -0.2955 0.1902 -0.2187 1

Emerging Countries
Entry_density Ctrl_Cor Rule_Law Reg_Qual Gov_Eff Pol_Sta Voi_Acc Inst_Qual Bus_Free Tra_Free Fiscal_Free Inv_Free GDPP Inflation Unemploy FDI Ltrade Dom_Cre
Entry_density 1
Ctrl_Cor 0.3432 1
Rule_Law 0.4162 0.6591 1
Reg_Qual 0.3856 0.7162 0.7025 1
Gov_Eff 0.3324 0.8796 0.685 0.7215 1
Pol_Sta 0.5244 0.7112 0.5364 0.5019 0.7513 1
Voi_Acc 0.4476 0.6814 0.6847 0.645 0.6204 0.6249 1
Inst_Qual 0.4922 0.8968 0.8352 0.828 0.8992 0.8213 0.8381 1
Bus_Free 0.2386 0.4291 0.3627 0.3114 0.4591 0.2887 0.1957 0.3913 1
Tra_Free 0.401 0.427 0.5803 0.5987 0.4557 0.4091 0.4953 0.5819 0.2353 1
Fiscal_Free 0.2838 -0.0498 -0.0966 -0.0175 -0.1038 0.0155 -0.033 -0.0512 0.0159 0.1465 1
Inv_Free 0.3666 0.6591 0.5515 0.5612 0.518 0.4966 0.6457 0.6701 0.4047 0.2719 -0.0502 1
GDPP 0.4496 0.5693 0.6128 0.5762 0.662 0.6767 0.5977 0.728 0.3224 0.5817 -0.1913 0.4521 1
Inflation -0.0066 -0.3729 -0.1323 -0.1824 -0.4296 -0.2952 -0.2016 -0.307 -0.2064 -0.027 0.2437 -0.2645 -0.2158 1
Unemploy -0.0001 -0.0119 -0.093 -0.1077 -0.1208 -0.0199 -0.0273 -0.0715 -0.1395 -0.0595 0.025 0.0766 -0.2421 0.0398 1
FDI 0.4838 0.2378 0.1825 0.2766 0.1997 0.3012 0.1866 0.2751 0.1001 0.2168 0.0744 0.279 0.2018 -0.0055 -0.019 1
Ltrade 0.3967 0.4012 0.3712 0.3786 0.575 0.5055 0.2085 0.4756 0.3399 0.4128 0.0992 0.1445 0.3796 -0.2156 -0.0849 0.3871 1
Dom_Cre 0.2547 0.4698 0.2572 0.2089 0.5735 0.4042 0.1112 0.3857 0.3291 0.1835 -0.119 0.1843 0.3989 -0.3051 -0.2334 0.2244 0.607 1

Low Income Countries
Entry_density Ctrl_Cor Rule_Law Reg_Qual Gov_Eff Pol_Sta Voi_Acc Inst_Qual Bus_Free Tra_Free Fiscal_Free Inv_Free GDPP Inflation Unemploy FDI Ltrade Dom_Cre
Entry_density 1
Ctrl_Cor 0.0965 1
Rule_Law 0.1545 -0.3074 1
Reg_Qual 0.3442 0.3057 0.1552 1
Gov_Eff 0.1034 0.8092 -0.3634 0.2814 1
Pol_Sta 0.5001 0.5652 -0.169 0.3743 0.4976 1
Voi_Acc -0.1024 0.1485 -0.0056 0.2925 0.1186 0.1182 1
Inst_Qual 0.3621 0.7063 0.1292 0.6991 0.6486 0.7425 0.4715 1
Bus_Free 0.4086 0.4031 -0.0148 0.0568 0.4714 0.2333 -0.1722 0.2775 1
Tra_Free 0.3396 -0.1665 0.3386 0.3362 -0.2202 0.0257 0.0922 0.1383 -0.0316 1
Fiscal_Free 0.2042 -0.2484 0.0314 0.2268 -0.3653 0.063 0.0492 -0.0473 -0.233 0.5045 1
Inv_Free 0.0607 0.2397 -0.0721 0.1341 0.2086 0.3152 0.0382 0.2614 0.2234 -0.1779 -0.0846 1
GDPP 0.3506 0.5929 -0.1749 0.3923 0.6213 0.559 -0.0488 0.5647 0.3966 0.168 0.0761 0.0946 1
Inflation -0.0408 -0.3184 0.2946 0.1293 -0.4609 -0.2419 0.0937 -0.1373 -0.3072 0.2454 0.2565 -0.4017 -0.2684 1
Unemploy -0.1105 0.2468 -0.0378 -0.047 0.1228 0.2316 0.0253 0.1667 0.0212 -0.1023 -0.1634 0.1744 -0.0929 -0.1016 1
FDI 0.316 0.1734 0.0202 0.2705 0.0217 0.2245 -0.3527 0.118 -0.0486 0.1569 0.2199 0.0113 0.1214 0.038 -0.1104 1
Ltrade 0.4269 0.1816 -0.0164 0.2249 0.1018 0.2662 -0.1323 0.1948 0.1521 0.3853 0.2844 -0.306 0.3039 0.0383 -0.2308 0.4339 1
Dom_Cre 0.0909 0.6175 -0.3094 0.2638 0.6248 0.3184 -0.0377 0.4017 0.3007 -0.1462 -0.3616 0.042 0.5404 -0.2565 -0.0964 0.2661 0.3463 1

The table shows the covariance among the variables used in the developed models. The unit of analysis is country and the unit of time is year. The first panel has information of 19 countries with high income, the second of 35 emerging countries and the third of 24 countries with low incomes. Countries with high and low income were categorized by the classification of The World Bank Atlas method21; on the other hand the emerging economies were categorized by The Financial Times and the London Stock Exchange: FTSE index22. The period of time is 6 years (from 2004 to 2009). Entry Density is the number of new companies registered per 1,000 people of working age (age between 15 and 64). The following variables are the proportions of institutional quality of a country in a particular year (Kaufmann et al.: 2010): Ctrl_Cor: shows the perception over the magnitude, where the public power is used in order to obtain private earnings. Rule_Law: Is the agents’ perception about their confidence in the existing rules. Reg_Qual: Is the perception of the government ability to formulate and implement regulations and policies that allow and promoted the development of the private sector. Gov_Eff: is the perception of the quality of public and civil services. Pol_Sta: is the perception of the possibility that the government will be destabilized or overthrown by nonviolent or no constitutional means. Voi_Acc: is the perception of the level at which citizens can participated in the government selection, as well as freedom of expression, association and media. Ins_qual: is the average of all the institutional quality dimensions proposed by Kaufmann et al. (2010). The followings are measures oriented to determine the freedom of market (Beach y Kane: 2007): Bus_free: is the quantitative measure of the facility to start, operate and close a business. Tra_free: is a measure composed of the absence of tariff barriers and nontariff barriers, which affect the importations and exports of goods and services in each country. Fiscal_Free: is a measure of the tax barriers imposed by the government. Inv_Free is a measure for the existing restrictions to the flow of capital investment on a specific country. Fdi: is the net flow of foreign investment divided by the gross domestic product. GDPP: is the gross domestic product per capita in dollars in power parity values. Inflation: is the porcentage change of the consumer prices at the end of the period. Unemploy: is the percentage of unemployed people of the total available workforce. Ltrade: is the logarithm of the sum of all the exportations and importations divided by the current value of the gross domestic product in current dollars. Dom_Cre: is the domestic credit of the private sector as percentage of the gross domestic product
21
The definition of the World Bank atlas method can be find at: http://data.worldbank.org/about/country-classifications/world-bank-atlas-method. 22
The definition of the “Financial Times and the London Stock Exchange, FTSE Index” method can be find at: http://www.ftse.com/Indices/Country_Classification/index.jsp

Table 5. Firms Creation Determinants
Determinants of Firm Creation
Dependent Variable New Firms Entry Density
High Income Countries Emerging Countries Low Income Countries
(1) (2) (3) inst_qual 4.197 (1.327)*** 1.019 (0.458)** 0.477 (0.195)*** dom_cre 0.011 (0.003)*** 0.019 (0.006)*** 0.005 (0.002)** bus_free 0.137 (0.041)*** 0.027 (0.009)*** 0.005 (0.002)**
tra_free -0.129 (0.059)*** 0.003 (0.005) 0.007 (0.002)*** fiscal_free 0.057 (0.033)* 0.014 (0.008) 0.005 (0.003) inv_free 0.027 (0.029) 0.014 (0.004)** 0.001 (0.001)
Fdi(t-1) 0.030 (0.027) 0.059 (0.007)*** 0.002 (0.004)
gdp_pcu 0.0001 (0.00008)** 0.00004 (0.00003) 0.0002 (0.00003) unemploy -0.224 (0.097)** -0.109 (0.037)*** -0.004 (0.003)* ltrade-1 2.482 (0.797)** 0.754 (0.369)** 0.119 (0.055)*
inflation 0.121 (0.080) 0.031 (0.017) 0.001 (0.003) intercept 10.214 (6.706) 2.408 (1.486) -0.41 (0.359)
R² 0.576
Within 0.7231 0.6474 Betwee 0.3360 0.2870 Overall 0.3319 0.2470 n 114 194 99
Test p-value Test p-value
wald chi² 101.52 0.0000 265.34 0.0000 100.54 0.0000 Hausman 6.27 0.7127 12.12 0.3545 2.59 0.9951 Breusch-Pagan (LM) 100.28 0.0000 181.05 0.0000 118.31 0.0000
The dependent variable for country i at year t is the number of new companies registered per 1,000 people of working age (age between 15 and 64).The regression (1) is done for high income countries group ; The regression (2) is done for emerging countries group; and the regression (3) is done for low income countries group. Countries with high and low income were categorized by the classification of The World Bank Atlas method23; on the other hand the emerging economies were categorized by The Financial Times and the London Stock Exchange: FTSE index24. The period of time is 6 years (from 2004 to 2009). The independent variables are: Ins_qual: is the average of all the institutional quality dimensions proposed by Kaufmann et al (2010). Dom_Cre: is the domestic credit
23
The definition of the World Bank atlas method can be find at: http://data.worldbank.org/about/country-classifications/world-bank-atlas-method. 24
The definition of the “Financial Times and the London Stock Exchange, FTSE Index” method can be find at http://www.ftse.com/Indices/Country_Classification/index.jsp

of the private sector as percentage of the gross domestic product (Beach y Kane: 2007): Bus_free: is the quantitative measure of the facility to start, operate and close a business. Tra_free: is a measure composed of the absence of tariff barriers and nontariff barriers, which affect the importations and exports of goods and services in each country. Fiscal_Free: is a measure of the tax barriers imposed by the government. Inv_Free is a measure for the existing restrictions to the flow of capital investment on a specific country. Fdi: is the net flow of foreign investment divided by the gross domestic product. gdp_pcu: is the gross domestic product per capita in dollars calculated at prices and currents exchange rates. Unemploy: is the percentage of unemployed people of the total available workforce. Ltrade: is the logarithm of the sum of all the exportations and importations divided by the current value of the gross domestic product in current dollars. Inflation: is the porcentage change of the consumer prices at the end of the period. Fdi and Ltrade are lagging in order to avoid possible endogeneity with Ins_qual, Inv_Free or Tra_free. The static is specified in parentheses. The regression (1) contains temporal effects and the coefficients are based on the errors estimating. PCSE (Panel Corrected Standard Errors). Moreover the regression (2) and (3) the coefficients are based on the errors estimating GLS (Randon effects GLS regression robust standard error).***, ** and *, which means statistical significance at 1%, 5% and 10% respectively. Table 6. Time of impact of changes in the institutional quality, FDI and regulation of free trade in Entry Density
Time of impact of changes in the institutional quality, FDI and regulation of free trade in Entry Density
Dependent Variable New Firms Entry Density
Variable Emerging Countries Low Income Countries
(t-1) (t-2) (t-1) (t-2)
(4) (5) (6) (7)
inst_qual 0.548 (0.318)* 0.819 (0.420)** 0.429 (0.163)*** 0.284 (0.167)*
dom_cre 0.014 (0.006)** 0.007 (0.247) 0.0005 (0.003) 0.003 (0.004)
bus_free 0.006 (0.010) 0.021 (0.0121) 0.003 (0.004) 0.002 (0.003)
tra_free 0.003 (0.007) 0.002 (0.008) 0.006 (0.001)*** 0.002 (0.004)
fiscal_free 0.001 (0.012) 0.034 (0.0187)* 0.005 (0.005) 0.003 (0.004)
inv_free 0.01 (0.008) 0.001 (0.005) 0.002 (0.001) 0.001 (0.001)
Fdi(t-1) 0.034 (0.009)*** 0.038 (0.013)*** 0.0004 (0.005) 0.001 (0.005)
gdp_pcu 0.00001 (0.00003) 0.00001 (0.00006) 0.000006 (0.00004) 0.00008 (0.00004)**
unemploy -0.025 (0.031) 0.034 (0.033) -0.006 (0.002)*** -0.007 (0.003)**
ltrade(t-1) 1.102 (0.402)*** 1.121 (0.490)** 0.196 (0.077)** 0.379 (0.136)***
inflation -0.047 (0.019) -0.0007 (0.009) -0.005 (0.003) -0.004 (0.004)
intercept -3.859 (2.011)* -4.321 (2.110)** -0.951 (0.678) -1.285 (0.795)
R²

Within 0.2796 0.2352 0.2758 0.2510
Betwee 0.3080 0.3854 0.3028 0.3843
Overall 0.2854 0.3688 0.2717 0.3244
n 194 194 115 115
Test p-value Test p-value Test p-value Test p-value
wald chi² 72.76 0.0000 50.18 0.0000 107.48 0.0000 77.09 0.0000
Hausman 2.37 0.9927 9.97 0.5331 4.92 0.8962 4.91 0.9159 Breusch-Pagan (LM) 234.39 0.0000 238.4 0.0000 130.59 0.0000 142.17 0.0000
The dependent variable for country i at year t is the number of new companies registred per 1,000 people of working age (age between 15 and 64). The regressions (4) and (5) are done for emerging countries group; and the regressions (6) and (7) are done for the low income countries group. Countries with low income were categorized by the classification of The World Bank Atlas method25; on the other hand the emerging economies were categorized by The Financial Times and the London Stock Exchange: FTSE index26. The period of time is 6 years (from 2004 to 2009). The independent variables are: Ins_qual: is the average of all the institutional quality dimensions proposed by Kaufmann et al (2010). Dom_Cre: is the domestic credit of the private sector as percentage of the gross domestic product (Beach y Kane: 2007): Bus_free: is the quantitative measure of the facility to start, operate and close a business. Tra_free: is a measure composed of the absence of tariff barriers and nontariff barriers, which affect the importations and exports of goods and services in each country. Fiscal_Free: is a measure of the tax barriers imposed by the government. Inv_Free is a measure for the existing restrictions to the flow of capital investment on a specific country. Fdi: is the net flow of foreign investment divided by the gross domestic product. gdp_pcu: is the gross domestic product per capita in dollars calculated at prices and currents exchange rates. Unemploy: is the percentage of unemployed people of the total available workforce. Ltrade: is the logarithm of the sum of all the exportations and importations divided by the current value of the gross domestic product in current dollars. Inflation: is the porcentage change of the consumer prices at the end of the period. Fdi and Ltrade are lagging two periods in order to avoid possible endogeneity with Ins_qual, Inv_Free or Tra_free. The statistical is specified in parentheses. The coefficients of the regression are based on the error estimation due to the countries aggrupation (Randon effects GLS regression robust standard error clusters in countrys). ***, ** and * *, which means statistical significance at 1%, 5% and 10% respectively.
25
The definition of the world bank atlas method can be find at: http://data.worldbank.org/about/country-classifications/world-bank-atlas-method. 26
The definition of the “Financial Times and the London Stock Exchange, FTSE Index” method can be find at: http://www.ftse.com/Indices/Country_Classification/index.jsp

Table 7. FDI Productivity in firm creation at emerging countries.
FDI Productivity in firm creation at emerging countries
Dependent Variable New Firms Entry Density
(8) (9)
inst_qual 0.665 (0.376)** 0.695 (0.362)*
Fdi(t-1)*Ins_qual (mitad superior) 0.065 (0.011)***
Fdi(t-1)*Ins_qual (mitad inferior) 0.012 (0.011)
fdi(t-1)*Ins_qual (<1er quartil) 0.007 (0.022)
fdi(t-1)*Ins_qual (1er-3er quartil) 0.064 (0.033)*
fdi(t-1)*Ins_qual (> 3er quartil) 0.059 (0.007)*** dom_cre 0.019 (0.009)** 0.019 (0.008)** bus_free 0.018 (0.010)* 0.013 (0.008) tra_free 0.004 (0.006) 0.002 (0.005) fiscal_free 0.001 (0.010) 0.0007 (0.009) inv_free 0.006 (0.005) 0.005 (0.005) gdp_pcu 0.0001 (0.0004) 0.00001 (0.0005)
unemploy -0.032 (0.040) -0.030 (0.041)
inflation(t-1) 0.739 (0.394)* 0.763 (0.436)*
ltrade(t-1) -0.015 (0.012) -0.023 (0.015) intercept -2.586 (1.607) -2.663 (1.721)
R² Within 0.6293 0.6413 Betwee 0.2547 0.2730 Overall 0.2749 0.3007 n 194 194
Test p-value Test p-value
wald chi² 260.09 0.0000 147.27 0.0000 Hausman 0.88 0.9999 7.01 0.8572 Breusch-Pagan (LM) 189.49 0.0000 142.07 0.0000
The dependent variable for country i at year t is the number of new companies registered per 1,000 people of working age (age between 15 and 64). For emerging countries group categorized by the classification of the Financial Times and the London Stock Exchange: FTSE index. The period of time is 6 years (from 2004 to 2009). The independent variables are: Ins_qual: is the average of all the institutional quality dimensions proposed by Kaufmann et al. (2010). Fdi: is the net flow of foreign investment divided by the gross domestic product. Fdi*Int_qual (upper half): multiply the FDI by one if the institutional quality of the country is
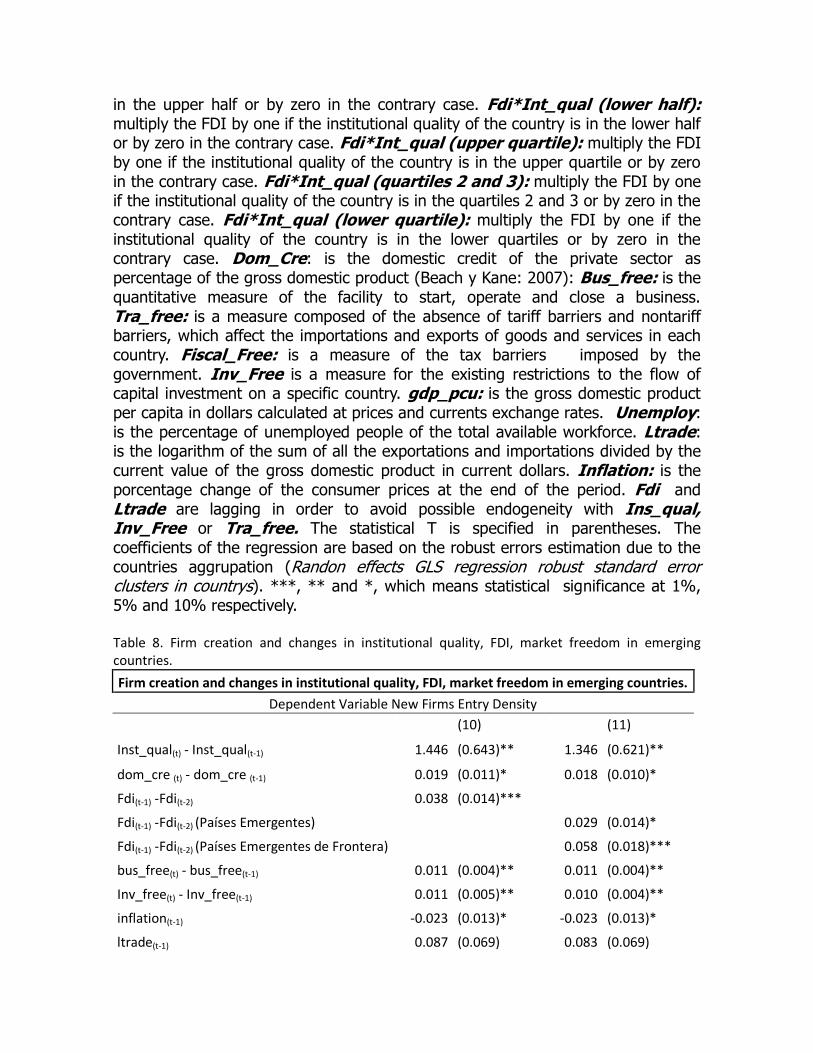
in the upper half or by zero in the contrary case. Fdi*Int_qual (lower half): multiply the FDI by one if the institutional quality of the country is in the lower half or by zero in the contrary case. Fdi*Int_qual (upper quartile): multiply the FDI by one if the institutional quality of the country is in the upper quartile or by zero in the contrary case. Fdi*Int_qual (quartiles 2 and 3): multiply the FDI by one if the institutional quality of the country is in the quartiles 2 and 3 or by zero in the contrary case. Fdi*Int_qual (lower quartile): multiply the FDI by one if the institutional quality of the country is in the lower quartiles or by zero in the contrary case. Dom_Cre: is the domestic credit of the private sector as percentage of the gross domestic product (Beach y Kane: 2007): Bus_free: is the quantitative measure of the facility to start, operate and close a business. Tra_free: is a measure composed of the absence of tariff barriers and nontariff barriers, which affect the importations and exports of goods and services in each country. Fiscal_Free: is a measure of the tax barriers imposed by the government. Inv_Free is a measure for the existing restrictions to the flow of capital investment on a specific country. gdp_pcu: is the gross domestic product per capita in dollars calculated at prices and currents exchange rates. Unemploy: is the percentage of unemployed people of the total available workforce. Ltrade: is the logarithm of the sum of all the exportations and importations divided by the current value of the gross domestic product in current dollars. Inflation: is the porcentage change of the consumer prices at the end of the period. Fdi and Ltrade are lagging in order to avoid possible endogeneity with Ins_qual, Inv_Free or Tra_free. The statistical T is specified in parentheses. The coefficients of the regression are based on the robust errors estimation due to the countries aggrupation (Randon effects GLS regression robust standard error clusters in countrys). ***, ** and *, which means statistical significance at 1%, 5% and 10% respectively. Table 8. Firm creation and changes in institutional quality, FDI, market freedom in emerging countries.
Firm creation and changes in institutional quality, FDI, market freedom in emerging countries.
Dependent Variable New Firms Entry Density
(10) (11)
Inst_qual(t) - Inst_qual(t-1) 1.446 (0.643)** 1.346 (0.621)**
dom_cre (t) - dom_cre (t-1) 0.019 (0.011)* 0.018 (0.010)*
Fdi(t-1) -Fdi(t-2) 0.038 (0.014)***
Fdi(t-1) -Fdi(t-2) (Países Emergentes) 0.029 (0.014)*
Fdi(t-1) -Fdi(t-2) (Países Emergentes de Frontera) 0.058 (0.018)***
bus_free(t) - bus_free(t-1) 0.011 (0.004)** 0.011 (0.004)**
Inv_free(t) - Inv_free(t-1) 0.011 (0.005)** 0.010 (0.004)**
inflation(t-1) -0.023 (0.013)* -0.023 (0.013)*
ltrade(t-1) 0.087 (0.069) 0.083 (0.069)

intercept -0.175 (0.317) -0.162 (0.315)
R² Within 0.3026 0.3085 Between 0.6745 0.7494 Overall 0.376 0.3982 n 194 194
Test p-value Test p-value
wald chi² 30.72 0.0001 36.48 0.0000
Hausman 3.55 0.8298 3.32 0.9126
Breusch-Pagan (LM) 8.00 0.0047 10.74 0.0010
At the regressions (10) and (11) the dependent varible for theconutry i and the year t is the variation between t and t-1 in the number of new companies registered per 1,000 people of working age (age between 15 and 64). For emerging countries group categorized by The Financial Times and the London Stock Exchange: FTSE index. The period of time is 6 years (from 2004 to 2009). The independent variables are: Ins_qual(t)- Ins_qual(t-1): is the variation
between t and t-1, of the average of the institutional quality dimensions proposed by Kaufmann et al. (2010). dom_cre(t)-dom_cre(t-1): ): is the variation between t and t-1, of the domestic credit to the private sector as a percentage of the gross domestic product. Fdi(t-1)- Fdi(t-2): ): is the variation between t-1 and t-2, of the net flow of foreign investment divided by the gross domestic product. Fdi(t-1)- Fdi(t-2)
(emerging countries): multiplies by one the variation between t-1 and t-2 of the net flow of the foreign investment divided by the gross domestic product if the emerging country is not classify as frontier economy according to The Financial Times and the London Stock Exchange: FTSE index. Fdi(t-1)- Fdi(t-2) (Frontier emerging countries): multiplies by one the variation between t-1 and t-2 of the net flow of foreign investment divided by the gross domestic product, if the emerging country is classify as frontier economy according to The Financial Times and the London Stock Exchange: FTSE index. bus_free(t)-bus_free(t-1): is the variation between t and t-1, in the quantitative measure of the ease to start, operate and close a business (Beach y Kane: 2007). Inv_free(t)-Inv_free(t-1) is the variation between t and t-1, the extended of any restrictions on the flow of investment capital in a given country (Beach y Kane: 2007). Inflation: is the porcentage change of the consumer prices at the end of the period. Ltrade: is the logarithm of the sum of all the exportations and importations divided by the current value of the gross domestic product in current dollars. The coefficients of the regression are based on the robust errors estimation due to the countries aggrupation (Randon effects GLS regression robust standard error clusters in countrys). ***, ** and *, which means statistical significance at 1%, 5% and 10% respectively.