The Relationship among Brand Experience, Brand Image and ...
16
Proceedings Book of ICEFMO, 2013, Malaysia Handbook on the Economic, Finance and Management Outlooks ISBN: 978-969-9347-14-6 162 The Relationship among Brand Experience, Brand Image and Customer Satisfaction of Facebook Users in Indonesia Ida Yulianti Department of Management, Faculty of Economic and Business, University of Brawijaya Email: [email protected] Wei Tung Graduate Institute of Marketing and Logistics, National Chiayi University Email: [email protected] Abstract This study examined relationships among brand experience, brand image and customer satisfaction by using Facebook as the research object. Facebook.com as the new communication media becomes popular around the world. Based on the main purpose of product and service to achieve customer satisfaction, the study indicated that brand experience and brand image had a positive influence to support that goal. Its samples were university students in Indonesia and were analyzed based on three variables i.e brand experience, brand image and customer satisfaction. Brand experience consists of four dimensions (1) sensory, (2) affective, (3) behavioral, (4) intellectual. Brand image consists of eight items. Customer satisfaction consists of six items. This research indicated that brand experience had positive influence to brand image and customer satisfaction. However, brand image had positive influence to customer satisfaction. Key words: Brand, Brand experience, Brand image, Customer satisfaction, Facebook.com, Indonesia 1. Introduction Most companies try to measure customer satisfaction for their product and services, because the fundamental views whether a product successful or failed are customer satisfaction and loyalty. They do not think about the important factors to build customer satisfaction. An article in Harvard Business Review explains that many companies have been trying to measure customer satisfaction and have plenty of data as a result. The problem is that measuring customer satisfaction does not tell anyone how to achieve it (Harvard Business Review, 2007). One of important strategies to achieve customer satisfaction is branding strategy. Brand strategy consists of (1) choosing a good name, symbol or
-
Upload
khangminh22 -
Category
Documents
-
view
5 -
download
0
Transcript of The Relationship among Brand Experience, Brand Image and ...

Proceedings Book of ICEFMO, 2013, Malaysia
Handbook on the Economic, Finance and Management Outlooks
ISBN: 978-969-9347-14-6
162
The Relationship among Brand
Experience, Brand Image and
Customer Satisfaction of Facebook
Users in Indonesia
Ida Yulianti
Department of Management, Faculty of Economic and Business, University of Brawijaya
Email: [email protected]
Wei Tung Graduate Institute of Marketing and Logistics, National Chiayi University
Email: [email protected]
Abstract This study examined relationships among brand experience, brand image and customer satisfaction by
using Facebook as the research object. Facebook.com as the new communication media becomes
popular around the world. Based on the main purpose of product and service to achieve customer
satisfaction, the study indicated that brand experience and brand image had a positive influence to
support that goal. Its samples were university students in Indonesia and were analyzed based on three
variables i.e brand experience, brand image and customer satisfaction. Brand experience consists of
four dimensions (1) sensory, (2) affective, (3) behavioral, (4) intellectual. Brand image consists of
eight items. Customer satisfaction consists of six items. This research indicated that brand experience
had positive influence to brand image and customer satisfaction. However, brand image had positive
influence to customer satisfaction.
Key words: Brand, Brand experience, Brand image, Customer satisfaction, Facebook.com,
Indonesia
1. Introduction
Most companies try to measure customer satisfaction for their product and services, because the
fundamental views whether a product successful or failed are customer satisfaction and loyalty. They
do not think about the important factors to build customer satisfaction. An article in Harvard Business
Review explains that many companies have been trying to measure customer satisfaction and have
plenty of data as a result. The problem is that measuring customer satisfaction does not tell anyone
how to achieve it (Harvard Business Review, 2007). One of important strategies to achieve customer
satisfaction is branding strategy. Brand strategy consists of (1) choosing a good name, symbol or

Ida Yulianti; Wei Tung
163
logos and (2) making sure that startegy elements have six good criteria such as memorability,
meaningfulness, likability, transferability, adaptability and protectability. In addition to service or
product quality itself, a company should try to provide positive customer consumption experiences in
every possible encountering opportunities to establish good associations toward the brand. As a result,
it may enhance customer satisfaction toward the brand. In fact, a brand contains experiential meaning
and emotional associations to its customers. Misunderstanding the connections between a brand and its
target customer may cause a disaster. One of parts in brand association is brand image (Low & Lamb,
2000). Brand image is customer perception about product and service. If they have good perception
about product, they will tend to choose that product. It is really important because some companies
already have their own brand image and try to make it in customer mind. To create a strong brand,
companies have to offer positive experience to customers. If customers have positive experience, they
will tend to generate satisfaction and loyalty to the brand. Aaker (1997) describes that brand
experience occur whenever there is a direct or indirect interaction with the brand. To create positive
experience, a company needs support from all brand elements such as image, quality, and personality
of products or services. This indicates that brand experience have relationship with brand image to
achieve customer satisfaction.
Recently, Facebook.com becomes one of the most famous brands in the world. A lot of people
from different social background have Facebook.com account. According to a study conducted by
ComScore (2007), around six billion people around the world use social networking site and give
contribution about a quarter of internet traffic. Today, Facebook.com has around 700 million active
users. Pempek, Yermolayeva and Calvert (2009) indicate that students use Facebook.com
approximately 30 minutes throughout the day as part of their daily routine. In South East of Asia,
especially Indonesia, Thailand, Malaysia, and Singapore, Facebook.com is the most popular social
networking site. There are at least 34,999,080 Facebook.com user in Indonesia, and become the
second country which has the most Facebook user in the world, after United States
(CheckFacebook.com, 2011). Because of that reason, this study was intended to explore the
relationships among brand experience, brand image and customer satisfaction on Facebook.com users
in Indonesia.
2. Literature Review
2.1 Customer Satisfaction According to Kotler and Keller (2009), satisfaction is a person’s feelings of pleasure or
disappointment resulted from comparing a product perceived performance (or outcome) to his
expectation. If performance falls to meet customer expectation, a customer will be dissatisfied. If
performance matches customer expectation, a customer will be satisfied. If performance exceeds
customer expectation, a customer will be highly satisfied or delighted. Tjiptono (1997) suggests that
customer satisfaction or customer dissatisfaction is a customer’s response to the matching evaluation
and disconfirmation between expectation and product / service performance. From this definition,
there are two feelings of customer satisfaction - happy and disappoint after they make evaluation of
product/service performance. The quality of products and services comes from customer expectation
and ends at customer perception. Because of that, if companies can fulfill customer’s needs and
expectation, they can be successful. The purpose of producing goods or services is to make ideal ones
based on customer expectation. Customer satisfaction has led to: (1) higher future profitability of a
firm (Anderson, Fornell, & Lehmann, 1994); (2) lower costs related to defective goods and services
(Anderson, Fornell, & Rust, 1997); (3) increase of customer willingness to pay premium price, provide
referrals, and use more products or services (Anderson & Mittal, 2000; Reichheld, 1996), and (4)
higher levels of customer retention and loyalty (Anderson & Mittal, 2000).
Factors Affecting Customer Satisfaction
Customers may explain their satisfaction with products or services in terms of specific aspects such as
product’s attributes, price, customer services, or the combination of these features. These product’s
attributes or their combination of product’s features are related to brand. The previous research shows
a significance relationship between customer satisfaction and brand of product (different kinds of

Handbook on the Economic, Finance and Management Outlooks
164
brand such as brand equity, brand image, brand experience and so on) as well as how brand elements
influence customer satisfaction. Ahmad and Hashim (2010) find that satisfaction mediates the
relationship between customer based brand equity construct and loyalty. Che Ha and Sharizal (2007)
describe that brand meaning is an important factor to create brand equity that will lead to customer
satisfaction and loyalty. Customer satisfaction can be measured either by a single item (e.g., Cronin &
Taylor, 1992) or multiple items (e.g., Gilbert & Veloutsou, 2004; Spreng & Mackoy, 1996; Wirtz and
Lee, 2003). In its simplest form, customer satisfaction research involves dividing customers’ overall
experience into sub-levels of criteria, and then a rating scale is applied to measure how satisfied these
customers with services on the basis of these criteria.
2.2 Brand Experience Brand experience refers to subjective, internal customer responses (sensations, feelings, and
cognitions) and behavioral responses evoked by brand-related stimuli that are part of a brand’s design
and identity, packaging, communications, and environments (Brakus, Schmitt & Zarantonello, 2009).
In other words, brand experience means the experiential aspects consisting of the sum of all points of
contact with the brand (Wikipedia, 2011). The customer’s perception of a brand is related with
customer experience (Cliffe and Motion, 2004). Therefore, marketers have to understand customer
experience about their brands for developing marketing strategies. In brand strategy, brand experience
is an important thing and becomes paramount. They suggest ‘‘marketing and external communications
help to build the brand, but nothing is more powerful than the customer’s actual experience’’ (Berry,
2000, p. 136).
Factors Affecting Brand Experience
A brand experience includes the use of product or service directly as well as relates to brand image,
brand association and events (Cliffe and Motion, 2004). Some marketing research have shown that
experience occurs when customers search product, receive services, and consume products (Arnould,
Price, and Zinkhan, 2002; Brakus, Schmitt, and Zhang, 2008; Holbrook, 2000). Product experience
happens when customers have a direct interaction with a product such as searching a product,
examining and evaluating that product (Hoch, 2002). Shopping experience happens when customers
have direct interactions with a store’s physical environment (Hui and Bateson, 1991; Kerin, Jain and
Howard, 2002). In addition, Aaker (1997) suggests that brand experience not only happen when
consumption and after consumption, but also whenever a direct or indirect interaction with a brand
exists. There are some previous studies that describe about factors affecting brand experience as well
as how brand experience affects customer satisfaction and relationship between brand experience and
brand image. In 2007, Ismail analyzed that brand experience affected brand personality, brand image
and brand love to formulate positive word of mouth. Positive word of mouth indicates the positive
response of customer and also has an influence to build customer satisfaction. According to a recent
research, there are four dimensions that can be used to measure brand experience (Brakus, Schmitt &
Zarantonello, 2009):
1. Sensory: using a sense of customers to measure the customer experience.
2. Affective: using feelings and emotional of customer the customer experience.
3. Intellectual: using the ability of the brand to engage customers.
4. Behavioral: using bodily experience, lifestyles and interactions with the brand to measure the
customer experience.
2.3 Brand Image Brand image is certain characteristics of product and service that required to be assured in
customer mind. Brand image, refers to the different perceptions that consumers hold in their mind
(Keller, 1993) resulted from communicating the brand identity to the market (Kapferer, 2004; Stern,
Zinkhan, and Jaju, 2001). The previous research suggest that parent brand experience improves the
brand extension evaluation (Swaminathan et al., 2001; Swaminathan, 2003) and avoids the risk of
brand image dilution (Alexander and Colgate, 2005; Swaminathan, 2003). This indicates that brand
image has positive relation with brand experience. On the other side, Eva, et.al (2009) find that brand
image has positive influence to brand loyalty. This also indicates that brand image has a strong
influence to customer satisfaction. When a consumer feels good about the relationship and appreciates

Ida Yulianti; Wei Tung
165
the product or brand, a high level of commitment and loyalty results (Anderson and Sullivan 1993;
Mittal and Kamakura 2001; Oliver 1997).
Factors Affecting Brand Image
A positive brand image is created by strong and favorable marketing programs and unique associations
(Keller, 2003). There are three main elements of brand image i.e (1) Logos is a means to indicate
origin, ownership and association of products or services. There are many types of logos, such as
corporate names or trademarks written in a distinctive form; (2) Slogans are short sentence that
communicate information about the brand. Slogans are powerful branding tools because they are
efficient to build brand equity; (3) Image identifiers are other devices to communicate a brand such as
brochures, advertising media, business card, truck signage, website, and every single piece of
communication to customers and prospects.
2.3 Introduction to Facebook.com. Since 2004, Mark Zuckerberg, Andrew McCollum and Eduardo Saverin have launched a social
network that has changed online social interaction forever. Facebook.com was started in the campus
of Harvard University and within 24 hours Facebook.com had a community of 1200 Harvard
University students. Facebook.com grew faster in Harvard campus, and after a few weeks many
students from Stanford and Yale wanted in. The network was extended and became an Ivy League
server in April 2004. In September 2004, the founders of Facebook.com got capital from PayPal
founder Peter Thiel. The investment was $500,000. Seeing the potential value of Facebook.com, Jim
Breyer and Accel Partners ponied up $12.7 million to assist Zuckerberg in the expansion of his virtual
empire. Therefore, in October 2004, Zuckerberg had money, manpower, and institutional backing to
enter the global market. In August 2005, Facebook.com was registered and had a slogan “Facebook is
a social utility that connects you with the people around you”. After the network is open, everyone
who has valid institutional email address from 30,000 organizations becomes a member, including
high school students, government employees and the corporate community. In September 2006,
Facebook.com was expanded once again. They launched “News Feed” feature to protect privacy of
users in longtime and attracted new membership to join. In fact, between May 2006 and May 2007
Facebook.com traffic grew by an astonishing 89%.
Facebook.com extends their platform where one integrates internet activities into a single
Facebook profile. Developers quickly start to build applications for all popular sites, and users start
adding them in an effort to streamline their virtual identities. The next strategy of Facebook.com is
doing direct advertising. In August 2007 Facebook.com announced that it was looking to “translate its
popularity into bigger profits” by offering advertisers direct access to their targeted demographic
customers. As a Wall Street Journal article put it, “While the Web site had roughly 30.6 million
visitors in July, the company says it needs to do a better job profiting from its huge user base.” From
this offering, it shows that Facebook.com is still having little independent startup and holding out
against the big corporate bullies like Viacom and Yahoo, despite its ties to Accel and Silicon Valley’s
corporate elite. Table 2.1 shows the list of countries that have the most Facebook.com users around the
world.
Table-2.1. Top 10 Countries of Facebook.com users around the world
No. Country User Penetration
1.
2.
3.
4.
5.
6.
7.
8.
9.
10.
United States
Indonesia
United Kingdom
Turkey
Philipines
India
Mexico
France
Italy
Canada
151.820.460
34.999.080
28.841.840
26.198.200
22.515.820
21.726.960
21.560.720
20.957.320
18.355.680
17.357.660
24.30%
5.60%
4.62%
4.19%
3.60%
3.48%
3.45%
3.35%
2.94%
2.78%
Source: CheckFacebook.com(February 12st,2011)

Handbook on the Economic, Finance and Management Outlooks
166
Creating a Facebook Profile has several benefits such as accessing network with friends, updating
status, sharing photos or videos, and so on. Students browse Facebook around 30 per day (Pempek, et
al, 2009). Hussein and Isharina (2009) find that Facebook’s service quality affects user loyalty. The
reason of why this research choose students as the representative of Facebook users is because they
have more experience in using Facebook.com.
3. The Methodology and Model
3.1 Research Model This research proposed a tentative model to serve as a conceptual framework for developing
hypothesis and model testing. The model in Figure 3.1 suggests that brand experience has positive
influences on brand image and customer satisfaction. Meanwhile, brand image has positive influence
on customer satisfaction.
H2 H3
H1
The first hypothesis is:
H1 : Brand experience has positive influence on customer satisfaction.
Brakus et al (2009) in their research find that brand experience affects consumer satisfaction and
loyalty directly and indirectly through brand personality associations. Prahalad and Ramaswamy
(2004) suggest managing customer experience as the primary sources of value creation. Value creation
is performing activities that increase the value of goods and services to consumers (ventureline.com,
2011). If products or services have a good value creation, it will support best performance of the
products or services themselves. Thus, it can make customer feel satisfied. Groot, Antonides, Read
and Raaij (2009) also find that a direct product experience affects consumer’s product evaluation.
Product evaluation plays an important role of customer’ in making purchase decision. Customers tend
to make purchase decision to some products or services when they feel satisfed with them.
Consequently, customers tend to have higher interest to products and services when they have positive
experiences with them. The findings of those previous research support that brand experience has an
important impact on customer satisfcation.
The second hypothesis is:
H2 : Brand experience has positive influence on brand image.
The previous research suggest that parent brand experience improves the brand extension evaluation
(Swaminathan et al., 2001; Swaminathan, 2003) and avoids the risk of brand image dilution
(Alexander and Colgate, 2005; Swaminathan, 2003). This indicates that brand image has positive
relation with brand experience.
The third hypothesis is:
H3 : Brand image has positive influence on customer satisfaction.
Eva, et.al (2009) find that brand image has positive influence to brand loyalty. This also indicates that
brand image has a strong influence to customer satisfaction. When a consumer feels good about the
Sensory
Affective
Behavioral
Intellectual
Brand image
Brand experience Customer
satisfaction

Ida Yulianti; Wei Tung
167
relationship and appreciates the product or brand, a high level of commitment and loyalty results
(Anderson and Sullivan 1993; Mittal and Kamakura 2001; Oliver 1997).
3.2 Sampling Method The population of this research were Facebook.com users in Indonesia. In February 2011, there
were 34.999.080 Facebook users in Indonesia. Table 3.1 describes characteristic population of
Facebook users in Indonesia in February 2011.
Table-3.1. Characteristics population of Indonesian Facebook users in 2011.
Distribution Total Percentage
Gender Male
Female
20.713.700
14.172.400
59.4%
40.6%
Age <=13 years old
14-17 years old
18-24 years old
25-34 years old
35-44 years old
45-54 years old
55-64 years old
65+ years old
694.600
8.971.360
14.431.060
7.520.220
2.187.420
591.980
134.960
467.480
2.0%
25.6%
41.2%
21.5%
6.2%
1.7%
0.4%
1.4%
Source: CheckFacebook.com (February 12st, 2011)
This research applied a purposive sampling. Purposive sampling is a sampling technique that chooses
a person who tries as a representative (Barrerio & Albandoz, 2001). Therefore, the goal becomes
finding a representative sample (or subset) of that population. The samples of this research were
university students of Brawijaya University, Indonesia that included undergraduate students and
graduate students. The reason to choose student as respondents because they represented one of the
largest groups of Facebook.com users.
3.3 Data Collection Data were collected by questionnaire from May 9th until May 21th, 2011. Deciding the
sampled number research was based on Slovin’s formula by Guilford and Fructher (1973):
Where, n = sample size; N= population size; e = margin of error.
The suggested number of samples in this research was 399. A total of 400 questionnaires were
distributed to Indonesia. In the total of 400 questionnaires, due to missing data, this research collected
398 effective sample size, which was very close to the suggested sample size. Table 3.2 provides
background information of respondents who used Facebook. The information includes: (1) gender ,(2)
age, (3) occupation, (4) average use of Facebook per day, and (5) average use of Facebook per week.
Table-3.2. Profile and behavior of respondent in using Facebook
Frequency
N=398
Percentage (%)
Gender
Male
Female
228
170
57.3
42.7
Age
14-17
18-24
25-34
3
386
9
0.8
97
2.2
Occupation
Undergraduate student
Graduate student
388
10
97.5
2.5
Average use of FB
per day
< 1 hour
1-3 hours
163
147
41
36.9

Handbook on the Economic, Finance and Management Outlooks
168
3-5 hours
5-7 hours
7-9 hours
9-11 hours
>11 hours
52
19
5
8
4
13.1
4.8
1.3
2
1
Average use of FB
per week
1 day
2 days
3 days
4 days
5 days
6 days
7 days
46
62
90
45
46
22
87
11.6
15.6
22.6
11.3
11.6
5.5
21.9
3.4 Measurement Model The purpose of this research was to explore about relationships among brand experience, brand
image, and customer satisfaction study case at Facebook.com. This research used quantitative analysis.
To collect primary data from the respondents, this research used a questionnaires. They included
questions about brand experience, brand image and customer satisfaction toward Facebook.com.
Every question had multiple answers of 7 Likert scales. A numerical value is assigned to each
potential choice and a mean figure for all responses is computed (Likert, 1932).
3.5 Scale Development
The data analysis in this research involved three stages. Stage one was item generation and
selection. Stage two was item reduction and dimensionality of the scale. Stage three was testing the
structural model.
Stage One: Item Generation and Selection
The objective of stage one was to generate scaled items for proposed dimensions of brand experience,
brand image and customer satisfaction. In this research, the items for each variable were recruited
from previous related studies which had reliability (α > 0.70). Brand experience has four dimensions
including sensory, affective, behavioral and intellectual. It uses 12 items to measure brand experience.
The items of brand experience are based on Brakus, et al’s (2009) research that suggests about
measurement of brand experience. All these items had the value of Cronbach Alpha greater than 0.7.
Table 3.3 shows the list of question items for brand experience modifed for Facebook.com condition
in this research. Brand image uses eight items combining several previous researches suggesting
about brand image. Variable customer satisfaction was measured by multiple items. These items were
based on some previous research studying customer satisfaction. This research choose six items that
had Cronbach Alpha >0.70. Therefore in total, this research adopted 26 items for brand experience
(including sensory 3 items, affective 3 items, behavioral 3 items and intellectual 3 items), brand image
(8 items), and customer satisfaction (6 items).
Table 3.3. Question Items for Brand Experience
No. Question items Source
1.
2.
3.
4.
5.
6.
7.
Sensory:
Facebook makes a strong impression on my visual sense or
other sense.
I find Facebook interesting in sensory way.
Facebook appeals in my sense.
Affective:
Facebook induces feelings and sentiments.
I have strong emotions with Facebook.
Facebook is an emotional brand.
Behavioral:
I am engaged in physical actions and behaviors when I use
Brakus, Schmitt and
Zarantonello (2009)
Ida Yulianti; Wei Tung
169
8.
9.
10.
11.
12.
Facebook.
Using Facebook results in behavior experiences.
Facebook is action- oriented.
Intellectual:
I am engaged in a lot of thinking when I encounter Facebook.
Facebook makes me think.
Facebook stimulates my curiosity and problem solving.
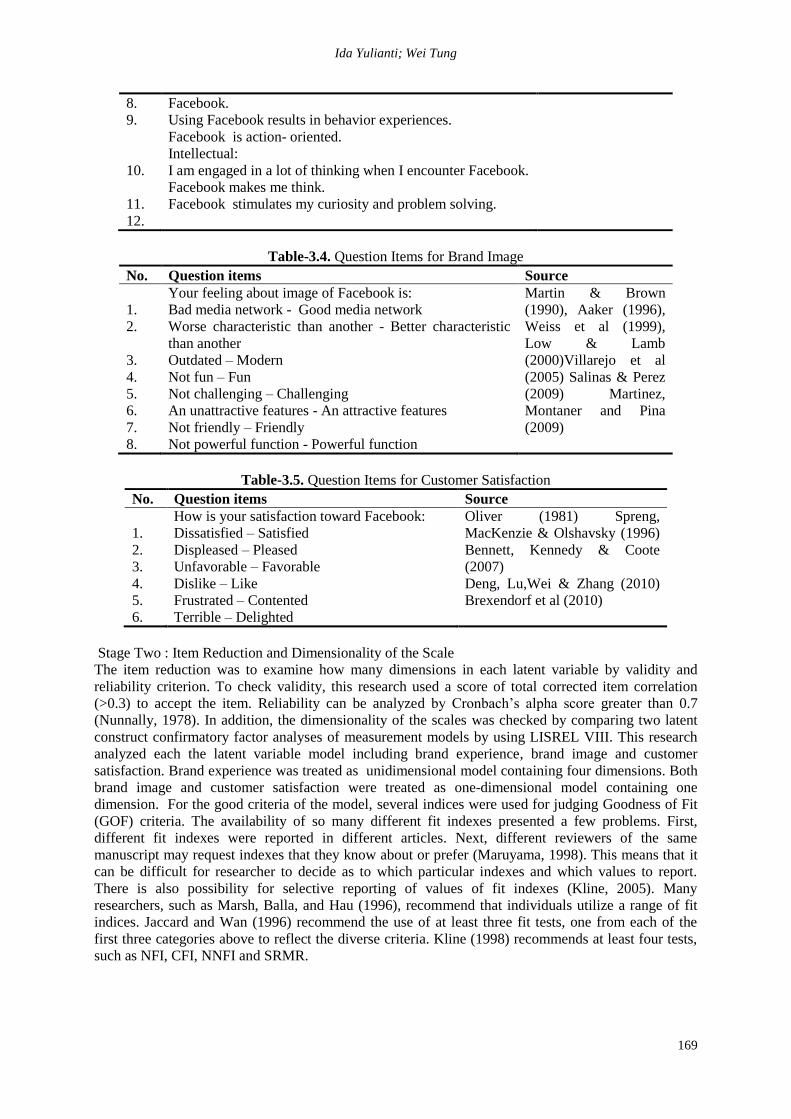
Table-3.4. Question Items for Brand Image
No. Question items Source
1.
2.
3.
4.
5.
6.
7.
8.
Your feeling about image of Facebook is:
Bad media network - Good media network
Worse characteristic than another - Better characteristic
than another
Outdated – Modern
Not fun – Fun
Not challenging – Challenging
An unattractive features - An attractive features
Not friendly – Friendly
Not powerful function - Powerful function
Martin & Brown
(1990), Aaker (1996),
Weiss et al (1999),
Low & Lamb
(2000)Villarejo et al
(2005) Salinas & Perez
(2009) Martinez,
Montaner and Pina
(2009)
Table-3.5. Question Items for Customer Satisfaction
No. Question items Source
1.
2.
3.
4.
5.
6.
How is your satisfaction toward Facebook:
Dissatisfied – Satisfied
Displeased – Pleased
Unfavorable – Favorable
Dislike – Like
Frustrated – Contented
Terrible – Delighted
Oliver (1981) Spreng,
MacKenzie & Olshavsky (1996)
Bennett, Kennedy & Coote
(2007)
Deng, Lu,Wei & Zhang (2010)
Brexendorf et al (2010)
Stage Two : Item Reduction and Dimensionality of the Scale
The item reduction was to examine how many dimensions in each latent variable by validity and
reliability criterion. To check validity, this research used a score of total corrected item correlation
(>0.3) to accept the item. Reliability can be analyzed by Cronbach’s alpha score greater than 0.7
(Nunnally, 1978). In addition, the dimensionality of the scales was checked by comparing two latent
construct confirmatory factor analyses of measurement models by using LISREL VIII. This research
analyzed each the latent variable model including brand experience, brand image and customer
satisfaction. Brand experience was treated as unidimensional model containing four dimensions. Both
brand image and customer satisfaction were treated as one-dimensional model containing one
dimension. For the good criteria of the model, several indices were used for judging Goodness of Fit
(GOF) criteria. The availability of so many different fit indexes presented a few problems. First,
different fit indexes were reported in different articles. Next, different reviewers of the same
manuscript may request indexes that they know about or prefer (Maruyama, 1998). This means that it
can be difficult for researcher to decide as to which particular indexes and which values to report.
There is also possibility for selective reporting of values of fit indexes (Kline, 2005). Many
researchers, such as Marsh, Balla, and Hau (1996), recommend that individuals utilize a range of fit
indices. Jaccard and Wan (1996) recommend the use of at least three fit tests, one from each of the
first three categories above to reflect the diverse criteria. Kline (1998) recommends at least four tests,
such as NFI, CFI, NNFI and SRMR.

Handbook on the Economic, Finance and Management Outlooks
170
Stage Three : Testing the Structural Model
The last analysis was to measure and analyze the structural model of relationships among brand
experience, brand image and customer satisfaction. To analyze goodness of fit for that model, this
research used structural equation modeling and criteria of GOF suggested by Kline (1998), Boomsma
(2000), and McDonald & Ho (2002). Kline (1998a: 130) recommends at least four tests, such as NFI,
CFI, NNFI and SRMR. Boomsma (2000) and McDonald & Ho (2002) suggest that the particular set
indexes includes: (1) the chi-square model, (2) the Bentler comparative fit index (CFI) and (3) the
standardized root mean square residual (SRMR). In the analysis of the structural model this research
used the summated scales of each dimension. A summated scale is a method of combining several
variables that measure the same concept into a single variable in an attempt to increase the reliability
of measurement. In most instances, the separate variables are summed, and then their total or average
scores are used for analysis. (Hair,2006).
4. Findings
4.1 Item Reduction and Dimensionality of the Scale The first thing before analyzing measurement model, was to check that all items were valid and
reliable. This research used item reduction to choose valid and reliable item. The reduction of items
was to examine how many dimensions in each latent variable by validity and reliability criterion. To
check the validity criterion, we used a score of total corrected item correlation (>0.3) to accept the
item. Reliability can be analyzed by Cronbach’s alpha score greater than 0.7 (Nunnally, 1978). Table
4.1 show the reliability and validity of each questionnaire items by using SPSS 16.0.
Table-4.1 Validity and Reliability
Latent variable Construct
variable
Items Cronbach alpha Corrected Item-
Total Correlation
Brand experience
Sensory
Sen1
Sen2
Sen3
0.843
0.719
0.787
0.803
Affective
Aff1
Aff2
Aff3
0.847
0.758
0.789
0.798
Behavioral
Bev1
Bev2
Bev3
0.813
0.626
0.690
0.671
Intellectual
Int1
Int2
Int3
0.849
0.831
0.834
0.717
Brand image
Brand image Im1
Im2
Im3
Im4
Im5
Im6
Im7
Im8
0.778 0.658
0.634
0.753
0.820
0.450
0.727
0.771
0.686
Customer
satisfaction
Customer
satisfaction
Cs1
Cs2
Cs3
Cs4
Cs5
Cs6
0.798 0.727
0.833
0.674
0.825
0.698
0.758

Ida Yulianti; Wei Tung
171
Based on the test of validity and reliability analysis, all questionnaire items had Alpha Cronbach
greater than 0.70, and corrected item total correlation score was smaller than 0.30. This research had
three measurement models including brand experience, brand image and customer satisfaction. Brand
experience was treated as unidimensional model with four dimensions. Both brand image and
customer satisfaction were treated as one-dimensional model. In the measurement model, the
questionnaire items were independent variables explaining the condition of dimension as a dependent
variable. Generally, any t-value greater than +2 or less than -2 is significant and acceptable
(allbusiness.com, 2011). For standardized solution, Hair et al (1998) suggest that cut off is fixed at 0.4.
Table-4.2. Confirmatory Factor Analysis of Brand Experience questions
Items Standardized Score T value Score Note (Hair,2006)
Sen1
Sen2
Sen3
Aff1
Aff2
Aff3
Bev1
Bev2
Bev3
Int1
Int2
Int3
0.65
0.79
0.86
0.79
0.76
0.76
0.63
0.62
0.66
0.90
0.85
0.61
13.47
17.36
19.22
17.37
16.48
16.48
12.78
12.61
13.54
21.76
20.02
12.95
Acceptable
Acceptable
Acceptable
Acceptable
Acceptable
Acceptable
Acceptable
Acceptable
Acceptable
Acceptable
Acceptable
Acceptable
Table-4.3. Goodness of Fit Brand Experience Model
Measurement Score Criterion of Fit Note (Kline, 1998)
Comparative fit index (CFI)
Normed fit index (NFI)
Non-normed fit index (NNFI)
Standardized root mean square
residual (SRMR)
Significance (P-value)
0.96
0.95
0.94
0.068
0.00
> 0.90
> 0.90
> 0.90
< 0.10
<0.05
Acceptable
Acceptable
Acceptable
Acceptable
Acceptable
The standardized solution of entire questions in brand experience was greater than 0.4 and below than
1.00. T-value in all of brand experience question was greater than 2. It indicated that questions of
brand experience had a construct validity and were significant to be used in the structural analysis.
Brand experience model had fullfiled the criteria of goodness of fit. This indicated brand experience
model was confirmed that it consisted of four dimensions, including sensory, affective, behavioral and
intellectual.
Table-4.4. Standardized solution of Brand Image questions
Items Standardized Score T value Score Note (Hair,1998)
Im1
Im2
Im3
Im4
Im5
Im6
Im7
Im8
0,64
0,61
0,76
0,85
0,41
0,73
0,79
0,68
13,73
12,82
17,24
20,32
8,17
16,39
18,24
14,70
Acceptable
Acceptable
Acceptable
Acceptable
Acceptable
Acceptable
Acceptable
Acceptable

Handbook on the Economic, Finance and Management Outlooks
172
Table-4.5. Goodness of Fit Brand Image Model
Measurement Score Criterion of Fit Note (Kline, 1998)
Comparative fit index (CFI)
Normed fit index (NFI)
Non-normed fit index (NNFI)
Standardized root mean square
residual (SRMR)
Significance (P-value)
0.96
0.95
0.94
0.050
0.00
> 0.90
> 0.90
> 0.90
< 0.10
<0.05
Acceptable
Acceptable
Acceptable
Acceptable
Acceptable
The standardized solution of entire questions in brand image was greater than 0.4 and below than
1.00. T-value in all of brand image question was greater than 2. It indicated that questions of brand
image had a construct validity and were significant to be used in the structural analysis. Brand image
model had fullfiled the criteria of goodness of fit. This indicated brand image model was confirmed
that it consisted of eight question items.
Table-4.6. Standardized Solution of Customer Satisfaction questions
Items Standardized Score T value Score Note (Hair,2006)
Cs1
Cs2
Cs3
Cs4
Cs5
Cs6
0.74
0.89
0.65
0.86
0.63
0.71
16.73
21.86
13.89
21.01
13.42
15.61
Acceptable
Acceptable
Acceptable
Acceptable
Acceptable
Acceptable
Table-4.7. Goodness of Fit Customer Satisfaction Model
Measurement Score Criterion of Fit Note (Kline, 1998)
Comparative fit index (CFI)
Normed fit index (NFI)
Non-normed fit index (NNFI)
Standardized root mean square
residual (SRMR)
Significance (P-value)
0.96
0.95
0.93
0.052
0.00
> 0.90
> 0.90
> 0.90
< 0.10
<0.05
Acceptable
Acceptable
Acceptable
Acceptable
Acceptable
The standardized solution of entire questions in customer satisfaction was greater than 0.4 and below
than 1.00. T-value in all of customer satisfaction question was greater than 2. This indicated that
questions of customer satisfaction had a construct validity and were significant to be used in the
structural analysis. Customer satisfaction model had fullfiled the criteria of goodness of fit. It indicated
customer satisfaction model was confirmed that it consisted of six question items to measure user
satisfaction about Facebook.
Figure-4.1. The four dimensional model of brand experience

Ida Yulianti; Wei Tung
173
Figure-4.2. The One dimensional model of brand image
Figure-4.3. The One dimensional model of customer satisfaction
In the analysis of structural model (relationships among brand experience, brand image and customer
satisfaction), this research used summated scales. A summated scale is a method of combining several
variables that measure the same concept in an attempt to increase the reliability of measurement. In
most instances, the separate variables are summed and then their total or average score is used in the
analysis. (Hair,2006).
Table-4.8. Standardized Solution of structural model
Items Score Criterion of fit Note (Hair,2006)
Sensory
Affective
Behavioral
Intellectual
Im1
Im2
Im3
Im4
Im5
Im6
Im7
Im8
Cs1
Cs2
Cs3
Cs4
Cs5
Cs6
0.67
0.76
0.75
0.77
0.65
0.61
0.74
0.85
0.42
0.73
0.79
0.69
0.74
0.89
0.65
0.86
0.63
0.71
0.4<x<1.00
Acceptable
Acceptable
Acceptable
Acceptable
Acceptable
Acceptable
Acceptable
Acceptable
Acceptable
Acceptable
Acceptable
Acceptable
Acceptable
Acceptable
Acceptable
Acceptable
Acceptable
Acceptable

Handbook on the Economic, Finance and Management Outlooks
174
Table-4.9. T-value of Structural Model
Relationship Score Criterion of fit Note
Brand experience – Customer Satisfaction.
Brand experience – brand image.
Brand image – customer satisfaction.
3.80
8.01
7.33
>2
Significant
Significant
Significant
Table-4.10. Relationship Score of Structural Model
Relationship Score Note
Brand experience – Customer Satisfaction.
Brand experience – brand image.
Brand image – customer satisfaction.
0.22
0.50
0.48
Positive Influence
Positive Influence
Positive Influence
Table-4.11. Goodness of Fit of Structural Model
Measurement Score Criterion of Fit Note (Kline, 1998)
Comparative fit index (CFI)
Normed fit index (NFI)
Non-normed fit index (NNFI)
Standardized root mean square
residual (SRMR)
Significance (P-value)
0.96
0.95
0.96
0.057
0.00
> 0.90
> 0.90
> 0.90
< 0.10
<0.05
Acceptable
Acceptable
Acceptable
Acceptable
Acceptable
The structural model had fullfiled the criteria of goodness of fit and had a significance (t-value greater
than 2). This indicated relationships among brand experience, brand image and customer
satisfaction’s model were confirmed that they consisted of four dimensions of brand experience, eight
items of brand image, and six items of customer satisfaction.
4.2 Hypothesis Testing In this part, the research discussed the influence of brand experience to customer satisfaction,
brand experience to brand image, and the influence of brand image to customer satisfaction. This
discussion was based on the hypothesis of this research that included three hypotheses:
H1 : Brand experience has positive influence on customer satisfaction.
H2: Brand experience has positive influence on brand image.
H3: Brand image has positive influence on customer satisfaction.
Brand experience significantly had positive influence on customer satisfaction (t-value=3.80;
y=0.22), supporting H1. Brand experience significantly had positive influence on brand image (t-
value=8.01; y=0.50), supporting H2. Meanwhile, brand image also significantly had positive influence
on customer satisfaction (t-value=7.33; y=0.48) supporting H3. Following this result, the entire
hypotheses and the model of this research were proven.
Figure-4.4. Relationships among brand experience, brand association, and customer satisfaction
(Standardized Solution)

Ida Yulianti; Wei Tung
175
5. Conclusions
The objectives of this study were to explore: (1) the relationships among brand experience,
brand image and customer satisfaction toward Facebook user, (2) a proposed tentative model and an
empirical test to examine the related hypothesis. Based on CFA analysis, brand experience had four
dimensions include sensory, affective, behavioral and intellectual. This proposed model was justified
by the criteria goodness of fit (GOF) such as CFI, NFI, NNFI and SRMR. Brand experience is
significantly and has positive influence on customer satisfaction. Brand experience was significant and
had positive influence on brand image. Meanwhile, brand image also was significant and had positive
influence on customer satisfaction. Therefore, there were significantly positive relationships among
brand experience, brand image and customer satisfation as the research model suggested. The findings
of this research provided a number of insights to marketing managers. Based on findings, managers
can enhance customer satisfaction by focusing on brand experience and brand iamge. Positive
customer experience and strong brand image can assist customers to choose company’s product or
services. To create positive brand experience, managers can focus on sensory, affective, behavioral
and intellectual elements of the products or services. Meanwhile, this research provides some
managerial implications for Facebook’s owner regarding the information about Facebook’ image in
the customer’s mind.
References
Aaker, D. 1996. Measuring brand equity across products and markets. California Management
Review. 38, 102-120.
Aaker, J and Maheswaran, D. 1997. The effect of cultural orientation on persuasion. Journal of
Consumer Research. 24, 315-328.
Ahmad, Z and Hashim, R. 2010. Customer’s brand equity and customer loyalty: a study on hotel’s
conference market. World Applied Sciences Journal. 10, 115-120.
Alexander, N and Colgate, M. 2005. Customers' responses to retail brand extensions. Journal of
Marketing Management. 21,393–419.
Anderson, Eugene, W and Mary WS. 1993. The Antecedents and Consequences of Customer
Satisfaction for Firms. Marketing Science. 12 (2), 125–43.
Anderson, EW and Mittal, V. 2000. Strengthening the satisfaction-profit chain. Journal of Service
Research. 3, 107-120.
Anderson, EW, Fornell, C and Lehmann, DR. 1994. Customer satisfaction, market share and
profitability: Findings from Sweden. Journal of Marketing. 56, 53-66.
Anderson, EW, Fornell, C and Rust, RT. 1997. Customer satisfaction, productivity and profitability:
Differences between goods and services. Marketing Science. 16, 129-145.
Arnould, Price, L and Zinkhan, GL. 2002. Consumers 2nd edition. McGraw-Hill. New York.
Barreiro, PL and Albandoz, JP. 2001. Population and sample: Sampling techniques. Management
mathematics for European Schools.
Bennett, R, Kennedy, JRM and Coote, LV. 2007. Involvement, satisfaction, and brand loyalty in a
small business services setting. Journal of Business Research. 60, 1253-1260.
Berry, L. 2000. Cultivating service brand equity. Journal Academic Marketing Science. 28, 128-137.
Boomsma, A. 2000. Reporting analyses of covariance structures. Structural Equation Modeling. 7,
461-483.
Brakus, JJ, Schmitt, BH and Zarantonello, L. 2009. Brand experience: what is it? how is it measured?
does it affect loyalty?. Journal of Marketing. 73, 52-68.
Brexendorf, TO, Muhlmeier, S, Tomczak, T and Eisend, M .2010. The impact of sales encounters on
brand loyalty. Journal of Business Research. 63, 1148-1155.
Che-Ha, N and Sharizal, H. 2007. Brand equity, customer satisfaction and loyalty: Malaysian banking
sector. International review of business papers. 3. 123-133.
Christopher M and Andre S. 2007. Understanding Customer Experience. Harvard Business Review.
Cliffe, SJ and Motion, J. 2005. Building contemporary brands: a sponsorship based strategy. Journal
of Business Research. 58, 1068-1077

Handbook on the Economic, Finance and Management Outlooks
176
Comscore, Inc. 2007. Comscore Report.
Cronin, Jr JJ and Taylor, SA. 1992. Measuring service quality: A reexamination and extension.
Journal of Marketing. 56, 55-68.
Deng, Z, Lu, Y, Wei, KW and Zhang, J. 2010. Understanding customer satisfaction and loyalty: An
empirical study of mobile instant message in China. International Journal of Information
Management. 30, 289-300.
Eva, M, Tereza, M, and Jose, P. 2009. Brand extension feedback: The role of Advertising. Journal of
Business Research. 62, 305-313.
Gilbert, GR, Veloutsou, C. 2004. A cross industry comparison of customer satisfaction, Journal of
Service Marketing. 20, 298-308.
Groot, IM, Antonides, G, Read, D and Raaij, WF. 2009. The effects of direct experience on consumer
product evaluation. Journal of Socio-Economics. 38, 509-518.
Hair, JF, Black, WC, Babin, BJ, Anderson, RE and Tatham, RL. 1998. Multivariate data analysis.
Prentice Hall. New Jersey.
Hair, JF, Black, WC, Babin, BJ, Anderson, RE, and Tatham, RL. 2006. Multivariate data analysis:
Sixth edition. Prentice Hall. New Jersey.
Hoch, S.J. 2002. Product experience is seductive. Journal of Consumer Research. 29, 448-454.
Holbrook, MB. 2000. The millenial consumer in the texts of our times: Experience and Entertainment.
Journal of Macromarketing. 20, 178-192.
Hui, MK, Bateson, JEG. 1991. Perceived control and the effects of crowding and consumer choice on
the service experience. Journal of Consumer Research. 18, 174-184.
Hussein, AS, Isharina, IK. 2009. The impact of service quality toward user loyalty: Facebook and
Friendster user perception. Asia Pasific Management Conference.
Jaccard, J, Wan, CK. 1996. Lisrel approaches to interaction effects in multiple regression. Sage
Publications. California.
Kapferer, JN. 2004. The new strategic brand management: Creating and sustaining brand equity long
term 3rd ed. Londres. Kogan.
Keller, K. 1993. Conceptualizing, measuring and managing customer based-brand equity. Journal of
Marketing. 57, 1-22.
Keller, K. 2003. Strategic brand management: Building, measuring and managing brand equity 2nd
edition. Prentice Hall. New Jersey.
Kerin, RA, Jain, A and Howard, DJ. 1992. Store shopping experience and consumer price-quality-
value perceptions. Journal of Retailing. 68, 376-397.
Kline, RB. 1998. Principles and practices of structural equation modeling. The Guilford Press. New
York.
Kline, RB. 2005. Principles and practice of structural equation modeling, second edition
(Methodology in the social science). The Guilford Press. New York.
Kotler,P and Keller, K. 2009. Marketing management 13th edition. Prentice Hall. New Jersey.
Likert, R. 1932. A technique for the measurement of attitudes. Archive of Psychology. 140, 5-55.
Low, GS and Lamb, CW. 2000. The measurement and dimensionality of brand associations. Journal
of Product and Brand Management. 9, 350-368.
Marsh, HW, Balla, JR and Hau, KT. 1996. An evaluation of incremental fit indexes: A clarification of
mathematical and empirical properties. In G. A. Marcoulides & R. E. Schumacker (Eds.),
Advanced structural equation modeling techniques. 315-353.
Martin, GS and Brown, T. 1990. The conceptualization and measurement of the brand impression
construct. American Marketing Association. 2, 431-438.
Martínez, E, Montaner, T and Pina, JM. 2009. Brand extension feedback: the Role of advertising.
Journal of Business Research. 62, 305-313.
Maruyama, GM. 1998. Basics of structural equation modeling. Thousand Oaks. Sage. California.
McDonald, RP and Ho, MHR. 2002. Principles and practice in reporting structural equation analyses.
Psychological Methods. 7, 64-82.
Mittal, Vikas and Wagner AK. 2001. Satisfaction, Repurchase Intent, and Repurchase Behavior:
Investigating the Moderating Effect of Customer Characteristics. Journal of Marketing
Research. 38, 131–42.
Nunnally, JC. 1978. Psychometric theory 2nd edition. McGraw-Hill. New York.

Ida Yulianti; Wei Tung
177
Oliver, RL. 1981. Measurement and evaluation of satisfaction processes in retail settings. Journal of
Retailing. 57, 25–48.
Oliver and Richard L. 1997. Satisfaction: A Behavioral Perspective on the Consumer. McGraw-Hill.
Boston.
Prahalad, CK and Ramaswamy, V. 2004. Co-creation experiences: The next practice in value creation.
Journal of Interactive Marketing. 18, 5-14.
Pempek, TA, Yermolayeva, YA and Calvert, S. 2009. College students' social networking experiences
on Facebook. Journal of Applied Developmental Psychology. 30, 227-238.
Salinas, EM and Perez, JMP. 2009. Modeling the brand extensions’ influence on brand image. Journal
of Business Research. 62, 50-60.
Spreng, RA, MacKenzie, SB and Olshavsky, RW. 1996. A reexamination of the determinants of
consumer satisfaction. Journal of Marketing. 60, 15-32.
Stern, B, Zinkhan, GM and Jaju, A. 2001. Construct definition, measurement issues, and theory
development. Marketing images. 1(2), 201–24.
Swaminathan V, Fox, RJ and Reddy SK. 2001. The impact of brand extension introduction on choice.
Journal of Marketing. 65, 1–15.
Swaminathan, V. 2003. Sequential Brand Extensions and Brand Choice Behavior. Journal of Business
Research. 56, 431-442.
Tjiptono, F. 2008. Strategi Pemasaran. ANDI. Indonesia.
Villarejo, AF and Sanchez, M. 2005. The impact of marketing communication and price promotion on
brand equity. Journal of Brand Management. 12, 431-445.
Weiss, AM, Anderson, E, and MacInnis, D. 1999. Reputation management as a motivation for sales
structure decisions. Journal of Marketing. 63, 74-89.
www.allbusiness.com (access at July, 26, 2011)
www.CheckFacebook.com (access at February, 2011)
www.ventureline.com (access at July, 26, 2011)
www.wikipedia.com (access at January,19,2011)