Brand and country-of-origin effect on consumers' decision to purchase luxury products
Upload
jiwajigwaliormpCategory
view
1download
0
Far East Research Centre www.fareastjournals.com
25
RELATIONSHIP BETWEEN COUNTRY OF ORIGIN, BRAND IMAGE
AND CUSTOMER PURCHASE INTENTIONS
Dr. S. S. Bhakar DirectorPrestige Institute of Management
Airport Road, Gwalior (M.P.)
Email: [email protected]
Shailja Bhakar Assistant Professor, Prestige Institute of Management
Airport Road, Gwalior (M.P.)
Email: [email protected]
Shilpa Bhakar Assistant Professor, School of Management Sciences
Apeejay Stya University, Sohna, Gurgaon (Haryana)
Email: [email protected]
ABSTRACT
Today the world has become a small village.Products manufactured in one country are being
sold in every country all over the world. Manufacturers are using all the tools to build a different
brand image of their brands in the new country. This paper therefore examines the effect of
country of origin and brand image on purchase intentions of customers.
The current study is based on the responses received from 150 respondents selected on the basis
of non-probability (Purposive) sampling technique. The results indicated that country of origin
negatively affects the purchase intention of a customer while buying a fridge and the effect
becomes significant when country of origin is evaluated along with brand image at the same
time.Also, it was found that brand image positively affects the purchase intentions of a customer
while buying a fridge.Therefore,themanufacturing companies should concentrate on building a
positive and strong brand image of their products in the minds of customers so that the country
of origin cannot affect the purchase intentions of a customer.
Keywords:Origin, Brand Image, Branding, Consumer Intentions, Purchase Intentions, Buying
Decision.
Paper Type: Research Paper
INTRODUCTION
Ghazali Maznah M. Said Othman, A. Zahiruddin Yahya and M. Sarif Ibrahim defined Country
of origin effect as any influence that the country of manufacture has on a consumer‟s positive or
negative perception of a product, Cateora and Graham(1999).With increasing availability of
foreign goods in most national markets, the country of origin cue has become more important as

Far East Journal of Psychology and Business Vol. 10 No. 2 Feb 2013
26
consumers often evaluate imported goods differently than they do competing domestic
products,(Bilkey and Nes, 1982).
The country of origin may create a “halo effect” whereby consumers‟ attention and evaluation of
other product dimensions are affected, Erickson et al.(1984), Han(1989).Buyers may simply use
the country of origin as one of the many attributes employed (Johansson et al., 1985) to engage
in product evaluation (Hong and Wyer, 1989).
Elliot, Cameron, and Acharya (1994) defined the country of origin (COO) as the country of
origin or the country of manufacturing for a specific product. Numerous studies have found that
consumers have biases in favor and against products made in certain countries. Liu, Murphy, Li,
and Liu (2007) found that the country of origin effect has a significant impact on consumers‟
attitudes and intentions to buy foreign products.
The effects of country-of-origin (COO) upon consumer perceptions, and purchase intentions
remain of interest to marketing researchers, Bloemer et al.(2009). The COO concept evolved into
a more complex notion as global production operations became increasingly diverse and new
market opportunities emerged in both developed and developing countries. Initially, the notion of
the COO was perceived as analogous to the "made-in" country, Dichter (1962),(Nebenzahl et
al.,1997).
In today‟s increasingly competitive business environment, more and more international
companies are willing to seek production in less developed countries. The large body of existing
research has recognized the importance of Country of Origin (COO) effects on consumers‟
product evaluations and purchasing decisions, Bilkey and Nes (1982), Al-Sulaiti and
Baker(1998).
FIGURE - 1: RELATIONSHIP BETWEEN BRAND AND COO AND ITS EFFECT ON
PERCEPTIONS & PURCHASE INTENTIONS
Source: Bruno Godey, Daniel Pederzoli, Gaetano Aiello, Raffaele Donvito, Klause Peter
Wiedmann (2010), Luxury Brand and Country of Origin effect: Results of an International
Study, Journal of Marketing Trends, Vol. 1, No. 1, pp. 67-75.
A Brand is adistinguishing name and/or symbol intended to identifythe goods or services of
either one seller or a group of sellers, and to differentiate those goods or services from those of

Far East Research Centre www.fareastjournals.com
27
competitors,Aaker(1991), Stanton(1994), and Kotler(1996).A brand thus signals to the customer
the source of the product, and protects both the customer and the producer from competitors who
would attempt to provide products that appear to be identical.Although brands have long had a
role to play in commerce, it was not until the twentieth century that branding and brand
association became so central to competitors. Infact, distinguishing characteristic of modern
marketing has been its focus upon the creation of differentiated brand associations to accentuate
the bases of differentiation. The idea has been to move beyond commodities to branded
productsto reduce the primary effect of price upon the purchase decision. Consumers associate
the value of the product with the brand. The brand can convey either a positive or a negative
message about the product to the consumer, KimandChung(1997).
Brand Image
How much is a brand worth? How does a brand represent the product? Kotler (2000) contends
that brand is a name, term, symbol, design or all the above, and is used to distinguish one‟s
products and services from competitors. For example, Nike adopts a check mark as its brand
image, which creates a positive effect indicating approval.
Keller (1993) defines brand image as an association or perception consumers make based on
their memory towards a product. Thus, brand image does not exist in the technology, features or
the actual product itself, but is something brought out by promotions, advertisements, or users.
Through brand image, consumers are able to recognize a product, evaluate the quality, lower
purchase risks, and obtain certain experience and satisfaction out of product differentiation.
When it comes to experiential product evaluation, a positive brand image may make up for an
inferior image of the origin country and raise the possibility of the product being selected Thakor
and Katsanis(1997).
According to Grewal, Krishnan, Baker, and Borin (1998), the better a brand image is, the more
recognition consumers give to its product quality. Consumers are usually limited in regards to
the amount of time and product knowledge they have to make an informed purchase decision
when facing similar products to choose from. As a result, brand image is often used as an
extrinsic cue to make a purchase decision, Richardson, Dick and Jain(1994).
Akaah and Korgaonkar (1988) concluded that consumers are more likely to purchase well-
known brand products with positive brand image as a way to lower purchase risks. This
argument is also supported by Rao and Monroe (1988) where they posited that a brand with a
more positive image does have the effect of lowering consumers‟ product perception risks and
increasing positive feedback from consumers. Therefore, consumers generally believe they can
make a satisfying purchase by choosing well-known brands and also lower any purchase risks by
doing so.
Purchase Intention
Prior to purchasing, consumerscollect product information based on personal experience and
external environment. When the amount of information reaches a certain level, consumers start
the assessment and evaluation process, and make a purchase decision after comparison and

Far East Journal of Psychology and Business Vol. 10 No. 2 Feb 2013
28
judgment.Therefore, purchase intention is often used to analyze consumer behavior in related
studies. The so-called purchase intention means a subjective inclination consumers have towards
a certain product, and has been proven to be a key factor in predicting consumer behavior,
Fishbein and Ajzen(1975).
The EKB model, developed by Engel, Kollat and Blackwell (1984), depicts the process used to
evaluate consumers‟ decision making. The model stresses that consumer behavior is a continuing
process, including recognition of a problem, information gathering, solution evaluation, and
decision making. The process is also affected by both internal and external factors like
information input, information process, general motives, environment, etc. Among these factors,
information gathering and environmental stimulation are two crucial influential factors in the
final decision making.
FIGURE - 2: THE EFFECT OF COUNTRY IMAGE ON PURCHASE INTENSION
Source: Dr. Piet Pouwels and Dr Koen Harber, Department of Marketing Management,
Summary „Brand Perception and Purchase Intension‟, in a B to B Context, The effect of Brand
Origin
According to Kotler (2000), consumer behavior occurs when consumers are stimulated by
external factors and come to a purchase decision based on their personal characteristics and
decision making process. These factors include choosing a product, brand, a retailer, timing, and
quantity. This means consumers‟ purchasing behavior is affected by their choice of product and
brand.
LITERATURE REVIEW
Social Pressure
CSR Program
Esteem Among Colleagues
Others
Purchase Intension
Subjective
Norms
Attitude towards the Brand
Beliefs about Brand Origin
Country of Brand Origin Image
Other (Friendliness) Service etc.
Business Conduct
Product Performance

Far East Research Centre www.fareastjournals.com
29
Fabris (1999), Fornari (1995)compared Pakistani consumers' perceptions regarding electronic
and electrical products made in Pakistan, the United States, Japan, South Korea, China and
Germany. Consumers in Pakistan were observed to hold distinctly different views of products
from different countries in terms of quality, value, image and promotion.Further, the
reinforcement of the brand‟s strategic dimension and of its impact on perceptions and purchasing
intentions additionally springs from the fact that the contemporary customer is less and less in
search of primary, tangible and objective, elements in products-services; rathercustomers seek
emotive elements (sometimes anchored to socio-cultural trends towards which customers feel a
sense of belonging) Fabris (1999), Fornari (1995).
In other words as a way of prompting consumers to purchase the firm‟s products in consequence
of the values and meanings summarized by the brand.The results of the study provide relative
competitive positions of manufacturers from other countries and domestic manufacturers in the
Pakistani market in terms of various marketing variables as perceived by the consumers'
themselves.
YiCai(1994) investigated the effect of foreign products' country of origin on consumers' buying
intentions. By using tangible products and providing different levels of information, this effect
was tested in the participants' decision making processes. The 'made-in' effect was found to be
significant in a multiple-attribute scenario. Also, the size of the country-of-origin effect was
examined through price manipulations. In addition, the difference between consumers' responses
to price changes in different products from a less-developed country was investigated through
elasticity computations. The durable goods from the country were found to be less own-price
elastic than was the non-durable goods from the same country.
Papadopoulos (1993) suggested that the degree of economic development of the producing
country does affect consumers‟ buying intentions when other information is also present.
Second, the country-of-origin effect does not totally prohibit consumers from considering
products from a country against which they have a bias. Decreases in the prices of products from
less-developed countries will induce the consumers to increase their willingness to buy these
products.
Heslop, Liefeld, and Wall (1987),found that pricing policies and well-known brand names could
not improve a negative country-of-origin effect. The fact that their study was done two decades
ago may be able to explain the inconsistency of the results with that of the studies carried out
recently. Today‟s global market is more integrated than that in 1980s.
Gaedeke(1973) found that there was no clear indication of the consumer‟s biasness or preference
for local over imported products, or vice-versa., since should the respondents have preference for
local over imported products, products from industrialized countries tended to be more favorably
evaluated than those from developing countries. Schooler (1971) discovered a positive
relationship between the degree of a country‟s level of development and the evaluation of its
products.
Bandyopadhyay and Syed (2000) showed that consumers were inclined to attribute higher
quality to products made in developed countries. The study also showed that the average

Far East Journal of Psychology and Business Vol. 10 No. 2 Feb 2013
30
consumer did not consider the country of origin aspect to be their priority in deciding to purchase
a product. Other product attributes take precedence, particularly its quality, technological
progress and price. Results indicated that country of origin effects are not as strong as might be
expected, and varied with age and migrant status of consumers. Consumer perceptions were used
to partition the countries analyzed into two distinct groups. Ex. Apparel from New Zealand,
Australia and United Kingdom was rated significantly higher on all product attributes than was
apparel from Asian countries.
Rahul Singh(1997) reported that people seem clearly more interested in brands, and in the
projection of the nationality of these brands, than in COO. Therefore, we will have to develop a
causal model for evaluating the respective weight of the brand and COO. Some interesting
results emerge from our research, especially concerning the possibility to identify potential
country groups based on the analysis variables. This would be worth confirming by a cluster
analysis from our sample. The respondents seem to have fully grasped the globalization of
markets and especially of the value chain, from conception and design to the manufacture of a
product. Some interesting cross-cultural differences among respondents emerge for this analysis
too.
Mourali(2005)found that consumers rely more on the COO cue when the product origin facets
are perceived as congruent. Higher perceived product origin congruency increases the perceived
reliability of the COO image held by consumers. As a consequence this image is used more
when evaluating products and considering a purchase. In other words, when consumers consider
a product from a higher image product-origin, the positive relationship between COO image and
product evaluation is strengthened as the consumer perceives that the product origins are
congruent.
Ahmed & d'Astous(2004)founded that consumers utilize COO image more when making product
evaluations if they perceive that the product origins are more congruent than if they perceive that
the product origins are less congruent. In addition to augmenting our knowledge of the
conditions under which COO image is more or less salient, our study is an extension of research
that examined the role of the various facets of COO, Ahmed & d'Astous(2004), Chao(2001),
Kleppe, Iversen, & Stensaker (2002), Laroche, Papadopoulos, Heslop, & Moural, (2005), Li et
al.(2000).
OBJECTIVES OOF THE STUDY
1. To develop and standardized a measure for Country Of Origin, Brand Image, and Customer
Purchase Intension
2. To develop a relationship between country of origin, brand image and customer purchase
intention.
3. To open the new vistas for further research.
RESEARCH METHODOLOGY
The Study
The study was causal in nature with survey method being used for data collection.

Far East Research Centre www.fareastjournals.com
31
Sampling Design
Population
The population included customer‟s firm Gwalior region
Sampling frame: Since the data was collected through personal contact the sampling frame
included customers who were present at their place of residence at Gwalior during the data
collection phase of the study
Sample size
Sample size was 150 respondents.
Sample Elements
Individual respondentswere the sample elements.
Sampling Techniques
Non-probability (Purposive) sampling technique was used to select the sample elements as the
complete list of consumers of fridges was not available from any source.
Tools for data collection
Self designed questionnaireswere used to evaluatecountry of origin, brand image and customer
purchase intention. Data was collected on a 7 - point Likert type scale, where 1 indicated
minimum agreement and 7 maximum agreement with the statements.
Tools for data analysis
Internal consistency reliability of all the three measures was established through the computation
ofCronbach‟salpha reliability coefficient using PASW 18 software. Factor analysis was applied
to find out the underlying factors of the all the measures. Multiple Regressions was applied to
evaluate the effect of country of origin and brand image on customers‟ purchase intention. Linear
Regression was applied to find out the individual effect of country of origin and brand image on
customer purchase intention. One way ANOVA was applied to evaluate the effect of brand name
on all the three measures used in the study.
HYPOTHESIS
Null hypothesis H0 (1): There is no difference between the country of origin image of all the
three brands
Null hypothesis H0 (2): There is no difference between the brand image of all the three brands
Null hypothesis H0 (3): There is no difference between the purchase intentions of customers
towards all the three brands

Far East Journal of Psychology and Business Vol. 10 No. 2 Feb 2013
32
Null hypothesis H0 (4): There is no effect of country of origin and brand image on purchase
intention
Null hypothesis H0 (5): There is no effect of country of origin on purchase intention
Null hypothesis H0 (6): There is no effect of brand image on purchase intention
RESULTS AND DISCUSSION
Country of OriginQuestionnaire Reliability
Reliability test was carried out on the data collected using country of origin questionnaire
onPASW 18 software and the Cronbach‟s Alpha reliability coefficient was found to be 0.886.
TABLE-1: CRONBACH’S ALPHA RELIABILITY TEST
Reliability Statistics
Cronbach's
Alpha
Cronbach's Alpha Based on Standardized
Items
N of Items
.812 .886 11
Reliability coefficient values those are greater than 0.7 indicate high internal consistency
reliability for the measure. As displayed in the table-1 above the Cronbach‟s alpha coefficient
value for the country of origin measure is 0.886 which is greater than 0.7. Therefore, the country
of origin measure is considered to have high internal consistency reliability.
TABLE - 2: KAISER- MEYER-OLKIN MEASURE OF SAMPLING ADEQUACY AND
BARTLETT’S TEST OF SPHERICITY
KMO and Bartlett's Test
Kaiser-Meyer-Olkin Measure of Sampling Adequacy. .869
Bartlett's Test of Sphericity Approx. Chi-Square 804.784
Df 55
Sig. .000
Kaiser-Meyer-Olkin (KMO) measure of Sampling Adequacy
The Kaiser-Meyer-Olkin (KMO) measure of sampling adequacy is an index used to examine the
appropriateness of factor analysis. High values (between 0.5 and 1.0) indicate factor analysis is
appropriate. Values below 0.5 imply that factor analysis may not be appropriate. The Kaiser -
Meyer - Olkin Measure of Sampling Adequacy value for the country of origin measure was
0.869 indicating that the sample was adequate to consider the data suitable for factor analysis.
Bartlett's test of Sphericity
Bartlett's test of sphericity is a test statistic used to examine the hypothesis that the variables are
uncorrelated in the population. In other words, the population correlation matrix is an identity
matrix; each variable correlates perfectly with itself (r = 1) but has no correlation with the other

Far East Research Centre www.fareastjournals.com
33
variables (r = 0). The Bartlett‟s Test of Sphericity was tested through Chi-Square value having a
value of 804.784, which is significant at 0% level of significance. Therefore, the above
hypothesis is rejected, indicating that the data collected using country of origin measure was
suitable for factor analysis.
Factor Analysis
Principle component analysis (PCA) with varimax rotation and Kaiser Normalization was
applied to identify the underlying factors of the country of origin measure. The principle
component analysis converged on two factors after 5 iterations. The details about the factors, the
factor name, variable convergence and their Eigen valuesaredisplayed in table-3 below.
TABLE - 3: FACTOR ANALYSIS APPLIED ON COUNTRY OF ORIGIN MEASURE
SNo Factor Name Eigen
Value
% of
variance
Items Item
Loading
1 Country of
origin
Importance
5.163 46.939 2It is important to look for a country of
origin information when deciding which
product to buy
1 When buying expensive items such
Fridge, I always seek to find out what
country the product was made in.
10 To purchase a product that is acceptable
to my family and my friends, I look for the
product‟s country of origin
7 When I am buying a new product, the
country of origin is the first piece of
information that I consider
11 I look for country of origin information
to choose the best product available in a
product class
4 If I have a little experience with a product,
I search for country of origin information
about the product to help me make a more
informed decision
9 I find out a product‟s country of origin to
determine the quality of a product
6 When purchasing a product, I believe
country of origin will determine the
technological sophistication of the product
5 I refuse to purchase a product without
knowing its country of origin
3 To make sure that I buy the highest
quality product or brand, I look to see what
.894
.826
.742
.735
.720
.688
.686
.614
.593
.573
Far East Journal of Psychology and Business Vol. 10 No. 2 Feb 2013
34
country the product was made in
2 COO
Unimportant
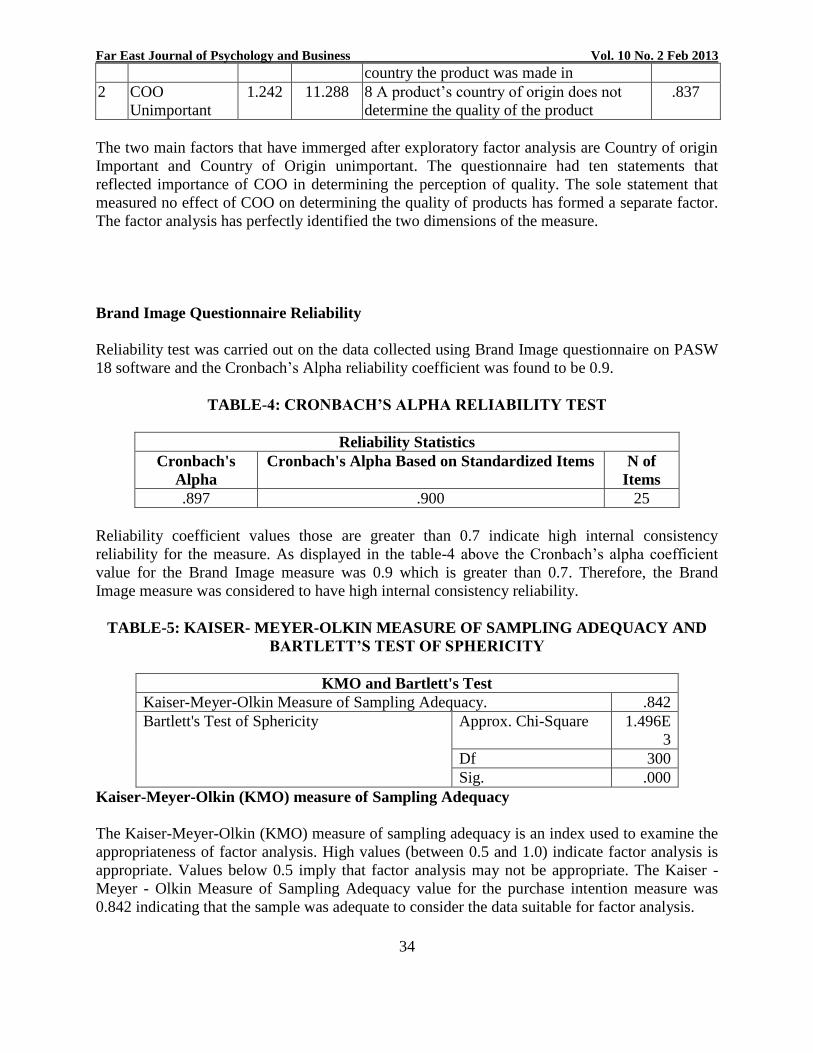
1.242 11.288 8 A product‟s country of origin does not
determine the quality of the product
.837
The two main factors that have immerged after exploratory factor analysis are Country of origin
Important and Country of Origin unimportant. The questionnaire had ten statements that
reflected importance of COO in determining the perception of quality. The sole statement that
measured no effect of COO on determining the quality of products has formed a separate factor.
The factor analysis has perfectly identified the two dimensions of the measure.
Brand Image Questionnaire Reliability
Reliability test was carried out on the data collected using Brand Image questionnaire on PASW
18 software and the Cronbach‟s Alpha reliability coefficient was found to be 0.9.
TABLE-4: CRONBACH’S ALPHA RELIABILITY TEST
Reliability Statistics
Cronbach's
Alpha
Cronbach's Alpha Based on Standardized Items N of
Items
.897 .900 25
Reliability coefficient values those are greater than 0.7 indicate high internal consistency
reliability for the measure. As displayed in the table-4 above the Cronbach‟s alpha coefficient
value for the Brand Image measure was 0.9 which is greater than 0.7. Therefore, the Brand
Image measure was considered to have high internal consistency reliability.
TABLE-5: KAISER- MEYER-OLKIN MEASURE OF SAMPLING ADEQUACY AND
BARTLETT’S TEST OF SPHERICITY
KMO and Bartlett's Test
Kaiser-Meyer-Olkin Measure of Sampling Adequacy. .842
Bartlett's Test of Sphericity Approx. Chi-Square 1.496E
3
Df 300
Sig. .000
Kaiser-Meyer-Olkin (KMO) measure of Sampling Adequacy
The Kaiser-Meyer-Olkin (KMO) measure of sampling adequacy is an index used to examine the
appropriateness of factor analysis. High values (between 0.5 and 1.0) indicate factor analysis is
appropriate. Values below 0.5 imply that factor analysis may not be appropriate. The Kaiser -
Meyer - Olkin Measure of Sampling Adequacy value for the purchase intention measure was
0.842 indicating that the sample was adequate to consider the data suitable for factor analysis.

Far East Research Centre www.fareastjournals.com
35
Bartlett's test of Sphericity
Bartlett's test of sphericity is a test statistic used to examine the hypothesis that the variables are
uncorrelated in the population. In other words, the population correlation matrix is an identity
matrix; each variable correlates perfectly with itself (r = 1) but has no correlation with the other
variables (r = 0). The Bartlett‟s Test of Sphericity was tested through Chi-Square value having a
value of 1.496E3, which is significant at 0% level of significance. Therefore, the above
hypothesis is rejected, indicating that the data was suitable for factor analysis.
Factor Analysis
Exploratory factor analysis was carried out using Principle Component Analysis with Varimax
Rotation and Kaiser Normalization to identify underlying factors of Brand Image measure.
Principle Component Analysis converged on 6 factors after 11 iterations. The details about the
factors, the factor name, variable number, variable convergence and their Eigen value is given in
the table-6 below.
TABLE - 6: EXPLORATORY FACTOR ANALYSIS APPLIED ON BRAND IMAGE
MEASURE
S.No Factor Name Eigen Value % of variance Items Item Loading
1 Conscientious 3.231 12.925 3 Friendly
1Honest
2Wholesome
4Young
6Up-to-date
.800
.763
.714
.714
.490
2 Professional 2.985 11.939 19Savvy
20Innovative
22Mature
18Perfectionist
21Sophisticated
.721
.671
.666
.558
.450
3 Victorious 2.772 11.087 9Technical
10Successful
8Intelligent
7Reliable
.841
.637
.610
.517
4 Sauvé 2.674 10.697 12Upper Class
5Unique
11Leader
13Good Looking
14Feminine
.721
.629
.627
.479
.463
5 Collective 1.789 7.156 25Social
23Authentic
24Competitive
.847
.561
.547
6 Manly 1.765 7.059 15Masculine
16Tough
17Persistent
.700
.692
.483

Far East Journal of Psychology and Business Vol. 10 No. 2 Feb 2013
36
Customer Buying Intentions Questionnaire Reliability
Reliability test was carried out on the data collected using Customer Buying Intentions
questionnaire on PASW 18 software and the Cronbach Alpha reliability coefficient was found to
be 0.909.
TABLE-7: CRONBACH’S ALPHA RELIABILITY TEST APPLIED ON CUSTOMERS’
BUYING INTENTIONS
Reliability Statistics
Cronbach's
Alpha
Cronbach's Alpha Based on Standardized
Items
N of
Items
.909 .909 10
Reliability coefficient values those are greater than 0.7 indicate high internal consistency
reliability for the measure. As displayed in the table-7 above the Cronbach‟s alpha coefficient
value for the Customers‟ Purchase Intentions measure was 0.909 which is greater than 0.7.
Therefore, the Customers‟ Purchase Intentions measure was considered to have high internal
consistency reliability.
TABLE-8: KAISER- MEYER-OLKIN MEASURE OF SAMPLING ADEQUACY AND
BARTLETT’S TEST OF SPHERICITY
KMO and Bartlett's Test
Kaiser-Meyer-Olkin Measure of Sampling Adequacy. .906
Bartlett's Test of Sphericity Approx. Chi-Square 783.113
Df 45
Sig. .000
Kaiser-Meyer-Olkin (KMO) measure of Sampling Adequacy
The Kaiser-Meyer-Olkin (KMO) measure of sampling adequacy is an index used to examine the
appropriateness of factor analysis. High values (between 0.5 and 1.0) indicate factor analysis is
appropriate. Values below 0.5 imply that factor analysis may not be appropriate. The Kaiser -
Meyer - Olkin Measure of Sampling Adequacy value for the purchase intention measure was
0.906 indicating that the sample was adequate to consider the data suitable for factor analysis.
Bartlett's test of Sphericity
Bartlett's test of sphericity is a test statistic used to examine the hypothesis that the variables are
uncorrelated in the population. In other words, the population correlation matrix is an identity
matrix; each variable correlates perfectly with itself (r = 1) but has no correlation with the other
variables (r = 0). The Bartlett‟s Test of Sphericity was tested through Chi-Square value having a
value of 783.113, which is significant at 0% level of significance. Therefore, the above
hypothesis is rejected, indicating that the data was suitable for factor analysis.

Far East Research Centre www.fareastjournals.com
37
Factor Analysis
Principle component factor analysis with varimax rotation and Kaiser Normalization was
applied. The factor analysis converged into one factor therefore it can be said that all the
questions in the questionnaire were representing customer buying intentions only
One-Way ANOVA between Country of Origin and Brand Names
Null hypothesis H0 (1):There is no significant difference between the country of origin image of
all the three brands
TABLE - 8: LEVENE’S TEST APPLIED ON COUNTRY OF ORIGIN DATA
Test of Homogeneity of Variances
COO
Levene Statistic df1 df2 Sig.
4.957 2 147 .008
TABLE - 9: ONE WAY ANOVA APPLIED BETWEEN THE DATA OF COUNTRY OF
ORIGIN FOR THE THREE BRANDS UNDER STUDY
ANOVA
COO
Sum of Squares df Mean
Square
F Sig.
Between
Groups
4598.173 2 2299.087 8.709 .000
Within Groups 38806.900 147 263.993
Total 43405.073 149
One way ANOVA test was applied to find out the effect of country of origin image on the three
brands of fridge. From the ANOVA table it can be seen that the value of F is 8.709 significant at
0% level of significance which indicates a significant difference between the country of origin
image of all the three brands of fridge. Therefore null hypothesis was rejected, indicating that the
image of the country of origin for all the three brands is different.
TABLE-10: POST-HOC TEST RESULTS APPLIED ON COO DATA OF THE THREE
BRANDS UNDER STUDY
Multiple Comparisons
COO
Tukey HSD
(I)
BrandName
(J)
BrandName
Mean Difference (I-
J)
Std.
Error Sig.
95% Confidence Interval
Lower
Bound
Upper
Bound
1 2 -6.98000 3.24957 .084 -14.6740 .7140
Far East Journal of Psychology and Business Vol. 10 No. 2 Feb 2013
38
3 6.58000 3.24957 .110 -1.1140 14.2740
2 1 6.98000 3.24957 .084 -.7140 14.6740
3 13.56000* 3.24957 .000 5.8660 21.2540
3 1 -6.58000 3.24957 .110 -14.2740 1.1140
2 -13.56000* 3.24957 .000 -21.2540 -5.8660
*. The mean difference is significant at the 0.05 level.
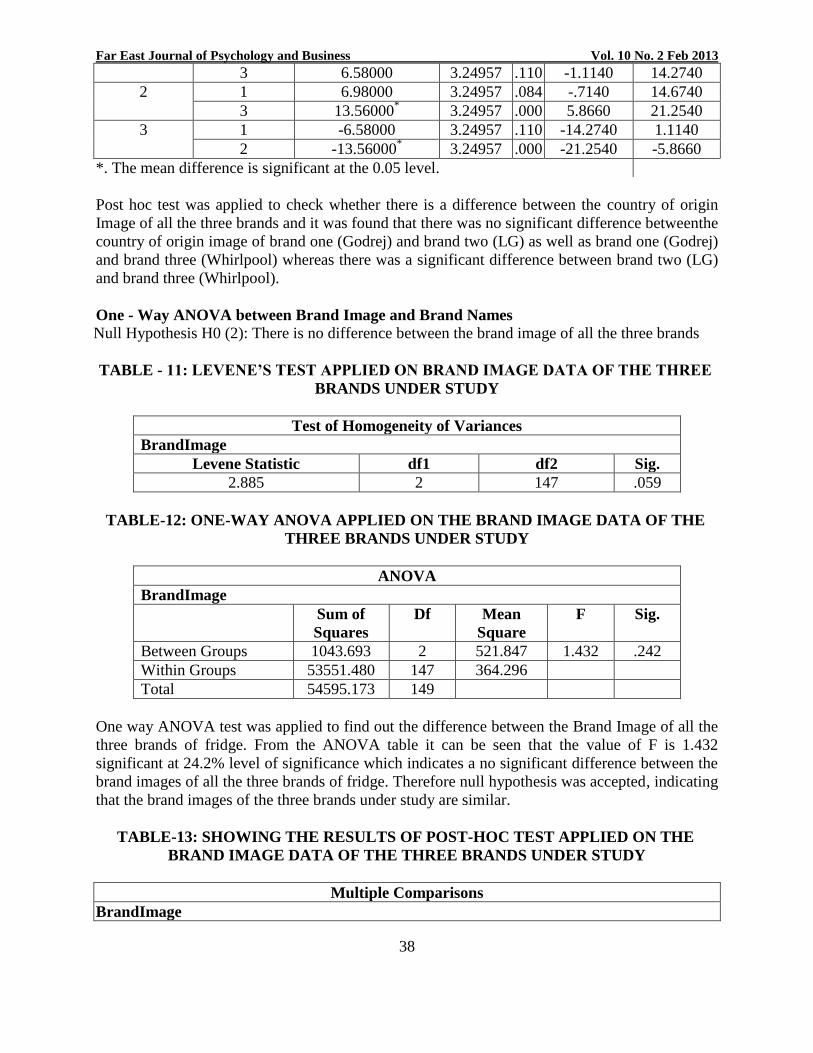
Post hoc test was applied to check whether there is a difference between the country of origin
Image of all the three brands and it was found that there was no significant difference betweenthe
country of origin image of brand one (Godrej) and brand two (LG) as well as brand one (Godrej)
and brand three (Whirlpool) whereas there was a significant difference between brand two (LG)
and brand three (Whirlpool).
One - Way ANOVA between Brand Image and Brand Names
Null Hypothesis H0 (2): There is no difference between the brand image of all the three brands
TABLE - 11: LEVENE’S TEST APPLIED ON BRAND IMAGE DATA OF THE THREE
BRANDS UNDER STUDY
Test of Homogeneity of Variances
BrandImage
Levene Statistic df1 df2 Sig.
2.885 2 147 .059
TABLE-12: ONE-WAY ANOVA APPLIED ON THE BRAND IMAGE DATA OF THE
THREE BRANDS UNDER STUDY
ANOVA
BrandImage
Sum of
Squares
Df Mean
Square
F Sig.
Between Groups 1043.693 2 521.847 1.432 .242
Within Groups 53551.480 147 364.296
Total 54595.173 149
One way ANOVA test was applied to find out the difference between the Brand Image of all the
three brands of fridge. From the ANOVA table it can be seen that the value of F is 1.432
significant at 24.2% level of significance which indicates a no significant difference between the
brand images of all the three brands of fridge. Therefore null hypothesis was accepted, indicating
that the brand images of the three brands under study are similar.
TABLE-13: SHOWING THE RESULTS OF POST-HOC TEST APPLIED ON THE
BRAND IMAGE DATA OF THE THREE BRANDS UNDER STUDY
Multiple Comparisons
BrandImage

Far East Research Centre www.fareastjournals.com
39
Tukey HSD
(I)
BrandName
(J)
BrandName
Mean Difference (I-
J)
Std.
Error Sig.
95% Confidence Interval
Lower
Bound
Upper
Bound
1 2 3.12000 3.81731 .693 -5.9182 12.1582
3 -3.34000 3.81731 .657 -12.3782 5.6982
2 1 -3.12000 3.81731 .693 -12.1582 5.9182
3 -6.46000 3.81731 .212 -15.4982 2.5782
3 1 3.34000 3.81731 .657 -5.6982 12.3782
2 6.46000 3.81731 .212 -2.5782 15.4982
Post hoc test was applied to check whether there is a difference between the brand images of
different brands taking two at a time and it was found that there was no significant difference
between brand one (Godrej) and brand two (LG), brand one (Godrej) and brand three
(Whirlpool) as well as brand two (LG) and brand three (Whirlpool).
One way ANOVA between Purchase Intention for the three brands under study
Null hypothesis H0 (3): There is no difference between the purchase intentions of customers
towards all the three brands
TABLE - 14: LEVENE’S TEST APPLIED ON CUSTOMERS PURCHASE INTENTIONS
DATA FOR THE THREE BRANDS UNDER STUDY
Test of Homogeneity of Variances
Purchase Intention
Levene Statistic df1 df2 Sig.
.305 2 147 .738
TABLE-15: ONE-WAY ANOVA APPLIED ON THE CUSTOMERS PURCHASE
INTENTIONS DATA FOR THE THREE BRANDS UNDER STUDY
ANOVA
Purchase Intention
Sum of Squares df Mean Square F Sig.
Between Groups 6934.493 2 3467.247 35.888 .000
Within Groups 14202.280 147 96.614
Total 21136.773 149
One way ANOVA test was applied to find out differences between the purchase intentions of
customers towards all the three brands of fridge. From the ANOVA table it can be seen that the
value of F is 35.888 which is significant at 0% level of significance. indicating significant
difference between the purchase intentions of customers towards the three brands of fridge.

Far East Journal of Psychology and Business Vol. 10 No. 2 Feb 2013
40
Therefore null hypothesis was rejected, indicating that the purchase intension of customers for
the three brands is different.
Table-16: POST-HOC TEST APPLIED ON THE CUSTOMERS PURCHASE
INTENTION DATA ON ALL THE THREE BRANDS UNDER STUDY
Multiple Comparisons
Purchase Intention
Tukey HSD
(I)
BrandName
(J)
BrandName
Mean Difference (I-
J) Std. Error Sig.
95% Confidence Interval
Lower
Bound
Upper
Bound
1 2 -1.56000 1.96585 .708 -6.2145 3.0945
3 -15.14000* 1.96585 .000 -19.7945 -10.4855
2 1 1.56000 1.96585 .708 -3.0945 6.2145
3 -13.58000* 1.96585 .000 -18.2345 -8.9255
3 1 15.14000* 1.96585 .000 10.4855 19.7945
2 13.58000* 1.96585 .000 8.9255 18.2345
*. The mean difference is significant at the 0.05 level.
Post hoc test was applied to check whether there is a difference between the purchase intentions
of customers taking two brands at a time. It was found that the difference between brand one
(Godrej) and brand two (LG) was insignificant whereas a significant difference was found in the
purchase intentions of brand one (Godrej) and brand three (Whirlpool) as well as brand two (LG)
and brand three (Whirlpool).
Multiple Regressions
Multiple regressions were carried out between Country of Origin, Brand Image and Purchase
Intention taking Country of Origin and Brand Image as independent variables and Purchase
Intention as dependent variable. The result of multiple regressionswas as indicated below:
Null hypothesis H0 (4): There is no significant effect of country of origin and brand image on
purchase intention
TABLE – 17: MULTIPLE REGRESSIONS APPLIED BETWEEN BRAND IMAGE AND
COO AS INDEPENDENT VARIABLES AND PURCHASE INTENSION AS
DEPENDENT VARIABLE
Model Summary
Model R R Square Adjusted R Square Std. Error of the Estimate Durbin-Watson
1 .486a .236 .226 10.47881 1.336
a. Predictors: (Constant), Brand Image, COO
b. Dependent Variable: Purchase Intention

Far East Research Centre www.fareastjournals.com
41
TABLE – 18: MULTIPLE REGRESSIONS APPLIED BETWEEN BRAND IMAGE AND
COO AS INDEPENDENT VARIABLES AND PURCHASE INTENSION AS
DEPENDENT VARIABLE
ANOVA
Model Sum of Squares df Mean Square F Sig.
1 Regression 4995.370 2 2497.685 22.746 .000a
Residual 16141.403 147 109.805
Total 21136.773 149
a. Predictors: (Constant), Brand Image, COO
b. Dependent Variable: Purchase Intention
TABLE – 19: MULTIPLE REGRESSIONS APPLIED BETWEEN BRAND IMAGE AND
COO AS INDEPENDENT VARIABLES AND PURCHASE INTENSION AS
DEPENDENT VARIABLE
Coefficients
Model Unstandardized
Coefficients
Standardized
Coefficients
T Sig. Collinearity
Statistics
B Std. Error Beta Tolerance VIF
1 (Constant) 20.408 3.405 5.994 .000
COO -.152 .051 -.218 -
2.978
.003 .966 1.035
BrandImage .297 .046 .477 6.498 .000 .966 1.035
a. Dependent Variable: Purchase Intention
Y= a + bx + cx
Y= 20.408 +(-.152)x + .297x
Where,
X= Country of Origin and Brand Image (independent variable)
Y= Purchase Intention (dependent variable)
The model having Country of Origin and Brand Image as independent variable and Purchase
Intention as dependent variable has good fit as indicated by F-test value which is 22.746
significant at .000 level of significance. The result of regression table from the coefficient table
indicates that Country of Origin has a negative cause and effect relationship with purchase
intentions of customers having beta value of -.218 tested through t-test value of -2.978 which is
significant at .003 level of significance indicating a significant effect of country of origin on
purchase intention, whereas Brand Image has significant cause and effect relationship with
Purchase Intention having beta values of -.218 and .477 tested through t-test having t-value of -
2.978 and 6.498 which is significant at .003 and .000 level of significance
The model summary table indicates that Country of Origin and Brand Image in combination has
22.6% effect on Purchase Intention since the adjusted r square value of table is .226.Therefore
null hypothesis was rejected.

Far East Journal of Psychology and Business Vol. 10 No. 2 Feb 2013
42
Linear Regression Country of Origin and Customer Purchase Intentions
Where Country of Origin is taken as independent variable and Customer purchase intentions is
taken as dependent variable
Null hypothesis H0 (5): There is no significant effect of country of origin on purchase intention
Table–20: SIMPLE REGRESSION APPLIED BETWEEN COO USED AS
INDEPENDENT VARIABLE AND PURCHASE INTENTION AS DEPENDENT
VARIABLE
Model Summary
Model R R
Square
Adjusted R
Square
Std. Error of the
Estimate
Durbin-
Watson
1 .130a .017 .010 11.84864 1.010
a. Predictors: (Constant), COO
b. Dependent Variable: Purchase Intention
Table – 21: SIMPLE REGRESSION APPLIED BETWEEN COO USED AS
INDEPENDENT VARIABLE AND PURCHASE INTENTION AS DEPENDENT
VARIABLE
Table – 22: SIMPLE REGRESSION APPLIED BETWEEN COO USED AS
INDEPENDENT VARIABLE AND PURCHASE INTENTION AS DEPENDENT
VARIABLE
Coefficients
Model Unstandardized
Coefficients
Standardized
Coefficients
t Sig. Collinearity
Statistics
B Std. Error Beta Tolerance VIF
1 (Constant) 36.966 2.554 14.476 .000
COO -.091 .057 -.130 -1.599 .112 1.000 1.000
a. Dependent Variable: Purchase Intention
Y= a+ bx
Y= 13.544 + .889x
Where,
ANOVA
Model Sum of Squares df Mean
Square
F Sig.
1 Regression 359.007 1 359.007 2.557 .112a
Residual 20777.767 148 140.390
Total 21136.773 149
a. Predictors: (Constant), COO
b. Dependent Variable: Purchase Intention

Far East Research Centre www.fareastjournals.com
43
X= Country of Origin (independent variable) and Y= Purchase Intention (dependent variable)
The model having country of origin as independent variable and purchase intention as dependent
variable has bad fit as indicated by F-test value which is 2.557significant at .112 level of
significance. The result of regression table from the coefficient table indicates that country of
origindoes not have a cause and effect relationship with purchase intention having beta value of -
.130 tested through t-test having t-value of -1.599 which is significant at .112 level of
significance.
The model summary table indicates that country of origin has only 1.7% effect on purchase
intention since the r square value of table is .017 which means country of origin does not have a
significant impact on purchase intentions. Therefore null hypothesis was accepted.
Linear regression between Brand Image and Purchase Intentions
Brand image is taken as independent variable and Purchase Intentions is taken as dependent
variable
Null hypothesis H0 (6): There is no significant effect of brand image on purchase intention
Table – 23:SIMPLE REGRESSION APPLIED BETWEEN BRAND IMAGE AS
INDEPENDENT VARIABLE AND PURCHASE INTENTIONS AS DEPENDENT
VARIABLE
Model Summary
Model R R
Square
Adjusted R
Square
Std. Error of the
Estimate
Durbin-
Watson
1 .436a .190 .185 10.75379 1.278
a. Predictors: (Constant), BrandImage
b. Dependent Variable: PurchaseIntention
Table – 24:SIMPLE REGRESSION APPLIED BETWEEN BRAND IMAGE AS
INDEPENDENT VARIABLE AND PURCHASE INTENTIONS AS DEPENDENT
VARIABLE
Table – 25:SIMPLE REGRESSION APPLIED BETWEEN BRAND IMAGE AS
INDEPENDENT VARIABLE AND PURCHASE INTENTIONS AS DEPENDENT
VARIABLE
ANOVA
Model Sum of Squares df Mean Square F Sig.
1 Regression 4021.465 1 4021.465 34.775 .000a
Residual 17115.308 148 115.644
Total 21136.773 149
a. Predictors: (Constant), Brand Image
b. Dependent Variable: Purchase Intention

Far East Journal of Psychology and Business Vol. 10 No. 2 Feb 2013
44
Coefficients
Model Unstandardized
Coefficients
Standardized
Coefficients
t Sig. Collinearity
Statistics
B Std. Error Beta Tolerance VIF
1 (Constant) 15.694 3.094 5.073 .000
BrandImage .271 .046 .436 5.897 .000 1.000 1.000
a. Dependent Variable: Purchase Intention
Y= a+ bx
Y= 13.544 + .889x
Where,
X= Brand Image (independent variable)
Y= Purchase Intention (dependent variable)
The model having brand Image as independent variable and Purchase Intention as dependent
variable has good fit as indicated by F-test value which is 34.775 significant at .000 level of
significance. The result of regression table from the coefficient table indicates that brand image
has very high cause and effect relationship with purchase intention having beta value of .436
tested through t-test having t-value of 5.897 which is significant at .000 level of significance.
The model summary table indicates that brand image has 19% effect on purchase intention since
the r square value of table is .19. Therefore null hypothesis was rejected.
CONCLUSION
Questionnaires on Country of Origin, Brand Image and Purchase Intention were developed and
standardized using item to total correlation, reliability and factor analysis. One way ANOVA
was applied to check difference between country of origin image, brand image and purchase
intentions of customers towards all the three brands of fridge i.e. Godrej, LG and Whirlpool.
The results of one way ANOVA indicated a significant difference between country of origin
image and purchase intentions of customers of all the threefridge brands where as no significant
difference was found between the brand images of all the three fridge brands. Multiple
regression was applied to check theeffect of country of origin and brand image on purchase
intention and it was found that brand image has a significant effect on purchase intentions and
country of origin has a negative effect on purchase intention and which is significant when
country of origin is taken along with brand image.
Linear regression was applied to find out individual effect of country of origin and brand image
on purchase intention and it was found that country of origin has a negative cause and effect
relationship with purchase intention and the effect was insignificant and brand image has a
significant and positive cause and effect relationship with purchase intention.
Finally, from the results we can conclude that country of origin can negatively affect the
purchase intention of a customer while buying a fridge and the effect becomes significant when

Far East Research Centre www.fareastjournals.com
45
country of origin is evaluated along with brand image at the same time.Alsoit was found that
brand image positively affects the purchase intentions of a customer while buying a fridge
therefore all thecompanies should concentrate on building a positive and strong brand image of
their brands in the minds of customers so that the country of origin cannot affect the purchase
intentions of a customer while buying a fridge.
REFERENCES
Aaker DA (1991),Managing Brand Equity: Capitalizing on the Value of a Brand Nam,. New
York: Free Press, 1991.
Acharya, C.; R. Cameron and G. Elliot (1994),An Empirical Investigation of Consumer
Ethnocentrism in Australia, Proceedings of ASBBS, Vol. 17, No. 1.
Ahmed, S.A. and A. d‟Astous (2004), Perceptions of Countries as Producers of Consumer
Goods: A T-Shirt Study in China,Journal of Fashion Marketing and Management, Vol. 8,
No. 2,187-200.
Akaah, I. P. and Korgaonkar, P. K. (1988), A Conjoint Investigation of the Relative
Importance of RiskRelievers in Direct Marketing, Journal of Advertising Research 28 (4),
38-44.
Al-Sulaiti, K and Bakar, M. J. (1998), “Country of Origin effects: a literature
review”,Marketing Intelligence and Planning, Vol. 16 No. 13.
BIkely, W.J. and Nes, E. (1982), Country of Origin Effects on Product Evaluations, Journal
of International Business Studies, Vol. 1 No. 3, pp 131-141.
Bloemer J, Brijs K, Kasper H. (2009), The COO-ELM Model: A Theoretical Framework for
the CognitiveProcesses Underlying Country Of Origin-Effects,European Journal of
Marketing, 43(1–2):62–89.
Cateora, P.R. and Graham, J. L, (1999), International Marketing, 10th,
Edition, Irwin:
McGraw-Hill.
Chao, Paul (2001), “The Moderating Effects of Country of Assembly, Country of Parts, and
the Country of Design on Hybrid Product Evaluations”,Journal of Advertising 30(4): 67-82.
Dichter E. (1962), The World Customer,Harvard Business Review, 40, 1962, p.113–22
[July–August].
Engel, J. F., Kollat, D. T. and Blackwell, R. D. (1984),Consumer Behavior, 3rd ed., New
Jersey: Prentice-Hall.
Erickson GM, Johansson JK, Chao P. (1984), Image Variables in Multi-AttributeProduct
Evaluations: Country-Of-Origin Effects,Journal of Consumer Research, 11:694 – 9
(September).

Far East Journal of Psychology and Business Vol. 10 No. 2 Feb 2013
46
Fabris G., (1999), TowardsNew Patterns of Consumption, inVaraldoR.(eds.), Marketingin
thetwenty-first century,Challenges for the newcentury,Gueriniand Associates,Milan.
Fishbein, M. and Ajzen, I. (1975),Belief, Attitude, Intention, and Behavior: An Introduction
to Theory and Research, MA: Addison-Wesley Publishing Company.
Fornari D. (1995),The New Dimensions ofConsumption PatternsinItaly, in “Trade Marketing
No. 15.
Gaedeke R. (1973), Consumer Attitudes Toward Products „„Made in‟‟
DevelopingCountries,Journal of Retail, 49(2):13 – 24 (Summer).
Grewal, Dhruv, Krishnan, R. Baker, Julie and Borin, Norm (1998), The Effect of Store
Name, Brand Name and Price Discounts on Consumers‟ Evaluations and Purchase
Intentions, Journal of Retailing 74 (3), 331-352.
Heslop, L. A., Liefeld, J. and M, Wall (1987), An Experimental Study of the Impact of COO
Information,in R. Turner (ed.), Proceedings of the annual conference of the administrative
sciences association of Canada, 8, 179-85.
Hong S-T, Wyer RS. (1990), Effects of Country-Of-Origin and Product-
AttributeInformation on Product Evaluation: An Information Processing Perspective,Journal
of Consumer Research, 16:175 – 87 (September).
Johansson JK, Douglas SP, Nonaka I. (1985), Assessing the impact of country oforigin on
product evaluations: a new methodological perspective,Journal Marketing Research, 22:388
– 96 (November).
Keller K. L. (1993), Conceptualizing, Measuring, Managing Customer-Based Brand
Equity,The Journal of Marketing,57(1):1-22.
Kim CK, Chung JY (1997), Brand Popularity, CountryImage and Market Share: An
Empirical Studies,Journal of International Business Studies, 28(2): 361-386.
Li, Zhan G, L William Murray, and Don Scott (2000), "Global Sourcing, Multiple Country-
Of-Origin Facets, and Consumer Reactions",Journal of Business Research, 47 (2): 121-33.
Kleppe, Ingeborg Astrid, Nina Marianne Iversen and Inger G. Stensaker (2002),”Country
Images in Marketing Strategies,Conceptual Issues and an Empirical Asian
Illustration”,Journal of Brand Management, Vol. 10, No. 1, 61-74, (Authors contributed
equally).
Kotler, P., Armstrong, G., Saunders, J. andWong, V. (1996), Principles of Marketing, The
European Edition, Prentice-Hall, HemelHempstead, p. 556.
Kotler, Philip (2000),Marketing Management: Analysis, Planning, Implementation, and
Control, 10th ed., New Jersey: Prentice-Hall.

Far East Research Centre www.fareastjournals.com
47
Laroche, M., Papadopoulos, N., Heslop, L., and Mourali, M (2005), “Country Image
Structure and its Influence on Consumer Evaluations of Foreign Products,” International
Marketing Review, 22 (1), 96-115.
Li, J., F.L. Liu, X. Liu and J. Murphy (2007), English and Chinese: The Role of Consumer
Ethnocentrism and Country of Origin in Chinese Attitudes towards Store Signs,Australian
Marketing Journal 14(2), 5-16.
Maznah Ghazali, M. Said Othman, A. Zahiruddin Yahya and M. Sarif Ibrahim, “Products
and Country of Origin Effects: The Malaysian Consumers‟ Perception”. International
Review of Business Research Papers, Vol. 4 No.2 March 2008 Pp.91-102
Nebenzahl I.D., Jaffe´ E.D., Lampert S.I., (1997), “Towards A Theory of Country
ImageEffect on Product Evaluation”, Management International Review, 37, pp. 27–49.
Papadopoulos N. (1993), What Product and Country Images are and are Not,inPapadopoulos
N, Heslop LA, editors,Product-country images: impact and role in international marketing,
New York: Haworth Press, 1993.p. 3 – 38.
Rao, Akshay R. and Monroe, Kent B. (1988), The Moderating Effect of Prior Knowledge on
Cue Utilization in Product Evaluations, Journal of Consumer Research 15 (2), 253-264.
Richardson, Paul S., Dick, Alan S. and Jain, Arun K. (1994), Extrinsic and Extrinsic Cue
Effect on Perceptions of Store Brand Quality, Journal of Marketing Research 58 (4), 28-36.
Schooler, R.D. (1971), 'Bias Phenomena: Attendant to the Marketing of Foreign Goods inthe
US', Journal of International Business Studies, 21: 71-80.
Soumava Bandyopadhyay and Anwar, Syed Tariq, (2000), Product Country-Of-Origin
Perceptions of Consumers in Pakistan, Southwestern Marketing Association, San Antonio,
Texas March 15-18, 2000.
Stanton, W. J., Michael J. E, and Bruce J. W. (1994),Fundamentals in Marketing, 10th ed.
New Delhi: McGraw-Hill.
Thakor, M. V. and Katsanis, L. P. (1997), A Model of Brand and Country Effects on Quality
Dimensions: Issues and Implications, Journal of International Consumer Marketing 9 (3),
79-100.
YI CAI (1994) Athens, Georgia (2002), “Country-Of-Origin Effects on Consumers'
Willingness to Buy Foreign Products: An Experiment in Consumer Decision Making”, A
Thesis Submitted to the Graduate Faculty of the University of Georgia, Athens.
Copyright © 2022 FDOKUMEN