Sedimentation equilibrium and the generalized Archimedes' principle
Upload
independentCategory
view
5download
0
PALEOCEANOGRAPHY, VOL. 3, NO. 1, PAGES 39-59, FEBRUARY 1988
THE RECOR• OF LATE PLEISTOCENE B IOGENIC
SEDIMENTATION IN THE EASTERN TROPICAL
PACIFIC OCEAN
Mitchell Lyle
College of Oceanography Oregon State University, Corvallis
David W. Murray
Department of Geology Brown University, Providence, Rhode Island
Bruce P. Finney, Jack Dymond, James M. Robbins, and Kathryn Brooksforce
College of Oceanography Oregon State University, Corvallis
Abstract. We have generated .--300 Kyr records of biogenic opal calcite and organic carbon (Cor) for three cores in the , , g eastem and central equatorial Pacific Ocean and have compared the records to determine whether common periods of biogenic sedimentation have occurred throughout the region. We find that Cor•; has been deposited in common pulses throughout the area[while opal has a much more local pattern of variation. Calcite varies regionally, but the record is shaped by superimposed dissolution and productivity processes. The most intense Corg peak occurs at 18 ka and can have greater than 2 flaes the Holocene Cory content. Other major Corg peaks occur 150 lea and perhapõ at 280 lea. We have
compared the Corg record in one of the cores, V19-28, to a model deepwater oxygen record developed from •}13C data in the nearby V 19-30 to test whether the Corg record has been mostly shaped by degradation or by the rain of organic matter from the euphotic zone. We found no coherence between the
two records, implying that the Corg .record is primarily a measure of productivity. By companng the opal, calcite, and
Corg records in V 19-28, a core which is at or above the lysocline, we found that both increased calcite and opal deposition matches high Cor k accumulation. We also found, however, that the calcite and o-pal records were uncorrelated, so that episodes of high opal deposition do not necessarily accumulate calcite rapidly. We hypothesize that at least two different plankton communities have been dominant in the waters above this site, one rich in opal-secreting plankton and one more dominated by calcite producers. The opal-rich plankton community was dominant during the intervals 10-15 ka and 35-60 ka.
Copyright 1988 by the American Geophysical Union.
Paper number 8P0030. 0883-8305/88/008P-0030510.00
INTRODUCTION
The biogeochemical cycle of carbon has complex but only partially understood connections with the Earth's climate. Marine plankton play an important role within the carbon cycle because they mediate the transfer of carbon between the atmosphere and the ocean. Plankton regulate the exchange of CO 2 between the atmosphere and ocean by determining the size and to some extent the speciation of the dissolved inorganic carbon pool that resides at the air-ocean boundary. They convert dissolved carbon into tissue and calcite skeletal material, a portion of which sinks out of the euphotic zone.
Phytoplankton growtli is in turn regulated by the exchange of nutrients from the ocean's interior into the euphotic zone, and is driven by ocean circulation. High-productivity areas mark regions of surface water divergence where deeper nutrient-rich waters are imported into the euphotic zone. Enhanced productivity also extends downstream from the upwelling regions due to horizontal advection of upwelled nutrients [Bernal, 1981]. Potentially then, paleoceanographers can use the position and intensity of ancient regions of high productivity to determine the extent of exchange between the surface and the deep ocean, to locate the position of oceanic divergences and to trace horizontal advection away from upwelling areas.
In the deep ocean basins the primary source of sedimentary Cor calcite and opal is the plankton g, , community that occupies the surface waters above the sediments. The task of hindcasting primary productivity based upon the sedimentary record is hampered, however, by a poor understanding of how biogenic material preserved in marine sediments is related to primary productivity in the euphotic zone above. Intuitively it seems clear that relationships should exist among the records of Cory, calcite, opal, and the magnitude of past primary productivity. The relationship is complicated, however, because of mixed
4 0 Lyle et al.: Late Pleistocene Biogenic Sedimentation
140'
20'
I0'
30'
20'
I0'
140'
//Jc c If of California
SURFACE CURRENTS
MEXICO
30'
20'
I0'
30'
20*
I0 o
- O'
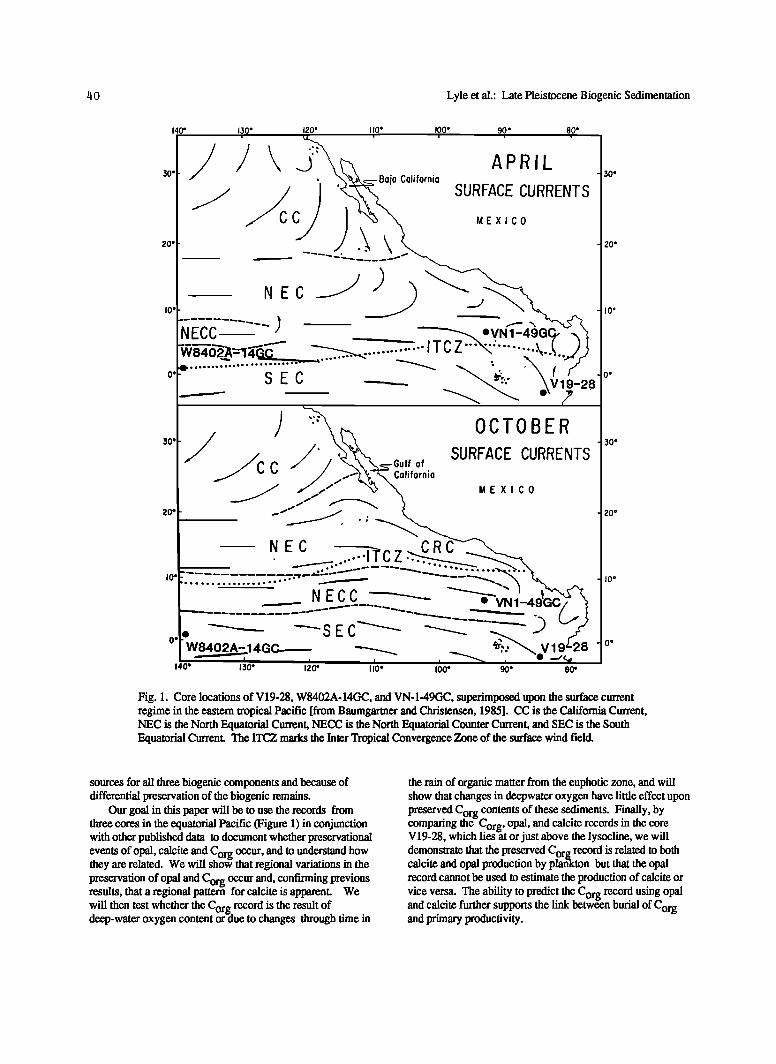
Fig. 1. Core locations of V19-28, W8402A-14GC, and VN-1-49GC, superimposed upon the surface current regime in the eastern tropical Pacific [from Baumgarmer and Christensen, 1985]. CC is the California Current, NEC is the North Equatorial Current, NECC is the North Equatorial Counter Current, and SEC is the South Equatorial Current. The ITCZ marks the Inter Tropical Convergence Zone of the surface wind field.
sources for all three biogenic components and because of differential preservation of the biogenic remains.
Our goal in this paper will be to use the records from three cores in the equatorial Pacific (Figure 1) in conjunction with other published data to document whether preservational events of opal calcite and Cry occur, and to understand how ' O_ they are related. We will show that regional variations in the
preservation of opal and Corg occur and, confirming previous results, that a regional pattern for calcite is apparent. We will then test whether the Cory record is the result of deep-water oxygen content or-due to changes through time in
the rain of organic matter from the euphotic zone, and will show that changes in deepwater oxygen have little effect upon preserved Cory contents of these sediments. Finally, by comparing the-Cory, opal, and calcite records in the core V19-28, which lies•t or just above the lysocline, we will
demonstrate that the preserved Corg record is related to both calcite and opal production by plankton but that the opal record cannot be used to estimate the production of calcite or vice versa. The ability to predict the C r record using opal og
and calcite further supports the link between burial of Corg and primary productivity.
Lyle et al.: Late Pleistocene Biogenic Sedimentation
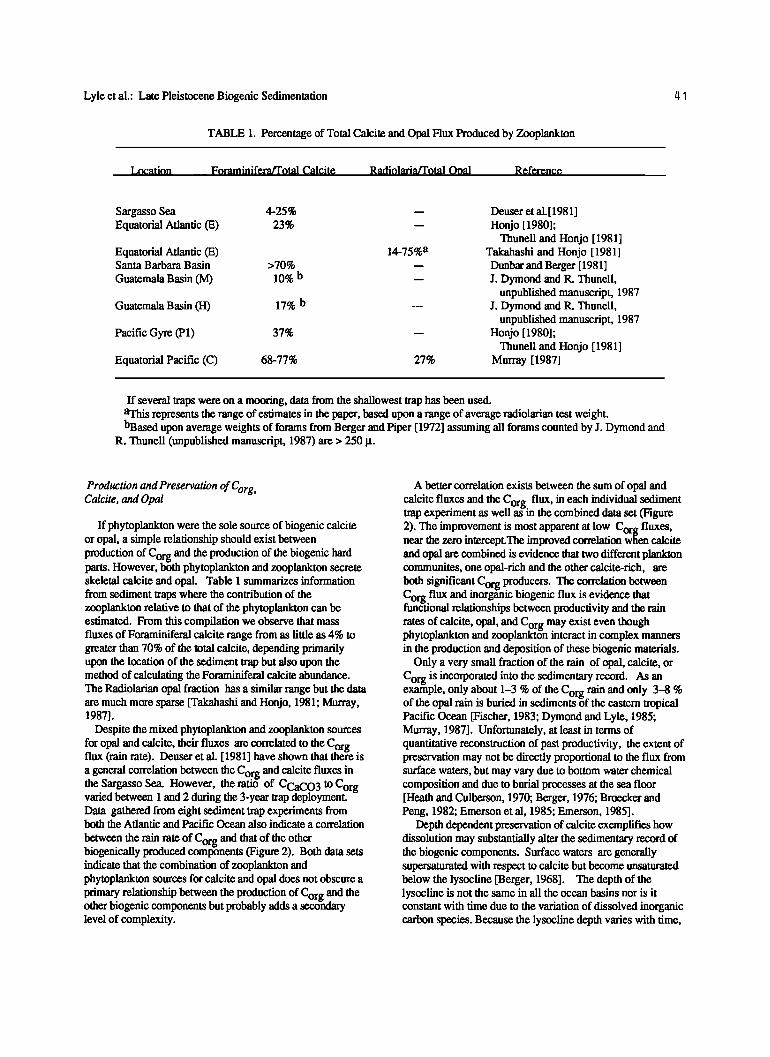
TABLE 1. Percentage of Total Calcite and Opal Flux Produced by Zooplankton
Location _ Foraminifera/Total Calcite Radiolaria/Total Ooal Reference _
Sargasso Sea Equatorial Atlantic (E)
Equatorial Atlantic (E) Santa Barbara Basin
Guatemala Basin (M)
Guatemala Basin (H)
Pacific Gyre (P1)
Equatorial Pacific (C)
4-25%
23%
>70%
10% b
17% b
37%
68-77%
-- Deuser et al. [ 1981 ] -- Honjo [ 1980];
Thunell and Honjo [1981] 14-75% a Takahashi and Honjo [1981]
-- Dunbar and Berger [1981] -- J. Dymond and R. Thunell,
unpublished manuscript, 1987 --- J. Dymond and R. Thunell,
unpublished manuscript, 1987 -- Honjo [ 1980];
Thunell and Honjo [1981] 27% Murray [1987]
If several traps were on a mooring, data from the shallowest trap has been used. aThis represents the range of estimates in the paper, based upon a range of average radiolarian test weight. bBased upon average weights of forams from Berger and Piper [1972] assuming all forams counted by J. Dymond and
R. Thunell (unpublished manuscript, 1987)are > 250
Production and Preservation of Corg ' Calcite, and Opal
If phytoplankton were the sole source of biogenic calcite or opal, a simple relationship should exist between
production of Corg and the production of the biogenic hard parts. However, both phytoplankton and zooplankton secrete skeletal calcite and opal. Table 1 summarizes information from sediment traps where the contribution of the zooplankton relative to that of the phytoplankton can be estimated. From this compilation we observe that mass fluxes of Foraminfferal calcite range from as little as 4% to greater than 70% of the total calcite, depending primarily upon the location of the sediment trap but also upon the method of calculating the Foraminiferal calcite abundance. The Radiolarian opal fraction has a similar range but the data are much more sparse [Takahashi and Honjo, 1981; Murray, 1987].
Despite the mixed phytoplankton and zooplankton sources for opal and calcite, their fluxes are correlated to the Cor flux (rain rate). Deuser et al. [1981] have shown that th•rge is a general correlation between the Co.rg and calcite fluxes in the Sargasso Sea. However, the ratio of CCaCO 3 to Corg varied between 1 and 2 during the 3-year trap deployment. Data gathered from eight sediment trap experiments from both the Atlantic and Pacific Ocean also indicate a correlation
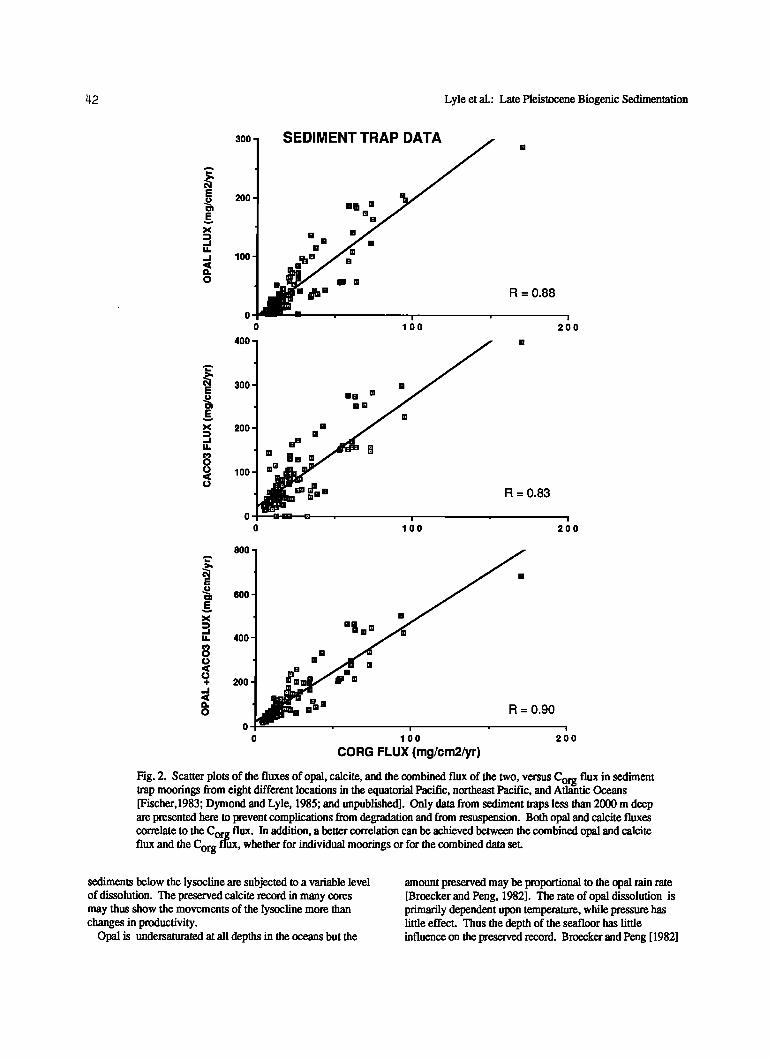
between the rain rate of Corg and that of the other biogenically produced components (Figure 2). Both data sets indicate that the combination of zooplankton and phytoplankton sources for calcite and opal does not obscure a primary relationship between the production of C r and the og other biogenic components but probably adds a secondary level of complexity.
A better correlation exists between the sum of opal and calcite fluxes and the C rg flux in each individual sediment O w ' ' trap experiment as well as in the combined data set (Figure
2). The improvement is most apparent at low Corg fluxes, near the zero intercept. The improved correlation when calcite and opal are combined is evidence that two different plankton communites, one opal-rich and the other calcite-rich, are both significant C producers The correlation between org ß C flux and inorganic biogenic flux is evidence that f•gtional relationships between productivity and the rain rates of calcite, opal, and Corg may exist even though phytoplankton and zooplankt6n interact in complex manners in the production and deposition of these biogenic materials.
Only a very small fraction of the rain of opal, calcite, or C is incorporated into the sedimentary record. As an org example, only about 1-3 % of the C r rain and only 3-8 % og of the opal rain is buried in sediments of the eastern tropical Pacific Ocean [Fischer, 1983; Dymond and Lyle, 1985; Murray, 1987]. Unfortunately, at least in terms of quantitative reconstruction of past productivity, the extent of preservation may not be directly proportional to the flux from surface waters, but may vary due to bottom water chemical composition and due to burial processes at the sea floor [Heath and Culberson, 1970; Berger, 1976; Broecker and Peng, 1982; Emerson et al, 1985; Emerson, 1985].
Depth dependent preservation of calcite exemplifies how dissolution may substantially alter the sedimentary record of the biogenic components. Surface waters are generally supersaturated with respect to calcite but become unsaturated below the lysocline [Berger, 1968]. The depth of the lysocline is not the same in all the ocean basins nor is it constant with time due to the variation of dissolved inorganic carbon species. Because the lysocline depth varies with time,
•42 Lyle et al.: Late Pleistocene Biogenic Sedimentation
300
200
100
o
o
400
SEDIMENT TRAP DATA
[]
[] []
[]
[]
I
lOO
R = 0.88
I
200
o
300
200
100
E] []
mm
0.83
0 100 200
o
o
8OO
600
4OO
200
[] []
0.90 ß i ß i
0 100 200
CORG FLUX (mg/cm2/yr)
Fig. 2. Scatter plots of the fluxes of opal, calcite, and the combined flux of the two, versus C flux in sediment 0rg trap moorings from eight different locations in the equatorial Pacific, northeast Pacific, and Atlantic uceans [Fischer, 1983' Dymond and Lyle, 1985; and unpublished]. Only data from sediment traps less than 2000 m deep are presented here to prevent complications from degradation and from resuspension. Both opal and calcite fluxes correlate to the Corg flux. In addition, a better correlation can be achieved between the combined opal and calcite flux and the Corg flux, whether for individual moorings or for the combined data set.
sediments below the lysocline are subjected to a variable level of dissolution. The preserved calcite record in many cores may thus show the movements of the lysocline more than changes in productivity.
Opal is undersaturated at all depths in the oceans but the
amount preserved may be proportional to the opal rain rate [Broecker and Peng, 1982]. The rate of opal dissolution is primarily dependent upon temperature, while pressure has little effect. Thus the depth of the seafloor has little influence on the preserved record. Bmecker and Peng [1982]
Lyle et al.: Late Pleistocene Biogenic Sedimentation t[3
suggested that the dissolution rate of opal in sediments is proportional to the square root of the opal fraction of the sediments. Their model is untested, but even if it is only approximately correct, episodes of high opal rain will result in higher preserved opal in sediments than episodes of low opal rain. Thus the preserved opal record is at least a qualitative record of opal production.
The processes responsible for Corg preservation are not well established. Some advocate tiff' -t preserved Cor e is primarily a record of Cor $ rain, while others believedhat the preserved Corg record in aeep-sea sediments contains a mixed record of productivity and degradation [M'tiller and Suess, 1979; Samtheim et al., 1987; Emerson, 1985; Emerson et al., 1985]ß Miiller and Suess [1979] first tried to quantify the relationship between preserved Corg and primary productivity. They extended a correlation first noted by Heath et al [1977] between Cot g contents of sediments and the bulk accumulation rate and dearmined empirically that the C0_rg content of deep-sea sediments approximately doubles with either a doubling of primary productivity or with a tenfold increase of sedimentation rate, provided all other factors remain constant. They thus maintained that hindcasts of the magnitude of past C r rain can be made from the og
sedimentary Corg record if the changes in sedimentation rate through time are Known.
Emerson et al. [1985] and Emerson [1985] modeled the degradation of organic matter in marine sediments assuming that organic matter is homogeneous in composition and degrades with first-order kinetics. The model also assumes that molecular oxygen is the primary oxidant of the organic matter. It predicts that both the rain rate of organic matter and the diffusion of oxygen into sediments are important factors controlling the Corg content of marine sediments. Variations of equivalent ma-gnitude in bottomwater oxygen
content or in the rain rate of Corg should have roughly equal effects upon the preservation of Corg in marine sediments. In other words, doubling the oxygen content in bottom waters would have approximately the same effect upon the
Corg content of the sediments as halving the Corg rain rate frorfi the euphotic zone Thus the C record in-deep-sea ß , org sediments may be partly a record of bottom water oxygen variations.
THE CORES
V19-28
Core V 19-28 is the longest of the cores in this study (16.2m), and was recovered from the Peru Basin flank of the Carnegie Ridge ( 2ø28'S, 84ø39W; 2670 m water depth). It is situated about 400 km from the coast of Ecuador, underneath the South Equatorial Current. An oxygen isotopic record using the benthic Foraminifera Uvigerina probiscidea [Ninkovich and Shackleton, 1975] was one of several used to construct a stacked oxygen isotope record spanning the last 300 Kyr [Pisias et al., 1984; Martinson et al., 1987]ß The chronostratigraphy of Martinson et al. [1987] was used to delimit ages and sedimentation rates in the upper 11 m of the core. Because of the age errors associated with the stacked record and the error associated with transferring the
age scale from the stack to an individual record, the absolute age is known to about +5 Kyr [Martinson et al, 1987]. The sedimentation rate over the last 300 Kyr ranged from 16.3 to 1.0 cm/Kyr and averaged 3.7 cm/Kyr (Table 2) 1.
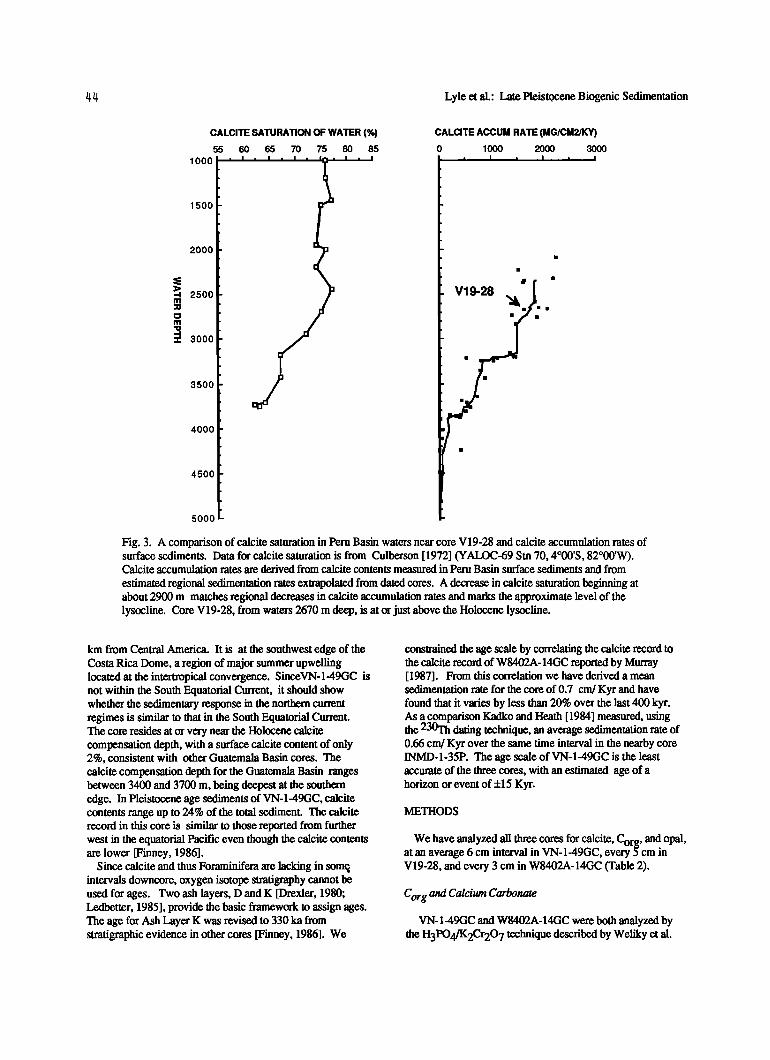
V 19-28 was chosen for this study partly because the calcite record in the core would be minimally controlled by dissolution (Figure 3). It is located approximately at the Holocene lysocline, based upon our own analyses of surface sediments in the eastern Pacific and based upon estimates of calcite saturation of deep waters [Culberson, 1972]. The decrease in calcite preservation in Holocene surface sediments matches in depth where Culberson [1972] observed a significant decrease in calcite saturation of the deep waters in the Peru Basin. Calcite is only supersaturated in waters less than 350 m deep, but between 350 m and about 2900 m the waters remain at about 75% of calcite saturation. Below
2900 m to the bottom of the profile at 3750 m, however, the percent saturation decreases to about 60% saturation. This change in saturation below 2900 m probably marks the interval of accelerated calcite dissolution, and 2900 m is the approximate lysocline.
W8402A-14GC
W8402A-14GC is a 330-cm gravity core from MANOP site C ( 0ø57.2'N, 138ø57.3W; 4287 m water depth). Site C is typical of the central Pacific equatorial region, having sediments composed primarily of calcite with minor opal and minimal continental detritus. W8402A- 14GC, like V 19-28, is located underneath the South Equatorial Current and also beneath waters upwelled in the equatorial divergence. The age scale for this core is also based upon oxygen isotope stratigraphy, measured upon Globorotalia turnida [Murray, 1987]. The age scale was assigned by mapping the isotope record to the SPECMAP stack of Imbrie et al. [1984] with the signal correlation technique of Martinson et al [1982]. The average error of age assignments in W8402A-14GC is about the same as the Martinson et al. [1987] stack, or about +5 Kyr. The average sedimentation rate for this core is 1.3 cm/Kyr, but ranges between 2.1 and 0.73 cm/Kyr. W8402A-14GC is located below the regional lysocline of about 3700 m [Parker and Berger, 1971] but well above the calcite compensation depth [4800 m, Berger et al., 1976]. Its calcite profde should strongly reflect the changes in lysocline depth over the Pleistocene. The profile correlates well with others from the central Pacific, showing the regional dissolution influence [Murray, 1987].
VN-1-49GC
VN-1-49GC is a 305-cm gravity core from MANOP site H (6ø32.3'N, 92ø46.2'W, 3580m water depth; Finney [1986]). Site H is located in the Guatemala Basin about 800
1 Supplement data (Table 2) is available with entire article on microfiche. Order from American Geophysical Union, 2000 Florida Avenue, N.W., Washington, DC 20009. Document P88001; $2.50. Payment must accompany order.
/4/4 Lyle et al.' Late Pleistocene Biogenic Sedimentation
55
1000
1500
2OOO
2500
3000
3500
4000
4500
5000
CALCITE SATURATION OF WATER (%)
60 65 70 75 80 85 i I ß ß , ,al , i , i
CALCITE ACCUM RATE (MG/CM2/KY)
0 1000 2000 3000 , I , I , I
V19-28
ß
ß ß
ß ß
Fig. 3. A comparison of calcite saturation in Peru Basin waters near core V19-28 and calcite accumulation rates of surface sediments. Data for calcite saturation is from Culberson [1972] (YALOC-69 Stn 70, 4ø00'S, 82ø00'W). Calcite accumulation rates are derived from calcite contents measured in Peru Basin surface sediments and from
estimated regional sedimentation rates extrapolated from dated cores. A decrease in calcite saturation beginning at about 2900 m matches regional decreases in calcite accumulation rates and marks the approximate level of the lysocline. Core V19-28, from waters 2670 m deep, is at or just above the Holocene lysocline.
km from Central America. It is at the southwest edge of the Costa Rica Dome, a region of major summer upwelling located at the intertropical convergence. SinceVN- 1-49GC is not within the South Equatorial Current, it should show whether the sedimentary response in the northern current regimes is similar to that in the South Equatorial Current. The core resides at or very near the Holocene calcite compensation depth, with a surface calcite content of only 2%, consistent with other Guatemala Basin cores. The calcite compensation depth for the Guatemala Basin ranges between 3400 and 3700 m, being deepest at the southern edge. In Pleistocene age sediments of VN-1-49GC, calcite contents range up to 24% of the total sediment. The calcite record in this core is similar to those reported from further west in the equatorial Pacific even though the calcite contents are lower [Finney, 1986].
Since calcite and thus Foraminifera are lacking in som E intervals downcore, oxygen isotope stratigraphy cannot be used for ages. Two ash layers, D and K [Drexler, 1980; Ledbetter, 1985], provide the basic framework to assign ages. The age for Ash Layer K was revised to 330 ka from stratigraphic evidence in other cores [Finney, 1986]. We
constrained the age scale by correlating the calcite record to the calcite record of W8402A- 14GC reported by Murray [1987]. From this correlation we have derived a mean sedimentation rate for the core of 0.7 cm/Kyr and have found that it varies by less than 20% over the last 400 kyr. As a comparison Kadko and Heath [1984] measured, using the 230T1:• dating technique, an average sedimentation rate of 0.66 cm/Kyr over the same time interval in the nearby core INMD- 1-35P. The age scale of VN- 1-49GC is the least accurate of the three cores, with an estimated age of a horizon or event of_+15 Kyr.
MJ•THODS
We have analyzed all three cores for calcite, Corg, and opal, at an average 6 cm interval in VN- 1-49GC, every 5 cm in V19-28, and every 3 cm in W8402A-14GC (Table 2).
Corg and Calcium Carbonate
VN-1-49GC and W8402A-14GC were both analyzed by the H3PO4/K2Cr20 7 technique described by Weliky et al.
Lyle et al.' Late Pleistocene Biogenic Sedimentation
[1983], while V19-28 was analyzed by a variation to improve precision for Corg analyses in the presence of abundant calcite. In the standard method CO 2 is evolved from a 50 mg sample by treating it with hot phosphoric acid and is measured using a LECO carbon analyzer. The same sample is then oxidized with potassium dichromate to liberate organically bound CO 2 for measurement in the same instrument.
In samples with high calcite content we have found that small amounts of CO 2 from the calcite analysis may at times contaminate the subsequent C r analysis and may og necessitate unacceptable numbers of repeat analyses. We have also found that high precision is difficult to maintain on
the typical 50 mg sample when Corg contents drop below 0.20%. Consequently, we have used the following procedure for the V19-28 samples. Calcium carbonate is first removed from a 300 mg sediment sample with phosphoric acid and let stand overnight to outgas the calcite-bound CO 2. The sample is then purged with oxygen to remove any residual
gas before potassium dichromate is added for the Crag measurement. Subsequenfiy, a different split of the sample is analyzed for total carbon by oxidizing the sample at 1500øC. The carbon associated with calcite in the sediment sample is
derived by subtracting the Corg from the total carbon content.
Opal
We have analyzed opal by an Na2CO 3 extraction procedure for V 19-28, and by a normative analysis for W8402A- 14GC and for VN-1-49GC. Approximately 300 mg. samples from V19-28 were treated with 25 mL of 2M Na2CO 3 . The samples were then mounted in a vertical 'daisy wheel' and rotated for 24 hours in an 80øC steam bath. After
centrifugation, 5 mL of solution was transferred into 15 mL of double distilled water and analyzed for Si by flame atomic absorption. We express all opal concentrations in Table 2 as %SiO 2 without correction for water of hydration in opaline material. Precision of duplicate analyses as expressed as absolute %SiO 2 was 0.1-0.2% below 10% SiO 2 and 0.2-0.4% at higher SiO 2 concentrations. We have tested the extraction procedure on standard clays and find that the leach is specific for opal with almost no attack upon the clay material. For example, only 0.4% SiO 2 was extracted from a smectite-rich soil standard.
The normarive analysis of opal for W8402A-14GC and VN-1-49GC is based upon X ray fluorescence analyses of the bulk sediments for total Si and Al and uses the residual of a
sequential extraction sequence to determine a detrital Si/Al ratio at each location [Finney, 1986; Murray, 1987]. We assume that this detrital Si/Al ratio does not change with time. Opaline Si is determined by multiplying the total Al in a sediment sample by the detrital Si/A1 ratio to determine the detrital Si and subtracting this value from the total Si. We have compared the opal Si determined by the normarive method with that determined by the extraction procedure in core W8402A-14GC. We found that the relative downcore
changes in opal matched in both records but that the Na2CO 3 extraction systematically determined, in relative terms, about 10% lower opal contents.
Production of Final Records
We have removed anomalous sedimentation events
(volcanic ash falls and turbidites) from V19-28 and VN-1-49GC [Ninkovich and Shackleton,1975; Finney, 1986]. In VN-1-49GC where we had the benefit of auxiliary chemical analyses on bulk samples and on separated ash, we were able to determine the percentage of volcanic ash in each sample and can normalize the data to an ash-free basis (Table 2; see also Finney [1986]). In V19-28, where such data are not available, we merely removed samples from the 'contaminated' intervals. Thus, we have removed a mrbidite from the interval 570 to 608 cm, and Ash Layer T,' from 855 to 878 cm (Ninkovich and Shackleton, 1975). The ash layer interval is larger than previously reported because we also removed samples that we believe to contain low quantities of ash.
Calculation of Mass Accumulation Rates (MAR)
We have calculated mass accumulation rates of the
different biogenic components using sedimentation rates from the age profiles of each core, and a calculated dry bulk density from Murray [1987] using the calcite content of each sample (Table 2). Mass accumulation rates of individual components are determined by multiplying the bulk accumulation rate by the weight fraction of the component in the sample.
THE RECORDS OF Corg, CALCITE, AND OPAL IN THE EQUATORIAL PACIFIC
In this section we will investigate whether opal and Corg have been deposited in regionally coherent episodes or whether the biogenic records primarily reflect local events. We will also briefly compare the calcite records of W8402A- 14GC and V 19-28.
Corg
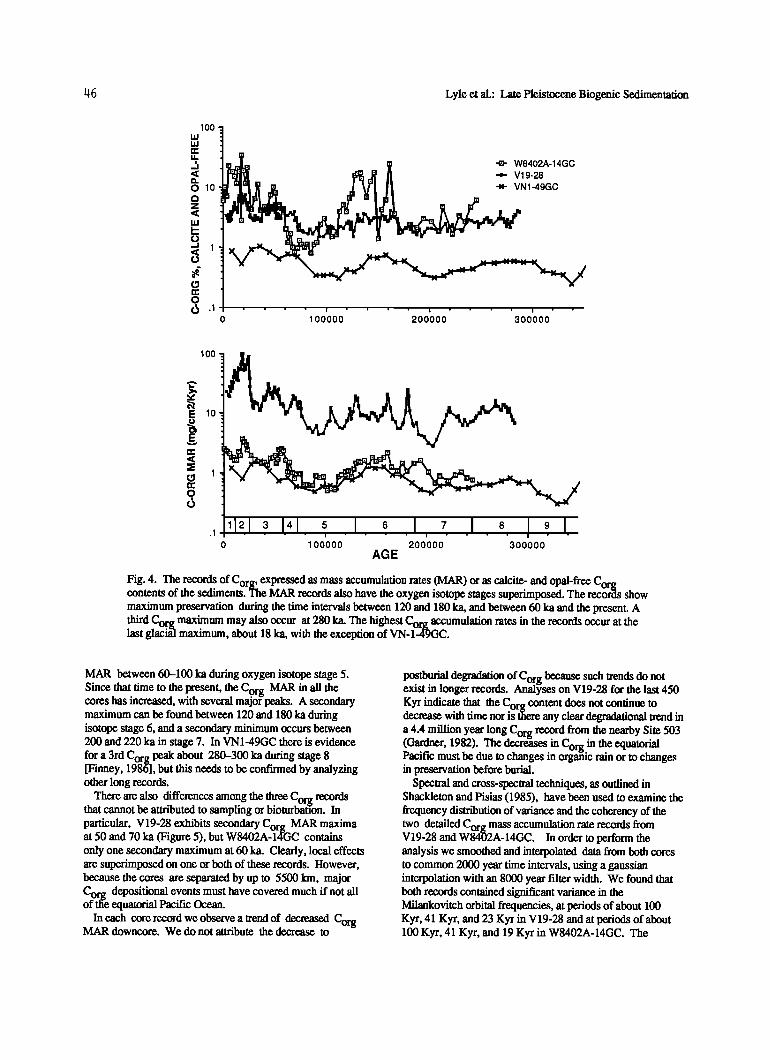
Pedersen [1983] proposed that a high- productivity event occurred throughout the eastern equatorial Pacific during the last glacial maximum at 18 ka. He observed, compared to Holocene sediments, a doubling of preserved Corg in two gravity cores, one from about 200 km west of the Galapagos Islands and the other from the Panama Basin. V19-28 and
W8402A-14GC also display a strong maximum in Corg MAR and Corg content during the last glacial maximum at 18 ka (Figure 4). Like Pedersen's data, the Corg maximum in both our cores are between 2 and 3 times higher than the
Holocene Corg contents and the Corg pulse did not begin until the end of isotope stage 3. This Corg pulse is missing from VN-1-49GC perhaps due to the coarse resolution of this record or perhaps because the Costa Rica Dome upwelling has a history different from that of the equatorial divergence region. Higher resolution sampling from cores in the same vicinity indicate that no 18 Ka peak is prominent [Lyle et al., 1984].
The records shown in Figure 4 have several other Corg burial events in common. All display minima of Corg
146 Lyle et al.: Late Pleistocene Biogenic Sedimentation
IOO
OlO
z
b
-J 1
0
0 100000 200000 300000
ß .a- W8402A-14GC
'-=- V19-28
ß -n- VN1-49GC
100
E lO
E
• 1
o,
12.1.3 1.41. $ I I .I ! ? I. ! .... ! ß ß ,
0 100000 200000 300000 AGE
Fig. 4. The records of Corg, ex•pressed as mass accumulation rates (MAR) or as calcite- and opal-free Corg contents of the sediments. 'l'ne MAR records also have the oxygen isotope stages superimposed. The recor•ts show maximum preservation during the time intervals between 120 and 180 ka, and between 60 ka and the present. A third Corg maximum may also occur at 280 ka. The highest Corg accumulation rates in the records occur at the last glaci•il maximum, about 18 ka, with the exception of VN-1-49GC.
MAR between 60-100 ka during oxygen isotope stage 5. Since that dme to the present the Corg MAR in all the cores has increased, with several major peaks. A secondary maximum can be found between 120 and 180 ka during isotope stage 6, and a secondary minimum occurs between 200 and 220 ka in stage 7. In VN1-49GC there is evidence
for a 3rd Corg peak about 280-300 ka during stage 8 [Finney, 1986], but this needs to be confirmed by analyzing other long records.
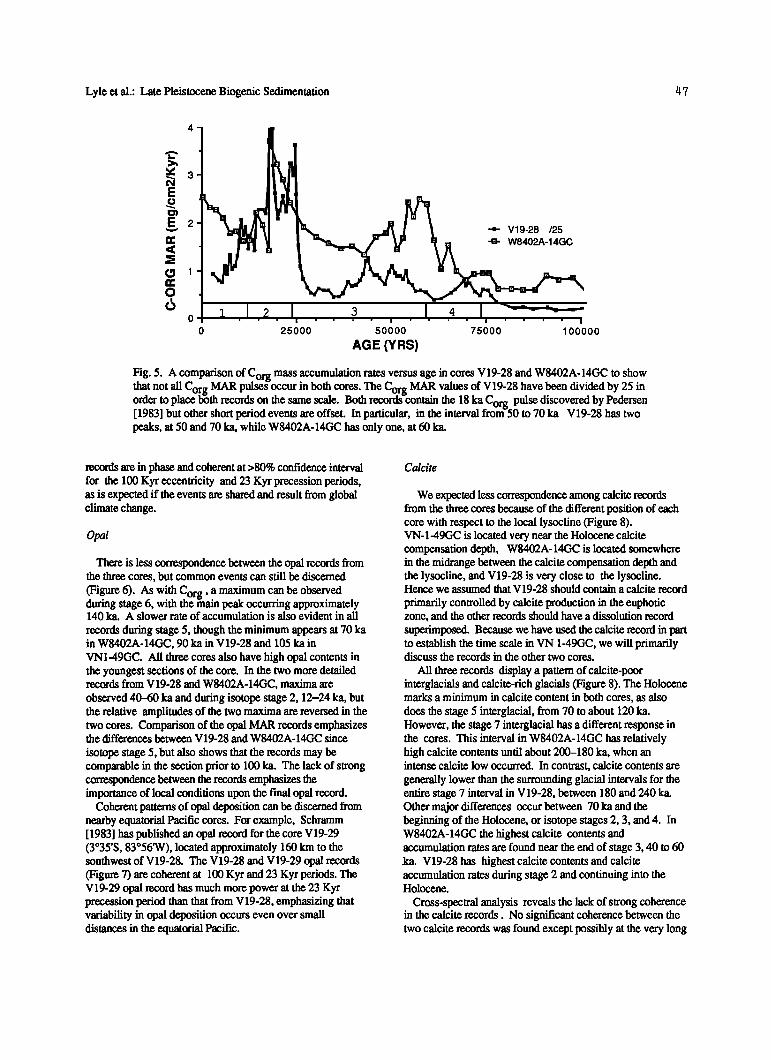
There are also differences among the three Corg records that cannot be attributed to sampling or bioturbatlon. In particular, V19-28 exhibits secondary Corg MAR maxima at 50 and 70 ka (Figure 5), but W8402A-14GC contains only one secondary maximum at 60 ka. Clearly, local effects are superimposed on one or both of these records. However, because the cores are separated by up to 5500 km, major Cor. g depositional events must have covered much if not all of the equatorial Pacific Ocean.
In each core record we observe a trend of decreased Corg MAR downcore. We do not attribute the decrease to
postburial degradation of Corg because such trends do not exist in longer records. Analyses on V19-28 for the last 450 Kyr indicate that the Corg content does not continue to decrease with time noris there any clear degradational trend in a 4.4 million year long Cor k record from the nearby Site 503 (Gardner, 1982). The decr6-ases in Corg.in the equatorial Pacific must be due to changes in organic rain or to changes in preservation before burial.
Spectral and cross-spectral techniques, as outlined in Shackleton and Pisias (1985), have been used to examine the frequency distribution of variance and the coherency of the two detailed Corg mass accumulation rate records from V19-28 and W8402A-14GC. In order to perform the analysis we smoothed and interpolated data from both cores to common 2000 year time intervals, using a gaussian interpolation with an 8000 year filter width. We found that both records contained significant variance in the Milankovitch orbital frequencies, at periods of about 100 Kyr, 41 Kyr, and 23 Kyr in V 19-28 and at periods of about 100 Kyr, 41 Kyr, and 19 Kyr in W8402A-14GC. The
Lyle et al.: Late Pleistocene Biogenic Sedimentation /47
=-= v19-28 /25
4• W8402A-14GC
0 3 0 25000 50000 75000 100000
AGE (YRS)
Fig. 5. A comparison of Corg mass accumulation rates versus age in cores V19-28 and W8402A-14GC to show that not all C rg MAR pulsegoccur in both cores The Corg MAR values of V19-28 have been divided by 25 in O __ '
order to place 1/oth records on the same scale. Both records-contain the 18 ka Corg pulse discovered by Pealersen [1983] but other short period events are offset. In particular, in the interval from-50 to 70 ka V19-28 has two peaks, at 50 and 70 ka, while W8402A-14GC has only one, at 60 ka.
records are in phase and coherent at >80% confidence interval for the 100 Kyr eccentricity and 23 Kyr precession periods, as is expected if the events are shared and result from global climate change.
Opal
There is less correspondence between the opal records from the three cores, but common events can still be discerned
(Figure 6). As with Corg, a maximum can be observed during stage 6, with the •nain peak occurring approximately 140 Ira. A slower rate of accumulation is also evident in all
records during stage 5, though the minimum appears at 70 ka in W8402A-14GC, 90 ka in V19-28 and 105 ka in VN1-49GC. All three cores also have high opal contents in the youngest sections of the core. In the two more detailed records from V 19-28 and W8402A-14GC, maxima are observed 40-60 ka and during isotope stage 2, 12-24 ka, but the relative amplitudes of the two maxima are reversed in the two cores. Comparison of the opal MAR records emphasizes the differences between V19-28 and W8402A-14GC since
isotope stage 5, but also shows that the records may be comparable in the section prior to 100 Ira. The lack of strong correspondence between the records emphasizes the importance of local conditions upon the final opal record.
Coherent patterns of opal deposition can be discerned from nearby equatorial Pacific cores. For example, Schramm [1983] has published an opal record for the core V19-29 (3ø35'S, 83ø56•r), located approximately 160 km to the southwest ofV19-28. The V19-28 and V19-29 opal records (Figure 7) are coherent at 100 Kyr and 23 Kyr periods. The V19-29 opal record has much more power at the 23 Kyr precession period than that from V19-28, emphasizing that variability in opal deposition occurs even over small distances in the equatorial Pacific.
Calcite
We expected less correspondence among calcite records from the three cores because of the different position of each core with respect to the local lysocline (Figure 8). VN-1-49GC is located very near the Holocene calcite compensation depth, W8402A-14GC is located somewhere in the midrange between the calcite compensation depth and the lysocline, and V19-28 is very close to the lysocline. Hence we assumed that V19-28 should contain a calcite record
primarily controlled by calcite production in the euphotic zone, and the other records should have a dissolution record superimposed. Because we have used the calcite record in part to establish the time scale in VN 1-49GC, we will primarily discuss the records in the other two cores.
All three records display a pattern of calcite-poor interglacials and calcite-rich glacials (Figure 8). The Holocene marks a minimum in calcite content in both cores, as also does the stage 5 interglacial, from 70 to about 120 ka. However, the stage 7 interglacial has a different response in the cores. This interval in W8402A-14GC has relatively high calcite contents until about 200-180 ka, when an intense calcite low occurred. In contrast, calcite contents are generally lower than the surrounding glacial intervals for the entire stage 7 interval in V19-28, between 180 and 240 ka. Other major differences occur between 70 ka and the beginning of the Holocene, or isotope stages 2, 3, and 4. In W8402A- 14GC the highest calcite contents and accumulation rates are found near the end of stage 3, 40 to 60 .ka. V 19-28 has highest calcite contents and calcite accumulation rates during stage 2 and continuing into the Holocene.
Cross-spectral analysis reveals the lack of strong coherence in the calcite records. No significant coherence between the two calcite records was found except possibly at the very long
/48 Lyle et al.: Late Pleistocene Biogenic Sedimentation
100
80
• 60
0 40
0 20
..a- W8402A-14GC
-..-- V19-28
ß .• VN-1-49GC X 2
0
0 100000 200000 300000 AGE
1000 ] •.• •l,& -a- W8402A-14GC :l •'•!• •'•r• =.- v19-28
_ _
• lOO
'• 10 !.1 • • " O
1 ........ . . .
' ' '0 0 100000 200000 300 00 AGE
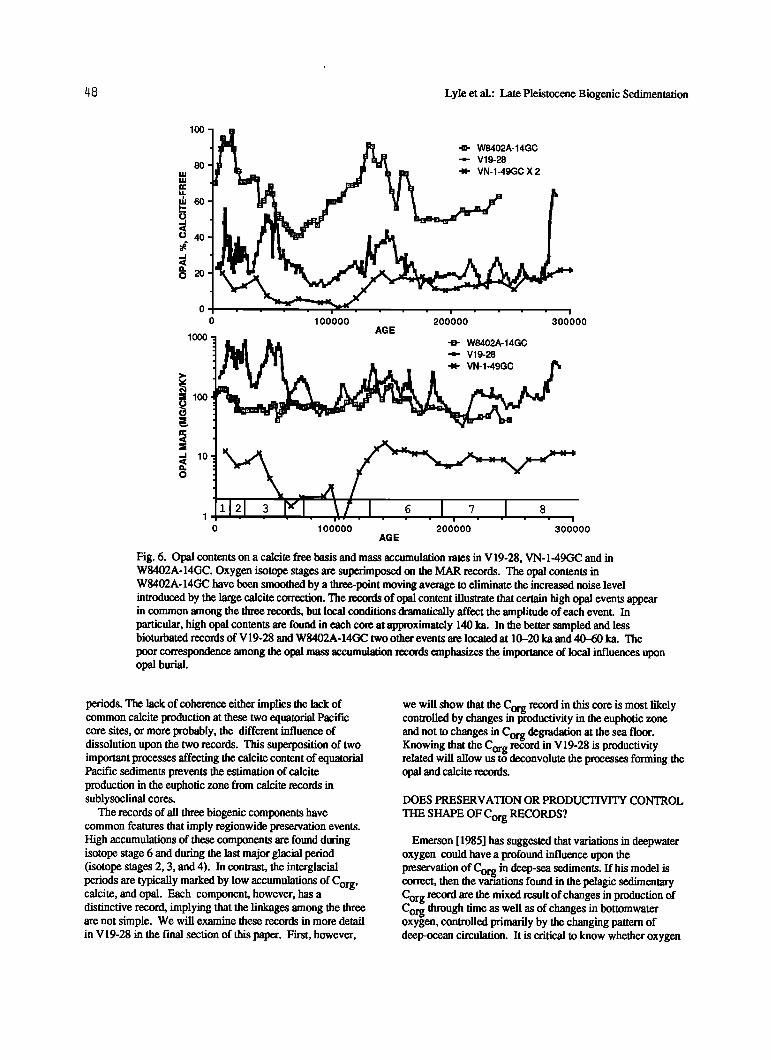
Fig. 6. Opal contents on a calcite free basis and mass accumulation rates in V19-28, VN-1-49GC and in W8402A-14GC. Oxygen isotope stages are superimposed on the MAR records. The opal contents in W8402A-14GC have been smoothed by a three-point moving average to eliminate the increased noise level introduced by the large calcite correction. The records of opal content illustrate that certain high opal events appear in common among the three records, but local conditions dramatically affect the amplitude of each event. In particular, high opal contents are found in each core at approximately 140 ka. In the better sampled and less bioturbated records of V19-28 and W8402A-14GC two other events are located at 10-20 ka and 40-60 ka. The
poor correspondence among the opal mass accumulation records emphasizes t•. importance of local influences upon opal burial.
periods. The lack of coherence either implies the lack of common calcite production at these two equatorial Pacific core sites, or more probably, the different influence of dissolution upon the two records. This superposition of two important processes affecting the calcite content of equatorial Pacific sediments prevents the estimation of calcite production in the euphotic zone from calcite records in sublysoclinal cores.
The records of all three biogenic components have common features that imply regionwide preservation events. High accumulations of these components are found during isotope stage 6 and during the last major glacial period (isotope stages 2, 3, and 4). In contrast, the interglacial
periods are typically marked by low accumulations of Corg, calcite, and opal. Each component, however, has a distinctive record, implying that the linkages among the three are not simple. We will examine these records in more detail in V19-28 in the final section of this paper. First, however,
we will show that the C record in this core is most likely org . controlled by changes in productivity in the euphotic zone
and not to changes in Corg degradation at the sea floor. Knowing that the Corg record in V19-28 is productivity related will allow us t6 deconvolute the processes forming the opal and calcite records.
DOES PRESERVATION OR PRODUCTIVITY CONTROL
THE SHAPE OF Corg RECORDS?
Emerson [1985] has suggested that variations in deepwater oxygen could have a profound influence upon the
preservation of Corg in deep-sea sediments. If his model is ß
correct, then the variations found in the pelagic sedimentary cCorg record are the mixed result of changes in production of org through time as well as of changes in bottomwater
oxygen, controlled primarily by the changing pattern of deep-ocean circulation. It is critical to know whether oxygen
Lyle et al.: Late Pleistocene Biogenic Sedimentation 149
80 V19-29, open, offset +20%; V19-28, closed
u.i
o
o 40
•' 20 O
0 I 00000 200000 300000 AGE
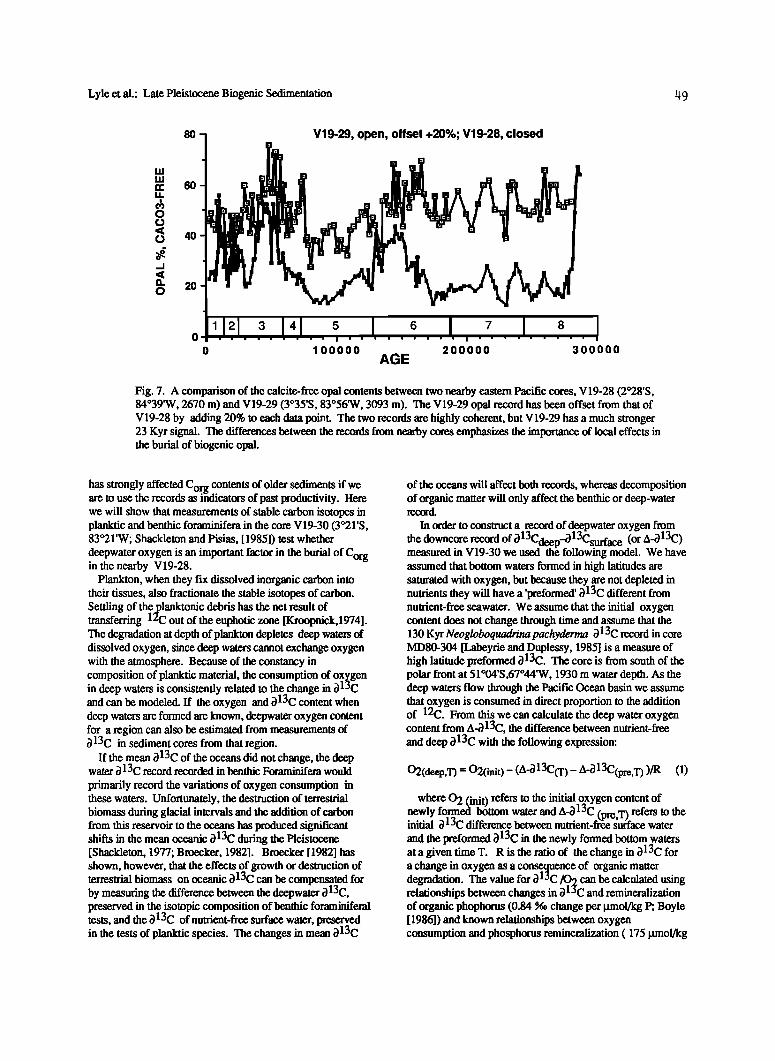
Fig. 7. A comparison of the calcite-free opal contents between two nearby eastern Pacific cores, V19-28 (2ø28'S, 84ø39'W, 2670 m) and V19-29 (3ø35'S, 83ø56•V, 3093 m). The V19-29 opal record has been offset from that of V19-28 by adding 20% to each data point. The two records are highly coherent, but V19-29 has a much stronger 23 Kyr signal. The differences between the records from nearby cores emphasizes the importance of local effects in the burial of biogenic opal.
has strongly affected C r contents of older sediments if we og are to use the records as indicators of past productivity. Here we will show that measurements of stable carbon isotopes in planktic and benthic foraminifera in the core V 19-30 (3ø2 I'S, 83ø21'W; Shackleton and Pisias, [ 1985]) test whether
deepwater oxygen is an important factor in the burial of Corg in the nearby V19-28.
Plankton, when they fix dissolved inorganic carbon into their tissues, also fractionate the stable isotopes of carbon. Settling of theplanktonic debris has the net result of transferring 12C out of the euphotic zone [Kroopnick, 1974]. The degradation at depth of plankton depletes deep waters of dissolved oxygen, since deep waters cannot exchange oxygen with the atmosphere. Because of the constancy in composition of planktic material, the consumption of oxygen in deep waters is consistently related to the change in/}13C and can be modeled. If the oxygen and/)13C content when deep waters are formed are known, deepwater oxygen content for a region can also be estimated from measurements of /}13C in sediment cores from that region.
If the mean/)13C of the oceans did not change, the deep water/} 13 C record recorded in benthic Foraminifera would primarily record the variations of oxygen consumption in these waters. Unfortunately, the destruction of terrestrial biomass during glacial intervals and the addition of carbon from this reservoir to the oceans has produced significant shifts in the mean oceanic/)13C during the Pleistocene [Shackleton, 1977; Broecker, 1982]. Broecker [1982] has
o•gr destruction of shown, however, that the effects owth or terrestrial biomass on oceanic/} 13 can be compensated for by measuring the difference between the deepwater i} 13C, preserved in the isotopic composition of benthic foraminiferal tests, and the/}13C of nutrient-free surface water, preserved in the tests of planktic species. The changes in mean/}13C
of the oceans will affect both records, whereas decomposition of organic matter will only affect the benthic or deep-water
In order to construct a record of deepwater oxygen from the downcore record of/)13Cde e •-•13Csurfac e (or A-/)13C) P measured in V19-30 we used the following model. We have assumed that bottom waters formed in high latitudes are
saturated with oxygen, but because the]• are not depleted in nutrients they will have a 'preformed'/} 3C different from nutrient-free seawater. We assume that the initial oxygen content does not change through time and assume that the 130 Kyr Neogloboquadrina pachyderma /)13C record in core MD80-304 [Labeyrie and Duplessy, 1985] is a measure of high latitude preformed/}13C. The core is from south of the polar front at 51 ø04'S,67ø44'W, 1930 m water depth. As the deep waters flow through the Pacific Ocean basin we assume that oxygen is consumed in direct proportion to the addition of 12C. From this we can calculate the deep water oxygen content from A-/} 13C, the difference between nutrient-free and deep/)13C with the following expression:
O2(deep,T) = O2(init) - (A<313C(T)- A-c313C(pre,T) )/R (1)
where 0 2 (iniO refers to the initial oxygen content of newly form• bottom water and A-/}13C (r•re T) refers to the initial /} 13 C difference between nutrient-fr'•e s'urface water and the preformed/)13C in the newly formed bottom waters at a given time T. R is the ratio of the change in/}13C for a change in oxygen as a cons•uence of organic matter ß 13 degradation. The value for/} C/0_2 can be calculated using relationships between changes in/)12•C and remineralization of organic phophorus (0.84 •o change per gmol/kg P; Boyle [1986]) and known relationships between oxygen consumption and phosphorus remineralization ( 175 grnol/kg
50 Lyle et al.: Late Pleistocene Biogenic Sedimentation
.a- W8402A-14GC
..e- V19-28
• VN1-49GC,+40%
0 100000 200000 300000 AGE
o o
,•.
o
o o
,
0
-a- W8402A-14GC
ß '== V19-28
• VN1-49GC X25
5 7 8
100000 200000 300000 AGE
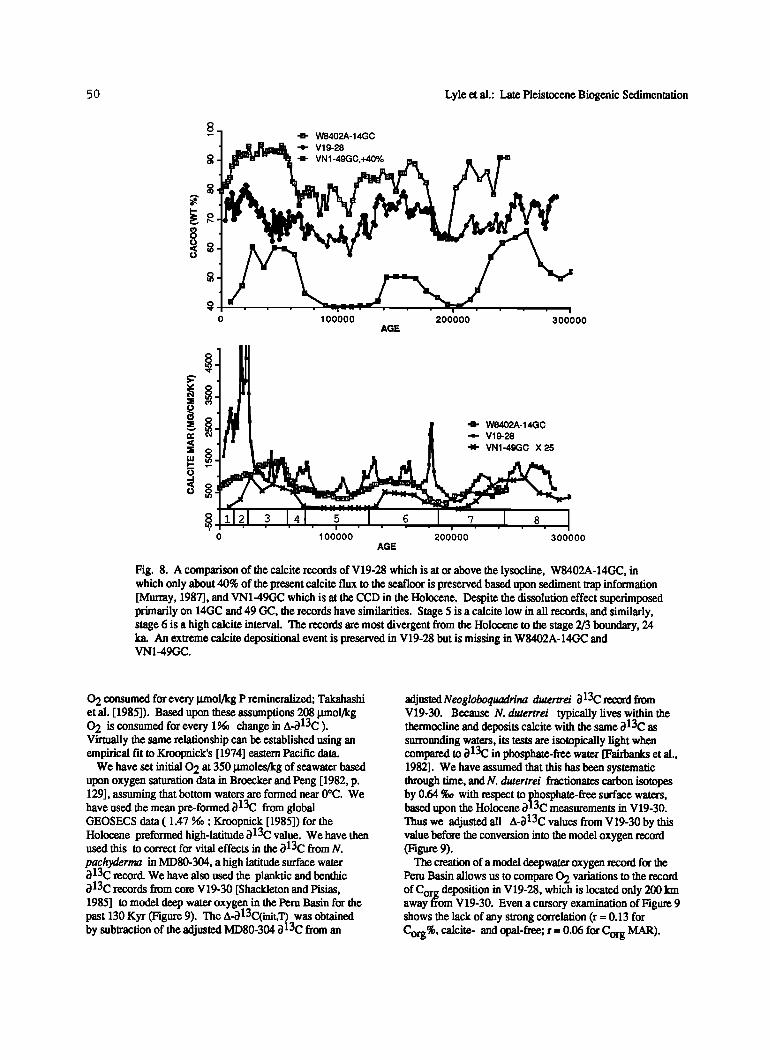
Fig. 8. A comparison of the calcite records of V19-28 which is at or above the lysocline, W8402A-14GC, in which only about 40% of the present calcite flux to the seafloor is preserved based upon sediment trap information [Murray, 1987], and VN1-49GC which is at the CCD in the Holocene. Despite the dissolution effect superimposed primarily on 14GC and 49 GC, the records have similarities. Stage 5 is a calcite low in all records, and similarly, stage 6 is a high calcite interval. The records are most divergent from the Holocene to the stage 2/3 boundary, 24 ka. An extreme calcite depositional event is preserved in V19-28 but is missing in W8402A-14GC and VN1-49GC.
0 2 consumed for every •mol•g P remineralized; Takahashi et al. [1985]). Based upon these assumptions 208 I. unol•g 0 2 is consumed for every 1 ø•0 change in A-013C ). Virtually the same relationship can be established using an empirical fit to Kroopnick's [1974] eastern Pacific data.
We have set initial 0 2 at 350 I. unoles/kg of seawater based upon oxygen saturation data in Broecker and Peng [1982, p. 129], assuming that bottom waters are formed near 0øC. We have used the mean pre-formed 013 C from global GEOSECS data ( 1.47 %o; Kroopnick [1985]) for the Holocene preformed high-latitude 013C value. We have then used this to correct for vital effects in the 013C from N. pachyderma in MD80-304, a high latitude surface water 013C record. We have also used the planktic and benthic 013C records from core V19-30 [Shackleton and Pisias, 1985] to model deep water oxygen in the Peru Basin for the past 130 Kyr (Figure 9). The A-013C(init,T) was obtained by subtraction of the adjusted MD80-304 013C from an
adjusted Neo g loboquadrina dutertrei 013C record from V19-30. Because N. dutertrei typically lives within the thermocline and deposits calcite with the same 013C as surrounding waters, its tests are isotopically light when compared to/} 13 C in phosphate-free water [Faffbanks et al., 1982]. We have assumed that this has been systematic through time, and N. dutertrei fractionates carbon isotopes by 0.64 %0 with respect to lDhosphate-free surface waters, based upon the Holocene 0t3C measurements in V19-30. Thus we adjusted all A-013C values from V19-30 by this value before the conversion into the model oxygen record (Figure 9).
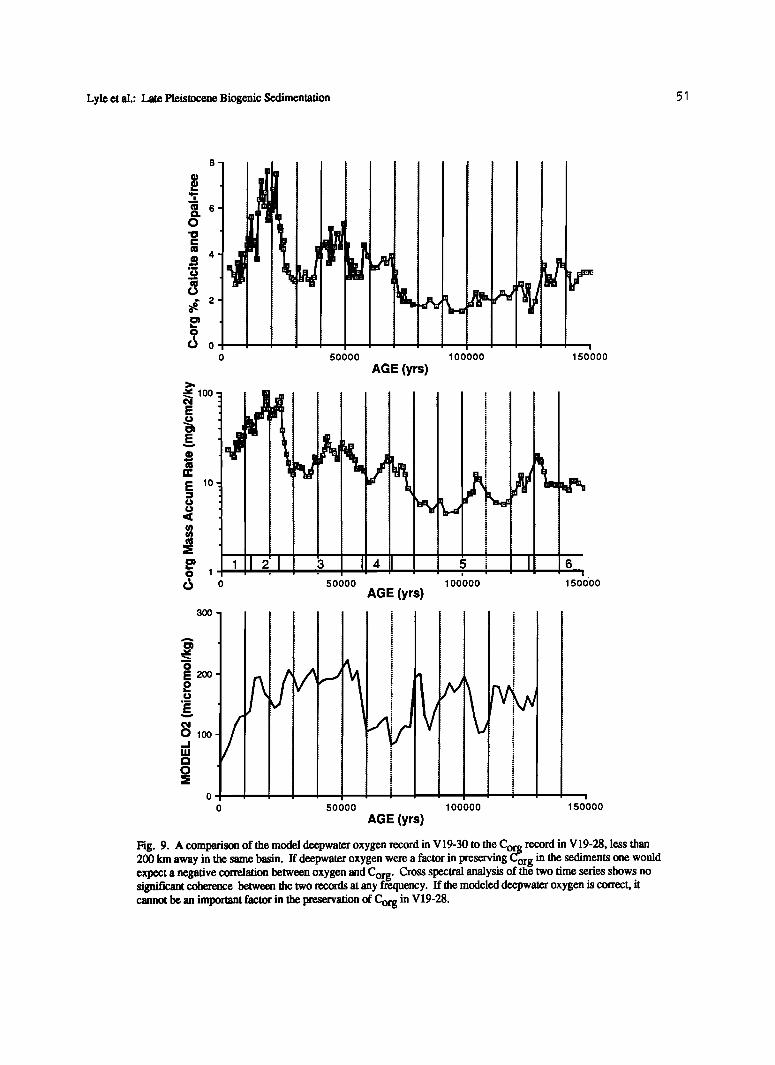
The creation of a model deepwater oxygen record for the Peru Basin allows us to compare 0 2 variations to the record of Corg deposition in V19-28, which is located only 200 km away f•om V19-30. Even a cursory examination of Figure 9 shows the lack of any strong correlation (r = 0.13 for
Corg%, calcite- and opal-free; r = 0.06 for Corg MAR).
Lyle et al.: Late Pleistocene Biogenic Sedimentation
8 -
0 50000 100000
AGE (yrs)
' •oo -:
• 5 i
C) 0 50000 100000 AGE (yrs)
30o] 200-
lOO
o
100000
i
150000
6
150000
, !
0 50000 150000
AGE (yrs)
Fig. 9. A comparison of the model deepwater oxygen record in V19-30 to the Cor.• record in V19-28, less than 200 km away in the same basin. If deepwater oxygen were a factor in preserving Corg in the sediments one would expect a negative correlation between oxygen and Corg. Cross spectral analysis of the two time series shows no significant coherence between the two records at any frequency. If the modeled deepwater oxygen is correct, it cannot be an important factor in the preservation of Corg in V19-28.
5 2 Lyle et al.: Late Pleistocene Biogenic Sedimentation
Cross-spectral analysis of the model oxygen profile and that
of the Corg mass accumulation rate leads to the same conclusion: there is no significant coherence between the two records at any frequency. If we have correctly modeled the deepwater oxygen record in the Peru Basin, then deepwater oxygen content is unimportant in the preservation of Corg for cores in this region.
The haodel oxygen record is only a first approximation of deepwater oxygen. We assumed that the planktic Foraminifera recorded a signal that can be converted to nutdent-free sea water in V19-30 and to high-latitude surface water in MD80-304. Both of these assumptions could superimpose significant changes upon the model oxygen record. We examined whether the high- latitude surface water record could have destroyed coherence between the MAR Corg _ record and the model oxygen record by constructing a second oxl(gen model assuming a constant high latitude preformed i• lac. The results were the same as for the model presented above--there was no significant coherence between oxygen
and Corg MAR. The 'nutdent-free surface water' record from V19-30 has
now been tested using equatorial Atlantic and Sargasso Sea cores [Curry and Crowley, 1987]. Records of A-i•13C generated from these surface-water i• 13C records and the V19-30 benthic i•13C record have basically the same form as the record published by Shackleton and Pisias [ 1985] but have a glacial amplitude about 0.2-0.3 %0 less. Such a difference implies higher oxygen in glacial deep waters in the Peru Basin than we have estimated.
The benthic Foraminifera Uvigerina senticosa used for the benthic record in V 19-30 is known to live within the bottom
sediments and to incorporate porewater carbon into its test. Because the pore waters of the sediments can have a different i•13C value than the surrounding deep waters, the species may record a contaminated signal of deep-water i•13C [McCorkle et al., 1985]. The primary cause of the difference between pore water and deep water i• 13 C is the addition of light carbon to the pore water pool through the degradation of C r Thus high depositional episodes of C r which also og' og, should have the highest proportion of organic matter degraded within the sediments, will have the most extreme negative excursions of 313C in the pore waters. Such excursions will mimic the consumption of oxygen in deep waters and will tend to force the model oxygen record to correlate with
episodes of high Corg deposition, whether or not deepwater oxygen actually did change. This process should actually introduce coherence between the model deepwater oxygen
record and the record of Corg deposition, which we do not observe.
The lack of coherence between our model deepwater oxygen record and the record of Cor • deposition in V19-28 implies that the Corg deposition is 15rimarily controlled in the core by the Cor g rain from the euphotic zone, that is, paleoprodu'•tivity. Although organic matter degradation processes must be better understood before we can state the precise relationship between Corg preservation and productivity, we can still use th•Corg records as a semiquantitative measure of fluxes fro-m the euphotic zone in the eastern equatorial Pacific. We will apply this logic in our comparison of the calcite, opal, and Corg records in the next section.
COMPARISONS OF Corg, OPAL, AND CALCITE RECORDS FROM V19-28
The downcore records of calcite, opal, and Corg content are shown in Figures 10 and 11, presented on an opal-free, calcite-free, and calcite- and opal-free basis, respectively. Presentation of the data in this manner eliminates
dilution-imposed negative correlations between the biogenic fractions and does not introduce the positive correlations inherent in mass accumulation rate data due to the
multiplication of each data set by a common sedimentation rate. It is especially well suited for the data from V19-28 since the detdtal, or nonbiogenic fraction in this core is on the average about 30% of the total sediment and changes little downcore. In additon, opal contents are sufficiently high to actually dilute the calcite content of the core, helping to increase the negative correlation between the two raw records. Highest opal contents are found between 45 and 55 ka and reach 31.3 % of the total sediment or about 55% of the
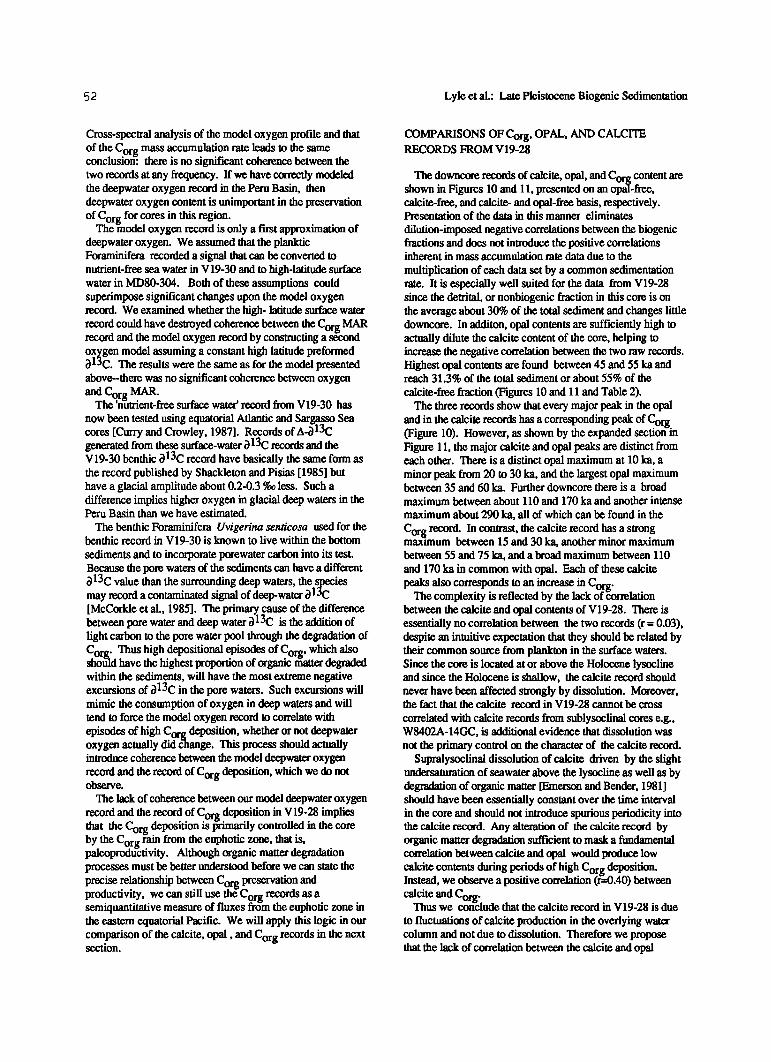
calcite-free fraction (Figures 10 and 11 and Table 2). The three records show that every major peak in the opal
and in the calcite records has a corresponding peak of Corg (Figure 10). However, as shown by the expanded section in Figure 11, the major calcite and opal peaks are distinct from each other. There is a distinct opal maximum at 10 ka, a minor peak from 20 to 30 ka, and the largest opal maximum between 35 and 60 ka. Further downcore there is a broad maximum between about 110 and 170 ka and another intense
maximum about 290 ka, all of which can be found in the
Corg record. In contrast, the calcite record has a strong maxunum between 15 and 30 ka, another minor maximum between 55 and 75 ka, and a broad maximum between 110
and 170 ka in common with opal. Each of these calcite peaks also corresponds to an increase in Corg.
The complexity is reflected by the lack of •orrelation between the calcite and opal contents of V19-28. There is essentially no correlation between the two records (r = 0.03), despite an intuitive expectation that they should be related by their common source from plankton in the surface waters. Since the core is located at or above the Holocene lysocline and since the Holocene is shallow, the calcite record should never have been affected strongly by dissolution. Moreover, the fact that the calcite record in V19-28 cannot be cross
correlated with calcite records from sublysoclinal cores e.g., W8402A-14GC, is additional evidence that dissolution was not the primary control on the character of the calcite record.
Supralysoclinal dissolution of calcite driven by the slight undersaturation of seawater above the lysocline as well as by degradation of organic matter [Emerson and Bender, 1981] should have been essentially constant over the time interval in the core and should not introduce spurious periodicity into the calcite record. Any alteration of the calcite record by organic matter degradation sufficient to mask a fundamental correlation between calcite and opal would produce low calcite contents during periods of high Cot deposition g ß Instead, we observe a positive correlation (f=0.40) between
calcite and Corg. Thus we conclude that the calcite record in V19-28 is due
to fluctuations of calcite production in the overlying water column and not due to dissolution. Therefore we propose that the lack of correlation between the calcite and opal
Lyle et al.: Late Pleistocene Biogenic Sedimentation 5 3
70-
50
•o
30
20
•o
0 50000 100000 150000 200000 250000
ß i
300000
8 -
90-
80
a. 7o o
o
<o so
50
1.12.1..3 [4.1 0 50000 100000 150000 200000 250000 300000
0 50000 100000 150000 200000 250000 AGE (YRS)
300•)00
Fig. 10. The records of calcite, opal, and Corg in V19-28, presented on an opal-free, calcite-free, and calcite- and opal-free basis, respectively. This mode of presentation eliminates negative correlations between the records due to dilution by the other components. It can be seen from the records that calcite and opal peaks are represented as peaks in the Corg record, but there is litde correlation between the calcite and opal records themselves.
records results from the existence of at least two partially exclusive plankton communities that have occupied the waters above V19-28 through time. We hypothesize, as has commonly been observed in the modern oceans, that one plankton community is highly productive of opal, and may be rich in diatoms and Radiolaria, while the other is rich in calcite producers (coccolithophorids and Foraminifera). Both of these communities can be associated with high primary
productivity, as is witnessed by the positive correlation of skeletal material with Corg.
Prediction of Corg from Calcite and Opal
Because both the calcite and opal records in V 19-28 are productivity-related and not controlled by degradation processes and because calcite and opal are uncorrelated, we
5q Lyle et al.: Late Pleistocene Biogenic Sedimentation
70
50-
40
30
20
10
0 50000 100000
8
50000 100'000
LU LU
n_ 70 o
o
90]
50
i i
i
0 50000 100'000 AGE (YES)
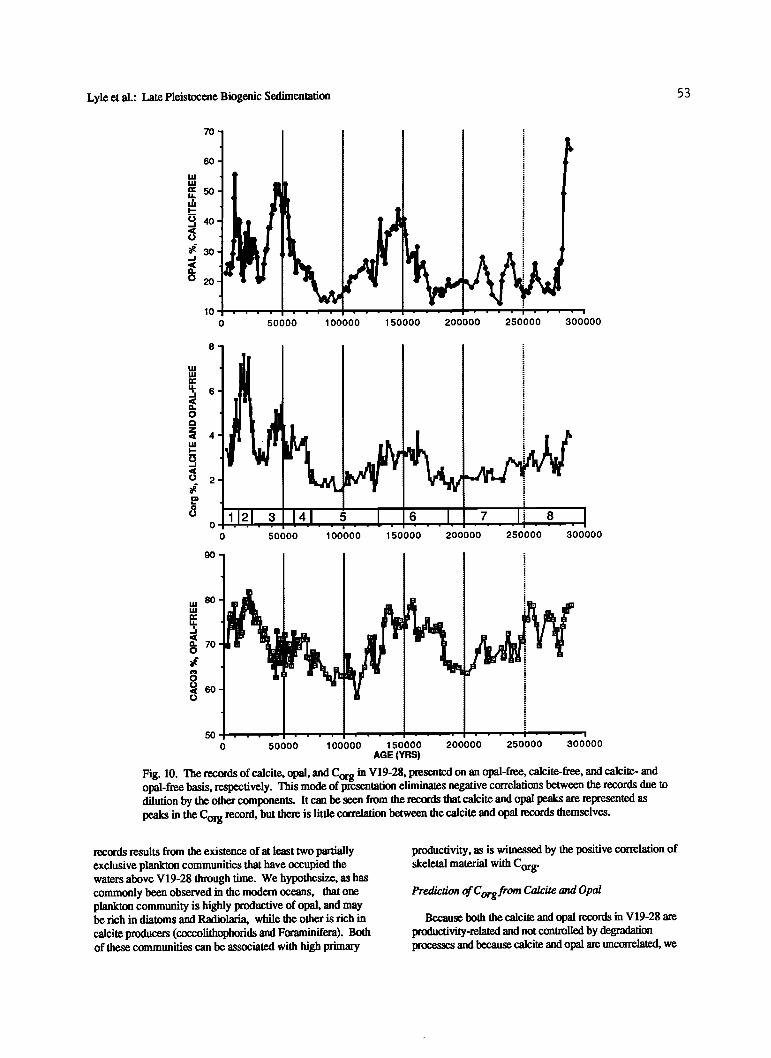
Fig. 11. An expanded section of the last 100 Kyr of the records shown in Figure 10, so that the features of each record can be viewed in detail.
should be able to predict the C content in the core based org _ upon the other two records. Accordingly we have performed a multiple linear regression between C and the calcite and org •, opal contents, all expressed on a biogenic-free basis. tne analysis indicates that calcite accounts for 35% of the total variance of the Corg record, and opal accounts for an additional 14% of •e variance. The final regression, with a multiple correlation coefficient of 0.697 is as follows:
Corg = 0.107*CaCO 3 + 0.0412'Opal - 5.67
where Corg is expressed on a calcite and opal-free basis, CaCO 3 is expressed on an opal-free basis, and Opal is opaline SiO 2 expressed on a calcite-free basis. The standard error of the estimate is 0.87 % Corg. Figure 12 shows a comparison between the predicted and the measured Corg contents in V19-28, as well as the residuals from the
Lyle et al.: Late Pleistocene Biogenic Sedimentation 55
•6
-2
•'• C)BSERVED
. i j• ESTIMATED i I,
' I -'
ß ' ' ' I ' ' ' ' I ' ß ' ß
0 500 1000 1500 Sample Depth (cm)
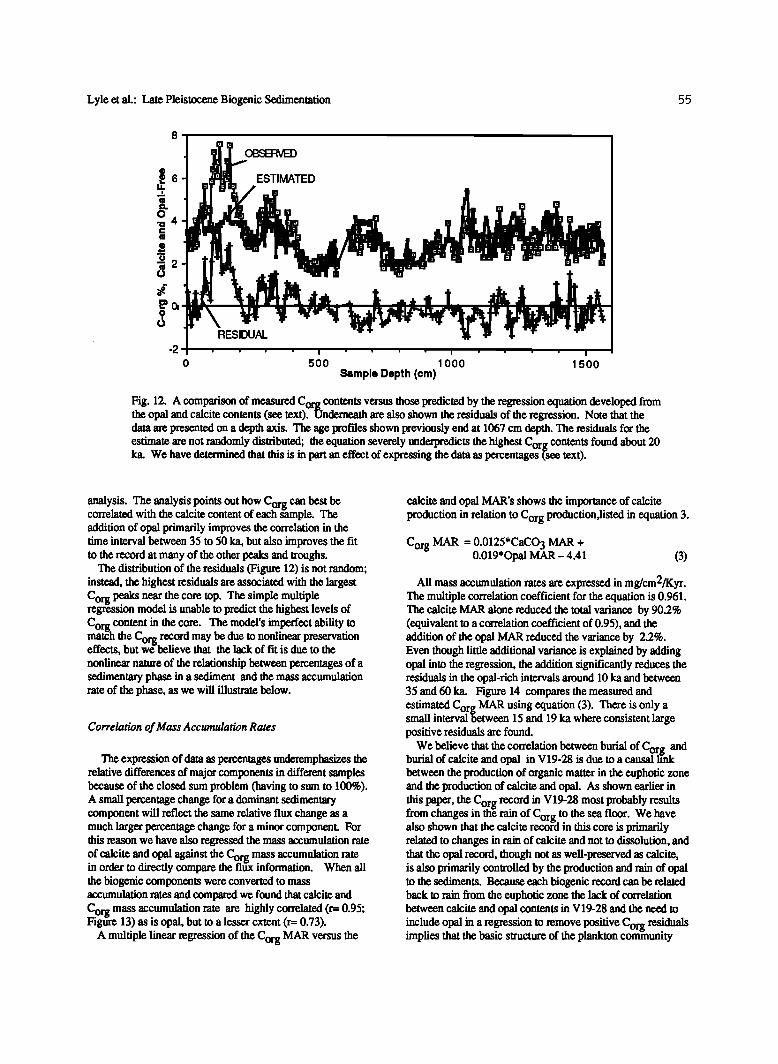
Fig. 12. A comparison of measured Corg contents versus those predicted by the regression equation developed from the opal and calcite contents (see text). Underneath are also shown the residuals of the regression. Note that the data are presented on a depth axis. The age profries shown previously end at 1067 cm depth. The residuals for the
estimate are not randomly distributed; the equation severely underpredicts the highest Corg contents found about 20 ka. We have determined that this is in part an effect of expressing the data as percentages (see tex0.
analysis. The analysis points out how Corg can best be correlated with the calcite content of each •rnple. The addition of opal primarily improves the correlation in the time interval between 35 to 50 ka, but also improves the fit to the record at many of the other peaks and troughs.
The distribution of the residuals (Figure 12) is not random; instead, the highest residuals are associated with the largest
Corg peaks near the core top. The simple multiple regression model is unable to predict the highest levels of C r content in the core The model's imperfect ability to og ' match the Corg record may be due to nonlinear preservation effects, but wSbelieve that the lack of fit is due to the nonlinear nature of the relationship between percentages of a sedimentary phase in a sediment and the mass accumulation rate of the phase, as we will illustrate below.
Correlation of Mass Accumulation Rates
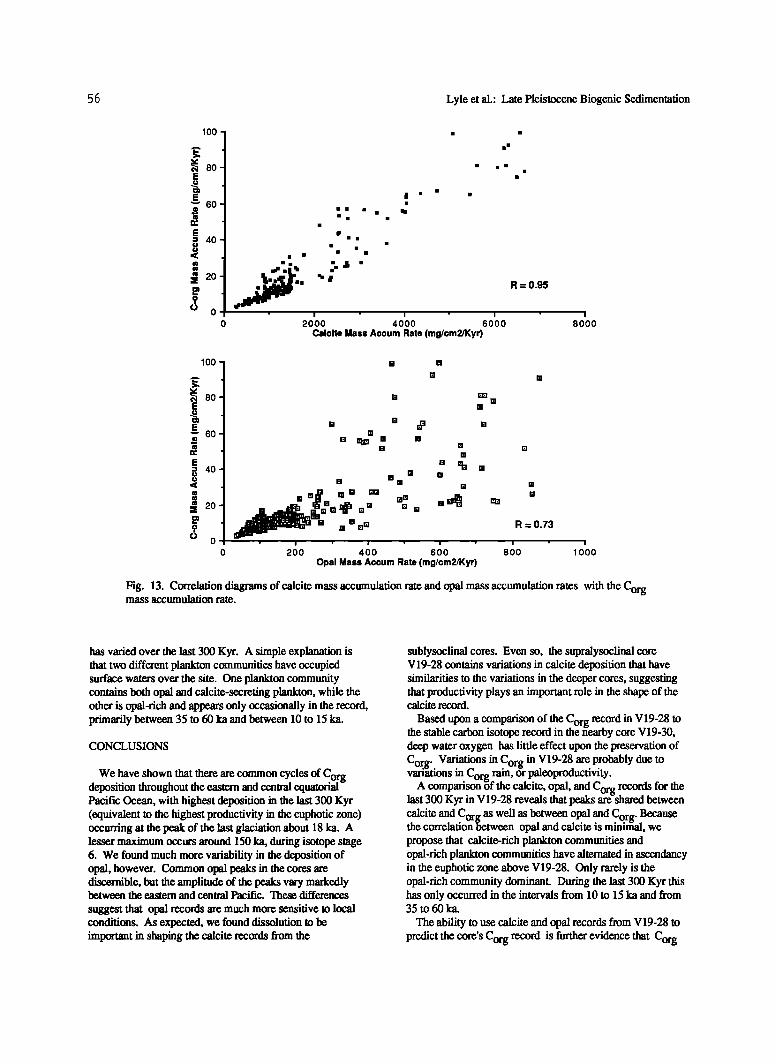
The expression of data as percentages underemphasizes the relative differences of major components in ddferent samples because of the closed sum problem (having to sum to 100%). A small percentage change for a dominant sedimentary component will reflect the same relative flux change as a much larger percentage change for a minor component. For this reason we have also regressed the mass accumulation rate of calcite and opal against the Corg mass accumulation rate in order to directly compare the fiu-x information. When all the biogenic components were converted to mass accumulation rates and compared we found that calcite and C r mass accumulation rate are highly correlated (r=- 0.95; og Figure 13) as is opal, but to a lesser extent (r=- 0.73).
A multiple linear regression of the Corg MAR versus the
calcite and opal MAR's shows the importance of calcite
production in relation to Corg production,listed in equation 3.
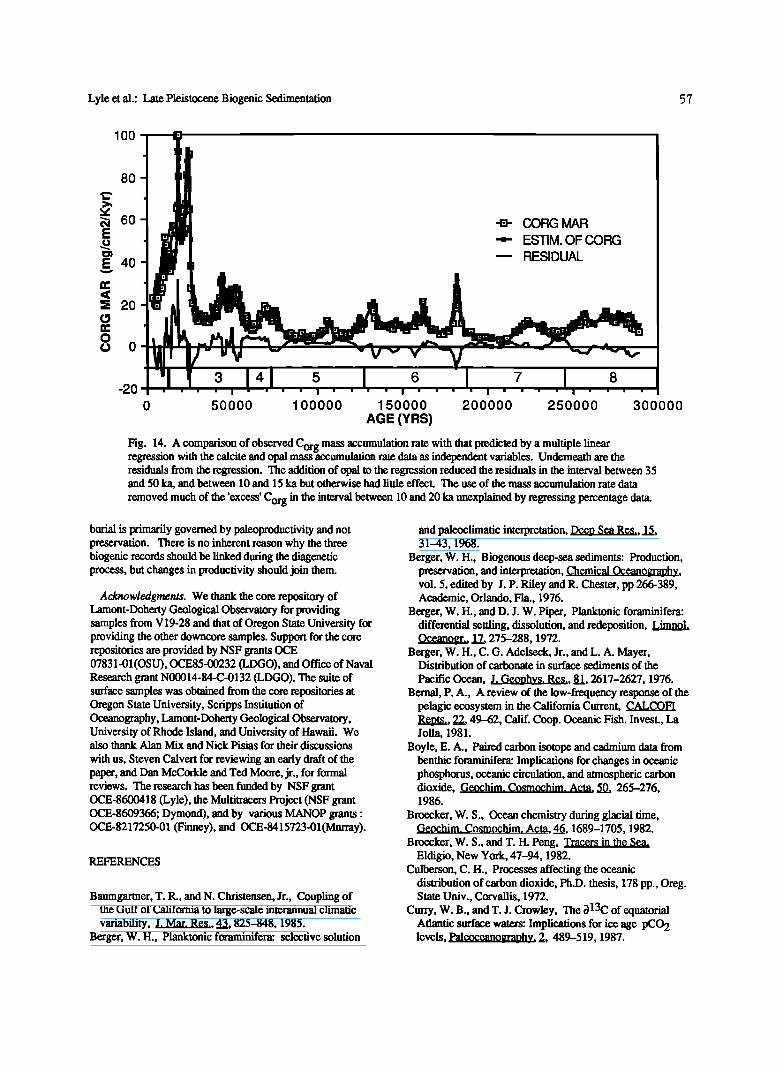
Corg MAR = 0.0125'CACO 3 MAR + 0.019*Opal MAR - 4.41 (3)
All mass accumulation rates are expressed in mg/cm2/Kyr. The multiple correlation coefficient for the equation is 0.961. The calcite MAR alone reduced the total variance by 90.2% (equivalent to a correlation coefficient of 0.95), and the addition of the opal MAR reduced the variance by 2.2%. Even though little additional variance is explained by adding opal into the regression, the addition significantly reduces the residuals in the opal-rich intervals around 10 ka and between 35 and 60 ka. Figure 14 compares the measured and
estimated Corg MAR using equation (3). There is only a small interval between 15 and 19 ka where consistent large positive residuals are found.
We believe that the correlation between burial of Cor e and burial of calcite and opal in V19-28 is due to a causal fi'nk between the production of organic matter in the euphotic zone and the production of calcite and opal. As shown earlier in this paper the C r record in V19-28 most probably results , og from changes in the rain of Corg to the sea floor. We have also shown that the calcite reCOld in this core is primarily related to changes in rain of calcite and not to dissolution, and that the opal record, though not as well-preserved as calcite, is also primarily controlled by the production and rain of opal to the sediments. Because each biogenic record can be related back to rain from the euphotic zone the lack of correlation between calcite and opal contents in V19-28 and the need to
include opal in a regression to remove positive Corg residuals implies that the basic structure of the plankton community
56 Lyle et al.: Late Pleistocene Biogenic Sedimentation
100 -
80
60
40
20
0
0
ß
ßß
ß ß ß
1
ß ß
ß ß
ß ß ß
ß ; ß •a
,,
ß ' ' •l½ite Mass Aceurn Rate (mg/cm•Kyr)
R = 0.95
8o'oo
lOO
• 80 E
E '-' 60
E :3 40
:• 20
o o
[] []
[]
[]
[]
[] []
[] [] [] []
m[] mE] Ell El m .l•m Eta la þm •• [] an R = 0.73
ß i ß i ß i ß i ß i 0 0 200 400 600 800 10 0
Opal Mass Accum Rate (mg/cm2/Kyr)
Fig. 13. Correlation diagrams of calcite mass accumulation rate and opal mass accumulation rates with the Corg mass accumulation rate.
has varied over the last 300 Kyr. A simple explanation is that two different plankton communities have occupied surface waters over the site. One plankton community contains both opal and calcite-secreting plankton, while the other is opal-rich and appears only occasionally in the record, primarily between 35 to 60 ka and between 10 to 15 ka.
CONCLUSIONS
We have shown that there are common cycles of Corg deposition throughout the eastern and central equatorial Pacific Ocean, with highest deposition in the last 300 Kyr (equivalent to the highest productivity in the euphotic zone) occurring at the peak of the last glaciation about 18 ka. A lesser maximum occurs around 150 ka, during isotope stage 6. We found much more variability in the deposition of opal, however. Common opal peaks in the cores are discernible, but the amplitude of the • vary markedly between the eastern and central Pacific. These differences
suggest that opal records are much more sensitive to local conditions. As expected, we found dissolution to be important in shaping the calcite records from the
sublysoclinal cores. Even so, the supralysoclinal core V 19-28 contains variations in calcite deposition that have similarities to the variations in the deeper cores, suggesting that productivity plays an important role in the shape of the calcite record.
Based upon a comparison of the Cor record in V19-28 to g the stable carbon isotope record in the nearby core V19-30, deep water oxygen has little effect upon the preservation of C r Variations in Cor in V19-28 are probably due to og- g variations in Corg rain, or paleoproductivity.
A comparison •f the calcite opal, and Corg records for the last 300 Kyr in V19-28 reveals that peaks are shared between
calcite and Corg as well as between opal and Corg. Because the correlation between opal and calcite is minitrial, we propose that calcite-rich plankton communities and opal-rich plankton communities have alternated in ascendancy in the euphotic zone above V19-28. Only rarely is the opal-rich community dominant. During the last 300 Kyr this has only occurred in the intervals from 10 to 15 ka and from 35 to 60ka.
The ability to use calcite and opal records from V19-28 to
predict the core's Corg record is further evidence that Corg
Lyle et al.: Late Pleistocene Biogenic Sedimentation 5 7
lOO
80
60
40
2O
0
-20
i ..el- CORG MAR i --- ESTIM. OF CORG
-- RESIDUAL , i
I
ß, __
V{ t-"v " -3/ - '"'-"-'" "1 {41 I I I ' ' ß ' I ' ' ' I ' ' ' ' I ' ' ' ß I ß ' ' ' I ' ' ' '
0 50000 100000 150000 200000 250000 300000 AGE (YRS)
Fig. 14. A comparison of observed Corg mass accumulation rate with that predicted by a multiple linear regression with the calcite and opal massb, ccumulation rate data as independent variables. Underneath are the residuals from the regression. The addition of opal to the regression reduced the residuals in the interval between 35 and 50 ka, and between 10 and 15 ka but otherwise had little effect. The use of the mass accumulation rate data
removed much of the 'excess' Corg in the interval between 10 and 20 ka unexplained by regressing percentage data.
burial is primarily governed by paleoproductivity and not preservation. There is no inherent reason why the three biogenic records should be linked during the diagenetic process, but changes in productivity should join them.
Acknowledgments. We thank the core repository of Lamont-Doherty Geological Observatory for providing samples from V19-28 and that of Oregon State University for providing the other downcore samples. Support for the core repositories are provided by NSF grants OCE 07831-01(OSU), OCE85-00232 (LDGO), and Office of Naval Research grant N00014-84-C-0132 (LDGO). The suite of surface samples was obtained from the core repositories at Oregon State University, Scripps Institution of Oceanography, Lamont-Doherty Geological Observatory, University of Rhode Island, and University of Hawaii. We also thank Alan Mix and Nick Pisias for their discussions
with us, Steven Calvert for reviewing an early draft of the paper, and Dan McCorkle and Ted Moore, jr., for formal reviews. The research has been funded by NSF grant OCE-8600418 (Lyle), the Multitracers Project (NSF grant OCE-8609366; Dymond), and by various MANOP grants: OCE-8217250-01 (Finney), and OCE-8415723-01 (Murray).
REFERENCES
Baumgartner, T. R., and N. Christensen, Jr., Coupling of the Gulf of California to large-scale interannual climatic variability, J. Mar. Res., 43,825-848, 1985.
Berger, W. H., Planktonic foraminifera: selective solution
and paleoclimatic interpretation, Deed Sea Res., 15, 31-43, 1968.
Berger, W. H., Biogenous deep-sea sediments: Production, preservation, and interpretation, Chemical Oceano•aphy, vol. 5, edited by J.P. Riley and R. Chester, pp 266-389, Academic, Orlando, Fla., 1976.
Berger, W. H., and D. J. W. Piper, Planktonic foraminifera: differential settling, dissolution, and redeposition, Limnol. Oceano•., 17, 275-288, 1972.
Berger, W. H., C. G. Adelseck, Jr., and L. A. Mayer, Distribution of carbonate in surface sediments of the
Pacific Ocean, J. Geophys. Res., 81, 2617-2627, 1976. Bernal, P. A., A review of the low-frequency response of the
pelagic ecosystem in the Califomia Current, CALCOFI Repts., 22, 49-62, Calif. Coop. Oceanic Fish. Invest., La Jolla, 1981.
Boyle, E. A., Paired carbon isotope and cadmium data from benthic foraminifera: Implications for changes in •ic phosphorus, oceanic circulation, and atmospheric carbon dioxide, Geochim. Cosmochim. AC•, 50, 265-276, 1986.
Broecker, W. S., Ocean chemistry during glacial time, Geochim. Cosmochim, Acta, 46, 1689-1705, 1982.
Broecker, W. S., and T. H. Peng, Tracers in the Sea. Eldigio, New York, 47-94, 1982.
Culberson, C. H., Processes affecting the oceanic distribution of carbon dioxide, Ph.D. thesis, 178 pp., Oreg. State Univ., Corvallis, 1972.
Curry, W. B., and T. J. Crowley, The •}13C of equatorial Atlantic surface waters: Implications for ice age pCO 2 levels, Paleoceanography, 2, 489-519, 1987.
58 Lyle et al.: Late Pleistocene Biogenic Sedimentation
Deuser, W. G., E. H. Ross, and R. F. Anderson, Seasonality in the supply of sediment to the deep Sargasso Sea and implications for the rapid transfer of matter to the deep ocean, Deep-Sea Res., 2•IA, 495-505, 1981.
Drexler, J. W., W. I. Rose, Jr., R. S. J. Sparks, and M. T. Ledbetter, The Los Chocoyos ash, Guatemala: a major stratigraphic marker in middle America and in three ocean basins. Ouat. Res., 13, 327-345, 1980.
Dunbar, R. B., and W. H. Berger, Fecal pellet flux to modem bottom sediment of Santa Barbara Basin
(California) based upon sediment trapping, Geol. Soc. Am. Bull., 92, 212-218, 1981.
Dymond, J., and M. Lyle, Flux comparisons between sediments and sediment traps in the eastern tropical Pacific: Implications for atmospheric CO 2 variations in the Pleistocene. Limnol. Oceanogr., 30, 699-712, 1985.
Emerson, S., Organic carbon preservation in marine
sediments, The Carbon Cycle and Atmospheric CO.• Natural Variations Archeart to Present, edited by E. T. Sundquist and W. S. Broecker, pp. 78-89, AGU, Washington, D.C., 1985.
Emerson, S., and M. Bender, Carbon fluxes at the sediment-water interface of the deep-sea: Calcium carbonate preservation. J. Mar. Res., 39, 139-161, 1981.
Emerson, S., K. Fischer, C. Reimers, and D. Heggie, Organic carbon dynamics and preservation in deep-sea sediments. Deep Sea Res., 32, 1-21, 1985.
Fairbanks, R. G., M. Sverdlove, R. Free, P. H. Wiebe, and A. W. H. Be, Vertical distribution and isotopic fractionation of living planktonic foraminifera from the Panama Basin, Nature, 298, 841-844, 1982.
Finney, B. P., Paleoclimatic influence on sedimentation and manganese nodule growth during the past 400,000 years at MANOP site H (eastern equatorial Pacific), Ph.D. thesis, 195 pp., Oreg. State Univ., Corvallis, 1986.
Fischer, K., Particle fluxes in the eastern tropical Pacific Ocean--sources and processes, Ph.D. thesis, 225 pp., Oreg. State Univ., Corvallis, 1983.
Gardner, J. V., High-resolution carbonate and organic-carbon stratigraphies for the late Neogene and Quaternary from the western Caribbean and eastern equatorial Pacific. Initial Rep. Deep Sea Drill. Pro_i, 68, 347-365, 1982.
Heath, G. R., and C. Culberson, Calcite: degree of saturation, rate of dissolution, and the compensation depth in the deep oceans, Geol. Soc. Am. Bull., 81, 3157-3160, 1970.
Heath, G. R., T. C. Moore, Jr., and J.P. Dauphin. Organic carbon in deep-sea sediments, The Flt[• of Fossil Fuel CO2 in the Oceans. edited by N. R. Andersen and A. Malahoff, Plenum, New York, 605-625, 1977.
Honjo, S., Material fluxes and modes of sedimentation in the mesopelagic and bathypelagic zones, J. Mar. Res., 38, 53-97, 1980.
Imbrie, J., J. D. Hays, D. G. Martinson, A. Mcintyre, A. C. Mix, J. J. Morley, N. G. Pisias, W. L. Prell, and N.J. Shackleton, The orbital theory of Pleistocene climate: support from a revised chronology of the marine/} 18 0 record, Milankovitch and Climate. part I, edited by A. L. Berger, pp. 269-305, D. Reidel, Hingham, Mass., 1984.
Kadko, D., and G.R. Heath, Models of depth-dependent
bioturbation at MANOP site H in the eastern equatorial Pacific, J. Geop_ hys. Res., 89, 6567-6570, 1984.
Kroopnick, P.M., The dissolved O2-CO 2-13 C system in the eastern equatorial Pacific, Dee•Sea Res., 21, 211-227, 1974.
Kroopnick, P.M., The distribution of 13 C and of Y. CO 2 in the world oceans, Deep Sea Res., 32, 57-77, 1985.
Labeyrie, L. D. and J. C. Duplessy, Changes in the oceanic 13C/12C ratio during the last 140,000 years: High-latitude surface water records, Palaeogeogr. Paleaoclimatol. Paleoeg9!,, 50, 217-240, 1985.
Ledbetter, M. T., Tephrochronology of marine tephra adjacent to Central America, Geol. Soc. Am. Bull., 96, 77-82, 1985.
Lyle, M., G. R. Heath, and J. M. Robbins, Transport and release of transition elements during early diagenesis: Sequential leaching of sediments from MANOP sites M and H. Part I. pH 5 acetic acid leach, Geochim. Cosmochim. Acta,, 48, 1705-1715, 1984.
Martinson, D. G., N. G. Pisias, J. D.Hays, J. Imbrie, T. C. Moore, Jr., and N.J. Shackleton, Age dating and the orbital theory of the ice ages: Development of a high-resolution 0 to 300,000-year chronostratigraphy, Ouat. Res., 27, 1-29, 1987.
Martinson, D. G., W. Menke, and A. Stoffa, An inverse approach to signal correlation, J. Geophys. Res, 87, 4807-4818, 1982.
McCorkle, D.C., S. R. Emerson, and P. D. Quay, Stable carbon isotopes in marine porewaters. Earth Plan. $ci. Lett, 74, 13-27, 1985.
Mtiller, P.J., and E. Suess, Productivity, sedimentation rate, and sedimentary organic matter in the oceans I. Organic carbon preservation. Deep Sea Res., 26A, 1347-1362, 1979.
Mtiller, P.J., H. Erlenkeuser, and R. von Grafenstein, Glacial-Interglacial cycles in oceanic productivity inferred from organic carbon 6ontents in eastern north Atlantic sediment cores, Coastal Ur}welline. its Sediment Record
_ w
Part B: Sedimentary Records of Ancient Coastal Upwelling, edited by J. Thiede and E. Suess, Plenum, New York, NATO Conf. Ser., 10B, 365-398, 1983.
Murray, D. W., Spatial and temporal variations in sediment accumulation in the central tropical Pacific, Ph.D. thesis, Oreg. State Univ., Corvallis, 220 pp., 1987.
Ninkovich, D., and N.J. Shackleton, Distribution, stratigraphic position and age of ash layer "L" in the Panama Basin Region, Earth Planet. Sci. Lett., 27, 20-34, 1975.
Parker, F. L., and W. H. Berger, Faunal and solution patterns of planktonic foraminifera in surface sediments of the south Pacific, Deer} Sea Res., 18, 73-107, 1971.
_
Pedersen, T. F., Increased productivity in the eastern equatorial Pacific during the last glacial maximum (19,000 to 14,000 yr. b.p.), Geology, 1_.!.1, 16-19, 1983.
Pisias, N. G., D. G. Martinson, T. C. Moore Jr., N.J. Shackleton, W. Prell, J. Hays, and G. Boden, High resolution stratigraphic correlation of benthic oxygen isotopic records spanning the last 300,000 years, Mar, Geol., 56, 119-136, 1984.
Samtheim, M., K. Winn, and R. Zahn, Paleoproductivity of
Lyle et al.: Late Pleistocene Biogenic Sedimentation 5 9
oceanic upwelling and the effect on atmospheric CO 2 and climatic change during deglaciation times. Abrupt Climatic F,,haagg., edited by W. H. Berger and L. D. LaBe•e, D. Reidel, Hingham, Mass., NATO ASI Ser..C216, 311-341, 1987.
Schramm, C. T., Atmospheric and oceanic circulation in the east equatorial Pacific during the Late Quaternary, MS. thesis, Univ. of R. I., Kingston, 127 pp., 1983.
Shackleton, N.J., Carbon- 13 in Uvigerina' tropical rainforest history and the Equatorial Pacific carbonate dissolution cycles, The Fate of Fossil Fuel CO2 in the Oceans. edited by N. R. Andersen and A. Malahoff, Plenum, New York, 401-427, 1977.
Shackleton, N.J., and N. G. Pisias, Atmospheric carbon dioxide, orbital forcing, and climate. The Carbon Cycle nd Atmost>heric CO2: Natural Variations Archeart to
sent, e•lited by E?r. Sundquist and W. S. Broecker, pp. 303-317, AGU, Washington, D.C., 1985.
Takahashi, K., and S. Honjo, Vertical flux of radiolaria: A taxon-quantitative sediment trap study from the western tropical Atlantic. Micropaleontology, 27, 140-190, 1981.
Takahashi, T., W. S. Broecker, and S. Langer, Redfield ratio based on chemical data from isopycnal surfaces, J. Geot•hvs. Res., 90, 6907-6925, 1985.
_ _
Thunnell, R. C., and S. Honjo, Planktonic foraminiferal flux to the deep ocean: Sediment trap results from the tropical Atlantic and the central Pacific, Mar. Geol., 40, 237-253, 1981.
Weliky, K., E. Suess, C. A. Ungerer, P. J. Muller, and K. Fischer, Problems with accurate carbon measurements in marine sediments and water column particulates: a new approach, Limnol. Oceanogr., 28, 1252-1259, 1983.
K. Brooksforce, J. Dymond, B. P. Finney, M. Lyle, and J. M. Robbins, College of oceanography, Oregon State University, Corvallis, OR 97331.
D. W. Murray, Department of Geology, Brown University, Providence, R102912.
(Received June 12, 1987; revised December 29, 1987; accepted January 5, 1988.)
Copyright © 2022 FDOKUMEN