the recent history of forest cover in - Open Collections
110
TESTING ASSUMPTIONS: THE RECENT HISTORY OF FOREST COVER IN NAKAI-NAM THEUN NATIONAL PROTECTED AREA, LAOS by William G. Robichaud A THESIS SUBMITTED IN PARTIAL FULFILLMENT OF THE REQUIREMENTS FOR THE DEGREE OF MASTER OF SCIENCE in THE FACULTY OF GRADUATE STUDIES (Zoology) THE UNIVERSITY OF BRITISH COLUMBIA September 2005 © William G. Robichaud, 2005
-
Upload
khangminh22 -
Category
Documents
-
view
0 -
download
0
Transcript of the recent history of forest cover in - Open Collections
T E S T I N G A S S U M P T I O N S : T H E R E C E N T H I S T O R Y O F F O R E S T C O V E R IN
N A K A I - N A M T H E U N N A T I O N A L P R O T E C T E D A R E A , L A O S
by
Wi l l iam G . Rob ichaud
A T H E S I S S U B M I T T E D IN P A R T I A L F U L F I L L M E N T
O F T H E R E Q U I R E M E N T S F O R T H E D E G R E E O F
M A S T E R O F S C I E N C E
in
T H E F A C U L T Y O F G R A D U A T E S T U D I E S
(Zoology)
T H E U N I V E R S I T Y O F BRIT ISH C O L U M B I A
September 2005
© Wil l iam G . Rob ichaud, 2005
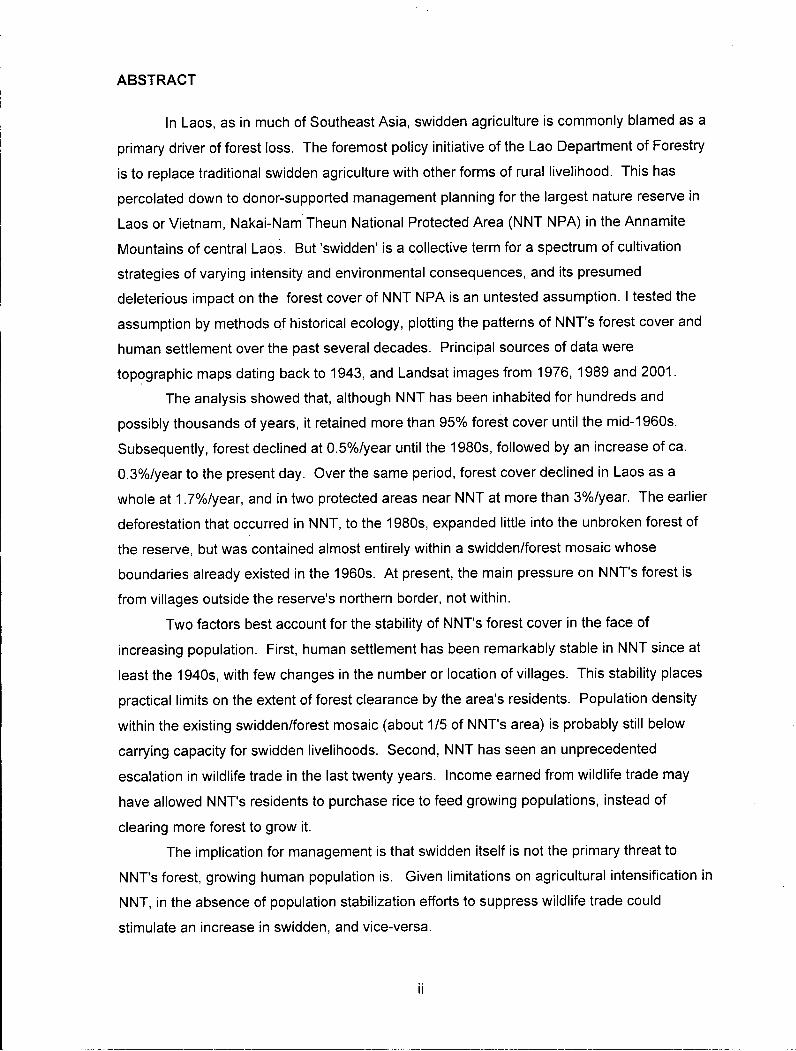
ABSTRACT
In Laos, as in much of Southeast Asia, swidden agriculture is commonly blamed as a
primary driver of forest loss. The foremost policy initiative of the Lao Department of Forestry
is to replace traditional swidden agriculture with other forms of rural livelihood. This has
percolated down to donor-supported management planning for the largest nature reserve in
Laos or Vietnam, Nakai-Nam Theun National Protected Area (NNT NPA) in the Annamite
Mountains of central Laos. But 'swidden' is a collective term for a spectrum of cultivation
strategies of varying intensity and environmental consequences, and its presumed
deleterious impact on the forest cover of NNT NPA is an untested assumption. I tested the
assumption by methods of historical ecology, plotting the patterns of NNT's forest cover and
human settlement over the past several decades. Principal sources of data were
topographic maps dating back to 1943, and Landsat images from 1976, 1989 and 2001.
The analysis showed that, although NNT has been inhabited for hundreds and
possibly thousands of years, it retained more than 95% forest cover until the mid-1960s.
Subsequently, forest declined at 0.5%/year until the 1980s, followed by an increase of ca.
0.3%/year to the present day. Over the same period, forest cover declined in Laos as a
whole at 1.7%/year, and in two protected areas near NNT at more than 3%/year. The earlier
deforestation that occurred in NNT, to the 1980s, expanded little into the unbroken forest of
the reserve, but was contained almost entirely within a swidden/forest mosaic whose
boundaries already existed in the 1960s. At present, the main pressure on NNT's forest is
from villages outside the reserve's northern border, not within.
Two factors best account for the stability of NNT's forest cover in the face of
increasing population. First, human settlement has been remarkably stable in NNT since at
least the 1940s, with few changes in the number or location of villages. This stability places
practical limits on the extent of forest clearance by the area's residents. Population density
within the existing swidden/forest mosaic (about 1/5 of NNT's area) is probably still below
carrying capacity for swidden livelihoods. Second, NNT has seen an unprecedented
escalation in wildlife trade in the last twenty years. Income earned from wildlife trade may
have allowed NNT's residents to purchase rice to feed growing populations, instead of
clearing more forest to grow it.
The implication for management is that swidden itself is not the primary threat to
NNT's forest, growing human population is. Given limitations on agricultural intensification in
NNT, in the absence of population stabilization efforts to suppress wildlife trade could
stimulate an increase in swidden, and vice-versa.
ii
T A B L E OF CONTENTS
A B S T R A C T ii
TABLE OF CONTENTS iii
LIST OF TABLES: v
LIST OF FIGURES: vi
P R E F A C E vii
A C K N O W L E D G E M E N T S viii
1 INTRODUCTION 1 1.1 Forest Loss in Southeast Asia 1 1.2 Swidden Agriculture 2
1.2.1 Overview 2 1.2.2 Swidden In Laos 4
1.3 Historical Ecology 5 1.4 The Research Questions 6
2 THE STUDY A R E A : NAKAI-NAM THEUN NPA 9 2.1 Area of Analysis 9 2.2 Physical Geography 9
2.2.1 Land 9 2.2.2 Climate 12
2.3 Biodiversity 13 2.3.1 Overview 13 2.3.2 Flora 14 2.3.3 Fauna 16
2.4 Human Geography 18 2.4.1 Ethnic diversity and livelihoods 18 2.4.2 Some determinants of human distribution in NNT 22
2.5 Management 24
3 METHODS 26 3.1 Potential Sources of Data 26
3.1.1 Introduction 26 3.1.2 Paper topographic maps 26 3.1.3 Aerial photographs 29 3.1.4 Satellite imagery 29
3.1.4.1 Corona 29 3.1.4.2 Landsat 30 3.1.4.3 SPOT 31
3.1.5 Local informants and field observations 31 3.1.6 Written records 32 3.1.7 Conclusion 33
3.2 Analysis of Geodata 34 3.2.1 Topographic Maps 34 3.2.2 Landsat 38 3.2.3 Calculations 43
iii

4 FINDINGS 45 4.1 Trends in Forest Cover in NNT 45
4.1.1 Topographic maps uncorrected for scale 45 4.1.2 . Topographic maps corrected for scale 47 4.1.3 Convex hulls analysis 48 4.1.5 Landsat 56 4.1.6 Summary 58
4.2 Trends in Forest Type 58 4.3 Trends in Forest Cover Nationally 59 4.4 Trends in Other Biodiversity in NNT 60 4.5 Distribution of Biota of Conservation Priority 63 4.6 Trends in Human Distribution 65
5 DISCUSSION 67 5.1 Explaining the Trends in NNT's Forest Cover 67
5.1.1 Introduction 67 5.1.2 Pre-1980s decline in forest cover 67 5.1.3 Post 1980s stability of forest cover 70
5.2 Implications for the Conservation of Nakai-Nam Theun 75 5.2.1 Some guidelines for management 75 5.2.2 Geographic priorities for management 80 5.2.3 Research priorities 86
5.3 Errors, Biases and Uncertainties 87
6 CONCLUSION 90
R E F E R E N C E S 92
iv

LIST OF T A B L E S :
Table 2.1: Seasons of Laos 12 Table 2.2: Larger mammals recently described from the Annamites and their occurrence in NNT NPA 18 Table 3.1: Attributes of topographic maps of NNT NPA 28 Table 3.2: Summary of topographic map habitat groupings 35 Table 3.3: Combinations of maps compared for habitat areas 38 Table 3.4: Landsat images analyzed 39 Table 3.5: Sizes of NNT's watersheds within the areas of analysis 44 Table 4.1: Dense forest mapped within full area of NNT, 1960s and 1981 45 Table 4.2: All forest mapped within full area of NNT, 1960s and 1981 46 Table 4.3: Dense forest mapped within area covered by 1992/93 maps 46 Table 4.4: All forest mapped within area covered by 1992/93 maps 46 Table 4.5: Values of r x 100 for uncorrected maps, exclusive of the Nam One watershed 47 Table 4.6: Forest in the full area of NNT, with 1960s 1:50 000 maps homogenized to approximate 1981 1:100 000 maps 47 Table 4.7: Forest in the area covered by 1992/93 maps, with 1960s 1:50 000 and 1992/93 1:25 000 maps homogenized to approximate 1981 1:100 000 maps 48 Table 4.8: Values of r x 100 for all forest for homogenized maps, exclusive of the Nam One watershed 48 Table 4.9: NNT forest classified from Landsat for 1976, 1989, 2001 58 Table 4.10: NNT forest cover rfrom Landsat for three epochs between 1976 and 2001 58 Table 4.12: Wildlife sale prices in the vicinity of NNT NPA, 1997-2005 62 Table 4.13: Ethnicity, population and forest cover change in NNT's watersheds 66 Table 5.1: Priority watersheds for active forest conservation in NNT NPA 85
v
LIST OF F IGURES:
Figure 2.1: Nakai Nam-Theun and other National Protected Areas in Laos 10 Figure 2.2: Nakai Nam-Theun National Protected Area (exclusive of recent extensions) 11 Figure 2.3: Villages by ethnicity in NNT NPA 21 Figure 3.2: Areas of analysis 44 Figure 4.1: Comparison of non-forest from 1960s 1:50 000 and 1981 1:100 000 topographic maps 49 Figure 4.2: Comparison of non-forest from 1981 1:100 000 and 1992/93 1:25 000 topographic maps 50 Figure 4.3: Convex hulls around non-forest from 1960s 52 Figure 4.4: 1960s non-forest convex hulls overlaid on non-forest from 1981 1:100 000 topographic maps 52 Figure 4.5: 1960s non-forest convex hulls overlaid on non-forest from 1992/93 1:25 000 topographic maps 53 Figure 4.6: Non-forest in the Nam Kata watershed from 1960s, 1981 and 1992/93 topographic maps 55 Figure 4.7: Supervised Landsat classification of non-forest and forest in NNT NPA, 1976, 1989 and 2001 57 Figure 4.8: Trend in the local trade value of Chinese Three-striped Box Turtle Cuora trifasciata in and around NNT NPA, 1990-2003 61 Figure 4.9: Distributions of Saola, wet evergreen forest and non-forest in NNT NPA 64 Figure 5.1: Bomb drops in the vicinity of NNT NPA during the American Indochina War 69 Figure 5.2: Landsat M S S 1976, showing distribution of pressure on NNT's forest 83 Figure 5.3: Priority watersheds for active forest conservation in NNT NPA 85
vi
P R E F A C E
"All clear ideas tend to be false".
- Robert Smithson
vii

A C K N O W L E D G E M E N T S
This thesis would not have been written without the support of four people: foremost
is my academic supervisor, Dr. A .R .E . Sinclair, whose patience with this process gratefully
exceeded my own at critical moments; Dr. Joshua Ginsberg of the Wildlife Conservation
Society, who put me in Tony Sinclair's path; Naa Odarkor-Lanquaye, my outstanding and
indispensable research assistant, whose hundreds of hours of map digitizing and Landsat
manipulation far exceeded the expected workload and normal limits of human patience; and
Dr. Glenn Morgan, Senior Environmentalist, World Bank, whose championing of financial
support made the research possible.
Both the excellent guidance and fraternal mien of my other two committee members,
Dr. Brian Klinkenberg and Dr. Roy Turkington, have been much appreciated. Dr. Carl
Walters of UBC's Department of Zoology, quasi-curmudgeon and outstanding thinker, offered
insightful suggestions and encouragement at several stages along the way. Dr. Juanita
Sundberg and Dr. Derek Gregory of the Department of Geography and Dr. Julie Cruickshank
of the Department of Anthropology and Sociology also provided key encouragement and
input in early phases of the study, for which I am very grateful.
The idea for this research came while I enjoyed the hospitality and friendship of
villagers in Nakai-Nam Theun National Protected Area, Laos. In particular, I owe thanks to
my host and the former chief in the village of Ban Nameo, Mr. Chandy. The dense forest
within literal spitting distance of his house planted the seed of curiosity that grew into this
thesis.
The Director of the Forest Inventory and Planning Division of the Lao Department of
Forestry, Mr. Thongphath Leuangkhamma, and his staff Mr. Khamma Homsisavath, kindly
and generously shared key data with me. Two other institutions in Laos did the same, UXO
Laos (bomb impact data) and the Nam Theun 2 Power Company (various geodata). Two
geographers gave extensive and professional support to the technical aspects of the
research, Michael Sheinkman and Dr. Robert Magai. Dr. Magai also read and provided
helpful feedback on some sections of an earlier draft.
In my experience, librarians are the world's most helpful stratum of humanity, and the
process of writing this thesis did nothing to change this view, due to the kind assistance I
received from Sally Taylor of UBC's Woodward Biomedical Library, and the staff of France's
Institut Geographique National. Their helpfulness was matched by three key staff of the UBC
Department of Zoology, Allison Barnes, Kathy Gorkoff, and Irene Wingate. With unending
patience my brother, Doug Robichaud, handled my personal affairs in Wisconsin during my
viii
expatriate days in Vancouver and Laos. My friend, George Allez, provided some key and
much appreciated support to help me get launched at UBC.
Numerous individuals patiently and generously responded to requests for data,
references, ideas or other assistance, and to each I owe thanks. Foremost are Michael
Hedemark and Dr. Arlyne Johnson, Co-Coordinators of the Wildlife Conservation Society's
Lao Program, and their intern, Visanou Sayavong. A particular intellectual debt is owed to
Dr. James Chamberlain for his insightful interpretations of the Nakai-Nam Theun ecosystem,
which he is always happy to discuss. Others, in alphabetical order, are:
C. Alton, I. Baird, R. Beyers, A. Blachford, R. Boonratana, V. Caron, T. Castle, L. Chazee, G.
Claridge, P. Daravong, W. Duckworth, O. Ducourtieux, P. Ersts, T: Evans, R. Eve, C.
Feldkotter, J . Fidloczky, C. Flint,. J . Foppes, J . Foster, M. Guerin, T. Hansel, J . Hanus, B.
Hodgdon, P. Jones, C. Le Bail, D. Ludwig, J . Maedel, B. Moizo, C. Mossberg, J . Noven, F.
Obein, D. Pauly, G. Reams, J . Robichaud, M. Sandewall, G. Schaller, G. Schroering, T.
Scudder, S. Southammakhoth, S. Sparkes, B. Starzomski, E. Sterling, B. Stuart, B.
Southidara, S. Sygnavong, L. Sylavong, L. Talbot, R. Timmins, T. Tizard, L. Warman, T.
Whitmore, T. Whitten and Y. Yim.
Some friends and colleagues lent inspiration and moral support at key times, for
which I am grateful: Bea, Coach, Duck, Eph, Ian, Liza, Leanna, Nick, Scott and Skydog.
Finally, I owe a debt to my dear daughter, Alonda. She grew up in the course of the
thesis but, because of it and to my regret, not always in front of my eyes.
ix
1 INTRODUCTION
1.1 FOREST LOSS IN SOUTHEAST ASIA
Southeast Asia has the highest deforestation rate in the world, about twice that of
Africa or South America (Achard et al. 2002; Lepers et al. 2005). The loss has repercussions
for biodiversity loss through direct removal of species with the removal of forest, and indirect
extinctions through reduced populations and subsequent stochastic effects (Caughley &
Sinclair 1994). It also has significant implications for human welfare, through global climate
change, the loss of forest ecosystem services, the loss of forest resources for both
subsistence and commercial use, and increased emotional stress from the loss of spiritual or
esthetic values of the forest (Wilson 1984).
Two solutions to deforestation, which are not exclusive, are to reduce annual
destruction of tropical forest to less than its intrinsic rate of recovery, and active restoration of
deforested areas (Sinclair et al. 1995). Which is best emphasized will depend in part on the
drivers of forest loss in a particular area of interest.
Deforestation in Southeast Asia is generally attributed to three main causes, i)
commercial logging, ii) commercial crop plantations and iii) swidden agriculture, a.k.a.,
'shifting cultivation' or 'slash and burn' (Terborgh 1992; Dove 1993; Kummer & Turner 1994;
Brady 1996).1 Poorly regulated commercial logging (i.e., the situation in every country that
logs timber in SE Asia) and commercial crop plantations (e.g., palm oil) are universally
regarded as detrimental to forest cover and biodiversity in Asia. There is less consensus on
the impact of swidden agriculture, and what sort of response, if any, is required in the
interests of sustainable livelihoods and biodiversity conservation. This thesis investigates
trends in forest cover in a large nature reserve where swidden agriculture is the main
anthropogenic influence on forest structure, Nakai-Nam Theun National Protected Area (NNT
NPA), in central Laos. 2 NNT is one of the most important sites in Asia for the conservation of
biodiversity, harboring, for example, a suite of recently discovered forest mammals endemic
1 In recent years wildfires have done extensive damage to forests in Indonesia, but the fires are
largely a consequence of logging operations (Siegert ef al. 2001)
2 Throughout this thesis, the word 'Laos' is used to denote the geographical entity of the Lao state,
while the nation's official name, Lao People's Democratic Republic (or Lao PDR), is used to denote
the political entity. Furthermore, 'Lao' rather than the outmoded term 'Laotian' is used to denote the
people and their language and as the descriptive adjective.
1

to central Indochina, such as the Saola (Pseudoryx nghetinhensis) and Large-antlered
Muntjac (Muntiacus vuquangensis). Consequently, a basic understanding of the dynamics of
the reserve's forest cover is a high conservation priority.
1.2 SWIDDEN AGRICULTURE
1.2.1 Overview
Swidden is an agricultural system that uses energy and nutrients stored in forested
land for the cultivation of crops. A farmer cuts a patch of forest, allows the slash to dry, then
burns the slash to clear it, improve the soil and kill competing ground cover. The soil is
usually cultivated for 1-3 years, until nutrients are depleted and weeds flourish, at which time
another patch of forest is cleared and the process repeated. It is commonly a system of
sloping land, where the establishment of permanent, stable agricultural plots is problematic.
Swidden is primarily a system of subsistence rather than commercial agriculture, most
commonly practiced the world over by single families (although often within rules and
customs of a community). It is probably the original cropping system used by early
agriculturists in many of the world's forests (Spencer 1966). In centuries past swidden was
practiced in temperate areas, such as Finland (Lehtonen & Huttunen 1997), but is now
confined almost solely to the tropics. In terms of external energy inputs required, it is
considered the most efficient form of agriculture in tropical environments (Russell 1988).
Although this thesis examines the balance between swidden and forest, in reality
there is no sharp distinction between the two. That which a biologist would classify as a tall
secondary forest, a farmer might view as his resting swidden field, drawing nutrients to the
surface in preparation for being cut again. Consequently, while a map or satellite image
shows a static dichotomy of 'forest' and 'clearing', the landscape is actually a complex and
shifting continuum, from swidden field to scrub to forest and back again (IFAD etal. 2001;
Raintree & Soydara 2001).
There is a large body of literature on swidden agriculture in the tropics, but despite
decades of research, there is little consensus among agronomists, anthropologists,
geographers and conservationists on its consequences for forest cover and biodiversity, and
on the system's inherent sustainability. Assessments range, for example, from "a
sustainable form of land-use, compatible with specific conservation goals" (Raman 1996) and
"the most efficient and proven method of agriculture in many of the world's tropical habitats"
(Netting 1986) to "an environmentally and economically unsuitable practice" (Rasul & Thapa
2003), "...an extravagant and unscientific form of land use... [t]he evil effects of shifting
cultivation are devastating and far-reaching in degrading the environment" (Ranjan &
2
Upadhyay 1999). The tendency to blame swidden for deforestation reaches an absurd
extreme in a recent edition of the biennial State of the World's Forests report published by
the Food and Agriculture Organization of the United Nations, which lists subsistence
agriculture among the major causes of tropical forest loss but not logging (FAO 1999).
There are several possible explanations for the diversity of views about the nature of
swidden. Observers probably generalize their knowledge of particular, local swidden
systems to swidden as a whole. The context in which swidden is practiced and observed is
also important. For example, is it by indigenous groups with generations of tenancy in their
local environment, or by immigrant opportunists cultivating land opened up by commercial
logging operations (De Koninck 1999; Baker et al. 2000)? If the latter, does the blame for
deforestation properly lie with swidden or with the processes that opened the forest to
colonization? O'Brien (2002) and Instone (2003) argue that this very propensity to
categorize swidden dualistically as either destructive or "Edenic" is rooted in colonialist
assumptions about cultural evolution from primitive to developed states (Eden-lost or Eden-
found, depending on one's perspective).
In fact, the nature of a pronouncement on swidden depends very much on who is
making it - agronomist or ecologist, foreign academic or national bureaucrat. A sample of a
decade of literature on swidden reveals some interesting patterns. Of the 26 papers
published between 1991 and 2000 with either "swidden", "slash and burn" or "shifting
cultivation" in the title and an online abstract catalogued by the Web of Science, about half
(N=12) cast swidden as unequivocally negative and half (N=14) as a sustainable, appropriate
livelihood system. The negative conclusions were expressed predominantly by agronomists
and other agriculture scientists, including nearly all researchers working on the Indian
Subcontinent. Positive views were expressed mainly by biologists, ecologists and
geographers, and from most of the research in the rest of Asia. The differences are likely due
in part to different criteria used to define and measure the 'sustainability' of swidden. Such
criteria have variously included sustainability of energy and nutrient flows (e.g., soil fertility),
recovery of local plant communities, continuity of landscape-wide habitats, continuity of
faunal diversity, and continuity of the livelihoods and cultures of the swiddeners.
Interestingly, nationals of the countries about which they wrote (based on the authors'
surnames and affiliations) were more than 2-1 negatively disposed toward swidden. The
reverse was true of authors foreign to the country of their research, with more than 2-1
expressing a positive view.
While observer bias contributes to differing views on the good or ill of swidden, the
sum of the literature makes the essential point that swidden is not a monolith, but a diverse
3
collection of agricultural systems with different techniques, intensities and implications for the
conservation of tropical forests
1.2.2 Swidden In Laos Laos is the least densely populated country in Southeast Asia, mainly because it is
the most mountainous (in terms of the ratio of sloping land to overall area). It is also one of
the most densely forested countries in Asia, retaining about 40% of its land area in some
type of non-plantation forest. This nonetheless represents a significant decline in the past
few decades; it is estimated that 70% of Laos was forested in the 1940s (Baker et al. 2000).
The country is populated by ethnic lowland Lao who cultivate permanent rice paddies along
the deforested plain of the Mekong River, and a diversity of ethnic groups practicing
subsistence swidden agriculture in the forested mountains. An estimated 35%-40% of the
country's population practices swidden (Hansen & Sodarak 1997; Ducourtieux 2004), most of
them non-Lao ethnic groups.
Lao PDR is a communist, one-party state, and the state, probably encouraged by
some international donors, has long denounced swidden as unequivocally destructive and
the primary driver of the country's deforestation. Consequently, the foremost national land-
use policy of the Government of Lao PDR (GoL) in the 1990s was to eliminate swidden
cultivation among its population by the year 2000 (Fujisaka 1991). Following failure to
achieve this (which is not surprising - given the lack of alternatives in the mountainous
terrain, much of the country's population would have starved had this been achieved), GoL
now aims to "stabilize" swidden by the year 2010 (MAF 2003).
Laos has more than 230 ethnic groups (ADB 2001), and thus probably nearly as
many swidden systems. Many upland areas in the north of the country are dominated by
Tibeto-Burman and Hmong ethnic groups. They are generally relatively recent arrivals to
Laos, having migrated from the north from southern China in the last few hundred years.
The Hmong in particular are efficient "resource maximizers" (J. Chamberlain, pers. comm.)
and often practice a form of vigorous, pioneering swidden: A village will settle on a mountain,
and spend the next several years clearing, burning and intensively cultivating (and hunting)
the surrounding slopes until soil nutrients are so exhausted the land regenerates not in forest
but in the grass Imperata cylindrica. The entire village will then move to another mountain
and repeat the process, generally never returning to the first site (Smitinand et al. 1978).
Hmong have been moving south in Laos for about three hundred years in this way. It is likely
that, locally, their swidden practices are not sustainable. Consequently, the northern
provinces of Laos are the most severely deforested.
4
Upland areas of central and southern Laos are populated mainly by various Mon-
Khmer ethnic groups. Compared to the Hmong, Mon-Khmer groups tend to be more
sedentary and thus more likely to use less intensive rotational swidden systems, wherein
they return to cultivate plots used previously after intervening fallow/regeneration periods of
up to 20 or more years. Consequently, forest is more likely to persist near Mon-Khmer
settlements than Hmong. This may explain in part why the densest forests in Laos are found
today in the southern half of the country.
Because deforestation has been most severe in northern Laos, this is where most
research to-date on swidden in the country has taken place, which in turn has probably
reinforced the negative perception of swidden nationwide. That is, swidden researchers in
Laos (who have been mostly agricultural scientists) have selectively - and understandably -
focused on the most destructive forms of the system. Yet, recent research has begun to
demonstrate that at least some swidden systems in Laos are sustainable
(Pravongviengkham 1997; NAFRI 2004 and papers therein), and that the government's drive
to eliminate swidden has often been deleterious to the rural population and to the local
environment, by driving villagers toward more rather than less intensive use of the forest
(ADB 2001). Criticism of the policy by international donors along with new research has led
to some softening of the government's position. For example, GoL now classifies upland
agriculture into three types, with different degrees of desirability (WMPA 2004):
• pioneering swidden: "unacceptable";
• rotational upland cultivation without encroachment on new forest areas: "acceptable";
• sedentary cultivation: "preferable".
Encouraging as this is, the above categories have not been clearly defined, nor have
the various swidden systems in Laos been classified according to the criteria. At present, it
is a policy that lacks sufficient information for implementation, a gap which this thesis can
perhaps help in a small way to close. One means to study of the impacts of swidden
agricultural is historical ecology.
1.3 HISTORICAL ECOLOGY
Conservation biology is fundamentally a science of trends: Discerning them,
identifying their causes and proposing ways to alter those considered detrimental (Caughley
& Gunn 1996). Whether the parameter of interest is the population of a rare species or the
area of a threatened habitat, knowledge of its present magnitude is generally less important
than understanding the direction and magnitude of its trend.
Monitoring is the tool most commonly used to discern biodiversity trends. Monitoring
programs start now and proceed forward in time. Consequently, they can be designed to
5
collect precisely the type and volume of data required to answer the question of interest. A
disadvantage of monitoring is that, for many subjects of interest (e.g., populations of large
mammals), many years of monitoring may be needed to expose an existing trend. The effort
can be expensive and, more importantly, a detrimental trend may continue over the period of
the study, before enough information is collected to realize there is even a problem, let alone
find and implement a solution.
An alternative, or complement, to monitoring is the post facto detection of trends by
the investigation of historical ecology (Ludwig etal. 1993; Fairhead & Leach 1996; Meine
1999). In somewhat the reverse of monitoring, the process starts now and works back in
time. Its principal limitation is dependence on archival data as one finds them, which means
that the testing of hypotheses is difficult, and frequently impossible. But historical ecological
investigation has several advantages: a) it can cover greater spans of time - sometimes
millennia - than can most monitoring programs; b) the passage of time may have yielded a
greater diversity of information sources (e.g., diverse written records, photographs, museum
specimens, soil strata) than might be available to the typical monitoring program; c) lower
cost, and d) an immediate return of results to use in conservation planning (Rackham 1998).
The application of historical ecology can sometimes overturn widely held but untested
assumptions about the direction of ecological trends (e.g., Fairhead and Leach 1996).
Historical ecology has been used before to evaluate the long-term impacts of swidden
cultivation on forest cover in Asia. Methods have included analysis of a time series of aerial
photographs (Fox et al. 2000) and satellite images (Dwivedi & Ravi Sankar 1991),
sometimes coupled with on-ground sampling of vegetation and the collection of oral histories
from indigenous cultivators. Examples in Laos include efforts to determine the rate of forest
cover change on a national scale (MAF 2003), and historical patterns of land use at a locality
in northern Laos (Sandewall etal. 2001) and on the Nakai Plateau (NTPC 2005). This is the
first known attempt to examine in detail the ecological history of an upland area in central or
southern Laos.
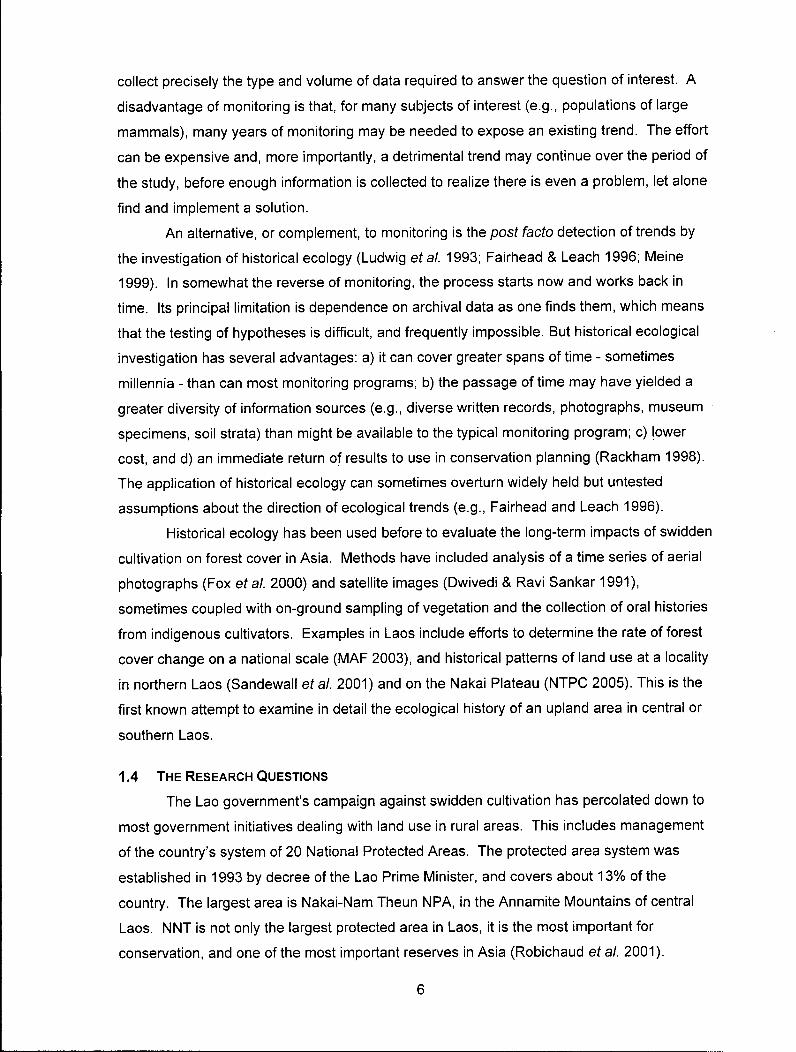
1.4 THE RESEARCH QUESTIONS
The Lao government's campaign against swidden cultivation has percolated down to
most government initiatives dealing with land use in rural areas. This includes management
of the country's system of 20 National Protected Areas. The protected area system was
established in 1993 by decree of the Lao Prime Minister, and covers about 13% of the
country. The largest area is Nakai-Nam Theun NPA, in the Annamite Mountains of central
Laos. NNT is not only the largest protected area in Laos, it is the most important for
conservation, and one of the most important reserves in Asia (Robichaud et al. 2001).
6

In part due to its biological importance and in part due to its proximity to a planned
hydropower project, NNT has been the focus of intense management planning in the last
decade (WCS 1995b, a, 1996; IUCN 1997, 1998b, a, 1999; Seatec International 2000;
W M P A 2004, 2005). A prominent thesis in many of these studies and management plans is
that swidden cultivation by the area's indigenous residents is a major threat to the area's
forest cover, and that replacing swidden with fixed rice paddies must be a major focus of the
protected area's management. Following are some excerpts on the topic of swidden from
the body of literature on NNT:
IUCN (1998b):
"...the progressive destruction of forest and wildlife habitat by shifting cultivation".
"Development of rice paddies wherever possible is the top priority intervention".
Chazee ([2000])
"The two main current identified causes of natural resources depletion are...the use of shifting cultivation technique for upland cropping...".
"...protection of the forest against swidden farming".
Tobias (1997; IUCN 1998b):
"Intensive swidden agriculture is highly detrimental to biodiversity conservation because large areas of forest are converted to cultivation".
W M P A (2004):
"The main objectives...will be to...foster the diversification of livelihoods, and the gradual intensification of land use away from shifting cultivation towards more sedentary and managed farming systems".
"The aim of livelihood development is to...intensify land use away from reliance on hunting, gathering and shifting cultivation".
"The emphasis is on encouraging alternative lifestyles to the exploitation of forest lands...".
"...[Sjhifting cultivation contributes to national level pollutants and threatens to destroy the forests on which the country.is dependant (shifting cultivation has destroyed much of the forest already)".
"As a way of life it also debilitates the ability of the new generation to participate in schooling and thus development opportunities. Thus, the policy to stop shifting cultivation is a key development policy for the Lao PDR".
7

"Concomitant with this forest/land use approval, each village must agree - via a binding and legal contract - that the total number of families and persons relying on shifting cultivation does not increase".
"In addition, any opportunities to improve and/or modify the current systems of swidden farming...will be identified, tested and/or developed".
"As in the rest of the Lao PDR, the opening up and development of irrigated paddy rice fields is considered the main alternative to shifting cultivation".
However, the impact of swidden on NNT's forest cover has never been studied. While
the forest cleared to-date for agriculture in NNT is evident, we have little idea if the trend is
increasing, decreasing or stable, and if it is increasing, at what rate, and where (i.e., in which
sub-watersheds of the protected area and around which villages). The threat from swidden
and the urgency in solving the perceived problem are assumptions, which this thesis is a
modest attempt to test.
The lack of trend information on forest loss in NNT also leaves conservation planning
susceptible to the "shifting baseline" syndrome (Pauly 1995). That is, we do not know the
status of the forest baseline that management plans seek to conserve in NNT, if the current
mix of forest cover and degraded habitat in NNT is of recent origin; or a relatively long
standing and stable condition. Is the NNT of today that management seeks to conserve
representative of the area.historically, or has the baseline shifted significantly in recent years,
leaving us to try to conserve it in a much altered state? The answer to this will influence
whether NNT's management should focus solely on conservation, or also invest resources in
habitat restoration (Sinclair et al. 1995).
Finally, without trend information it is difficult to prioritize where in the reserve limited
conservation resources should be focused. Priority sites for management attention are those
at the intersection of highest biodiversity value and highest human impact. Yet we have little
understanding of the latter in NNT in regards to forest cover. There has never been a
detailed analysis of the long-term rate of forest cover change in NNT, and its spatial and
ethnographic patterns. This study seeks to describe the impact of human residents on the
forest cover of the reserve. Specifically, I sought to answer four questions:
1. What data are available and most suitable to examine historic rates of forest
cover change in NNT?
2. Is forest cover changing in NNT and, if so, where and at what rate?
3. If forest cover is changing, what are the likely drivers of the change?
4. What are the implications of the findings for management of NNT?
8

2 T H E S T U D Y A R E A : N A K A I - N A M T H E U N N P A .
2.1 AREA OF ANALYSIS
Nakai-Nam Theun (NNT) lies in east central Laos along the country's border with
Vietnam, and is the largest protected area in either country (Figure 2.1). The reserve covers
about 3,500 km 2 of the Annamite Mountains ('Saiphou Louang' in Lao), which run NW-SE
along the Lao - Vietnam border, and continue southeast along Vietnam's border with
Cambodia. The area of analysis for this study is the reserve exclusive of two recent
extensions to the reserve, one to the northwest across the Nakai Plateau and a small one to
the south. Officially, the western boundary of NNT along the Nakai Plateau is defined as the
538 m contour, which is the full supply level of a proposed hydropower reservoir (see
Sections 2.5 and 2.6, below). For simplicity, I marked this boundary as a straight line drawn
approximately across the 538 m contour.
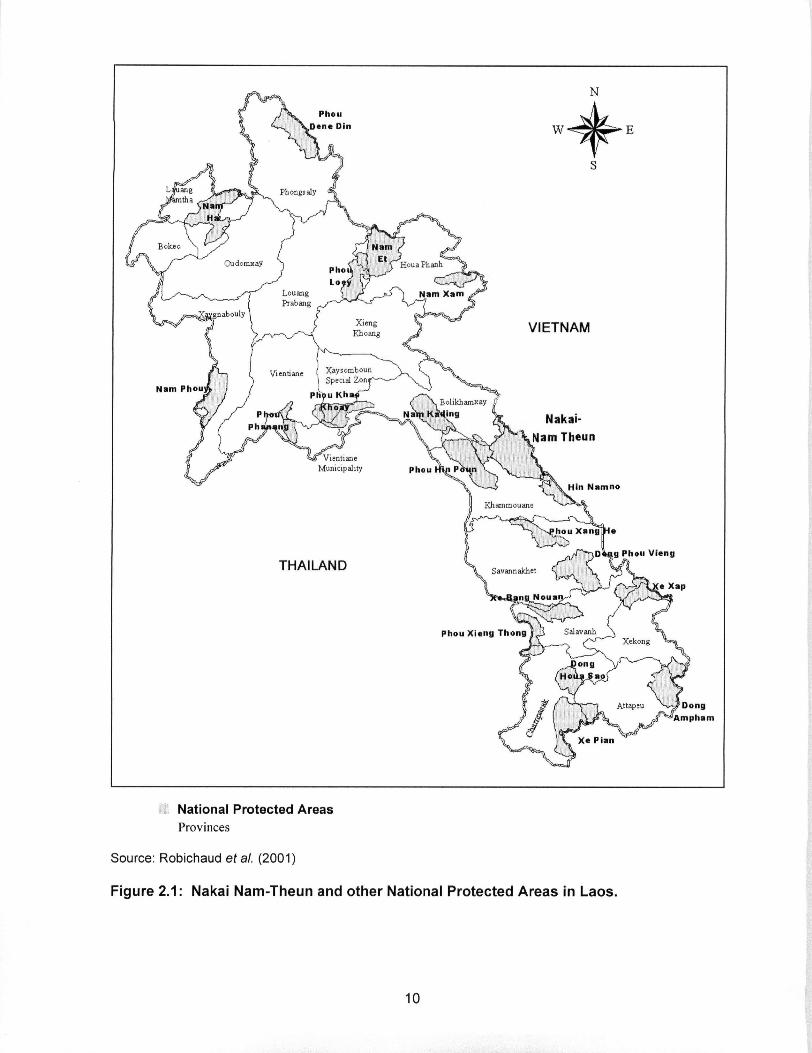
In NNT, humans and their impacts are concentrated in the major stream valleys, and
so division of the reserve into its separate watersheds allows more detailed understanding of
human-forest dynamics. The reserve is comprised of the watersheds of five roughly parallel
tributaries of the Nam Theun river; from north to south the Nam Kata, Nam Xot, upper Nam
Theun, Nam Noy and Nam One (pronounce 'awn'). All start in high slopes near the Vietnam
border and flow down through the reserve to the Nakai Plateau and the main channel of the
Nam Theun (which itself is a tributary of the Mekong, and one of its largest). Two large
branches of these tributaries, the Nam Mon (Nam Xot) and Nam Pheo (Nam Noy) have
significant human populations, and merit consideration as separate watersheds. Figure 2.2
shows the NNT area of analysis, villages, rivers, and the divisions of the seven watersheds
(the watershed boundaries were hand digitized from 1:100 000 topographic maps).
2.2 PHYSICAL GEOGRAPHY
2.2.1 Land
NNT comprises a range of increasingly high hills and mountains that rise from the
Nakai Plateau on the west edge of the reserve, and climb northeast to the main spine of the
Annamites, which defines the border between Laos and Vietnam. This largely unmarked
9
P h o u
. D e n e D i n 4-s Ljtiang
rfamtha
Bokeo
Phongsaly
Oudomxay
wgnabouly i
I N a m
E t ,
Louang
HouaPhanh
N a m X a m
N a m Pho i i i l
Xieng Khoang
Vientiane ! Xaysomboun Special Zonr
VIETNAM
P I
P h i
Vientiane Municipality
. Bolikhamxay Nakn K a M i n g
P h o u Htn Ponin
Nakai-.Nam Theun
H i n N a m n o
Khammouane
THAILAND
• h o u X a n g
\D
Savannakhet
P h o u X i e n g T h o n g ) A Salavanh
He
itj P h o u V i e n g
<e X a p
Xekong
J o n g
f H o i a S a o l
Attapeu X - ^ D o n g A m p h a r i
X e P i a n
National Protected Areas Provinces
Source: Robichaud etal. (2001)
Figure 2.1: Nakai Nam-Theun and other National Protected Areas in Laos.
10
Figure 2.2: Nakai Nam-Theun National Protected Area (exclusive of recent extensions).
11
international border comprises the entire eastern boundary of the reserve. To the north the
reserve is bounded by Lao National Route 8 to Vietnam, and to the south by a steep
escarpment above Lao National Route 12 to Vietnam (Figure 2.2). The reserve spans an
elevation range from approximately 500 m to 2,288 m asl (although areas above 2,000 m are
uncommon). Lowest portions lie near the Nakai Plateau and along interior river courses, and
highest points are peaks along the Vietnam border to the east.
2.2.2 Climate
The climate of Laos is strongly seasonal, due to two factors: First, although tropical,
the country lies well above the equator (more than 17° north), producing seasonal variations
in temperature. Second, it is visited annually by a strong southwest, or 'summer', monsoon
that sweeps up from the Indian subcontinent. The combination of the two has endowed most
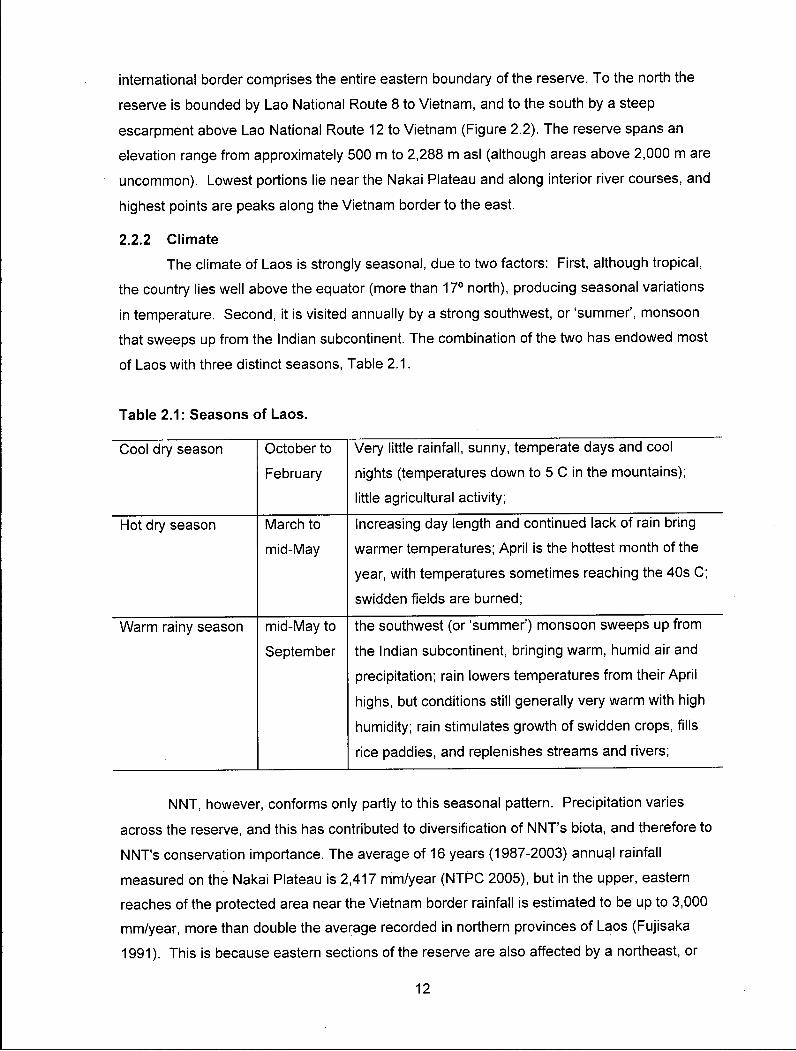
of Laos with three distinct seasons, Table 2.1.
Table 2.1: Seasons of Laos.
Cool dry season October to
February
Very little rainfall, sunny, temperate days and cool
nights (temperatures down to 5 C in the mountains);
little agricultural activity;
Hot dry season March to
mid-May
Increasing day length and continued lack of rain bring
warmer temperatures; April is the hottest month of the
year, with temperatures sometimes reaching the 40s C;
swidden fields are burned;
Warm rainy season mid-May to
September
the southwest (or 'summer') monsoon sweeps up from
the Indian subcontinent, bringing warm, humid air and
precipitation; rain lowers temperatures from their April
highs, but conditions still generally very warm with high
humidity; rain stimulates growth of swidden crops, fills
rice paddies, and replenishes streams and rivers;
NNT, however, conforms only partly to this seasonal pattern. Precipitation varies
across the reserve, and this has contributed to diversification of NNT's biota, and therefore to
NNT's conservation importance. The average of 16 years (1987-2003) annual rainfall
measured on the Nakai Plateau is 2,417 mm/year (NTPC 2005), but in the upper, eastern
reaches of the protected area near the Vietnam border rainfall is estimated to be up to 3,000
mm/year, more than double the average recorded in northern provinces of Laos (Fujisaka
1991). This is because eastern sections of the reserve are also affected by a northeast, or
12
'winter', monsoon that crosses Vietnam, from about November to February, in the heart of
the Lao dry season. The high Annamite ridge along the border blocks much of the
monsoon's influence on Laos, but low passes in the ridge allow its penetration for several km
into eastern portions of Laos. These areas experience extensive periods of overcast and cold
mist and rains at a time when most of Laos is invariably dry and clear. The consequence is
an unusually long rainy season in some areas, up to ten months per year, with no month
receiving less than 40 mm of rain (Robichaud & Timmins 2004). This localized border-area
climate has produced a distinctive wet evergreen or "everwet" forest (Timmins & Evans
1996). Wet evergreen forest probably defines the distribution of some of the newly described
endemic mammals from the Annamites (see Section 2.3.3, below).
2.3 BIODIVERSITY
2.3.1 Overview
According to the biogeographic classification of MacKinnon and MacKinnon (1986),
NNT lies within the Indochinese Subregion of the Indo-Malayan Realm. More recently, WWF
defined the area containing NNT as the Northern Annamites Rain Forests Ecoregion within
the Indochina Bioregion (Wikramanayake etal. 2001). The ecoregion is characterized by
"Globally Outstanding" biological distinctiveness, and NNT is the ecoregion's largest
protected area. Following are some assessments of the significance of NNT specifically:
• MacKinnon's (1997) review of Indo-Malayan protected areas rated NNT as "globally
significant".
• An analysis of existing and proposed national protected areas in Laos according to
three aspects of their forest cover - extent, quality, and the significance of
representation in its biogeographic subunit - found NNT's forest to be the country's
most important (Berkmuller et al. 1995).
• Ling (1999) ranked existing and proposed Lao protected areas using a
complementarity algorithm based on vertebrate diversity. Complementarity is a step-wise
analysis for identifying a set of protected areas that most efficiently meet some
conservation goal, usually maximum representation of biodiversity within minimum area.
It picks the most diverse site first, and then selects subsequent sites, one at a time, that
add the most new diversity to the set of sites picked before it. Ling applied to the method
to existing or proposed Lao protected areas, using three components of their biodiversity:
i) all bird species, ii) threatened birds, and iii) threatened mammals. NNT ranked first or
13

second for all three criteria, and highest overall of all sites analyzed. Ling concluded that
"NNT clearly emerges as the lynch-pin of the Lao protected areas network...".
• A review of the Lao national protected areas system included a prioritization of the
importance of the NPAs (Robichaud et al. 2001). NPAs were assigned to ranked
categories according to their importance for biodiversity, watershed protection and
ecotourism potential. NNT was the only protected area that ranked in the highest
category for each.
• The WWF Indochina Programme coordinated a comprehensive analysis of
conservation priorities in a complex of ecoregions covering parts of Laos, Vietnam and all
of Cambodia, termed the "Forests of the Lower Mekong Ecoregion Complex" (FLMEC)
(Baltzer et al. 2001). One of the priority landscapes identified in this complex is the
"Northern Annamites". Its conservation priority is rated "Critical" (the highest category),
and NNT is by far the largest protected area in the unit.
• Biologists at WWF recently ranked 33 protected areas in the Annamite Mountains of
Cambodia, Laos and Vietnam for conservation importance, and NNT placed first (STEA
2004).
2.3.2 F l o r a
NNT's forest cover is extensive. Primary forest, or at least forest of outstanding
quality and which most observers would characterize as 'pristine', covers most of the
reserve. But the vegetation of NNT is poorly known by scientists. There have been only a
few, superficial botanical studies of the area, all since 1995 (the work in Laos of the
renowned French botanist J .E. Vidal in the mid 20 t h century apparently did not include
sampling from the area of NNT). Of these studies, one focused on general habitat structure
(Jarvie 1997), two focused on tree composition on the Nakai Plateau (Phaengsintham 1996),
three collected information from villagers on their use of non-timber forest products (NTFPs)
(Foppes etal. 1997; Ingles etal. 1998; Foppes 2001), and one was a quick, localized
investigation of rattans (T. Evans, pers. comm.). Reconnaissance surveys for commercial
timber trees, and possibly rattans, have probably been made in NNT by one or more
government institutions (Soviet advisers likely helped with timber surveys of the area in the
1970s and 1980s), but the results of such work are not available.
Despite a paucity of systematic identification of the vegetation of NNT, its forests are
known to be species rich, a consequence in part of its strong gradients of elevation and
microclimate (and possibly soil). For example, residents of just one village in NNT (Ban
Navang) named 466 local plant NTFPs they use for food, construction material, medicine,
trade and other purposes. This is more than the combined total named by 28 villages studied
14

elsewhere in Laos (Foppes 2001). The reserve undoubtedly holds undescribed species of
vascular plants, and perhaps some undescribed genera.
Summary reports of general biodiversity and ecological surveys of the area contain
broad habitat descriptions (Timmins & Evans 1996; Jarvie 1997). In general, NNT is
dominated by extensive and dense evergreen and semi-evergreen broadleaf forest and, as
noted earlier, it contains the forest of highest quality and conservation importance in existing
or proposed protected areas in Laos. In fact, NNT NPA may be the highest quality
evergreen/semi-evergreen forest block in Laos, Vietnam, Yunnan (China) or Thailand.
The predominant forest type in NNT is tropical dry evergreen/semi-evergreen forest,
which transitions in some areas to mixed deciduous forest. These forest types are also
found in regenerating secondary formations, most commonly near villages. Secondary
habitats are most likely to follow abandonment of a swidden field, and probably often form
part of a conscious, rotational strategy by villagers wherein the regenerating forest is left to
draw nutrients back to the surface for several years or even a few decades, then is cut and
burned again. If left long enough, just when a forest ceases to be 'secondary' and returns to
maturity has no easy answer, but some areas that are now good quality forest in NNT may
have been cleared for cultivation historically, especially near abandoned village sites.
Logging has had little impact on NNT's forest cover, and most degraded habitat seen today
is a consequence of subsistence swidden agriculture.
There are also areas of mixed broadleaf/pine forest and, at higher elevations,
fagaceous forest and ericaceous cloud forest. Finally, NNT has two forest types of
elevated conservation significance:
Wet evergreen forest: This occurs at mid-elevation (roughly 500 - 900 m) near the
Vietnam border, where winter monsoon precipitation penetrates the protected area, as
described earlier. Annual precipitation possibly reaches 3,000 mm, with only 1-3 months of
dry season, and the air temperature is markedly lower than elsewhere in the protected area.
This may be the preferred habitat of rare species such as the Saola and Annamite Striped
Rabbit (Nesolagus timminsi). Plant endemism is expected to be high, and wet evergreen
forest is the most globally significant terrestrial habitat not only in NNT, but Laos as a whole.
Cypress forest: The conifer Fokienia hodginsii (Cupressaceae) occurs
uncommonly, on dry ridges above 1000 m. Trees can grow very large, probably to 40 m tall
and 2 m diameter. Where F. hodginsii occurs it usually comprises 5-30% of the canopy, and
may occur in mixed associations with oaks (Fagaceae). Stands are found in, at least, the
upper Nam Xot and Nam Theun watersheds and below the summit of the Phou Vang massif.
15
It is has exceptionally valuable timber, and the species has been assessed as Near
Threatened by IUCN (IUCN 2004).
Non-forest habitats include extensive areas of brush, bamboo stands, a few small
areas (the largest about 25 ha) of natural, level grassland, and minor areas of hillside
Imperata grass. Imperata cylindricans (Poaceae) characteristically establishes after repeated
burning and cultivating of hillsides, when nutrient exhaustion of the soil impedes regeneration
of forest. This formation is much more common in northern Laos than in NNT.
All agriculture in the protected area is done by its residents, that is, there is no
commercial agriculture by external enterprises. Virtually all cultivation is for subsistence,
there being little market for cash crops from the area. Agriculture is found in a diversity of
forms in the protected area, with more than 50 crops grown by some villages (Chazee
[2000]). Most common are swidden plantings of glutinous rice on hillsides near villages.
Cassava, corn and other food crops also are grown in swidden fields, and vegetables in
small permanent plots or along seasonally exposed river banks.
Less common in NNT are permanent rice paddies. Unsuitable soil, cool and cloudy
climate and lack of level ground constrain the potential for paddy development. The practice
of paddy cultivation is also determined in part by culture. Some ethnic groups do little, even
though they live on potentially favorable sites, whereas other groups have been energetic in
developing rice paddies around their villages (see Section 2.4.1). Most paddies are rainfed
and produce one crop per year, but some villages have limited streamfed gravity irrigation,
and are able to get two yields per year from some paddies (Chamberlain et al. 1996).
2.3.3 F a u n a
The fauna of NNT is generally of Himalayan affinity, but includes elements not found
elsewhere in the Himalayan Realm.
The first field wildlife survey of NNT wasn't made until 1994 (Timmins & Evans 1996).
This and a handful of subsequent surveys generally focused on baseline inventories of birds
and larger mammals. There have also been some focused collections of bats and small
mammals (Francis etal. 1996), herpetofauna (Robichaud & Stuart 1999) and fish (Kottelat
1998), but these groups remain much less well known than the birds and larger mammals.
NNT's invertebrates are virtually unstudied.
Surveys indicate that the upper watershed of Nakai-Nam Theun probably retains its
original complement of vertebrates, with the possible exception of rhinoceroses. The two
Southeast Asian rhinos, Lesser One-horned (a.k.a., 'Javan') Rhinoceros sondaicus and
Asian Two-horned (a.k.a, 'Sumatran') Dicerorhinus sumatrensis are among the word's most
threatened animals. Both occurred historically in Laos (Duckworth et al. 1999), and in two
16
areas of the country villagers report that some rhinos persist today, one of which is NNT
(author's own data).
Ten species of reptiles, 14 birds and 35 mammals listed as Threatened, Near-
threatened or Data Deficient in the 2004 IUCN Red List of Threatened Species (IUCN 2004)
have been recorded recently from NNT and the adjacent Nakai Plateau (NTPC 2005).
As measured by its birds and mammals, the fauna of NNT is remarkably rich. Three
factors help explain this: NNT's diversity of habitats and altitudes (altitudinal range is more
than 1700 m in the reserve), the overlap of Himalayan and Indomalayan faunal elements,
and endemism of many elements of the Annamites biota. The diversity and rarity of NNT's
mammals and birds, along with the quality and expanse of its forest cover, are what make it
a protected area of global importance. Following are some examples of the richness and
significance of NNT's fauna:
NNT has the highest diversity of both birds and mammals recorded in any protected
area in Laos (Ling 1999).
• More than 400 species of birds have been recorded in NNT (1/25th of the world's bird
species). This is amongst the highest bird diversity recorded in any protected area in
Asia, and probably the highest of any Asian protected area with a similar level of survey
effort. If it is accepted that bird diversity provides an appropriate basis for evaluating the
importance of an area for wildlife conservation, these totals establish NNT as the most
important site yet surveyed in the three countries of Indochina.
• At least nine species of non-human primate occur in NNT, all of them are on the
IUCN Red List.
• Twelve species of forest ungulates probably occur in the reserve - a very high total for
Asia; eight are on the IUCN Red List.
• Since the early 1990s, more new species of larger mammals have been described
from the Annamites than any area of similar size in at least the last one hundred years.
Nearly all of these probably occur in NNT. The importance of NNT is heightened by that
fact that, as the largest protected area in the Annamites, it probably harbors the world's
largest protected populations of most of these Annamite endemic and near-endemic
species. Table 2.2 summarizes the newly described or rediscovered mammals and their
occurrence in NNT.
17
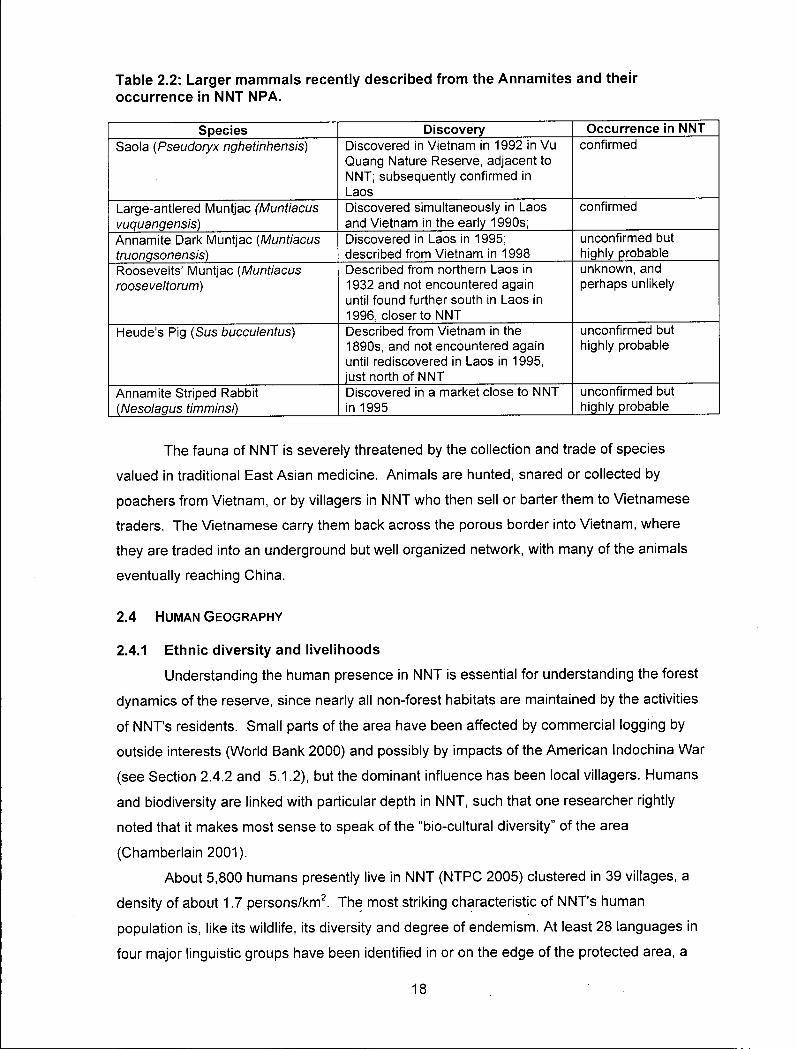
Table 2 .2 : Larger mammals recently descr ibed from the Annamites and their occurrence in NNT NPA.
Species Discovery Occurrence in NNT Saola (Pseudoryx nghetinhensis) Discovered in Vietnam in 1992 in Vu
Quang Nature Reserve, adjacent to NNT; subsequently confirmed in Laos
confirmed
Large-antlered Muntjac (Muntiacus vuquangensis)
Discovered simultaneously in Laos and Vietnam in the early 1990s;
confirmed
Annamite Dark Muntjac (Muntiacus truongsonensis)
Discovered in Laos in 1995; described from Vietnam in 1998
unconfirmed but highly probable
Roosevelts' Muntjac (Muntiacus rooseveltorum)
Described from northern Laos in 1932 and not encountered again until found further south in Laos in 1996, closer to NNT
unknown, and perhaps unlikely
Heude's Pig (Sus bucculentus) Described from Vietnam in the 1890s, and not encountered again until rediscovered in Laos in 1995, just north of NNT
unconfirmed but highly probable
Annamite Striped Rabbit (Nesolagus timminsi)
Discovered in a market close to NNT in 1995
unconfirmed but highly probable
The fauna of NNT is severely threatened by the collection and trade of species
valued in traditional East Asian medicine. Animals are hunted, snared or collected by
poachers from Vietnam, or by villagers in NNT who then sell or barter them to Vietnamese
traders. The Vietnamese carry them back across the porous border into Vietnam, where
they are traded into an underground but well organized network, with many of the animals
eventually reaching China.
2.4 HUMAN GEOGRAPHY
2.4.1 Ethnic diversity and l ivel ihoods
Understanding the human presence in NNT is essential for understanding the forest
dynamics of the reserve, since nearly all non-forest habitats are maintained by the activities
of NNT's residents. Small parts of the area have been affected by commercial logging by
outside interests (World Bank 2000) and possibly by impacts of the American Indochina War
(see Section 2.4.2 and 5.1.2), but the dominant influence has been local villagers. Humans
and biodiversity are linked with particular depth in NNT, such that one researcher rightly
noted that it makes most sense to speak of the "bio-cultural diversity" of the area
(Chamberlain 2001).
About 5,800 humans presently live in NNT (NTPC 2005) clustered in 39 villages, a
density of about 1.7 persons/km 2. The most striking characteristic of NNT's human
population is, like its wildlife, its diversity and degree of endemism. At least 28 languages in
four major linguistic groups have been identified in or on the edge of the protected area, a
18

remarkable cultural breadth for an area of just 3,500 km 2 . Three of the 28 languages and the
indigenous groups who speak them have been described by ethnographers only since 1996,
and are endemic to NNT. Linguistic and anthropological evidence suggests that NNT could
be the longest continually inhabited upland area of Laos or Vietnam (Chamberlain 1997,
1999).
Despite the ethnic diversity of NNT, there are commonalities in the livelihoods of its
residents. Nearly all live in discrete, generally isolated villages surrounded by forest.
Electricity is absent except for the recent appearance of micro hydro turbines owned by
individual households in some villages (in the dry season they generate only enough power
for one or two light bulbs). Village water is drawn by hand from nearby streams or rivers.
Houses are usually raised 1-3 meters above the ground on timber posts, and constructed
either of walls of split and woven bamboo or hand-sawn timber planks. Houses are clustered
together within clear village boundaries, with agricultural fields surrounding the village
(sometimes kilometers distant).
Water buffalo are the most highly valued domestic animals, and are used for draft
work, ritual sacrifices and to sell to purchase rice in years when harvests are poor. Other
common livestock are cattle, pigs and chickens. Domestic dogs are kept for protection and
hunting.
All villages rely on a mix of agriculture and hunting and gathering of forest and stream
products. Most protein comes from stream fish and aquatic intertebrates, and most calories
from the products of swidden agriculture. Swidden systems and cultivation intensities vary,
mainly with ethnicity, but typical crops are glutinous rice (the staple), cassava, corn, squash
and chili. Regenerating forest fallows are important for some NTFPs, such as medicinal
cardamom Amomum sp. Merchandise such as clothing and, in poor harvest years, rice, is
exchanged for or purchased from the sale of wildlife, NTFPs, livestock or labor.
In addition to its ethnic diversity, NNT is distinctive in that none of its residents belong
to the Lao ethnic group (called Lao Loum, i.e., 'lowland Lao'), the country's dominant
ethnicity. That is, Lao is the first language of none of NNT's residents. The four major ethnic
groups that reside in or use the area are the following, after Chamberlain et al. (1996):
Tai-Kadai: Tai language family. One language, Sek, is spoken in four villages in the
southern portion of NNT. The Sek comprise about 18% of NNT's population, and probably
arrived in the 1700s. Of all NNT's ethnic groups, they are the most attached to permanent
village sites, and have the greatest reliance on paddy rice and least on swidden. Although
their villages are some of the most remote in NNT, in general, the Sek probably have the
least direct reliance on the forest for their subsistence.
19
Vietic: Mon-Khmer language family. The Vietics comprise a diverse group of about
ten languages in the protected area, comprising perhaps 15% of the area's population. They
have the least reliance on agriculture and greatest reliance on forest resources of NNT's
residents (and in this sense, are culturally at the opposite extreme from the Sek). Some
Vietics have moved (involuntarily) from forest to village only since the 1970s, and a small
group reportedly still lives in the forest as hunter-gatherers in the southern end of the
protected area. Vietics are believed to be the original inhabitants of the area, possibly for
thousands of years. Their marginal agricultural production is based entirely on swidden, with
less emphasis on rice and more on tubers such as cassava than other groups. Vietics have
extensive spirit forests in the protected area (where disturbances are avoided) and taboos on
killing many large species of wildlife - all large cats, wild cattle, elephants and rhino
(Robichaud & Stuart 1999). As a consequence of their cosmology and livelihood strategy,
they have a comparatively light impact on the environment.
Katuic: Mon-Khmer language family. Although found in numerous villages in the
protected area, they comprise just one monolinguistic group, the Brou, which indicates
relatively recent arrival. The Brou may have settled in NNT only since 1860, following
cessation of Thai raids in the area (see Section 2.4.2, below). Although the most recent
arrivals, Brou comprise about two-thirds of the protected area's population, and due to their
numbers alone are the source of greatest impact on the forest. The livelihood strategy of the
Brou falls between that of the Sek and Vietic. Brou cultivation is based mainly on swidden
rice, with some cultivation of paddy where conditions of topography and soil allow.
Hmong: Hmong-Mien language family. The Hmong are industrious pioneering
swidden cultivators, who have been moving south into Laos from China (and to some extent
from northern Vietnam) for about 300 years. Wherever they are found in Laos, they usually
live at the highest elevation of all ethnic groups, usually above 1000 m (at least prior to
recent government programs to relocate them to the lowlands). There are a few Hmong
villages close to the northern periphery of NNT, and they probably hunt and gather in the
protected area's forests. There was formerly one Hmong village on the border of NNT, and it
represented the southern-most point of Hmong advance in Laos. GoL forced the village to
relocate away from the reserve in about 1996.
Figure 2.3 shows the distribution of the major ethnic groups within NNT's boundaries
(exclusive of recent extensions).
20

I I Vietic A Tai-Kadai © Katuic O unknown
| | Nakai -Nam Theun N P A & watersheds
Figure 2.3: Vi l lages by ethnicity in NNT NPA.
21
2.4.2 Some determinants of human distribution in NNT
Most of NNT's villages are found in the heart of the protected area in clusters, or
'enclaves', along NNT's major rivers (Figure 2.2). A series of three historical influences since
the early 1800s have influenced the composition and distribution NNT's ethnic groups, and
thus the patterns of forest change in the reserve: Siamese incursions in the 1800s, America's
Indochina (or Vietnam) War (early 1960s-1973), and the implementation of various policies
since the ascension to power of the Lao communist government in 1975.
Siamese incursions of the 1800s: In the 19 t h Century, the territory that is now
central Laos stood between the Kingdom of Siam (modern Thailand) and the territory of one
of its rivals, the Emperor Minh Mang at the court of Hue, Vietnam. To prevent Lao villagers
from providing material and labor to a potential Vietnamese invasion of Siam, between 1834-
1847 Siam encouraged mercenaries to cross to the Lao side of the Mekong river, to raze and
pillage villages and remove their inhabitants to the Siam side of the Mekong River (Breazeale
& Smukarn 1988). This had a significant impact on the human distribution of NNT, the
effects of which remain evident today. Some residents, such as the Sek, were permanently
resettled from the area of NNT to what is now northeastern Thailand (this may explain why
the only Sek villages in NNT today are in the opposite side of the reserve from Thailand, near
the Vietnam border). Other groups used the area of NNT as a refuge, fleeing into its dense
montane forests to escape the Siamese raiders (Chamberlain et ai., 1996). The patterns of
ethnic distribution in the reserve today are in large measure a consequence of the upheavals
caused by the Siamese raids more than 150 years ago.
American Indochina War, 1961-1975: The former North Vietnam (and its
successor, the unified Democratic Republic of Vietnam) forms the eastern border of NNT.
The escarpment of the Mu Gia Pass, which was the head of the Ho Chi Minh Trail (HCMT) in
Laos, marks the reserve's southeastern boundary. For almost 15 years (from about 1959
onward) North Vietnam used the HCMT to move men and supplies south to support Viet
Cong guerrillas fighting the U.S. military and its allies in South Vietnam, and to move
communications, some wounded, and prisoners of war back north. Northern legs of the trail
network ran through North Vietnam, but the presence of the U.S. and South Vietnamese
militaries in South Vietnam forced the North Vietnamese to divert the trail through Laos
before reaching the border between the two Vietnams. Mu Gia is the last pass through the
Annamites into Laos above the 17 t h parallel, which marked the border between North and
22
South Vietnam. The North Vietnamese had to use it, U.S. military planners knew it, and thus
it became one of the most intensely bombed sites of the war (Prados 1999):
The proximity of the NNT area to both North Vietnam and the HCMT had two
consequences for residents of the area. Some villages in the lower watershed, near the
Nakai Plateau and under nominal control of the US-allied Royal Lao Government, were
evacuated to more settled areas beyond NNT, probably to keep them from falling under the
influence of the Lao communist insurgency, the Pathet Lao, and their North Vietnamese
supporters. Villages in the more remote, upper watershed were bombed, apparently to
prevent them from supplying food and other support to the HCMT network.
Some NNT villagers report that for several years during the war the threat of
American bombing forced them to abandon their villages and hide in the forest (as they had
a century earlier to escape the Siamese). One village reported that they hid from 1966 to
1971 (Chamberlain etal. 1996) and another from 1968 to 1973 (author's own data). They
survived on wild tubers and other forest foods until they were able to return to resettle their
old villages (or settle new sites) when the American military withdrew from Indochina in 1973.
This extended interruption in villagers' normal cultivation cycles has particular import for this
study, since it complicates interpretation of their impact on the forest.
Rural policies of the Government of Lao PDR: The current communist
government of Lao PDR came to power in December 1975, eight months after the fall of
Saigon marked the end of the Vietnam War. Since then, several GoL policies have affected
indigenous livelihoods and thus probably also forest cover in NNT:
1. In the mid-1970s the new government took some of the non-sedentary hunter-
gatherer Vietic groups out of the forest in NNT and settled them into existing villages of other
ethnic groups, in an attempt to bring them into the Lao mainstream. The consequences were
disastrous, since the groups adapted poorly to village life and separation from their traditional
territories, and many died. By 1996, one of the groups had only five surviving families - the
last speakers in the world of their language (Chamberlain et al. 1996).
2. As noted earlier, until the mid or late 1990s, there was one Hmong village on the
edge of NNT. In contrast to the rotational swidden practices of the other ethnic groups in
NNT, Hmong commonly clear large slopes of forest, cultivate it to nutrient exhaustion and
past the point of recovery, then move to another mountain, leaving in their wake swales of
Imperata grass. But the Lao government drew a policy line at the border between
Bolikhamxay and Khammouane Provinces, which cuts through the northern end of NNT
(most of NNT lies in Khammouane Province), and barred any Hmong from moving further
23
south. In about 1996, when the Hmong village on the edge of NNT (the southernmost
Hmong village in the country) attempted to relocate further south, into NNT, government
authorities forced it elsewhere, away from the protected area. Since then, no Hmong
settlement has been allowed in-upland areas of Khammouane Province or NNT. Centuries
of Hmong expansion south is at an end, at least in rural Laos.
3. More recently, a GoL program of village land allocation (part of its program to
stabilize swidden cultivation nationwide), has reduced the amount of land legally available to
villages for cultivation in many areas of Laos. As of early 2004, land allocation had been
implemented in at least one village I visited in NNT, but it is not clear to what extent it has
been implemented (or followed) in other villages in the reserve.
2.5 MANAGEMENT
NNT was designated as a conservation area by Prime Ministerial Decree in 1993.
The reserve has a modest headquarters (located outside the area, in the district capital), a
head and a small staff. However, for years on-the-ground management has been limited,
with few resources or staff, and low staff professionalism and inclination to venture into the
forest or the NPA's villages. Patrolling is provided mainly by a single post near the Vietnam
border, manned by a contingent of district border police. There are no visitor facilities or
hiking trails, as are found at several nature reserves in neighboring countries (and to a
limited extent in one or two NPAs elsewhere in Laos).
Management planning has intensified in recent years in response to a proposal to
build a US$1.3 billion hydroelectric dam, Nam Theun 2 (NT2), on the edge of NNT (the
project will inundate 430 km 2 of the Nakai Plateau; the western shore of the reservoir will
become the eastern boundary of NNT NPA). The electricity will be exported to Thailand. In
March 2005, the World Bank agreed to support the project, with the condition that part of the
dam's annual revenues (about 1%, or $1M per year) be earmarked for management and
protection of NNT, and that a comprehensive management plan be in place before
construction begins. With Bank support NNT has seen, since the mid-1990s, by far the most
intensive (and expensive) management planning of any nature reserve in Laos. It yielded
several volumes of management strategies (IUCN 1997, 1998b, a, 1999; W M P A 2004, 2005)
and two editions of an action plan for the conservation of the Saola (Robichaud 1997, 1999).
The final draft of a comprehensive NNT management plan was completed in January, 2005
(WMPA 2005), with implementation due to begin in 2005.
A proposition common to the NNT management strategies prepared to-date is that a
major threat to the reserve is swidden cultivation by its residents. This is essentially the
raison d'etre for some incipient Integrated Conservation and Development Projects (ICDPs)
24
that have been tried in the area - to help villagers find less destructive livelihoods, particularly
cultivation methods. The construction of vehicle tracks to interior villages has also been
proposed as a means to raise villagers' standards of living (through connections to extension
services and external markets), thereby reducing their need to exploit the forest for
agricultural land and other resources (IUCN 1997). Unfortunately, a key element required to
conserve forest through village-focused projects is missing: an understanding of the trends
and patterns of anthropogenic forest loss in NNT. Hence this thesis.
25

3 M E T H O D S
3.1 POTENTIAL SOURCES OF DATA
3.1.1 Introduction
Various sources of data were assessed for their potential to reveal historical trends of
forest change in NNT. Each has strengths and weaknesses, none alone proved
comprehensive, and so more than one was used. Given the modest scope of this study and
the considerable bureaucratic and logistical barriers to fieldwork in Laos, focus was placed
on ex situ sources of information.
The following section describes the types of data examined, with comments on their
relative merits and eventual importance to the study.
3.1.2 Paper topographic maps
Laos's often tragic recent history (first a French colony, and then a player in the
American Indochina War) has resulted in a relatively rich body of topographic maps. Maps
showing land use features in NNT are available from four eras in recent Laos history:
• 1:100 000, Carte de I'lndochine, data from 1909-1929, partially updated in 1943. These
maps were produced by the French colonial administration, and are now held in the
archives of France's Institut Geographique National (IGN), from which color copies were
obtained. They show and name NNT's villages at the time, as well as other features such
as major watercourses. The maps' habitat classifications are very broad, basically only
degraded habitat, forest (or perhaps 'dense vegetation') and rice paddies. There is no
way to know, for example, if scrub and secondary forest were grouped under degraded
habitat or forest. Consequently, the maps were not suitable as a baseline for this study,
except for village locations.
• 1:50 000, U.S. Army Map Service 1965-1967 and U.S. Army Topographic Command
1970. These maps are at a larger scale than the earlier French maps and they
distinguish more habitat types. They are judged to be of very high quality and accuracy,
given that they were made by a military involved in a conflict in the area mapped (C.
Feldkotter, Mekong River Commission, pers. comm.). These maps are the earliest good
starting point for this study.
1:100 000, Republique Democratique Populaire Lao, Service Geographique d'Etat, data
from 1981. These maps were produced by the Lao government with Soviet technical
assistance. Although smaller scale than the earlier U.S. Army maps, they distinguish
more habitat features. They also indicate the height and diameter of representative trees
at selected locations in the forest (which suggests the map data were groundtruthed).
26
• 1:25 000, Lao People's Democratic Republic, National Geographic Department, data
from 1992-1993. They were produced in partnership with, and technical assistance from,
the government of Japan. They distinguish the same set of habitat features as the earlier
1:100 000 series, but their larger scale suggests greater accuracy. Unfortunately, the set
covers only about half of NNT.
The principal advantage of the topographic maps is their detail. Using them together
in a comparative time series, however, is complicated by the facts that they are at different
scales and projections, and were made by different agencies, which used different definitions
for the habitat types the maps distinguish. These differences are summarized in Table 3.1.
27

Table 3.1: Attributes of topographic maps of NNT NPA.
Map data year(s) Scale Publisher Relevant classified habitats Horizontal datum
Projection
1909-1929; updated 1943
1:100 000 Govt, of France • rice paddies • degraded habitats • forest
Clarke spheroid Bonne
1965-1970 1:50 000 U.S. Army • clearing • plantation • marsh or swamp • rice field [paddy only, not swiddens] • brushwood • bamboo • forest-open canopy* • forest-closed canopy**
Indian 1960 (Everest)
Transverse Mercator
1981 1:100 000 Govt, of Lao PDR
• rice paddy • upland rice field • plantation • marsh • herbaceous growth ("plante herbacee") • brush • bamboo • small trees ("arbrisseaux") • cleared forest ("foret clairere") • open forest ("foref claire") • dense forest ("foret dense")
Krasovskie [sic] Gauss
Dec. 1992-Jan. 1993
1:25 000 Govts, of Lao PDR and Japan
• rice paddy • upland rice field • plantation • swamp • grass/weeds • brush • bamboo • thin forest • dense forest
Indian 1975 (Everest)
UTM Zone 48
*Defined by the legend as "...25%-75% of ground area is concealed under an uneven, discontinuous cover". **Defined by the legend as "...75% or more of ground area is concealed under a dense cover".
28

3.1.3 Aerial photographs Aerial photos made in the 1950s by the French exist for, at least, areas of Vietnam
(Fox et al. 2000) and Cambodia (I. Baird pers. comm.), but apparently not the area of NNT
(C. Le Bail, IGN, pers. comm.). The area's remote location and sparse population probably
made it of little interest to French colonial cartographers.
The area's proximity to Vietnam and the Ho Chi Minh Trail, however, lent it
considerable interest to the Americans in the 1960s and 1970s, and areas close to or in what
is now NNT NPA were the subject of aerial reconnaissance photography (e.g., Prados 1999,
pg. 169). A collection of U.S. reconnaissance photos of Laos from the late 1960s and early
1970s are held by the Vietnam Archive of Texas Tech University, but they can be examined
only on-site. Constraints of time and cost precluded this. Furthermore, aerial photos were
used to produce the high quality 1960s 1:50 000 topographic maps used in this study, so
examination of the archive's photos would have been to some degree redundant.
The Lao National Geographic Department reportedly holds aerial photos from the
1980s of the whole country (most likely those on which the topographic maps of the 1980s
were based), but I was refused access to them. The only accessible aerial photographs I had
access to were the 1992/1993 set from which the 1:25 000 topographic maps were made,
but these were not analyzed separately from the maps. There seemed little to gain by re
interpreting photos that had already been professionally interpreted and georectified in the
process of making the maps.
3.1.4 Satellite imagery
3.1.4.1 Corona
In 1960, one of the U.S.'s earliest orbital satellites, "Corona", was fixed with a film
camera and sent aloft to photograph areas of strategic military interest to the U.S., including
Indochina. Exposed film was rigged to release from the satellite and fall to earth by
parachute, to be snagged from the air by a chase plane. These black and white photographs
were collected until 1972. They have been declassified, and paper copies are publicly
available. For this study, the approximately 500 images that cover some part of NNT
between the early 1960s and early 1970s were examined. Unfortunately, two factors limit
their value. First, out of the hundreds of images, only about ten had little cloud cover.
Second, the resolution and general quality of the photographs are poor, making interpretation
of habitat features difficult and of doubtful accuracy (C. Feldkotter, Mekong River
Commission, pers. comm.). Consequently, Corona images were not used.
29

3.1.4.2 Landsat
Images of NNT from several modern satellite platforms are available to the public,
such as SPOT, RADAR and Landsat. Landsat was chosen as the best compromise of
suitability, availability and cost. Landsat scenes of Laos as early as 1972 are available, and
a search was made of various Landsat data holding centers in North America and Southeast
Asia for suitable images. The goal was to sample three epochs: mid-1970s, mid-1980s and
recent (i.e., 2000 or 2001). I purposely did not seek either the earliest (1972) or most recent
scenes available, for the following reasons. As noted earlier, some villages in NNT
suspended much of their agricultural activity and hid in the forest for several years, until
1973, to avoid attacks by American and Royal Lao aircraft, and thus the amount of cleared
land shown on satellite images from this period would probably be less than is representative
of their normal livelihoods. More recently, with increased passage of time there is increased
likelihood that the Lao government's land allocation program has reached villages in NNT
and constrained the amount of cleared land below traditional norms. Thus, Landsat images
from 2001 are more likely to reflect traditional patterns of forest use than are images from,
say, 2003.
It proved quite difficult to assemble suitable coverage, i.e., scenes with little cloud
cover, sufficient image quality, and in the same month or at least season in each of the three
sample periods. Initially, a listing of available scenes was requested from RADARSAT
International in Richmond, British Columbia. This did not yield useable images as most of
them had greater than 20% cloud cover (the majority had 70 - 80% cloud cover, consistent
with the Corona satellite photographs). The search was expanded to Landsat holdings
elsewhere in North America, namely the University of Maryland, the Tropical Rain Forest
Information Center (TRFIC) at Michigan State University (MSU) and the U.S. Geographic
Service (USGS). This yielded some images within the desired parameters, but not a
complete set. I also queried institutions in Laos that might have purchased their own
Landsat coverage of NNT, such as the Nam Theun 2 Electricity Consortium and the Ministry
of Agriculture and Forestry, but found nothing useable.
The difficulty of assembling a complete set of suitable images was compounded by
the fact that for the 1970s, two Landsat scenes are needed to cover all of NNT, and three
scenes are needed from the 1980s onward, due to changes in the satellites. Another
problem is that the holding centers had few images from the early to mid 1980s. This period,
curiously, is something of a blank for Landsat coverage of Laos, at least among North
American sources. In an attempt to solve this, the search was widened to Landsat Ground
Receiving Stations in India and Thailand, in the event the Asian centers possess downlinked
30
scenes unavailable in North American holding centers. However, repeated inquiries by
RADARSAT International on my behalf and directly by e-mails to regional representatives of
the centers did not yield any response. It is quite possible that, while these centers have
scenes from the 1980s, they are stored, uncatalogued, on the original magnetic tapes (C.
Feldkotter, Mekong River Commission, pers. comm.). Another possibility is that the receiving
station, in an effort to conserve tapes and reduce cost, continually copied new data over the
old. This was reportedly once routine at ground stations in India (B. Klinkenberg, University
of British Columbia, pers. comm.).
The result of balancing these requirements and constraints was the selection of
images from 1976, 1989 and 2001.
3.7.4.3 SPOT
In 2000, the National Office of Forest Inventory and Planning (NOFIP; now known as
the Forestry Inventory and Planning Division, FIPD) of the Lao Department of Forestry (DoF)
collaborated with an advisor from the Lao-Swedish Forestry Program (LSFP) to map land
cover in two sample provinces in two eras about ten years apart, 1990 and 2000. They
based their analysis on Satellite Image Maps (SIMs) at 1:100 000 and 1:50 000 scale
assembled from satellite imagery acquired by SPOT (Systeme Pour I'Observation de la
Terre) (F. Fidloczky, pers. comm). One of the provinces sampled was Khammouane, in
which more than 80% of NNT lies. FIPD generously gave me digital copies of the results,
from which I isolated NNT.
Their classifications are detailed and potentially very useful, with more than ten
habitats distinguished in the area of NNT. They also distinguished four incremental timber
stand classes (based on trunk diameter) and three crown density classes. Unfortunately,
significant anomalies in the data make them suspect. For example, in 2000, 26% of the area
of NNT is classified as forest of the largest stand class (> 60 cm dbh), but in 1990 none of it
is. In 1990, there is no Mixed Coniferous Forest, but by the year 2000 58,300 ha - ca. 17%
of NNT - has appeared. Such differences are without doubt due to differences in the method
of classification rather than changes on the ground. The project's technical advisor proofed
the 2000 data set and found and corrected errors, but was unable to proof the 1990 set (J.
Fidloczky, pers. comm.). Consequently, the SPOT data were used only peripherally, mainly
as a comparative check of my Landsat analysis.
3.1.5 Local informants and field observations
The most in-depth source of information on patterns of forest use in NNT is
undoubtedly the local residents who have been responsible for most of the anthropogenic
changes in forest cover. Discussions with them followed by tours of their local forests and
31
agricultural areas would likely yield the highest quality information. Unfortunately, while I
have had occasion to work in NNT, most of it was before this thesis was conceived in 2001.
It is difficult to get permission from GoL to work in the area for extensive and predictable
periods, and thus specific field work to help answer the research questions was beyond the
scope of this study.
Nonetheless, I visited the area on the ground for several days each in 2002, 2003,
and 2004. In 2003,1 also had occasion to meet with and question villagers from areas that I
did not visit. Finally, wildlife field surveys I conducted in the area in 1995, 1997 and 1998-
1999 have allowed me to ground-truth post facto some of the geodata from notes and
memory.
3.1.6 Written records
There are written sources with varying potential to shed some light on the history of
NNT:
Precolonial records: Laos became a French colonial possession in 1893. Little
written information before this time on the area encompassed by NNT is known. A
remarkable exception has recently come to light, however - administrative records from a
former Vietnamese border post, Quy Hop, located opposite NNT near the headwaters of the
Nam Noy river. Surviving records date from the early 17 t h century, and while, naturally, do
not give detailed descriptions of forest cover in NNT, they provide some indications of habitat
type and the level of human activity in the area at the time (Tran Van Quy 2002).
French colonial records: The area now recognized as Laos was part of the French-
controlled Indochinese Union from 1893 - 1954, (excluding a period during World War II,
when it fell under control of the Japanese). There was a French border post on Route 8,
near the northern border of NNT, and villagers from Ban Kunaeh in the southern portion of
the reserve showed me a site where they say the French attempted to mine gold in the
1950s.
The written records of the French Indochina colonial administration are held at an
archive in Aix-en-Provence, France, but no attempt was made to search them for information
related to NNT. Given the remoteness of NNT, the generally limited French colonial attention
to Laos (compared to their possession in Vietnam), it is unlikely that the French archives
would yield much information - and almost certainly no quantitative data - on the past extent
of forest cover in NNT or the livelihoods of its residents.
32
Biological and social surveys: During the colonial period and into the 1960s, some
biological expeditions were mounted in Laos, and while some bird specimens were collected
in the area of NNT (Dickinson 1970), no one left a published description of the area. There is
an English language account of a brief (about 10 days) hunting expedition to the Nakai
Plateau by an American in the late 1920s (Legendre 1936). However, it provides little
information on the watershed above the Plateau (i.e., the area of analysis for this study).
The first formal biological field surveys of Nakai-Nam Theun started in 1994, and
have continued intermittently to-date, under the auspices of GoL, often in partnership with
the Wildlife Conservation Society (WCS) and IUCN. Some of these surveys were part of
preparatory studies for the Nam Theun 2 dam. Included amongt this work for NT2, from
1996 onward, were several studies of the culture and livelihoods of NNT's residents,
although few of them in-depth. The most important, informative publication on the biology of
the area remains the report of the first 1994 survey (Timmins & Evans 1996), and for social
aspects the first surveys by Chamberlain et al. (1996).
In summary, the only detailed written information on either the biology or culture of
NNT is of recent origin, since 1994. Consequently, these later studies were the only written
ones used in any detail, and mainly as supplemental information.
3.1.7 Conc lus ion
Geodata are the only feasible sources of information sufficiently detailed to answer
the principal research questions. Of these, I chose topographic maps and Landsat as the
best primary sources. The object was to use them independently, one as a check of the
other, in a two-step, sequential process: first describing the general patterns of forest change
from the detailed but internally inconsistent (e.g., scale variation) topographic maps, and then
comparing the results to those from the less detailed but more uniform Landsat data. The
SPOT satellite data were used as a third corroborative check, but only sparingly given the
uncertainty of their accuracy.
In all phases of the analysis, my first-hand knowledge of NNT and written reports of
other first-hand observers were used to supplement, verify and refine the information from
the geodata.
Analysis from Landsat covers the same length of time as the map analysis (about 26
years), but shifted forward about a decade. Together then, the two encompass a span of
about 36 years. Data on village locations, starting from the French topographic maps, is
available for a span of more than 60 years.
Written material was used to describe other trends relevant to forest cover in NNT,
and to attempt to elucidate causes for any observed changes in the area's forest cover.
33

3.2 ANALYSIS OF GEODATA
3.2.1 Topographic Maps Maps covering NNT from the four periods described above were acquired and
analyzed. Three of these sets, 1965-1970 1:50 000 (11 sheets), 3 1981 1:100 000 (seven
sheets) and 1992-93 1:25 000 (21 sheets) were scanned, georectified to one another and
digitized in ArcView 3.3 for the major habitat features distinguished on their legends and all
named villages. For the 1:50 000 set, a research assistant hand digitized on a digitizing
tablet two separately acquired sheets from 1966 and 1967. The results were substituted for
those from corresponding, scanned 1970 sheets, in order to take the analysis as far back as
possible. The fourth set, the 1943 French maps, was used without scanning. The maps'
principal useful data, village locations and names (the maps distinguish few habitat features),
were digitized manually in ArcView.
Analysis of the maps was complicated by five constraints, each principally the result
of the fact that they were produced by different agencies. Each is discussed below with its
attempted solution.
1. Only about one-half (54%) of NNT is covered by the 1992/93 1:25 000 map series.
This necessitated two domains of analysis across all the maps: comparison of the full 1960s
and 1980s map sets to one another, and comparison of the 1960s, 1980s and 1990s maps
for just the area covered by the limited 1990s set.
2. There is no way to know if habitat classifications were applied consistently across
the map sets. Although the maps use broadly similar (though not identical) habitat
classifications, the various cartographic agencies may have defined these habitats
differently. For example, the 1960s 1:50 000 set shows "open canopy" forest in six of NNT's
seven watersheds; the 1981 set shows the presumed equivalent, '"foret claire", in just one
watershed; and in the 1990s, maps again show "thin forest" in six watersheds. This
suggests that the cartographers used different definitions of open forest.
A more specific and certain example of the variation in habitat definition is the case of
the Phou Vang massif, a mountain that divides the watersheds of the Nam Pheo and Nam
One in the southern portion of the protected area. In 1998, with considerable difficulty, a local
guide and I reached the summit of the massif, two days' walk from the nearest village.
Villagers said neither they nor anyone they knew had ever been to the top (it is nearly
inaccessible, due to steep topography and dense vegetation). It is highly unlikely, then, that
the plant community has changed during the span of this analysis. The summit is dominated
3 Since only one of the eleven sheets was from 1970, these will hereafter be referred to as the '1960s' maps.
34
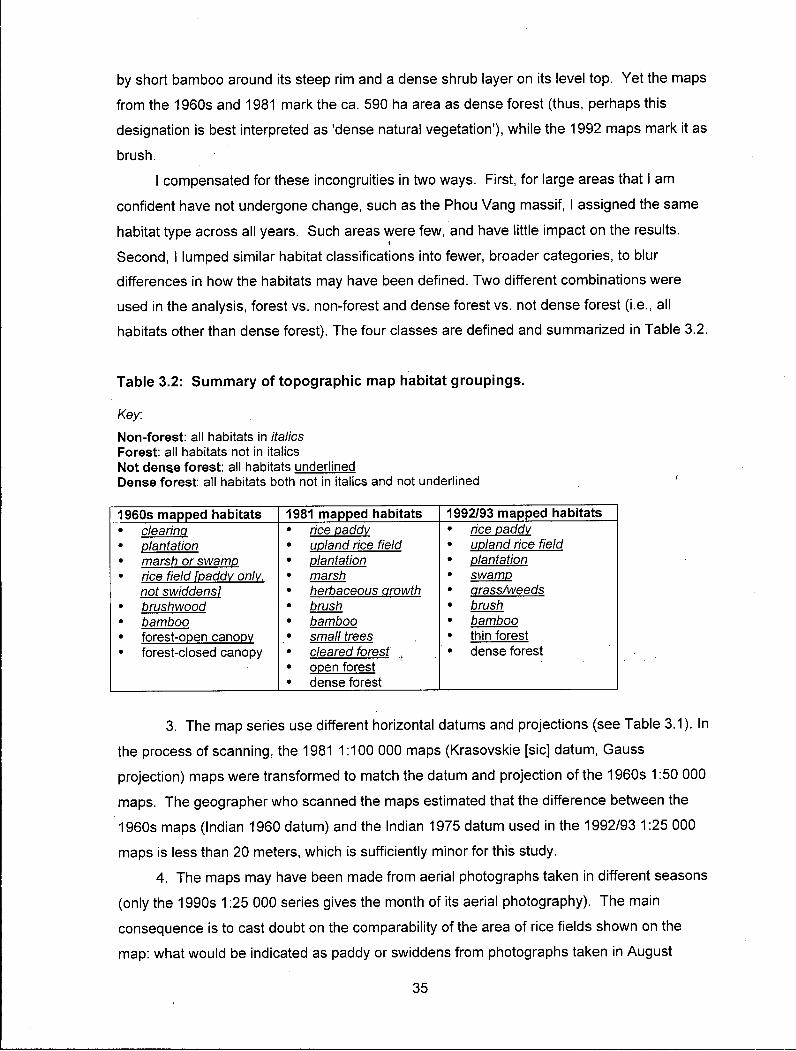
by short bamboo around its steep rim and a dense shrub layer on its level top. Yet the maps
from the 1960s and 1981 mark the ca. 590 ha area as dense forest (thus, perhaps this
designation is best interpreted as 'dense natural vegetation'), while the 1992 maps mark it as
brush.
I compensated for these incongruities in two ways. First, for large areas that I am
confident have not undergone change, such as the Phou Vang massif, I assigned the same
habitat type across all years. Such areas were few, and have little impact on the results.
Second, I lumped similar habitat classifications into fewer, broader categories, to blur
differences in how the habitats may have been defined. Two different combinations were
used in the analysis, forest vs. non-forest and dense forest vs. not dense forest (i.e., all
habitats other than dense forest). The four classes are defined and summarized in Table 3.2.
Table 3.2: Summary of topographic map habitat groupings.
Key: Non-forest: all habitats in /'ra//'cs Forest: all habitats not in italics Not dense forest: all habitats underlined Dense forest: all habitats both not in italics and not underlined
1960s mapped habitats 1981 mapped habitats 1992/93 mapped habitats • clearing • rice paddv • rice paddv • plantation • upland rice field • upland rice field • marsh or swamp • plantation • plantation • rice field fpaddv only. • marsh • swamp
not swiddensl • herbaceous arowth • arass/weeds • brushwood • brush • brush • bamboo • bamboo • bamboo • forest-ooen canopv • small trees • thin forest • forest-closed canopy • cleared forest • dense forest
• open forest • dense forest
3. The map series use different horizontal datums and projections (see Table 3.1). In
the process of scanning, the 1981 1:100 000 maps (Krasovskie [sic] datum, Gauss
projection) maps were transformed to match the datum and projection of the 1960s 1:50 000
maps. The geographer who scanned the maps estimated that the difference between the
1960s maps (Indian 1960 datum) and the Indian 1975 datum used in the 1992/93 1:25 000
maps is less than 20 meters, which is sufficiently minor for this study.
4. The maps may have been made from aerial photographs taken in different seasons
(only the 1990s 1:25 000 series gives the month of its aerial photography). The main
consequence is to cast doubt on the comparability of the area of rice fields shown on the
map: what would be indicated as paddy or swiddens from photographs taken in August
35
during the growing season might appear simply as 'cleared' land a few months later, after the
harvest. This is further rationale for lumping similar habitats, as described above.
5. Most serious of the constraints is the variation in scale of the maps. Topographic
maps are only approximations of the landscape, and the diversion of that approximation from
reality increases with decreasing map scale. For this study, the principal consequence of
scale variation is variation in the size of the minimum mapping unit (MMU), the size of the
smallest habitat polygon that the cartographer distinguished from surrounding dominant
habitat. The MMU varies with factors other than scale, such as the needs of the mapping
agency and the feature being mapped (for example, with these maps the MMU for clearly
defined anthropogenic features such as rice paddies was apparently smaller than for
amorphous areas of brush), but scale differences are the major influence.
Small clearings distinguished from the surrounding forest in the preparation of the
1960s 1:50 000 map may have been ignored at the smaller 1981 1:100 000 scale, leaving
the area shown as unbroken forest. Given that on maps of NNT dense forest (or, at least,
dense natural vegetation) is the 'background', or 'default', cover type from which other
habitats are distinguished, all else equal, analysis of the 1:50 000 maps might show more
clearing than 1:100 000 maps simply due to their larger scale, even if they were made from
the same aerial photographs and by the same agency.
On the other hand, a cluster of small cleared areas distinguished as individual
polygons at 1:50 000 might be merged into one large, cleared polygon at 1:100 000, resulting
in an overestimation of the area of clearing area at that location.4
These are opposing effects, but examination of the maps coupled with my experience
in NNT suggests that, as map scale decreases, lumping of discrete cleared areas into larger
polygons is likely to be of greater significance than the exclusion of isolated clearings smaller
than the map's MMU. This net result would be overestimation of cleared area with
decreasing map scale.
In any case, I attempted to correct for effects in both directions by the following:
Compensation for the omission of small polygons: On the smaller scale 1:50:000 and
1:100 000 maps the smallest polygons distinguished of each habitat type were identified and
measured. These were assumed to represent the MMUs. Next, when comparing these sets
to maps of larger scale (1:100 000 to 1:50 000 and 1:25 000, and 1:50 000 to 1:25 000), all
polygons smaller than these MMUs on the larger scale maps were excluded from
4 Similarly, just as small clearings within forest might be ignored on smaller scale maps, small forest patches within larger clearings might be ignored, too. But NNT's land use patterns suggest that the former is much more common - villagers more often open a swidden within a larger forest area than they leave a forest patch within a degraded area.
36

calculations of habitat area. The effect is to underestimate the absolute area of each habitat
on the more accurate, larger scale maps, but it transforms the measurements into indices
that are comparable map-to-map. This is consistent with the goals of the project - to identify
trends rather than absolute values of forest cover change in the reserve.
Compensation for the merging of small polygons: Examination of the smallest scale
(1:100 000) maps suggests that in degraded areas of NNT, the cartographers merged
deforested patches into larger, homogenous areas of clearing. Therefore, I replicated this
process for the 1:25 000 and 1:50 000 scale maps, by digitizing in ArcView single large
polygons around the outer limits of clusters of non-forest areas. This replicated the
appearance of the 1:100 000 maps. The process was subjective (e.g., in determining what
constituted a cluster), but it may have been equally subjective for the cartographers of the
1:100 000 series.
The two processes were combined to produce versions of the 1:25 000 and 1:50 000
maps that approximated the cartography of the 1:100 000 series.
Due to the subjectivity of the homogenization process, I also compared the maps by a
more objective analysis, that of convex hulls. A convex hull is a polygon drawn around a
cluster of points, such that it encloses all points within the minimum total length of segments
possible (a rubber band stretched around a cluster of protruding nails forms a convex hull).
Using an algorithm known as "Jarvis' march" or "gift-wrapping" (Hausner 2005), I drew
convex hulls around non-forest areas shown on the 1960s maps, with the exception of the
following:
• the uninhabited Nam One watershed
• natural clearings such as river banks and rock outcrops
• isolated clearings smaller than the smallest non-forest polygon on the 1981 maps
• clearing along the edge of the Nakai Plateau.
The result was four convex hulls, for the Nam Theun and Nam Mon watersheds and the
combined Nam Kata/Nam Xot and Nam Noy/Nam Pheo watersheds. These last four
watersheds were combined as pairs because large areas of clearing are shared across their
boundaries. I then calculated how much of the 1981 and 1992/93 non-forest is contained
within the convex hulls bounding the 1960s non-forest.
In summary, in order to compensate for both the variation in geographic coverage of
the maps (i.e., only part of NNT for 1992/93) and for their different scales, results were
obtained from comparisons of various combinations of the maps, as summarized in Table
37

3.3. The point is to compensate for the diversity in the maps by comparing them in a
diversity of ways, to test if a consistent result emerges under all reasonable assumptions.
Table 3.3: Combinat ions of maps compared for habitat areas.
Full area of NNT Limited area covered by 1:25k map series
All polygons, as depicted on the maps. 1:50k, 1:100k 1:25k, 1:50k, 1:100k
1:25k and 1:50k maps homogenized to approximate the 1:100k map cartography.
1:50k, 1:100k 1:25k, 1:50k, 1:100k
Convex hulls 1:50k, 1:100k 1:25k, 1:50k
3.2.2 Landsat
The digital Landsat images acquired for analysis (Table 3.4) represent the best
compromise with respect to limitations of availability.
Four constraints complicated use of the Landsat data. Each is discussed below with
its attempted solution:
1. The dearth of available coverage for the 1980s gave me the choice of only a single
year from that decade, 1989.
2. For the 1980s onward (Landsat 5-7), three scenes are needed to cover NNT, due to
the unfortunate position of NNT on an image path 'corner' (just two scenes from the
1976 Landsat M S S platform are needed). This increased the cost and complicated
the process of orthorectifying and merging the scenes into a single image.
Consequently, I limited analysis in 1989 and 2001 to two scenes covering most of
NNT. The scenes encompass 83% of the area of analysis, and the most important
watersheds from the perspective of this study, those with large concentrations of
inhabitants of the protected area. This was deemed a sufficient sample for the
objectives of the Landsat analysis.
3. The three sample epochs are covered by three different Landsat platforms. The main
issue for the analysis is the difference in resolution of the image pixels among the
platforms: 80 x 80 m pixels (0.64 ha) for the earliest platform (Landsat 2; 1976), and
30 x 30 m (0.09 ha) for later platforms (Landsat 5 and 7). This was resolved first by
resampling the 80 m resolution (1976) to 60 m and, more importantly, using in all the
classifications a minimum Mapping unit of pixel clusters totaling 2.88 ha. That is,
comparability was achieved by making the resolution of the classification coarser than
the coarsest resolution of the satellite imagery.
38
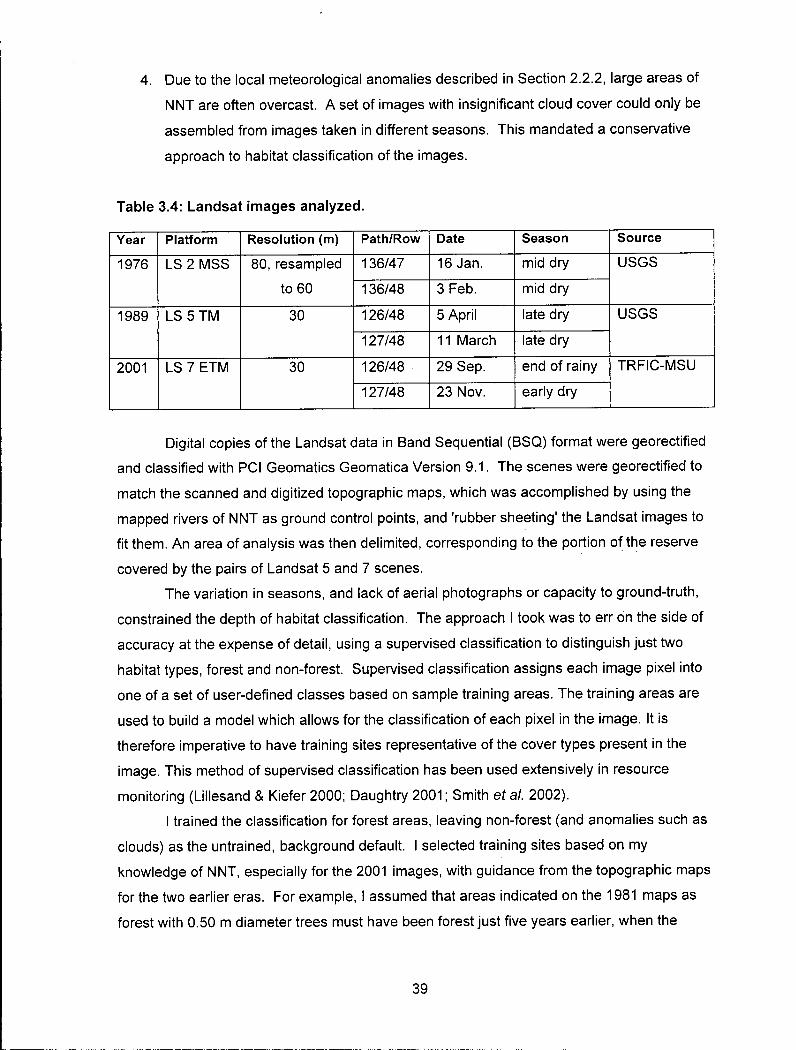
4. Due to the local meteorological anomalies described in Section 2.2.2, large areas of
NNT are often overcast. A set of images with insignificant cloud cover could only be
assembled from images taken in different seasons. This mandated a conservative
approach to habitat classification of the images.
Table 3.4: Landsat images analyzed.
Year Platform Resolution (m) Path/Row Date Season Source
1976 LS 2 M S S 80, resampled
to 60
136/47 16 Jan. mid dry U S G S 1976 LS 2 M S S 80, resampled
to 60 136/48 3 Feb. mid dry
U S G S
1989 L S 5 T M 30 126/48 5 April late dry U S G S 1989 L S 5 T M 30
127/48 11 March late dry
U S G S
2001 LS 7 ETM 30 126/48 29 Sep. end of rainy TRFIC-MSU 2001 LS 7 ETM 30
127/48 23 Nov. early dry
TRFIC-MSU
Digital copies of the Landsat data in Band Sequential (BSQ) format were georectified
and classified with PCI Geomatics Geomatica Version 9.1. The scenes were georectified to
match the scanned and digitized topographic maps, which was accomplished by using the
mapped rivers of NNT as ground control points, and 'rubber sheeting' the Landsat images to
fit them. An area of analysis was then delimited, corresponding to the portion of the reserve
covered by the pairs of Landsat 5 and 7 scenes.
The variation in seasons, and lack of aerial photographs or capacity to ground-truth,
constrained the depth of habitat classification. The approach I took was to err on the side of
accuracy at the expense of detail, using a supervised classification to distinguish just two
habitat types, forest and non-forest. Supervised classification assigns each image pixel into
one of a set of user-defined classes based on sample training areas. The training areas are
used to build a model which allows for the classification of each pixel in the image. It is
therefore imperative to have training sites representative of the cover types present in the
image. This method of supervised classification has been used extensively in resource
monitoring (Lillesand & Kiefer 2000; Daughtry 2001; Smith et al. 2002).
I trained the classification for forest areas, leaving non-forest (and anomalies such as
clouds) as the untrained, background default. I selected training sites based on my
knowledge of NNT, especially for the 2001 images, with guidance from the topographic maps
for the two earlier eras. For example, I assumed that areas indicated on the 1981 maps as
forest with 0.50 m diameter trees must have been forest just five years earlier, when the
39
1976 satellite imagery was acquired. I used the 1992/1993 topographic maps in the same
way to guide classification of the 1989 satellite images.
Training started with the most recent images, 2001, and I selected areas to capture
each of the NNT forest types mapped in Timmins & Evans (1996), NNT's altitudinal range,
the range of NNT's relief (e.g., level and steep sites) and areas both close to and distant from
the wet climate of the Vietnam border. I also trained shaded and sunlit slopes within each of
these categories and, to the extent possible, samples of each within each of the seven major
watersheds of the reserve. The result was 26 training areas ranging in size from 31 ha to
2,603 ha (Figure 3.1).
These same training areas were then copied and applied in turn to the 1989 and
1976 images. The rationale for working back in time is the assumption that forest cover has
decreased with time. Therefore, an area that is forest now was likely to be forest in the past,
or at least more likely than the reverse. However, this was checked and training areas
adjusted as needed to avoid areas of cloud or non-forest habitats.
40

I I Landsat t ra in ing areas | | Naka i -Nam Theun N P A and wa te r sheds
Figure 3.1: Landsat training areas for forest in NNT NPA.
41

Based on these training areas, a maximum likelihood algorithm was used to classify
the full area of analysis in each epoch. Maximum likelihood is one of the most commonly
used methods, due to its high classification accuracy. The algorithm uses the means and
variance/co-variances of the training class spectral response patterns. For each training
class, the mean vector and a variance-covariance matrix for all spectral bands are
calculated. When the classifier is applied to the image as a whole, each pixel's spectral
signature and the class statistics are used to calculate the probability of each class belonging
to that pixel. The pixel is then assigned to the class to which it has the highest probability of
membership. This classifier assumes multivariate normality, namely that the distribution of
points making up each training class of each input channel is Gaussian (PCI Geomatics
2004). Given the limited number of classes I used (just two), this is a valid assumption.
A strength of the classification I used is its conservatism. One weakness is its lack of
specific, quantitative definitions of'forest' and 'non-forest'. However, when I examined the
resulting non-forest classification over the satellite images in the visible bands, they clearly fit
well to the obviously cleared land and pale, secondary vegetation on the margins of these
cleared areas. This was checked by examining them over several other band combinations,
with the same result.
The classifications were smoothed to a minimum pixel cluster of 2.88 ha. This was
achieved by first resampling the 1976 Landsat M S S image to 60m resolution, and then
filtering with PCI Modeler's SIEVE translation algorithm for 8 pixels at 60 m resolution (1976)
and 32 pixels for the 30 m resolution scenes (1989 and 2000). The results for non-forest
were then converted to ArcView shapefile polygons using PCI Modeler's R A S 2 P O L Y
translation algorithm. 'Forest' was left as the unspecified, background default.
Lastly, I manually edited the non-forest polygons in ArcView to correct for the
following:
• Streams and rivers and their banks. These were removed from the non-forest
classification, except in densely and uniformly degraded areas.
• Clouds over areas known to be forest.
• Cloud over an area likely to be a mosaic df forest/non-forest. There was only one
instance of this, a patch of dense cloud over an inhabited area of one of NNT's valleys
(Nam Theun) on one of the 1976 images. To solve this, I ordered another, clearer image
from 1978 in jpeg format, and used it to correct by hand the classification of this limited
area. The correction changed the classification forest by less than 0.1%.
• Areas known to be natural, non-forest sites, such as cliffs and high, remote plateaux. I
removed them from the classification of 'non-forest', since the focus of this study is
42

anthropogenic influences on forest cover. I identified such areas from my knowledge of
NNT, from topographic maps, and sometimes by the coincidence across all three epochs
of small, isolated areas of clearing. The last were assumed to be natural, since it is
highly unlikely that a man-made clearing remote from a village would persist unchanged
for twenty-five years.
3.2.3 Calculat ions
For the maps and Landsat, the areas of polygons of non-forest (and not dense forest
for the maps) in each epoch of analysis (three for each) were summed in ArcView 3.3, and
subtotaled within each of NNT's seven watersheds. Figure 3.2 shows the areas of analysis,
which varied somewhat between data sets. Only the 1960s and 1981 topographic maps
covered all of NNT; Landsat coverage for all three epochs was uniform, but missed about
17% of the area, a lightly inhabited area in the north. The size of each watershed within each
domain of analysis is given in Table 3.5.
The instantaneous, annual rate of change in forest cover between each sample
period within each watershed was then calculated by r= [ln(A2 / Ai)] / (T 2 - Ti), where:
r = annual rate of change
Ai = proportion of forest area to total area at time 1\
A 2 = proportion of forest area to total area at time T 2
Ti = first year of sample period
T 2 = last year of sample period
For the secondary SPOT data, areas of forest and non-forest were summed and
rates of change calculated only for the reserve as a whole, not for each watershed, since
their use is broadly corroborative only.
The next chapter summarizes the results of these calculations, and the findings of
other trends that are potentially related to forest cover dynamics in NNT.
43

o Village | | Landsat area of analysis
1992/93 maps area of analysis J^™ Nakai-Nam Theun NPA (1960s & 1981 maps area of analysis) I I Nakai-Nam Theun NPA
Figure 3.2: Areas of analysis.
Table 3.5: S izes of NNT's watersheds within the areas of analysis.
All figures in hectares Watershed Full Area, covered by Area covered by Area covered by
1960s and 1981 maps 1992/93 maps Landsat Nam Kata 29,026 12,743 7,316 Nam Xot 44,716 35,431 16,222 Nam Mon 28,626 28,459 27,316 Nam Theun 74,788 29,708 74,788 Nam Noy 40,634 7,697 40,634 Nam Pheo 19,295 7,812 19,295 Nam One 71,404 44,110 71,404 Totals 308,465 165,960 256,975
44

4 FINDINGS
4.1 TRENDS IN FOREST COVER IN NNT
4.1.1 Topographic maps uncorrected for scale
Tables 4.1 - 4.4 summarize forest cover represented on the maps, without correction
for the maps' scale differences. The tables are organized as follows:
Full area of NNT 1960s, 1981 Dense forest: Table 4.1
Full area of NNT 1960s, 1981 All forest: Table 4.2
Limited area of
1992/93 maps 1960s, 1981, 1992/93
Dense forest: Table 4.3 Limited area of
1992/93 maps 1960s, 1981, 1992/93
All forest: Table 4.4
Each table shows, for each map year, the absolute area of the forest type in each
watershed and its proportion (%) of the watershed. The annual rate of change, r, in the area
of the forest type between sample periods is given, also expressed as a percent. In all tables
the watersheds are listed in order from north to south.
It should be noted that, although the tables give areas for dense forest, 'dense' is not
necessarily an indication of forest quality, since very young secondary stands can have a
closed canopy. For example, the 1960s maps show more than 3,000 ha of treeless habitats
on sites subsequently indicated as 'dense forest' in 1981, at most just 16 years later.
Table 4.1: Dense forest mapped within full area of NNT, 1960s and 1981.
Watershed 1960s (1:50 000) 1981 (1:1 00 000) rx100 Watershed ha % ha %
rx100
Kata 28,340 97.6 25,969 89.5 -0.583 Xot 44,182 98.8 41,695 93.2 -0.527 Mon 27,499 96.1 26,224 91.6 -0.432 Theun 71,745 95.9 66,658 89.1 -0.525 Noy 39,404 97.0 37,477 92.3 -0.386 Pheo 17,611 91.3 17,207 89.2 -0.194 One 70,310 98.5 69,223 96.9 -0.111 Al l 299,091 97.0 284,453 92.2 -0.386
45

Table 4.2: All forest mapped within full area of NNT, 1960s and 1981.
Watershed 1960s (1:50 000) 1981 (1:1 00 000) rx100 Watershed ha % ha %
rx100
Kata 28,422 97.9 25,969 89.5 -0.602 Xot 44,182 98.8 41,695 93.2 -0.527 Mon 27,594 96.4 26,224 91.6 -0.463 Theun 72,121 96.4 66,658 89.1 -0.563 Noy 39,432 97.1 37,477 92.3 -0.391 Pheo 17,629 91.4 17,207 89.2 -0.202 One 70,712 99.0 71,080 99.5 0.037 All 300,092 97.3 286,310 92.8 -0.362
Table 4.3: Dense forest mapped within area covered by 1992/93 maps.
Watershed 196 9s 1981 rx100, 60S-81
1992/93 rx100, 81-93
rx100, 60S-93
Watershed ha % ha %
rx100, 60S-81 ha %
rx100, 81-93
rx100, 60S-93
Kata 12,205 95.8 9,686 76.0 -1.779 9,554 75.0 -0.105 -0.979 Xot 34,901 98.5 32,410 91.5 -0.673 31,116 87.8 -0.370 -0.499 Mon 27,334 96.0 26,058 91.6 -0.435 25,256 88.7 -0.284 -0.344 Theun 28,324 95.3 26,543 89.3 -0.464 25,622 86.2 -0.252 -0.386 Noy 7,559 98.2 7,134 92.7 -0.445 6,509 84.6 -0.706 -0.598 Pheo 7,286 93.3 6,604 84.5 -0.819 6,801 87.1 0.245 -0.287 One 43,126 97.8 41,667 94.5 -0.246 42,558 96.5 0.151 -0.053 All 160,734 96.9 150,102 90.4 -0.526 147,416 88.8 -0.150 -0.346
Table 4.4: All forest mapped within area covered by 1992/93 maps.
Watershed 196C )s 198 1 rx100, 60s-81
1992/93 rx100, 81-93
rx100, 60S-93
Watershed ha % ha %
rx100, 60s-81 ha %
rx100, 81-93
rx100, 60S-93
Kata 12,205 95.8 9,686 76.0 -1.779 11,081 87.0 1.036 -0.386 Xot 34,901 98.5 32,410 91.5 -0.673 33,047 93.2 0.184 -0.234 Mon 27,427 96.4 26,058 91.6 -0.466 26,295 92.4 0.082 -0.183 Theun 28,558 96.1 26,543 89.3 -0.522 26,049 87.7 -0.134 -0.354 Noy 7,559 98.2 7,134 92.7 -0.445 6,785 88.2 -0.385 -0.432 Pheo 7,303 93.5 6,604 84.5 -0.839 6,801 87.1 0.245 -0.297 One 43,509 98.6 43,524 98.7 0.002 43,896 99.5 0.061 0.035 All 161,462 97.3 151,958 91.6 -0.467 153,954 92.8 0.110 -0.190
These data are consistent in showing a decline in forest across nearly all watersheds
between the 1960s and 1981, and in showing a trend of minimal decline or small increase in
forest cover in the period 1981-1993. This must be used with great caution, however.
Perhaps it merely shows that the smallest scale maps (1981) distinguished less forest in part
by virtue of their scale (by lumping scattered areas of clearing into larger polygons). I
attempt to correct for this scale bias in the next section, 4.1.2.
Table 4.5 shows rfor the inhabited portion of NNT only, i.e., all watersheds except
the Nam One.
46

Table 4.5: Values of r x 100 for uncorrected maps, exclusive of the Nam One watershed.
1960s -81 1981 -93 1960s -93
Full area (1960s and 1981 maps)
Dense forest -0.470 n/a n/a Full area (1960s and 1981 maps) All forest -0.490 n/a n/a
1992/93 map area Dense forest -0.625 -0.280 -0.459
1992/93 map area All forest -0.647 0.126 -0.276
The results are of different magnitude but similar pattern: greatest loss in the period
from the 1960s to 1981, significantly decreased rate of loss, or a gain, subsequently.
4.1.2 Topographic maps corrected for scale
Tables 4.6 and 4.7 summarize the results of homogenizing the larger scale 1960s
and 1992/93 maps to approximate the cartography of the smaller 1981 1:100 000 maps.
Table 4.8 gives rvalues exclusive of the Nam One watershed. Due to the inconsistency
across the maps in distinguishing dense from thin or open forest (and the minor extent of
non-dense forest - at its most, in 1992/93, only 4% of all forest within the area of analysis),
results are given for all forest only.
Table 4.6: Forest in the full area of NNT, with 1960s 1:50 000 maps homogenized to approximate 1981 1:100 000 maps.
Watershed 1960s (1:50 000) 1981 (1:1 00 000) rx100 Watershed ha % ha %
rx100
Kata 27,654 95.3 25,969 89.5 -0.419 Xot 42,011 94.0 41,695 93.2 -0.069 Mon 26,653 93.1 26,224 91.6 -0.148 Theun 65,642 87.8 66,658 89.1 0.110 Noy 36,272 89.3 37,477 92.3 0.251 Pheo 15,305 79.3 17,207 89.2 0.976 One 70,524 98.8 71,080 99.5 0.056 All 284,061 92.1 286,310 92.8 0.061
47

Table 4.7: Forest in the area covered by 1992/93 maps, with 1960s 1:50 000 and 1992/93 1:25 000 maps homogenized to approximate 1981 1:100 000 maps.
Watershed 196C )s 198 1 rx100, 60s-81
1992/93 rx100, 81-93
rx100, 6 0 S - 9 3
Watershed ha % ha %
rx100, 60s-81 ha %
rx100, 81-93
rx100, 6 0 S - 9 3
Kata 11,433 89.7 9,686 76.0 -1.276 10,869 85.3 0.961 -0.202 Xot 33,911 95.7 32,410 91.5 -0.412 31,704 89.5 -0.184 -0.293 Mon 26,486 93.1 26,058 91.6 -0.148 25,758 90.5 -0.096 -0.121 Theun 26,056 87.7 26,543 89.3 0.132 25,761 86.7 -0.249 -0.044 Noy 7,440 96.7 7,134 92.7 -0.323 6,695 87.0 -0.529 -0.422 Pheo 6,351 81.3 6,604 84.5 0.325 6,755 86.5 0.189 0.257 One 43,380 98.3 43,524 98.7 0.024 43,923 99.6 0.076 0.050 Al l 155,057 93.4 151,958 91.6 -0.155 151,465 91.3 -0.027 -0.094
Table 4.8: Values of r x 100 for all forest for homogenized maps, exclusive of the Nam One watershed.
1960s-81 1981-92/93 1 9 6 0 S - 9 2 / 9 3
Full area 0.061 n/a n/a
1992/93 map area -0.227 -0.069 -0.051
Comparison of Tables 4.1 - 4.5 with Tables 4.6 - 4.8 shows that the homogenization
exercise in some cases reversed the direction of calculated forest cover change, but the
general trend remained the same: a reduction in rates of forest loss with the passage of
time.
4.1.3 Convex hulls analysis
Figure 4.1 compares the extent of non-forest between the homogenized 1960s maps
and the 1981 maps, and Figure 4.2 does the same for the homogenized 1992/93 maps and
1981 maps. They show that, especially in the earlier period, with the exception of the Nam
Kata watershed the clearing that occurred was more a process of filling in a broad
swidden/forest mosaic than expanding, balloon-like, into the unbroken forest of the protected
area.
48
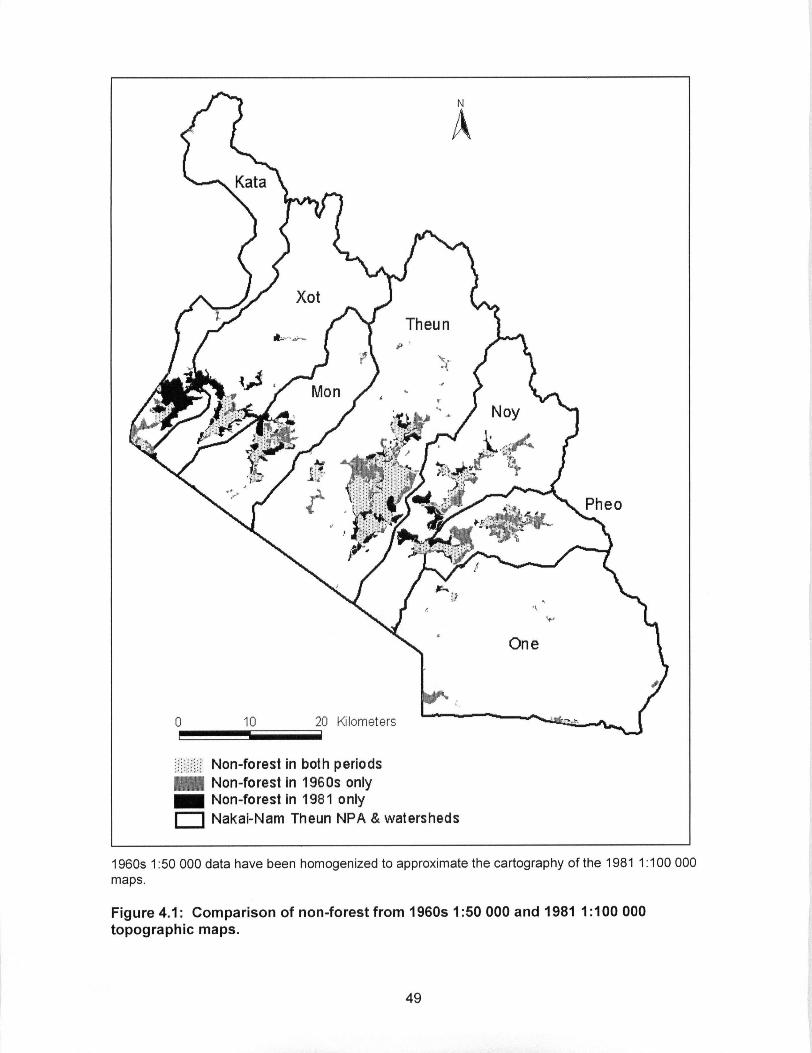
Non-forest in both periods I H Non-forest in 1960s only
Non-forest in 1981 only ] Nakai-Nam Theun NPA & watersheds
1960s 1:50 000 data have been homogenized to approximate the cartography of the 1981 1:100 000 maps.
Figure 4.1: Compar ison of non-forest from 1960s 1:50 000 and 1981 1:100 000 topographic maps.
49

Non-forest in both periods Non-forest in 1981 only Non-forest in 1992/93 only Nakai-Nam Theun N P A , 1992/93 maps' area of coverage
1992/93 1:125 000 data have been homogenized to approximate the cartography of the 1981 1:100 000 maps.
Figure 4.2: Compar ison of non-forest from 1981 1:100 000 and 1992/93 1:25 000 topographic maps.
50
The in-filling is demonstrated quantitatively and more rigorously through the convex
hull analysis. Figure 4.3 shows the construction of convex hulls around non-forest of likely
anthropogenic origin in the 1960s. When overlaid onto the 1981 maps, they capture 95% of
the non-forest of that period (Figure 4.4). Deforestation occurred between the two periods,
but internally within pre-existing bounds, rather than as an outward expansion.
Figure 4.5 shows non-forest in 1992/93 starting to expand somewhat beyond the
bounds of the convex hulls, especially along the northwestern edge of NNT. Nonetheless,
the 1960s hulls still capture 86% of non-forest area mapped in 1992/93.
51

] 1960s non-forest convex hulls 1960s non-forest Nakai-Nam Theun NPA
Only anthropogenic non-forest away from the Nakai Plateau is shown. Non-forest in the southern Nam One watershed is not shown.
Figure 4.3: Convex hulls around non-forest from 1960s 1:50 000 topographic maps.
] 1960s non-forest convex hulls l l l i i i 1981 non-forest r****1 Nakai-Nam Theun NPA
Only anthropogenic non-forest away from the Nakai Plateau is shown. Non-forest in the southern Nam One watershed is not shown.
Figure 4.4: 1960s non-forest convex hulls overlaid on non-forest from 1981 1:100 000 topographic maps.
Note: The increased density of non-forest depicted between the two figures appears more dramatic than reality due to scale differences of the maps.
52

I I 1960s non-forest convex hulls • i 1992/93 non-forest • Nakai-Nam Theun NPA, area of 1992/93 map coverage
Only anthropogenic non-forest away from the Nakai Plateau is shown. Non-forest in the southern Nam One watershed is not shown.
Figure 4.5: 1960s non-forest convex hulls overlaid on non-forest from 1992/93 1:25 000 topographic maps.
53
Figures 4.1, 4.2 and 4.5 show an exception to the pattern of in-filling, along the
northwestern border of the protected area in the Nam Kata watershed, where clearing
expanded will beyond the limits of the 1960s. Figure 4.6 isolates the Kata watershed and
shows the extent of non-forest from each map series without homogenized correction for
scale. Since nearly all of the changes occurred within the lower the watershed covered by
the 1992/93 maps, only this area is shown. It can be seen that, although the sum total of
cleared area was somewhat constant from 1981 to 1992/93, there was a pronounced shift in
its location during this period. This shift is probably related to the construction of dirt road
through the area between 1981 and 1992/93, and the subsequent establishment of two
villages along the road.
54
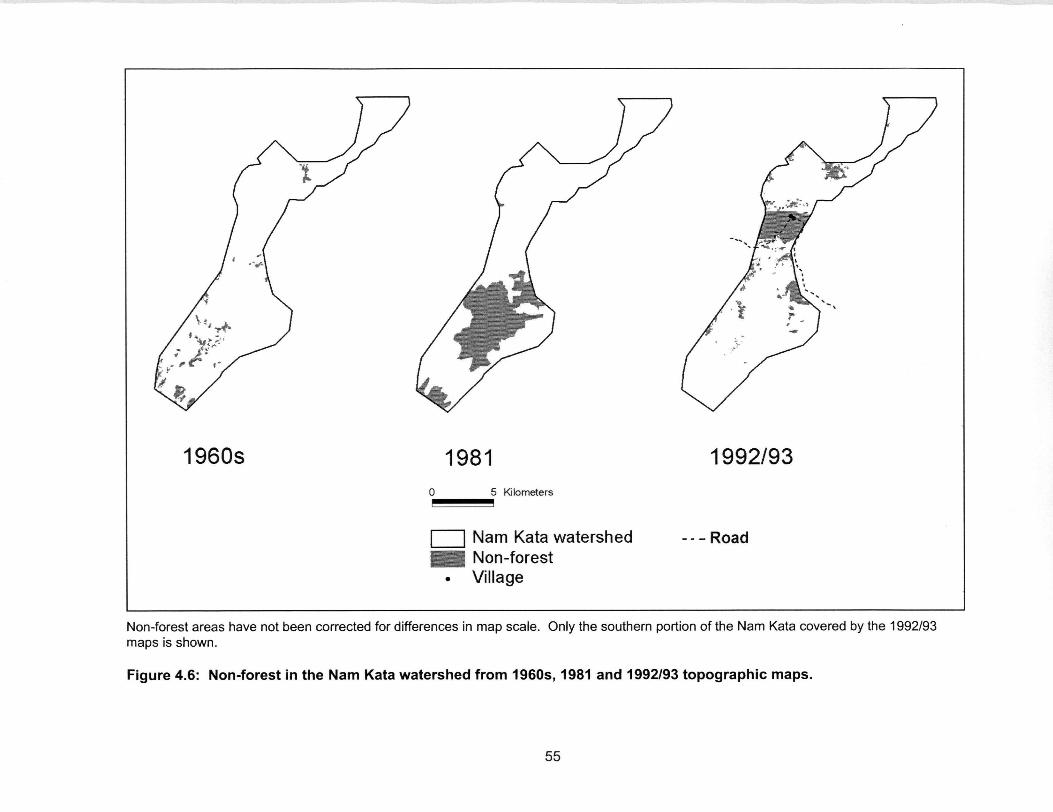
1960s 1981 1992/93 0 5 Kilometers
| | N a m K a t a w a t e r s h e d — R o a d Non- fo res t
• V i l l a g e
Non-forest areas have not been corrected for differences in map scale. Only the southern portion of the Nam Kata covered by the 1992/93 maps is shown.
Figure 4.6: Non-forest in the Nam Kata watershed from 1960s, 1981 and 1992/93 topographic maps.
55

4.1.5 Landsat
Figure 4.7 shows the supervised Landsat classification of NNT's forest and non-forest
in 1976, 1989 and 2001. Table 4.9 summarizes the area of forest in each watershed for
each year, and Table 4.10 gives r, the annual rate of change, between each period in each
watershed, all watersheds combined, and all inhabited watersheds.
Qualitatively, the Landsat and map results corroborate each other: significant decline
in forest cover until the 1980s, and a recovery since then. Quantitatively, the Landsat results
probably represent more accurately the magnitude of the changes, since the Landsat
analysis lacked most of the problems of comparison of the map sets.
56

1976 1989 0 10 20 Kilometers
| | Nakai-Nam Theun NPA | H Non-forest in Landsat area of analysis
Forest in Landsat area of analysis
Non-anthropogenic open areas such as fluvial scrub and sandbanks, rock outcrops, and mountain summits are grouped with "forest
Figure 4.7: Superv ised Landsat c lassi f icat ion of non-forest and forest in NNT NPA, 1976,1989 and 2001.
57

Table 4.9: NNT forest c lassi f ied from Landsat for 1976,1989, 2001.
Watershed 1976 1989 20 D1 Watershed ha % ha % ha %
Kata 6,101 83.4 5,290 72.3 5,843 79.9 Xot 12,903 79.5 11,503 70.9 13,063 80.5 Mon 24,673 90.3 23,538 86.2 23,870 87.4
Theun 68,547 91.6 62,278 83.3 65,715 87.9 Noy 38,720 95.3 34,487 84.9 34,998 86.1
Pheo 18,656 96.7 15,050 78.0 15,823 82.0 One 65,122 91.2 66,850 93.6 68,831 96.4 A l l 234,722 91.3 218,995 85.2 228,141 88.8
Table 4.10: NNT forest cover r f rom Landsat for three epochs between 1976 and 2001.
Watershed rx100,1976-89 rx100,1989-2001 rx100,1976-2001 Kata -1.097 0.829 -0.173 Xot -0.884 1.060 0.049 Mon -0.362 0.116 -0.132
Theun -0.738 0.448 -0.178 Noy -0.890 0.123 -0.404
Pheo -1.652 0.418 -0.659 One 0.202 0.243 0.222 Al l -0.533 0.341 -0.114
Exclus ive of One watershed
-0.826 0.384 -0.253
4.1.6 Summary
Taken together, the geodata show three eras of forest cover dynamics in NNT:
1. Long-term forest cover stability prior to the 1960s or early 1970s;
2. A decline of about 0.5%/year from the mid 1970s to late 1980s;
3. An increase of about 0.3%/year since the 1980s.
As described in Section 4.3, below, the pattern in NNT is in contrast to a consistent
decline in forest cover over Laos as a whole during the same periods, at a higher rate than
experienced at any time in NNT.
4.2 TRENDS IN FOREST TYPE
The largest scale, 1992/93 topographic maps clearly took the greatest care to
distinguish "thin forest" from dense forest (4.3% of the 1992/93 area of analysis exclusive of
the Nam One watershed is classified as "thin forest", compared to 0.3% "open canopy" over
the same area in the 1960s and 0% "foret claire" in 1981). Although 'dense' forest as viewed
58
by cartographers does not necessarily equate to older, high quality forest, a trend toward
increasing open or 'thin' forest would be considered detrimental for conservation of NNT, and
so an understanding of the trend in the balance between the two forest types is desirable. Of
the 45% of NNT covered both by the 1992/93 maps and Landsat, the maps classified 88%
as dense forest. My Landsat analysis of a similar time, 1989, classified 83% of the same
area as forest, indicating a more conservative selection of higher quality forest. Furthermore,
62% of the area classified by the 1992/93 maps as "thin forest" lies outside the areas of
forest as defined by the analysis of 1989 Landsat. This is consistent with the fact that I used
only known areas of high quality, old forest as training areas for the Landsat classification.
Consequently, the Landsat analysis of forest evidently does not include degraded or
obviously secondary areas, and the trends it shows are for forest of comparatively high
quality. We can be confident that forest cover is not being maintained in NNT at the expense
of increasing proportion of secondary, degraded formations. This is contrary to a trend found
by Fox et al. (2000) in a small area of northern Vietnam subject to swidden agriculture, which
from 1952 to 1995 saw a pronounced conversion of open and closed canopy forest to more
degraded habitats.
Although no specific analysis was done of the relationship between forest clearance
and elevation, it is clear from examination of the topographic maps that clearing in NNT
largely follows the boundaries of the comparatively level lowlands along NNT's interior river
valleys, which, not surprisingly, is where the villages are concentrated. Consequently, during
periods of forest decline, lower elevation forest was lost disproportionately to upper elevation
forest.
4.3 TRENDS IN FOREST COVER NATIONALLY
According to calculations from data in Baker et al. (2000) and Azimi etal. (2001),
between 1989 and 1997 forest cover in the whole of Laos declined at an instantaneous rate
of 1.7%/year, more than three times the highest rate of decline shown by Landsat for NNT (in
the period 1976-1989).5 Lepers et al. (2005) calculated that during 1981-2000 - the general
period of forest stability or increase in NNT - Southeast Asia as a whole had the greatest
expansion in cropland and decrease in forest of any region the world.
It is not surprising that rates of forest cover change are lower in NNT, since it is a
protected area. By comparison, what are the rates in other protected areas? Using the
SPOT analysis described earlier, DoF and LSFP compared 1990 and 2000 forest cover in
5 An independent Landsat analysis showed that forest cover declined markedly on the adjacent Nakai Plateau in the 1980s and 1990s, but this was due mainly to logging of the reservoir area of the proposed Nam Theun 2 dam (NTPC 2005), and so is not considered further here.
59
three other forested NPAs in central Laos, Nam Kading (NK), Phou Xang He (PXH) and
Dong Phou Vieng (DPV). NK is the first NPA north of NNT, and P X H and D P V are the first
significantly forested NPAs south (Figure 2.1). Annual, instantaneous rates of forest cover
change for each were -0.49%, -1.2% and -3.7% per year, respectively.
Combining these three sites yields an annual r of -1.7% over the sum of their
collective area, precisely the same as Laos as a whole in approximately the same period,
and a much more negative trend than in NNT. Nam Kading, however, is something of an
anamoly in that it is the only uninhabited NPA in Laos. Excluding it, the rate of forest change
in the two inhabited NPAs, PXH and DPV, was -3.2%/ year. While there are no population
figures available for these areas, their ratios of area/village frame that of NNT: 99 km2/village
in DPV, 66 km2/village in PXH and 77 km2/village in the NNT area of analysis (DFRC [2001]).
Consequently, differences in population density are unlikely to explain the differences from
NNT in rates of forest change. In fact, the rate for NNT is much closer to that of an
uninhabited NPA, NK, than the two inhabited ones.
4.4 TRENDS IN OTHER BIODIVERSITY IN N N T
The most obvious trend in biodiversity in NNT in the last twenty years is an explosion
in wildlife poaching and trade, principally to Vietnam of animals valued in traditional East
Asian medicine, with many of the animals destined for China (Nooren & Claridge 2001). The
broad figures are staggering; for example, each year tens of millions of wild turtles enter
China through the trade networks (van Dijk et al. 2000 and papers therein), some of them
without doubt collected in NNT.
The trade in wildlife and forest products from Nakai-Nam Theun is at least centuries
old (Hickey 1982; Tran Van Quy 2002), but the current, catastrophic intensity is a
phenomenon of only the past two decades. Local villagers consistently report that
Vietnamese poachers first appeared in NNT in significant numbers in 1984 or 1985
(Robichaud & Stuart 1999). This may be related to concurrent economic liberalization in
Vietnam and China, and/or a rapprochement and renewed crossborder trade between the
two countries after China's punitive invasion of Vietnam in 1979. In any case, the demand
from Vietnamese and ultimately Chinese trade networks for a diversity of wildlife from Laos
quickly accelerated to alarming levels (Nooren & Claridge 2001). Figure 4.8 shows the
escalation in the price since 1990 that a Lao villager could obtain from a Vietnamese trader
for single, 1 kg Chinese Three-striped Box Turtle Cuora trifasciata (a.k.a., 'golden turtle').6
Two NNT villages involved in the trade reported that they handled 300 of these turtles per
6 In China, consuming the blood of C. trifasciata is believed to cure cancer (Yoon 1999).
60
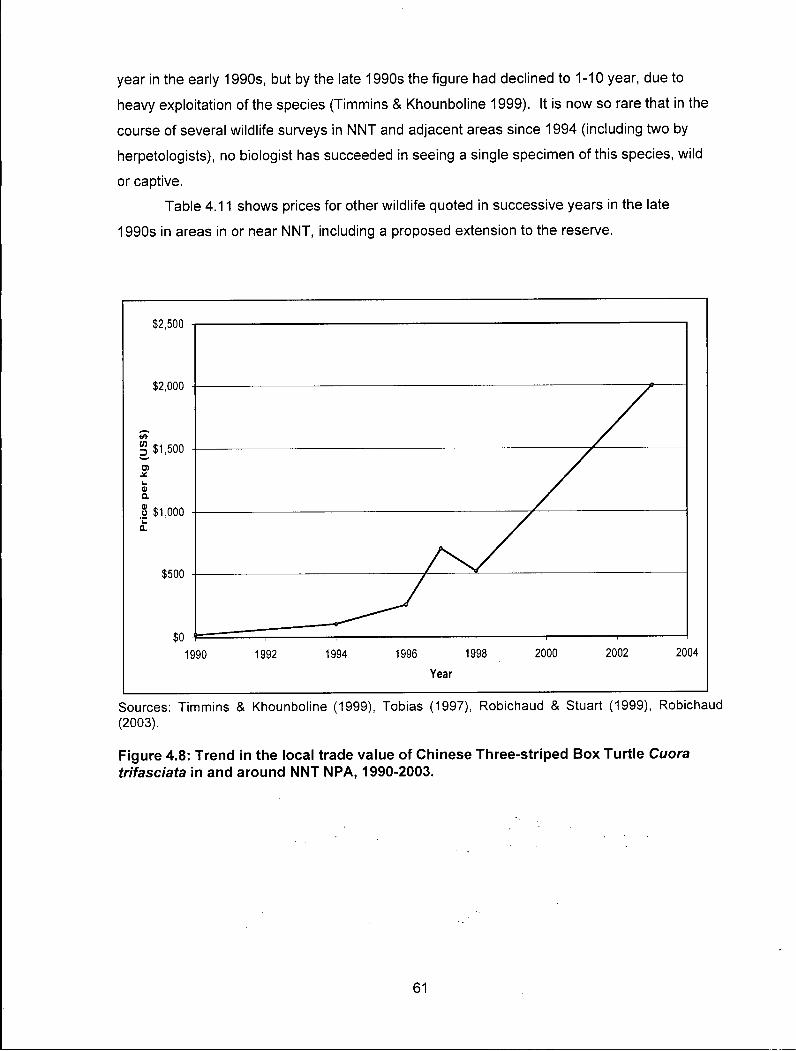
year in the early 1990s, but by the late 1990s the figure had declined to 1-10 year, due to
heavy exploitation of the species (Timmins & Khounboline 1999). It is now so rare that in the
course of several wildlife surveys in NNT and adjacent areas since 1994 (including two by
herpetologists), no biologist has succeeded in seeing a single specimen of this species, wild
or captive.
Table 4.11 shows prices for other wildlife quoted in successive years in the late
1990s in areas in or near NNT, including a proposed extension to the reserve.
$2,500 -r
1990 1992 1994 1996 1998 2000 2002 2004
Year
Sources: Timmins & Khounboline (1999), Tobias (1997), Robichaud & Stuart (1999), Robichaud (2003).
Figure 4.8: Trend in the local trade value of Chinese Three-striped Box Turtle Cuora trifasciata in and around NNT NPA, 1990-2003.
61
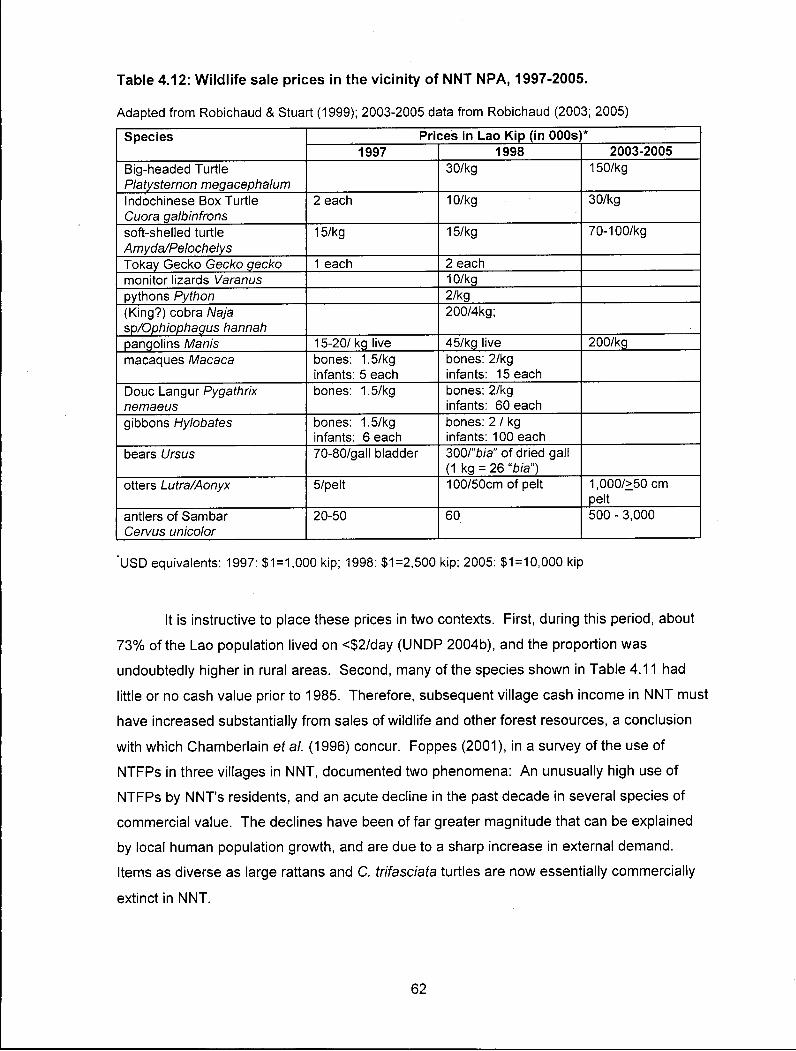
Table 4.12: Wildlife sale prices in the vicinity of NNT NPA, 1997-2005.
Adapted from Robichaud & Stuart (1999); 2003-2005 data from Robichaud (2003; 2005)
Species Prices in Lao Kip (in 000s * Species 1997 1998 2003-2005
Big-headed Turtle Platysternon megacephalum
30/kg 150/kg
Indochinese Box Turtle Cuora galbinfrons
2 each 10/kg 30/kg
soft-shelled turtle Amyda/Pelochelys
15/kg 15/kg 70-100/kg
Tokay Gecko Gecko gecko 1 each 2 each monitor lizards Varanus 10/kg pythons Python 2/kg (King?) cobra Naja sp/Ophiophagus hannah
200/4kg;
pangolins Manis 15-20/ kg live 45/kg live 200/kg macaques Macaca bones: 1.5/kg
infants: 5 each bones: 2/kg infants: 15 each
Douc Langur Pygathrix nemaeus
bones: 1.5/kg bones: 2/kg infants: 60 each
gibbons Hylobates bones: 1.5/kg infants: 6 each
bones: 2 /kg infants: 100 each
bears Ursus 70-80/gall bladder 300/"bia" of dried gall (1 kg = 26 "bia")
otters Lutra/Aonyx 5/pelt 100/50cm of pelt 1,000/>50 cm pelt
antlers of Sambar Cervus unicolor
20-50 60 500 - 3,000
'USD equivalents: 1997: $1=1,000 kip; 1998: $1=2,500 kip; 2005: $1=10,000 kip
It is instructive to place these prices in two contexts. First, during this period, about
73% of the Lao population lived on <$2/day (UNDP 2004b), and the proportion was
undoubtedly higher in rural areas. Second, many of the species shown in Table 4.11 had
little or no cash value prior to 1985. Therefore, subsequent village cash income in NNT must
have increased substantially from sales of wildlife and other forest resources, a conclusion
with which Chamberlain era/. (1996) concur. Foppes (2001), in a survey of the use of
NTFPs in three villages in NNT, documented two phenomena: An unusually high use of
NTFPs by NNT's residents, and an acute decline in the past decade in several species of
commercial value. The declines have been of far greater magnitude that can be explained
by local human population growth, and are due to a sharp increase in external demand.
Items as diverse as large rattans and C. trifasciata turtles are now essentially commercially
extinct in NNT.
62
4.5 DISTRIBUTION OF BIOTA OF CONSERVATION PRIORITY
Biological significance within NNT can be defined and measured in a near-infinite
number of ways (e.g., richness, endemism, global conservation significance), any of which
can be applied to habitats, or to individual species of plants and animals. There is also a
diversity of opinion on which parameters are most appropriate for assessing the conservation
value of an area. In any case, data from NNT for many potential indices are insufficient to
identify local areas of biological importance within the reserve. There are two components of
NNT's biota, however, that are both generally recognized to be of very high conservation
significance, and whose distribution within NNT is comparatively well known. One is wet
evergreen forest, which is the most globally significant terrestrial habitat in Laos, and the
other is Saola, the wildlife species of highest priority for conservation attention in NNT.
Timmins & Evans (1996) mapped the approximate distribution of wet evergreen forest
in NNT. For Saola, I compiled all documented records of the animal in NNT from the 1980s
and 1990s (little information on Saola in NNT has been collected since that time). Figure 4.9
maps both in NNT, indicating areas of high conservation significance, and their position
relative to areas of forest clearance from a composite of Landsat 2001 and, for areas not
covered by Landsat, 1992/93 (mostly) and 1981 topographic maps. Although Saola has an
affinity for wet evergreen forest, the mapped distributions of the two only partly correspond
mainly because all areas have not been surveyed for Saola. Another reason is that wet
evergreen forest is a continuum, and even areas outside of its subjectively mapped
distribution in NNT are wetter than other parts of Laos. Figure 4.9 indicates that both Saola
and wet evergreen forest are presently most threatened by agricultural clearing in the Nam
Pheo watershed, secondarily in the Nam Xot for Saola and the Nam Noy for wet evergreen
forest.
63
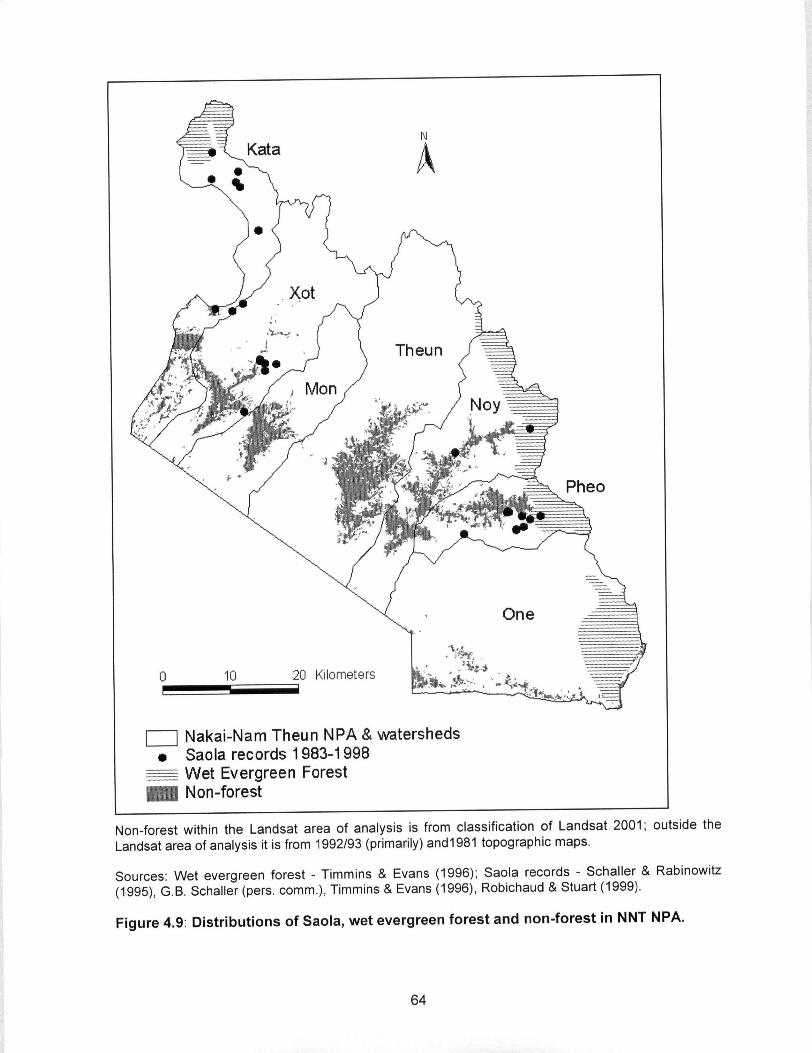
I Nakai-Nam Theun N P A & watersheds • Saola records 1983-1998
E E S E S E Wet Evergreen Forest Non-forest
Non-forest within the Landsat area of analysis is from classification of Landsat 2001; outside the Landsat area of analysis it is from 1992/93 (primarily) and1981 topographic maps.
Sources: Wet evergreen forest - Timmins & Evans (1996); Saola records - Schaller & Rabinowitz (1995), G.B. Schaller (pers. comm.), Timmins & Evans (1996), Robichaud & Stuart (1999).
Figure 4.9: Distr ibutions of Saola, wet evergreen forest and non-forest in NNT NPA.
64

4.6 TRENDS IN HUMAN DISTRIBUTION
The annual population growth rate for Laos as a whole is 2.2 % (UNDP 2004a).
Concrete data for NNT specifically are lacking. However, a socio-economic study by C A R E
in 1996 estimated that the rate was well in excess of 3% in villages on the adjacent Nakai
Plateau and even higher in NNT. The assessment was based, for example, on village
demographic structure (high percentage of individuals < 15 years old) and villagers' self
assessments of the trajectory of their populations (Chamberlain et al. 1996).
Given NNT's long human occupancy but low population density (about 1.5
persons/km 2), high growth rates must be a relatively recent phenomenon, and they are not
due to immigration. Possibly, they represent a 'baby boom' demographic release following
the communist ascension to power in 1975, which ended decades of intermittent warfare in
the country. This was probably amplified by the general acceleration of population growth in
the developing world in the 1960s, from declining mortality due to the spread of medical care
(Sinclair & Wells 1989). The C A R E study concluded that in 1996 villages were in a stage of
"pre-demographic transition", characterized by high fertility and high but lowering infant
mortality, and that this transitional acceleration of population growth had commenced about a
decade earlier.
Russell (1988) summarized estimates from five tropical areas (India, Borneo, Java,
African rain forest and African savannah woodland) of what he termed "critical population
densities of swidden farmers" - human densities within which swidden cultivation is
sustainable without altering its traditional practice. The estimates range from 10 to 50
persons/km 2. The convex hulls (Section 4.1.3) that enclose nearly all of NNT's
swidden/forest mosaic and all of its villages have a combined area of 750 km 2 (about 1/5 of
NNT). This equates to a population density of 8 persons/km 2, below the lowest range given
by Russell. It is possible, then, that despite recent population growth, within the historic
expanse of their impact in NNT humans and their traditional livelihoods remain within
carrying capacity. Chazee ([2000]) reached the same conclusion based on his first-hand
observations in three NNT villages. It should be noted, however, that Brush (1975) outlined
several problems with applying the concept to humans, and specifically to swidden
cultivators.
Many of the villages in NNT are of long standing, with several known to have existed
at approximately their current locations for at least 150 years, and probably much longer
(Chamberlain et al. 1996). Indeed, comparison of NNT villages on the 1943 topographic
maps and those mapped as of 2003 by the Nam Theun 2 Watershed Management and
Protection Authority (WMPA 2004) reveals a degree of social stability that is remarkable for
65

the region. Both sources show precisely 40 named villages, and 30 of the 2003 villages
existed at more or less the same place and by the same name in 1943. 7
Different ethnic groups tend to cluster in different watersheds of NNT (Figure 2.3),
and since their livelihood practices differ, this could influence rates of forest cover change.
Table 4.12 compares for each watershed its ethnicity, population in 1996 (the last year for
which data are available), population density and rates of forest change from Landsat 1976-
2001.
Table 4.13: Ethnicity, population and forest cover change in NNT's watersheds.
The Nam Kata watershed is not included because the ethnicity and population size of its only two villages are not known.
Source: WMPA (2004)
Watershed No. of Populat ion, Persons/km^ Forest cover r, vi l lages by 1996 1976-2001 /1989-2001
ethnicity Nam Xot Vietic: 2 550
Tai-Kadai: 1 139 1.5 0.05/1.06 subtotal 689
Nam Mon Katuic: 5 797 2.8 -0.13/0.12 Nam Theun Katuic: 13 1,634 2.2 -0.18/0.45 Nam Noy Vietic: 8 827 Nam Noy
Katuic: 3 264 3.2 -0.40/0.12 Tai-Kadai: 1 213
3.2 -0.40/0.12
subtotal 1,304 Nam Pheo Tai-Kadai: 3 455
Katuic: 2 76 2.8 -0.66 / 0.42 subtotal 531
Nam One no villages 0 0 0.22/0.24
It is problematic to draw conclusions from Table 4.12 about a relationship between
ethnicity and impact on the forest. Relationships could be obscured by differences in
population density, and the possibility that new clearing may have been the consequence of
the establishment of one or more new villages during the period of analysis. It is perhaps
noteworthy, however, that the only areas with no loss of forest throughout the period were
the two areas with population densities of < 2 persons/km 2.
7 The mapped village stability may extend even earlier than 1943. The early maps actually date from 1909-1929, but were 'partially corrected in 1943'. Unfortunately, it is not known if the 1943 corrections included villages or if villages are shown as they existed in 1909 or 1929.
66

5 DISCUSSION
5.1 EXPLAINING THE TRENDS IN NNT's FOREST C O V E R
5.1.1 Introduction
The findings show some clear trends in NNT, which have fundamental implications
for management of the protected area. The two most important questions to be considered
are:
• Why did forest decline before the 1980s?
• Why has forest cover and village distribution since remained stable under
increasing human population?
5.1.2 Pre-1980s decl ine in forest cover
In the mid 1960s forest cover of NNT was 97%, from which it declined at about
0.5%/year. If the formula for r, the instantaneous rate of forest change, is recast and used
for a regression, it shows that at this rate of decline NNT must have been 100% forested just
six years earlier, in about 1960. Since the area has been inhabited by swidden cultivators
for at least a few hundred years, this clearly cannot be the case. The decline of 0.5%/year is
a recent anomaly.
Evidence discussed in earlier sections rules out logging and immigration as drivers of
the decline. There are three other likely explanations, none exclusive to the others:
• impacts of the American Indochina War
• natural population growth
• changes in local subsistence strategies.
Each is examined in turn, below.
Impacts of the American Indochina War: It has not been studied to what extent
U.S. aircraft sprayed chemical defoliants such as Agent Orange in NNT, but its use there is
unlikely. During the war the American military use defoliants to expose two things, bases of
the Viet Cong in South Vietnam and branches of the Ho Chi Minh Trail, neither of which
occurred in NNT. Also, over the course of years of interaction with NNT's villagers by myself
and others, I'have never heard of villagers mentioning defoliant spraying (although I don't
know how many have been asked directly). Furthermore, in Vietnam, where Agent Orange
spraying was heavy, Vietnamese scientists consider it a minor factor in forest loss in the
country (Fox etal. 2001).
NNT was, however, subjected to conventional bombing. Figure 5.1 shows the
distribution of bomb drops in the area during the American Indochina War. Bombing was
67
intense along roads around the reserve, particularly in the southeast near the Mu Gia Pass.
The escarpment of the Mu Gia Pass forms the southeastern comer of NNT. The pass was
also the main head of the Ho Chi Minh Trail in Laos, and as a consequence was one of the
most heavily bombed points of the war (Prados 1999). This could have caused some forest
loss in the Nam One watershed before the mid-1970s (the last U.S. combat sortie over Laos
was in April 1973). In fact, the 1976 Landsat images show a large area of open habitat in
NNT near the pass (Figure 4.7), which was not present on the 1967 topographic map. This
is likely due to air attacks against the Mu Gia Pass and/or its surrounding anti-aircraft
defenses, some of which were probably situated atop the escarpment in NNT. 8
Figure 5.1 shows that bombing was scattered and comparatively light within the rest
of NNT, insufficient to cause significant forest loss, at least in areas beyond the Nam One
watershed. Although bombing could have ignited forest fires, it is unlikely the fires would
have expanded on a large scale, given the damp conditions of NNT. Furthermore, forest fire
is seldom, if ever, mentioned as a consequence of American bombing elsewhere in
Indochina.
As noted earlier, however, conventional bombing was of sufficient magnitude to drive
the residents of some NNT villages into hiding in the forest in the late 1960s and early 1970s.
Populations of some other villages were relocated outside of NNT by the US-allied Royal Lao
Government, and some of these people returned to NNT after the war (Chamberlain et al.
1996). Consequently, there were several years during the war when, atypically, forest
fallows were not cleared for agriculture. Since five of the 1:50 000 map sheets used in the
study, covering 64% of the area of analysis, are dated during this period of suspension in
forest clearance (1967, 1969 or 1970), as a baseline they probably show an atypically low
extent of forest cover in NNT. Consequently, rates of forest decline calculated subsequently,
after villagers resumed their normal livelihoods in the early 1970s, would be atypically high.
This likely accounts for at least some of the decline in forest cover during this period, at least
as shown by the topographic maps.
8 That the deforestation recovered quickly - by 1989 at the latest - indicates that it was not from Agent Orange spraying, the effects of which can last for decades.
68
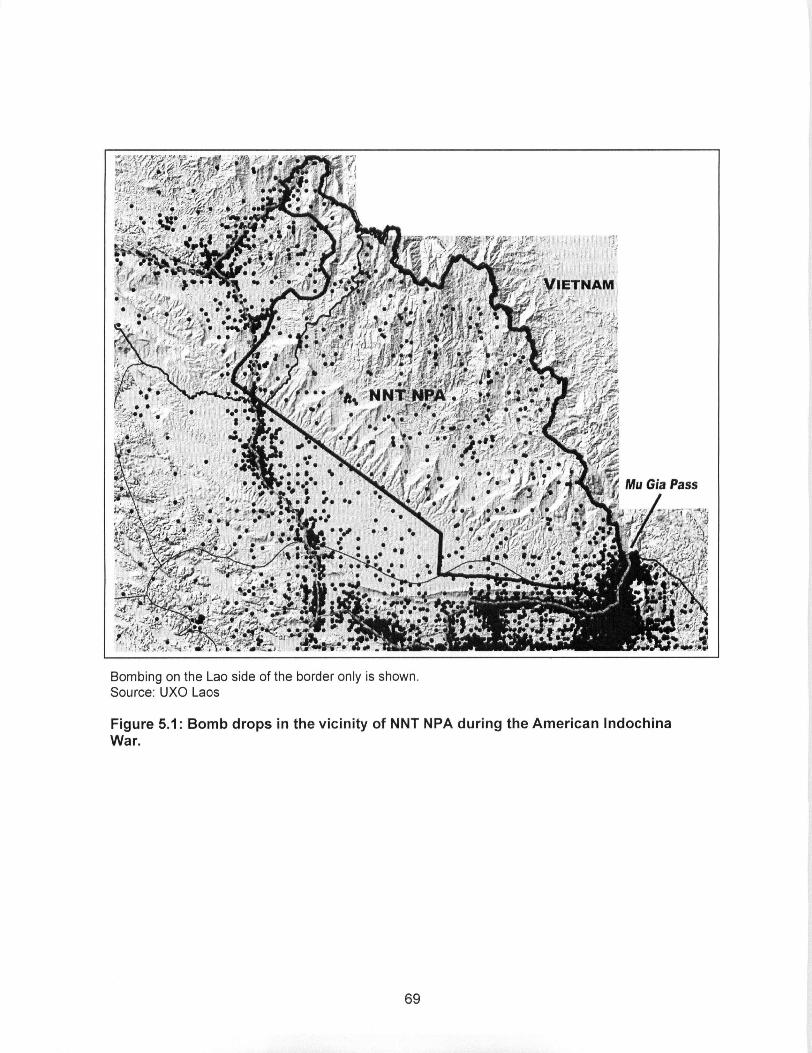
Bombing on the Lao side of the border only is shown. Source: UXO Laos
Figure 5.1: Bomb drops in the vicinity of NNT NPA during the Amer ican Indochina War.
69
Population growth: The American Indochina War probably suppressed population
growth in NNT at a time when it was accelerating in the rest of the developing world. This
suppression would have been released after the war, and the release is probably a
contributing factor to the increased forest clearance until the 1980s. Additional population
was added by the return of villagers exiled from the area during the war.
Changes in local subsistence strategies: Ethnic Brou residents of NNT report that
in 1975 cadres of the new communist government arrived in their village with upland rice
seed, and encouraged the villagers to grow more rice and rely less on wild and cultivated
tubers, because the consumption of rice conformed more to the dominant Lao culture
(author's own data). It is likely this resulted in the clearance of more forest for swiddens than
had been done traditionally by the Brou and others, although the magnitude of the change is
not possible to estimate from available information.
In conclusion, three factors probably worked in concert to reduce forest cover
between the 1960s and 1980s: war-time suppression and then release of indigenous
agriculture, increasing post-war population and post-war encouragement of upland rice
cultivation by the new Lao government. None of these is an endemic characteristic of the
local human-forest ecology.
5.1.3 Post 1980s stability of forest cover
Sandewall et al. (2001) likewise reported an increase in forest cover in the 1990s at
their study site in northern Laos, but attributed it to local declines in human population (-
3%/year) from out-migration, a situation not paralleled in NNT.
In NNT, the observed shift to stability of forest cover can be partly explained as a
simple contrast to the spike in clearing in the 1970s, when residents returned to their villages
after the war and resumed normal livelihoods (villages in Sandewall et a/.'s study area did not
suffer similar levels and impacts of bombing). But not only was post-1980s forest clearance
less than previously, Landsat data show no loss of good forest, and perhaps an increase,
even in the face of growing populations. Several explanations could reasonably account for
this, none of which is necessarily exclusive:
• establishment of NNT as a National Protected Area in 1993;
• swidden reduction campaigns by the Lao government;
• agricultural intensification by NNT's residents;
• stability of NNT's villages;
• villages feeding their growing populations from means other than increased agricultural
production.
70
Each possibility is discussed in turn, below.
Establishment of NNT as a National Protected Area: NNT's gazettement as an
NPA in 1993 is alone insufficient to explain the stability of its forest cover, since at the same
time forest declined in three forested protected areas near NNT. In addition, a simple
change in administrative designation of the area would not explain the trend without a
functional mechanism linked to the change, such as relocation of villagers out of the new
reserve, which did not happen in NNT.
The combination of NNT's status as an NPA and the attention brought to the area by
the proposed Nam Theun 2 dam did, however, suppress illicit commercial logging in the area
(World Bank 2000). Logging could have been a factor in forest loss in the other NPAs.
Swidden reduction programs of the Lao government: The foremost policy goal of
the Lao Department of Forestry is to replace swidden cultivation with other means of rural
livelihood, such as fixed plot cash cropping and rice paddies. Chamberlain et al. (1996)
reported that at least as early as 1996 villagers in NNT were aware of GoL's policy to reduce
swidden agriculture, but acknowledged they had no sense how well villagers adhered to the
policy.
Two lines of evidence suggest that GoL initiatives alone are insufficient to explain the
recent stability of forest cover in NNT. First, villages in NNT are, compared to other areas of
the country, more isolated from the reach of GoL administration and monitoring. Only a few
can be reached by vehicle (and only in the dry season). If anything, efforts to reduce
swidden were probably prosecuted less intensely in NNT than other areas of the country.
Yet, over the country as whole during the period of stability in NNT, forest cover was
declining at the rate of 1.7%/year, and 3.2% in other inhabited protected areas in central
Laos. Second, the topographic map analysis shows that forest loss was already abating in
the decade between 1981 and 1992/93, but implementation of GoL's campaign to control
swidden through land allocation didn't commence until 1995 (MAF 2003).
Agricultural intensification: Villages may have responded to increased population
by intensification rather than expansion of their agriculture, and this is one of the
mechanisms promoted by GoL to reduce swidden. There is little a farmer can do to increase
the production of an upland swidden field, since the field cannot be irrigated, widely applied
with fertilizer or easily sprayed against insect pests. The only options for intensification are
to shift to fixed plots such as rice paddies, or reduce the fallow period between swiddens.
71

The latter however, reaches a point of diminishing returns in productivity if fallow periods
drop below about five years (Hansen & Sodarak 1997).
Rice paddies are uncommon in NNT. Limiting factors are insufficient flat terrain and
suitable soil, and to some extent limited cultural experience with and/or interest in paddy
development among NNT's ethnic groups. Only five villages (four of them are the only ethnic
Sek villages in the NPA) have significant areas of rice paddy, and three of these are in the
Nam Pheo watershed. But each of the five villages have had paddies for decades (and
probably centuries in the case of the Sek), preceding my period of analysis, and forest cover
was stable across all watersheds of NNT, not just the Nam Pheo. Furthermore, as of 1996
only one of the villages was using an imported, higher yield paddy rice variety (Chamberlain
et al. 1996). For these reasons, replacement of swidden with increased rice production from
paddies cannot explain the overall stability of forest cover in NNT.
If swidden fallow periods are reduced, the result is to cultivate and fallow a smaller
expanse of swidden/forest mosaic per capita, but more frequently. If this is done in response
to increasing population, the resulting landscape pattern will be more cleared area
(regardless of how they organize it, villagers will have to plant a larger area of swidden each
year to feed larger populations) and increasingly younger secondary forest within the mosaic,
but stability of surrounding mature forest. In contrast, if villagers stick to traditional fallow
regimes as their population increases, the landscape pattern will be larger cleared areas
coupled with progressive erosion of mature forest as traditional swidden/forest mosaics
expand. There is some evidence for fallow reduction from this study: Landsat data show
that the area of mature forest has been stable, while the FIPD SPOT analysis, when
corrected, indicates that secondary habitats saw an increase of about 9% in proportion of
cleared land from 1990-2000. However, the average range of fallow periods reported in
1996 for four sample NNT villages, 4-10 years (Chamberlain et al. 1996), is still longer than
the range of 3-6 years reported from two provinces in northern Laos (Fujisaka 1991). In
addition, in the course of field studies in the past decade by social scientists and
agronomists, villagers in NNT frequently reported declines from overexploitation in local
natural resources (fish, wildlife and NTFPs) and poor rice yields due to intermittent floods
and pests, but none seem to have complained of declining rice yields due to reduced fallow
periods, something that is frequently mentioned in more densely populated areas of Laos
(Chamberlain etal. 1996; NTPC 2005; Chazee [2000]). For these reasons, reduction in
fallow period alone is unlikely to account for stability of the area's forest cover.
72
Stability of NNT's villages: The degree of settlement stability in NNT is remarkable,
especially given the upheavals of wars and revolution endured by Laos in the latter half of
the 20 t h century. Since the printing of the 1943 maps used in this study, Laos has witnessed
occupation by the Japanese (in World War II), a post-war return to French Colonial rule, the
departure of the French, the American Indochina War, its own civil war, and the
commencement of communist rule. NNT's social stability is in stark contrast to neighboring
Vietnam where, for example, since 1976 more than 3 million people have moved from the
Red River Delta to the Central Highlands of the Vietnamese Annamites (Hodgdon 2004).
This social stability goes a long way toward explaining the stability of NNT's forest
cover. The distance from their village that a family can cultivate a swidden is limited by the
time and effort of travel (usually by foot) required to reach the site to clear, plant, weed, repel
pests (such as wild pigs) and harvest, and transport the crop back to the village. If a village
doesn't move, the area of its swidden fields cannot expand indefinitely, and few villages in
NNT have moved in recent decades.
A number of reasons explain the settlement stability in NNT. One is ethnicity, with
NNT populated by groups with a tendency for sedentariness. Another reason may be
sufficient local carrying capacity, with the rich environment and low population density of
NNT providing enough local resources (including forest fallows) to support residents
indefinitely without moving. The typical response of shifting cultivators to population growth
is village fission and migration (Kunstadter & Chapman 1978), a phenomenon that is
uncommon in NNT. A third possibility is that large areas of NNT may be ill-suited for
settlement and agriculture due to poor weather (such as near the Vietnam border), steep
terrain, poor soils or other factors. The extent of cultivation witnessed in NNT is possibly
defined simply by environmental constraints (certainly, there is a preference for settling and
cultivating relatively level areas near rivers). This may explain why the large Nam One
watershed has seen almost no settlement since at least 1943.
Finally, the Lao government has lately instituted a policy of consolidating rural villages
into larger communities, and presumably by extension keeping them from splitting off new
villages, but this is much more recent than the trend of stability seen in NNT.
Villages feeding growing populations from means other than increased
agriculture: Rarely does an upland family in Laos produce enough rice to feed themselves
for the entire year. But in Laos, and in particular in the rich environment of NNT, rice
insufficiency is not the same as food insufficiency (Chazee [2000]). Lao villagers employ a
diversity of strategies to fill annual rice deficits. These include consumption of non-rice
73
carbohydrates such as cassava, corn, or wild tubers and shoots; selling livestock (particularly
water buffalo) to earn cash to buy rice; and trading their labor for cash or rice (ADB 2001;
Dechaineux 2001). Another important strategy in many areas, including NNT, is the
collection and sale of wild animals and plant NTFPs, and using the cash to buy rice
(Chamberlain etal. 1996; Nooren & Claridge 2001).
The study by Foppes (2001) of NTFP use in NNT showed that locally consumed
resources, such as forest vegetables and mushrooms, remain abundant, while many
commercially valuable plants were severely depleted in the 1990s. The most valuable
wildlife species, such as Chinese Three-striped Box Turtle, were depleted at the same time.
Indeed, given NNT's unusually diverse and abundant biodiversity and its proximity to trade
networks in Vietnam, its residents have been better positioned to earn income from trade in
natural resources than have villagers in most other areas of Laos, and their embracement of
this opportunity was noted by Chazee ([2000]). In NNT, the increase in wildlife and NTFP
trade is the most pronounced change in natural resource use in at least the past two
decades.
NNT's residents have no cars or motorcycles, few motor boats, stereos, or other
tangibles. What then, have they done with the income earned from selling $2,000 turtles? A
reasonable hypothesis is that, instead of opening new swiddens to feed their growing
populations, they have used income from the wildlife trade to buy rice. This could also
explain why villages have not responded to their increasing population by spinning off new
settlements to cultivate other areas.
The hypothesis is suggested by the coincidence in timing (1980s to present) of the
sharp increase in wildlife trade and the stability of NNT's forest cover in the face of high
population growth. Support for the hypothesis also comes from the fact that the two nearby
protected areas that have seen significant declines in forest cover (Dong Phou Vieng and
Phou Xang He) are poorer in biodiversity than NNT (Robichaud et al. 2001), and are not
along the Vietnam border. Consequently, the intensity and value of wildlife trade there has
probably been much lower than in NNT. In addition, it has been observed that maximization
of agricultural production is generally not the goal of traditional forest swiddeners. Instead,
their goal is minimization of labor (Beckerman 1983), and selling a turtle is undoubtedly
easier than clearing and cultivating a swidden. Villagers in NNT have continued to rely on the
forest as their populations increase, but new markets for forest resources and the rich NNT
environment have allowed a partial shift in their pattern of forest use, from growing rice from
swiddens to buying rice with wildlife.
74
Similarly, Brashares et al. (2004) documented a shift to increased exploitation of
wildlife in Ghana in response to declines in Ghana's offshore fishery, a traditional source of
income and protein. But the shifts differ in nature: resource scarcity made it obligatory for
Ghanaians, while it has probably been optional for NNT's residents, adopted in the interests
of labor minimization.
It is not clear, however, where purchased rice would have come from, and if it is
feasible for villagers to transport it from the nearest market (on the Nakai Plateau). But the
one vehicle track and the navigable rivers of the lower watershed mean that rice could be
transported under motor power to within about one days' walk of most villages in NNT. That
may be close enough to bring sufficient quantities the rest of the way by foot, but this needs
further study. Furthermore, in some years the five villages with paddy land probably produce
surplus rice, and surpluses are commonly traded or sold to other villages.
In summary, the factors most likely to have contributed to the maintenance of NNT's
forest cover are the area's social conservatism and stability, possibly some reduction in
swidden fallow period (perhaps in response to GoL) and, more significantly, the consumption
and trade of NTFPs and trade of wildlife. NNT is probably similar to other Lao protected
areas in its increase in human population, but unique in the value of its wildlife trade, the
stability of its forest cover and perhaps the stability of its human settlement. Of the
explanations considered, the hypothesis that best fits the juxtaposition of all trends is that the
generation of cash through the trade in forest resources has substituted for clearing new land
to grow rice.
5.2 IMPLICATIONS FOR THE CONSERVATION OF N A K A I - N A M THEUN
5.2.1 Some guidel ines for management
Nakai-Nam Theun is a large and diverse area. Resources for its conservation - both
financial and human - should be focused where they can do the most good. The findings of
this research suggest some guidelines that can lead to more effective management of NNT,
some of which are applicable to other protected areas in the region.
1. Nakai-Nam Theun is distinctive, and needs to be studied specif ical ly.
I was able to trace 20 published papers on swidden cultivation in Laos, and all are
based on research in the northern provinces of Laos (Fujisaka 1991; Roder & Maniphone
1995; Roder etal. 1995a; Roder etal. 1995b; Roder etal. 1995c; Roder etal. 1996; Hansen
& Sodarak 1997; Pravongviengkham 1997; Roder 1997; Roder et al. 1997a; Roder et al.
75

1997b; Roderetal. 1997c; Roder e i al. 1998; Roder& Maniphone 1998; Cohen 2000; Roder
2001; Sandewall et al. 2001; de Rouw et al. 2002; de Rouw et al. 2004; Ducourtieux 2004).
This is not surprising, since the form and intensity of swidden practiced in the north makes it
a threat to forest cover in many areas, and it is natural to study a problem where it is worst.9
But the lessons from these studies have been applied to Laos as a whole, including NNT,
culminating in the GoL policy to eliminate swidden nationwide, and the prominent focus on
'solving' swidden in NNT's management plans. Yet swidden in the north may have little in
common with practices elsewhere in the country, such as NNT.
NNT also has a distinctive ethnic landscape, environment, and dynamic of resource
abundance yet connection to insatiable markets. Studies, generalizations and management
models drawn from other areas may have little relevance - and may even be
counterproductive - to wise stewardship of NNT. Jarosz (1993), from her research in
Madagascar, amply demonstrates the complexity of links between deforestation and
potential causative factors such as swidden, population growth, economics and governance.
Before detailed management interventions are designed for NNT, fuller understanding of the
situation on-the-ground is needed. This is in contrast to the view of Chazee [2000] who, in
contributing to the design of a rural development project for NNT, wrote "...there is no further
need for general studies". Findings from this study suggest otherwise, and it is perhaps not
surprising that the project mentioned suffered chronic setbacks traceable to superficial
comprehension of local socio-economics and culture. At the project's end, a member of its
internal evaluation unit concluded, "Regarding the [unsuccessful] agriculture activities, we
didn't begin by looking carefully into the custom and culture of the local people" (H.
Phimphisane, quoted from author's own data).
Even within NNT, each watershed and its villages have unique histories, cultures and
ecological dynamics, and each needs focused study before effective management can be
designed.
2. Suppression of wildlife trade in NNT could promote forest loss, and vice-versa. In recent years, NNT's residents have probably fed growing populations less through
expansion of agriculture, more through increased collection of forest resources for
consumption and trade. Had NNT's biodiversity not been so rich, and had the market
demand for wildlife and other resources not escalated in Vietnam and China, there might
have been more forest clearance in NNT than occurred in the past twenty years.
9 Five of Laos' twenty provinces have no national protected areas (or only fractions of adjacent ones), because they have so little forest left. All are in the north.
76
This presents a conundrum for conservationists: If NNT's management heeds calls to
crack down on wildlife trade in NNT, this could cause a release in forest clearance. If forest
clearance for swidden is banned, it could force continued reliance on wildlife trade to procure
rice. Baker et al. (2000) observed this in Vietnam, about which they wrote, "By prohibiting
clearance of fallows for cultivation, the Government forces swiddeners to rely upon NTFP
collection, hunting wildlife, fuelwood collection, timber cutting, selling rights to their land, and
hiring out their labor to meet their subsistence needs". In NNT, opening access to markets
for village cash crops is not the answer (even if it were economically viable, which is
doubtful), since improved access would only exacerbate the wildlife and NTFP trade.
The point is that NNT's residents will continue to live in large measure on the forest -
either producing food from it through swidden agriculture, collecting food from it, or collecting
things from it to sell for food. Cutting off one strategy will inevitably stimulate a shift to
another.
It should be noted that wildlife trade is a special case, and the feedback mechanism
does not flow in the opposite direction. That is, allowing expansion of swidden is unlikely to
end the trade in threatened wildlife. International demand has driven wildlife prices too high,
and a 'desirable' level of local income probably has no practical upper limit. Even with
storehouses bulging with rice, and/or with supplemental income from the sale of cash crops,
a NNT villager is unlikely to forego the opportunity to collect and sell a $2,000 turtle.
Even without intervention, the era of lucrative wildlife trade in NNT may be fading. In
2003, residents of a village just outside the northern boundary of the protected area said
fewer Vietnamese poachers now entered NNT than five years earlier, because the most
valuable resources, such as Aquilaria wood and highly prized turtle species, had been
exhausted, leaving less to attract the poachers (author's own data). Consequently, the ability
of villagers to substitute the sale of wildlife and NTFPs for clearing new rice fields may be
coming to an end.
This puts villagers in a resource squeeze: at the same time that market pressure and
poaching have depleted commercial wildlife and NTFPs, government is pressing them to
reduce their area of swidden. Given the constraints to agricultural intensification in NNT
(e.g., Chazee [2000]), if population growth continues it is unlikely villagers can maintain their
standard of living while reducing both their traditional agriculture and trade in forest
resources.
77

3. T h e m o s t p r e s s i n g threat to N N T ' s forest c o v e r is f rom p o p u l a t i o n s o u t s i d e the
reserve .
In recent years, the greatest shifts in NNT's forest cover have been in the Nam Kata
watershed, along the northern border of the protected area. The impacts are undoubtedly
originating from a dense human population just to the north of the reserve, and this is
discussed in more detail in the next section, Geographic Priorities for Management (5.2.2).
Consequently, a fundamental shift from management focus to-date is needed - thus far rural
development projects aimed at conserving NNT's biodiversity have worked only in villages
within the reserve's boundary.
4. H u m a n popu la t ion growth is the ultimate threat to N N T ' s b iod ivers i ty , of w h i c h
s w i d d e n cul t ivat ion a n d u n s u s t a i n a b l e harvest of forest r e s o u r c e s are on ly prox imal
s y m p t o m s .
Prohibiting one or the other of swidden, NTFP collection or wildlife trade will likely
stimulate an increase in the other(s) in NNT. The reason that none of these actions in
themselves is a conservation solution is that none addresses the root problem - recent and
atypical acceleration of human population growth. Russell (1988) observed of swidden:
"...this farming system is superbly well adapted for conserving tropical forest, unless the local
population exceeds a critical density". He concluded that unless human population growth is
addressed, "...all other conservation measures are futile, always in the long run and often in
the short run". Locally, the issue was succinctly framed by an official of the provincial
government in Khammouane Province, Mr. Sivixay Soukkharath, who said at workshop on
NNT in 2003, "On the one hand, we want to conserve the area, and on the other we want to
improve people's livelihoods. Have we thought about how many people can live in the [NPA]
under these conditions, and what to do with the surplus population?" (author's own data).
Although the importance of population growth is increasing acknowledged, it is
seldom acted on in conservation and development projects in Laos. Such projects tend to
employ agriculture specialists far more often than population biologists, and the former,
acting naturally from what they know, put faith in agricultural intensification to address
conservation and poverty issues. But agronomists have concluded that the potential for
agricultural intensification in NNT is limited (and, in any case, it is only a temporary answer at
best), due to constraints of terrain, climate and soil (Chazee [2000]). And even where
conditions permit, such transition is often very slow, and frequently unsuccessful. Yet human
population is increasing as the forest resources on which NNT's residents depend decline.
Consequently, if an expansion of swidden is to be avoided, and the unsustainable collection
78

of forest resources ameliorated, management efforts will have to provide one or more of the
following in NNT:
• Family planning services to reduce pregnancy rates. This will be especially important as
development continues to lower rates of infant and overall mortality.
• Protection of NNT's wildlife and NTFPs from outside poachers, coupled with programs to
allow sustainable harvest by residents.
• Opportunities for voluntary emigration of some NNT residents out of the reserve, such as
skills training for life in provincial towns (L. Chazee, pers. comm.).
• Opportunities for generation of sustainable cash income. Potential mechanisms include
employment as reserve staff and payment for services such as anti-poaching patrolling.
These may be a partial solution only, since there are limited opportunities for benign
generation of income in the reserve. Contrary to frequent suggestion, it is difficult to see
how the promotion of cash cropping could fill the gap. Villages are far from a major
market, and road infrastructure would undermine NNT's role as a conservator of
biodiversity. Expansion of cash cropping is the major threat to some other protected
areas in Laos (Robichaud et al. 2001). It should be noted that given the tight
interconnection in NNT between livelihood and culture, substitution of wage labor for the
former poses some 'risk to the latter.
5. If NNT 's v i l l ages d o not m o v e , land a l locat ion a n d other land cont ro l m e a s u r e s may
not be n e c e s s a r y .
Management must decide wisely where action is needed, but also where it is not.
Attempts to control resource exploitation in Laos by formulaic programs such as land
allocation, land use planning and village relocation from highland areas have frequently had
deleterious consequences for the well-being of the target populations, and have even
exacerbated overexploitation of natural resources (Hansen & Sodarak 1997; ADB 2001).
Results from this study show that NNT's residents cultivate food within swidden/forest
mosaics whose boundaries have changed little since at least as far back as the 1960s. The
swidden stabilization that GoL desires to achieve through land allocation already exists in
NNT, at least to a much greater degree than in other forested areas of Laos. Agriculture and
forest conservation lands in NNT have already been allocated, by indigenous institutions and
practical constraints on the extent of areas that can be brought under cultivation.
Furthermore, global studies indicate that the population densities of NNT's present
swidden/forest mosaics remain within carrying capacity for the maintenance of forest cover
and traditional livelihoods (Russell 1988).
79

This results of this study caution against NNT's management confusing means (e.g.,
land allocation) with ends (forest conservation). If management simply informs residents that
they may not move their villages, and if human population growth is stabilized and increased
access does not open the area to outside land grabbers and immigrant farmers, then there is
doubtful justification vis-a-vis forest conservation to bar NNT's residents from their traditional
agricultural systems. At the least, more detailed on-site assessment is warranted before
interventions are attempted.
6. Planned development of a track network in NNT could result in an expansion of
swidden.
In the last two decades the extent of swidden/forest mosaic in NNT has remained
stable due in part to limitations on the distance farmers can travel from village to field. The
convex hulls analysis (Section 4.1.3) shows that cultivation in NNT has been confined to
discrete, non-overlapping areas of swidden/forest mosaic, defined by watershed. The latest
management plan for NNT proposes development of a track network to link NNT's
watersheds, tracks wide enough to accommodate a two-wheeled tractor. This will increase
the distance from his village that a farmer can effectively cultivate and harvest a field, and
could result in 'bridging' and merging the discrete swidden/forest mosaics. It will make
possible an expansion of swidden beyond limits that have existed for at least the past forty
years, and possibly centuries. It will also expand the potential range and volume of local
commercial harvest of NTFPs, such as rattan.
Perhaps the reserve's new management team can control this, but they are untested,
and it gives them yet another issue for their already dispersed attention and resources.
5.2.2 Geographic priorities for management
Geographically, the management resources of a protected area should be focused
where the pressure on biodiversity is most severe, or where biodiversity is most significant,
and best where the two intersect. The identification of where attention should be focused to
insure maintenance of NNT's forest cover is complicated by the fact that variation in the
areas of analysis constrains comparison of the individual watersheds. But looking at the only
epoch for which there is complete coverage of NNT, map analysis between the 1960s and
1981, the results show that only three watersheds, Kata, Theun and Pheo, retained less
than 90% forest cover in 1981 (Table 4.2). The three watersheds with the deepest negative
trend in forest cover (r, uncorrected) during this period were Kata, Xot and Theun, all steeper
than -0.5%/year (Table 4.2).
80

In 2001, of the five watersheds covered fully (or nearly so) by the Landsat analysis
(i.e., all but Kata and Xot), the One had by far the most extensive forest cover, 96%, and
Pheo the least, 82%, with the others clustered between 86-88%. The result for the Pheo
watershed is somewhat artificial, since the Nam Pheo river is just a tributary of the Nam Noy,
and its watershed was delineated for separate analysis because of its discrete human
population. 1 0 Selected based on its human rather than physical geography, it is not
surprising that it shows the greatest human impact. Nonetheless, it is likely to represent a
discrete management unit within any management strategy for NNT, which justifies its
separate consideration.
The SPOT analysis, which did not cover the Kata watershed, showed greatest
increase in clearing in the decade of the 1990s in the Xot.
In summary, based on threat to forest cover, three or four watersheds stand out as
most important for management attention, Kata, Xot, Pheo and possibly Theun. A curious
aspect of this result is that, with the exception of the uninhabited One, the Kata and Xot have
the lowest human densities of NNT's watersheds. Although the population of the Kata is not
known, it has only 5% of NNT's villages (2 of 40) within 12% of NNT's area. The Xot has only
three villages, and by far the lowest population density of the known inhabited watersheds
(Table 4.12). In sum, there is little correlation between a watershed's population and the
magnitude of its forest loss.
For the Kata, there are probably two explanations. First, sometime since 1981, a dirt
road was cut through the lower Kata and Xot watersheds, ending just over the border of the
adjacent Mon watershed. Figure 4.6 shows that the road apparently attracted increased
clearing to the Kata watershed, at least in part through the establishment of its only two
villages (in the portion within NNT). Second, alone among NNT's watersheds, the Kata is
split by the boundary of NNT and only its southern half lies in the reserve. The northern half
was not included in NNT because of a high density of villages and deforested land. But the
impacts of these villages are undoubtedly crossing the boundary of the reserve. Figure 5.2
shows a composite Landsat M S S image of NNT and the surrounding area from the only year
for which I have full Landsat coverage, 1976. It is clear, even from this older image, that the
main pressure on the Kata's forest is from villages outside the reserve's boundary, not within
the reserve. One management option is to extend the northern boundary of NNT to include
the nearest concentration of villages affecting its forest cover, along the upper Nam Kata
river. The reason for exclusion of this area - its human density - when the boundaries of
1 0 The same is true for the Nam Mon, a tributary and sub-watershed of the Nam Xot.
81
NNT were drawn may be the strongest argument for including it formally under the aegis of
NNT's management.
The trend in the Xot watershed is harder to explain. While cleared areas correspond
to the route of the road, they predate it. The road seems to have followed the path of the
clearing, rather than the reverse. Rather, the watershed's proximity to the density of villages
just north of the reserve (less than 5 km distant) is likely more significant.
82

I I NNT NPA and watersheds
The bright, white patches on the far right of the image, over Vietnam, are cloud. Most other light patches are deforested areas.
Figure 5.2: Landsat M S S 1976, showing distribution of pressure on NNT's forest.
83

An assessment of forest clearance indicates, on one level, in which watersheds
conservation attention should be focused. Are these the same areas with the most
significant biodiversity? The strongest co-occurrences of globally significant Saola and wet
evergreen forest (Figure 4.9) are in the Nam Kata and Nam Pheo watersheds. Saola might
be found in similar numbers in the wet evergreen forest of the Nam One, but the area has
never been surveyed for the animal. Of these watersheds, the results show that forest
clearance has encroached on these key areas most significantly in the Nam Pheo and Nam
Xot watersheds. Figure 5.2 suggests that the situation is the same for areas of wet
evergreen forest and Saola occurrence in the Kata watershed, but I have insufficient recent
data to say for certain.
Based on these considerations, Table 5.1 summarizes priority watersheds for active
forest conservation in NNT, in subjectively ranked in order. The areas are mapped in Figure
5.3.
84

Table 5.1: Priority watersheds for active forest conservat ion in NNT NPA.
Watersheds are listed in priority order. Watershed Pressure on: Pressure source 1. Nam Kata • general forest cover
• wet evergreen forest(?) • Saola(?)
villages outside NNT NPA, and two new local villages
2. Nam Pheo • wet evergreen forest • Saola
local villages
3. Nam Xot • general forest cover • Saola*
local villages; logging and possibly agricultural encroachment from outside
4. Nam Theun • general forest cover local villages
*Saola formerly occurred in areas close to forest clearance in the Nam Xot, but it is not known if they persist there today.
Darker watersheds are higher priority (see text and Table 5.1 for ranking criteria).
Figure 5.3: Priority watersheds for active forest conservat ion in NNT NPA.
85
5.2.3 Research priorities
The results of my research are largely indicative. In particular, the link between
wildlife trade and swidden, while likely, remains speculative, and reality is likely to be more
complex. Further studies are needed to refine, verify and expand on the results. Useful
directions for investigation include the following:
1. A detailed study of forest types and their trends in NNT. While I have been able to
show that overall forest cover in NNT is fairly stable, I can say little about the trend in finer
scale forest structure or community. Of particular concern is the status of lower elevation
forest, which has been cleared at a higher rate than upper elevations in NNT, and constitutes
the forest type under the greatest deforestation pressure in Indochina. Such a study could
start with ground-truthing and proofing the 1990/2000 S P O T analysis.
2. Determination and monitoring of human population growth rates in NNT. As yet,
there is only qualitative, anecdotal information on human population in NNT. Population is
the principal challenge for NNT's management, and thus a critical information gap.
3. Determination of what defines the geographic limits of cultivation in NNT. It is not
clear to what degree the stability of NNT's villages and their geographic extent of cultivation
represent a cultural choice or an environmental constraint. The answer has fundamental
implications for management of the area.
4. Detailed studies of swidden agriculture in central and southern Laos. There has
never been a study of swidden practices in the regions of Laos where forest cover is most
extensive, and where the ethnographic map is markedly different from where studies have
been done in the country's north. This is a gaping omission given the prominence of
swidden reduction programs in the country. Agronomists need to shift their preoccupation
with northern Laos to include other parts of the country.
5. Participatory studies with NNT's villagers of their resource use. Chamberlain (1997)
rightly points out that NNT is not simply an assemblage of biodiversity over which elements
of human culture have been laid, but an integrated system of bio-cultural wholes. A
reductionist study of one separate from the other, such as this thesis, is artificial, or at least
incomplete. The present work should be viewed as only one stage in a longer study of the
NNT environment. The next logical step is an in-depth investigation of patterns of forest use
86
among a sample of NNT's villages. The information could be used to build and refine a
spatial model of human forest use in NNT. An excellent place for such a study, if the
villagers concurred, is in the adjacent Nam Noy and Nam Pheo watersheds, where the
diverse range of NNT's livelihoods are represented by Sek, Vietic and Brou villages in
relatively close proximity.
A high priority is better understanding of the nature of the wildlife trade in NNT, its
importance to indigenous livelihoods, and the depth of its link to loss or maintenance of forest
cover. It is not clear to what degree income from wildlife trade is essential to villagers'
livelihoods - i.e., how much of the income is used to purchase rice and other staples - and
how much represents supplemental, 'non-essential' income.
6. Improved understanding of the impact of swidden on Saola habitat. Records of
Saola come from areas close to active swiddening in NNT, especially in the Nam Xot and
Nam Pheo watersheds. It is not known to what extent clearance for swidden limits Saola's
local range and population, and what alternatives are available to villagers. Both are
priorities for investigation, to achieve understanding of how much human use the ecosystem
can support and still maintain elements of biodiversity, such as Saola, that NNT was
established to conserve.
5.3 ERRORS, BIASES AND UNCERTAINTIES
The topographic maps are problematic to compare due to differences in, most
importantly, scale, habitat classifications and geographic coverage. The issues have been
discussed in detail in the Methods section. In sum, both the original cartography and my
homogenized corrections are subjective approximations, and so I am least confident of
results from the period covered only by maps, from the 1960s to the commencement of
Landsat coverage in 1976. I have dealt with this by relying only on the maps' qualitative
results.
The most significant uncertainty in the Landsat analysis is the lack of definitions of
'forest' and 'non-forest', which were not possible to make without comprehensive ground-
truthing. There are some potential sources of quantitative error in the Landsat analysis, as
well. One is overall weak verifiability of the basic classifications I did use, due to limited
ground-truthing and lack of access to contemporaneous aerial photography. The second
most important issue is the contrasting seasons (dry and wet) of the Landsat coverage.
However, both problems were substantially addressed by the very conservative habitat
classification used - both in the limited number of habitats distinguished, and the fairly
coarse smoothing of pixel clusters.
87

Nonetheless, given the uncertainties, it would be helpful to estimate a margin of error
for the Landsat classification. This study was fortunate to have access to a second
independent sample, the FIPD SPOT analysis, which was derived over a comparable period
as one of my Landsat intervals. The SPOT analysis for 1990 classified 89.2% of NNT as
forest, vs. 85.2% according to the 1989 Landsat results; SPOT 2000 showed 86.4% forest,
vs. 88.8% from the 2001 Landsat. Despite differences between the two studies in data type,
period of analysis, methods, personnel and objectives, the variations between their results in
each period, 4.0% and 2.4% respectively, are within or close to the U.S. Forest Service
precision standard for distinguishing forest and non-forest from remote sensing, 3% per
million acres (= 404,700 ha, vs. 257,000 ha for the NNT Landsat area of analysis) (Reams
et al. 2005), even though the Forest Service uses far more intensive analytical methods
(e.g., field surveys, aerial photos).
Of the dynamics shown by each data set, according to the S P O T analysis, in its 11-
year span (1991-2000) 3.0% of the area of NNT shifted from forest to non-forest (r =
-0.34%); my Landsat analysis indicates that over almost the same period (1989-2001), 3.6%
of the area shifted from non-forest to forest, for an identical absolute value of r but in the
opposite direction, +0.34%. Is the difference small enough that the results can be
considered 'comparable'? It is an important consideration, since they indicate opposing
trends.
I propose that they are comparable. These independently calculated rates for NNT
are much closer to each other than to rates elsewhere in the country. For example, the rate
of forest decline for the country as a whole and in three NPAs near NNT, -1.7%, is almost
triple the spread between the calculations for NNT from FIPD's S P O T and my Landsat
analyses. The point is that, despite their modest differences, both show that NNT has
changed far less than the rest of Laos or its protected areas.
Another issue is the incomplete coverage of the geodata, particularly Landsat. This
may have skewed the calculations of proportionate forest cover, and/or missed some
important local trends. Unfortunately, two of the watersheds that the findings identify as
priority for management attention, Nam Kata and Nam Xot, are the only two significantly
truncated by the Landsat coverage. Hindsight now shows that assembling full Landsat
coverage of NNT would have warranted the additional investment of money and time.
The Nam One watershed is an outlier in the results, with trends markedly different
from the rest of NNT. As noted earlier, there are two reasons for this. In the wartime years,
when forest clearance in most of NNT abated due to the partial abandonment of village
agriculture, the Nam One, in contrast, may have been partly deforested by bombing.
88
Second, it is the only uninhabited watershed in NNT. It is also one of the largest watersheds,
and so its atypical pattern dampens the trend shown by the inhabited portion of NNT. I
compensated for this in the results by calculating rates of forest cover change exclusive of
the Nam One. While this changed the magnitude of some of the results, it did not change
their direction.
89
6 CONCLUSION
In Laos to-date, initiatives to conserve forest and protected areas have emphasized
the destructive nature of swidden agriculture. A major government program aims within the
next five years to fully control (and in some areas eliminate) this agricultural system, one
which has been practiced in Laos for perhaps thousands of years.
But the perception of swidden as a problem in Laos is based almost exclusively on
research from where deforestation is most severe, the northern provinces. As a
consequence, the 'problem' has been studied intensively, but rarely have solutions been
studied, i.e., livelihood systems in areas that retain good forest cover.
Nakai-Nam theun National Protected Area in central Laos is one such forested area.
It is characterized by a degree of stability in the distribution of both human residents and
forest that is unmatched in Laos or Vietnam, and most of Southeast Asia. At present, the
bio-cultural ecology of NNT does not fit the dominant institutional thesis applied to forest
conservation in Laos, i.e., that swidden cultivation is one of the primary current threats to
forest, and its elimination or stabilization the most urgent response. In fact, anthropological
evidence suggests that NNT may be the longest continually inhabited upland area in Laos or
Vietnam, yet it retains the most extensive block of forest in either country.
Although NNT lost forest cover between the 1960s and early 1990s, the pace of the
decline was probably driven by outside forces that came into play after the American
Indochina War, and even at its worse, deforestation expanded little beyond the limits of a
swidden/forest mosaic that was already defined in the 1960s (with the exception of the Nam
Kata watershed, along the reserve's northern border). Throughout the study period - and
probably its entire history - most of NNT's forest has remained untouched by cultivation.
Since the 1980s forest cover has remained stable or increased in NNT, even as it declined
significantly in the rest of the country and in nearby protected areas. The principal threat to
NNT from swidden is coming from outside NNT's northern boundary, not from within the
reserve.
Likewise, the number and location of NNT's villages have changed little. Two other
significant trends in the reserve in the past twenty to thirty years are increases in human
population and the trade in wildlife and NTFPs. I hypothesize that all four trends are related,
and the newly lucrative trade in wildlife and NTFPs has allowed NNT's villagers to feed
growing populations without splitting off new villages and expanding swidden cultivation. The
residents of NNT continue to rely on the forest for their livelihoods, as they always have, but
have shifted some of the emphasis of their exploitation. Instead of increasing exploitation of
90

forest nutrients though expanded swidden agriculture, they have increased their exploitation
of consumable and marketable forest organisms.
If true, the hypothesis has significant implications for management. The potential for
agricultural intensification to replace swidden is limited in NNT's environment. Consequently,
continued increase in human population in NNT will be followed inevitably by increased
forest use - either swidden or the wildlife and NTFP trade. One cannot be suppressed
without releasing the other. Management objectives to simultaneously reduce swidden and
the trade in wildlife and NTFPs are unrealistic, and if implemented too precipitously would
have negative consequences for the welfare of NNT's residents.
Since wildlife trade is by far the most pressing threat to NNT's globally significant
biodiversity, the solution is to focus management resources on two things, controlling wildlife
trade and stabilizing NNT's human population. As long as new immigration and new
settlement are prevented, specific programs for swidden stabilization are only needed
outside the northwestern boundary of the reserve, and near Saola habitat in the Nam Pheo
watershed. More important is research on swidden/forest dynamics in NNT, of which this
thesis is a small start.
91

REFERENCES
Achard, F., H.D. Eva, H.-J. Stibig, P. Mayaux, J . Gallego, T. Richards & J. -P. Malingreau. 2002. Determination of deforestation rates of the world's humid tropical forests. Science, 297, 999-1002.
ADB. 2001. Participatory Poverty Assessment: Lao People's Democratic Republic. Asian Development Bank. Manila.
Azimi, A., W. Knowland, J . Carew-Reid, I. Ruzicka & A. Zola. 2001. Environments in Transition: Cambodia, Lao PDR, Thailand, Viet Nam. Asian Development Bank. Manila.
Baker, J . , B. McKenney & J . Hurd. 2000. Initial Assessment of Social and Economic Factors Affecting Biodiversity Conservation Efforts in the Forests of the Lower Mekong Ecoregion Complex. WWF Indochina Programme/IUCN Laos. Hanoi and Vientiane:
Baltzer, M . C , Nguyen Thi Dao & R.G. Shore. 2001. Towards a Vision for Biodiversity Conservation in the Forests of the Lower Mekong Ecoregion Complex. WWF Indochina/WWF US. Hanoi and Washington DC.
Beckerman, S. 1983. Does the swidden ape the jungle? Human Ecology, 11, 1-13.
Berkmuller, K., S. Southammakoth & V. Vongphet. 1995. Protected Area System Planning and Management in Lao PDR: Status Report to Mid-1995. lUCN/Lao-Swedish Forestry Cooperation Programme. Vientiane:
Brady, N.C. 1996. Alternatives to slash-and-burn: A global imperative. Agriculture Ecosystems & Environment, 58, 3-11.
Brashares, J .S. , P. Arcese, M.K. Sam, P.B. Coppolillo, A .R .E . Sinclair & A. Balmford. 2004. Bushmeat hunting, wildlife declines, and fish supply in West Africa. Science, 306, 1180-1183.
Breazeale, K. & S. Smukarn. 1988. A Culture in Search of Survival: The Phuan of Thailand and Laos. Yale Center for International and Area Studies. New Haven, Connecticut, USA.
Brush, S.B. 1975. The concept of carrying capacity for systems of shifting cultivation. American Anthropologist, 77, 799-811.
Caughley, G. & A. Gunn. 1996. Conservation Biology in Theory and Practice. Blackwell Science. Cambridge, MA, USA.
Caughley, G. & A .R .E . Sinclair. 1994. Wildlife Ecology and Management. Blackwell Scientific Publishing. Boston, USA.
92

Chamberlain, J.R. 1997. Nature and Culture in the Nakai-Nam Theun Conservation Area. Privately published.
Chamberlain, J.R. 1999. The origins of the Sek: implication forTai and Vietnamese history. Journal of the Siam Society, 86, 27-48.
Chamberlain, J.R. 2001. Biocultural diversity and Lao NBCAs. In: Review of the National Protected Area System of Lao PDR (Ed. by Robichaud, W., C.W. Marsh, S. Southammakoth & S. Khounthikoummane), pp. 21. Lao-Swedish Forestry Programme. Vientiane
Chamberlain, J.R., C. Alton, L. Silavong & B. Philavong. 1996. Socio-Economic and Cultural Survey, Nam Theun 2 Project Area, Lao People's Democratic Republic. C A R E International. Vientiane:
Chazee, L. [2000]. Farming System and Agroforestry Mission, 9 October- 11 December 2000; Volume 1; Main Report. District Upland Development and Conservation Project.
Cohen, P.T. 2000. Resettlement, opium and labour dependence: Akha-Tai relations in northern Laos. Development and Change, 31, 179-200.
Daughtry, C.S.T. 2001. Discriminating crop residues from soil by shortwave infrared reflectance. Agronomy Journal, 93, 125-131.
De Koninck, R. 1999. Deforestation in Viet Nam. International Development Research Centre. Ottawa:
de Rouw, A., P. Baranger & B. Soulilad. 2002. Upland rice and Jobs' tear cultivation in slash and burn systems under very short fallow periods in Luang Prabang province. The Lao Journal of Agriculture and Forestry, 5, 2-10.
de Rouw, A., B. Soulilad, K. Phanthavong & B. Dupin. 2004. The adaptation of upland rice cropping to ever-shorter fallow periods and it's [sic] limit. In: Poverty reduction and shifting cultivation stabilization in the uplands of Lao PDR: Technologies, approaches and methods for improving upland livelihoods. Luang Phrabang, Laos: Lao PDR National Agriculture and Forestry Research Insititute.
Dechaineux, R. 2001. The role of forest food resources in village livelihood systems: A study of three villages in Salavan Province, Lao PDR. In: NTFPs in Lao PDR (CD). Non-timber Forest Products Project, Forest Research Centre, IUCN. Vientiane
DFRC. [2001]. Fact Sheets for National Biodiversity Conservation Areas in the Lao PDR [draft]. Lao PDR Division of Forest Resources Conservation, Department of Forestry. Vientiane:
Dickinson, E.C. 1970. Birds of the Legendre Indochina expedition 1931-32. Amer. Mus. Novit, 2423, 1-17.
93

Dove, M.R. 1993. A revisionist view of tropical deforestation and development. Environmental Conservation, 20, 17-25 & 56.
Duckworth, J.W., R.E. Salter & K. Khounboline. 1999. Wildlife in Lao PDR: 1999 Status Report. IUCN-The World Conservation Union/Wildlife Conservation Society/Centre for Protected Areas and Watershed Management. Vientiane.
Ducourtieux, O. 2004. Shifting cultivation and poverty eradication: a complex issue. In: Poverty Reduction and Shifting Cultivation Stabilization in the Uplands of Lao PDR: Technologies, Approaches and Methods for Improving Upland Livelihoods. Luang Phrabang, Laos: Lao PDR National Agriculture and Forestry Research Institute.
Dwivedi, R.S. & T. Ravi Sankar. 1991. Monitoring shifting cultivation using space-borne multispectral and multitemporal data. International Journal of Remote Sensing, 12, 427-433.
Fairhead, J . & M. Leach. 1996. Misreading the African Landscape : Society and Ecology in a Forest-Savanna Mosaic. Cambridge University Press. Cambridge, UK and New York, USA.
FAO. 1999. State of the World's Forests. Food and Agriculture Organization of the United Nations. Rome.
Foppes, J . 2001. Domestication of Non-Timber Forest Products (NTFPs) in the Nakai-Nam Theun NBCA. District Upland Development and Conservation Project. Thakhek, Lao PDR:
Foppes, J . , T. Saypaseuth, K. Sengkeo & S. Chantila. 1997. The Use of Non-Timber Forest Products on the Nakai Plateau. IUCN. Vientiane:
Fox, J . , Dao Minh Truong, A T . Rambo, Nghiem Phuong Tuyen, Le Trong Cue & S. Leisz. 2000. Shifting cultivation: A new old paradigm for managing tropical forests. Bioscience, 50, 521-528.
Fox, J . , S. Leisz, Dao Minh Truong, A T . Rambo, Nghiem Phuong Tuyen & Le Trong Cue. 2001. Shifting Cultivation Without Deforestation: A Case Study in the Mountains of Northwestern Vietnam. In: GIS and Remote Sensing Applications in Biogeography and Ecology (Ed. by Millington, A.C. , S .J . Walsh & P.E. Osborne), pp. 289-307. Kluwer. Norwell, MA, USA
Francis, C , K. Khounboline & N. Aspey. 1996. Reporton 1996 Survey of Bats and Small Mammals in Nakai-Nam Theun NBCA and Nearby Areas, Bolikhamsai and Khammouan Provinces, Lao PDR. WCS/CPAWM/Ministry of Agriculture and Forestry. Vientiane:
Fujisaka, S. 1991. A diagnostic survey of shifting cultivation in northern Laos - Targeting research to improve sustainability and productivity. Agroforestry Systems, 13, 95-109.
94
Hansen, P.K. & H. Sodarak. 1997. Potentials and constraints on shifting cultivation stabilisation in Lao P.D.R. Paper presented at the "Stakeholder Workshop on Shifting Cultivation", Vientiane, Laos 6-7 February 1997. Ministry of Agriculture and Forestry and Asian Development Bank. Vientiane:
Hausner, A. 2005. Convex Hulls. Princeton University www.cs.princeton.edu/~ah/alq anim/versionl/ConvexHull.html.
Hickey, G.C. 1982. Sons of the Mountains; Ethnohistory of the Vietnamese Central Highlands to 1954. Yale University Press. New Haven USA and London.
Hodgdon, B. 2004. Situation Analysis for the Greater Annamites Ecoregion. World Wide Fund for Nature Indochina Programme. Vientiane:
I FAD, IDRC, CIIFAD & IRR. 2001. Shifting Cultivation: Towards Sustainability and Resource Conservation. International Fund for Agricultural Development, International Development Research Center, Cornell Institute for Food Agriculture and Development, International Center for Research in Agroforestry and International Institute of Rural Reconstruction.
Ingles, A., T. Saypaseuth, K. Sengkeo & S. Bousou. 1998. A Rapid Survey of the Use and Government Regulations of Non-Timber Forest Products from the Nakai-Nam Theun NBCA, Central Laos. IUCN Lao Country Office. Vientiane:
Instone, L. 2003. Shaking the Ground of Shifting Cultivation: Or Why (Do) We Need Alternatives to Slash-and-Burn? Resource Management in Asia-Pacific Program, Research School of Pacific and Asian Studies, The Australian National University. Canberra.
IUCN. 1997. Environmental and Social Management Plan for Nakai-Nam Theun Catchment and Corridor Areas. lUCN-Lao PDR. Vientiane:
IUCN. 1998a. Environmental and Social Management Plan for Nakai-Nam Theun Catchment and Corridor Areas - Revision 1 May 1998. IUCN. Vientiane:
IUCN. 1998b. Social Action Plan for the Nakai-Nam Theun Conservation Area. IUCN. Vientiane:
IUCN. 1999. Nakai-Nam Theun Conservation Project Phase 2: Community Development and Biodiversity Conservation - Pilot Field Activities, Final Report. lUCN-Lao PDR. Vientiane:
IUCN. 2004. 2004 IUCN Red List of Threatened Species. IUCN Species Survival Commisson www.iucnredlist.org.
Jarosz, L. 1993. Defining and explaining tropical deforestation: Shifting cultivation and population growth in colonial Madagascar (1896-1940). Economic Geography, 69, 366-379.
95
Jarvie, J.K. 1997. Environmental and Social Action Plan for the Nakai Nam Theun Catchment and Corridor Areas - Technical Report of the Botanist-Plant Ecologist. lUCN-The World Conservation Union. Vientiane:
Kottelat, M. 1998. Fishes of the Nam Theun and Xe Bangfai basins, Laos, with diagnoses of twenty-two new species (Teloestei: Cyprinidae, Balitoridae, Cobitidae, Coiidae and Odontobutidae). Icthyol. Explor. Freshwaters, 9, 1-128.
Kummer, D.M. & B.L. Turner. 1994. The human causes of deforestation in Southeast Asia. Bioscience, 44, 323-328.
Kunstadter, P. & E.C. Chapman. 1978. Problems of Shifting Cultivation and Economic Development in Northern Thailand. In: Farmers in the Forest - Economic Development and Marginal Aghculture in Northern Thailand (Ed. by Kunstadter, P., E.C. Chapman & S. Sabhasri), pp. 3-23. East-West Center. Honolulu, HI, USA
Legendre, S.J . 1936. Land of the White Parasol and the Million Elephants; a Journey Through the Jungles of Indo-China. Dodd, Mead. New York.
Lehtonen, H. & P. Huttunen. 1997. History of forest fires in eastern Finland from the fifteenth century AD - The possible effects of slash-and-burn cultivation. Holocene, 7, 223-228.
Lepers, E., E.F. Lambin, A .C . Janetos, R. DeFries, F. Achard, N. Ramankutty & R.J. Scholes. 2005. A synthesis of information on rapid land-cover change for the period 1981-2000. Bioscience, 55, 115-124.
Lillesand, T.M. & R.W. Kiefer. 2000. Remote Sensing and Image Interpretation. John Wiley & Sons. New York, NY.
Ling, S. 1999. A Biological System of Prioritisation for Protected Areas in the Lao PDR. Centre for Protected Areas and Watershed ManagementVWildlife Conservation Society Cooperative Program. Vientiane:
Ludwig, D., R. Hillborn & C. Walters. 1993. Uncertainty, resource exploitation, and conservation: Lessons from history. Science, 260, 17+36.
MacKinnon, J . , (Ed.). 1997. Protected Areas Systems Review of the Indo-Malayan Realm. Asian Bureau for Conservation. Canterbury, England.
MacKinnon, J . & K. MacKinnon. 1986. Review of the Protected Areas of the Indo-Malayan Realm. IUCN. Gland, Switzerland and Cambridge, UK.
MAF. 2003. Forestry Strategy to the Year 2020 (second draft). Ministry of Agriculture and Forestry, Lao People's Democratic Republic. Vientiane:
Meine, C. 1999. It's about time: Conservation biology and history. Conservation Biology, 1 3 , 1-3.
96
NAFRI. 2004. Poverty Reduction and Shifting Cultivation Stabilization in the Uplands of Lao PDR: Technologies, Approaches and Methods for Improving Upland Livelihoods (CD). Luang Phrabang, Lao PDR: Lao PDR National Agriculture and Forestry Research Institute.
Netting, R.M. 1986. Cultural Ecology. Waveland Press, Inc. Prospect Heights, IL, USA.
Nooren, H. & G. Claridge. 2001. Wildlife Trade in Laos: The End of the Game. Netherlands Committee fo IUCN. Amsterdam.
NTPC. 2005. Nam Theun 2 Hydroelectric Project Environmental Assessment and Management Plan; Main Text. Nam Theun 2 Power Company. Vientiane:
O'Brien, W.E. 2002. The nature of shifting cultivation: Stories of harmony, degradation, and redemption. Human Ecology, 30, 483-502.
Pauly, D. 1995. Anecdotes and the shifting base-line syndrome of fisheries. Trends in Ecology & Evolution, 10, 430-430.
PCI Geomatics. 2004. Geomatica Version 9.1. Gatineau, Quebec, Canada.
Phaengsintham, P. 1996. Vegetation Survey in Nakai-Nam Theun Protected Area. National University of Lao and Wildlife Conservation Society. Vientiane:
Prados, J . 1999. The Blood Road: The Ho Chi Minh Trail and the Vietnam War. Wiley. New York.
Pravongviengkham, P.P. 1997. Local regulatory systems in support of the Lao swidden-based farm economy. In: Community Forestry at a Crossroads: Reflections and Future Directions in the Development of Community Forestry - Proceedings of an International Seminar, held in Bangkok, Thailand, 17-19 July, 1997. (Ed. by Victor, M., C. Lang & Bornemeier). R E C O F T C . Bankgkok
Rackham, O. 1998. Implications of Historical Ecology for Conservation. In: Conservation Science and Action (Ed. by Sutherland, W.J.), pp. 152-175. Blackwell. Oxford, UK
Raintree, J . & V. Soydara. 2001. Human Ecology and Rural Livelihoods, unpublished draft. Vientiane:
Raman, T.R.S. 1996. Impact of shifting cultivation on diurnal squirrels and primates is Mizoram, northeast India: A preliminary study. Current Science, 70, 747-750.
Ranjan, R. & V.P. Upadhyay. 1999. Ecological problems due to shifting cultivation. Current Science, 77, 1246-1250.
97
Rasul, G. & G.B. Thapa. 2003. Shifting cultivation in the mountains of South and Southeast Asia: Regional patterns and factors influencing the change. Land Degradation and Development, 14, 495-508.
Reams, G.A., W.D. Smith, M.H. Hansen, W.A. Bechtold, F.A. Roesch & G.G. Moisen. 2005. The Forest Inventory and Analysis Sampling Frame. In: The Enhanced Forest Inventory and Analysis Program-National Sampling and Estimation Procedures. Gen. Tech. Rep. SRS-80 (Ed. by Bechtold, W.A. & P.L. Patterson). US Department of Agriculture Forest Service, Southern Research Station. Asheville, NC, USA
Robichaud, W. 1997. Saola Conservation Action Plan for Lao PDR. Wildlife Conservation Society. Vientiane:
Robichaud, W. 1999. Saola Conservation Action Plan for Lao PDR - Revision. Wildlife Conservation Society/IUCN-The World Conservation Union. Vientiane:
Robichaud, W. 2003. A Reconnaissance of the Nam Chat-Nam Pan Provincial Protected Area, Bolikhamxay Province, Lao PDR, March 2003; with appended notes on wildlife in other areas of eastern Bolikhamxay Province. Report to the International Environmental and Social Panel of Experts for the Nam Theun 2 Hydroproject, Lao PDR. Vientiane:
Robichaud, W. 2005. Survey Summary: Investigation of Saola in the Nam Gnouang/Heung Watershed, 6-10 March 2005. RMR Asia. Vientiane:
Robichaud, W., C.W. Marsh, S. Southammakoth & S. Khounthikoummane. 2001. Review of the National Protected Area System in Lao PDR. Lao-Swedish Forestry Programme. Vientiane:
Robichaud, W. & R. Timmins. 2004. The natural history of Saola {Pseudoryx nghetinhensis) and the species' distribution in Laos. In: Rediscovering the Saola; Workshop Proceedings (Ed. by Hardcastle, J . , S. Cox, Nguyen Thi Dao & A. Grieser-Johns). WWF Indochina Programme; S N F C Project; Pu Mat National Park. Hanoi
Robichaud, W.G. & B.L. Stuart. 1999. Summary of Saola, Herpetological and Wildlife Trade Studies in Nakai-Nam Theun NBCA and the Proposed Nam Theun Extension. Wildlife Conservation Society. Vientiane:
Roder, W. 1997. Slash-and-burn rice systems in transition: Challenges for agricultural development in the hills of northern Laos. Mountain Research & Development, 17, 1-10.
Roder, W. 2001. Slash-and-Burn Rice Systems in the Hills of Northern Lao PDR: Description, Challenges, and Opportunities. International Rice Research Institute. Los Banos, Philippines:
98

Roder, W., B. Keoboulapha, S. Phengchanh, J .C. Prot & D. Matias. 1998. Effect of residue management and fallow length on weeds and rice yield. Weed Research, 38, 167-174.
Roder, W., B. Keoboulapha, K. Vannalath & B. Phouaravanh. 1996. Glutinous rice and its importance for hill farmers in Laos. Economic Botany, 50, 401-408.
Roder, W. & S. Maniphone. 1995. Forage Legume Establishment in Rice Slash-and-Burn Systems. Tropical Grasslands, 29, 81-87.
Roder, W. & S. Maniphone. 1998. Shrubby legumes for fallow improvement in northern Laos: establishment, fallow biomass, weeds, rice yield, and soil properties. Agroforestry Systems, 39, 291-303.
Roder, W., S. Maniphone & B. Keoboulapha. 1997a. Pigeon pea for fallow improvement in slash-and-burn systems in the hills of Laos? Agroforestry Systems, 39, 45-57.
Roder, W., S. Phengchanh, B. Keoboualapha & S. Maniphone. 1995a. Chromolaena odorata in slash-and-burn rice systems of northern Laos. Agroforestry Systems, 31, 79-92.
Roder, W., S. Phengchanh & B. Keoboulapha. 1995b. Relationships between soil, fallow period, weeds and rice yield in slash-and-burn systems of Laos. Plant & Soil, 176, 27-36.
Roder, W., S. Phengchanh & B. Keobulapha. 1997b. Weeds in slash-and-burn rice fields in northern Laos. Weed Research, 37, 111-119.
Roder, W., S. Phengchanh & S. Maniphone. 1997c. Dynamics of soil and vegetation during crop and fallow period in slash-and-burn fields of northern Laos. Geoderma, 76, 131-144.
Roder, W., S. Phengchanh & H. Soukhaphonh. 1995c. Estimates of Variation for Measurements of Selected Soil Parameters on Slash-and-Burn Fields in Northern Laos. Communications in Soil Science and Plant Analysis, 26, 2361-2368.
Russell, W.M.S. 1988. Population, swidden farming and the tropical environment. Population and Environment, 10, 77-94.
Sandewall, M., B. Ohlsson & S. Sawathvong. 2001. Assessment of historical land-use changes for purposes of strategic planning - a case study in Laos. Ambio, 30, 55-61.
Schaller, G.B. & A. Rabinowitz. 1995. The saola or spindlehorn bovid Pseudoryx nghetinhensis in Laos. Oryx, 29, 107-114.
Seatec International. 2000. Nam Theun 2 Hydroelectric Project Environmental Assessment and Management Plan (EAMP) - Draft Final Report (Main report). Seatec International Ltd/ Sincair Knight Merz ECI Inc. Vientiane:
99
Siegert, F., G. Ruecker, A. Hinrichs & A A . Hoffmann. 2001. Increased damage from fires in logged forests during droughts caused by El Nino. Nature, 414, 437-440.
Sinclair, A .R.E . , D.S. Hik, O.J. Schmitz, G.G.E. Scudder, D.H. Turpin & N.C. Larter. 1995. Biodiversity and the need for habitat renewal. Ecological Applications, 5, 579-587.
Sinclair, A .R .E . & M.P. Wells. 1989. Population Growth and the Poverty Cycle in Africa: Colliding Ecological and Economic Processess? In: Food and Natural Resources (Ed. by Pimentel, D. & C.W. Hall), pp. 439-484. Academic Press. San Diego, CA, USA
Smith, M.L., S.V. Ollinger, M.E. Martin, J.D. Aber, R.A. Hallett & C L . Goodale. 2002. Direct estimation of aboveground forest productivity through hyperspectral remote sensing of canopy nitrogen. Ecological Applications, 12,1286-1302.
Smitinand, T., S. Sabhasri & P. Kunstadter. 1978. The Environment of Northern Thailand. In: Farmers in the Forest - Economic Development and Marginal Agriculture in Northern Thailand (Ed. by Kunstadter, P., E.C. Chapman & S. Sabhasri), pp. 24-40. East-West Center. Honolulu, HI, USA
Spencer, J .E. 1966. Shifting Cultivation in Southeastern Asia. Univ. of California Press. Berkely and Los Angeles, CA, USA.
STEA. 2004. Conservation Action Plan for the Saiphou Louang: Lao PDR; draft for discussion. Lao PDR Science, Technology and Environment Agency. Vientiane:
Terborgh, J . 1992. Tropical Deforestation. Carolina Biological Supply Company. Burlington, NC, USA.
Timmins, R.J. & T.D. Evans. 1996. A Wildlife and Habitat Survey of Nakai-Nam Theun National Biodiversity Conservation Area, Khammouan and Bolikhamxai Provinces, Lao PDR. Wildlife Conservation Society. Vientiane:
Timmins, R.J. & K. Khounboline. 1999. Occurence and trade of the Golden Turtle, Cuora trifasciata, in Laos. Chelonian Conservation and Biology, 3, 441-447.
Tobias, J . 1997. Environmental and Social Action Plan for the Nakai-Nam Theun Catchment and Corridor Areas: Report of the Wildlife Survey. Wildlife Conservation Society. Vientiane:
Tran Van Quy. 2002. The Quy Hop Archive: Vietnamese-Lao Relations Reflected in Border-Post Documents Dating From 1619 to 1880. In: Breaking New Ground in Lao History: Essays on the Seventh to Twentieth Centuries (Ed. by Ngaosrivathana, M. & K. Breazeale), pp. 239-259. Silkworm Books. Chiang Mai, Thailand
UNDP. 2004a. Human Development Report 2004 - Country Fact Sheets - Lao People's Dem. Rep. United Nations Development Program. http://hdr.undp.org/statistics/data/country fact sheets/cty fs LAO.html, 18 June 2005
100
UNDP. 2004b. Human Development Reports 2003 - Indicators - Lao People's Dem. Rep. United Nations Development Program. http://hdr.undp.org/statistics/data/ctv/ctv f LAO.html. 18 June 2005
W C S . 1995a. Preliminary Management Plan for Nakai-Nam Theun National Biodiversity Conservation Area. Wildlife Conservation Society. Vientiane:
W C S . 1995b. Results ofa Survey of Terrestrial Wildlife in the Area to be Affected by the Proposed Nam Theun 2 Hydroelectric Project. Wildlife Conservation Society. Vientiane:
W C S . 1996. Additional surveys and recommendations on the birds and mammals for the Nakai-Nam Theun 2 Hydropower project, with emphasis on the proposed corridor and the reservoir islands area. Wildlife Conservation Society. New York:
Wikramanayake, E., E. Dinerstein, C .J . Loucks, D. Olson, J . Morrison, J . Lamoreux, M. McKnight & P. Hedao. 2001. Terrestrial Ecoregions of the Indo-Pacific: A Conservation Assessment. Island Press. Washington, DC.
Wilson, E.O. 1984. Biophilia. Harvard University Press. Cambridge, USA.
WMPA. 2004. Social and Environmental Management Framework and 1st Operational Plan Nam Theun 2 Watershed Management and Protection Authority. Vientiane:
WMPA. 2005. Social and Environmental Management Framework and 1st Operational Plan Nam Theun 2 Watershed Management and Protection Authority. Vientiane:
World Bank. 2000. World Bank Logging Survey Mission: Technical Report. World Bank. Washington DC:
Yoon, C.K. 1999. Turtles vanish in black hole: soup pots and pans of China. New York Times, May 4, 1999
101