The Principalship: A Study of the Principal's Time on Task ...
156
Marshall University Marshall Digital Scholar eses, Dissertations and Capstones 2007 e Principalship: A Study of the Principal's Time on Task From 1960 to the Twenty-First Century Jacqueline A. McPeake Follow this and additional works at: hp://mds.marshall.edu/etd Part of the Demography, Population, and Ecology Commons , Educational Assessment, Evaluation, and Research Commons , Educational Leadership Commons , Elementary and Middle and Secondary Education Administration Commons , and the Teacher Education and Professional Development Commons is Dissertation is brought to you for free and open access by Marshall Digital Scholar. It has been accepted for inclusion in eses, Dissertations and Capstones by an authorized administrator of Marshall Digital Scholar. For more information, please contact [email protected]. Recommended Citation McPeake, Jacqueline A., "e Principalship: A Study of the Principal's Time on Task From 1960 to the Twenty-First Century" (2007). eses, Dissertations and Capstones. Paper 765.
-
Upload
khangminh22 -
Category
Documents
-
view
2 -
download
0
Transcript of The Principalship: A Study of the Principal's Time on Task ...

Marshall UniversityMarshall Digital Scholar
Theses, Dissertations and Capstones
2007
The Principalship: A Study of the Principal's Timeon Task From 1960 to the Twenty-First CenturyJacqueline A. McPeake
Follow this and additional works at: http://mds.marshall.edu/etdPart of the Demography, Population, and Ecology Commons, Educational Assessment,
Evaluation, and Research Commons, Educational Leadership Commons, Elementary and Middleand Secondary Education Administration Commons, and the Teacher Education and ProfessionalDevelopment Commons
This Dissertation is brought to you for free and open access by Marshall Digital Scholar. It has been accepted for inclusion in Theses, Dissertations andCapstones by an authorized administrator of Marshall Digital Scholar. For more information, please contact [email protected].
Recommended CitationMcPeake, Jacqueline A., "The Principalship: A Study of the Principal's Time on Task From 1960 to the Twenty-First Century" (2007).Theses, Dissertations and Capstones. Paper 765.

THE PRINCIPALSHIP: A STUDY OF THE PRINCIPAL’S TIME ON TASK FROM 1960 TO THE TWENTY-FIRST CENTURY
Jacqueline A. McPeake, EdD Marshall University
College of Education and Human Services
Dissertation submitted to the Faculty of the Marshall University Graduate College
In partial fulfillment of the Requirements for the degree of
Doctor of Education
In
Educational Leadership
Committee Chair, Teresa Eagle, EdD
Michael Cunningham, EdD
Jerry Jones, EdD
Emily Meadows, EdD
Huntington, West Virginia, 2006
Keywords: Principal, Time on Task, Bifurcation, Responsibilities
Copyright 2007 by Jacqueline Ann McPeake

ABSTRACT
THE PRINCIPALSHIP: A STUDY OF THE PRINCIPAL’S TIME ON TASK FROM 1960 TO THE TWENTY-FIRST CENTURY
Jacqueline McPeake
The purpose of this study was to examine legislative and societal developments in the United States in relation to changes in educational administration and determine the existence of bifurcation points of change. The effects of legislative and societal changes on the tasks on which administrators focus their time were evaluated. The administrators were surveyed to determine if changes in time on task have occurred to meet the demands of current legislative priorities and if any demographic relationships existed. The study’s population consisted of 1950 (N=1950) administrators in public elementary, middle and high schools in the Southern Regional Educational Board 16 states. A systematic stratified random sample (n=480) was used with a researcher developed survey, for a return rate of 51.05%. In this study, 60.6% of the elementary respondents were females, while 60% of the 85 middle level principals and 69.2% of the 91 secondary principals were male.
The analysis of the literature from the 1960s to the 21st century revealed bifurcation points in the time allocated to administrative tasks. One of the most pronounced findings was the consistent increase in the total amount of time that principals spend per week from the 1960s to 2007. Bifurcation points in educational administration were identified as occurring in the 1970s, 1980s, and early 2000s. The literature review demonstrated the mean time dedicated to the job was 49.31 hours in the 1960s and had risen to 61.1 hours in the early 2000s. The current study found the mean time worked by principals to be 60.3 hours per week. Positive correlations were discovered in six of the seven demographic characteristics in relation to the nine task areas: gender, grade level, student population, type of community, level of education, and principals’ experience. The percent of increase in time for the last three year period was: School Management - 57.5%, Personnel - 64.8%, Program Development - 64%, Student Activities - 38.4%, Student Behavior - 30.6%, Planning – 60.8%, Community Relations- 42.5%, District Office – 38.8%, and Professional Development - 52.9%. Fifty percent of the respondents pointed to the mandates of No Child Left Behind as a cause for the increase in time on task.

iii
DEDICATION
This paper is lovingly dedicated to my husband Jeff and my precious children,
Justin and Jessica, with the belief that we have all earned this degree together. This work
is also respectfully dedicated to my mother, Jean Radford, who has always supported my
dreams, and to my father, Thomas Radford, who would have been so proud to have a
Doctor in the family.

iv
ACKNOWLEDGEMENTS
I must recognize and acknowledge my appreciation and respect for the support
and encouragement that I have received along this journey from my family, friends, and
colleagues. My sincere gratitude and appreciation to:
My doctoral committee chair, Dr. Teresa Eagle, who was always there to listen to
my doubts and fears, and to provide the support to overcome all the obstacles. Our
friendship has become an important part of my life. I will always cherish her faith in my
abilities to accomplish this goal.
Dr. Michael Cunningham, whose challenge to always meet his high standards has
made me better prepared for the world of academia and whose faith in my abilities has
allowed me to experience the challenges and benefits of teaching in higher education.
Dr. Jerry Jones, who has been the quiet support in the background and has always
provided reassurance when I needed it. Dr. Jones provided the chance to first experience
teaching fellow principals.
Dr. Emily Meadows, who was my cheerleader and support person before I even
knew I needed one. Dr. Meadows never hesitated to tactfully and gently suggest another
way to get the job done, and then helped me do it. I truly appreciate her sharing of her
vast knowledge in the area of personnel.
The faculty in leadership studies at Marshall University Graduate College who
allowed me to become an active participant in their community of scholars: Dr. Bobbi
Nicholson, Dr. Jack Yeager, Dr. Sam Securro, Dr. Edna Meisel, Dr. Michael Galbraith,
Dr. Rebecca Goodwin, and Dr. Mary Harris-John.

v
My classmates in the pursuit of this degree who have shared, supported, and
laughed to keep from screaming. My hope is that all my “higher ed” and “lower ed”
friends accomplish their goals. A special nod of gratitude goes to Serena Starcher, Joel
Harris, Suzette Cook, Erika Zimmerman, Lisa Beck, Monica Brooks, Trecia Peterson,
and Christi Chambers.
My fellow administrators, teachers, and staff at Woodrow Wilson High School
who always offered assistance and encouragement through this long process. To my
principal, Bob Maynard who covered many extra-curricular duties when I needed to
attend class. To Pam Faulkner for your support and proofreading skills.
The Southern Regional Education Board for the cooperation in securing the
mailing lists for schools.
The National Association of Secondary School Principals for graciously
providing past studies completed by their organization for the improvement of the
professional school administrators.
My parents who engrained in me the belief that I could accomplish any goal with
hard work and determination. To my mother who unselfishly watched my children for
every class, deadline, and presentation and who never complained about her lack of
personal time. Thank you for instilling the values of the importance of education.
Connie and Dennis King who cared enough to come after me when it was time to
come home.

vi
My children, Justin and Jessica, who have never complained or whined about
Mommy’s homework. The days when my determination would wane I could always
count on my angels to boost my spirits by calling me “Dr. Mom.” Jessica became my
official sorter, folder and stamper, while Justin became the jokester to keep me laughing.
Finally, my undying appreciation to my understanding and supportive husband,
Jeff, whose constant encouragement and patience has made this dream possible. Your
name should be on the cover also.

vii
TABLE OF CONTENTS
ABSTRACT………………………………………………………………………………ii
DEDICATION…………………………………………………………………………....iii
ACKNOWLEDGEMENTS………………………………………………………………iv
LIST OF TABLES……………………………………………………………………...viii
LIST OF FIGURES………………………………………………………………………ix
CHAPTER ONE…………………………………………………………………………..1
CHAPTER TWO………………………………………………………………………...18
CHAPTER THREE…………………………………………………………….………..60
CHAPTER FOUR……………………………………………………………………….69
CHAPTER FIVE……………………………………………………………………….103
REFERENCES…………………………………………………………………………122
APPENDICES………………………………………………………………………….135
Appendix A……………………………………………………………………..136
Appendix B……………………………………………………………………..140
Appendix C……………………………………………………………………..142
Appendix D……………………………………………………………………..144
CURRICULUM VITAE..………………………………………………………………146

viii
LIST OF TABLES
Table 1 Percent Comparisons of Time Reported by School Principals Page 34
Table 2 Percent of Time Spent by Principals on Tasks Page 53
Table 3 Percent of Time Documented by Literature Review Page 83
Table 4 Mean Amount of Time (Hours/week) on Nine Task Areas Page 84
Table 5 T-test of Gender to Total Time Page 85
Table 6 Correlation of Gender to Nine Task Areas Page 86
Table 7 ANOVA of Principals’ Age to Total Time Page 87
Table 8 Correlation of Principals’ Age to Nine Task Areas Page 88
Table 9 ANOVA of School Grade Levels to Total Time Page 88
Table 10 Correlation of School Grade Levels to Nine Task Areas Page 89
Table 11 ANOVA of Student Population to Total Time Page 90
Table 12 Correlation of Student Population to Nine Task Areas Page 91
Table 13 ANOVA of the Type of Community to Total Time Page 93
Table 14 Correlation of the Type of Community to Nine Task Areas Page 94
Table 15 ANOVA of Principals’ Experience to Total Time Page 95
Table 16 Correlation of Principals’ Experience to Nine Task Areas Page 96
Table 17 ANOVA of Principals’ Education Level to Total Time Page 96
Table 18 Correlation of Principals’ Education Level to Nine Task Areas Page 98
Table 19 Mean Percent of Change in Time on Task Areas Page 99
Table 20 Frequency of Gender in Relation to School Levels Page 101

ix
LIST OF FIGURES
Figure 1 School Management Reported Percentage Page 71
Figure 2 Student Activities Reported Percentage Page 72
Figure 3 Student Behavior Reported Percentage Page 73
Figure 4 Personnel Reported Percentage Page 74
Figure 5 Program Development Reported Percentage Page 75
Figure 6 District Office Reported Percentage Page 76
Figure 7 Community Relations Reported Percentage Page 77
Figure 8 Planning Reported Percentage Page 78
Figure 9 Professional Development Reported Percentage Page 79

1
CHAPTER 1
INTRODUCTION
The role of the principal has increased in complexity as the school leader has
struggled to find the balance between the responsibilities of the instructional leader,
building manager, organizational leader, strategic planner, and community leader
(Goodwin, 2002; SAELP, 2003). The principal’s major task has always been to make a
positive difference in the environment of students, teachers, parents, and others
concerned with the school’s success (Drake & Roe, 1999; Kearney, 2005; Marzano,
Waters, & McNulty, 2005). In addition, the issues of school accountability and
improvement have become a constant challenge for educational leaders. Numerous
researchers have documented these evolving and demanding challenges of school
administration, although the reasons for the constant change in the profession have not
been determined (Blair, 2001; Goodwin, 2002; Morrow, 1993). Goodwin (2002)
described the profession as being in a “state of chaos.” This condition is evidenced by the
professional school leader performing a job that is fragmented and varied, while being
expected to remain focused on emphasizing teamwork and promoting consistent school
reform (Blair, 2001; Morrow, 1993).
To meet the needs of educational reform, the importance of the principals’
leadership skills have been emphasized (Edmonds, 1988; Lezotte, 1991; Marzano et al.,
2005). Research has indicated that the school administrator’s influence is an essential
component in establishing and promoting improvement in the schools (Lezotte, 1991;
Marzano et al., 2005). With the importance of school administrators being stressed as
essential to meeting the ever-growing demands of education, the time that an

2
administrator can dedicate to tasks continues to be divided more than any time in history.
This study will examine the historical developments in the amount of time that principals
have spent on administrative tasks, and determine the time on tasks on which
administrators currently focus their efforts.
History of Educational Administration
Educational administrators have experienced many modifications in the
responsibilities of the job since the early inception of the position of a head teacher.
From the time when the head teacher took care of the coal fire and maintained the
building, the tasks of administrators have changed drastically over the years (Drue,
1981). In the early years, school principals rang the bells and occasionally paddled a few
mischievous boys. During the first half of the 19th century, the principal teacher became
responsible as the instructional leader in charge of finance, personnel, and the facility.
The Federal Courts and legislature have continued to have an impact on
educational administration with landmark cases and legislation. In 1954, the landmark
school desegregation case, Brown v. Topeka Board of Education, presented the
administrator with the responsibility of assuring equality of education to all students
regardless of race, sex, or economic condition. The successful Russian launch of the
spacecraft Sputnik provided the public their first chance to influence public education in
the United Sates to change. The public outcry for better education in the United States
placed administrators in the position of modifying curriculum to meet the demands of a
technological world and not be left behind in the global economy. This criticism gave
impetus to The Great Debate: Our Schools in Crises. The viewpoints expressed by the
authors presented the opportunity for another focused change in schools (Winfield, Hills,

3
& Burns, 1959). In 1964, Title VI of the Civil Rights Act followed up the Brown v
Topeka decision by barring discrimination on the basis of race, color, or national origin.
Later, the Elementary and Secondary Act of 1965 made federal funds available to serve
the needs of low socio-economic children in public and non-public schools (Drake &
Roe, 1999).
Then in the 1970s, administrators became responsible for problems that could be
related to a shift in cultural norms and parental attitudes. The Education for All
Handicapped Children Act of 1975 added the responsibility to principals of ensuring that
all handicapped children received a free and appropriate education in the least restrictive
environment. The 1980s brought a wave of new reform with the publication of A Nation
at Risk. This report commissioned by the National Commission on Excellence in
Education focused attention on the shortcomings of national educational practices and
recommended an overhaul of the system (Drake & Roe, 1999; National Commission on
Education, 1983). During this same time, Graham (1982) found the time spent on tasks
by elementary, middle, and high school principals varied based on principals’
preferences, expectations of the superintendent and community, and the amount of
administrative support being provided. These tasks provide insight into the daily rigors
of the job of a school administrator.
Current Legislative and Societal Changes
With these workloads, in 2002 educational administrators found themselves faced
with the added obligations to create and manage schools where all students can achieve to
their full potential (SAELP, 2003). From elementary to secondary, schools have been
seeking leadership to help meet the criteria set forth in the federal legislation known as

4
the No Child Left Behind (NCLB) Act which was signed into law, January 8, 2002, by
President George W. Bush (United States Department of Education, 2006). NCLB is the
most recent reauthorization of the Elementary and Secondary Education Act (ESEA): the
federal government’s legislation written to impact public education in elementary and
secondary levels (Swanson & Chaplin, 2003). Similar goals have been incorporated into
past federal legislation, but NCLB exceeds earlier attempts by attaching high stakes to the
failure of a school. The success of a school requires the most effective use of an
administrator’s time. This success has been measured by standardized test results;
schools are held accountable through the use of student test data.
According to NCLB, each state shall develop and implement an accountability
system that will ensure all Local Educational Agencies (LEAs) and schools make
Adequate Yearly Progress (AYP). The success of the school in meeting AYP is
ultimately traced back to the leadership within each individual school. The broad
definition of AYP is that each school and each subgroup of students will meet the annual
objectives determined by state and federal guidelines. The ultimate purpose of calculating
AYP is to ensure that schools and LEAs are focused on the accountability goal of all
students becoming proficient by 2014 (United States Department of Education, 2006).
The accomplishment of these goals falls directly on the principals of the individual
schools.
Along with the accomplishment of these goals of NCLB, principals have become
inundated with a variety of societal problems that cannot be ignored. According to
Kopkowski (2006), “More than 5 million English-language learners enrolled in public
schools in the early 2000s - a greater than 65 percent jump from the previous decade” (p.

5
26). These students require a wide array of services to provide the quality education
mandated by current legislation. Dealing with the needs of an increasingly diverse ethnic
and racial population has changed the complexity of the school principal’s job also. In
1992, the populations of school age students were 67% Caucasian, 17% African-
American, 12% Hispanic, 4% Asian or Pacific Islander and 1% American Indian/Alaska
Native. By the early 2000s, the numbers had a significantly different composition. The
number of Caucasian students had dropped to 60% of the school age population, due
mostly to the increase of Hispanic students who now amounted to 18% of the total
enrollment (Kopkowski, 2006). The changes in the characteristics of the American
family have also affected the roles of school administrators, along with the affects on the
child’s achievement in school. A standard of measure of family environment has been
the family’s status for the school lunch program. Eligibility for free or reduced price
meals provides a measure of the family’s poverty status. In 2005, 41% of all fourth
graders in the United States were eligible for free and reduced meals. Another important
characteristic of the family environment is the classification of the family’s household
based on the number of parents or guardians. According to the National Center for
Education Statistics (NCES),
The past 25 years have seen a decrease in the percentage of two-parent
households, from 83 percent in 1976 to 68 percent in 2001. White and Hispanic
children ages 5-17 in 2001 were more likely than their Black peers to be living in
a two-parent household (NCES, 2006, p. 1).
Furthermore, while the composition of school populations and the family
characteristics have changed, the alternatives for school choices have also expanded.

6
Parents can now choose to have their children home-schooled (Peoples, 2001) or can
utilize the option of school vouchers for private school attendance (Kopkowski, 2006).
Additionally the increased technology skills of modern day society have resulted
in an increase in the technology available in the school setting. For example,
In the early 2000s, the average school contained 136 instructional computers, and
nearly 93 percent of classrooms reported having Internet access, up from 51
percent just five years earlier. Virtually every school now has some level of
Internet access (Kopkowski, 2006, p.26).
The increased technology has added the responsibility of maintenance and upgrading of
hardware and software to the principals’ never-ending list of to-dos.
Principals’ responsibilities now included the implementation of Safe Schools
policies. Especially in the aftermath of the terrorist attacks of 9/11/2001, principals have
been placed in the position of developing plans for homeland security to protect the
student body. One Maryland secondary school is even pioneering the first homeland
security curriculum (Phillips, 2006). The discussion of patriotism versus individual
rights is also of consequence in schools and requires the principal’s consideration
(Westheimer, 2006).
Principals are now faced with the added knowledge that the number of college
graduates choosing to enter the field of education has continued to shrink (Phillips,
2002). With the shrinking number of certified teaching candidates, the pool of principals
who feel competent to handle all of these administrative responsibilities has also
decreased in the last decade (Copland, 2001). This study will examine the range of

7
administrative tasks in the past decades to better understand the administrators’ daily
responsibilities.
Administrative Tasks
Studies of the routines by which principals utilize their time have been conducted
(Blair, 2001; Campbell & Williams, 1991; Cook, 1998; Morrow, 1993). Researchers
over the past decades have also examined the amount of time spent on tasks, but have
limited their studies by geographic areas, gender, grade levels of the schools, or other
demographic data (Balsamo, 2004; Cook, 1998; Graham, 1982; Hull, 2005; Zirkes,
1987). Blair (2001) provided more current information on the relationship between
student achievement and principal time. Blair’s (2001) study found a significant
correlation between the amount of time principals in Texas spent on instructional
leadership and management tasks and their schools ratings on the Academic Excellence
Indicator System (AEIS) and the ability to meet the standards of NCLB Act.
The Association of California School Administrators (1983) developed a guide in
an attempt to help school administrators develop time strategies and techniques to
manage their time better, but the workload has continued to increase with each year and
each new mandate. Principals continue to be trained as building managers and general
administrators, but are not prepared and do not have the time needed to be instructional
leaders (Cook, 1998; Drake & Roe, 1999; Marzano et al., 2005). The National
Association of Secondary School Principals (NASSP) has identified nine significant areas
of responsibility in which principals focus their time. These nine areas are (a) school
management, (b) personnel, (c) program development, (d) student activities, (e) student
behavior, (f) planning, (g) community, (h) district office, and (i) professional

8
development (NASSP, 1996). In addition to the NASSP study, Morrow (1993)
discovered that from 1977 to 1993 there had been little change in the tasks principals
believed should be demanding their time for student achievement and the tasks that
actually received their time and effort.
In order to understand the obstacles that prevent administrators from being
focused on the most significant tasks, one must understand the problems and challenges
that face school principals on a daily basis. The State Action for Educational Leadership
Project (SAELP) is a Kentucky-based initiative to investigate how principals spend their
time on daily activities. SAELP has suggested an administrator is expected to do it all in
an 8-hour day, then devote their evenings to the extra-curricular duties inherent to the job
description (SAELP, 2003). The SAELP further found that Kentucky principals spend an
average of 9 hours and 15 minutes on the job every day in order to accomplish the wide
variety of tasks. These many tasks require a vast body of knowledge, attention to detail,
appropriate training, and excellent communication skills. Principals are expected to lead
schools that consist of diverse student populations and staff while maintaining a sense of
purpose and teamwork (Blair, 2001). New responsibilities are constantly added, but
responsibilities are never deleted from the list (King, 2002; SAELP, 2003; Sergiovanni,
2001). Today’s administrators continue to be faced with a variety of responsibilities:
attendance issues, curriculum alignment, curriculum development, professional
development, teacher selection, fiscal compliance with state mandates, and dealing with
disruptive students (Rayfield & Diamantes, 2004). The current focus of attention for
administrators at all levels is the compliance with the mandates that have become an
added area of responsibility.

9
This study will examine the amount of time that school principals currently spend
on administrative tasks. It will seek to determine the existence of critical points in history
that have had a significant impact on the tasks that an administrator performs on a daily
basis. This analysis of the historical transformation of educational leadership tasks will
assist in identifying critical points of change. These critical points of change have been
referred to as the bifurcation points in educational administration (Goodwin, 2002).
Bifurcation points are those points in time where decisions, choices, and actions can
dramatically alter the entire system. These points can destroy the entire system or lead to
a new way of doing things (Bifurcation Points, 2006). Thus, since new accountability
measures have been mandated, there is a need to supplement the existing data with
current research that relates the time that the principal spends on activities in relation to
the time that was spent by administrators in the past.
Statement of the Problem
A principal with strong leadership skills and who focuses on creating a school
climate conducive to learning has been identified as one of the most important attributes
of an effective school (Gordon, 1996). The responsibilities of a school principal have
evolved from one of a minor financial and maintenance position to the current position of
being responsible for every child in the building becoming a successful learner (Drue,
1981; Marzano et al., 2005). Principals have acknowledged two major obstacles to
performing their assigned responsibilities: the increasing complexity of the job and the
lack of staff to handle the myriad of routine duties that occur in a school. These routine
duties and the day-to-day needs of the school are so demanding that there is little time left
for curriculum and instruction concerns (Smith & Andrews, 1989). The mandates of

10
accountability and testing have added a greater focus towards the areas of curriculum and
instruction. Historically, the research on educational leadership has identified the
numerous tasks of school principals in conjunction with the time allocated to these
particular tasks. The current question is whether or not the administrators’ time on tasks
has changed to meet societal and legislative expectations.
Purpose of the Study
The purpose of the study was to examine the legislative and societal
developments in the United States in comparison to the changes in educational
administration to determine the existence of bifurcation points of change. This study
sought to determine the effect that legislative and societal changes have had on the tasks
on which administrators focus their time. To understand how these legislative and
societal changes have affected the function of administrators, it is necessary to study the
current responsibilities and tasks of educational administrators in relation to the historical
responsibilities and tasks of school leaders. This study fills the void in the literature
regarding the changes in the leadership roles of school administrators in relation to the
mandates of present legislation and societal expectations. This information assists in
analyzing the current time-on-task of school administrators to determine if recent events
and legislative mandates of the early 2000s have become a bifurcation point in
educational leadership. The time-on-task of the administrators was surveyed to
determine if changes had occurred to meet the demands of the current legislative
priorities and if any of the changes had a relationship to the demographic data collected
on the principals and their schools. This study investigated the principals’ current use of
time in school leadership activities.

11
Conceptual Framework
The concept of organizational leadership has developed and been modified to
attempt to describe the roles and activities of principals. Burns (1978) originated the
concept of transformational leadership to explore how a leader will produce results
beyond expectations by being focused on change. In this study, the bifurcation points of
change in educational leadership were identified in order to evaluate if principals have
had the vision necessary to adapt to societal changes and produce results beyond
expectations. To explain the changes within organizations, Leithwood (1994) further
developed the concept of transformational leadership in education based on the work of
Burns (1978) and Bass and Avolio (1994). Leithwood based his composite beliefs on the
model of the four I’s of transformational leadership. Leithwood’s four I’s were posed as
necessary traits for administrative leaders to meet the mandates of the ever-changing
educational environment. These four I’s include individual consideration, intellectual
stimulation, inspirational motivation, and idealized influence (Leithwood, 1994; Marzano
et al., 2005).
The basic premise is that an effective leader is shaped by a combination of these
traits or behaviors (Blair, 2001). The assertion is that a transformational leader must have
vision and goals to meet the ever-changing parameters of education. The conceptual
framework of transformational leadership will explain whether or not the school leaders
have the ability to change what they do on a daily basis, so that their schools achieve the
goals established by societal and legislative mandates. The concept of transformational

12
leadership and adaptive behaviors for change will be further developed in the literature
review to follow in Chapter 2.
Research Questions
In order to realize the purpose of this study, the following questions guided the
research:
1. Since the 1960s, what are the major historical bifurcation points marking the
changes in principals’ time on task that were brought about by political and
societal changes?
2. How do principals currently allocate their time on administrative tasks?
3. Are there significant relationships between selected demographic data and the
current amount of time being allocated to administrative tasks?
4. Do principals perceive the legislative and societal changes in the early 2000s to
have altered the amount of time allocated to administrative tasks?
5. What legislative and societal issues in the early 2000s do principals perceive as
the reasons for any changes in the time allocated to tasks?
Significance of the Study
This study suggested the bifurcation points of educational administration and
explored whether the edicts of society and legislation have significantly influenced the
day-to-day performance of school administrators. The study of the past roles and the
critical legislative and social bifurcation points helped determine if education is changing
to meet the demands of the times, or simply maintaining the status quo. The analysis of
bifurcation points will assist future policy makers and legislators in understanding the
impact of their actions on the professional responsibilities of educational administrators.

13
In order to develop appropriate principal training programs that meet the demands
of educational institutions, an analysis of the status of time management of school
administrators was necessary. The analysis of how administrators are delegating their
time in the new era of accountability as compared to past roles provides useful
information for professional development and training. The parties responsible for
professional development benefit from the statistical data by gaining more insight into
the needs for related training. The higher education personnel who are responsible for
developing the programs to train future principals have a better understanding of the
current time constraints and the areas of responsibilities that require increased training.
This study provided critical information for school systems searching for methods
of making schools more efficient by allowing the principals to delegate time to critical
activities. Drake and Roe (1999) suggested that a services' coordinator might be one
avenue of improving the time utilized on curriculum and instruction. The data provided
by this research may determine the need for part-time help to cover some of the
demanding aspects of a principal’s time. Principals may need to be trained in the
delegation of tasks and other time management skills. The awareness of the time on task
issues will assist administrators in performing a self-analysis and developing an
improvement plan for their own delegation of time. Some school systems are opening the
discussion to the reduction of paperwork required by the central office and redefining
roles of the central administration (Drake & Roe, 1999). The results of this study will
assist the leaders of school systems and policy makers in prioritizing changes to support
principals in improving student achievement.

14
Limitations
This study is limited in that principals are expected to be able to determine the
amount of time that has been spent on the multitude of tasks in which they are involved
on a daily basis. The researcher recognizes that many activities are so instinctively and
efficiently accomplished, the reporting of time may not be accurate. Self-reporting is a
concern when requesting respondents to answer honestly. In addition, there are activities
that may occur more at certain times of the school year and the timing of this study may
have coincided with certain of these activities. The subjects responding to this study may
inadvertently misrepresent the true picture of overall school functions because the
principals are focused on current responsibilities. The employment of an assistant
principal may also bias the information being provided by the principal. The length of
tenure of the principal is also a limiting factor. The length of tenure would affect the
amount of time the principal may have been able to build teams and relationships. This
team building will have an effect on his ability to delegate responsibilities to others or
focus his time on accomplishing the tasks independently.
The review of literature to determine the existence of bifurcation points in relation
to administrative changes is based on the researcher’s ability to assimilate the
information. The variability in the different literature sources being utilized may raise
questions over the conclusions that are made in relation to the bifurcation points in
educational administration.
Delimitations
The following delimitations have been identified for this study. In view of the fact
that the majority of private schools are not under the regulations of NCLB, the principals

15
included in this study will be limited to ones who are employed in public schools.
Administrators in the states located in the Southern Regional Educational Board (SREB)
will be surveyed. These 16 states are Alabama, Arkansas, Delaware, Florida, Georgia,
Kentucky, Louisiana, Maryland, Mississippi, North Carolina, Oklahoma, South Carolina,
Tennessee, Texas, Virginia, and West Virginia. The SREB states were selected due to
the commonalities in the goals established by the SREB’s Challenge to Lead (SREB,
2006). This study was limited to full time principals and did not survey assistant
principals. The principals considered in this research have served in their current
administrative position for a minimum of three years.
Assumptions
This study was based on the following assumptions:
1. The principals’ perceptions of activities and times are reasonably accurate.
2. The principals’ understanding of the defined terms of the study are congruent with
the researcher’s understanding of the defined terms.
3. The principals are working diligently at all aspects required in their position.
4. The principals in the study are representative of the larger population of
administrators.
5. Responses obtained in the survey approach in gathering information are honestly
reported by the respondents.
Definitions
The following operational definitions were utilized in this study.
Demographic Data - The response of the participant as measured by the McPeake

16
Time Analysis Survey (Appendix A) of the gender of the principal, size of the school
population, level of the school, socio-economic status of the school, and location of
the school.
Levels of Schools- The response of the participant as indicated on the McPeake
Time Analysis Survey of Principals:
High School – contains a 12th grade class,
Middle School – does not meet the definition of an elementary school and
contains a grade 8 but does not contain grade 12, or
Elementary School – may include grades K – 4 but does not contain grade 8 or
higher. (WV Dept. of Ed., 2006).
The effect of the Legislative and Societal Changes in the 2000s - The response of
the participant as measured by the McPeake Time Analysis Survey of Principals on
the perceived effect on time spent after the passage of No Child Left Behind Act,
passed in 2001, and other societal and legislative changes in the early 2000s.
Time Spent on Tasks- The response of the participant on the amount of time,
expressed in hours per week, allocated to the task areas as measured by the McPeake
Time Analysis Survey. The nine task areas that have been identified are: (a) school
management, (b) personnel, (c) program development, (d) student activities, (e)
student behavior, (f) planning, (g) community, (h) district office, and (i) professional
development (NASSP, 1996). To clarify the task areas, the following definitions
have been developed utilizing the definitions of Murphy (1983). These definitions
will be explained in the survey to assist principals in classifying their time on task.

17
(a) School management – Time reported by the respondent spent on office
responsibilities, building maintenance, and budget finance.
(b) Personnel – Time reported by the respondent spent on supervision, evaluations,
staff development discussions, and grievances.
(c) Program development- Time reported by the respondent spent on scheduling
planning, demonstration teaching, selecting materials, testing/evaluation, and
lesson plans.
(d) Student activities- Time reported by the respondent spent on athletics,
supervision (lunch, yard, bus), programs, plays, and field trips.
(e) Student behavior- Time reported by the respondent spent on discipline, parent
conferences, informal visits, and counseling.
(f) Planning- Time reported by the respondent spent on county and district planning
sessions, department meetings, and curriculum meetings.
(g) Community relations- Time reported by the respondent spent on civic
organizations, media, discussions, Parent Teacher Association (PTA) meetings,
and parent groups.
(h) District office- Time reported by the respondent spent on District meetings,
meetings with supervisors, and principal meetings.
(i) Professional development- Time reported by the respondent spent on
conferences, self-improvement planning, and professional readings.

18
Chapter Two
Review of the Literature
Introduction
This chapter includes a review of the literature pertinent to the amount of time
principals spend on school related tasks. The review of literature includes suggested
bifurcation points in educational leadership in relation to legislative and societal changes.
The current emphasis on increased student performance has led to additional
responsibilities being placed on the over-worked school principals. It is important to
research the way that principals currently spend their time on daily tasks and
responsibilities. An examination of the type of tasks and the amount of time spent
reveals the historical expansion of the roles of school administrators. The amount of time
was reported in different units of measurement in many of the studies, but for the purpose
of comparison, the researcher has converted to percents wherever feasible.
The following review of literature includes a discussion of transformational
leadership, the historical developments in educational administration in relation to time
on tasks, and the pertinent studies related to the types of tasks and the time that principals
have been found to spend on these tasks.
The Changes in the Principalship from the 1920s to the 1950s
The review of the historical literature begins with the 1920s period since the
National Education Association (NEA) established the Department of Elementary School
Principals and the Department of Secondary School Principals during this decade (Beck
& Murphy, 1993). The literature from the 1920s through 1950s contains many insights
into the revolving roles of school administrators. Actual records of how administrators

19
dedicated their time are scarce and mostly anecdotal. In the late 1930s and 1940s, some
of education’s most prestigious and influential organizations conducted studies which
were followed by a variety of reports that expanded on the philosophy advocated by the
Commission on Reorganization of Secondary Education (Drake & Roe, 1999). The
Commission’s key report, Cardinal Principles of Secondary Education (1928), stressed
that the basic principles of school were: (a) health, (b) command of the fundamental
processes, (c) home membership, (d) vocation, (e) citizenship, (f) appropriate use of
leisure time, and (g) ethical character.
Beck and Murphy (1993) confirmed that these objectives became part of the
principals’ responsibilities from the use of the metaphors in the pertinent literature of this
time. They explained, “The metaphors of the twenties suggest that principals are
expected to link their schools with spiritual and social values and with principles of
scientific management” (p. 31). Beck and Murphy suggested in the 1930s the focus of
school administrators shifted to fascination with the principles of business and the
application of business theories to education. Tyack and Hansot (1982) furthered this
opinion by examining surveys where administrators were judged by checklists. These
checklists and concrete figures were used to determine how successfully the principals
were running their school.
America’s view of itself as a world power was shaken to the core when the
devastating attack on Pearl Harbor happened on December 7, 1941 (Rutherford, 1998).
The role of the school administrator is described repeatedly as the “democratic” leader in
the 1940s literature reviewed by Beck and Murphy (1993). The demands of World War
II and the post-war society’s expectations set the stage for what should be provided to the

20
students by the educational institutions. According to Beck and Murphy, the principal
became viewed as the school’s leader on the home front. The social purpose of the
school came to the forefront as a main objective to be accomplished. The principal’s’
role expanded to curriculum developer, group leader and coordinator, supervisor, and
public relations representative within the community.
As educational leaders moved into the 1950s, the system’s expectations continued
to expand and shift. One report during this time that seemed to set the stage for the
functions of administrators was the Moral and Spiritual Values in Public Schools (1951).
Beck and Murphy (1993), after studying the metaphors in educational administrative
literature of the 1950s, found a wide variety of descriptors for the roles and
responsibilities of the building level principal. The principal’s relationship with the
teachers is described as the supportive academician, but the theme of the principal as a
manager also emerges. This manager oversees classroom activities in great detail,
performs as the office photographer, and develops special reading programs.
With these many roles, principals were ill prepared for the next addition of
responsibilities. The 1954 Court decision in Brown vs. Board of Education stated, “No
state shall deprive any person of life, liberty, or property without due process of the law”
referred specifically to the racial segregation that had become the norm for American
school systems. The effect on principals was an immediate change in the population that
was to be served by their schools (Beck & Murphy, 1993). The Brown vs. Board of
Education decision initiated social transformation and educational reform, while
becoming the catalyst for the modern day Civil Rights Movement (Brown Foundation,
2006).

21
Only 16 years after the Pearl Harbor attack, another world event seemed to
challenge the value of the American educational system. The Soviet Union successfully
launched the spacecraft, Sputnik, on October 5, 1957. According to Rutherford (1998),
the finger of blame pointed directly at the schools. The post-Sputnik concerns were
curricular, focused on what was being taught and how. The impact of analyzing and
implementing change fell upon the school administrators. The science and mathematics
curriculum became the immediate area of concern. The launching of Sputnik convinced
many Americans that their schools were deficient and put an end to the progressive
education movement (Schugurensky, 2006).
Thus in the 1950s, the principalship is in what might be called a transitional phase
in terms of role definitions. Women and men in positions of school leadership are
receiving messages concerning their roles and functions from a number of
quarters, and they seem to be wavering between taking highly theoretical
perspectives on their work and dwelling on the mundane issues of practice (Beck
& Murphy, 1993, p. 86).
The 1960s
Legislative and Societal Impacts. During the 1960s, American society went
through a turbulent period of unrest, protests, and rebellion (Tyack & Hansot, 1982). In
many cases, the protests against the Vietnam War and other civil injustices took place on
college campuses. The assassinations of Malcolm X, Martin Luther King, and President
John F. Kennedy are major events that marked the turbulence of the 1960s (International
Information Programs, 2005). School systems also were affected by the events that
occurred in the “social revolution” that occurred during these years. The 1960s launched

22
a period in education that has been referred to as the Modern Period of American
Education (History of American Education Web Project, 2006). Goodwin (2002) stated
“The civil rights movement and other protest movement of the 1960s became forces of
change in public education, and both schools and society reached a bifurcation point that
led to conflict and change” (p. 43).
At about the same time that the Civil Rights Movement was causing upheaval and
change in the school environment, the New York Board of Regents' mandate to enforce
school prayer was being questioned in the US Supreme Court. In 1962, the Court held in
the Engel vs. Vitale decision, that the idea of the state mandating prayer in schools was
contrary to the First Amendment’s ban against the establishment of religion. A staple of
the opening of the regular school day was forever changed and principals were obligated
with the responsibility of ensuring that the Supreme Court ruling was not violated
(Schugurensky, 2006).
The Civil Rights Movement, along with public opinion, initiated more landmark
legislation to be passed by the US Congress in the 1960s (Drake & Roe, 1999). Title IV
of the Civil Rights Act of 1964 bars discrimination based on race, color, or national
origin. This Act reinforced what the Supreme Court had previously ruled. The
Elementary and Secondary School Act (ESEA) of 1965 was another program that
resulted from the Civil Rights Movement. The ESEA increased federal financial
involvement in local education and was a response to the social changes that were already
occurring in the United States. ESEA made funds available to local schools to meet the
needs of culturally deprived children in public and private schools. The Act directly
related to President Johnson’s “War on Poverty,” which provided for special programs

23
for children in low-income families. The $1 billion that was immediately provided to
school systems was to be used to improve the education of the economically
disadvantaged children (Bayliss-Heerschop, 2004).
Beck and Murphy (1993) in the review of the 1960s literature made note of
several interesting metaphors that were utilized to describe the roles of principals. The
principal was viewed as a member of the well-developed educational bureaucracy. The
principal was the protector of the bureaucracy and was expected to be scientific in his
approach to the management of the school. School principals of the 1960s devoted most
of their time to student discipline, scheduling, building maintenance, busing, reports and
extracurricular activities (Pulliam, 1991). This devotion of their time to the wide range of
duties was to be monitored by several studies.
Time and Tasks of the 60s. Nutto (1960) studied the duties of elementary
principals in New Jersey to determine if the principals’ duties were the same in theory
and practice. The researcher stated that by becoming familiar with the routine services of
a school administrator, a beginning principal could more efficiently dispense their time.
Nutto found these New Jersey elementary principals in1960 were spending their time as
follows: supervision (25%), pupil personnel (21%), community relations (11%),
administration (28%), clerical work (8%), miscellaneous (6%), teaching (0.5%), and
other duties (1%). Nutto referred to the recommended amount of time that principals
should be spending on tasks, according to the Twenty- Seventh Yearbook of the
Department of Elementary School Principals (cited by Nutto, 1960). Nutto stated the
recommendations are: supervision (37%), pupil personnel (17%), community relations
(11%), administration (24%), clerical work (3.5%), miscellaneous (4%), teaching (2.6%),

24
and other duties (0 %.). Nutto continued with “The most striking combinations of
statistics belong in the area of supervision, clerical work, and teaching. Here we find that
Newark administrators must spend 2.3 times more hours on clerical work than in the
perfect situation” (p. 91).
Haddock (1961) performed a study of the time utilization of Oregon elementary
principals. He surveyed only principals in schools with grade levels kindergarten through
sixth grade and used large districts within a one county area. Haddock developed his
own five categories of activities for the purpose of this study. The activities were: (a)
Teacher supervision and improvement of instruction, (b) Maintenance of good relations
between home and school, (c) Working directly with students, (d) Supervision of
building, supplies, and equipment, and (e) Professional self-improvement. Haddock
found that principals reported a total time on the job of 38.25 hours, including lunch and
informal conversations. Areas that reported total time on tasks were: 8.5 hours on
classroom visitations (22.2%), 5.3 hours on maintenance of good relations between home
and school (13.9%), 5 hours working directly with students (13.1%), and 2.75 hours on
clerical duties (7.2%). One interesting note was that the principals reported no time
supervising students in the cafeteria since students were close enough to go home during
lunch.
The National Association of Secondary Principals conducted a study of the senior
high principals and the conditions of their jobs (Hemphill, Richards, & Peterson, 1965).
Hemphill et al. (1965) analyzed the data obtained from this national study. The length of
the principal’s workweek was one area of consideration. The median amount of time on
the job for a senior high principal was about 54 hours. The data suggested that principals

25
at larger and urban schools worked longer hours. The administrators were asked to
designate the approximate percent of time they spent on a variety of activities.
Administrative planning was the most time consuming activity, with 24% reporting more
than 13% of their time was consumed by this planning. This planning activity was
followed by (a) meetings with students on matters other than discipline (60% spent one to
six percent of their time), (b) work with individual teachers to improve their classroom
skills (56% spent one to six percent of their time), (c) meeting with teachers on
curriculum issues (63% spent one to six percent of their time), and (d) correspondence
(64% spent one to six percent of their time). Major problems that were reported by the
principals were the variation in the ability and dedication of teachers, insufficient
physical facilities, and insufficient time to handle all the details of the position.
Rock and Hemphill (1966) evaluated the data obtained from a survey of junior-
high school principals done as another special project for the NASSP. The median
workweek was 50-54 hours with two-year and/or rural school principals working fewer
hours. The principals were questioned on the percent of time that they spent on a variety
of tasks. This review of the literature will report on the largest percent of principals who
designated the same amount of time spent. In the area of administrative planning with a
supervisor, 50% of the principals reported only spending one to three percent of their
time. Meeting with groups of teachers was reported by 44% of the principals to require
one to three percent of their time. On meeting with students on disciplinary issues, 43%
of the principals reported spending one to three percent of their time in this activity.
Working with individual teachers required 34% of the principals to dedicate four to six
percent of their time to help teachers improve their instruction. While 43% of the

26
principals spent one to three percent of their time on extracurricular activities, 14%
reported no time spent on these activities at all.
The National Education Association (1968) undertook an analysis of the time
spent on major job functions of elementary school administrators. Principals at this time
reported that they spent 30% of their time on administration, 30% on supervision, 14% on
clerical work, 4% on teaching, and 7% on community work and self-improvement
activities. The principals reported that community work and public relations were the
areas of responsibility that required more time than in previous years. The principals also
stated that clerical work required time that they could have spent on curricular related
matters. Curriculum development required 8% of their time and in the survey was
separated out from other task areas to emphasize and distinguish the differences since the
1958 study. The NEA reported that 60% of the elementary principals reported spending
42-53 hours per week in school and school-related activities, along with 5% indicating
that they spent more than 66 hours per week in school and school-related activities.
Concerns for principals of this time period were the trends of increasing mobility of
families and the “nourished attitudes of rebellion against necessarily orderly methods of
school management and instruction” (p. 151).
The 1970s
Legislative and Societal Impacts. Beck and Murphy (1993) cited many
metaphors concerning the principals of the 1970s. The principal was described as a
community leader, imparter of meaning, facilitator of positive relations, interpersonal
facilitator, resource allocator, and child advocate. With all of these responsibilities,

27
principals were constantly encouraged to utilize their humanistic side to resolve conflicts
between student, parents, and staff.
The Education for all Handicapped Children Act of 1975 required each state to
provide a detailed plan for assuring all children with disabilities receive an appropriate
education (Drake & Roe, 1999; Payne, 2004). The legislation was intended to improve
the educational opportunities for handicapped children and adults by utilizing the
principle of “least restrictive environment.” The principal became responsible for
monitoring the teachers involved in the special education process and in the development
of the Individualized Education Plan for any special education students in their building.
The principal was also designated as a critical part of the interdisciplinary team that was
to develop the plans to meet the special education children’s needs (Pulliam, 1991).
Gorton and McIntyre (1978), as a preface to their study of 60 effective principals
and their time on tasks, stated:
The nature of the principalship surely has changed during the past decade in
response to the many forces acting upon high schools in the late 1960s and early
1970s. Certainly, the emergence of professional negotiations, of court decisions
on student affairs, and on desegregation, and the constantly shifting priorities of
the public for schools presaged a different principalship in the late 1970s than
existed in the mid 1960s (p. V).
Time and Tasks of the 70s. The Georgia State Department of Education (1974)
surveyed three elementary principals, two middle school principals, and one high school
principal to determine the amount of time on task. The mean percents of time being
spent were: curriculum and instruction (2%), staff personnel (18%), student personnel

28
(21%), support management (16%), school-community interface (8%), fiscal
management (2%), system wide policies and operations (7%), miscellaneous (12%), and
unclassified (13%). An interesting finding was that the time spent varied little for
principals in each level of schooling.
Johnston (1974) evaluated the time on task of principals in year round schools,
and asked them to compare their time on task in the Year Round Environment (YRE) to
the time they spent when they were principals in a traditional environment. The YRE
principal reported increased time in all six administrative areas. These principals asserted
that this situation had occurred because they had not been given extra administrative
support when they converted to an YRE. The greater time devotion was in the two areas
of business management and non-instructional tasks. According to Johnson (1974), “the
most significant increases in time spent by the YRE principals have been in the area of
Principal’s Professional Growth and in the area of Pupil and Parent Concerns” (p. 59).
In 1977, the National Association of Secondary School Principals (NASSP)
conducted a study to survey their membership on the amount of time that they were
spending on tasks considered pertinent to the position. Using this data, Byrne, Hines, and
McCleary (1978) listed nine areas of responsibility that were critical to role of a building
principal. This study indicated 83% of high school principals spent over 50 hours per
week on their job. The principals were asked to rank order these nine areas as to how
they actually spent their time and how they should spend their time. Their time was
dedicated to the areas in the following order: (a) school management, (b) personnel
relations, (c) student activities, (d) student behavior, (e) program development, (f) district
office, (g) planning, (h) community relations, and (i) professional development.

29
Gorton and McIntyre (1978) completed another 1970s study on time and task
analysis that included an interview component to survey senior high principals and
“significant others” which included students, teachers, and parents. Sixty effective
principals participated in on-site interviews to provide more detail on the daily schedule
and characteristics of an effective secondary principal.
The survey questions concerned the time that the principal spent on the job and
the priorities. The typical principal responded that he spent an average of 9½ hours on
the job, which began at 7:30 a.m. and ended around 5:00 p.m. These principals also
reported spending at least 3 nights a week on school business. This study, as many others
during this period did not determine the actual amount of time spent on specific tasks.
The respondents were asked to rank order from 1-9 how they had spent their time in the
previous school year. The number one area requiring a principal’s time was the area of
school management. The second area was personnel. Principals also responded that they
believed these two areas should receive the largest amount of time allocation. The
remainders of the categories in the order of time required were: program development,
student activities, student behavior, planning, community relations, district office, and
professional development.
The principals in their interviews agreed that even though school management
required the most time, it should have only been ranked at a level three out of the nine in
the areas that required their time. Since the areas of school management and student
behavior required more time than principals preferred, Gorton and McIntyre (1978)
surveyed the principals for the possible reasons for the time allocations to these areas.
The principals responded that the following factors were having an influence: lack of

30
administrative staff, emergencies, discipline problems, the need to be visible, and
immediate needs of people in the building.
Another study completed by Pharis and Zakariya (1979) examined the state of
elementary school principals. Although a specific time on task analysis was not
completed, the survey did examine the problems that were being faced by elementary
principals in the late 1970s. The study was in the fifth of its type to be done in
cooperation with the National Association of Elementary School Principals (NAESP).
The preface makes note that “the five studies reflect not only the changing status of the
elementary school principal, but also the changing concerns of those who occupy the
position” (p. xiii). Principals were asked to identify the main problem areas that they
were faced with in their school. A selection of 33 problem areas were listed for them to
rate as "serious problem," "problem," or "little or no problem." The two major problems
identified by 53% of the principals as serious problems or problems were (1) Dismissing
incompetent staff and (2) managing student behavior. The problem areas that followed
were declining enrollment (50.5%), staff reductions and evaluating teachers (44.7%), and
vandalism by school age outsiders and pupil absenteeism (43.8%). Of less significance
as problems, but still listed by more than 25% of the principals were pupils’ disregard for
authority, declining test scores, dealing with teacher due process, and staff morale. Even
in the 1970s, the concerns over test scores were beginning to be recognized as problem
areas for 32.1% of the elementary principals.
The 1980s
Legislative and Societal Impacts. In the early 1980s, major concerns over
dropouts, poor test scores, and illiteracy became the focus of public attention (Morrow,

31
1993). On August 26, 1981, the National Commission on Excellence in Education was
created to investigate the quality of education in the United States (The National
Commission on Excellence in Education, 1983). This Commission was responsible for
the publication of A Nation at Risk. Doud (1989) summarized the transition into the
1980s with “And then along came the tidal wave of educational reform, beginning with
the publication of A Nation at Risk in 1983. Suddenly a harsh spotlight focused on our
schools. Change became the order of the day.” (p. xi) The National Center for
Educational Statistics (NCES) (2001) reported that the publication of A Nation at Risk in
1983 (National Commission on Excellence in Education, 1983) catalyzed widespread
school improvement initiatives in the 1980s.
The Nation at Risk (1983) report concentrated mainly on secondary education.
Secondary school curricula were found no longer to have a central purpose that unified
all subjects. Other findings included that some 23 million Americans were functionally
illiterate, American students spent much less time on school work than students in other
countries, and the process of education was not working in its current design. As a
method to increase the results of the system, five new basics were added to the
curriculum of secondary schools. These basics included four years of English, three
years of mathematics, three years of science, three years of social studies, and half a year
of computer science. The report even went into detail by suggesting the standards of
what should be taught in these recommended new basics (National Commission on
Excellence in Education, 1983; Scherer, 2004). Principals again found new regulations
for which they were responsible for monitoring the progress in their building.
The 1980s have been referred to as the “Me! Me! Me! Generation” with double-

32
digit inflation raging and President Ronald Reagan declaring a “War on Drugs.” This
societal atmosphere explains many of the issues that schools of the 1980s were facing.
Toward the end of the decade, President George Bush called for a kinder, gentler nation
and rallied the nation to become involved in volunteerism and charitable organization.
American education continued to be assaulted by budget costs and cries for a return to the
basics for public school students (Whitely, 2006). Educational administrators accepted
many of the ideas espoused by big business, such as respecting individual workers and
rewarding unusual efforts by ordinary people. The themes of accountability, positive
organizational climate, and management of change for excellence became the order of the
day (Pulliam, 1991). Smith and Andrews (1989) emphasized that a good principal would
create a climate of high expectations for the school and would strive to model those
expectations.
Beck and Murphy (1993) examined the literature of this period for a change in the
metaphors used to describe the roles and responsibilities of the school administrator. An
interesting trend was the movement back to metaphors that had been used for principals
in the early part of the century. “Establishing and cultivating a mission” gives the
impression of the return to the early 1900s religious imagery that was the normal
descriptor of the first school administrators.
Time and Tasks of the 80s. Lehman (1980) shadowed four Indiana elementary
principals for a total of two days to collect information on how effective principals spent
their school day. These principals were selected as effective administrators by a jury of
school superintendents. All of the actions of the principals were documented on a tape
recorder and then analyzed relative to the type of tasks and the amount of time spent on

33
the tasks. Directing and supervising curriculum and instruction consumed 32% of the
day, while 25% of the day was used in the area of student personnel, with an emphasis on
student discipline and behavior. The remainder of the time was allocated to staff
personnel (15%), building management (7%), community relations (4%), and personal
affairs (17%).
Howell (1981) surveyed 14 middle/high school principals from school districts
represented in the Arkansas-Oklahoma Consortium for the Emerging Adolescent. The
participants were required to indicate their major activity in blocks of 15-minute periods
from 8:00 a.m. to 5:00 p.m. This phase, referred to as Phase One, was the feasibility
study to test the relevance of the items and was administered during a Friday in April.
The following percents of time on tasks were discovered: paperwork (33.3%), parent
conferences (13.5%), personnel conferences (13.5%), discipline (9.9%), scheduling
(9.9%), cafeteria (9.9%), supervision (7.4%), and instructional leadership (2.6%).
Howell contended that the disproportionate amount of time spent on instructional
leadership might have been due to the timing of the survey on a Friday in April.
This led to Phase Two of the Howell (1981) study that utilized 61 principals in
middle/junior high schools in the same Consortium as Phase One. The administrators
were asked to complete the forms on five days over a one-month period, rotating to a
different day each week. Phase Three was a national study that included all school levels
of the principalship. A sample of 163 elementary, middle/junior, and senior high
administrators with a variety of student populations were represented. The outcome of
Phase Two and Phase Three provided very similar results. The cumulative time on task
of both phases yielded the following percents: office responsibility (32%),

34
faculty/community relations (25%), students (21%), curriculum (14%), and professional
development (7%).
Phase Three of the Howell (1981) study presented many details comparing the
amount of time on task that was spent by the different levels of administrators. Table 1
illustrates the percent of time that each level of administrator designates to each category
of tasks. Howell asserted, “It appears evident that the bonds attaching principals to the
office are growing stronger and stronger” (p. 334).
Table 1
Percent Comparisons of Time Reported by School Principals in Literature Role Elementary Middle/Junior Senior High
Instructional Leadership 30 25 20
Office Responsibilities 40 45 30
Community Relations 5 0 5
Student Relations 10 10 20
Extracurricular Supervision 5 5 10
Personal/Professional Development 5 5 5
Faculty Relations 5 10 10
_______________________________________________________________________
This concept of the principals’ attachment to the office in the 1980s was further
investigated in relationship to student achievement. Graham (1982) studied 68
elementary principals in Mississippi to determine their time on tasks over a five-day
period. The mean total time on tasks for the group of principals, who worked for an
appointed superintendent, rather than an elected one, was 41.46 hours. The cumulative
time on task for specific categories yielded the following percents: office responsibility

35
(23.1%), faculty relations (24.1%), community relations (6.0%), student relations
(15.7%), curriculum leadership (10.3%), extracurricular supervision (10.6%), and
personal/professional development (7.3%). Graham noted that there was not a
statistically significant correlation between administrative experience or the level of the
administrator’s education and the amount of time allocated to tasks.
Elementary principals were studied again in 1984 to examine the estimate of time
allocation to five functional task areas (Korporaal, 1984). Principals in Los Angeles, CA,
were questioned by survey, along with a random sample of ten principals being observed
on site. The results revealed that principals spent most of their time on short-duration,
high frequency activities. The principals who participated in the actual observations were
found to spend 33.8% of their time on tasks related to general administration. The
remainder of their time was found to be divided as follows: 19.3% in community-school
relations, 18.6% in staff relations, 17.3% in curriculum and instruction and 10.9% in
pupil personnel services. Significant differences were obtained when estimated time was
compared with respect to gender of the principal, the size of the certified staff, and the
age of principal.
Hall (1986) surveyed the principals and superintendents in Maine in the spring of
1986. High school principals were excluded because the researcher asserted the
departmental nature of high schools might confound the issue of time. Administrators
were asked to indicate the amount of time spent on 41 tasks commonly associated with
administrative functions. A forced choice process was used where the descriptions
included: “0=Not part of my job,” “1=Rarely,” “2=Occasionally,” “3=Frequently,” and
“4=Routinely.” The following categories were reported between frequent or routine

36
activities: attending school board meetings (3.3), meeting with teachers (3.8), meeting
with individual students (3.5), managing the office (3.5), visiting classrooms (3.3),
supervising and evaluating teachers (3.5), preparing reports (3.3), gathering information
(3.2), and attending student functions (3.2), planning curriculum (3.2), and planning and
monitoring budget (3.6). Interestingly, Carr found the supervision of extra-curricular
activities required the least amount of time falling in the range of an occasional activity
(1.77).
Zirkes (1987), a New York high school principal, did a one-year qualitative self-
study. His self-study was coordinated with studies done by Mintz and Bayersdorfer, an
elementary principal and middle school assistant principal. The high school data were as
follows: staff supervision (28%), pupil supervision (18%), documentation (14%),
curriculum (5.8%), professional interactions (2.8%), community relations (10.8%),
facilities (5.8%), operations (8.6%), and staff relations (5.4%). Zirkes also surveyed his
own staff concerning the amount of time he spent on task and found that his perception
differed from the staff’s on four of the nine categories studied. Over the ten-month
period, the elementary principal, Mintz, reported the following time on task: staff
supervision (23.5%), pupil supervision (19.3%), documentation (9.1%), curriculum
(9.9%), professional interactions (8.5%), community relations (6.2%), facilities (2.0%),
operations (17.4%), and staff relations (5.2%). The middle school assistant principal,
Bayersdorfer, monitored the activities of his principal and found the following time on
tasks: staff supervision (13.4%), pupil supervision (24.9%), documentation (7.7%),
curriculum (21.0%), professional interactions (8.5%), community relations (7.1%),

37
facilities (2.3%), operations (12.0%), and staff relations (3.4%). Zirkes concluded from
the data: (a) duties of the principalship varied according to grade level,
(b) duties are related to the amount of administrative support provided, and (c) amount of
time spent on after school activities varied according to the time of the school year.
Doud (1989) published the K-8 Principal in 1988. This comprehensive national
analysis of the duties and demographics of elementary principals was sponsored by the
National Association of Elementary School Principals (NAESP). The eight-page survey
was mailed to 2,414 principals with a 34.5% return rate. The data provided a national
picture of the status of elementary principals, along with valuable information on the
personal characteristics of these administrators. Many questions concerning the time use
of the 1980s administrators were answered in this survey. This survey discovered the
number of hours that principals spend at their building in all school-related activities was
an average of 51 hours per week.
In the previous 60 years of NAESP studies, no attempts were made to determine
the actual categories of activities where principals were spending their time. However,
this 1988 study (Doud, 1989) did determine that principals spent their time in the
following categories: supervision/evaluation of teachers (25%), supervision/evaluation
of non-teaching staff (6%), curriculum development (11%), discipline/student
management (17%), student evaluation/placement (6%), parent/community contacts
(9%), facilities management (8%), budget administration (6%), duties assigned by the
central office (9%), and other (2%). Doud contended that the variation in the amount of
time spent within each category was based on the years of experience of the
administrator. In addition, for the first time ever, principals reported being employed 11

38
or more months with the mean number of days worked at 217.
The secondary school principals were surveyed by their national association in
1988 also. Pellicer, Anderson, Keefe, Kelley, and McCleary (1988) concluded that more
than one-half of the principals spent a minimum of 55 hours per week on job related
activities. They also note that during the last two decades, the percentage of principals
who work fewer than 50 hours per week has decreased from 17% to 14%. The principals
were asked to rank order 9 responsibilities in order of the amount of time spent on the
task. A rank of “1" indicated the greatest amount of time, while a rank of "9" indicated
the least amount of time was spent on the task. The mean ranking of the principals was:
(1) school management, (2) personnel, (3) student activities, (4) program development,
(5) student behavior, (6) district office, (7) community, (8) planning, and (9) professional
development.
Smith and Andrew (1989) determined the amount of time spent by elementary
principals in the state of Washington. These principals were asked to estimate the
amount of time spent in four specific areas. These principals reported spending 49% of
their time in the area of educational programming. After that task area, 23% of their time
was dedicated to building and district activities, 20% to student services, and 8% to
school and community relations.
Pavan and Reid (1990) surveyed principals in 1988 in an attempt to better
understand urban elementary school principals in Philadelphia, PA. Eighteen elementary
principals in Title I schools were selected because these schools and administrators had
been involved in a Priority I improvement plans since 1983. Priority One improvement
plans were developed for schools that were in need of improvement on the state standards

39
of achievement. The five most effective schools were selected for the sample. The
principals completed the survey during the week of May 2-6, 1988, by indicating which
activity utilized the most time during 30-minute intervals. A semi-structured interview
was performed during the months of June and July, 1988. The follow-up interview
provided more detail on the activities that had been documented in the survey and more
detail on the school culture. The socio-economic statuses ranged from 45% to 76%
percent of the children in the selected schools were receiving aid for the dependent
children, a descriptor of the socio-economic status of the school. The categories of
activities and percents of time based on the average of 45.75 hours were: faculty
relations (35%), office responsibilities (14.2%), student relations (21.9%), community
relations (2.7%), personal/professional development (10.9%), curriculum leadership
(5.5%), and extra-curricular supervision (9.8%). Pavan and Reid stated, “Findings
indicate that most principals have internalized the norm of high expectations for their
students and teachers, and were least concerned with behaviors related to maintaining
order.” (p.19).
The 1990s
Legislative and Societal Impacts. To understand the changes that may have
occurred in education in the 1990s, insight is provided from the NCES (2001) summary
of areas of concern for principals during this time. For the 1993-94 survey, public and
private elementary principals identified poverty and lack of parent involvement as serious
problems in their schools. For public secondary schools, lack of parent involvement
ranked first as the most serious problem, followed closely by student apathy, poverty, and

40
student use of alcohol. These societal problems compounded the already complicated
daily job of principals.
To continue to complicate the daily rigors of the principalship, information
technology was being implemented by many school systems (Cremin, 1990; Telem &
Buvitski, 1995). Management responsibilities had continued to increase, along with the
expectations that education must be accessible to all students. Education for the majority
had become the norm in this decade and according to some critics, resulted in mediocrity
as the standard (Cremin, 1990). Other issues that became prevalent in the 1990s were
school choice, declining test scores, and unsatisfied employers of graduates (Bainbridge,
1990).
Beck and Murphy (1993) suggested that the metaphors that were being applied to
principals in the 1990s reflected the second wave of educational reform-the restructuring
movement. This reform is based on the belief that the United States had lost its place as
the leader in the world economy. Beck and Murphy (1993) contended that certain
conditions during this time have had the most profound effect on education. The three
conditions or trends were: “the perceived crisis in the economy, the changing nature of
the social fabric of society, and the evolution from an industrial to a post-industrial
society” (p. 179). Educators were being asked to educate more and more types of
students successfully, but also the definition of success had been dramatically expanded
(Beck & Murphy, 1993; Smith, 1989).
Time and Tasks of the 90s. Morrow (1993) surveyed 150 Missouri secondary
school principals to determine the amount of time that they spent time on nine tasks. The
results were rank ordered from one- to- nine according to which tasks required the most

41
time. The tasks in order of time spent were: (a) school management, (b) student
activities, (c) student behavior, (d) personnel, (e) program development, (f) district office,
(g) community, (h) planning, and (i) professional development. The survey instrument
utilized by Morrow was based on the 1977 study conducted by the NASSP that was
mentioned in the previous section on the 1970s task analysis.
The NASSP surveyed leaders in middle level education in 1992 to determine the
status of the administrators and their schools (Valentine, Clark, Irvin, Keefe, & Melton,
1993). Eighty-eight percent of the middle level principals reported working an average of
more than 50 hours in a typical week. This survey indicated that the self –reported
number of work hours had increased significantly since the surveys in 1966-1981. Twice
as many principals reported spending 60-69 hours per week on the job and three times as
many reporting 70 or more hours. The principals were asked to rank order 9
responsibilities in order of the amount of time spent on the task. A rank of “1" indicated
the greatest amount of time, while a rank of "9" indicated the least amount of time was
spent on the task. The mean ranking of the principals was: (1) school management, (2)
personnel, (3) student behavior, (4) student activities, (5) program development, (6)
district office, (7) planning, (8) community, and (9) professional development.
Booth, Bradley, Flick, Keough, and Kirk (1994) participated in a study
cosponsored by The Executive Educator and Xavier University. Over 6000 school
administrators from all 50 states were mailed a survey to complete on the time being
spent on a variety of tasks. Fifty-one percent of the principals reported working between
50 and 60 hours, while another 29% worked over 60 hours per week. In other words,
95.3% of those principals who worked more than 50 hours were high school principals.

42
At the high school level, 62% percent of the principals reported spending more time to
simply maintain the school’s programs than the time that was spent five years ago.
Additionally, 71% of all principals reporting more time on paperwork than was spent five
years ago. Booth et al. (1994) recommended that school systems build on the positive
attitudes of building principals to find creative solutions to the problems.
Changing the role of the principalship was the focus of the Chicago School
Reform Act. Ford and Bennett (1994) studied the effect of this act on principals in
Chicago’s urban school districts. Principals who in the past had made decisions with
faculty members and central office staff were now required to make decisions in
collaboration with parent dominated Local School Councils (LSCs). The study was done
by interviewing a small number of Chicago principals and by employing a system wide
survey to explore the changing aspects of the principalship. More than half of the
principals who were surveyed reported that they were spending more time on school
management and almost 40% reported spending more time on Central and district office
functions. On average, the principals reported spending more than 10 hours per week on
each of the following task areas: school management, community relations, district
office, student activities, and instructional leadership. Principals indicated that they were
working on average 60 hours per week, but were still not addressing their most critical
concern, instructional leadership for improvement. Principals mentioned that the most
frustrating aspects of their job were paperwork demands (34%), not enough time (21%),
community politics (12%), and incompetent or uncaring teachers (7%).
Gaziel (1995) studied the work patterns of principals in high- and average-
achieving Israeli elementary schools. His study relied on field observation, description

43
and an analysis of the job behavior of practicing principals. The sample of 10 elementary
principals, five from high-performing and five from average-performing schools, were in
schools similar in size and in the socio-economic status of the students. All were women
principals with enrollments of 350-450 students and were responsible for 25-36 staff
members. Gaziel grouped the principals’ behaviors into 13 categories: instructional
management, keeping up-to-date, planning for school improvement, student affairs,
personnel management, office management, parent-community relations, school system
interactions, coping with disorders, interruptions, informal meetings, personal affairs, and
teaching. Teaching 330 minutes per week was mandatory for each principal in the Israeli
school system.
The results of the observations revealed the principals at high-performing schools
divided their day by spending 13.4% on instructional achievement, 7.1% on school
improvement, 11.4% on personnel management, 6.5% on parent and community
relations, 22.4% on office management, 0.3% on coping with disorders, and 2.5%
interruptions. The principals at the average performing schools spent 7.4% on
instructional achievement, 3.9% on school improvement, 7.4% on personnel
management, 3.9% on parent and community relations, 34.2% on office management,
1.4% on coping with disorders, and 5.2% on interruptions. The two groups spent
approximately the same amount of time on teaching (14.3%), keeping up to date (1.1%),
and personal affairs (5.0%). The principals at both schools were observed spending 40%
of their time reacting to situations, rather than initiating the actions. Both groups of
principals reported spending an average of 13 - 16 hours extra during the 5-day school
week on after school activities, which gave a total of 53-56 hours per week.

44
Gordon (1996) further explored how secondary principals used their time on tasks
when he examined a group of principals from Missouri. Gordon’s study was a
comprehensive study that asked principals to complete a time-use log one day from each
month during a seven-month period. The principals were to record their activities at least
two times during the selected day. The principals were directed to categorize their time
into eight activities based on their judgment as to the appropriate category. The
categories were predetermined for the respondents’ ease of reporting. The notation
should be made that the category of staff personnel included teacher observation and
substitute provisions, while the student personnel category included all forms of student
conferencing, discipline and extracurricular activities.
Principals reported spending the most time in student personnel activities such as
discipline, supervision and extracurricular activities, while reporting the least amount of
time spent on instruction/curriculum and facilities management. The total mean minutes
of activity were 2735.14 minutes and the percent of times calculated were as follows: (a)
instruction/curriculum - 3.2% (87 minutes), (b) staff personnel - 14.7% (400.7 minutes),
(c) student personnel - 45.7% (1250.1 minutes), (d) public relations - 4.2% (114.4
minutes), (e) school district meetings - 8.5% (234.0 minutes), (f) facilities management -
2.0% (54.4 minutes), (g) personal/professional preparation - 8.3% (227.6 minutes), and
(h) office management - 13.4% (366.9 minutes).
In a similar study, Cook (1998) utilized the nine areas from the NASSP ten-year
surveys to determine the time on tasks spent by South Dakota elementary principals.
Cook also analyzed the length of time spent on tasks in relation to selected demographics,
such as how long that the principal had been in the position, gender, and age. The

45
following data provide details on how the 251 elementary principals spent their average
43.3 - hour week. The survey found the percent of time as follows: (a) personnel -
17.5% (7.6 hours), (b) school office management - 17% (7.4 hours), (c) student activities
- 13.9% (6.0 hours), (d) student behaviors - 12.6% (5.4 hours), (e) program development
- 11.5% (5.0 hours), (f) district office - 8.7% (3.8 hours), (g) planning - 7.0% (3.0 hours),
(h) community - 6.2% (2.7 hours), and (i) professional development - 5.6% (2.4 hours).
When Cook (1998) analyzed the data in relation to selected demographics, several
notable characteristics were found. There were no significant differences found in the
amount of time spent on tasks based on the size of the school enrollment or based on
gender. Principals with a bachelor’s of arts degree spent the most hours in the area of
personnel and the least hours in office management, professional development, and
planning. The principals with a master’s of arts degree reported spending more time in
personnel and the least time in professional development. Principals, with the highest
degree obtained a doctorate degree, also spent the most amount of time in personnel, but
the least amount of time in community relations. Both the group of principals who
worked 41-50 hours per week and the group that worked more than 51 hours per week
reported the greatest amount of time was spent on personnel issues and the least amount
in the area of community relations. Principals with more than 300 students spent a mean
of 2.2 hours on office management while schools of more than 300 students spent 3.2
hours per week on this area. An area that revealed a large discrepancy when analyzed
with school size of less or more than 300 students determined that the principals of
smaller school spent a mean of 3.9 hours while at the larger schools the principals spent
7.4 hours on student behavior.

46
An EdSource (1998) study of California elementary, middle, and high school
principals found that the principals preferred to spend more time on teaching and learning
issues. Overall the principals reported being able to spend 16.8% less time on teaching
and learning issues than they preferred to spend, while spending 15.4% more time than
preferred in the areas of students, parents, and discipline. The actual time spent is
reflected by these percents: instructional issues/curriculum (14.5%), school wide
planning/evaluation (11.3%), budget/maintenance (15.4%), parent relations (13.3%),
student contact and discipline (18.5%), and staff supervision/evaluation (27%).
Another ten-year NAESP study was undertaken to determine the changing role of
the principalship (Doud & Keller, 1998). The percentages indicated emerging
responsibility areas and new job pressures. The results in the areas of curriculum
development and instructional practice suggested that there is an increased emphasis on
individual schools to perform and to be held accountable. This survey asked principals to
indicate the top three areas where they spent the majority of their time. The results
indicated that percent of principals listed the following categories as requiring their time:
supervision/contact with staff (81.1%), interaction with students (64.5%),
discipline/student management (60.6%), parent/community contacts (24.8%), facilities
management (16%), curriculum development (11%), student evaluation/placement
(11%), duties assigned by the central office (9.4%), safety/ security issues (8.4%),
interaction with central office staff (6.1%), planning/conducting staff development
(5.8%), budget administration (4.6%), and other (41.1%). This study suggested that the
“other” category needed further investigation to determine where principals are spending
such a large percent of their time. The other unexpected result was that although the call

47
of most site-based management programs is for school-based control of staff
development, the building principal still did not do this type of planning. The typical
principal was spending 10 hours a day on the job and an additional 8 hours per week on
school related activities, but still not accomplishing all of the goals for which he was
accountable.
The 21st century
Legislative and Societal Impacts. Even with the confirmation that principals
were increasing their energies to focus on curriculum and instructional practices, along
with the administrative focus on a more rigorous curriculum for students, the
undercurrents of public dissatisfaction were evident. President William Clinton’s
administration established a nationwide pact by which the output of the educational
systems could be measured and evaluated. The passing of the GOALS 2000: Educate
America Act on March 31, 1994, allowed the federal government to establish its new role
as a major support for education. The federal government could now establish a
comprehensive approach to improve the education for all students to succeed in life. The
impact of the Goals 2000 Program on building level principals is evidenced by the goals
of the program:
(a) Every child will start school ready to learn.
(b) The high school graduation rate will increase to at least 90%.
(c) American students will be prepared for productive employment in the
nation’s modern economy.
(d) The teaching force will have access to professional development
(e) U.S. students will be the first in math and science.

48
(f) Every adult American will be literate and exercise the rights and
responsibilities of the citizenship.
(g) Every school will be safe.
(h) Every school will encourage parent and community partnerships. (Austin,
2004).
Austin (2004) stated that the purpose of the GOALS 2000 Act was to encourage
local school systems to meet educational needs, help students reach their potential,
increase parent involvement, and improve teachers’ skills. People were divided in their
support of this act fearing it was an attempt of the federal government to take over the
local school authority. Principals viewed parts of this act as usurping their autonomy
over how their school was managed.
Then in 2002, President Clinton asked in his budget proposal to Congress that $40
million be set aside for professional development for current and prospective school
leaders. This initiative was called the School Leadership Initiative and gave
administrative organizations cause for hope to increase the flow of principal candidates
and to bolster the spirit of current administrators (Ferrandino & Tirozzi, 2000).
Even with this flicker of hope, educational administrators continued to find
themselves faced with other added obligations to create and manage schools where all
students could achieve to their full potential (Educational Research Service, 2000). From
elementary to secondary, schools were seeking leadership to help meet the criteria set
forth in the federal legislation known as the No Child Left Behind (NCLB) Act which
was signed into law, January 8, 2002, by President George W. Bush (United States
Department of Education, 2006). The success of a school requires the most effective use

49
of an administrator’s time. This success, since the inception of the mandatory testing
required by the NCLB legislation, has been measured by standardized test results.
Schools are held accountable through the use of student test data. These data will reveal
if principals have made changes in their daily activities to meet the standards that have
been established by the NCLB legislation. According to NCLB, each state shall develop
and implement an accountability system that will ensure all Local Educational Agencies
(LEAs) and schools make Adequate Yearly Progress (AYP). The success of the school
in meeting AYP is ultimately traced back to the leadership within each individual school.
The broad definition of AYP is that each school and each subgroup of students will meet
the annual objectives determined by state and federal guidelines. The ultimate purpose of
calculating AYP is to ensure that schools and LEAs are focused on the accountability
goal of all students becoming proficient by 2014 (United States Department of Education,
2006).
The accomplishment of these goals falls directly on the principals of the
individual schools. The NCLB Act allowed each state two years to develop and
implement a plan to improve the condition of education. Since each state had time to
develop their own plan to meet the mandates of NCLB, the effects of this legislation
would not be produced immediately. Along with all of the legislative influences,
principals also faced the challenges of a more diverse ethnic and racial population, an
increase in the number of families at poverty level, and an increase in the number of
single parent households (NCES, 2006). Other factors impacting a principal’s job
included an increase in home-schooled children, an increase in the special education
regulations, an increase in required paperwork and documentation, and a decrease in the

50
number of qualified candidates entering the teaching field (DiPaola & Tschannen-Moran,
2003; Kopkowski, 2006; NCES, 2006; Peoples, 2002; Phillips, 2001). These
challenging, and sometimes overwhelming, responsibilities of the 2000s principals must
be considered when examining the changes in time spent on task areas.
Time and Tasks of the 2000s Principal. Yamada (2000) surveyed 60 elementary
principals in Fresno, California, during the 1999 school year. The survey requested that
principals rank-order tasks in terms of how they spent their time during the regular school
day. The scale utilized a ranking of 1-5 with “1” representing the task that required the
most time and effort, “2” being the second most time required, and so on. These
functions were related to instructional leadership functions only. The study revealed that
principals spent the most time on school community relations (M = 3.67), followed by
goal setting (M = 3.30), coordination of learning activities (M = 2.77), curriculum and
instruction (M = 2.67), and school climate (M = 2.27). In addition, 86.7% of the
principals reported that the number one problem they faced in their job was the lack of
time. This information continued to be supported by research in the ensuing years.
Blair (2001) examined the relationship between principals’ leadership styles,
school ratings, and the time principals spent on instructional leadership and management
tasks. This study involved 170 principals from all grade levels of schools in Texas.
Texas has established the Academic Excellence Indicator System (AEIS). The Texas
Education Agency (2000) utilizes four categories of academic achievement to classify the
success of schools. “Exemplary” indicates a school had 90% of all students and
subgroups passing each subject area. “Recognized” indicates a school had 80% of all
students and subgroups passing each subject area. “Acceptable” indicates at least 50% of

51
the student population and subgroups passed each subgroup area. “Low Performing”
indicates that the school had below 50% of the students passing all tests taken for the
subject areas. The results of Blair’s (2001) study revealed that the principals in
Exemplary schools spent 62.3% of their time on leadership activities, while spending
37.7% on management issues. The next category reported that principals in Recognized
schools spent 60.7% of their time on leadership activities, while spending 39.3% on
management issues. The results revealed principals in Acceptable schools spent 60.6%
of their time on leadership activities, while spending 39.4% on management issues.
Principals in Low-Performing schools spent 56.5% of their time on leadership activities,
while spending 43.5% on management issues.
Milyard (2001) utilized a researcher-developed survey to determine the opinions
and perceptions of New Mexico (NM) elementary principals on high-stakes testing and
time spent on instructional leadership functions in relation to the NM accountability
system. When the 388 elementary principals were surveyed, two positive correlations
were found: (a) between the principal’s opinion of high stake testing and the relationship
to the NM accountability system and (b) increased amount of perceived time spent on the
five leadership functions and changes in the school’s accountability rating.
An addendum to the study included an analysis of the written comments provided by the
respondents. The respondents’ comments revealed major themes of concerns, including:
standardized testing, accountability system, poor preparation and planning by the district,
and stress related to the accountability standards.
Valentine, Clark, Hackmann, and Petzko (2002) conducted a research study in
cooperation with the Middle Level Leadership Center to examine middle level leaders

52
and their school programs. Middle level school principals reported that 48% of them
worked more than 60 hours per week. The principals were asked to rank order 9
responsibilities in order of the amount of time spent on the task. A rank of “1" indicated
the greatest amount of time, while a rank of "9" indicated the least amount of time. The
mean ranking of the principals was: (1) school management, (2) personnel, (3) student
activities, (4) student behavior, (5) program development, (6) planning, (7) district office,
(8) community, and (9) professional development. This indicated that the principals were
spending more time on school management, but only gave school management a ranking
of "4" for where they should spend their time. Valentine et al. noted that principals
perceived an increase in their authority to make budgetary and personnel decisions.
Time, mandates, and money were listed as the major roadblocks to accomplishing their
job.
Other principals were dealing with the same roadblocks in their struggle to
manage their schools. The Public Agenda for the Wallace Foundation found in a 2003
study that 58 % of the principals cited insufficient funding and the implementation of
NCLB as the most critical problems that they were now facing in their profession
(Farkas, Johnson, & Duffet, 2003). This study also concluded that a large proportion of
principals (63%) felt that the mandates of special education law obligated a
disproportionate amount of their time and resources.
To delve more totally into the administrators’ problems, the Wallace Foundation
established the Leading Educational Achievement in Districts (LEAD) in Kentucky. The
purpose of LEAD was to identify and remove barriers that kept principals from
advancing student achievement for all students (ASAS, 2005). The Alternative School

53
Administration Study (ASAS) was started in the 2003-2004 school year to address the
question of administrative time. The study established a job description for a person to
serve in the school to relieve the principal of some of his duties. The School
Administration Manager (SAM) job description included all school administrative work
not directly related to instruction or student learning. The SAM was responsible for
ensuring that the principal was able to spend his time on activities connected to
instruction and student achievement. The SAM model was affordable; the cost of a SAM
was an average of $30,000 each year. The results are pertinent to this study, because the
principals’ time usage was determined before and after the SAMs were hired by the
initiative. Baseline data were collected in November 2003 from 21 Kentucky schools.
The follow-up collections of data done in November 2004 represented three pilot schools.
The data were collected using shadows that followed the principals and documented their
activity every 5 minutes for one week.
Table 2
Percent of Time Spent by Principals on Tasks
________________________________________________________________________
In another study which added to the data, Schiff (2001) reported on the 2001
NASSP survey of its membership to determine the current conditions of the high school
Conducting
Instructional Tasks
Conducting
Managerial Tasks
Attending to
Personal Needs
November 2003 29.7% 66.2% 4.1%
November 2004 65.8% 31.7% 2.5%

54
leadership. This survey was the fourth in a series which confirmed that high school
principals do not have enough time to get the job done. The total average number of
hours spent by high school principals in a week was 62.2 hours. The percents of time on
specific categories were: dealing with parent issues (12.3%), discipline issues (10.9%),
community relations (9.8%), facilities management (9.4%), teacher evaluation (8.3%),
program evaluation (7.8%), school safety (7.5%), curriculum development (7.0%),
budgets (6.7%), strategic planning (6.4%), professional development (6.1%), student
assessment (5.8%), and lesson demonstration (2.0%). Schiff commented, “Women tend
to spend more time on average per week on the activities we listed than do men (70 hours
per week compared to 61 hours per week). Enrollment does not seem to affect the
average number of hours spent by principals…” (p. 8).
The North Central Regional Educational Laboratory (2003) surveyed elementary
and secondary principals in a seven-state region in the Midwest. A stratified random
sample of 2,600 principals from urban, rural, suburban, and small town schools was
selected to answer questions that focused on the daily activities. Only 1.4% of the
principals reported working 7-8 hour days, while the majority of principals (83.1%)
reported days from 9-12 hours in length. The instructional leadership categories that
received the most time were classroom observations, staff development, and planning. In
the category of communication, principals reported spending the most time on personnel
and parent issues. Principals reported that in the area of school and community relations
the two greatest time consuming categories were improving staff morale and building a
positive school climate. The last area to be considered in the survey was interaction with
students. In this area, principals reported a significant amount of time was spent on

55
student discipline. One interesting finding was that principals reported that they believed
that due to their daily responsibilities their principal preparation programs should
emphasize the legal aspects of the profession.
A recent study by Kellogg (2005) examined the differences between actual and
ideal time expenditures in relation to the career stage of the principal. The activity
groups and percents found were: staff activities consumed 15% of the time, student
activities consumed 51% of the time, managerial activities consumed 21% of the time,
curriculum consumed 5% of the time, strategic planning consumed 4% of the time, fiscal
planning 0.3% of the time, and community relations consumed 2% of the time. These
results were not affected by gender, career stage, years of experience as a professional
educator, or years of experience as a principal. Kellogg made note of what he considered
an interesting phenomena. “Most noticeable is the principal’s desire for more time to be
spent on curricular activities and less time on managerial” (p.24-25).
In order to meet the challenges of public education, the old paradigms of
leadership are inadequate; the principal’s two-dimensional role as a manager and
instructional leader must evolve into the role of a transformational leader (Blair, 2003).
These challenges are not new to education, but are now in a different form. To better
understand the need for transformational leadership in education, an examination of the
underlying concepts of this form of leadership will be valuable.
Transformational Leadership
In order to explore the constantly changing role of the principalship (Goodwin,
2002), the conceptual framework of this study is based on transformational leadership.
Burns (1978) originated the concept of transformational leadership to explore how a

56
leader will produce results beyond expectations by being focused on change. In this
study, the bifurcation points of change in educational leadership will be evaluated to
determine if principals have had the vision necessary to adapt to societal changes and
produce results beyond expectations. To produce results beyond expectations, Burns
(1978) asserted transformational leadership is complex and change oriented. The
transformational leader examines the motives of his followers and seeks to engage the
full person in the process for purpose of mutual satisfaction. Burns posited that
transformational leadership has two stages of development. The first stage concentrates
on higher-order needs for self-esteem and actualization, while the second stage considers
the moral issues regarding what is ethical or appropriate. The inspection of the historical
developments of educational administration will examine the need to be successful and
the quest for what actions are appropriate within the societal standards of the time.
To explain the changes within organizations, Leithwood (1994) continued the
development of the concept of transformational leadership in education that was based on
the work of Burns (1978) and Bass and Avolio (1994). Bass and Avolio challenged
Burn’s concept of transformational leadership by asserting that behaviors of a
transformational leader are based on the actions of a transactional leader. The
transactional leader exhibits the traits of a good manager, while Bass’ focus was more on
the motivations of the followers based on the leader’s actions. Bass continued with the
assertion that the transformational leader changes the organization based on the needs and
that this leadership style is applicable in a wide range of cultures and organizations.
Leithwood expanded his beliefs based on the Bass model of the four I’s of
transformational leadership. The four I’s were proposed as necessary traits for

57
administrative transformational leaders to meet the mandates of the ever-changing
educational environment. Bass’s (1990) four I’s included individual consideration,
intellectual stimulation, inspirational motivation, and idealized influence. Bass described
individual consideration as the process of recognizing members of the organization who
seem neglected. Individual consideration exhibits a high level of interaction with his
followers. Intellectual stimulation is the enabling of the followers to challenge their way
of thinking and find solutions to old problems in new ways. This approach is exhibited
by leaders who are risk-takers and not afraid to challenge old assumptions in order to
accomplish goals. Inspirational motivation is the act of communicating the high
expectations that are expected in the organization by a dynamic leader who inspires his
followers. This leader models team spirit and inspires with his visionary explanations of
the goals to be achieved. Idealized influence is the modeling of behaviors that will
inspire followers through personal achievement and actions. This leader places the needs
of others above his own and is seen by others as a moral person who is concerned with
everyone’s success. Leithwood (1994) took the notion of these four I’s to explain the
productive relationship between the principal and the teacher to achieve the higher goals
of the institution and to accomplish needed reforms.
National educational reforms have been a focal point of attention in every decade.
With the effective school movement came an increase emphasis to alter the power
structures and leadership of schools (Marzano et al., 2005). The movement recognized
that transformational leadership concentrated on the leaders’ ability to empower others
and encourage participatory decision-making (Leithwood, 1994). Hoy and Miskel (1996)
stated that a transformation leader is expected to: (a) define the need for change, (b)

58
create new visions and encourage commitment to new visions, (c) concentrate on long
term goals, and (d) inspire followers to strive for higher order goals. Stronge (1998)
emphasized that current research on the principalship identifies the profession as
overwhelmed by the myriad of responsibilities and duties. The principal is expected to
be more than just a manager, but also expected to be an instructional leader and change
agent (Day, 2000; Murphy, 2005). This change agent must constantly be prepared to
make modifications to improve student achievement.
This change agent as the transformational leader can have positive effects in the
school setting in terms of instructional and student achievement. Leithwood and Earl
(2000) contended that a transformational leader would change the organization to
accommodate their own vision and goals, rather than continue to work within the existing
structure of the organization. Leithwood (1992) supported the belief that
transformational leaders have fundamental goals: (a) help staff develop and maintain a
collaborative and professional climate, (b) foster teacher development and growth, and
(c) help teachers become more effective problem solvers.
Sergiovanni (2006) furthered the concept of transformational leadership, which he
refers to as transformative leadership. Transformative leadership initially has the focus
of raising expectations of both the leader and follower to higher levels of performance.
The leader and follower are united in pursuit of higher level goals, becoming the best,
and shaping the school in the new direction that may be needed to succeed. Sergiovanni
also emphasized that leadership should be viewed as the “power to accomplish” (p.180).

59
Summary
Nationwide reform efforts in education seem to rise and fall with the issues of the
time. The political, economic and technological changes affect the public’s expectations
of the purpose of education in society. Education is simply too complex an institution to
determine if reform movements are ultimately successful. By the time that a reform
movement has measurable effect, the situation of society and education has again
changed. The efforts to change education may fluctuate in intensity, but seldom
disappear entirely for any length of time (Rutherford, 1998).
Kennedy (2002) confirmed that the job of a principal is an immense undertaking
and must be filled by a strong individual. She stated:
At one such meeting, participants concluded that today’s principal must be a
manager, instructional leader, visionary, politician, strategist, community leader,
and following the events of September 11, an emotional leader as well. That
made me wonder if a principal’s job posting should read, “Only God need apply.”
(p. 29)
Principals realize that their job has changed tremendously, but all too many times
the general public and policymakers do not recognize the situation (Kennedy, 2002). By
examining the data in the literature from past decades and comparing previous time on
task usage with current reports, this study will determine if changes in the amount of time
on tasks have occurred for principals because of present-day societal and legislative
events.

60
Chapter Three
Research Methods
The purpose of the study was to examine societal and legislative historical
developments in educational administration to determine the existence of bifurcation
points of change. This study proposed to determine the effect that societal and legislative
conditions have had on the tasks on which administrators focus their time in comparison
to the time spent on tasks previously. To understand how recent societal and legislative
changes have affected the function of administrators, it was necessary to study the current
responsibilities and tasks of educational administrators in relation to the historical
responsibilities and tasks of school leaders. The time-on-task of the administrators was
surveyed to determine if changes have occurred to meet the demands of the current
legislative priorities and if any of the changes have a relationship to the selected
demographic data collected. This study investigated the principals’ use of time in nine
selected school leadership activities.
To achieve the purpose of this study, the following research questions were
examined:
1. Since the 1960s, what are the major historical bifurcation points marking the
changes in principals’ time on task that were brought about by political and
societal changes?
2. How do principals currently allocate their time on administrative tasks?
3. Are there significant relationships between selected demographic data and the
current amount of time being allocated to administrative tasks?

61
4. Do principals perceive the legislative and societal changes in the early 2000s to
have altered the amount of time allocated to administrative tasks?
5. What legislative and societal issues in the early 2000s do principals perceive as
the reasons for any changes in the time allocated to tasks?
This chapter reviews various components of the study. The components that will
be examined are the research design utilized in the study, the population surveyed, the
survey instrument, the data collection, and the methods used to analyze the data.
Research Design
This study utilized a mixed method approach involving the review of literature for
the statistical data related to the time principals spend on job related tasks from the 1960s
to current literature. Additionally, a research method utilizing quantitative descriptive
design employed a written survey instrument, the McPeake Time Analysis Survey of
Principals (Appendix A), arranged to obtain numerical data and related demographical
information from the respondents. Numerical data were obtained for the number of hours
estimated per week dedicated on tasks for nine school leadership activities. The survey
was also structured to obtain estimates about the changes in time spent on these tasks in
the past three years. The past was keyed to qualitative ranking categories such as
“significant increase” and “slight increase”. These were numerically coded to yield
numerical values for summation and comparison. As noted, the design also accounted
for selected demographic variables to identify potential variations in the survey results.
The review of the literature component of the study was quantitative in nature
with a primary focus on the collection of numerical data. The researcher examined the
past literature in educational administration to find documentation of principals’ activities

62
and the amount of time the principals reported spending on tasks. The literature that was
selected was written during the period from the 1960s to the current period of educational
leadership. This time frame was selected since this era has been referred to as the
Modern Period of Leadership (History of American Education Web Project, 2006).
Population
The population in this study was full time principals included in this study were
employed in elementary, middle, and high public schools. Private schools were excluded
from the population, given that private schools are not as directly impacted by societal
and legislative regulations. Administrators in the states located in the Southern Regional
Educational Board (SREB) were surveyed. These states are Alabama, Arkansas,
Delaware, Florida, Georgia, Kentucky, Louisiana, Maryland, Mississippi, North Carolina,
Oklahoma, South Carolina, Tennessee, Texas, Virginia, and West Virginia. The SREB
states were selected due to the commonalities in the goals established by the SREB’s
Challenge to Lead (SREB, 2006), which is an initiative to improve the quality of
education being provided and to prepare children for modern society. This study was
limited to full time principals and did not survey assistant principals.
The population was selected based on the 16 states that participate in the SREB.
According to the SREB, there are 1300 secondary schools in the 16 states that participate
in the Challenge to Lead initiative (SREB, 2006). If an equitable number of elementary
schools were included in the survey so that each group represented one-third of the
population, the total number of schools in the population would be 1,950 (N=1950). A
mailing list of 480 principals (n=480) was determined to be sufficient to achieve the
desired responses (M. Cunningham, personal communication, September 26, 2006).

63
Instrumentation
The researcher developed the instrument to survey current principals on their time
on tasks and to gather demographic data on the respondents. The task areas that were
included in the survey were derived from the researcher’s review of the literature to
determine the most appropriate categories and then by the discussion that involved three
acting school principals. These task categories were also utilized in the survey because it
allowed comparisons to be made to the past literature. The survey was pilot tested with a
group of administrators at all three levels of school administration to determine validity
and readability. The questionnaire was designed to provide an accurate profile of the
current administrators in the SREB regions of the United States. The task areas were
general enough to be applicable to elementary, middle, and secondary school principals.
In Part I of the survey, the respondents were asked to answer demographic
questions concerning the following areas: gender, age, years of professional experience,
grade levels of school, total school enrollment, school attendance community, number of
support professionals, and highest level of education. Part II requested respondents to
estimate the number of hours per week that they spent on a list of nine categories of
activities. In Part III, the respondents were asked to determine the changes in the time
spent on the selected nine task areas in the last three years. The ranking used to
determine the changes in time were “significant decrease”, “slight decrease”, “no
change”, “slight increase”, and “significant increase.” An open response question was
included in the last part of the survey. In this question, the respondents were asked to
identify any legislative or societal conditions that may have contributed to changes in
their allocation of time on tasks. An assembled group of current public school

64
administrators was utilized to develop the appropriate categories for the survey and to
validate the readability of the McPeake Time Analysis Survey of Principals (Appendix
A).
Data Collection
To survey the principals, the researcher mailed each principal (n=480) selected in
the random sample a personally addressed packet. The mailed packet provided an
introduction to the study with information regarding the purpose of the study (Appendix
B), the informed consent information as required by the Institutional Review Board
(IRB), and the survey instrument, along with a stamped self-addressed return envelope.
The principals were provided with the informed consent information in the introductory
letter that explained their rights as a participant in the study. The researcher assured the
participants that confidentiality would be maintained. All participants were informed that
their participation in the study was voluntary and anonymous, and at no cost to the
participants.
The population was selected based on the 16 states that participate in the SREB.
According to the SREB, there are 1300 secondary schools in the 16 states that participate
in the Challenge to Lead initiative (SREB, 2006). If an equitable number of elementary
schools were included in the survey so that each group represented one-third of the
population (Appendix D), the total number of schools in the population would be 1,950
(N=1950). According to Fink (2003), a stratified random sampling would allow the
population to be divided into the subgroups and a random sample would then be selected
from each subgroup. The appropriate subgroups utilized for this study were elementary,
middle, and secondary school principals. The subgroup populations were included in the

65
survey to give a true sampling of all levels of school administrators and the amount of
time on task that was being spent on selected tasks. Systematic random sampling
provided the target members of the population (Fink, 2003). The response rate of 240
was established with a 95% confidence interval with an error margin of 5.9% (Guideline,
2006). The researcher established the acceptable response rate based on the
recommended minimum level of Kerlinger and Lee (1999) of 50% plus one. A mailing
list of 480 principals (n=480) was determined to be sufficient to achieve the desired
responses (M. Cunningham, personal communication, September 26, 2006). Based on
the number of elementary schools located in each state in relation to the total number of
elementary schools in the 16 states, a corresponding ratio of schools was selected from
each state .
The return envelopes were numbered for tracking purposes. Once these
numbered envelopes were received, the surveys were separated from the envelopes and
the envelopes were destroyed. The look-up table that has the correlation of the numbers
to the participants was located in the office of Dr. Teresa Eagle at the Marshall University
Graduate College. When the response rate did not meet this criterion, a reminder letter
(Appendix C) was mailed to the appropriate participants to encourage them to complete
the survey.
Data Analysis
Data were entered into SPSS data analysis for respondents who had completed the
questionnaire in the appropriate method. The review of the literature provided the first
set of data. The literature review was utilized to answer research question one: Since the
1960s, what are the major historical bifurcation points marking the changes in principals’

66
time on task that were brought about by political and societal changes? A review of the
literature provided data on the amount of time on tasks from the previous decades being
considered in this study. The review of the literature provided data on the percent of time
and means of the time on task areas as reported by the literature. The past time on task
was compared to the time on task reported by the respondents on the McPeake Time
Analysis Survey of Principals.
The second set of data used in this study was obtained from Part II in the survey.
These data answered research question two: How do principals currently (2006-2007)
allocate their time on administrative tasks? The nine task areas considered for this study
were: (a) school management, (b) personnel, (c) program development, (d) student
activities, (e) student behavior, (f) planning, (g) community, (h) district office, and (i)
professional development (NASSP, 1996). A comparison of the percent of time and
means of the time on task areas were employed. The dependent variable that was
measured was the amount of time spent on each task listed in the table in Part II. The
total time on task was also utilized for comparison.
A third set of data was considered to answer research question three: Are there
significant relationships between selected demographic data and the current amount of
time being allocated to administrative tasks? The data were obtained from Part I and Part
II of the McPeake Time Analysis Survey of Principals. The relationship to time on task
was done using the independent variables of gender, age, grade levels of school, total
school enrollment, community type, years of experience as a principal, and level of
education. The use of multiple correlations provided detail on the relationships that exist
between the dependent variables of the demographic characteristics and the independent

67
variables of the time on task measurement. Multiple regressions will allow the prediction
of an outcome from two or more independent variables (Salkind, 2004).
In Part III of the survey, the respondents were asked to identify the changes in the
amount of time spent on any task area that requires a different amount of time now than it
did three years ago. The respondents were asked to estimate the change in time using the
categories: “significant decrease”, “slight decrease”, “no change”, “slight increase”, and
“significant increase.” The data provided answered research question four: Do
principals perceive the legislative and societal changes in the early 2000s to have altered
the amount of time allocated to administrative tasks? Values were assigned for the
responses: “-2” for “significant decrease”, “-1” for “slight decrease”, “0” for “no
change”, “1” for “slight increase”, and “2” for “significant increase.” The areas of
“slight” and “significant” were combined in both categories of increase and decrease to
provide a better understanding of principals’ opinions. Frequency and percentages were
computed for each task area. An open response question was included in the last part of
the survey. In this question, the respondents were asked to state any legislative or
societal conditions that may have contributed to changes in their allocation of time on
tasks. The responses were summarized by the researcher utilizing regrouping and
frequencies.
Summary
The procedures described in this chapter were used to examine the historical
developments in educational administration in relation to historical and societal
developments. The existence of critical points of change were examined, along with the
changes in the amount of times that school building principals spend on daily tasks. This

68
study was a mixed method study utilizing past literature data and a quantitative analysis
of current principals being surveyed. The population consisted of a random selection of
elementary, middle school and high school principals in the Southern Regional Education
Board. The survey was mailed to 480 (n=480) principals in 16 states. The literature
reviewed was written from the 1960s through the current period of educational literature.
The literature included information regarding how school building principals were
dedicating their time on selected tasks.

69
Chapter Four
Presentation and Analysis of Data
Chapter Four of this mixed-method study of the time on tasks of principals
presents the data collected from the literature review and the quantitative survey. This
chapter is presented in three sections: (a) the summary of procedures, (b) the research
questions and analyses of data, and (c) a summary of the major findings.
Summary of Procedures
This was a mixed method study utilizing a literature review of principals’ time on
task from 1960 to the 21st Century. The objectives of the first part of the study were two-
fold: (a) determine the amount of time that principals have spent on administrative tasks
through five decades and (b) determine the existence of bifurcation points in the time on
task based on societal and legislative issues. The second part of the study was to survey
current principals to determine their time on task and the relationship to selected
demographic data. The respondents were also requested to state the changes in the time
dedicated to the selected nine task areas and any perceived legislative and societal
reasons for changes in the amount of time being dedicated to the task areas.
The McPeake Time on Task Analysis was distributed to 480 (n=480) principals in
the 16 state region of the Southern Regional Educational Board (SREB). The principals
were employed in an elementary, middle, high, or combination public school (N=1950)
and had more than two years experience as a school administrator. Of the 480 surveys,
four were returned due to an incorrect mailing address or school closure, and one was
returned due to the school district policy restricting participation in research. Finally, one
survey was returned unanswered, apparently indicating the principal’s desire not to

70
participate in the study. After the second mailing, a total of 242 usable surveys were
obtained and established a return rate of 51.05%. The respondents were comprised of
102 females and 140 males consisting of 66 elementary principals, 85 elementary
principals, and 91 high school principals.
Major Findings
The results regarding each of the research questions will be summarized and
conclusions will be stated regarding the findings from this study.
Q1: Since the 1960s, what are the major historical bifurcation points marking the
changes in principals’ time on task that were brought about by political and societal
changes?
This question was addressed by quantifying the findings of the current study in
relation to the review of literature. A review of literature from 1960 to the 21st Century
was completed in order to analyze the amount of time spent on administrative tasks and
any changes in the time on tasks in relation to societal and legislative impacts. The
information discussed in this section details the results of the statistical analysis of the
first research question.
In order to analyze the changes in the time reported during each decade, different
categories were combined from the various studies. Individual researchers had labeled
activities with a variety of titles. This re-categorizing required critical judgments to
determine the relationship between the activities that were identified. For example, in the
1980 studies, the categories of “Paperwork” and “Facilities Management” were combined
to match the category of “School Management” that had been calculated in the 1960s,
1970s, and 1980s literature.

71
The data for each societal and legislative time period were calculated. The
categories were combined for the purposes of comparison. A mean for each of the nine
categories of activities was calculated, along with the mean of the total number of hours
that principals reported spending on the job. Table 3 (p. 84) reflects the summary of the
data that were obtained for comparison. It should be noted that several categories of
activities were not documented in the literature for particular time periods. Utilizing a
review of the literature and the summary of data from past studies, indications of
bifurcation points in educational administration were then observed.
36.7%28.3%
30.2%25.2% 27.3%
05101520253035404550
Perc
ent
1960s 1970s 1980s 1990s 2000s
Years
School Management Reported Percentage
Figure 1. Percent of Time on School Management
From the 1960s to the 2000s, principals reported dedicating roughly one-third of
the day to school management issues. These issues include any time allocated to office
responsibilities, building maintenance, safety, and budget concerns. As shown in Figure
1, the maximum amount of time reported in the 1960s could be attributed to fewer
categories during that time period that were considered in the literature. A decrease in
the 1990s has since increased up to the current 27.3% revealed by the literature.

72
14.8% 17% 11.8% 16.7%21.2%
05
101520253035404550
Perc
ent
1960s 1970s 1980s 1990s 2000s
Years
Student Activities Reported Percentage
Figure 2. Percent of Time on Student Activities
Student activities have shown fluctuation in the amount of time being reported by
principals in the time period (Figure 2). The 14.8% of the day reported in the 1960s
dropped to a low of 11.8% in the 1980s. This task area has since slowly increased to
requiring a maximum of 21.2% of the principals’ time. The increase in the 2000s could
be attributed to the mounting pressure for principals and schools to supplement the
problems associated with societal concerns of this time period.

73
27.3%
7.5%11.8% 12.9% 15.5%
05
101520253035404550
Perc
ent
1960s 1970s 1980s 1990s 2000s
Years
Student Behavior Reported Percentage
Figure 3. Percent of Time on Student Behavior
Figure 3 notes the percent of time reported by principals being dedicated to
student behavior. The 1960s percent of 27.3% could be attributed to the lack of
categories of personnel, program development, and planning. Therefore, principals may
have included a wide range of activities in the category of student behavior. The large
percent of time allocated to student behavior could also be attributed to the lack of
assistant principals to help handle any student behavior problems. The slow increase
back to 15.5% indicated for student behavior may be a result of the societal conditions
that have continued to impact school systems in the 2000s.

74
N/A
22.7% 19.6%14.3% 16.8%
05
101520253035404550
Perc
ent
1960s 1970s 1980s 1990s 2000s
Years
Personnel Reported Percentage
Figure 4. Percent of Time on Personnel
The amount of time reported to be devoted to the area of personnel has shown a
decrease since the 1970s when this category was first considered as a separate task area.
As indicated in Figure 4, the maximum time determined to have occurred was in the
1970s which coincides with the implementation of the Education for All Handicapped
Children Act of 1975. This act required principals to monitor the activities of their
special education teachers more closely and to work cooperatively with personnel in
developing Individual Education Plans for all special education students. The
introduction of the “least restrictive environment” required principals to increase
interactions and decisions with personnel in order to meet the requirements of the
legislation.

75
N/A N/A
11.2%7.1% 5.7%
05
101520253035404550
Perc
ent
1960s 1970s 1980s 1990s 2000s
Years
Program Development Reported Percentage
Figure 5. Percent of Time on Program Development
Figure 5 demonstrates the lack of emphasis on program development in the 1960s
and 1970s where this task area was not even considered as a principal’s responsibility.
With the publication of A Nation at Risk in 1983, the focus on program development
became evident for principals to include in their daily schedule of activities. The
maximum amount of time reported on program development in the 1980s (11.2%) was
needed to increase the rigor of the school’s curriculum to meet the needs of society and to
ensure the students’ success. The decrease in time allocated to program development in
the 1990s and 2000s may be attributed to the changing focus to assessment results.

76
3.0%2.0%
5.2%2.0%
05
101520253035404550
Perc
ent
1960s 1970s 1980s 1990s 2000sYears
District Office Reported Percentage
N/A
Figure 6. Percent of Time on District Office
The amount of time reported to be dedicated to district office tasks (Figure 6) has
consistently remained a minimal amount of time in a principal’s week. The
responsibilities included in this task area were district meetings, meetings with
supervisors, and principal meetings. The only small increase occurred in the 1990s and
could be attributed to the societal issues of lack of parental involvement and student
apathy. Beck and Murphy (1993) cited the 1990s as the beginning of the second reform
movement in education which could explain the principals’ increase involvement with
personnel at the district office level.

77
10.7%
3.7%8.5%
4.0% 4.3%
05
101520253035404550
Perc
ent
1960s 1970s 1980s 1990s 2000sYears
Community Relations Reported Percentage
Figure 7. Percent of Time on Community Relations
As exhibited in Figure 7, the percent of time allocated to community relations has
required less than 10% of the principals’ time since the 1960s. The maximum in the
1960s could be attributed to the societal conditions that existed during this time period.
The area of community relations included the time dedicated to civic organizations,
media, Parent Teacher Associations, and parent groups. The next evident change
occurred in the 1980s where the literature indicated both the lack of parent involvement
and student apathy were social issues of major concern.

78
N/A 2.5% N/A 4.0% 4.6%
05
101520253035404550
Perc
ent
1960s 1970s 1980s 1990s 2000s
Years
Planning Reported Percentage
Figure 8. Percent of Time on Planning
Figure 8 illustrates that principals spend very little time planning what happens in
a school. For the last five decades, principals have consistently allocated less than 5% of
their time to planning. The task area of planning was defined to include any time that
was devoted to county and district planning sessions, department meetings, and
curriculum meetings. The increase to a maximum of 4.6% reported in the 2000s may be
attributed to the implementation of the GOALS 2000: Educate America Act (Austin,
2004) and the No Child Left Behind Act (United States Department of Education, 2006).
Both pieces of legislation placed the responsibility for the success of each student directly
on the principal and the staff of the school. The need to plan a wider variety of strategies
to guarantee this success mandated more time to be devoted to planning.

79
N/A 1.0%6.2% 4.9% 3.6%
05
101520253035404550
Perc
ent
1960s 1970s 1980s 1990s 2000s
Years
Professional Development Reported Percentage
Figure 9. Percent of Time on Professional Development
The task area of professional development (Figure 9) was identified as time
dedicated to conferences, self improvement planning, and professional readings. The
category was not identified in the 1960s, but may have been included in the area of
miscellaneous. The minimal amount of time that principals have remaining in their work
week after the school required tasks may be a contributing factor to the lack of time to
dedicate to their own professional development. The maximum of 6.2% in the 1980s
may be linked to the need for personal professional development of the principals to
assist their teachers in the handling the challenges of A Nation at Risk (1983).
Synthesis of the Findings from the Literature
The analysis of the literature demonstrated changes in the percent of time that
administrators had dedicated to the task areas (Table 3). It was found that while an
increase in time from the 1960s to 1970s is reflected in student activities from 14.3% to
17%, there is also more time reported being dedicated to personnel issues (22.7%) than in

80
any other decade. The literature of that time period reflects that many principals were
impacted by the Education for all Handicapped Children Act of 1975. This legislation
made the principal responsible for monitoring the teachers involved in the special
education process and also responsible for being part of the interdisciplinary team
accountable for the development of Individual Education Plans. Gorton and McIntyre
(1978) in their study of 60 effective principals stated that the nature of the principalship
had changed during the previous decade in response to the emergence of professional
negotiations, court decisions, and the constantly shifting priorities that had been
established for public schools.
In the 1980s, a significant increase in the amount of time spent in the area of
program development also became a major task area that had not even been considered in
previous literature. In this era, program development was reported as requiring 11.2% of
the time per week. This was the most time reported during the five decades studied.
Professional development also exhibited a marked increase from the 1970s to an all time
high of 6.2% per week. All of these increases could be attributed to references in the
literature of that time period to the Nation at Risk (1983) report. This would explain the
finding that principals had increased the focus on planning curriculum to better meet the
needs of students and to encourage students to perform at higher levels (Smith &
Andrews, 1989). Since the Nation at Risk report detailed the standards that each school
should establish to meet the new basics, principals were required to find new curriculum
to meet these benchmarks and to train staff to utilize the new strategies (National
Commission on Excellence in Education, 1983; Scherer, 2004). This increase in program
development was also identified by Beck and Murphy’s (1993) finding that the metaphor

81
most used at this time was that the principal’s main function was to “establish and create
a mission”.
The literature of the 1990s indicates the impact of the social crises of the era. The
literature of the 1990s reflects an increase in the amount of time spent on student
activities from 11.76% in 1980s to 16.73% in the 1990s, while a slighter increase in also
reflected in student behavior from 11.76% to 12.85%. District office time reached an all
time high of 5.15%. The literature of this time focused on the lack of parent involvement
as the most serious problem, followed closely by student apathy and poverty (NCES,
2001). The lack of any significant legislative impacts of this time is evident. Bifurcation
points in the time period are not apparent.
In the early 2000s, a change in almost all areas is recorded in the literature.
School management increased from the 1990s figure of 25.17% to 27.37%, Student
activities increased from the previous decades 16.73% to 21.20%, and student behavior
increased from 12.85% to 15.46%. The task area of personnel also revealed an increase
from 14.33% to 16.77%. The only areas that showed a decrease were district office to
2.00%, program development to 5.67%, and professional development to 3.55%. Several
major legislative actions impacted the school system at the beginning of the 21st century.
According to Austin (2004), the GOALS 2000: Educate America Act was to encourage
local school systems to help students reach their potential, increase parent involvement,
and improve teachers’ skills. Another goal was for every school to be safe for students to
attend and learn. Then in 2002, the No Child Left Behind (NCLB) Act placed the
responsibility of every child’s success directly on the school and ultimately the school’s
administrator. According to NCLB, each state shall develop and implement an

82
accountability system that will ensure all Local Educational Agencies (LEAs) and
schools make Adequate Yearly Progress (AYP) (United States Department of Education,
2006).
In addition to the legislative influences, principals also faced the challenges of a
more diverse ethnic and racial population, an increase in the number of families at
poverty level, and an increase in the number of single parent households (NCES, 2006).
Other factors impacting a principal’s job included an increase in home-schooled children,
an increase in the special education regulations, an increase in required paperwork and
documentation, and a decrease in the number of qualified candidates entering the
teaching field (DiPaola & Tschannen-Moran, 2003; Kopkowski, 2006; NCES, 2006;
Peoples, 2002; Phillips, 2001).
These influences are reflected in the change in percent of time that principals
allocate to tasks. Additionally, one major change that was evident after examining the
literature from the 1960s to the 21st century was the dramatic increase in the number of
hours that principals work every week to accomplish the variety of responsibilities that
are assigned to the administrative leader of a school. In the 1960s principals worked an
average of 49.3 hours per week. From that time period, there was a gradual increase to
the 1990s average of 52.8 hours per week, but the 21st century principal faced a dramatic
time increase on the job to 61.1 hours per week. From this data, the legislative and social
factors of the early 21st century appear to be major bifurcation points in administrative
history.

83
Table 3
Percent of Time and Total Time Documented by Literature Review
Activity 1960s 1970s 1980s 1990s 2000s
School
Management
36.73% 28.33% 30.18% 25.17% 27.37%
Student
Activities
14.78% 17.00% 11.76% 16.73% 21.20%
Student
Behavior
27.33% 7.50% 11.76% 12.85% 15.46%
Personnel -- 22.67% 19.55% 14.33% 16.77%
Program
Development
-- -- 11.24% 7.05% 5.67%
District Office 3.0% 2.00% -- 5.15% 2.00%
Community
Relations
10.73% 3.67% 8.47% 3.97% 4.27%
Planning -- 2.5% -- 4.03% 4.60%
Professional
Development
-- 1.00% 6.2% 4.85% 3.55%
Unclassified
for comparison
8.37%(Teach/Misc) 12.00%(Misc) -- -- --
TOTAL
HRS/WEEK
49.3 hrs 51.3 hrs 46.1 hrs 52.8 hrs 61.1hrs

84
Q2: How do principals currently allocate their time on administrative tasks?
The second set of data used in this study was obtained from Part II in the survey.
The nine task areas considered for this study were: (a) school management, (b)
personnel, (c) program development, (d) student activities, (e) student behavior, (f)
planning, (g) community, (h) district office, and (i) professional development (NASSP,
1996). Means in each task area were utilized to establish the amount of time spent on
each task.
Table 4
Mean Amount of Time (Hours/Week) in Nine Task Areas ________________________________________________________________________
School Mangmnt
Person Progm Develop
Student Activities
Student Behavior
Plan Community Relations
District Office
Profess Develop
Other
Mean Std. Dev.
12.2
8.29
11.1
6.37
6.0
4.24
8.9
5.83
7.7
6.33
4.2
2.88
2.6
2.01
3.1
2.68
3.0
2.77
0.5
2.27
The mean amount of time on task in Table 4 was summed to determine the total
amount of time dedicated to the nine task areas plus the area labeled as “Other
Activities.” Principals reported a mean time on the job of 59.4 hours per week. The
greatest amount of time was reported in the area of school management with a mean of
12.24 hours per week, while the least amount of time to a task area was reported to be
2.61 hours per week dedicated to the area of community relations.
Q3: Are there significant relationships between selected demographic data and the
current amount of time being allocated to administrative tasks?
The data were obtained from Part I and Part II of the McPeake Time Analysis
Survey of Principals. The relationship to time on task was done using the independent

85
variables of gender, age, grade levels of school, total school enrollment, community type,
years of experience as a principal, and highest level of education. Independent t-tests,
multiple correlations and ANOVAs were used to examine the relationships that exist
between the dependent variables of the demographic characteristics and the independent
variables of time on task measurement. Multiple correlations were utilized to predict the
outcome from two or more independent variables (Salkind, 2004).
Gender to Time on Task Findings
Respondents to the McPeake Time Analysis Survey of Principals were composed
of 102 females (42.1%) and 140 males (57.9%). The relationship between gender and the
total time on task was analyzed using an independent t-test for significance which yielded
an F-value of 3.524 with a probability of significance of 0.062, which was not
statistically significant. This relationship is presented in Table 5.
Table 5 T-Test of Gender to Total Time (Hours/week)
Sum of
Squares Df Mean
Square F Sig. Between Groups
817.607 1 817.607 3.524
.062
Within Groups 55677.696 240 231.990 Total 56495.303 241
For further clarification of the data, the bivariate correlation was used to
determine the relationship between the principal’s gender to the amount of time allocated
to each of the nine task areas. The correlations and the significance are shown in Table 6.
There were significance relationships found in the areas of school management,
personnel, program development, and planning. Using the cross tabulation function of
SPSS, the data revealed more specific details concerning the significant time on these

86
four task areas with respect to gender. The majority of time in the area of school
management was 10.0 hours allocated by 80 principals (33% of the total respondents).
These 80 principals were composed of 36 females (35% of the females) and 44 males
(31.4% of the males). The majority of time in the area of personnel was 10.0 hours per
week allocated by 73 principals (50.7%). These 70 principals were composed of 29
females (28.4% of the females) and 44 males (31.4% of the males).
In addition, the majority of time allocated to program development was 5 hours
per week reported by 67 principals (27.6% of the total respondents). These 67 principals
were composed of 29 females (28.4% of the females) and 38 males (27.1% of the males).
The majority of time allocated to planning was clustered in the range of 2-5 hours. A
total of 158 principals (65.3% of the total respondents) reported spending 2-5 hours per
week on planning. Sixty-seven females (65.7% of the females) and 92 males (65.7% of
the males) were found in this range of time.
There were no significant differences in the amount of time that administrators
allocated to tasks based on gender. Correlations were found to exist in the areas of
school management (10 hours), personnel (10 hours), program development (5 hours),
and planning (2-5 hours).
Table 6 Correlation of Gender to the Nine Task Areas
School Mangmnt
Personnel Prog Develop
Student Activities
Student Behavior
Planning Commun Relations
District Office
Prof Devel
Pearson Correlation -.139*
-.237** -.292**
.068 .059
-.168** .000
-.100
-.113
Sig (2-tailed)
.031
.000
.000
.291
.364
.009
.995
.119
.079
* Correlation is significant at the 0.05 level (2-tailed). ** Correlation is significant at the 0.01 level (2-tailed).

87
The negative correlation of gender was significant in the task areas of school
management, personnel, program development, and planning. This indicated that more
females reported a greater amount of time on these areas than did males. Specifically, in
the area of personnel, 2/3 of the males allocated less than the 10.0 hours, while ½ of the
females spent more than the 10.0 hours on the area of personnel.
Age to Time on Task Findings
In Part I of the survey, the respondents were asked their year of birth. The
responses were grouped into categories for comparison. There were 62 respondents in
the category of 29 -44 years old (25.6%), 56 respondents in 45-50 years old (23.1%), 62
respondents in the 51-55 years old (25.6%), and 62 respondents were 56- 64 years old
(25.6%). The relationship between age and the total time on task was analyzed using the
ANOVA test, shown in Table 7, which yielded an F-value of 0.598 with a probability of
significance of 0.617, which was not statistically significant.
Table 7 ANOVA of Principals’ Age to Total Time
Sum of
Squares Df Mean
Square F Sig. Between Groups 422.715 3 140.905 .598 .617 Within Groups
56072.587 238 235.599
Total
56495.303 241
For further clarification of the data, the bivariate correlations were analyzed to
determine the relationship between the demographic of principals’ age to the amount of
time allocated to each of the nine task areas. The correlations and the significance are
shown in Table 8. There was no significance noted for any of the nine task areas.

88
Table 8
Correlation of Principals’ Age to the Nine Task Areas School
Mangmnt Person
Prog Develop
Student Activities
Student Behavior
Planning Commun Relations
District Office
Prof Devel
Pearson Correlation
.112
.006
.026
-.036
.035
-.051
-.073
-.008
-.048
Sig (2-tailed) .083 .931 .692 .577 .591 .432 .257 .898 .455 * Correlation is significant at the 0.05 level (2-tailed). ** Correlation is significant at the 0.01 level (2-tailed). School Grade Levels to Time on Task Findings
In Part I of the survey, the respondents were asked to state the grade levels that
attend their school. The respondents were grouped into three categories: (a) elementary
for grades K-4 (not containing grade 8), (b) middle schools for schools that contain a
grade, but not a grade 12, and (c) high school for any school that contains a grade 12
(WV Department of Education, 2006). There were 66 respondents in elementary schools
(27.3%), 85 respondents in middle schools (35.1%), and 91 respondents in high schools
(37.6%). The relationship between school grade levels and the total time on task was
analyzed using the ANOVA, shown in Table 9, which yielded an F-value of 1.326 with a
probability of significance of 0.268, which was not statistically significant.
Table 9 ANOVA of School Grade Levels to Total Time
Sum of
Squares Df Mean Square F Sig. Between Groups 619.892 2 309.946 1.326 .268 Within Groups 55875.410 239 233.788 Total 56495.303 241
For further clarification of the data, the bivariate correlations were analyzed to
determine the relationship between the school’s grade levels to the amount of time
allocated to each of the nine task areas. The correlations and the significance are shown

89
in Table 10. There were significance relationships found in the areas of program
development and student activities. Using the cross tabulation function in SPSS, the data
revealed more specific details concerning the significant time on these two task areas.
The majority of time allocated to program development was 5 hours per week. This time
was reported by 18 elementary principals (27% of the elementary principals), 19 middle
school principals (22% of the middle school principals), and 30 of the high school
principals (33% of the high school principals). The majority of time allocated to Student
Activities was 5 hours by 12 elementary (18.2%) and 23 middle (27%) school principals,
while 27 high (29.6%) school principals reported allocating 10 hours per week to this
task area.
There were no significant differences in the amount of time that administrators
allocated to total time on tasks based on the school grade levels. Significant correlations
were found to exist in the amount of time in the areas of program development (5 hours)
and student activities (5 hours) in relation to school grade levels.
Table 10
Correlation of School Grade Levels to Nine Task Areas School
Mangmnt Personnel Prog
Develop Student Activities
Student Behavior
Planning Commun Relations
District Office
Prof Devel
Pearson Correlation
.038
.-.072
-.159*
-.227**
.004
-.053
-.020
.109
-.053
Sig (2-tailed)
.554 .265 .013 .000 .947 .408 .762 .091 .409
* Correlation is significant at the 0.05 level (2-tailed). ** Correlation is significant at the 0.01 level (2-tailed).

90
Student Population to Time on Task Findings
In Part I of the survey, the respondents were asked about the number of students
currently enrolled in the school where they were serving as principals. These responses
were then categorized into population ranges for the purposes of comparison. The data
revealed 51 principals in schools of 90-400 students (21.1%), 49 principals in schools of
401-600 students (20.2%), 57 principals in schools of 601-800 (23.6%), 29 principals in
schools of 801-1000 (12.0%), 13 principals in schools of 1001-1200 (5.4%), 29 principals
in schools of 1201-2000 (12.0%), and 14 principals in schools of 2001-4200 (5.8%). The
relationship between number of students in the school and the total time on task was
analyzed using the ANOVA, shown in Table 11, which yielded an F-value of 0.226 with
a probability of significance of 0.968, which was not statistically significant.
Table 11 ANOVA of Student population to Total Time
Sum of
Squares Df Mean Square F Sig. Between Groups 324.516 6 54.086 .226 .968 Within Groups 56170.786 235 239.025 Total 56495.303 241
For further clarification of the data, the bivariate correlations were analyzed to
determine the relationship between the number of students attending the school to the
amount of time allocated to each of the nine task areas. The correlations and the
significance are shown in Table 12. There were significance relationships found in the
areas of student behavior, planning, community relations, and district office. The use of
the cross tabulation function in SPSS revealed more specific details concerning the

91
significant time on these four task areas. The majority of time allocated to Student
Behavior was 5 hours per week. This time was identified as the time allocated by a total
of 55 principals (22.7% of the total respondents). The 55 respondents consisted of 8
principals with a population of 90-400 students, 13 principals with a population 401-600,
14 principals with a population of 601-8000, 5 with a population of 801-1000, 2 with a
population of 1001-1200, 9 with a population of 1201-2000, and 4 with a population of
2001-4200.
Table 12
Correlation of Student Population to Nine Task Areas School
Mangmnt Personnel Prog
Develop Student Activities
Student Behavior
Planning Commun Relations
District Office
Prof Devel
Pearson Correlation
-.064
-.007
-.015
.048
-.135*
.169**
.132*
.165*
.042
Sig (2-tailed) .323 .917 .811 .455 .035 .009 .040 .010 .519 * Correlation is significant at the 0.05 level (2-tailed). ** Correlation is significant at the 0.01 level (2-tailed).
In addition, the majority of time allocated to planning ranged from 2-5 hours per
week. A total of 159 principals (65.7% of the total respondents) reported this amount of
time being dedicated to planning. An interesting observation was that the majority of
schools with a population from 90-1000 reported 2 hours as the total time on task, while
schools with population from 1001-4200 reported 5 hours per week allocated to planning.
The majority of time allocated to the third task area of community relations was 2 hours
per week. Seventy-six principals (53.5%) reported that they dedicated 2.0 hours to
community relations. There were 14 principals with school population 90-400, 13 with
population of 401-600, 25 principals with 601-800, 8 principals with 801-1000 students,

92
4 principals with 1001-1200 students, 10 principals with 1201-2000 students, and 2
schools with 2001-4200 students.
The last area that revealed a significant correlation was the task area of district
office. The majority of every student population group asserted that 2.0 hours per week
were utilized in the district office task area. This total of 77 principals was composed of
16 principals with school population 90-400, 18 with population of 401-600, 19
principals with 601-800, 7 principals with 801-1000 students, 4 principals with 1001-
1200 students, 9 principals with 1201-2000 students, and 4 schools with 2001-4200
students.
There were no significant differences in the amount of time that administrators
allocated to tasks based on the number of students enrolled in the school. Significant
correlations were found to exist in the areas of student behavior (5 hours), district office
(2 hours), community relations (2 hours), and planning (2-5 hours). The negative
correlation indicated in Table 12 also provided evidence that the larger the school
population, the less amount of time the principal dedicated to student behavior. The
utilization of assistant principals could explain this finding that principals with larger
student populations allocate less time to discipline than in the smaller schools.
Type of Community to Time on Task Findings
In Part I of the survey, the respondents stated the type of community where their
school was located. These responses were categorized as rural, suburban, or urban based
on the principals’ personal interpretations. The data revealed 117 principals considered
their community to be rural (48.3%), 66 principals considered their community to be
urban (27.3%), and 59 principals considered their school community to be suburban

93
(24.4%). The relationship between the type of community in which the school was
located and the principals’ total time on task was analyzed using the ANOVA, shown in
Table 13, which yielded an F-value of 0.278 with a probability of significance of 0.758,
which was not statistically significant.
Table 13 ANOVA of the Type of Community to Total Time
For further clarification of the data, the bivariate correlations were used to
determine the relationship between the types of community to the amount of time
allocated to each of the nine task areas. The correlations and the significance are shown
in Table 14. There were significance relationships found in the areas of student behavior
and planning. The use of the cross tabulation function in SPSS revealed more specific
details concerning the significant time on these two task areas. The majority of time
allocated to student behavior was 5 hours per week. This time was identified as the time
allocated by a total of 55 principals (22.7% of the total respondents). The 55 respondents
consisted of 25 principals in a rural community (21.4% of the rural schools), 12
principals in an urban community (18.2% of the urban schools), and 18 principals in a
suburban community (30.5% of the suburban schools).
The second area of significance was the task area of planning. The majority of
time allocated was 2 hours which was reported by 55 principals, but this was followed
closely by another group of 50 principals who reported allocating 5 hours per week to the
task of Planning. The time of 2 hours was significant and was indicated by 32 rural
Sum of
Squares Df Mean Square F Sig. Between Groups 131.002 2 65.501 .278 .758 Within Groups 56364.300 239 235.834 Total 56495.303 241

94
principals (27.4% of the rural schools), 15 urban principals (22.7% of the urban schools),
and 8 suburban principals (13.6% of the suburban schools).
There were no significant differences in the amount of time that administrators
allocated to tasks based on the type of community in which the school was located.
Significant correlations were found to exist in the areas of Student Behavior (5 hours) and
Planning (2 hours).
Table 14 Correlation of the Type of Community to Nine Task Areas School
Mangmnt Personnel Prog
Develop Student Activities
Student Behavior
Planning Commun Relations
District Office
Prof Devel
Pearson Correlation
-.090
.050
.051
-.054
-.176**
.159*
.119
.081
-.012
Sig (2-tailed) .163 .438 .431 .399 .006 .013 .064 .212 .857 * Correlation is significant at the 0.05 level (2-tailed). ** Correlation is significant at the 0.01 level (2-tailed).
Years of Experience as a Principal to Time on Task Findings
In Part I of the survey, the respondents were asked to state their years of
experience as a principal. These responses were separated into categories based on five-
year increments for purposes of analyzing the data. The data revealed 36 principals with
0-5 years experience (14.9%), 80 principals with 5.5-10 years experience (33.1%), 56
principals with 11-15 years experience (23.1%), 22 principals with 16-20 years
experience (9.1%), 26 principals with 21-25 years experience (10.7%), and 22 principals
with over 26 years experience (9.1%). The relationship between the number of years of
experience as a principal and the principal’s time on task was analyzed using the
ANOVA, shown in Table 15, which yielded an F-value of 1.385 with a probability of
significance of 0.231, which was not statistically significant.
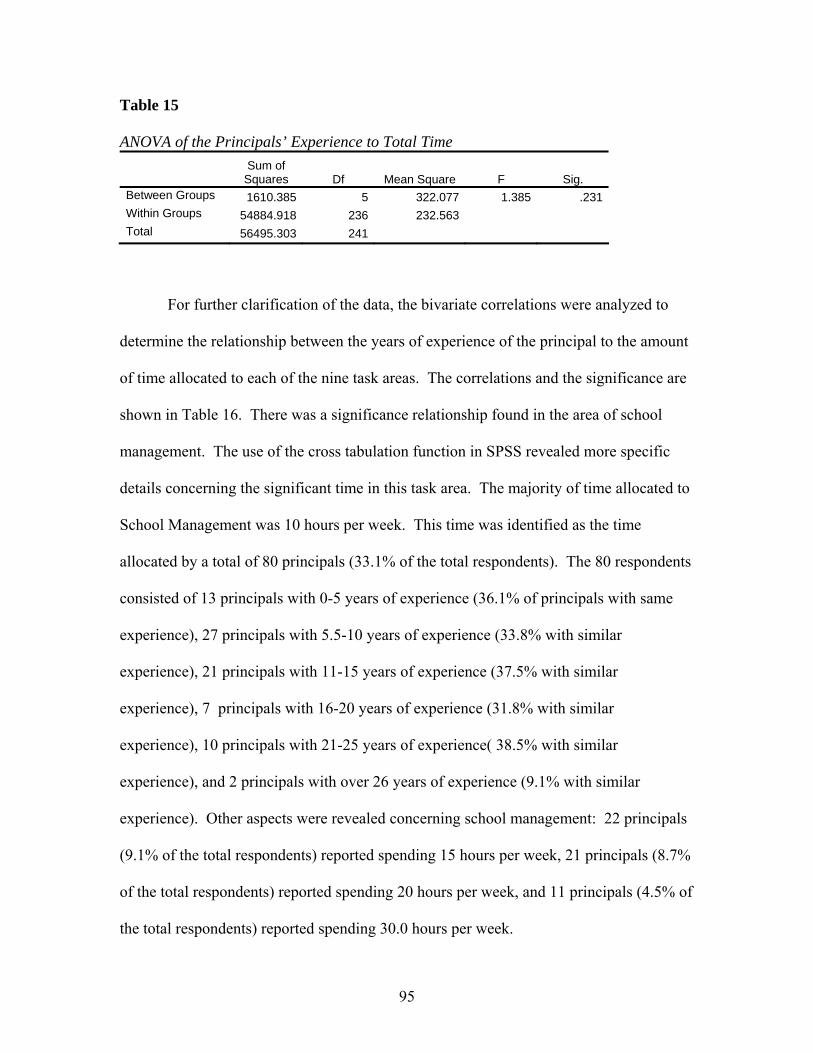
95
Table 15 ANOVA of the Principals’ Experience to Total Time
Sum of
Squares Df Mean Square F Sig. Between Groups 1610.385 5 322.077 1.385 .231 Within Groups 54884.918 236 232.563 Total 56495.303 241
For further clarification of the data, the bivariate correlations were analyzed to
determine the relationship between the years of experience of the principal to the amount
of time allocated to each of the nine task areas. The correlations and the significance are
shown in Table 16. There was a significance relationship found in the area of school
management. The use of the cross tabulation function in SPSS revealed more specific
details concerning the significant time in this task area. The majority of time allocated to
School Management was 10 hours per week. This time was identified as the time
allocated by a total of 80 principals (33.1% of the total respondents). The 80 respondents
consisted of 13 principals with 0-5 years of experience (36.1% of principals with same
experience), 27 principals with 5.5-10 years of experience (33.8% with similar
experience), 21 principals with 11-15 years of experience (37.5% with similar
experience), 7 principals with 16-20 years of experience (31.8% with similar
experience), 10 principals with 21-25 years of experience( 38.5% with similar
experience), and 2 principals with over 26 years of experience (9.1% with similar
experience). Other aspects were revealed concerning school management: 22 principals
(9.1% of the total respondents) reported spending 15 hours per week, 21 principals (8.7%
of the total respondents) reported spending 20 hours per week, and 11 principals (4.5% of
the total respondents) reported spending 30.0 hours per week.

96
There were no significant differences in the amount of time that administrators
allocated to tasks based on the years of administrative experience. Significant correlations
were found to exist in the area of School Management where principals reported
allocating 10 hours per week to this task area.
Table 16
Correlation of Principal’s Experience to Nine Task Areas School
Mangmnt Personnel Prog
Develop Student Activities
Student Behavior
Planning Commun Relations
District Office
Prof Devel
Pearson Correlation
.186**
.091
.001
.057
-.086
-.018
.098
.043
-.010
Sig (2-tailed) .004 .160 .991 .377 .182 .785 .128 .509 .873 * Correlation is significant at the 0.05 level (2-tailed). ** Correlation is significant at the 0.01 level (2-tailed). Level of Education of the Principal to Time on Task Findings
In Part I of the survey, the respondents were asked to state the highest level of
education that they have completed. These responses were categorized as master’s
degree, educational specialist (EDS), all but dissertation (ABD), or doctorate degree
(EDD/PHD). The data revealed 173 principals with master’s degrees (71.5%), 38
principals had obtained educational specialist degrees (15.7%), 5 principals were ABD
(2.1%), and 26 principals had obtained a doctorate degree (10.7%). The relationship
between the level of education of the principal and the principal’s time on task was
analyzed using the ANOVA, shown in Table 17, which yielded an F-value of 0.118 with
a probability of significance of 0.950, which was not statistically significant.
Table 17 ANOVA of Principals’ Education Level to Total Time
Sum of
Squares Df Mean
Square F Sig. Between Groups 83.856 3 27.952 .118 .950 Within Groups 56411.447 238 237.023 Total 56495.303 241

97
For further clarification of the data, the bivariate correlations were analyzed to
determine the relationship between the principal’s level of education to the amount of
time allocated to each of the nine task areas. The correlations and the significance are
shown in Table 18. There was a significant relationship found in the area of personnel.
Using the cross tabulation function in SPSS, the data revealed more specific details
concerning the significant time on this task area. The majority of time reported by 73
principals (30.2% of the total respondents) that was allocated to personnel was 10.0 hours
per week. This time was reported by 52 principals with master’s degrees (30.1% of
master’s degree principals), 10 principals with educational specialist degrees (26.3% of
educational specialist Degrees), 10 principals with PHD/EDDs (38.5% of the
PHD/EDDs), and 1 of the all but dissertation (ABD) principals (20% of the ABDs).
Other interesting facts emerged including: 30 principals (12.4% of the total respondents)
reported spending 15.0 hours per week, 24 principals (9.9% of the total respondents)
reported spending 20.0 hours per week, and 6 principals (2.5% of the total respondents)
reported spending 30.0 hours per week.
There were no significant differences in the amount of time that administrators
allocated to tasks based on the principal’s highest degree of educational level. Significant
correlations were found to exist in the area of personnel where principals reported that 10
hours per week were dedicated to this task area.

98
Table 18 Correlation of Principals’ Education Level to Nine Task Areas School
Mangmnt Personnel Prog
Develop Student Activities
Student Behavior
Planning Commun Relations
District Office
Prof Devel
Pearson Correlation
-.060
.205**
-.077
-.065
-.087
.063
.062
.031
.033
Sig (2-tailed) .352 .001 .234 .313 .175 .332 .336 .630 .609 * Correlation is significant at the 0.05 level (2-tailed). ** Correlation is significant at the 0.01 level (2-tailed). Q4: Do principals perceive the legislative and societal changes in the early 2000s to
have altered the amount of time allocated to administrative tasks?
In Part III of the survey, the respondents were asked to identify the changes in the
amount of time spent on any task area that requires a different amount of time now than it
did three years ago. The respondents were asked to estimate the change in time using the
categories: “significant decrease”, “slight decrease”, “no change”, “slight increase”, and
“significant increase.” Values were assigned for the responses: “-2” for “significant
decrease”, “-1” for “slight decrease”, “0” for “no change”, “1” for “slight increase”, and
“2” for “significant increase.” Frequency and percents were computed for each task
area. The results are reported in Table 19. The reported areas of “significant increase”
and “slight increase” were combined to be reported as “Increase” and the areas of
“Decrease” were similarly combined.

99
Table 19
Mean Percent of Principals’ Change in the Amount of Time in the Task Areas
Decrease No Change Increase
School Management 12.4% 28.1% 57.5%
Personnel 9.5% 23.6% 64.8%
Program Development 6.2% 27.7% 64.0%
Student Activities 10.4% 49.2% 38.4%
Student Behavior 29.3% 38.0% 30.6%
Planning 7.4% 29.8% 60.8%
Community Relations 7.0% 48.3% 42.5%
District Office 8.7% 50.4% 38.8%
Professional Development 10.3% 34.7% 52.9%
When analyzing the data for each task area, a comparison of the sum of the
percents of significant increase or slight increase revealed information about changes that
have occurred in the last three years. The task areas that follow had reported the of
increase for the last three year period: school management - 57.5%, personnel - 64.8%,
program development - 64%, student activities - 38.4%, student behavior - 30.6%,
planning – 60.8%, community relations- 42.5%, district office – 38.8%, and professional
development - 52.9%.
From this data, it would appear that almost all of the nine task areas have had an
increase in the amount of time being allocated to the areas. Four of the nine task areas
were indicated to have less than a 50% increase, but all nine areas exhibited increase of

100
time above 35%. Principals do not state that any of the task areas have a significant
decrease.
Q5: What legislative and societal issues in the early 2000s do principals perceive as
the reasons for any changes in the time allocated to tasks?
An open response question was included in the last part of the survey. In this
question, the respondents were asked to state what (if any) legislative or societal
conditions may have contributed to changes in their allocation of time on tasks. The
responses were summarized by the researcher utilizing regrouping, frequencies, and
means. Of the 242 respondents, 93 respondents chose not to respond to this question
along with 5 principals who had not been in the position long enough to discuss changes
since 2000. Many of the respondents listed multiple reasons for the changes in their time
in the nine task areas. To calculate the percent of the responses, 144 respondents were
considered as the total.
Several of the categories of responses are associated with the mandates of the No
Child Left Behind (NCLB) Act and will be included in the discussion of this category.
Seventy-two principals (50%) stated that the No Child Left Behind Act was a direct cause
of the increased amount of time being allocated to tasks. Along with this response,
Adequate Yearly Progress (13%), accountability (18.8%), Highly Qualified Teachers
(6.3%), and professional development (3.5%) were mentioned as having made an impact
on the time on task. All of these categories could be directly associated with NCLB and
its requirements.
Additionally, the following reasons and the corresponding percents were asserted
by the respondents as the cause for changes in the time on tasks: Specific state initiatives

101
(22.9%), increased paperwork (16.6%), parental or family issues (12.5%), special
education or IDEA (6.9%), Safe Schools (6.9%), funding (6.9%), and English as Second
Language (ESL) students (5.6%). A response from two (0.014%) of the principals
reported that their time on task had dramatically changed since the events of Hurricane
Katrina. This response merits mentioning since all schools can be impacted
tremendously by events not classified under the guise of societal or legislative impact.
Ancillary Findings
The McPeake Time Analysis Survey of Principals provided information on
the current demographics of principals in the 16 state region of the SREB. The study
revealed the results presented in Table 20. The majority of elementary principals are
females (60.6%), while the majority of principals were males in middle school (60.0%)
and in secondary schools (69.2%). This indicates the trend of more females being
employed in administrative positions and more females entering the ranks of secondary
school administration.
Table 20 Frequency of Gender in Relation to School Level School Level Elementary Middle High Total
Female 40 34 28 102Gender Male 26 51 63 140
Total 66 85 91 242
Summary
The analysis of the literature from the 1960s to the early 21st century revealed
bifurcation points in the time allocated to administrative tasks. One of the most
pronounced statistics was the consistent increase in the amount of time that principals

102
spent per week on the job from the 1960s to the 21st century. From the literature, the
mean of time dedicated to the job was 49.31 hours in the 1960s with a high of 61.1 in the
2000s. The current study found the mean time worked by principals to be 59.4 hours per
week.
Positive correlations were discovered in six of the seven demographic
characteristics in relation to the nine task areas. The six demographic characteristics that
had significant correlations were: gender, grade level, the number of students, the type of
community, the principals’ level of education, and the principals’ experience. The
following percent of respondents also reported that the task areas had an increase of time
for the last three year period: school management - 57.5%, personnel - 64.8%, program
development - 64%, student activities - 38.4%, student behavior - 30.6%, planning –
60.8%, community relations- 42.5%, district office – 38.8%, and professional
development - 52.9%. The open ended question to determine the societal and legislative
reasons for increase in the time on tasks indicated an agreement by 50% of the
respondents that NCLB mandates had impacted their daily activities.
The ancillary findings revealed the demographics of the population were 42%
female with the majority of principals in elementary schools being females (60.6%). The
study also determined an increase in the number of females employed as principals in
secondary schools.

103
CHAPTER FIVE
Summary, Discussion of Findings, and Recommendations
Chapter five includes a review of the population and sample, summary of the
purpose, conceptual framework, and a synthesis of the data collected from the literature
review and survey instrument. This chapter also includes an evaluation of the findings as
related to the review of the past literature from the 1960s to the current time period. The
implications, limitations, and recommendations for further study are also discussed.
Population and Sample
The population of this study (N=1950) consisted of principals in the 16 state
region that participates in the Southern Regional Education Board (SREB). The
McPeake Time on Task Analysis was distributed to 480 (n=480) principals in this 16 state
region. The principals were employed in an elementary, middle, high, or combination
public school and had more than two years experience as a school administrator. Of the
480 surveys, four were returned due to an incorrect mailing address or school closure,
and one was returned due to the school district policy restricting participation in research.
Finally, one survey was returned unanswered, apparently indicating the principal’s desire
not to participate in the study. After a second mailing four weeks after the initial mailing,
a total of 242 usable surveys were obtained. This established a return rate of 51.05%
which met the criteria determined as an acceptable response rate by Kerlinger and Lee
(1999).
Summary of the Purpose
The purpose of the study was to determine the effect that legislative and societal
changes have had on the tasks on which administrators focus their time. To understand

104
how these legislative and societal changes have affected the function of administrators,
the current responsibilities and tasks of educational administrators were examined in
relation to the historical responsibilities and tasks of school leaders. This information
provided data on the current time-on-tasks of school administrators to determine if recent
events and legislative mandates of the early 2000s have become a bifurcation point in
educational leadership. The time-on-task of the administrators were surveyed to
determine if changes have occurred to meet the demands of the current legislative
priorities and if any of the changes have a relationship to the demographic data collected.
The following research questions were utilized to guide this study:
1. Since the 1960s, what are the major historical bifurcation points marking the
changes in principals’ time on task that were brought about by political and
societal changes?
2. How do principals currently allocate their time on administrative tasks?
3. Are there significant relationships between selected demographic data and the
current amount of time being allocated to administrative tasks?
4. Do principals perceive the legislative and societal changes in the early 2000s to
have altered the amount of time allocated to administrative tasks?
5. What legislative and societal issues in the early 2000s do principals perceive as
the reasons for any changes in the time allocated to tasks?
Conceptual Framework
The conceptual framework of this study was transformational leadership which is
based on the concept of the leader being able to adapt and modify activities in order to
meet the demands of the ever-changing profession. The data from this current study

105
indicates that principals have increased the total amount of time being required to
accomplish the job. At the same time, principals have had to make decisions to modify
the amount of time that is allocated to each of the nine task areas. Effective,
transformational leaders must modify what they do on a daily basis to fully impact the
school (Lezotte, 1991; Leithwood, 1994). The research does support the theory that
principals follow the characteristics of a transformational leader due to the stringent and
ever-changing restrictions placed on the profession.
Summary of Findings and Conclusions
This section details the findings and conclusions of the current study. The
findings and conclusions in relation to each of the research questions will be summarized.
The results for (a) the qualitative analysis of the literature from 1960s to the 21st century
and (b) the quantitative results for the next four research question will be discussed.
Q1: Since the 1960s, what are the major historical bifurcation points marking the
changes in principals’ time on task that were brought about by political and societal
changes?
While an increase in time from the 1960s to 1970s is reflected in student activities
from 14.27% to 17.00%, there is also more time reported being dedicated to personnel
issues (22.67%) than in any other decade. The literature of that time period reflects that
many principals were impacted by the Education for all Handicapped Children Act of
1975.
In the 1980s, a significant increase in the amount of time spent in the area of
program development also became a major task area that had not even been considered in
previous literature. In this era, program development was reported as requiring 11.24%

106
of the time per week, the most hours reported during the time frame studied. Professional
development also showed a marked increase from the 1970s to an all time high of 6.2%
of the time per week. All of these increases could be attributed to references in the
literature of that time period to the Nation at Risk (1983) report.
The literature of the 1990s indicates the impact of the social crises of the era. The
literature of the 1990s reflects an increase in the amount of time spent on student
activities from 11.76% in 1980s to 16.73% in the 1990s, while a slighter increase in also
reflected in student behavior from 11.76% to 12.85%. Bifurcation points in the time
period are not apparent.
In the early 2000s, a change in almost all areas is recorded in the literature.
School management increased from the 1990s figure of 25.17% to 27.37%, student
activities increased from the previous decades 16.73% to 21.20%, and student behavior
increased from 12.85% to 15.46%. The task area of personnel also revealed an increase
from 14.33% to 16.77%. The only areas that showed a decrease were district office to
2.00%, program development to 5.67%, and professional development to 3.55%. Several
major legislative actions impacted the school system at the beginning of the 21st century.
The GOALS 2000: Educate America Act (Austin, 2004) and the No Child Left Behind
(NCLB) Act (NCLB, 2002) placed the responsibility of every child’s success directly on
the school and ultimately the school’s administrator. In addition to the legislative
influences, principals also faced the challenges of a more diverse ethnic and racial
population, an increase in the number of families at poverty level, and an increase in the
number of single parent households (NCES, 2006). Other factors influencing a
principal’s job included an increase in home-schooled children, an increase in the special

107
education regulations, an increase in required paperwork and documentation, and a
decrease in the number of qualified candidates entering the teaching field (DiPaola &
Tschannen-Moran, 2003; Kopkowski, 2006; NCES, 2006; Peoples, 2002; Phillips, 2001).
Therefore, bifurcation points appear to exist at the beginning of the 2000s decade.
The change in percent of time that principals allocate to tasks was also
demonstrated by the findings. The examination of the literature from the 1960s to the
21st century revealed the dramatic increase in the number of hours that principals work
every week to accomplish the variety of responsibilities. In the 1960s principals worked
an average of 49.31 hours per week. From that time period, there was a gradual increase
to the 1990s average of 52.8 hours per week, but the 21st century principal realized a
dramatic time increase on the job of 61.1 hours per week to accomplish their tasks as the
school leader. This data also supported the conclusion that legislative and social factors
of the 21st century appear to have created a major bifurcation point in administrative
history.
Q2: How do principals currently allocate their time on administrative tasks?
The total time on task was determined by summing the nine task areas plus the
area labeled as other activities. Principals reported a mean time on the job of 59.4 hours
per week. The greatest amount of time was reported in the area of school management
with a mean of 12.2 hours per week, while the least amount of time was reported to be
2.6 hours per week dedicated to the area of community relations. This finding suggests
that principals’ time on the job has become elevated to the maximum number of hours
that are available in a week to work.

108
These findings are in accord with the findings of Valentine, Clark, Hackman, and
Petzko (2002) that 48% of middle level of principals worked more than 60 hours per
week. Schiff (2001) also reported that high school principals spent an average of 62.2
hours per week. In the task areas, Valentine et al. (2002) also discovered that School
Management required the most time of principals and that the task area of personnel
required the second most dedication of time.
Q3: Are there significant relationships between selected demographic data and the
current amount of time being allocated to administrative tasks?
The relationships that exist between the dependent variables of the demographic
characteristics and the independent variables of the time on task measurement were
analyzed. ANOVAs and independent t-tests were used to investigate the selected
demographic characteristics with the total time on tasks, while the correlations were
evaluated to determine significant relationships between the demographic characteristics
and the time on each of the nine task areas.
Gender to Time on Task Findings
The respondents were composed of 102 females (42.1%) and 140 males (57.9%).
The independent t-test yielded an F-value of 3.524 with a probability of significance of
0.062, which was not statistically significant. This finding suggests that the gender of
the principal has no effect on the Total Time on the nine task areas. When the bivariate
correlation was analyzed to determine the relationship between the principal’s gender to
the amount of time allocated to each of the nine task areas. There were significance
relationships found in the areas of school management, personnel, program development,
and planning. These findings indicated significant correlation between gender and the

109
amount of time allocated to the four task areas mentioned. The negative correlation
suggested that more females were likely to allocate a greater amount of time to these
same areas of school management, personnel, program development, and planning.
The findings from the current study support Howell’s (1981) conclusion that, “the
bonds attaching principals to the office are growing stronger and stronger” (p. 334). In
respect to gender, Korporaal (1984) found significant differences were obtained when
time was compared with respect to gender. These findings agree with Schiff (2001) who
noted that women tended to spend more time on administrative activities than did men
(70 hours for females compared to 61 hours for males). The findings of the current study
agree with the findings of Cook (1998) who noted no differences in the amount of time
spent on tasks based on gender.
Age to Time on Task Findings
The ANOVA test yielded an F-value of 0.598 with a probability of significance of
0.617, which was not statistically significant. This finding suggests that the age of the
principal has no effect on the Total Time on the nine task areas. The bivariate
correlations were analyzed to determine the relationship between the demographic of
principals’ age to the amount of time allocated to each of the nine task areas. There was
no significance noted for any of the nine task areas. This finding suggests that there is no
correlation between the age of the principal and the amount of time allocated to each of
the nine task areas.
These findings support the studies done by Doud (1998) and Graham (1982) that
found no correlation between the principals’ age and the amount of time dedicated to the
nine task areas. The results of the current study do not agree with the findings of
110
Korporaal (1984) where significant differences were found with respect to elementary
principals’ age and the amount of time allocated to the task areas.
School Grade Levels to Time on Task Findings
The ANOVA yielded an F-value of 1.326 with a probability of significance of
0.268, which was not statistically significant. This finding suggests that the school grade
levels have no effect on the total time allocated by the principals. The bivariate
correlations were analyzed to determine the relationship between the school’s grade
levels to the amount of time allocated to each of the nine task areas. There were
significance relationships found in the areas of program development and student
activities. The majority of principals allocated 5 hours per week to program development
and 5 hours per week to student activities. These findings suggest there is a significant
correlation between principals’ school grade levels and the amount of time allocated to
the two task areas of program development and student activities.
These findings support the study done by Booth, Bradley, Flick, Keough, and
Kirk (1994). Booth et al. found that 62% of the principals reported spending more time
to maintain school’s programs than had been spent 5 years previously. Gaziel (1995)
also supported this study’s finding of a correlation of increased time on student activities
when he determined that both groups of principals in his study reported spending an
average of 13-16 hours extra during a 5-day school week.
Student Population to Time on Task Findings
The ANOVA yielded an F-value of 0.226 with a probability of significance of
0.968, which was not statistically significant. This finding suggests that the number of
students in the school has no effect on the total time allocated by the principals. The

111
bivariate correlations were analyzed to determine the relationship between the student
population to the amount of time allocated to each of the nine task areas. There were
significant relationships found in the areas of student behavior, planning, community
relations, and district office. The majority of time allocated to (a) student behavior was 5
hours per week, (b) planning ranged from 2-5 hours per week, (c) community relations
was 2 hours per week, and (d) district office task area was 2.0 hours per week. These
findings suggest there is a significant correlation between the student population and the
amount of time allocated to the task areas of student behavior, planning, community
relations, and district office. The negative correlation that was determined from the
findings indicated that as the size of the school population increased the amount of time
the principals allocated to student behavior actually decreased. This finding could be
attributed to the utilization of assistant principals in larger schools to handle student
behavior issues.
The findings of the current study agree with the findings of Cook (1998) and
Schiff (2001) who noted no differences in the amount of time spent on tasks based on the
size of the school enrollment. The task area where the data revealed a negative
correlation was in student behavior where the principals of larger schools reported less
time than principals in smaller schools. The time spent on the task area of community
relations of 2 hours corresponds to the data reported in the Pavan and Reid (1990) study
of principals. In the current study, the total amount of time dedicated to district office
tasks is 50% less than the time reported by Gordon (1996). Gordon studied Missouri
secondary school principals and determined their amount of time on district office tasks

112
was 3.9 hours per week. The time allocated to community relations in the Gordon study
was 1.9 hours which agrees with the finding of the current study.
Type of Community to Time on Task Findings
The ANOVA yielded an F-value of 0.278 with a probability of significance of
0.758, which was not statistically significant. This finding suggests that the type of
community has no effect on the total time allocated by the principals. The bivariate
correlations were analyzed to determine the relationship between the type of community
to the amount of time allocated to each of the nine task areas. There were significance
relationships found in the areas of student behavior and planning. The majority of
principals reported student behavior was allocated 5 hours per week and the task area of
planning was allocated 2 hours per week. These findings suggest there is a significant
correlation between the type of community and the amount of time allocated to the task
areas of student behavior and planning.
The findings of the current study agree with the findings of Cook (1998) who
noted no differences in the amount of time spent on tasks based on the type of community
in which the school is located. The current study indicates 5 hours of time dedicated to
student behavior and 2 hours of time allocated to planning, while the Ford and Bennett
(1994) study reported that Chicago urban principals indicated 10 hours of time per week
were dedicated to these task areas.
Years of Experience as a Principal to Time on Task Findings
The ANOVA yielded an F-value of 1.385 with a probability of significance of
0.231, which was not statistically significant. This finding suggests that the principals’
years of experience as an administrator has no effect on the total time allocated. The

113
bivariate correlations were analyzed to determine the relationship between the years of
experience of the principal to the amount of time allocated to each of the nine task areas.
There was a significance relationship found in the area of school management with 10
hours per week allocated. These findings suggest there is a significant correlation
between the principals’ years of experience and the amount of time allocated to the task
areas of school management.
The findings of the current study do not agree with the findings of Graham (1982)
who noted no significant correlations in the amount of time spent on tasks based on the
years of experience of the principal. The current study did find a significant correlation in
the task area of school management, although Korporaal (1984) found there were
significant differences in the estimated time compared to the years of experience. The
current study indicated 10 hours were allocated to school management which agrees with
the Ford and Bennett (1994) study that stated Chicago principals allocated10 hours of
time per week to school management.
Level of Education of the Principal to Time on Task Findings
The ANOVA yielded an F-value of 0.118 with a probability of significance of
0.950, which was not statistically significant. This finding suggests that the principals’
level of education has no effect on the total time allocated. The bivariate correlations
were analyzed to determine the relationship between the principal’s level of education to
the amount of time allocated to each of the nine task areas. There was a significant
relationship found in the area of personnel. The majority of time reported for the area of
personnel was 10.0 hours per week. These findings suggest there is a significant

114
correlation between the principals’ level of education and the amount of time allocated to
the task area of personnel.
The findings of the current study do not agree with the results from Graham
(1982) who found there was not a statistically significant correlation between the level of
the administrator’s education and the amount of time allocated to the task areas.
According to Cook (1998), principals with a bachelor’s degree, master’s degree, and
doctorate degree reported the most hours in a week were allocated to personnel. In the
Cook study, the only principal with a bachelor’s degree reported 3 hours per week, 152
principals with master’s degrees had a mean of 7.8 hours per week, 42 principals with
educational specialist degrees reported 6.76 hours per week, and 9 principals with
doctorate degrees reported a mean of 7.33 hours. This does reflect an increase in the
amount of time allocated to the personnel based on the level of education of the principal.
The summary of the data from the comparison of the demographic data to the total time
on task and to the nine individual task areas provided details on the status of principals.
Correlations were discovered in six of the seven demographic characteristics in relation
to the nine task areas: gender, grade level, student population, type of community, level
of education, and principals’ experience. The negative correlations supported that
principals of larger schools allocated less time to discipline and that females allocated
more time to personnel, school management, program development, and planning.
Q4: Do principals perceive the legislative and societal changes in the early 2000s to
have altered the amount of time allocated to administrative tasks?
The respondents were asked to identify the changes in the amount of time spent
on any task area compared to three years ago. Frequency and percents were computed

115
for each task area. A comparison of the percents of increase for the last three year period
indicated the following: school management - 57.5%, personnel - 64.8%, program
development - 64%, student activities - 38.4%, student behavior - 30.6%, planning –
60.8%, community relations- 42.5%, district office – 38.8%, and professional
development - 52.9%. These findings suggest that there has been a significant change in
the amount of time principals perceive is allocated to each task area.
These findings agree with Cook (1998), Ford and Bennett (1994), and Schiff
(2001) that principals continue to see increases in the amount of time required to do their
job. Schiff (2001) states that one of the principal’s most frustrating aspects of the job is
not enough time to get the job done. In the Doud (1989) ten-year study of the K-8
principals, the respondents were asked to state how their roles have changed in the five
years prior to the study. The selections for the Doud study were limited to “Increase”,
“No change”, or “Decrease”. The results were very similar to the current findings when
analyzing the response of “Increase”: building level authority/responsibility – 51.1%
increase, curriculum development – 52.4% increase, development of instructional
practices – 57.0% increase, fiscal decision making – 27.0% increase, personnel selection
– 29.2% increase, personnel evaluation – 60.5% increase, and participation in district
policy development – 26.6%.
Q5: What legislative and societal issues in the early 2000s do principals perceive as
the reasons for any changes in the time allocated to tasks?
The responses were summarized by the researcher utilizing regrouping, frequencies,
and means. To calculate the percent of the responses, 144 respondents were considered

116
as the total. Several of the categories of responses are associated with the mandates of
the No Child Left Behind (NCLB) Act and will be included in the discussion of this
legislative issue. Seventy-two principals (50%) stated that the No Child Left Behind Act
was a direct cause of the increased amount of time being allocated to tasks. Along with
this response, Adequate Yearly Progress (13%), accountability (18.8%), Highly Qualified
Teachers (6.3%), and professional development (3.5%) were mentioned as having made
an impact on the time on task. The following reasons and the corresponding percents
were asserted by the respondents as the cause for changes in the time on tasks: specific
state initiatives (22.9%), increased paperwork (16.6%), parental or family issues (12.5%),
special education or IDEA (6.9%), Safe Schools (6.9%), funding (6.9%), and English as
Second Language (ESL) students (5.6%). These findings suggest that the No Child Left
Behind Act has significantly impacted the principals’ time on task and can be viewed as a
bifurcation point in educational administration.
These findings agree with the results of Doud (1989) who found that 20% of the
principals reported that “unsatisfactory student performance” was a major concern.
Twenty percent of the principals surveyed listed the four major problems that could
impact the profession as (a) providing programs for underachievers, (b) coping with state
regulations and initiatives, (c) meshing instruction with special academic programs, and
(d) involving parents in schools. Principals in Chicago urban schools reported that
activities which resulted from school reform were the most taxing and time intensive
(Ford & Bennett, 1994). Milyard (2005) had 105 out of 180 surveys of New Mexico
principals returned with written comments added to the survey. These comments were
categorized into 10 major themes that resulted in changes in the time allocated to task

117
areas. The resulting concerns of these elementary principals support the findings of the
current study. The common themes of the Milyard study were (a) poor design of the
accountability system (37.1%), (b) negative effects of testing and rating on minorities
(18.1%), and (c) the limited scope of testing and using only one measurement (15.2%).
Ancillary Demographic Findings
The study revealed the majority of elementary principals are females (60.6%),
while the majority of principals were males in middle school (60.0%) and in secondary
schools (69.2%). This continues to support the trend of more females being placed in
administrative positions and more females entering the ranks of secondary school
administration.
In the Schiff study (2001), the secondary principals were 20% females and 80%
males. This compares to the Doud (1989) study of K-8 principals which found 20.2%
females and 79.8% males. DiPaola and Tschannen-Moran (2003) utilized a mail survey
with 1543 respondents to determine the demographics of principals in the state of
Virginia. Their sample was almost evenly mixed between women (51%) and men (49%).
Elementary principals were 62% women and 38% men, while middle school principals
were 62% men and 38% women. High school principals in this 1989 study numbered
71% men and 29% women. This increase in the number of women entering the
administrative profession was supported by the results of the current study. The current
study determined that of the 66 elementary respondents, 60.6% were females and 39.4%
were males. The current study also noted that the 85 middle level principals were
composed of 40% females and 60% males. A similar finding for the 91 secondary
principals reflected 30.8% females and 69.2% males.

118
Summary
Regardless of the demographic characteristics, commonalities of the principal’s
responsibilities transcend decades of changes. Current principals indicated their time on
task had continued to expand to the limits of available hours that can be worked in a
week. This continuous expansion of the roles and responsibilities of school
administrators must be examined for the survival of the profession. The complexity of
the profession must be recognized and these professionals must be offered assistance in
the quest to provide quality education for all students.
The analysis of the literature from the 1960s to the 21st century revealed bifurcation
points in the time allocated to administrative tasks. One of the most pronounced findings
was the consistent increase in the total amount of time that principals spend per week
from the 1960s to 2007. Bifurcation points in educational administration were identified
as occurring in the 1970s, 1980s, and early 2000s. The literature review demonstrated
the mean time dedicated to the job was 49.31 hours in the 1960s and had risen to 61.1
hours in the early 2000s. The current study found the mean time worked by principals to
be 60.3 hours per week. Positive correlations were discovered in six of the seven
demographic characteristics in relation to the nine task areas: gender, grade level, student
population, type of community, level of education, and principals’ experience. The
percent of increase in time for the last three year period was: school management -
57.5%, personnel - 64.8%, program development - 64%, student activities - 38.4%,
student behavior - 30.6%, planning – 60.8%, community relations- 42.5%, district office
– 38.8%, and professional development - 52.9%. Fifty percent of the respondents pointed
to the mandates of No Child Left Behind as a cause for the increase in time on task. In

119
this study, 60.6% of the elementary respondents were females, while 60% of the 85
middle level principals and 69.2% of the 91 secondary principals were male.
Implications
This study has implications for theory and future research in educational
leadership. This section is based on the insights gained through the research involved in
this study. The researcher suggests the following implications to superintendents, boards
of education, school district leadership, and fellow administrators.
Due to the increasing demands on principals, district and state officials should
provide more staff development to assist principals in acquiring time management skills.
Even more experienced principals should be provided with ongoing professional
development to assist in the time management of the increased responsibilities associated
with the accountability of federal legislation and societal issues.
As evidenced by the Kentucky State Action for Educational Leadership (SAELP,
2003), school administrators can be assisted by hiring designated building managers to
handle managerial duties. The designated building managers will allow principals to
concentrate on the mandates of school improvement and the critical instructional
components of curriculum and personnel.
Additionally, more time should be built into the school calendar to provide
principals designated time to interact with school personnel. This extra time is essential
for the administrator to perform a quality job with the school staff. This designated time
would allow for interactions without the constant interruptions that occur in an

120
administrator’s job. This would also allow for staff development to in-service teachers
on the constantly changing regulations and policies.
Principal preparation programs should be designed to include opportunity for
observation of principals’ time on task. The programs should recognize the need for
potential principals to develop the skills to prioritize and plan for the many functions that
will be performed as the school leader. Higher education can utilize the data from this
study to expand the current programs to include components to meet the needs of these
professionals.
Policy makers and legislators are provided evidence of the influence of their
actions on the professional responsibilities of educational administrators. Many times
those who enact educational legislation are not aware of the actual effect of their actions
on the daily functions of those involved in the school setting. The data may assist policy
makers in justifying an increase in support services for school administrators.
Recommendations for Further Research
Based on the findings of this study, the following recommendations are made for
further research:
1. Implementation of a longitudinal study to document principals’ time on task at the
various times of the school year.
2. Construction of a time analysis study to directly observe and classify the
principals’ time on task.
3. Expansion of the study to include all fifty states and to continue this study of
inclusion of all grade levels of schools.

121
4. Expansion of this study to include private schools at all grade levels.
5. Investigation of principals’ time on task at schools that did meet AYP compared to
schools that did not meet AYP.
6. Examination of principals’ time on task based on other demographic
characteristics (ethnicity of the school population, length of school year, socio-
economic status).
7. Replication of this study of principals’ time on task after the modifications to No
Child Left Behind Act or the enactment of other legislative mandates.
8. Investigation of principals’ time on task after societal changes that may occur in
the next decade.
9. Implementation of a study with quantitative and qualitative designs to investigate
the amount of time that principals dedicate to administrative tasks.

122
REFERENCES
Austin, T. (2004). Goals 2000- The Clinton Administration Education Program. History
of American Education Web Project, University of Notre Dame. Retrieved on
August 5, 2006, from http://www.nd.edu/~rbarger/www7/goals200.html
Bainbridge, W. (1990). School choice: the education issue of the 1990s. The
SchoolMatch Guide to Public Schools. New York: Simon and Schuster
Consumer Group.
Balsamo, M.A. (2004). Assessing principal practices in a standards-based environment
and examining the association between principal practices and student
achievement. (Doctoral dissertation, The University of Rochester, 2004).
Dissertation Abstracts International, 65(12).
Bass, B., & Avioli, B. (1994). Improving organizational effectiveness through
transformational leadership. Thousand Oaks, CA: Sage.
Bayliss-Heerschop, C. (2004). Federal aid to education. History of American Education
Web Project, University of Notre Dame. Retrieved on August 5, 2006, from
http://www.nd.edu/~rbarger/www7/fedaid.html
Beck, L., & Murphy, J. (1993). Understanding the principalship: Metaphorical themes.
1920s-1990s. New York: Teachers College Press.
Blair, D. (2001). Principals' leadership styles, school ratings, and principals' time spent
on instructional leadership and management tasks in Texas. Doctoral Dissertation
for Sam Houston State University. Retrieved January 22, 2006, from ProQuest
(AAT 3059689).
Bifurcation points. (2006). Retrieved June 11, 2006, from

123
http://the-bifurcation-point.blogspot.com/
Boothe, J., Bradley, L., Flick, T., Keough, K., & Kirk, S. (1994, Feb). This working life.
The Executive Educator, 16(2). 39-42.
Brown Foundation. (2006). Brown vs. Board of Education – Background summary.
Retrieved August 3, 2006, from http://brownvboard.org/summary/
Burns, J. M. (1978). Leadership. New York: Harper & Row.
Byrne, D., Hines, S., & McCleary, L. (1978). The senior high school principalship.
Volume I: The national survey. Reston, VA: National Association of Secondary
School Principals.
Cardinal Principles of Secondary Education. (1928). A Report of the Commission on
the Reorganization of Secondary Education. Department of the Interior, Bureau
of Education, Bulletin 1918, No. 35. Washington, DC: Government Printing
Office. Retrieved August 3, 2006, from http://tmh.floonet./articles/cardprin.html
Carr, J. (1987). Effects of structural complexity on administrative role demands. Paper
presented at the Annual Meeting of the American Educational Research
Association (Washington, DC, April 20-24, 1987). (ED283280)
Christensen, M. (2002). Effective Comprehensive High School Administration Teams.
Dissertation Abstracts International, 63, 06A, 2054.
Cook, D. (1998). Time-on-task responsibilities of the elementary school principal.
(Doctoral Dissertation, University of South Dakota, 1998). (UMI No. 9946681)
Copland, M. (2001). The myth of the superprincipal. Phi Delta Kappan, 82(7), 528-
562.
Cremin, L. (1990). Popular education and its discontents. New York: Harper & Row.

124
Day, C. (2000). Beyond transformational leadership. Educational Leadership, 57(7).
56-59.
DiPaola, M., & Tschannen-Moran, M. (2003). The principalship at a crossroads: A
study of the conditions and concerns of principals. NASSP Bulletin, 87, 43-65.
Doud, J. (1989). The K-8 Principal in 1988. Alexandria, VA: National Association of
Elementary School Principals.
Doud, J., & Keller, E. (1998). The K-8 Principal in 1998: A ten-year study. Alexandria,
VA: National Association of Elementary School Principals.
Drake, T., & Roe, W. (1999). The Principalship. (5th ed.). Upper Saddle River, NJ:
Prentice-Hall.
Drue, J. (1981). The high school principalship in Michigan from 1960-1980.
Dissertation Abstracts International, 42, 11A, 4663.
Edmonds, R. (1982). Programs of school improvement: An overview. Educational
Leadership, 40(3), 4-11. Retrieved May 7, 2006, from
http://ezproxy.marshall.edu:2292/DeliveryPrintSave
EdSource Report. (1998, March). California’s school principals: At the center of
school improvement efforts. Palo Alto, CA: Author.
Educational Research Service. (2000). The Principal, Keystone of a high achieving
school: Attracting and keeping leaders we need. Report produced in cooperation
with National Association of Elementary School Principals and the National
Association of Secondary School Principals. Arlington, VA: Author.

125
Farkas, S., Johnson, J., & Duffett, A. (2003). Rolling up their sleeves: Superintendents
and principals talk about what’s needed to improve public schools. A report from
Public Agenda for the Wallace Foundation. New York: Public Agenda.
Ferrandino, V. & Tirozzi, G. (2000). Principals may get a share of the pie: Our time
has come. Reston, VA: National Association of Secondary School Principals.
Retrieved on May 1, 2000, from
http://nassp.org/press_releases/prns_get_shr_tir.htm
Fink, A. (2003). How to sample in surveys. (2nd ed.) Volume 7 in The Survey Kit.
Thousand Oaks, CA: Sage Publications.
Ford, D. & Bennett, A. (1994). The changing principalship in Chicago. Education and
the Urban Society, 26(3). 238-247.
Gaziel, H. (1995). Managerial work patterns of principals at high- and average-
performing Israeli elementary schools. The Elementary School Journal, 96(2).
179-194.
Georgia State Department of Education. (August 1974). Results Oriented Management
in Education: Project Rome. Identification and development of competencies of
building level administrators of Greater Lomas County, Georgia. Urbana, Ill.
(ERIC ED 105 558)
Graham, W. (1982). The relationship between student achievement and principals’ time-
on-task in instructional leadership roles. Dissertation Abstracts International,
43(03). (UMI No. 8217227)

126
Gordon, R. (1996). Relationships among secondary principal use of time, principal
effectiveness, and student achievement. (Doctoral Dissertation, University of
Missouri, 1996). (UMI No. 9812950)
Gorton, R., & McIntyre, K. (1978). The effective principal/The senior high school
principalship, Vol. 2. Reston, VA: National Association of Secondary School
Principals.
Goodwin, R. (2002). On the edge of chaos: A Delphi study of the changing role of the
secondary principal. (Doctoral Dissertation, West Virginia University, 2002).
(UMI No. 3055917)
Guideline. (2006). Interactive sample calculator. Retrieved on August 20, 2006, from
http://www.guideline.com/capabilities/market-research/calculator.html
Haddock, A. (1961). A study of time utilization by Oregon elementary school principals
and a criterion for time apportionment. Dissertation Abstracts International,
22(05). (UMI No. 6104515)
Hardon, J. (1962). Moral and Spiritual Values in Public Education. Speech
Delivered at Communion Breakfast of Catholic Teachers Association of
Diocese of Brooklyn, May 5, 1962. Retrieved May 7, 2006, from
http://www.therealpresence.org/archives/Education/Education_003.htm
Howell, B. (1981, Jan). Profile of the principalship. Educational Leadership, 38(4), 333-
336.
Hoy, W., & Miskel, C. (1996). Educational administration: Theory, research, and
practice. New York: McGraw-Hill, Inc.

127
Hull, P. I. (2005). Closing the achievement gap: A model for successful principal
leadership in impoverished schools. Dissertation Abstracts International, 66(06).
(UMI No. 318044).
International Information Programs. (November 2005). Outline of U. S. history,
Decades of Change: 1960-1980. Retrieved August 6, 2006, from
http://usinfo.state.gov/products/pubs/histryotln/decades.htm
Johnston, J. (1974). A study of time spent on administrative tasks in year-round schools
by elementary principals. (Doctoral Dissertation, Virginia Polytechnic Institute
and State University, 1974). (UMI No. 83266).
Kearney, K. (2005). Guiding improvements in principal performance. Leadership,
35(1). 18-21.
Kellogg, S. (2005). Principals’ organizational activities: An analysis of the differences
between actual and ideal time expenditures as a function of career stage.
Dissertation Abstracts International, 66(11). (UMI No. 3195524)
Kennedy, C. (Sept/Oct 2002). The principalship: Too much for one person? National
Association of Elementary School Principals, 82(1). 28-31. Retrieved July 23,
2006, from http://www.naesp.org/ContentLoad.do?contendId=814&action=print
King, D. (2002). The changing shape of leadership. Educational Leadership, 59(8),
61-64.
Kerlinger, F., & Lee, H. (1999). Foundations of behavior research. (4th ed.)
Philadelphia: Harcourt College Publishers.
Kopkowski, C. (September 2006). Then and now. NEA Today, 25(1), 24-29.
Korporaal, A. (1984). The tasks and functions of the elementary school principal.

128
Dissertation Abstracts International, 45(07). (UMI No. AAT 0554734).
Leithwood, K. (1992). The move toward transformational leadership. Educational
Leadership, 49(5), 8-12.
Leithwood, K. (1994). Leadership for school restructuring. Educational Administration
Quarterly, 30(4), 498-518.
Leithwood, K., & Earl, L. (2000). Educational accountability effects: An international
perspective. Peabody Journal of Education, 75(4), 1-18.
Lehman, L. (1980). Interaction patterns and tasks of effective elementary school
principals. Dissertation Abstracts International, 41(04). (UMI No. 8022712).
Lezotte, L. (1991). Correlates of effective schools: The first and second
generation. Okemos, MI: Effective Schools Products, Ltd.
Marzano, R., Waters, T., & McNulty, B. (2005). School Leadership that Works:
From Research to Results. Alexandria, Va.: Association for Supervision and
Curriculum Development.
Milyard, C. (2001). New Mexico elementary principals: Opinions on high-stakes
testing, perceptions of time spent on instructional leadership functions, and the
relationship to the New Mexico accountability rating system. Dissertation
Abstracts International, 62(03). (UMI No. 3008945).
Modern Period of Education. (2006). History of education web project.
University of Notre Dame. Retrieved on August 5, 2006, from
http://www.nd.edu/~rbarger/www7/mod.html
Morrow, T. (1993). A study of Missouri secondary school principals’ time usage.
(Educational Specialist Thesis, Northeast Missouri State University).

129
Murphy, J. (1983). Instructional Leadership: A conceptual framework. Planning and
Changing, 14, 137-149.
Murphy, L. (2005, March). Transformational leadership: a cascading chain reaction.
Journal of Nursing Management, 13(2). 128-136.
National Center for Education Statistics. (2006). The condition of education. Indicator
list. Retrieved on September 6, 2006, from http://nces.ed.gov/programs/coe/
National Center for Education Statistics. (2005). Section 1: Elementary and Secondary
Enrollment, Projections of Education Statistics to 2014. Retrieved January 15,
2006, from http://nces.ed.gov/programs/projections/ch_1.asp
National Center for Education Statistics. (1995). Public and private school principals in
the United States: A statistical profile, 1987-88 to 1993-94. Washington, DC:
U.S. Department of Education, Office of Educational Research and Improvement.
Retrieved January 29, 2001, from http://nces.ed.gov/pubs/ppsp/97455-0.html
National Commission on Excellence in Education. (1983, April). A nation at risk: The
imperative for education reform. A report to the Nation and the Secretary of
Education United States Department of Education. Retrieved June 21, 2006, from
http://www.ed.gov/pubs/NatAtRisk/index.html
National Education Association. (1968 April). The elementary school principalship in
1968…a research study. Washington, DC: Department of Elementary School
Principals.
North Central Regional Educational Laboratory (NCREL). (August 2003). Survey of
principals in the midwest. Retrieved May 10, 2006, from
http://www.ncrel.org/policy/pubs/html/pivol14/aug2003d.htm

130
Nutto, O. (1960). The administrative (including clerical) duties of an elementary
principal: Theory and practice in Newark, New Jersey. (Doctoral dissertation,
Kean University, 1960). (UMI No. EP11493).
Payne, S. (2004). Public Law 94-142. History of American Education Web Project,
University of Notre Dame. Retrieved on August 5, 2006, from
http://www.nd.edu/~rbarger/www7/p194-142.html
Pellicer, L., Anderson, L., Keefe, J., Kelley, E., & McCleary, L. (1988). High school
leaders and their schools. Volume I: A national profile. Reston, VA: National
Association of Secondary School Principals.
Pharis, W., & Zakariya, S. (1979). The elementary school principalship in 1978: A
research study. Arlington, VA: National Association of Elementary School
Principals.
Peoples, B. (2001). Going home to school. Crisis (The New), 108(5), 10-12.
Phillips, S. (2002). Paltry pay raises turn off recruits. Times Educational Supplement,
Issue 4477, 20.
Phillips, S. (2006). Trained for boom in terror industry. Times Educational Supplement,
Issue 4695, 14.
Project Leadership. (1983). Time Analysis: Managing Brevity, Variety, and
Fragmentation. A Presenter’s Guide. Association of California School
Administrators: Author.
Pulliam, J. (1991). History of education in America. (5th ed.). New York: Merrill, an
Imprint of Macmillan Publishing Company.
Rayfield, R., & Diamantes, T. (2004, Sept.). An analysis of administrator attitudes

131
toward tasks in school administration. Journal of Instructional Psychology, 31(3),
253-256.
Rock, D., & Hemphill, J. (1966). Report of the junior high-school principalship. The
study of the secondary school principalship. Reston, VA: National Association
of Secondary School Principals.
Rutherford, F. (1998). Reflecting on Sputnik: Linking the past, present, and future of
educational reform. A symposium hosted by the Center for Science,
Mathematics, and Engineering Foundation. Retrieved on August 5, 2006, from
http://www.nas.edu/sputnik/ruther1.htm
Salkind, N. (2004). Statistics for people who (think they) hate statistics. Thousand Oaks,
CA: Sage Publications, Inc.
Scherer, M. (2004). A nation at risk: The imperative for educational reform, 1983.
History of American Education Web Project, University of Notre Dame.
Retrieved on August 5, 2006, from
http://www.nd.edu/~rbarger/www7/nationrs.html
Schiff, T. (2001). Priorities and barriers in high school leadership: A survey of
principals. Reston, VA: National Association of Secondary School Principals.
Schugurensky, D. (2006). History of education: Selected moments of the 20th century.
Retrieved on August 5, 2006, from
http://fcis.oise.utoronto.ca/~daniel_schugurensky/assignment1/sigevents50.html
Sergiovanni, T. (2001). The principalship: A reflective practice perspective. Boston:
Allyn and Bacon.
132
Shellinger, M. (2005). Alternative School Administration Study. Online submission of r
report prepared for the Wallace Foundation. (ERIC No. ED490688)
Southern Regional Education Board. (2006). Challenge to lead. Retrieved on June 24,
2006, from http://www.sreb.org/
State Action for Educational Leadership Project (SAELP): Principals’ Job-Time
Analysis. (2003). Retrieved on February 12, 2006, from www.education.ky.gov
Smith, W., & Andrews, R. (1989). Instructional Leadership: How Principals Make
A Difference. Alexandria, Va.: Association for Supervision and Curriculum
Development.
Swanson, C., & Chaplin, D. (2003). Counting high school graduates when graduates
count: Measuring graduation rates under the high stakes of NCLB. Education
Policy Center, The Urban Institute. Paper presented at the National Economic
Association on January 3, 2003. Washington, DC.
Stronge, J. (1998). Leadership skills in school and business. The School Administrator,
55(9), 21-26.
Telem, M., & Buvitski, T. (1995, Spring). The potential impact of information
technology on the high school principal: a preliminary exploration. Journal of
Research on Computing in Education, 27(3). 281-297.
Texas Education Agency. (2001). Accountability standards for 2001. Retrieved October
2, 2006, from
http://www.tea.state.tx.us/perfreport/account/2001/manual/sec03.html
Tyack, D., & Hansot, E. (1982). Managers of virtue: Public school leadership in
America, 1920-1980. New York: Basic Books.

133
United States Department of Education. (2006). No child left behind. Retrieved on
August 20, 2006, from http://www.ed.gov/nclb/landing.jhtml
Valentine, J., Clark, D., Hackmann, D., & Petzko, V. (2002). A national study of
leadership in middle level schools. Volume I: A national study of middle level
leaders and school programs. Reston, VA: National Association of Secondary
School Principals.
Valentine, J., Clark, D., Irving, J., Keefe, J., & Melton, G. (1993). Leadership in middle
level education. Volume I: A national survey of middle level leaders and
schools. Reston, VA: National Association of Secondary School Principals.
West Virginia Department of Education. (2006). Statewide assessment program.
Retrieved on August 20, 2006, from http://wvde.state.wv.us/policies/p2340.html
Westheimer, J. (April 2006). Patriotism and education. Phi Delta Kappan, 87(8), 569-
575.
Whitely, P. (2006). American Cultural History, 1980-1989. Internet site prepared for
Kingwood College Library. Retrieved August 4, 2006, from
http://kclibrary.nhmccd.edu/decade80.html
Winfield, S., Hill, C., & Burns, R. (1959). The Great Debate: Our Schools in Crises.
Upper Saddle River, NJ: Prentice Hall.
Yamada, A. (2000). Elementary school principals’ perceptions of responsibilities and
competencies for instructional leadership. Dissertation Abstracts International,
61(10). (UMI No. 9988324).

134
Zirkes, M. (1987). The high school principalship including a comparison with the
elementary and middle school principalships. Dissertation Abstracts
International, 48(07). (UMI No. 8721188).

135
Appendices

136
Appendix A
McPeake Time Analysis Survey

137
Time Analysis Survey of Principals The following questions concerning your personal and school information are to allow a more complete assessment of the status of administrators.
PART I – Personal Data Please indicate the following information related to you personally: (answer N/A if appropriate) 1 Sex: _________________
2 Year of Birth: ____________
3 Total years of professional experience in education: ___________ yrs
4 Number of years of experience as a classroom teacher ___________ yrs
5 Number of years of experience as a guidance counselor ___________ yrs
6 Number of years of experience as an assistant principal ___________ yrs
7 Number of years of experience as a principal ___________ yrs
8 Number of years of experience as other professional ___________ yrs
9 Highest level of educational attainment _____________________
___
PART II – School Data
Please indicate the following information related to your school:
10 Grade levels attending your school: _________ -- __________
11 Total school student enrollment: ___________ students
12 Percent of students receiving free and reduced lunch: ________ %
13 How many other administrative positions does your school have? __________
14 How many assistant principals does your school have? ________
15 How many deans does your school have? ___________
16 How many counselors does your school have? _________
17
How many athletic directors does your school have (not counted as an AP above)?
_____________
18
Would you classify your school attendance area as: Rural □ Urban
□
Suburban
□

138
PART III – School Classifications
Please indicate the following information related to your school’s classifications:
(Check all that apply)
1
9
Title I □
2
0
Exemplary □
2
1
School of Excellence □
2
2
Meeting Adequate Yearly Progress □
2
3
List any other relevant classifications. _______________________________________________
_________
PART IV - Task Analysis Please estimate the number of hours that you spend on each activity during a typical week. Due to the nature of your job, it is understood that you may work more than 40 hours per week.
TASK AREAS HOURS Per Week
24
School Management (Office duties, building maintenance, budget finance, etc.)
2
5
Personnel (Supervision, evaluations, staff development discussions, grievances, etc)
2
6
Program Development (Scheduling, planning, selecting materials,
testing/evaluation, lesson plans)
2
7
Student Activities (Athletics, supervision {lunch, yard, bus}, programs, plays,
field trips, etc)
2
8
Student Behavior (Discipline, parent conferences, Informal visits, counseling, etc)
2
9
Planning (County and district planning sessions, department meetings, curriculum
meetings, etc)
3
0
Community Relations (Civic organizations, media discussions, PTO, parent groups)
3
1
District Office (District meetings, meetings with supervisors, principal meetings,
etc)
3
2
Professional Development (Conferences, Self-improvement planning, Professional
readings)
3
3
Specify Any Other Activities:

139
PART V– Changes in Administrative Time The nine task areas of administrative responsibility are listed. Please judge whether your time on the task has shown any change over the last three years. Please check the most appropriate description to classify the amount of change in the time spent on each area.
Task Areas Change in Time Spent
Sign
ifica
nt
Dec
reas
e
Slig
ht
Dec
reas
e
No
chan
ge
Slig
ht
Incr
ease
Sign
ifica
nt
Incr
ease
School Management □ □ □ □ □ Personnel □ □ □ □ □ Program Development □ □ □ □ □ Student Activities □ □ □ □ □ Student Behavior □ □ □ □ □ Planning □ □ □ □ □ Community Relations □ □ □ □ □ District Office □ □ □ □ □ Professional
Development □ □ □ □ □
In the last 3 years, what (if any) legislative initiatives and/or societal conditions have contributed to changes in your time allocation to tasks?
Please return to: Jacquie McPeake at Woodrow Wilson High School, 400 Stanaford Road, Beckley WV 25801.

140
Appendix B
Cover Letter: First Mailing

141

142
Appendix C
Cover Letter: Follow Up Mailing

143

144
Appendix D
Sampling Calculation Based on
Elementary School Numbers in Each State

145
Appendix D
Calculation of the Number of Schools to Survey
State Elementary schools % Total Sample sizeNo.in random
sample Alabama 611 4 160 7 Arkansas 553 3.4 160 6 Delaware 92 0.006 160 1 Florida 1632 10.2 160 16 Georgia 1232 7.7 160 12 Kentucky 794 5 160 8 Louisiana 710 4.4 160 7 Maryland 826 5.2 160 8 Mississippi 427 2.6 160 4 North Carolina 1240 7.8 160 13 Oklahoma 1009 6.3 160 10 South Carolina 573 3.6 160 6 Tennessee 904 5.7 160 9 Texas 3789 23.8 160 38 Virginia 1110 7 160 11 West Virginia 431 2.7 160 4 Total 15933 160

146
CURRICULUM VITAE
JACQUELINE ANN MCPEAKE [email protected]
Education Marshall University Graduate College, Charleston, WV
Doctor of Education in Educational Leadership, 2007 Marshall University Graduate College, Charleston, WV
Educational Specialist in Leadership Studies, 2006 West Virginia Graduate College, Institute, WV
Master’s Degree Educational Leadership, 1996 Fairmont State College, Fairmont, WV
Bachelor of Arts in Secondary Education, Majors: Mathematics and Social Studies Comprehensive, 1979
Woodrow Wilson High School, Beckley, WV, 1976 Experience
2001- Present Assistant Principal, Woodrow Wilson High School, Beckley, WV 2004- Present Part Time Faculty, Marshall University Graduate College, South Charleston, WV 1999 – 2001 Principal, Piney View Elementary, Piney View, WV 1995 – 1999 Mathematics Teacher, Independence High School, Coal City, WV 1990 – 1995 Mathematics Teacher, Woodrow Wilson High, Beckley, WV Honors
Gertrude Roberts Scholarship Recipient, Kappa Delta Gamma State Scholarship, 2005 Independence High School Teacher of the Year, 1999 Raleigh County Teacher of the Year, 1999