The prediction of one-, two-, and three-dimensional heave in expansive soils
25
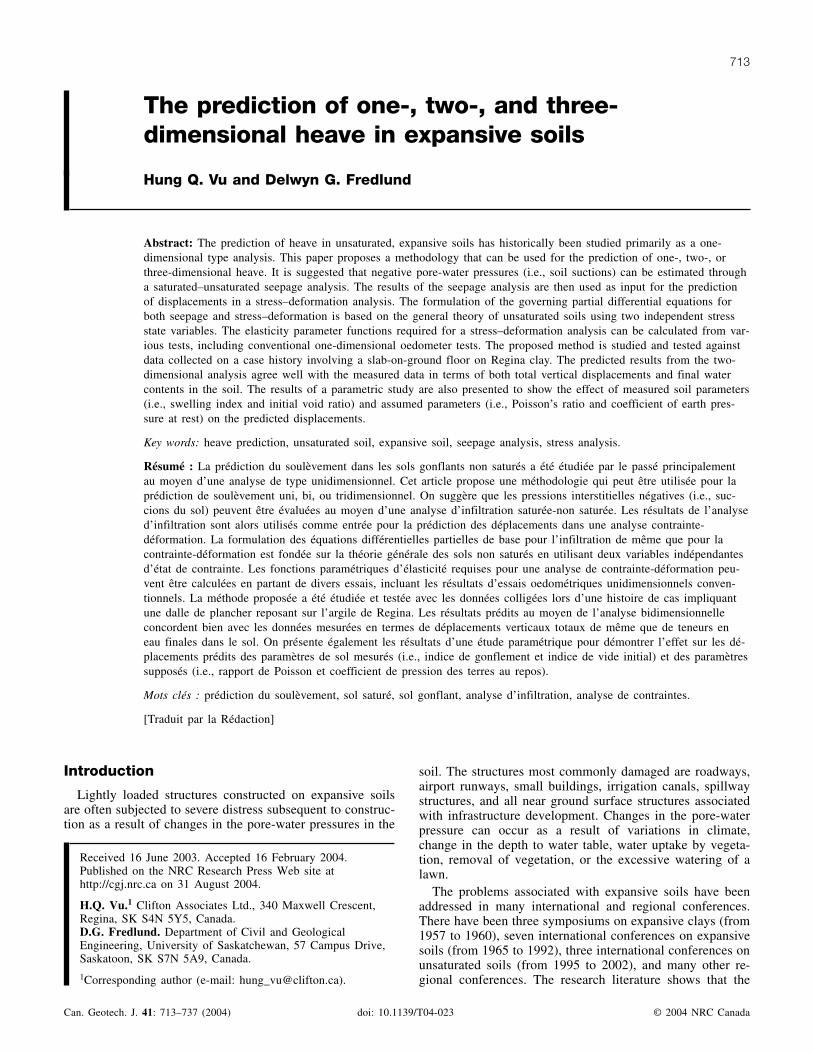
The prediction of one-, two-, and three- dimensional heave in expansive soils Hung Q. Vu and Delwyn G. Fredlund Abstract: The prediction of heave in unsaturated, expansive soils has historically been studied primarily as a one- dimensional type analysis. This paper proposes a methodology that can be used for the prediction of one-, two-, or three-dimensional heave. It is suggested that negative pore-water pressures (i.e., soil suctions) can be estimated through a saturated–unsaturated seepage analysis. The results of the seepage analysis are then used as input for the prediction of displacements in a stress–deformation analysis. The formulation of the governing partial differential equations for both seepage and stress–deformation is based on the general theory of unsaturated soils using two independent stress state variables. The elasticity parameter functions required for a stress–deformation analysis can be calculated from var- ious tests, including conventional one-dimensional oedometer tests. The proposed method is studied and tested against data collected on a case history involving a slab-on-ground floor on Regina clay. The predicted results from the two- dimensional analysis agree well with the measured data in terms of both total vertical displacements and final water contents in the soil. The results of a parametric study are also presented to show the effect of measured soil parameters (i.e., swelling index and initial void ratio) and assumed parameters (i.e., Poisson’s ratio and coefficient of earth pres- sure at rest) on the predicted displacements. Key words: heave prediction, unsaturated soil, expansive soil, seepage analysis, stress analysis. Résumé : La prédiction du soulèvement dans les sols gonflants non saturés a été étudiée par le passé principalement au moyen d’une analyse de type unidimensionnel. Cet article propose une méthodologie qui peut être utilisée pour la prédiction de soulèvement uni, bi, ou tridimensionnel. On suggère que les pressions interstitielles négatives (i.e., suc- cions du sol) peuvent être évaluées au moyen d’une analyse d’infiltration saturée-non saturée. Les résultats de l’analyse d’infiltration sont alors utilisés comme entrée pour la prédiction des déplacements dans une analyse contrainte- déformation. La formulation des équations différentielles partielles de base pour l’infiltration de même que pour la contrainte-déformation est fondée sur la théorie générale des sols non saturés en utilisant deux variables indépendantes d’état de contrainte. Les fonctions paramétriques d’élasticité requises pour une analyse de contrainte-déformation peu- vent être calculées en partant de divers essais, incluant les résultats d’essais oedométriques unidimensionnels conven- tionnels. La méthode proposée a été étudiée et testée avec les données colligées lors d’une histoire de cas impliquant une dalle de plancher reposant sur l’argile de Regina. Les résultats prédits au moyen de l’analyse bidimensionnelle concordent bien avec les données mesurées en termes de déplacements verticaux totaux de même que de teneurs en eau finales dans le sol. On présente également les résultats d’une étude paramétrique pour démontrer l’effet sur les dé- placements prédits des paramètres de sol mesurés (i.e., indice de gonflement et indice de vide initial) et des paramètres supposés (i.e., rapport de Poisson et coefficient de pression des terres au repos). Mots clés : prédiction du soulèvement, sol saturé, sol gonflant, analyse d’infiltration, analyse de contraintes. [Traduit par la Rédaction] Vu and Fredlund 737 Introduction Lightly loaded structures constructed on expansive soils are often subjected to severe distress subsequent to construc- tion as a result of changes in the pore-water pressures in the soil. The structures most commonly damaged are roadways, airport runways, small buildings, irrigation canals, spillway structures, and all near ground surface structures associated with infrastructure development. Changes in the pore-water pressure can occur as a result of variations in climate, change in the depth to water table, water uptake by vegeta- tion, removal of vegetation, or the excessive watering of a lawn. The problems associated with expansive soils have been addressed in many international and regional conferences. There have been three symposiums on expansive clays (from 1957 to 1960), seven international conferences on expansive soils (from 1965 to 1992), three international conferences on unsaturated soils (from 1995 to 2002), and many other re- gional conferences. The research literature shows that the Can. Geotech. J. 41: 713–737 (2004) doi: 10.1139/T04-023 © 2004 NRC Canada 713 Received 16 June 2003. Accepted 16 February 2004. Published on the NRC Research Press Web site at http://cgj.nrc.ca on 31 August 2004. H.Q. Vu. 1 Clifton Associates Ltd., 340 Maxwell Crescent, Regina, SK S4N 5Y5, Canada. D.G. Fredlund. Department of Civil and Geological Engineering, University of Saskatchewan, 57 Campus Drive, Saskatoon, SK S7N 5A9, Canada. 1 Corresponding author (e-mail: [email protected]).
-
Upload
independent -
Category
Documents
-
view
1 -
download
0
Transcript of The prediction of one-, two-, and three-dimensional heave in expansive soils
The prediction of one-, two-, and three-dimensional heave in expansive soils
Hung Q. Vu and Delwyn G. Fredlund
Abstract: The prediction of heave in unsaturated, expansive soils has historically been studied primarily as a one-dimensional type analysis. This paper proposes a methodology that can be used for the prediction of one-, two-, orthree-dimensional heave. It is suggested that negative pore-water pressures (i.e., soil suctions) can be estimated througha saturated–unsaturated seepage analysis. The results of the seepage analysis are then used as input for the predictionof displacements in a stress–deformation analysis. The formulation of the governing partial differential equations forboth seepage and stress–deformation is based on the general theory of unsaturated soils using two independent stressstate variables. The elasticity parameter functions required for a stress–deformation analysis can be calculated from var-ious tests, including conventional one-dimensional oedometer tests. The proposed method is studied and tested againstdata collected on a case history involving a slab-on-ground floor on Regina clay. The predicted results from the two-dimensional analysis agree well with the measured data in terms of both total vertical displacements and final watercontents in the soil. The results of a parametric study are also presented to show the effect of measured soil parameters(i.e., swelling index and initial void ratio) and assumed parameters (i.e., Poisson’s ratio and coefficient of earth pres-sure at rest) on the predicted displacements.
Key words: heave prediction, unsaturated soil, expansive soil, seepage analysis, stress analysis.
Résumé : La prédiction du soulèvement dans les sols gonflants non saturés a été étudiée par le passé principalementau moyen d’une analyse de type unidimensionnel. Cet article propose une méthodologie qui peut être utilisée pour laprédiction de soulèvement uni, bi, ou tridimensionnel. On suggère que les pressions interstitielles négatives (i.e., suc-cions du sol) peuvent être évaluées au moyen d’une analyse d’infiltration saturée-non saturée. Les résultats de l’analysed’infiltration sont alors utilisés comme entrée pour la prédiction des déplacements dans une analyse contrainte-déformation. La formulation des équations différentielles partielles de base pour l’infiltration de même que pour lacontrainte-déformation est fondée sur la théorie générale des sols non saturés en utilisant deux variables indépendantesd’état de contrainte. Les fonctions paramétriques d’élasticité requises pour une analyse de contrainte-déformation peu-vent être calculées en partant de divers essais, incluant les résultats d’essais oedométriques unidimensionnels conven-tionnels. La méthode proposée a été étudiée et testée avec les données colligées lors d’une histoire de cas impliquantune dalle de plancher reposant sur l’argile de Regina. Les résultats prédits au moyen de l’analyse bidimensionnelleconcordent bien avec les données mesurées en termes de déplacements verticaux totaux de même que de teneurs eneau finales dans le sol. On présente également les résultats d’une étude paramétrique pour démontrer l’effet sur les dé-placements prédits des paramètres de sol mesurés (i.e., indice de gonflement et indice de vide initial) et des paramètressupposés (i.e., rapport de Poisson et coefficient de pression des terres au repos).
Mots clés : prédiction du soulèvement, sol saturé, sol gonflant, analyse d’infiltration, analyse de contraintes.
[Traduit par la Rédaction] Vu and Fredlund 737
Introduction
Lightly loaded structures constructed on expansive soilsare often subjected to severe distress subsequent to construc-tion as a result of changes in the pore-water pressures in the
soil. The structures most commonly damaged are roadways,airport runways, small buildings, irrigation canals, spillwaystructures, and all near ground surface structures associatedwith infrastructure development. Changes in the pore-waterpressure can occur as a result of variations in climate,change in the depth to water table, water uptake by vegeta-tion, removal of vegetation, or the excessive watering of alawn.
The problems associated with expansive soils have beenaddressed in many international and regional conferences.There have been three symposiums on expansive clays (from1957 to 1960), seven international conferences on expansivesoils (from 1965 to 1992), three international conferences onunsaturated soils (from 1995 to 2002), and many other re-gional conferences. The research literature shows that the
Can. Geotech. J. 41: 713–737 (2004) doi: 10.1139/T04-023 © 2004 NRC Canada
713
Received 16 June 2003. Accepted 16 February 2004.Published on the NRC Research Press Web site athttp://cgj.nrc.ca on 31 August 2004.
H.Q. Vu.1 Clifton Associates Ltd., 340 Maxwell Crescent,Regina, SK S4N 5Y5, Canada.D.G. Fredlund. Department of Civil and GeologicalEngineering, University of Saskatchewan, 57 Campus Drive,Saskatoon, SK S7N 5A9, Canada.
1Corresponding author (e-mail: [email protected]).
prediction of heave associated with the wetting of an expan-sive soil has received more attention than any other probleminvolving unsaturated soils (Fredlund 2000).
The worldwide interest in research on expansive soils inthe last four decades has resulted in numerous methods be-ing proposed for the prediction of heave. The heave predic-tion methods are based either on one-dimensional oedometertest results or on direct matric suction measurements (Fred-lund and Rahardjo 1993). Although an analytical tool for theprediction of heave is extremely important, there has beenlittle advancement in the development of an analyticalmethod for solving engineering problems. There does notappear to be a computer program that has been written andwidely accepted for multidimensional heave predictions inexpansive soils. It is important that such an analytical tool bedeveloped for one-, two-, and three-dimensional problems.
Review of the prediction of heave inexpansive soils
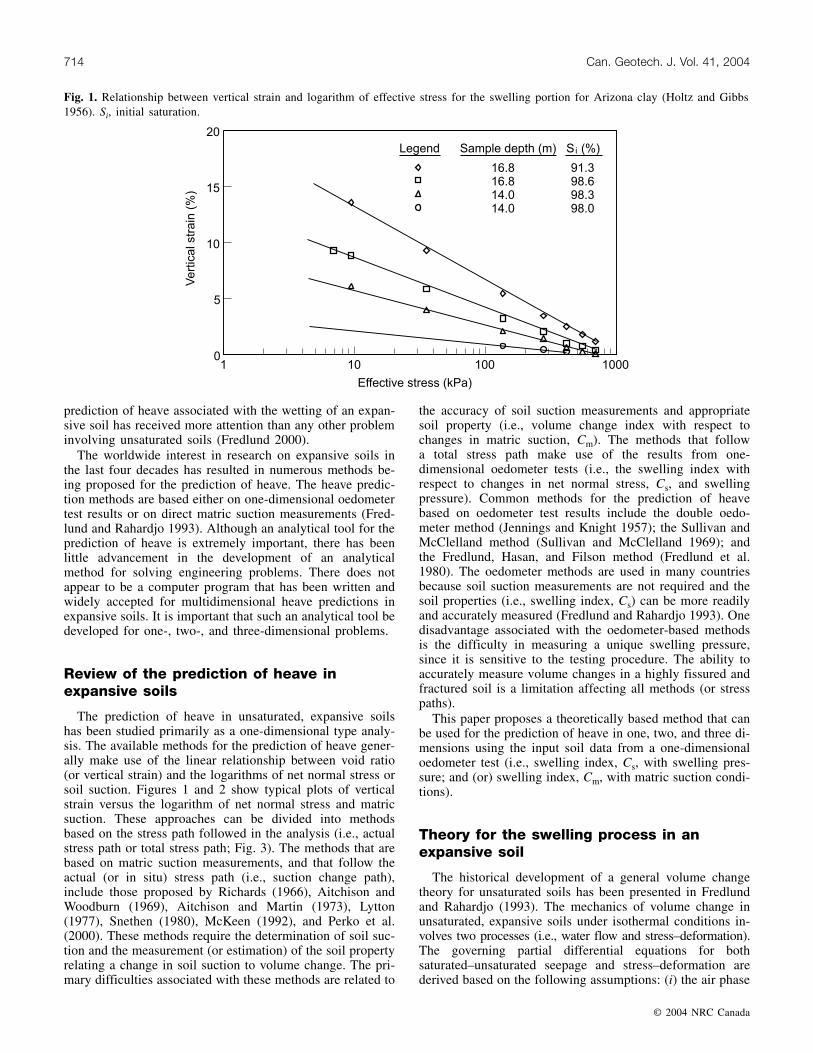
The prediction of heave in unsaturated, expansive soilshas been studied primarily as a one-dimensional type analy-sis. The available methods for the prediction of heave gener-ally make use of the linear relationship between void ratio(or vertical strain) and the logarithms of net normal stress orsoil suction. Figures 1 and 2 show typical plots of verticalstrain versus the logarithm of net normal stress and matricsuction. These approaches can be divided into methodsbased on the stress path followed in the analysis (i.e., actualstress path or total stress path; Fig. 3). The methods that arebased on matric suction measurements, and that follow theactual (or in situ) stress path (i.e., suction change path),include those proposed by Richards (1966), Aitchison andWoodburn (1969), Aitchison and Martin (1973), Lytton(1977), Snethen (1980), McKeen (1992), and Perko et al.(2000). These methods require the determination of soil suc-tion and the measurement (or estimation) of the soil propertyrelating a change in soil suction to volume change. The pri-mary difficulties associated with these methods are related to
the accuracy of soil suction measurements and appropriatesoil property (i.e., volume change index with respect tochanges in matric suction, Cm). The methods that followa total stress path make use of the results from one-dimensional oedometer tests (i.e., the swelling index withrespect to changes in net normal stress, Cs, and swellingpressure). Common methods for the prediction of heavebased on oedometer test results include the double oedo-meter method (Jennings and Knight 1957); the Sullivan andMcClelland method (Sullivan and McClelland 1969); andthe Fredlund, Hasan, and Filson method (Fredlund et al.1980). The oedometer methods are used in many countriesbecause soil suction measurements are not required and thesoil properties (i.e., swelling index, Cs) can be more readilyand accurately measured (Fredlund and Rahardjo 1993). Onedisadvantage associated with the oedometer-based methodsis the difficulty in measuring a unique swelling pressure,since it is sensitive to the testing procedure. The ability toaccurately measure volume changes in a highly fissured andfractured soil is a limitation affecting all methods (or stresspaths).
This paper proposes a theoretically based method that canbe used for the prediction of heave in one, two, and three di-mensions using the input soil data from a one-dimensionaloedometer test (i.e., swelling index, Cs, with swelling pres-sure; and (or) swelling index, Cm, with matric suction condi-tions).
Theory for the swelling process in anexpansive soil
The historical development of a general volume changetheory for unsaturated soils has been presented in Fredlundand Rahardjo (1993). The mechanics of volume change inunsaturated, expansive soils under isothermal conditions in-volves two processes (i.e., water flow and stress–deformation).The governing partial differential equations for bothsaturated–unsaturated seepage and stress–deformation arederived based on the following assumptions: (i) the air phase
© 2004 NRC Canada
714 Can. Geotech. J. Vol. 41, 2004
Fig. 1. Relationship between vertical strain and logarithm of effective stress for the swelling portion for Arizona clay (Holtz and Gibbs1956). Si, initial saturation.

is continuous and remains at atmospheric pressure; (ii) soilis isotropic, nonlinear, and elastic; (iii) strains are small;(iv) pore water is incompressible; and (v) the effects of airdiffusing through water, air dissolving in the water, and themovement of water vapor are negligible.
Strain–displacement relationsLet us consider a three-dimensional field with x, y, and z
as the rectangular Cartesian coordinates (i.e., x for the hori-zontal direction and y for the vertical direction) and with uibeing components of the displacement vector (i.e., u, v, andw for the x, y, and z directions, respectively). The compo-nents of the strain tensor for the soil structure, ε ij , are writ-ten in terms of displacements as follows:
[1] ε ∂∂
∂∂ij
i
j
j
i
ux
u
x= +
12
The normal strains can be designated as εx, ε y, and ε z forthe x, y, and z directions, respectively. For infinitesimal de-formations, volumetric strain, εv, is the sum of the normalstrain components:
[2] ε ∂∂
∂∂
∂∂
∂∂
ε ε εv = = + + = + +ux
ux
vy
wz
i
ix y z
Fredlund and Morgenstern (1977) proposed that the con-stitutive behaviour of unsaturated soils be described usingtwo independent stress state variables, namely, net normalstress (σ – ua) and matric suction (ua – uw). The use of inde-pendent stress state variables has formed the basis for theformulations of shear strength and volume change problemsfor unsaturated soils (Fredlund and Rahardjo 1993).
An unsaturated soil is considered as a four-phase mixture(Fredlund 1979), with two phases that come to equilibriumunder applied stress (i.e., soil particle and contractile skin)and two phases that flow under applied pressure (i.e., the airand the water). The total volume change of an unsaturatedsoil element must be equal to the sum of volume changes as-sociated with each phase. If the soil particles are assumedincompressible and the volume change of the contractileskin assumed internal to the element, the continuity require-ment for an element of unsaturated soil reduces to
[3]∆ ∆ ∆VV
VV
VV
v w a
0 0 0
= +
where V0 is the initial overall volume of an unsaturated soilelement, Vv is the volume of soil voids, Vw is the volume ofwater in the element, and Va is the volume of air in the ele-ment.
Two constitutive relationships are required to describe thevolume change associated with an unsaturated soil, one forthe soil structure (in terms of void ratio or volumetric strain)and one for the water phase (in terms of degree of saturationor water content). Constitutive relationships for soil structureand water phase are presented in indicial notation for theformulation of the partial differential equations for the waterflow and stress–deformation processes. The stress state of an
© 2004 NRC Canada
Vu and Fredlund 715
Fig. 2. Relationship between vertical strain and the logarithm of matric suction for the loading and unloading of Athelstone Park clay(Richards et al. 1984). σy , total vertical stress.
Fig. 3. Stress paths followed in conventional methods for theprediction of heave in one dimension. e, void ratio; e0, initialvoid ratio; ef, final void ratio; ua, pore-air pressure; uw, pore-water pressure; σy , total vertical stress.

unsaturated soil can be written in terms of two independentstress tensors, namely, the net normal stress tensor,( )σ δij iju− a , and the matric suction tensor, (ua − u ijw)δ . If theair phase is assumed to be continuous and remain at atmo-spheric pressure, a flow law is required only for the waterphase.
Soil structure constitutive relationshipThe constitutive relationship for the soil structure can be
written in an incremental elasticity form using elasticity pa-rameters (Fredlund and Rahardjo 1993):
[4] d d da aε µ σ δ µ σ δij ij ij kk ijE
uE
u= + − − −13( ) ( )
+ −d a w( )u uH
ijδ
where σ ij are components of the total stress tensor for thesoil structure, σkk = (σx + σy + σz), δij is the Kronecker delta,E is the elasticity parameter for the soil structure with re-spect to a change in the net normal stress, H is the elasticityparameter for the soil structure with respect to a change inmatric suction, and µ is Poisson’s ratio.
Equation [4] can be used to write the equation for an in-cremental volumetric strain using the coefficients of volumechange in a compressibility form as follows:
[5] d d dv 1s
mean as
a wε σ= − + −m u m u u( ) ( )2
where σ σ σ σ σmean = = + + =kk x y z/ ( )/3 3 the mean net totalstress, m E1 3 1 2s = − =( )/µ the coefficient of volume changewith respect to a change in net normal stress, andm H2 3s = =/ the coefficient of volume change with respect toa change in matric suction.
The unloading constitutive relationship for the soil struc-ture is presented graphically in the form of a constitutivesurface in Fig. 4a. The coefficients of volume change, m1
s
and m2s, are slopes on the soil structure constitutive surface
and can be obtained by differentiating the surface with re-spect to net normal stress and matric suction, respectively.The coefficients of volume change for the soil structure canbe written as a function of void ratio as follows:
[6] mu e
eu
10
11
s v
mean a mean a
=−
=+ −
∂ε∂ σ
∂∂ σ( ) ( )
[7] mu u e
eu u
20
11
s v
a w a w
=−
=+ −
∂ε∂
∂∂( ) ( )
where d dvε = +e e/( )1 0 , e0 is the initial (i.e., referential) voidratio of the soil, and e is the void ratio of the soil.
Water phase constitutive relationshipThe water phase constitutive relationship can be presented
in an incremental compressibility form as follows (Fredlundand Rahardjo 1993):
[8]d
d dw wmean a
wa w
VV
m u m u u0
1 2= − + −( ) ( )σ
where m1w is the coefficient of water volume change with re-
spect to a change in net normal stress, and m2w is the coeffi-
cient of water volume change with respect to a change inmatric suction.
Solving eq. [5] for mean net normal stress and substitut-ing into eq. [8] gives
[9]d
d dw v w a wVV
u uw
01 2= + −β ε β ( )
where
βµ1w
w
s
wor=
−mm
m E1
1
1
3 1 2( )
βµ2w
ww s
sw
wor= − −
−m
m mm
mm E
H2
1 2
12
1
1 2( )
The unloading constitutive relationship for the waterphase is presented graphically as the constitutive surface inFig. 4b. The coefficients of water volume change, m1
w andm2
w, indicate the amount of water taken on or released by thesoil because of a change in the net normal stress and matricsuction. Therefore, the slopes on the water phase constitutivesurface can be obtained by differentiating the surface withrespect to net normal stress and matric suction, respectively:
© 2004 NRC Canada
716 Can. Geotech. J. Vol. 41, 2004
Fig. 4. Constitutive surfaces for (a) soil structure and (b) water phase of an unsaturated, swelling soil.

[10] mu
1w w
mean a
=−
∂θ∂ σ( )
[11] mu u
2w w
a w
=−
∂θ∂( )
where θw w= =V V/ 0 the volumetric water content.
Flow law for water phaseDarcy’s law relates the water flow rate to the hydraulic
head (i.e., pressure head plus elevation head) as follows:
[12] v kx
ug
Yi ii
w ww
w
= − +
∂
∂ ρ
where v iw is Darcy’s flux in the i direction, k iw is the hydrau-lic conductivity in the i direction, ρw is the density of water,g is the gravitational acceleration, and Y is the elevation.
Governing partial differential equations for seepage inan unsaturated, swelling soil
The water continuity equation for an unsaturated soil, as-suming that water is incompressible and deformations areincrementally infinitesimal, can be written as follows(Freeze and Cherry 1979):
[13]∂ θ∂( )
( )ww
t+ ∇ =v 0
where t is time,
∇ = + +∂∂
∂∂
∂∂x y z
i j k
is the divergence operator, and v i j kw w w w= + +v v vx y z isDarcy’s flux.
The governing equation for the water phase can be ob-tained by substituting the time derivative of the water phaseconstitutive equation (eq. [9]) and Darcy’s law (eq. [12]) intothe water phase continuity equation (eq. [13]):
[14] β ∂ε∂
β ∂∂ ρw
vw
a ww
w
w1 2 0
tu u
tu
gY+ − − ∇ ∇ +
=( ) k
Equation [14] can be written for two-dimensional seepagein unsaturated, expansive soils:
[15] β ∂ε∂
β ∂∂
∂∂
∂∂ ρw
vw
a ww
w
w1 2
tu u
t xk
xu
gYx+ − = +
( )
+ +
∂∂
∂∂ ρy
ky
ug
Yyw
w
w
The analysis of seepage in an unsaturated, expansive soil(eq. [15]) requires the definition of the soil structure and wa-ter phase constitutive surfaces (i.e., Fig. 4), the coefficient ofpermeability function, and the rate of change of soil volume.Equation [14] shows the influence of the compressibilityof the soil structure and the rate of the volume change ofthe soil structure, which are dependent on the net normalstresses, on the transient water flow process in a swelling
soil. The effect of changes in stress and volume on eq. [15]has been studied and presented in Vu (2003). The solutionfor transient seepage through a swelling soil is more sensi-tive to changes in stress and volume when the soil is close tosaturation, when the soil has higher compressibility or morevolume change. The effect of changes in stress and volumeappeared to be minimal when the soil is at high matric suc-tion (Vu 2003).
The formulation can be simplified by not consideringchanges in volume and induced net normal stresses duringthe seepage process. The soil structure constitutive surfacebecomes unnecessary and the constitutive surface for the wa-ter phase can be represented using the soil-water characteris-tic curve. Equation [15] then takes on the following form:
[16] mu u
t xk
xu
gYx
2w a w
ww
w
∂∂
∂∂
∂∂ ρ
( )− = +
+ +
∂∂
∂∂ ρy
ky
ug
Yyw
w
w
Equation [16] applies for both saturated and unsaturatedsoils and for transient and steady state seepage conditions.Two unsaturated soil properties are required when solvingtransient seepage problem (i.e., eq. [16]), namely, the coeffi-cient of water volume change (or coefficient of water stor-age) and the coefficient of permeability. Both the coefficientof water storage and the coefficient of permeability are pre-dominantly functions of matric suction.
The coefficient of water storage is the slope of the soil-water characteristic curve and can be obtained by differenti-ating the soil-water characteristic curve with respect tomatric suction. Numerous equations have been proposed tosimulate the soil-water characteristic curve (Gardner 1958;van Genuchten 1980; Fredlund and Xing 1994). The assess-ment of equations to represent the soil-water characteristiccurve has been presented by Sillers and Fredlund (2001) andSillers et al. (2001). The soil-water characteristic curve usedin the present study is the Fredlund and Xing (1994) equa-tion:
[17] θ θψw s
e=
+
1ln[ ( / ) ]a n
m
where ψ is the soil suction (kPa), e is the natural logarithm(base 2.71828 …), θs is the volumetric water content at satu-ration, a is a soil parameter that is related to the air-entryvalue of the soil (kPa), n is a soil parameter that controls theslope at the inflection point in the soil-water characteristiccurve, and m is a soil parameter that is related to the residualwater content of the soil.
The coefficient of permeability function can be indirectlycomputed or estimated from the soil-water characteristiccurve and the saturated coefficient of permeability. There areseveral equations for the coefficient of permeability thathave been proposed to represent the permeability functionof an unsaturated soil (e.g., Gardner 1958; Fredlund et al.1994; Leong and Rahardjo 1997). These equations involvefinding best-fit parameters which produce a curve thatfits the measured data or data estimated from the soil-water
© 2004 NRC Canada
Vu and Fredlund 717

characteristic curve. The equation proposed by Leong andRahardjo (1997) appeared to be satisfactory for the problemat hand. Leong and Rahardjo illustrated that the coefficientof permeability can be approximated as a power function ofdimensionless volumetric water content. Using the Fredlundand Xing (1994) equation for the soil-water characteristiccurve, the permeability function was shown to take the fol-lowing form:
[18] k kn
mp
w se
=+
1ln[ ( / ) ]ψ a
The parameter p can be evaluated using the curve fittingof the coefficient of permeability data.
The transient water flow equation (eq. [16]) along withthe equation of a soil-water characteristic curve (eq. [17])and a permeability function (eq. [18]) can be used to predictpore-water pressure profiles (i.e., matric suction profiles) atdifferent times during a seepage process. The matric suctionprofiles can then be used in an uncoupled manner to com-pute the matric suction change for the stress–deformationanalysis. Deformations due to changes in matric suction dur-ing any time period can then be predicted based on initialand final matric suction profiles.
The solution for transient saturated–unsaturated seepagealso requires the designation of initial soil suction conditionsand the moisture flux boundary conditions. The results ofthe seepage analysis provide the distributions of matric suc-tion in the soil profile with respect to time for the specifiedboundary conditions.
Quantification of boundary conditions for seepageanalysis
Either a flux or a head boundary condition can be speci-fied for a seepage analysis. Both the flux and head types ofboundary conditions can be functions of space and time. Ac-curate prediction of suction conditions in soils requiresboundary conditions based on a reasonable analysis of cli-matic conditions at particular sites. Research studies on fluxboundary conditions have been presented in Wilson et al.(1994, 1997) and Blight (2003). The boundary flux condi-tions are characterized by considering the soil system waterbalance at a particular site.
Governing partial differential equations for soilstructure equilibrium
The equations of overall static equilibrium for an unsatu-rated soil can be written as follows:
[19]∂σ∂
ij
ji
xb+ = 0
where σ ij are components of the net total stress tensor, andbi are components of the body force vector.
Substituting the strain–displacement relationship (eq. [1])and the stress–strain relationship (eq. [4]) into the equilib-rium equation, eq. [19] gives the following governing equa-tions for general three-dimensional problems (i.e., equationsfor x, y, and z directions):
[20] G uG
xu u
xux
bii i i
i∇ +−
− − + + =2
1 20
µ∂ε∂
β ∂∂
∂∂
v a w a( )
where
βµ
= =−
mm
E H2
1 1 2
s
s
/( )
∇ = + + =22
2
2
2
2
2
∂∂
∂∂
∂∂x y z
the Laplace operator
ε ∂∂
∂∂
∂∂
∂∂v = = + +u
xux
vy
wz
i
i
GE=+2 1( )µ
Equations [14] and [20] form a system of coupled equa-tions for the theory of swelling in three dimensions for anunsaturated, swelling soil with a continuous air phase. Theequations have essentially the same form as those presentedby Biot (1941) for a soil with occluded air bubbles.
Equation [20] can be written for two-dimensional planestrain problems as follows:
[21]∂∂
∂∂
∂∂
∂∂
∂∂
∂∂x
cux
cvy
cy
uy
vx
11 12 33+
+ +
− − + =du u
xbxs
a w∂∂
( )0
[22] cx
uy
vx y
cux
cvy
33 12 22∂∂
∂∂
∂∂
∂∂
∂∂
∂∂
+
+ +
− − + =du u
ybys
a w∂∂
( )0
where bx and by are body forces in x- and y-directions re-spectively,
c cE
11 221
1 1 2= = −
+ −( )
( )( )µ
µ µ
cE
121 1 2
=+ −
µµ µ( )( )
cE
332 1
=+( )µ
dE
Hs =
−( )1 2µ
Equations [21] and [22] can be used to compute displace-ments in the horizontal and vertical directions under an ap-plied load and (or) due to changes in matric suction.
Solutions to the seepage equation (eq. [15]) and soil struc-ture equilibrium equations (eqs. [21] and [22]) can be ob-tained through either an uncoupled or a coupled analysis.Uncoupled and coupled volume change problems in expan-sive soils were studied, analyzed, and compared through var-ious example problems by Vu (2003) and Vu and Fredlund(2003). Both uncoupled and coupled solutions were obtainedfor a general case with respect to soil properties when the
© 2004 NRC Canada
718 Can. Geotech. J. Vol. 41, 2004

elasticity parameters E and H, the coefficients of water vol-ume change m1
w and m2w, and the coefficient of permeability
kw were functions of both stress state variables. Only the un-coupled approach is reported in this paper.
The solution of the stress–deformation equations (i.e.,eqs. [21] and [22]) under specified boundary conditions re-quires the designation of initial matric suctions, initial stressconditions, the elasticity parameter functions associated withthe volume change of the soil, and the results from a seep-age analysis (i.e., for changes in soil suction).
Evaluation of the elasticity parameter functions fromvolume change indices
The stress–deformation analysis in two and three dimen-sions requires the characterization of the elasticity parame-ters E and H, which are functions of stress state. Theelasticity parameters can be calculated from the coefficientsof volume change, m1
s and m2s, by differentiating the constitu-
tive surface for the soil structure using eqs. [6] and [7], re-spectively. Several testing conditions can be used to obtainthe void ratio constitutive surface (i.e., K0 condition, planestrain condition, or isotropic condition). It is important tonote that three fundamental elasticity parameters are re-quired in the constitutive equations (i.e., E, H, and µ). How-ever, there are only two coefficients of volume changeobtained from the constitutive surface for soil structure (i.e.,m1
s and m2s). Therefore, it is suggested that Poisson’s ratio be
assumed (or measured) to convert the coefficients of volumechange for different loading conditions to the fundamentalelasticity parameters.
The elasticity parameter functions can be calculated fromvarious testing conditions and then used for different typesof analyses (Fig. 5). Table 1 presents the calculation of theseelasticity parameter functions for various loading conditions(after Fredlund and Rahardjo 1993).
The coefficients obtained from one loading condition canbe converted to other loading conditions using the assumedvalue of Poisson’s ratio (Fredlund and Rahardjo 1993):
[23] m m m1 1 1 1 23 11
32 1
s- D
s- D
s= −+
=+
( )( ) ( )
µµ µ
[24] m m m2 2 1 2 23 11
32 1
s- D
s- D
s= −+
=+
( )( ) ( )
µµ µ
The coefficients of volume change can be obtainedthrough the conversion of the semilogarithmic plot of voidratio to an arithmetic plot (Vu 2000). The swelling indices,Cs and Cm, are the slope of the void ratio versus logarithm ofnet normal stress or matric suction as shown in Fig. 6. Thesemilogarithmic plot of the void ratio constitutive surface foran unsaturated soil is approximately linear on the extremeplanes over a relatively large stress range (Ho et al. 1992).The volume change indices obtained from K0 loading havebeen shown to be essentially the same as those obtainedfrom isotropic loading conditions (Graham and Li 1985; Al-Shamrani and Al-Mhaidib 2000; Vu 2003).
The elasticity parameter functions E and H can also becalculated directly from volume change indices Cs (from netnormal stress plane) and Cm (from matric suction plane), re-spectively. The elasticity parameters are calculated from the
coefficient of volume change as shown in Table 1. Theelasticity parameter E can be expressed as a function of thevolume change index with respect to net normal stress, Cs,initial void ratio, and Poisson’s ratio. The elasticity parame-ter H can be expressed as a function of the volume changeindex with respect to matric suction, Cm, initial void ratio,and Poisson’s ratio. The equations for these elasticity param-eters can be written for general three-dimensional loadingconditions as follows:
[25] Ee
Cu= − + −6.908(1
smean a
2 1 0µ σ)( )( )
[26] He
Cu u= + −6.908
ma w
( )( )
1 0
The constant 6.908 arises from the conversion betweenthe logarithmic and arithmetic scales (i.e., 6.908 = 3/log102.718).
Equations [25] and [26] can be written for two-dimensional plane strain conditions as follows:
[27] Ee
Cu= − + −4.605(1 + )(1
save a
µ µ σ2 1 0)( )( )
[28] He
Cu u= + −4.605(1 + )
ma w
µ ( )( )
1 0
The constant 4.605 arises from the conversion betweenthe logarithmic and arithmetic scales (i.e., 4.605 = 2/log102.718).
Assuming a constant value of Poisson’s ratio, the elastic-ity parameter E (or H) increases with an increase in net nor-mal stress (or matric suction) and a decrease in the volumechange index Cs (or Cm). Figures 7 and 8 graphically illus-trate the relationship between the elasticity parameter E andnet normal stress for various values of the swelling index Csand various values of Poisson’s ratio, respectively. Figure 9presents the variation of elasticity parameter H with matricsuction for various values of swelling index Cm.
Estimation of the swelling indicesThe swelling indices can be measured experimentally or
estimated through correlation with the Atterberg limits(Fredlund and Rahardjo 1993; Lytton 1994). Test proceduresfor the estimation of swelling indices are presented in Fred-lund and Rahardjo (1993) and the American Society for
© 2004 NRC Canada
Vu and Fredlund 719
Fig. 5. Proposed procedure for the use of elasticity functions forthe prediction of heave.

Testing and Materials (ASTM) standards. The ASTM stan-dards related to the measuring of swelling indices includeD4546 (ASTM 1996a), D2435 (ASTM 1996b), and D427(ASTM 1998). It should be noted that these swelling indicesare commonly used for a conventional heave analysis in onedimension. This paper does not present any new testing pro-cedures to measure these soil properties for two- and three-dimensional analyses but suggests the use of conventionaloedometer test results.
Poisson’s ratioPoisson’s ratio may not be a constant for an unsaturated
soil but may be a function of stress state (i.e., net normal
stress and matric suction). It is generally assumed that Pois-son’s ratio increases with increasing net mean stress andwith decreasing matric suction (Pereira and Fredlund 2000).Several researchers (Miranda 1988; Alonso et al. 1988) haveused a constant Poisson’s ratio of 0.3 in numerical simula-tions of the behaviour of unsaturated, collapsing soils. It wassuggested that this value of Poisson’s ratio might reflect theas-compacted condition of a loosely compacted embank-ment. The choice of a value for Poisson’s ratio can also berelated to an experimentally observed relationship betweenthe coefficient of earth pressure at rest (K0) and theoverconsolidation ratio (OCR). In this study, the Poisson’sratio is assumed to be a constant and is related to K0 as fol-lows:
[29] µ =+K
K0
01
Initial matric suction and stress conditionsInitial matric suction conditions can be measured using
field methods and laboratory methods (Fredlund andRahardjo 1993) or estimated from theoretical considerationsof unsaturated soil conditions.
The net normal stress state within the soil mass can beeither computed by switching on gravity due to the unitweight of the soil or estimated from the total unit weight ofthe soil through total stress theory. Horizontal net normalstresses can be estimated from the vertical stresses and K0:
[30] σ ρyH
g y= ∫ d0
[31] σ σx yK= 0
where σx and σ y are the horizontal and vertical net normalstress, respectively; y is the vertical distance from the groundsurface, and H is the depth of soil under consideration.
© 2004 NRC Canada
720 Can. Geotech. J. Vol. 41, 2004
Stress state variables Coefficient of volume change functions Elasticity parameter functions
Three-dimensional (3D) loading( ); ( )σmean a a w D− −u u u 3 m
u e
C
u1
0
s v
mean a
s
mean a
0.434(1 +
=−
=−
∂ε∂ σ σ( ) ) ( )
Em
= −3
1 2
1
( )µs
mu u e
C
u u2
0
s v
a w 3D
m
a w 3D
0.434(1 +
=−
=−
∂ε∂( ) ) ( )
Hm
= 3
2s
K0 loading, one-dimensional (1D)( ); ( )σy u u u− −a a w 1D m
u e
C
uy
y y1
0-1D
s
a
s
a
0.434(1 +
=−
=−
∂ε∂ σ σ( ) ) ( )
Em
= + −−
( )( )
( )
1 1 2
1
µ µµ 1-1D
s
mu u e
C
u uy
20
-1Ds
a w 1D
m
a w 1D
0.434(1 +
=−
=−
∂ε∂( ) ) ( )
Hm
= +−( )
( )
1
1
µµ 2-1D
s
Plane strain loading, two dimensional (2D)( ); ( )σave a a w 2D− −u u u
mu e
C
ux y
10
-2Ds
ave a
s
ave a
0.434(1 +
=+−
=−
∂ ε ε∂ σ σ
( )
( ) ) ( )E
m= + −2 1 1 2( )( )µ µ
1-2Ds
mu u e
C
u ux y
20
-2Ds
a w 2D
m
a w 2D
0.434(1 +
=+
−=
−∂ ε ε∂
( )
( ) ) ( )H
m= +2 1( )µ
2-2Ds
Note: σ σ σ σmean = + +( )/ ;x y z 3 σ σ σave = +( )/ ;x y 2 d d vε εy = for K0 loading; d d v( )ε ε εx y+ = for plane strain loading.
Table 1. Relationship between the fundamental elasticity parameters and the coefficients of volume change(after Fredlund and Rahardjo 1993).
Fig. 6. A typical void ratio constitutive surface plotted insemilogarithmic scale.

© 2004 NRC Canada
Vu and Fredlund 721
Fig. 7. Relationship between elasticity parameter, E, and net normal stress for various values of swelling index, Cs.
Fig. 8. Relationship between elasticity parameter, E, and net normal stress for various values of Poisson’s ratio, µ.
Fig. 9. Relationship between elasticity parameter, H, and net normal stress for various values of swelling index, Cm.
Coefficient of earth pressure at restThe coefficient of earth pressure can go from as low as
zero to as high as the coefficient of passive earth pressure.Several procedures suggested in the literature for the estima-tion of the coefficient of earth pressure at rest are presentedin the following equations. Fredlund and Rahardjo (1993)considered elastic equilibrium within a homogenous, isotro-pic soil mass and presented the following equation for thecoefficient of earth pressure at rest:
[32] KE
Hu u
u0
1 1=
−−
−−−
µµ µ) σ(
( )( )
a w
v a
Equation [32] can be rewritten as follows:
[33] KCC
u uu
01
1 21
=−
− −−
−−
µµ
µ)µ) σ
((
( )( )
m
s
a w
v a
Considering the effect of previous stress paths (i.e., previ-ous wetting and drying, loading and unloading), the coeffi-cient of earth pressure should have the following tangentvalue:
[34] KCC
u uu
01
1 21
=−
− −−
−−
µµ
µ)µ) σ
((
( )( )
m
s
a w
v a
∆∆
Jaky (1944) estimated the coefficient of earth pressure fornormally consolidated soils (Knc) from the effective stressparameter φ:
[35] Knc = −1 sin φ
Wroth (1979) proposed two empirical relationships be-tween K0, Knc, and OCR:
[36] K K01
1= −−
−ncOCR OCRµµ
( )
[37] mKK
KK
K3 11 2
3 11 2
1 21
( ) ( )ln
( )−+
− −+
= +
+nc
nc
0
0
nc OCR2K0
where m = 0.0022875PI + 1.22, in which PI is the plasticityindex.
Equation [36] provides a reasonable fit to existing data forsoils up to an OCR of about 5. The value of Poisson’s rationecessary to fit the observed data was in the range of 0.254–0.371 for eight different soils. Equation [37] was proposedas being valid for even higher OCR values (Wroth 1979).
Mayne and Kulhawy (1982) suggested that a modifiedJaky’s equation be used to estimate the coefficient of earthpressure at rest:
[38] K K0 = ncOCRsinφ
where φ is the angle of internal friction.Lytton (1994) presented the following typical values for
coefficients of lateral earth pressure back-calculated fromfield observations of heave and shrinkage:
[39] K0 =
0 when the soil is dry and cracked
0.333 when the soil is dry andcracks are opening
0.500 when cracks are closed and suc-tion is at a steady state condition
0.667 when cracks are closed andthe soil is wetting
when the soil is wetting and is inhydrostatic
1stress condition
when the soil is approachingpa
2 3−ssive earth pressure
The coefficient of earth pressure at rest presented byeq. [39] is used for the estimation of horizontal net normalstress in this study.
Case history of a slab-on-grade floor onRegina clay
The proposed method for the prediction of heave wasstudied using data collected by the Prairie Regional Stationof the Division of Building Research (DBR), National Re-search Council of Canada, located in Saskatoon, Saskatche-wan. In the study, a two-dimensional heave analysis wasused to investigate volume change problems associated withthe heave of a floor slab of a light industrial building innorth-central Regina, Saskatchewan. History of the site anddetails on testing and monitoring programs were presentedby Yoshida et al. (1983).
Construction of the building and instrumentation tookplace during the month of August 1961. Instrumentation in-stalled at the site included a deep benchmark, vertical move-ment gauges, and a neutron moisture meter access tube.Vertical ground movement was monitored at depths of 0.58,0.85, and 2.39 m below original ground level. The buildingowner noticed heave and cracking of the floor slab in earlyAugust 1962, about a year after construction. The owneralso noticed an unexpected increase in water consumption ofapproximately 35 000 L. The loss of water was traced to aleak in a hot-water line beneath the floor slab, which wassubsequently repaired. The location of the cracking and con-tours of heave for the floor slab are shown in Fig. 10.
Laboratory analyses were performed on samples from aborehole advanced on August 1961 for the installation of thedeep benchmark. Laboratory tests evaluated the Atterberglimits, in situ water content, grain-size distribution, swellingindices, and the corrected swelling pressures of the soil. Onaverage, the liquid limit was found to be 77%, with a plasticlimit of 33% and a natural water content of 29%. The spe-cific gravity and unit weight for the soil profile were 2.82and 18.88 kN/m3, respectively.
Constant-volume oedometer tests on three samples wereused to evaluate the initial void ratios, swelling indices, andcorrected swelling pressures. Table 2 presents the oedometertest results and water content of samples collected at differ-ent depths. Although there was some variation in the initialvoid ratio and the swelling index, an average value of 0.962for the initial void ratio and 0.090 for the swelling index are
© 2004 NRC Canada
722 Can. Geotech. J. Vol. 41, 2004
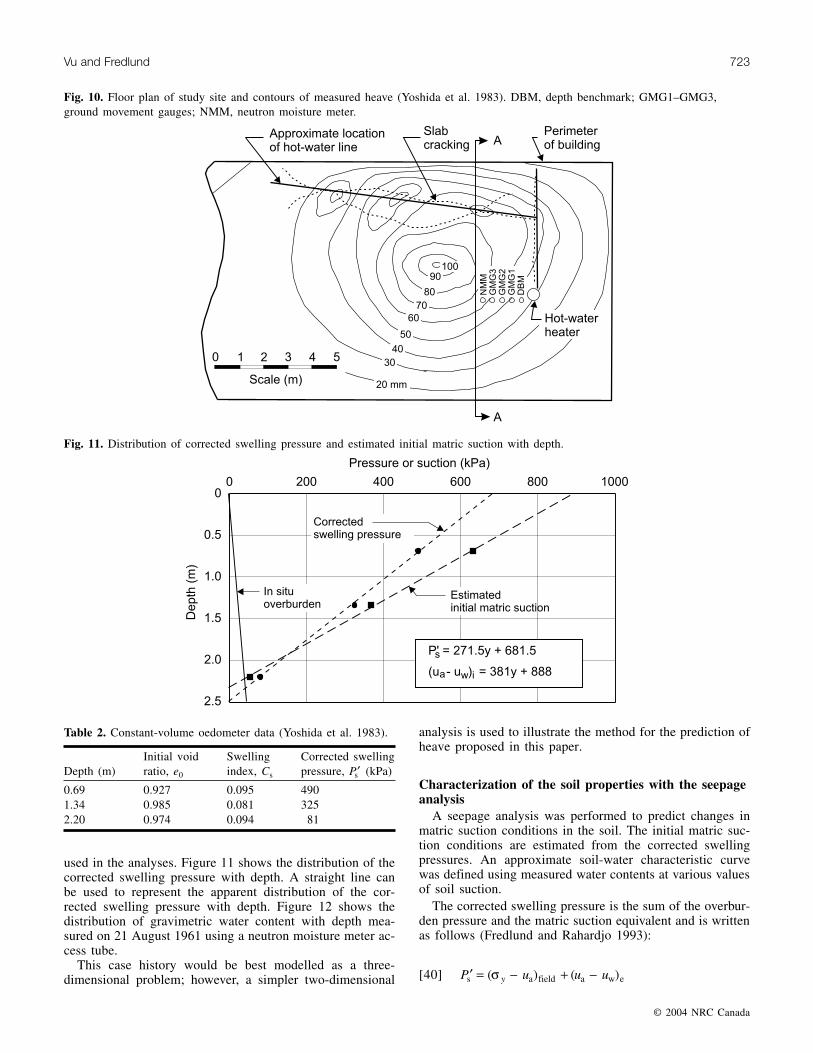
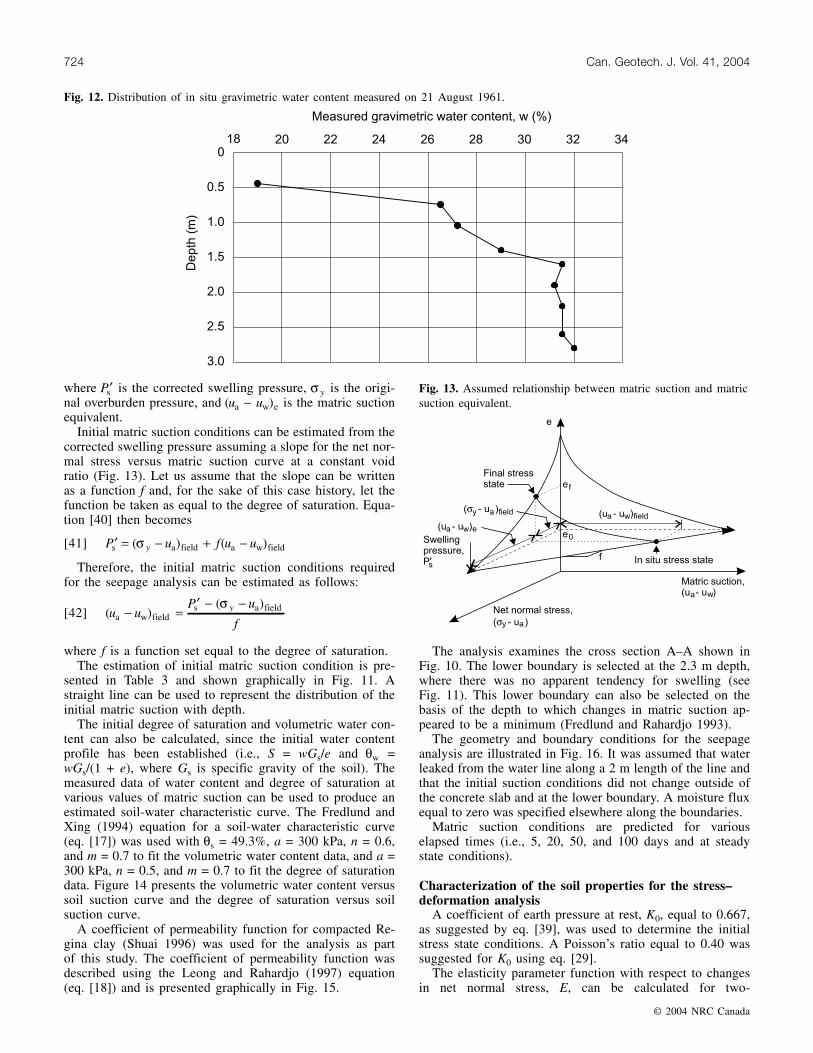
used in the analyses. Figure 11 shows the distribution of thecorrected swelling pressure with depth. A straight line canbe used to represent the apparent distribution of the cor-rected swelling pressure with depth. Figure 12 shows thedistribution of gravimetric water content with depth mea-sured on 21 August 1961 using a neutron moisture meter ac-cess tube.
This case history would be best modelled as a three-dimensional problem; however, a simpler two-dimensional
analysis is used to illustrate the method for the prediction ofheave proposed in this paper.
Characterization of the soil properties with the seepageanalysis
A seepage analysis was performed to predict changes inmatric suction conditions in the soil. The initial matric suc-tion conditions are estimated from the corrected swellingpressures. An approximate soil-water characteristic curvewas defined using measured water contents at various valuesof soil suction.
The corrected swelling pressure is the sum of the overbur-den pressure and the matric suction equivalent and is writtenas follows (Fredlund and Rahardjo 1993):
[40] P u u uys a field a w e′ = − + −( ) ( )σ
© 2004 NRC Canada
Vu and Fredlund 723
Fig. 10. Floor plan of study site and contours of measured heave (Yoshida et al. 1983). DBM, depth benchmark; GMG1–GMG3,ground movement gauges; NMM, neutron moisture meter.
Fig. 11. Distribution of corrected swelling pressure and estimated initial matric suction with depth.
Depth (m)Initial voidratio, e0
Swellingindex, Cs
Corrected swellingpressure, Ps′ (kPa)
0.69 0.927 0.095 4901.34 0.985 0.081 3252.20 0.974 0.094 81
Table 2. Constant-volume oedometer data (Yoshida et al. 1983).
where Ps′ is the corrected swelling pressure, σ y is the origi-nal overburden pressure, and ( )u ua w e− is the matric suctionequivalent.
Initial matric suction conditions can be estimated from thecorrected swelling pressure assuming a slope for the net nor-mal stress versus matric suction curve at a constant voidratio (Fig. 13). Let us assume that the slope can be writtenas a function f and, for the sake of this case history, let thefunction be taken as equal to the degree of saturation. Equa-tion [40] then becomes
[41] P u f u uys a field a w field′ = − + −( ) ( )σ
Therefore, the initial matric suction conditions requiredfor the seepage analysis can be estimated as follows:
[42] ( )( )
u uP u
fy
a w fields a field− =′ − −σ
where f is a function set equal to the degree of saturation.The estimation of initial matric suction condition is pre-
sented in Table 3 and shown graphically in Fig. 11. Astraight line can be used to represent the distribution of theinitial matric suction with depth.
The initial degree of saturation and volumetric water con-tent can also be calculated, since the initial water contentprofile has been established (i.e., S = wGs/e and θw =wGs/(1 + e), where Gs is specific gravity of the soil). Themeasured data of water content and degree of saturation atvarious values of matric suction can be used to produce anestimated soil-water characteristic curve. The Fredlund andXing (1994) equation for a soil-water characteristic curve(eq. [17]) was used with θs = 49.3%, a = 300 kPa, n = 0.6,and m = 0.7 to fit the volumetric water content data, and a =300 kPa, n = 0.5, and m = 0.7 to fit the degree of saturationdata. Figure 14 presents the volumetric water content versussoil suction curve and the degree of saturation versus soilsuction curve.
A coefficient of permeability function for compacted Re-gina clay (Shuai 1996) was used for the analysis as partof this study. The coefficient of permeability function wasdescribed using the Leong and Rahardjo (1997) equation(eq. [18]) and is presented graphically in Fig. 15.
The analysis examines the cross section A–A shown inFig. 10. The lower boundary is selected at the 2.3 m depth,where there was no apparent tendency for swelling (seeFig. 11). This lower boundary can also be selected on thebasis of the depth to which changes in matric suction ap-peared to be a minimum (Fredlund and Rahardjo 1993).
The geometry and boundary conditions for the seepageanalysis are illustrated in Fig. 16. It was assumed that waterleaked from the water line along a 2 m length of the line andthat the initial suction conditions did not change outside ofthe concrete slab and at the lower boundary. A moisture fluxequal to zero was specified elsewhere along the boundaries.
Matric suction conditions are predicted for variouselapsed times (i.e., 5, 20, 50, and 100 days and at steadystate conditions).
Characterization of the soil properties for the stress–deformation analysis
A coefficient of earth pressure at rest, K0, equal to 0.667,as suggested by eq. [39], was used to determine the initialstress state conditions. A Poisson’s ratio equal to 0.40 wassuggested for K0 using eq. [29].
The elasticity parameter function with respect to changesin net normal stress, E, can be calculated for two-
© 2004 NRC Canada
724 Can. Geotech. J. Vol. 41, 2004
Fig. 12. Distribution of in situ gravimetric water content measured on 21 August 1961.
Fig. 13. Assumed relationship between matric suction and matricsuction equivalent.
dimensional conditions using eq. [27] for e0 = 0.962, Cs =0.090, and µ = 0.40 and can be written as follows:
[43] E u= −28.11( ave aσ )
The swelling index with respect to changes in matric suc-tion, Cm, was not measured for this case history. It is sug-
gested that a value of Cs be used for Cm, and the initialstress state (IST) and final stress state (FST) from the netnormal stress plane be used as the initial and final matricsuctions for the stress–deformation analysis. The analysisprocedure is illustrated in Fig. 17.
The elasticity parameter function with respect to changesin matric suction, H, can be calculated for two-dimensional
© 2004 NRC Canada
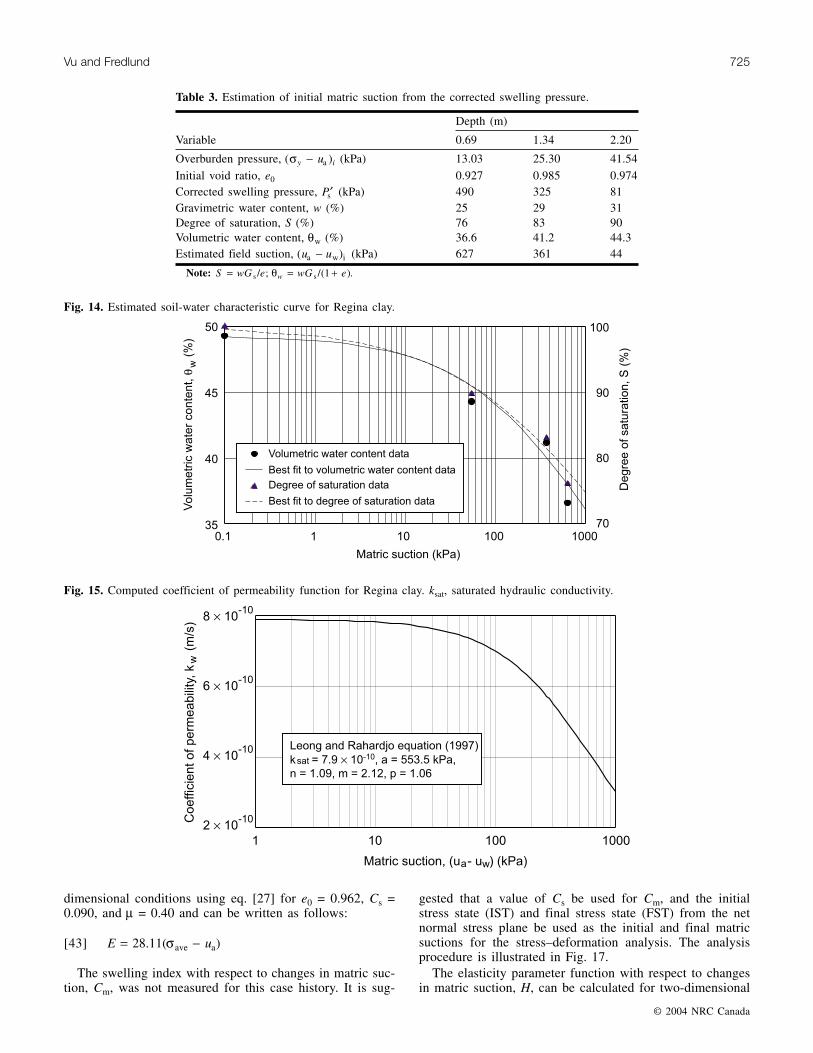
Vu and Fredlund 725
Depth (m)
Variable 0.69 1.34 2.20
Overburden pressure, ( )σy iu− a (kPa) 13.03 25.30 41.54
Initial void ratio, e0 0.927 0.985 0.974Corrected swelling pressure, Ps′ (kPa) 490 325 81Gravimetric water content, w (%) 25 29 31Degree of saturation, S (%) 76 83 90Volumetric water content, θw (%) 36.6 41.2 44.3Estimated field suction, ( )u ua w i− (kPa) 627 361 44
Note: S wG e wG ew= = +s s/ ; /( ).θ 1
Table 3. Estimation of initial matric suction from the corrected swelling pressure.
Fig. 14. Estimated soil-water characteristic curve for Regina clay.
Fig. 15. Computed coefficient of permeability function for Regina clay. ksat, saturated hydraulic conductivity.

conditions using eq. [28] for e0 = 0.962, Cm = 0.090, and µ =0.40 and can be written as follows:
[44] H u u= −140.5( a w)
The in situ stress state (IST) is the sum of net normalstress and matric suction equivalent and can be written asfollows for a two-dimensional analysis:
[45] IST ave a i i a w i= − + −( ) ( )σ u f u u
or
[46] IST a i i a w i= + − + −12
0Ku f u uy( ) ( )σ
The final stress state (FST) can be written as follows:
[47] FST ave a f f a w f= − + −( ) ( )σ u f u u
or
[48] FST a i ave a f a w f= + − + − + −12
0Ku u f u uy( ) ( ) ( )σ σ∆
Deformation of the slab associated with this case was dueto applied load and wetting. Deformation of the slab and inthe soil mass due to loading can be assumed to respond im-mediately, whereas the deformations due to wetting are atime-dependent process. Therefore, the stress–deformationsdue to loading and wetting need to be analyzed independ-ently. Figure 18 shows the stress path followed in the analy-
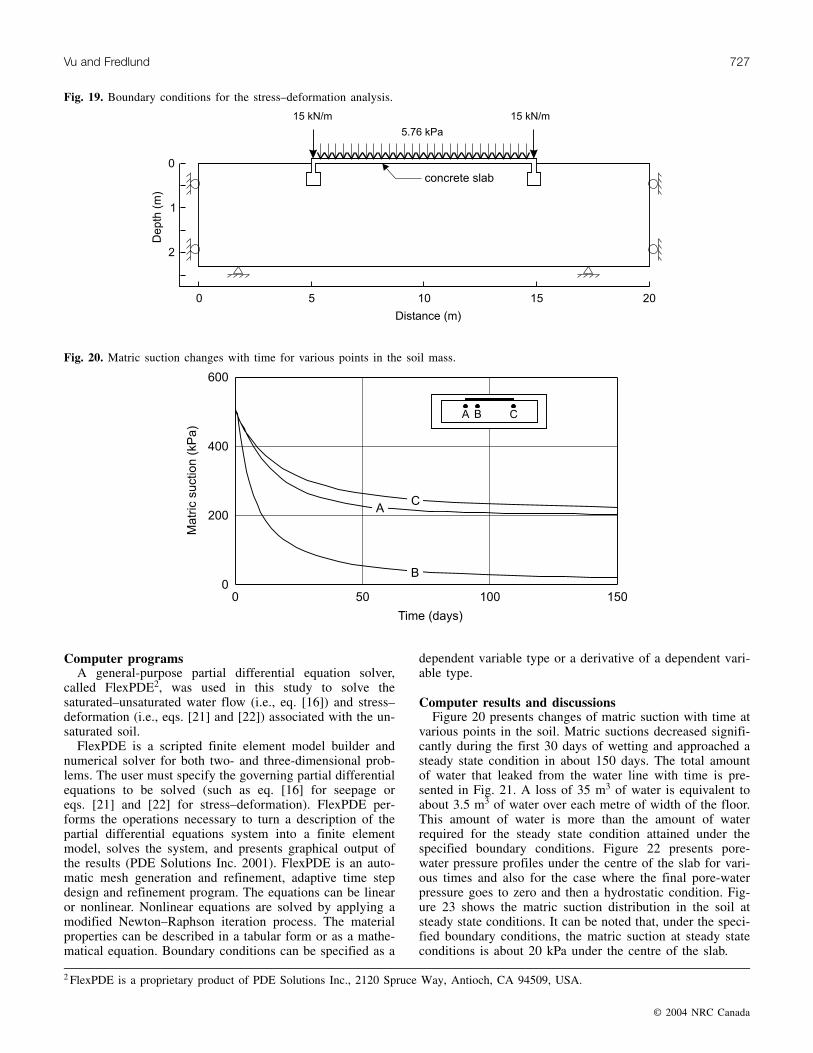
sis. The stress–deformation analysis was first performed topredict the displacements and induced stress due to the load-ing of the slab. The deformations due to changes in matricsuction were then predicted for various elapsed times usingmatric suction profiles obtained from the seepage analysis.The stress–deformation analysis is also performed for thecases when pore-water pressure goes to zero and when thegroundwater level rises to the ground surface, resulting ina hydrostatic pore-water pressure distribution. Hydrostaticconditions present the upper limits for total heave.
Figure 19 shows the geometry and boundary conditionsfor the stress–deformation analysis. A load equal to 5.76 kPais applied on the surface of a 100 mm thick concrete slab.This surcharge is made up of 180 mm of fill with a unitweight of 18.88 kN/m3 and 100 mm of concrete with a unitweight of 23.6 kN/m3. An accurate perimeter load is un-known, however, a typical value of 15 kN/m was assumed.The perimeter load includes the weight of footing and theload of the upper structure. The soil is free to move in a ver-tical direction and fixed in the horizontal direction at the leftand right sides of the domain. The lower boundary is fixedin both directions. A Young’s modulus of 10 GPa and Pois-son’s ratio of 0.15 were used for the concrete slab.
A parametric study was also performed to show the effectof varying Poisson’s ratio, swelling index, initial void ratio,coefficient of earth pressure at rest, and stiffness of the con-crete slab on the predicted results.
© 2004 NRC Canada
726 Can. Geotech. J. Vol. 41, 2004
Fig. 16. Geometry and boundary conditions for seepage analysis. q, boundary flux.
Fig. 17. Illustration of the use of initial stress state (IST), finalstress state (FST), and swelling index obtained at net normalstress plane (Cs) for suction stress path.
Fig. 18. Stress path followed in the stress–deformation analysis.
Computer programsA general-purpose partial differential equation solver,
called FlexPDE2, was used in this study to solve thesaturated–unsaturated water flow (i.e., eq. [16]) and stress–deformation (i.e., eqs. [21] and [22]) associated with the un-saturated soil.
FlexPDE is a scripted finite element model builder andnumerical solver for both two- and three-dimensional prob-lems. The user must specify the governing partial differentialequations to be solved (such as eq. [16] for seepage oreqs. [21] and [22] for stress–deformation). FlexPDE per-forms the operations necessary to turn a description of thepartial differential equations system into a finite elementmodel, solves the system, and presents graphical output ofthe results (PDE Solutions Inc. 2001). FlexPDE is an auto-matic mesh generation and refinement, adaptive time stepdesign and refinement program. The equations can be linearor nonlinear. Nonlinear equations are solved by applying amodified Newton–Raphson iteration process. The materialproperties can be described in a tabular form or as a mathe-matical equation. Boundary conditions can be specified as a
dependent variable type or a derivative of a dependent vari-able type.
Computer results and discussionsFigure 20 presents changes of matric suction with time at
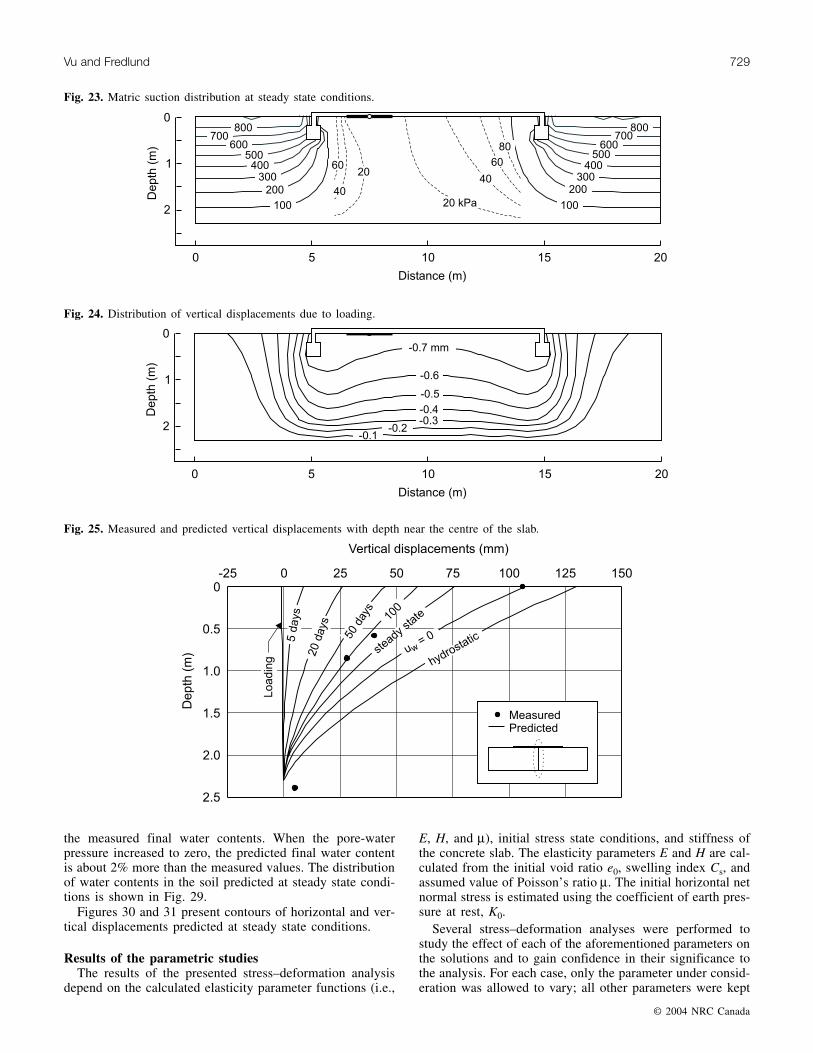
various points in the soil. Matric suctions decreased signifi-cantly during the first 30 days of wetting and approached asteady state condition in about 150 days. The total amountof water that leaked from the water line with time is pre-sented in Fig. 21. A loss of 35 m3 of water is equivalent toabout 3.5 m3 of water over each metre of width of the floor.This amount of water is more than the amount of waterrequired for the steady state condition attained under thespecified boundary conditions. Figure 22 presents pore-water pressure profiles under the centre of the slab for vari-ous times and also for the case where the final pore-waterpressure goes to zero and then a hydrostatic condition. Fig-ure 23 shows the matric suction distribution in the soil atsteady state conditions. It can be noted that, under the speci-fied boundary conditions, the matric suction at steady stateconditions is about 20 kPa under the centre of the slab.
© 2004 NRC Canada
Vu and Fredlund 727
Fig. 19. Boundary conditions for the stress–deformation analysis.
Fig. 20. Matric suction changes with time for various points in the soil mass.
2 FlexPDE is a proprietary product of PDE Solutions Inc., 2120 Spruce Way, Antioch, CA 94509, USA.

© 2004 NRC Canada
728 Can. Geotech. J. Vol. 41, 2004
Figure 24 shows contours of vertical displacement due toloading. Less than 1 mm of settlement is predicted due tothe loading at the centre of the slab. The induced net normalstress was used to calculate the final net normal stress statein the soil. Also, the soil was loaded at initial net normalstress and matric suction conditions in the field. Therefore,the sum of initial net normal stress and initial matric suctionequivalent must be used along with the swelling index ob-tained on the net normal stress plane for the prediction ofdisplacements and induced stresses due to loading.
Figure 25 compares the predicted vertical displacementsat various final suction conditions with the measured totalheave at the centre of the slab. The agreement between thepredicted and the measured heave at different depths differsto some degree. The amounts of heave measured at depthsof 0.58 and 0.85 m correspond to the predicted heave at100 days, and the total heave of 106 mm at ground surfacecorresponds to the case when the pore-water pressure goesto zero under the slab. It must be noted that a heave of
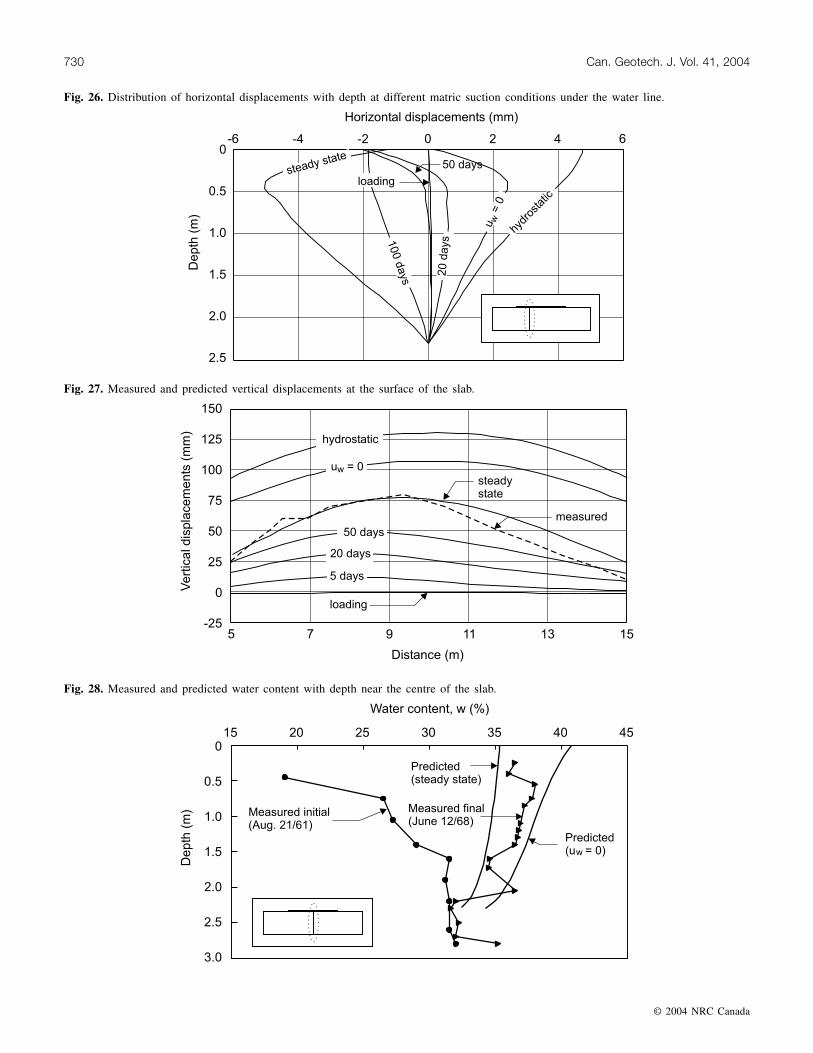
106 mm represents the maximum heave observed on theslab. The maximum heave observed at the cross section un-der consideration is only 80 mm (see Fig. 10). The distribu-tion of horizontal displacements at different final suctionconditions right under the water line is presented in Fig. 26.
Figure 27 compares the predicted vertical displacement atvarious final matric suction conditions with the measured to-tal heave at the top surface of the slab. The total heave pre-dicted under steady state conditions agrees well with themeasured heave. It should be noted that there were some un-known loads placed near the perimeter of the floor slab, andthis was not considered in the study. Assuming that the finalpore-water pressure increases from a negative value to zeroresults in a maximum predicted heave of 107 mm. A maxi-mum heave of 130 mm is predicted for the case when thefinal pore-water pressures are assumed to be hydrostatic.
Figure 28 shows the measured and predicted water con-tents under the centre of the slab. The final water contentspredicted at steady state conditions are about 3% less than
Fig. 21. Total amount of water leaked from water line with time per metre of cross section.
Fig. 22. Pore-water pressure profiles for various times and for the cases where final pore-water pressure is assumed to be zero and hy-drostatic.
the measured final water contents. When the pore-waterpressure increased to zero, the predicted final water contentis about 2% more than the measured values. The distributionof water contents in the soil predicted at steady state condi-tions is shown in Fig. 29.
Figures 30 and 31 present contours of horizontal and ver-tical displacements predicted at steady state conditions.
Results of the parametric studiesThe results of the presented stress–deformation analysis
depend on the calculated elasticity parameter functions (i.e.,
E, H, and µ), initial stress state conditions, and stiffness ofthe concrete slab. The elasticity parameters E and H are cal-culated from the initial void ratio e0, swelling index Cs, andassumed value of Poisson’s ratio µ. The initial horizontal netnormal stress is estimated using the coefficient of earth pres-sure at rest, K0.
Several stress–deformation analyses were performed tostudy the effect of each of the aforementioned parameters onthe solutions and to gain confidence in their significance tothe analysis. For each case, only the parameter under consid-eration was allowed to vary; all other parameters were kept
© 2004 NRC Canada
Vu and Fredlund 729
Fig. 23. Matric suction distribution at steady state conditions.
Fig. 24. Distribution of vertical displacements due to loading.
Fig. 25. Measured and predicted vertical displacements with depth near the centre of the slab.
© 2004 NRC Canada
730 Can. Geotech. J. Vol. 41, 2004
Fig. 26. Distribution of horizontal displacements with depth at different matric suction conditions under the water line.
Fig. 27. Measured and predicted vertical displacements at the surface of the slab.
Fig. 28. Measured and predicted water content with depth near the centre of the slab.

unchanged at the values used for the “base case.” Table 4shows the values of the parameters that were used in theparametric study. It should be noted that the relationship be-tween Poisson’s ratio and the coefficient of earth pressure atrest (i.e., eq. [29]) was not considered in the parametric
studies. The displacements are only calculated for steadystate conditions of matric suction.
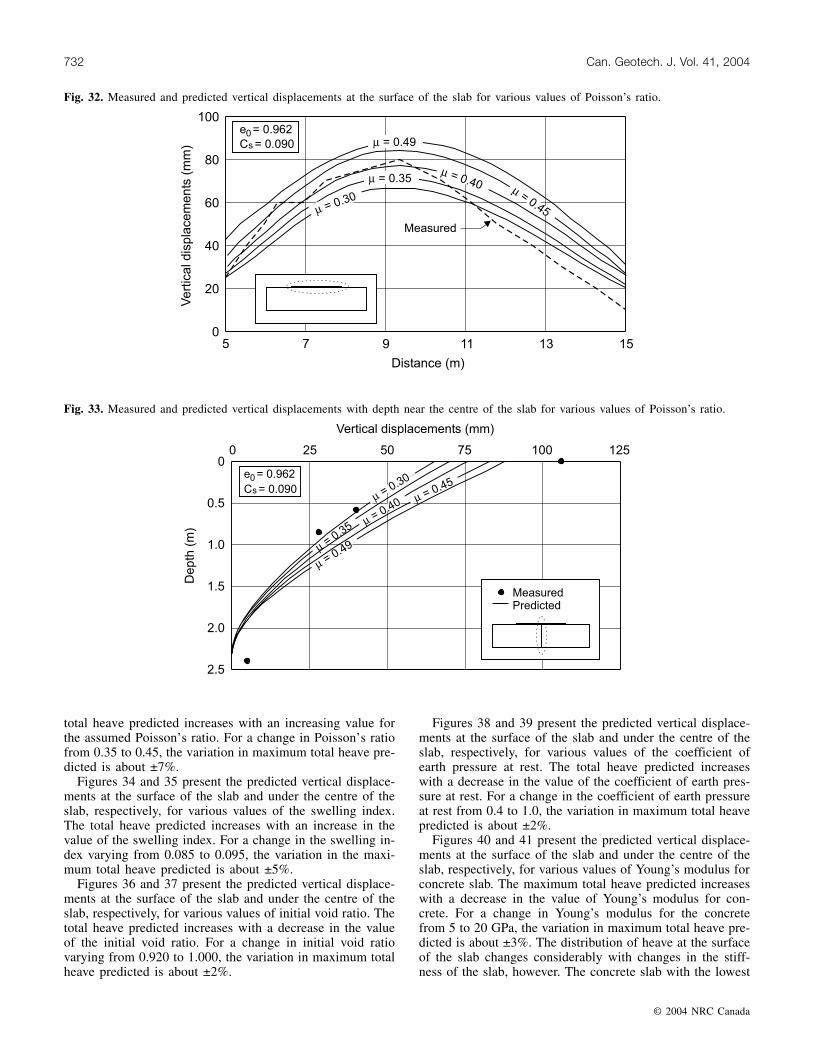
Figures 32 and 33 present the predicted vertical displace-ments at the surface of the slab and under the centre of theslab, respectively, for various values of Poisson’s ratio. The
© 2004 NRC Canada
Vu and Fredlund 731
Fig. 29. Distribution of gravimetric water content at steady state conditions.
Fig. 30. Distribution of horizontal displacements at steady state conditions.
Fig. 31. Distribution of vertical displacements at steady state conditions.
Parameter Lower values Base case Upper values
Poisson’s ratio, µ 0.30, 0.35 0.40 0.45, 0.49Swelling index, Cs 0.085 0.090 0.095, 0.100Initial void ratio, e0 0.920 0.962 1.000Coefficient of earth pressure at rest, K0 0.400 0.667 1.000Young’s modulus of concrete, Ec (GPa) 5 10 20
Table 4. Values of parameters used in the parametric study.
© 2004 NRC Canada
732 Can. Geotech. J. Vol. 41, 2004
total heave predicted increases with an increasing value forthe assumed Poisson’s ratio. For a change in Poisson’s ratiofrom 0.35 to 0.45, the variation in maximum total heave pre-dicted is about ±7%.
Figures 34 and 35 present the predicted vertical displace-ments at the surface of the slab and under the centre of theslab, respectively, for various values of the swelling index.The total heave predicted increases with an increase in thevalue of the swelling index. For a change in the swelling in-dex varying from 0.085 to 0.095, the variation in the maxi-mum total heave predicted is about ±5%.
Figures 36 and 37 present the predicted vertical displace-ments at the surface of the slab and under the centre of theslab, respectively, for various values of initial void ratio. Thetotal heave predicted increases with a decrease in the valueof the initial void ratio. For a change in initial void ratiovarying from 0.920 to 1.000, the variation in maximum totalheave predicted is about ±2%.
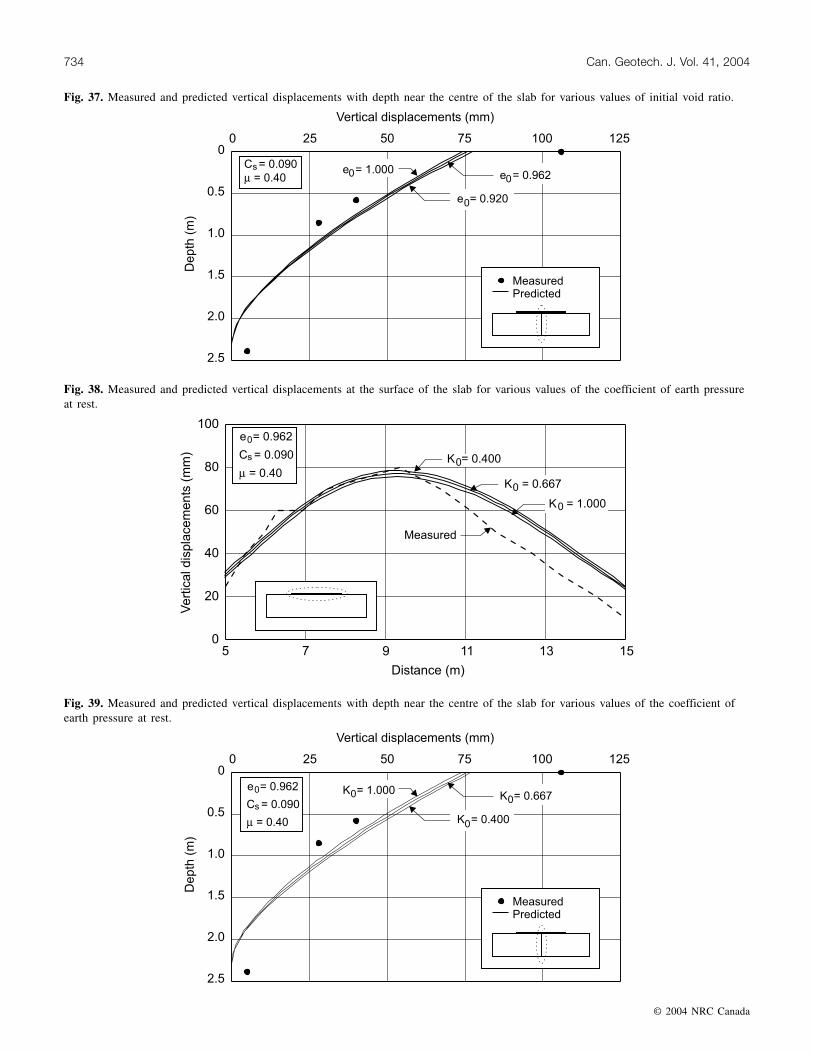
Figures 38 and 39 present the predicted vertical displace-ments at the surface of the slab and under the centre of theslab, respectively, for various values of the coefficient ofearth pressure at rest. The total heave predicted increaseswith a decrease in the value of the coefficient of earth pres-sure at rest. For a change in the coefficient of earth pressureat rest from 0.4 to 1.0, the variation in maximum total heavepredicted is about ±2%.
Figures 40 and 41 present the predicted vertical displace-ments at the surface of the slab and under the centre of theslab, respectively, for various values of Young’s modulus forconcrete slab. The maximum total heave predicted increaseswith a decrease in the value of Young’s modulus for con-crete. For a change in Young’s modulus for the concretefrom 5 to 20 GPa, the variation in maximum total heave pre-dicted is about ±3%. The distribution of heave at the surfaceof the slab changes considerably with changes in the stiff-ness of the slab, however. The concrete slab with the lowest
Fig. 32. Measured and predicted vertical displacements at the surface of the slab for various values of Poisson’s ratio.
Fig. 33. Measured and predicted vertical displacements with depth near the centre of the slab for various values of Poisson’s ratio.

© 2004 NRC Canada
Vu and Fredlund 733
Fig. 35. Measured and predicted vertical displacements with depth near the centre of the slab for various values of swelling index.
Fig. 34. Measured and predicted vertical displacements at the surface of the slab for various values of swelling index.
Fig. 36. Measured and predicted vertical displacements at the surface of the slab for various values of initial void ratio.
© 2004 NRC Canada
734 Can. Geotech. J. Vol. 41, 2004
Fig. 37. Measured and predicted vertical displacements with depth near the centre of the slab for various values of initial void ratio.
Fig. 38. Measured and predicted vertical displacements at the surface of the slab for various values of the coefficient of earth pressureat rest.
Fig. 39. Measured and predicted vertical displacements with depth near the centre of the slab for various values of the coefficient ofearth pressure at rest.

Young’s modulus would suffer more differential heave. Thecracking of the slab may result in a larger amount of maxi-mum heave.
The results of the parametric study are summarized in Ta-ble 5. It can be seen that the swelling index and Poisson’sratio are the factors that have the greatest effect on the solu-tion. The value of Young’s modulus for concrete appears tocontrol the shape of the deformed slab.
Conclusions
The proposed method for the prediction of heave based onthe general theory of unsaturated soil provides a practicalmeans of predicting multidimensional heave in unsaturated,expansive soils. Changes in matric suction (or pore-waterpressure) in the soil mass are estimated through a saturated–unsaturated seepage analysis. Displacements due to loading
© 2004 NRC Canada
Vu and Fredlund 735
Fig. 40. Measured and predicted vertical displacements at the surface of the slab for various values of Young’s modulus for concreteslab, Ec.
Fig. 41. Measured and predicted vertical displacements with depth below the water line for various values of Young’s modulus forconcrete slab.
Parameter Range
Variation ofpredictedheave (%)
Poisson’s ratio, µ 0.35–0.45 ±7Swelling index, Cs 0.085–0.950 ±5Initial void ratio, e0 0.92–1.00 ±2Coefficient of earth pressure at rest, K0 0.4–1.0 ±2Young’s modulus of concrete, Ec (GPa) 5–20 ±3
Table 5. Results of the parametric study.
and changes in matric suction are predicted using a stress–deformation analysis. The elasticity parameter functions re-quired for the stress–deformation analysis can be calculatedfrom conventional oedometer test results.
Verification of the proposed method is accomplished us-ing data collected for the case history of a floor slab in alight industrial building on Regina clay. The predicted re-sults appear to be in reasonable agreement with measuredvalues.
The results of the analysis show that the predicted heavein two dimensions is somewhat sensitive to the assumedvalue of Poisson’s ratio and the measured swelling index.The predicted heave for the case history presented in thisstudy is insignificantly affected by the initial void ratio mea-sured in the laboratory and the coefficient of earth pressureat rest.
References
Aitchison, G.D., and Martin, R. 1973. A membrane oedometer forcomplex stress-path studies in expansive clays. In Proceedingsof the 3rd International Conference on Expansive Soils, Haifa,Israel, 30 July – 1 August 1973. Academic Press, Jerusalem.Vol. 2, pp. 83–88.
Aitchison, G.D., and Woodburn, J.A. 1969. Soil suction in founda-tion design. In Proceedings of the 7th International Conferenceon Soil Mechanics and Foundation Engineering, Mexico City,25–29 August 1969. A.A. Balkema, Rotterdam, The Netherlands.Sociadad Mexicana de Meamia de Suelos, Mexico. pp. 1–8.
Alonso, E.E., Batlle, F., Gens A., and Lloret, A. 1988. Consolida-tion analysis of partially saturated soils. Application to earthdamconstruction. In Proceedings of the 6th International Conferenceon Numerical Methods in Geomechanics, Innsbruck, Austria,11–15 April 1988. Edited by G.A. Swoboda. A.A. Balkema,Rotterdam, The Netherlands. pp. 1303–1308.
Al-Shamrani, M.A., and Al-Mhaidib, A.I. 2000. Swelling behav-iour under oedometric and triaxial loading conditions. In Ad-vances in Unsaturated Geotechnics: Proceedings of Sessions ofGeo-Denver 2000, Denver, Colo., 5–8 August 2000. Edited byC.D. Shackelford, S.L. Houston, and N.-Y. Chang. AmericanSociety of Civil Engineers, Geotechnical Special Publication 99,Reston, VA. pp. 344–360.
ASTM. 1996a. Standard test methods for one-dimensional swell orsettlement potential of cohesive soils (D4546). In 2003 ASTMStandards on Disc, vol. 04.08. American Society for Testing andMaterials (ASTM), West Conshohocken, Pa.
ASTM. 1996b. Standard test methods for one-dimensional consoli-dation properties of soils (D2435). In 2003 ASTM Standards onDisc, vol. 04.08. American Society for Testing and Materials(ASTM), West Conshohocken, Pa.
ASTM. 1998. Standard test methods for shrinkage factors of soilsby the mercury method (D427). In 2003 ASTM Standards onDisc, vol. 04.08. American Society for Testing and Materials(ASTM), West Conshohocken, Pa.
Biot, M.A. 1941. General theory of three-dimensional consolida-tion. Journal of Applied Physics, 12(2): 155–164.
Blight, G.E. 2003. The vadose zone soil-water balance and transpi-ration rates of vegetation. Géotechnique, 53(1): 55–64.
Fredlund, D.G. 1979. Second Canadian geotechnical colloquium:Appropriate concepts and technology for unsaturated soils. Ca-nadian Geotechnical Journal, 16: 121–139.
Fredlund, D.G. 2000. Historical developments and milestones inunsaturated soil mechanics. In Unsaturated Soils for Asia: Pro-
ceedings of the 1st Asian Conference on Unsaturated Soils(UNSAT-ASIA 2000), Singapore, 18–19 May 2000. Edited byH. Rahardjo, D.G. Toll, and E.C. Leong. A.A. Balkema, Rotter-dam, The Netherlands. pp. 53–68.
Fredlund, D.G., and Morgenstern, N.R. 1977. Stress state variablesfor unsaturated soils. Journal of the Geotechnical EngineeringDivision, ASCE, 103: 447–466.
Fredlund, D.G., and Rahardjo, H. 1993. Soil mechanics for unsatu-rated soils. John Wiley & Sons, New York.
Fredlund, D.G., and Xing, A. 1994. Equations for the soil-watercharacteristic curve. Canadian Geotechnical Journal, 31: 521–532.
Fredlund, D.G., Hasan, J.U., and Filson, H. 1980. The predictionof total heave. In Proceedings of the 4th International Confer-ence on Expansive Soils, Denver, Colo., 16–18 June 1980.American Society of Civil Engineers, New York. Vol. 1, pp. 1–17.
Fredlund, D.G., Xing, A., and Huang, S. 1994. Predicting the per-meability function for unsaturated soils using the soil-watercharacteristic curve. Canadian Geotechnical Journal. 31: 533–546.
Freeze, R.A., and Cherry, J.A. 1979. Groundwater. Prentice-HallInc., Englewood Cliffs, N.J.
Gardner, W.R. 1958. Some steady state solutions of the unsaturatedmoisture flow equation with application to evaporation from awater table. Soil Science, 85: 228–232.
Graham, J., and Li, E.C.C. 1985. Comparison of natural and re-molded plastic clay. Journal of Geotechnical Engineering,ASCE, 111(7): 865–881.
Ho, D.Y.F., Fredlund, D.G., and Rahardjo, H. 1992. Volumechange indices during loading and unloading of an unsaturatedsoil. Canadian Geotechnical Journal, 29: 195–207.
Holtz, W.G., and Gibbs, H.J. 1956. Engineering properties ofexpansive clays. Transactions of the American Society of CivilEngineers, 121: 641–663.
Jaky, J. 1944. The coefficient of earth pressure at rest. Journal ofthe Society of Hungarian Architects and Engineers, 78(22):355–358.
Jennings, J.E., and Knight, K. 1957. The prediction of total heavefrom the double oedometer test. In Proceedings of the Sympo-sium on Expansive Clays, Johannesburg, September 1957. SouthAfrican Institute of Civil Engineers, Johannesburg. Vol. 7,No. 9, pp. 13–19.
Leong, E.C., and Rahardjo, H. 1997. Permeability functions for un-saturated soils. Journal of Geotechnical and GeoenvironmentalEngineering, ASCE, 123(12): 1118–1126.
Lytton, R.L. 1977. Foundation on expansive soils. In Numericalmethods in geotechnical engineering. Edited by C.S. Desai andJ.T. Christian. McGraw-Hill, New York. pp. 427–457.
Lytton, R.L. 1994. Prediction of movement in expansive clay. InVertical and Horizontal Deformations of Foundations and Em-bankments: Proceedings of Settlement ‘94, College Station,Tex., 16–18 June 1994. Edited by A.T. Yeung and G.Y. Feaalio.American Society of Civil Engineers, Geotechnical Special Pub-lication 40, pp. 1827–1845.
Mayne, P.W., and Kulhawy, F.H. 1982. K0–OCR relationships insoil. Journal of the Geotechnical Engineering Division, ASCE,108(GT6): 851–872.
McKeen, R.G. 1992. A model for predicting expansive soil behav-iour. In Proceedings of the 7th International Conference on Ex-pansive Soils, Dallas, Tex., 3–5 August 1992. American Societyof Civil Engineers, New York. Texas Tech University Press,Lubbock. Vol. 1, pp. 1–6.
© 2004 NRC Canada
736 Can. Geotech. J. Vol. 41, 2004

© 2004 NRC Canada
Vu and Fredlund 737
Miranda, A.N. 1988. Behaviour of small earth dams during initialfilling. Ph.D. dissertation, Colorado State University, Fort Col-lins, Colo.
PDE Solutions Inc. 2001. FlexPDE 3 reference manual. PDE Solu-tions Inc., Antioch, Calif.
Pereira, J.H.F., and Fredlund, D.G. 2000. Volume change behaviorof a residual soil of gneiss compacted at metastable-structuredconditions. Journal of Geotechnical and Geoenvironmental En-gineering, ASCE, 126: 907–916.
Perko, H.A., Thompson, R.W., and Nelson, J.D. 2000. Suctioncompression index based on CLOD test results. In Advances inUnsaturated Geotechnics: Proceedings of Sessions of Geo-Denver 2000, Denver, Colo., 5–8 August 2000. Edited by C.D.Shackelford, S.L. Houston, and N.-Y. Chang. American Societyof Civil Engineers, Geotechnical Special Publication 99, Reston,VA, pp. 393–408.
Richards, B.G. 1966. Moisture flow and equilibria in unsaturatedsoils for shallow foundation. In Symposium on Permeability andCapillarity in Soils, Atlantic City. American Society for Testingand Materials, Special Technical Publication STP 417, Philadel-phia, pp. 185–191.
Richards, B.G., Peter, P., and Martin, R. 1984. The determinationof volume change properties in expansive soils. In Proceedingsof the 5th International Conference on Expansive Soils, Ade-laide, Australia, 21–23 May 1984. The Institution, Barton,A.T.C. pp. 179–186.
Shuai, F. 1996. Simulation of swelling pressure measurements onexpansive soils. Ph.D. dissertation, University of Saskatchewan,Saskatoon, Sask.
Sillers, W.S., and Fredlund, D.G. 2001. Statistical assessment ofsoil-water characteristic curve models for geotechnical engineer-ing. Canadian Geotechnical Journal, 38: 1297–1313.
Sillers, W.S., Fredlund, D.G., and Zakerzadeh, N. 2001. Mathemat-ical attributes of some soil-water characteristic curve models.Journal of Geotechnical and Geological Engineering, 19: 243–283.
Snethen, D.R. 1980. Characterization of expansive soils using soilsuction data. In Proceedings of the 4th International Conferenceon Expansive Soils, Denver, Colo., 16–18 June 1980. AmericanSociety of Civil Engineers, New York. Vol. 1, pp. 54–75.
Sullivan, R.A., and McClelland B. 1969. Predicting heave of build-ings on unsaturated clay. In Proceedings of the 2nd Conferenceon Expansive Clay Soils, College Station, Texas. American So-ciety of Civil Engineers, New York. pp. 404–420.
van Genuchten, M.T. 1980. A closed-form equation for predictingthe hydraulic conductivity of unsaturated soils. Soil Science So-ciety of America Journal, 44: 892–898.
Vu, H.Q. 2000. Finite element method for the prediction of volumechange in expansive soils. M.Sc. thesis, Department of Civil En-gineering, University of Saskatchewan, Saskatoon, Sask.
Vu, H.Q. 2003. Uncoupled and coupled solutions of volumechange problems in expansive soils. Ph.D. thesis, Department ofCivil Engineering, University of Saskatchewan, Saskatoon,Sask.
Vu, H.Q., and Fredlund, D.G. 2003. Uncoupled and coupled solu-tions of two-dimensional swelling in expansive soils. In Pro-ceedings of the 2nd Asian Conference on Unsaturated Soils(UNSAT-ASIA 2003), Osaka, Japan, 10–12 November 2003.Edited by D. Karube, A. Iizuka, S. Kato, K. Kawai, and K.Tateyama. The organizing committee of UNSAT-ASIA, The Jap-anese Geotechnical Society, Tokyo, Japan. pp. 53–58.
Wilson, G.W., Fredlund, D.G., and Barbour, S.L. 1994. Coupledsoil–atmosphere modelling for soil evaporation. Canadian Geo-technical Journal, 31: 151–161.
Wilson, G.W., Fredlund, D.G., and Barbour, S.L. 1997. The effectof soil suction on evaporative fluxes from soil surfaces. Cana-dian Geotechnical Journal, 34: 145–155.
Wroth, C.P. 1979. Correlations of some engineering properties ofsoils. Acta Informatica, 1: 121–132.
Yoshida, R.T., Fredlund, D.G., and Hamilton, J.J. 1983. The pre-diction of total heave of a slab-on-grade floor on Regina clay.Canadian Geotechnical Journal, 20: 69–81.