forage, more milk (Forage production for small-scale zero ...
MURDOCH RESEARCH REPOSITORY
This is the author’s final version of the work, as accepted for publication following peer review but without the publisher’s layout or pagination.
The definitive version is available at http://dx.doi.org/10.1016/j.scitotenv.2012.12.058
Lymbery, A.J., Kay, G.D., Doupé, R.G., Partridge, G.J. and Norman, H.C. (2013) The potential of a salt-tolerant plant
(Distichlis spicata cv. NyPa Forage) to treat effluent from inland saline aquaculture and provide livestock feed on salt-affected
farmland. Science of The Total Environment, 445-446 . pp. 192-201.
http://researchrepository.murdoch.edu.au/13045/
Copyright: © 2012 Elsevier B.V.
It is posted here for your personal use. No further distribution is permitted.
1
The potential of a salt-tolerant plant (Distichlis spicata cv. NyPa Forage) to treat effluent from inland saline aquaculture and provide livestock feed on salt-affected farmland Alan J. Lymberya,*, Gavin D. Kaya, Robert G. Doupé a, Gavin J. Partridge a,b, Hayley C. Normanc a Fish Health Unit, School of Veterinary and Life Sciences, Murdoch University, South Street, Murdoch WA 6150, Australia b Australian Centre for Applied Aquaculture Research, Challenger Institute of Technology, 1 Fleet Street, Fremantle WA 6160, Australia c CSIRO Animal, Food and Health Sciences, Private Bag 5, Wembley WA 6193, Australia * Corresponding author. Tel. +61 8 9360 7509; fax: +61 8 9360 7512 E-mail address: [email protected]
2
Abstract Dryland salinity is a major problem affecting food production from agricultural land in Australia and throughout the world. Although there is much interest in using saline groundwater to grow marine fish on salt-affected farmland, the disposal of nutrient enriched, saline aquaculture effluent is a major environmental problem. We investigated the potential of the salt-tolerant NyPa Forage plant (Distichlis spicata L. Greene var. yensen-4a) to trap nutrients from saline aquaculture effluent and subsequently to provide a fodder crop for livestock. Sub-surface flow wetlands containing NyPa Forage were constructed and their efficacy in removing total nitrogen, ammonia, nitrite/nitrate, total phosphorus and orthophosphate was monitored under different levels of nutrients and salinity. The wetlands removed 60 – 90% of total nitrogen loads and at least 85% of ammonia, nitrite/nitrate, total phosphorus and orthophosphate loads, with greater efficiency at high nutrient and low salinity levels. The above-ground yield, sodium, crude protein (CP) and in vitro dry matter digestibility (DMD) of NyPa Forage plants were measured after fertilisation with different nutrient levels and cropping at different frequencies. Yield of plants increased with increased nutrient, while nutritive value was greater when nutrients were applied but did not differ among nutrient levels. Yield was not affected by cropping frequency, but nutritive value was greatest when plants were cropped at intervals of 21 or 42 days. At optimum nutrient addition and cropping levels, the plants had a mean CP content of 16.7 % and an in vitro DMD of 67.6 %, equivalent to an energy value of 9.5 MJ kg-1. Assuming an equivalent fibre content and voluntary food intake as grass hay, and no accumulation of other toxic minerals, these nutritive values would be sufficient for maintenance or moderate liveweight gains in dry adult sheep or cattle. Keywords: salinity; inland saline aquaculture; effluent; constructed wetlands; saltland pasture; agri-aquaculture
3
1. Introduction Secondary salinisation, in which human activities lead to high concentrations of ions (principally sodium and chloride) in the landscape, is a major environmental problem affecting freshwater and soil in many arid and semi-arid areas of the world (Ghassemi et al., 1995; Rozema and Flowers, 2008). Secondary salinisation occurs because of rising water tables, as a result of irrigation (irrigation salinity) or land clearing (dryland salinity). It is a particular problem in economically less-developed countries (e.g. India, Tunisia, Morocco, Peru and Bolivia) although more-developed regions, such as Australia, may also be badly affected (Rozema and Flowers, 2008). In Australia, the widespread clearing of native vegetation has resulted in approximately 5.7 M ha of agricultural land being adversely affected by dryland salinity, and this figure may grow to 17 M ha by 2050 (National Land and Water Resources Audit, 2001).
The salinisation of agricultural land in arid regions is largely irreversible because freshwater is not available to leach accumulated salts from the soil. As a result, there is increasing interest in the development of productive uses for salt-affected agricultural land (Rozema and Flowers, 2008; Bennett et al., 2009). Much research has concentrated on the development of salt-tolerant crop and pasture plants for human consumption or livestock production (Glenn et al., 1991; Rogers et al. 2005; Al-Shorepy et al., 2010; Norman et al., 2012; Pearlstein et al., 2012). Another productive option for salt-affected agricultural land is to use saline groundwater for aquaculture (Barson and Barrett-Lennard 1995; Forsberg et al., 1996; Doupé et al., 2003). Inland saline aquaculture not only provides a potentially productive use for land that can no longer support standard agricultural enterprises, but may also be used to defray the cost of surface and subsurface water management (Doupé et al., 2003; Partridge et al., 2008). Aquaculture is the world’s fastest growing food production system and is expected to continue to increase in importance as returns from wild capture fisheries decline (FAO, 2009). The global expansion of aquaculture, however, has often been associated with a variety of negative environmental impacts (Beveridge et al., 1997; Bosma and Verdegem, 2011) and an important consideration in the development of inland saline aquaculture is to prevent any further degradation of land and water resources.
Partridge et al. (2008) reviewed technical constraints on inland saline aquaculture in Australia and identified pond production, using groundwater from established public or private interception schemes, as the most promising option for future development. A small number of farmers in the southern wheatbelt of Western Australia have, for the last 10 years, been producing and selling small quantities (< 50 t/annum) of rainbow trout (Oncorhynchus mykiss) from ponds fed with saline groundwater. Production methods vary from static pond to flow-through systems, with regular feeding of commercial trout pellets (Doupé et al., 2003; Lever et al., 2004). Uneaten food and fish excretion produce nutrient-enriched effluent and the off-farm disposal of this effluent into natural waterways or back to the water table is regarded by resource managers as the most important environmental impact from inland saline aquaculture in Western Australia (Starcevich et al., 2003).
Sub-surface flow wetlands offer a potentially simple and low cost technology for the treatment of nutrient-rich aquaculture effluent, because they exploit the ecological interactions between the components of wetland ecosystems (plants, sediments, and microbial flora and fauna) to trap and store nutrients from wastewater (Lin et al., 2002; Schultz et al., 2003; Lymbery et al., 2006; Vymazal, 2007; Zachritz et al., 2008). Applying a wetland treatment system to effluent from inland saline aquaculture in Australia, however, poses some unique problems. First, the periodic discharge from current production systems of relatively low volumes of water which
4
is both nutrient-enriched and saline restricts the range of plants which can be used. Lymbery et al. (2006) investigated the ability of a subsurface-flow wetland, incorporating the estuarine sedge Juncus krausii, to filter nutrients from inland saline aquaculture effluent. The wetland removed up to 69% of total nitrogen and 89% of total phosphorus, but both growth of the plants and efficiency of nutrient removal were limited by increasing levels of salinity. Second, the large areal loading rates required for efficient nutrient removal by subsurface-flow wetlands (Crites, 1994) may not be economically feasible in an agricultural setting, unless the wetland plants have some productive use. In this context, whole-farm bio-economic analyses have shown that the establishment of saltland pastures can significantly increase farm profitability (O’Connell and Young, 2002) and there has been much recent interest in salt-tolerant fodder plants (Rogers et al. 2005; Masters et al., 2007; Rozema and Flowers 2008). Therefore, a wetland treatment system that could both remove nutrients from aquaculture effluent and provide a suitable fodder crop for livestock holds much promise for the development of an integrated agri-aquaculture system on salt-affected agricultural land. In this study, we investigated the potential of NyPa Forage, a cultivated strain of perennial seagrass Distichlis spicata, to fulfil these dual functions. Distichlis spicata is a C4 halophyte which grows in naturally saline areas throughout the Pacific rim. NyPa Forage is a male clone of D. spicata which has been developed as a livestock fodder plant (Yensen et al. 1985). There is, however, very little information available about either the yield or nutritive value of NyPa Forage, and no information on the ability of the plant to trap nutrients from effluent. There were three parts to the current study: first, we measured the nitrogen and phosphorus load in effluent from a number of inland saline aquaculture farms in Western Australia; second, we determined the efficacy of constructed wetlands incorporating NyPa Forage in removing nitrogen and phosphorus from simulated aquaculture effluent; and finally, we determined the in vitro nutritive value of NyPa Forage after irrigation with effluent. 2. Materials and methods 2.1 Field measurements of nutrients in aquaculture effluent
Water samples were taken from four inland saline aquaculture farms in the south west of Western Australia. These farms were all utilising saline groundwater for semi-intensive pond production of rainbow trout (Onchorhynchus mykiss), as described by Lever et al. (2004). Water obtained from salinised streams or pumped directly from the ground into production ponds was discharged periodically into existing waterways. Production was seasonal, with relatively small numbers of trout being stocked in autumn and harvested in late spring. In all cases trout production was a sideline to the main farm operations. At each farm, four separate water samples were taken at inflow and outflow, over a twenty four hour period, once during autumn (after stocking) and once during spring (before harvest). On location, each water sample was measured for temperature, pH and conductivity, using a handheld YSI 30 (YSI Inc, Yellow Springs, OH). Conductivity measurements were converted to mg L-1 total dissolved solids. Sub-samples of water were then frozen immediately for analysis of total nitrogen (TN) and total phosphorus (TP), or filtered and frozen for analysis of ammonia (NH3), nitrite/nitrate (NO2/NO3), and orthophosphate (OP) by the Marine and Freshwater Research Laboratory (MAFRL) at Murdoch University, using standard methods adapted from the American Public Health Association (APHA, 2005). Water quality measurements are reported as means, standard deviations and ranges over all 32 samples (4 farms
5
x 2 sampling dates x 4 times). To calculate total loads of nitrogen and phosphorus in effluent, mean outflow concentrations for each farm were multiplied by mean outflow rate over the production cycle and divided by the weight of fish harvested. 2.2 Removal of nutrients in experimental wetlands
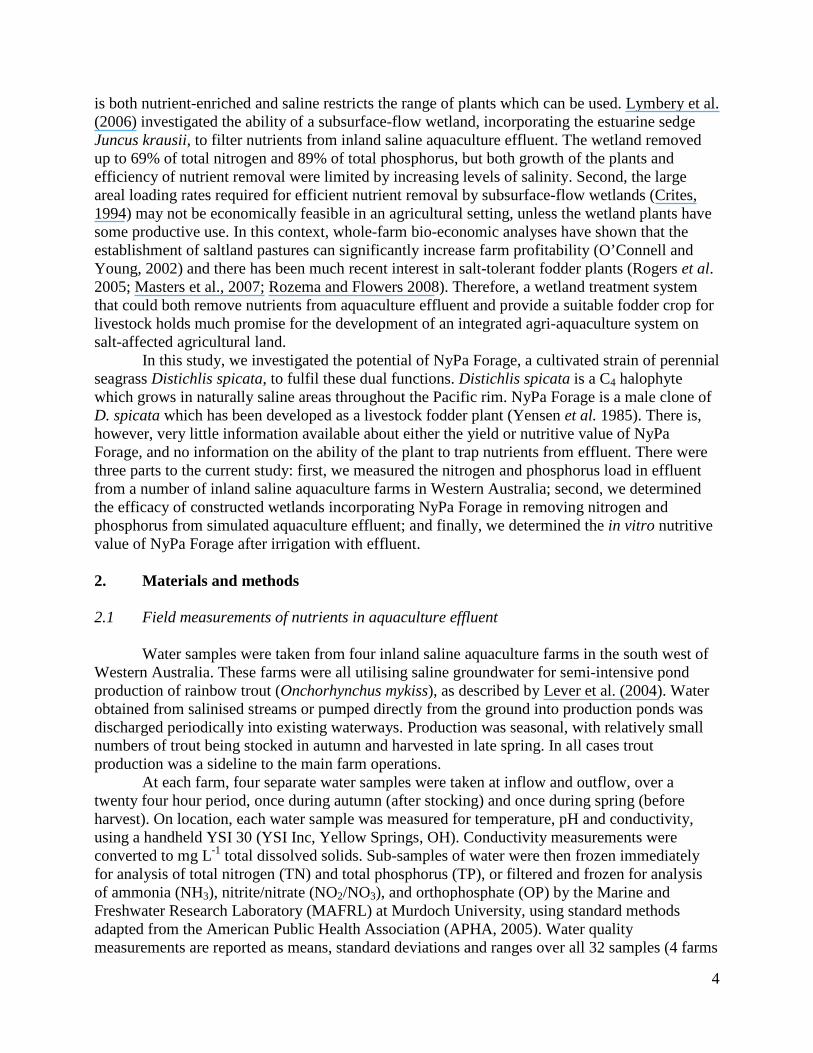
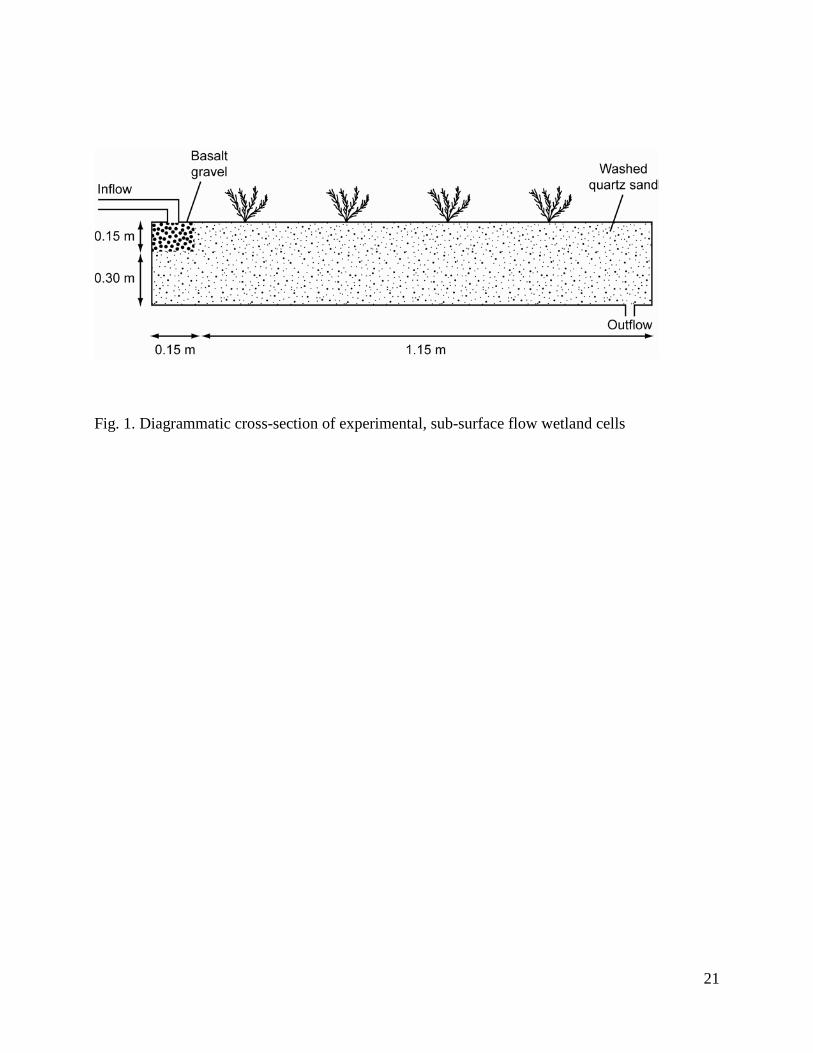
Experiments were conducted in 20, 1.3 m × 0.55 m × 0.45 m elevated wetland cells designed for a horizontal flow (0.05% slope, see Schulz et al., 2003). To each cell we added 0.12 m3 of washed quartz sand (1 mm particle size), with a 0.15 × 0.15 m infiltration area comprising basalt gravel (15 mm particle size) and a discharge/collection point of outflow (Fig. 1). In 16 randomly selected cells, we planted four rooted shoots of NyPa Forage (Distichlis spicata var. yensen-4a) at equal spacings and these were established over a 42 day period using distilled water. The remaining four cells had no plants.
We investigated the effects of different salinity and nutrient levels on the efficacy of the wetland cells to treat aquaculture effluent. Two salinity levels and two nutrient levels were used in a randomised factorial design to create four treatment combinations: high salinity high nutrients (HSHN), low salinity high nutrients (LSHN), high salinity low nutrients (HSLN) and low salinity low nutrients (LSLN). The salinity levels (high 15,000 mg L-1; low 3,000 mg L-1) and nutrient levels (high: 5000 µg L-1 N: 1000 µg L-1 P; low 1000 µg L-1 N: 200 g L-1 P) were chosen to represent the extremes found in field measurements of effluent from inland saline aquaculture farms (see Results). Different salinity levels were created using synthetic sea salt (Flossy SaltTM, W.A. Salt Supplies, Fremantle, Western Australia) added to distilled water, as the ionic composition of saline groundwater in Western Australia is typically similar to seawater, except for deficient concentrations of potassium (Partridge et al. 2008). Different nutrient levels were made from a water soluble commercial fertilizer (PolyfeedTM, Micros Bros, Perth Western Australia), added to distilled water. This fertiliser has a similar total nitrogen and phosphorus composition to effluent from trout farms in Western Australia, although these nutrients are present only in inorganic form. Treatment solutions were made periodically throughout the experiment. Prior to use, all treatment solutions were measured for salinity, TN and TP, as described above, and, if necessary, adjusted to within 500 mg L-1 salinity, 200 µg L-1 TN and 20 µg L-1 TP of the target values. Nitrogen and phosphorus components were also measured periodically (N = 24) in the treatment solutions. Over the course of the experiment, the mean concentrations of these components in the high nutrient solutions were 455.6 µg L-1 NH3 (SD 13.6 µg L-1), 3888.9 µg L-1 NO2/NO3 (SD 68.0 µg L-1) and 966.7 µg L-1 OP (SD 23.6 µg L-1), while the mean concentrations in the low nutrient solutions were 91.1 µg L-1 NH3 (SD 2.7 µg L-
1), 777.8 µg L-1 NO2/NO3 (SD 13.6 µg L-1) and 193.3 µg L-1 OP (SD 4.7 µg L-1). The four unplanted wetland cells were allocated to the HSHN treatment and the 16
planted cells were randomly allocated to each of the four treatments (4 cells per treatment) and watered with 12.0 L of solution, at a rate of 0.2 L s-1, twice weekly. This low hydraulic loading (4.8 L m-2 day-1) was considered appropriate, because most inland saline aquaculture operations in Western Australia operate an essentially closed system, with intermittent, partial water exchange throughout the production cycle (Starcevich et al., 2003; Lymbery et al., 2006). Plants were gradually acclimated to the different salinity and nutrient levels for a further 42 day pre-experimental phase, prior to a test period of 231 days. Before commencement of the test period, plants in all cells were trimmed to a height of 55 mm.
6
During the test period, we measured the effects of salinity and nutrient levels on the removal of TN, NH3, NO2/NO3, TP and OP by the wetland cells. To measure removal efficiency, we sampled inflow and outflow waters from each cell at days 10, 38, 66, 94, 164, 192 and 231 of the test period. Samples at each time period were analysed for TN and TP concentrations, and samples at the final period (231 days) were analysed for TN, NH3, NO2/NO3, TP and OP concentrations, using standard methods as described above. Concentrations were converted to loads and the amount removed expressed as a percentage of the input load, referred to as removal efficiency. Removal efficiency values were normalised using an arcsine transformation. At the end of the test period, all plants were removed from the wetland cells, divided into shoots (all above-ground material) and roots (all below-ground material), washed, then oven-dried at 80˚C for 36 hours and measured for dry weight.
To test the effects of nutrient and salinity level on nutrient removal, the removal efficiencies of TN, NH3, NO2/NO3, TP and OP after 231 days, were compared among the four treatments (HSHN, LSHN, HSLN and LSLN) applied to the 16 planted cells using two-factor analyses of variance (ANOVAs). Since measurements of each parameter in each wetland cell at different times were not independent, the effect of time on removal efficiencies of TN and TP was tested using repeated measures ANOVAs, with treatment regarded as the between-subject (i.e. wetland cell) effect and time (10, 38, 66, 94, 164, 192 and 231 days) as the within-subject effect. Dry weight of shoots and roots after 231 days were compared among treatments by two-factor ANOVAs.
To test the effect of plants on nutrient removal, the removal efficiencies of TN, NH3, NO2/NO3, TP and OP after 231 days, were compared between the planted and unplanted cells which received the HSHN treatment using single factor ANOVAs. The effect of time on the removal efficiency of TN and TP was tested using repeated measures ANOVAs, with plants or no plants regarded as the between-subject effect and time (10, 38, 66, 94, 164, 192 and 231 days) as the within-subject effect. 2.3 Assessment of yield and in vitro nutritive value
Two separate experiments were undertaken. In each experiment, twenty wetland cells, all planted with NyPa Forage, were prepared as described above. The aim of the first experiment was to compare growth and nutritive value of NyPa Forage plants grown at different nutrient levels, and a constant salinity of 15,000 mg L-1. Five nutrient levels were used: (1) 0 µg L-1 N: 0 µg L-1P; (2) 2,500 µg L-1 N: 500 µg L-1 P; (3) 5000 µg L-1 N: 1000 µg L-1 P; (4) 7,500 µg L-1 N: 1,500 µg L-1 P; (5) 10,000 µg L-1 N: 2000 µg L-1 P. Salinity and nutrient levels were made using synthetic sea salt and commercial fertiliser added to distilled water, and tested as described above. For the 0 treatment, no fertiliser was added to the water and levels of TN and TP were always below detectable limits (<50 µg TN L-1 and <5 µg TP L-1).
Four replicate cells were allocated randomly to each treatment and watered with 12.0 L of solution, at a rate of 0.2 L s-1, twice weekly. Plants were gradually acclimated to the different nutrient levels for a 42 day pre-experimental phase, before a test period of 90 days, after which all above ground plant material was harvested from each cell and measured for wet weight, dry weight, sodium, crude protein (CP), dry matter digestibility (DMD) and total ash. Sodium concentrations were measured using ICP-AES analysis at MAFRL. Crude protein and DMD levels were measured at the Feed Evaluation Laboratory, Western Australian Department of Agriculture; CP by the Kjeldahl digestion method and DMD using a pepsin cellulase digestion, based on Klein and Baker (1993). As the NyPa Forage plant material had 94.4% organic matter,
7
comparable to other pasture plants, and ash components were in the normal range (9-12%) for pasture plants, metabolisable energy (ME) was calculated from DMD as ME = 0.17 (%DMD) – 2.0 (AFRC 1993). Differences in dry weight and arcsine-transformed CP and DMD values among treatments were compared by one-way ANOVA’s, with post hoc comparison of means using the Tukey-Kramer HSD test.
The aim of the second experiment was to compare growth and in vitro nutritive value of NyPa Forage plants at different cropping levels. All wetland cells were watered twice weekly with 12.0 L of nutrient solution (10,000 µg L-1 N: 2,000 µg L-1 P; salinity of 15,000 mg L-1), made and tested as described above. Four cropping levels were applied: (1) no cropping; (2) growing shoots cropped every 21 days; (2) growing shoots cropped every 42 days; (3) growing shoots cropped every 63 days. Five replicate cells were allocated randomly to each treatment. Plants were gradually acclimated to the nutrient solution for a 42 day pre-experimental phase, before a test period of 126 days. At each cropping time and at the end of the experiment (126 days), harvested plant material from each cell was measured for wet weight, dry weight, sodium, CP and DMD as for experiment 1. Differences in dry weight and arcsine-transformed CP and DMD values among treatments were compared by one-way ANOVA’s, with post hoc comparison of means using the Tukey-Kramer HSD test. 2.4 Assessment of in vivo DMD and voluntary feed intake
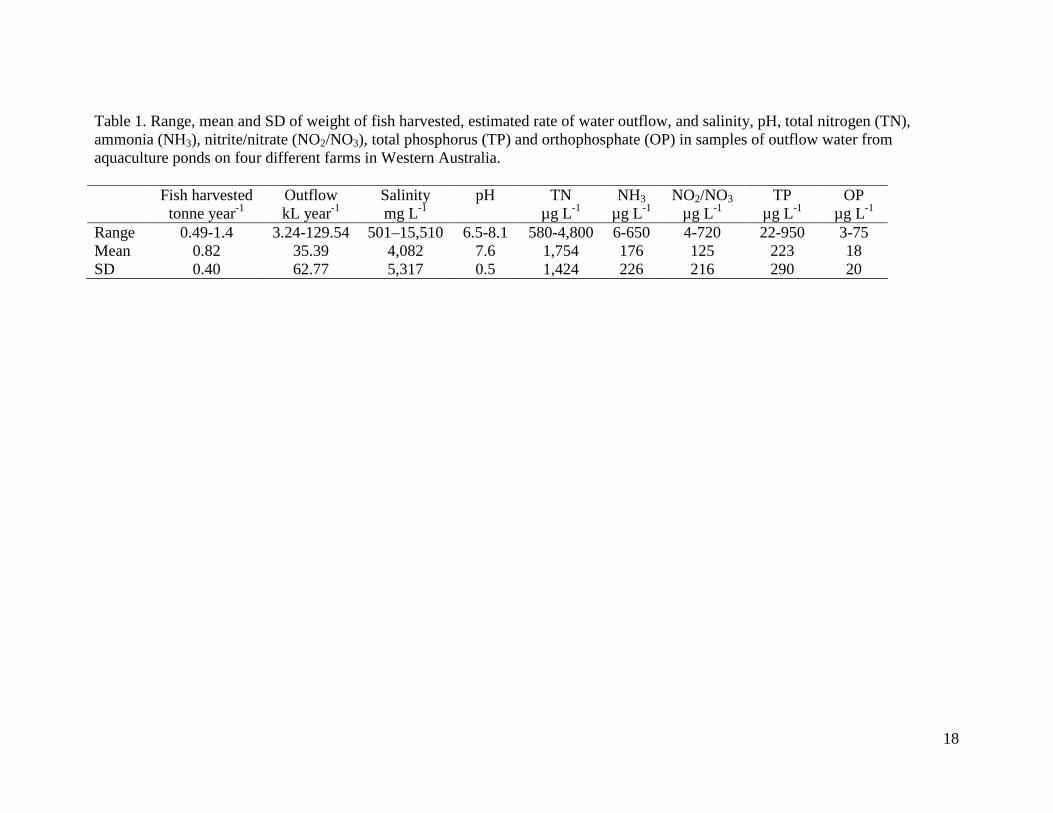
Recent studies have shown that standard laboratory (in vitro) techniques for measuring DMD often overestimate in vivo DMD of salt-tolerant plants (Masters et al., 2007; Norman et al., 2010). To determine whether this was the case for NyPa Forage, 100 kg of unfertilised, ungrazed plant material was obtained from a farm in Wickepin, Western Australia, air dried and stored for 6 months. A subsample of the dried material was taken for determination of acid detergent fibre (ADF), using an Ankom 200/220 fibre analyser (Ankom® Tech. Co., Fairport, NY, USA) and in vitro DMD, using the pepsin cellulase digestion method described previously. The remaining dried material was used to determine in vivo DMD on eight, 14 month old Merino wethers (47 ±3.0 kg) offered 0.8 kg of DM day-1, following the methods of Norman et al. (2010). The research complied with the Australian Code of Practice for the Care and Use of Animals for Scientific Purposes (Australian Government National Health and Medical Research Council, 2004), following approval by the CSIRO Centre for Environment and Life Sciences and Murdoch University Animal Ethics Committees. 3. Results 3.1 Nutrient levels in aquaculture effluent Table 1 shows the ranges and means of water quality parameters in outflow water from the four different aquaculture farms that were sampled. Based on estimates of mean annual nutrient concentrations in outflow water, and mean annual harvest weight and outflow rate from each farm, the TN load produced over a full trout production cycle ranged from 0.022 to 0.285 kg day-1 tonne-1 (mean 0.15; SD 0.11 kg day-1 tonne-1) and the TP load from 0.001 to 0.030 kg day-1 tonne-1 (mean 0.002; SD 0.002 kg day-1 tonne-1). 3.2 Removal of nutrients by planted wetlands
8
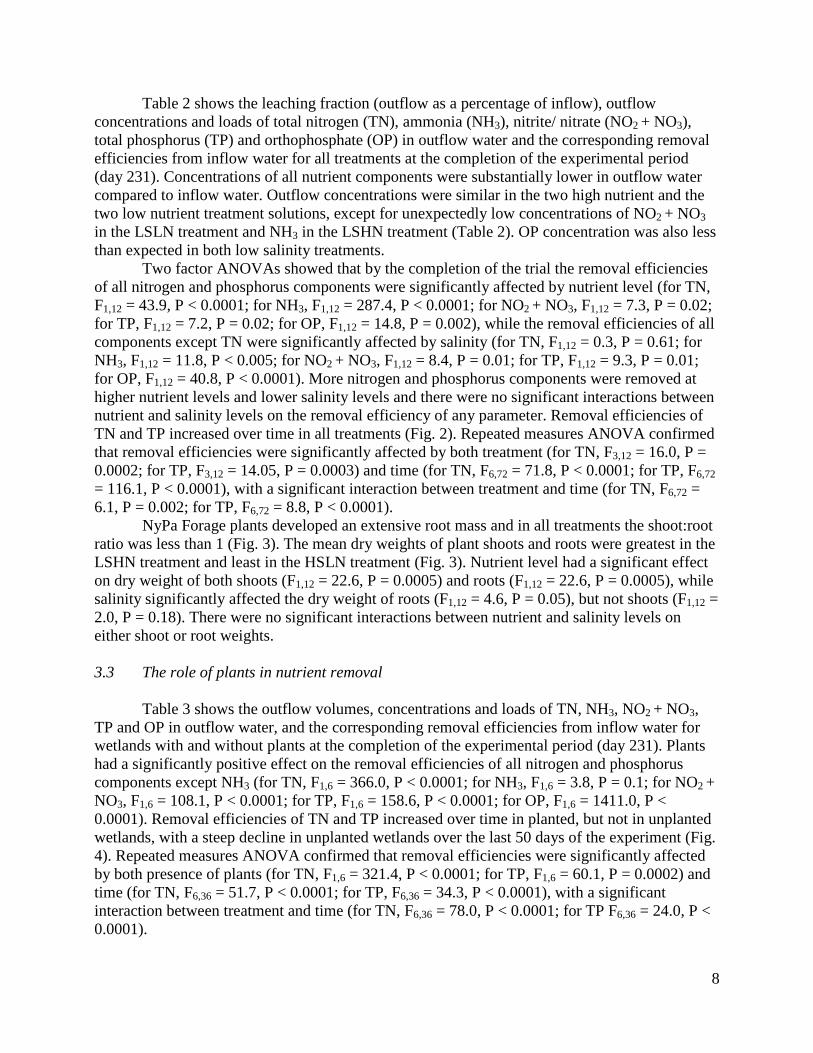
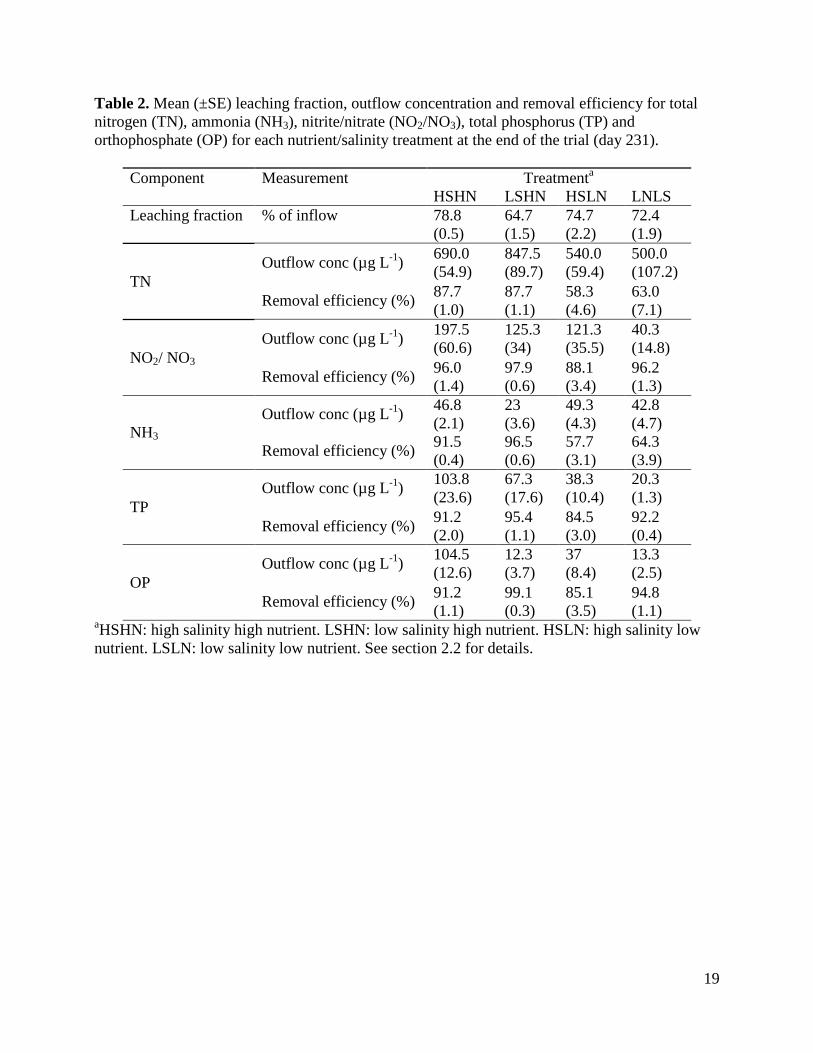
Table 2 shows the leaching fraction (outflow as a percentage of inflow), outflow concentrations and loads of total nitrogen (TN), ammonia (NH3), nitrite/ nitrate (NO2 + NO3), total phosphorus (TP) and orthophosphate (OP) in outflow water and the corresponding removal efficiencies from inflow water for all treatments at the completion of the experimental period (day 231). Concentrations of all nutrient components were substantially lower in outflow water compared to inflow water. Outflow concentrations were similar in the two high nutrient and the two low nutrient treatment solutions, except for unexpectedly low concentrations of NO2 + NO3 in the LSLN treatment and NH3 in the LSHN treatment (Table 2). OP concentration was also less than expected in both low salinity treatments.
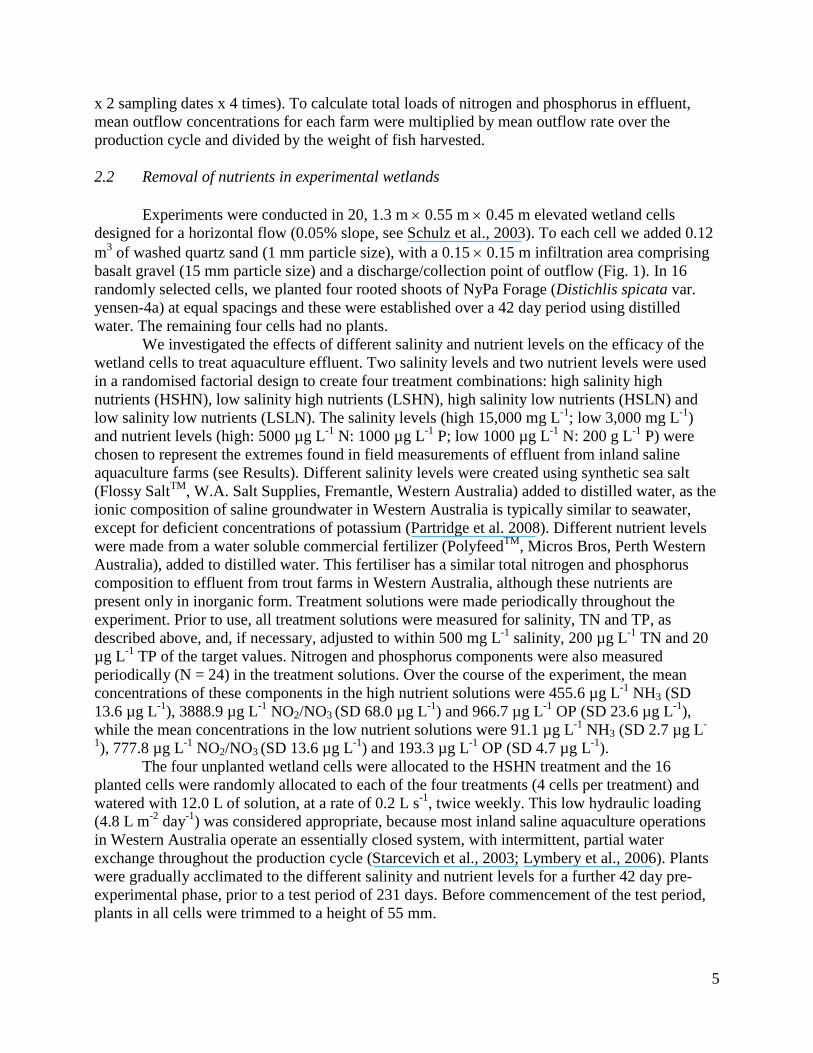
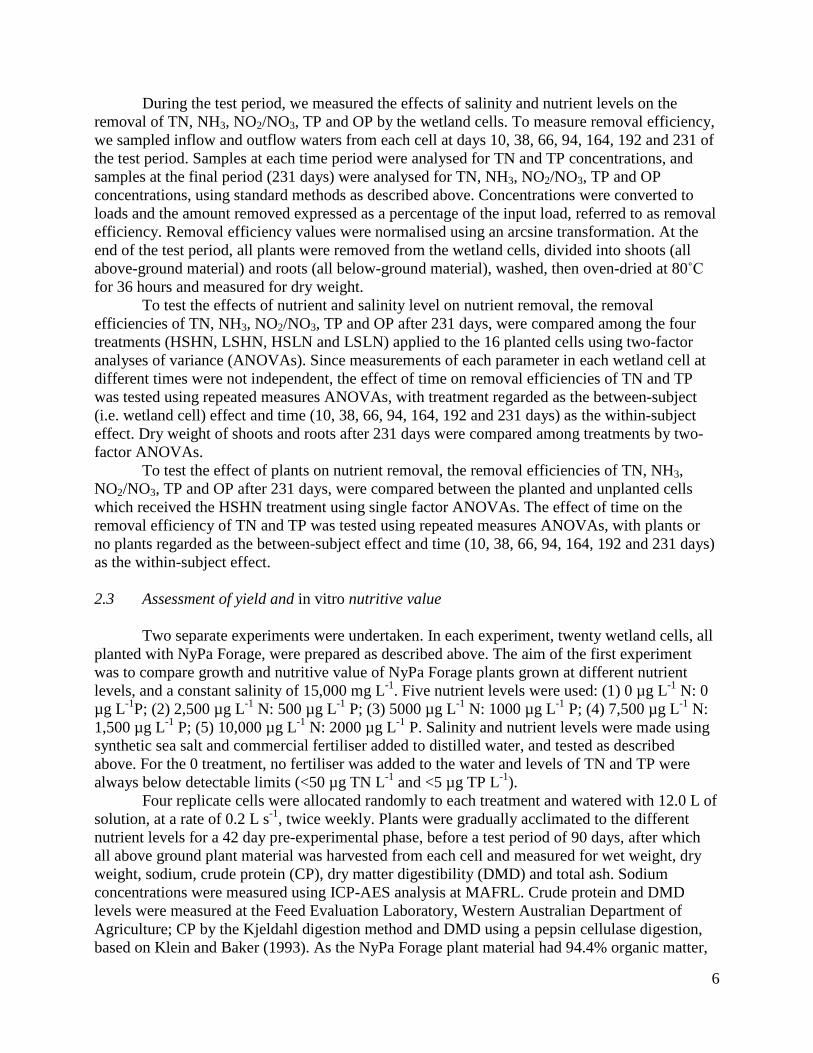
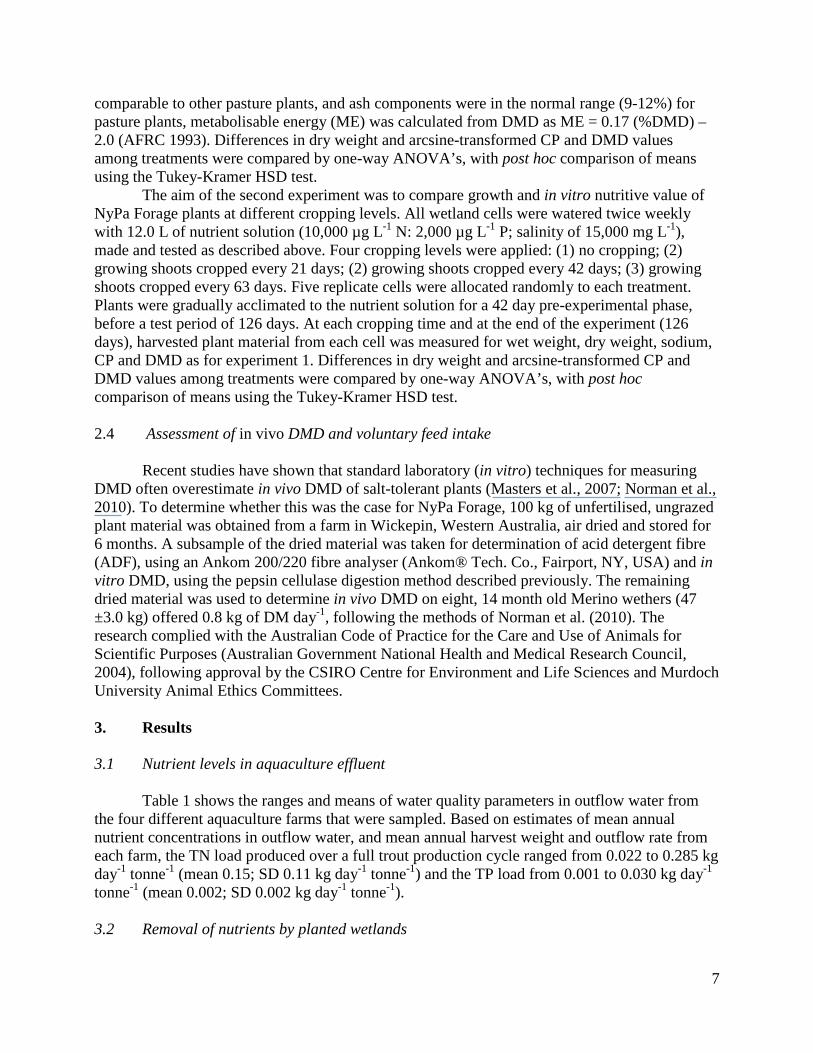
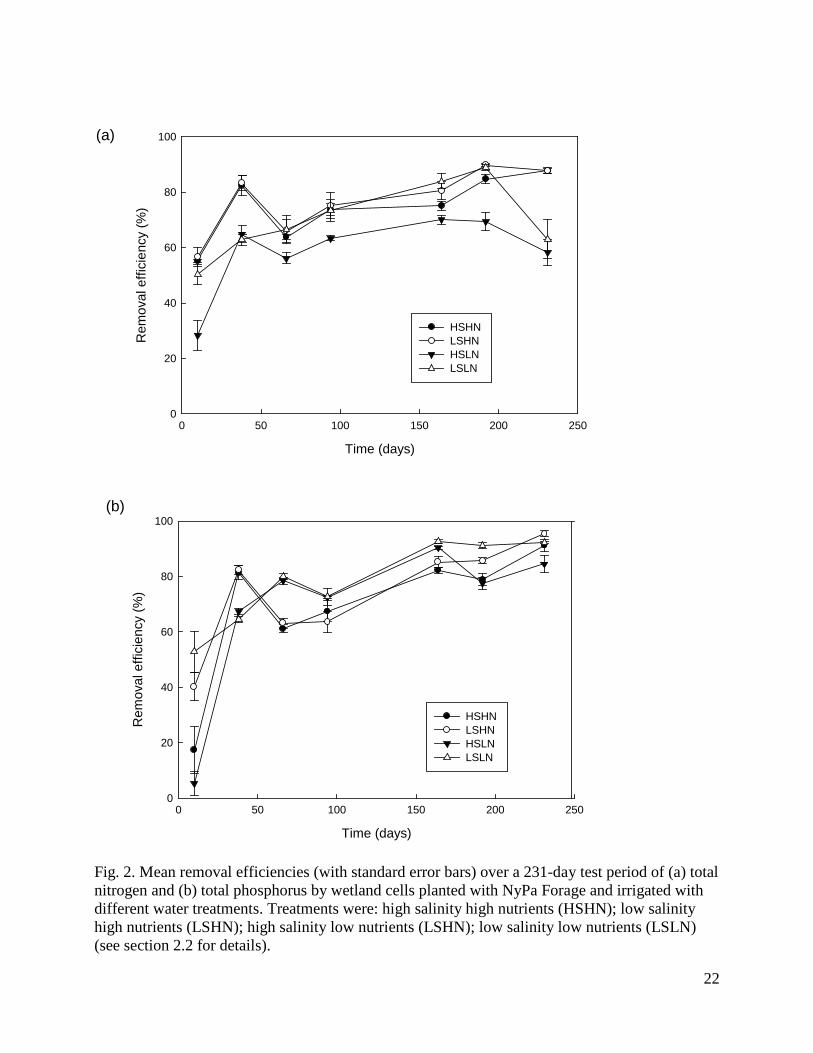
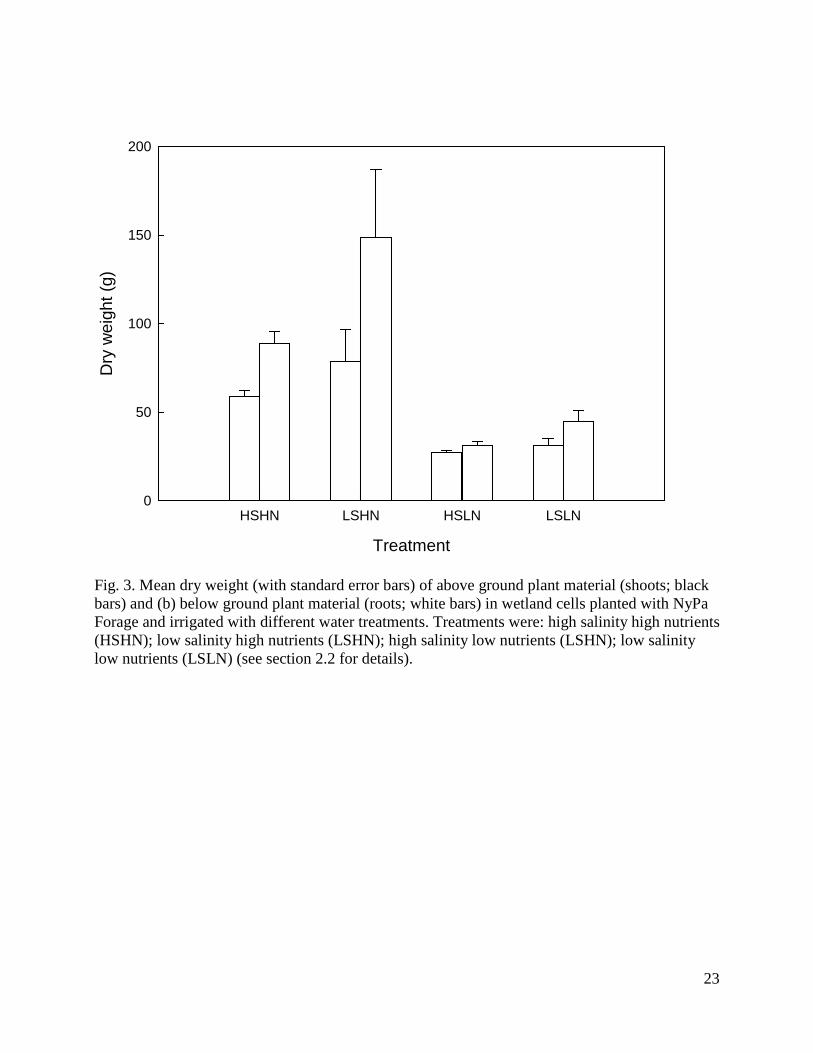
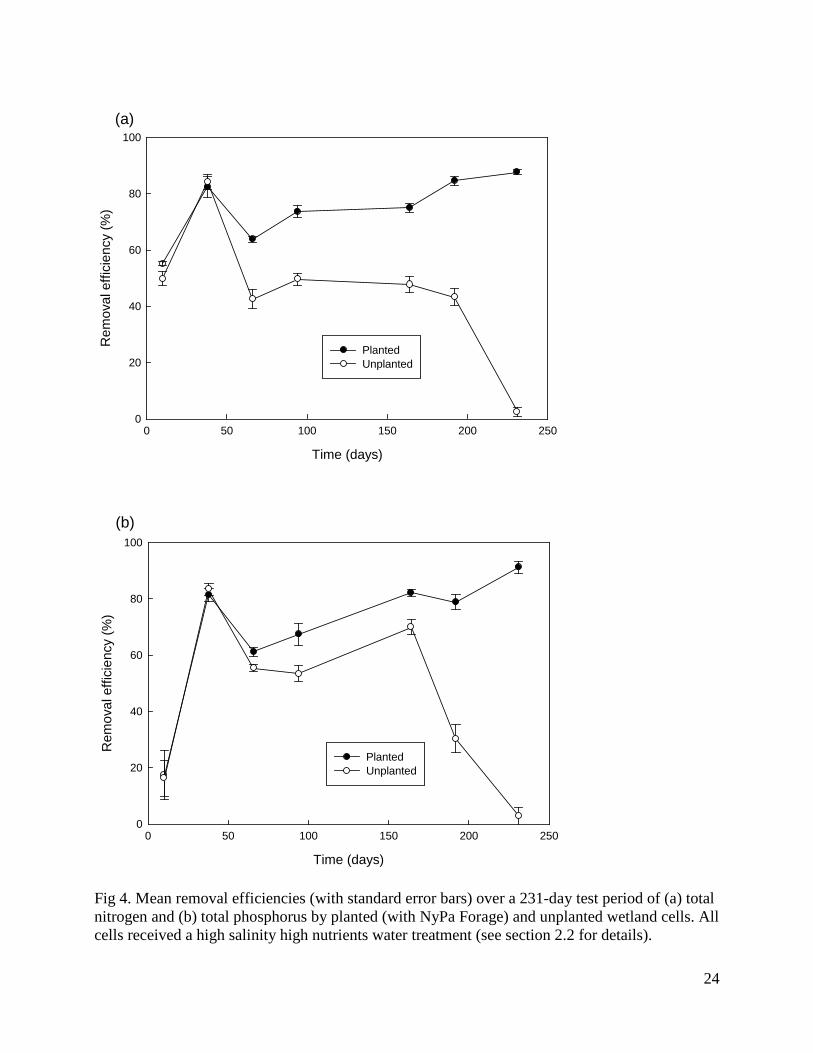
Two factor ANOVAs showed that by the completion of the trial the removal efficiencies of all nitrogen and phosphorus components were significantly affected by nutrient level (for TN, F1,12 = 43.9, P < 0.0001; for NH3, F1,12 = 287.4, P < 0.0001; for NO2 + NO3, F1,12 = 7.3, P = 0.02; for TP, F1,12 = 7.2, P = 0.02; for OP, F1,12 = 14.8, P = 0.002), while the removal efficiencies of all components except TN were significantly affected by salinity (for TN, F1,12 = 0.3, P = 0.61; for NH3, F1,12 = 11.8, P < 0.005; for NO2 + NO3, F1,12 = 8.4, P = 0.01; for TP, F1,12 = 9.3, P = 0.01; for OP, F1,12 = 40.8, P < 0.0001). More nitrogen and phosphorus components were removed at higher nutrient levels and lower salinity levels and there were no significant interactions between nutrient and salinity levels on the removal efficiency of any parameter. Removal efficiencies of TN and TP increased over time in all treatments (Fig. 2). Repeated measures ANOVA confirmed that removal efficiencies were significantly affected by both treatment (for TN, F3,12 = 16.0, P = 0.0002; for TP, F3,12 = 14.05, P = 0.0003) and time (for TN, F6,72 = 71.8, P < 0.0001; for TP, F6,72 = 116.1, P < 0.0001), with a significant interaction between treatment and time (for TN, F6,72 = 6.1, P = 0.002; for TP, F6,72 = 8.8, P < 0.0001). NyPa Forage plants developed an extensive root mass and in all treatments the shoot:root ratio was less than 1 (Fig. 3). The mean dry weights of plant shoots and roots were greatest in the LSHN treatment and least in the HSLN treatment (Fig. 3). Nutrient level had a significant effect on dry weight of both shoots (F1,12 = 22.6, P = 0.0005) and roots (F1,12 = 22.6, P = 0.0005), while salinity significantly affected the dry weight of roots (F1,12 = 4.6, P = 0.05), but not shoots (F1,12 = 2.0, P = 0.18). There were no significant interactions between nutrient and salinity levels on either shoot or root weights. 3.3 The role of plants in nutrient removal Table 3 shows the outflow volumes, concentrations and loads of TN, NH3, NO2 + NO3, TP and OP in outflow water, and the corresponding removal efficiencies from inflow water for wetlands with and without plants at the completion of the experimental period (day 231). Plants had a significantly positive effect on the removal efficiencies of all nitrogen and phosphorus components except NH3 (for TN, F1,6 = 366.0, P < 0.0001; for NH3, F1,6 = 3.8, P = 0.1; for NO2 + NO3, F1,6 = 108.1, P < 0.0001; for TP, F1,6 = 158.6, P < 0.0001; for OP, F1,6 = 1411.0, P < 0.0001). Removal efficiencies of TN and TP increased over time in planted, but not in unplanted wetlands, with a steep decline in unplanted wetlands over the last 50 days of the experiment (Fig. 4). Repeated measures ANOVA confirmed that removal efficiencies were significantly affected by both presence of plants (for TN, F1,6 = 321.4, P < 0.0001; for TP, F1,6 = 60.1, P = 0.0002) and time (for TN, F6,36 = 51.7, P < 0.0001; for TP, F6,36 = 34.3, P < 0.0001), with a significant interaction between treatment and time (for TN, F6,36 = 78.0, P < 0.0001; for TP F6,36 = 24.0, P < 0.0001).
9
3.4 In vivo DMD and voluntary feed intake Of the eight sheep offered dried, unfertilised and ungrazed NyPa Forage obtained from
the farm, only five ate sufficient for six days of digestibility measurement. Mean individual intakes from the five animals ranged from 0.44 to 0.73 kg DM day-1 (group mean of 0.57 kg DM day-1). Mean in vivo DMD of the biomass was 48.6 ± 1.6% (equivalent to 6.3 MJ kg-1 DM). The NyPa Forage had 5.6 % ash, indicating that it had not accumulated high soluble salts. The sample contained 34.7% ADF and 3.8 % CP (both on a DM basis). The prediction of DMD using the pepsin-cellulase laboratory method slightly underestimated in vivo DMD (in vitro DMD was 43.2 % and in vivo DMD was 48.6%). 3.5 Yield and in vitro nutritive value of NyPa Forage at different nutrient levels
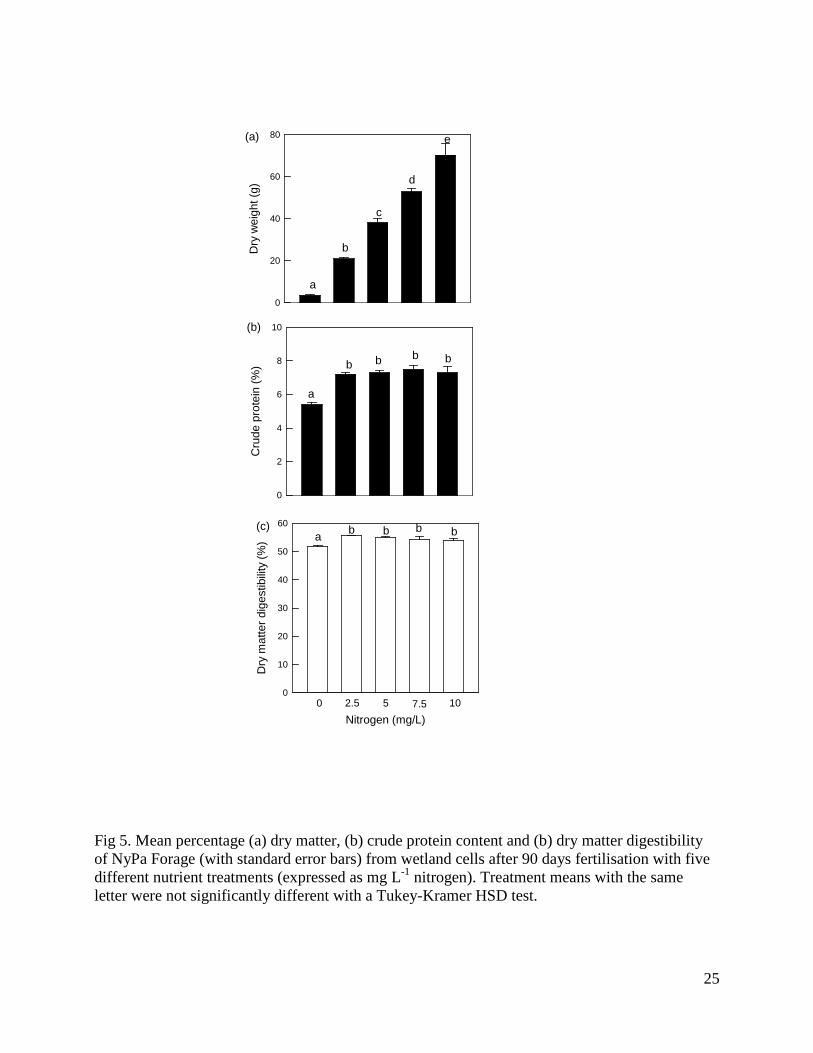
There was a positive relationship between nutrient level and dry weight of plant material harvested, with a significant overall effect (F4,15 = 93.1, P < 0.0001), and significant differences among all treatment levels (Figure 5a). Crude protein was significantly greater when the NyPa Forage was fertilised (7.5%) than with no fertilisation (5.4%; F4,15 = 20.0, P < 0.0001), but did not differ significantly among nutrient treatments (Figure 5b). Similarly, in vitro DMD was significantly greater when the NyPa Forage was fertilised (54.7%) than with no fertilisation (51.6%; F4,15 = 5.9, P = 0.004), but did not differ significantly among nutrient treatments (Figure 5c). The mean sodium content of plant material was 8.2 ± 0.5 mg/g and did not differ significantly among treatments. 3.6 Yield and in vitro nutritive value of NyPa Forage at different cropping levels
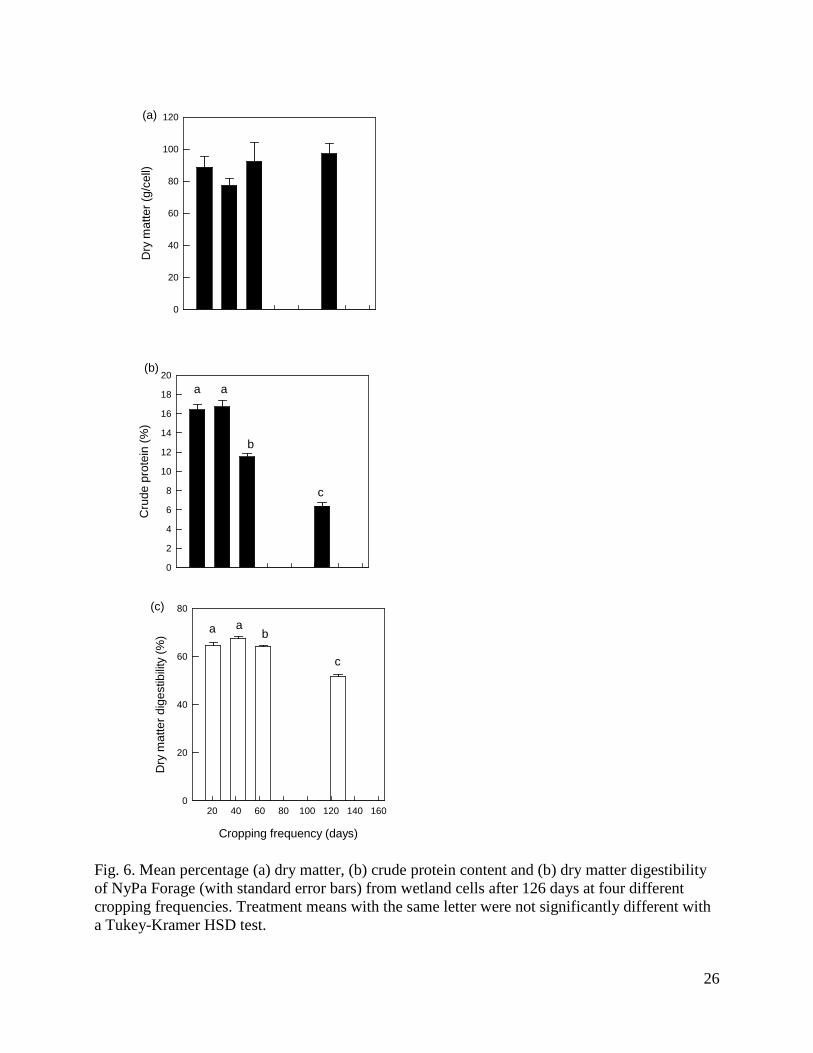
Cropping rate did not significantly affect the total amount of dry matter harvested per cell after 126 days, with a mean over all treatments of 88.8 ± 4.0 g (Fig. 6a; F3,16= 1.12, P = 0.37). Crude protein differed significantly among cropping treatments (F3,16 = 96.9, P < 0.0001), being greatest at 21 and 42 days, significantly lower at 63 days and least with no cropping until 126 days (Fig. 6b). Similarly, DMD differed significantly among cropping treatments (F3,16 = 68.9, P < 0.0001), and was again greatest at 21 and 42 days, significantly lower at 63 days and least with no cropping until 126 days (Fig. 6c). The mean sodium content of plant material was 8.1 ± 0.4 mg g-1 and did not differ significantly among treatments.
4. Discussion 4.1 Potential environmental effects of effluent from inland saline aquaculture
Untreated effluent from land-based aquaculture farms may leach into groundwater or be disposed of in natural waterways (Brown and Glenn, 1999; Miranda et al., 2008). The amount of nutrients released in effluent from trout farms in inland Western Australia were substantially less than those reported from flow-through aquaculture farms in other parts of the world, such as Europe, where total nitrogen loads may reach 0.47 kg day-1 tonne-1 and total phosphorus loads 0.16 kg day-1 tonne-1 (e.g. Foy and Rosell, 1991; Rennert, 1994). The much smaller loads found in this study are a reflection of the semi-intensive, pond style of production in inland Western Australia, with low fish stocking densities, low feed inputs and limited water outflow. Nevertheless, this release of nutrients may have adverse environmental impacts and the extent to which this occurs will depend on both the quantity and composition of nutrients released and the
10
assimilative capacity of the receiving waterway. The freshwater ecosystems of south western Australia are naturally nutrient-poor (Pen, 1999), and are therefore particularly susceptible to nutrient loading from anthropogenic activities.
Studies in Europe and North America have found that trout farm effluent reduces the diversity of macroinvertebrate and fish communities in local rivers (Pillay, 1992; Loch et al., 1996; Selong and Helfrich, 1998). These effects are due partly to the toxicity of substances such as ammonia and nitrite, but mostly to the promotion of eutrophication (Sindilariu, 2007; Simōes et al., 2008). Eutrophication of freshwater ecosystems is increasingly being recognised as a major environmental problem in Australia (Davis and Koop, 2006). In Western Australia, as in other Australian states and many other countries throughout the world, government regulations to reduce the environmental impact of land-based aquaculture set limits on the concentrations of nutrients in released effluent and require proponents to implement a monitoring regime (Bergheim and Brinker, 2003; Boyd, 2003; Productivity Commission, 2004). The concentrations of nitrogen and phosphorus components in the effluent released from the farms in this study were often greater than environmental trigger values for south western Australia (ANZECC, 2000), and further industry development, with greater stocking densities and increased feeding levels, will likely see them increase to a point which requires treatment prior to off-farm release. 4.2 The role of constructed wetlands in treatment of effluent from inland saline aquaculture Aquaculture effluent contains nutrients in both particulate and dissolved forms (Sindilariu, 2007). Technologies for treating aquaculture effluent have been mainly based on the mechanical separation of solids to purify drained water using static and rotating screens, or in the case of flow through systems, effluent sedimentation in tanks or ponds (Van Rijn, 1996). Mechanical methods, however, are not effective in removing dissolved nutrients such as ammonia, urea, and soluble phosphorus. Constructed wetlands are gaining increased attention as an alternative to traditional mechanical treatment of nutrients in aquaculture wastewater, because of their lower costs, reduced maintenance requirements and capacity to capture dissolved nutrients (e.g. van Rijn, 1996; Brix, 1999).
The current study found that subsurface-flow wetlands may provide an effective method for removing nutrients from the effluent generated by inland saline aquaculture, by capturing up to 89% of total nitrogen and up to 95% of ammonia, nitrite/nitrate, total phosphorus and orthophosphate. Nutrient removal efficiencies were reduced under low nutrient and high salinity conditions, but even under the worst experimental treatments, approximately 60% of total nitrogen and ammonia, and 85% or more of the other nutrient components were removed. These nutrient removal capabilities are similar to those reported in other studies of wetland treatment of aquaculture effluent (e.g. Cripps and Bergheim, 2000; Lin et al., 2002; Schultz et al,. 2003; Lymbery et al., 2006; Sindilariu et al., 2007, 2009; Zachritz et al., 2008; Webb et al., 2012), and they compare favourably with mechanical filters that typically remove 10 – 43% of total nitrogen and 49 – 63% of total phosphorus (Mäkinen et al., 1988; Lekang et al., 2000).
The results from our study indicated that plants were a necessary component of wetland ecosystems for the removal of nitrogen and phosphorus. The role of plants in constructed wetlands is not fully understood. Although some studies have found no difference in nutrient removal rates between planted and unplanted wetlands, most have reported improved treatment efficiency from planted wetlands (Vymazal, 2011). This may occur because of the uptake of nitrogen and phosphorus through the roots and assimilation into plant biomass, and also the enhancement of nutrient-removal processes operating in the root zone of the soil. Root systems
11
provide increased surface area and oxygen for the establishment and growth of aerobic nitrifying bacteria, which in turn enhances the biological conversion of ammonia to nitrate in the root rhizobia and the eventual removal of nitrogen through denitrification or plant uptake and assimilation (Koottatep and Polprasert, 1997; Schulz et al., 2003; Vymazal, 2007). In our study, plants significantly improved the removal efficiency of all nitrogen components except ammonia. This suggests that even without plants the wetland cells were operating aerobically, and the enhanced removal of nitrogen was occurring principally through direct uptake. Although direct uptake of nitrogen is usually thought to be relatively unimportant in constructed wetlands (Koottatep and Polprasert, 1997; Vymazal, 2007), Webb et al. (2012) suggested that it may be much greater when using plants that have evolved to sequester nitrogen in nutrient-limited environments. Phosphorus removal in the soil appears to occur mainly through sediment adsorption and precipitation (Brown and Glenn, 1999; Comeau et al., 2001; Vymazal, 2007); although the conditions favouring these processes are less well understood, they may also be enhanced by the plant root system, for example by preventing a lowering of the redox potential of the soil (Schulz et al., 2003). The dense root mass of NyPa forage plants, a characteristic feature of Distichlis spicata (Sargeant et al., 2008; Al-Shorepy et al., 2010), may have contributed to the greater removal efficiencies found in the current study than in the study by Lymbery et al. (2006), which used a similar experimental system, but planted with the estuarine sedge Juncus kraussi. In the current study, the discrepancy in nutrient removal efficiencies between planted and unplanted wetlands was particularly marked towards the end of the experiment, which may indicate saturation of removal processes in the soil and an increasing role for the developing root systems of the plants.
Lymbery et al. (2006) found that the efficacy of nutrient removal from aquaculture effluent in subsurface-flow wetlands planted with Juncus kraussi was limited by increasing salinities. This may have been due to an adverse effect of salinity on the growth of J. kraussi, as plant biomass was significantly reduced at higher salinities. In the current study, increasing salinity had an adverse effect on the root mass, but not the aboveground shoot mass of NyPa Forage, and, while the efficiency of removal of all nutrient components except total nitrogen was reduced at higher salinities, this reduction was much less pronounced than found by Lymbery et al. (2006) with the J. kraussi wetlands. At a salinity level of 15,000 mg L-1, the NyPa Forage wetlands removed up to 87.7% of total nitrogen, 96% of nitrite/nitrate, 91.5% of ammonia, and 91.2% of total phosphorus and orthophosphate. This maintenance of removal efficiencies at higher salinities was not unexpected because Distichlis spicata is a halophyte; previous studies have shown that NyPa Forage, a cultivar of Distichlis spicata, produces maximum yield at moderate salinities (approximately 11,000 mg L-1), with survival in hypersaline conditions (up to 44,000 mg L-1) (Leake et al., 2002). It is likely, therefore, that NyPa Forage wetlands would be suitable for treating aquaculture effluent at even higher salinities than those tested here. Other studies have identified a number of halophytes within the Amaranthaceae family that have good nutrient removal capabilities in salinities of up to 35,000 mg L-1 (Brown et al., 1999; Webb et al., 2012).
While the results from our study show that wetlands planted with NyPa Forage have good potential as a treatment system for effluent from inland saline aquaculture, considerable work is required before commercial application. We used a fertiliser solution, which contained nutrients only in inorganic form, to simulate aquaculture effluent. Aquaculture effluent is more complex, with different ratios of organic and organic nutrients (e.g. see Jackson et al., 2003; Webb et al., 2012) and Webb et al. (2012) found that halophyte wetlands had different removal efficiencies
12
for dissolved inorganic nitrogen and dissolved organic nitrogen. In addition, nutrient removal efficiencies in constructed wetlands are principally influenced by nutrient inflow concentration, hydraulic load (which is inversely related to hydraulic residence time) and the accumulation of solids, which lead to wetland clogging (Rousseau et al., 2008; Zachritz et al., 2008; Sindilariu et al., 2009). Design criteria to optimise hydraulic residence time and minimise clogging will require long-term studies in more realistic on-farm or pilot-scale wetlands irrigated with aquaculture effluent. Nevertheless, the peculiar nature of inland saline aquaculture operations in Western Australia, with intermittent release of relatively low volumes of nutrient-enriched, saline effluent, suggest that the experimental wetland cells we used in this study may provide a good guide to on-farm performance. 4.3 Potential of irrigated NyPa Forage as a livestock feed
The suitability of NyPa Forage, when irrigated with aquaculture effluent, as livestock feed depends on yield, nutritive value and voluntary feed intake (Norman et al., 2012). The yield of NyPa Forage was not affected by cropping rate, but showed a direct linear response to nutrient level in the effluent with which it was watered. Estimated yield on a per hectare basis ranged from 1.5 kg DM ha-1 day-1 (with no nutrient fertilisation) to 31.4 kg DM ha-1 day-1 (with fertilisation at a level of 10,000 µg L-1 N: 2000 µg L-1 P) in the laboratory trials. Assuming a four month growing season, this equates to a total yield over late summer/autumn of up to 3.8 t DM ha-1, which is only about half the expected yield from well managed improved clover pasture (Norman et al., 2005), but the feed is available at a time of the year when green feed, energy and protein is limited in Mediterranean-type climates. Furthermore, the linear relationship seen between yield and nutrient levels in our laboratory experiments suggests that there is still much scope for further improvements in yield with increasing nutrient loading.
The current study suggests that, without fertilization and intensive cropping, NyPa Forage has only low DMD and would not maintain liveweight of non-reproducing, mature sheep or cattle. As a rather general rule of thumb, liveweight maintenance of a 50 kg wether requires feed with a CP content of 8% and an energy value of more than 7.4 mJ kg-1 (equivalent to a DMD of 55%) (AFRC 1993; Freer et al. 1997). NyPa Forage, when grown in washed river sand with no nutrient fertilisation and no cropping, had a mean CP content of 5.4 ± 0.1 %, an in vitro DMD of 51.6 ± 0.1 % and an energy value of 6.8 MJ kg-1. The unfertilised, uncropped NyPa Forage harvested from the farm was even poorer with CP of 3.8 %. and in vivo DMD of 48.6 % (6.3 MJ kg-1) The indigestible material was mostly fibre with ADF of 35%. These values are similar to those of most salt-tolerant annual and perennial grasses (Thompson et al., 2002; Bustan et al., 2005; Norman et al., 2012). In comparison halophytic shrubs, such as saltbush, usually have similar low levels of digestibility but less fibre and greater levels of CP and salt (Norman et al. 2010).
The nutritive value of NyPa Forage was significantly improved by fertilisation with aquaculture effluent and by regular cropping. In this study, the greatest nutritive values were obtained by fertilisation with effluent containing 10 mg L-1 N and 2 mg L-1 P, and with cropping every 42 days; with these treatments NyPa Forage had a mean CP content of 16.7 ± 0.7 %, a DMD of 67.6 ± 0.6 % and an energy value of 9.5 ± 0.1 MJ kg-1. These values are equivalent to those contained by good quality conserved fodder, and assuming an equivalent voluntary food intake as grass hay, would be sufficient for maintenance of dry adult sheep or cattle, or moderate liveweight gain in growing animals (AFRC, 1993; Freer et al., 1997). Previous studies with
13
Distichlis spicata have also found that good quality forage can be obtained from the plant (Bustan et al., 2005; Al-Shopery et al., 2010)
There are a number of caveats to this conclusion, however. First, recent studies have shown that standard laboratory (in vitro) techniques for measuring DMD often overestimate in vivo DMD of salt-tolerant plants (Norman et al., 2010). While our preliminary in vivo digestibility trial indicated that in vitro DMD calculations were not upwardly biased, more extensive measurements of in vivo digestibility, using fertilised and cropped NyPa Forage from on-farm or pilot-scale wetlands, will provide a more accurate estimate of nutritive value.
Second, nutritive value is not equivalent to feeding value because it does not consider voluntary feed intake, which is a function of both accessibility and intake constraints of the plant to the animal. Variation in voluntary feed intake accounts for at least 50% of the variation that is observed in the feeding value of forages (Ulyatt 1973). The in vivo feeding experiment demonstrated that voluntary feed intake (0.57 kg day-1) of unfertilised and uncropped NyPa forage was not high enough to allow the sheep to meet their nutritive requirements. This was unlikely to be due to high salt levels in the plant. The sodium concentration of NyPa Forage, irrigated with water with a salinity of 15,000 mg L-1, was approximately 8 mg g-1, towards the high end of the range found in most pasture plants, but well below levels often found in other halophytes (≥80 mg g-1) and known to depress intake and liveweight gain in grazing livestock (Masters et al. 2005, 2007). This relatively low sodium concentration reflects the fact that, unlike many other halophytes that tolerate saline conditions by accumulating salts in their tissues, NyPa Forage actively excretes salt through salt glands and may have higher feeding value than many other salt tolerant fodder plants (Flowers et al., 1986; Brizuela et al., 1990; Sergeant et al. 2006).
From the data collected in this study, the most likely factor limiting feed intake was high indigestible fibre (ADF). Weston (1996) proposed that the voluntary feed intake of forages is regulated by the interplay between the rate of clearance of dry matter from the rumen and the amount of useful energy that is available to the animal, relative to the animal’s capacity to use the energy. The resistance of forage organic matter to pass from the rumen (i.e. the indigestibility of fibre) therefore limits intake. Mixed stands of NyPa Forage and other salt-tolerant plants, such as saltbush (with some grain for energy) could provide a balanced diet and result in higher voluntary feed intake of livestock. This is because the intake constraints are likely to be different for these different feeds, with high fibre limiting intake of the grass (physical constraint) while high salt limits intake of the saltbush (chemical constraint). 4.4 Conclusions
NyPa Forage has many advantages as a plant species in constructed wetlands receiving aquaculture effluent that is high in both nutrients and salt levels. Our study showed that experimental subsurface-flow wetlands planted with NyPa Forage may remove more than 90% of nitrogen and phosphorus from effluent, and their efficacy is only moderately constrained by increasing salinity. Longer-term studies, in more realistic pilot-scale wetlands are now needed to confirm these results. Although unfertilised NyPa Forage had poor DMD, in vitro studies indicated that when irrigated with saline, nutrient-rich effluent and cropped on a regular basis, the plant produced feed with sufficient nutritive value for maintenance and moderate growth of livestock. Feeding value may also be improved if it is grown with salt-tolerant amaranths such as saltbush. This should now be tested with livestock feeding trials. Acknowledgements
14
This study was funded by the Rural Industries Research and Development Corporation of Australia. Thanks to John Leake, Raymond Matthews, Gavin Sarre and Michael Klunzinger for help with sourcing and planting the NyPa Forage; Mark Starcevich, Rob Michael, Samuel Lymbery, Elizabeth Hulm and Matt Wilmot for field, animal house and laboratory assistance; Leonarda Baizert for the feed evaluation analyses; and Jasper Trendall and the members of the Saltwater Trout Alliance for access to aquaculture ponds. Figure 1 was drawn by Belinda Cale. References AFRC. Energy and protein requirements of ruminants. An advisory manual prepared by the
AFRC Technical Committee on Responses to Nutrients. Wallingford, UK: CAB International; 1993.
Al-Shorepy SA, Alhadrami GA, El Awad AI. Development of sheep and goat production system based on the use of salt-tolerant plants and marginal resources in the United Arab Emerites. Small Rumin Res 2010;91:39-46.
APHA. Standard methods for the examination of water and wastewater, 18th ed. Washington: American Public Health Association, American Water Works Association, Water Environment Federation; 2005.
ANZECC. Australian and New Zealand guidelines for fresh and marine water quality. Canberra: National Water Quality Management Strategy, Australian and New Zealand Environment and Conservation Council and Agriculture and Resource Management Council of Australia and New Zealand; 2000.
Barson M, Barrett-Lennard EG. Productive use and rehabilitation of Australia's saline lands. Aust J Soil Water Cons 1995;8:33-7.
Bennett SJ, Barret-Lennard EG, Colmer TD. Salinity and waterlogging as constraints to saltland pasture production: a review. Agr Ecosyst Environ 2009;129:349-60.
Bergheim A, Brinker A. Effluent treatment for flow through systems and European environmental regulations. Aquacult Eng 2003;27:61-77.
Beveridge MCM, Phillips MJ, Macintosh DJ. Aquaculture and the environment: the supply of and demand for environmental goods and services by Asian aquaculture and the implications for sustainability. Aquacult Res 1997;28:797-807.
Bosma RH, Verdegem MCJ. Sustainable aquaculture in ponds: principles, practices and limits. Livest Sci 2011;139:58-68.
Boyd CE. Guidelines for aquaculture effluent management at the farm-level. Aquaculture 2003;226:101-12.
Brix H. How 'green' are aquaculture, constructed wetlands and conventional wastewater treatment systems? Water Sci Technol 1999;40:45-50.
Brizuela MA, Cid MS, Miňon DP, Grecco RF. Seasonal utilsation of saltgrass (Distichlis spp.) by cattle. Anim Feed Sci Technol 1990;30:321-5.
Brown JJ, Glenn EP. Reuse of a highly saline aquaculture effluent to irrigate a potential forage halophyte, Suaeda esteroa. Aquacult Eng 1999;20:91-111.
Brown JJ, Glenn EP, Fitzsimmons KM, Smith SE. Halophytes for the treatment of saline aquaculture effluent. Aquaculture 1999;175:255-68.
Bustan, A, Pasternak D, Pirogova I, Durikov M, Devries TT, El-Meccawi S, et al. Evaluation of saltgrass as a fodder crop for livestock. J Sci Food Agric 2005;85:2077-84.
15
Comeau Y, Brisson J, Reville J-P, Forget C, Drizo A. Phosphorus removal from trout farm effluents by constructed wetlands. Water Sci Technol 2001;44:55-60.
Cripps S, Bergheim A. Solids management and removal for intensive land-based aquaculutre production systems. Aquacult Eng 2000;22:33-56.
Crites RW. Design criteria and practice for constructed wetlands. Water Sci Technol 1994;29:1-6.
Davis JR, Koop K. Eutrophication in Australian rivers, reservoirs and estuaries - a southern
hemisphere perspective on the science and its implications. Hydrobiologia 2006;559:23-76. Doupé RG, Lymbery AJ, Starcevich MR Rethinking the land: the development of inland saline
aquaculture in Western Australia. Int J Agric Sustain 2003;1:30-7. FAO. The state of world fisheries and aquaculture. Rome: FAO; 2009 Flowers TJ, Hajibagheri MA, Clipson NJW. Halophytes. Quart Rev Biol 1986;61:313-37. Forsberg JA, Dorsett PW, Neill WH. Survival and growth of red drum Sciaenops ocellatus in
saline groundwaters of West Texas, U.S.A. J World Aquacult Soc 1996;27:462-74. Foy RH, Rosell R. Loadings of nitrogen and phosphorus from a Northern Ireland fish farm.
Aquaculture 1991;96:17-30. Freer M, Moore AD, Donnelly JR. GRAZPLAN: decision support systems for Australian grazing
enterprises. II. The animal biology model for feed intake, production and reproduction and the GrazFeed DSS. Agric Syst 1997;54:77-126.
Ghassemi F, Jakeman AJ, Nix HA. Salinisation of land and water resources: human causes, extent, management, and case studies. Sydney: University of New South Wales Press Ltd; 1995.
Glenn EP, O'Leary JW, Watson MC, Thompson TL, Kuehl RO. Salicornia bigelovii Torr.: an oilseed halophyte for seawater irrigation. Science 1991;251:1065-1067.
Jackson C, Preston N, Thompson PJ, Burford M. Nitrogen budget and effluent nitrogen components at an intensive shrimp farm. Aquaculture 2003;218:397-411.
Klein L, Baker, S. Composition of the fractions of dry, mature subterranean clover digested in vivo and in vitro. Proceedings of the XVII International Grasslands Congress; 1993 p. 593-4.
Koottatep T, Polprasert C. Role of plant uptake on nitrogen removal in constructed wetlands located in the tropics. Water Sci Technology 1997;36:1-8.
Leake J, Barrett-Lennard E, Sargeant M, Yensen N, Prefumo J. NyPa Distichlis cultivars: rehabilitation of highly saline areas for forage, turf and grain. Kingston, ACT: RIRDC; 2002.
Lekang OI, Bergheim A, Dalen H. An integrated wastewater treatment system for land-based fish-farming. Aquacult Eng 2000;22:199-211.
Lever C, Lymbery AJ, Doupé RG. Preliminary comparisons of yield and profit achieved from different rainbow trout (Oncorhynchus mykiss) production systems in inland Western Australia. J Appl Aquacult 2004;16:63-74.
Lin Y-F, Jing S-R, Lee D-Y, Wang T-W. Nutrient removal from aquaculture wastewater using a constructed wetlands system. Aquaculture 2002;209:169-84.
Loch DD, West JL, Perlmutter DG. The effect of trout farm effluent on the taxa richness of benthic macroinvertebrates. Aquaculture 1996;147:37-55.
Lymbery AJ, Doupé RG, Bennett T, Starcevich MR. Efficacy of a subsurface-flow wetland using the estuarine sedge Juncus kraussii to treat effluent from inland saline aquaculture. Aquacult Eng 2006;34:1-7.
Mäkinen T, Lindgren S, Eskilinen P. Sieving as an effluent treatment method for land-based fish-farming. Aquacult Eng 1988;7:367-77.
16
Masters DG, Rintoul AJ, Dynes RA, Pearce KL, Norman HC. Feed intake and production in
sheep fed diets high in sodium and potassium. Aust J Agric Res 2005, 56:427-434. Masters DG, Benes S, Norman HC. Biosaline agriculture for forage and livestock production.
Agric Ecosys Environ 2007, 119:234-248. National Land and Water Resources Audit. Australian dryland salinity assessment 2000: extent,
impacts, processes, monitoring and management options. Canberra: Land and Water Australia; 2001.
Norman HC, Masters DG, Rintoul A, Wilmot M, Jayasena V, Loi A, Revell C. The relative feeding value of a new pasture legume, eastern star clover (Trifolium dasyurum), compared with subterranean clover (Trifolium subterraneum). Aust J Agric Res 2005, 56:637-644.
Norman HC, Revell DK, Mayberry DE, Rintoul AJ, Wilmot MG, Masters DG. Comparison of in vivo organic matter digestibility of native Australian shrubs by sheep to in vitro and in sacco predictions. Small Rumin Res 2010;91:69-80.
Norman HC, Masters DG, Barrett-Lennard EG . Halophytes as forages in saline landscapes: interactions between plant genotype and their environment change their feeding value to ruminants. Environ Exper Bot 2012;(in press).
O’Connell M, Young J. The role of saltland pastures in the farming system – a whole-farm bioeconomic analysis. Proceedings 8th National Conference and Workshop on the Productive Use and Rehabilitation of Saline Lands; 2002. p. 223-32.
Partridge GJ, Lymbery AJ, George RG. Finfish mariculture in inland Australia: a review of potential water sources, species and production systems. J World Aquacult Soc 2008;39:291-310.
Pen LJ. Managing our rivers: a guide to the nature and management of the streams of south-west Western Australia. Perth: Western Australian Water and Rivers Commission; 1999.
Pillay TVR. Aquaculture and the environment. Oxford: Fishing News Books; 1992. Productivity Commission. Assessing environmental regulatory arrangements for aquaculture.
Canberra: Commonwealth of Australia; 2004. Rennert B. Water pollution by a land-based trout farm. J Appl Ichthyol 1994;10:373-8. Rogers ME, Craig AD, Munns RE, Colmer TD, Nichols PGH, Malcom CV et al. The potential
for developing fodder plants for the salt-affected areas of southern and eastern Australia: an overview. Aust J Exp Agric 2005;45:301-29.
Rousseau DPL, Lesage E, Story A, Vanrolleghem PA, De Pauw N. Constructed wetlands for water reclamation. Desalination 2008;218:181-9.
Rozema J, Flowers T. Crops for a salinized world. Science 2008;322:1478-80. Sargeant M, Tang C, Sale P. The ability of Distichlis spicata to grow sustainably within a saline
discharge zone while improving the soil chemical and physical properties. Aust J Soil Res 2008;46:37-44.
Schulz C, Gelbrecht J, Rennert B. Treatment of rainbow trout farm effluents in constructed wetland with emergent plants and subsurface horizontal water flow. Aquaculture 2003;217:207-21.
Selong JH, Helfrich LA Impacts of trout culture effluent on water quality and biotic communities in Virginia headwater streams. Progress Fish Cult 1998;60:247-62.
Simōes FS, Moreira AB, Bisinoti MC, Gimenez SMN, Yabe MJS. Water quality index as a simple indicator of aquaculture effects on aquatic bodies. Ecol Indicat 2008;8:476-84.
Sindilariu P-D. Reduction in effluent nutrient loads from flow-through facilities for trout production: a review. Aquacult Res 2007;38:1005-36.
17
Sindilariu P-D, Schulz, C, Reiter R. Treatment of flow-through trout aquaculture effluents in a constructed wetland. Aquaculture 2007;270:92-104.
Sindilariu P-D, Brinker A, Reiter R. Factors influencing the efficiency of constructed wetlands used for the treatment of intensive trout farm effluent. Ecol Eng 2009; 25: 711-22.
Starcevich MR, Lymbery AJ, Doupé RG. Potential environmental impacts from farming rainbow trout using inland saline water in Western Australia. Aust J Environ Manag 2003;10:15-24.
Thompson A, Norman H, Masters D, Dynes R, Edwards N, Lee G. Animal production from saline land – case studies across southern Australia. Proceedings 8th National Conference and Workshop on the Productive Use and Rehabilitation of Saline Lands; 2002. p. 49-57.
Ulyatt MJ. The feeding value of herbage, In: Butler GW Bailey RW, editors. Chemistry and biochemistry of herbage. New York: Academic Press; 1973. p 131-75.
van Rijn J. The potential for integrated biological treatment systems in recirculating fish culture - a review. Aquaculture 1996;139:181-201.
Vymazal J. Removal of nutrients in various types of constructed wetlands. Sci Tot Env 2007;380:48-65.
Vymazal J. Plants used in constructed wetlands with horizontal subsurface flow: a review. Hydrobiologia 2011;674:133-156.
Webb JM, Quintã R, Papadimitriou S, Norman L, Rigby M, Thomas DN. Halophyte filter beds for treatment of saline wastewater from aquaculture. Water Res 2012;46:5102-5144.
Weston RH. Some aspects of constraint to forage consumption by ruminants. Aust J Agr Res 1996;47:175-197.
Yensen NP, Yensen SB, Weber CW. A review of Distichlis spp. for production and nutritional values. In: Whitehead EE, Hutchinson CF, Timmermann BN, Varady RG, editors. Arid lands today and tomorrow. Boulder: Westview Press; 1985 p. 809-22.
Zachritz WH II, Hanson AT, Sauceda JA, Fitzsimmons KM. Evaluation of submerged surface flow (SSF) constructed wetlands for recirculating tilapia production systems. Aquacult Eng 2008;39:16-23.
18
Table 1. Range, mean and SD of weight of fish harvested, estimated rate of water outflow, and salinity, pH, total nitrogen (TN), ammonia (NH3), nitrite/nitrate (NO2/NO3), total phosphorus (TP) and orthophosphate (OP) in samples of outflow water from aquaculture ponds on four different farms in Western Australia. Fish harvested
tonne year-1 Outflow kL year-1
Salinity mg L-1
pH TN µg L-1
NH3 µg L-1
NO2/NO3 µg L-1
TP µg L-1
OP µg L-1
Range 0.49-1.4 3.24-129.54 501–15,510 6.5-8.1 580-4,800 6-650 4-720 22-950 3-75 Mean 0.82 35.39 4,082 7.6 1,754 176 125 223 18 SD 0.40 62.77 5,317 0.5 1,424 226 216 290 20
19
Table 2. Mean (±SE) leaching fraction, outflow concentration and removal efficiency for total nitrogen (TN), ammonia (NH3), nitrite/nitrate (NO2/NO3), total phosphorus (TP) and orthophosphate (OP) for each nutrient/salinity treatment at the end of the trial (day 231).
Component Measurement Treatmenta HSHN LSHN HSLN LNLS Leaching fraction % of inflow 78.8
(0.5) 64.7 (1.5)
74.7 (2.2)
72.4 (1.9)
TN Outflow conc (µg L-1) 690.0
(54.9) 847.5 (89.7)
540.0 (59.4)
500.0 (107.2)
Removal efficiency (%) 87.7 (1.0)
87.7 (1.1)
58.3 (4.6)
63.0 (7.1)
NO2/ NO3 Outflow conc (µg L-1) 197.5
(60.6) 125.3 (34)
121.3 (35.5)
40.3 (14.8)
Removal efficiency (%) 96.0 (1.4)
97.9 (0.6)
88.1 (3.4)
96.2 (1.3)
NH3 Outflow conc (µg L-1) 46.8
(2.1) 23 (3.6)
49.3 (4.3)
42.8 (4.7)
Removal efficiency (%) 91.5 (0.4)
96.5 (0.6)
57.7 (3.1)
64.3 (3.9)
TP Outflow conc (µg L-1) 103.8
(23.6) 67.3 (17.6)
38.3 (10.4)
20.3 (1.3)
Removal efficiency (%) 91.2 (2.0)
95.4 (1.1)
84.5 (3.0)
92.2 (0.4)
OP Outflow conc (µg L-1) 104.5
(12.6) 12.3 (3.7)
37 (8.4)
13.3 (2.5)
Removal efficiency (%) 91.2 (1.1)
99.1 (0.3)
85.1 (3.5)
94.8 (1.1)
aHSHN: high salinity high nutrient. LSHN: low salinity high nutrient. HSLN: high salinity low nutrient. LSLN: low salinity low nutrient. See section 2.2 for details.
20
Table 3. Mean (±SE) leaching fraction, outflow concentration and removal efficiency for total nitrogen (TN), ammonia (NH3), nitrite/nitrate (NO2/NO3), total phosphorus (TP) and orthophosphate (OP) in wetlands with and without plants at the end of the trial (day 231).
Component Measurement Treatmenta Plants No plants Leaching fraction (% of inflow)
78.8 (0.5)
82.0 (0.6)
TN Outflow conc (µg L-1) 690.0
(54.9) 5375.0 (179.7)
Removal efficiency (%) 87.7 (1.0)
0.7 (3.1)
NO2/ NO3 Outflow conc (µg L-1) 197.5
(60.6) 4575.0 (319.8)
Removal efficiency (%) 96.0 (1.4)
6.8 (4.0)
NH3 Outflow conc (µg L-1) 46.8
(2.1) 68.2 (12.0)
Removal efficiency (%) 91.5 (0.4)
87.1 (2.3)
TP Outflow conc (µg L-1) 103.8
(23.6) 1200.0 (81.6)
Removal efficiency (%) 91.2 (2.0)
2.9 (2.9)
OP Outflow conc (µg L-1) 104.5
(12.6) 1182.5 (96.5)
Removal efficiency (%) 91.2 (1.1)
4.4 (4.4)
aBoth planted and unplanted wetlands received high salinity high nutrient treatment solution; see section 2.2 for details.
21
Fig. 1. Diagrammatic cross-section of experimental, sub-surface flow wetland cells
22
Time (days)
0 50 100 150 200 250
Rem
oval
effi
cien
cy (%
)
0
20
40
60
80
100
HSHN LSHNHSLN LSLN
Time (days)
0 50 100 150 200 250
Rem
oval
effi
cien
cy (%
)
0
20
40
60
80
100
HSHN LSHNHSLNLSLN
(a)
(b)
Fig. 2. Mean removal efficiencies (with standard error bars) over a 231-day test period of (a) total nitrogen and (b) total phosphorus by wetland cells planted with NyPa Forage and irrigated with different water treatments. Treatments were: high salinity high nutrients (HSHN); low salinity high nutrients (LSHN); high salinity low nutrients (LSHN); low salinity low nutrients (LSLN) (see section 2.2 for details).
23
Treatment
HSHN LSHN HSLN LSLN
Dry
wei
ght (
g)
0
50
100
150
200
Fig. 3. Mean dry weight (with standard error bars) of above ground plant material (shoots; black bars) and (b) below ground plant material (roots; white bars) in wetland cells planted with NyPa Forage and irrigated with different water treatments. Treatments were: high salinity high nutrients (HSHN); low salinity high nutrients (LSHN); high salinity low nutrients (LSHN); low salinity low nutrients (LSLN) (see section 2.2 for details).
24
Time (days)
0 50 100 150 200 250
Rem
oval
effi
cien
cy (%
)
0
20
40
60
80
100
PlantedUnplanted
(a)
Time (days)
0 50 100 150 200 250
Rem
oval
effi
cien
cy (%
)
0
20
40
60
80
100
PlantedUnplanted
(b)
Fig 4. Mean removal efficiencies (with standard error bars) over a 231-day test period of (a) total nitrogen and (b) total phosphorus by planted (with NyPa Forage) and unplanted wetland cells. All cells received a high salinity high nutrients water treatment (see section 2.2 for details).
25
Dry
wei
ght (
g)
0
20
40
60
80
Cru
de p
rote
in (%
)
0
2
4
6
8
10
Nitrogen (mg/L)
Dry
mat
ter d
iges
tibilit
y (%
)
0
10
20
30
40
50
60
0 2.5 5 7.5 10
(a)
(b)
(c)
a
b
c
d
e
a
b b b b
a b b b b
Fig 5. Mean percentage (a) dry matter, (b) crude protein content and (b) dry matter digestibility of NyPa Forage (with standard error bars) from wetland cells after 90 days fertilisation with five different nutrient treatments (expressed as mg L-1 nitrogen). Treatment means with the same letter were not significantly different with a Tukey-Kramer HSD test.
26
Dry
mat
ter (
g/ce
ll)
0
20
40
60
80
100
120
Cru
de p
rote
in (%
)
0
2
4
6
8
10
12
14
16
18
20
Cropping frequency (days)
20 40 60 80 100 120 140 160
Dry
mat
ter d
iges
tibilit
y (%
)
0
20
40
60
80
(a)
(b)
(c)
a a
b
c
a ab
c
Fig. 6. Mean percentage (a) dry matter, (b) crude protein content and (b) dry matter digestibility of NyPa Forage (with standard error bars) from wetland cells after 126 days at four different cropping frequencies. Treatment means with the same letter were not significantly different with a Tukey-Kramer HSD test.
Copyright © 2022 FDOKUMEN