The Potential Impact of Enforced Lease Capitalisation in the UK Retail Sector
34
The potential impact of enforced lease capitalisation in the UK retail sector Alan Goodacre * August 2001 Abstract The main objective of the paper is to assess the potential economic consequences of the G4+1 proposed changes to lease accounting by examining companies in the UK retail sector over the 1994-99 period. The magnitude of the impact of lease capitalisation is assessed by examining the effect on nine key accounting ratios that are used in decision-making and in financial contracts. A ‘constructive capitalisation’ procedure is used to estimate the unrecorded lease liability and asset. Operating lease finance is shown to be very important in the retail sector, with a long-term liability approximately 3.3 times higher than on-balance sheet long-term debt; by contrast, finance leases are immaterial. Operating leased assets, the major part of which is ‘land and buildings’ (98%), represent a significant proportion (28%) of reported total assets. Capitalisation of operating leases would have a major impact on all nine ratios. Further, the ranking of companies changes markedly for asset turnover, interest cover and the three capital-based gearing measures, and especially for general retailers. Using credit-risk adjusted discount rates would lessen slightly the impact of capitalisation, but would have little impact on intra-sector ranking of company performance. Anticipation of future lease rental increases would have a significant impact on the level of operating lease assets/liabilities and on profit after tax. While the use of renewable short lease contracts (or break clauses) would reduce the level of operating lease assets and liabilities, substantial amounts would remain to be reported on-balance sheet. These findings contribute to the assessment of the economic consequences of a policy change requiring operating lease capitalisation. Prior research suggests that individual users of financial statements are not efficient information processors, and also that company managers do not believe that users, even in aggregate (e.g. the stock market) are efficient processors. Consequently, the significant changes in the magnitude of key accounting ratios and the major shift in company performance rankings suggest that interested parties’ economic decisions are likely to be affected. * Alan Goodacre, Dept. of Accounting, Finance and Law, University of Stirling, Stirling FK9 4LA, UK (e- mail: [email protected]) . Acknowledgements The financial support of the University of Stirling Faculty of Management Research Fund is gratefully acknowledged.
Transcript of The Potential Impact of Enforced Lease Capitalisation in the UK Retail Sector

The potential impact of enforced lease capitalisation inthe UK retail sector
Alan Goodacre*
August 2001
Abstract
The main objective of the paper is to assess the potential economic consequences of the G4+1 proposedchanges to lease accounting by examining companies in the UK retail sector over the 1994-99 period. Themagnitude of the impact of lease capitalisation is assessed by examining the effect on nine key accountingratios that are used in decision-making and in financial contracts. A ‘constructive capitalisation’ procedure isused to estimate the unrecorded lease liability and asset.
Operating lease finance is shown to be very important in the retail sector, with a long-term liabilityapproximately 3.3 times higher than on-balance sheet long-term debt; by contrast, finance leases areimmaterial. Operating leased assets, the major part of which is ‘land and buildings’ (98%), represent asignificant proportion (28%) of reported total assets. Capitalisation of operating leases would have a majorimpact on all nine ratios. Further, the ranking of companies changes markedly for asset turnover, interest coverand the three capital-based gearing measures, and especially for general retailers.
Using credit-risk adjusted discount rates would lessen slightly the impact of capitalisation, but would havelittle impact on intra-sector ranking of company performance. Anticipation of future lease rental increaseswould have a significant impact on the level of operating lease assets/liabilities and on profit after tax. Whilethe use of renewable short lease contracts (or break clauses) would reduce the level of operating lease assetsand liabilities, substantial amounts would remain to be reported on-balance sheet.
These findings contribute to the assessment of the economic consequences of a policy change requiringoperating lease capitalisation. Prior research suggests that individual users of financial statements are notefficient information processors, and also that company managers do not believe that users, even in aggregate(e.g. the stock market) are efficient processors. Consequently, the significant changes in the magnitude of keyaccounting ratios and the major shift in company performance rankings suggest that interested parties’economic decisions are likely to be affected.
* Alan Goodacre, Dept. of Accounting, Finance and Law, University of Stirling, Stirling FK9 4LA, UK (e-mail: [email protected]).
AcknowledgementsThe financial support of the University of Stirling Faculty of Management Research Fund is gratefullyacknowledged.

1
The potential impact of enforced lease capitalisation in the UK retailsector
INTRODUCTION
Leasing represents a significant source of finance for many companies. Total lease financeused by non-financial industrial and commercial UK listed companies was estimated in1994 to be approximately £71 billion. 1 This was about half the level of the companies’ long-term debt finance and financed about 28% of their net fixed assets. In 1999, new businessleasing by members of the Finance & Leasing Association represented 15.3% of the totalinvestment in equipment (Finance & Leasing Association, 2000). In the UK, leasing iscurrently governed by accounting standard SSAP 21 ‘Accounting for leases and hirepurchase contracts’, which was issued in 1984 (ASC, 1984). Since its introduction, there hasbeen a considerable growth in the use of off-balance sheet operating leases (Goodacre &Beattie, 1999) and this has encouraged accounting standard setters to review the working ofthe standard and to propose major changes. This culminated in a G4+1 discussion paper‘Leases: Implementation of a New Approach’ (ASB, 1999), which adopts a ‘propertyrights’ perspective and proposes that all leases should be recognised on the balance sheet.
Leases have been shown to be a major source of finance in the UK, with operating leasesdominating finance leases in importance, measured by the value of assets financed (Beattie,Edwards & Goodacre, 1998, (hereafter BEG)). The predominance of operating leasesillustrates the shift from finance leases to operating leases that was anticipated by managersat the time SSAP21 was introduced (Taylor & Turley, 1985; Drury & Braund, 1990). In theUS, Imhoff & Thomas (1988) document similar ‘economic consequences’ as companymanagers switched to operating leases (and non-lease finance) around the time ofimplementation of SFAS 13.
As a result of the different accounting treatments, the classification of leases has importantimplications for reported levels of indebtedness and for standard performance measures.Profit margins, return on assets and gearing measures would all be significantly affected ifoperating leases were required to be recognised on the lessee’s balance sheet rather thanmerely disclosed in a footnote (BEG, 1998; Imhoff, Lipe & Wright, 1991 (hereafter ILW)).The use of operating leases, and therefore also the potential impact of lease capitalisationvaries both across broad industry sectors and within each sector. The impact is particularlyacute in high usage areas such as the services sector. In particular, the retail sub-sector hasbeen identified as one that undertakes more operating leasing than average (DresdnerKleinwort Benson, 1998, (hereafter DKB); Beattie, Goodacre & Thomson, 2000a). Retailassets are good candidates for operating leases; they are relatively standard assets (rather thanfirm-specific), mainly land and buildings 2, with relatively low ‘residual value risk’ makingthem attractive to lessors.
The main objective of this paper is to provide evidence that will assist in assessing theeconomic consequences of a change in the regulation of lease accounting, as proposed in theG4+1 discussion document (ASB, 1999). The potential impact of the change onperformance measures such as accounting ratios within the UK retail sector is assessed.Three further aspects of the proposed accounting changes are separately investigated. First,the effect of using a credit-risk adjusted interest rate, rather than a risk-free rate, to discountlease rental payments is assessed. Second, the contentious issue of the treatment of leaseswith rentals that rise in line with prices (e.g. traditional upward-only rent review leases onUK property) is explored. Third, the use of renewable short-term lease contracts (or break

2
clauses) to mitigate the impacts of capitalisation is modelled and the differential impact ismeasured. The study represents policy-relevant ex ante research in support of the standard-setting process of the type advocated by Schipper (1994).
The remainder of the paper is structured as follows. After a discussion of the current andproposed methods of accounting for leases, section two provides a review of relevantliterature including various approaches to the assessment of economic consequences.Section three outlines the methods employed in the current study, including sample and datacollection procedures. The results and discussion are presented in section four and arefollowed by a summary and conclusion.
Accounting for leases: current and proposed
SSAP 21 identifies two types of lease and requires a radically different accounting treatmentfor each. A lease that transfers to the lessee substantially all the risks and rewards ofownership is a finance lease and is treated as an ‘in substance’ purchase by the lessee andsale by the lessor. Accordingly, an asset is shown on the lessee’s balance sheet at thepresent value of the minimum lease payments and a corresponding liability is recognised.On the other hand, a lease which does not transfer substantially all the risks and rewards ofownership to the lessee is deemed to be an operating lease. Under an operating lease thewhole of the leased property is treated as an asset of the lessor and the lessee simplyrecognises the rental payments as an expense, with limited additional footnote disclosure offuture lease rental commitments. Internationally, other existing leasing standards such asIAS 17 (revised 1997) and FAS 13 in the USA are based on similar concepts to SSAP 21 inrelation to distinguishing finance leases from operating leases.
In 1996, the G4+1 published a special report entitled Accounting for Leases: A NewApproach (McGregor, 1996). This identified several fundamental deficiencies in currentlease accounting standards. First, they omit material assets and liabilities arising from ‘off-balance sheet’ operating lease contracts. Second, marginal differences in contractual termscan result in one lease being claimed as a finance lease and another as an operating leaseand thus similar transactions do not receive the same accounting treatment. Third, the ‘all ornothing’ approach to the capitalisation of leased assets does not adequately reflect moderncomplex transactions. The report went on to explore a conceptual approach to leaseaccounting, recommending that new standards should be developed that would remove thedistinction between finance leases and operating leases and would require lessees torecognise as assets and liabilities all material rights and obligations arising under leasecontracts.
More recently, the ASB published a discussion paper Leases: Implementation of a NewApproach (ASB, 1999), in which the G4+1 develops the approach recommended in thespecial report. This recommends that all leases should be reflected in financial statements ina consistent manner and it explores the principles that should determine the extent of theassets and liabilities that lessees and lessors would recognise under leases. Under therecommended approach, at the beginning of a lease the lessee would recognise an asset anda liability equivalent to the fair value of the rights and obligations that are conveyed by thelease (usually the present value of the minimum payments required by the lease).Thereafter, the accounting for the lease asset and liability would follow the normalrequirements for accounting for fixed assets and debt. The lessor would report financialassets (representing amounts receivable from the lessee) and residual interests as separateassets. The principles for accounting for more complex features of lease contracts including

3
renewal options, contingent rentals, residual value guarantees and sale and leasebacktransactions are also examined.
All the G4+1 organisations have published the discussion paper in their own jurisdictionsbut, further progress on accounting standards is likely to be slow. Even in the UK wherethere has been strong commitment to the project, the ASB has acknowledged that ‘becauseof the complexity of the issues arising and the concerns expressed by some respondents, itwill take some time for the Board to consider all of the points raised. Therefore, an exposuredraft of a new accounting standard is unlikely to be published until late 2001’ (ASB, 2001).
The proposals are controversial and have already generated significant negative responsefrom some who fear that there will be major economic consequences if the proposals areadopted. For example, the Finance & Leasing Association issued a press release ‘Thinkagain Sir David: lease accounting reform is not as simple as you think’, in which theysuggested that the proposals ‘would have complex and dramatic effects on the financing ofBritish business’ and ‘will be damaging to many companies’ balance sheets’ (Finance &Leasing Association, 1999). KPMG suggested that ‘there seems little merit in replacing oneset of arbitrary rules with another’ (KPMG, 2000). The real estate industry is also concernedabout the impact on the sector. It has argued that the proposals ‘will increase the occupiersreluctance to enter into long term commitments, leading to a further and more rapid demandfor flexible arrangements’ and that in the period of uncertainty surrounding discussion ofthe proposals ‘decision making will be difficult and this may create a substantial slowdownin the letting market’ (Investment Property Forum, 1999).
LITERATURE
During the late 1970’s, accounting regulators became increasingly aware that economicconsequence arguments were being used explicitly in the standard-setting process andbecame sensitive to the ‘economic consequences’ of a change in accounting method on thebehaviour of the various users (Zeff, 1978). Holthausen & Leftwich (1983) discuss thepredictions of economic consequence theories in terms of contracting and monitoring costsand provide a review of the early empirical work. More recently, Blake (1992) hassuggested a classification system for economic consequences based on impacts that arisefrom users’ decision making and those that arise from the mechanistic application ofregulations or contracts. Since the late 1970’s, the potential impact of changes in accountingstandards on interested parties has become an important influence on decisions by standardsetters world-wide. Indeed, the constitutions of standard-setting bodies such as theAccounting Standards Board (UK), the Financial Accounting Standards Board (US) andsimilar bodies reflect this by seeking direct representation from the various constituencies ofinterested parties, including users, in the standard-setting process. Similarly, the processitself enables interested parties to contribute formally at various stages from initialdiscussion paper through exposure draft to promulgation of a final accounting standard.Typically, this will be augmented by informal discussions between standard-setters andconstituency-groups.
Whilst the principle of giving due weight to ‘economic consequences’ has become wellestablished, the practice of identifying and measuring potential (ex ante) and actual (expost) economic consequences is fraught with difficulties. Several different approaches havebeen adopted. First, the direct link between accounting changes and firm response has beeninvestigated, usually by an ex post analysis of reported accounting numbers, to inferresponses attributable to new accounting standards (e.g. R&D: Dukes, Dyckman & Elliot,
4
1980; Horwitz & Kolodny, 1980; Elliot et al. 1984; Shehata, 1991). Second, an indirectapproach has been chosen, involving the analysis of market reaction to accounting changes,usually using the ‘event study’ methodology (e.g. pensions: Gopalakrishnan & Sugrue,1992; oil and gas: Larcker & Revsine, 1983; R&D: Dukes, 1976; Vigeland, 1981; Wasley &Linsmeier, 1992; leasing: Ro, 1978; El-Gazzar, 1993). Third, ex post surveys of users’perceptions of the impact of accounting changes have been undertaken (e.g., R&D in theUK: Ball, Thomas, & McGrath, 1991), as well as ex ante surveys of interested parties’views on potential accounting changes (see below).
Several studies have considered previous changes in accounting for leases, mainly in the USenvironment. Abdel-khalik (1981) carried out a detailed ex post study of the economicconsequences on US lessees of the changes in lease accounting caused by SFAS 13 (enactedin 1976) as part of the FASB post-enactment review of the statement. The study analysedchanges in the financial statements themselves, assessed the market risk impact on equityand debt, and undertook a mail survey of attitudes to the changes. The study found thatcompany management responded to the standard by structuring new lease contracts, andrenegotiating existing lease contracts, to avoid capitalisation of leases. There was evidencethat more assets were bought, or constructed, instead of being leased and also evidence ofchanges in capital structure. Three possible reasons for this reaction by company managerswere proposed: managers’ belief that users are informationally inefficient, the impact onmanagers’ compensation, and the avoidance of debt covenant violation. While there was nosubstantive evidence of adverse market reaction to the standard, some company managersexpressed concern that users’ evaluations are often influenced by cosmetic accountingchanges. When asked about possible future changes to lease accounting based on a propertyrights perspective, users responded positively, but company managers negatively, towardcapitalising all non-cancellable leases.
Imhoff & Thomas (1988) examined capital structure changes in response to SFAS 13 andfound that the standard had a significant impact on lessees. They document a systematicsubstitution from finance (capital) leases to operating leases and non-lease sources offinance, suggesting that re-negotiation of lease contracts is a relatively low-cost alternativefor mitigating the financial statement effects. In addition, lessees appeared to reduce bookleverage by increasing equity and reducing conventional debt. Australian firms alsoresponded to the new lease accounting rules by reducing their reliance on finance leasingand increasing their use of non-lease debt and equity. However, in contrast with the US,they did not appear to have renegotiated finance lease contracts to operating leases (Godfrey& Warren, 1995). For the similar changes brought about by SSAP21 in the UK, Garrod(1989) found weak evidence that the market reacted to the new information available post-SSAP21 and also that managers reacted to the standard by reducing their non-lease debtprior to first disclosure of their lease information.
Two, non-mutually exclusive, approaches have been adopted in the ex ante assessment of thelikely economic consequences of proposed lease accounting changes. First, companymanagers’ and other interested parties’ views have been solicited directly usingquestionnaire surveys. Taylor & Turley (1985) investigated the opinions of UKmanagement on lease accounting following ED29, the exposure draft that precededSSAP21. They found that only a minority of managers believed that internal financing orinvestment decisions would be significantly affected by the proposed accounting standard.However, managers believed that users’ decisions, including risk assessment, were likely tobe affected, suggesting that managers’ behaviour could be influenced by informationinductance (Prakash & Rappaport, 1977). Managers also anticipated that future lease

5
contracts would be structured as operating leases to avoid capitalisation; a similar responsewas reported by Drury & Braund (1990) in their (post-SSAP21) general survey of theleasing decision.
Recently, Beattie, Goodacre & Thomson (2001a) surveyed UK finance directors on theG4+1 proposals for lease accounting reform. They found that respondents recognised thatadditional assets and liabilities would be brought on to the balance sheet under the newproposals and that this would impact on reported gearing. This was considered likely to leadto the need to re-negotiate borrowing covenants, and to a reduction in credit ratings forsome companies. It was also accepted that this would improve the evaluation of long-termfinancial commitments and company comparisons. Additional compliance costs andadministrative burdens relating to lease accounting were anticipated by respondents. Thefinance directors believed that lease terms would become shorter to minimise balance sheetobligations and also that the proposals would make lease finance less attractive. However,they did not believe that the proposals would substantially change the UK property market.In particular, the purchase of property rather than leasing was considered unlikely, probablybecause the purchase alternative is seldom available.
The second approach to ex ante assessment of economic consequences involves estimatingthe impact of lease capitalisation on accounting numbers used as performance measures(e.g. accounting ratios). Economic consequences can be inferred if the changes inperformance measures are likely to lead to changes in the decision-making behaviour ofusers and/or company managers. The validity of this inference is dependent either on usersbeing ‘inefficient’ in their information processing or on managers believing them to be so.Thus, it is also necessary to have evidence of users’ processing of lease accountinginformation and/or of managers’ perceptions of this.
The evidence on users’ processing of lease accounting information is somewhat conflicting.Most studies find that individual users appear to be influenced by whether the information isrecognised in the financial statements or merely disclosed in the footnotes to the accounts(Wilkins & Zimmer, 1983b; Munter & Ratcliffe, 1983; Breton & Taffler (1995);Gopalakrishnan & Parkash, 1996), but some studies do not (Wilkins & Zimmer, 1983a;Wilkins, 1984). On the other hand, there is both general and lease-specific evidence thatusers in aggregate (i.e., the stock market) are not misled by such presentational issues. Inparticular, there is quite strong evidence for both the UK (Beattie, Goodacre & Thomson,2000b) and the US (Ely, 1995; Imhoff, Lipe & Wright, 1993) that the market alreadyincorporates footnote operating lease disclosures in its assessment of equity risk.3 Further,there is evidence that, at least some, investment analysts and credit rating agencies recastfinancial statements by calculating the assets and liabilities implicit in off-balance sheetoperating leases (e.g., DKB, 1998).
The general evidence that markets are informationally efficient suggests that any changes inreported performance resulting from the accounting changes are probably alreadyimpounded in stock market prices. However, the evidence that individual users (e.g., bank-lenders, investment analysts) may not be informationally efficient suggests that companycapital-raising may be affected by the proposed accounting changes. Further, there is strongevidence that company managers do not believe that users, in aggregate or individually,process information efficiently (e.g. Mayer-Sommer, 1979; Abdel-khalik, 1981; Taylor &Turley, 1985; Beattie, Goodacre & Thomson, 2001b). This suggests that managers’decisions will be affected by the expected change in performance measures if all leases are

6
required to be recognised on lessees’ balance sheets, as a result of information inductance(Prakash & Rappaport, 1977).4
Several prior studies have investigated the effect of lease capitalisation on ratio performancemeasures. In an early study, Nelson (1963) examined the impact on the debt-equity ratio ofeleven US companies and found a significant change in the rankings of the companies aftercapitalisation. In the UK, Ashton (1985) estimated the effect of finance lease capitalisationon six ratios for 23 companies and found that only the gearing ratio would be affectedsignificantly and that correlations between pre- and post-capitalisation ratios were high.However, his conclusion that inter-firm comparisons of performance would not be affectedsignificantly by capitalisation may be subject to sample selection bias. ILW (1991)developed a method for the constructive capitalisation of operating leases and used this toestimate the impact of capitalisation on two ratios (return on assets and debt to equity) for14 US companies (seven matched pairs, selected to represent high and low operating leaseuse). They found material differences in the ratios for both ‘high’ and ‘low’ lessees. In asubsequent paper (Imhoff, Lipe & Wright, 1997), they explored income effects of operatinglease capitalisation and indicate that the effects can be both substantial and unpredictable indirection. The retail investment analyst team at Dresdner Kleinwort Benson produced aresearch report highlighting the high level of gearing that would result from capitalisingoperating leases (DKB, 1998). This was based on a detailed study of 27 large UK generalretail companies and showed that ‘net debt would be in excess of 100% of equity marketcapitalisation in many cases, …. exposing shareholders to extremely volatile returns’. Noneof these studies directly investigate potential economic consequences of capitalisation, butthe results allow such consequences to be inferred.
While these five studies are all based on small samples, BEG (1998) used a large randomsample of 232 UK listed companies to estimate the potential impact of capitalising leasecontracts currently classified as operating leases; they also made the link between impactand economic consequences. For 1994, they found that the average operating lease liabilitywas £51m, split between £8m short-term and £43m long-term, with the latter representingapproximately 39% of on-balance sheet long-term debt, on average. There was a widevariation across different sectors ranging between 14% (general industrial) and 69% (services)of long-term debt, reflecting the variation in the use of operating lease finance. The £43moperating lease liability compared with an average reported liability for finance leases of £4m,implying that operating leases were 13 times as important as finance leases. They also foundthat performance measures such as profit margin and gearing would be significantlyaffected by operating lease capitalisation. On average, operating profit margin increasedfrom 8.7% to 9.8% and there was a dramatic increase in the gearing ratio (net debt toequity) from 20% to 72% for the sample as a whole and from 24% for 141% in the servicessector. Further, the relative ranking of companies changed markedly both within and acrossdifferent sectors. They concluded that ‘significant changes in the magnitude of keyaccounting ratios and a major shift in company performance rankings suggest that interestedparties’ decisions and company cash flows are likely to be affected’ by a policy changerequiring operating lease capitalisation.
Each of the two approaches to ex ante assessment of likely economic consequences offersunique insights, though each also has its own inherent limitations. For this reason, thetriangulation of results, where relevant, is to be recommended. A greater understanding ofthe potential impact of accounting change can be achieved by adopting both approaches andassessing the consistency of predictions. The present study based on the second approachcomplements the survey method adopted recently by Beattie et al. (2001a). Prior research

7
suggests that indebtedness levels and performance measures in the retail sector are likely tobe significantly affected if the G4+1 proposals are adopted as an accounting standard. Thepresent study investigates whether the empirical evidence for a large sample of both smalland large UK retail companies is consistent with these expectations.
METHODS
Sample selection and data
A list of food retail and general retail companies was extracted from Datastream and cross-checked to FT Sequencer database and yielded 106 companies. Of these, data could not befound for four companies leaving a total of 102 for further analysis.5 Basic data on sales,profits, assets and liabilities were extracted from Datastream for the period 1994 to 1999.Operating lease data is not available in computerised databases at a level of sufficient detailfor the constructive capitalisation process. Thus all operating lease data were extractedmanually from company microfiches, obtained from the Registrar of Companies, or fromhard-copy published accounts. Data on finance leases were also collected in this way forconsistency and to improve reliability.
Impact of capitalisation on key accounting ratios
To facilitate comparison with prior studies, the potential impact of capitalisation on ninekey performance ratios was investigated. These ratios were an operating margin, threereturn on capital measures, asset turnover, income gearing and three capital gearingmeasures. Definitions of the measures are given in Table 1 together with the effect ofoperating lease capitalisation on each ratio.
< TABLE 1 here >
In some contexts performance is judged against an absolute benchmark. For example, loancovenant restrictions may focus on a maximum gearing level or a minimum level of interestcover (or both). Executive compensation schemes may, in part, be based on achieving aparticular level of profitability (e.g. return on assets, or return on equity). Consequently,changes in the actual performance measures are important so the differences between pre-and post-capitalisation ratios are investigated here.
In other decision contexts, such as investment decisions made by investors, the relativeperformance of companies may be more relevant (i.e. company rankings). The impact ofoperating lease capitalisation on relative performance is assessed by measuring thecorrelation between pre- and post-capitalisation ratios; both Spearman rank and Pearsoncorrelation coefficients are reported and discussed.
Operating lease capitalisation procedure
The rights to use assets acquired under operating lease contracts are not currently recognisedon the balance sheet of UK companies; rather, aggregate information about such contracts isdisclosed by way of a note to the financial statements. The information disclosed is a scheduleof next year’s operating lease payments analysed by asset category (i.e. ‘land and buildings’and ‘other’) and by lease expiry date (i.e. leases expiring within one year, between one andfive years, and after five years).

8
Estimation of the present value of the unrecorded lease liability requires assumptions to bemade regarding the appropriate interest rate and the average remaining lease life. Estimation ofthe present value of the unrecorded lease asset requires further assumptions to be maderegarding the average total lease life and the depreciation method. Finally, the impact ofcapitalisation on deferred tax requires an assumption to be made regarding the appropriate taxrate.
In the present study, the ‘constructive capitalisation’ procedure followed the basic methodoutlined by BEG (1998), which derived from ILW (1991). Effectively, the methodincorporates company-specific assumptions in respect of the average remaining and total lifeof the company’s lease portfolio, the lease asset/liability proportion and an effective tax rate. Italso distinguishes between asset categories and lease expiry categories, with separatecalculations of remaining lease life and asset/liability proportions performed for each.6
Depreciation on the lease asset is assumed to be charged on a straight-line basis over the life ofthe lease.
Company financial statements will be affected in several ways by the capitalisation ofoperating leases. The current standard on leases (SSAP21) details the accounting treatmentfor finance (capital) leases and this treatment has been assumed to apply to operating leases.On the balance sheet, fixed assets will increase by the capitalised leased asset, and liabilitieswill increase by the liability to make future lease payments, split between the currentportion due within one year (current liability) and the longer-term portion. Shareholders’equity (retained profit) will be changed by the cumulative profit and loss effect ofcapitalisation and provisions will also be affected through adjustments to deferred tax.
In the profit and loss account the full operating lease rental (OLR) payment is presentlycharged against operating profit as a tax-deductible expense. On capitalisation of the leasedasset, depreciation will be charged against operating profit and the interest element of theOLR will be included under interest charges. The impact is that operating profit will behigher (depreciation < OLR). Profit before tax will be lower in the early years of a lease, orlease portfolio, (depreciation + interest > OLR) and higher in the later years as the interestelement of OLR declines (depreciation + interest < OLR). Under current tax rules, theamount of tax paid will be unchanged. However, the tax charged in the profit and lossaccount will be lower in the early years of the lease portfolio, reflecting the lower profitbefore tax, and higher in the later years. The difference between tax paid and charged isaccommodated by adjustments to deferred tax.
BEG (1998) describe a rationale for adopting particular remaining and total lease lifeestimates for each lease expiry category (<1year/2-5years/>5years) of each asset type (landand buildings/other).7 The same estimates are used in the present study. One of the keyassumptions, for example, is that leases of ‘land and buildings’ within the ‘>5 years’ expirycategory have 16 years remaining of a total 25 year lease life.8 The DKB study providesfurther support for the reasonableness of these assumptions. Given their analyst/brokerrelationship with companies, DKB were able to obtain estimates of average remaining leaselife directly from companies. For 1999, these ranged between 5 and 48 years with four‘outlier’ companies reporting remaining lives in excess of 40 years. Excluding these fouroutliers, the mean remaining lease life was 15 years (19 years including the outliers).Comparison of the median remaining life showed 13 in DKB against 14 in the presentstudy, for companies common to both. The similarities between overall estimates ofremaining lease life in the present study and those obtained by DKB suggest that the leaselife estimates used here are reasonable. The differences observed suggest that the

9
assumptions used here will tend to bias downwards the lease liabilities for the small numberof companies having very long leases on their properties; i.e. the overall estimates will beslightly ‘conservative’.
As the tax rate can vary considerably over time, an average tax rate for each company wascalculated over the period 1994 to 1999. For companies reporting a loss in a particular yearor with a negative tax charge (usually giving a negative tax rate), the tax rate was set tozero. To avoid distortions in the average tax rate, a small number (7 out of 483 firm-yearobservations) of outlier positive tax rates were set to 50%.
There is considerable debate as to the appropriate interest rate to use in the discountingprocess. Various possibilities have been suggested including a single discount rate to beapplied by all companies, a company-specific borrowing rate that will reflect the credit riskof the company, and a lease-specific rate (rate implied by the terms of the lease) that willreflect the lessor’s risks as well as the credit risk of the lessee.
The G4+1 discussion paper argues that the major lessor risk is often ‘residual value’ risk,relating to the lessor’s need to estimate residual value at the start of the lease contract. Thecurrent G4+1 proposals suggest that any guarantees, or other residual value arrangements,should be reflected in the ‘fair value’ of the guarantee that will be reported separately. Inview of this, the appropriate discount rate for estimating the present value of minimum leasepayments will be an ‘estimate of the lessee’s incremental borrowing rate for a loan ofsimilar terms and with the same security as provided by the lease’ (ASB, 1999, p.127).However, responses to the proposals in the discussion paper are mixed. While somecommentators agree with the logic, others argue that this will reduce comparability betweencompanies, since the same lease asset/liability will be valued differently in differentcompanies. Further, it will lead to a situation in which riskier lessees will report a lowerliability for the same lease contract because they will discount at a higher interest rate.
The main focus of the present study is to report average aggregate effects of leasing in theretail sector so a relatively simple approach is adopted. Land and buildings represent themajor asset category for operating leases and these tend to be relatively long contracts, oftenof 15-50 years. The assumption implicit in the estimation of the present value of leaseliabilities is that land and building contracts were, on average, of 25 years duration andstarted 9 years before the accounting period (i.e. remaining lease life = 16 years). Theaverage interest rate implied in 10-year UK government stock over the period 1984-1999was 8.44%, so a single risk-free discount rate of 8.5% is used for all companies. In view ofthe fall in interest rates over the 1990s this may lead to somewhat conservative estimates ofoperating lease liabilities and impacts. The sensitivity of the results to this interest rateassumption is tested by varying the discount rates by ± 1.5%.
The impact of using discount rates adjusted for company-specific credit risk was alsoinvestigated. Based on a direct survey of companies, DKB (1998) estimated credit-riskpremia for a selection of 27 general retail companies. As might be expected, there was astrong relationship between credit risk and company size. Consequently, the data in DKBwas used to derive a simple linear model between credit risk premium and size; this modelwas then used to derive risk premia for the companies in the present study. 9
A further issue relates to the treatment of rentals that rise in line with prices. The mostcommon, and important, occurrence is in the upward-only rent review lease, typical ofmany commercial property leases in the UK. The G4+1 consensus is that the likely future

10
price changes should be estimated at the start of the lease contract and incorporated in thecalculation of the present value of minimum lease payments. This treatment is theoreticallysound since a nominal interest rate (which incorporates the market’s inflation expectations)is used to discount the cash flows. However, the ASB dissented from this view on thegrounds that estimates of future price increases would be unreliable.
The main results of this paper are based on the ASB view, with no anticipation of futureprice increases. However, it is interesting to investigate the incremental impact of adoptingthe G4+1 approach. This is modelled by assuming that rent-reviews on ‘land and buildings’leases occur at 5 year intervals. The basic lease life assumption for land and buildings leasesthat expire beyond year 5 is that there are 16 years remaining of a 25 year lease. Thus 9years have already expired and a rent review will be due at year 10, in one year’s time.Rentals are assumed to rise in line with general price inflation, estimated to be 3% perannum.10 This implies that rentals will rise from a current 100 in year 10, to 115.9 for years11-15, to 134.4 for years 16-20 and finally to 155.8 for the last five years of the contract.11
RESULTS
Operating lease assets and liabilities
Table 2 provides a summary of the estimated average values of operating lease assets andliabilities within the food retail and general retail sectors, and over all retail companies, for1999. An indication of the scale of operating leases is provided by making comparisonswith long-term (on-balance sheet) debt, total assets and finance lease liabilities. Estimates ofaverage income effects are also presented.
< TABLE 2 here >
The overall mean (median) level of operating lease liability in the retail sector for 1999 isestimated to be £234m (£60m), of which £12m is due within one year and £222m is dueafter more than one year. The large mean-median difference reflects the positively skewedsize distribution of companies within the sector. Companies in the general retail sub-sectorhave slightly smaller operating lease liabilities (mean = £222m) than those in food retailing(mean = £287m). The scale of these off-balance sheet liabilities can be judged bycomparison with the on-balance sheet long-term debt. On average, retailing companies havea mean debt level of £67m but there is a large difference between the two sub-sectors, withfood retailers having £173m compared with £41m for general retailers. The ratio of thelong-term element of operating lease liabilities to on-balance sheet long-term debt is 1.6 forfood retailers, 5.1 for general retailers and 3.3 overall. These figures are based on the meansector and sub-sector values of operating lease liability and debt. To appreciate theimportance of operating leases at the individual company level, median ratios wereestimated excluding those companies with zero long-term debt. The median ratios were 2.9,9.1 and 6.6 for food, general and the sector overall.12 Thus, in the retail sector, andparticularly the general retailing sub-sector, operating lease finance is significantly moreimportant than long-term debt. This is of major potential importance in the assessment offinancial risk.
The level of finance (capital) lease liabilities is relatively small in the retail sector withmean liabilities of £10.8m (food), £5.4m (general) and £6.4m (all); the median finance leaseliabilities are very small (all less than £0.1m). The relative unimportance of finance leases isclear from the operating lease/finance lease ratios of 27 (food), 41 (general) and 37 (all); i.e.

11
operating lease liabilities are, on average, approximately 37 times the level of financeleases.
On the asset side, mean total operating leased assets are estimated to be £182m, the majorpart of which is land and buildings (£178m, 98%) rather than plant and equipment (2%).These off-balance sheet assets represent a major proportion of reported total assets withestimates, based on overall means, of 16% for the food sub-sector, 37% for general and28% overall. The equivalent median figures based on individual company ratios are higherat 34%, 55% and 52% respectively. Thus, operating leased assets are extremely important inthe retail sector, and their current exclusion from the balance sheet has the potential todistort return on asset type performance measures.
The effect of operating lease capitalisation on operating profit (EBIT) will be positive sinceexpenses will include depreciation rather than the operating lease rental (and depreciation <OLR). The approximate effect in the retail sector is that the mean operating profit wouldincrease by 14% (food), 30% (general) and 23% (all). The impact on net profit (profit aftertax) depends on the stage reached in the life of the lease portfolio. In the early years, netprofit is reduced (depreciation + interest > OLR) and this is reversed in the later years of alease contract (or portfolio). If investment in operating leased assets is growing (as in theretail sector) then companies will generally be in the ‘early years’ period. Based on thisassumption, the reduction in mean net profit is estimated to be 4% (food), 9% (general) and7% (all); median net profit reductions based on individual company data are similar. Thus,the average impact on net profit is relatively small, but the average does mask the fairlydrastic effect that would be felt by some companies, notably those with very high levels ofoperating leases or those with low levels of reported profit.
Impact of capitalisation on performance ratios
There are several features of the data that cause difficulties in calculating or interpreting theperformance ratios or changes therein. As a result, some companies had to be excluded fromthe analysis of ratios:
(a) Four companies had negative equity in their reported financial statements (i.e. prior tocapitalisation of operating leases) leading to problems with equity-based and asset-basedratios.13 Excluding these companies totally from further analysis led to sample sizes of18 (food), 80 (general) and 98 (all).
(b) Capitalisation of operating leases led to several additional companies having negativeequity. These have been excluded only from the analysis of the three ratios specificallyaffected (ROE, gearingILW and net debt to equity).
(c) Companies having zero interest in their reported financial statements are excluded fromanalysis of interest cover. This is necessary because it is not possible to calculatechanges in interest cover since pre-capitalisation interest cover equals infinity.
Table 3 reports the results from assessing the impact of operating lease capitalisation onperformance ratios in the retail sector for 1999. The notes at the foot of the table give fulldetails of the numbers of companies excluded from analysis.
< TABLE 3 here >
To reduce the impact of outlier observations, median rather than mean ratios are reported.The ratios are calculated pre-capitalisation based on figures in the published financial

12
statements (termed pre in the table) and post-capitalisation. The difference between mediansis also reported together with a two-tailed test of whether the samples are drawn frompopulations with the same medians and the same continuous distribution (the Wilcoxonsigned ranks test).14 Two-tailed t-tests of mean differences were also carried out (but notreported here) and, except where noted, similar results were obtained.
For the general retail sub-sector, significant differences were observed for all nine ratios (atthe 1% level).15 The median operating margin increased (from 8.1% to 11.5%), ROAdecreased, asset turnover decreased and the three gearing measures all increased; forexample, net debt to equity increased from 17% to 157% after capitalisation of operatingleases. For the three ratios with indeterminate directional expectations, ROE increased,ROCE decreased and interest cover decreased. For food retailers, five of the nine medianratios were significantly different (at the 1% level), three of them (ROA, ROCE and interestcover) at the 5% significance level with just ROE not significant.16 For the sector as awhole, all ratios were significantly different following capitalisation of operating leases.Thus, a requirement to capitalise all operating leases would potentially have a major impacton ratio measures of operating performance. This could have important economicconsequences in decision contexts where performance is judged against an absolutebenchmark, such as loan covenant restrictions or executive compensation schemes.
In other decision contexts (such as investment decisions made by investors) the relativeperformance of companies is more relevant. The impact of operating lease capitalisation onrelative performance is assessed by measuring the correlation between pre- and post-capitalisation ratios. Both Spearman rank and Pearson correlation coefficients are reportedin Table 4. Broadly similar results are obtained for food and general retailers. The ratios canbe split roughly into three groups on the basis of the strength of pre- and post-capitalisationcorrelations. A group of four ratios have ‘moderate to high’ positive correlations (above 0.8on one or both measures); these are the three return on asset measures and the profit margin.A group of three ratios have ‘low’ positive correlations (between 0.6 and 0.8, butstatistically significantly greater than zero); i.e. asset turnover, interest cover and thegearingILW measure. The two remaining gearing ratios, gearingAshton and net debt to equity,both have ‘very low’ correlations (less than 0.3, statistically insignificantly different fromzero17). Thus, lease capitalisation will affect relative performance based on all nine ratiosconsidered, but particularly on gearing measures.
< TABLE 4 here >
Comparison with other sectors in prior studies
Table 5 provides a comparison between the balance sheet effects for retail companies andthe overall (across all sectors) and services sector results reported by BEG (1998). The retailfigures are based on those companies from the current sample that existed in 1994 (the lastyear and focus of the BEG study). Thus this sub-sample suffers from survivorship bias.However, comparisons between ‘new’ and ‘continuing’ retail companies (not reported here)show that ‘continuing’ companies have lower usage of operating leases than ‘new’companies. So, in view of the directional difference observed, survivorship bias is likely toreduce the reported differences. Also, to avoid distortions due to different interest rates theretail figures are calculated using a 10% discount rate, as applied by BEG.
< TABLE 5 here >

13
The mean total operating lease liability within the retail sector companies in 1994 isestimated to be £195m, 1.9 times higher than the services sector and 3.8 times higher thanthe overall level reported in BEG. The retail operating lease liability is 2.56 the level of on-balance sheet debt compared with 0.7 (services) and 0.39 (overall). A similar pictureemerges for the operating lease asset, which for retail is 23% of total assets compared with13% (services) and 6% (overall). These figures confirm prior expectations that retailers areheavy users of lease finance, much heavier than most other sectors (as suggested in Beattieet al., 2000a).
A comparison between changes in performance ratios for retail companies and thosereported in two prior studies (BEG, 1998 and ILW, 1991) is given in Table 6. For closerconsistency with the prior studies, the comparisons are based on mean ratios (rather thanmedians) derived from 1994 data.18 While formal cross-study significance tests cannot beapplied, the impact of operating lease capitalisation in the retail sector is clearly muchgreater than reported in these prior studies. For example, the changes in gearing ratios forretailers are between 4.7 and 8.6 times greater than the all-sector changes in the UK (BEG,1998) and the change in gearingILW is 2.5 times greater than the average change reported forUS companies (ILW, 1991).19 These observations are consistent with the very heavy use ofoperating leases in the retail sector illustrated above.
< TABLE 6 here >
Sensitivity analysis
To test the inter-temporal stability of the findings, the basic analysis reported in Tables 2through 4 was repeated for the four years 1994 through 1998 on several alternative bases.For illustrative purposes, the figures for all retailers based on a constant discount rate of8.5% will be used. Across the retail sector as a whole, the estimated mean total operatinglease liability varied between £213m (1994) and £229m (1997) compared with the £234mreported for 1999 in Table 2. The ratio of the long-term element of the operating leaseliability to long-term debt ranged from 2.94 (1994) to 3.91 (1997) compared with 3.32 in1999 (Table 2). Across all years and all nine ratios for both sub-sectors and all retailers, thechanges in median performance ratios following capitalisation were of the same sign, ofsimilar magnitude and were all significantly different from zero.20 For example, thedifferences in net debt to equity varied between +102% (1996) and +152% (1997)compared with 138% in 1999 (Table 3). With minor exceptions, the pattern of correlationseach year was consistent with that illustrated for 1999 in Table 4. Thus, the impact ofoperating lease capitalisation seems to be stable over the time period covered here.
The sensitivity of the results to key assumptions was investigated using 1999 data. First, thebase assumption of a common interest rate of 8.5% was varied by ±1.5%. Second, the baseestimates for remaining (RL) and total lease (TL) lives were changed to more extreme, butstill plausible, estimates. This only really affects leases in the category that expire aftermore than five years. One set of estimates places leases at an earlier stage in a long lease;for land and buildings RL = 22 years, TL = 30 years, for other assets RL = 9 years, TL = 12years. The other set places leases at a later stage in a short lease; for land and buildings RL= 10 years, TL = 20 years, for other assets RL = 5 years, TL = 8 years.21
For all four scenarios, all ratio differences were of similar size, in the same direction andhad identical significance levels, with one or two minor exceptions caused by extremeoutliers. These exceptions were for the changes to base estimate lease lives and just three
14
ratios. The change in median ratio for ROCE in food retailers in the later stage/short leasescenario was of similar size, in the same direction but ceased to be significant at the 5%level. No other median change was significantly affected. For changes in mean ratios, theROE ratio was affected by extreme outliers and changed sign for general retailers in theearly stage/long lease scenario. In the later stage/short lease scenario the gearingILW ratioceased to be significant and the net debt to equity ratio was only significant at the 5% level,both driven by extreme outliers (e.g. Harveys Furnishing had a post-capitalisation net debtto equity ratio of 20,298%!). In all cases, removal of the outliers led to results consistentwith the original assumptions employed. Correlations between pre- and post-capitalisationratios were all of similar magnitude to those observed for the original assumptions. In viewof the minor changes, detailed results are not reported.
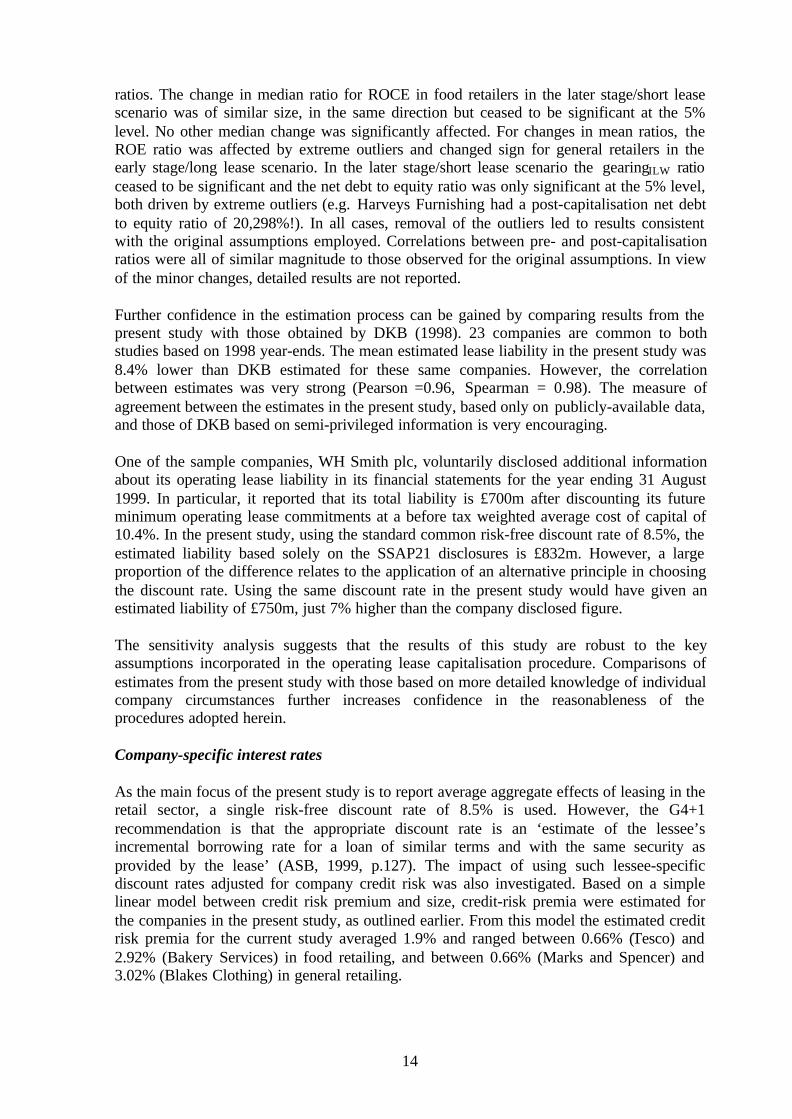
Further confidence in the estimation process can be gained by comparing results from thepresent study with those obtained by DKB (1998). 23 companies are common to bothstudies based on 1998 year-ends. The mean estimated lease liability in the present study was8.4% lower than DKB estimated for these same companies. However, the correlationbetween estimates was very strong (Pearson =0.96, Spearman = 0.98). The measure ofagreement between the estimates in the present study, based only on publicly-available data,and those of DKB based on semi-privileged information is very encouraging.
One of the sample companies, WH Smith plc, voluntarily disclosed additional informationabout its operating lease liability in its financial statements for the year ending 31 August1999. In particular, it reported that its total liability is £700m after discounting its futureminimum operating lease commitments at a before tax weighted average cost of capital of10.4%. In the present study, using the standard common risk-free discount rate of 8.5%, theestimated liability based solely on the SSAP21 disclosures is £832m. However, a largeproportion of the difference relates to the application of an alternative principle in choosingthe discount rate. Using the same discount rate in the present study would have given anestimated liability of £750m, just 7% higher than the company disclosed figure.
The sensitivity analysis suggests that the results of this study are robust to the keyassumptions incorporated in the operating lease capitalisation procedure. Comparisons ofestimates from the present study with those based on more detailed knowledge of individualcompany circumstances further increases confidence in the reasonableness of theprocedures adopted herein.
Company-specific interest rates
As the main focus of the present study is to report average aggregate effects of leasing in theretail sector, a single risk-free discount rate of 8.5% is used. However, the G4+1recommendation is that the appropriate discount rate is an ‘estimate of the lessee’sincremental borrowing rate for a loan of similar terms and with the same security asprovided by the lease’ (ASB, 1999, p.127). The impact of using such lessee-specificdiscount rates adjusted for company credit risk was also investigated. Based on a simplelinear model between credit risk premium and size, credit-risk premia were estimated forthe companies in the present study, as outlined earlier. From this model the estimated creditrisk premia for the current study averaged 1.9% and ranged between 0.66% (Tesco) and2.92% (Bakery Services) in food retailing, and between 0.66% (Marks and Spencer) and3.02% (Blakes Clothing) in general retailing.

15
As expected when applying a higher discount rate, the estimated total operating leaseliability and asset are lower: the mean (median) liability and asset reduced by 5.6% (10.6%),7.1% (11.7%) and 6.7% (11.7%) for food, general and all retailers, respectively. Profit andloss account effects increased slightly as a result of the higher interest charge. For ‘allretailers’, operating profit increased by 24.5% compared with an increase of 23.2% whenusing a single risk-free rate for all companies, and after-tax profit fell by 8.0% comparedwith a fall of 7.3%. The impact on performance ratios was relatively small, but the mediandifferences were almost entirely statistically significant. Profit margin, ROA, ROCE andasset turnover all improved (increased), the three gearing ratios improved (decreased) butROE and interest cover both deteriorated (decreased). The changes in median ratios for ‘allretailers’ averaged 5.1% of the level of the original (risk-free) ratio, and ranged between1.7% for ROA (a decrease from 16.13% to 15.14%) and 9.5% for net debt to equity (a fallfrom 153.6% to 139.0%). These results suggest that performance, measured against anabsolute benchmark, would generally look better if credit-risk adjusted rather than risk-freediscount rates are used. This is mainly a function of using a higher discount rate, whichreduces asset and liability estimates. The impact will be higher for companies with a lowercredit rating; i.e. for riskier, often smaller, companies.
Also important is the impact of using credit-risk adjusted discount rates on relativeperformance; i.e., does the use of a lessee-specific discount change the performance rankingof companies? This can be assessed by considering the correlation between a company’sranking on each performance measure for the two discount rates. The Spearman rankcorrelation coefficients were all close to 1. For food retailers they ranged between 0.975 and1.0 and for general retailers between 0.993 and 1.0. Thus relative performance in the retailsector would not be affected by the choice between the two discount rates.
Overall, the use of a credit-risk adjusted rather than a risk-free discount rate would reduceslightly the impact of lease capitalisation. It would have very little impact on intra-sectorperformance ranking. This is useful information for standard-setters in making the choicebetween the two. However, this study focuses on only one sector in which there is generallya high level of lease usage. The use of a risk-free discount rate would increase the contrastbetween sectors/companies with high and low lease usage. It also avoids the ‘anomaly’ thatidentical assets (and liabilities) would be valued differently by different companies, withriskier companies reporting lower liabilities. The use of a single discount rate across allcompanies has the further advantage of simplicity, consistent with the adage that ‘it is betterto be approximately right than precisely wrong’.
G4+1 proposal to anticipate future rental increases
The modelling of the incremental effect of anticipating future increases in lease rentals, asproposed in the discussion paper by G4+1, provides useful evidence for both companymanagers and standard-setters. Post-capitalisation, the overall mean operating lease liabilitywould rise 25.1% from £234.5m (Table 2) to £293.4m, and would be 4.3 times the level ofon-balance sheet debt (up from 3.3 in Table 2). The operating lease asset would represent35% of on-balance sheet assets (up from 28% in Table 2).
The anticipated positive impact on operating profit would be slightly lower at +19.2% (from+23.2%) as a result of higher depreciation on the leased asset. The larger operating leaseliability implies that a larger part of the current operating lease rental relates to interest(rather than capital repayment). This leads to a much more pronounced change in profitafter tax, which would fall by –19.1% (compared with –7.3% in Table 2), reflecting the

16
increased interest charge on top of the higher depreciation. Thus, the G4+1 proposal wouldhave a much larger negative impact on reported profit after tax in the earlier stages of alease portfolio (assumed in the present paper). However, this would reverse in the laterstages when a much smaller impact on profit would be experienced (see Ringer & Unerman,2000, for a neat graphical illustration of this effect).
Consistent with the larger operating lease asset and liability, seven of the nine ratios wouldsuffer a greater impact if future rental increases were recognised. For example, post-capitalisation ROCE would fall even further to 12.4% (15.1% in Table 2) and net debt toequity would rise even higher to 186% (from 154% in Table 2). The first of the two ratioswith reduced impacts is operating profit margin (as explained above) with a median of10.1% (10.7% in Table 2), but the change from pre-capitalisation level is still statisticallysignificant (1% level). The second ratio, ROE would have a median value of similarmagnitude (13.5%) to its pre-capitalisation level. Intra-sector correlations would increaseslightly for profit margin and ROE but would decline for the other seven ratios, the resultssuggesting a moderate change in companies’ rankings.
Overall, adoption of the G4+1 proposals concerning lease rentals that rise in line with priceswould exacerbate the already large impact of operating lease capitalisation in the retailsector. Asset and liability levels would increase more, than under the ASB’s preferredapproach and, in particular, profit after tax levels would suffer quite seriously in the earlierstages of the life of a lease portfolio. As a result, performance ratios and company rankingswould also deteriorate.
Managers’ response to lease capitalisation
A major assumption in the paper thus far, somewhat unrealistic in the light of priorevidence, is that company management will not take any steps to mitigate the effect ofcapitalisation. Rather extremely, they might change their asset financing policies away fromleasing, but this may not be possible, for example in obtaining access to ‘land and buildings’assets. Alternatively, they might seek to modify lease contract terms to minimise the impactof capitalisation as illustrated by their switch from finance to operating lease contracts inresponse to the introduction of SSAP21. Based on the current G4+1 proposals, a possibleroute focuses on the treatment of renewable leases. A lease may be written for a fairly shortprimary rental period with an option to renew the lease. Under the G4+1 proposals, theexercise of renewal options ‘should not generally be anticipated’ except where the fixednon-cancellable term is clearly unrepresentative of the period that the lessee is compelled touse the property (ASB, 1999, pp. 90-91). Thus, one way to mitigate the impact of leasecapitalisation would be to use shorter primary lease periods (much shorter than currentpractice on ‘land and buildings’ contracts) with options to renew for further short periods.22
Obviously, this would not suit all circumstances. However, it is consistent with the trendtowards lessees seeking shorter leases for purely commercial reasons, mainly reflectinglessees’ need for greater flexibility in choosing and changing locations of retail outlets, forexample (Nelson, 1999; BPF/IPD, 1999). These renewable short contracts are likely to shiftrisks from lessees to lessors since, for example, the lessor will now bear the risk that thelessee will not exercise the option to renew. This is most likely to happen when theattractiveness of the asset has reduced for some reason. When this is a general ‘decline’ inthe future worth of the asset, rather than lessee-specific, then a significant cost (loss ofvalue, difficulty in obtaining a new lessee or disposing of the asset) will be borne by thelessor. This risk shift will be of concern to lessors, some of whom will see it as a threat

17
while others may recognise an opportunity for increasing returns to compensate for the extrarisk.
A new set of calculations was undertaken to obtain a preliminary ‘feel’ for the change inimpact if all company managers were to adopt this approach. For this, a simple but fairlyradical assumption was made that all lease contracts (i.e., both ‘other’ and ‘land andbuildings’ categories) would have a maximum term (TL) of 5 years. After an initial phasethe average remaining life (RL) for these contracts would settle at about 3 years. A secondassumption implicit in the calculations is that the value of the renewal option will be smalland so can be ignored. For simplicity, any increase in lease rental required to compensatefor the lessor taking on additional residual value risk is also ignored; this may impart adownward bias to the estimation of lessees’ operating lease assets and liabilities. Theoverall impact on reported lease assets and liabilities based on 1999 data is summarised inTable 7, and the consequent effect on performance ratios in Table 8.
< TABLE 7 here >
Notwithstanding the radical nature of the assumption, operating lease assets and liabilitieswould remain a substantial feature on retail companies’ balance sheets. The mean totaloperating lease liability estimates are £94m (food retailers), £77m (general retailers) and£80m (all); the long-term element of these liabilities represents 37%, 128% and 82% of on-balance sheet debt, respectively. Overall, reported operating lease assets would representapproximately 11% of total assets. The impact on profit would also be slightly reduced but,across the retail sector overall, operating profit would still increase by about 9% and profitafter tax would decrease by about 4%; the impact on general retailers would continue to beslightly greater than on food retailers.
As expected, the size of the impact on performance ratios is also reduced, but the patternand (statistical) significance of the median changes is almost identical. The one exception isthe small reductions in median ROE, which are statistically significant but the size of thechanges suggests low economic significance.23 Correlations between pre- and post-capitalisation ratios are higher than those reported in Table 4 and range between 0.22 andalmost 1. The margin, return and asset turnover ratios are now mainly above 0.9, but interestcover and two of the three gearing ratios remain ‘low’. For example, the Spearman rankcorrelation coefficient for the net debt to equity ratio is 0.53 (food) and 0.49 (general), andfor gearingAshton is 0.49 (food) and 0.33 (general).
< TABLE 8 here >
The situation of maximum 5-year lease contracts modelled here may not be appropriate forsome contracts. However, other ‘opportunities’ for mitigating the impact will be available(e.g. the use of contingent rental contracts?). The above results suggest that, in the retailsector, lease capitalisation will probably have a fairly major impact on published financialstatements and on performance ratios, even if company managers take steps to minimise theimpact.
SUMMARY AND CONCLUSIONS
The rights to use assets acquired under operating lease contracts are not currently recognisedon the balance sheet of UK companies; rather, aggregate information about such contracts isdisclosed by way of a note to the financial statements. Two G4+1 discussion papers have
18
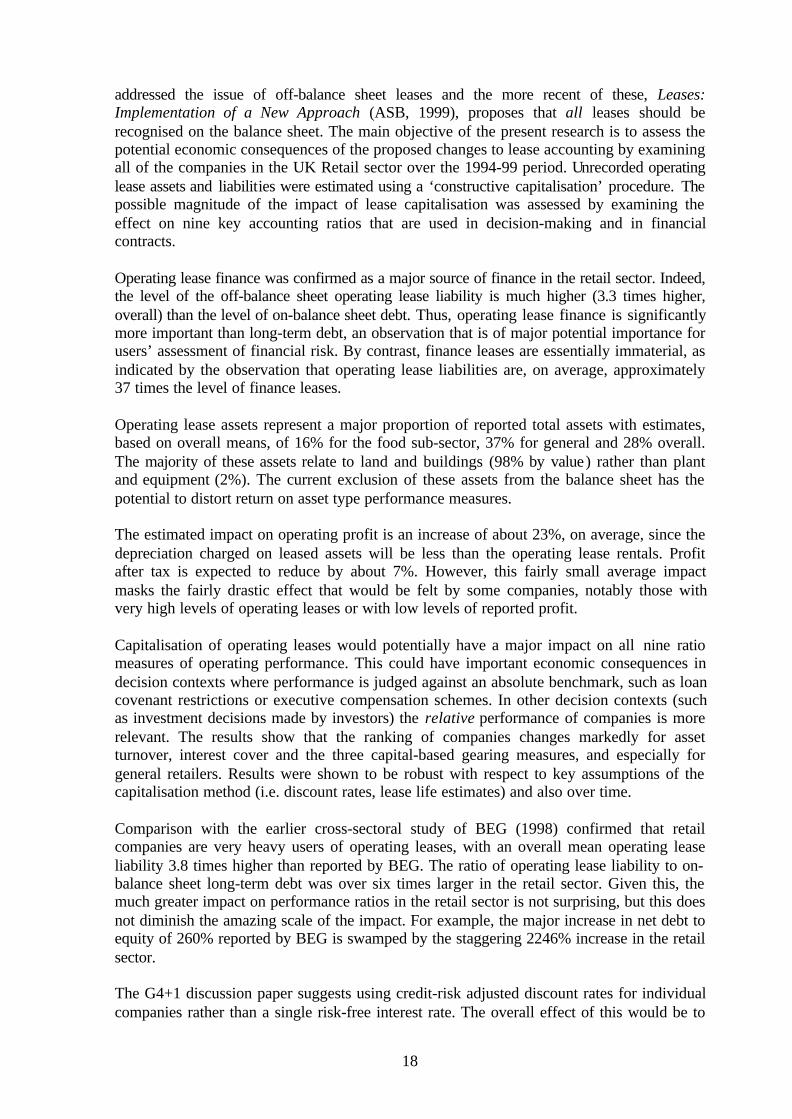
addressed the issue of off-balance sheet leases and the more recent of these, Leases:Implementation of a New Approach (ASB, 1999), proposes that all leases should berecognised on the balance sheet. The main objective of the present research is to assess thepotential economic consequences of the proposed changes to lease accounting by examiningall of the companies in the UK Retail sector over the 1994-99 period. Unrecorded operatinglease assets and liabilities were estimated using a ‘constructive capitalisation’ procedure. Thepossible magnitude of the impact of lease capitalisation was assessed by examining theeffect on nine key accounting ratios that are used in decision-making and in financialcontracts.
Operating lease finance was confirmed as a major source of finance in the retail sector. Indeed,the level of the off-balance sheet operating lease liability is much higher (3.3 times higher,overall) than the level of on-balance sheet debt. Thus, operating lease finance is significantlymore important than long-term debt, an observation that is of major potential importance forusers’ assessment of financial risk. By contrast, finance leases are essentially immaterial, asindicated by the observation that operating lease liabilities are, on average, approximately37 times the level of finance leases.
Operating lease assets represent a major proportion of reported total assets with estimates,based on overall means, of 16% for the food sub-sector, 37% for general and 28% overall.The majority of these assets relate to land and buildings (98% by value) rather than plantand equipment (2%). The current exclusion of these assets from the balance sheet has thepotential to distort return on asset type performance measures.
The estimated impact on operating profit is an increase of about 23%, on average, since thedepreciation charged on leased assets will be less than the operating lease rentals. Profitafter tax is expected to reduce by about 7%. However, this fairly small average impactmasks the fairly drastic effect that would be felt by some companies, notably those withvery high levels of operating leases or with low levels of reported profit.
Capitalisation of operating leases would potentially have a major impact on all nine ratiomeasures of operating performance. This could have important economic consequences indecision contexts where performance is judged against an absolute benchmark, such as loancovenant restrictions or executive compensation schemes. In other decision contexts (suchas investment decisions made by investors) the relative performance of companies is morerelevant. The results show that the ranking of companies changes markedly for assetturnover, interest cover and the three capital-based gearing measures, and especially forgeneral retailers. Results were shown to be robust with respect to key assumptions of thecapitalisation method (i.e. discount rates, lease life estimates) and also over time.
Comparison with the earlier cross-sectoral study of BEG (1998) confirmed that retailcompanies are very heavy users of operating leases, with an overall mean operating leaseliability 3.8 times higher than reported by BEG. The ratio of operating lease liability to on-balance sheet long-term debt was over six times larger in the retail sector. Given this, themuch greater impact on performance ratios in the retail sector is not surprising, but this doesnot diminish the amazing scale of the impact. For example, the major increase in net debt toequity of 260% reported by BEG is swamped by the staggering 2246% increase in the retailsector.
The G4+1 discussion paper suggests using credit-risk adjusted discount rates for individualcompanies rather than a single risk-free interest rate. The overall effect of this would be to

19
lessen slightly the impact of capitalisation, as a result of using a higher discount rate tocompute the present value of minimum lease payments. However, it would have littleimpact on intra-sector ranking of company performance. Inter-sectoral differences are notexplored in this paper, but it is likely that using a higher discount rate would reduce thedifferences between sectors with high and low lease usage.
The ASB dissented with one of the G4+1 proposals concerning the treatment of leaserentals that rise in line with prices. In particular, G4+1 suggested that the increase in futurerentals should be estimated at the start of the lease contract and incorporated into thevaluation of the operating lease asset and liability. The recognition of future rental increaseswas modelled and the incremental effect was found to be quite important. Reportedoperating lease assets/liabilities would be substantially higher (by about 25%) withcommensurate changes in most performance ratios, including gearing levels. In the earlystages of a lease portfolio, profit after tax would significantly decline. The size of theseimpacts, coupled with the uncertainties involved in estimating future rental increasesidentified by the ASB, suggest that company managers are likely to resist this G4+1proposal quite vigorously.
One method by which managers might seek to minimise the impact of capitalisation is theuse of renewable short lease contracts. The effect of one particular type of contract (i.e. a‘rolling five year’ lease contract) for ‘land and buildings’ was also assessed. While thisreduces the level of operating lease assets and liabilities, very significant amounts wouldstill be reported on-balance sheet. The mean operating lease liability for the sector wouldstill represent 82% of on-balance sheet long-term debt. All performance ratios continue tobe significantly affected. For example, net debt to equity would increase from 16% to 57%,a percentage change of 260%, the same average change that BEG (1998) reported across allsectors in the absence of any management attempt at mitigation.
These findings contribute to the assessment of the economic consequences of a policychange requiring operating lease capitalisation. Prior research suggests that individual usersof financial statements are not efficient information processors, and also that companymanagers do not believe that users, even in aggregate (e.g. the stock market) are efficientprocessors. Consequently, the significant changes in the magnitude of key accounting ratiosand the major shift in company performance rankings suggest that interested parties’(especially company managers’) economic decisions are likely to be affected. The level ofoperating lease use in the retail sector is very high, on average. The results of modelling theimpact of adopting renewable short-term lease contracts suggest that company managers,and their advisers, may find it difficult to avoid a significant impact on the balance sheetand on key performance ratios.
The results also have implications for researchers concerned with investigating companyfinancing and capital structure decisions. Non-capitalised operating lease finance is animportant source of finance and one whose usage varies across different companies andsectors. This implies that studies of capital structure that ignore operating leases can onlyprovide a partial portrayal of corporate finance practice.

20
NOTES
1 These figures are derived from data reported by Beattie, Edwards & Goodacre (1998) and Beattie, Goodacre& Thompson (2000a). The mean total lease finance was estimated at £54.6m (£3.8m finance leases, £50.8moperating leases) and so gives a total lease liability of about £71 billion (£54.6 × 1300) for the total ofapproximately 1300 companies in the Datastream UKQI list for 1994. Total lease finance to long-term debt =51% (£54.6m/£108.1m). The ratios of total leases to total assets (LRC) and net fixed assets to total assets(faprop), after adjustment for operating lease capitalisation in the former ratio, allow the calculation of 28%for leases to net fixed assets.
2 Beattie et al. (2000a) report that, across all sectors in 1994, ‘land and buildings’ represented over 80% of thetotal value of operating leased assets.
3 By contrast, Gallery & Imhoff (1998) found no evidence that Australian stock market investors incorporatefootnote operating lease disclosures in their assessment of equity risk.
4 For example, company managers appear to have reacted in this way to a requirement to report inflation-adjusted income numbers in the US (Odaiyappa and Nainar, 1992).
5 The four with missing data were Kleeneze, Magic Moments Internet, Partners Holdings and OriflameInternational; the latter is registered in Luxemburg. Of the 102 analysed, two were registered in the ChannelIslands (Flying Flowers and Le Riche Group) and one in Northern Ireland (Hampden Group).
6 An alternative approach to estimating the operating lease asset value has been adopted in the present paper(see BEG, 1998, footnote 9, p. 243,). The asset (PVA) and liability (PVL) values are related as follows:PVA/PVL = (RL×PVAFi,TL)/ (TL×PVAFi,RL), where RL and TL are remaining and total lease lives, andPVAFi,n is the present value of an annuity for n years discounted at i% (BEG, 1998, equation 8, p. 243). In theBEG paper, the PVA /PVL proportion was based on the historically weighted average RL and TL. In the presentpaper, the PVA /PVL proportion is estimated for each expiry category, rather than using the overall averageremaining and total lease lives. This approach reflects the current year position and is more appropriate forcompanies in which the historic average differs from the current balance between expiry categories. While thischanges the estimated asset value for individual companies, as BEG report, the overall results are robust withrespect to these alternatives.
7 The remaining lease life estimates for the three expiry categories for ‘land and buildings’ are 1 year (<1 yearexpiry), 3 years (1-5 years expiry) and 16 years (> 5 years expiry); the equivalent total lease life estimates are1, 3 and 25 years respectively. For the ‘other’ category of assets, the remaining (total) lease life estimates are 1(1), 3 (5) and 7 (10) years for the three expiry categories.
8 The British Property Federation/Investment Property Databank Annual Lease Review (BPF/IPD, 1999) alsoprovides support for these assumptions. The average rent-weighted lease length of new leases over the period1990-93 was 22.8 years. In more recent years, the lease life trend has been downwards; the average for newleases has fallen to 19.3, 18.5 and 16.4 years for 1994-5, 1996-7 and 1998-9 respectively. This downwardtrend will have some impact on the average life of ‘land and buildings’ leases for the retail companies in thestudy. However, these data are for new leases and, for many companies, a large proportion of their leaseportfolio will have originated prior to the recent period in which lease lives have been falling. This may not betrue for new companies in the sector and so there may be an element of upward bias in our estimates for newcompanies.
9 The model was estimated using OLS based on credit premium data on page 34 in DKB (1998). The derivedmodel was: premium (%) = 2.902 – 0.2395 ln(market capitalisation in £m); R2 = 81%. From this model theestimated credit risk premia for the current study ranged between 0.66% (Tesco) and 2.92% (Bakery Services)in food retailing, and between 0.66% (Marks and Spencer) and 3.02% (Blakes Clothing) in general retailing.
10 In practice, the increase in rentals would depend on various factors such as general and local economicconditions at the time of the rent review, the exact site and nature of the property, demand and supply factors,and ultimately on the relative bargaining power of landlord and tenant. Consequently, the estimates of rentalincreases would probably be different for each property and would also be subject to considerable uncertainty;these issues have contributed to the ASB’s dissension.

21
11 The overall effect of such rental increases is to increase the operating lease liability at the end of year 9 by26.9%.
12 There were 3, 22 and 25 companies with zero long-term debt in food, general and the sector overall.Including these companies increased the observed median ratios to 3.3, 39.6 and 29.2 respectively.
13 For example, a loss-making company with negative equity produces a positive ROE ratio. A more profitablecompany with negative equity produces a more negative ROE, so ROE is not a continuous measure forcompanies having negative equity. Similar issues arise with equity-based gearing measures. Asset-basedmeasures (ROCE, asset turnover and gearingAshton) are also affected. If assets are negative the ratio measuresare again not continuous, and even if positive the reduced asset size can lead to distorted ratios.
14 The use of a non-parametric test is more suitable given the non-normal distribution of many ratios (Barnes,1987). Despite the existence of uni-directional expectations for six of the ratios, for consistency two tailed-tests were used throughout, leading to conservative reported significance levels for these ratios.
15 Several extreme outliers (defined as the quartiles ± 10 × inter-quartile range) were identified in the ratiodifferences for interest cover (9 outliers) and the three ratios involving equity: ROE (9 outliers); gearingILW (3outliers) and net debt to equity (3 outliers). Excluding these extreme outliers, the mean differences betweenpre- and post-capitalisation ratios had identical signs and two-tailed t-stat significance to those reported formedian differences. Including outliers, identical signs and significance were observed for seven ratios, but themean difference for ROE was not significant and for interest cover was significant at the 5%, rather than 1%,level.
16 Mean differences were not statistically different for ROE, ROA, ROCE or interest cover, even after removalof the 2 extreme outliers for the interest cover ratio.
17 The one exception here is the Pearson correlation coefficient for the net debt to equity gearing measure inthe food retailing sub-sector; the coefficient is 0.57 and significantly above zero (at the 5% level).
18 Extreme outlier companies (discussed in footnotes 6 and 7 above) were excluded from the mean ratiocalculations from which this table is derived.
19 The fourteen companies in the ILW (1991) study include 4 food retailers, 4 general retailers, 4 fast-foodrestaurants and 2 airline companies, paired on the basis of being either a ‘high lessee’ or ‘low lessee’company. Data was derived from accounts for the 1987 fiscal year.
20 There was just one exception. While the difference in the ROE ratio for general retailers for 1994 was of thesame sign and similar magnitude to the other years, it was not statistically significant.
21 The early stage/long lease combination tends to increase operating lease asset and liability and increaseinterest charge, thereby reducing profit; the opposite is true for the later stage/short lease combination.
22 A similar effect can be achieved using break clauses. These can be used to give the lessee an option to exitthe lease contract at various stages during the contract (e.g. every five years?).
23 The balance between profit impact (numerator) and equity impact (denominator) is now tipped towards agreater negative change in the numerator, leading to a reduction in median ROE. Mean changes in ROE forgeneral retailers are again affected by extreme outliers. After removal of these, the mean change for generalretailers is –0.20% (statistically insignificant) and for all retailers is –0.27% (significant at the 5% level).

22
REFERENCES
Abdel-khalik, A.R., (1981). The Economic Effects on Lessees of FASB Statement No. 13,Accounting for Leases, Stamford, CT, Financial Accounting Standards Board.
ASB (1999). Leases: Implementation of a New Approach, Discussion Paper, London,Accounting Standards Board.
ASC (1984). Accounting for Leases and Hire Purchase Contracts, Statement of StandardAccounting Practice No. 21, London, Accounting Standards Committee.
Ashton, R.K. (1985). ‘Accounting for finance leases: a field test’. Accounting and BusinessResearch, 15, Summer, pp. 233-238.
Ball, R., Thomas, R.E. & McGrath, J. (1991). ‘Influence of R&D accounting conventionson internal decision-making of companies’, R&D Management, 21 (4), pp. 261-269.
Barnes, P. (1987). ‘The analysis and use of financial ratios: a review article’. Journal ofBusiness Finance & Accounting, 14(4), Winter, pp. 449-461.
Beattie, V.A., Edwards, K. & Goodacre, A. (1998). ‘The impact of constructive operatinglease capitalisation on key accounting ratios’, Accounting and Business Research, 28 (4),Autumn, pp. 233-254.
Beattie, V.A., Goodacre, A. & Thomson, S. (2000a). ‘Operating leases and the assessmentof lease-debt substitutability’, Journal of Banking & Finance, 24 (3), pp. 427-470.
Beattie, V.A., Goodacre, A. & Thomson, S. (2000b). ‘Recognition versus disclosure: aninvestigation of the impact on equity risk using UK operating lease disclosures’, Journal ofBusiness Finance & Accounting, 27 (9&10), November/December, pp. 1185-1224.
Beattie, V.A., Goodacre, A. & Thomson, S. (2001a). ‘Lease accounting reform: the viewsof UK finance directors’, paper presented at the British Accounting Association AnnualConference 2001, Nottingham, 26-28 March.
Beattie, V.A., Goodacre, A. & Thomson, S. (2001b). Leasing and corporate financingdecisions, unpublished manuscript.
Blake, J. (1992). ‘A classification system for economic consequences issues in accountingregulation’, Accounting and Business Research, 22 (88), Autumn, pp. 305-321.
BPF/IPD (1999). Annual Lease Review 1999, London, British PropertyFederation/Investment Property Databank.
Breton, G. & Taffler, R.J. (1995). ‘Creative accounting and investment analyst response’,Accounting and Business Research, 25 (98), pp. 81-92.
Dresdner Kleinwort Benson (1998). Operating leases: the retail house of cards, London,Dresdner Kleinwort Benson Research.
Drury, C. & Braund, S. (1990). ‘The leasing decision: a comparison of theory and practice’,Accounting and Business Research, 20 (79), Summer, pp. 179-191.
Dukes, R. (1976). ‘An investigation of the effects of expensing research and developmentcosts on security prices’ In M. Schiff & G. Sorter (eds), Proceedings of the Conference onTopical Research in Accounting, pp. 147-193, New York University, New York, RossInstitute of Accounting Research, School of Business.

23
Dukes, R., Dyckman, T. & Elliot, J. (1980). ‘Accounting for research and developmentcosts: the impact on research and development expenditures’, Journal of AccountingResearch, 18 (Supplement), pp. 1-26.
El-Gazzar, S.M. (1993). ‘Stock market effects of the closeness to debt covenant restrictionsresulting from capitalization of leases’, Accounting Review, 68 (2), April, pp. 258-272.
Elliot, J., Richardson, G., Dyckman, T. & Dukes, R. (1984). ‘The impact of SFAS No 2 onfirm expenditures on research and development: replications and extensions’, Journal ofAccounting Research, 22, Spring, pp. 85-102.
Ely, K.M. (1995). ‘Operating lease accounting and the market’s assessment of equity risk’,Journal of Accounting Research, 33 (2), Autumn, pp. 397-415.
Finance & Leasing Association (1999). ‘Think again Sir David: lease accounting reform isnot as simple as you think’, Press Release: 17 December, London, Finance & LeasingAssociation.
Finance & Leasing Association (2000). Annual survey of business finance 2000, London,Finance & Leasing Association.
Gallery, G. & Imhoff, E.A. (1998). ‘Disclosure versus recognition: some evidence from theAustralian capital market regarding off-balance sheet leasing’. Paper presented at theUniversity of Melbourne, Research Seminar Series.
Garrod, N. (1989). ‘Regulation and response: the case of lease disclosure in the UK’. Researchin Accounting Regulation, 3, pp. 69-92.
Godfrey, J.M. and Warren. S.M. (1995). ‘Lessee reactions to regulation of accounting forleases’, Abacus, 31 (2), September, pp. 201-228.
Goodacre, A. & Beattie, V.A. (1999). ‘Operating leases get the treatment’, ProfessionalInvestor, October, pp. 24-27.
Gopalakrishnan, V. & Parkash, M. (1996). ‘The debt-equivalency of recognized vs.disclosed obligations: an examination of borrower and lender perceptions’, Research inAccounting Regulation, 10, pp. 63-77.
Gopalakrishnan, V. & Sugrue, T.F. (1992). ‘Economic consequences of pension policydeliberations (SFAS no. 87): an empirical assessment of debt-covenant hypothesis’, Journalof Business Finance & Accounting, 19 (5), September, pp.751-775.
Holthausen, R.W. & Leftwich, R.W. (1983). ‘The economic consequences of accountingchoice: implications of costly contracting and monitoring’, Journal of Accounting andEconomics, 5 (2) pp. 77-117.
Horwitz, B.N. & Kolodny, R. (1980). ‘The economic effects of involuntary uniformity inthe financial reporting of R&D expenditures’, Journal of Accounting Research, 18(Supplement), pp. 38-74.
Imhoff, E.A. & Thomas, J.K. (1988). ‘Economic consequences of accounting standards: thelease disclosure rule change’, Journal of Accounting and Economics, 10 (4), pp. 277-310.
Imhoff, E.A., Lipe, R.C. & Wright, D.W. (1991). ‘Operating leases: impact of constructivecapitalization’, Accounting Horizons, 5(1), March, pp. 51-63.
Imhoff, E.A., Lipe, R.C. & Wright, D.W. (1993), ‘The effects of recognition versusdisclosure on shareholder risk and executive compensation’, Journal of Accounting,Auditing and Finance, 8 (4), Fall, pp. 335-368.

24
Imhoff, E.A., Lipe, R.C. & Wright, D.W. (1997). ‘Operating leases: income effects ofconstructive capitalization’, Accounting Horizons, 11(2), June, pp. 12-32.
Investment Property Forum (1999). ‘Proposed capitalisation of operating leases – whatimpact on the UK property market?’, Forum Review, Issue No. 3 October, pp. 2-3.
KPMG (2000). ‘Approach with caution’, Financial Reporting Update, January/February,pp. 1-2.
Larcker, D.F. & Revsine, L. (1983). ‘The oil and gas accounting controversy: an analysis ofeconomic consequences’, Accounting Review, 58 (4), October, pp. 706-732.
Mayer-Sommer, A.P. (1979). ‘Understanding and acceptance of the efficient marketshypothesis and its accounting implications’, Accounting Review, 54 (1), January, pp. 88-106.
McGregor, W. (1996). Accounting for Leases: A New Approach, Stamford, CT, FinancialAccounting Standards Board.
Munter, P. & Ratcliffe, T.A. (1983). ‘An assessment of user reactions to lease accountingdisclosure’, Journal of Accounting, Auditing and Finance, 6 (2), pp. 108-114.
Nelson, A.J. (1963). ‘Capitalising leases - the effect on financial ratios’, Journal ofAccountancy, July, pp. 49-58.
Nelson, F. (1999), ‘Trouble in store for high street retailers’, The Times, 4 December, p. 31.
Odaiyappa, R. and Nainar, S.M.K. (1992). ‘Economic consequences of SFAS No 33 – aninsider-trading perspective’, Accounting Review, 67 (3), July, pp. 599-609.
Prakash, P. & Rappaport, A. (1977). ‘Information inductance and its significance foraccounting’, Accounting, Organisations and Society, 2 (1), pp. 29-38.
Ringer, M. & Unerman, J. (2000). ‘Hidden gearing’, Accountancy, June, pp. 104-105.
Ro, B.T. (1978). ‘The disclosure of capitalised lease information and stock prices’, Journalof Accounting Research, 16 (2), Autumn, pp. 315-340.
Schipper, K. (1994). ‘Academic accounting research and the standard setting process’.Accounting Horizons, 8 (4), December, pp. 61-73.
Shehata, M. (1991). ‘Self-selection bias and the economic consequences of accountingregulation: an application of two-stage switching regression to SFAS no. 2’, AccountingReview, 66 (4), October, pp. 768-787.
Taylor, P. & Turley, S. (1985). ‘The views of management on accounting for leases’,Accounting and Business Research, 16, Winter, pp. 59-67.
Vigeland, R.L. (1981). ‘The market reaction to SFAS no. 2’, Accounting Review, April, pp.309-325.
Wasley, C.E. & Linsmeier, T.J. (1992). ‘A further examination of the economicconsequences of SFAS no.2’, Journal of Accounting Research, 30 (1), Spring, pp. 156-164.
Wilkins, T. & Zimmer, I. (1983a). ‘The effect of leasing and different methods ofaccounting for leases on credit evaluations’, Accounting Review, 58 (4), pp. 749-764.
Wilkins, T. & Zimmer, I. (1983b). ‘The effect of alternative methods of accounting forleases - an experimental study’, Abacus, 19 (1), pp. 64-75.

25
Wilkins, T. (1984). ‘A behavioural investigation of alternative methods of financing capitalacquisitions and lease capitalization’, Accounting and Business Research, 14 (56), Autumn,pp. 359-366.
Zeff, S.A. (1978). ‘The rise of “economic consequences”’, Journal of Accountancy,December, pp. 56-63.

26
TABLE 1
Definitions of key performance ratios and the impact of operating lease capitalisation
Ratio Definition (pre-capitalisation) Impact of capitalisationSign Ratio definition
Profit margin Earnings before interest & tax (EBIT)Sales +
EBITpre + OLR – depnSales
Return on equity(ROE)
Profit after interest & tax (PAIT)Equity (EAshton) + or -
PAITpre + (1 - T)(OLR - depn - int)EAshton , pre - (PVL – PVA )
Return on assets(ROA)
Profit after interest & tax (PAIT)Total assets (TA)
-PAITpre + (1 - T)(OLR - depn - int)TApre + PVA
Return on capitalemployed (ROCE)
Earnings before interest & tax (EBIT)Capital employed (CE) + or -
EBITpre + OLR – depnCEpre + PVA – [OLR - i × PVL ]
Asset turnover Sales .Capital employed (CE) -
Sales .CEpre + PVA – [OLR - i × PVL ]
Interest cover Earnings before interest & tax (EBIT)Interest (I)
+ or -EBITpre + OLR - depnIpre + int
GearingAshton Long-term debt (LTD)Capital employed (CE) +
LTD pre + PVL - [OLR - i × PVL ]CEpre + PVA – [OLR - i × PVL ]
GearingILW Total debt (D)Equity (EILW) +
Dpre + PVL - T(PVL - PVA)EILW, pre - (1 - T)(PVL - PVA )
Gearing(net debt to equity)
Total borrowings - cash & equivalents (TB)Equity (EILW)
+TBpre + PVL .EILW, pre - (1 - T)(PVL - PVA )
OLR = annual operating lease rental (for consistency with asset and liability estimates, this was taken asnext year’s operating lease commitment, as specified in the notes to the accounts, rather that thecurrent year reported operating lease rental);
depn = annual straight line depreciation of capitalised asset;T = company-specific effective tax rate;PVL = estimated operating lease liability based on the present value of minimum lease payments
discounted at i%;PVA = estimated operating lease asset derived using the relationship:
PVA/PVL = (RL×PVAFi,TL)/ (TL×PVAFi,RL), where RL and TL are remaining and total leaselives, and PVAFi,n is the present value of an annuity for n years discounted at i% (see footnote 6);
int = annual lease interest expense = i × (PVL + OLR)]/(1 + i);i = rate of interest for discounting minimum lease payments;T(PVL- PVA) = reduction in deferred tax due to operating lease capitalisationOLR - i×PVL = short-term portion of lease liability
[This short-term operating lease liability is incorrectly calculated as OLR/(1+ i) in BEG (1998)]

27
TABLE 2
Estimated value of operating lease assets and liabilities for 1999
Food (n=20) General (n=82) All (n=102)Mean Median Mean Median Mean Median
£m £m £m £m £m £m
BALANCE SHEET EFFECTS
Operating leasesLiability due within 1 year 13.4 3.5 12.2 2.8 12.4 2.8
A Liability due after more than 1 year 273.9 62.6 209.5 57.5 222.1 57.5B Total liability 287.3 66.1 221.7 59.9 234.5 59.9
C Long-term debt (excl op leases) 172.9 15.2 40.9 1.6 66.8 1.8
A/C Lease liability/debt1 1.58 2.87 5.12 9.11 3.32 6.64
Lease asset: plant and equipment 9.0 0.8 3.0 0.3 4.2 0.4Lease asset: land and buidings 212.9 48.5 169.0 45.9 177.6 45.9
D Total lease asset 221.9 51.3 172.0 46.0 181.8 46.0
E Total assets (excl op leases) 1408.7 131.2 464.5 65.7 649.7 76.6
D/E Lease asset/total asset2 0.16 0.34 0.37 0.55 0.28 0.52
Finance leases (reported)Liability due within 1 year 2.1 0.1 1.0 0.0 1.2 0.0Liability due after more than 1 year 8.7 0.1 4.4 0.0 5.2 0.0
F Total liability 10.8 0.1 5.4 0.0 6.4 0.0
B/F Op leases/fin leases 26.6 41.1 36.6
INCOME EFFECTS
Operating profit (EBIT) reported 147.4 14.5 51.5 9.9 70.3 10.5Operating profit post-capitalisation 167.4 21.6 66.9 13.1 86.6 14.4Percentage change2 13.6 15.6 29.9 28.2 23.2 24.1
Net profit (profit after tax) reported 89.6 9.3 32.7 6.4 43.9 6.7Net profit post-capitalisation 85.8 7.7 29.7 4.9 40.7 5.2Percentage change2 -4.2 -5.1 -9.2 -8.4 -7.3 -7.7
Notes
1. Median lease liability/debt ratio is based on individual company figures; several companies with zerolong-term debt are excluded from the calculation: 3 (food), 22 (general), 25 (all).
2. Median lease liability/debt ratio is based on individual company figures.

28
TABLE 3
Changes in median ratios following lease capitalisation for 1999
Food retailers 1 General retailers 1 All retailers 1
pre post diff 2 pre post diff 2 pre post diff 2
Profit margin (%) 4.31 5.73 1.42 ** 8.07 11.51 3.44 ** 7.69 10.70 3.00 **
Return on equity (%)3 13.13 13.49 0.36 14.39 17.02 2.63 ** 13.72 16.13 2.42 **
Return on assets (%) 6.36 4.63 -1.73 * 7.65 4.43 -3.22 ** 7.28 4.48 -2.80 **
Return on capital employed (%) 17.33 14.71 -2.62 * 21.06 15.15 -5.90 ** 18.88 15.15 -3.73 **
Asset turnover 3.24 2.30 -0.94 ** 2.56 1.31 -1.25 ** 2.78 1.38 -1.41 **
Interest cover4 9.43 2.92 -6.52 * 11.01 2.21 -8.80 ** 10.06 2.33 -7.73 **
GearingAshton (%) 11.28 61.42 50.13 ** 5.14 69.26 64.13 ** 5.37 67.70 62.33 **
GearingILW (%)5 109.86 306.26 196.40 ** 86.78 285.65 198.88 ** 89.39 286.13 196.74 **
Gearing (net debt to equity)(%)5 15.16 111.33 96.17 ** 16.56 156.75 140.19 ** 15.86 153.62 137.76 **
Notes
1. With the general exclusion of 4 companies having negative equity pre-capitalisation, the results are for sample sizesof 18 (food), 80 (general) and 98 (all) except as indicated.
2. diff = post – pre; ** (*) = significance at 1% (5%) level of two-tailed Wilcoxon signed ranks test of difference inmedians.
3. Excludes companies having negative equity post-capitalisation: 1 (food), 14 (general), 15 (all).4. Excludes companies having no interest pre-capitalisation: 8 (general), 8 (all).5. Excludes companies having negative equity post-capitalisation: 1 (food), 11 (general), 12 (all). For the last two
gearing measures, deferred tax is effectively treated as a liability and, since capitalisation generally reduces deferredtax, overall debt is reduced. Further, equity is affected by the cumulative net of tax profit reduction. Thus, there arefewer companies having negative debt post-capitalisation than for the Return on equity measure, which treatsdeferred tax as equity.

29
TABLE 4
Correlations between ratios pre- and post-operating leases capitalisation for 1999
Food retailers 1,2 General retailers 1,2 All retailers 1,2
Spearman Pearson Spearman Pearson Spearman Pearson
Profit margin (%) 0.816 0.973 0.864 0.883 0.871 0.921
Return on equity (%)3 0.912 0.989 0.973 0.438 0.974 0.434
Return on assets (%) 0.639 0.929 0.835 0.868 0.805 0.880
Return on capital employed (%) 0.827 0.958 0.901 0.870 0.894 0.875
Asset turnover 0.655 0.670 0.470 0.549 0.518 0.511
Interest cover4 0.645 0.837 0.465 0.369 0.480 0.086 ns
GearingAshton (%) 0.181 ns 0.295 ns 0.098 ns 0.168 ns 0.075 ns 0.170 ns
GearingILW (%)5 0.713 0.712 0.663 0.171 ns 0.642 0.160 ns
Gearing (net debt to equity)(%)5 0.294 ns 0.575 0.151 ns 0.017 ns 0.172 ns 0.016 ns
Notes
1. With the general exclusion of 4 companies having negative equity pre-capitalisation, the results are forsample sizes of 18 (food), 80 (general) and 98 (all) except as indicated.
2. ns = not significantly different from zero at 5% level (two-tailed) .3. Excludes companies having negative equity post-capitalisation: 1 (food), 14 (general), 15 (all).4. Excludes companies having no interest pre-capitalisation: 8 (general), 8 (all).5. Excludes companies having negative equity post-capitalisation: 1 (food), 11 (general), 12 (all). For the
last two gearing measures, deferred tax is effectively treated as a liability and, since capitalisationgenerally reduces deferred tax, overall debt is reduced. Further, equity is affected by the cumulative net oftax profit reduction. Thus, there are fewer companies having negative debt post-capitalisation than for theReturn on equity measure, which treats deferred tax as equity.

30
TABLE 5
Comparison with other sectors: estimated mean value of operating lease assets andliabilities for 1994
Present study BEG (1998)
All retail Services All sectors
(n=63) 1 (n=81) (n=232)
£m £m £mOperating leasesLiability due within 1 year 9.2 15.5 8.3
A Liability due after more than 1 year 185.7 87.9 42.5B Total liability 194.9 103.4 50.8
C Long-term debt (excl op leases) 72.5 127.5 108.1
A/C Lease liability/debt 2.56 0.69 0.39
D Total lease asset 146.7 79.8 39.9
E Total assets (excl op leases) 640.0 628.4 629.8
D/E Lease asset/total asset 0.23 0.13 0.06
Notes
1. This sub-sample represents the 63 retail companies, from the original sample of 102, that existed in 1994[see comment in text concerning survivorship bias]. A discount rate of 10% is used here for consistencywith the BEG (1998) study.
2. The details for other sectors are extracted from BEG (1998), Table 6, p. 247.

31
TABLE 6
Comparison with previous studies on operating lease capitalisation
Study Present study 1 BEG (1998) 2 ILW (1991) 3
Sector covered All retailers All sectors Sundry
Country UK UK US
Sample size n=98 4 n=232 n=14
Financial statement year 1999 1994 1988
Percentage change in mean ratio following capitalisation
Profit margin (%) 51.4 ** 12.1 ** na
Return on equity (%) 5 35.1 ** 4.8 * na
Return on assets (%) -44.8 ** -10.8 ** -22.0
Return on capital employed (%) -32.8 ** -0.6 na
Asset turnover -55.2 ** -12.5 ** na
Interest cover 6 -79.3 ** -25.9 na
GearingAshton (%) 433.2 ** 92.8 ** na
GearingILW (%)7 295.0 ** 48.7 ** 119.0
Gearing (net debt to equity) (%) 8 2246.0 ** 260.0 ** na
Notes
1. Changes in means (rather than medians) are reported in this table for consistency with prior studies, butextreme outliers are removed to avoid distortions (see below for impact of outliers). A discount rate of10% is used here for consistency with the BEG (1998) and ILW (1991) studies.
2. Figures reported in BEG (1998), Table 8, p. 249.3. Derived from figures reported in ILW (1991), p. 61; no statistical tests of significance were reported.4. Number of companies is 98 except for those ratios affected by negative equity, zero pre-capitalisation
interest and extreme outliers: ROE (n=74), interest cover (n=79), gearingILW (n=83), net debt to equity(n=83).
5. Including 9 outliers gave a percentage change of 61.3% in ROE.6. Including 11 outliers gave a percentage change of –98.3% in interest cover.7. Including 3 outliers gave a percentage change of 517.5% in gearingILW.8. Including 3 outliers gave a percentage change of 4271.3% in net debt to equity.9. na = ratio not included in study; ** (*) = significance at 1% (5%) level of a two-tailed paired t-test.

32
TABLE 7
Effect of managers’ response to lease capitalisationEstimated value of operating lease assets and liabilities for 1999 assuming
re-negotiation of long contracts to renewable five-year terms
Food (n=20) General (n=82) All (n=102)Mean Median Mean Median Mean Median
£m £m £m £m £m £m
BALANCE SHEET EFFECTS
Operating leasesLiability due within 1 year 29.8 7.2 24.5 5.9 25.5 5.9
A Liability due after more than 1 year 64.5 15.4 52.5 13.0 54.9 13.0B Total liability 94.3 22.7 77.0 18.9 80.4 18.9
C Long-term debt (excl op leases) 172.9 15.2 40.9 1.6 66.8 1.8
A/C Lease liability/debt1 0.37 0.85 1.28 2.19 0.82 1.72
Lease asset: plant and equipment 7.2 0.8 2.9 0.3 3.8 0.3Lease asset: land and buidings 80.1 18.5 68.5 17.4 70.7 17.4
D Total lease asset 87.3 21.0 71.4 17.5 74.5 17.5
E Total assets (excl op leases) 1408.7 131.2 464.5 65.7 649.7 76.6
D/E Lease asset/total asset2 0.06 0.14 0.15 0.22 0.11 0.20
INCOME EFFECTS
Percentage change in operating profit2 5.3 20.7 12.2 8.1 9.4 9.5
Percentage change in net profit2 -1.9 -7.5 -4.6 -7.8 -3.6 -10.5
Notes
1. Median lease liability/debt ratio is based on individual company figures; several companies with zerolong-term debt are excluded from the calculation: 3 (food), 22 (general), 25 (all).
2. Median lease liability/debt ratio is based on individual company figures.

33
TABLE 8
Effect of managers’ response to lease capitalisationChanges in median ratios following lease capitalisation for 1999 assuming
re-negotiation of long contracts to renewable five-year terms
Food retailers 1 General retailers 1 All retailers 1
pre post diff 2 pre post diff 2 pre post diff 2
Profit margin (%) 4.31 5.22 0.90 ** 8.07 9.90 1.83 ** 7.69 8.43 0.74 **
Return on equity (%)3,5 13.13 13.06 -0.07 ** 16.39 16.17 -0.22 ** 15.48 14.32 -1.16 **
Return on assets (%) 6.36 5.15 -1.21 * 7.65 5.74 -1.91 ** 7.28 5.42 -1.86 **
Return on capital employed (%) 17.33 17.11 -0.22 21.06 18.98 -2.08 ** 18.88 18.08 -0.80 **
Asset turnover 3.24 2.83 -0.41 ** 2.56 2.07 -0.49 ** 2.78 2.24 -0.54 **
Interest cover4 9.43 4.79 -4.64 * 11.01 3.43 -7.58 ** 10.06 3.59 -6.48 **
GearingAshton (%) 11.28 29.72 18.44 ** 5.14 32.55 27.41 ** 5.37 32.29 26.92 **
GearingILW (%)5 109.86 149.59 45.67 ** 92.06 160.21 68.15 ** 92.88 155.27 62.39 **
Gearing (net debt to equity)(%)5 15.16 50.87 40.79 ** 16.26 61.03 44.77 ** 15.56 57.16 41.60 **
Notes
1. With the general exclusion of 4 companies having negative equity pre-capitalisation, the results are forsample sizes of 18 (food), 80 (general) and 98 (all) except as indicated.
2. diff = post – pre; ** (*) = significance at 1% (5%) level of two-tailed Wilcoxon signed ranks test ofdifference in medians.
3. Excludes companies having negative equity post-capitalisation: 1 (general), 1 (all).4. Excludes companies having no interest pre-capitalisation: 8 (general), 8 (all).5. The reduced number of general (and all) retailers having negative equity post-capitalisation gives
increased sample sizes for these three ratios. In turn, this affects the pre-capitalisation ratios, whichtherefore differ from those reported in Table 3.