The POP Project
21
The POP Project Jesús Labarta (BSC) 6 th AICS Symposium Kobe, Feb 23 rd , 2016
-
Upload
khangminh22 -
Category
Documents
-
view
2 -
download
0
Transcript of The POP Project
The POP ProjectJesús Labarta (BSC)
6th AICS Symposium
Kobe, Feb 23rd, 2016
EU HPC Ecosystem
Centres of Excellence in HPC applications
POP CoE• A Center of Excellence
• On Performance Optimization and Productivity• Promoting best practices in parallel programming
• Providing Services• Precise understanding of application and system behavior• Suggestion/support on how to refactor code in the most productive way
• Horizontal• Transversal across application areas, platforms, scales
• For academic AND industrial codes and users !
3EU H2020 Center of Excellence (CoE) Grant Agreement No 676553
Why?• Complexity of machines and codes Frequent lack of quantified understanding of actual behavior Not clear most productive direction of code refactoring
• Important to maximize• Efficiency (performance, power) of compute intensive applications
• Productivity of the development efforts
4
Motivation
• Who?• BSC (coordinator), ES• HLRS, DE• JSC, DE• NAG, UK• RWTH Aachen, IT Center, DE• TERATEC, FR
A team with• Excellence in performance tools and tuning• Excellence in programming models and practices• Research and development background AND proven commitment in application to real academic and industrial use cases
5
Partners
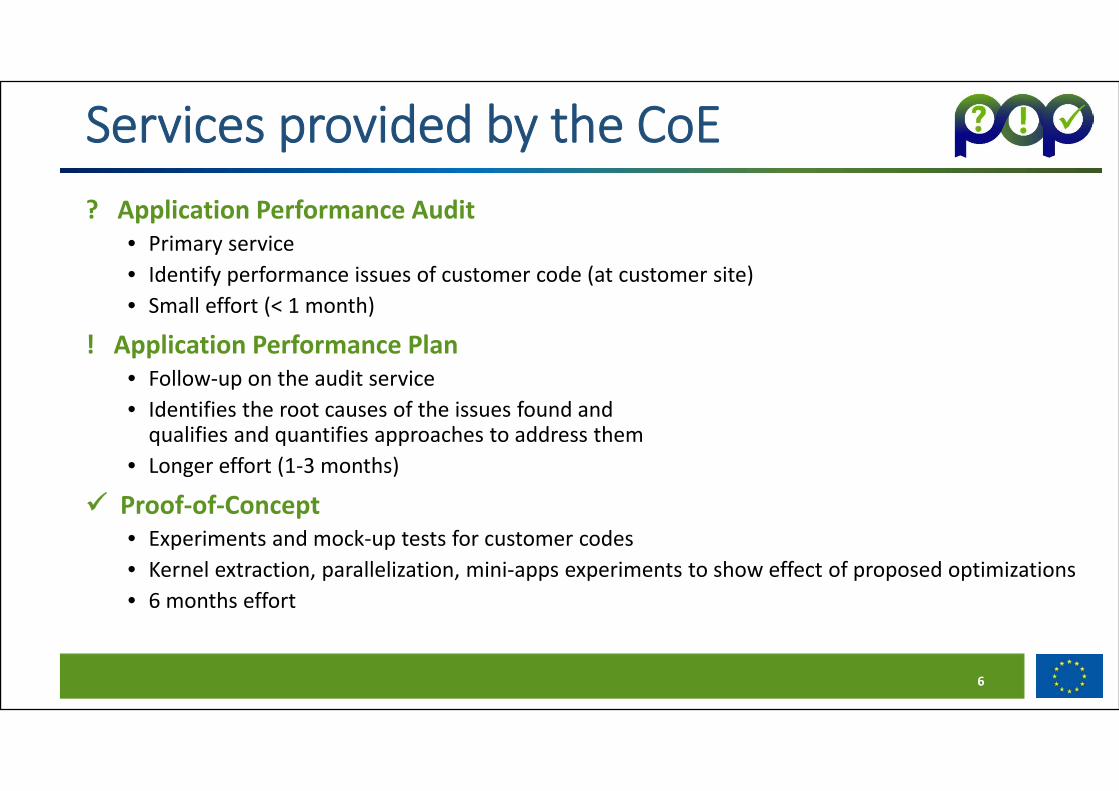
? Application Performance Audit• Primary service• Identify performance issues of customer code (at customer site)• Small effort (< 1 month)
! Application Performance Plan• Follow‐up on the audit service• Identifies the root causes of the issues found andqualifies and quantifies approaches to address them
• Longer effort (1‐3 months)
Proof‐of‐Concept• Experiments and mock‐up tests for customer codes• Kernel extraction, parallelization, mini‐apps experiments to show effect of proposed optimizations• 6 months effort
6
Services provided by the CoE
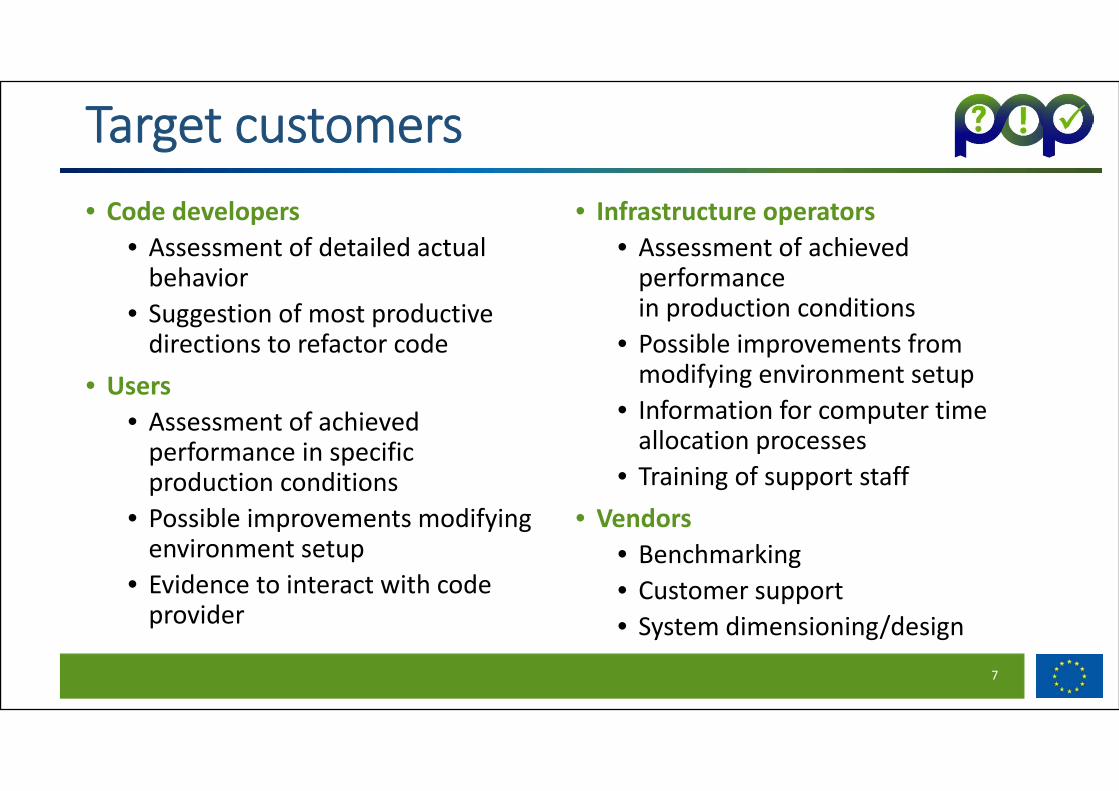
Target customers• Code developers
• Assessment of detailed actual behavior
• Suggestion of most productive directions to refactor code
• Users• Assessment of achieved performance in specific production conditions
• Possible improvements modifying environment setup
• Evidence to interact with code provider
• Infrastructure operators• Assessment of achieved performancein production conditions
• Possible improvements from modifying environment setup
• Information for computer time allocation processes
• Training of support staff• Vendors
• Benchmarking• Customer support• System dimensioning/design
7
About methodologiesTarget and approach
• Real production codes and operation conditions• Install tools @ customer production machine (local, PRACE, …)• Interactively: Gather data Analysis Report
Challenge• Integration of methodologies
• How to look at performance in a hierarchical/structured way• Tools to validate/reject hypotheses and help generate new ones
• Duration of studies?
8

9
BSC – tools framework
CUBE, gnuplot, vi…
.prv+
.pcf
.dim
Time Analysis, filters .cfg
Paramedir
.prv
Instruction level simulatorsTasksim, Sniper, gem5
XMLcontrol
ParaverLD_PREPLOAD, Valgrind,
Dyninst, PINPAPI
MRNETExtrae
DIMEMAS
VENUS (IBM-ZRL)
Machine description
Trace handling & displaySimulatorsAnalytics
Open Source (Linux and windows)
http://www.bsc.es/paraver
Performance analytics
prv2dim
.xls.txt
.cube
.plot
Instr. traces
10
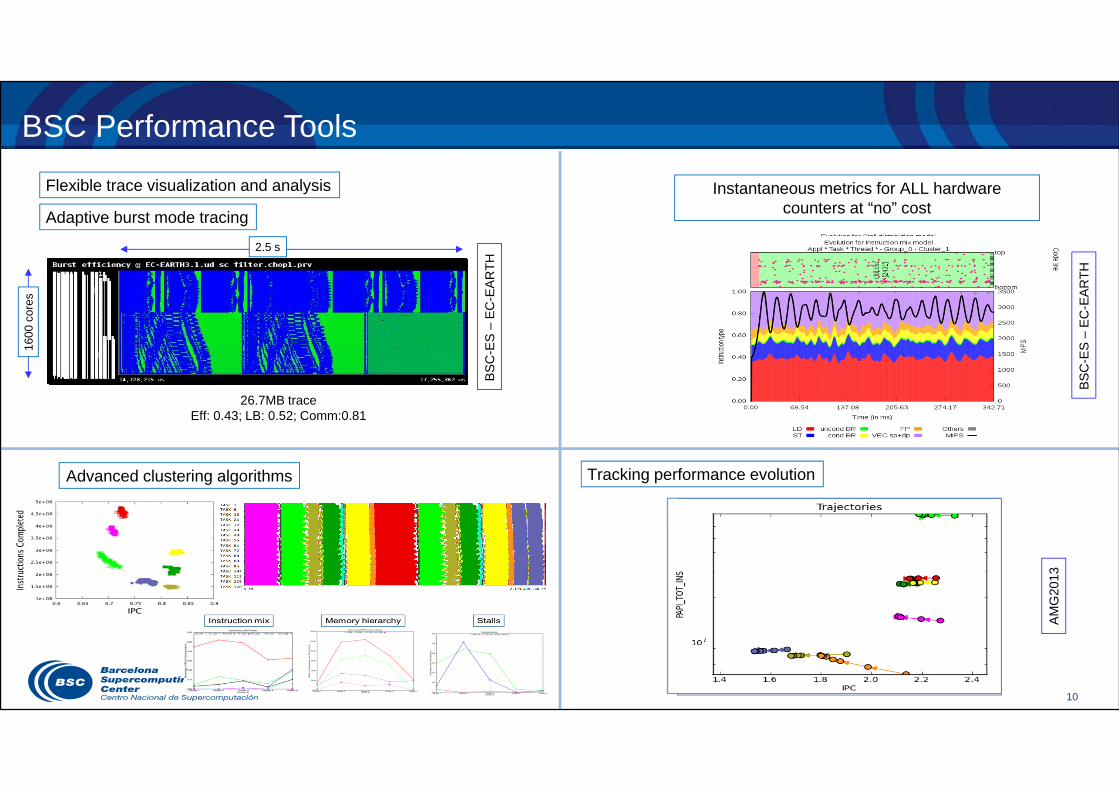
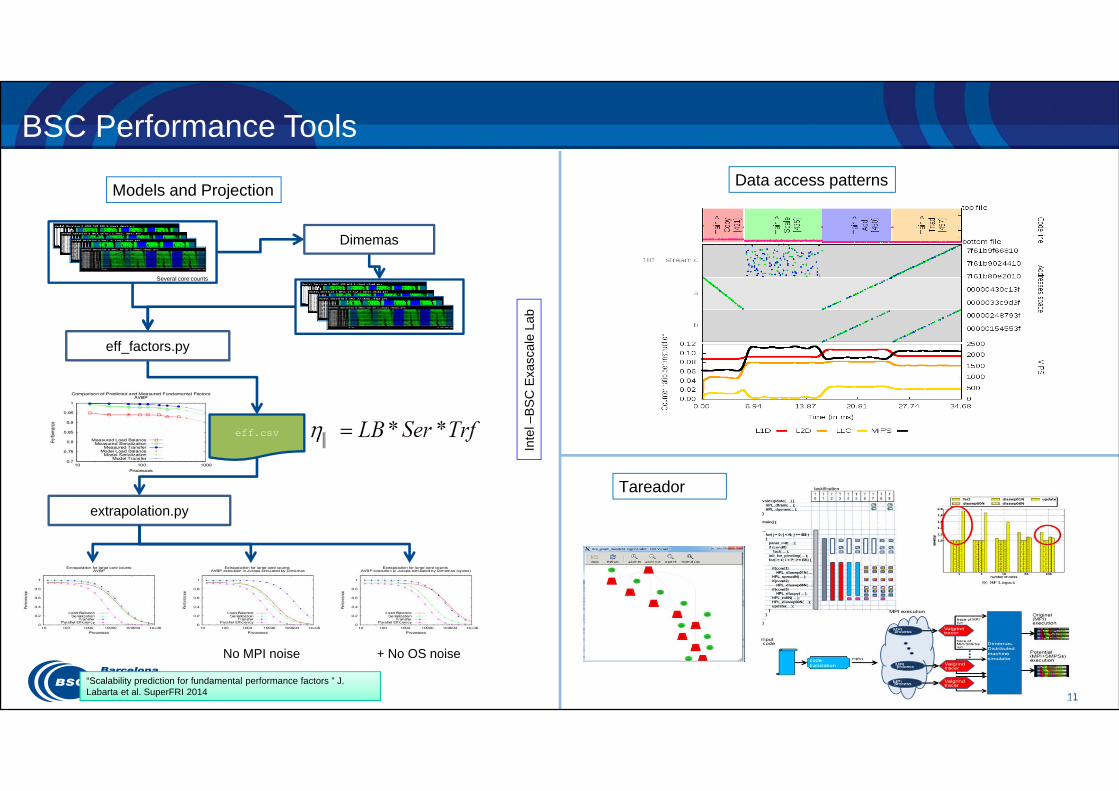
BSC Performance Tools
Instantaneous metrics for ALL hardware counters at “no” costAdaptive burst mode tracing
Tracking performance evolution
26.7MB traceEff: 0.43; LB: 0.52; Comm:0.81
1600
cor
es
2.5 s
BSC
-ES
–EC
-EAR
TH
BSC
-ES
–EC
-EA
RTH
AMG
2013
Flexible trace visualization and analysis
Advanced clustering algorithms
11
BSC Performance Tools
eff.csv
Several core counts
eff_factors.py
extrapolation.py
Dimemas
No MPI noise + No OS noise
“Scalability prediction for fundamental performance factors ” J. Labarta et al. SuperFRI 2014
Models and Projection Data access patterns
Tareador
Inte
l –B
SC
Exa
scal
eLa
b
12
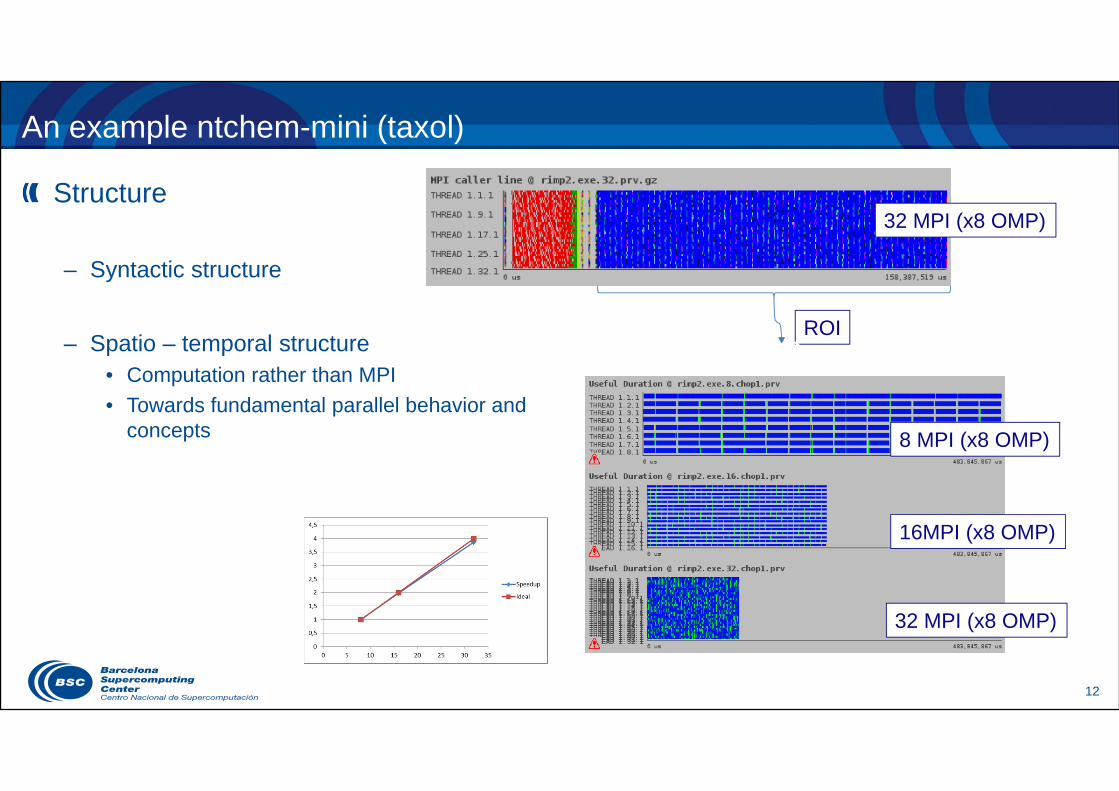
An example ntchem-mini (taxol)
Structure
– Syntactic structure
– Spatio – temporal structure• Computation rather than MPI• Towards fundamental parallel behavior and
concepts
32 MPI (x8 OMP)
32 MPI (x8 OMP)
8 MPI (x8 OMP)
16MPI (x8 OMP)
ROI

Efficiency factors and extrapolation
TrfSerLB **
Time imbalance … on first process !!!Same granularity (~7ms) for all core counts !! Computationally balanced!!
Some IPC imbalance
Some “frequency” imbalance

14
Addressing fundamental bottlenecks
Avoiding first process imbalance– Compiling without DEBUG define– Using Dimemas and cycle based trace conversion
Fair improvement in load balance …. but still !!!Transfer stays very important !!!Serialization effects appeared !!!
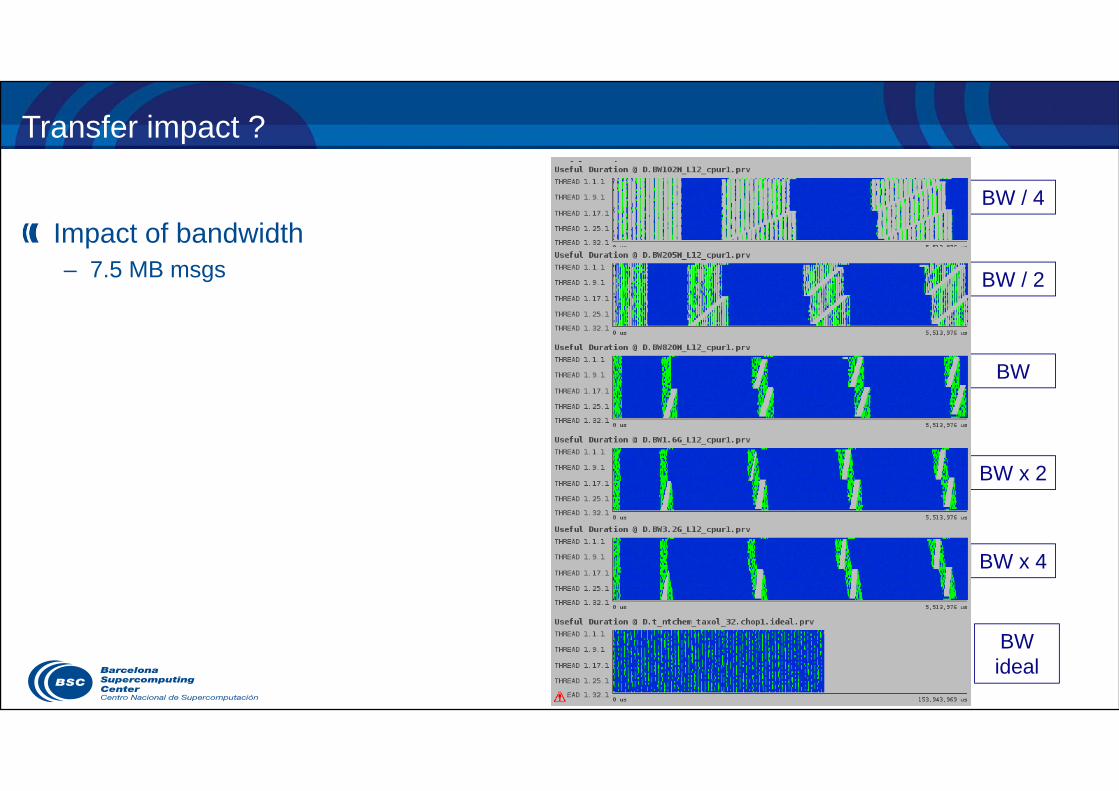
Transfer impact ?
Impact of bandwidth– 7.5 MB msgs
BW x 2
BW
BW x 4
BW / 2
BW / 4
BW ideal
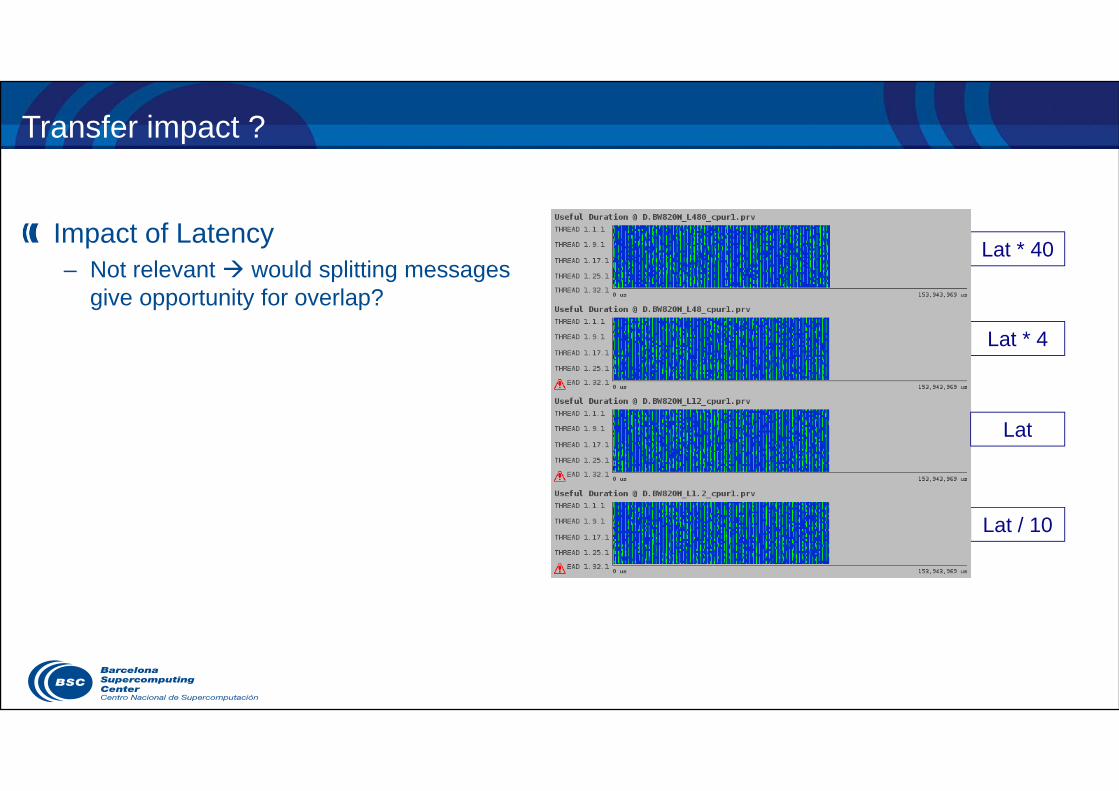
Transfer impact ?
Impact of Latency– Not relevant would splitting messages
give opportunity for overlap?
Lat / 10
Lat
Lat * 4
Lat * 40
17
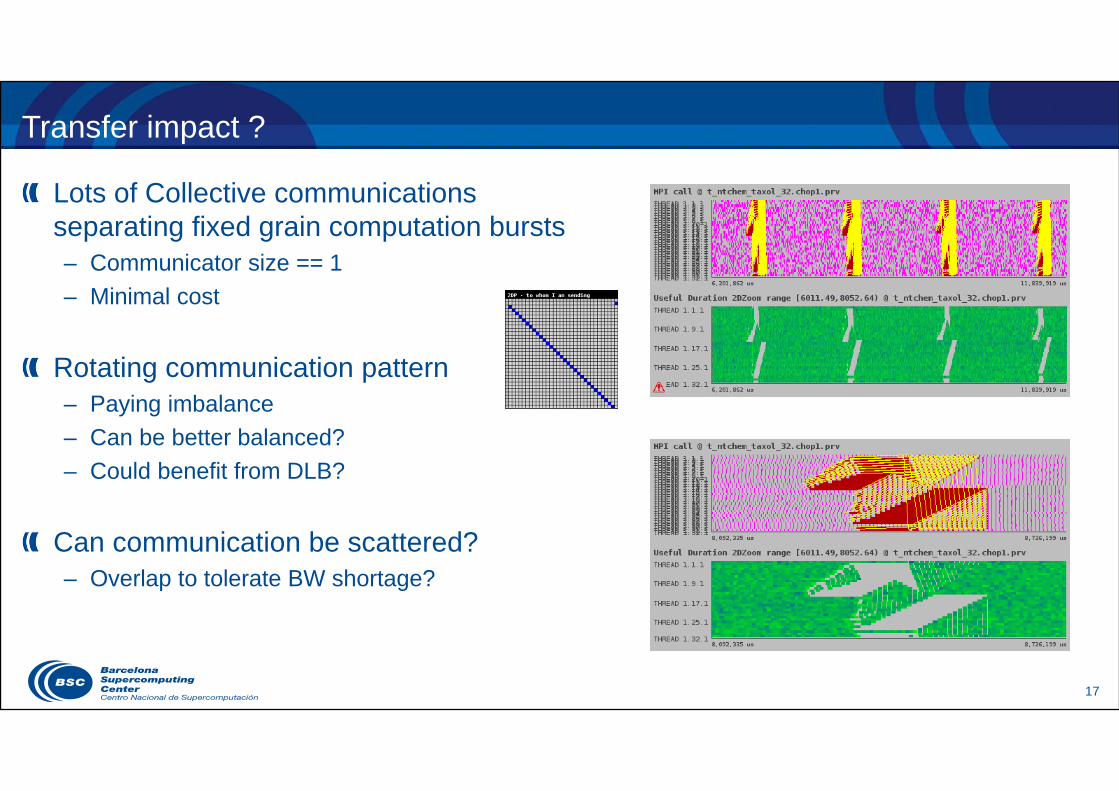
Transfer impact ?
Lots of Collective communications separating fixed grain computation bursts– Communicator size == 1– Minimal cost
Rotating communication pattern– Paying imbalance– Can be better balanced?– Could benefit from DLB?
Can communication be scattered?– Overlap to tolerate BW shortage?
18
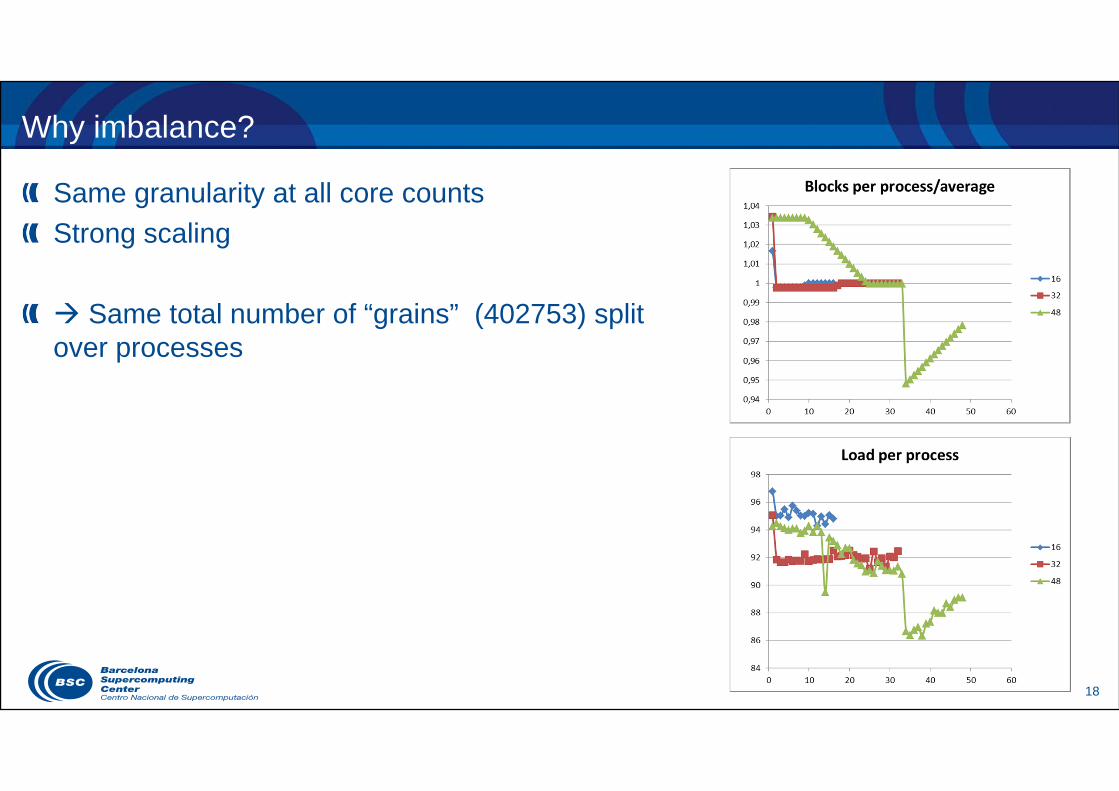
Why imbalance?
Same granularity at all core countsStrong scaling
Same total number of “grains” (402753) split over processes
19
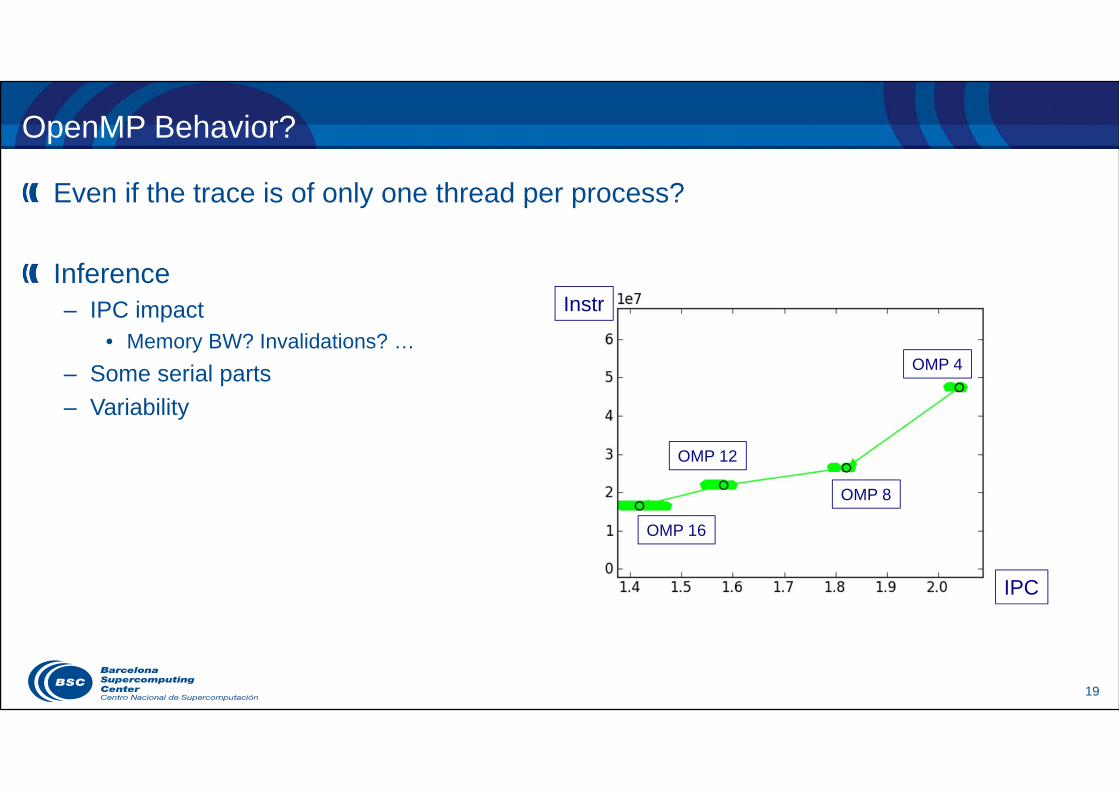
OpenMP Behavior?
Even if the trace is of only one thread per process?
Inference– IPC impact
• Memory BW? Invalidations? …– Some serial parts– Variability
IPC
Instr
OMP 4
OMP 8
OMP 12
OMP 16
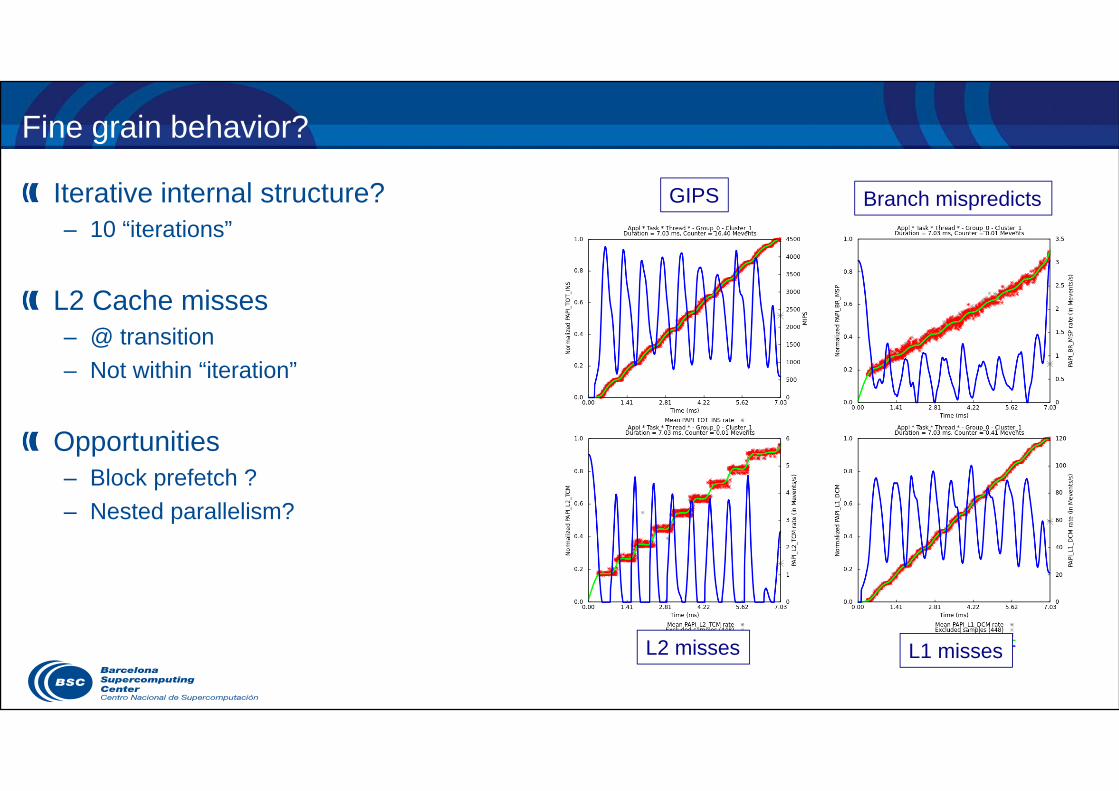
Fine grain behavior?
Iterative internal structure?– 10 “iterations”
L2 Cache misses – @ transition– Not within “iteration”
Opportunities– Block prefetch ?– Nested parallelism?
GIPS Branch mispredicts
L2 misses L1 misses
ConclusionPOP
• develop best practices• integrate analysis methodologies• Towards accelerating the analysis cycle• Increasing insight and guidance to application developer
Opportunities• Apply to other applications• And target machines• Integrate other tools
21