The Politics of Palin: Gender in the 2008 Presidential Election ...
193
The Politics of Palin: Gender in the 2008 Presidential Election A DISSERTATION SUBMITTED TO THE FACULTY OF THE GRADUATE SCHOOL OF THE UNIVERSITY OF MINNESOTA BY Melanie Faith Burns IN PARTIAL FULFILLMENT OF THE REQUIREMENTS FOR THE DEGREE OF DOCTOR OF PHILOSOPHY Lawrence R. Jacobs, Adviser October 2009
-
Upload
khangminh22 -
Category
Documents
-
view
3 -
download
0
Transcript of The Politics of Palin: Gender in the 2008 Presidential Election ...

The Politics of Palin: Gender in the 2008 Presidential Election
A DISSERTATION SUBMITTED TO THE FACULTY OF THE GRADUATE SCHOOL
OF THE UNIVERSITY OF MINNESOTA BY
Melanie Faith Burns
IN PARTIAL FULFILLMENT OF THE REQUIREMENTS FOR THE DEGREE OF
DOCTOR OF PHILOSOPHY
Lawrence R. Jacobs, Adviser
October 2009

© Melanie Faith Burns 2009

i
Acknowledgements
I would like to thank the Maze and her many inhabitants. Eric Ostermeier, who
read every page, probably more than once, and stuck beside me as I navigated the highs
and lows that come with a project of this magnitude. Applejacks, the handsomest and
regal-est kitten I have ever known, who is always there to hug or nap away my problems.
Zoot, who will always hold a special place in my heart, no matter how many times he bites,
scratches, or claws me. The Maze is my home, and you three are my family. I look forward
to many more years of singing, dancing, and laughing.
My parents, Gerald and Kathy Burns, provided support and encouragement over
many, many years. My dad’s never-ending arsenal of jokes has kept me laughing, while my
mom provided me with some of the best gifts I could ask for – my love of reading, my
desire for adventure, and my brown eyes. My sisters have made life much more fun.
Thank you Andi (for whipping me into shape – or at least trying to), Julz (for being a
fantastic travel partner), and Ziggy (for supporting my tv habit).
A special thank you to my soon to be in-laws, Arlene and Terry Ostermeier, whose
encouragement has meant so much to me. I can’t wait to officially be part of the family.
Thank you to my peeps: Angela Bos and Monica Schneider, who pulled me through
prelims and connected me to a world outside political science; Henriet Hendriks, the best
mentee a girl could hope for; Monica Lake, the most unconditionally supportive person
I’ve ever known; and Alina Oxendine, with whom I enjoyed the most wonderful ‘working
lunches,’ though we didn’t always get much work done.
Finally, thank you to my committee members, Adviser Larry Jacobs, Joanne Miller,
Kathryn Pearson, and Chris Federico. Your support and encouragement throughout this
process was absolutely vital to the project and for that I am eternally grateful.

ii
Dedication
This dissertation is dedicated to Erie,
my friend, my partner, my bocheecho.

iii
Abstract
Sarah Palin, the Republican nominee for Vice President in the 2008 election, was
only the second major party female nominee for the office of vice president in U.S. history
and the first for the Republican Party. While criticized extensively by the left and the
conservative intellectual elite, Palin’s conservative credentials were never questioned and
she was embraced by many grass-roots conservatives. Palin’s strong conservatism and
Republican partisan credentials stand in stark contrast to most female politicians, who
overwhelmingly and increasingly hail from the Democratic Party in both state and
national politics.
The central puzzle of this project is to determine how voters react to the
competing stereotypes that conservative female Republican candidates, like Sarah Palin,
must endure. The gender stereotype – that females are considered to be more empathetic,
caring, and compassionate – is in conflict with the partisan stereotype – that Republicans
are believed to possess more strength and leadership. Which stereotypes do voters apply,
and how does that differ based on their own gender or partisan identity? Specifically, how
do voters’ own gender and party identification shape ratings of a conservative female
candidate’s traits and ideology, as well as the impact of each on vote choice and candidate
evaluation?
Two public opinion surveys are utilized to answer these questions – a survey of
Minnesotans and a national survey of women. The Minnesota data revealed that a citizen’s
gender and party identification shape their perceptions of Sarah Palin’s traits, ideology,
and overall evaluations. While party identification is the strongest predictor, gender did
have some impact. Furthermore, the differences in how Palin is rated on her traits and
ideology had significant impacts on overall evaluations of her, as measured by presidential

iv
vote choice and evaluations of her performance in the vice presidential debate. Nationally,
women’s party identification shape their perceptions of Sarah Palin’s traits and policy
issue agreement. In addition, there is a strong relationship between party identification
and overall evaluations, but this relationship is overshadowed when trait ratings or policy
position agreement are included in the model. The strong, significant effects of party
identification on overall evaluations disappear on measures of Palin’s favorability
measure and opinions of McCain’s choice of Palin, but remain significant on vote for
McCain.
Both traits and policy position agreement have a significant impact on overall
evaluations of Palin. And while the effects of party remain directly significant on vote for
McCain in the presence of these variables, it appears they are indirectly significant for
evaluations of McCain’s choice of Palin as his vice presidential running mate on issue
positions, and, to a lesser extent, trait ratings. Different traits and policy issues have
significant impacts on McCain’s choice of Palin for Republicans and Democrats.

v
Table of Contents
List of Tables .......................................................................................................................................................... vi List of Figures ........................................................................................................................................................ ix Chapter 1: Introduction ..................................................................................................................................... 1 The Gender Gap ..................................................................................................................................... 4 Stereotypes ........................................................................................................................................... 10 Implications.......................................................................................................................................... 15 Going Forward .................................................................................................................................... 18 Chapter 2: Republican Women in a Partisan Era ................................................................................. 23 Female Representation in Elite Politics .................................................................................... 23 Partisan and Ideological Polarization........................................................................................ 25 Female Congresswomen in a Polarized Era ............................................................................ 29 Public Opinion towards Female Republicans ........................................................................ 34 The Gender Gap .................................................................................................................. 35 The Partisan Gap ................................................................................................................ 36 Partisan Gender Gaps ....................................................................................................... 37 Gender Partisan Gaps ....................................................................................................... 38 Female Candidates on the National Stage ............................................................................... 39 Conclusion ............................................................................................................................................ 46 Chapter 3: Minnesotans’ Opinions of Sarah Palin ................................................................................ 62 Trait Ratings and Ideology Assessment ................................................................................... 64 Introduction ......................................................................................................................... 64 Results .................................................................................................................................... 66 Candidate Evaluations ..................................................................................................................... 71 Introduction ......................................................................................................................... 71 Results .................................................................................................................................... 72 Discussion ............................................................................................................................................. 76 Conclusion ............................................................................................................................................ 79 Chapter 4: Opinions of Sarah Palin Among the Nation’s Women .................................................. 91 Trait Ratings and Ideology Assessment ................................................................................... 94 Introduction ......................................................................................................................... 94 Results .................................................................................................................................... 96 Candidate Evaluations ................................................................................................................... 100 Introduction ....................................................................................................................... 100 Results .................................................................................................................................. 101 Discussion ........................................................................................................................................... 110 Conclusion .......................................................................................................................................... 112 Chapter 5: Conclusion .................................................................................................................................... 132 Implications........................................................................................................................................ 134 Future Research ............................................................................................................................... 136

vi
List of Tables
Table 2-1. The Gender Gap in Support for Republican Women in the United States Senate,
2000-2008 ............................................................................................................................................. 55
Table 2-2. The Partisan Gap in Support for Republican Women in the United States Senate,
2000-2008 ............................................................................................................................................. 56
Table 2-3. The Republican Gender Gap in Support for Republican Women in the United
States Senate, 2000-2006 ................................................................................................................ 57
Table 2-4. The Democratic Gender Gap in Support for Republican Women in the United
States Senate, 2000-2006 ................................................................................................................ 58
Table 2-5. The Independent Gender Gap in Support for Republican Women in the United
States Senate, 2000-2006 ................................................................................................................ 59
Table 2-6. The Female Partisan Gap in Support for Republican Women in the United States
Senate, 2000-2006 ............................................................................................................................. 60
Table 2-7. The Male Partisan Gap in Support for Republican Women in the United States
Senate, 2000-2006 ............................................................................................................................. 61
Table 3-1. Minnesotans’ Assessments of Sarah Palin’s Ideology .................................................... 81
Table 3-2. Minnesotans’ Ratings of Sarah Palin’s Traits..................................................................... 82
Table 3-3. Effects of Gender and Party Identification on Minnesotans’ Trait Ratings and
Ideology Assessment of Sarah Palin............................................................................................ 84
Table 3-4. Effects of Watching the Vice Presidential Debate on Minnesotans’ Trait Ratings
and Ideology Assessment of Sarah Palin ................................................................................... 85
Table 3-5. Minnesotans’ Presidential Vote Choice by Gender and Party Identification ........ 86
Table 3-6. Minnesotans’ Evaluation of Sarah Palin’s Performance in the Vice Presidential
Debate by Gender and Party Identification .............................................................................. 87

vii
Table 3-7. Effects of Minnesotans’ Gender and Party Identification on Presidential Vote
Choice and Evaluations of Sarah Palin’s Performance in the Vice Presidential
Debate ...................................................................................................................................................... 88
Table 3-8. Effects of Minnesotans’ Ratings of Sarah Palin on Presidential Vote Choice and
Evaluations of her Performance in the Vice Presidential Debate ................................... 89
Table 4-1. Women’s Trait Ratings of Sarah Palin on Being Understanding and Personally
Identifiable ......................................................................................................................................... 114
Table 4-2. Women’s Trait Ratings of Sarah Palin on Preparedness ........................................... 115
Table 4-3. Women’s Agreement with Sarah Palin’s Policy Positions ......................................... 116
Table 4-4. Effects of Party Identification on Women’s Ratings of Sarah Palin’s Traits ...... 118
Table 4-5. Effects of Party Identification on Women’s Agreement with Sarah Palin’s Policy
Positions .............................................................................................................................................. 119
Table 4-6. Women’s Evaluations of Presidential Vote Choice, Favorability of Sarah Palin,
and John McCain’s Choice of Sarah Palin by Party Identification ................................ 120
Table 4-7. Effects of Party Identification on Women’s Evaluations of Presidential Vote
Choice, Favorability of Sarah Palin, and John McCain’s Choice of Sarah Palin ....... 121
Table 4-8. Effects of Ratings of Sarah Palin’s Traits on Women’s Evaluations of Presidential
Vote Choice, Favorability of Sarah Palin, and John McCain’s Choice of Sarah Palin
................................................................................................................................................................. 122
Table 4-9. Effects of Party Identification and Ratings of Sarah Palin’s Traits on Women’s
Evaluations of Presidential Vote Choice, Favorability of Sarah Palin, and John
McCain’s Choice of Sarah Palin ................................................................................................... 124
Table 4-10. Effects of Policy Position Agreement with Sarah Palin on Women’s Evaluations
of Presidential Vote Choice, Favorability of Sarah Palin, and John McCain’s Choice
of Sarah Palin ..................................................................................................................................... 126

viii
Table 4-11. Effects of Party Identification and Policy Position Agreement with Sarah Palin
on Women’s Evaluations of Presidential Vote Choice, Favorability of Sarah Palin,
and John McCain’s Choice of Sarah Palin ............................................................................... 128
Table 4-12. Women’s Reason for Rating of Sarah Palin and Opinions about Supporting
Female Candidates .......................................................................................................................... 130
Table 4-13. Effects of Saying Personal Qualities Were More Important in Favorability
Rating of Palin on Having a Favorable Opinion of Sarah Palin ..................................... 131

ix
List of Figures
Figure 2-1. Number of Women in the United States Senate by Party, 1918-2009 .................. 49
Figure 2-2. Number of Women in the United States House of Representatives by Party,
1918-2009 ............................................................................................................................................. 50
Figure 2-3. Conservative Ideology Rankings of Republican Women in the United States
House of Representatives, 1981-2008 ....................................................................................... 51
Figure 2-4. Liberal Ideology Rankings of Democratic Women in the United States House of
Representatives, 1981-2008 .......................................................................................................... 52
Figure 2-5. Conservative Ideology Rankings of Republican Women in the United States
Senate, 1981-2008 ............................................................................................................................. 53
Figure 2-6. Liberal Ideology Rankings of Democratic Women in the United States Senate,
1981-2008 ............................................................................................................................................. 54

1
Chapter One
Introduction
Sarah Palin, the Republican nominee for Vice President in the 2008 election, was
only the second major party female nominee for the office of vice president in U.S. history
and the first for the Republican Party. Few pundits predicted Governor Palin would be John
McCain’s choice of running mate – she was relatively unknown nationally, seemingly lacking
in experience, and from a politically noncompetitive and electorally inconsequential state
(Alaska). The public and the mass media alike were unsure what to make of McCain’s
selection and her vice presidential candidacy, though Palin quickly became fodder for the
entertainment and news industries. CBS News anchor Katie Couric and late night television
show Saturday Night Live both garnered significant buzz by interviewing and parodying
Palin, respectively.
While criticized extensively by the left and the conservative intellectual elite, Palin’s
conservative credentials were never questioned and she was embraced by many grass-
roots conservatives as a staunch defender of the 2nd amendment, the ‘right to life,’ and a
limited federal government. Palin’s strong conservatism and Republican partisan
credentials stand in stark contrast to most female politicians, who overwhelmingly and
increasingly hail from the Democratic Party in both state and national politics.
Female politicians make up a small percentage of representatives at the local, state,
and national levels, and gains in female representation have mostly occurred within the
Democratic Party. Because women in the electorate comprise a larger percentage of the
Democratic Party, it has a larger pool of female candidates from which to nominate and a
larger group of female voters to rely upon come Election Day. Currently, 77 percent of

2
women in Congress hail from the Democratic Party (72 of 93). As a result, much of what has
been studied about female representation has dealt with the advantages and challenges
faced by female Democratic representatives. Still, prominent conservative female politicians
like Sarah Palin have become more common over the past few decades, as increased levels
of partisan polarization at the elite and mass levels had led politicians of both parties to
become more and more extreme ideologically, and women representatives are no
exception. As a minority subgroup within the Republican Party, these women face a
different set of challenges than female Democratic representatives. There are three key
findings from the current literature on female representation that help to frame the
potential challenges and advantages held by conservative female politicians.
First, female candidates of both parties are perceived by voters as being more
liberal than their male colleagues (Alexander and Andersen 1993; Dolan 2004; Huddy and
Terkildsen 1993a; King and Matland 2003; McDermott 1997). Because their core support
group values liberalism, this is generally an advantage for female Democratic candidates.
However, it disadvantages female Republican candidates who are trying to gain the support
of a more conservative electorate (King and Matland 2003; Sanbonmatsu and Dolan 2009).
Secondly, women are rated as better able to handle ‘female issues’, such as education and
social welfare, thus giving them an advantage when these issues are salient in a given
election.
Thirdly, women are stereotypically characterized as being caring, empathetic, and
compassionate. While these characteristics do not hold negative connotations, they are not
particularly beneficial to female candidates as voters value masculine traits such as
leadership for their representatives (Huddy and Terkildsen 1993b; Lawless 2004;
Rosenwasser and Seale 1988). However, when evaluating female Republicans, voters are

3
presented with conflicting stereotypes. The gender stereotype – that females are considered
to be more empathetic, caring, and compassionate – is in conflict with the partisan
stereotype – that Republicans are believed to possess more strength and leadership (Hayes
2005). Less conservative female Republican candidates may be able to better tread the line
between these stereotypes, and benefit from both their gender and party in comparison to
more conservative female GOPers. Because they are not seen as displaying strong partisan
stereotypes, they are able to gain the support of women voters in the ideological center and
avoid the more obvious tension between gender and party that more conservative
Republican women face.
In this project, I seek to examine voter reactions to one prominent conservative
female Republican candidate, Sarah Palin, in order to determine how voters’ own gender
and party identification shape evaluations of a candidate’s traits and ideology, as well as to
evaluate Palin in the context of other GOP female candidates. In addition, I will test the
relative impact of candidate traits, ideology, and issue positions on vote choice and
candidate evaluation. Are traits more important in determining support, or is policy
agreement a better predictor of vote choice? And how does this relationship differ, if at all,
between gender and partisan groups? I will address these questions through an analysis of
two sets of public opinion data on Sarah Palin during the run up to the 2008 presidential
election. One is a survey of Minnesotans conducted in early October 2008, around the time
of the vice presidential debate. The other is a national survey of women conducted in mid-
September 2008 after Palin formally became the GOP’s nominee at the Republican National
Convention.
This chapter lays the groundwork for the subsequent analyses by discussing the
relationships between gender and politics. It will examine sources of the gender gap as well

4
as the importance of gender and partisan stereotypes in candidate evaluation and vote
choice. Finally, it will look at the historical importance of vice presidential candidates on
electoral outcomes and describe the analyses to be conducted in subsequent chapters.
I. The Gender Gap
The gender gap – the differences between men and women on issue positions,
partisanship, and voting behavior – is pervasive, existing outside of the context of specific
elections or issues (Box-Steffensmeier, De Boef, and Lin 2004). Although these three
dimensions are heavily related, research has shown policy preferences to be the most
significant source of the gender gap. Controlling for political attitudes largely erases gender
gaps in voting behavior and party identification (Kaufmann and Petrocik 1999). In addition,
the gender gap in support for a government that takes a more activist stance on social
policy issues is larger than the gap associated with ideology, and equal in magnitude to gaps
among partisan and voters of difference race groups (Schlesinger and Heldman 2001).
The gap in policy preferences is important in three respects. First, differences in
policy preferences may alter the salience of various political issues, thus prompting changes
in the political agenda and the direction of public policy (Conover 1988). Secondly, women
constitute a large voting bloc, and the emergence of even small gender differences in issue
preferences can have substantial consequences on public policy (Shapiro and Mahajan
1986). Thirdly, policy cleavages in the electorate are important to the outcome of elections.
Women voters are more likely to use gender-related issue positions in determining their
vote choice when there is a female candidate on the ballot (Dolan 1998).
The substantive political opinions of men and women are increasingly
disparate(Erskine 1971; Smith 1984). Women are more likely to be concerned with

5
‘women’s issues,’ that is, “public concerns that impinge primarily on the private (especially
domestic) sphere of social life, and particularly those values associated with children and
nurturance” (Sapiro 1981, 703). Gender cleavages on these issues only partially overlap
with other types of cleavages, suggesting that gender is a primary determinant of issue
position (Schumaker and Burns 1988).
Women are also more likely to be concerned with social welfare policy, specifically
services and issues that directly affect their rights and the rights of children – for example,
abortion, child care, education, parental leave, sexual harassment, and women’s rights
(Dolan 1998; Schlozman et al. 1995; Schumaker and Burns 1988). In fact, social welfare
issues may be the predominant contributors to the gender gap (Conover 1988; Kaufmann
2002; Kaufmann and Petrocik 1999). However, recent research has shown that women’s
votes are more heavily influenced by ideology than women’s issues, and the main source of
the gender gap is shaped by differences on the opinions on the role of government and
society (Kanthak and Norrander 2002).
These gender gap differences are partly a result of particular life circumstances that
men or women are more likely to experience, or the presence of distinctively masculine or
feminine responses to those circumstances – namely, women are more likely to bear a
disproportionate share of the child-rearing responsibilities and to be poor (Schlozman,
Burns, Verba, and Donahue 1995).
The gender divide over social welfare policy took root during the onset of the
struggle for welfare benefits from the government. As early as the latter part of the 19th
century, women became increasingly organized and active in promoting social welfare, with
a particular emphasis on women’s welfare issues. Women heavily influenced the
development of American social welfare policy (Sapiro 1986), and were prominent

6
proponents of the notion that the federal government should provide a safety net for its
citizens (Skocpol 1992). Women continue to be concerned with ensuring equal opportunity
for all and helping others, and believe government should take an activist role in social
welfare. Women are consistently more likely than men to think government should be
proactive in assisting the poor by guaranteeing jobs and a minimum standard of living
(Seltzer, Newman, and Leighton 1997). These values may be learned early in life. Due to a
sustained attachment to their mother, female children learn to emphasize fairness and
equality, and thus develop as more empathetic and responsive to the needs of others than
male children who are pushed quickly into the public sphere where morality is based on
rules, rationality, and self-interest (Chodorow 1974). This is reinforced for women as
culture continues to place strong expectations on them to remain noncompetitive, care
giving, and cooperative (Howell and Day 2000).
The gender gap in attitudes toward social welfare is borne out in political behavior.
Research on the activities and types of issues on which political activists are focused points
to significant differences in issue priorities among men and women activists, especially for
education and abortion policy – with women giving them a higher status (Schlozman, Burns,
Verba, and Donahue 1995). In addition, women act on behalf of neighborhoods and social
service policies more often than men (Schumaker and Burns 1988).
Women are also less militaristic than men and have demonstrated greater
opposition to war. Gender differences are most pronounced when women are asked about
specific military involvement, as opposed to hypothetical scenarios for the use of force
(Conover and Sapiro 1993). Shapiro and Mahajan's (1986) study of public opinion data
collected over a period of twenty years reveals sizable and persistent gender differences in
attitudes toward issues involving the use of force, in addition to smaller gender differences

7
toward other policies concerning regulation and public protection, social welfare, and
traditional values. These differences between the genders on military and social welfare
issues, and especially in how men and women use their attitudes on these issues in
presidential evaluations, were the most important contributors of the gender differences in
approval of President Reagan’s job performance (Gilens 1988).
The reasons for gender gaps vary from issue to issue, but four factors are primarily
responsible for the differences in opinion: women are more concerned with equality of
opportunity and hold egalitarian views, women place greater value on helping others,
women are more likely to hold occupations affected by redistributive government policies,
and the obtaining of a higher level of education has had a liberalizing effect on women
(Howell and Day 2000). However, Conover (1988) finds that gender differences exist in
basic value orientations, not in political values such as egalitarianism, individualism, racism,
or liberalism. Instead, the gap arises because women are more committed to religious
fundamentalism than are men and have more positive feelings toward the disadvantaged in
society. Furthermore, holding feminist values, and indeed, the process itself of becoming a
feminist may “be a catalyst that helps women recognize their underlying ‘female’ values”
(1005). However, further examination of the relationship between feminist attitudes and
policy preferences suggests that feminism does not promote uniquely feminine values.
Instead, a feminist perspective, consisting of egalitarian values and generally liberal
policies, is associated with distinctive values and policy preferences for both men and
women (Cook and Wilcox 1991).
Closely related to the gender gap on policy issues are gender gaps in ideology and
party identification. Since the 1970s, both men and women have moved in a conservative
direction. However, one segment of the female population – well-educated and single

8
women – has kept its liberal self-identifications (Norrander and Wilcox 2008). Similarly,
women have moved to the Democratic Party, while men have increasingly identified
themselves as Republicans. Beginning in the 1980s, women began giving their allegiance to
the Democratic Party to such an extent that they began to comprise the majority of
Democratic identifiers (Frankovic 1982). During the same time period, men have become
increasingly Republican in both their party identification and voting behavior (Kaufmann
and Petrocik 1999).
This partisan gender gap has grown for a number of reasons: the political climate
moved in a more conservative direction, the economy deteriorated, and the percentage of
economically vulnerable, single women increased (Box-Steffensmeier, De Boef, and Lin
2004). In addition, the culture war, along with the increased salience of cultural issues it
brought to the nation in the 1990s (e.g. reproductive rights, female equality, and legal
protections for homosexuals) played a role in the increasing partisan identity gap among
men and women. Woman began to give these issues significantly more weight in their
partisan identity, while men continued to base their partisan choice more centrally on social
welfare issues (Kaufmann 2002).
Both the gender gaps in policy preferences and partisanship have contributed to a
gender gap in voting. Coinciding with the increases in the number of women joining and the
number of men leaving the Democratic Party, the 1980 presidential election was the first
time a gender gap, defined as the difference between the percentage of women and the
percentage of men voting for a given candidate, was evident. This gender gap has persisted
in every election since that time, with women more likely to vote for the Democratic
candidate, according to exit polling data. The gender gap in voting was lowest in 1992, at
four percentage points, and reached a high of 11 percentage points in 1996. In the most

9
recent presidential election in 2008, women were seven percentage points more likely to
vote for the Democratic candidate, Barack Obama.
The gender gap is not only observed in the nation as a whole, but also persists
among different demographic subsets of the population. If fact, some scholars have argued
that the gender gap is better understood as being composed of smaller “cohort gender gaps”
(O'Regan, Stambough, and Thorson 2006). Gender gaps have been shown to exist among
different groups based on age, marital status, and religious affiliation (Bendyna and Lake
1994; Cook and Wilcox 1995; Edlund and Pande 2002; Greenberg 2001; Howell and Day
2000; Inglehart and Norris 2003; Mattei and Mattei 1998; Seltzer, Newman, and Leighton
1997). Gender gaps among different racial groups are less clear. Studying issue attitudes,
partisan identification, and voting behavior among African Americans, Welch and Sigelman
(1989) find few differences between men and women. A later study conducted by the
authors focusing on gender gaps among Hispanics, blacks, and Anglos found gender gaps
among all three racial groups, with the most prominent difference being that the gender gap
in political ideology was weaker among Hispanics and blacks than for Anglos (Welch and
Sigelman 1992).
The differences in issue positions that contribute to the gender gap in voting have
been shown to be larger than the differences in attitudes expected based on ideology
(Schlesinger and Heldman 2001). Women are more likely to support Democratic candidates
(Klein 1985; Wirls 1986). In addition, an increasing amount of economic independence and
autonomy from men have exacerbated the electoral gender gap. Married women with high
status occupations and advanced education along with unmarried women at all
socioeconomic levels differ the most from men in their voting behavior and presidential
approval ratings (Carroll 1988). Gender-based voting can also partly be attributed to gender

10
identity, which is driven by feelings of group solidarity. By running as representatives of
women, female candidates for public office invoke heightened feelings of gender identity
among female voters (Plutzer and Zipp 1996).
II. Stereotypes
Image is important to candidates running for any office, and especially so for the
presidential nominee hoping to win the vote of people who are likely to rely on mental
shortcuts and cues when choosing a candidate instead of a detailed examination of each
candidate’s policy platform. A candidate’s personality, appearance, and demeanor can
provide a valuable shorthand for voters as they make these calculations. Popkin (1991)
asserts that voters are able to make rational choices between candidates by using
information shortcuts they receive during campaigns. Specifically, campaigns increase the
importance of some issues, strengthen the connections between issues and the office, and
increase the perceived differences between candidates. Given the importance of campaigns
in voter preferences, candidates spend increasingly large sums of money and time
perfecting their campaign materials and cultivating the best outward appearance. This can
lead to generous praise and predictions of success, as with Barack Obama’s campaign signs
and logo (see, for example, DesignBay 2008) or lead to a public roasting if the designer
clothes purchased are too expensive (Cummings 2008).
Research has shown that candidates do indeed employ distinctive image priming
strategies. Druckman, Jacobs, and Ostermeier (2004) further research on issue priming to
show that candidates are also able to design strategies that appeal to voters based on the
candidate’s image. Political psychologists have identified four images, or traits, as most
appealing to the public. Competence, as indexed by ratings on qualities such as knowledge

11
and intelligence, along with integrity, as measured by ratings of candidate morality or
honesty, have been shown to be the most universally relevant to candidate evaluations. The
impact of leadership, assessed as strength or inspiring, and empathy, gauged as compassion
and caring, is less clear (Funk 1999, 702; Kinder 1986). These four attributes can be grouped
into two broad clusters: competence and leadership are performance-based, while integrity
and empathy are interpersonal (Druckman, Jacobs, and Ostermeier 2004; Iyengar and
Kinder 1987).
How are male and female candidates perceived in terms of personality traits?
Research has shown that citizens are more likely to identify men as strong, assertive, and
self-confident, while women are identified as more compassionate, warm, and kind (I. K.
Broverman et al. 1972; Deaux and Lewis 1984; McKee and Sherriffs 1957; Spence,
Helmreich, and Stapp 1974; Williams and Best 1982). In addition, female candidates are
more likely to be perceived as competent in maintaining honesty and integrity in
government, and dealing with issues that revolve around poverty, women, and children.
Conversely, men are more likely to garner higher ratings in dealing with military issues and
making decisions on agricultural issues (Lawless 2004; Sapiro 1981).
In an experimental study of a hypothetical presidential race between a male
candidate and a female candidate, Rosenwasser, et. al (1987) find evidence of gender
stereotyping. To define their list of masculine and feminine presidential tasks, the authors
instructed a group of college students to rate 23 different presidential duties on a five point
masculine-feminine scale. A different group of respondents then rated hypothetical male
and female candidates on each of the four most masculine items, the four most feminine
items, and the two most neutral items.

12
The authors find that the male candidate was evaluated as being more effective on
the masculine items of dealing with terrorism, dealing with a military crisis, ensuring an
adequate military defense system, and filling the president's role as Commander-in-Chief of
the Armed Forces. The female candidate, meanwhile, received higher ratings on four
feminine tasks – solving problems in the educational system, guaranteeing the rights of
racial minorities, solving problems of the disabled and handicapped, and solving problems
of the aged – as well as on two neutral items, conserving and wisely utilizing natural
resources and being able to relate to and lead the American public.
In addition, on both the feminine and masculine traits, the researchers found
significant interactions between candidate sex and scores on a scale of attitudes toward
women. Respondents with less favorable attitudes toward women rated the female
candidate significantly lower than the male candidate on the masculine items, while those
with more favorable attitudes toward women rated the female candidate higher than the
male candidate on the feminine items.
The differences in candidate trait stereotypes matter. Mueller (1986) finds that
voters were unwilling to support a female presidential or vice-presidential candidate
because she was seen as less competent to handle the military, war, and the economy.
Asking participants to rate whether or not a list of masculine and feminine qualities should
be possessed by a good politician, Huddy and Terkildsen (1993b) find that while feminine
qualities were not a liability for candidates, typical male qualities “are considered crucial for
higher office” (1993b, 518). This type of gender stereotyping continues in the post-
September 11th era. Lawless (2004) shows that citizens prefer masculine traits and
characteristics in their elected officials. Through the use of a differential measure of trait
possession (hypothetical male candidate vs. hypothetical female candidate), Lawless shows

13
that citizens believe that men are more likely than women to possess these masculine
qualities.
One masculine trait that is valued in elected officials is leadership, and people’s
beliefs about what makes a good leader are more similar to their stereotypical views of men
than women (Schein 2001). Because of this, and the perceived incongruity between
women’s stereotypic qualities (e.g. affectionate, helpful, and kind) and typical leadership
qualities (e.g. assertive and instrumentally competent), both women’s potential for
leadership and actual leadership behavior are rated unfavorably (Eagly and Karau 2002).
The stereotypes regarding gender and leadership potential or ability come about because of
inferences people make linking observed behavior of men and women in their social roles
to the personal qualities associated with those behaviors (Eagly 1987).
In addition to gender stereotypes, voters use partisan stereotypes to infer
candidates’ issue positions and traits (Hamill, Lodge, and Blake 1985; Hayes 2005; Rahn
1993). Research has shown that these partisan stereotypes fall along gendered lines.
Through an examination of National Election Studies data from the 1980-2004 presidential
elections, Hayes (2005) shows that voters perceive GOP candidates as stronger leaders than
Democratic candidates, a trait commonly thought of as masculine. At the same time,
Democratic candidates are viewed as having more compassion and empathy, which are
typically identified as feminine traits. These findings are particularly important for this
study, because they present competing expectations for public opinion towards Sarah Palin
– her gender evokes feminine stereotypes, while her party identification would trigger
contrasting masculine stereotypes.
Voters are faced with multiple cues when evaluating a candidate. Two of these are
the social stereotypes based on the candidate’s gender and party. In their parallel-

14
constraint-satisfaction model, Kunda and Thagard (1996) assert that social stereotypes and
information such as traits or behavior work together to jointly influence impressions of
individuals. When applied to the relationship between voters and candidates, Huddy and
Capelos (2002) find limited evidence in support of this model. They do find that voters are
able to apply two stereotypes simultaneously, though their results show that partisanship
plays a more significant role than gender in shaping evaluations. As such, “voters regard a
Republican woman politician as a Republican first and a woman second” (47). In addition,
among Republican candidates, there is no evidence that gender stereotypes come into play
(King and Matland 2003).
However, there are certain instances in which gender stereotypes can have a more
powerful role in candidate evaluations. Sanbonmatsu and Dolan (2009) find that perceived
issue competency and issue positions differ by gender for both Democrats and Republicans,
to the detriment of Republican candidates. Similar to other studies, the authors find that
nearly a third of their sample perceive female candidates as having an advantage on a
traditional female issue, education, and male candidates as having an advantage on a typical
masculine strength, crime. Evaluations of female candidates by their same party members
of the electorate show that Democrats are more likely to hold attitudes that benefit women
candidates. On education, Democratic female candidates are more likely than Republican
female candidates to be perceived favorably by members of their party. Furthermore,
Democratic women in the electorate are less likely than Republicans to see an advantage for
male candidates on the issue of crime.

15
III. Implications
Sarah Palin is a useful test case to study perceptions and evaluations of her traits not
only for being an example of a conservative female politician, but also because of her role as
a the first female Republican Party vice presidential nominee. McCain’s choice of Sarah Palin
to be his running mate was seen by some analysts as a return to his maverick image
designed to shake up the presidential race and draw attention not simply to his campaign
but away from Barack Obama’s. The strategy seemed to work, at least in the short term.
McCain’s numbers shot up in horserace polling immediately after the announcement and
were sustained through Palin’s rousing speech at the Republican National Convention.
Ultimately, the strategy was not successful enough to win the presidency, and may have
done more harm than good, as McCain lost the general election in November by nearly two
hundred electoral votes.
A presidential nominees’ selection of his running mate is frequently seen as the
nominee’s first act as president. The choice of a running mate can impact the presidential
election, and is potentially important for succession. The American people pay close
attention to the selection and evaluate the vice presidential nominee “with their
constitutional role as a presidential successor uppermost in mind…[i]llnesses, impeachment
proceedings, and assassination attempts have made succession an active possibility”
(Goldstein 1982, 207-8). The potential ability of a vice president to lead the country is viewed
as even more important at this stage in U.S. history, as the world becomes a more and more
dangerous place. “[E]ver since the importance of having an able and faithful vice president
available to assume the presidency became unmistakably clear with the birth of the nuclear
age, the public has demanded that governance criteria be served in vice presidential
selection, lest electoral consequences be paid” (Nelson 1988).

16
For a presidential candidate, many considerations come into play when selecting a
running mate. One of the most important considerations is the potential strategic advantage
a vice presidential nominee can have in the general election. Anecdotal evidence points to
the usefulness of the vice president as traditionally ending after Election Day. For example,
an aide to Vice President Hubert Humphrey proclaimed, "Once the election is over, the Vice
President's usefulness is over. He's like the second stage of a rocket. He's damn important
going into orbit, but he's always thrown off to burn up in the atmosphere" (Light 1984, 11).
Indeed, research shows that the choice of vice presidential running mate is “far more likely
to be based on short-term electoral calculations than on long-term governance
considerations” (Sigelman and Wahlbeck 1997, 855).
How can a vice president be most useful in a general election? A candidate can serve
one of two purposes – solidifying the base or reaching out to independents and more
moderate voters. With either strategy, balancing the party’s ticket has been shown to be an
important consideration for presidential candidates (Goldstein 1982; Natoli 1985; Nelson
1988). The home state, ideology, age, and insider vs. outsider status of the candidate are all
areas in which balance can be achieved. However, the perceived importance of balancing
the ticket has lessened over time as a result of two occurrences. First, the guidelines issued
by the McGovern-Fraser Commission both resulted in candidate-centered campaigns that
gave more power to the president in selecting his running mate and gave presidential
candidates more time to do so. Second, George McGovern’s hasty and un-researched
selection of Senator Thomas Eagleton (who was later discovered to have undergone
electroshock therapy and replaced in the campaign) as his running mate on the 1972
Democratic ticket led future presidential candidates to implement a more intricate vetting
process for their potential running mates (Hiller and Kriner 2008).

17
Research on the strategic effectiveness of vice presidential selections is mixed. Some
research findings at the individual level of analysis suggest that the selection is an
important one. Employing American National Election Studies data, Wattenberg (1984)
estimated that voter evaluation of the vice presidential candidates contributed about 0.75
percent toward the national presidential vote margin from 1952 to 1980, generated about
one-half the influence as presidential candidate evaluations and party identification, and is
approximately one-and-a-half times as impactful as ideological influences on vote choice.
More recently, Wattenberg (1995) examined the 1968 to 1992 presidential elections, and
although his findings are less dramatic, his empirical results suggest that the typical voter is
substantially influenced by his or her evaluation of vice presidential nominees: voters with
split presidential and vice presidential preferences (about 11 percent in a typical election
year) are more likely to defect from their preferred presidential candidate than those with
consistent evaluations (15.6 percent vs. 2.9 percent).
In opposition to these studies, Romero (2001) utilizes the 1972-76 National Election
Studies panel study to show that voters’ rationalization of their intended vote exaggerates
the influence vice presidential nominees are estimated to have on the presidential vote.
After controlling for these rationalization affects, he finds that vice presidential candidate
evaluations do not maintain a statistically and substantively meaningful influence on the
vote for president. Furthermore, aggregate-level analyses find that vice presidential
candidates have little to no influence, bringing the national ticket no home state or regional
advantage. Examining presidential contests from 1884 to 1984, Dudley and Rapoport
(1989) find that on average, the vice-presidential candidate gains only about 0.3 percent
more than expected in his home state. In addition, vice presidential candidates on average
neither increase their ticket’s share of the two-party vote nor the presidential candidate’s

18
ability to carry the vice president’s home state. Similarly, Holbrook (1991) employs a state-
level model of presidential election outcomes for elections between 1960 and 1984, and
finds that while presidential candidates enjoy both a home state and home region
advantage, vice presidents do not receive either.
IV. Going Forward
This project will examine voter reactions to Sarah Palin, a conservative female
Republican, to determine how voters evaluate her given the conflict between stereotypes
based on her gender and her party identification. Do voters see Palin as holding the
feminine traits of caring and honesty, or do they view her as a stereotypical Republican
candidate with leadership skills and preparedness for office? Furthermore, how do voters’
own gender and party identification shape evaluations of Palin’s traits and ideology, as well
as overall evaluations of her candidacy? In addition, what is the relative impact of trait
ratings, ideology assessment, and policy position agreement on vote choice and candidate
evaluation? Are traits more important in determining support, or is policy agreement a
better predictor of vote choice? And how does this relationship differ, if at all, between men
and women and Democrats and Republicans?
Palin does not stand alone as a conservative female politician. Increasing levels of
partisan polarization have given rise to the number of conservative women serving in
Congress and in the electorate. Chapter Two will document the rise in polarization and its
effect on the partisan composition of state and national political offices. An analysis of
National Journal vote rankings will illustrate the trend in ideological polarization over the
past three decades, and voter support for female Republican Senators as measured in public
opinion surveys will be analyzed to demonstrate how the gender gap varies for the least

19
conservative and most conservative Senators. Finally, a thorough investigation of public
opinion towards Palin will provide a backdrop for examinations of gender and partisan gaps
in support on trait ratings, ideology assessment, and overall evaluations.
Chapter Three will examine data from an early October survey of Minnesota
residents to determine to what extent gender and partisan identify influence ratings of Palin
on three traits (honesty, caring, and experience)1 and her political ideology.2 This chapter is
divided into two sections. The first will utilize descriptive statistics and regression analysis
to examine the public’s assessments of Sarah Palin’s ideology as well as ratings of Palin on
three traits – honesty, caring, and experience.
• Research Question #1. What is the relationship between gender and party in the
public’s ratings of Sarah Palin on her traits and assessment of her ideology? Within
partisan groups, is there a gender gap in ratings of Sarah Palin’s traits and ideology? If
so, on which traits and evaluations are gender gaps more pronounced?
• Research Question #2. Does a voter’s gender and party identification have a significant
effect on their ratings of Palin’s traits and ideology, controlling for factors such as
demographics and socioeconomic indicators? Is the effect of gender on Palin’s traits
and ideology moderated by party?
• Research Question #3. Does increased information about a candidate have a
significant relationship with voters’ ratings of a candidate’s traits and ideology?
Specifically, do those who watched the vice-presidential debate rate Sarah Palin
differently than those who did not watch the debate? Are these relationships
moderated by party or gender?
The second section in Chapter Three will focus on overall evaluations of Palin as
measured by presidential vote choice and appraisals of her performance in the vice
1 Question wording: Next, I am going to read you a list of statements. Tell me whether you think each statement applies more to Joe Biden or Sarah Palin: a) Is honest? b) Has the right experience to be president? c) Cares about people like me? 2 Question wording: Do you think Sarah Palin's political views are too conservative, about right, or too liberal?

20
presidential debate.3 In addition, the impact of trait ratings and ideology assessment on
these overall evaluations will be examined.
• Research Question #4. Within partisan groups, is there a gender gap in vote for
McCain and evaluations of Sarah Palin’s performance in the debate?
• Research Question #5.What is the effect of gender and party on vote for McCain and
evaluations of Sarah Palin’s performance in the debate, controlling for other factors?
Is the effect of gender moderated by party?
• Research Question #6. To what extent do trait ratings and ideology assessment have a
significant effect on overall evaluations of Palin? Is the relationship between trait
ratings, ideology assessment, and overall evaluations moderated by gender or party?
Chapter Four will sharpen the analyses put forth in Chapter Three, by focusing on
the relationship between party, traits, and candidate evaluations among a national sample
of women. An examination of ratings of Palin’s traits will be conducted on the dimensions of
women viewing her as being understanding, personally identifiable, prepared to take over
the Presidency, and prepared to be commander-in-chief.4 In addition, the chapter will
examine differences in policy position agreement to determine if there is a gender gap
within each party, both in agreement as well as in how much salience these agreements
have for overall evaluations of Palin.5 The specific policy issues examined are creationism
3 Question wording: If the 2008 presidential election were being held today, would you vote for ... Democrat Barack Obama or Republican John McCain? (If don’t know or refused): As of today, who do you lean more towards?; Does Palin's performance in the debate make you more or less likely to vote for McCain, or didn't it make a difference? 4 Question wording: How well does Sarah Palin understand the everyday concerns and needs of people like yourself – a great deal, some, not much, or not at all?; How much do you personally identify with the everyday life experiences and values of Sarah Palin – a great deal, some, not much, or not at all?; Regardless of who you’re voting for, which Vice Presidential candidate, Joe Biden, the Democrat, or Sarah Palin, the Republican, would be best prepared to take over the Presidency if that were necessary?; And which Vice Presidential candidate, Joe Biden, the Democrat, or Sarah Palin, the Republican, would be best prepared to be commander-in-chief? 5 Question Wording: If the Presidential election were held today and the candidates were Barack
Obama and Joe Biden, the Democrats, and John McCain and Sarah Palin, the Republicans, and you had to choose, for whom would you vote?; Based on what you’ve seen or heard, do you have a favorable

21
and evolution, abortion, the right to bear arms, drilling for oil and gas, global warming, and
the war in Iraq.6
• Research Question #7. What are the opinions of the nation’s women in regards to
Sarah Palin’s traits and policy positions? How do these opinions vary by party identification?
• Research Question #8. Does a woman’s party identification have a significant effect on
her ratings of Palin’s traits and agreement with Palin’s policy positions, controlling for
other demographic and socioeconomic factors?
• Research Question #9. Is there a partisan gap among women in overall evaluations of
Palin – vote for McCain, approval of Sarah Palin, and opinion of McCain’s choice of
Palin?
• Research Question #10.What is the effect of party on vote for McCain, approval of
Sarah Palin, and opinion of McCain’s choice of Palin, controlling for demographic and
socioeconomic factors?
• Research Question #11. To what extent do trait ratings have a significant effect on
overall evaluations of Palin? Are the relationships between trait ratings and overall
evaluations moderated by party?
• Research Question #12. To what extent does policy issue agreement have a significant
effect on overall evaluations of Palin? Are the relationships between policy issue
agreement and overall evaluations moderated by party?
• Research Question #13. Is policy issue agreement more important in overall candidate
ratings than candidate traits or gender? Does this differ among Democrats and
Republicans?
or unfavorable opinion of Sarah Palin?; Did John McCain’s choice of Sarah Palin as his running mate make you less likely to vote for McCain, more likely, or didn’t it make much difference to you? 6 Please tell me whether you personally agree or disagree with Sarah Palin’s positions on the following issues. Do you agree or disagree with her position? Palin supports teaching of both creationism and evolution in public schools; She opposes abortion in all cases, including rape and incest, except when the life of the mother is in danger; Palin supports the right to bear arms, including handguns; She favors more drilling for oil and gas, including in the Arctic wildlife refuge; She does not believe that global warming is caused by humans; Palin supports the war in Iraq

22
Chapter Five will summarize the findings from the previous chapters, and explore
the implications of the analyses for existing gender research. In addition, it will outline the
areas where conservative Republican female candidates hold advantages and are
challenged.

23
Chapter Two
Republican Women in a Partisan Era
Sarah Palin’s 2008 vice-presidential run occurred at a time in American history
when women are playing a greater role in elite-level politics, and when there is an elevated
level of political polarization between the Democratic and Republican parties among both
the party elite and the mass public.
This chapter will document the current political climate for elected female
officeholders and trace the historical increase in female political representation that has
taken place across state and national government. These trends will be situated against the
backdrop of the increasingly polarized political climate in which females officeholders are
participating. National Journal vote ratings will then be used to examine the rising partisan
polarization of one group of female elected officials – women serving in Congress over the
last three decades. Public opinion as measured through Election Day exit polling data will be
used to assess support for female Republican Senators from different gender and partisan
groups. Finally, an overview of public attitudes toward Republican Vice Presidential
nominee Sarah Palin and Democratic Presidential nominee hopeful Hillary Rodham Clinton
will be presented.
I. Female Representation in Elite Politics
While historically women have not achieved levels of representation in state and
national political offices equal to their percentage in the population, women today are
increasingly involved in all levels of government, including holding elected office at elite
positions in Congress, state legislatures, and governorships.

24
At the state level, six of the 50 states are currently led by female executives (Jan
Brewer of Arizona, Jodi Rell of Connecticut, Linda Lingle of Hawaii, Jennifer Granholm of
Michigan, Bev Perdue of North Carolina, and Christine Gregoire of Washington), and during
the 2009 legislative session, there were 1,793 women legislators serving in the 50 states,
holding a total of 24.3 percent of state legislative seats – an all-time high (National
Conference of State Legislatures 2009).
In the United States Congress, there are currently 17 female Senators and 73 female
Representatives – also record highs. Nearly three decades ago in the 101st Congress (1989-
1990), there were just 2 female Senators and 29 female Representatives. This marks an
increase of 190 percent in the total number of female legislators at the national level (from
31 to 90). The election of 1992, known as the Year of the Woman (Dolan 1998), brought with
it a surge in female legislators, and the number has been increasing steadily since that time.
While there are currently more women holding elite elected office today, these
women are not coming from the two major political parties in equal numbers, and the GOP’s
share of female representatives in decreasing. While half of the female governors are
Republicans, Democrats make up the majority of other female officeholders at the state and
national level. In state legislatures, 70 percent of female officeholders in 2009 came from
the Democratic Party (1,259 of the 1,793), with 29 percent (520) from the Republican Party,
and the remaining 1 percent (14) belonging to a third party or having no official partisan
affiliation (National Conference of State Legislatures 2009).
In the United States Congress, 76 percent of female Senators and 77 percent of
female Representatives are Democrats. In the 101st Congress, there was an equal number of
Republican and Democrat female Senators (1 of each), but Democrats have outnumbered
Republicans in every year since (see Figure 2-1). In the U.S. House, Democrats have held the

25
advantage among female Representatives since the mid-1950s beginning with the 84th
Congress, with the exception of the 88th Congress in which each party had six female
Representatives (see Figure 2-2). The dominance of Democratic women representatives at
the state and national levels means that as a conservative Republican woman, Palin is an
anomaly among female politicians.
II. Partisan and Ideological Polarization
The political climate in which these women are serving as elected officials has
become increasingly polarized. The two parties are growing more homogenous in their
policy positions, and the differences between their stands on major policy issues are
expanding (Aldrich 1995; Coleman 1997; Fleisher and John R. Bond 2004; Roberts and S. S.
Smith 2003; Stonecash, Brewer, and Mariani 2003). In fact, data shows the two political
parties in the U.S. Congress are as ideologically divergent as they have been at any point
during the last three decades (Theriault 2003).
These trends suggest a puzzle, as formal theory literature suggests that converging
on a center point in the ideological spectrum is the optimal electoral strategy in a two-party
system (Davis, Hinich, and Ordeshook 1970; Hinich and Munger 1994). Downs (1957)
predicted that political parties would race toward this ideological center in hopes of
capturing the “median voter”. While candidates may begin their campaigns with relatively
extreme ideologies, possibly in order to navigate their way successfully through a tough
primary, they will moderate their positions in the general election in order to appeal to the
median voter.
However, empirical data show that the two major parties are not currently ascribing
to this strategy. Party voting in the U.S. Congress decreased during the late 1960s and
1970s, and the parties became more ideologically closer to one another than they would be

26
at any point thereafter. Since that time, the Democratic Party has become noticeably more
liberal while the Republican Party has become much more conservative. Party-line voting
increased dramatically from the early 1980s through the mid-1990s, reaching a high of 73
percent in 1995. After a steady rise from 1970 through 1995, the percentage of party votes
dropped, reaching only 47 percent in 1999 and 43 percent in 2000 (Stonecash, Brewer, and
Mariani 2003, 6)7. There is also evidence of growing party polarization on congressional
committees (Aldrich and Rohde 2000; Sinclair 2000) and in members’ support for
presidential initiatives (Edwards and Barrett 2000; Fleisher and Jon R. Bond 2000; Sinclair
2000).
The increase in party polarization in Congress has had important consequences for
both lawmaking and the public’s perception and ratings of the institution. More
ideologically extreme members have begun to fill pivotal legislative roles as political
moderates have become scarcer. As a result, the vast middle of the electorate has become
under-represented in its political institutions (Poole and Rosenthal 1984). Additionally,
congressional polarization fuels the negative view that most Americans have of Congress.
Polarization and partisanship have been blamed for a decrease in congressional comity
(Jamieson and Falk 2000; Uslaner 1993) as well as an increase in legislative
gamepersonship (Aldrich and Rohde 2000; Sinclair 2000, 2000). These two factors are often
mentioned by the public as reasons why they disapprove of Congress (Hibbing and Theiss-
Morse 1995, 2002).
7 Scholars have shown the same basic pattern across different measures of polarizations - Poole-Rosenthal DW-NOMINATE scores (Alexander and Andersen 1993; Dolan 2004; Huddy and Terkildsen 1993a; King and Matland 2003; McDermott 1997), party unity scores (Coleman 1997; Rohde 1991; Stonecash, Brewer, and Mariani 2003), Americans for Democratic Action (ADA) scores (Stonecash, Brewer, and Mariani 2003), American Conservative Union (ACU) scores (2000), and a mixture of ADA and ACU scores (Fleisher and Bond 2000).

27
Member conversion and member replacement are two mechanisms through which a
shift in party polarization may occur. Member conversion happens when elected officials
become more partisan later in their career. Members tend to be more ideologically
moderate in order to get elected (Downs 1957), as well as early in their career when they are
most politically vulnerable (Jacobson 2009). However, officeholders face increased party
pressure to tow the party line as they move into a protectionist stage of their careers after
having developed a level of trust with their constituency that allows them more freedom in
their voting behavior (Fenno 1977). Empirical research has found that only 10 percent of
congressmen become more ideologically extreme by voting differently (Fleisher and Bond
2004). However, when looking specifically at the definitive polarizing phases for each of the
parties (the 98th to 100th Congresses for Democrats and the 102nd to 104th Congresses for
Republicans), member conversion was shown to account for between 50 and 82 percent of
the polarization of the parties (Roberts and Smith 2003).
Member replacement can happen suddenly (e.g. 1974 liberal Democrats, 1994
conservative Republicans, and 2002 conservative Republicans), or more gradually as
slightly more partisan candidates replace less partisan members (Clausen 1973; Kingdon
1989). Member replacement is responsible for more than half of the Senate polarization and
more than two-thirds of the House polarization, and is facilitated in one of three ways:
incumbent defeat, cross-party replacement, or same party replacement (Theriault 2003).
Two primary explanations have been given for why Congress has become so
polarized. The first focuses on changes in congressional decision-making over the last three
decades. The increasing restrictiveness of congressional rules has made it difficult for
moderate members to demonstrate moderate ideologies (S. S. Smith 1989), and majority
leaders have an even greater ability than in the past to control the agenda, committee

28
assignments, and other key resources (Sinclair 1995). In addition, both the types of issues
being debated in Congress (Theriault 2003) and the party leadership itself (Collie and Mason
2000; C. L. Evans and Oleszek 1997; Roberts and S. S. Smith 2003; Rohde 1991) are more
ideologically extreme than ever before.
The second explanation is electorally-based. Members’ voting behaviors have
changed as the districts they are representing have changed. Social changes such as
increasing rates of Hispanic immigration, residential segregation among racial and class
lines, and increasing mobility have contributed to a homogenization of districts (Gimpel
1999; Gimpel and Schuknecht 2001; Oppenheimer 2005; Stonecash, Brewer, and Mariani
2003). As a result, Democrats are more likely to represent urban, lower-income, heavily
non-white districts, while Republicans are more likely to be voted into office by districts
that are suburban or rural with more affluent, white populations (Stonecash, Brewer, and
Mariani 2003). This homogenization of districts, which has been jolted every ten years by
redistricting (Carson et al. 2007; Jacobson 2009), has emboldened party leaders to pursue
explicitly ideological strategies (Rohde 1991).
Ideological differences are not only increasing among the party elite. Indeed, there
has also been a significant increase in the ideological differences between those who vote
Republican and those who vote Democrat in congressional elections (Abramowitz and
Saunders 1998; Jacobson 2009; Pomper and Weiner 2002; Weisberg 2002). Moreover,
levels of polarization at the mass and elite levels tend to feed off of one another. The
increase in polarization among the elites has been driven in part by the ideological
polarization that is seen at the mass level (Jacobson 2000). In turn, the increase in
polarization at the mass level is influenced by the increased polarization of the elites
(Carmines and Stimson 1989; Nie, Verba, and Petrocik 1976; Zaller 1992). This is facilitated

29
by the political parties, which can send cues down from elites, to party activists, and finally
to the masses (Bartels 2000; Carsey and Layman 1999).
However, not all individuals in the electorate receive and accept cues from political
parties or elites. Those who have strong party affiliations, those who are aware of elite-level
polarization, and those who are politically sophisticated are more likely to respond to
partisan cues than those who pay little attention to elite-level politics or have weak ties to a
political party (Box-Steffensmeier and De Boef 2001; Layman and Carsey 2002; Sniderman,
Brody, and Tetlock 1991). Even for those citizens with high levels of political awareness,
political cues are most likely to be taken from those elites who share their political
predispositions (Zaller 1992).
In 2008, the increased ideological polarization at the elite and mass level thus
created a conundrum for the ‘moderate maverick’ John McCain. In light of the success
achieved by George W. Bush chief strategist Karl Rove to rally the conservative base in the
2000 and 2004 presidential elections, as well as John McCain’s own rocky history and
moderate ideological reputation within the Republican Party, the selection of the more
ideologically extreme Governor Palin to mobilize the GOP base for McCain in late August
2008 made strategic sense for his presidential campaign.
III. Female Congresswomen in a Polarized Era
Studies of women’s voting patterns and legislative behavior have shown female
legislators tend to display greater liberalism than their male counterparts, are more
supportive of issues of concern to women, children, and families, and play an active role in
fostering measures to further women's interests at both the local and state levels (Carroll
2001; Dodson and Carroll 1991; Epstein, Niemi, and Powell 2005; Norton 1999; Reingold

30
2000; Thomas 1994) as well as in the US House (Burrell 1994; J. J. Evans 2005). A
Representative’s gender has been found to have a significant effect on voting for women’s
issues in the House, and influences both the nature of the bills placed on the national agenda
and the choices made about those bills (Dodson 1998, 2006; Swers 1998, 2002).
Republican women in Congress have historically played an important role in
contributing to collective gender differences that have been found to exist on women’s
issues. In order to vote for women’s issues, Republican women must frequently defect from
their party’s more conservative platform and leadership positions (Swers 1998). In addition,
for specific issues such as the arts, gender differences are primarily a result of the greater
support of Republican women than their male counterparts (Boles and Scheurer 2007).
However, during the past 15 years since the 1994 elections, a new group of more
conservative female Republicans have been elected to the U.S. House, largely from the
Southern and Western areas of the United States. These women are less supportive of
traditional female issues, and their views on issues such as abortion, taxes, and national
security are more in step with the Republican party line (Dodson 2006; J. J. Evans 2005;
Gertzog 2004; Klatch 1987; Swers 2002). In fact, female Republican Representatives
remained slightly less conservative than male Republicans until the 108th Congress, when
Republican women in Congress were for the first time no longer ideologically
distinguishable from their male colleagues (Frederick 2009).
In his study of roll-call voting behavior of women in the U.S House of
Representatives from 1981 to 2006, Frederick (2009) finds that in the 108th and 109th
Congresses, female Republicans were not ideologically distinguishable from their male
colleagues. In addition, Republican and Democratic female Representatives in 2006 were
more divided among partisan ideological lines than at any time during the past 25 years.

31
Frederick also finds that in the 97th Congress the difference between the two party’s female
Representative DW-Nominate scores was approximately .55 points. In the 109th Congress,
this difference had catapulted to .94 points, with female Democrats having a mean score of -
.46 points, and female Republicans scoring a mean of .47.
The yearly ideological rankings on key votes compiled by National Journal is
another measure by which to study the voting behavior among female Representatives and
Senators. These rankings, which have been conducted since 1981, examine key votes in
three areas (economic issues, social issues, and foreign policy) to rank lawmakers relative
to one another on a conservative-to-liberal scale (National Journal 2008). In order to analyze
these rankings over time, I created a data set containing the economic, social, foreign policy,
and composite rankings for each female member of the U.S. House of Representatives and
U.S. Senate. I then charted the over-time averages for each branch of Congress using
conservative rankings for Republican Congresswomen and liberal rankings for Democratic
Congresswomen to confirm previously seen upward trends in party polarization in
Congress.
Indeed, the analysis shows increasing ideological polarization for both Republican
and Democratic female Representatives, with female Senators of both parties equally or less
polarized than in the early 1980s. The average conservative composite ranking of
Republican female Representatives has increased gradually from 54.9 in 1981 to 74.9 in
2008, with an average ranking of 65.3 for the time period. This 36 percent increase means
that female Republicans have, on average, moved from being in the ideological center of the
House to being more conservative than 74.9 percent of the other members of Congress (see
Figure 2-3).

32
This rise in conservatism generally was also mirrored in the conservative ratings of
female Republicans across all three areas of policymaking. Female Republicans began the
1980s as more conservative on economic issues than social and foreign policy issues, with a
ranking of 65.5. This ranking oscillated from year to year throughout the 1980s, finally
stabilizing in the mid-1990s, and increasing steadily since that time. The rankings on
foreign policy saw the largest increase in conservative voting by female Republicans. In
1981, the average female Republican in the House was more conservative on foreign policy
votes than just 45.1 percent of all members of the House. This ranking increased steadily,
with the exception of a brief drop after the 1998 elections, ending at a conservative ranking
of 75.0 in 2008. Conservative rankings on social issues saw an increase of 20 points (from
51.1 in 1981 to 71.5 in 2008), with an average of 59.2 for the time period studied. Half of the
jump occurred during the last six years, following the 2002 elections.
Similarly, the average liberal composite ranking of female Representatives in the
Democratic Party has increased from 72.4 in 1981 to 79.8 in 2008, reaching a low of 67.5
following the elections of 1986 and a high of 84.3 following the elections of 2002 (see Figure
2-4). The rise in overall liberalism is largely a result of more liberal attitudes in votes on
foreign policy. In fact, the liberal rankings of female Representatives on economic issues is
slightly lower today (75.3) than in 1981 (76.2), and the rankings on social issues have only
marginally increased (73.1 in 1981 to 75.0 in 2008). The averages for the time period (75.3
and 75.9 respectively) are nearly equal with the rankings in 1981 and 2008, indicating that
the liberal rankings on economic and social issues have been stable over time. On foreign
policy, the average Democratic female Representative was 64.3 percent more liberal than
the rest of the House in 1981. By 2008, this had increased 18%, so that the average female
Democrat Representative was more liberal than 76.1 percent of the House.

33
The patterns of increasing polarization, however, do not hold in the Senate. Since
these rankings are dealing with averages, there is more room for fluctuations from year-to-
year due to the smaller N for both the number of female Senators (2 in 1981 to 16 in 2008)
and the number of other seats with which those females are being compared (100 versus
435 for the House). The first Democratic female Senator to be ranked by National Journal,
Barbara Mikulski of Maryland, was elected in 1986, and was first ranked in 1987. Her
cumulative liberalism ranking was 84.2 in that year. In 2008, National Journal ranked 11
female Democratic Senators, with an average liberal rating of 74.2 (see Figure 2-5). There
have been across the board decreases in liberalism across the three areas of policymaking
that comprise the cumulative rankings, with each aggregate policy component averaging
approximately 76 percent for the entire time period. Member cumulative liberalism
rankings decreased from 74.0 to 72.5 on economic issues, from 74.0 to 71.5 on social issues,
and from 81.0 to 66.5 on foreign policy.
In both 1981 and 2008, female Republican Senators had a conservatism ranking of
59.8, with an average ranking of 62.7 over this time period (see Figure 2-6). Rankings on
economic issues were also almost equal in 1981 and 2009, increasing only 0.2 points from
57.0 to 57.2, though there was quite a bit of movement during the intervening years. At the
end of the 1980s and again in the early 1990s, the average conservative ranking of female
Republican Senators on economic issues reached upwards of 70.0 and 80.0, driving the
average ranking for the time period to 63.5. During this time period, female Republican
Senators became more conservative on foreign policy issues, but less conservative on social
issues. The average conservative ranking on foreign policy increased 33 percent from 44.0
in 1981 to 58.4 in 2008, though spikes in the early and late 1990s to 70.0 resulted in an
average conservative ranking of 61.4 for the time period. Alternatively, the conservative

34
ranking on social issues decreased from 73.0 in 1981 to 58.8 in 2008. The ranking in 1981
was an aberration for the period, falling to 45.0 in the following year, and matched in only
one other year, 1994. The average ranking was 58.0.
IV. Public Opinion towards Female Republicans
Since the elections of 1994, there have been 11 elections in which a female
Republican candidate was elected to the U.S. Senate. In 1994, Kay Bailey Hutchison (TX) was
elected to her first full term in the Senate. Hutchison had first been elected to the Senate via
a special election in 1993, and was reelected to her second and third terms in 2000 and
2006 with overwhelming majorities of the vote. After serving eight terms in the U.S. House
of Representatives, Olympia Snowe (ME) was elected to her first term in the Senate in 1994
with 60 percent of the general election vote. She was reelected in 2000 with 69 percent of
the vote and again in 2006 with 74 percent of the vote. In 1996, Susan Collins (ME) became
the 15th woman to be elected to the Senate in her own right. She was re-elected in 2002 with
59 percent of the general election vote and again in 2008 with 61 percent of the vote. After
serving more than two decades in the White House and making an unsuccessful bid for the
presidency in 2000, Elizabeth Dole (NC) successfully ran for Senate in 2002. She was elected
with 54 percent of the vote. In 2008, Dole lost her reelection race to Democratic challenger
Kay Hagan by eight points, receiving only 44 percent of the votes. Lisa Murkowski (AK), a
former three-term state congresswoman, was appointed to the Senate in December 2002 by
her father, Governor Frank Murkowski. She was elected to a full six-year term in 2004 with
49 percent of the vote.
These 12 elections, including Elizabeth Dole’s unsuccessful 2008 contest, will serve
as the data points for a brief examination of public opinion attitudes towards female

35
Republican Senators. In order to examine public opinion, I gathered exit polling data for
each U.S. Senate contest. For the elections prior to 2008, the full data sets of exit polling
were obtained, and thus the results are examined along gender and party lines
simultaneously. The data for the elections of 2008 are only available in the form of
crosstabs, and will be examined in terms of gender or party, but not both.
In this section I seek to identify trends among support by gender and partisan
groups for female Republican Senators. Due to the small sample size, as well as the fact that
these Senatorial elections are occurring across different states, years, and candidates, I
average support for the least conservative and most conservative Senators and focus on the
average differences among gender and partisan groups. Thus, in each of the tables
presented, the candidates are listed in order of their National Journal conservatism
rankings. Of the 12 cases included in this analysis, Senator Olympia Snowe in 2006 received
the lowest conservativism rating, with a score of 44.5, while Senator Kay Bailey Hutchison
received the highest rating in 1994, with a score of 85.7. The average rating for the six least
conservative Senators was 47.9, while the average rating for the six most conservative
Senators was 70.4. The average across the 12 cases was 59.1.
A. The Gender Gap
The exit polling data shows that, on average, women were slightly more likely to
vote for less conservative Senators than for more conservative Senators (see Table 2-1). The
six least conservative female Republican Senators were the candidate of choice for an
average of 61.7 percent of the women who voted in the respective elections, while the six
most conservative Senators received an average of 55.5 percent of the vote among the
female electorate. The gap in support for both groups by male voters (2.9 points) was

36
smaller than that of female voters (6.2 points) – averaging 63.2 percent support for the least
conservative Senators and 60.3 percent support for the most conservative. Overall, women
were slightly less likely to support female candidates than were men (3.1 percentage
points), and this gap was not significant.
On average, women were 1.5 percentage points less likely than men to vote for the
least conservative candidates, and 4.8 percentage points less likely to vote for the most
conservative candidates. However, the gender gaps in vote for female Republican Senators
were largely statistically insignificant.8 There was a significant gap between male and
female support in only three of the 12 races – Susan Collins in 2008 (one of the less
conservative candidates), and Elizabeth Dole in 2008 and Lisa Murkowski in 2004 (both
more conservative candidates). In all three of these cases, women were less likely to
support the female Republican candidate than men.
B. The Partisan Gap
Not surprisingly, Republicans were more likely to vote for female Republican
Senators across the board than were Democrats (see Table 2-2). In fact, Republicans
supported the least conservative and most conservative candidates in equal numbers (91.5
percent and 91.2 percent respectively). Democrats were less likely to support these
candidates, though on average over one-third (35.2 percent) supported the least
conservative Senators, while only 16.3 percent supported the most conservative Senators.
The gaps in support by Republicans and Democrats were highly significant in every race.
8 Levels of significance throughout this section are obtained using the difference in proportions method.

37
C. Partisan Gender Gaps
The data thus far have shown that women are more likely to vote for less
conservative female Republican candidates than more conservative candidates, and less
likely to vote for both of these groups when compared to male voters. However, the effects
of party identification are strong, with Republicans overwhelmingly supporting these
female Republican candidates. What does support look like when controlling for party
identification? That is to say, do gender gaps remain among Democratic voters and
Republican voters?
Among Republican voters, women are slightly more likely to support less
conservative candidates than more conservatives ones (see Table 2-3). While 93 percent of
Republican women supported the less conservative candidates on average, 91.4 percent
supported the more conservative candidates. Meanwhile, men are just slightly more likely
to support more conservative candidates (91.6 to 90.8 percent). The gender gap among
Republicans is larger for less conservative candidates. Women are more likely than men to
vote for less conservative candidates (2.2 percent), but less likely to vote for more
conservative candidates (-.02 percent). However, the gender gap is only significant in three
of the 10 races – Susan Collins in 2002, and Kay Bailey Hutchison in 2000 and 2006.
Both male and female Democrats were more likely to support the less conservative
candidates than the more conservative candidates (see Table 2-4). Women were 18.9
percentage points more supportive of less conservative candidates (38.4 to 19.5 percent),
while men were 15.5 percentage points more supportive of less conservative candidates
(32.0 to 16.5 percentage points). The gender gap among Democratic voters was larger for
less conservative candidates (6.4 percent) than for more conservative candidates (3.0
percent). However, none of the gender gaps are statistically significant.

38
Majorities of Independent voters were supportive of female Republican candidates,
with both men and women supporting less conservative and more conservative candidates
in approximately the same percentages (around 65 and 57 percent respectively; see Table
2-5). The gender gap was slightly larger for the most conservative candidates, with men 1.3
percentage points more supportive of the most conservative female Republican candidates
and 0.2 percentage points more supportive of the least conservative candidates. The gender
gap among Independent voters was significant in only two of the 10 races – Olympia Snowe
in 1994 and Kay Bailey Hutchison in 2000.
D. Gender Partisan Gaps
Does party identification have a greater effect on female support or male support for
female Republican Senators? The gap in support among male Republicans and male
Democrats was 4.2 percentage points larger on average than the gap among female
Republicans and Democrats (see Tables 2-6 and 2-7). Republican women in the electorate
were an average of 63.2 percentage points more likely to vote for female Republican
Senators than Democratic women, while Republican men were 67 percentage points more
likely to vote for female Republican Senators than Democratic men. These gaps are driven
more by the lack of support by both male and female Democrats for the most conservative
female Republican candidates. For the most conservative candidates, only 19.5 percent of
female Democrats and 16.5 percent of male Democrats gave their support to the most
conservative female Republican Senators on average, while both male and female
Republicans were 91.6 and 91.4 percent in approval for this group.

39
V. Female Candidates on the National Stage
Despite the number of female politicians in elite positions, no woman has ever been
nominated by one of the two major parties for President of the United States. Hillary Clinton
came close to achieving that distinction in 2008. After eight years as the country’s First
Lady, and eight years as a Democratic Senator from New York, Hilary Clinton made a run for
the White House in 2008. Through most of 2007, Clinton was the frontrunner in public
opinion horserace polling. However, towards the end of that year, the race tightened
considerably as the mood of the country became more favorable toward Barack Obama’s
message of change than to Clinton’s platform of experience (Tumulty 2008). In the first
contest of 2008, the Iowa caucuses, Clinton placed third behind Obama and John Edwards.
Although Clinton won several important contests (the New Hampshire primary, the largest
states on Super Tuesday), Obama won more states and more pledged delegates. By the June
3rd primaries, Obama had enough delegates to become the presumptive nominee, and
Clinton ended her campaign shortly thereafter.
If Clinton had emerged as the Democratic presidential nominee, national exit polling
data on Election Day indicates that she would likely have been the victor. A majority of
voters (52 percent) said they would have voted for Clinton over John McCain if she had been
the Democratic nominee. Some of Clinton’s supporters were dismayed by the political
process and the treatment of Clinton by the media and the Obama campaign. After Michigan
and Florida – both of which were won by Clinton – were stripped of their convention
delegates as punishment for holding their primaries earlier than the Democratic rules
allowed, Clinton’s supporters turned out in mass numbers to protest at the party's rules
committee meeting. In addition, some Clinton backers turned their support to Palin and
McCain. In October, a reception held specifically for former Clinton supporters raised more

40
than $500,000 for the McCain campaign (Luo 2008), and national exit polling conducted on
Election Day 2008 indicates that 15 percent of voters who would have voted for Clinton had
she been the Democratic nominee, chose to vote for McCain instead of Obama in the
presidential election (CNN 2008).
Because of her years in the White House (as First Lady) and Senate, Clinton was well
known to the electorate in the 2008 campaign. However, McCain’s choice for the GOP’s vice
presidential nominee was quite unknown. Born in 1964, Sarah Heath moved to Alaska with
her family at age three months. She spent her formative years in Wasilla, a small town about
40 miles north of Anchorage, and was a former co-captain of her high school state
championship basketball team and runner up for Miss Alaska. After earning her degree in
journalism at the University of Idaho in 1987, she became a sports reporter in Anchorage. In
1988, Sarah married Todd Palin, and they went on to have five children: Track, Bristol,
Willow, Piper, and Trig.
Palin began her political career in 1992 by winning a seat on the Wasilla City
Council. Four years later, she defeated a three-term incumbent to become mayor of Wasilla.
She ran her first statewide campaign in 2002, but fell 2,000 votes short of the Republican
nomination for lieutenant governor. A year later, she was appointed to chair Alaska’s Oil
and Gas Conservation Commission by Governor Frank Murkowski, but resigned in 2004 in
protest over what she perceived to be a lack of ethics among her fellow Republican leaders.
In 2006, Palin defeated Murkowski in the Republican primary race for Governor and
became both the first woman and youngest ever governor of Alaska by winning the general
election against former Democratic Governor Tony Knowles, 49 to 41 percent.
On August 29, 2008, Republican presidential nominee John McCain introduced Palin
as his running mate at a campaign rally in Dayton, Ohio. Palin was formally nominated on

41
September 4 at the Republican National Convention, becoming only the second woman to
run for vice president on a major party ticket and the first Republican female to do so.
Addressing the party's convention in St. Paul, Minnesota, on September 3rd, Palin depicted
herself as an average ‘hockey mom,’ memorably joking that the only difference between a
hockey mom and a pit bull is lipstick.
As a conservative Protestant, Palin is pro-life, pro-marriage, pro-gun, and supports
oil drilling both offshore and in the Arctic National Wildlife Refuge. She opposes gay
marriage, embryonic stem cell research, and all abortions unless the mother's life is in
danger. Palin supports the teaching of creationism alongside evolution in public schools,
and is a long time member of the National Rifle Association. Palin is a supporter of drilling,
and as Governor she enthusiastically pursued a pipeline to deliver natural gas from the
North Slope of Alaska to oil companies. In addition, she passed a major tax increase on state
oil production, giving most of that money back to Alaskans.
After the McCain campaign lost the 2008 presidential election, Palin returned to her
home state of Alaska to finish her term as governor. On July 3, 2009, just two and half years
into her term, Palin announced her resignation. She is currently a fixture in both tabloid and
mainstream news outlets. Palin’s outspoken views on health insurance reform and other
political matters, as well as her visibility since resigning, have fuelled speculation that she is
planning a run for the White House in 2012.
Between the time of her announcement as vice presidential nominee on August 29th
to Election Day, Palin was the subject of a multitude of public opinion polling questions as
the media scrambled to learn more about this unknown quantity and the American public’s
reaction to her. Roper’s iPOLL databank of online survey questions catalogued 330
questions relating to Palin conducted between August 29, 2008 and November 3, 2008, or

42
roughly five questions per day. The remainder of this section will analyze the responses to
these questions, which range from attitudes toward Palin’s traits, positions, and
performance in the vice presidential debate to her effect on vote choice for McCain and the
news media’s treatment of her.9
The desire to elect the first female vice president in history was not enough to give
John McCain a boost in support to carry him to victory. In an early September poll
conducted by Princeton Survey Research Associates International for Newsweek, only 18
percent of registered voters said electing the first woman vice president would make them
more likely to vote for McCain, while 77 percent responded it did not make them more
likely to do so.10 As to the specific effect of McCain’s choice of Palin as the GOP vice
presidential nominee on vote choice, an average of 43 percent of respondents said it made
no difference across 24 polls. Equal numbers of respondents said it made them more likely
and less likely to vote for McCain (27 percent each).
Before her vice presidential nomination acceptance speech at the Republican
National Convention on September 1, 2008, most people were not aware enough of Palin to
give her favorable or unfavorable marks. In her speech, Palin portrayed herself as a
reformer as well as an “average hockey mom”. She defended her perceived lack of political
experience by focusing on her time as Mayor and Governor, and criticized Democratic
Presidential nominee Barack Obama at length. Palin’s speech was well received among the
electorate. In public opinion polling conducted a few days after the convention, 42 percent
9 In this section, if the public opinion data is based upon findings from one survey, the source and question wording is included as a footnote. In all other cases, the percentages reported are averages from multiple surveys. 10 Princeton Survey Research Associates International/Newsweek Poll, September 10-11, 2008. Question wording: If elected (in 2008), Sarah Palin would be the first woman vice president. Does this make you more likely to vote for John McCain and the Republican ticket this fall, or not?

43
of respondents rated the speech as excellent,11 and 48 percent of registered voters said they
had watched the speech and it had made them think better of Palin.12 After the speech,
Palin’s favorability rating jumped to 50 percent and reached levels as high as 58 percent
over the next few days. Over the subsequent two month period before the election, across
52 polls, there were many peaks and valleys in Palin’s favorability ratings, but the overall
pattern was one of gradual decline. Just before the election, Palin’s rating had settled into
the mid 40s. Palin’s thermometer ratings tell a similar story. Starting with a mean rating of
52 on September 3rd, Palin’s rating at dropped to 45 by October 7th, across four polls.
Palin’s policy positions and traits could have been factors in her favorability ratings.
Overall, an average of 45 percent of respondents agreed with Palin on the issues that
mattered most to them, and 54 percent felt she shared their own positions on current
issues. In particular, a majority of respondents personally agreed with Palin’s positions on
teaching both creationism and evolution in public schools, the right to bear arms, and the
need to drill for oil and gas to alleviate the nation’s energy problems. On the other hand, a
majority of Americans disagreed with her policy positions on abortion, global warming, and
the war in Iraq.
Palin fared much better on interpersonal traits than on her experience and
qualification ratings. Respondents found her to be personally likeable (70 percent), down-
to-earth (70 percent), not arrogant (65 percent), and caring (51 percent). Furthermore,
Palin was seen as sharing the concerns and values of the people – respondents believed she
understood the everyday concerns of people (57 percent) and felt they could relate to her 11 Gallup / USA Today Poll, September 5-7, 2008. Question wording: (Turning to the recent (2008) Republican convention...) From what you have heard or read, how would you rate vice presidential nominee Sarah Palin's acceptance speech at the Republican Convention on Wednesday night (September 3, 2008), as--excellent, good, just okay, poor, or terrible? 12 CBS News Poll, September 5-7, 2008, Registered Voters. Question wording: Did you watch or listen to any of Sarah Palin's acceptance speech at the (2008) Republican National Convention? (If Yes, ask:) Did what you see of Palin's speech make you think better of her or worse of her?

44
(58 percent). However, Palin was not viewed as experienced (39 percent), well-informed
(40 percent), qualified (43 percent), prepared (44 percent), or having the leadership
qualities a President should have (44 percent). Despite these ratings, 56 percent would have
still felt at least somewhat comfortable with Palin as vice president.
One opportunity the public had to get to know Palin better was during the vice
presidential debate with Democratic Vice Presidential nominee Joe Biden. Leading up to the
debate, expectations for Palin’s performance were not high. Across four polls, only 38
percent of respondents thought she would do a better job than Biden. Palin was expected to
be more likeable (65 percent), but less informed on the issues (28 percent). While Palin did
score high marks in some areas, she did not fare well vis-à-vis Biden. An average of only 29
percent of respondents across four polls thought Palin won the debate, and the majority
thought Biden was more intelligent, expressed his views more clearly, was more in touch
with the needs and problems of the people, and seemed more likely to bring the kind of
change the country needs. The only victory Palin scored over Biden was that she seemed
more likeable. When not comparing her performance to Biden’s, however, the majority of
respondents thought Palin’s performance in the debate was good or excellent (65%), and 84
percent of respondents thought she did better than expected. Fifty-five percent of all voters
and 29 percent of registered voters changed their opinion of Palin for the better after the
debate, with only 14 and 11 percent changing their opinion for the worse. After the debate,
Palin was generally viewed as prepared for the job of Vice President, sharing respondent’s
values and positions on most issues, and coming across as knowledgeable about the
important issues facing the country.
According to the public, the media was increasingly unfair to Palin as Election Day
neared. In early September, half of respondents rated the media’s coverage as fair, and 41

45
percent rated it as unfair.13 By the end of that month, only 31 percent rated the coverage as
fair, while 57 percent rated it as unfair.14 Fifty four percent of respondents in early
September thought the media was being harder on Palin than on any of the other
candidates, 29 percent felt all candidates were treated the same, and only 10 percent
thought Palin had it easier.15 In a poll conducted one week later, only 14 percent of
respondents said the media was favoring McCain and Palin over Obama and Biden, while 34
percent felt Obama and Biden were being favored by the media, and 49 percent said both
sets of candidates were being treated equally.16
The country was evenly split on whether Sarah Palin’s gender played a role in
criticisms of her by the press and the public. In early September, 45 percent of Americans
believed Palin was the target of sexist or gender-based attacks by the press, while 48
percent disagreed.17 In addition, 45 percent believed Palin was criticized for not having
experience only because she is a women, while 50 percent believed criticisms based on her
lack of experience were fair.18 In late September, 35 percent of Americans felt Palin received
more criticism because of her gender than for her experience and record, and 58 percent
13 ABC News Poll, September 4, 2008. Question wording: Overall, do you think the news coverage of (Sarah) Palin has been fair or unfair? 14 NBC News, Wall Street Journal, September 19-22, 2008. Question wording: Do you think that the criticism that Sarah Palin has received (in the 2008 presidential election campaign) has been mostly fair and deserved or mostly unfair and undeserved? 15 CBS News Poll, September 5-7, 2008, Registered Voters. Question wording: Compared to the way the news media have treated other (2008 presidential election) candidates, have the news media been harder on Sarah Palin, easier on Sarah Palin, or have they treated him the same as other candidates? 16 Quinnipiac University Poll, September 11-16, 2008. Question wording: Do you think the news media coverage of the (2008) Presidential (election) campaign has favored--John McCain and Sarah Palin, has favored Barack Obama and Joe Biden or has it treated them about equally? 17 FOX News/Opinion Dynamics Poll, September 8-9, 2008. Question wording: Do you think Sarah Palin has been the target of sexist or gender-based attacks in the press? 18 CNN/Opinion Research Corporation Poll, September 5-7, 2008. Question wording: Some people say Sarah Palin does not have enough experience to be vice president. Do you think they are making a fair criticism of her, or are they saying that only because she is a woman?

46
believed Palin’s lack of experience, not gender, was the reason for the criticism.19 Only 36
percent of likely voters in mid-September thought Palin’s gender would not be an issue for
voters, while 33 percent said it would matter to a few voters, 27 percent said it would
matter to some voters, and 3 percent said it would matter to a lot of voters.20
VI. Conclusion
Women in state and national political offices are not hailing from the two major
political parties in equal number, and in fact, the GOPs share of female representatives is
shrinking. Sarah Palin’s emergence as the Republican vice-presidential nominee occurred
not only against this political backdrop, but also during a time of heightened political
polarization. In Congress and in the electorate, the differences between the parties is
widening as Democrats are becoming more liberal and Republicans are becoming more
conservative. Party-line voting has dropped dramatically since the mid-1990s,
congressional committees have become more polarized, and presidential support has been
drawn along partisan lines, leading to negative ratings of Congress, as well as changes in
lawmaking. Congressional polarization has been blamed for a decrease in congressional
comity, the under-representation of the vast middle of the electorate, and an increase in
legislative gamesmanship.
Those female GOPers who are elected into office have also become less moderate as
their party has become more ideologically polarized. A new group of conservative female
Republicans in the House are less supportive of traditional female issues, and their views 19 NBC News/Wall Street Journal Poll, September 19-22, 2008. Question wording: Do you think that Sarah Palin has received criticism (in the 2008 presidential election campaign) more because of her gender or more because of her experience and record? 20 Associated Press/Gfk Poll, September 5-10, 2008, Likely Voters. Question wording: Regardless of what people say publicly, how many people do you think will not vote for John McCain and Sarah Palin (for president in 2008) because Palin is a woman? Do you think a lot of people won't vote for them, some people won't, just a few won't, or do you think Palin's gender won't be an issue to anyone?

47
are more in step with the Republican Party line. In the 108th Congress, Republican women
were no longer ideologically distinguishable from their male colleagues.
An analysis of National Journal rankings for women in the House of Representatives
confirmed this pattern of increasing levels of polarization. Female Republicans in the House
have, on average, moved from being in the ideological center to being more conservative
than 74.9 percent of the other members of Congress (from 54.9 in 1981 to 74.9 in 2008).
Female Representatives in the Democratic Party have become even more liberal today than
they were in 1981, with their liberal ranking increasing from 72.4 in 1981 to 79.8 in 2008.
This ideological separation is important because the gender gaps in candidate
support are related to the conservatism of the candidate. Exit polling data of the twelve
elections resulting in a female Republican Senator shows that, on average, both women and
men were slightly more likely to vote for less conservative Senators than for more
conservative Senators. In the three elections in which there was a significant gender gap,
women were less likely than men to support the female Republican candidate. The gaps in
support by Republicans and Democrats were highly significant in every race, with
Republicans supporting the least conservative and most conservative candidates in equal
numbers. The least conservative Senators received more support from Democrats than did
the most conservative Senators.
Though there is no ideological rating for governors comparable to the rankings of
congresswomen provided by National Journal, Sarah Palin is known by her public
statements and policy positions to be very much on the conservative side of this spectrum.
John McCain’s selection of Palin as his running mate should thus be seen through the lens of
increased political polarization and successful past efforts in recent presidential elections to
tap the support of the conservative base. Based on the trends identified in this chapter in

48
the differences in support for candidates along the conservative ideological spectrum, it is
expected that Republicans in the electorate will have high ratings of Palin and Democrats
will have low ratings, though women in both parties will have lower levels of support for
Palin than their male counterparts.
The next two chapters will examine evaluations of Palin, both overall and on specific
traits, to determine the effects of gender and party identification at the state and national
level. Chapter Three will examine data from an early October survey of Minnesota residents
to determine to what extent gender and partisan identify influence ratings of Palin on three
traits (honesty, caring, and experience) and her political ideology, and how these traits in
turn affect overall evaluations of Palin as measured by presidential vote choice and
appraisals of her performance in the vice presidential debate.
Chapter Four will focus on the relationship between party, traits, and candidate
evaluations among a national sample of women. An examination of ratings of Palin’s traits
will be conducted on the dimensions of women viewing her as being understanding,
personally identifiable, prepared to take over the presidency, and prepared to be
commander-in-chief. In addition, the chapter will examine differences in policy position
agreement – on creationism and evolution, abortion, the right to bear arms, drilling for oil
and gas, global warming, and the war in Iraq – to determine if there is a gender gap within
each party, both in agreement as well as in how much salience these agreements have for
overall evaluations of Palin.

49
Figure 2-1. Number of Women in the United States Senate by Party, 1918-2009
0
2
4
6
8
10
12
14
1918 1928 1938 1948 1958 1968 1978 1988 1998 2008
Dem Rep

50
Figure 2-2. Number of Women in the United States House of Representatives by Party, 1918-2009
0
10
20
30
40
50
60
1918 1928 1938 1948 1958 1968 1978 1988 1998 2008
Dem Rep

51
Figure 2-3. Conservative Ideology Rankings of Republican Women in the United States House of Representatives, 1981-2008
Note: Conservative Ideology Rankings compiled by National Journal magazine. These rankings, which have been conducted since 1981, examine key votes in three areas (economic issues, social issues, and foreign policy) to rank lawmakers relative to one another on a 100 point liberal-to-conservative scale.
40
50
60
70
80
90
100
1981 1984 1987 1990 1993 1996 1999 2002 2005 2008
Economic Social Foreign Composite

52
Figure 2-4. Liberal Ideology Rankings of Democratic Women in the United States House of Representatives, 1981-2008
Note: Liberal Ideology Rankings compiled by National Journal magazine. These rankings, which have been conducted since 1981, examine key votes in three areas (economic issues, social issues, and foreign policy) to rank lawmakers relative to one another on a 100 point conservative-to-liberal scale.
40
50
60
70
80
90
100
1981 1984 1987 1990 1993 1996 1999 2002 2005 2008
Economic Social Foreign Composite

53
Figure 2-5. Conservative Ideology Rankings of Republican Women in the United States Senate, 1981-2008
Note: Conservative Ideology Rankings compiled by National Journal magazine. These rankings, which have been conducted since 1981, examine key votes in three areas (economic issues, social issues, and foreign policy) to rank lawmakers relative to one another on a 100 point liberal-to-conservative scale.
40
50
60
70
80
90
100
1981 1984 1987 1990 1993 1996 1999 2002 2005 2008
Economic Social Foreign Composite

54
Figure 2-6. Liberal Ideology Rankings of Democratic Women in the United States Senate, 1981-2008
Note: Liberal Ideology Rankings compiled by National Journal magazine. These rankings, which have been conducted since 1981, examine key votes in three areas (economic issues, social issues, and foreign policy) to rank lawmakers relative to one another on a 100 point conservative-to-liberal scale.
40
50
60
70
80
90
100
1981 1984 1987 1990 1993 1996 1999 2002 2005 2008
Economic Social Foreign Composite

55
Table 2-1. The Gender Gap in Support for Republican Women in the United States Senate, 2000-2008
Notes: Conservative Ideology Rankings compiled by National Journal magazine. Female and Male percentages are based on national exit polling conducted by Edison Media Research and reported by CNN. Entries in the Average Least Conservative row are averages from the first six candidates. Entries in the Average Most Conservative row are averages from the last six candidates. Gender Gap is calculated by subtracting the percentage of men supporting a candidate from the percentage of women supporting that candidate. A difference in proportions test was used to determine if the gender gap is significant. Significance levels: ***=p<.001, **=p<.01, *=p<.05, +=p<.10.
Conservative
RankingGender Gap
% N % N %
Snowe (‘06) 44.5 75.1 301 72.8 275 2.3
Collins (‘02) 44.5 60.0 69 55.6 69 4.4
Collins (‘96) 47.7 47.1 305 58.7 383 -11.6
Snowe (‘94) 49.8 60.0 439 60.5 401 -0.5
Snowe (‘00) 49.8 68.7 307 68.3 274 0.4
Collins (‘08) 51.0 59.0 832 63.0 709 -4.0+
Dole (‘08) 60.8 41.0 1487 50.0 1266 -9.0***
Hutchison (‘06) 66.3 59.6 611 62.4 614 -2.8
Murkowski (‘04) 67.3 45.4 272 57.1 323 -11.7**
Hutchison (‘00) 70.5 63.0 260 67.7 273 -4.7
Dole (‘02) 71.8 63.6 161 63.7 116 -0.1
Hutchison (‘94) 85.7 60.5 507 61.1 452 -0.6
Average Least
Conservative47.9 61.7 63.2 -1.5
Average Most
Conservative70.4 55.5 60.3 -4.8
MaleFemale

56
Table 2-2. The Partisan Gap in Support for Republican Women in the United States Senate, 2000-2008
Notes: Conservative Ideology Rankings compiled by National Journal magazine. Republican, Democrat, and Independent percentages are based on national exit polling conducted by Edison Media Research and reported by CNN. Entries in the Average Least Conservative row are averages from the first six candidates. Entries in the Average Most Conservative row are averages from the last six candidates. Partisan Gap is calculated by subtracting the percentage of Democrats supporting a candidate from the percentage of Republicans supporting that candidate. A difference in proportions test was used to determine if the partisan gap is significant. Significance levels: ***=p<.001, **=p<.01, *=p<.05, +=p<.10.
Conservative
Ranking
Partisan
Gap
% N % N % N %
Snowe ('06) 44.5 96.0 218 55.6 159 74.1 195 40.4***
Collins ('02) 44.5 94.5 69 24.7 20 61.0 36 69.8***
Collins ('96) 47.7 86.1 298 22.4 101 57.2 243 63.7***
Snowe ('94) 49.8 90.6 358 31.2 139 62.0 299 59.4***
Snowe ('00) 49.8 91.7 198 44.1 105 71.2 242 47.6***
Collins ('08) 51.0 90.0 401 33.0 539 67.0 616 57.0***
Dole ('08) 60.8 89.0 853 6.0 1156 55.0 743 83.0***
Hutchison ('06) 66.3 95.9 766 18.2 109 57.4 312 77.7***
Murkowski ('04) 67.3 82.7 378 11.1 24 38.4 172 71.6***
Hutchison ('00) 70.5 95.1 312 27.8 73 69.1 125 67.3***
Dole ('02) 71.8 92.2 200 14.9 17 54.1 46 77.3***
Hutchison ('94) 85.7 92.2 545 19.9 101 65.0 266 72.3***
Average Least
Conservative47.9 91.5 35.2 65.4 56.3
Average Most
Conservative70.4 91.2 16.3 56.5 74.9
DemocratRepublican Independent

57
Table 2-3. The Republican Gender Gap in Support for Republican Women in the United States Senate, 2000-2006
Notes: Conservative Ideology Rankings compiled by National Journal magazine. Female Republican and Male Republican percentages are based on national exit polling conducted by Edison Media Research and reported by CNN. Entries in the Average Least Conservative row are averages from the first five candidates. Entries in the Average Most Conservative row are averages from the last five candidates. Republican Gender Gap is calculated by subtracting the percentage of Male Republicans supporting a candidate from the percentage of Female Republicans supporting that candidate. A difference in proportions test was used to determine if the Republican gender gap is significant. Significance levels: ***=p<.001, **=p<.01, *=p<.05, +=p<.10.
Conservative
Ranking
Republican
Gender Gap
% N % N %
Snowe ('06) 44.5 97.1 100 95.9 116 1.2
Collins ('02) 44.5 100.0 33 90.0 36 10.0*
Collins ('96) 47.7 85.3 116 86.6 181 -1.3
Snowe ('94) 49.8 90.3 186 90.9 170 -0.6
Snowe ('00) 49.8 92.4 97 90.8 99 1.6
Hutchison ('06) 66.3 93.7 386 97.9 379 -4.2**
Murkowski ('04) 67.3 80.4 160 84.0 216 -3.6
Hutchison ('00) 70.5 97.4 148 93.2 165 4.2*
Dole ('02) 71.8 92.3 108 91.8 90 0.5
Hutchison ('94) 85.7 93.3 294 91.2 248 2.1
Average Least
Conservative47.3 93.0 90.8 2.2
Average Most
Conservative72.3 91.4 91.6 -0.2
Male RepublicanFemale
Republican

58
Table 2-4. The Democratic Gender Gap in Support for Republican Women in the United States Senate, 2000-2006
Notes: Conservative Ideology Rankings compiled by National Journal magazine. Female Democrat and Male Democrat percentages are based on national exit polling conducted by Edison Media Research and reported by CNN. Entries in the Average Least Conservative row are averages from the first five candidates. Entries in the Average Most Conservative row are averages from the last five candidates. Democratic Gender Gap is calculated by subtracting the percentage of Male Democrats supporting a candidate from the percentage of Female Democrats supporting that candidate. A difference in proportions test was used to determine if the Democratic gender gap is significant. Significance levels: ***=p<.001, **=p<.01, *=p<.05, +=p<.10.
Conservative
Ranking
Democratic
Gender Gap
% N % N %
Snowe ('06) 44.5 59.1 91 51.5 67 7.6
Collins ('02) 44.5 29.3 12 19.5 8 9.8
Collins ('96) 47.7 23.6 62 20.5 38 3.1
Snowe ('94) 49.8 33.3 86 28.3 51 5.0
Snowe ('00) 49.8 46.6 69 40.0 36 6.6
Hutchison ('06) 66.3 19.5 65 15.9 42 3.6
Murkowski ('04) 67.3 12.8 17 8.3 7 4.5
Hutchison ('00) 70.5 27.5 42 28.2 31 -0.7
Dole ('02) 71.8 16.9 13 10.8 4 6.1
Hutchison ('94) 85.7 20.9 59 19.3 42 1.6
Average Least
Conservative47.3 38.4 32.0 6.4
Average Most
Conservative72.3 19.5 16.5 3.0
Male DemocratFemale Democrat

59
Table 2-5. The Independent Gender Gap in Support for Republican Women in the United States Senate, 2000-2006
Notes: Conservative Ideology Rankings compiled by National Journal magazine. Female Independent and Male Independent percentages are based on national exit polling conducted by Edison Media Research and reported by CNN. Entries in the Average Least Conservative row are averages from the first five candidates. Entries in the Average Most Conservative row are averages from the last five candidates. Independent Gender Gap is calculated by subtracting the percentage of Male Independents supporting a candidate from the percentage of Female Independents supporting that candidate. A difference in proportions test was used to determine if the Independent gender gap is significant. Significance levels: ***=p<.001, **=p<.01, *=p<.05, +=p<.10.
Conservative
Ranking
Independent
Gender Gap
% N % N %
Snowe ('06) 44.5 76.3 106 71.3 87 5.0
Collins ('02) 44.5 60.0 18 65.5 19 -5.5
Collins ('96) 47.7 51.9 107 62.2 135 -10.3*
Snowe ('94) 49.8 63.9 147 60.3 149 3.6
Snowe ('00) 49.8 74.0 125 68.0 115 6.0
Hutchison ('06) 66.3 55.8 134 58.4 177 -2.6
Murkowski ('04) 67.3 34.9 87 42.9 85 -8.0
Hutchison ('00) 70.5 64.4 56 75.0 69 -10.6+
Dole ('02) 71.8 62.2 28 46.2 18 16.0
Hutchison ('94) 85.7 64.4 123 65.7 142 -1.3
Average Least
Conservative47.3 65.2 65.5 -0.2
Average Most
Conservative72.3 56.3 57.6 -1.3
Male
Independent
Female
Independent

60
Table 2-6. The Female Partisan Gap in Support for Republican Women in the United States Senate, 2000-2006
Notes: Conservative Ideology Rankings compiled by National Journal magazine. Female Republican and Female Democrat percentages are based on national exit polling conducted by Edison Media Research and reported by CNN. Entries in the Average Least Conservative row are averages from the first five candidates. Entries in the Average Most Conservative row are averages from the last five candidates. Female Partisan Gap is calculated by subtracting the percentage of Female Democrats supporting a candidate from the percentage of Female Republicans supporting that candidate. A difference in proportions test was used to determine if the female partisan gap is significant. Significance levels: ***=p<.001, **=p<.01, *=p<.05, +=p<.10.
Conservative
Ranking
Female
Partisan Gap
% N % N %
Snowe ('06) 44.5 97.1 100 59.1 91 38.0***
Collins ('02) 44.5 100.0 33 29.3 12 70.7***
Collins ('96) 47.7 85.3 116 23.6 62 61.7***
Snowe ('94) 49.8 90.3 186 33.3 86 57.0***
Snowe ('00) 49.8 92.4 97 46.6 69 45.8***
Hutchison ('06) 66.3 93.7 386 19.5 65 74.2***
Murkowski ('04) 67.3 80.4 160 12.8 17 67.6***
Hutchison ('00) 70.5 97.4 148 27.5 42 69.9***
Dole ('02) 71.8 92.3 108 16.9 13 75.4***
Hutchison ('94) 85.7 93.3 294 20.9 59 72.4***
Average Least
Conservative47.3 93.0 38.4 54.6
Average Most
Conservative72.3 91.4 19.5 71.9
Female
Republican
Female
Democrat

61
Table 2-7. The Male Partisan Gap in Support for Republican Women in the United States Senate, 2000-2006
Notes: Conservative Ideology Rankings compiled by National Journal magazine. Male Republican and Male Democrat percentages are based on national exit polling conducted by Edison Media Research and reported by CNN. Entries in the Average Least Conservative row are averages from the first five candidates. Entries in the Average Most Conservative row are averages from the last five candidates. Male Partisan Gap is calculated by subtracting the percentage of Male Democrats supporting a candidate from the percentage of Male Republicans supporting that candidate. A difference in proportions test was used to determine if the male partisan gap is significant. Significance levels: ***=p<.001, **=p<.01, *=p<.05, +=p<.10.
Conservative
Ranking
Male
Partisan Gap
% N % N %
Snowe ('06) 44.5 95.9 116 51.5 67 44.4***
Collins ('02) 44.5 90.0 36 19.5 8 70.5***
Collins ('96) 47.7 86.6 181 20.5 38 66.1***
Snowe ('94) 49.8 90.9 170 28.3 51 62.6***
Snowe ('00) 49.8 90.8 99 40.0 36 50.8***
Hutchison ('06) 66.3 97.9 379 15.9 42 82.0***
Murkowski ('04) 67.3 84.0 216 8.3 7 75.7***
Hutchison ('00) 70.5 93.2 165 28.2 31 65.0***
Dole ('02) 71.8 91.8 90 10.8 4 81.0***
Hutchison ('94) 85.7 91.2 248 19.3 42 71.9***
Average Least
Conservative47.3 90.8 32.0 58.9
Average Most
Conservative72.3 91.6 16.5 75.1
Male RepublicanMale
Democrat

62
Chapter Three
Minnesotans’ Opinions of Sarah Palin
The previous two chapters have provided theoretical and empirical backdrops on
political behavior, especially as it relates to stereotypes and differences in gender opinion
and voting behavior, and the increasing climate of political polarization in Washington, D.C.
Chapter Two also surveyed public opinion towards female candidates in the Senate as well
as attitudes toward 2008 Republican Vice Presidential nominee Sarah Palin. The next two
chapters will delve more deeply into public opinion about Palin by analyzing public
attitudes towards her in a battleground state and in a national sample. Specifically, these
chapters will analyze trait ratings, ideology assessments, policy position agreement, and
overall evaluations of Palin in the 2008 Presidential contest.
While the next chapter will concentrate on the opinions and attitudes of a national
sample of women, this chapter will focus on the state of Minnesota. The opinions of
Minnesotans regarding the traits and evaluations of Sarah Palin are well suited to this
research project for three reasons. First, as a battleground state, the actions of Minnesota
voters were politically important on Election Day, and with 10 electoral votes, Minnesota is
able to affect the outcome of presidential elections. Secondly, Minnesota voters have
recently demonstrated support of a female candidate for federal office, as shown by the
election of U.S. Senator Amy Klobuchar in 2006. Thirdly, a public opinion survey was
administered in the Gopher State around the time of the 2008 Vice Presidential debate –
specifically, three days before and three days after. This allows for an examination of the
differences in attitudes among those who watched the debate and those who did not in

63
order to ascertain the potential effects increased information can have on candidate
evaluations and how that varies by gender and party.
The Minnesota public opinion survey was conducted by Minnesota Public Radio and
the Center for the Study of Politics and Governance at the University of Minnesota’s
Humphrey Institute of Public Affairs after the selection of the Democratic and Republican
vice presidential running mates and both political party conventions. The survey was
conducted of 1,141 residents between September 29th and October 5th, 2008. The margin
of error is +/-3.6 percentage points.21
This chapter is divided into two sections. The first will utilize descriptive statistics
and regression analysis to examine the public’s assessments of Sarah Palin’s ideology as
well as ratings of Palin on three traits – honesty, caring, and experience22. The second
section will focus on overall evaluations of Palin as measured by presidential vote choice
and appraisals of her performance in the vice presidential debate23. In addition, it will study
the impact of trait ratings and ideology assessment on these overall evaluations.
21 The survey was fielded by the Center for Survey Research and Analysis (CSRA) at the University of Connecticut, which has extensive national and state experience conducting non-partisan surveys on politics and government policy. CSRA called a sample of telephone exchanges that was randomly selected by a computer from a list of active residential exchanges within the State of Minnesota. Within each exchange, random digits were added to form a complete telephone number, thus permitting access to both listed and unlisted numbers. The results are weighted to reflect the number of adults and telephone lines in a household as well as the demographic characteristics of adults in Minnesota based on region, sex, age, education, and race. 22 Ideology is assessed with the following question: “Do you think Sarah Palin's political views are too conservative, about right, or too liberal?” Traits are rated with the following questions: “Next, I am going to read you a list of statements. Tell me whether you think each statement applies more to Joe Biden or Sarah Palin: a) Is honest? b) Has the right experience to be president? c) Cares about people like me?” 23 Question wording: Does Palin's performance in the debate make you more or less likely to vote for McCain, or didn't it make a difference?

64
I. Trait Ratings and Ideology Assessment
A. Introduction
A candidate’s personality, appearance, and demeanor can provide a valuable
shorthand for voters (Popkin 1991). Voters are faced with multiple cues when evaluating a
candidate, and two of these are the social stereotypes based on the candidate’s gender and
party. Citizens are more likely to identify men as strong, assertive, and self-confident, while
women are identified as more compassionate, warm, and kind (I. K. Broverman, Vogel, D. M.
Broverman, Clarkson, and Rosenkrantz 1972; Deaux and Lewis 1984; McKee and Sherriffs
1957; Spence, Helmreich, and Stapp 1974; Williams and Best 1982). Partisan stereotypes
fall across these gendered lines. GOP candidates are typically viewed as stronger leaders
than Democratic candidates, a trait commonly thought of as masculine, while Democratic
candidates are viewed as having more compassion and empathy, which are typically
identified as feminine traits (Hayes 2005).
These stereotypes create a conflict when a candidate is both female and Republican,
as is the case with Sarah Palin. On the one hand, findings about how voters evaluate the
traits of female candidates would predict that voters are likely to rate Palin highly on
feminine measures of honesty and caring. On the other hand, literature on stereotypes of
GOPers indicates that voters would rate Palin highly on more masculine traits.
This study focuses on three traits. Previous research has identified two of the
candidate traits as both feminine and interpersonal (honesty and caring), while the third
trait is regarded as performance-based (experience). While the trait of experience is not
masculine per se, the fact that it is related to performance makes it a close proxy. All three
traits are measured relative to Palin’s Democratic vice presidential opponent, Joe Biden.
This method of measuring traits for a female candidate relative to her male opponent is one

65
of the two primary ways evaluations of traits have been examined in previous research. One
set of studies asks respondents to rate a hypothetical male candidate and a hypothetical
female candidate individually (e.g. Rosenwasser et al. 1987). Alternatively, candidate traits
have been asked as a relative rating, or as an either/or choice between candidates (Lawless
2004).
In addition to trait ratings, this section analyzes assessments of Palin’s ideology.
Female candidates of both major political parties are perceived by voters as being more
liberal than their male colleagues (Alexander and Andersen 1993; Dolan 2004; Huddy and
Terkildsen 1993a; King and Matland 2003; McDermott 1997). While the Minnesota survey
does not provide assessments of Sarah Palin’s ideology compared to a male Republican
candidate, it does ask respondents to assess whether Palin’s ideology is about right, too
conservative, or too liberal.
One important reason for the selection of the Minnesota survey for analysis is its
timing: the fact that it was conducted both before and after the vice presidential debate
gives leverage to answer questions about the differences in opinions of those who were
exposed to increased information about the candidates, and those who were not. The vice-
presidential debate between Sarah Palin and Democratic vice-presidential nominee Joe
Biden, held on October 2nd, 2009, was viewed across the nation by 69.9 million Americans.
This set a new record for vice presidential debate television audience size, beating the
Ferraro-Bush debate of 1984 by 13.2 million viewers. The debate also surpassed the first
presidential debate between Barack Obama and John McCain, which drew an audience of
52.4 million on September 26th, 2008 (Nielsen 2008b). In the Minneapolis-St. Paul
television market area, 49.8 percent of households viewed the debate, leading the metro

66
area to be ranked 16th in viewership among the 56 market areas tracked by Nielsen (Nielsen
2008a).
B. Results
Research Question #1. What is the relationship between gender and party in the public’s
ratings of Sarah Palin on her traits and assessment of her ideology? Within partisan groups, is
there a gender gap in ratings of Sarah Palin’s traits and ideology? If so, on which traits and
evaluations are gender gaps more pronounced?
Overall, only 9.8 percent of the sample viewed Palin as too liberal. An additional
46.1 percent believed her ideology is about right, and 44.1 percent believed she is too
conservative (see Table 3-1).24 In order to take an in-depth look at the way Minnesotans
assess Sarah Palin’s ideology, I grouped the data into gender partisan groups (male
Democrats, female Democrats, male Republicans, female Republicans, male Independents,
and female Independents). This allows for an examination of variations in the assessment of
ideological ratings across different subsets of the population. These gender and partisan
gaps were then tested for significance using a difference in proportions test.
The data indicate there are no statistically significant gender or partisan gaps
among those assessing Palin’s ideology as too liberal. However, there is evidence of
significant gender gaps within political parties on ratings of Sarah Palin’s ideology as about
right and too conservative. Within the Democratic Party, women are 6.9 percentage points
less likely than men to think Palin is too conservative. In addition, Republican women are
5.8 percentage points more likely than Republican men to think Palin’s ideology is about
24 Question wording: Do you think Sarah Palin's political views are too conservative, about right, or too liberal?

67
right. In addition, there are partisan gaps for both genders. Republican women are 62.7
percentage points more likely to rate Sarah Palin’s ideology as about right and 54.3
percentage points less likely to rate her as too conservative than Democratic women.
Similarly, men in the Republican Party are 59.0 percentage points more likely to rate Palin
as about right and 54.7 percentage points less likely to rate Palin as too conservative than
men in the Democratic Party.
Consistent with the research finding that women are more likely to be rated as
having feminine traits is the finding from the Minnesota survey data that Palin is rated
higher than Joe Biden on the trait of caring. Fifty five percent believed Palin was more
caring, while 44.9 percent believed this trait best described Biden.25 However, Minnesotans
rated Palin only equally with Biden on the trait of honesty, another trait commonly
associated with females, with each being named by about 50 percent of the sample as
holding this trait.26 In addition, Palin was rated as less experienced than Biden by an
overwhelming margin, with 74.8 percent saying he was the vice presidential candidate who
had the right experience to be president (see Table 3-2).27
Examining the differences among gender partisan groups, Democratic women
judged Palin more favorably than Democratic men on caring (22.3 percent to 18.9 percent),
but less favorably on honesty (16.2 percent to 20.2 percent) and experience (3.2 percent to
4.6 percent). Republican women judged Palin more favorably than Republican men on
caring (96.6 percent to 92.6 percent) and honesty (93.5 percent to 90.3 percent), but less
25 Question wording: Next, I am going to read you a list of statements. Tell me whether you think each statement applies more to Joe Biden or Sarah Palin: Cares about people like me? 26 Question wording: Next, I am going to read you a list of statements. Tell me whether you think each statement applies more to Joe Biden or Sarah Palin: Is honest? 27 Question wording: Next, I am going to read you a list of statements. Tell me whether you think each statement applies more to Joe Biden or Sarah Palin: Has the right experience to be president?

68
favorably on experience (51.5 percent to 55.2 percent). Independent women rated Palin
less favorably than Independent men on all three traits: caring (76.1 percent to 77.2
percent), honesty (53.7 percent to 59.6 percent), and experience (29.5 percent to 37.7
percent). While these gaps give some clue as to differences in ratings among gender and
partisan groups, the only significant gender gap is among Republican men and women on
the trait of caring. Partisan gaps within gender groups are significant for all three traits. The
male partisan gap was nearly equal to the female partisan gap on all three traits: caring
(73.6 to 74.3 percent), honesty (70.1 to 77.3 percent), and experienced (50.6 to 48.3
percent).
Research Question #2. Does a voter’s gender and party identification have a significant effect
on their ratings of Palin’s traits and ideology, controlling for factors such as demographics and
socioeconomic indicators? Is the effect of gender on Palin’s traits and ideology moderated by
party?
Descriptive statistics show that a voter’s party identification is a strong predictor of
candidate traits and ideology assessment, while gender has a more nuanced effect. In order
to more fully test the relationship between a voter’s own gender and party identification on
their ratings of Sarah Palin as caring, honest, and experienced, as well as assessments of her
ideology as about right, I ran a series of logistic regression models. Each model uses one of
the traits or ideology assessment as the dependent variable. Demographic and
socioeconomic variables are included as controls in each model. These include a dummy
variable for religious fundamentalism, and categorical variables for age, income, and
education.

69
The results of the logistic regressions are shown in Table 3-3. The variables of
interest in Model 1 for each trait are dummy variables for Female, Republican, and
Independent. The findings indicate that gender is not significantly associated with any of
the trait ratings or assessment of ideology. However, party identification is highly
significant. Republicans are more likely to think Palin is caring by a factor of 60.2, honest by
a factor of 40.8, experienced by a factor of 19.4, and ideologically about right by a factor of
14.1.
While party may overshadow the effects of gender in a simplified model, it is
possible that gender plays a role in trait ratings of Sarah Palin within partisan groups. In
order to test this hypothesis, Model 2 introduces an interaction term between Female and
Party identification. The interaction between being Republican and female has a significant
effect on ratings of Palin as honest (b=1.16, sig at the .05 level), but is not significantly
associated with any of the other ratings. When examining the relationships between gender
and trait ratings for each party individually, being female is not associated with rating Sarah
Palin as honest for Democratic respondents. However, being female is significantly
associated with ratings of honesty for Republicans. For Republicans, the odds of rating
Sarah Palin as honest are increased by a factor of 2.2 by being female rather than male.
Research Question #3. Does increased information about a candidate have a significant
relationship with voter’s ratings of a candidate’s traits and ideology? Specifically, do those who
watched the vice-presidential debate rate Sarah Palin differently than those who did not
watch the debate? Are these relationships moderated by party or gender?

70
In order to test the differences between respondents who watched the debate, and
those who did not, logistic regression was again used with each of the traits along with
ideology assessment, as dependent variables. In this analysis, the independent variable of
interest is a dummy variable indicating whether or not a respondent watched the debate.28
The results shown in Table 3-4 indicate that watching the debate had a significant effect on
voter’s evaluations of two of Palin’s traits. Those who viewed the debate were less likely to
think Palin was caring (b = -.90, sig at the .001 level) or honest (b=-.59, sig at the .01 level).
There was no significant relationship between having watched the debate and ratings of
Palin as experienced or ideologically about right.
In order to determine how these relationships varied by gender and party
identification, I ran two additional sets of models (results not shown in table). In one, I
included interaction terms between gender and having watched the debate; in the other, I
included interaction terms between party identification and having watched the debate. The
results show that that the relationship between watching the debate and rating Sarah Palin
did vary by subgroup in certain instances. The relationship between watching the debate
and rating Sarah Palin as caring varied by gender (b=-1.49, sig at the .001 level). For men,
watching the debate did not have a significant impact on ratings of Sarah Palin as caring, but
it did have a significant impact for women. Women who watched the debate were less likely
to rate Palin as caring than women who did not watch the debate by a factor of .18. The
relationship between watching the debate and rating Palin as honest varied by party (b=.97,
sig at the .10 level). Democrats who watched the debate were less likely to rate Sarah Palin
as being honest than Democrats who did not watch the debate by a factor of .47. However,
28 Question wording: Did you happen to watch any of the Vice Presidential debate between Joe Biden and Sarah Palin that was televised on Thursday, Oct. 2?

71
for Republicans, watching the debate did not have a significant effect on rating Sarah Palin
as honest.
II. Candidate Evaluations
A. Introduction
The Minnesota survey provides two measures that capture overall evaluations of
Sarah Palin: presidential vote choice and the impact of her performance in the vice
presidential debate on vote choice.29 While it may seem a stretch to think that opinions of a
vice-presidential candidate may be affecting presidential vote choice, research has shown
that vice presidential candidates can make a difference. Studies conducted at the individual
level of analysis on the impact of vice presidential candidates on vote choice have found that
voter evaluation of the vice presidential candidates contributed about 0.75 percent toward
the national presidential vote margin from 1952 to 1980, generated about one-half the
influence as presidential candidate evaluations and party identification, and was
approximately one-and-a-half times as impactful as ideological influences on vote choice
(Wattenberg 1984). Moreover, in the presidential elections taking place between 1968 and
1992, voters were substantially influenced by their evaluations of vice presidential
nominees: voters with split presidential and vice presidential preferences were more likely
to defect from their preferred presidential candidate than those with consistent evaluations
(Wattenberg 1995).
This section proceeds along two lines of analysis. The first examines differences in
overall evaluations of Sarah Palin by gender and partisan groups. The second focuses on the
29 Question wording: If the 2008 presidential election were being held today, would you vote for ... Democrat Barack Obama or Republican John McCain? (If don’t know or refused): As of today, who do you lean more towards?; Does Palin's performance in the debate make you more or less likely to vote for McCain, or didn't it make a difference?

72
impact of the trait ratings and ideology assessment investigated above on those overall
evaluations and how that impact varies for gender and partisan groups.
Research has shown that when voters are faced with competing gender and partisan
cues, as is the case with a female Republican politician like Sarah Palin, partisanship plays a
more significant role than gender in shaping evaluations (Huddy and Capelos 2002). In
addition, for Republican candidates specifically, studies have shown that gender stereotypes
do not even come into play (King and Matland 2003). The literature is less clear about
which traits should be more powerful in shaping overall evaluations of candidates,
especially in the context of conflicting stereotypes.
B. Results
Research Question #4. Within partisan groups, is there a gender gap in vote for McCain and
evaluations of Sarah Palin’s performance in the debate?
Table 3-5 presents data on presidential vote choice for gender partisan groups. For
partisans, there were very small gender gaps in vote choice (0.4 percentage points between
Democratic men and women, and 1.4 percentage points between Republican men and
women). Among Independents, there was a wider gender gap with men 15.6 percentage
points more favorable to McCain (60.3 percent to 44.7 percent). However, the gender gaps
within parties were not significant. There were similar significant partisan gaps among the
genders. Republican women were 85.9 percentage points more likely than Democratic
women to vote for McCain, while Republican men were 86.9 percentage points more likely
to do so than Democratic men.

73
Those who watched the vice presidential debate were asked whether they were
more or less likely to vote for McCain as a result of Palin’s performance in the debate, or
whether it made no difference.30 As shown in Table 3-6, female and male Democrats were
equally as likely to be more apt to vote for McCain (3 percent to 3.1 percent), but women
were more likely to penalize McCain as a result of Palin’s performance (33.1 percent to 29
percent). Republican women were less likely than Republican men to reward McCain (30.3
percent to 36.8 percent), and equally likely to punish him (2.2 percent to 2.6 percent).
Among Independents, women were more likely than men to reward McCain (29.2 percent
to 25 percent) and less likely to punish him (12.5 percent to 15.6 percent). However, none
of these gaps are statistically significant.
There were significant differences between partisan groups among men and women
on being less likely and more likely to vote for McCain. Republican women were 30.9
percentage points less likely than Democratic women to punish McCain for Palin’s
performance in the debate, and 27.3 percentage points more likely to reward McCain for
Palin’s performance. Similarly, Republican men were 26.4 percentage points less likely than
Democratic men to punish McCain and 33.7 percentage points more likely to reward him.
Research Question #5.What is the effect of gender and party on vote for McCain and
evaluations of Sarah Palin’s performance in the debate, controlling for other factors? Is the
effect of gender moderated by party?
While the crosstabs used to answer the previous question give insight into the
differences between gender and partisan groups, regression analysis provides a better way
30 Question wording: Does Palin's performance in the debate make you more or less likely to vote for McCain, or didn't it make a difference?

74
to investigate the effects of party and gender on overall evaluations of Sarah Palin. The
dependent variables used above, vote for McCain and Palin’s performance in the debate, are
again employed here.31 In models that use vote for McCain – a dichotomous variable – as
the dependent variable, logistic regression is used. The question regarding Palin’s
performance in the debate has three possible responses: it asks whether a respondent less
likely to vote for McCain, more likely to vote for McCain, or whether the debate performance
makes no difference in the vote for McCain. Therefore, ordinal logistic regression is used. In
addition to the control variables used thus far in this chapter’s analyses, the models using
vote choice and evaluations of Palin’s performance in the debate as dependent variables
include as a control variable John McCain’s ideology, as that is potentially a large predictor
of attitudes toward McCain.32
Table 3-7 shows the effects of gender and party on the two measures of candidate
evaluation. The results indicate that women are less likely than men to vote for McCain (by
a factor of .48), while Republicans, not surprisingly, are more likely than Democrats to
support McCain (by a factor of 159.46). Furthermore, women were more likely than men to
punish McCain for Palin’s performance in the debate, while Republicans were more likely
than Democrats to reward McCain. In order to test if the impact of gender on overall
evaluations varies within partisan groups, Model 2 for each dependent variable in Table 3-7
includes interaction terms between party and gender. These interactions were not
significant, indicating that party does not moderate the effects of gender on these two
evaluations.
31 Question wording: If the 2008 presidential election were being held today, would you vote for ... Democrat Barack Obama or Republican John McCain? (If don’t know or refused): As of today, who do you lean more towards?; Does Palin's performance in the debate make you more or less likely to vote for McCain, or didn't it make a difference? 32 Question Wording: Do you think John McCain's political views are too conservative, about right, or too liberal?

75
Research Question #6. To what extent do trait ratings and ideology assessment have a
significant effect on overall evaluations of Palin? Is the relationship between trait ratings,
ideology assessment, and overall evaluations moderated by gender or party?
In order to answer this question, I ran the previous models using vote for McCain
and Palin’s performance in the debate as dependent variables, adding the trait ratings and
ideology assessment as independent variables. The results in Table 3-8 indicate that those
who view Sarah Palin as honest (b=3.77, sig at the .001 level), experienced (b=5.91, sig at
the .001 level), and ideologically about right (b=2.17, sig at the .05 level) were more likely to
vote for McCain, and those who viewed her as caring (b=2.22, sig at the .001 level), honest
(b=.91, sig at the .10 level), and experienced (b=.67, sig at the .10 level) were more likely to
vote for McCain after viewing Palin’s performance in the vice presidential debate.
To determine if these relationships varied by gender, I ran the models again and
included interaction terms (see Table 3-8, Model 2). There were no significant interactions
between gender and ratings of any of the four traits on evaluations of Palin’s performance
in the debate. Likewise, there were no significant interactions between gender and three of
the ratings on vote for McCain. While ratings of Palin as honest, experienced, and
ideologically about right did not vary in their impact on vote for McCain by gender, there
was a significant interaction between gender and rating Palin as caring (b=5.08, sig at the
.10 level). Women who rated Palin as caring were more likely than women who did not rate
her as such to vote for McCain by a factor of 298.9, but there was no significant difference in
vote for McCain among men who rated Palin as caring and those who did not.

76
I also ran the models using interaction terms between party identification and
ratings of Palin (results not shown in table). There were significant interactions between
party and assessments of Palin as ideologically about right on vote for McCain (b=5.41, sig
at the .05 level), as well as interactions between party and ratings of experience on
evaluations of Palin’s performance in the debate (b=-2.31, sig at the .05 level). On vote for
McCain, among Republicans, those who thought Palin’s ideology was about right, were more
likely than those who thought she was more extreme to vote for McCain by a factor of 40.3.
There was no relationship between opinions on Palin’s ideology and vote for McCain among
non-Republicans. Regarding Palin’s performance in the debate, ratings of her experience
impacted evaluations among non-Republicans, but did not for Republicans. Those
Democrats and Independents who believed Palin was experienced were more likely than
those who did not to reward McCain as a result of Palin’s performance (b=1.65, sig at the .05
level).
III. Discussion
This chapter has analyzed ratings of Sarah Palin’s traits, assessments of her
ideology, and overall evaluations of her. While the literature asserts that female candidates
of both major political parties are perceived by voters as being more liberal than their male
colleagues (Alexander and Andersen 1993; Dolan 2004; Huddy and Terkildsen 1993a; King
and Matland 2003; McDermott 1997), the Minnesota data shows that Palin was not viewed
as liberal among any group of voters. Overall, only 10 percent believed she was too liberal.
However, women of both parties were more likely than their male counterparts to view
Palin as too liberal, and surprisingly, Democratic women were more likely than Republican
women to think of Palin as too liberal.

77
The conflict between partisan and gender stereotypes is at the heart of this analysis.
Research on gender stereotypes indicate Palin should be seen as caring and honest, while
research on partisan stereotypes would deemphasize these feminine traits in favor of more
masculine traits. In fact, there were no significant gender gaps in ratings of Palin on any of
the three traits studied, including the two feminine traits. Women were not more likely than
men to rate Palin as caring, honest, or experienced. However, party identification was a very
strong predictor of ratings on all three traits. Republicans were more likely than Democrats
to view Palin as caring, honest and experienced. It is possible that because Republicans
identify with Palin’s party and views, they are more likely to have a positive view of her and
thus rate her highly on any and all traits. But this strong effect of party identification does
not seem to overshadow any gender effects. Only on the trait of honesty is there a
significant difference in the ratings of Palin by female Democrats and Republicans.
It would not be surprising if Palin’s strategy in the debate was to emphasize
masculine traits, as research has long shown that voters prize those traits for their elected
representatives (Huddy and Terkildsen 1993b; Lawless 2004; Rosenwasser and Seale
1988). However if Palin’s goal was to play to her feminine strengths, she did not achieve
success among Minnesotans. Watching the debate had significant, negative effects on viewer
ratings of caring and honesty. Those who watched the debate were less likely to view Palin
as having these stereotypical feminine traits than those who did not watch her
performance. In this case, having increased information about the candidate did not
reinforce stereotypical female traits. The effect of watching the debate also varied in some
cases by gender and in some cases by party. Men who watched the debate were no different
from men who did not watch the debate in their ratings of Palin on caring. However, for
women, seeing Palin’s performance in the debate made them less likely to rate her as caring.

78
Ratings of Palin on the trait of honesty also varied by party. Watching the debate did not
have a significant effect on Republicans’ ratings of Palin as honest, but Democrats who
watched the debate were more likely to rate Palin as being honest than those who did not.
In overall evaluations, there were no gender gaps within parties in vote for McCain
or evaluations of Palin’s performance in the debate. Democrat men and women were within
just a few points of each other on these two measures. The largest gap among men and
women was among Republicans on the rating of Palin’s performance as making them more
likely to vote for McCain, though this result was not statistically significant. When
controlling for other variables, gender was a significant predictor of both overall
evaluations, with women less likely than men to vote for McCain or reward McCain for
Palin’s performance in the debate. Party identification had a large impact on both measures,
though it was larger for overall vote for McCain than for Palin’s performance in the debate.
These findings are not surprising given that research has shown that when voters are faced
with competing gender and partisan cues, partisanship plays a more significant role than
gender in shaping evaluations (Huddy and Capelos 2002).
It is important to examine what factors determine trait ratings and assessments, and
thus far this project has found that ratings of a conservative female Republican candidate
are driven by party identification of the respondents. However, this project goes even
further to look at the impact of those ratings on overall evaluations. How much weight are
feminine traits given in the decision of whom to vote? Are those who think Palin is caring
more likely to vote for McCain? Is this different for men versus women, or Republicans
versus Democrats?
Those who view Sarah Palin as honest, experienced, and ideologically about right
were more likely to vote for McCain, and those who viewed her as honest, caring, and

79
experienced were more likely to vote for McCain after viewing Palin’s performance in the
vice presidential debate. In addition, there were significant differences in the salience of
these ratings among gender and partisan groups. Women who rated Palin as caring were
more likely than women who did not rate her as such to vote for McCain, but there was no
significant difference in vote for McCain among men who rated Palin as caring and those
who did not. Republicans who thought Palin’s ideology was about right were more likely
than those who thought she was more extreme to vote for McCain. Regarding Palin’s
performance in the debate, ratings of her experience impacted evaluations among non-
Republicans, but did not for Republicans. Those Democrats and Independents who believed
Palin was experienced were more likely than those who did not to reward McCain as a
result of Palin’s performance.
IV. Conclusion
In this chapter, I have shown that a citizen’s gender and party identification shape
their perceptions of Sarah Palin’s traits, ideology, and overall evaluations. Party
identification is the strongest predictor, with gender playing a much smaller role. The
differences in how Palin is rated on her traits and ideology are important as evidenced by
their significant impact on her overall evaluations.
The next chapter will further investigate opinions towards Sarah Palin and the
relationship between gender, party, and candidate evaluations using a national sample of
females. I will examine ratings of Palin’s traits on the dimensions of being caring, personally
identifiable, being prepared to take over the Presidency, and being prepared to be
commander-in-chief. A new dimension to be analyzed will be differences in policy position
agreement, specifically on the issues of creationism and evolution, abortion, the right to

80
bear arms, drilling for oil and gas, global warming, and the war in Iraq. These measures will
be used to determine if there is gender gap within each party, both in agreement as well as
in how much salience these agreements have for overall evaluations of Palin.

81
Table 3-1. Minnesotans’ Assessments of Sarah Palin’s Ideology
Method: Crosstabs. Question Wording: Do you think Sarah Palin's political views are too conservative, about right, or too liberal? Notes: Democratic Gender Gap is calculated by subtracting the percentage of Male Democrats giving a response from the percentage of Female Democrats giving that same response. Republican Gender Gap is calculated by subtracting Male Republicans from Female Republicans. Independent Gender Gap is calculated by subtracting Male Independents from Female Independents. Female Partisan Gap is calculated by subtracting Female Democrats from Female Republicans. Male Partisan Gap is calculated by subtracting Male Democrats from Male Republicans. A difference in proportions test was used to determine if these gaps are significant. Significance levels: ***=p<.001, **=p<.01, *=p<.05, +=p<.10.
Too liberal About rightToo
conservative
% % %
Total 9.8 46.1 44.1
Male Democrat 10.3 17.0 72.8
Female Democrat 14.7 19.4 65.8
Male Republican 5.6 76.3 18.1
Female Republican 6.4 82.1 11.6
Male Independent 9.7 58.1 32.3
Female Independent 11.6 46.5 41.9
Democrat Gender Gap 4.5 2.5 -6.9+
Republican Gender Gap 0.8 5.8+ -6.5
Independent Gender Gap 2.0 -11.6 9.6
Female Partisan Gap -8.4 62.7*** -54.3***
Male Partisan Gap -4.7 59.0*** -54.7***

82
Table 3-2. Minnesotans’ Ratings of Sarah Palin’s Traits
Method: Crosstabs.
Palin Biden Palin Advantage
% % %
Cares About People Like Me 55.1 44.9 10.3
Male Democrat 18.9 81.1 -62.1
Female Democrat 22.3 77.7 -55.5
Male Republican 92.6 7.4 85.2
Female Republican 96.6 3.4 93.1
Male Independent 77.2 22.8 54.4
Female Independent 76.1 23.9 52.2
Democrat Gender Gap 3.3
Republican Gender Gap 4.0*
Independent Gender Gap -1.1
Female Partisan Gap 74.3***
Male Partisan Gap 73.6***
Is Honest 50.8 49.2 1.5
Male Democrat 20.2 79.8 -59.6
Female Democrat 16.2 83.8 -67.6
Male Republican 90.3 9.7 80.6
Female Republican 93.5 6.5 87.0
Male Independent 59.6 40.4 19.2
Female Independent 53.7 46.3 7.3
Democrat Gender Gap -4.0
Republican Gender Gap 3.2
Independent Gender Gap -6.0
Female Partisan Gap 77.3***
Male Partisan Gap 70.1***
Has the right experience to be
president25.2 74.8 -49.6
Male Democrat 4.6 95.4 -90.7
Female Democrat 3.2 96.8 -93.6
Male Republican 55.2 44.8 10.5
Female Republican 51.5 48.5 2.9
Male Independent 37.7 62.3 -24.6
Female Independent 29.5 70.5 -40.9
Democrat Gender Gap -1.4
Republican Gender Gap -3.8
Independent Gender Gap -8.2
Female Partisan Gap 48.3***
Male Partisan Gap 50.6***

83
Question Wording: Next, I am going to read you a list of statements. Tell me whether you think each statement applies more to Joe Biden or Sarah Palin. Cares about people like me? Is honest? Has the right experience to be president? Notes: Palin Advantage is calculated by subtracting the percentage of respondents saying the trait applies more to Biden from the percentage of respondents saying the trait applies more to Palin. Democratic Gender Gap is calculated by subtracting the percentage of Male Democrats giving a response from the percentage of Female Democrats giving that same response. Republican Gender Gap is calculated by subtracting Male Republicans from Female Republicans. Independent Gender Gap is calculated by subtracting Male Independents from Female Independents. Female Partisan Gap is calculated by subtracting Female Democrats from Female Republicans. Male Partisan Gap is calculated by subtracting Male Democrats from Male Republicans. A difference in proportions test was used to determine if these gaps are significant. Significance levels: ***=p<.001, **=p<.01, *=p<.05, +=p<.10.

84
Table 3-3. Effects of Gender and Party Identification on Minnesotans’ Trait Ratings and Ideology Assessment of Sarah Palin
Method: Logistic Regression. Question Wording: Next, I am going to read you a list of statements. Tell me whether you think each statement applies more to Joe Biden or Sarah Palin. Cares about people like me? Is honest? Has the right experience to be president? Do you think Sarah Palin's political views are too conservative, about right, or too liberal? Notes: Dependent Variables are listed across the top of the table. For the first three dependent variables, 0 = this trait applies more to Biden, and 1 = this trait applies more to Palin. For the fourth dependent variable, 0 = too conservative and too liberal, and 1 = about right. Two models were run for each dependent variable. Model 2 includes all variables of Model 1 in addition to interaction variables between party and gender. Entries are beta coefficients with standard errors in parentheses. Significance levels: ***=p<.001, **=p<.01, *=p<.05, +=p<.10.
(1) (2) (1) (2) (1) (2) (1) (2)
Female 0.35 0.33 0.05 -0.22 -0.23 -0.57 0.09 -0.07
(.22) (.27) (.21) (.28) (.20) (.49) (.18) (.27)
Republican 4.10*** 4.00*** 3.71*** 3.24*** 2.97*** 2.77*** 2.65*** 2.45***
(.30) (.38) (.26) (.33) (.27) (.37) (.21) (.28)
Independent 2.41*** 2.47*** 1.68*** 1.64*** 2.23*** 2.00*** 1.50*** 1.51***
(.30) (.42) (.29) (.40) (.34) (.45) (.26) (.36)
Republican x 0.27 1.16* 0.39 0.43
Female (.61) (.55) (.54) (.40)
Independent x -0.13 0.00 0.49 -0.09
Female (.59) (.57) (.69) (.53)
Age -0.36*** -0.36*** -0.41*** -0.40*** 0.01 0.01 0.10 0.10
(.11) (.11) (.11) (.11) (.10) (.10) (.09) (.09)
Income 0.20* 0.20* 0.02 0.02 0.01 0.01 -0.12 -0.12
(.10) (.10) (.10) (.10) (.09) (.09) (.08) (.08)
Education -0.43** -0.42** -0.21 -0.21 -0.35** -0.36** -0.23* -0.23+
(.14) (.15) (.14) (.14) (.13) (.13) (.12) (.12)
Evangelical 0.52* 0.50* 0.53* 0.49* 0.70*** 0.70*** 0.75*** 0.73***
(.24) (.24) (.22) (.23) (.20) (.20) (.19) (.19)
Constant -0.89** -0.88* -0.65+ -0.49 -2.80*** -2.63*** -1.23*** -1.15***
(.36) (.36) (.35) (.36) (.39) (.44) (.31) (.33)
N 759 759 722 722 773 773 750 750
Cox and Snell R2 .438 .438 .413 .417 .270 .271 .301 .302
Caring Honest ExperiencedIdeologically
About Right

85
Table 3-4. Effects of Watching the Vice Presidential Debate on Minnesotans’ Trait Ratings and Ideology Assessment of Sarah Palin
Method: Logistic Regression. Question Wording: Next, I am going to read you a list of statements. Tell me whether you think each statement applies more to Joe Biden or Sarah Palin. Cares about people like me? Is honest? Has the right experience to be president? Do you think Sarah Palin's political views are too conservative, about right, or too liberal? Notes: Dependent Variables are listed across the top of the table. For the first three dependent variables, 0 = this trait applies more to Biden, and 1 = this trait applies more to Palin. For the fourth dependent variable, 0 = too conservative and too liberal, and 1 = about right. Entries are beta coefficients with standard errors in parentheses. Significance levels: ***=p<.001, **=p<.01, *=p<.05, +=p<.10.
Caring Honest ExperiencedIdeologically
About Right
Watched Debate -.90*** -.59** -.17 -.20
(.22) (.21) (.21) (.19)
Female .34 .03 -.24 .08
(.23) (.21) (.20) (.19)
Republican 4.19*** 3.72*** 2.97*** 2.64***
(.31) (.26) (.27) (.21)
Independent .24*** 1.66*** 2.22*** 1.48***
(.31) (.29) (.34) (.27)
Age -.34** -.39*** .03 .12
(.11) (.11) (.10) (.09)
Income .21* .03 .02 -.12
(.10) (.10) (.09) (.08)
Education -.40** -.19 -.35** -.22+
(.15) (.14) (.13) (.12)
Evangelical .54* .53* .71*** .76***
(.24) (.22) (.20) (.19)
Constant -.60+ -.45 -2.78*** -1.19***
(.37) (.36) (.39) (.31
N 759 722 773 750
Cox and Snell R2 .451 .420 .271 .302

86
Table 3-5. Minnesotans’ Presidential Vote Choice by Gender and Party Identification
Method: Crosstabs. Question Wording: If the 2008 presidential election were being held today, would you vote for … Democrat Barack Obama or Republican John McCain? (If Don’t Know or Refused, ask: As of today, who do you lean more towards?) Notes: McCain Advantage is calculated by subtracting the percentage of respondents saying they would vote for Obama from the percentage of respondents saying they would vote for McCain. Democratic Gender Gap is calculated by subtracting the percentage of Male Democrats giving a response from the percentage of Female Democrats giving that same response. Republican Gender Gap is calculated by subtracting Male Republicans from Female Republicans. Independent Gender Gap is calculated by subtracting Male Independents from Female Independents. Female Partisan Gap is calculated by subtracting Female Democrats from Female Republicans. Male Partisan Gap is calculated by subtracting Male Democrats from Male Republicans. A difference in proportions test was used to determine if these gaps are significant. Significance levels: ***=p<.001, **=p<.01, *=p<.05, +=p<.10.
McCain ObamaMcCain
Advantage
% % %
Total 45.4 54.6 -9.3
Male Democrat 7.3 92.7 -85.5
Female Democrat 6.9 93.1 -86.3
Male Republican 94.1 5.9 88.3
Female Republican 92.7 7.3 85.5
Male Independent 60.3 39.7 20.7
Female Independent 44.7 55.3 -10.5
Democrat Gender Gap 0.4
Republican Gender Gap 1.4
Independent Gender Gap 15.6
Female Partisan Gap 85.9***
Male Partisan Gap 86.9***

87
Table 3-6. Minnesotans’ Evaluation of Sarah Palin’s Performance in the Vice Presidential Debate by Gender and Party Identification
Method: Crosstabs. Question Wording: Does Palin's performance in the debate make you more or less likely to vote for McCain, or didn't it make a difference? Notes: Democratic Gender Gap is calculated by subtracting the percentage of Male Democrats giving a response from the percentage of Female Democrats giving that same response. Republican Gender Gap is calculated by subtracting Male Republicans from Female Republicans. Independent Gender Gap is calculated by subtracting Male Independents from Female Independents. Female Partisan Gap is calculated by subtracting Female Democrats from Female Republicans. Male Partisan Gap is calculated by subtracting Male Democrats from Male Republicans. A difference in proportions test was used to determine if these gaps are significant. Significance levels: ***=p<.001, **=p<.01, *=p<.05, +=p<.10.
Less likely to
vote for McCain
It didn't make
a difference
More likely to
vote for McCain
% % %
Total 19.0 64.2 16.8
Male Democrat 29.0 67.9 3.1
Female Democrat 33.1 63.9 3.0
Male Republican 2.6 60.7 36.8
Female Republican 2.2 67.4 30.3
Male Independent 15.6 59.4 25.0
Female Independent 12.5 58.3 29.2
Democrat Gender Gap 4.1 -4.1 0.0
Republican Gender Gap -0.3 6.7 -6.4
Independent Gender Gap -3.1 -1.0 4.2
Female Partisan Gap -30.9** 3.6 27.3**
Male Partisan Gap -26.4** -7.3 33.7**

88
Table 3-7. Effects of Minnesotans’ Gender and Party Identification on Presidential Vote Choice and Evaluations of Sarah Palin’s Performance in the Vice Presidential Debate
Method: Vote for McCain = Logistic Regression; Palin’s Performance in the Debate = Ordinal Logistic Regression. Question Wording: If the 2008 presidential election were being held today, would you vote for … Democrat Barack Obama or Republican John McCain? (If Don’t Know or Refused, ask: As of today, who do you lean more towards?); Does Palin's performance in the debate make you more or less likely to vote for McCain, or didn't it make a difference? Notes: Dependent Variables are listed across the top of the table. For Vote for McCain, 0 = No, and 1 = Yes. For Palin’s Performance in the Debate, 0 = Less Likely to Vote for Him, 1 = It didn’t make a difference, and 2 = More Likely to Vote for Him. Two models were run for each dependent variable. Model 2 includes all variables of Model 1 in addition to interaction variables between party and gender. Entries are beta coefficients with standard errors in parentheses. Significance levels: ***=p<.001, **=p<.01, *=p<.05, +=p<.10.
(1) (2) (1) (2)
Female -.74* -0.80+ -.35+ -0.32
(.31) (.46) (.21) (.31)
Republican 5.07*** 5.15*** 2.10*** 2.19***
(.40) (.54) (.32) (.38)
Independent 2.73*** 2.56*** 1.54*** 1.24*
(.41) (.52) (.40) (.52)
Republican x Female -0.14 -0.20
(.73) (.44)
Independent x Female 0.40 0.67
(.76) (.73)
Age -.28+ -0.28+ .21* 0.20+
(.16) (.16) (.10) (.10)
Income .03 0.03 .05 0.05
(.14) (.14) (.10) (.10)
Education -.18 -0.19 -.32* -0.33*
(.21) (.21) (.15) (.15)
Evangelical .16 0.18 -.12 -0.09
(.32) (.32) (.23) (.24)
McCain Ideology About Right 3.02*** 3.03*** .72*** 0.74**
(.35) (.35) (.26) (.26)
Constant -2.71*** -2.68***
(.56) (.58)
[palinperf = .00] -.67* -0.68+
(.35) (.37)
[palinperf = 1.00] 3.14*** 3.14***
(.41) (.43)
N 723 723 394 394
Cox and Snell R2 .616 .617 .274 .277
Palin's Performance
in the DebateVote for McCain

89
Table 3-8. Effects of Minnesotans’ Ratings of Sarah Palin on Presidential Vote Choice and Evaluations of her Performance in the Vice Presidential Debate
(1) (2) (1) (2)
Palin Cares 1.08 -0.61 2.22*** 2.22**
(.97) (1.18) (.62) (.86)
Palin Honest 3.77*** 5.34*** 0.91+ 0.89
(.99) (1.62) (.55) (.87)
Palin Experience 5.91*** 4.03** 0.67+ 1.01*
(1.68) (1.53) (.35) (.47)
Palin Ideology About Right 2.17* 1.97 0.33 0.34
(.91) (1.27) (.40) (.51)
Female -1.74* -4.69+ -0.46+ -0.19
(.81) (2.55) (.25) (.37)
Palin Cares x Female 5.08+ -0.06
(2.81) (1.09)
Palin Honest x Female -2.36 -0.11
(2.36) (1.09)
Palin Experience x Female 19.08 -0.77
(3425.5) (.70)
Palin Ideology About Right x 0.45 0.13
Female (2.09) (.82)
Republican 4.97*** 5.80*** 0.09 0.17
(1.00) (1.23) (.43) (.44)
Independent 2.79** 3.58** -0.43 -0.42
(1.11) (1.41) (.55) (.57)
Age 0.54 0.43 0.22+ 0.21+
(.34) (.36) (.13) (.13)
Income 0.70* 0.85* 0.14 0.14
(.34) (.38) (.12) (.12)
Education 0.57 0.41 -0.17 -0.19
(.48) (.56) (.18) (.18)
Evangelical -1.53+ -1.94+ 0.08 0.08
(.92) (1.01) (.27) (.27)
McCain Ideology About Right 2.70*** 2.81** -0.18 -0.14
(.78) (.90) (.33) (.33)
Constant -10.27*** -10.47***
(2.08) (2.21)
[palinperf = .00] -0.11 0.03
(.41) (.42)
[palinperf = 1.00] 4.53*** 4.68***
(.59) (.60)
N 567 567 307 307
Cox and Snell R2 .715 .718 .377 .382
Vote for McCainPalin's Performance
in the Debate

90
Method: Vote for McCain = Logistic Regression; Palin’s Performance in the Debate = Ordinal Regression. Question Wording: If the 2008 presidential election were being held today, would you vote for … Democrat Barack Obama or Republican John McCain? (If Don’t Know or Refused, ask: As of today, who do you lean more towards?); Does Palin's performance in the debate make you more or less likely to vote for McCain, or didn't it make a difference? Notes: Dependent Variables are listed across the top of the table. For Vote for McCain, 0 = No, and 1 = Yes. For Palin’s Performance in the Debate, 0 = Less likely to vote for him, 1 = It didn’t make a difference, and 2 = More likely to vote for him. Two models were run for each dependent variable. Model 2 includes all variables of Model 1 in addition to interaction variables between trait ratings and gender. Entries are beta coefficients with standard errors in parentheses. Significance levels: ***=p<.001, **=p<.01, *=p<.05, +=p<.10.

91
Chapter Four
Opinions of Sarah Palin Among the Nation’s Women
The previous chapter illustrates how Minnesotans’ gender and party identification
shape their perceptions of Sarah Palin’s traits, ideology, and overall evaluations. Party
identification is the strongest predictor, with gender playing a lesser role. Furthermore, the
differences in how Gopher State residents rate Palin on her traits and ideology have a
significant impact on overall evaluations. Those who view Sarah Palin as honest,
experiences, and ideologically about right were more likely to vote for McCain, and those
who viewed her as caring, honest, and experienced were more likely to vote for McCain
after viewing Palin’s performance in the vice presidential debate.
While Minnesota makes a good case study for opinions of Sarah Palin because of its
status as a battleground state and its demonstrated support for a female candidate for
federal office, it is an open question as to whether the findings presented in the previous
chapter apply to the nation as a whole. This chapter will sharpen the analyses put forth in
Chapter Three, by focusing on the relationship between party, traits, and candidate
evaluations among a national sample of women.
The central puzzle of this project is to determine how voters react to the competing
stereotypes that conservative female Republican candidates must endure. As a female
candidate, they are subject to a set of feminine stereotypes, but as a Republican candidate,
they are subject to an opposing set of masculine stereotypes. Which stereotypes do voters
apply, and how does that differ based on their own gender or partisan identity? Research
conducted in this area prior to this study indicates that partisan stereotypes plays a more
significant role in evaluations than gender stereotypes, so much so that “voters regard a

92
Republican woman politician as a Republican first and a woman second” (Huddy and
Capelos 2002, 47). Studies have even shown that there is no evidence that gender
stereotypes come into play among Republican candidates (King and Matland 2003).
In this chapter, I focus solely on women, and specifically on the differences between
Republican and Democratic women in the electorate. Do women in the electorate share a
social identity with female candidates, regardless of that woman’s party identification? Is it
possible that they are more likely to use gender stereotypes than partisan stereotypes as a
result of this shared identify, or do the effects of party identification overwhelm gender
stereotypes? In addition, what stereotypical traits are related to overall evaluations? Do
high ratings on feminine traits impact overall vote choice, for example, or do high ratings on
Republican traits have a larger effect? Is this relationship moderated by party (i.e. is the
relationship between trait ratings and overall evaluations different for Republicans and
Democrats)?
To answer these questions, an examination of ratings of Palin’s traits will be
conducted on the dimensions of women viewing her as being understanding, personally
identifiable, prepared to take over the Presidency, and prepared to be commander-in-
chief.33 Respondents were asked to rate Sarah Palin on a scale of ‘not at all’ to ‘a great deal’
on two traits: how well she understands the everyday concerns and needs of people and
how much they personally identify with her values and life experiences. On the two
preparedness trait questions – preparedness to take over the Presidency and preparedness
33 Question wording: How well does Sarah Palin understand the everyday concerns and needs of people like yourself – a great deal, some, not much, or not at all?; How much do you personally identify with the everyday life experiences and values of Sarah Palin – a great deal, some, not much, or not at all?; Regardless of who you’re voting for, which Vice Presidential candidate, Joe Biden, the Democrat, or Sarah Palin, the Republican, would be best prepared to take over the Presidency if that were necessary?; And which Vice Presidential candidate, Joe Biden, the Democrat, or Sarah Palin, the Republican, would be best prepared to be commander-in-chief?

93
to be commander-in-chief – respondents were asked to compare Sarah Palin to Democratic
Vice Presidential nominee Joe Biden.
Another dimension will also be analyzed, that of differences in policy position
agreement, specifically on the issues of creationism and evolution, abortion, the right to
bear arms, drilling for oil and gas, global warming, and the war in Iraq.34 These measures
will be implemented in a model to determine the size of the partisan gap in issue agreement
as well as in how much salience these agreements have for overall evaluations of Palin. The
evaluation measures in this chapter are presidential vote choice, favorability of Sarah Palin,
and the impact of McCain’s choice of Palin as his vice presidential running mate on vote for
McCain.35
In selecting a national public opinion survey for this chapter, I undertook a
comprehensive search of all surveys conducted by the leading academic and industry
pollsters during the final months before the 2008 presidential election. Eighty-five surveys
conducted between August 29 and November 4, 2008 mentioned Sarah Palin in one or more
questions. In some cases, this was as simple as including her name as vice presidential
candidate in the presidential horse race question; other surveys asked a battery of
questions related to Palin’s opinions, actions, and media coverage. However, only one
survey asked the range of question necessary to allow for a thorough examination of female
34 Please tell me whether you personally agree or disagree with Sarah Palin’s positions on the following issues. Do you agree or disagree with her position? Palin supports teaching of both creationism and evolution in public schools; She opposes abortion in all cases, including rape and incest, except when the life of the mother is in danger; Palin supports the right to bear arms, including handguns; She favors more drilling for oil and gas, including in the Arctic wildlife refuge; She does not believe that global warming is caused by humans; Palin supports the war in Iraq 35 Question Wording: If the Presidential election were held today and the candidates were Barack
Obama and Joe Biden, the Democrats, and John McCain and Sarah Palin, the Republicans, and you had to choose, for whom would you vote?; Based on what you’ve seen or heard, do you have a favorable or unfavorable opinion of Sarah Palin?; Did John McCain’s choice of Sarah Palin as his running mate make you less likely to vote for McCain, more likely, or didn’t it make much difference to you?

94
voters’ reactions to Sarah Palin generally, and to her traits and policy positions more
specifically.
Time Magazine conducted a survey of 913 female likely voters between September
11-15, 2008.36 Respondents were interviewed via landlines and cellular telephones. The
survey was fielded by Abt SRBI, a full-service global strategy and research organization
specializing in public policy and opinion surveys. Abt SRBI has an established track record
of providing high quality, timely and cost effective research and analysis.37 The data set was
made available through the Roper Center for Public Opinion Research at the University of
Connecticut.
I. Trait Ratings and Policy Position Agreement
A. Introduction
As discussed in the previous chapter, voters are faced with multiple cues when
evaluating a candidate. Two of these are the social stereotypes based on the candidate’s
gender and party, and a conflict emerges when a candidate is both female and Republican.
While women are typically seen as more compassionate, warm, and kind, GOP candidates
are typically viewed as being stronger leaders and having less compassion and empathy
than Democratic candidates (I. K. Broverman, Vogel, D. M. Broverman, Clarkson, and
Rosenkrantz 1972; Deaux and Lewis 1984; Hayes 2005; McKee and Sherriffs 1957; Spence,
Helmreich, and Stapp 1974; Williams and Best 1982).
In addition to cues based on social stereotypes, voters also weigh a candidate’s
ideology and positions on policy issues. The public opinion survey analyzed in this chapter
36 The full sample size of the survey is 1,290 women. All of these women were asked demographic questions. However, only those who indicated they were registered and would likely or definitely vote in the 2008 Presidential Election were given the full survey. 37 http://www.srbi.com/what_we_do.html

95
asks respondents a series of six policy issue questions – specifically, whether or not they
personally agree with Sarah Palin’s position on the issues of creationism and evolution,
abortion, the right to bear arms, drilling for oil and gas, global warming, and the war in
Iraq.38
The policy issues men and women find important are different, and research has
shown that the substantive political opinions of men and women are increasingly disparate
(Erskine 1971; Smith 1984). Women are more likely to be concerned with ‘women’s issues,’
and social welfare policy, specifically services and issues that directly affect their rights and
the rights of children such as abortion, child care, education, parental leave, sexual
harassment, and women’s rights (Dolan 1998; Sapiro 1981; Schlozman, Burns, Verba, and
Donahue 1995; Schumaker and Burns 1988). One such women’s issue, abortion, is
examined in this chapter. Respondents are asked whether they agree with Palin’s
opposition to abortion in all cases, including rape and incest, except when the life of the
mother is in danger.
Another of the policy positions in this study is support for the war in Iraq. Research
has shown that women are less militaristic than men and have demonstrated greater
opposition to war. There are sizable and persistent gender differences in attitudes toward
issues involving the use of force, though gender differences are most pronounced when
women are asked about specific military involvement, as opposed to hypothetical scenarios
for the use of force (Conover and Sapiro 1993; Shapiro and Mahajan 1986).
38 Please tell me whether you personally agree or disagree with Sarah Palin’s positions on the following issues. Do you agree or disagree with her position? Palin supports teaching of both creationism and evolution in public schools; She opposes abortion in all cases, including rape and incest, except when the life of the mother is in danger; Palin supports the right to bear arms, including handguns; She favors more drilling for oil and gas, including in the Arctic wildlife refuge; She does not believe that global warming is caused by humans; Palin supports the war in Iraq

96
Because the survey being utilized in this study is of female respondents only, it is
impossible to determine whether or not there is a gender gap on these issues. However, it is
possible to look at partisan gaps as well as to see if these issues are significant in shaping
overall evaluations of Sarah Palin..
B. Results
Research Question #7. What are the opinions of the nation’s women in regards to Sarah Palin’s
traits and policy positions? How do these opinions vary by party identification?
Respondents were asked a total of four trait questions focusing on the dimensions of
being understanding, personally identifiable, prepared to take over the Presidency, and
prepared to be commander-in-chief. 39 As a whole, women rated Sarah Palin highly on the
feminine trait of understanding and on the dimension of being personally identifiable. Palin
did less well on the masculine traits of preparedness, though it is possible the differences
between the feminine and masculine traits are a result of question type and not
stereotyping. The feminine trait of understanding is measured on a scale, while the
masculine traits are asked in comparison to Biden. Both Democrats and Republicans rated
Palin less well on the masculine traits than the feminine trait, and the gap between the
parties was larger on the masculine traits.
Overall, 40.3 percent of respondents felt the feminine traits of understanding
described Palin a great deal, 32.1 percent felt this described her some, while 10 percent felt 39 Question wording: How well does Sarah Palin understand the everyday concerns and needs of people like yourself – a great deal, some, not much, or not at all?; How much do you personally identify with the everyday life experiences and values of Sarah Palin – a great deal, some, not much, or not at all?; Regardless of who you’re voting for, which Vice Presidential candidate, Joe Biden, the Democrat, or Sarah Palin, the Republican, would be best prepared to take over the Presidency if that were necessary?; And which Vice Presidential candidate, Joe Biden, the Democrat, or Sarah Palin, the Republican, would be best prepared to be commander-in-chief?

97
not much and 18 percent felt it did not describe her at all (see Table 4-1). A second trait
question asked respondents whether they personally identified with Palin’s everyday life
experiences and values. This interpersonal trait is neither feminine nor masculine, but does
provide additional insight into women’s views of Sarah Palin. When asked if this trait
described Palin, 30 percent said a great deal, 35.7 percent said some, 11.9 percent said not
much, and 22.4 percent said not at all. Respondents were also asked two masculine,
performance-based traits – prepared to take over the Presidency and prepared to be
Commander in Chief. In these two questions, respondents were asked to rate Palin
compared to Joe Biden. In both instances, Palin was thought to greater display the trait by
only about 40 percent of the women sampled (see Table 4-2).40
There are stark differences as to how Palin was perceived on each of these measures
along party lines. Republicans were more likely to think Palin is understanding: 95.6
percent of Republican women felt the phrase “understands the everyday concerns and
needs of people like yourself” described Palin some or a great deal, compared to only 53.6
percent of Democratic women. Likewise, 91.1 percent of Republican women felt they could
“personally identify with her everyday life experiences and values” some or a great deal,
while only 44.3 percent of Democratic women feel this is true. There were even greater
gaps between the parties on the two masculine stereotype traits. Republicans felt Palin was
“prepared to take over the presidency” and “prepared to be Commander in Chief” by 77.1
and 76.2 percent respectively, while Democrats held these beliefs 11.9 and 13.1 percent of
the time.
40 This section utilizes crosstabs between party identification and the trait ratings and policy position agreement measures. These gaps were then tested for significance using a difference in proportions test.

98
Table 4-3 shows that majorities of Republican women agreed with Sarah Palin on
the six policy issues in the survey: 89.8 percent support more drilling for oil and gas, 86.3
percent support the right to bear arms, 85.5 percent support the war in Iraq, 59.3 percent
oppose abortion in all cases, 57.7 percent favor teaching creationism alongside evolution in
public schools, and 50.8 percent do not believe global warming is caused by humans.41
Conversely, a majority of Democratic women disagreed with Palin on every measure. Only
45.4 percent support the right to bear arms, 38.3 percent favor teaching creationism
alongside evolution in public schools, 33.6 percent support more drilling for oil and gas,
13.7 percent support the war in Iraq, 13.7 percent oppose abortion in all cases, and 5.6
percent do not believe global warming is caused by humans. Because there are more
Democrats in the sample, which mirrors the American public at large whereby the majority
of women belong to the Democratic Party, the majority of women in the total sample of
respondents only agree with Sarah Palin on three of the six issues – teaching creationism
alongside evolution in public schools, the right to bear arms, and more drilling for oil and
gas.
Research Question #8. Does a woman’s party identification have a significant effect on her
ratings of Palin’s traits and agreement with Palin’s policy positions, controlling for other
demographic and socioeconomic factors?
41 Please tell me whether you personally agree or disagree with Sarah Palin’s positions on the following issues. Do you agree or disagree with her position? Palin supports teaching of both creationism and evolution in public schools; She opposes abortion in all cases, including rape and incest, except when the life of the mother is in danger; Palin supports the right to bear arms, including handguns; She favors more drilling for oil and gas, including in the Arctic wildlife refuge; She does not believe that global warming is caused by humans; Palin supports the war in Iraq

99
The descriptive statistics employed in the previous section show that a woman’s
party identification is strongly related to the trait ratings of and policy position agreement
with Sarah Palin, though there are some differences among the two party’s use of feminine
and masculine stereotypes. In order to more fully test the relationship between women’s
party identification and their ratings of Sarah Palin as being understanding, personally
identifiable, prepared to be vice president, and prepared to be Commander in Chief, as well
as agreement with her policy positions, I ran a series of regression models. The results show
that party identification is indeed a strong predictor of trait ratings of Sarah Palin, on both
the feminine and masculine stereotypical traits.
In order to see if the relationship between party identification and trait ratings
remains strong when controlling for other demographic and socioeconomic variables, I
used the four trait ratings and six policy issues discussed previously as dependent variables
in regression models. Because the traits of understanding and being personally identifiable
were answered on a four-part scale ranging from “none” to “a great deal”, these models use
OLS regression. Since the traits concerning preparedness to be vice president and
preparedness to be Commander in Chief were asked vis-à-vis Joe Biden, these models use
logistic regression. Logistic regression was also used when designating any of the six policy
issues as the dependent variable.
The independent variable in these models is party identification as a Republican,
with Democrats as the reference group. In addition, several control variables are included:
dummy variables for race, evangelicalism, and conservativism; and categorical variables for
age, income, and education.
Table 4-4 shows that Republican women were significantly more likely to rate Palin
as having all four of the traits tested. Being Republican is associated with an increase in the

100
ratings of Palin as understanding and personally identifiable by .86 and .83 points
respectively, giving Palin a boost almost equal to one whole rating category. In addition,
being Republican is associated with an increase in the ratings of Palin as prepared to be vice
president and prepared to be Commander in Chief by a factor of 11.5 and 10.2 respectively.
Similarly, table 4-5 shows that being Republican is associated with an increase in
agreeing with Sarah Palin on all six policy issues. This is not surprising, since she holds the
party-line Republican view on these issues, and one would expect Republicans in the
electorate to share many of the same viewpoints. It is interesting, however, to note the
differences in agreement among the issues. On one end of the scale, agreeing with Palin on
creationism, abortion, and the right to bear arms is increased by a factor of between four
and five for Republicans. On the other end, agreeing with Palin on drilling, global warming,
and the war in Iraq are increased by factors of 9.1, 8.3, and 16.4 respectively.
II. Candidate Evaluations
A. Introduction
Three measures of overall candidate evaluation were asked in this sample. First,
respondents were asked which presidential candidate they would vote for if the election
were held that day.42 As discussed in Chapter Three, research has shown that vice
presidential candidates are able to make a difference in presidential vote choice (Wattenberg
1984, 1995). Secondly, respondents were asked whether or not they had a favorable view of
Sarah Palin.43 This question is the most direct test of opinions toward the Republican Vice
Presidential nominee. Thirdly, respondents were asked if John McCain’s choice of Sarah
42 Question Wording: If the Presidential election were held today and the candidates were Barack
Obama and Joe Biden, the Democrats, and John McCain and Sarah Palin, the Republicans, and you had to choose, for whom would you vote? 43 Question Wording: Based on what you’ve seen or heard, do you have a favorable or unfavorable
opinion of Sarah Palin?

101
Palin as his running mate made them less likely to vote for McCain, more likely, or if didn’t
make much difference.44
This section has two main goals. The first is to examine the partisan differences
among women in their overall evaluations of Sarah Palin. These partisan differences are
expected to be quite large, as partisanship plays a significant role in shaping candidate
evaluations (Huddy and Capelos 2002; King and Matland 2003). The second goal is to study
the impact of the trait ratings and policy position agreement discussed earlier on overall
evaluations of Palin in order to determine which traits and issues have the largest impact
and whether or not party identification moderates this relationship. Is the relationship
between trait ratings and overall evaluations different for Republicans and Democrats?
B. Results
Research Question #9. Is there a partisan gap among women in vote for McCain, favorability of
Sarah Palin, and opinion of McCain’s choice of Palin?
The four research questions posed in this section use three separate measures of
overall evaluation of Sarah Palin – presidential vote choice, favorability of Sarah Palin, and
the impact of McCain’s choice of Palin as his vice presidential running mate on vote for
McCain.45 The first step employed to determine the relationship between party
identification and overall candidate evaluations is a set of crosstabs, used to examine how
44 Question Wording: Did John McCain’s choice of Sarah Palin as his running mate make you less
likely to vote for McCain, more likely, or didn’t it make much difference to you?
45 Question Wording: If the Presidential election were held today and the candidates were Barack
Obama and Joe Biden, the Democrats, and John McCain and Sarah Palin, the Republicans, and you had to choose, for whom would you vote?; Based on what you’ve seen or heard, do you have a favorable or unfavorable opinion of Sarah Palin?; Did John McCain’s choice of Sarah Palin as his running mate make you less likely to vote for McCain, more likely, or didn’t it make much difference to you?

102
responses vary by the respondent’s party identification. Based on the literature on the
strong role party identification plays in shaping candidate evaluations, as well as the results
of this project so far, it is expected that there will be large differences among the two party’s
responses. The results show that to be the case (see Table 4-6).
In total, 49 percent of the women in the sample said they would vote for McCain,
62.6 percent said they held a favorable opinion of Sarah Palin, and 32.3 percent said they
were more likely to vote for McCain as a result of his choice of Palin as vice presidential
running mate. There are significant differences in these measures among the opinions of
Republicans and Democrats. The Republicans were 79 percentage points more likely than
Democrats to vote for McCain (92.2 to 13.2 percent). In addition Republicans were 84.4
percentage points more likely to vote for McCain than Obama, and Democrats were 73.6
percentage points more likely to vote for Obama.
Respondents who identified as Republican were also much more likely to hold a
favorable view of Sarah Palin than those who identified themselves as Democrats (62.6 to
33.2 percent). Palin’s net favorability rating was 87.6 percent for Republicans and -33.6
percent for Democrats. For many respondents of both parties, McCain’s choice of Palin did
not make much of a difference in their voting behavior. However, a slight majority of
Republicans did say they were more likely to reward McCain for his choice of Palin (53.4
percent). This was 39.6 percentage points higher than the percentage of Democrats who
said McCain’s vice presidential selection made them more likely to vote for him (13.8
percent). In fact, a third of Democrats said they were even less likely to vote for McCain
because of his choice (33.9 percent).

103
Research Question #10.What is the effect of party on vote for McCain, favorability of Sarah
Palin, and opinion of McCain’s choice of Palin, controlling for demographic and socioeconomic
factors?
Having established through the use of crosstabs that there are significant
differences in the overall evaluations of Sarah Palin by Republicans and Democrats, the next
step in examining the relationship between party identification and evaluations is to use
regression models. These models control for other factors that have been shown to be
related to vote choice and other measures of candidate evaluation. Specifically, controls for
race, evangelicalism, conservativism, age, income, and education are included. In addition,
when vote for McCain is the dependent variable, a measure of McCain’s favorability is
included as a control since candidate favorability has a large impact on vote choice.46
Of the three overall evaluation questions asked to respondents concerning Sarah
Palin, two are dummy variables (vote for McCain and Palin favorability), and therefore
require the use of logistic regression. The third measure, impact of McCain’s choice of Palin
as running mate on presidential vote choice, has ordered responses, ranging from making
voters “less likely” to vote for McCain, to having “no difference” in their vote, to “more
likely” to vote for McCain. Thus, ordinal logistic regression is used.
Table 4-7 shows the results of three regression models, one for each of the three
measures of overall evaluation. Being a Republican is significantly associated with all three
dependent variables. Party identification has the strongest effect on vote for McCain.
Republicans are more likely to vote for McCain by a factor of 37.5. In addition, Republicans
46 Question Wording: Based on what you’ve seen or heard, do you have a favorable or unfavorable opinion of John McCain?

104
are more likely to hold a favorable view of Sarah Palin by a factor of 10.9, and are more
likely to vote for McCain as a result of his vice presidential pick (b=1.59).
Research Question #11. To what extent do trait ratings have a significant effect on overall
evaluations of Palin? Are the relationships between trait ratings and overall evaluations
moderated by party?
The opinions of Minnesotans examined in the previous chapter showed that
residents of the Gopher State used trait ratings in their overall evaluations of Sarah Palin.
The relationship between trait ratings of Palin and overall evaluations of her were
significant in most cases, and the relationship between the masculine trait of experience
and one candidate evaluation measure, Palin’s performance in the vice presidential debate,
varied by party identification. Democrats who rated Palin as experienced were more likely
than those who did not rate her as experienced to reward McCain for Palin’s performance in
the debate, but there was no relationship between opinions on Palin’s experience and her
performance in the debate for Republicans
Are there similar relationships between trait ratings and overall evaluations of Palin
among the nation’s women? Do ratings of Sarah Palin’s traits have a significant relationship
with overall evaluations? Does this relationship differ for masculine and feminine traits, or
based on the party identification of the respondent?
To answer these questions, I ran three regression models, one for each of the overall
evaluation measures, with each of the four trait ratings as an independent variable. The
results as shown in Table 4-8 indicate that rating Palin highly on any of the trait ratings,
does indeed, have a positive effect on overall evaluations. Specifically, the traits of

105
understanding, preparedness to be vice president, and preparedness to be Commander in
Chief have a positive impact on vote for McCain, while understanding, being personally
identifiable, and preparedness to be vice president have a positive impact on Palin’s
favorability rating. All four traits have a positive impact on McCain’s choice of Palin as his
vice presidential running mate.
The two masculine traits of being prepared to be vice president and commander in
chief have the strongest relationship with overall evaluations. Believing that Palin was
prepared to be vice president has the largest relative impact of the four traits on vote for
McCain (b=3.2, sig at the .001 level) and favorable ratings of Palin (b=4.87, sig at the .001
level). Believing Palin was ready to be Commander in Chief if necessary has the largest
impact on McCain’s choice of Palin as a reason to be more likely to vote for him (b=.94, sig at
the .01 level). The feminine trait of understanding is highly and significantly associated with
ratings of Palin unrelated to vote choice. Those who rated Palin as understanding were
more likely to have a favorable opinion of her (b=1.2, sig at the .001 level). In addition,
believing Palin was someone that one could personally identify with also increased her
favorable ratings (b=.97, sig at the .001 level).
At first blush, these findings make intuitive sense. If a woman in the electorate rates
Palin highly on her characteristics, she is likely to also rate her highly in general, and vice
versa. However, these findings are nonetheless revealing in several respects. First, even
while controlling for a host of factors that predict vote choice, the characteristics of the vice
presidential candidate have significant and sizeable effects on vote choice. Second, while
important to overall ratings, the feminine trait of understanding does not have as large of an
impact as the masculine traits dealing with her preparedness for office. Third, and perhaps
most strikingly, for two of the overall evaluation measures, favorability of Palin and

106
McCain’s choice of Palin, including trait ratings of Palin in the model wipes out the strong
effects of party identification seen previously. This is likely due, at least in part, to the strong
relationship between party identification and trait ratings established earlier in this
chapter. However, it is striking that party identification remains a significant predictor of
vote for McCain, even when including all four trait ratings in the model.
Do these relationships between trait ratings and overall support for Palin differ
among Republicans and Democrats? To answer this question, I ran a reduced version of the
model, with the addition of interaction terms.47 The results show two significant
interactions (see Table 4-9). For Republicans, being able to identify with Palin on a personal
level is a significant predictor of whether or not McCain’s choice of Palin makes one more
likely to vote for him (b=1.04, sig at the .01 level). This relationship is also significant for
Democrats, but at a significantly lower magnitude (b=.33, sig at the .01 level). Additionally,
believing Palin was prepared to be Commander in Chief was a strong predictor of whether
or not to reward McCain for his choice of Palin for Democrats (b=2.70, sig at the .001 level),
but was not significant for Republicans.
The relationship between rating Palin highly on the masculine trait of preparedness
to be Commander in Chief and rewarding McCain for his choice of Palin mirrors the finding
from the Minnesota survey that the relationship between the masculine trait of experience
and rewarding McCain for Palin’s performance in the vice presidential debate was
significant for Democrats but not Republicans.
47 A fully specified model was also run. The results were very similar. However, problems with multicollinearity among the independent variables made the use of a reduced model more appropriate.

107
Research Question #12. To what extent does policy issue agreement have a significant effect on
overall evaluations of Palin? Are the relationships between policy issue agreement and overall
evaluations moderated by party?
As in the previous research question, answering this querying required the use of
three regression models, one for each of the overall evaluation measures. Instead of ratings
of Sarah Palin’s traits, this section focuses on the impact of policy position agreement on
overall evaluations. There are six models in total, one for each of the policy issues included
in the survey. The results shown in Table 4-10 indicate that agreeing with Palin on any of
these issues has a positive effect on overall evaluations. Specifically, the issues of abortion,
drilling, global warming, and the war in Iraq have a positive impact on vote for McCain,
while all six traits have a positive impact on Palin’s favorability rating. Creationism,
abortion, drilling, and the war in Iraq have a positive impact on rewarding McCain for his
choice of Palin as his vice presidential running mate.
Agreeing with Palin on the war in Iraq is the largest predictor of the six issues for all
three measures of overall candidate evaluation. Supporting the war in Iraq is associated
with a greater likelihood of voting for McCain (b=2.1, sig at the .001 level), holding a
favorable opinion of Sarah Palin (b=1.8, sig at the .001 level), and rewarding McCain for his
vice presidential pick (b=.93, sig at the .001 level). Agreeing with Palin on support for
drilling has the next largest impact on the three measures. The only feminine issue among
the six is that of abortion, which Palin opposes under most circumstances. Agreeing with
Palin on this issue was related to all three measures, but only weakly so for Palin’s
favorability and McCain’s choice of Palin.

108
In a reduced model that includes interactions between two of the issues – abortion
and the war in Iraq – and party identification, there was one significant difference in how
policy position agreement affects overall evaluations for Republicans and Democrats (see
Table 4-11).48 The issue of abortion operated differently for Republicans and Democrats as
it relates to McCain’s choice of Palin. Democrats who agreed with Palin on the issue of
abortion were more likely to reward McCain for his choice of her as vice president (b=1.05,
sig at the .001 level), but this relationship was not significant for Republicans.
Research Question #13. Is policy issue agreement more important in overall candidate ratings
than candidate traits or gender? Does this differ among Democrats and Republicans?
The previous sections have shown that both trait ratings and policy issue agreement
have been shown to be significant in women’s evaluations of Sarah Palin. It would be
interesting to see which of the two makes more of an impact – are there stronger
relationships between trait ratings and candidate evaluations, or between policy position
agreement and candidate evaluations. However, including all of these variables in one
model and drawing comparisons about statistical impact is not easy due to the relationships
among the independent variables – trait ratings, policy agreement, and partisan
identification. Another way to test the relative impact of each is through a question that
directly asks women which is more important in their favorability rating of Sarah Palin, her
personal qualities (i.e. traits) or her policy positions. In this national sample of women,
immediately after rating Palin, respondents were asked which was more important in their
48 A fully specified model was also run. The results were very similar. However, problems with multicollinearity among the independent variables made the use of a reduced model more appropriate.

109
favorable or unfavorable rating – her personal qualities such as her experience, family life
and leadership qualities or her positions on specific issues.49
Overall, the women were nearly equally split between thinking Palin’s positions on
specific issues or her personal qualities were more important in determining their
favorability ratings (51.9 to 48.1 percent; see Table 4-12). Republicans were also equally
split, with 49.2 percent saying Palin’s issue positions were more important, and 50.8
percent saying her personal qualities mattered more in their rating. The gap for Democrats
was slightly larger, with a majority believing Palin’s positions were more important (55.6 to
44.4 percent).
When controlling for other factors in a logistic regression model (age, income,
education, race, evangelicalism, and conservatism), party identification does not have a
significant effect on whether the respondent thought personal qualities or issue positions
were more important. However, when examining Palin’s favorability ratings as a dependent
variable, believing Palin’s personal qualities were more important is significant. Those who
thought Palin’s personal qualities mattered more than her issue positions were more likely
to rate Palin favorably by a factor of 2.88 (see Table 4-13). There are no interaction effects
between party identification and thinking Palin’s personal qualities mattered more.
Is the candidate’s gender more important than policy issue agreement? While not
asked about Palin specifically, respondents were asked whether they felt they should try to
support a female candidate for office, even if they did not agree on many issues.50 The
overwhelming majority of women responded that gender does not matter (95.5 percent).
49 Which is more important to you in your (favorable or unfavorable) rating of Sarah Palin – her personal qualities such as her experience, family life and leadership qualities or her positions on specific issues? 50 In general, do you feel that you should try to support a female candidate for office, even if you don’t agree with the female candidate on many issues, or doesn’t the gender of the candidate really matter to you?

110
Only 4.5 percent of women said one should try to support a female candidate for office, even
if one does not agree with them on many issues. Democrats were slightly more likely than
Republicans to believe this was true (6.4 percent to 2.8 percent). Despite this small
difference between Democrats and Republicans, in a logistic regression model, party is a
significant predictor of believing one should vote for the female candidate. Republicans are
less likely to believe gender should matter by a factor of .25, controlling for other variables.
Believing one should vote for female candidates, regardless of issue positions, is not
significantly related to favorability ratings of Sarah Palin (results not shown in table).
III. Discussion
Research has shown that women candidates are typically seen as more
compassionate, warm, and kind, and Republican candidates are typically viewed as being
stronger leaders and having less compassion and empathy than Democratic candidates. In
this study of Sarah Palin’s traits, I have found that a majority of women did in fact feel that
the feminine trait of understanding described Sarah Palin either some or a great deal. In
addition, a majority of women thought Palin was someone they could relate to on a personal
level. On the masculine traits, also associated with GOP candidates, preparedness to be vice
president and preparedness to be Commander in Chief, 40 percent of women felt these
traits applied more towards Palin, while 60 percent felt they applied more towards Biden.
There were significant gaps between Republicans and Democrats on all four traits, with
Republicans having a much more positive view of Palin’s traits. This partisan gap was larger
on the masculine traits than the feminine traits.
Rating Palin higher than Biden on any of the four trait ratings has a positive effect on
overall evaluations, and this relationship varies by party. For Republican women, being able

111
to identify with Palin on a personal level is a significant predictor of whether or not
McCain’s choice of Palin makes one more likely to vote for him, but does not have a
significant impact for Democratic women. Conversely, believing Palin was prepared to be
Commander in Chief was a strong predictor of whether or not to reward McCain for his
choice of Palin for Democrats, but was not significant for Republicans.
This study confirmed that female voters also weigh a candidate’s ideology and
positions on policy issues. Women have historically been concerned with ‘women’s issues,’
and social welfare policy, specifically services and issues that directly affect their rights and
the rights of children. One such issue is abortion. The data from the Time survey shows that
33.5 percent of respondents agreed with Palin in opposing abortion in most cases.
Republicans were more likely to agree with Palin than Democrats (59.3 to 13.7 percent).
Agreeing with Palin’s on the issue of abortion was significantly related to an increase in vote
for McCain, Palin favorability, and rewarding McCain for his choice of Palin. This issue
operated differently for Republicans and Democrats. Democrats who agreed with Palin on
the issue of abortion were more likely to reward McCain for his choice of her as his vice
presidential running mate, but this relationship was not significant for Republicans.
Research has also shown that women are less militaristic than men and have
demonstrated greater opposition to war, especially when asked about specific military
involvement. Overall 45.2 percent of the sample agreed with Palin’s position of supporting
the war in Iraq, including 85.5 percent of Republicans and 13.7 percent of Democrats.
Agreeing with Palin on the war in Iraq was the largest predictor of the six issues studied for
all three measures of overall candidate evaluation. Supporting the war in Iraq is associated
with a greater likelihood of voting for McCain, holding a favorable opinion of Sarah Palin,
and rewarding McCain for his vice presidential pick.

112
When asked directly whether policy issues or the personal qualities of Sarah Palin
were more important in their favorability rating of her, half of the women stated policy
issues and half stated personal qualities, with Democrats a little more likely to say that her
positions were more important in their ratings. This study also found policy issue
agreement to be much more important to women than voting for a candidate solely because
she is female, at least in the abstract. Less than five percent of women said they felt they
should try to support a female candidate for office, even if they don’t agree with her on
many issues. These five percent of women were not more likely to rate Palin as favorable
than those who believed gender does not matter.
IV. Conclusion
In this chapter, I have shown that women’s party identification shape their
perceptions of Sarah Palin’s traits and policy issue agreement. In addition, there is a strong
relationship between party identification and overall evaluations, but this relationship is
overshadowed when trait ratings or policy position agreement are included in the model.
The strong, significant effects of party identification on overall evaluations disappear on
measures of Palin’s favorability measure and opinions of McCain’s choice of Palin, but
remain significant on vote for McCain.
Both traits and policy position agreement have a significant impact on overall
evaluations of Palin. And while the effects of party remain directly significant on vote for
McCain in the presence of these variables, it appears they are indirectly significant for
evaluations of McCain’s choice of Palin as his vice presidential running mate on issue
positions, and, to a lesser extent, trait ratings. Different traits and policy issues have
significant impacts on McCain’s choice of Palin for Republicans and Democrats.

113
Finally, data in this chapter shows that women of both parties are equally split
between saying Palin’s personal qualities and policy positions were more important in their
ratings of her.

114
Table 4-1. Women’s’ Trait Ratings of Sarah Palin on Being Understanding and Personally Identifiable
Method: Crosstabs. Question Wording: How well do each of the following candidates understand the everyday concerns and needs of people like yourself - a great deal, some, not much, or not at all?; How much do YOU personally identify with the everyday life experiences and values of Sarah Palin – a great deal, some, not much, or not at all? Notes: Partisan Gap is calculated by subtracting the percentage of Democrats giving a response from the percentage of Republicans giving that same response. A difference in proportions test was used to determine if the partisan gap is significant. Significance levels: ***=p<.001, **=p<.01, *=p<.05, +=p<.10.
Not at all Not Much SomeA Great
Deal
% % % %
Understands the everyday
concerns and needs of people
like yourself
17.5 10.1 32.1 40.3
Republican 2.9 1.4 25.7 69.9
Independent 13.8 16.1 32.2 37.9
Democrat 30.4 16.0 37.3 16.3
Partisan Gap -27.5 -14.6 -11.6 53.6
Personally identify with her
everyday life experiences and
values
22.4 11.9 35.7 30.0
Republican 3.8 5.2 37.3 53.8
Independent 22.5 7.9 37.1 32.6
Democrat 37.5 18.2 34.2 10.1
Partisan Gap -33.7 -13.0 3.1 43.7

115
Table 4-2. Women’s’ Trait Ratings of Sarah Palin on Preparedness
Method: Crosstabs. Question Wording: Regardless of who you’re voting for, which Vice Presidential candidate, Joe Biden, the Democrat, or Sarah Palin, the Republican, would be best prepared to take over the Presidency if that were necessary?; And which Vice Presidential candidate, Joe Biden, the Democrat, or Sarah Palin, the Republican, would be best prepared to be commander-in-chief? Notes: Palin Advantage is calculated by subtracting the percentage of respondents saying the trait applies more to Biden from the percentage of respondents saying the trait applies more to Palin. Partisan Gap is calculated by subtracting the percentage of Democrats giving a response from the percentage of Republicans giving that same response. A difference in proportions test was used to determine if the partisan gap is significant. Significance levels: ***=p<.001, **=p<.01, *=p<.05, +=p<.10.
Palin BidenPalin
Advantage
% % %
Prepared to take over the Presidency 40.0 60.0 -20.0
Republican 77.1 22.9 54.2
Independent 46.6 53.4 -6.8
Democrat 11.9 88.1 -76.2
Partisan Gap 65.2***
Prepared to be Commander in Chief 39.6 60.4 -20.8
Republican 76.2 23.8 52.4
Independent 38.7 61.3 -22.6
Democrat 13.1 86.9 -73.8
Partisan Gap 63.1***

116
Table 4-3. Women’s Agreement with Sarah Palin’s Policy Positions
Method: Crosstabs.
Agree Disagree Difference
% % %
Favors teaching creationism and
evolution in public schools57.7 42.3 15.4
Republican 80.3 19.7 60.6
Independent 65.1 34.9 30.2
Democrat 38.3 61.7 -23.4
Partisan Gap 42.0***
Opposes abortion in all cases 33.5 66.5 -33.0
Republican 59.3 40.7 18.6
Independent 31.5 68.5 -37.0
Democrat 13.7 86.3 -72.6
Partisan Gap 45.6***
Supports the right to bear arms 64.4 35.6 28.8
Republican 86.3 13.7 72.6
Independent 71.1 28.9 42.2
Democrat 45.4 54.6 -9.2
Partisan Gap 40.9***
Favors more drilling for oil and gas 58.6 41.1 17.5
Republican 89.8 10.2 79.6
Independent 56.7 43.3 13.4
Democrat 33.6 66.4 -32.8
Partisan Gap 56.2***
Does not believe global warming is
caused by humans24.6 75.4 -50.8
Republican 50.8 49.2 1.6
Independent 23.5 76.5 -53.0
Democrat 5.6 94.4 -88.8
Partisan Gap 45.2***
Supports the war in Iraq 45.2 54.8 -9.6
Republican 85.5 14.5 71.0
Independent 44.6 55.4 -10.8
Democrat 13.7 86.3 -72.6
Partisan Gap 71.8***

117
Question Wording: Please tell me whether you personally agree or disagree with Sarah Palin’s positions on the following issues. Do you agree or disagree with her position?
a. Palin supports teaching of both creationism and evolution in public schools b. She opposes abortion in all cases, including rape and incest, except when the life of the
mother is in danger c. Palin supports the right to bear arms, including handguns d. She favors more drilling for oil and gas, including in the Arctic wildlife refuge e. She does not believe that global warming is caused by humans f. Palin supports the war in Iraq
Notes: Difference is calculated by subtracting the percentage of respondents who disagree with Palin’s policy position from the percentage of respondents who agree with Palin’s policy position. Partisan Gap is calculated by subtracting the percentage of Democrats giving a response from the percentage of Republicans giving that same response. A difference in proportions test was used to determine if the partisan gap is significant. Significance levels: ***=p<.001, **=p<.01, *=p<.05, +=p<.10.

118
Table 4-4. Effects of Party Identification on Women’s Ratings of Sarah Palin’s Traits
Method: 1. OLS Regression; 2. Logistic Regression. Question Wording: How well do each of the following candidates understand the everyday concerns and needs of people like yourself - a great deal, some, not much, or not at all?; How much do YOU personally identify with the everyday life experiences and values of Sarah Palin – a great deal, some, not much, or not at all?; Regardless of who you’re voting for, which Vice Presidential candidate, Joe Biden, the Democrat, or Sarah Palin, the Republican, would be best prepared to take over the Presidency if that were necessary?; And which Vice Presidential candidate, Joe Biden, the Democrat, or Sarah Palin, the Republican, would be best prepared to be commander-in-chief? Notes: Dependent Variables are listed across the top of the table. For the first two dependent variables, 0 = Not at all, 1 = Not much, 2 = Some, and 3 = A great deal. For the last two dependent variables, 0 = this trait applies more to Biden, and 1 = this trait applies more to Palin. Entries are beta coefficients with standard errors in parentheses. Significance levels: ***=p<.001, **=p<.01, *=p<.05, +=p<.10.
Understanding1
Personally
Identifiable1
Prepared to be
Vice President2
Prepared to be
Commander in
Chief2
Republican .86*** .83*** 2.45*** 2.33***
(.08) (.09) (.24) (.23)
Independent .37** .49*** 1.62*** 1.07***
(.12) (.12) (.35) (.33)
Age -.03 -.05 -.36** -.17
(.04) (.04) (.12) (.11)
Income .02 .03 .05 .02
(.02) (.02) (.07) (.07)
Education -.05 -.01 -.23 .02
(.05) (.05) (.14) (.14)
White .46*** .27** 1.19*** .71**
(.09) (.09) (.29) (.27)
Evangelical .16* .28*** .76*** .32
(.08) (.08) (.23) (.22)
Conservative .17*** .21*** .73*** .73***
(.03) (.04) (.11) (.11)
Constant .81*** .57*** -3.90*** -3.79***
(.13) (.13) (.47) (.44)
N 728 738 762 758
R2 .316 .312 .413 .376

119
Table 4-5. Effects of Party Identification on Women’s Agreement with Sarah Palin’s Policy Positions
Method: Logistic Regression. Question Wording: Please tell me whether you personally agree or disagree with Sarah Palin’s positions on the following issues. Do you agree or disagree with her position?
a. Palin supports teaching of both creationism and evolution in public schools b. She opposes abortion in all cases, including rape and incest, except when the life of the
mother is in danger c. Palin supports the right to bear arms, including handguns d. She favors more drilling for oil and gas, including in the Arctic wildlife refuge e. She does not believe that global warming is caused by humans f. Palin supports the war in Iraq
Notes: Dependent Variables are listed across the top of the table. For all dependent variables, 0 = Disagree, and 1 = Agree. Entries are beta coefficients with standard errors in parentheses. Significance levels: ***=p<.001, **=p<.01, *=p<.05, +=p<.10.
Creationism AbortionRight to
Bear ArmsDrilling
Global
WarmingWar in Iraq
Republican 1.45*** 1.60*** 1.58*** 2.21*** 2.12*** 2.80***
(.21) (.22) (.23) (.24) (.28) (.24)
Independent 1.07*** .74* .98*** .71** 1.01* 1.33***
(.29) (.33) (.30) (.29) (.42) (.33)
Age -.17+ -.03 -.31** .28** .01 .10
(.09) (.10) (.10) (.10) (.12) (.13)
Income -.10+ -.12+ .04 .04 .12+ .23**
(.06) (.06) (.06) (.06) (.07) (.07)
Education -.04 .13 -.16 -.38** -.26+ -.12
(.12) (.13) (.12) (.13) (.15) (.15)
White .48* .55* .93*** .68** .83** 1.14***
(.21) (.25) (.22) (.23) (.33) (.29)
Evangelical .14 1.11*** .41* .58** .59** .25
(.18) (.20) (.20) (.21) (.22) (.24)
Conservative .37*** .69*** .21* .44*** .77*** .93***
(.09) (.10) (.09) (.09) (.12) (.12)
Constant -.96** -3.94*** -.68* -2.35*** -5.45*** -5.38***
(.33) (.43) (.34) (.38) (.56) (.53)
N 799 816 807 797 779 800
R2 .188 .293 .196 .329 .301 .467

120
Table 4-6. Women’s Evaluations of Presidential Vote Choice, Favorability of Sarah Palin, and John McCain’s Choice of Sarah Palin by Party Identification
Method: Crosstabs. Question Wording: If the Presidential election were held today and the candidates were Barack Obama and Joe Biden, the Democrats, and John McCain and Sarah Palin, the Republicans, and you had to choose, for whom would you vote?; Based on what you’ve seen or heard, do you have a favorable or unfavorable opinion of Sarah Palin?; Did John McCain’s choice of Sarah Palin as his running mate make you less likely to vote for McCain, more likely, or didn’t it make much difference to you? Notes: McCain Advantage is calculated by subtracting the percentage of respondents saying they would vote for Obama from the percentage of respondents saying they would vote for McCain. Partisan Gap is calculated by subtracting the percentage of Democrats giving a response from the percentage of Republicans giving that same response. A difference in proportions test was used to determine if the partisan gap is significant. Significance levels: ***=p<.001, **=p<.01, *=p<.05, +=p<.10.
Presidential Vote Choice: McCain ObamaMcCain
Advantage
% % %
Total 49.0 51.0 -2.0
Republican 92.2 7.8 84.4
Independent 52.2 47.8 4.4
Democrat 13.2 86.8 -73.6
Partisan Gap 79.0***
Palin Favorability: Favorable Unfavorable Net Favorable
% % %
Total 62.6 37.4 25.2
Republican 93.8 6.2 87.6
Independent 66.2 33.8 32.4
Democrat 33.2 66.8 -33.6
Partisan Gap 60.6***
McCain's Choice of Palin: Less LikelyNot Much
DifferenceMore Likely
% % %
Total 20.5 47.2 32.3
Republican 4.3 42.3 53.4
Independent 18.9 41.1 40.0
Democrat 33.9 52.3 13.8
Partisan Gap -29.6 -10.0 39.6

121
Table 4-7. Effects of Party Identification on Women’s Evaluations of Presidential Vote Choice, Favorability of Sarah Palin, and John McCain’s Choice of Sarah Palin
Method: 1. Logistic Regression; 2. Ordinal Logistic Regression. Question Wording: If the Presidential election were held today and the candidates were Barack Obama and Joe Biden, the Democrats, and John McCain and Sarah Palin, the Republicans, and you had to choose, for whom would you vote?; Based on what you’ve seen or heard, do you have a favorable or unfavorable opinion of Sarah Palin?; Did John McCain’s choice of Sarah Palin as his running mate make you less likely to vote for McCain, more likely, or didn’t it make much difference to you? Notes: Dependent Variables are listed across the top of the table. For Vote for McCain, 0 = No, and 1 = Yes. For Palin Favorability, 0 = Unfavorable, and 1 = Favorable. For McCain’s Choice of Palin, 0 = Less likely, 1 = Not much difference, and 2 = More likely. Entries are beta coefficients with standard errors in parentheses. Significance levels: ***=p<.001, **=p<.01, *=p<.05, +=p<.10.
Republican 3.63*** 2.39*** 1.59***
(.44) (.27) (.19)
Independent 2.35*** 1.03*** 1.18***
(.58) (.32) (.26)
Age -.34+ -.26* -.26***
(.20) (.12) (.08)
Income .15 .06 -.02
(.12) (.07) (.05)
Education .14 -.24+ -.03
(.24) (.15) (.10)
White 1.70*** 1.35*** .35+
(.51) (.27) (.19)
Evangelical .87* .50*** .21
(.39) (.23) (.16)
Conservative 1.15*** .67*** .40***
(.20) (.11) (.08)
McCain Favorability 4.68***
(.51)
Constant -9.29*** -2.51***
(1.06) (.43)
[McCain's Choice = .00] -.19
(.28)
[McCain's Choice = 1.00] 2.41***
(.30)
N 728 740 751
Cox and Snell R2
.649 .379 249
Vote for McCain1
Palin
Favorability1
McCain's choice
of Palin2

122
Table 4-8. Effects of Ratings of Sarah Palin’s Traits on Women’s Evaluations of Presidential Vote Choice, Favorability of Sarah Palin, and John McCain’s Choice of Sarah Palin
Method: 1. Logistic Regression; 2. Ordinal Logistic Regression. Question Wording: If the Presidential election were held today and the candidates were Barack Obama and Joe Biden, the Democrats, and John McCain and Sarah Palin, the Republicans, and you had to choose, for whom would you vote?; Based on what you’ve seen or heard, do you have a favorable
Palin Understands .68+ 1.16*** .70***
(.38) (.23) (.12)
Palin Personally Identifiable -.06 .97*** .22*
(.35) (.22) (.12)
Palin Prepared to be 3.20*** 4.87*** .68+
Vice President (.91) (1.37) (.39)
Palin Prepared to be 1.48+ -.25 .94**
Commander in Chief (.86) (.82) (.38)
Republican 2.92*** .72 .31
(.63) (.48) (.24)
Independent 1.61+ .43 .65*
(.87) (.62) (.32)
Age .01 -.11 -.18+
(.32) (.20) (.09)
Income .21 .01 -.09
(.18) (.12) (.06)
Education .70+ -.21 .05
(.43) (.25) (.12)
White 1.60* .60 -.17
(.78) (.46) (.22)
Evangelical -.32 -.07 -.13
(.62) (.41) (.19)
Conservative 1.31*** .49** .20*
(.29) (.17) (.09)
McCain Favorability 4.23***
(.78)
Constant -13.05*** -5.34***
(2.02) (.83)
[McCain's Choice = .00] .33
(.33)
[McCain's Choice = 1.00] 3.62***
(.38)
N 632 642 636
Cox and Snell R2 .697 .613 .431
Vote for McCain1
Palin
Favorability1
McCain's choice
of Palin2

123
or unfavorable opinion of Sarah Palin?; Did John McCain’s choice of Sarah Palin as his running mate make you less likely to vote for McCain, more likely, or didn’t it make much difference to you? Notes: Dependent Variables are listed across the top of the table. For Vote for McCain, 0 = No, and 1 = Yes. For Palin Favorability, 0 = Unfavorable, and 1 = Favorable. For McCain’s Choice of Palin, 0 = Less likely, 1 = Not much difference, and 2 = More likely. Entries are beta coefficients with standard errors in parentheses. Significance levels: ***=p<.001, **=p<.01, *=p<.05, +=p<.10.

124
Table 4-9. Effects of Party Identification and Ratings of Sarah Palin’s Traits on Women’s Evaluations of Presidential Vote Choice, Favorability of Sarah Palin, and John McCain’s Choice of Sarah Palin
Palin Personally Identifiable .28 1.42*** .33**
(.38) (.22) (.12)
Palin Prepared to be 3.62*** 2.41*** 2.61***
Commander in Chief (.79) (.64) (.38)
Palin Personally Identifiable x .06 -.08 .71***
Republican (.59) (.40) (.22)
Palin Prepared to be Commander 1.07 .46 -2.15***
in Chief x Republican (1.56) (1.01) (.50)
Palin Personally Identifiable x .41 .70 .21
Independent (.87) (.71) (.30)
Palin Prepared to be Commander -.97 .57 .13
in Chief x Independent (1.61) (1.79) (.80)
Republican 2.97** 1.11 .32
(1.15) (.75) (.45)
Independent 1.33 -.77 .29
(1.77) (1.43) (.52)
Age -.26 -.05 -.20*
(.27) (.16) (.09)
Income .19 .02 -.09+
(.17) (.10) (.05)
Education .31 -.44* .00
(.36) (.21) (.11)
White 2.12** 1.43*** .11
(.73) (.39) (.20)
Evangelical .09 .07 -.10
(.53) (.33) (.18)
Conservative 1.10*** .33* .21**
(.26) (.15) (.09)
McCain Favorability 4.29***
(.74)
Constant -11.15*** -4.21***
(1.60) (.68)
[McCain's Choice = .00] -.23
(.32)
[McCain's Choice = 1.00] 3.03***
(.36)
N 657 671 670
Cox and Snell R2 .688 .563 .412
McCain's choice
of Palin2Vote for McCain
1Palin
Favorability1

125
Method: 1. Logistic Regression; 2. Ordinal Logistic Regression. Question Wording: If the Presidential election were held today and the candidates were Barack Obama and Joe Biden, the Democrats, and John McCain and Sarah Palin, the Republicans, and you had to choose, for whom would you vote?; Based on what you’ve seen or heard, do you have a favorable or unfavorable opinion of Sarah Palin?; Did John McCain’s choice of Sarah Palin as his running mate make you less likely to vote for McCain, more likely, or didn’t it make much difference to you? Notes: Dependent Variables are listed across the top of the table. For Vote for McCain, 0 = No, and 1 = Yes. For Palin Favorability, 0 = Unfavorable, and 1 = Favorable. For McCain’s Choice of Palin, 0 = Less likely, 1 = Not much difference, and 2 = More likely. Entries are beta coefficients with standard errors in parentheses. Significance levels: ***=p<.001, **=p<.01, *=p<.05, +=p<.10.

126
Table 4-10. Effects of Policy Position Agreement with Sarah Palin on Women’s Evaluations of Presidential Vote Choice, Favorability of Sarah Palin, and John McCain’s Choice of Sarah Palin
Method: 1. Logistic Regression; 2. Ordinal Logistic Regression.
Creationism .19 1.02*** .73***
(.54) (.29) (.19)
Abortion 1.60** .66+ .35+
(.63) (.38) (.22)
Right to Bear Arms .13 .74** .31
(.57) (.29) (.20)
Drilling 1.74** 1.28*** .91***
(.59) (.31) (.23)
Global Warming 2.14* .86+ .14
(1.06) (.49) (.24)
War in Iraq 2.06*** 1.84*** .93***
(.58) (.39) (.26)
Republican 1.46* .07 .25
(.66) (.45) (.26)
Independent 1.47+ -.02 .79**
(.84) (.45) (.31)
Age -.57+ -.35* -.26**
(.30) (.16) (.09)
Income .25 .10 .03
(.18) (.09) (.06)
Education .40 -.27 -.03
(.38) (.20) (.11)
White 2.16** 1.17*** .10
(.78) (.36) (.21)
Evangelical .34 .16 .12
(.58) (.31) (.18)
Conservative .55* .25+ .13
(.27) (.14) (.09)
McCain Favorability 4.57***
(.81)
Constant -10.51*** -3.14***
(1.67) (.59)
[McCain's Choice = .00] -.04
(.34)
[McCain's Choice = 1.00] 3.04***
(.37)
N 610 620 626
Cox and Snell R2
.687 .511 .348
Vote for McCain1
Palin
Favorability1
McCain's choice
of Palin2

127
Question Wording: If the Presidential election were held today and the candidates were Barack Obama and Joe Biden, the Democrats, and John McCain and Sarah Palin, the Republicans, and you had to choose, for whom would you vote?; Based on what you’ve seen or heard, do you have a favorable or unfavorable opinion of Sarah Palin?; Did John McCain’s choice of Sarah Palin as his running mate make you less likely to vote for McCain, more likely, or didn’t it make much difference to you? Notes: Dependent Variables are listed across the top of the table. For Vote for McCain, 0 = No, and 1 = Yes. For Palin Favorability, 0 = Unfavorable, and 1 = Favorable. For McCain’s Choice of Palin, 0 = Less likely, 1 = Not much difference, and 2 = More likely. Entries are beta coefficients with standard errors in parentheses. Significance levels: ***=p<.001, **=p<.01, *=p<.05, +=p<.10.

128
Table 4-11. Effects of Party Identification and Policy Position Agreement with Sarah Palin on Women’s Evaluations of Presidential Vote Choice, Favorability of Sarah Palin, and John McCain’s Choice of Sarah Palin
Abortion 1.72** .72+ 1.40***
(.65) (.42) (.32)
War in Iraq 1.83*** 1.95*** .95**
(.54) (.42) (.32)
Abortion x -.08 .52 -1.57***
Republican (1.21) (.74) (.41)
War in Iraq x -.24 .95 .07
Republican (1.00) (.70) (.47)
Abortion x -1.60 19.90 -1.29+
Independent (2.04) (9224.00) (.76)
War in Iraq x 1.75 .58 1.65*
Independent (1.81) (1.08) (.69)
Republican 3.25*** .68 1.57***
(.81) (.43) (.35)
Independent 1.55+ .25 .64+
(.86) (.45) (.36)
Age -.54* -.39** -.30***
(.25) (.13) (.09)
Income .10 .02 -.03
(.15) (.08) (.05)
Education .26 -.33* .01
(.29) (.17) (.10)
White 2.02** 1.34*** .19
(.64) (.31) (.20)
Evangelical .68 .40 .18
(.48) (.27) (.17)
Conservative .67** .35** .23**
(.23) (.12) (.08)
McCain Favorability 4.16***
(.64)
Constant -8.73*** -1.84***
(1.26) (.46)
[McCain's Choice = .00] -.43
(.31)
[McCain's Choice = 1.00] 2.44***
(.33)
N 696 708 713
Cox and Snell R2 .671 .458 .318
McCain's choice
of Palin2Vote for McCain
1Palin
Favorability1

129
Method: 1. Logistic Regression; 2. Ordinal Logistic Regression. Question Wording: If the Presidential election were held today and the candidates were Barack Obama and Joe Biden, the Democrats, and John McCain and Sarah Palin, the Republicans, and you had to choose, for whom would you vote?; Based on what you’ve seen or heard, do you have a favorable or unfavorable opinion of Sarah Palin?; Did John McCain’s choice of Sarah Palin as his running mate make you less likely to vote for McCain, more likely, or didn’t it make much difference to you? Notes: Dependent Variables are listed across the top of the table. For Vote for McCain, 0 = No, and 1 = Yes. For Palin Favorability, 0 = Unfavorable, and 1 = Favorable. For McCain’s Choice of Palin, 0 = Less likely, 1 = Not much difference, and 2 = More likely. Entries are beta coefficients with standard errors in parentheses. Significance levels: ***=p<.001, **=p<.01, *=p<.05, +=p<.10.

130
Table 4-12. Women’s Reason for Rating of Sarah Palin and Opinions about Supporting Female Candidates
Method: Crosstabs. Question Wording: Which is more important to you in your rating of Sarah Palin (her personal qualities such as her experience, family life and leadership qualities) or (her positions on specific issues)?; In general, do you feel that you should try to support a female candidate for office, even if you don’t agree with the female candidate on many issues, or doesn’t the gender of the candidate really matter to you? Notes: Partisan Gap is calculated by subtracting the percentage of Democrats giving a response from the percentage of Republicans giving that same response. A difference in proportions test was used to determine if the partisan gap is significant. Significance levels: ***=p<.001, **=p<.01, *=p<.05, +=p<.10.
Reason for Rating of Palin:Her Positions on Specific
IssuesHer Personal Qualities
% %
Total 51.9 48.1
Republican 49.2 50.8
Independent 44.2 55.8
Democrat 55.6 44.4
Partisan Gap -6.4
Supporting Female
Candidates:Gender Doesn't Matter
Should Try to Support
Female Candidates
% %
Total 95.5 4.5
Republican 97.2 2.8
Independent 97.8 2.2
Democrat 93.6 6.4
Partisan Gap 3.6

131
Table 4-13. Effects of Saying Personal Qualities Were More Important in Favorability Rating of Palin on Having a Favorable Opinion of Sarah Palin
Method: Logistic Regression. Question Wording: Based on what you’ve seen or heard, do you have a favorable or unfavorable opinion of Sarah Palin? Notes: For Dependent Variable, 0 = Unfavorable, and 1 = Favorable. Two models were run. Model 2 includes all variables of Model 1 in addition to interaction variables between party and feeling personal qualities were more important in favorability rating of Sarah Palin. Entries are beta coefficients with standard errors in parentheses. Significance levels: ***=p<.001, **=p<.01, *=p<.05, +=p<.10.
(1) (2)
Personal Qualities More Important 1.06*** 1.08***
(.24) (.29)
Republican 2.16*** 2.14***
(.29) (.36)
Independent .92* 1.09*
(.40) (.56)
Personal Qualities More Important x .09
Republican (.60)
Personal Qualities More Important x -.36
Inependent (.79)
Age -.26* -.27*
(.13) (.13)
Income .11 .10
(.08) (.08)
Education -.32* -.32+
(.16) (.16)
White 1.64*** 1.64***
(.31) (.31)
Evangelical .56* .57*
(.26) (.26)
Conservative .55*** .55***
(.12) (.12)
Constant -3.00*** -2.99***
(.50) (.51)
N 578 578
Cox and Snell R2 .377 .377
Palin Favorability

132
Chapter Five
Conclusion
Female politicians make up a small percentage of representatives at the local, state,
and national levels, and gains in female representation have mostly occurred within the
Democratic Party. Currently, 77 percent of women in Congress hail from the Democratic
Party (72 of 93). Still, prominent conservative female politicians like Sarah Palin have
become more common over the past few decades, as increased levels of partisan
polarization at the elite and mass levels had led women of both parties to become more and
more extreme ideologically. Indeed, the two parties are growing more and more
homogenous in their policy positions, and the differences between their stands on major
policy issues are expanding (Aldrich 1995; Coleman 1997; Fleisher and John R. Bond 2004;
Roberts and S. S. Smith 2003; Stonecash, Brewer, and Mariani 2003). In fact, the two
political parties in the U.S. Congress are as ideologically divergent as they have been at any
point during the last three decades (Theriault 2003).
This finding was borne out in my analysis of National Journal rankings, which
revealed how Congresswomen have become more polarized since the early 1980s. The
average conservative composite ranking of Republican female Representatives has
increased gradually from 54.9 in 1981 to 74.9 in 2008. This 36 percent increase means that
Republican women have, on average, moved from being in the ideological center of the
House to being more conservative than 75 percent of the other members of Congress.
Similarly, the average liberal composite ranking of female Representatives in the
Democratic Party has increased from 72.4 in 1981 to 79.8 in 2008.

133
Given the increased polarization of female candidates, and the rise in conservative
female Republican candidates it has precipitated, the goal of this project was to examine
voter reactions to one such conservative female candidate, Sarah Palin. Specifically, it
examined how voters’ own gender and party identification shape evaluations of a
conservative female candidate’s traits and ideology, as well as the impact of each on vote
choice and candidate evaluation. I was able to address these questions by utilizing two
public opinion surveys conducted in the months preceding the 2008 presidential election.
One, a survey of Minnesotans, was selected because of the Gopher state’s status as a
battleground state and demonstrated support for a female candidate for federal office, as
well as the timing of the survey around the vice presidential debate. The other, a survey of a
national sample of women, was the only poll conducted that posed the range of questions
necessary to conduct a thorough examination of female voters’ reactions to Sarah Palin
generally, as well as to her traits and policy positions specifically.
The Minnesota data revealed that a citizen’s gender and party identification shape
their perceptions of Sarah Palin’s traits, ideology, and overall evaluations. While party
identification is the strongest predictor, gender did have some impact. Furthermore, the
differences in how Palin is rated on her traits and ideology had significant impacts on
overall evaluations of her, as measured by presidential vote choice and evaluations of her
performance in the vice presidential debate. Nationally, women’s party identification
shapes their perceptions of Sarah Palin’s traits, policy issue agreement, and overall
evaluations. Both traits and policy position agreement have a significant impact on overall
evaluations of Palin, as measured by vote choice, favorability ratings, and increased
likelihood of voting for McCain as a result of his choice of Palin for his vice presidential

134
running mate. In addition, women are equally split between saying Palin’s personal
qualities and policy positions were more important in their ratings of her.
Implications
This study has two important implications. Firstly, ratings of the traits and ideology
of vice presidential candidate matter for outcome of the presidential race. Secondly, while
party is a main driver of candidate evaluation, opinions on traits also contribute to overall
evaluations, and do so in different ways for Democratic and Republican women.
Palin’s effect on the presidential campaign could be seen immediately in the
horserace polls that between John McCain’s announcement of her as his running mate
through her speech at the Republican National Convention. Palin made her presence felt at
every stop along the way. Research has shown that a vice presidential candidate can serve
one of two purposes – solidifying the base or reaching out to independents and more
moderate voters, and adding Palin to the ticket was clearly an attempt at the former
(Goldstein 1982; Natoli 1985; Nelson 1988).
Scholarly work has shown that vice presidential candidates can make a difference in
presidential outcomes. Studies conducted at the individual level of analysis on the impact of
vice presidential candidates on vote choice have found that voter evaluation of the vice
presidential candidates contributed about 0.75 percent toward the national presidential
vote margin from 1952 to 1980, generated about one-half the influence as presidential
candidate evaluations and party identification, and was approximately one-and-a-half times
as impactful as ideological influences on vote choice (Wattenberg 1984). Moreover, in the
presidential elections taking place between 1968 and 1992, voters were substantially
influenced by their evaluations of vice presidential nominees: voters with split presidential

135
and vice presidential preferences were more likely to defect from their preferred
presidential candidate than those with consistent evaluations (Wattenberg 1995).
This study has shown that ratings of Palin’s traits were important predictors of vote
choice for both Minnesotans and women across the nation. Minnesotans who viewed Palin
as honest, experienced, and ideologically about right were more likely to vote for McCain.
Furthermore, ratings operated differently for men and women. In particular, the trait of
caring was salient for women, but not for men. Women who rated Palin as caring were more
likely than women who did not rate her as such to vote for McCain, but there was no
significant difference in vote for McCain among men who rated Palin as caring and those
who did not. There were also differences between the ways Republicans and Democrats
used traits in their vote choice. Republicans who thought Palin’s ideology was about right
were more likely than those who thought she was more extreme to vote for McCain, but this
relationship was not significant for Democrats.
Nationally, rating Palin as understanding, prepared to be vice president, and
prepared to be Commander in Chief each have a positive impact on vote for McCain. All four
traits studied – the three above in addition to Palin being personally identifiable – had a
positive relationship with being more likely to vote for McCain as a result of his choice of
Palin as his vice presidential running mate. These relationships varied by party for two of
the traits. For Republican women, being able to identify with Palin on a personal level was a
significant predictor of whether or not McCain’s choice of Palin makes one more likely to
vote for him, but does not have a significant impact for Democratic women. Conversely,
believing Palin was prepared to be Commander in Chief was a strong predictor of whether
or not to reward McCain for his choice of Palin for Democrats, but was not significant for
Republicans.

136
Future Research
There are three areas in which this research could benefit from further exploration,
and all three deal with expanding the data to be studied. Firstly, this project deals with only
one candidate, Sarah Palin. This ‘n’ of one does not allow larger statements to be made
about enduring patterns of behavior by the electorate. Though Palin is a prominent example
of a recent conservative female candidate running for a national office, expanding the study
to look at others would help to suss out whether the findings from this study are applicable
to a broader group of female candidates.
Secondly, there are male and female stereotypes that could not be tested with the
available data. Conducting a study with a fuller litany of both feminine and masculine traits
would give greater insight into how candidates are perceived. Similarly, one measure that is
closely related to traits that was not studied in this project is the difference in how male and
female candidates are rated on their perceived ability to handle certain issues. Research has
demonstrated that female candidates are more likely to be perceived as competent in
dealing with issues that revolve around poverty, women, and children. Conversely, men are
more likely to garner higher ratings in dealing with military issues and making decisions on
agricultural issues (Lawless 2004; Sapiro 1981). In addition to trait ratings, ideology
assessment, and policy position agreement, perceived candidate abilities could impact
overall evaluations along gendered lines.
Thirdly, there may be other factors that drive differences among female Democrats
and Republicans. One such example is feminism. Research has shown that holding feminist
values, and indeed, the process itself of becoming a feminist may “be a catalyst that helps
women recognize their underlying ‘female’ values” (Conover 1988, 1005) (1005). These

137
values may in turn affect how women use feminine values, traits, and issues to evaluate
candidates. In addition, this may not be limited to the manner in which women form
opinions. Scholarly examination of the relationship between feminist attitudes and policy
preferences suggests that a feminist perspective, consisting of egalitarian values and
generally liberal policies, is associated with distinctive values and policy preferences for
both men and women (Cook and Wilcox 1991).
In sum, there remains a lot to learn about female conservative politicians and
voters’ reactions to them. Much of what has been studied thus far has focused on the
challenges faced by Democratic female candidates in overcoming feminine stereotypes that
are not advantageous to them in elections. However, this case study of voter’s opinions and
attitudes about Sarah Palin has begun to offer insight on gender and partisan differences as
to how conservative Republican female politicians are perceived on both feminine and
masculine traits, as well as ideology and policy positions.

138
References
Abramowitz, Alan I., and Kyle L. Saunders. 1998. “Ideological Realignment in the U.S. Electorate.” Journal of Politics 60(3): 634-652.
Aldrich, John H. 1995. Why Parties?: The Origin and Transformation of Political Parties
in America. Chicago: The University of Chicago Press. Aldrich, John H., and David W. Rohde. 2000. “The Consequences of Party Organization
in the House: The Role of Majority and Minority Parties in Conditional Party Government.” In Polarized Politics: Congress and the President in a Partisan Era, eds. Jon R. Bond and Richard Fleisher. Washington, DC: CQ Press.
Alexander, Deborah, and Kristi Andersen. 1993. “Gender as a Factor in the Attribution of
Leadership Traits.” Political Research Quarterly 46(3): 527-545. Bartels, Larry M. 2000. “Partisanship and Voting Behavior, 1952-1996.” American
Journal of Political Science 44(1): 35-50. Bendyna, Mary E., and Celinda C. Lake. 1994. “Gender and Voting in the 1992
Presidential Election.” In The Year of the Woman: Myths and Realities, eds. Elizabeth Adell Cook, Sue Thomas, and Clyde Wilcox. Boulder, CO: Westview Press.
Boles, Janet K., and Katherine Scheurer. 2007. “Beyond Women, Children, and Families:
Gender, Representation, and Public Funding for the Arts.” Social Science Quarterly 88(1): 39-50.
Box-Steffensmeier, Janet M., and Suzanna De Boef. 2001. “Macropartisanship and
Macroideology in the Sophisticated Electorate.” Journal of Politics 63(1): 232-248.
Box-Steffensmeier, Janet M., Suzanna De Boef, and Tse-min Lin. 2004. “The Dynamics
of the Partisan Gender Gap.” American Political Science Review 98(3): 515-528. Broverman, Inge K. et al. 1972. “Sex-Role Stereotypes: A Current Appraisal.” Journal of
Social Issues 28: 59-78. Burrell, Barbara C. 1994. A Woman's Place Is in the House: Campaigning for Congress
in the Feminist Era. Ann Arbor, MI: University of Michigan Press. Carmines, Edward G., and James A. Stimson. 1989. Issue Evolution: Race and the
Transformation of American Politics. Princeton, NJ: Princeton University Press. Carroll, Susan J., ed. 2001. The Impact of Women in Public Office. Bloomington, IN:

139
Indiana University Press. Carroll, Susan J. 1988. “Women’s Autonomy and the Gender Gap: 1980 and 1982.” In
The Politics of the Gender Gap: The Social Construction of Political Influence, ed. Carol Mueller. Beverly Hills, CA: SAGE Publications.
Carsey, Thomas M., and Geoffrey C. Layman. 1999. “A Dynamic Model of Political
Change among Party Activists.” Political Behavior 21(1): 17-41. Carson, Jamie L. et al. 2007. “Redistricting and Party Polarization in the U.S. House of
Representatives.” American Politics Research 35(6): 878-904. Chodorow, Nancy. 1974. “Family Structure and Feminine Personality.” In Woman,
Culture, and Society, eds. Michelle Zimbalist Rosaldo, Louise Lamphere, and Joan Bamberger. Stanford, CA: Stanford University Press.
Clausen, Aage R. 1973. How Congressmen Decide: A Policy Focus. New York: St.
Martin's Press. CNN. 2008. “Exit Polls - Election Center 2008.” Available at:
http://www.cnn.com/ELECTION/2008/results/polls/#val=USP00p3 [Accessed October 10, 2009].
Coleman, John J. 1997. “The Decline and Resurgence of Congressional Party Conflict.”
Journal of Politics 59(1): 165-184. Collie, Melissa P., and John Lyman Mason. 2000. “The Electoral Connection Between
Party and Constituency Reconsidered: Evidence from the U.S. House of Representatives, 1972-1994.” In Continuity and Change in House Elections, eds. David W. Brady, John F. Cogan, and Morris P. Fiorina. Stanford, CA: Stanford University Press.
Conover, Pamela Johnston. 1988. “Feminists and the Gender Gap.” Journal of Politics
50(4): 985-1010. Conover, Pamela Johnston, and Virginia Sapiro. 1993. “Gender, Feminist Consciousness,
and War.” American Journal of Political Science 37(4): 1079-1099. Cook, Elizabeth Adell, and Clyde Wilcox. 1991. “Feminism and the Gender Gap - A
Second Look.” Journal of Politics 53(4): 1111-1122. Cook, Elizabeth Adell, and Clyde Wilcox. 1995. “Women Voters in the Year of the
Woman.” In Democracy's Feast: Elections in America, ed. Herbert F. Weisberg. Chatham, NJ: Chatham House.

140
Cummings, Jeanne. 2008. “RNC Shells out $150K for Palin Fashion.” Politico. Available at: http://www.politico.com/news/stories/1008/14805.html [Accessed July 9, 2009].
Davis, Otto A., Melvin J. Hinich, and Peter C. Ordeshook. 1970. “An Expository
Development of a Mathematical Model of the Electoral Process.” American Political Science Review 64(2): 426-448.
Deaux, Kay, and Laurie L. Lewis. 1984. “Structure of Gender Stereotypes:
Interrelationships Among Components and Gender Label.” Journal of Personality and Social Psychology 46(5): 991-1004.
DesignBay. 2008. “Obama's Logo Should Help Him Win | DesignBay.” Available at:
http://logo.designbay.com/articles/obamas-logo-beats-mccains-logo.aspx [Accessed July 4, 2009].
Dodson, Debra L. 1998. “Representing Women’s Interests in the US House of
Representatives.” In Women and Elective Office: Past, Present, and Future, eds. Sue Thomas and Clyde Wilcox. New York: Oxford University Press.
Dodson, Debra L. 2006. The Impact of Women in Congress. Oxford: Oxford University
Press. Dodson, Debra L., and Susan J. Carroll. 1991. Reshaping the Agenda: Women in State
Legislatures. New Brunswick, NJ: Center for American Women and Politics. Dolan, Kathleen. 2004. “The Impact of Candidate Sex on Evaluations of Candidates for
the U.S. House of Representatives.” Social Science Quarterly 85(1): 206-217. Dolan, Kathleen. 1998. “Voting for Women in the 'Year of the Woman'.” American
Journal of Political Science 42(1): 272-293. Downs, Anthony. 1957. An Economic Theory of Democracy. New York: Harper. Druckman, James N., Lawrence R. Jacobs, and Eric Ostermeier. 2004. “Candidate
Strategies to Prime Issues and Image.” Journal of Politics 66(4): 1180-1202. Dudley, Robert L., and Ronald B. Rapoport. 1989. “Vice-Presidential Candidates and the
Home State Advantage: Playing Second Banana at Home and on the Road.” American Journal of Political Science 33(2): 537-540.
Eagly, Alice H. 1987. Sex Differences in Social Behavior: A Social-Role Interpretation.
Hillsdale, NJ: L. Erlbaum Associates. Edlund, Lena, and Rohini Pande. 2002. “Why Have Women Become Left-Wing? The

141
Political Gender Gap and the Decline in Marriage.” Quarterly Journal of Economics 117(3): 917-961.
Edwards, George C. III, and Andrew Barrett. 2000. “Presidential Agenda Setting in
Congress.” In Polarized Politics: Congress and the President in a Partisan Era, eds. Jon R. Bond and Richard Fleisher. Washington, DC: CQ Press.
Epstein, Michael J., Richard G. Niemi, and Lynda W. Powell. 2005. “Do Women and
Men State Legislators Differ?” In Women and Elective Office: Past, Present, and Future, eds. Sue Thomas and Clyde Wilcox. New York: Oxford University Press.
Erskine, Hazel. 1971. “The Polls: Women's Role.” Public Opinion Quarterly 35(2): 275-
290. Evans, C. Lawrence, and Walter J. Oleszek. 1997. Congress Under Fire: Reform Politics
and the Republican Majority. Boston: Houghton Mifflin Company. Evans, Jocelyn Jones. 2005. Women, Partisanship, and the Congress. 1st ed. New York:
Palgrave Macmillan. Fenno, Richard F. 1977. “U.S. House Members in Their Constituencies: An
Exploration.” American Political Science Review 71(3): 883-917. Fleisher, Richard, and John R. Bond. 2004. “The Shrinking Middle in the US Congress.”
British Journal of Political Science 34(3): 429-451. Fleisher, Richard, and Jon R. Bond. 2000. “Partisanship and the President’s Quest for
Votes on the Floor of Congress.” In Polarized Politics: Congress and the President in a Partisan Era, eds. Jon R. Bond and Richard Fleisher. Washington, DC: CQ Press.
Frankovic, Kathleen A. 1982. “Sex and Politics: New Alignments, Old Issues.” PS:
Political Science and Politics 15(3): 439-448. Frederick, Brian. 2009. “Are Female House Members Still More Liberal in a Polarized
Era? The Conditional Nature of the Relationship Between Descriptive and Substantive Representation.” Congress & the Presidency: A Journal of Capital Studies 36(2): 181-202.
Funk, Carolyn L. 1999. “Bringing the Candidate into Models of Candidate Evaluation.”
Journal of Politics 61(3): 700-720. Gertzog, Irwin N. 2004. Women and Power on Capitol Hill: Reconstructing the
Congressional Women's Caucus. Boulder, CO: Lynne Rienner Publishers.

142
Gilens, Martin. 1988. “Gender and Support for Reagan: A Comprehensive Model of Presidential Approval.” American Journal of Political Science 32(1): 19-49.
Gimpel, James G. 1999. Separate Destinations: Migration, Immigration, and the Politics
of Places. Ann Arbor, MI: University of Michigan Press. Gimpel, James G., and Jason E. Schuknecht. 2001. “Interstate Migration and Electoral
Politics.” Journal of Politics 63(1): 207-231. Goldstein, Joel K. 1982. The Modern American Vice Presidency: The Transformation of
a Political Institution. Princeton, NJ: Princeton University Press. Greenberg, Anna. 2001. “Race, Religiosity, and the Women's Vote.” Women & Politics
22(3): 59-82. Hamill, Ruth, Milton Lodge, and Frederick Blake. 1985. “The Breadth, Depth, and
Utility of Class, Partisan, and Ideological Schemata.” American Journal of Political Science 29(4): 850-870.
Hayes, Danny. 2005. “Candidate Qualities through a Partisan Lens: A Theory of Trait
Ownership.” American Journal of Political Science 49(4): 908-923. Hibbing, John R., and Elizabeth Theiss-Morse. 1995. Congress as Public Enemy: Public
Attitudes Toward American Political Institutions. Cambridge: Cambridge University Press.
Hibbing, John R., and Elizabeth Theiss-Morse. 2002. Stealth Democracy Americans'
Beliefs About How Government Should Work. Cambridge: Cambridge University Press.
Hiller, Mark, and Douglas Kriner. 2008. “Institutional Change and the Dynamics of Vice
Presidential Selection.” Presidential Studies Quarterly 38(3): 401-421. Hinich, Melvin J., and Michael C. Munger. 1994. Ideology and the Theory of Political
Choice. Ann Arbor, MI: University of Michigan Press. Holbrook, Thomas M. 1991. “Presidential Elections in Space and Time.” American
Journal of Political Science 35(1): 91-109. Howell, Susan E., and Christine L. Day. 2000. “Complexities of the Gender Gap.”
Journal of Politics 62(3): 858-874. Huddy, Leonie, and Theresa Capelos. 2002. “Gender Stereotyping and Candidate
Evaluation: Good News and Bad News for Women Politicians.” In The Social Psychology of Politics, eds. Victor C. Ottati et al. New York: Klewer Academic /

143
Pienum Publishers. Huddy, Leonie, and Nayda Terkildsen. 1993a. “Gender Stereotypes and the Perception of
Male and Female Candidates.” American Journal of Political Science 37(1): 119-147.
Huddy, Leonie, and Nayda Terkildsen. 1993b. “The Consequences of Gender Stereotypes
for Women Candidates at Different Levels and Types of Office.” Political Research Quarterly 46(3): 503-525.
Inglehart, Ronald, and Pippa Norris. 2003. Rising Tide: Gender Equality and Cultural
Change Around the World. Cambridge: Cambridge University Press. Iyengar, Shanto, and Donald R. Kinder. 1987. News That Matters: Television and
American Opinion. Chicago: University of Chicago Press. Jacobson, Gary C. 2000. “Party Polarization in National Politics: The Electoral
Connection.” In Polarized Politics: Congress and the President in a Partisan Era, eds. Jon R. Bond and Richard Fleisher. Washington, DC: CQ Press.
Jacobson, Gary C. 2009. The Politics of Congressional Elections. 7th ed. New York:
Pearson/Longman. Jamieson, Kathleen Hall, and Erica Falk. 2000. “Continuity and Change in Civility in the
House.” In Polarized Politics: Congress and the President in a Partisan Era, eds. Jon R. Bond and Richard Fleisher. Washington, DC: CQ Press.
Kanthak, Kris, and Barbara Norrander. 2002. “Change and Continuity in the Gender
Gap.” presented at the Assessing the Vitality of Electoral Democracy in the U.S.: The 2000 Elections conference, The Ohio State University, Columbus, Ohio.
Kaufmann, Karen M. 2002. “Culture Wars, Secular Realignment, and the Gender Gap in
Party Identification.” Political Behavior 24(3): 283-307. Kaufmann, Karen M., and John R. Petrocik. 1999. “The Changing Politics of American
Men: Understanding the Sources of the Gender Gap.” American Journal of Political Science 43(3): 864-887.
Kinder, Donald. 1986. “Presidential Character Revisited.” In Political Cognition: The
19th Annual Carnegie Symposium on Cognition, eds. Richard R. Lau and David O. Sears. Hillsdale, NJ: L. Erlbaum Associates.
King, David C., and Richard E. Matland. 2003. “Sex and the Grand Old Party: An
Experimental Investigation of the Effect of Candidate Sex on Support for a Republican Candidate.” American Politics Research 31(6): 595-612.

144
Kingdon, John W. 1989. Congressmen's Voting Decisions. 3rd ed. Ann Arbor, MI:
University of Michigan Press. Klatch, Rebecca E. 1987. Women of the New Right. Philadelphia, PA: Temple University
Press. Klein, Ethel. 1985. “The Gender Gap: Different Issues, Different Answers.” The
Brookings Review 3(2): 33-37. Kunda, Ziva, and Paul Thagard. 1996. “Forming Impressions from Stereotypes, Traits,
and Behaviors: A Parallel-constraint-satisfaction Theory.” Psychological Review 103(2): 284-308.
Lawless, Jennifer L. 2004. “Women, War, and Winning Elections: Gender Stereotyping
in the Post-September 11th Era.” Political Research Quarterly 57(3): 479-490. Layman, Geoffrey C., and Thomas M. Carsey. 2002. “Party Polarization and "Conflict
Extension" in the American Electorate.” American Journal of Political Science 46(4): 786-802.
Light, Paul Charles. 1984. Vice-Presidential Power: Advice and Influence in the White
House. Baltimore, MD: Johns Hopkins University Press. Luo, Michael. 2008. “Clinton Supporters Aid Palin.” The Caucus, The New York Times.
Available at: http://thecaucus.blogs.nytimes.com/2008/10/14/clinton-supporters-aid-palin/ [Accessed July 17, 2009].
Mattei, Laura R. Winsky, and Franco Mattei. 1998. “If Men Stayed Home... The Gender
Gap in Recent Congressional Elections.” Political Research Quarterly 51(2): 411-436.
McDermott, Monika L. 1997. “Voting Cues in Low-Information Elections: Candidate
Gender as a Social Information Variable in Contemporary United States Elections.” American Journal of Political Science 41(1): 270-283.
McKee, John P., and Alex C. Sherriffs. 1957. “The Differential Evaluation of Males and
Females.” Journal of Personality 25(3): 356. Mueller, Carol M. 1986. “Nurturance and Mastery: Competing Qualifications for
Women's Access to High Public Office?” In Women and Politics: Activism, Attitudes and Office-Holding, Research in politics and society, eds. Gwen Moore and Glenna D. Spitze. Greenwich, CT: JAI Press.
National Conference of State Legislatures. 2009. “Women in State Legislatures: 2009.”
145
Women in State Legislatures: 2009. Available at: http://www.ncsl.org/default.aspx?tabid=15398 [Accessed July 5, 2009].
National Journal. 2008. “National Journal: 2007 Vote Ratings.” National Journal: 2007
Vote Ratings. Available at: http://www.nationaljournal.com.floyd.lib.umn.edu/voteratings/ [Accessed July 5, 2009].
Natoli, Marie D. 1985. American Prince, American Pauper: The Contemporary Vice
Presidency in Perspective. Westport, CT: Greenwood Press. Nelson, Michael. 1988. “Choosing the Vice President.” PS: Political Science and Politics
21(4): 858-868. Nie, Norman H., Sidney Verba, and John R. Petrocik. 1976. The Changing American
Voter. Cambridge, MA: Harvard University Press. Nielsen. 2008a. “45% Of Households In Top Local TV Markets Watched Palin and
Biden’s V.P. Debate.” Available at: http://blog.nielsen.com/nielsenwire/media_entertainment/45-of-households-in-top-local-tv-markets-watched-palin-and-bidens-vp-debate/ [Accessed July 29, 2009].
Nielsen. 2008b. “69.9 Million Watched Biden And Palin’s V.P Debate.” Available at:
http://blog.nielsen.com/nielsenwire/media_entertainment/699-million-watched-biden-and-palin%E2%80%99s-vp-debate/ [Accessed July 29, 2009].
Norrander, Barbara, and Clyde Wilcox. 2008. “The Gender Gap in Ideology.” Political
Behavior 30(4): 503-523. Norton, Noelle H. 1999. “Committee Influence Over Controversial Policy: The
Reproductive Policy Case.” Policy Studies Journal 27(2): 203. Oppenheimer, Bruce I. 2005. “Deep Red and Blue Congressional Districts: The Causes
and Consequences of Declining Party Competitiveness.” In Congress Reconsidered, eds. Lawrence C. Dodd and Bruce I. Oppenheimer. Washington, DC: CQ Press.
O'Regan, Valerie R., Stephen J. Stambough, and Gregory R. Thorson. 2006. “The Cohort
Gender Gap: A Disaggregation of the Well-Known Concept.” presented at the annual meeting of the Western Political Science Association, Albuquerque, New Mexico.
Plutzer, Eric, and John F. Zipp. 1996. “Identity Politics, Partisanship, and Voting for
Women Candidates.” Public Opinion Quarterly 60(1): 30-57.

146
Pomper, Gerald M., and Marc D. Weiner. 2002. “Toward a More Responsible Two-Party
Voter: The Evolving Bases of Partisanship.” In Responsible Partisanship?: The Evolution of American Political Parties Since 1950, Studies in government and public policy, eds. John Clifford Green and Paul S. Herrnson. Lawrence, KS: University Press of Kansas.
Poole, Keith T., and Howard Rosenthal. 1984. “The Polarization of American Politics.”
Journal of Politics 46(4): 1061-1079. Popkin, Samuel L. 1991. The Reasoning Voter: Communication and Persuasion in
Presidential Campaigns. Chicago: University of Chicago Press. Rahn, Wendy M. 1993. “The Role of Partisan Stereotypes in Information Processing
about Political Candidates.” American Journal of Political Science 37(2): 472-496.
Reingold, Beth. 2000. Representing Women: Sex, Gender, and Legislative Behavior in
Arizona and California. Chapel Hill, NC: University of North Carolina Press. Roberts, Jason M., and Steven S. Smith. 2003. “Procedural Contexts, Party Strategy, and
Conditional Party Voting in the U.S. House of Representatives, 1971-2000.” American Journal of Political Science 47(2): 305-317.
Rohde, David W. 1991. Parties and Leaders in the Postreform House. Chicago:
University of Chicago Press. Romero, David W. 2001. “Requiem for a Lightweight: Vice Presidential Candidate
Evaluations and the Presidential Vote.” Presidential Studies Quarterly 31(3): 454-463.
Rosenwasser, Shirley M. et al. 1987. “Attitudes toward Women and Men in Politics:
Perceived Male and Female Candidate Competencies and Participant Personality Characteristics.” Political Psychology 8(2): 191-200.
Rosenwasser, Shirley M., and Jana Seale. 1988. “Attitudes toward a Hypothetical Male
or Female Presidential Candidate: A Research Note.” Political Psychology 9(4): 591-598.
Sanbonmatsu, Kira, and Kathleen Dolan. 2009. “Do Gender Stereotypes Transcend
Party?” Political Research Quarterly 62(3): 485-494. Sapiro, Virginia. 1981. “Research Frontier Essay: When Are Interests Interesting? The
Problem of Political Representation of Women.” American Political Science Review 75(3): 701-716.

147
Sapiro, Virginia. 1986. “The Gender Basis of American Social Policy.” Political Science
Quarterly 101(2): 221-238. Schein, Virginia E. 2001. “A Global Look at Psychological Barriers to Women's Progress
in Management.” Journal of Social Issues 57(4): 675-688. Schlesinger, Mark, and Caroline Heldman. 2001. “Gender Gap or Gender Gaps? New
Perspectives on Support for Government Action and Policies.” Journal of Politics 63(01): 59-92.
Schlozman, Kay Lehman et al. 1995. “Gender and Citizen Participation: Is There a
Different Voice?” American Journal of Political Science 39(2): 267-293. Schumaker, Paul, and Nancy Elizabeth Burns. 1988. “Gender Cleavages and the
Resolution of Local Policy Issues.” American Journal of Political Science 32(4): 1070-1095.
Seltzer, Richard, Jody Newman, and Melissa Voorhees Leighton. 1997. Sex as a Political
Variable: Women as Candidates and Voters in U.S. Elections. Boulder, CO: Lynne Rienner Publishers.
Shapiro, Robert Y., and Harpreet Mahajan. 1986. “Gender Differences in Policy
Preferences: A Summary of Trends From the 1960s to the 1980s.” Public Opinion Quarterly 50(1): 42-61.
Sigelman, Lee, and Paul J. Wahlbeck. 1997. “The "Veepstakes": Strategic Choice in
Presidential Running Mate Selection.” American Political Science Review 91(4): 855-864.
Sinclair, Barbara. 2000. “Hostile Partners: The President, Congress, and Lawmaking in
the Partisan 1990s.” In Polarized Politics: Congress and the President in a Partisan Era, eds. Jon R. Bond and Richard Fleisher. Washington, DC: CQ Press.
Sinclair, Barbara. 1995. Legislators, Leaders, and Lawmaking: The U.S. House of
Representatives in the Postreform Era. Baltimore, MD: Johns Hopkins University Press.
Sinclair, Barbara. 2000. Unorthodox Lawmaking: New Legislative Processes in the U.S.
Congress. 2nd ed. Washington, DC: CQ Press. Skocpol, Theda. 1992. Protecting Soldiers and Mothers: The Political Origins of Social
Policy in the United States. Cambridge, MA: Belknap Press of Harvard University Press.

148
Smith, Steven S. 1989. Call to Order: Floor Politics in the House and Senate. Washington, DC: Brookings Institution.
Smith, Tom W. 1984. “The Polls: Gender and Attitudes Toward Violence.” Public
Opinion Quarterly 48(1): 384-396. Sniderman, Paul M., Richard A. Brody, and Philip Tetlock. 1991. Reasoning and Choice:
Explorations in Political Psychology. Cambridge: Cambridge University Press. Spence, Janet T., Robert Helmreich, and Joy Stapp. 1974. “The Personal Attributes
Questionnaire: A Measure of Sex Role Stereotypes and Masculinity-Femininity.” Catalog of Selected Documents in Psychology 4: 43-44.
Stonecash, Jeffrey M., Mark D. Brewer, and Mack D. Mariani. 2003. Diverging Parties:
Social Change, Realignment, and Party Polarization. Boulder, CO: Westview Press.
Swers, Michele L. 1998. “Are Women More Likely to Vote for Women's Issue Bills than
Their Male Colleagues?” Legislative Studies Quarterly 23(3): 435-448. Swers, Michele L. 2002. The Difference Women Make: The Policy Impact of Women in
Congress. Chicago: University of Chicago Press. Theriault, Sean M. 2003. “The Case of the Vanishing Moderates: Party Polarization in
the Modern Congress.” Thomas, Sue. 1994. How Women Legislate. New York: Oxford University Press. Tumulty, Karen. 2008. “The Five Mistakes Clinton Made.” Time. Available at:
http://www.time.com/time/politics/article/0,8599,1738331,00.html [Accessed July 16, 2009].
Uslaner, Eric M. 1993. The Decline of Comity in Congress. Ann Arbor, MI: University of
Michigan Press. Wattenberg, Martin. 1984. “And Tyler, too.” Public Opinion 7: 52-54. Wattenberg, Martin. 1995. “The Role of Vice-Presidential Candidate Ratings in
Presidential Voting Behavior.” American Politics Quarterly 23(4): 504-514. Weisberg, Herbert F. 2002. “The Party in the Electorate as a Basis for More Responsible
Parties.” In Responsible Partisanship?: The Evolution of American Political Parties Since 1950, Studies in government and public policy, eds. John Clifford Green and Paul S. Herrnson. Lawrence, KS: University Press of Kansas.

149
Welch, Susan, and Lee Sigelman. 1989. “A Black Gender Gap?” Social Science Quarterly 70(1): 120-33.
Welch, Susan, and Lee Sigelman. 1992. “A Gender Gap among Hispanics? A
Comparison with Blacks and Anglos.” Western Political Quarterly 45(1): 181-199.
Williams, John E., and Deborah L. Best. 1982. Measuring Sex Stereotypes: A Thirty-
Nation Study. Beverly Hills, CA: SAGE Publications. Wirls, Daniel. 1986. “Reinterpreting the Gender Gap.” Public Opinion Quarterly 50(3):
316-330. Zaller, John. 1992. The Nature and Origins of Mass Opinion. Cambridge: Cambridge
University Press.

150
Appendix A. Minnesota Questionnaire Title: HHH.MPR Early October Public Opinion Survey
Survey Organization: Center for Survey Research and Analysis, University of Connecticut
Sponsor: Humphrey Institute and Minnesota Public Radio
Field Dates: September 29 – October 5, 2008
Sample: Minnesotans
Sample Size: 1,141
Interview method: Telephone
Hello, my name is _____ and I’m calling from the Center for Survey Research and Analysis at the University of Connecticut. We are conducting a survey about the upcoming Presidential Election. May I please speak to the YOUNGEST MALE in this household, at least 18 years of age or older? Your answers to these questions are completely confidential and the results will only be reported in anonymous form. (NOTE: If there is a male that lives in the household and is not available at this time, schedule a callback. Only complete interview with female if there is no male in the household.) LV1. Are you currently registered to vote in the precinct or township where you live?
1. Yes (SKIP TO LV3) 2. No 98. Don’t know 99. Refused
LV2. Do you have plans to register to vote on or before November 4, 2008?
1. Yes 2. No 98. Don’t know 99. Refused
LV3. How likely is it that you will vote in the November 4th general election? Would you say you definitely will vote, probably will vote, probably won’t vote or definitely won’t vote in the November general election?
1. Definitely will 2. Probably will 3. Probably won’t 4. Definitely won’t 98. Don’t know 99. Refused
Q1. If the 2008 presidential election were being held today, would you vote for … (READ CHOICES 1-2, ROTATE) (IF DK/REF: As of today, who do you lean more towards?)
1. Democrat Barack Obama

151
2. Republican John McCain 80. Somebody else (specify) 97. Won’t vote (volunteered) 98. Don’t know (volunteered) 99. Refused (volunteered)
Q2. Are you certain now that you will vote for <q1> for president, or do you think you may change your mind between now and the November election?
1. Certain 2. Might change mind 98. Don’t know 99. Refused
Q3. When deciding for whom to vote for President, which one of the following qualities is most important to you? Someone who… (READ CHOICES 1-7; ROTATE)
1. Will bring about change 2. Is closer to you on the issues 3. Shares your values 4. Is a strong leader 5. Has experience 6. Has the best chance of being elected 7. Is in touch with people like you 80. Other (specify) 98. Don’t know 99. Refused
Q4. If the 2008 Senate election were being held today, would you vote for… (READ CHOICES 1-3; ROTATE 1-2) (IF DK/REF: If you had to choose today, for whom would you vote?)
1. Democrat Al Franken 2. Republican Norm Coleman 3. Independence Party member Dean Barkley 80. Somebody else (specify) 97. Won’t vote (volunteered) 98. Don’t know 99. Refused
Q5. Which candidate for the U.S. Senate do you think best represents the Minnesota way of life? (READ CHOICES 1-3, ROTATE 1-2)
1. Democrat Al Franken 2. Republican Norm Coleman 3. Independence Party member Dean Barkley 80. Somebody else (specify) 98. Don’t know 99. Refused

152
Q6. If the 2008 elections for the U.S. House of Representatives were being held today, would you vote for… (READ CHOICES 1-2; ROTATE)
1. Democrat Party candidate 2. Republican Party candidate 80. Somebody else (specify) 97. Won’t vote (volunteered) 98. Don’t know 99. Refused
Q7. If the 2008 elections for the Minnesota State Legislature were being held today, would you vote for... (READ CHOICES 1-2: ROTATE)
1. Democrat Party candidate 2. Republican Party candidate 80. Somebody else (specify) 97. Won’t vote (volunteered) 98. Don’t know 99. Refused
Q8. Generally speaking, would you say things in this country are heading in the right direction, or are they off on the wrong track?
1. Right direction 2. Wrong track 98. Don’t know 99. Refused
Q9. Which ONE of the following issues do you think is the single MOST important problem facing the United States today: (READ CHOICES 1-6; ROTATE) (PROBE IF NECESSARY for SINGLE MOST important issue)
1. The war in Iraq 2. The economy and jobs 3. Education 4. Health Care 5. Taxes 6. Terrorism 80. Or something else (specify) 98. Don’t know 99. Refused
Q10. Which ONE of the following issues do you think is the single MOST important problem facing Minnesota today: (READ CHOICES 1-5; ROTATE) (PROBE IF NECESSARY for SINGLE MOST important issue)
1. Transportation 2. The economy and jobs 3. Education

153
4. Health Care 5. Taxes 80. Or something else (specify) 98. Don’t know 99. Refused
Q11. Do you approve or disapprove of the way George W. Bush is handling his job as president? (PROBE: STRONGLY/SOMEWHAT APPROVE/DISAPPROVE)
1. Strongly approve 2. Somewhat approve 3. Somewhat disapprove 4. Strongly disapprove 98. Don’t know 99. Refused
Q12. Do you approve or disapprove of the way Tim Pawlenty is handling his job as governor? (PROBE: STRONGLY/SOMEWHAT APPROVE/DISAPPROVE)
1. Strongly approve 2. Somewhat approve 3. Somewhat disapprove 4. Strongly disapprove 98. Don’t know 99. Refused
Q13. Do you approve or disapprove of the way Norm Coleman is handling his job as US Senator? (PROBE: STRONGLY/SOMEWHAT APPROVE/DISAPPROVE)
1. Strongly approve 2. Somewhat approve 3. Somewhat disapprove 4. Strongly disapprove 98. Don’t know 99. Refused
Q14. Do you approve or disapprove of the way Amy Klobuchar is handling her job as US Senator? (PROBE: STRONGLY/SOMEWHAT APPROVE/DISAPPROVE)
1. Strongly approve 2. Somewhat approve 3. Somewhat disapprove 4. Strongly disapprove 98. Don’t know 99. Refused
Next, we would like to ask you about some of the issues in the presidential campaign.

154
Q15. Generally speaking, how much interest would you say you have in the upcoming Presidential election? (READ CHOICES 1-4)
1. A great deal 2. A fair amount 3. Only a little 4. No interest at all 98. Don’t know 99. Refused
Q16. How would you rate economic conditions in this country today? (READ CHOICES 1-4)
1. Excellent 2. Good 3. Fair 4. Poor 98. Don’t know 99. Refused
Q17. Would you say the problems currently facing financial institutions and the stock market make you feel scared, concerned but not scared, or are you not concerned by those events?
1. Scared 2. Concerned but not scared 3. Not Concerned 98. Don’t know 99. Refused
Q18. Do you think the federal government should step in and try to address these problems, or should the federal government stay out and let the financial markets and the economy try to recover on their own?
1. Step in 2. Stay out 98. Don’t know 99. Refused
Q19. Do you think the federal government should provide financial help to home owners who are having trouble paying their mortgages because their rates went up, or should the federal government not get involved?
1. Help out 2. Don’t get involved 98. Don’t know 99. Refused
Q20. What do you think is mainly responsible for the problems in the investment banking industry - bad management by those who run the investment banks or a lack of close supervision by the government?

155
1. Bad management by those who run the investment banks 2. Lack of close supervision by the government 98. Don’t know 99. Refused
Q21. Do you think the federal government should or should not significantly increase its regulation of the investment banking industry?
1. Should increase its regulation 2. Should not increase its regulation 98. Don’t know 99. Refused
Q22. Which presidential candidate do you think will do a better job handling the problems in the investment banking industry? (READ CHOICES 1-2; ROTATE)
1. Barack Obama 2. John McCain 3. Same (volunteered) 98. Don’t know 99. Refused
Now like to ask you about the campaign in Minnesota. Q23. How likely is it that the outcome of the presidential election will be determined by who wins the state of Minnesota? (READ CHOICES 1-4)
1. Very likely 2. Somewhat likely 3. Not too likely 4. Not at all likely 98. Don’t know 99. Refused
Q24. In this presidential election, do you think Minnesota will vote Republican, Democrat, or is it currently a toss-up between the two candidates?
1. Republican 2. Democrat 3. Toss-up 98. Don’t know 99. Refused
ROTATE Q25 AND Q26 Q25. How much do you think presidential candidate Barack Obama cares about the voters in Minnesota? (READ CHOICES 1-4)
1. A great deal

156
2. A fair amount 3. Only a little 4. Not at all 98. Don’t know 99. Refused
Q26. How much do you think presidential candidate John McCain cares about the voters in Minnesota? (READ CHOICES 1-4)
1. A great deal 2. A fair amount 3. Only a little 4. Not at all 98. Don’t know 99. Refused
Q27. A state constitutional amendment will be placed on the ballot in November to raise the Minnesota sales tax by three-eighths of one percent until the year 2034 to pay for clean water, wildlife habit, parks and trails, and arts projects. Do you plan to vote for this amendment or against it, or are you not planning to register a vote on this issue?
1. For it 2. Against it (SKIP TO Q28B) 3. Not planning to vote on this (SKIP TO IQ29) 98. Don’t Know (SKIP TO IQ29) 99. Refused (SKIP TO IQ29)
Q28A. Some people argue that the state of Minnesota has existing revenues to pay for these projects, and that it is bad policy to dedicate funding in the Constitution for them. Does hearing these reasons make you more likely to vote against the amendment, more likely to vote in favor of it, or do these reasons have no impact on your decision?
1. More likely to vote against it (SKIP TO IQ29) 2. More likely to vote for it (SKIP TO IQ29) 3. These reasons have no impact on the decision (SKIP TO IQ29) 98. Don’t Know (SKIP TO IQ29) 99. Refused (SKIP TO IQ29)
Q28B. Some people argue that this tax is necessary to protect Minnesota’s quality of life, and that the Legislature has proven unable to adequately fund things like drinking water, wildlife habitat and arts programs with existing revenue. Does hearing these reasons make you more likely to vote in favor of the amendment, more likely to vote against it, or do these reasons have no impact on your decision?
1. More likely to vote against it 2. More likely to vote for it 3. These reasons have no impact on the decision 98. Don’t know 99. Refused

157
Next, we have a few questions about the vice presidential debate on Thursday night. Q29A. Did you happen to watch any of the Vice Presidential debate between Joe Biden and Sarah Palin that was televised on Thursday, Oct. 2?
1. Yes 2. No 98. Don’t know 99. Refused
Q29B. Did you happen to read or hear any news reports about the Vice Presidential debate, or talk to anyone about the debate?
1. Yes 2. No 98. Don’t know 99. Refused
ROTATE Q30 AND Q31 Q30. Does Palin’s performance in the debate make you more or less likely to vote for McCain, or didn’t it make a difference?
1. More likely to vote for him 2. Less likely to vote for him 3. It didn’t make a difference 98. Don’t know 99. Refused
Q31. Does Biden’s performance in the debate make you more or less likely to vote for Obama, or didn’t it make a difference?
1. More likely to vote for him 2. Less likely to vote for him 3. It didn’t make a difference 98. Don’t know 99. Refused
Next, I am going to read you a list of statements. Tell me whether you think each statement applies more to Joe Biden or Sarah Palin. ROTATE Q32, Q33, AND Q34 Q32. Is honest? (READ CHOICES 1-2; ROTATE) (PROBE: Which candidate does this statement apply more to?)
1. Joe Biden 2. Sarah Palin 98. Don’t know 99. Refused

158
Q33. Has the right experience to be president? (READ CHOICES 1-2; ROTATE) (PROBE: Which candidate does this statement apply more to?)
1. Joe Biden 2. Sarah Palin 98. Don’t know 99. Refused
Q34. Cares about people like me? (READ CHOICES 1-2; ROTATE) (PROBE: Which candidate does this statement apply more to?)
1. Joe Biden 2. Sarah Palin 98. Don’t know 99. Refused
Next, I am going to asking about some of the political candidates competing in this year’s election. ROTATE Q35 AND Q36 Q35. Do you think John McCain’s political views are too conservative, about right, or too liberal?
1. Too Conservative 2. About Right 3. Too Liberal 98. Don’t know 99. Refused
Q36. Do you think Barack Obama’s political views are too conservative, about right, or too liberal?
1. Too Conservative 2. About Right 3. Too Liberal 98. Don’t know 99. Refused
ROTATE Q37 AND Q38 Q37. Do you think Joe Biden’s political views are too conservative, about right, or too liberal?
1. Too Conservative 2. About Right 3. Too Liberal 98. Don’t know 99. Refused
Q38. Do you think Sarah Palin’s political views are too conservative, about right, or too liberal?

159
1. Too Conservative 2. About Right 3. Too Liberal 98. Don’t know 99. Refused
ROTATE Q39 AND Q40 Q39. If John McCain were elected President, do you think he would generally continue George W. Bush’s policies, or would he take the country in a different direction?
1. Continue George W. Bush’s policies 2. Take the country in a different direction 98. Don’t know 99. Refused
Q40. Does the fact that Barack Obama is relatively new to national politics make you more likely to vote for him, less likely to vote for him, or wouldn’t it make a difference?
1. More likely to vote for him 2. Less likely to vote for him 3. It wouldn’t make a difference 98. Don’t know 99. Refused
ROTATE Q41 AND Q42 Q41. Does the fact that Barack Obama is African-American make you more likely to vote for him, less likely to vote will help him, or wouldn’t it make a difference?
1. More likely to vote for him 2. Less likely to vote for him 3. It wouldn’t make a difference 98. Don’t know 99. Refused
Q42. Does the fact that John McCain is 71 years old make you more likely to vote for him, less likely to vote for him, or wouldn’t it make a difference?
1. More likely to vote for him 2. Less likely to vote for him 3. It wouldn’t make a difference 98. Don’t know 99. Refused
Q43. Thinking about the presidential race between John McCain and Barak Obama, have the television advertisements in this race been more negative or less negative as presidential races from previous years or haven’t you seen much of a difference?
1. More negative 2. Less negative

160
3. Haven’t seen much of a difference 98. Don’t know 99. Refused
Q44. Who do you think is running more negative television advertisements? (READ CHOICES 1-2; ROTATE)
1. John McCain 2. Barack Obama 3. No difference (SKIP 1) 98. Don’t Know (SKIP 1) 99. Refused (SKIP 1)
Q45. Does this make you more likely to vote for <Q44>, less likely, or doesn’t it make a difference?
1. More Likely 2. Less Likely 3. Make No difference 98. Don’t know 99. Refused
ROTATE Q46 AND Q47 Q46. Thinking back to the Democratic nomination contest, who did you prefer more? (READ CHOICES 1-2; ROTATE)
1. Barack Obama 2. Hillary Clinton 98. Don’t know 99. Refused
Q47. Thinking back to the Republican nomination contest, who did you prefer more? (READ CHOICES 1-2)
1. John McCain 2. One of the other candidates 98. Don’t know 99. Refused
Now I would like to switch gears, and ask you several questions about the U.S. Senate race between Norm Coleman and Al Franken. ROTATE Q48 AND Q49 Q48. Do you think Norm Coleman’s political views are too conservative, about right, or too liberal?
1. Too Conservative 2. About Right 3. Too Liberal

161
98. Don’t know 99. Refused
Q49. Do you think Al Franken’s political views are too conservative, about right, or too liberal?
1. Too Conservative 2. About Right 3. Too Liberal 98. Don’t know 99. Refused
Q50. Have the television advertisements in the Senate race between Norm Coleman and Al Franken been more negative, less negative, or as negative as Senate races from previous years?
1. More negative 2. Less negative 3. Haven’t seen much of a difference 98. Don’t know 99. Refused
Q51. Who do you think is running more negative television advertisements? (READ CHOICES 1-2; ROTATE)
1. Al Franken 2. Norm Coleman 3. No difference (SKIP TO IQ53) 98. Don’t Know (SKIP TO IQ53) 99. Refused (SKIP TO IQ53)
Q52. Does this make you more likely to vote for <Q51>, less likely, or doesn’t it make a difference?
1. More Likely 2. Less Likely 3. Make No difference 98. Don’t know 99. Refused
Next, I am going to read you a list of statements. Tell me whether you think each statement applies more to John McCain or Barack Obama. ROTATE Q53 THROUGH Q59 Q53. He will be a strong leader as commander in chief? (PROBE: Do you think this statement applies more to John McCain or Barack Obama?)
1. John McCain 2. Barack Obama 98. Don’t know 99. Refused

162
Q54. He cares about people like me? (PROBE: Do you think this statement applies more to John McCain or Barack Obama?)
1. John McCain 2. Barack Obama 98. Don’t know 99. Refused
Q55. He is experienced? (PROBE: Do you think this statement applies more to John McCain or Barack Obama?)
1. John McCain 2. Barack Obama 98. Don’t know 99. Refused
Q56. He will be bring about positive change? (PROBE: Do you think this statement applies more to John McCain or Barack Obama?)
1. John McCain 2. Barack Obama 98. Don’t know 99. Refused
Q57. He is an independent thinker? (PROBE: Do you think this statement applies more to John McCain or Barack Obama?)
1. John McCain 2. Barack Obama 98. Don’t know 99. Refused
Q58. He is honest? (PROBE: Do you think this statement applies more to John McCain or Barack Obama?)
1. John McCain 2. Barack Obama 98. Don’t know 99. Refused
Q59. He is out of touch with people like me? (PROBE: Do you think this statement applies more to John McCain or Barack Obama?)
1. John McCain 2. Barack Obama 98. Don’t know 99. Refused

163
LV4. Thinking back to 20…Did you vote in the 20 general election for President between Al Gore and George W. Bush or did something come up that kept you from getting to the polls that day?
1. Voted 2. Did not vote 3. Not eligible (volunteered) 98. Don’t know 99. Refused
LV5. Thinking back to 24…Did you vote in the 24 general election for President between George W. Bush and John Kerry or did something come up that kept you from getting to the polls that day?
1. Voted 2. Did not vote 3. Not eligible (volunteered) 98. Don’t know 99. Refused
LV6. Thinking about all of the elections that have been held in your community over the last several years, including local elections for school board members and budget issues, how many would you say you have voted in? Would that be all of them, almost all of them, most of them, some of them, a few of them, or none of them?
1. All 2. Almost all 3. Most 4. Some 5. A few 6. None 98. Don’t know 99. Refused
LV7. Generally speaking, how enthusiastic are you about the upcoming Presidential election? (READ CHOICES 1-5)
1. Extremely Enthusiastic 2. Very Enthusiastic 3. Somewhat Enthusiastic 4. Not Too Enthusiastic 5. Not Enthusiastic At All 98. Don’t know 99. Refused
LV8. Compared to previous presidential elections, are you more enthusiastic about this election or less enthusiastic?
1. More enthusiastic

164
2. Less enthusiastic 3. Same (volunteered) 98. Don’t know 99. Refused
Lastly, we have some questions for classification purposes only. First... QD1. In what year were you born?
Record 4 digits 98. Don’t know 99. Refused
QD2. What racial or ethnic group would you most identify yourself with? African American, Asian, Hispanic, Native American, White, or some other group?
1. African American 2. Asian 3. Hispanic 4. Native American 5. White 80. Some other group (specify) 98. Don’t know 99. Refused
QD3. For classification purposes only, is the total yearly income of all the members of your family now living at home less than $50,000 or is it $50,000 or more?
1. Less than $50,000 2. $50,000 or more (SKIP TO QD3B) 98. Don’t Know (SKIP TO QD4) 99. Refused (SKIP TO QD4)
QD3A. Is it… (READ CHOICES 1-2)?
1. Under $25,000 (SKIP TO QD4) 2. $25,000 to less than $50,000 (SKIP TO QD4) 98. Don’t Know (SKIP TO QD4) 99. Refused (SKIP TO QD4)
QD3B. Is it… (READ CHOICES 1-3)?
1. $50,000 to less than $75,000 2. $75,000 to less than $100,000 3. $100,000 or more 98. Don’t know 99. Refused

165
QD4. Generally speaking, do you usually think of yourself as a Republican, a Democrat, an Independent, or what?
1. Republican 2. Democrat 3. Independent (SKIP TO QD4B) 80. Something else (specify) (SKIP TO QD4B) 98. Don’t Know (SKIP TO QD4B) 99. Refused (SKIP TO QD4B)
QD4A. Would you call yourself a strong or not very strong <QD4>?
1. Strong (SKIP TO QD5) 2. Not very strong (SKIP TO QD5) 98. Don’t Know (SKIP TO QD5) 99. Refused (SKIP TO QD5)
QD4B. Do you think of yourself as closer to the Republican Party or Democratic Party or neither?
1. Republican Party 2. Democratic Party 3. Neither 98. Don’t know 99. Refused
QD5. Are you currently married, widowed, divorced, separated, or single?
1. Married 2. Widowed 3. Divorced 4. Separated 5. Single 6. Partnered/not married (volunteered) 98. Don’t know 99. Refused
QD6. What is the highest grade of school or year of college you have completed and gotten credit for?
1. Grade school or less (0-8) 2. Some high school (9-11) 3. High school (12) 4. Some college (1-3 years) 5. College graduate (4 years) 6. Post graduate (Masters or Doctorate) 98. Don’t know 99. Refused

166
QD7. How much of the time do you think you can trust the government to do what’s right - just about always, most of the time, only some of the time, or never?
1. Just about always 2. Most of the time 3. Only some of the time 4. Never 98. Don’t know 99. Refused
QD8. Are you currently employed full-time, employed part-time, retired, temporarily laid off, or not employed?
1. Employed full-time 2. Employed part-time 3. Retired 4. Temporarily laid off 5. Not employed 6. Stay at home parent/caregiver (volunteered) 7. Student (volunteered) 98. Don’t know 99. Refused
QD9. Do you or does someone in your household belong to a labor union?
1. Yes 2. No 98. Don’t know 99. Refused
QD10. Were you born in the United States?
1. Yes 2. No 98. Don’t know 99. Refused
QD11. How many years have you lived at your current address?
Record 2 digit year. Round to nearest year. 1. Less than 6 months 98. Don’t know 99. Refused
QD12. What is your religious affiliation: Protestant, Catholic, Jewish, or something else?
1. Protestant 2. Catholic 3. Jewish (SKIP TO QD14)

167
80. Something else (specify) 97. No religious affiliation (volunteered; SKIP TO QD15) 98. Don’t Know (SKIP TO QD14) 99. Refused (SKIP TO QD14)
QD13. Do you consider yourself to be an evangelical or born-again Christian?
1. Yes 2. No 98. Don’t know (volunteered) 99. Refused (volunteered)
QD14. How often do you attend religious services: every week, almost every week, once or twice a month, a few times a year, or never?
1. Every week 2. Almost every week 3. Once or twice a month 4. A few times a year 5. Never 98. Don’t know 99. Refused
QD15. How many adults live in this household who are 18 years old or older including yourself?
1. 1 2. 2 3. 3 4. 4 5. 5 6. 6 7. 7 or more 98. Don’t know 99. Refused
QD16. How many children live in this household who are 17 years old or younger?
0. 0 1. 1 2. 2 3. 3 4. 4 5. 5 6. 6 7. 7 or more 98. Don’t know 99. Refused

168
QD17. How many phone numbers do you have in your household that are connected to phones that can be answered by a person, excluding cell phones?
1. 1 2. 2 3. 3 4. 4 5. 5 6. 6 7. 7 or more 98. Don’t know 99. Refused
QD18. Sometimes a reporter likes to call a survey participant for further comment. Would you be willing to be contacted?
1. Yes 2. No (SKIP TO QD19) 98. Don’t Know (SKIP TO QD19) 99. Refused (SKIP TO QD19)
QD18A. What is your first name?
Record Name and Verify Spelling 98. Don’t know 99. Refused
QD19. (RECORD GENDER. DO NOT ASK)
Male Female
Thank you for taking the time to complete this survey. Your cooperation is appreciated.
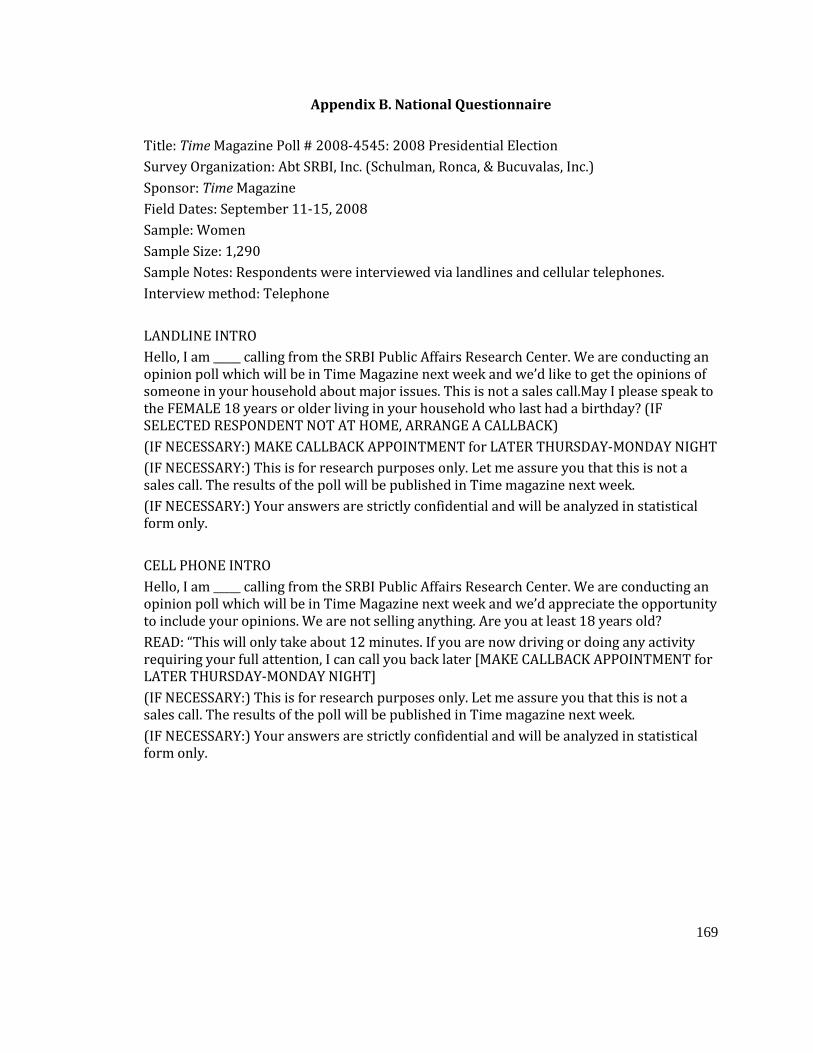
169
Appendix B. National Questionnaire
Title: Time Magazine Poll # 2008-4545: 2008 Presidential Election
Survey Organization: Abt SRBI, Inc. (Schulman, Ronca, & Bucuvalas, Inc.)
Sponsor: Time Magazine
Field Dates: September 11-15, 2008
Sample: Women
Sample Size: 1,290
Sample Notes: Respondents were interviewed via landlines and cellular telephones.
Interview method: Telephone
LANDLINE INTRO
Hello, I am _____ calling from the SRBI Public Affairs Research Center. We are conducting an opinion poll which will be in Time Magazine next week and we’d like to get the opinions of someone in your household about major issues. This is not a sales call.May I please speak to the FEMALE 18 years or older living in your household who last had a birthday? (IF SELECTED RESPONDENT NOT AT HOME, ARRANGE A CALLBACK)
(IF NECESSARY:) MAKE CALLBACK APPOINTMENT for LATER THURSDAY-MONDAY NIGHT
(IF NECESSARY:) This is for research purposes only. Let me assure you that this is not a sales call. The results of the poll will be published in Time magazine next week.
(IF NECESSARY:) Your answers are strictly confidential and will be analyzed in statistical form only.
CELL PHONE INTRO
Hello, I am _____ calling from the SRBI Public Affairs Research Center. We are conducting an opinion poll which will be in Time Magazine next week and we’d appreciate the opportunity to include your opinions. We are not selling anything. Are you at least 18 years old?
READ: “This will only take about 12 minutes. If you are now driving or doing any activity requiring your full attention, I can call you back later [MAKE CALLBACK APPOINTMENT for LATER THURSDAY-MONDAY NIGHT]
(IF NECESSARY:) This is for research purposes only. Let me assure you that this is not a sales call. The results of the poll will be published in Time magazine next week.
(IF NECESSARY:) Your answers are strictly confidential and will be analyzed in statistical form only.

170
The first question is…
CELL1. Just to verify, is this a cell phone?
1. Yes
2. No [TERMINATE: “Thank you for your time, but we’re only interviewing people with cell phones at this time.”]
9. Don’t know/Refused (volunteered; TERMINATE: “Thank you for your time.”)
A. Gender (DO NOT ASK)
1. Male (RESCREEN FOR FEMALE WITH LAST BIRTHDAY IN LANDLINE VERSION; IN CELL VERSION THANK AND TERMINATE)
2. Female
1. These days, many people are so busy they can't find time to register to vote. Are you NOW registered to vote in your precinct or election district, or haven't you been able to register so far?
1. Yes, registered
2. No, not registered (SKIP TO QF1)
3. Registration not required to vote (volunteered)
8. Don’t know/No answer (volunteered; SKIP TO QF1)
CELLREG. And, are you currently registered to vote in the Northeast, Midwest, South, or West?
1. Northeast
2. Midwest
3. South
4. West
5. Don’t know/No answer
2. As you know, there will be a Presidential election this November. At this point, would you say you’ll definitely not vote in the Presidential election, probably not vote, may or may not vote depending upon how you feel at the time, probably vote, or definitely vote in the Presidential election?
1. Definitely not vote (SKIP TO QF1)
2. Probably not vote (SKIP TO QF1)

171
3. May or may not vote (SKIP TO QF1)
4. Probably vote
5. Definitely vote
8. Don’t know/No answer (volunteered; SKIP TO QF1)
3. How closely have you been following the race so far – very closely, somewhat closely, not very closely, or haven’t you really been following it much at all?
1. Very closely
2. Somewhat closely
3. Not very closely (SKIP TO QF1)
4. Haven’t really been following it much at all (SKIP TO QF1)
8. Don’t know/No answer (volunteered: SKIP TO QF1)
5. If the Presidential election were held today and the candidates were (ROTATE) Barack Obama and Joe Biden (BY den), the Democrats, and John McCain and Sarah Palin (PAY lin), the Republicans, and you had to choose, for whom would you vote?
1. Barack Obama and Joe Biden, the Democrats (SKIP TO Q7)
2. John McCain and Sarah Palin, the Republicans (SKIP TO Q7)
3. Other/Neither (volunteered; SKIP TO Q7)
4. Would not vote in election (volunteered; SKIP TO QF1 AND RECODE Q2 AS 1)
8. Undecided/Don’t know/No answer
6. Do you lean more toward (SAME ROTATE AS IN Q3) Barack Obama and Joe Biden, the Democrats, or more toward John McCain and Sarah Palin, the Republicans?
1. Lean more toward Barack Obama and Joe Biden (SKIP TO Q8)
2. Lean more toward John McCain and Sarah Palin (SKIP TO Q8)
3. Other/Neither (volunteered; SKIP TO Q8)
4. Would not vote for either (volunteered; SKIP TO Q8)
8. Undecided/Don’t know/No answer (volunteered; SKIP TO Q10)
7. Is there any chance that you might change your mind about voting for (NAME IN Q5) or not?
1. Chance might change mind
2. Not
8. Don't know/Not sure (volunteered)

172
8. Are you very enthusiastic about the candidate you’re supporting for President, somewhat enthusiastic, not very enthusiastic, or not at all enthusiastic?
1. Very enthusiastic
2. Somewhat enthusiastic
3. Not very enthusiastic
4. Not at all enthusiastic
8. Don’t know/No answer (volunteered)
ASK IF Q5=1 or 2 OR Q6=1 or 2.
9. When did you decide to support/lean to (NAME IN Q. 5 OR Q.6)? Was it during or after the Democratic and Republican political conventions of the past few weeks, or before the political conventions?
1. During or after political conventions
2. Before
8. Don’t know/No answer (volunteered)
10. Some voters tell us that they’re now supporting a different candidate than they were a few weeks ago. Thinking back BEFORE the political conventions of the past few weeks, was there a time when you were thinking about voting for another candidate for President, but then changed your mind in the past few weeks?
1. Was a time when supported another candidate
2. No
8. Don’t know/No answer (volunteered)
(ROTATE Q.11 AND Q.12)
11. Did John McCain’s choice of Sarah Palin as his running mate make you less likely to vote for McCain, more likely, or didn’t it make much difference to you?
1. Less likely
2. More likely
3. Not much difference
8. Don’t know/No answer (volunteered)
12. Did Barack Obama’s choice of Joe Biden as his running mate make you less likely to vote for Obama, more likely, or didn’t it make much difference to you?
1. Less likely

173
2. More likely
3. Not much difference
8. Don’t know/No answer (volunteered)
13. Based on what you’ve seen or heard, do you have a favorable or unfavorable opinion of [INSERT NAME]? RANDOMIZE
a. Barack Obama
b. John McCain
c. Joe Biden
d. Sarah Palin
1. Favorable
2. Unfavorable
8. Don’t know/No answer (volunteered)
ASK IF Q13D=1 or 2.
14. Which is more important to you in your (RESPONSE IN Q13) rating of Sarah Palin (her personal qualities such as her experience, family life and leadership qualities) or (her positions on specific issues)?
1. Personal qualities
2. Her positions on specific issues
3. Both (volunteered)
4. Other (volunteered)
8. Don’t know/No answer (volunteered)
15. Do you feel that you know enough about (CANDIDATE) to make up your mind about the candidate, or not? (ROTATE)
a. Joe Biden
b. Sarah Palin (PAY lin)
1. Yes, I know enough
2. No, I do NOT know enough
8. Don’t know/No answer (volunteered)
16. In your opinion, which candidates, (ROTATE AS IN Q5) Barack Obama and Joe Biden, the Democrats, or John McCain and Sarah Palin, the Republicans, are MOST likely to bring real change to Washington?

174
1. Barack Obama and Joe Biden, the Democrats
2. John McCain and Sarah Palin, the Republicans
3. None/Neither (volunteered)
4. Both equal (volunteered)
8. Don’t know/No answer (volunteered)
17. How well prepared is (READ NAME) to carry out the duties of the President of the United States - very prepared, somewhat prepared, not very prepared, or not at all prepared?
a. Barack Obama
b. John McCain
1. Very prepared
2. Somewhat prepared
3. Not very prepared
4. Not at all prepared
8. Don’t know/No answer (volunteered)
18. How well do each of the following candidates understand the everyday concerns and needs of people like yourself - a great deal, some, not much, or not at all? (RANDOM)
a. Barack Obama
b. John McCain
c. Joe Biden
d. Sarah Palin
1. A great deal
2. Some
3. Not much
4. Not at all
8. Don’t know/No answer (volunteered)
19. How much do YOU personally identify with the everyday life experiences and values of (CANDIDATE) – a great deal, some, not much, or not at all? (RANDOM)
a. Barack Obama
b. John McCain
c. Joe Biden

175
d. Sarah Palin
1. A great deal
2. Some
3. Not much
4. Not at all
8. Don’t know/no answer (volunteered)
20. Regardless of who you’re voting for, which Vice Presidential candidate, (ROTATE) Joe Biden, the Democrat, or Sarah Palin, the Republican, would be best prepared to take over the Presidency if that were necessary?
1. Joe Biden, the Democrat
2. Sarah Palin, the Republican
3. Both equal (volunteered)
4. Neither (volunteered)
8. No answer/Don’t know (volunteered)
21. And which Vice Presidential candidate, (ROTATE) Joe Biden, the Democrat, or Sarah Palin, the Republican, would be best prepared to be commander-in-chief?
1. Joe Biden, the Democrat
2. Sarah Palin, the Republican
3. Both equal (volunteered)
4. Neither (volunteered)
8. No answer/Don’t know (volunteered)
22. Please tell me whether you personally agree or disagree with Sarah Palin’s positions on the following issues. (RANDOMIZE LIST. FOR EACH STATEMENT, ASK:) Do you agree or disagree with her position?
a. Palin supports teaching of both creationism and evolution in public schools
b. She opposes abortion in all cases, including rape and incest, except when the life of the mother is in danger
c. Palin supports the right to bear arms, including handguns
d. She favors more drilling for oil and gas, including in the Arctic wildlife refuge
e. She does not believe that global warming is caused by humans
f. Palin supports the war in Iraq
1. Agree

176
2. Disagree
8. No answer/Don’t know (volunteered)
23. Regardless of the candidates currently running for President, as things stand now, would you be more likely to vote for the (ROTATE) Democratic nominee for President or the Republican nominee? (Probe: As things stand now, which way do you lean?)
1. Democratic nominee
2. Republican nominee
3. Other party
8. No answer/Undecided/Don’t know (volunteered)
Turning to Congress…
24. There will be elections for the U.S. House of Representatives this year. If the election were being held today, would you be more likely to vote for the (ROTATE: Republican candidate/Democratic candidate) in the district where you live? If you don’t usually vote in Congressional elections just tell me.
1. Republican
2. Democratic
3. Other (volunteered)
4. Don’t usually vote/Not registered (volunteered)
8. No answer/Don’t know (volunteered)
25. Here are some issues in the news these days. Please tell me how important the issue is to you personally in voting in this year’s Presidential election. First, is [INSERT ITEM, RANDOMIZE] an issue that is extremely important to you, very important, somewhat important, not too important, or not at all important to you?
How about [NEXT ITEM]? [IF NECESSARY] Is [ITEM] extremely important to you, very important, somewhat important, not too important or not at all important to you?
a. The nation’s economy
b. Gas prices at the pump
c. The situation in Iraq
d. Immigration
e. Global warming
f. So-called “values issues,” such as abortion and gay marriage
g. Terrorism
h. Health care
i. Taxes
j. Reducing world poverty

177
1. Extremely important
2. Very important
3. Somewhat important
4. Not too important
5. Not important at all
8. No answer/Don’t know (volunteered)
26. Just thinking about your own personal economic situation, do you feel that over the past twelve months things have gotten better, worse, or stayed about the same?
1. Better
2. Worse
3. Same
8. No answer/Don’t know (volunteered)
27. In general, do you feel that you should try to support a female candidate for office, even if you don’t agree with the female candidate on many issues, or doesn’t the gender of the candidate really matter to you?
1. Yes, should try
2. Gender doesn’t matter
8. No answer/Don’t know (volunteered)
Turning to another issue…
28. In general, do you approve or disapprove of the way President Bush is handling his job as President? (ACCEPT ONE RESPONSE)
1. Approve
2. Disapprove
8. No answer/Don’t know (volunteered)
Next, just a few questions to help us classify your responses…
F1. What is your age? (READ LIST ONLY IF NECESSARY)
1. 18-24
2. 25-29
3. 30-34

178
4. 35-39
5. 40–44
6. 45-54
7. 55-64
8. 65 or older
9. No answer/Don’t know (volunteered)
F2. Are you of Hispanic origin or descent?
1. Yes
2. No
8. No answer/Don’t know (volunteered)
F3. What is your race? Are you White, Black, Asian, or something else?
1. White
2. Black
3. Asian
4. Hispanic (volunteered)
5. Other (volunteered)
8. Don’t know/No answer (volunteered)
F4. What is the highest grade of schooling that you’ve completed? (READ LIST ONLY IF NECESSARY)
1. 8th grade or less
2. Some high school
3. High school graduate
4. Some college
5. College graduate
6. Postgraduate study/law or medical school
8. Don’t know/No answer (volunteered)
ALL FEMALE SCREENOUTS TO DEMOGRAPHICS SHOULD TERMINATE HERE
F5. Generally speaking, do you usually think of yourself as a (ROTATE DEMOCRAT/REPUBLICAN) Republican, a Democrat, an independent, or something else?
1. Republican (SKIP TO QF7)

179
2. Democrat (SKIP TO QF7)
3. Independent
4. Something else (SKIP TO QF7)
8. No answer/Don’t know (volunteered; SKIP TO QF7)
F6. Do you lean more toward the (SAME ROTATION AS QF5) Republican party or more toward the Democratic party?
1. Lean more toward Republican party
2. Lean more toward Democratic party
3. Don’t lean/Independent/Something else (volunteered)
8. No answer/Don’t know (volunteered)
F7. In politics as of today, do you consider yourself very conservative, somewhat conservative, moderate, somewhat liberal, or very liberal?
1. Very conservative
2. Somewhat conservative
3. Moderate
4. Somewhat liberal
5. Very liberal
6. Something else (volunteered)
8. Don’t know/No answer (volunteered)
F7a. What is your marital status? (READ LIST)
1. Married
2. Single, never married
3. Divorced/Separated
4. Widowed
8. Don’t know/No answer (volunteered)
F8. Do you have any children age 18 or under currently living at your home?
1. Yes, have children
2. No, do not
8. Don’t know/No answer (volunteered)
F8a. Are you or anyone in your household currently caring for a parent?

180
1. Yes
2. No
8. Don’t know/No answer (volunteered)
F8b. Do you, or does anyone in your household currently own a firearm?
1. Yes, own a firearm
2. No, do not
8. Don’t know/No answer (volunteered)
F9. Are you currently employed full-time, part-time, laid off but looking for work, retired, a student, a homemaker, or something else?
1. Employed full-time
2. Employed part-time
3. Laid off but looking for work
4. Retired
5. Student
6. Homemaker
7. Something else
8. Don’t know/No answer (volunteered)
F11. Did you vote in your state's Democratic party presidential primary election earlier this year or participate in any of the Democratic state caucuses?
1. Yes
2. No (SKIP TO F13)
8. Don't know/No answer (SKIP TO F13)
F12. Do you recall which Democratic Party candidate you supported in your state's primary election or caucus?
1. Hillary Clinton
2. Barack Obama
3. John Edwards
4. Chris Dodd
5. Joe Biden
6. Another Candidate

181
8. Don't know/No answer (volunteered)
F13. Just for classification purposes, do you consider yourself Catholic, Protestant, Jewish, or some other religion?
1. Catholic
2. Protestant
3. Jewish (SKIP TO F16)
4. Some other religion
8. Don’t know/No answer (volunteered)
F14. Do you consider yourself an evangelical or born-again Christian?
1. Yes
2. No
8. Don’t know/No answer (volunteered)
F15. Do you consider yourself a feminist, however you wish to define it?
1. Yes
2. No
8. Don’t know/no answer (volunteered)
F16. Aside from weddings and funerals how often do you attend religious services... more than once a week, once a week, once or twice a month, a few times a year, seldom, or never?
1. More than once a week
2. Once a week
3. Once or twice a month
4. A few times a year
5. Seldom
6. Never
8. Don’t know/no answer (volunteered)
F17. Finally, just for classification purposes, was your total family income before taxes last year: (READ LIST) PROBE: Your best estimate is fine.
1. Less than $20,000
2. $20,000 to just under $35,000

182
3. $35,000 to just under $50,000
4. $50,000 to just under $75,000
5. $75,000 to just under $100,000
6. $100,000 to just under $150,000
7. $150,000 or more
8. Don’t know/no answer (volunteered)
ASK IF: NO COLLEGE EDUCATION [F4= 1,2,3] AND AGES 45 AND OLDER [F1=6,7,8], AND WHITE [F3=1]:
F18. Thank you very much for your participation. May a reporter from Time Magazine call you to talk about some of the things we've been discussing?
1. Yes
2. No (SKIP TO END)
8. Don’t know/No answer (volunteered; SKIP TO END)
F18a. What would be the best day to reach you, tomorrow or over the weekend?
1. Tomorrow
2. Over the weekend
8. Don’t know/No answer (volunteered; SKIP TO F18c)
F18b. And what time is the best to reach you [INSTER ANSWER ABOVE]?
1. RECORD TIME
8. Don’t know/No answer
F18c. May I please have a phone number to reach you at and your first name so the reporter will know who to ask for on that day?
1. Record First name and phone number
8. Don’t know/No answer
THANK YOU FOR YOUR PARTICIPATION!