
The physics of a plasma focus
16
The physics of a plasma focus M. Scholz, B. Bie´ nkowska, I. Ivanova–Stanik, L. Karpi´ nski, R. Miklaszewski, M. Paduch, W. Ste ¸pniewski, K. Tomaszewski Institute of Plasma Physics and Laser Microfusion Hery Str. 23, P.O. Box 49, 00–908 Warsaw, Poland M. J. Sadowski Andrzej Soltan Institute for Nuclear Studies, Otwock– ´ Swierk Received 30 April 2004 This invited lecture concerns Plasma–Focus (PF) devices belonging to the family of the dynamic Z–pinches which produce dense, hot and magnetized plasmas. The plasma is formed by an inter–electrode discharge of a capacitor bank, and the dynamics of the current sheet has two different phases: 1 – A long–time phase (lasting several microseconds) of a breakdown and the axial acceleration, during which the current sheath is formed and pushed out by the Lorentz force; 2 – A short–time phase, lasting a few hundreds nanoseconds, during which the pinch is created and (after the maximum compression) disrupted by instabilities. This lecture presents physics governing the behavior of current–carrying plasma in PF discharges. The lecture describes different phases of the PF phenomena: the breakdown and the early stage of the current sheath formation, dynamics of the axial acceleration (run–down) and the radial implosion, the formation of a transient quasi–equilibrium near the stagnation point, and a post–pinch phase. Some experimental results obtained with a large (mega–joule) PF–1000 facility are presented and discussed. PACS : 52.58.Lq Key words : z–pinches, plasma focus, breakdown, run–down phase, radial implosion 1 Introduction Plasma Focus devices belong to the family of the dynamic Z–pinches, which are self–constricted plasma configurations. These configurations are very interesting objects of plasma physics, because of their occurrence in Space (current channels in galactic scales, solar flares) and on Earth (aurora borealis, lighting, etc.), and because of their importance for different applications. The characteristic features of such configurations are as follows: 1. The total current of the discharge flows through a plasma column. 2. Plasma is compressed by the magnetic field surrounding the plasma cylinder. 3. Any other external magnetic fields can be neglected. The first important step to analyze such configurations was made in 1934 by W. H. Bennett, who found conditions for a quasi–stable structure of a current– carrying plasma column with a finite temperature. The next was L. Tonks, who C170 Czechoslovak Journal of Physics, Vol. 54 (2004), Suppl. C
-
Upload
independent -
Category
Documents
-
view
2 -
download
0
Transcript of The physics of a plasma focus

The physics of a plasma focus
M. Scholz, B. Bienkowska, I. Ivanova–Stanik, L. Karpinski,
R. Miklaszewski, M. Paduch, W. Stepniewski, K. Tomaszewski
Institute of Plasma Physics and Laser MicrofusionHery Str. 23, P.O. Box 49, 00–908 Warsaw, Poland
M. J. Sadowski
Andrzej So�ltan Institute for Nuclear Studies, Otwock–Swierk
Received 30 April 2004
This invited lecture concerns Plasma–Focus (PF) devices belonging to the family ofthe dynamic Z–pinches which produce dense, hot and magnetized plasmas. The plasmais formed by an inter–electrode discharge of a capacitor bank, and the dynamics of thecurrent sheet has two different phases: 1 – A long–time phase (lasting several microseconds)of a breakdown and the axial acceleration, during which the current sheath is formedand pushed out by the Lorentz force; 2 – A short–time phase, lasting a few hundredsnanoseconds, during which the pinch is created and (after the maximum compression)disrupted by instabilities.
This lecture presents physics governing the behavior of current–carrying plasma in PFdischarges. The lecture describes different phases of the PF phenomena: the breakdownand the early stage of the current sheath formation, dynamics of the axial acceleration(run–down) and the radial implosion, the formation of a transient quasi–equilibrium nearthe stagnation point, and a post–pinch phase. Some experimental results obtained witha large (mega–joule) PF–1000 facility are presented and discussed.
PACS : 52.58.LqKey words: z–pinches, plasma focus, breakdown, run–down phase, radial implosion
1 Introduction
Plasma Focus devices belong to the family of the dynamic Z–pinches, which areself–constricted plasma configurations. These configurations are very interestingobjects of plasma physics, because of their occurrence in Space (current channelsin galactic scales, solar flares) and on Earth (aurora borealis, lighting, etc.), andbecause of their importance for different applications.
The characteristic features of such configurations are as follows:
1. The total current of the discharge flows through a plasma column.
2. Plasma is compressed by the magnetic field surrounding the plasma cylinder.
3. Any other external magnetic fields can be neglected.
The first important step to analyze such configurations was made in 1934 byW.H. Bennett, who found conditions for a quasi–stable structure of a current–carrying plasma column with a finite temperature. The next was L. Tonks, who
C170 Czechoslovak Journal of Physics, Vol. 54 (2004), Suppl. C

The physics of a plasma focus
investigated the constriction of an arc under its own magnetic field. To describesuch configurations he introduced the term “Z–pinch”. The prefix “Z” means thata plasma column constricts at the z–axis under influence of a magnetic field inducedby the axial current flowing through this plasma.
Intensive studies of linear Z–pinches were connected with research on controlledthermonuclear fusion. For this research, in early Z–pinch experiments [1], [2] therewas used an experimental scheme consisting of two main parts: 1 – A condenserbank charged to a high voltage, e.g. about 30 kV; 2 – A cylindrical tube, filled witha deuterium gas. The walls of the tube were made of an insulator and the end–plugs(electrodes) were made of a metal. The discharge was initiated by means of a sparkgap. The high–voltage (e.g. 30 kV) was then applied to the electrodes of the tubeand it caused the gas breakdown inside the tube (usually near its walls). After thata current–carrying plasma sheath was formed. The current– induced magnetic field(BΘ), and in fact an electromagnetic force (jzBΘ) pushed the plasma towards theaxis. During the implosion of the plasma sheath, the neutral deuterium gas waspushed (snow–plowed) in the radial direction, accelerated, and heated by a shockwave. Therefore, it was ionized and transformed into a plasma state. At the end ofthe implosion the plasma tube reached the z–axis and formed a plasma column.
In the final stage of the dynamic radial implosion (of the Z–pinch) one may as-sume that the plasma column can be described by formulas derived by Bennett. TheBennett equilibrium assumes that the plasma column radius (a) remains constantin time, as a result of equality of two pressures acting upon the plasma surface:
– A gas–kinetic pressure (equal to p = 2nT , where n = ni = ne is a density ofthe deuterium plasma, Te = Ti is the plasma temperature);
– A magnetic pressure (equal to B2/8π).
For such equilibrium Bennett found a fundamental relation, which can be writ-ten as follows:
NT =I2
4c2
This relation combines plasma parameters (since N = πa2n is the ion densityper unit length of the pinch and T is plasma temperature) with the importantelectrical parameter (because I is the total current intensity).
In the case of a high–pressure deuterium gas or DT mixture, fusion reactionscan occur. Hence, the main idea was to heat a deuterium gas or DT mixture bythe adiabatic– and/or shock–compression in a Z–pinch and to keep that systemin the equilibrium state until a sufficient amount of fusion energy is released. Ifwe combine formulas for Bennet equilibrium and neutron production, then we geta simple equation for a neutron output (Yn). From this equation it follows thatfor constant pinch parameters, the neutron yield (Yn) is proportional to the totalcurrent (flowing through the pinch) in the forth power (I4). This relation definesa simple scaling law for the neutron production in the Z–pinch configuration.
Czech. J. Phys. 54 (2004) C171
M. Scholz et al.
ELECTRON BEAMS
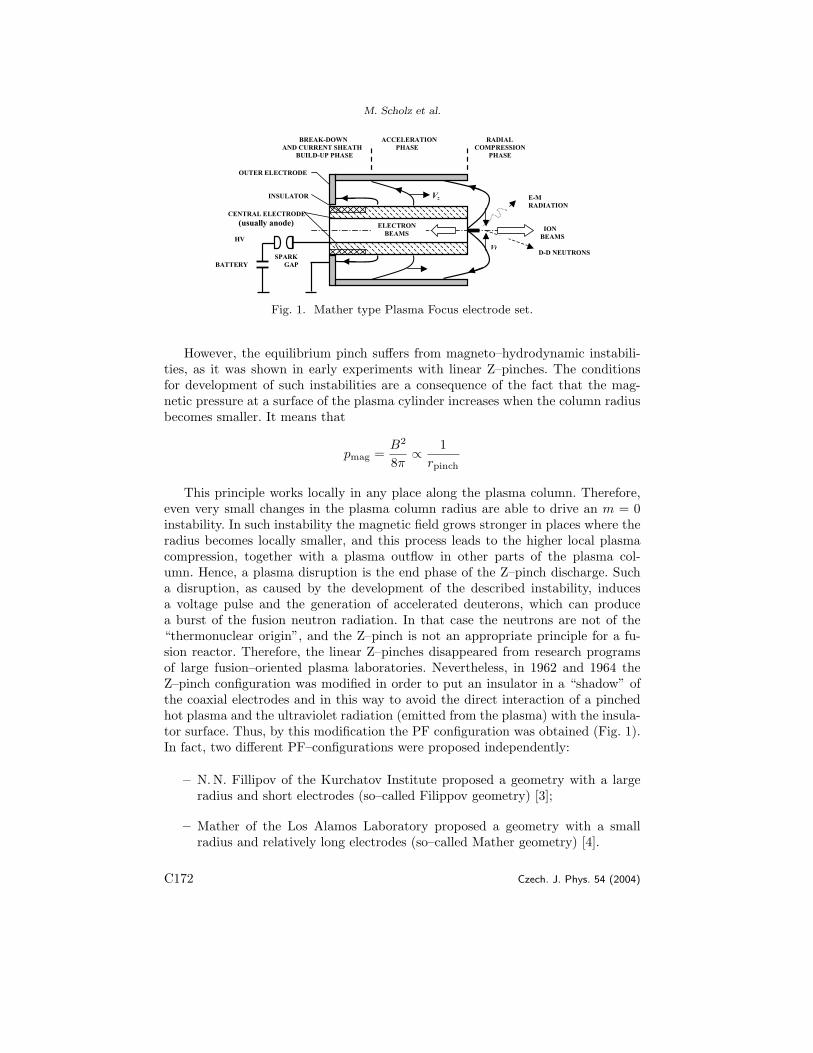
BREAK-DOWN ACCELERATION RADIAL AND CURRENT SHEATH PHASE COMPRESSION BUILD-UP PHASE PHASE
OUTER ELECTRODE
INSULATOR Vz CENTRAL ELECTRODE (usually anode) HV SPARK BATTERY GAP
E-M RADIATION
ION BEAMS
D-D NEUTRONSVr
Fig. 1. Mather type Plasma Focus electrode set.
However, the equilibrium pinch suffers from magneto–hydrodynamic instabili-ties, as it was shown in early experiments with linear Z–pinches. The conditionsfor development of such instabilities are a consequence of the fact that the mag-netic pressure at a surface of the plasma cylinder increases when the column radiusbecomes smaller. It means that
pmag =B2
8π∝ 1
rpinch
This principle works locally in any place along the plasma column. Therefore,even very small changes in the plasma column radius are able to drive an m = 0instability. In such instability the magnetic field grows stronger in places where theradius becomes locally smaller, and this process leads to the higher local plasmacompression, together with a plasma outflow in other parts of the plasma col-umn. Hence, a plasma disruption is the end phase of the Z–pinch discharge. Sucha disruption, as caused by the development of the described instability, inducesa voltage pulse and the generation of accelerated deuterons, which can producea burst of the fusion neutron radiation. In that case the neutrons are not of the“thermonuclear origin”, and the Z–pinch is not an appropriate principle for a fu-sion reactor. Therefore, the linear Z–pinches disappeared from research programsof large fusion–oriented plasma laboratories. Nevertheless, in 1962 and 1964 theZ–pinch configuration was modified in order to put an insulator in a “shadow” ofthe coaxial electrodes and in this way to avoid the direct interaction of a pinchedhot plasma and the ultraviolet radiation (emitted from the plasma) with the insula-tor surface. Thus, by this modification the PF configuration was obtained (Fig. 1).In fact, two different PF–configurations were proposed independently:
– N.N. Fillipov of the Kurchatov Institute proposed a geometry with a largeradius and short electrodes (so–called Filippov geometry) [3];
– Mather of the Los Alamos Laboratory proposed a geometry with a smallradius and relatively long electrodes (so–called Mather geometry) [4].
C172 Czech. J. Phys. 54 (2004)
The physics of a plasma focus
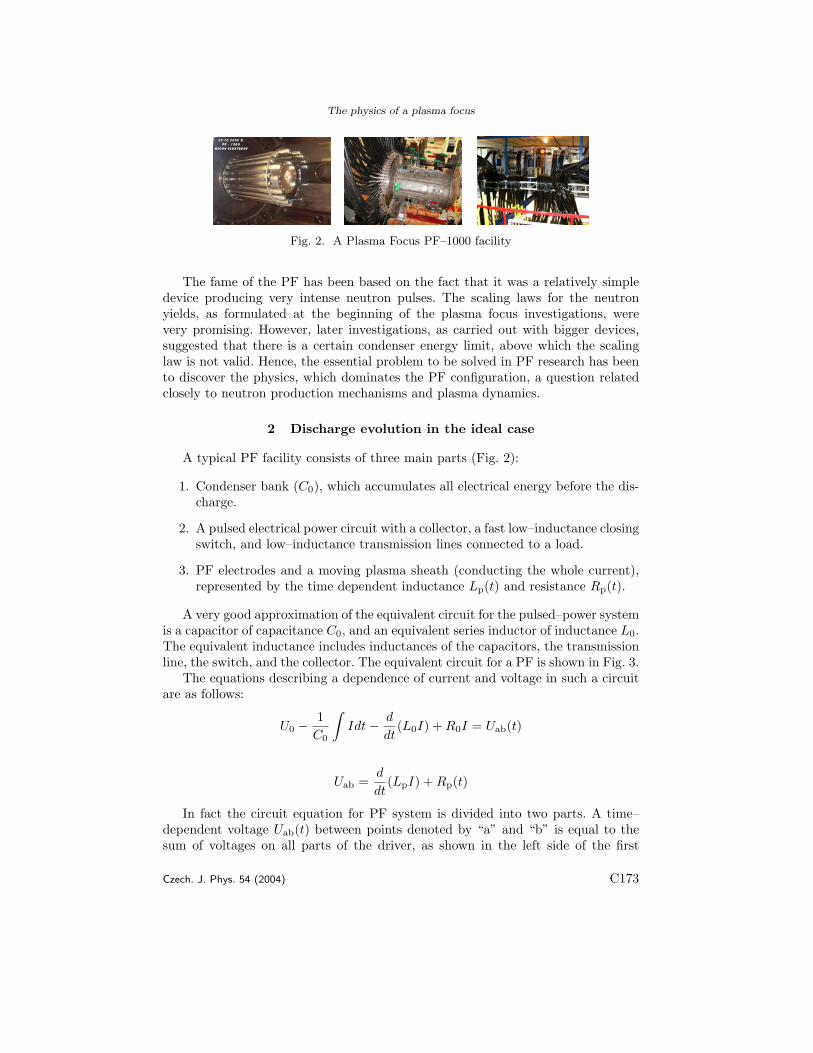
Fig. 2. A Plasma Focus PF–1000 facility
The fame of the PF has been based on the fact that it was a relatively simpledevice producing very intense neutron pulses. The scaling laws for the neutronyields, as formulated at the beginning of the plasma focus investigations, werevery promising. However, later investigations, as carried out with bigger devices,suggested that there is a certain condenser energy limit, above which the scalinglaw is not valid. Hence, the essential problem to be solved in PF research has beento discover the physics, which dominates the PF configuration, a question relatedclosely to neutron production mechanisms and plasma dynamics.
2 Discharge evolution in the ideal case
A typical PF facility consists of three main parts (Fig. 2):
1. Condenser bank (C0), which accumulates all electrical energy before the dis-charge.
2. A pulsed electrical power circuit with a collector, a fast low–inductance closingswitch, and low–inductance transmission lines connected to a load.
3. PF electrodes and a moving plasma sheath (conducting the whole current),represented by the time dependent inductance Lp(t) and resistance Rp(t).
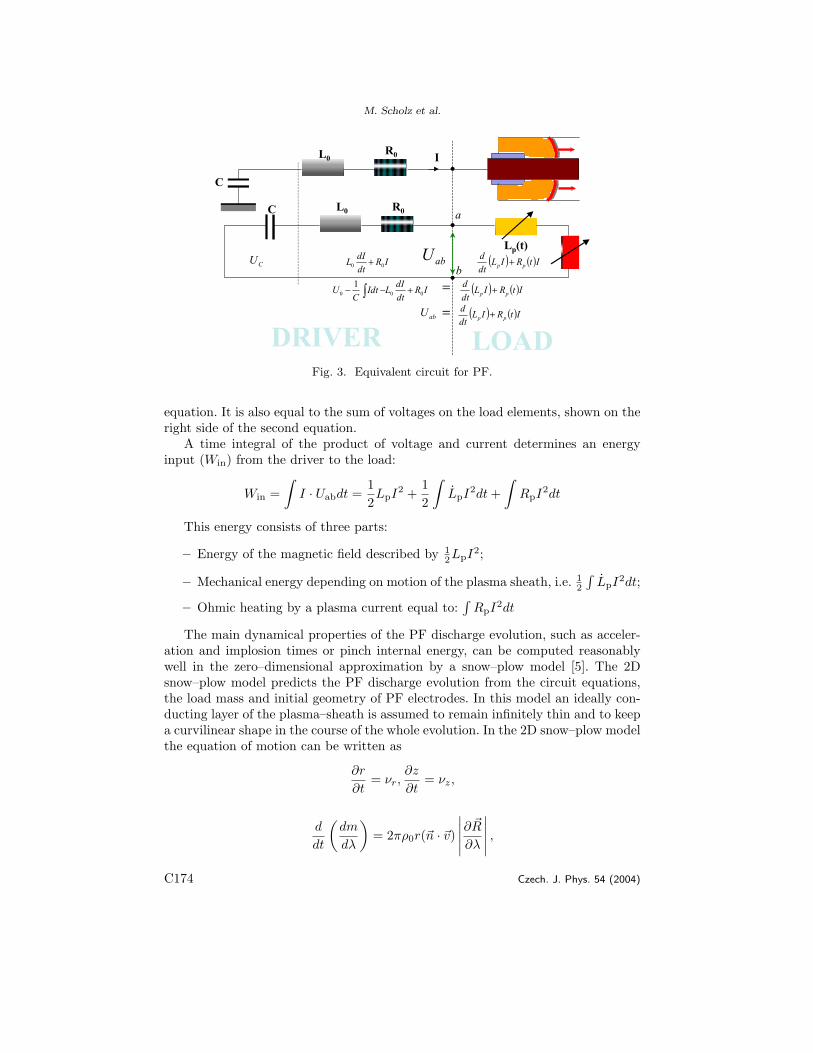
A very good approximation of the equivalent circuit for the pulsed–power systemis a capacitor of capacitance C0, and an equivalent series inductor of inductance L0.The equivalent inductance includes inductances of the capacitors, the transmissionline, the switch, and the collector. The equivalent circuit for a PF is shown in Fig. 3.
The equations describing a dependence of current and voltage in such a circuitare as follows:
U0 − 1C0
∫Idt − d
dt(L0I) + R0I = Uab(t)
Uab =d
dt(LpI) + Rp(t)
In fact the circuit equation for PF system is divided into two parts. A time–dependent voltage Uab(t) between points denoted by “a” and “b” is equal to thesum of voltages on all parts of the driver, as shown in the left side of the first
Czech. J. Phys. 54 (2004) C173
M. Scholz et al.
C L0
I
Lp(t)
R0
L0R0
C
CU IRdtdIL 00 + ( ) ( )ItRIL
dtd
pp +abU
a
bIR
dtdILIdt
CU 000
1 +−− � = ( ) ( )ItRILdtd
pp +
abU =
DRIVER LOAD( ) ( )ItRIL
dtd
pp +
Fig. 3. Equivalent circuit for PF.
equation. It is also equal to the sum of voltages on the load elements, shown on theright side of the second equation.
A time integral of the product of voltage and current determines an energyinput (Win) from the driver to the load:
Win =∫
I · Uabdt =12LpI2 +
12
∫LpI2dt +
∫RpI2dt
This energy consists of three parts:
– Energy of the magnetic field described by 12LpI2;
– Mechanical energy depending on motion of the plasma sheath, i.e. 12
∫LpI2dt;
– Ohmic heating by a plasma current equal to:∫
RpI2dt
The main dynamical properties of the PF discharge evolution, such as acceler-ation and implosion times or pinch internal energy, can be computed reasonablywell in the zero–dimensional approximation by a snow–plow model [5]. The 2Dsnow–plow model predicts the PF discharge evolution from the circuit equations,the load mass and initial geometry of PF electrodes. In this model an ideally con-ducting layer of the plasma–sheath is assumed to remain infinitely thin and to keepa curvilinear shape in the course of the whole evolution. In the 2D snow–plow modelthe equation of motion can be written as
∂r
∂t= νr,
∂z
∂t= νz,
d
dt
(dm
dλ
)= 2πρ0r(�n · �v)
∣∣∣∣∣∂�R
∂λ
∣∣∣∣∣ ,C174 Czech. J. Phys. 54 (2004)

The physics of a plasma focus
0 1 2 3 4 5 6 7 8 90
100
200
300
400
Uab
[kV]
time [μμμμs]]]]0 1 2 3 4 5 6 7 8 9
0,0
0,5
1,0
1,5
2,0
cur
rent
[MA
]
time [μμμμs]
Fig. 4. Current and voltage calculated from 2D snowplow model.
d
dt
(dm
dλ· ∂ �R
∂t
)=
μ0
4πI2 1
r�n
∣∣∣∣∣∂�R
∂λ
∣∣∣∣∣ ,where �R = �err(λ, t) + �ezz(λ, t) describes the shape of the plasma sheath in the PFsystem, λ is a local co-ordinate along the sheath, dm is the total mass of an elementof length dλ, and ρ0 - a density of a gas filling. From this equation of motion onecan evaluate Lp(t) and in consequence also I(t) (for a current–sheath). Uab(t) canalso be calculated from the described circuit equation. The important practicalpoint is possibility to compare the calculated and measured electrical parameters.Then the electrical circuit parameters can be determined as a result of the “circuitoptimization”, when the energy input to electrodes (Win) is maximized. The resultsof such calculations for the mega–joule PF–1000 discharge are shown in Fig. 4.
Measurements of current and voltage waveforms (i.e. as a function of time dur-ing a discharge) belong to the so–called routine diagnostics. The total current ofthe discharge (I) is usually measured with a Rogovsky coil and it shows a currentdip (ΔI), which results from an inductance grow–up during the fast current–sheathimplosion. At the instant when the pinch has the minimum radius a current deriva-tive (dI/dt) shows a narrow spike, which is used as a time marker of the pinching.Voltage changes as a function of time, U(t), are measured upon the resistance ofa voltage divider, and they show distinct voltage spikes during the breakdown andbeginning of the rundown phase, and another group of the voltage spikes duringthe sheath implosion and pinching.
The set of three waveforms (Fig. 5) delivers important information on plasmabehavior during the PF discharge and it can be used for pinch diagnostic purposes.
For instance, from the current oscillogram (Fig. 5) we get information aboutcurrent changes during subsequent phases of the investigated discharge; namelyabout a fast current rise just after the breakdown, the current maximum value dur-ing the run–down phase, a current “dip” during the implosion phase, and a currentvalue through the pinch column during the final pinch phase.
The estimates, which are based on the snow–plow model, appear to be quitereasonable, but the disadvantage of this model is that the pinch plasma parametersand its evolution cannot be calculated.
Czech. J. Phys. 54 (2004) C175

M. Scholz et al.
0 2 4 6 8 10 12 141,01,21,41,61,82,02,22,42,62,83,0 shot 2544
volta
ge [V
]t [μμμμs]
0 2 4 6 8 10 12 14-0,5
0,0
0,5
1,0
1,5
2,0 shot 2544
(t) [M
A]
t[μμμμs]0 2 4 6 8 10 12 14
0,40,60,81,01,21,41,61,82,02,22,42,6
shot 2544
volta
ge [v
]
t[μμμμs]
Fig. 5. Typical current and voltage oscillograms.
3 Hydrodynamic discharge evolution
Many authors have calculated the dynamics of PF discharges. The results oftwo–dimensional MHD simulations of the PF discharge were reported by [6], [7]and [8]. In fact, to obtain a good quantitative agreement with experimental results,one needs computer codes which are based on a more sophisticated physical model.
The main phase of the current sheet in the PF discharge evolution can bedescribed in the frame of a non–ideal MHD model. It should, however, be sup-plemented by taking into account atomic processes (i.e. ionization) in a neutralgas.
The magneto–hydrodynamic equations of such a code are described in detailselsewhere [9]. They can be solved for six unknown variables, namely the mass den-sity ρ, the radial and axial velocities ur and uz, the ion and electron temperaturesTi and Te and the azimuthal magnetic field Bφ.
Transport coefficients can be written according to Braginskii. Hence, we canobtain the following system of equations:
dρ
dt= −ρ∇ · �u
ρd�u
dt= −∇p + ∇Π +�j × �B
ρcνedTe
dt= −∇pe∇ · �ue −∇ · �qe +
1ene
�R ·�j − Qe−i − Qioniz
ρCνidTi
dt= −pi∇ · �u + Πi · ∇�u −∇ · �qi + Qe−i
d �B
dt= ∇×
[�u × �B +
1ene
(∇pe − �R) +1
ene
�j × �B
],�j = μ0∇× �B
where ddt ≡ ∂
∂t + �u · ∇, �u = (ur, 0, uz), �B = (0, BΘ, 0), �j = (jr, 0, jz), p = pe + pi,Π = Πi +Πart, νe = νei +νen, νi = νii +νin; cve, cvi are the electron and ion specificheat, respectively.
C176 Czech. J. Phys. 54 (2004)
The physics of a plasma focus
The system of MHD equations can be closed by the circuit equations:
d
dt[L(t)I] + RI = U
dU
dt= − I
C
Apart from the ion velocity �u, one also needs the electron (current) velocity:
�ue = �u − mi
eρ�j
When the current velocity is high enough different current micro–instabilitiescan grow to a level, which gives a high anomalous resistivity. In the model describedthe anomalous resistivity caused by lower hybrid and modified Buneman instabil-ities has been included. In the equation for the electron temperature there wereincluded: the Joule heating, an energy exchange with ions as well as the ionizationand radiation losses. The equation applied for the ion temperature contained theenergy exchange between ions and electrons and the viscous heating.
In an inelastic process it is necessary to include the electron impact ionizationfrom the ground state, the radiative recombination and the three–body recombina-tion.
Since the ionization and recombination are functions of the electron temperatureand density, respectively, it is necessary to solve the resulting equation:
dne
dt= ne(n0 − ne) · S − αrn
2e − β3Bn3
e
It should be solved together with the energy equation for the electron compo-nent.
In our considerations the boundary conditions were taken, respectively:
– On the pinch surface: �n · �qe = 0, �n · �qi = 0, �n · (pI − Π) = 0, BΘ(rp) = I5rp
;
– On the electrode: un = 0, ∂Te
∂n = 0, ∂Ti
∂n = 0;
– On the z–axis: ur = 0, BΘ = 0, ∂Te
∂r = 0, ∂Ti
∂r = 0.
In our PF–1000 experimental facility the outer electrode has been manufacturedas a squirrel–type rod arrangement, but in the model the outer electrode has beenassumed as a solid tube.
The calculations were started after the breakdown phase, when the currentsheath has already been formed. It was assumed that the current sheath starts tomove from the very end of the tubular insulator, at z = −0.5 m from the end ofthe inner electrode.
For numerical simulations the parameters of the PF–1000 facility have beentaken as follows: the radius of the inner electrode equal to 0.12 m, the radius of
Czech. J. Phys. 54 (2004) C177

M. Scholz et al.
a)
b) c)
Fig. 6. Numerical results from 2D MHD model.
the outer electrode equal to 0.18 m, the radius of the axial opening in the innerelectrode equal to 0.015 m, and the electrode length of 0.60 m. The dimensionsof the computation region at the end of the electrode has been restricted do therectangular area with rm = 0.3 m and zm = 0.26 m.
The computations started from the room temperature Te = Ti = 300 K, anda low initial ionization degree of ionization equal 1%. The filling pressure of thedeuterium gas was 400 Pa. The results of the performed calculations are shown inFig. 6
The maximum current of 2.3 MA (Fig. 6a), as obtained from the computa-tions has appeared to be about 15 % greater than the measured one. The velocitycomputed for the run down phase has also been greater than the measured value:uz exp = 8 × 10⁴ m/s, while uz comp = 8.9 × 10⁴ m/s.
A density profile, as computed for maximum compression, is shown in Fig.6b.It should be noted that the plasma sheath is relatively thick and that the densityprofile is parabolic one. Near the z–axis, for the region with the minimal radius ofthe plasma column equal to 0.048 m, the plasma density is equal to 5 × 1025 m−3.
The initial plasma–sheath velocity during the radial collapse phase is rather low,but when the sheath is near the z–axis it grows rapidly up to the value of 4 × 10⁴
m/s. There are not enough experimental data available for this phase to comparethem with computations.
A shock wave reaches pinch axis after 8.5 × 10⁻⁶ s, and the ion temperaturegrows up to 1.2 keV in this instant. From Fig. 6c one can see that the maximumvalue of the electron temperature is lower, because it is equal to about 600 eV. Thereis no evidence of the development of the Rayleigh–Taylor instability in the radialcompression phase. The curvature of the current sheath and the axial plasma flowstabilize the plasma boundary. The minimal radius of the pinch has been obtained
C178 Czech. J. Phys. 54 (2004)

The physics of a plasma focus
Fig. 7. Scheme of the passive optical system.
at a distance of 0.015 m from the anode end.The computer simulations were stopped at the instant of the current sheath
stagnation near the z–axis, when the MHD model is not valid anymore.These preliminary results of our simulations agree qualitatively with the exper-
imental results, which have been obtained with fast framing cameras. To study theevolution of the plasma, the use was made of a three–frame optical camera with anexposure time of about 1 ns (Fig. 7). In that case, image converters were used as fastshutters and light amplifiers. That camera allowed capturing frame plasma–imageswith the spatial resolution of 0.4 mm.
The delay time between subsequent frames was within the range of 10 ÷ 20 ns.To eliminate influence of intense spectral lines, an interference filter (with λmax =593 nm, FWHM = 6 nm) was put into the optical path of the passive opticaldiagnostic system. Its spectral band enabled to record the continuous radiationonly.
A sequence of the frame camera pictures, as taken for discharges carried outwith the deuterium filling (p = 400 Pa), are shown in Fig. 8. The images weretaken at different instants during the radial implosion (Fig. 8a), in the minimumradius stage (Fig. 8b), and in the post–pinch instability phase (Fig. 8c).
In the obtained images one can see strong perturbations of a plasma sheathsurface. These surface perturbations could be traced back to those appearing earlyupon the sheath during the radial compression. Such a perturbation remains moreor less frozen until the radial compression end and it does not tend to destroy theintegrity of the collapsing column. The upper part of the collapsing sheath hasa low radial velocity during the compression. The observed perturbations have infact a ring–like shape around the surface of the plasma column, as is shown inFig. 8a. The trajectory of characteristics points (the maximum or minimum) ofthese perturbations is approximately perpendicular to the z–axis of the electrodes.
Czech. J. Phys. 54 (2004) C179

M. Scholz et al.
-0.005 μs 0.005 μs 0.025 μs
AB
C
Fig. 8. Sequence of high–speed pictures taken with a framing camera, which illustrates theformation of a dense plasma column. The letters denote: A – the distinct pinch column,B – the collapsing current sheath, and C – a distinct mhd instability. The anode was on
the left side of the recorded pictures.
The pinch column tends to develop multiple necking when the pinch evolves. Anexample is shown in Fig. 8b. The necking develops at different z–positions alongthe pinch column, and each necking is pushing a plasma material away from theneck. The appearance of two such regions would produce a jet–like expansion ofplasma from the junction between the regions. This effect can be seen by comparingthe regions marked by A, B and C upon the picture shown in Fig. 8. In thatcase the letters A and B mark the positions of the two collapsing and neckingregions, while the region C develops evidently into a large–scale perturbation. Thisperturbation has a distinct border and the amplitude of about 0.05 m. This typeof the perturbation is stable and its lifetime is about 1 μs. It should be noted thatthe described large–scale perturbation appears about 0.08 m from the anode.
The period of the plasma column creation lasts about 200 ns. After this periodthere should be formed a plasma column of about 0.12 m in length. Such a longtime of the plasma column creation results in a disruption of the earliest createdpart (see position A) of the plasma column, before the creation process of the wholepinch is finished. As a rule, the minimum radius (rmin) of the plasma column inany cross–section amounts to 0.007 m.
4 Non–MHD phenomena
In the PF scheme one relies on the development of self–consistent phenomenaoccurring after the maximum compression, i.e. during the cylindrical re–expansionof the plasma column (Fig. 9). Anomalous microscopic effects are probably respon-sible for the charged particles heating. In general, instabilities create a favorablesituation for the onset of relaxation processes within the magnetized plasma, whichlead to the formation of a sheath plasma configuration (large plasma perturbations).
The lifetime of this configuration exceeds by an order of magnitude the tran-sit time (rpinch/νT ). In such a case, the efficiency of an energy transfer from thesource of magnetic energy stored in the system, as determined by the distributionof current densities in the plasma column, is of primary importance. A specificphenomenon called the micro–instability, which is the source of plasma turbulenceand self–induced anomalous resistivity, is responsible for the transfer of magnetic
C180 Czech. J. Phys. 54 (2004)

The physics of a plasma focus
Fig. 9. Frame picture after pinch maximum compression.
0,5 1,0 1,5 2,0 2,5
p = 400 PaUb = 33.0 kVEb = 734.0 kJImax = 1.8 MAL1 = 18858L2 = 16390L3 = 13645L4 = 28948L5 = 7476
t [μs]
shot 2544
U(t)
dI/dt
Fig. 10. dI/dt and U(t) traces for the moment of maximum compression.
energy stored in the system to the pinch plasma. This phenomenon is a source ofnon–thermal electrons and ions, hard X–rays, and fusion–produced neutrons.
An experimental evidence for existence of such resistivity [4] are oscillogramsof voltage changes in the course of the discharge (e.g. Fig. 10). Voltage spikes, asobserved during the implosion (ΔUL) and at the end of pinching (ΔUR), are manytimes higher than the condenser bank charging voltage (U0).
Formulas, which demonstrate a dependence of electrical parameters (i.e. of in-ductance (L) and resistivity (Rp)) on temporal changes of the macroscopic plasmaradius (drp/dt) and physical microscopic phenomena, are as follows:
L(t) =μ0
2πl ln
(r0
rp(t)
),
Rp =l
πr2pσ
where l is the length of the pinch, r0 and rp are radii of the inner electrode andpinch, respectively. The electrical conductivity σ is equal to
σ =ne2
meνeff=
ne2
me(νei + νanom).
Czech. J. Phys. 54 (2004) C181

M. Scholz et al.
The total plasma resistance (Rp(t)) is dependent on collisions of current–carryingelectrons in the pinch plasma. An effective collision frequency (νeff) is a sum ofclassical electron–ion collisions (νei) and electron collisions with micro–turbulencecollective structures formed inside the pinch. For typical micro–instabilities, e.g. themodified Buneman and lower–hybrid instabilities, the effective collision frequency isdependent on the ratio of a drift velocity (vd), which is the axial streaming velocityof electrons, to the thermal chaotic velocity of plasma electrons (vth). Therefore,the condition for driving micro–instabilities says that vd should be larger than vth.Using the formulas for the total current, the thermal chaotic electron velocity andthe Bennet relation, one can get the ratio
vd
vth=
5.2 × 10¹⁶
N1/2
It appears that the condition for driving micro–instabilities, i.e. νd
νth
> 1, dependson the total number of ions in the pinch cross–section (N), only [5]. During thepinching process in the PF discharge the total number of ions in the pinch is loweredas a result of a particle outflow through the open ends of the pinch. The value Ncan locally become very small, e.g. in the neck of the m = 0 instability. This leadsto driving local micro–instabilities and plasma turbulence, causing a grow–up ofthe anomalous resistivity. As a result, the local anomalous ohmic heating leads tothe plasma expansion and disruption of the pinched plasma column. Therefore, onecan get an induced electrical field and observe non–thermal ions, fast electrons,X–rays and neutrons.
Such localized regions of the increased emission are positioned roughly alongthe plasma focus column. They could be observed as a bright spots or elongatedpinches (Fig. 8).
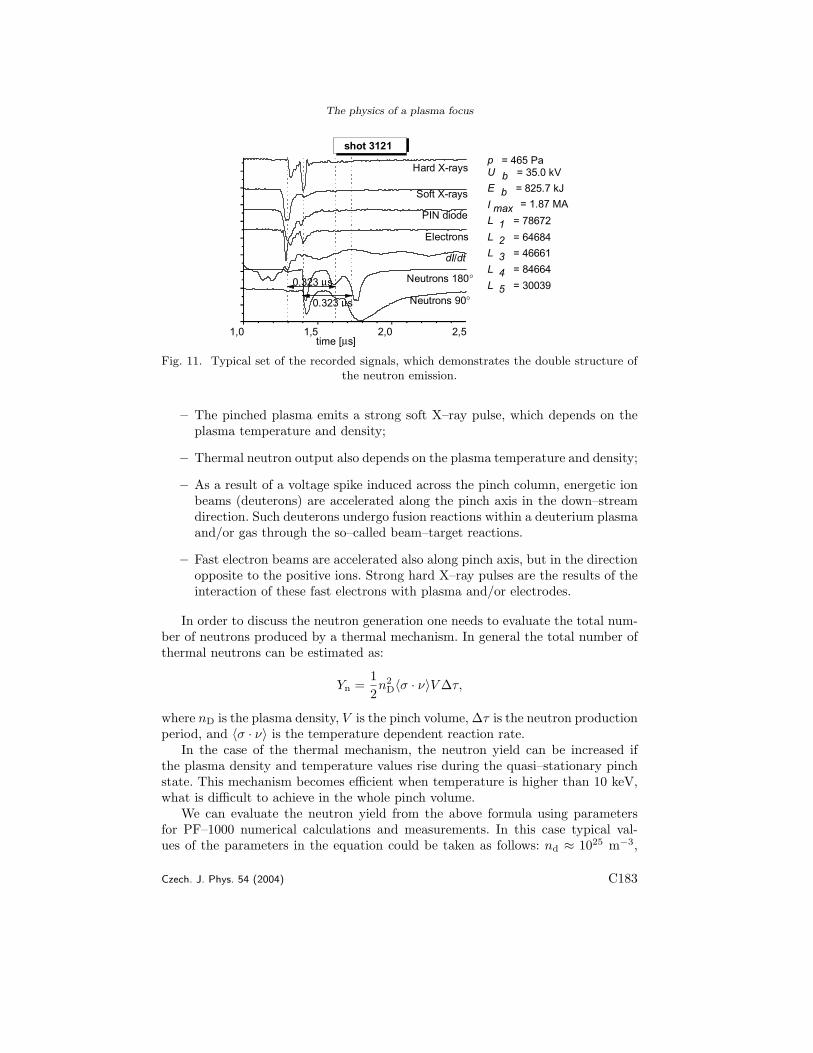
Some examples of typical waveforms are shown in Fig. 11. Looking from top tobottom, there are presented hard X–rays (8÷30 keV), soft X–rays (3÷8 keV), softX–rays recorded by a PIN diode (0.8 ÷ 4 keV), fast electron beams, the Rogowskicoil signal dI/dt and fusion–produced neutrons (recorded at 90◦ and 180◦).
For time–resolved measurements a reference time instant is usually the currentdip recorded by the PIN diode. This signal corresponds to the maximum compres-sion (i.e. the maximum density and temperature). The presented results show thecorrelation between phenomena described above.
5 Summary
Any particular discharge of the PF type runs through three main stages, fromthe filling gas breakdown and formation of a current–sheath, through the run–downphase, until the maximum compression. After that there is a short final phase(a few tens nanoseconds), when the pinch exists, until it is disrupted by differentinstabilities. The most important and interesting phenomena are induced in thepinch and post–pinch phases. These phenomena are as follows:
C182 Czech. J. Phys. 54 (2004)
The physics of a plasma focus
1,0 1,5 2,0 2,5
0.323 μs
Hard X-rays
Soft X-rays
PIN diode
Electrons
dI/dt
Neutrons 180°
Neutrons 90°
time [μs]
p = 465 PaU b = 35.0 kVE b = 825.7 kJI max = 1.87 MAL 1 = 78672L 2 = 64684L 3 = 46661L 4 = 84664L 5 = 30039
shot 3121
0.323 μs
Fig. 11. Typical set of the recorded signals, which demonstrates the double structure ofthe neutron emission.
– The pinched plasma emits a strong soft X–ray pulse, which depends on theplasma temperature and density;
– Thermal neutron output also depends on the plasma temperature and density;
– As a result of a voltage spike induced across the pinch column, energetic ionbeams (deuterons) are accelerated along the pinch axis in the down–streamdirection. Such deuterons undergo fusion reactions within a deuterium plasmaand/or gas through the so–called beam–target reactions.
– Fast electron beams are accelerated also along pinch axis, but in the directionopposite to the positive ions. Strong hard X–ray pulses are the results of theinteraction of these fast electrons with plasma and/or electrodes.
In order to discuss the neutron generation one needs to evaluate the total num-ber of neutrons produced by a thermal mechanism. In general the total number ofthermal neutrons can be estimated as:
Yn =12n2
D〈σ · ν〉V Δτ,
where nD is the plasma density, V is the pinch volume, Δτ is the neutron productionperiod, and 〈σ · ν〉 is the temperature dependent reaction rate.
In the case of the thermal mechanism, the neutron yield can be increased ifthe plasma density and temperature values rise during the quasi–stationary pinchstate. This mechanism becomes efficient when temperature is higher than 10 keV,what is difficult to achieve in the whole pinch volume.
We can evaluate the neutron yield from the above formula using parametersfor PF–1000 numerical calculations and measurements. In this case typical val-ues of the parameters in the equation could be taken as follows: nd ≈ 1025 m−3,
Czech. J. Phys. 54 (2004) C183
M. Scholz et al.
〈σ · ν〉 ≈ 7 × 10⁻²⁹ m3s−1 for Ti ≈ 1 keV, Δτ ≈ 200 ns, and the reaction volumeV = 18.5 × 10⁻⁶ m3. Then for the PF–1000 facility operated at Ucharg = 30 kV,pD = 400 Pa, the thermal neutron yield should reach Yn ≈ 1010. This value is oneorder lower than the neutron output measured by mean of silver activation countersat the same parameters of the PF discharges.
The neutron yield from beam–target reactions can be expressed by the simpleformula
YB = NTntσD−DΔz,
where NT is the total number of deuterons in the beam, σD−D is the D–D reactioncross section and Δz is the length of the reaction region.
It should be noted that in the case of the beam–target mechanism the neutronyield does not depend explicitly on the plasma temperature, but it depends mainlyon the number of accelerated ions (ND) and their velocity (vD). The ion accelerationprocesses are self–regulated ones and it is not clear how to increase the number ofaccelerated ions. This attempt, in order to evaluate the neutron yield data, showsthat neither the beam–target interactions nor pure thermonuclear reactions aresuitable for a consistent description of the neutron production.
6 Conclusions
Although the key physical rules of the PF phenomena have already been identi-fied, their subtle interpretation still requires better understanding of the occurringphysical processes. An example of research, where experimental information is al-most non–existing, is the direct detection of micro–turbulences. Such turbulencesmay be responsible for the anomalous resistivity of plasma and other effects. Un-fortunately, measurements of these effects are particularly difficult.
Numerical simulations have correctly described many aspects of the phenom-ena involved. In particular, the macroscopic dynamics, as predicted by the MHDsimulations, provides a correct value for the time–scale of a pinch collapse on thez–axis. On the other hand, it is still difficult to predict the temporal evolution ofplasma parameters in the current sheath and the experimentally observed shapesof the radiation pulses.
This work has been supported by IAEA CRP grants No. 11940, 11941 and the grant
of the European Commission G4M–CT–2002–04037.
References
[1] O.A. Anderson, W.R. Baker, S.A. Colgate, J. Is and R.V. Pyle: Phys Rev. 110 (1958)24, 2.
[2] P. P. Petrov, N.V. Filippov, T. I. Filippova and V. A. Kharbov: Plasma Physics andthe Problems of Controlled Thermonuclear Reactions vol. 4. M.A. Leontovich 1960.
C184 Czech. J. Phys. 54 (2004)
The physics of a plasma focus
[3] N.V. Filipov, T. I. Filippova, V. P. Vinogradov: Nucl. Fusion Suppl. v.2 (1962) 577.
[4] J.W. Mather: Phys. Fluids Suppl. v.7 (1964) 28.
[5] V.V. Vikhrev, S. I. Braginski: Voprosy teorii plazmy. Atomizdat, Moscov, 1980 v.10.
[6] D. E. Potter: Phys. Fluids 21 (1971) 1911.
[7] V. P. Dyachenko, V. S. Imshennik: Sov. Phys. JETP 29 (1969) 94.
[8] S. Maxon, J. Eddleman: Phys. Fluids 21 (1978) 1856.
[9] S. I. Braginski: Reviews of Plasma Physics vol. 1. Atomizdat, Moscow, 1963.
Czech. J. Phys. 54 (2004) C185