The phototransformation process in phytochrome. I. Ultrafast fluorescence component and kinetic...
10
Btochtmwa et Btophyswa Acta, 1140 (1992) 59-68 59 © 1992 Elsevier Science Pubhshers B.V. All rights reserved 0005-2728/92/$05.00 BBABIO 43721 The phototransformation process in phytochrome. I. Ultrafast fluorescence component and kinetic models for the initial Pr ~ Pfr transformation steps in native phytochrome Alfred R. Holzwarth, Elisabetta Venuti 1, Silvia E. Braslavsky and Kurt Schaffner Max-Planck-lnstttut fiir Strahlenchemw, Mulhelm an der Ruhr (Germany) (Recewed 5 March 1992) (Revised manuscript recewed 30 June 1992) Key words Global analysis, Target analysis; Pxcosecond fluorescence, Fluorescence decay, Thermodynamics, Phytochrome, Phototransformat~on The fluorescence kinetics of native (124 kDa) phytochrome from oat has been studied by time-resolved spectroscopy m the picosecond to nanosecond time range. The excitation wavelength and the buffer conditions were varied and data were recorded over the whole emission wavelength range The data were analyzed by gobal analysis methods and kinetic modelhng. In addition to three lifetime components of about 45 ps, 180 ps and longer than 1 ns reported earher, we now resolved an additional fast lifetime component in the range of 4 to 16 ps with dominant amphtude. The lifetimes and amphtudes of the three fastest components were not significantly dependent on the buffer used nor on the exchange of protons against deuterons. In parhcular, our data exclude a sign change in the amplitude of the ultrafast component from negative (rise term) in the non-deuterated buffer to a positive value (decay term) m the deuterated one. Thus, our data are in contrast to recently reported findings by Hermann et al. (Photochem. Photobiol. (1990) 52). The kmetic model consistent with the data involves a description m terms of two excited states which are in thermal equilibrium with each other. We suggest that these states represent the initially exoted state of Pr phytochrome and a conformationally relaxed, but still electronically excited, interme&ate state of the chromophore which is reached along the path of the Pr to Pfr phototransformation. The rate constants of the interconverslon of the exoted states, their species-associated spectra, and the free energy differences of these states are determined from the fluorescence kinetics. The data confirm our previous results that there occurs no kinetic deuterium isotope effect on the hfetlme of the excited Pr" However, the rate constants of the primary reactions are to some extent dependent on the nature of the medium. Introduction Phytochrome, the plant chromoprotein that is re- sponsible for most photomorphogenic responses, exists in two thermally stable photochromic forms, i.e., the red-absorbing form Pr and the biologically active, far- red absorbing form, Pfr. Native phytochrome from oat (Arena saticum) has a molecular mass of 124 kDa. The photoinduced transformation processes Pr ~ Per and Correspondence to: A.R. Holzwarth, Max-Planck-Instltut fur Strahlenchemle, Stlftstrasse 34-36, D-4330 Mulhelm an der Ruhr, Germany 1 Present address Fac Chlm Ind, Dlpartlmento dl Chlm. Flslca e Inorganlca, Umverslta dl Bologna, Vlale Rlsorglmento 4, 40100 Bologna, Italy Abbreviations. Pr, red absorbing form of phytochrome, Pfr, far-red absorbing form of phytochrome, DTris, Tns in D20; DAS, decay-as- sociated spectrum; SAS, speoes-assocmted spectrum, KPH, potas- smm phosphate. Per ~ Pr have been studied by several groups using various techniques (for reviews see Refs. 1-4). We have previously used time-resolved fluorescence in the picosecond range to study the primary photo- chemical processes in the Pr ~ Pfr phototransformation of oat phytochrome in its degraded [5], partially de- graded [6] and native forms [7]. The essential feature of these results, basically identical for all three forms, was a three-exponential fluorescence decay of Pr with a fast component of about 40 ps (relative amplitude > 90%), a middle component of 150-300 ps (relative amplitude < 10%) and a long-lived component of 1.0-1.5 ns lifetime (relative amplitude < 1%). We had also pre- sented fluorescence data on deuterated native Pr which were identical within the error limits with those of the non-deuterated form, both in lifetimes and relative amplitudes, of the shorter-lived components [7]. Only the longer-lived component had a slightly longer life- time in the deuterated form. We concluded that there occurred no significant deuterium isotope effect on the
-
Upload
independent -
Category
Documents
-
view
5 -
download
0
Transcript of The phototransformation process in phytochrome. I. Ultrafast fluorescence component and kinetic...

Btochtmwa et Btophyswa Acta, 1140 (1992) 59-68 59 © 1992 Elsevier Science Pubhshers B.V. All rights reserved 0005-2728/92/$05.00
BBABIO 43721
The phototransformation process in phytochrome. I. Ultrafast fluorescence component and kinetic models for the initial Pr ~ Pfr
transformation steps in native phytochrome
Alfred R. Holzwarth, Elisabetta Venuti 1, Silvia E. Braslavsky and Kurt Schaffner Max-Planck-lnstttut fiir Strahlenchemw, Mulhelm an der Ruhr (Germany)
(Recewed 5 March 1992) (Revised manuscript recewed 30 June 1992)
Key words Global analysis, Target analysis; Pxcosecond fluorescence, Fluorescence decay, Thermodynamics, Phytochrome, Phototransformat~on
The fluorescence kinetics of native (124 kDa) phytochrome from oat has been studied by time-resolved spectroscopy m the picosecond to nanosecond time range. The excitation wavelength and the buffer conditions were varied and data were recorded over the whole emission wavelength range The data were analyzed by gobal analysis methods and kinetic modelhng. In addition to three lifetime components of about 45 ps, 180 ps and longer than 1 ns reported earher, we now resolved an additional fast lifetime component in the range of 4 to 16 ps with dominant amphtude. The lifetimes and amphtudes of the three fastest components were not significantly dependent on the buffer used nor on the exchange of protons against deuterons. In parhcular, our data exclude a sign change in the amplitude of the ultrafast component from negative (rise term) in the non-deuterated buffer to a positive value (decay term) m the deuterated one. Thus, our data are in contrast to recently reported findings by Hermann et al. (Photochem. Photobiol. (1990) 52). The kmetic model consistent with the data involves a description m terms of two excited states which are in thermal equilibrium with each other. We suggest that these states represent the initially exoted state of Pr phytochrome and a conformationally relaxed, but still electronically excited, interme&ate state of the chromophore which is reached along the path of the Pr to Pfr phototransformation. The rate constants of the interconverslon of the exoted states, their species-associated spectra, and the free energy differences of these states are determined from the fluorescence kinetics. The data confirm our previous results that there occurs no kinetic deuterium isotope effect on the hfetlme of the excited Pr" However, the rate constants of the primary reactions are to some extent dependent on the nature of the medium.
Introduction
Phytochrome, the plant ch romopro te in that is re- sponsible for most pho tomorphogen i c responses, exists in two thermally stable pho tochromic forms, i.e., the red-absorbing form Pr and the biologically active, far- red absorbing form, Pfr. Native phy tochrome f rom oat (Arena saticum) has a molecular mass of 124 kDa. The pho to induced t ransformat ion processes Pr ~ Per and
Correspondence to: A.R. Holzwarth, Max-Planck-Instltut fur Strahlenchemle, Stlftstrasse 34-36, D-4330 Mulhelm an der Ruhr, Germany 1 Present address Fac Chlm Ind, Dlpartlmento dl Chlm. Flslca e
Inorganlca, Umverslta dl Bologna, Vlale Rlsorglmento 4, 40100 Bologna, Italy
Abbreviations. Pr, red absorbing form of phytochrome, Pfr, far-red absorbing form of phytochrome, DTris, Tns in D20; DAS, decay-as- sociated spectrum; SAS, speoes-assocmted spectrum, KPH, potas- smm phosphate.
Per ~ Pr have been studied by several groups using various techniques (for reviews see Refs. 1-4).
We have previously used t ime-resolved f luorescence in the picosecond range to study the pr imary photo- chemical processes in the Pr ~ Pfr photo t ransformat ion of oat phy tochrome in its degraded [5], partially de- graded [6] and native forms [7]. The essential feature of these results, basically identical for all three forms, was a three-exponent ia l f luorescence decay of Pr with a fast componen t of about 40 ps (relative ampli tude > 90%), a middle componen t of 150-300 ps (relative ampli tude < 10%) and a long-lived componen t of 1.0-1.5 ns lifetime (relative ampli tude < 1%). We had also pre- sented f luorescence data on deu te ra ted native Pr which were identical within the er ror limits with those of the non-deu te ra ted form, both in lifetimes and relative amplitudes, of the shorter-lived components [7]. Only the longer-lived componen t had a slightly longer life- time in the deutera ted form. We concluded that there occurred no significant deuter ium isotope effect on the
60
photoprocess P~ ~ P~r and that the primary reaction should not involve a proton transfer mechanism but rather a Z ~ E photoisomerization [7]. Our studies had been performed using a single photon-counting appa- ratus with a time resolution of about 20 ps. Similar fluorescence decay data have been presented by two other groups for both oat phytochrome [8,9] and rye phytochrome [10].
Recently, Hermann et al. [11] reported an additional fast fluorescence component in rye phytochrome. In a four-exponential analysis they found a lifetime of 14 ps for this new component. Interestingly, the additional component had a negative amplitude (risetime) in non-deuterated P~ and reversed its sign to a positive value in deuterated P~ without change in the lifetime. Several explanations are possible for the discrepancy between their data and ours. Firstly, the time-resolu- tion of our previous measurements might have well been insufficient to resolve such an ultrafast compo- nent. Secondly, there might exist significant differences in the kinetics of primary processes between oat and degraded rye phytochrome and in the different isola-
tion protocols and buffers employed• For these reasons we report here fluorescence kinetic data of native oat phytochrome measured with improved time resolution both in its non-deuterated and deuterated forms and in two different buffers. A further aim of this work is to test various kinetic models for their suitability to de- scribe the primary processes in the P4 ~ Pfr photo- transformation•
Materials and Methods
Native phytochrome was isolated from etiolated oat seedlings according to the procedure described by Lin- demann et al. [12]. The material was of a high purity as revealed from a specific absorption ratio (SAR) Z 6 6 6 / Z 2 8 0 _> 1.1 and a single detectable protein corre- sponding to 124 kDa in SDS-PAGE analysis• The phy- tochrome photochemistry was fully reversible and the Pfr form had an absorption maximum at 730 nm.
Measurements were carried out either in Tris or in phosphate (KPH) buffer. In order to change the buffer the phytochrome was precipitated in a solution (40%)
A 4 • 1 [ l 660 nm
= ,~_,.~ .Aat k-i, ~. i la,~.a
11' ' 3 exponentials Chi = 1.481 - 4 . 1
.7 r 670 nm
- 4.7 3.6
o~ ~1 ~ - - 680 nm /
rl ], ,,
rY 3 exponentials Chi=: 1.566 - 3 . 6
. O n m
dd ' w ..,
• 3 exponentials Chi=: 1.783
700nm
y w " " , '' ~ 5 . 3 I r 3 exponentials Chi =. 2 037
7.1 O3
r',,-
- 7 . 1
, 710 nm
~l la , . ~ A = L ' - ' - ' ~ _ = i . . . k . ~ J _ J . . ~ . l
3 exponentials ehi 2. 2.964 I
B ~'Sl . , 660 nm , i
- 3.5
4 . 7 1 670 nm
=a==
rr 4 exponentials Chi =. 1 041 - 4 7
3 .8
0
q) n , "
- 3 8
. 680 nm/
4 exponentials Chi = 1.079
ca 690 nm
3 5
= u a , L,
rY ¢ exponentials Cht=• 1 148 - 3 5
4.4 co [ ~ 710nm [
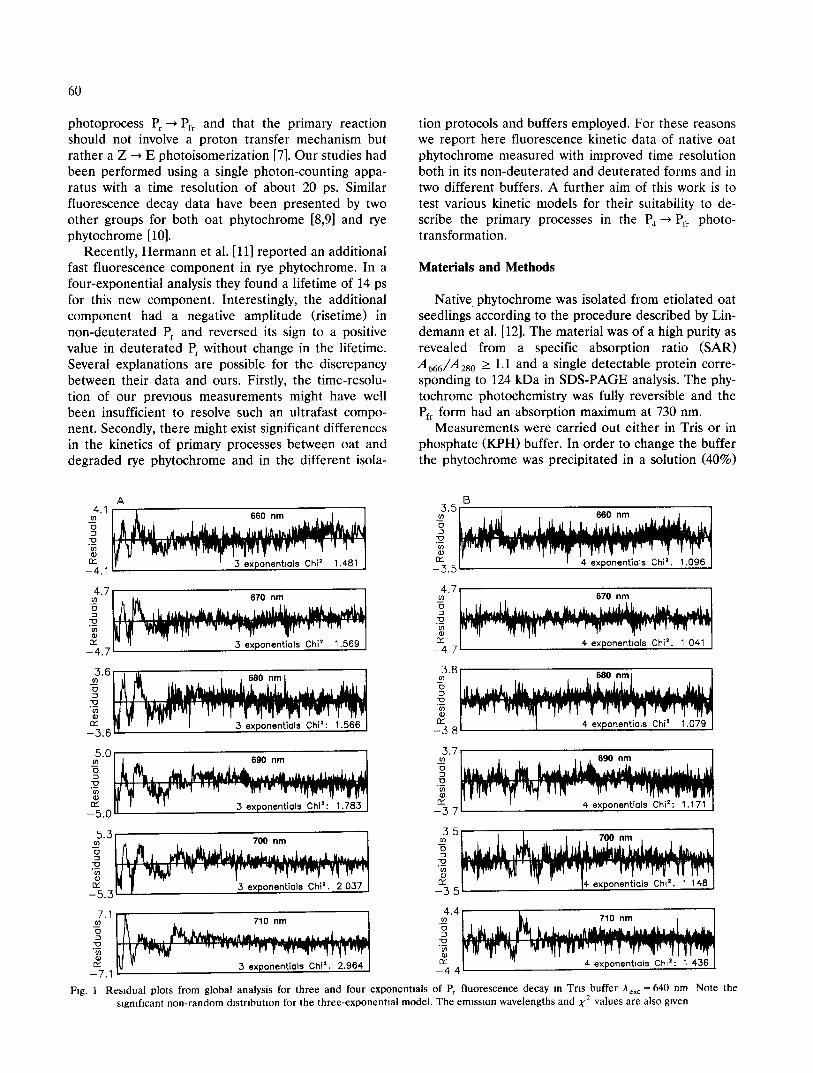
Fig. 1 Residual plots from global analysis for three and four exponentials of Pr fluorescence decay m Tns buffer Aexc = 640 nm Note the slgmficant non-random distribution for the three-exponential model. The emission wavelengths and X 2 values are also given

of (NH4)2SO 4 and then resuspended in the appropri- ate medium. The same procedure was used for the deuteration of phytochrome, i.e., the precipitated Pr was dissolved in deuterated buffer. In this case a delay of at least 3 h occurred between the dissolution in deuterated buffer and the first measurement. The fol- lowing concentrations were used: 50 mM Tris-HC1, 1 mM EDTA, pH 7.8, and in deuterated medium pD 8.2, corresponding to pH 7.8. Phosphate buffer was 100 mM (pH 7.8 and pD 8.2).
The concentrations of phytochrome were adjusted such that an absorbance in the range of 0.2-0.25/cm was obtained at 640 nm for Pr" All measurements were carried out at a temperature of 5-7°C in a flow cuvette of 0.15 cm pathlength. Handling of phytochrome and measurements were as described previously [6,7] if not mentioned otherwise.
Fluorescence decays Fluorescence was measured by a single-photon tech-
nique as described previously [5]. The detector had been replaced by a fast multichannel-plate photomulti- plier (Hamamatsu R 1564-U 01) with a multialkali photocathode as described [13]. The time resolution of this apparatus is about 5 ps (fwhm _< 50 ps of appara- tus response) with deconvolution. Fluorescence decays were measured at various excitation and emission wavelengths. For excitation at 640 nm time-resolved fluorescence spectra were recorded in the range 650- 700 nm at 10 nm intervals. Typically about 20000 counts in the peak channel were accumulated, except at the short and long-wavelength edges of the fluores- cence spectrum, where the low fluorescence intensity
61
precluded such a high signal-to-noise ratio. The mini- mum peak count was in this case 5000-6000. Data were analyzed either by single-decay or by global life- time analysis as described in Ref. 7. A sum of exponen- tials was used as the model function. For the kinetic modelling data were analyzed additionally by a global target analysis method [14,15]
Results
Fluorescence decays of Pr at different condiuons The residuals plots from the global analysis of the
fluorescence decay measurement in Tris buffer with Aex c = 640 nm are shown in Fig. 1. As seen from these plots, the data require a model of four exponentials for a good fit. The residual plots for single-decay analysis (not shown) show similar systematic deviations from a random distribution for a three-component fit as do the residual plots for global analysis (Fig. 1A). In single-decay analysis a component of a fast lifetime (~'1) in the range 5-12 ps with dominant amplitude is required. In addition, a 45-50 ps component (z 2) is resolved. Furthermore, an intermediate lifetime com- ponent of 160-210 ps (~'3) and a long lifetime of more than 800 ps (~'4) are required as well for a good fit in the long time range. Analogous results requiring the z~-component are found at all excitation/detection wavelength pairs for single-decay analysis. The same holds for all measurements in phosphate buffer. The results for single-decay analysis are collected in Table I.
Fig. 2 shows the decay-associated spectra (DAS) as calculated by global lifetime analysis from the fluores-
TABLE I
Fluorescence hfettmes of phytochrome determmed by four exponennal smgle decay analysts of fluorescence decays at vanous excltatton wavelengths
The range of lifetimes in each case refers to the various emission wavelengths m the range Aem = 660-710 nm. Errors in the z I hfetlme are _+2 ps, ±3 ps for z 2 and + 5 % for the other lifetimes.
Buffer State Aexc,nm "/'1 (ps) "1"2 (l°s) q'3 (ps) "r 4 (ps)
KPH Pr 620 4-- 6 42--51 156--182 810-- 950 Pr 640 5-12 43-48 156-182 810- 950 Pr 660 6-18 46-54 156-182 810- 950
Tris Pr 620 a) 4 47 177 780 Pr 640 5 - 9 42-49 163 1 120-1330 Pr 660 9-16 44-52 162 1 120-1330
DTris DP r 640 5-15 44-54 170-195 1450-1580 Dp r b) 640 5-- 8 46--50 170-195 1 210--1290 DP r 660 6-12 43 -49 170-195 1210-1 290
KPH Pr + fr 640 12-- 16 54--67 320--330 1 040
Tris Pr + fr 640 a) 9 53 334 1 180
DTris DPr+ fr 640 a) 4 52 402 1495 DPr+fr b) 640 a) 11 50 327 1 570
a) The fluorescence decay was detected only at Aem = 680 nm; b) after photochemical recychng.

62
100
6o • ~ = o oo~., / / \ ~. • r = 0 045 ns / / \ -- • T = 0 194 ns / / \ / \,
i 60 * 7- = I 405 ns / / / /
J 4 0
/ /
-" ~ .~ . . , , ~ : l l r " ~ ' ' ' ~ - x 5 0 ~ - ' ~ ' ~ * . . . .
0640 850 660 ' 670 880 690 700 710 WAVELENGTH (nm)
Fig 2 DAS plot of fluorescence kinetics of Pr phytochrome m T n s buffer, A~× c = 640 nm, as determined from global hfet ime analysis
- - - - - - , stationary fluorescence
100
/ / / / / ~
80 I I ' r = 0 008 ns / / / / \ \ k ~ • "r = 0 047 ns / I~ \ \
= 0to3 ns / / \ II, "~ 60 "k~'@'r : 1429 n s / / / \ \ ~ " - ' l l
2O
0 666 6;0 84o do do ,;o 71o 720
WAVELI~GTH (nm)
Fig. 3 DAS plot of fluorescence kinetics of deuterated Pr phy- tochrome m DTris buffer, A~x ~ = 640 nm, as determined from global
hfet~me analysis - - - - - - , stationary fluorescence
cence decay in Tris buffer upon excitation at 640 nm. The largest component (rel. amplitude > 80%) is the r~ = 5 ps component with a maximum at about 690 nm. The second largest component (rel. amplitude = 16%) has a lifetime of 45 ps (r2), i.e., the same as we have measured previously with lower time resolution [5-7]. The two long-lived components of approx. 190 ps (r 3) and approx. 1.4 ns (r 4) have very small amplitudes of approx. 1.4% and 0.1%, respectively. Except for the longest-lived component all decays show DAS maxima in the range 680-690 nm. Very similar results, both with respect to lifetimes and DAS were obtained in phosphate buffer. Results from global lifetime analysis are collected in Table II. We should like to point out that no negative amplitude (riseterm) has been ob- served in either the single-decay analyses or the global analyses in any of the DAS.
The corresponding results in deuterated Tris (DTris) buffer are also given in Tables I and II. Fig. 3 shows the DAS from global analysis of the phytochrome
decay in DTris upon excitation at 640 nm using a sample that had been cycled several times between Pr and Pfr in order to possibly facilitate the exchange of protons for deuterons. No significant differences were observed as compared to an uncycled sample except in the lifetime of the longest-lived component, which is slightly higher in the cycled sample. The other lifetimes are basically unchanged and they are the same, within the error limits, as those observed in non-deuterated buffer. However, the relative amplitude of the fastest component is somewhat smaller (rel. amplitude = 70%) as compared to non-deuterated sample, while the am- plitude of the r2-component is correspondingly higher. Furthermore, the DAS of the ~-Fcomponent in DTris buffer is slightly red-shifted and narrower as compared to the corresponding DAS in non-deuterated buffer. The other components have DAS which are essentially the same in deuterated and non-deuterated Tris buffer. The DAS of Pr in phosphate buffer (not shown) are the same in shape as in Tris buffer, except for small
TABLE II
Fluorescence hfettmes of phytochrome at various excitation wavelengths determmed by four-exponenual global analysts
Values m parenthesis gwe the relative ampli tudes of components at Acr n = 680 nm, the emission maximum of the fastest component Maximal errors are about 50% of those given in Table I
Buffer State A . . . . . . ,71 ( p s ) / % T 2 ( p s ) / % ~'3 ( p s ) / % r 4 ( p s ) / %
KPH Pr 620 5 (86) 49 (12) 194 (1 6) 850 (0 4) Pr 640 6 (85) 45 (13) 188 (1 8) 1000 (0 2) Pr 660 13 (86) 51 (12) 192 (1 7) 860 (0.3)
T n s Pr 640 5 (82) 45 (16.5) 194 (1 4) 1400 (0 1) Pr 660 11 (81) 44 (16.7) 162 (2 2) 1045 (0 1)
D T n s DP r 640 a 8 (69) 47 (29) 183 (1 8) 1530 (0 2) DPr 660 6 (71) 44 (26) 178 (2 8) 1290 (0.2)
KPH Pr + fr 640 16 (50) 66 (32) 320 (9) 1040 (9)
After recychng.

63
O 0 3 2 n s 20 • 1 04 ns
~ 1 ~ • 0 0 1 6 ns • 0 0 6 7 ns / igl"~
/ •
• ~ 0 ~ 0
0 ~ I I J I i •
6 5 0 6 6 0 6 7 0 6 8 0 6 9 0 7 0 0 7 1 0 7 2 0 Wavelength (nm)
Fig 4 DAS plot of fluorescence kinetics of Pr+fr phytochrome in phosphate buffer, Aex c = 640 nm, as determined from global hfetlme
analys~s. - - - - - - , stationary fluorescence.
differences in relative amplitudes of the two fastest components (cf. Table II). All lifetimes and relative amplitudes of components (at ~'em = 680 nm) from global analysis are collected in Table II. Measurements have also been carried out at A~x c = 620 nm, i.e., close to the excitation used in Ref. 11, and also at Aex c = 660 nm. The lifetime of the ultrafast component at the latter excitation wavelength is generally several pi- coseconds longer, as compared to Aex ~ ---620 and 640 nm.
Fluorescence decays of Pr + f r
Fig. 4 shows the DAS of the Pr+fr mixture in pho- tochromic equilibrium (after preillumination by 660 nm light) in phosphate buffer. The shape of the DAS is the same as for Pr in phosphate and Tris buffer, However the relative amplitude of the ultrafast component is lower and its lifetime is twice that of Pr at A~x c = 640 nm. Also, the lifetimes of the r 2- and ra-Components are increased by about 50%. No indication is seen for any fluorescence from Pfr at long wavelengths (above 730 nm), in agreement with our previous results [6,7].
TABLE III
Test for photochromtctty and photoret,erstbthty
Ratios (R) of absolute amplitudes (Aabs). R = Aabs(Pr)/Aabs(Pr+fr) for Aem = 680 rim. The various values refer to independent measure- ments either after photochemical recycling or with different fresh samples. Maximum error of amplitude ratios is + 20%
Buffer R 1 R 2 R 3 R 4
KPH 4.0 4.7 13 0.13 Tris 40 3.7 17 008
4.4 46 21 0.08 40 38 1.7 009 43 45 2.1 010 57 5.3 23 010 4.8 4.4 24 010 4.8 d 42 a 21 a 009 a
DTrls 5.5 4.6 1.2 013 51 46 12 010 4.6 3.5 13 019 47 3.5 1.4 019 5.0 a 4.0 a 1.2 a 017 a
a Recycled sample.
Table III shows the amplitude ratios of the various lifetime components for phytochrome in the far-red- light (pure Pr) and red-light (Pr+fr) adapted states. This ratio provides a photochromicity test for the lifetime components, since all fluorescence observed originates from Pr (or trace impurities) in either state. The ampli- tude ratio for Pr components responding properly to phototransformation should be in the range of about 4-5:1, assuming a percentage of 75-80% Per in the red-light-adapted state [16]. Inspection of Table III indicates that only components ~'1 and ~2 have pho- tochromic amplitude ratios in the expected range, while the values of components ~'3 and ~'4 are much smaller. This analysis, based on amplitudes only, ignores the lifetime changes between the Pr- and PL ÷ fr-States.
TABLE IV
Rate constants (k, n s - 1) and recalculated hfettmes ("c,, ps) o f P r f rom kmettc modelhng
X 2 values from target fit. Rate constant k A was kept fixed during the fit m order to avoid underdetermination of the kinetic equations. A variation of k A over a wide range, up to 2 ns -1, has no s~gnfflcant influence on the fitted rate constants, however
Model I (Sequential model with two components)
Buffer k A (fixed) (ns -1) kAB kBA ka "/'1 T2 "/'3 "1"4 X 2
Trls 0.1 214 4 8 22 4 5 46 196 1406 1 15 DTns 0.1 161 2 7 22 6 6 45 176 1500 1 11 KPH 0.1 208 8.1 22.9 5 45 189 989 1 13
Model H (Specws B not emtttmg)
k A (ftxed) (ns - I ) kAB knA k n ~'l ~'2 ~'3 "r4 X 2
Tns 0.1 332 33.5 2.6 3 43 191 1414 1 27
Model III (Sequenttal model wtth three components) a
k A (fixed) kAB kBA kBc kcB kc r l ~'2 73 74 X 2
0.1 216 6 21 0 04 5 5 46 198 1403 1 13
a Pr m TrlS buffer (same as above). State C is essentially non-emitting (negligible amphtude in SAS)

64
Kinettc modelhng by target analysts In order to test for the possibility that several of the
lifetime components arise from sequentially populated states with or without equilibria with their precursors, we fitted the original kinetic data to three Kinetic models by a global target analysis method. This allows us to calculate rate constants and the so-called species-associated spectra (SAS) [14,15] for an assumed kinetic scheme. The SAS are the pure emission spectra of the assumed excited states m each model. The following kinetic models were tested:
I A * ~ B * k s ~ c £aa.
kAB II A* ~ B kn~c
~" BA
1i, £8A kc8
where A* represents the initially excited state, as- sumed to be Pr*. B* and C* are excited states which are potentially emissive, while B, C, and D represent ground electronic states. For models I and II we expect a biexponential fluorescence decay, while model III gives rise to a three-exponential decay. Since in all global analyses we required four components to de- scribe the data, we allowed in the target analysis proce- dure for additional exponential components describing fluorescent species (states) which are not part of the examined kinetic schemes (models I-III) . These addi- tional components represent, for example, impurities. All results from global target analysis are summarized in Table IV.
Model I, involving two emitting excited states in equilibrium, fits the data very well (X2= 1.1). These analyses indicate that the two fastest components (~'1 and ~'2) resolved in global lifetime analysis are well described by model I, while components ~'3 and r4 represent unrelated impurity components. The SAS for this model are given in Fig. 5. They bear a pronounced similarity to the corresponding DAS. The SAS of B* is slightly blue-shifted as compared to the SAS of the mitially excited state A*. Since the area under each SAS is proportional to the radiative rate constant k ra d of the corresponding excited state, the data indicate that the B*-state has an approx. 10-fold smaller radia- tive rate than A*. The SAS are again very similar in Tris and phosphate buffer, while in DTris (not shown) similar differences in the shape of the SAS occur as seen already in the corresponding DAS (cf. Fig. 3). Apart from this difference in shape, the amplitude ratio of the SAS in DTris is similar to that in Tris and KPH.
Model II, involving an equilibrium between the state A* and a non-emitting state (B) - hence only one SAS - also gives rise to a biexponential decay. This model
250
200
~ I00
50
0
e 4 0
_ • A*
650 860 670 680 ogo 700 710 WAVEI,~GTII ( n m )
Fig. 5 Speoes-assoclated emission spectra (SAS) of Dr phytochrome in Tns buffer, Aex c = 640 nm, for the sequential model I with two components both emitting. The corresponding DAS are basically identical to those shown m Fig 2 Note that the two longest-hved components present in the DAS (Fig. 2) are taken into account as addmonal exponentials representing some other origin (e g , impuri- ties), since they are not described within the framework of this
kinetic model
also describes components ~-~ and r 2 but does not fit the data well (g 2 value = 1.27). The inadequacy of this model was already expected, because the DAS of life- time components ~-~ and ~'2 are different in shape and spectral position (Figs. 2 and 3). However, this model requires that both DAS be identical.
Finally, model III also fits the data. The rate con- stants of the early steps are very close to those of model I, as are the SAS of A* and B*. Furthermore, the backward rate for C* ~ B* (kcB) is very small and the SAS amplitudes for C* are nearly negligible. This characterizes state C* as a practically non-emitting state within this model. Thus, model III represents only a minor and insignificant extension of model I.
The lifetimes which have been recalculated from the rate constants of the kinetic models I - I I I (Table IV) are in full agreement with the lifetimes obtained by global lifetime analysis (Table II). Table V gives the free energy gaps, AG, which have been calculated according to AG = - R T ln(kAa/kBA) , between the
TABLE V
Free-energy dtfferences AG for the exerted-state equd, bna and yteld of reaction A* ~ C (c19 A) m the tested sequenttal two state model (I) as calculated from the kinetw data obtained by target analysts
The AG value has been calculated according to AG = - R T i n ( k A a / k n g )
Buffer State - AGAB (kJ/mol) qb A
Tns Pr 8 1 0 97 DTrls DP r 8 3 0 97 KPH Pr 7 5 0.95

65
two excited states of Pr" The reaction yields within model I for the three different buffers are also given. These data are all very similar and do not depend strongly on the buffer type.
Discussion
Our fluorescence kinetic measurements, with a time resolution which is higher than in our previous data [5-7], clearly reveal the presence of an additional fast lifetime component (1-~) of approx. 5-16 ps (depending on buffer and excitation wavelength) in addition to the previously resolved three fluorescence lifetime compo- nents of z 2 --- 45 ps, T 3 = 150-200 ps and 1" 4 > 1 ns. The presence of a fast component of about 15 ps has been reported already previously by Hermann et al. [11]. Despite the evidence for an additional fast component, our results are still at variance in important aspects with those of Hermann et al. First, we do not observe a riseterm (negative amplitude) for the 1"l-component nor do we observe a sign change in its amplitude upon deuteration. This fundamental difference cannot be explained by uncomplete deuteration in our case, as suggested in Ref. 11, since the negative amplitude for the 1"1-component has been reported for non-deu- terated buffer.
We would have clearly been able to resolve a nega- tive amplitude component with the lifetimes and am- plitude ratios as reported in Ref. 11 even with single- decay analysis, let alone with global analysis. This is demonstrated by the residuals plots shown in Fig. 6, where the data reported by Ref. 11 for non-deuterated sample (with negative amplitude) were simulated, with appropriate noise added, and then analyzed. The proper apparatus response of our detection system was taken into account for convoluting the simulated decay function (see also Table VI for further results of the simulations). The presence of the negative component is clearly resolved in this analysis of simulated data and
50
x I g V v, , ,"v, _ 5 . 0 [ [ 3 exponentials Ch~ 2 1.520 [
5.0
x ' --5 0 | 4 exponentials Chl 2 0.977 I
4
~3 0
C.)
t~2 0
exponentlal Tl(ns) 0 043 BI' 33 04 T2(ns) 0018 B2 -13.4 T3(ns) 0 156 By 7 6 2 7 -
I l l s ) . 0705 B4 0933
~1 I I I I I
02 04 06 0.8 1 0 1 2 Time , ns
Fig. 6. Simulated four-exponential fluorescence decays (lower part, the narrow curve represents the excitation function) w~th negatwe amplitude of the zl-component (14 ps) with amplitude ratios chosen according to Ref. 11 The residual plots and X 2 values are shown for
three- and four-exponential analysis.
the X2-value is drastically increased if a lower number of exponentials is used.
The fluorescence was not resolved in wavelength by Hermann et al. However, in our measurements, assum- ing the amplitude and sign of the 1-1-component would depend on emission wavelength (and perhaps also on excitation wavelength), we would expect to observe even larger effects, i.e., more negative amplitude, at least at some wavelengths. This was clearly not the case. Also, neither the buffer used nor the origin and quality of phytochrome (Arena vs. Secale) provides an
TABLE VI
Simulated and fitted parameters of four-exponennal fluorescence decays wtth posawe (no nseterrn) and negatwe (with nseterm) amphtudes of the fastest (r 1) component
The data for simulations have been chosen according to the results from Ref. 11. An apparatus width of 50 ps and a time resolution of 5 ps /channel has been assumed for the szmulations. Poissoman noise has been added to the data. ~-, llfetzmes (ps); A, amplitudes
T1 T 2 T 3 '7" 4 A 1 A2 A3 A4 X 2
No riseterm
Simulation 14 44 157 700 72 24 3 1 - Fit 4 exp 14 43 147 685 73 23 3.2 1 0 1.04
With nseterm
Slmulatzon 14 44 157 700 - 74 137 32 4 - Fzt a 4 exp. 18 43 156 705 - 5 4 132 30 3.7 0.98 a 3 exp 53 187 886 - 104 24 3 0 1.52 b
a A four-exponential and a three-exponenttal fit have been performed on this data set. b See Fig. 6 for residual plots of these fits.

~F
explanation for the discrepancy, since we measured both in phosphate and in Tris buffer and carried out also corresponding measurements as reported here on phytochrome from Secale (unpublished results in coop- eration with Dr. G. Hermann). We should like to note that a drastic change in amplitude, as exerted by deuteration according to Ref. 11 should generally also change the lifetimes within their chosen kinetic model, because it indicates a substantial change in either reaction mechanism or rate constants. Inexplicably, the lifetimes were claimed to remain unchanged upon am- plitude sign reversal [11].
There exists a further difference between our data and those of Ref. 11. For excitation wavelengths close to those used in their measurements, our ultrafast component is substantially shorter, generally by a fac- tor of about 2. Only for long excitation wavelength Ae~ c = 660 nm) do we find lifetimes nearly as long as those reported [11].
We do not observe a significant effect of deuteratlon on the lifetimes of components 71-~" 3. Only lifetime T 4 is somewhat increased upon deuteration, in agreement with our previous finding [7]. In addition, an approx. 15% change in the relative amplitude of the ~-l-compo- nent is observed upon deuteration (Table II). We do not consider this to reflect a direct kinetic H / D iso- tope effect on the primary photoreaction of the chro- mophore in the sense that it should involve a proton transfer directly. Rather this reflects an indirect effect imposed by the environment (see below).
The photochromicity tests (Table III) characterize components 71 and "/2 as genuine Pr components while 73 and T 4 should have some other origin. The two longer-lived components could be either impurities or, in view of the similar time-resolved spectra, intermedi- ates in the photocycle which are excited by subsequent laser pulses, which in our measurements occurred with a repetition rate of 800 kHz. However, Hermann et al. [11] worked with very low laser repetition rate and still observe these long-lived components.
The result that the longer-lived components have their emission maxima at shorter wavelengths than the fast components implies that the emission maximum shifts to the blue as time goes on after excitation. We have reported such an effect previously [7] and a simi- lar observation has been made by Song et al. [9], although in that work the authors claimed that no spectral shifts were observed in the picosecond range but only in the nanosecond range.
Kinetic models The most simple kinetic model to interpret our
lifetime data of phytochrome involves at least two different populations of phytochrome with excited state lifetimes 7~ = 5 - 1 3 ps and 7 2 = 4 5 ps. The other (longer-lived) components had been characterized al-
ready earlier as unlikely candidates for intact Pr [5--7] Based on their drastically different excited state hfe- times, one might also expect quite different pho- tochromic ratios for such potential Pr populations of long exoted state lifetime as compared to the major component represented by lifetime "r~. This ~s not the case for components 71 and 72 . These two components show very similar photochromic ratios which might qualify them as two different Pr ground state species. Although we cannot definitely exclude this two-popula- tion hypothesis, more complex kinetic schemes which are based on a homogeneous phytochrome population may in fact provide more suitable models to explain the primary phototransformatlon process in Pr"
We have tested three such kinetic models by global target analysis methods. They are all of the sequential kinetics type. Of these schemes, models I and III fit the data formally well while model II can be excluded based on the unsatisfactory fit quality. Judging from the rate constants and SAS obtained for models I and III (Table IV and Fig. 5), it is obvious that model III is only an insignificant modification or extension of model I, since the rate constant kcB is very small and state C is essentially non-emissive. We thus discuss only model I extensively here.
Both models I and III suggest that two excited states exist which are in rapid equilibrium with each other and have a free energy difference of AG = - 8 kJ /mol . The secondary excited state B* has shorter-wavelength emission than the primary excited state. A schematic potential energy diagram that rationalizes our data is shown in Fig. 7. According to this scheme the initially excited state would be Pr* The scheme can explain the observed excitation and emission wavelength depen-
A*
66
RF, a~, ffl'l ON COORDINATE
F~g 7 SchemaUc potential energy curves for the electromc ground and excited states of Pr (A) and its first intermediate (B). Note the break in the energy scale. The energy difference between A* and B* is much lower than the differences between ground and excited
states

dence, in particular that of the ~-~-component. Excita- tion at long wavelengths excites preferentially such molecules which have low vibrational quantum num- bers. These molecules must equilibrate with the envi- ronment before they can decay to state B*. They may thus have a longer lifetime. In contrast, excitation at short wavelength excites preferentially higher vibra- tional modes of the electronic excited state. These molecules could have sufficient vibrational energy to react to B* directly without thermal equilibration with the environment and without the need to overcome an activation barrier. The reaction could thus proceed faster. In such a picture, the conformation and mobility of the surrounding protein will play an important role for the rate of the relaxation processes.
An alternative explanation for the wavelength de- pendence of these lifetimes could be a continuous range of conformational ground states of the chro- mophores and the surrounding protein. The different ground-state conformations could have slightly differ- ent absorption spectra and also different excited state reaction rates. Thus, the significant influence of the buffer in particular on the rate constant kBA along with a much smaller effect on kAB could be explained by conformational effects of the buffer on the protein conformation and /or mobility and thus also on the chromophore conformation. Such factors could deter- mine the detailed shape of the excited state potential curve between states A* and B* as well as the height of the barrier. In the light of this scheme it is explica- ble that the value of k BA for Pr in KPH buffer is significantly higher than in Tris buffer. This difference is even larger than that induced by deuteration of the sample. Comparison of the respective rate constants in all buffer systems clearly excludes a genuine deuterium isotope effect, i.e. a direct involvement of a proton in the first reaction step. Of course, a secondary effect, e.g., via a modification of hydrogen bonds between chromophore and protein at a position somewhat more distant from the C-15 position of the chromophore, but not directly involved in the primary photoreaction, could provide a reasonable explication of the observed effects. A continuous range of conformational ground states might also explain the observed slowing down of the fastest phase upon preillumination (see above) provided that (i) the interconversion of the conforma- tional states were to be slow and (ii) their photo- chemical yield for the PR to PFR transformation were to be different.
What is the nature of state B*? Since the initial step in the phytochrome conversion is a Z ~ E- isomerization of the C-15 exocyclic double bond, the most likely nature of B* might be a conformation intermediate between the initial Z-conformation and the final E-conformation. Thus, the first part of the isomerization reaction would proceed on an excited
67
state surface, while the final part (after B*) would occur on an electronic ground state surface. Such a reaction scheme would in fact provide for an efficient and reasonable mechanism for driving a substantial conformational change in the apoprotein while, at the same time, preventing efficient thermal back reactions to Pr and thus favor the Pr ~ Per interconversion. A similar mechanism for the initial photoreactions - al- though probably providing for much smaller conforma- tion changes both in the chromophore and the sur- rounding protein than expected in the case of phy- tochrome - has been proposed for the early steps of the bacteriorhodopsin photocycle [17-19] (see also Ref. 1 for a review). There, the initial reaction is a very fast trans-cis isomerization followed by proton transfer on a much slower time-scale.
We thus propose that the most hkely reaction mech- anism involves the rapid formation of an intermediate excited state in equilibrium with the initial state. This intermediate state should represent a conformation which precedes the final E-isomer which is probably formed in the electronic ground state. However, we cannot unequivocally exclude the alternative possibility that a wide distribution of initial rate constants, due to a large conformational heterogeneity of the chro- mophore and/or protein, is responsible for the two fast lifetimes.
References
1 Holzwarth, A.R (1989) Q Rev Blophys. 22, 239-326 2 Schaffner, K., Braslavsky, S.E, and Holzwarth, A.R (1990) m
Advances m Photochemistry (Volman, D H., Hammond, G.S. and Gollnlck, K, eds.), pp. 229-277, John Wiley, New York
3 Braslavsky, S.E. (1990) m Photochromism. Molecules and Sys- tems (Durr, H. and Bouas-Laurent, H., ed.), 738-755, Elsevier, Amsterdam.
4 Ru&ger, W. and Thummler, F., (1991) Angew. Chem 103, 1242- 1254.
5 Wendler, J , Holzwarth, A.R., Braslavsky, S E., and Schaffner, K, (1984) Biochlm. Blophys. Acta 786, 213-221.
6 Holzwarth, A.R, Wendler, J , Ruzslcska, B P., Braslavsky, S.E and Schaffner, K (1984) Bioehim Biophys. Acta 791, 265-273.
7 Brock, H, Ruzsicska, B P., Holzwarth, A.R, Braslavsky, S E., Aral, T , Schlamann, W. and Schaffner, K. (1987) Biochemistry 26, 1412-1417.
8 Song, P.-S, Tamai, N and Yamazakl, I (1986) Blophys J. 49, 645-649
9 Song, P-S , Slngh, B R, Tamal, N., Yamazakl, T., Yamazakl, I., Tokutoml, S and Furuya, M, (1989) Biochemistry 28, 3265-3271
10 Llppitsch, M.E., Rlegler, H., Aussenegg, F R., Hermann, G. and MtiUer, E. (1988) Blochem Physiol. Pflanz 183, 1-6.
11 Hermann, G, Llppitsch, M.E, Brunner, H , Aussenegg, F.R and Muller, E , (1990) Photochem. Photoblol 52, 13-18
12 Lindemann, P., Schlamann, W, Braslavsky, S E and Schaffner, K, (1992) J Photochem. Photoblol. B 14, 293-310
13 Holzwarth, A R, Wendler, J and Suter, G W. (1987) Blophys J 51, 1-12
14 Beechem, J.M, Ameloot, M. and Brand, L. (1985) Anal Instrum 14, 379-402

68
15 Roelofs, T.A., Lee, Ch-H. and Holzwarth, A R (1992) BIophys. J 61, 1147-1163
16 Kelly, J M and Laganas, J.C. (1985) Biochemistry 24, 6003-6010 17 Polland, H.-J, Franz, M.A., Zmth, W., Kaiser, W., Kolling, E
and Oesterhelt, D. (1986), Biophys. J. 49, 651-662.
18 Dobler, J., Zlnth, W., Kaiser, W. and Oesterhelt, D (1988) Chem Phys. Lett. 144, 215-220.
19 Mathles, R.A., Cruz, C H B., Pollard, W T and Shank, C V (1988) Science 240, 777-779