The Philippines - Selected Issues for the 1983-87 Plan Period
177
Report No.3861-PH The Philippines Selected Issues for the 1983-87 Plan Period | .t J ''' -4'.. CF O )une 1, 1982 East Asia and Pacific Regional Office E}___£_____________-_ FOROFFICIALUSE ONLY Document of the WorldBank This document has a restricteddistribution and may be used by recipients only in the performance of their official duties. Its contents may not otherwise be disclosed without World Bankauthorization. Public Disclosure Authorized Public Disclosure Authorized Public Disclosure Authorized Public Disclosure Authorized
-
Upload
khangminh22 -
Category
Documents
-
view
2 -
download
0
Transcript of The Philippines - Selected Issues for the 1983-87 Plan Period

Report No. 3861-PH
The PhilippinesSelected Issues for the 1983-87 Plan Period
| .t J ''' -4'.. CF O
)une 1, 1982
East Asia and Pacific Regional Office E}___£_____________-_
FOR OFFICIAL USE ONLY
Document of the World Bank
This document has a restricted distribution and may be used by recipientsonly in the performance of their official duties. Its contents may not otherwisebe disclosed without World Bank authorization.
Pub
lic D
iscl
osur
e A
utho
rized
Pub
lic D
iscl
osur
e A
utho
rized
Pub
lic D
iscl
osur
e A
utho
rized
Pub
lic D
iscl
osur
e A
utho
rized

CURRENCY EQUIVALENTS (April 1982)
US$ 1.00 = 8.4 pesos
One peso = US$ 0.119

FOR OFFICIAL USE ONLY
THE PHILIPPINES
SELECTED ISSUES FOR THE 1983-87 PLAN PERIOD
Table of Contents
Page No.
WORLD BANK REPORTS ON THE PHILIPPINES, 1980-81
SUMMARY AND CONCLUSIONS . . . . . . . . . . . . . . . . . . . . . i
1. RECENT DEVELOPMENTS AND PROSPECTS FOR THE 1983-87 PLAN PERIOD 1
A. Recent Economic Developments . . . 1B. Strategy and.Prospects for the 1983-87 Plan Period . . . 3
2. RESOURCE MANAGEMENT
A. Overview of Savings and Investment . . . . . . . . . . . 15B. Mobilization and Allocation of Resources for Private
Investment: The Role of the Financial Sector . . . 18C. Public Sector Resource Mobilization . . . . . . . . . . 22
3. THE PUBLIC EXPENDITURE PROGRAM
A. Level and Structure of Public Expenditures . . . . . . . 29B. Priorities Among and Within Sectors . . . . . . . . . . 32C. Planning and Execution of Public Expenditures .40D. The Role of the Public Sector . . . . . . . . . . . . . 40
4. REGIONAL ASPECTS OF DEVELOPMENT
A. Regional Disparities and Regional Growth . . . . . . . . 40B. Government Programs and Policies for Regional
Development . . . . . . . . . . . . . . . . . . . . . 43
5. THE BALANCE OF PAYMENTS
A. Recent Balance of Payments Developments. . . . . . . . . 49B. Adjustment in the Current Account. . . . . . . . . . . . 50C. External Capital Requirements . . . . . . . . . . . . .
STATISTICAL APPENDIX ... . . . . . . . . . . . . . . . . . . . . 63
MAP
This report was prepared by an economic mission which visited the Philippinesin September 1981. The mission consisted of Bruce Jones (Chief),Guenter Reif, Carroll Long, Chukwuma Obidegwu, Christian Moulin andVeronique Bandon. Sarshar Khan also contributed to the report in the areaof the energy sector and advised the mission in certain other areas. Adraft report was discussed with Government officials in Manila duringApril/May 1982.
This document has a restricted distribution and may be used by recipients only in the performance oftheir official duties. Its contents may not otherwise be disclosed without World Bank authorization.

TABLES IN TEXT
Page No.
1. Selected Growth Rates 22. Selected Economic and Social Indicators:
the Philippines and some other Asian Countries 53. Targeted Plan Growth Rates 74. Employment, Area, and Yields in Irrigated and Rainfed
Agriculture 85. Labor Force and Employment 146. Investment aLnd Savings Ratios "167. Nominal and Real. Interest Rates 198. Public Sector Resource Mobilization 249. Major Tax Legislation in the 1978-82 Plan Period 2610. Financing of Government Corporation Investment '711. Structure of Public Expenditures 3012. Consolidated Public Expenditures by Sector 3313. Comparative Regional Data, 1975 4114. Growth Rates of Gross Regional Product and Population 4215. Regional Distribution of Infrastructure Investment 4416. Actual and Projected Current Account 5117. Actual and Projected Current Account (Percent of GNP) 5218. Trade Indexes 5319. Balance of Payments Summary 6020. External Debt and Debt Service 61
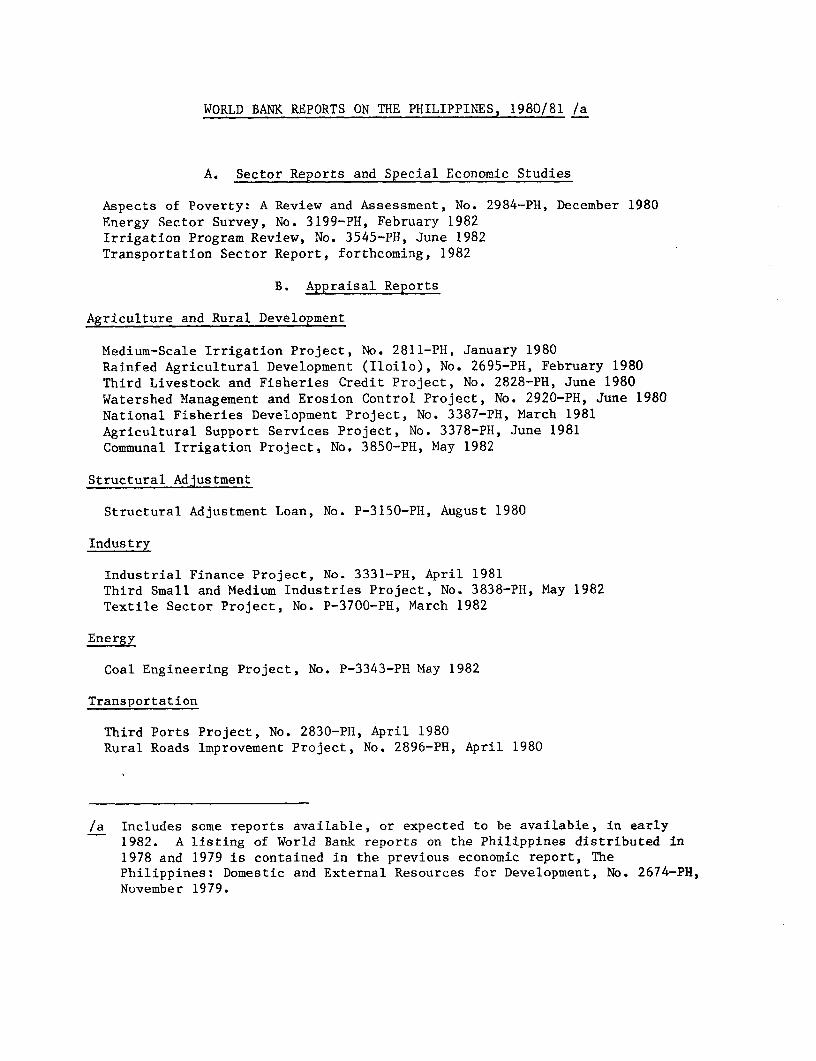
WORLD BANK REPORTS ON THE PHILIPPINES, 1980/81 /a
A. Sector Reports and Special Economic Studies
Aspects of Poverty: A Review and Assessment, No. 2984-PH, December 1980
Energy Sector Survey, No. 3199-PH, February 1982Irrigation Program Review, No. 3545-PH, June 1982Transportation Sector Report, forthcoming, 1982
B. Appraisal Reports
Agriculture and Rural Development
Medium-Scale Irrigation Project, No. 2811-PH, January 1980Rainfed Agricultural Development (Iloilo), No. 2695-PH, February 1980Third Livestock and Fisheries Credit Project, No. 2828-PH, June 1980Watershed Management and Erosion Control Project, No. 2920-PH, June 1980National Fisheries Development Project, No. 3387-PH, March 1981Agricultural Support Services Project, No. 3378-PH, June 1981Communal Irrigation Project, No. 3850-PH, May 1982
Structural Adjustment
Structural Adjustment Loan, No. P-3150-PH, August 1980
Industry
Industrial Finance Project, No. 3331-PH, April 1981Third Small and Medium Industries Project, No. 3838-PH, May 1982Textile Sector Project, No. P-3700-PH, March 1982
Energy
Coal Engineering Project, No. P-3343-PH May 1982
Transportation
Third Ports Project, No. 2830-PH, April 1980Rural Roads Improvement Project, No. 2896-PH, April 1980
/a Includes some reports available, or expected to be available, in early1982. A listing of World Bank reports on the Philippines distributed in1978 and 1979 is contained in the previous economic report, ThePhilippines: Domestic and External Resources for Development, No. 2674-PH,November 1979.

WORLD BANK REPORTS ON THE PHILIPPINES, 1980-81
Urban Development
Third Urban Development Project, No. 2703-PH, February 1980Manila Sewerage and Sanitation Project, No. 2792-PH, March 1980Urban Engineering Project, No. P-3150-PH, November 1981
Education
Sector Program for Elementary Education Project, No. 3423-PH, June 1981Vocational Training Project, No. 3750a-PH, March 1982
SUMMARY AND CONCLUSIONS
Recent Economic Developments
1. Recent economic developments have been dominated by a sharpdeterioration in the external terms of trade. The "second oil crisis" of1979 not only increased the price of a major import, but also brought aboutrecessionary conditions in the OECD countries and thereby falling prices andlittle quantitative growth for Philippine exports. From 1979 to 1981 theterms of trade deteriorated by 29%. Given the openness of the economy, thisresulted in deflation of domestic incomes and a slowdown in real domesticexpenditure. The growth rate of real GNP decelerated from 6.8% in 1978 to4.4% in 1980 and 3.8% in 1981. Recessionary conditions have persisted inthe early part of 1982, and it is expected that real GNP growth in 1982would be about 4%. Because of the deterioration in the external terms oftrade, the growth rate of real gross national income decelerated even moresharply, from 6.9% in 1978 to 2.3% in 1980 and 2.2% in 1981.
2. A number of private firms had financed long-term assets withshort-term liabilities, and were therefore in a vulnerable financialcondition when the economy decelerated and real interest rates shifted fromnegative to positive. Corporate financial difficulties led to a temporarycrisis of confidence in nonbank financial intermediaries in early 1981,which reinforced the effect of the terms of trade deterioration on businessconfidence and the level of private investment.
3. The Government took a number of measures, including expansion ofpublic investment, and Central Bank support to the financial institutions torestore and maintain confidence in the financial system, to counter theshort-term situation. At the same time, the Government has sustained itsongoing program of longer-term structural measures and investments designedto address the fundamental problems underlying the recent difficulties:considerable dependence of export earnings on a few commodities; heavydependence of the energy sector on imported petroleum; relativelyinefficient use of capital in the industrial sector, and excessivedependence of firms on short-term finance. The Government has also prepareda new Development Plan setting out its strategy for addressing these andother long-term challenges during the 1983-87 period.
Development Plan Strategy
4. The Development Plan strategy flows logically from its assessmentof the development challenges. The principal elements of the growthstrategy are the following:
(a) efficient exploitation of agricultural potentials for food,agro-energy, and export crops;
- ii -
(b) industrial development along the lines of comparative advantage,which would imply primarily labor-intensive industries, togetherwith selected capital-intensive industries based on domestic rawmaterials;
(c) expansion of necessary infrastructure to support the agriculturaland industrial growth;
(d) import-substituting investments and effective demand management inthe energy sector; and
(e) increased (lomestic resource mobilization, and more efficientresource ut:ilization.
It is expected that real GNP growth would be 6.5% p.a. during the Planperiod, and that the absorption of foreign savings would be reduced froan6.0% of GNP in 1981 to 2.6% of GNP in 1987. Equity aspects of developmentwould be pursued thrcough emphasis on employment generation; a more balancesdpattern of development among the regions; and increased public expendituresin sectors such as education, health, housing, and rural infrastructure.
5. The Plan is broadly appropriate to the Philippines' presentsituation and underlying development constraints. However, the Plan islargely strategic rather than quantitative in nature. The most criticalissues for the achievement of Plan targets are improvement in the efficiencyof resource use, and increased public sector resource mobilization.
6. Agricultural Strategy. The challenges and opportunities aresomewhat different in the irrigated and rainfed areas. Although the hig-lerproductivity of the irrigated lands is somewhat offset by a higherpopulation density, it appears that the average income per worker is higwErin the irrigated than in the rainfed areas. Furthermore, there are goodprospects for further income increases in the irrigated areas during thePlan period, since yields are presently considerably below the technologicalpotential.
7. The prospects for income growth in the rainfed areas are lesscertain. The strategy for the rainfed lowlands should consist of thepromotion of mixed farming systems comprising a range of crops and liveslocksuited to particular soils and rainfall patterns. The Government intend:!, tomake a major effort in corn during the Plan period, including disseminationof high-yielding disease-resistant varieties, and promotion of switching ofsome land from rainfed rice to corn. In some lowland areas there are alt:opotentials for commercial crops such as rubber, coffee, cotton, and cacao.The more steeply sloping uplands present a more difficult developmentproblem. The need is to combat soil erosion while simultaneously provid:nga livelihood for the people living in these areas. This can be accompli<;hedby switching land away from corn toward agro-forestry and foddercrop4

- iii -
livestock systems. However, such switching from annual subsistence cropsto longer-term cash crops requires credit, a substantial extension effort,land titling, and a reasonably good rural road network, all of which aresomewhat problematic in the upland areas.
8. Industrial Strategy. Just as the agricultural strategy is centeredaround the more productive utilization of land, the industrial strategy iscentered around the more productive utilization of capital. The principalelements of the Government's industrial strategy are:
(a) reform of trade policy and fiscal incentives for investment toencourage a more efficient and competitive industrial sector, withmore rapid growth of exports and employment;
(b) sector development programs to restructure specific industries toenable them to adjust to the policy reforms, and to promoteneglected industries with potential comparative advantages;
(c) a phased program of carefully selected major industrial projectsdesigned to deepen the industrial structure through thedevelopment of capital goods and intermediate goods industries;
(d) promotion of labor-intensive small and medium-scale industriesthrough technical, marketing and financial assistance; and
(e) regional dispersal of industry.
9. Population and Employment in the Plan Period. Two of the majorchallenges facing the Philippines in the Plan period are the highest levelof fertility and most rapidly growing labor force in East and SoutheastAsia. In the Plan it is projected that the crude birth rate will decline by16% from 1980 to 1987, leading to a decline in the population growth rateform 2.5% in 1980 to 2.2% in 1987. However, such a fertility decline couldbe achieved only with an intensified and more effective family planningeffort than indicated by the results of recent surveys.
10. The labor force is projected to increase by 3.7% annually duringthe Plan period, because the working-age population (reflecting the veryhigh fertility rates of the 1960s) is growing more rapidly than the totalpopulation, and because there is expected to be an increase in the laborforce participation rate. Between 1980 and 1987, the economy will have tofind jobs for 5 million persons, or 700,000 persons annually, if an increasein unemployment is to be prevented. The industrial policy reforms areexpected to promote more rapid growth of employment in the organized manu-facturing sector. However, the organized manufacturing sector presentlyaccounts for only a small share of total employment, and the labor forcewill grow so rapidly that most of the increment will have to be absorbed inthe already overcrowded agricultural and services sectors. The labor market
- iv -
situation therefore has a potential for stagnation or decline of real wagesand deterioration of income distribution. It will therefore be important inthe Plan period for the Government to utilize the fiscal system, both taxingand spending, for equity objectives.
Resource Management
11. Reducing the present unsustainable level of foreign savingsabsorption will require some combination of increased domestic savings and areduced level of investment. The high level of investment in the 1970s hasnot been accompanied by a corresponding growth performance, indicating thatsome of the investment has been inefficient. The Government has recentlyimplemented industrial and financial policy reforms designed to improve theefficiency of private investment; steps are also needed to improve theefficiency of public investment. The financial sector reforms are alsoexpected to increase private sector resource mobilization. Substantialsteps will be necessary in the Plan period to increase public sectorresource mobilization.
12. Private Sav4ings and the Financial Sector. The objectives of t:heGovernment's financia.l sector policy are to promote savings, to increase! theshare of financial savings in total savings, and to increase theavailability of financial savings on a longer-term basis (long-term loans orequity). In keeping with these objectives, the Government implemented acomprehensive set of regulatory reforms and related measures in 1980-81:all interest rates, except for lending rates of up to two years' maturitVwere deregulated; legislated specialization of financial institutions ha3been substantially reduced; and monetary and fiscal incentives forlonger-term lending and equity investment have been provided.
13. Government banks - principally the Philippine National Bank (Plil),the Development Bank of the Philippines (DBP), and the Land Bank of thePhilippines (LBP) - account for 36% of the assets of the banking system.Their behavior is therefore a significant influence on the financial sysl:emas a whole. Because of widespread defaults as well as relatively lowinterest rates, the resource mobilization performance of these institutioinshas been poor, and these institutions have therefore been heavilydependent on government contributions and government-guaranteed foreignborrowings. The Government has recently raised the lending rates of theseinstitutions as part of the overall rationalization of interest rates in tQeeconomy, and new management has been brought to DBP. Sustained anddetermined efforts will be needed to improve the loan evaluation capabil:ltyand loan recovery performance of these institutions.
14. Public Sector Resource Mobilization. Because of the low level ofpublic sector resource mobilization, government current expenditures are toolow, project implementation has been deteriorating, and recently the publicsector deficit has become too high. During the 1983-87 Plan period, it
- v -
will be necessary to reduce the public sector deficit in relative terms, aspart of the overall effort to reduce the current account deficit in thebalance of payments in relative terms. Every aspect of public sectorresource mobilization - tax effort, cost recovery by government corporations,and loan recovery by government financial institutions - needs to besubstantially strengthened.
15. It was expected that the tax strategy described in the DevelopmentPlan for 1978-82 would increase national government and local government taxrevenues to an average of 14.6% of GNP during 1978-82, which would have beena broadly appropriate level. However, the tax ratio was only 12.3% in1978-80 and then fell back to 11.0% in 1981 under the impact of recessionaryconditions. The shortfall from Plan projections has been primarily in thearea of domestic taxation, although taxes on international trade alsoslipped sharply in 1981. The shortfall appears to reflect the followingfactors: the Plan underestimated the need for new tax measures, some of thecontemplated Plan tax reforms are either taking effect fairly late in thePlan period or otherwise have not been enacted; and the revenue performanceimplies that tax administration has not improved very much. A substantialimprovement in the tax effort will be needed if there is to be a reasonablechance of achieving the objectives of the 1983-87 Development Plan.
16. The government corporations have recently been financing less than10% of their investment programs from internal cash generation. Because ofthis low self-financing ratio, these investment programs have been heavilydependent on government contributions and government-guaranteed foreignborrowings. This reflects various factors. (a) tariffs which are unreason-ably low from efficiency, equity, and resource mobilization perspectives;(b) low collection performance of charges which are at a reasonable level,(c) investments in new activities which have not yet been compensated bygeneration of revenue-earning services. In the Plan, the Government hasstated that the charges of government corporations will be regularlyrevised, to reduce the dependence of these corporations on the budget andgenerate savings to finance expansion. A reasonable target would be toincrease government corporation internal cash generation to 1.5% of GNP in1985.
The Public Expenditure Program
17. The public expenditure program is one of the most importantinstruments available to the Government for promoting development. Becausepublic sector resource mobilization performance has been less than projectedin the Development Plan for 1978-82, public expenditures have also beenless, leading to a relatively low level of current expenditures and adeceleration, in the face of a much larger number of projects, in the paceof implementation of individual projects. During the next Plan period1983-87, it would be appropriate to emphasize not only increased publicsector resource mobilization but also better allocation of publicexpenditures, both substantively and procedurally.
- vi -
18. Level and Structure of Public Expenditures. A striking trend hasbeen the shift in the distribution of public expenditures between currentand investment expenditures. National government and local governmentcurrent expenditures have decreased from 13% of GNP in 1976 to an estimated9% of GNP in 1982. The reduction in current expenditures has resulted .ininadequate maintenance of roads and irrigation systems; insufficientoperating supplies in the health and education sectors; and civil servicecompensation levels which generate problems in retaining sufficient numbersof capable professional and managerial staff.
19. Public fixed investment, on the other hand, has increased from5.5% of GNP in 1978 to 8% of GNP in 1980-82. This principally reflects thegrowth of government corporation investment, due to an increase ininfrastructure investment in sectors dominated by revenue-earning entities,particularly the energy sector; and an increasing public sector role innon-infrastructure activities such as industrial projects, real estatedevelopment, and agricultural marketing, which traditionally have areas ofprimary private sect:or responsibility. There has also been an expansion ofGovernment financial investment; this reflects the need to support theliquidity of government financial institutions in the face of poor loaiarecovery, the Indust:rial Rescue Fund, and the KKK program. Over the mediumterm, the primary need t:o bring about a better balance by raising governmentcurrent expenditures to a more reasonable level while cutting back oninvestment expenditures.
20. Priorities Among Sectors. At the present time, the largestsectors accounting for the largest share of public expenditure are: energy3.4% of GNP; transportation, 2.5% of GNP; education, 2.1% of GNP; andagriculture, 1.8% of GNP. The sectors which have displayed the most rapidgrowth during the 1978-82 Plan period are energy, industry (because of theMIP program) and housing. The sectoral distribution prevailing at thepresent time appears to be broadly appropriate. Any further shift in favorof energy, industry, or housing, would unreasonably compress agriculture,non-energy infrastructure, eduction and health.
21. Planning and Execution of Public Expenditures. In order toenhance the Government-s capability to efficiently make choices amongcompeting sectoral priorities, strengthening the system for the financialand operational planning of the public sector is a high priority task.Appropriate concepts have been set out in the Budget Reform Decree:(a) strengthening of planning-programming-budgeting linkages; (b) shiftLngsome of the weight oE resource allocation decision-taking from an annuaLbasis to a medium-term basis ("long-term budgeting"); and (c) integrattigthe government corporations more effectively into the public sector invlest-ment program and financial strategy ("total resource budgeting"). In ol-derto implement these concepts, the Government intends to adopt a medium-termfinancial planning systerm, covering the government corporations as well asthe National Government proper, during the 1983-87 Plan period. This w:ould
- vii -
provide a more stable environment for programming by implementing agenciesand facilitate simplification of budget execution procedures.
22. The Role of the Public Sector. The public sector has recentlybecome increasingly directly involved in activities which traditionally inthe Philippines have been areas of primarily private sector responsibility.There are well-justified rationales for some but not all of these involve-ments. These involvements have come at a time when the Government has notyet completed the task of providing basic public services, such as ruralroads and bridges or sanitary water supply, to all segments of the popu-lation, and when public sector project implementation has been deterioratingbecause of lack of funds. They have also given rise to some concern in thePhilippine private sector as to the relative roles of the public and privatesectors. In the new Plan the Government has, however, reaffirmed that theprivate sector will be the leading partner in development, and that the roleof public sector is to provide direction and basic support. This shouldprovide the basis for a more sharply focussed but more effective publicsector development effort.
Regional Aspects of Development
23. Historically, economic activity has been highly concentrated in theManila area; 1975, GDP per capita in Metro Manila was three times that inthe rest of the Philippines. This disparity, and the congestion and othersocial costs that can result from large-scale internal migration, argues infavor of substantial efforts to improve incomes in the poorer regions. Theprincipal aspects of the Government's regional development effort have been:
(a) better distribution of public investment among the regions;
(b) some decentralization of planning and programming functions,to promote more effective distribution of investment withinregions; and
(c) revision of industrial promotion policies to encourage a betterdistribution of industrial investment (the largest element ofprivate investment) among the regions.
There has been some progress in all of these areas but additional effortswill be needed during the 1983-87 Plan period.
Balance of Payments Adjustment
24. Adjustment in the Current Account. During the past two years, theGovernment has undertaken substantial measures - such as strengthening ofexport incentives, trade policy reform, interest rate deregulation, and aflexible exchange rate policy to promote balance of payments adjustment.These measures will have a significant impact over the medium term.
- viii -
However, in the short term the positive impact of these measures has beenexceeded by the negative impact of the terms of trade deterioration. Tlecurrent account deficit has therefore widened from $1.2 billion (4.9% DfGNP) in 1978 to $2.3 billion (6.0% of GNP) in 1981. In 1982, the termi.s oftrade are expected to stabilize, and the current account deficit is expectedto be $2.2 billion ('5.4% of GNP).
25. As the Plan recognizes, the dependence of the economy on foreignsavings must be reduiced during the Plan period, in order to maintain thIemanageability of the debt burden. This can be accomplished throughappropriate domestic resource management (fiscal and financial) policies toreduce the excess oi domestic investment over national savings; andinvestments and policies to adjust the production structure of the economyin such a way as to increase exports and efficiently replace imports.
26. The Philippines has a trade surplus in the agricultural andmineral sectors, and a trade deficit in the energy and manufacturing sectors.This is a typical pattern for a primary product-exporting, oil-importingdeveloping country. The two principal developments which have caused thewidening of the current account deficit are the growth of net energy importsare (including the e!nergy capital goods necessary for the adjustment process)from 5.3% of GNP in 1978 to 7.0% of GNP in 1981, and the growth of intesrestpayments from 1.3% of GNP in 1978 to 3.3% of GNP in 1981, reflecting both alarger volume of debt and a higher average cost. Meanwhile, the non-energybalance of trade has become positive, increasing from zero in 1978 to 1.2%of GNP in 1981. This indicates that there has been some adjustment in theeconomy generally to offset the higher energy prices and interest rates.
27. In principle, a structural adjustment program could focus onincreasing the agricultural and mineral surpluses, reducing the manufac-turing and energy deficits, or some combination of both. The Philippinestrategy is broadly to concentrate on reducing the manufacturing and eniergytrade deficits, while maintaining the agricultural and mineral surpluses.This reflects the fact that there are substantial profitable opportunitiesfor reducing the manufacturing and energy deficits through manufacturecexport growth, selective and economic import substitution in manufacturilng,and development of domestic energy production. At the same time, however,efforts are also being made to increase domestic processing of agriculturalproducts and minerals. Over the medium term, these structural adjustmeMt:efforts will reduce the vulnerability of the Philippine economy of fluc-tuations in the world prices of commodities.
28. If a substantial adjustment effort is made, and if the externalterms of trade improve as expected, then the trade deficit could be redulcedfrom $2.2 billion in 1981 to $1.9 billion by 1985. The current accountdeficit would then a:Lso be about $1.8 billion (3.5% of expected 1985 GNI').The recovery in the external terms of trade is, however, dependent on arecovery of the world economy in 1983. Because this is uncertain, the
- ix -
Philippines will have to take a cautious approach to balance of paymentsmanagement. This implies avoiding an investment program of a magnitude thatwould prevent reduction in the current account deficit, should the terms oftrade fail to recover as expected.
29. External Capital Requirements. Even with a strong adjustmenteffort the external capital requirements will be very considerable. TheGovernment hopes to raise more of the necessary external capital in the formof direct equity investment than it has in the past, particularly for theMIP program. Even if this effort is successful, the requirement for grossdisbursements of medium-and long-term loans would increase from $2.1 billionin 1981 to $3.2 billion by 1985. On the basis of known plans of officiallenders, disbursements of official-source loans, which were $830 million in1981, would increase by about $100 million annually. The requirement forgross disbursements from private source MLT loans would then increase from$1.2 billion in 1981 to as much as $2.0 billion annually by 1985. Thewillingness of these private sources to provide the necessary funds wouldlikely be influenced by, among other things, their perception of whether asufficient adjustment effort, to maintain the manageability of thePhilippine balance of payments over the longer term, was being made.
30. Assuming that export volume growth can recover to 8% p.a., and theterms of trade recover as expected, the debt service ratio, which increasedfrom 17% in 1978 to 19% in 1981 and is expected to be 23% in 1982, wouldstabilize at about 22% for the remainder of the Plan period. This would bea heavy but not an insupportable burden. The balance of payments managementissue is the need to avoid a situation in which the requirements for privateexternal capital exceed the willingness of private sources to furtherincrease their exposure in the Philippines. Should such a situationmaterialize, there would be an unplanned reduction in imports and thereby adisruption of the growth process. Such a situation can be avoided throughvigorous pursuit of the Plan strategies of increased domestic resourcemobilization and more efficient resource utilization.

1. RECENT DEVELOPMENTS AND PROSPECTS FOR THE 1983-87 PLAN PERIOD
A. Recent Economic Developments
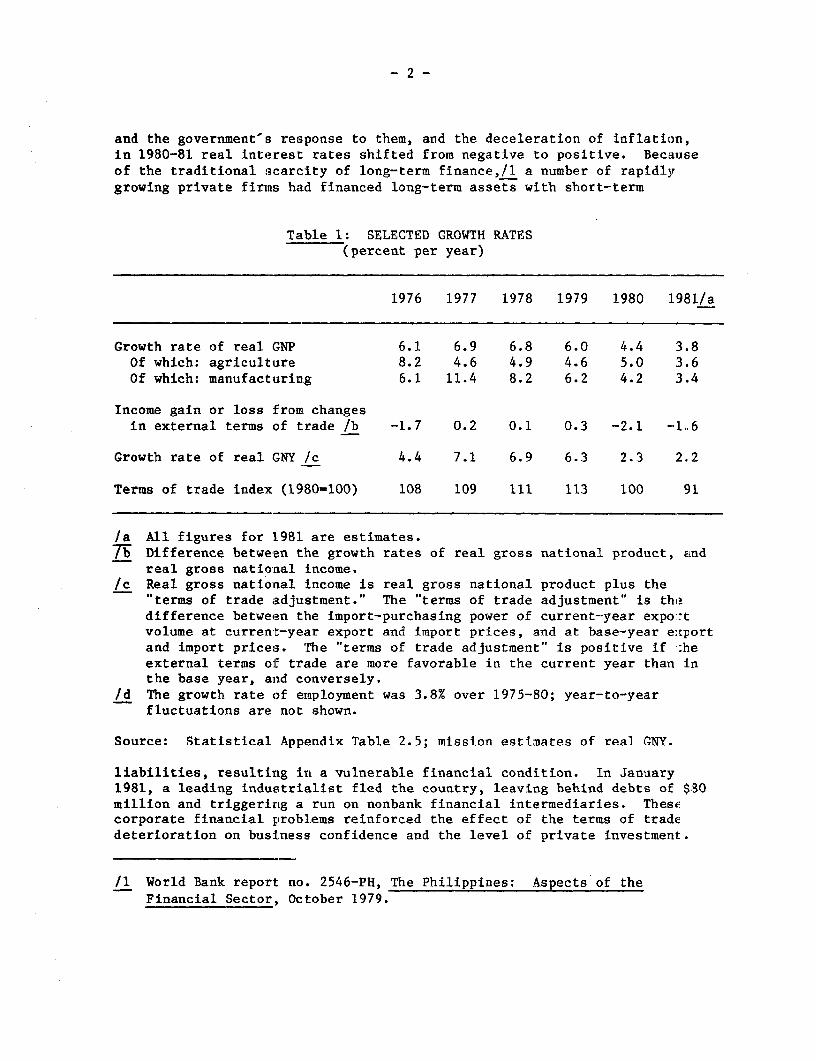
1.01 Recent Philippine economic developments have been dominated by asharp deterioration in the external terms of trade. As indicated in Table 1,the terms of trade, which had reached a depressed level in 1976-77 by long-term historical standards /1 began to recover slowly during 1977-79.However, the recovery turned out to be short-lived. In 1979 the "secondoil crisis" resulted in a major increase in the price of imported petroleum.There were also adverse price developments on the export side, some relatedto long-term trends (the growth of palm oil and soybean oil production ascompetitors to coconut oil), some related to traditionally cyclical behavior(sugar), and some related to recessionary conditions in the manufacturingand construction industries in the OECD countries (copper, lumber). Coconutprices peaked in 1979, and sugar and copper prices peaked in 1980. By 1981,the external terms of trade had fallen by 20% from the level of 1979, and by17% from the previous low in 1976-77.
1.02 The deterioration of the terms of trade had a deflationary impacton domestic incomes and, therefore, on production for the domestic market aswell as for the export market. The growth rate of real domestic expenditure(consumption plus investment) decelerated from 6.5% in 1978 to 3.9% in 1980and 3.4% in 1981. The growth rate of real GNP decelerated from 6.8% in 1978to 4.4% in 1980 and 3.8% in 1981. Recessionary conditions have persisted inthe early part of 1982, and it is expected that real GNP growth in 1982 wouldbe about 4%.
1.03 Because of the terms of trade developments, real gross nationalincome (the purchasing power of real GNP) has been growing even more slowlythan real GNP. During 1979-81, real GNP grew by a cumulative 8.9%. However,real gross national income increased by only 4.5% during the same period.Recently population has been growing by about 2.5% annually and the laborforce (reflecting the very high fertility rates of the 1960s) has beengrowing by about 3.5% annually. It would therefore appear that real incomeshave fallen slightly since 1979. The terms of trade are expected tostabilize in 1982, and therefore real incomes should begin to recover.
1.04 The economic slowdown was one of the factors underlying atemporary crisis of confidence in the financial system in early 1981. Withthe increase in nominal interest rates arising from external developments
/1 According to the 1972-based indices published by the Central Bank,the terms of trade had reached a level in 1976-77 that was 32%below the average level prevailing in 1970-72, before the 1973/74commodty boom and the first oil crisis. The 1970-72 level was, inturn, 15% below the average level prevailing in the 1960s.
- 2 -
and the government's response to them, and the deceleration of inflation,in 1980-81 real interest rates shifted from negative to positive. Becauseof the traditional scarcity of long-term finance,/l a number of rapidlygrowing private firms had financed long-term assets with short-term
Table 1: SELECTED GROWTH RATES(percent per year)
1976 1977 1978 1979 1980 1981/a
Growth rate of real GNP 6.1 6.9 6.8 6.0 4.4 3.8Of which: agriculture 8.2 4.6 4.9 4.6 5.0 3.6Of which: manufacturing 6.1 11.4 8.2 6.2 4.2 3.4
Income gain or loss from changesin external terms of trade /b -1.7 0.2 0.1 0.3 -2.1 -1.6
Growth rate of real GNY /c 4.4 7.1 6.9 6.3 2.3 2.2
Terms of trade index (1980=100) 108 109 111 113 100 91
/a All figures for 1981 are estimates.7b Difference between the growth rates of real gross national product, and
real gross national income./c Real gross national income is real gross national product plus the
"terms of trade adjustment." The "terms of trade adjustment" is thedifference betweean the import-purchasing power of current-year expo:-tvolume at currenit-year export and import prices, and at base-year e:cportand import prices. The "terms of trade adjustment" is positive if T:heexternal terms of trade are more favorable in the current year than inthe base year, and conversely.
Id The growth rate of employment was 3.8% over 1975-80; year-to-yearfluctuations are not shown.
Source: Statistical Appendix Table 2.5; mission estimates of real GNY.
liabilities, resulting in a vulnerable financial condition. In January1981, a leading industrialist fled the country, leaving behind debts of $30million and triggerirng a run on nonbank financial intermediaries. Thestcorporate financial problems reinforced the effect of the terms of tradedeterioration on business confidence and the level of private investment.
/1 World Bank report no. 2546-PH, The Philippines: Aspects of theFinancial Sector, October 1979.

-3-
1.05 The Government took a number of measures, including expansion ofpublic investment and Central Bank support to the financial institutions torestore and maintain confidence in the financial system, to counter theadverse short-term situation. At the same time, the Government has sustainedits ongoing program of longer-term structural measures and investmentsdesigned to address the fundamental problems underlying the recentdifficulties: considerable dependence of export earnings on a fewcommodities; heavy dependence of the energy sector on imported petroleum;relatively inefficient use of capital in the industrial sector, andexcessive dependence of firms on short-term finance. The Government hasalso prepared a new Development Plan setting out its strategy for addressingthese and other long-term challenges during the 1983-87 period.
B. Strategy and Prospects for the 1983-87 Plan Period
Development Challenges and Development Strategy
1.06 Most of the development challenges facing the Philippines in the1983-87 period are well described in the Plan document. These are:
(a) the need to expand productive employment in order to reduceunemployment and underemployment;
(b) the need to raise agricultural and industrial productivitythrough more effective use of land and capital;
(c) the need to redress rural and regional growth disparities, withparticular emphasis on rainfed agriculture;
(d) the need to reduce dependence on imported energy;
(e) inadequate infrastructure, particularly in the rural areas;
(f) insufficient domestic resource mobilization, leading to a highlevel of dependence on foreign borrowings; and
The need to provide for a larger population is also mentioned, but there isless recognition of the adverse implications of rapid population growth foreconomic and social development than in previous Philippine Plans. Thesevarious challenges, and Government policies and programs to meet them, arediscussed at various points later in this report.
1.07 It may be helpful to place some of the challenges facing thePhilippines in the perspective of inter-country comparisons. As indicated inTable 2, the Philippines has the highest fertility rate and the most rapidlygrowing labor force in East and Southeast Asia. The agricultural populationdensity is greater than in the Philippines' ASEAN neighbors, excluding thecity-state of Singapore, but lower than in the extremely densely populated

- 4 -
countries of Korea and China. The Philippines and Thailand currently have ahigh level of dependence on imported energy, but fortunately both countrieshave reasonably good prospects for reducing this dependence. The level ofnet external indebtedness is quite high; this indicates the need forintensified domestic resource mobilization efforts and restraint in foreignborrowing. On the positive side, the Philippines has a fairly high level ofgeneral education, and the important nonquantifiable asset of a vigorousentrepreneurial class.
Table 2: SELECTED INDICATORS: PHILIPPINES AND SOME OTHER ASIAN COUNI'RIES
Projectedlabor force Agricultural Dependence External Secondlary
Total growth population/ on imported debt/GNP schaolfertility (% p.a.) arable land energy (%)/a (%) enrollmentrate 1980-1990 (persons/ha) 1980 1980 rati (%)
Philippines 4.6 3.5 3.4 88 28 55
Indonesia 4.6 2.7 3.0 - 29/b L9
Thailand 4.3 2.7 2.0 89 20 28
Malaysia 3.8 2.9 0.7 - 22 !S8
Korea 3.3 2.7 5.9 72 29 50
/a Ratio ef net fuel imports (imports minus exports of crude petroleum,petroleu- products, and coal) to total energy consumption. For netexporters ,mport-dependence is indicated as zero.
/b Although inhionesia has a fairly high level of gross external debt, is: hasalso accumnlated very substantial foreign assets since the oil priceincreases of 1979.
Note! Data are for most recent year available unless specifically indicati,d.
Sources: World Development Report 1981; World Bank economic reports bascd onTaetional data.
1.08 The Jlan strategy flows logically from the assessment of thedevelopment challegres. The key elements of the macroeconomic strategy arethe following:
(a) ef.icient exploitation of agricultural potentials for food,agro--ei-iergy, and export crops;
- 5 -
(b) industrial development along the lines of comparative advantage,which would imply primarily labor-intensive industries, togetherwith selected capital-intensive industries based on domestic rawmaterials;
(c) expansion of necessary infrastructure to support the agriculturaland industrial growth;
(d) import-substituting investments and effective demand management inthe energy sector; and
(e) increased domestic resource mobilization, and more efficientresource utilization.
Equity aspects of development would be pursued through emphasis on employ-ment generation; a more balanced pattern of development among the regions;and increased public expenditures in sectors such as education, health,housing, and rural infrastructure. The Plan strategy is broadly appropriateto the Philippines' present situation and underlying development constraints.
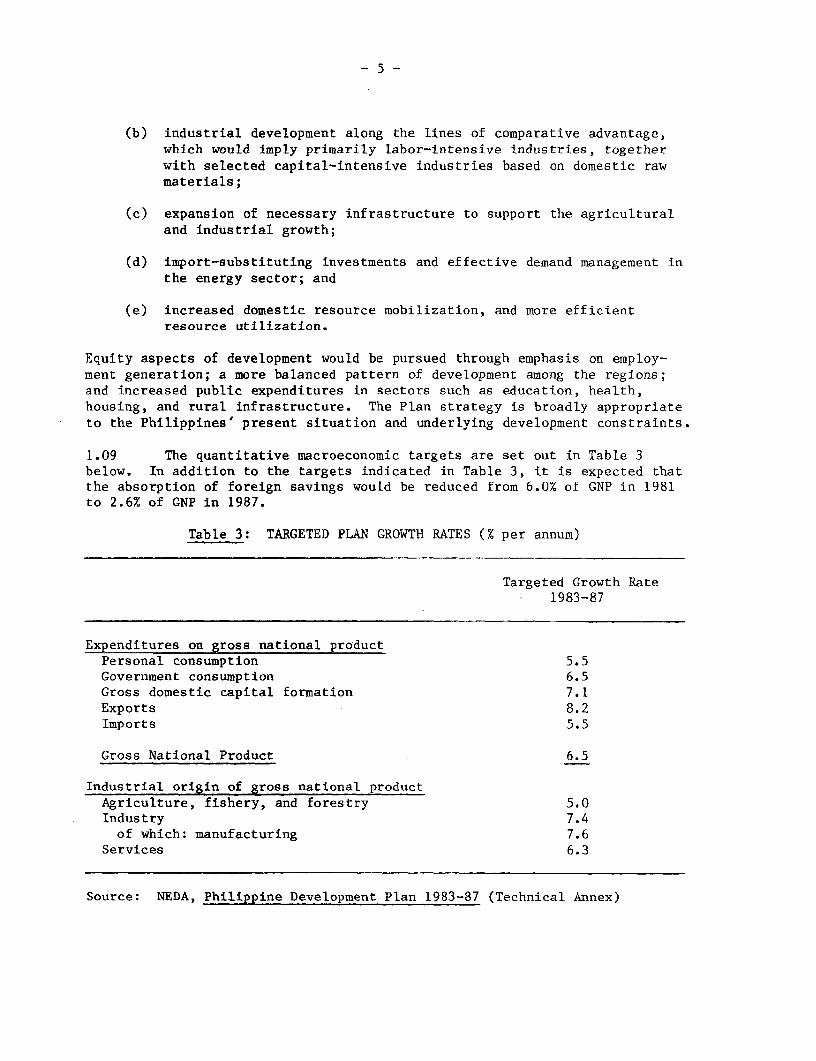
1.09 The quantitative macroeconomic targets are set out in Table 3below. In addition to the targets indicated in Table 3, it is expected thatthe absorption of foreign savings would be reduced from 6.0% of GNP in 1981to 2.6% of GNP in 1987.
Table 3: TARGETED PLAN GROWTH RATES (% per annum)
Targeted Growth Rate1983-87
Expenditures on gross national productPersonal consumption 5.5Government consumption 6.5Gross domestic capital formation 7.1Exports 8.2Imports 5.5
Gross National Product 6.5
Industrial origin of gross national productAgriculture, fishery, and forestry 5.0Industry 7.4of which: manufacturing 7.6
Services 6.3
Source: NEDA, Philippine Development Plan 1983-87 (Technical Annex)
1.10 In reviewing the targetted growth rates, it is difficult to behighly confident of quantitative projections of the Philippine economy, fortwo reasons. First, there are the usual uncertainties concerning theexternal environment. Second, the Government has initiated a structuraladjustment process, with measures in the industrial, financial, and energysectors designed to improve the structure and efficiency of the economy.While these measures can be expected to bring about a substantial improvementin economic efficiency and performance over a medium- to long-term period, thetime-path of such improvement is quite uncertain, particularly consideringthat there will be a complex interaction between the impact of these measuresand other factors such as fluctuations in the external terms of trade.
1.11 With the above caveats, some commentary on the Plan targets wouldbe appropriate. The projected export growth could be achieved by combiningcommodity export growth of 5% p.a. and manufactured export growth of 12% p.a.The volume of oil imports is expected to remain constant or possibly decreaseslightly, and therefore non-oil imports could be permitted to increase byabout 7% annually while containing overall import growth at the projecte.lrate. Thus the trade projections are broadly reasonable. The projectedgrowth of government consumption implies that the ratio of government cu-.rentexpenditures to GNP would remain constant. However, as discussed in Chapter3, there is a need for- an increase in the ratio of government currentexpenditures to GNP. The projected growth of capital formation implies t:hatthe ratio of investment to GNP would be rising. However as discussed inChapter 2, given domestic savings prospects, the necessary reduction inforeign savings probably could be achieved only with a stable or margina.lydecreasing investment ratio. It will be necessary to pursue policies whichwill improve the efficiency of investment and allocate an affordable amolant ofinvestment to the most: productive uses. In the case of private investmentthis would be done, as indicated in the Plan, largely through market-orientedinterest rates and exchange rates. In the case of public investment,difficult choices will, have to be made among competing priorities such asreducing dependence on imported petroleum, deepening the industrial stru(:tlre,and providing non-energy infrastructure in the outlying and relativelydepressed regions where most of the poorer people live.
1.12 The Plan is largely strategic rather than quantitative in nature.In order to enhance its capacity for the quantitative aspects of planning;,the Government intends to strengthen its statistical system, and itscapabilities in such areas as macroeconomic modelling and public sectorfinancial planning. A major purpose of the present report is to illustrateselected Plan period issues through suggestive quantitative analysis. Thleremainder of this chapter discusses strategy for the agricultural andindustrial sectors, which are the key engines of growth, and the populatiLnand employment prospects. Other Plan period issues, such as resourcemobilization, public eKpenditure management, regional development, and balaLnceof payments adjustment are discussed in Chapters 2 through 5.

-7-
Agricultural Strategy
1.13 By international standards, agricultural yields in the Philippinesare still relatively low. While this circumstance is a source of ruralpoverty, it also means that increased land productivity can be a significantsource of economic growth, unlike the case in countries, such as China orKorea, which have already achieved high physical yields per hectare. Thechallenges and opportunities are somewhat different in the irrigated andrainfed areas. As indicated in Table 4, the former are characterized by highpopulation density and high yields whereas the latter are characterized bylower population density and lower yields./l Taking into account yields/crop, cropping intensity, and prices, it is likely that average income perworker is slightly higher in irrigated than in rainfed agriculture. Further-more, there are good prospects for substantial productivity improvement inirrigated agriculture in the 1980s, whereas the prospects for rainfedagriculture are less certain.
Table 4: EMPLOYMENT, AREA, AND YIELDS IN IRRIGATEDAND RAINFED AGRICULTURE, 1980
Agricultural Cultivated Workers Yieldslabor force area per ha (mt/ha)(millions) (million ha)
Irrigated agriculture 2.0 1.2 1.7 2.8 (irrigated rice)
Rainfed agriculture 6.4 7.8 0.8 1.6 (rainfed rice),1.0 (copra), 1.0 (corn)
Total 8.4 9.0 0.9
/1 A study in the Western Visayas found that the farm area needed toachieve an income of 3,000 pesos/year was 1.0 hectare for irrigatedrice, 2.0 hectares with one crop of rainfed rice and a second crop ofcorn, and 2.7-3.0 hectares for upland farming. World Bank reportno. 2984-PH, Aspects of Poverty in the Philippines, (December 1980),p. 65.
- 8 -
1.14 Irrigated Agriculture. At present, almost all of the irrigated landin the Philippines is devoted to rice cultivation and this is likely to remainthe case for the foreseeable future./l Therefore, the strategy for irrigatedagriculture is an aspect of the overall strategy for rice. In the Plan it isprojected that, due t:o ongoing and new irrigated projects, the irrigated areawould increase from an estimated 1.4 million ha in 1982 to 2.0 million ha in1987, contributing tc, a growth rate of rice production of 3.7% annually duringthe Plan period sufficient to meet the growth in domestic demand.
1.15 Alternative projections imply, however, that comparable productionincreases could be achieved with a smaller increase in the irrigated area./2It is estimated that, due to increases in yield per crop and in croppingintensity (crops/year), yields per year on irrigated area could increase by31% during the decade of the 1980s. This, together with an increase inirrigated project service area from 1.2 million ha in 1980 to 1.6 million hain 1985 from completion of ongoing projects only, is expected to result in agrowth rate of rice production of 3.4% annually during the 1980s. With thehigher yield increases and the maximum increase in irrigated area, and inthe absence of either an export program (which would require cultivation ofuniform varieties and greatly improved post-harvest handling) or a foodsubsidy program for poverty target groups, there would be surpluses on thedomestic market beginnaing in the mid-1980s, which would tend to depressprices. It would appear that raising yields, through improved extension andappropriate pricing policy, on areas which are presently irrigated or soonwill be as a consequence of ongoing projects, will be a more cost-effectivemeans of achieving necessary increases in rice production than starts on newirrigation projects.
1.16 Rainfed Agr:iculture. The bulk of the rainfed cultivated area Lnthe Philippines is devoted to rice, corn, and coconut. In contrast toirrigated agriculture which is monocultural, rainfed agriculture isdominated by mixed farming systems, thus, corn may be grown as a second (:ropafter rainfed rice, or may be grown under coconut; and livestock raisingoften accompanies cultivation of crops. The rainfed areas of thePhilippines are characterized by an enormous diversity of climatic con-ditions, slope, soil types and locational and ethnic influences. Whilethere are no clear gecgraphic lines between different rainfed areas, it isuseful to consider separately the gradually sloping lowlands, and the moresteeply sloping uplands.
/1 Sugarcane and corn are also crops which, under certain circumstances,can be grown on irrigated land. However, most of the soils underirrigation are not well suited for sugarcane or corn; irrigated corncultivation, where agronomically feasible, would be less profitable tAanirrigated rice cultivation; and sugarcane is grown principally on largeestates which, from the social point of view, are a lower priority fo:-productivity improvement than small farms.
/2 World Bank report no. 3545-PH, Irrigation Program Review.

1.17 The rainfed lowlands have relatively more economic potential. Thestrategy for these areas should consist of the promotion of mixed farmingsystems comprising a range of crops and livestock suited to particular soilsand rainfall patterns. The gains in the area and yield of irrigated rice areexpected to reduce the relative profitability of rainfed rice cultivation.The Government therefore intends to make a major effort in corn during thePlan period, including dissemination of high-yielding disease-resistantvarieties, and promotion of switching of some land from rainfed rice to corn.In the Plan, it is projected that corn production will increase by 11%annually, primarily from yield increases, a high ambitious target in relationto past growth of 5%, mostly from area increases. In some lowland areas thereare also potentials for commercial crops such as rubber, coffee, cotton, andcacao.
1.18 The more steeply sloping uplands present a more difficult develop-ment problem. In many areas, "slash and burn" agriculture (clearing the land,followed by planting of corn for a few crops until the soil becomes tooeroded) is a serious problem. The need is to combat soil erosion while simul-taneously providing a livelihood for the people living in these areas. Thiscan be accomplished by switching land away from corn toward agro-forestry(production of leafmeal, fruits and nuts, firewood, and pulpwood) and fodder-crop/livestock systems. However, such switching from annual subsistence cropsto longer-term cash crops requires credit, a substantial extension effort,land titling, and a reasonably good rural road network. All of these effortswill be difficult in these areas, which are generally more remote and lesswell-served with infrastructure and services than the lowlands.
1.19 Agricultural Prices and Terms of Trade. Farmers' incentives andincomes are strongly affected by taxes, subsidies, the exchange rate, pricecontrols, and other pricing measures on both inputs and outputs. During the1950s and 1960s, government policy discriminated against the agriculturalsector through an overvalued exchange rate, heavy protection for the domesticindustrial sector, and price controls. In the 1970s, pricing policies foragriculture were more efficient and more equitable and the farmers' terms oftrade improved. During the past couple of years, however, the farmers' termsof trade have deteriorated./1 This is probably due primarily to externalfactors such as the second oil crisis and the fall in coconut prices, butincreased agricultural productivity may also have played a role. Notwith-standing the improved policy environment for agriculture established in the1970s, a study at the Unversity of the Philippines at Los Banos has found that"As a consequence of (the net impact of) pricing policy, agricultural produc-tion is less than what it should be ...... The fact that agriculture survivesand indeed grows suggests an inherent comparative advantage to competeeffectively in the export or home market, an advantage that would be moreeffective in the absence of these policy biases."/2
/1 Statistical Appendix Table 7.17.
/2 Christina C. David, "An Analysis of Agricultural Policies in t1lePhilippines " (1982), p. 18.
- 10 -
1.20 During the Plan period, there should be considerable increases inagricultural productivity arising from expanded irrigation, improved extensionservices, and other factors. It would be appropriate for Government policy toaim at a sharing between farmers and consumers of the benefits of improvedagricultural productivity. On the one hand, food accounts for two-thirds ofthe expenditures of low-income families, and if food prices can rise moreslowly than wages, this can be a significant element in poverty alleviation.On the other hand, raising the incomes of the farmer has been a major objec-tive of the agricultural programs, and it would be inequitable to the farmerif the impact of increased production on farm incomes were to be entirely off-set by falling prices. If the terms of trade are artificially turned againstthe agricultural sector, "premature" rural-to-urban migration (in relation toproductive job opportunities in urban areas) can result.
Industrial Strategy
1.21 Just as the agricultural strategy is centered around the moreproductive use of land, the industrial strategy is centered around the moreproductive utilization of capital. The principal elements of the Government'sindustrial strategy are:
(a) reform of overall industrial promotion policies to encourage amore efficient and competitive industrial sector, with morerapid growth of exports and employment;
(b) restructuring programs for specific subsectors;
(c) a program of eleven major industrial projects;
(d) promotion of small and medium-scale industries; and
(e) regional dispersal of industry./l
1.22 The first phase of the industrial policy reform has consisted oftrade liberalization (tariff reform and removal of quantitative importcontrols) and strengthening of export incentives. The tariff reform is i:aking^effect over a four-year period from 1981 to 1985. The maximum (nominal)tariff is being reduced to 50%; the effective rate of protection for themanufacturing sector as a whole will be reduced from 44% to 29%; and theeffective rate of protection for consumer goods manufacturing will be recucedfrom 77% to 41%. Quantitative import controls are also being removed instages over the same four-year period. Export incentives have beenstrengthened to place exporters on a free-trade basis to the maximumpracticable extent.
/1 Regional dispersal of industry is discussed in Chapter 4, RegionalAspects of Development.
- 11 -
1.23 A second phase of industrial policy reform, now under preparation,is centered around reform of fiscal incentives for investment. Under theproposed reform, the existing incentives system, which has had a capital-cheapening effect, would be replaced. The new system would compensate formarket imperfections, and would be directly related to the Government'semployment, export, and regional dispersal objectives. Economic analysiswould be more consistently employed in the selection of activities and .projects to be promoted, and the administration of the incentives would begreatly simplified to facilitate their accessibility.
1.24 Sectoral restructuring programs are designed to help specificselected industries increase competitiveness in order to adjust to the policychanges. Sector development programs are also being initiated for neglectedindustries with potential comparative advantages. Assistance includes,inter alia, the provision of fiscal incentives, financial and technicalsupport, manpower training and development, and institutional improvement.A restructuring program for the cement industry was started in 1980, and asimilar program for the textile industry will be initiated shortly. Sectordevelopment programs for the food-processing, electronics and mechanicalengineering industries are currently being formulated.
1.25 The eleven major industrial projects (MIPs) are intended to deepenthe industrial structure of the economy, through the development of selectedcapital goods and intermediate goods industries which would generate exportearnings or import savings. Two of the projects are for the production ofcapital goods, while the other nine are for the production of intermediategoods. Some of the intermediate goods projects are based on domestic rawmaterials (e.g., copper smelter, coconut-based chemicals) while others wouldbe based on imported raw materials. Intermediate goods industries aregenerally more capital-intensive and energy-intensive than either capitalgoods or consumer goods industries. Since the Philippines has a surplus oflabor and is a heavy energy importer, the comparative advantage of thePhilippines in intermediate goods projects based on imported raw materialsis not obvious, and would need to be investigated particularly carefully.The Government has displayed a flexible and pragmatic attitude towardimplementation of the MIP program, and is scrutinizing all of the projectscarefully to ensure their economic and financial viability. The need is notmerely to determine that they are export-earning or import-saving, but toensure that they are more cost-effective means of strengthening the balanceof payments than alternative investments in the economy.
1.26 Due to changes in some of the project concepts, the cost of theMIP program has been reduced from an original $6 billion to $4 billion, orabout 10% of 1981 GNP. The Government's financing strategy is to seekforeign equity investment and long-term suppliers' credits in order tominimize demands on domestic resources.
- 12 -
1.27 The importance of small- and medium-scale industries lies in theirlabor-intensity; the average capital/labor ratio in SMI is only half of thatin large-scale enterprises. During the Plan period the Government wilLexpand its program of industrial extension for SMI, which includes technicalassistance for project feasibility studies; promotion of subcontracting andother marketing assistance; and study of SMI problems and identification andtesting of solutions on an industry basis. Preferential credit programs forSMI, such as the Industrial Guarantee and Loan Fund, will be continued.
Population, Employment and Income Distribution in the Plan Period
1.28 As noted in para. 1.06, two of the major challenges facing thePhilippines are population growth arising from a high level of fertility, anda rapidly growing labor force. According to the recently published Republicof the Philippines Fertility Survey, the total fertility rate /1 fell from 5.9in 1970 to 5.0 in 1977, representing a relatively modest decline of 15% overthe seven-year period. As indicated in Table 2 this is still quite high byEast Asian standards. Most of this decline was attributable to a rise in theage of marriage; the marital fertility rate fell by only 6% during the sameperiod. The survey also found that, among married women who wished to have nomore children, only 29% were using "efficient" methods of contraception, while31% were using "inefficient" methods and 40% were not using any method at all.
1.29 In the Plan fcor 1983-87, it is projected that the crude birthrate /2 will decline by 16% from 1980 to 1987, leading to a decline in thepopulation growth rate from 2.5% in 1980 to 2.2% in 1987. However, incontrast to previous Philippine Plans, the population projection is treat:ed asa neutral projection rather than as a target. Given that the rise in the ageof marriage experienced in the 1970s will probably decelerate, the fertilityreduction implicit in the population projection could be achieved only Withmore effective family planning effort than indicated by the results of recentsurveys. Under the medium projection of the National Census and StatisticsOffice, which assumes a substantial fertility reduction, the Philippinepopulation would still increase to 70 million persons in the year 2000, ascompared with 48 million persons in 1980./3
/1 The total fertility rate is the sum of age-specific fertility rates forspecific age groups in the 15-49 years age bracket. It is therefore thenumber of children that would be born to a statistically average womnan,if she were to survive throughout the reproductive years.
/2 Unlike the total fertility rate, the crude birth rate (number of bii:thsper thousand popualation) is an indicator which is affected by theage structure of the population.
/3 Statistical Appendix Table 1.1.

- 13 -
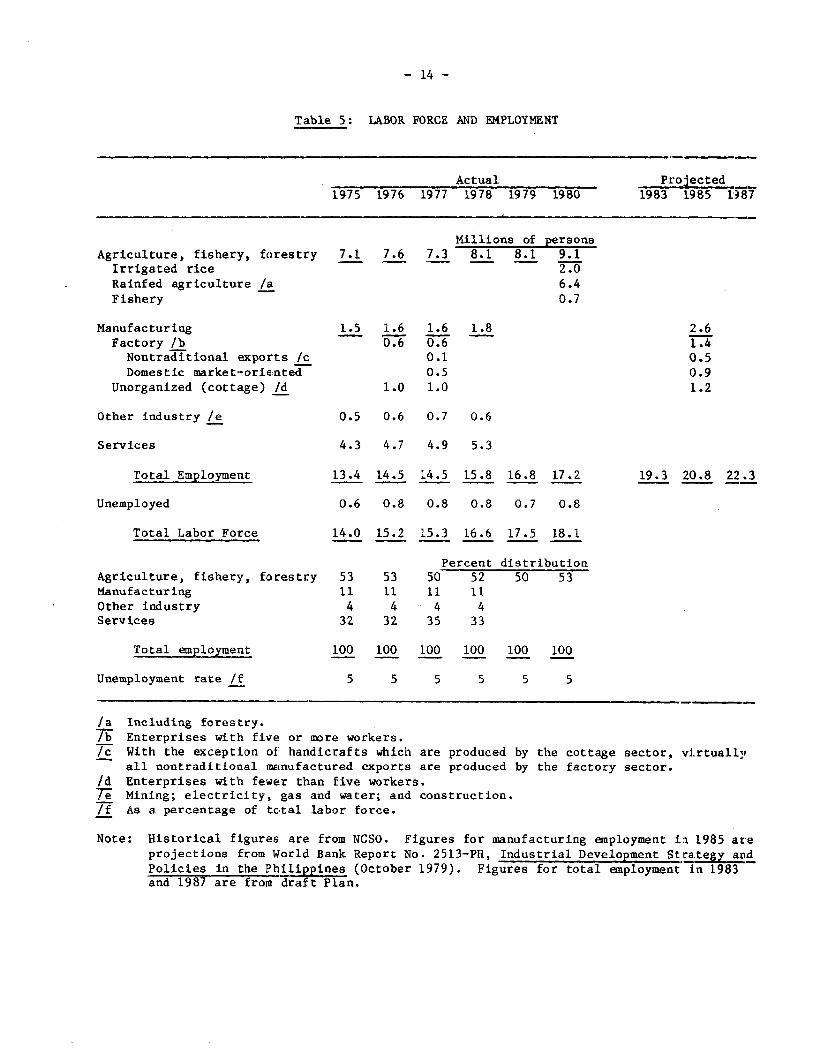
1.30 Although the total population is presently growing by 2.5% annually,the working-age population is growing by 3.1% annually because of the veryhigh fertility rates prevailing in the 1960s before the introduction of thefamily planning program. Additionally, it is expected that there will be aslight increase in the labor force partcipation rate among women. The laborforce is therefore projected by the Plan to increase by 3.7% annually. Thisis one of the highest rates in the world; the average projected labor forcegrowth for all middle-income oil-importing developing countries is 2.3%./lBetween 1980 and 1987, the economy will have to find jobs for 5 million per-sons, or 700,000 persons annually, if an increase in unemployment is to beprevented. The industrial policy reforms are expected to promote more rapidgrowth of employment in the organized manufacturing sector. However, theorganized manufacturing sector presently accounts for only a small share oftotal employment, and the labor force will grow so rapidly that most of theincrement will have to be absorbed in the already overcrowded agricultural andservices sectors (Table 5).
1.31 The empirically observed real wages of urban workers declinedsubstantially during the 1970s. Legislated minimum wages, on the other hand,more than kept pace with inflation, but it is believed that these are notwidely observed./2 Wage statistics do not give a complete picture ofdistributional trends in the economy, since many persons are self-employed inthe agricultural sector. However, if there had been adequate income-earningopportunities in the rural areas, the observed drop in urban real wages wouldhave been prevented or at least reduced by flows between the urban and rurallabor markets (assuming well-functioning labor markets, as are believed to befound in the Philippines). Thus, there are grounds for concern over distri-butional aspects of development.
1.32 The Plan strategy for addressing distributional considerations,through emphasis on employment generation, regional development, land reformand land settlement, progressive taxation, and public expenditures on ruralinfrastructure and the social sectors, is broadly appropriate. However, theneed for fertility reduction as an element of long-term distributionalstrategy is not recognized. The implications for public sector resourcemobilization and utilization of the proposed public expenditure strategy arealso not spelled out. In order to provide a better empirical basis for thedistributional strategy, it would be desirable for the Government to updateand improve the statistics on distributional aspects of development.
/1 World Development Report 1981, p. 170.
/2 Statistical Appendix Tables 11.4 and 11.5.
- 14 -
Table 5: LABOR FORCE AND EMPLOYMENT
Actual Projected1975 1976 1977 1978 1979 1980 1983 1985 11987
Millions of personsAgriculture, fishery, forestry 7.1 7.6 7.3 8.1 8.1 9.1
Irrigated rice 2.0Rainfed agriculture /i 6.4Fishery 0.7
Manufacturing 1.5 1.6 1.6 1.8 2.6Factory /b 0.6 0.6 1.4
Nontraditional exports /c 0.1 0.5Domestic market-oriented 0.5 0.9
Unorganized (cottage) /d 1.0 1.0 1.2
Other industry /e 0.5 0.6 0.7 0.6
Services 4.3 4.7 4.9 5.3
Total Employment 13.4 14.5 14.5 15.8 16.8 17.2 19.3 20.8 22.3
Unemployed 0.6 0.8 0.8 0.8 0.7 0.8
Total Labor Force 14.0 15.2 15.3 16.6 17.5 18.1
Percent distributionAgriculture, fishery, forestry 53 53 50 52 50 53Manufacturing 11 11 11 11Other industry 4 4 4 4Services 32 32 35 33
Total employment 100 100 100 100 100 100
Unemployment rate /f 5 5 5 5 5 5
/a Including forestry./b Enterprises with five or more workers.Ic With the exception of handicrafts which are produced by the cottage sector, vi.rtually
all nontraditional maLnufactured exports are produced by the factory sector.td Enterprises with fewer than five workers.7e Mining; electricity, gas and water; and construction.If As a percentage of total labor force.
Note: Historical figures are from NCSO. Figures for manufacturing employment i.Q 1985 ateprojections from World Bank Report No. 2513-PH, Industrial Development Strategy andPolicies in the Philippines (October 1979). Figures for total employment in 1983and 1987 are from draft Plan.
- 15 -
2. RESOURCE MANAGEMENT
2.01 As the Philippine population grows toward 70 million persons in theyear 2000, the ratio of population to natural resources will becomeincreasingly unfavorable. However, global experience indicates that economicdevelopment reflects not so much the endowment of natural resources, butrather the effectiveness with which all resources are utilized, includingman-made resources (capital) and human resources as well as natural resources.In the wake of the "second oil crisis," the dependence of the Philippineeconomy on foreign resources is at a greater level than is indefinitelysustainable. The Plan's emphasis on increased domestic resource mobilizationand more effective resource utilization is therefore particularly welcome.This can be achieved through conservation of natural factors of productionsuch as soil; appropriate pricing of the relatively scarcer manmade factors(capital, energy, and foreign exchange) in order to promote fuller employmentof the more abundant factor of production (labor); and better planning.
A. Overview of Savings and Investment
Level and Sources of Savings
2.02 It was originally projected in the Development Plan for 1978-82 thatthe Philippines' savings performance would improve by 3% of GNP during thePlan period. Most of the increase was to be devoted to reducing dependence onforeign savings, which had reached a level higher than indefinitelysustainable after the "first oil crisis"; in particular, dependence on foreignsavings was to be reduced from 5% of GNP in 1978 to 3% of GNP in 1982. Thealready high investment ratio was also projected to increase slightly.However, as indicated in Table 6, the savings performance has actuallyfluctuated around 22.5% of GNP, about the average for middle-incomeoil-importing developing countries. While this is satisfactory performance bycomparative standards, the investment ratio remained sufficiently high thatthe absorption of foreign savings, instead of being reduced as planned,increased to 6% of GNP by 1981. The continued heavy absorption of foreignsavings is a reflection, of course, not only of the inability of the economyto increase domestic resource mobilization, but also of the deterioration inthe external terms of trade and recessionary conditions, which have made itmore difficult to reduce the trade gap.
2.03 In order to avoid an excessive increase in external debt service,it will pe necessary for the dependence on foreign savings to be reducedfairly rapidly during the 1983-87 Plan period - perhaps to about 3.5% of GNPby 1985. Given the historical stability of the savings ratio, and the recentslow growth of incomes, it would be unrealistic to expect a rapid increase inthe savings ratio. The reduction in the absorption of foreign savings wouldtherefore have to be achieved, as notionally indicated in Table 6, by somecombination of an increased level of national savings and a marginally lowerlevel of investment.

- 16 -
rable 6: INVESTMENT AND SAVINGS RATIOS(Percentage of GNP)
Middle-income PhilippinesOIDCs /a Actual Estimate Pro`jected
1979 1978 1979 1980 1981 1982 1985
Gross Domestic Investment 25 27.0 27.9 28.7 28.6 28.0 27.5
Fixed investment n.a. 23.9 24.7 25.7 26.0 25.0 24.5Public /b n.a. 5.5 6.5 7.8 8.2 7.6 7.0Private n.a. 18.4 18.2 17.9 17.8 17.4 17.5
Increase in stocks /c n.a. 3.1 3.2 3.0 2.6 3.0 3.0
Foreign Savings /d 3 4.9 5.3 5.9 6.0 5.4 3.5
Gross National Savings 22 22.1 22.5 22.8 22.6 22.6 24.0Public n.a. 3.7 5.0 5.1 4.4 4.1 5.0Private n.a. 18.3 17.5 17.9 18.2 18.5 [9.0
/a Middle-income oil-importing developing countries./b This is a broader definition than used in previous economic reports, as it
includes capital expenditures of non-infrastructure corporations anc .ocalgovernments, as well as the infrastructure program and non-infrastructurecapital outlays of the national government.
/c Historical figureS have been adjusted. International comparisons imp].ythat "increase in stocks" in the published Philippine national accounts areprobably overestimated.
/d Current account deficit in the balance of payments.
Sources: World Development Report 1981. Statistical Appendix Tables 2.11 and5.10; mission projections.
2.04 The private! sector has recently been saving about 17.5-18% of GNP,and the public sector has been saving about 4.5% of GNP. Although the !evelof public savings is not very low, this has been achieved by combining ,relatively low level of public sector resource mobilization with an inanequatelevel of government current expenditures. Increases in the savingsperformance of both the private and public sectors will be necessary du7iagthe Plan period. The Government has recently taken substantial steps,particularly interest rate deregulation, to promote private savings. Asdiscussed later in this chapter, public sector resource mobilization is anarea in which substantial additional effort will be needed during the Planperiod.
- 17 -
Level, Efficiency, and Planning of Investment
2.05 Recently, fixed investment in the Philippines has been about 25% ofGNP, with public investment at about 7% of GNP and private investment, about18% of GNP. These are broadly appropriate levels. In 1981, however, therewas a low level of private investment because of recessionary conditions, andthe Government therefore temporarily elevated the level of public investment.
2.06 As indicated in Table 6, the Philippines has an investment ratiothat is somewhat higher than other countries in its group. This should pro-vide the basis for a strong growth performance. However, statisticalindicators such as incremental capital/output ratios and loan recovery ratiosindicate that, in the past, not all resources have been invested efficiently.A detailed empirical investigation of this issue would require data on fixedinvestment by sector, and calculation of sectoral ICORs; unfortunately, thenecessary data are not available. The relative inefficiency of investment inthe manufacturing sector has been attributed to excessive protection, thefiscal incentives for investment and the credit allocation system./l Asdiscussed in Chapter 1, the Government has recently taken decisive steps toimprove efficiency in this sector. The efficiency of public investment couldbe strengthened by focussing resources on projects of the highest priority;devoting relatively more resources to completion of ongoing projects ascompared with starts on new projects; and consistent use of competitivebidding procedures and cost-effective design standards.
2.07 Because fixed investment determines the future capital stock, andthereby the production structure, of the economy, influencing the pattern ofboth private and public investment in desired directions is one of the mostimportant tasks of economic planning. However, at the present time thePhilippine statistical system does not generate data on fixed investment bysector or by region. Inadequate knowledge of the past pattern of investmentmakes it more difficult to formulate policies, programs, and projects toinfluence the future pattern of investment in desired directions. Addition-ally, in the case of the public sector, planning-programming-budgetinglinkages are relatively weak. It will be necessary for the Government toinfluence the level and pattern of investment in such a way as to promote amaximum contribution toward its development objectives, while simultaneouslyreducing reliance on foreign savings. In order to enhance its capacity forthis task, the Government intends to upgrade its statistical and planningsystem during the Plan period.
/1 Philippine Institute for Development Studies, Industrial PromotionPolicies in the Philippines (1979).
- 18 -
B. Mobilization and Allocation of Resources for Private Investment:The Role of the Financial Sector
2.08 The Government influences the mobilization and allocation ofresources for private investment in numerous ways: trade policy(para. 1.23); exchange rate policy (para. 5.23) fiscal incentives forinvestment (para 1.24) and other aspects of tax policy; price controls 3indsubsidies; the distribution of public investment among sectors and regiorLs(Chapters 3 and 4); and regulation of, and direct public sector involvementin, the financial sector. As referenced above, many of these influences arediscussed elsewhere in the report. Most private savings and privateinvestments are finanacially intermediated, and the present section discussesthe important role of the financial sector in the mobilization andallocation of resources for the private sectors. In particular, itdiscusses overall financial sector reform; preferential credit allocation bysector; and the role of Government financial institutions and creditprograms.
Overall Financial Sector Reform
2.09 The objectives of the Government's financial sector policy are topromote savings; to :Lncrease the share of financial savings in total savings;and to increase the availability of financial savings on a longer-term basis(long-term loans or equity). In keeping with these objectives, the Govern-ment implemented a comprehensive set of regulatory reforms and relatedmonetary and fiscal measures in 1980-81:
(a) Administered maximum interest rates, effectively the prevailingrates, were raised in December 1979 and again in August 1980(Table 7). Finally, in July 1981, all interest rates exceptfor lending rates of up to one year maturity were deregulatedBecause of inflation generated by the "second oil crisis", re..linterest rates were substantially negative in 1979. With thesequence of upward adjustments in administered rates followed byderegulation, positive real interest rates have now been obtalned.In order to encourage term transformation, banks are also per-mitted to nmake longer-term loans at variable interest rates(a defined margin above a variable Manila Reference Rate).
(b) Legislated specialization of financial institutions has been nub-stantially reduced. In particular, qualifying commercial ban;.s("expanded banks") may now engage in equity investment; thrift-:banks have been granted full domestic banking powers; rural banksmay engage in branch banking; and the Monetary Board has beengiven authority to move institutions into "higher", lessrestricted categories on the basis of financial resources, prc-fessional capability, and demonstrated performance.
(c) A lender-of-last-resort facility has been established by theCentral Bank.
- 19 -
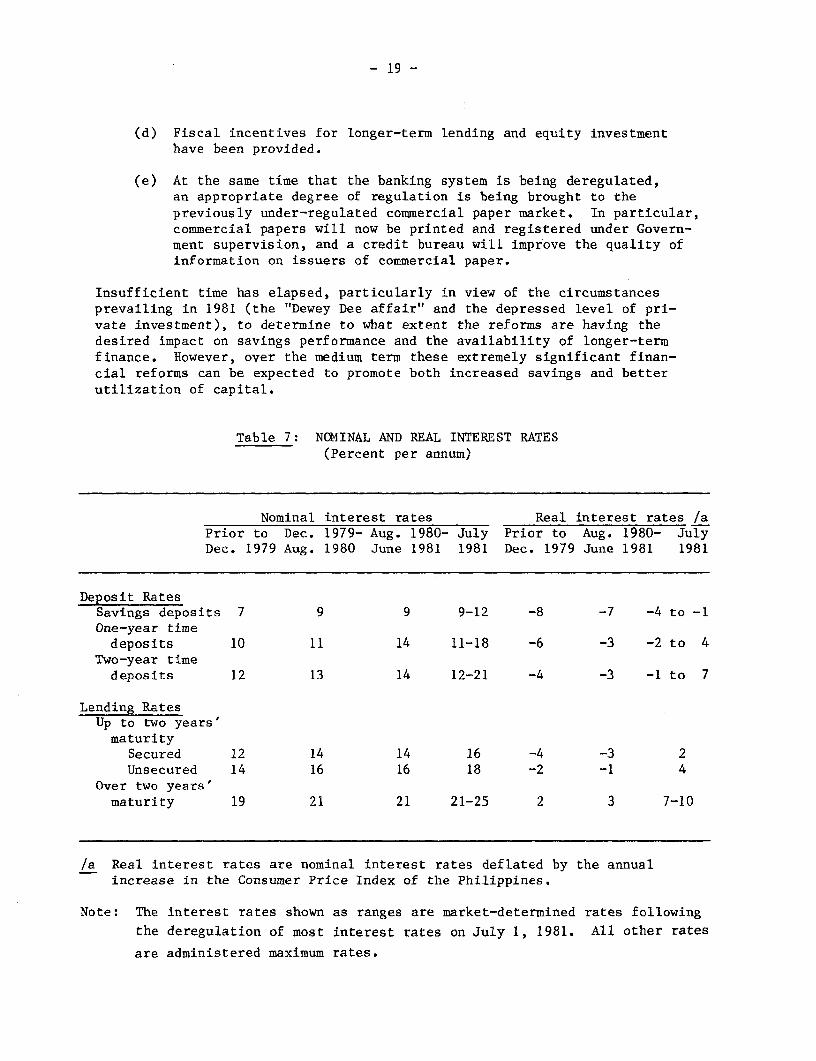
(d) Fiscal incentives for longer-term lending and equity investmenthave been provided.
(e) At the same time that the banking system is being deregulated,an appropriate degree of regulation is being brought to thepreviously under-regulated commercial paper market. In particular,commercial papers will now be printed and registered under Govern-ment supervision, and a credit bureau will improve the quality ofinformation on issuers of commercial paper.
Insufficient time has elapsed, particularly in view of the circumstancesprevailing in 1981 (the "Dewey Dee affair" and the depressed level of pri-vate investment), to determine to what extent the reforms are having thedesired impact on savings performance and the availability of longer-termfinance. However, over the medium term these extremely significant finan-cial reforms can be expected to promote both increased savings and betterutilization of capital.
Table 7: NCMINAL AND REAL INTEREST RATES(Percent per annum)
Nominal interest rates Real interest rates /aPrior to Dec. 1979- Aug. 1980- July Prior to Aug. 1980- JulyDec. 1979 Aug. 1980 June 1981 1981 Dec. 1979 June 1981 1981
Deposit RatesSavings deposits 7 9 9 9-12 -8 -7 -4 to -1One-year timedeposits 10 11 14 11-18 -6 -3 -2 to 4
Two-year timedeposits 12 13 14 12-21 -4 -3 -1 to 7
Lending RatesUp to two years'maturity
Secured 12 14 14 16 -4 -3 2Unsecured 14 16 16 18 -2 -1 4
Over two years'maturity 19 21 21 21-25 2 3 7-10
/a Real interest rates are nominal interest rates deflated by the annualincrease in the Consumer Price Index of the Philippines.
Note: The interest rates shown as ranges are market-determined rates following
the deregulation of most interest rates on July 1, 1981. All other rates
are administered maximum rates.

- 20 -
Preferential Credit Policies
2.10 Until recently, the trade, exchange rate, and fiscal incentivespolicy discriminated in favor of industry, import-substititutes, and capit:al-intensive activities. In the absence of compensating credit policies, thiisdiscrimination would have left nonfavored sectors such as agriculture,exports, and labor-intensive activities relatively starved for credit. TheGovernment has therefore established preferential credit policies aimed atpromoting the flow of credit to agriculture, exports, and small-scaleindustry. With the revised trade, exchange rate, and fiscal incentivespolicies now being introduced, the case for compensating credit allocationpolicies is being reviewed. Two of the major sectors benefitting fromcredit allocation policies are agriculture and housing.
2.11 Agricultural Credit. Following the enactment of the agrarianreform in 1972 and the rice shortages of the early 1970s, the Governmentintroduced credit programs designed to redirect small farmers from infornalto formal sources of credit, principally the rural banks and the PhilippineNational Bank (PNB). Resources for agricultural lending were generated,inter alia, by a requirement that 25% of the loanable funds of commercial.and savings banks be aset aside for agriculture; however, this requirementcould be satisfied (and in practice largely has been) by the purchase ofsecurities of government financial institutions as well as by directlending. These credit programs had a large volume of operations in themid-1970s, but then contracted as large numbers of farmers and rural banlk;swere disqualified by arrears. Another weak aspect is that these program:were not linked to resource mobilization efforts in the rural areas. SmalLfarmers have increasingly reverted to informal sources of credit.
2.12 Some increase in the role of formal financial intermediation woiuLdbe desirable, as this could both raise returns to farmers and promoteresource mobilization in the rural areas. The Government is presentlyconsidering how this nmight be accomplished while avoiding weakening offinancial discipline as occurred in the 1970s. Possibilities under consi-deration include a crop insurance system which could reduce financial risks,and an annual credit budgeting exercise. There is generally a need forrationalization of the roles of the various institutions and programs inthis area.
2.13 Housing Finance. Within the market for long-term finance, housLr,gfinance experiences particularly difficult problems. Because of theadministrative costs of mortgage lending as well as attractive alternativeainvestments, mortgage lending has been of little interest to privatefinancial institutions. Government-promoted mortgage lending, through thl!Social Security System and the Government Service Insurance System, has mintthe needs of a relatively small number of beneficiaries.

- 21 -
2.14 Recently Government policy has shifted to a more sectoralapproach. A secondary market institution, the National Home MortgageFinance Corporation (NHMFC), has been established for the purpose ofproviding liquidity by buying mortgages originated by banking institutions.NHMFC's initial funding comes from Government equity contributions and theissuance of long-term securities with privileged features. A compulsorysavings scheme, the Home Mutual Development Fund (HMDF) has also beenestablished. In principle, employees and employers in the formal sector ofthe economy, including the Government, must each contribute 3% of salary tothis fund; in practice, exemptions have been granted quite liberally./l HMDFmembers can obtain housing loans at an interest rate of 9%, representing asignificant transfer from its general membership to borrowers, who, underplausible assumptions, would be no more than 5% of the membership. Such ahighly concessional interest rate does not appear to be consistent with thethrust of the financial sector reforms. Because of Government budgetarycontributions as well as tax revenue foregone, these housing finance schemeshave substantial fiscal implications, and should be managed in a mannerconsistent with the Government's overall fiscal and financial policies./2
Government Financial Institutions and Credit Programs.
2.15 Government banks - principally the Philippine National Bank (PNB),the Development Bank of the Philippines (DBP), and the Land Bank of thePhilippines (LBP) - account for 36% of the assets of the banking system.Their behavior is therefore a significant influence on the financial systemas a whole. In the past, the artificially low interest rates charged bythese institutions generated an excess demand for credit. Because ofwidespread defaults as well as relatively low interest rates, the resourcemobilization performance of these institutions has been poor. DBP and PNBhave been insufficiently selective not only in direct lending, but also ingranting of loan guarantees. Recently, DBP and LBP have been collectingonly one-third of the debt service due to them, the loan recoveryperformance of PNB is somewhat better, but still unreasonably low. To someextent, this reflects the fact that, as Government-owned developmentinstitutions, these banks are sometimes assigned social objectives, andtherefore cannot be strictly compared with private financial institutions.
2.16 Because of their poor resource mobilization performance, theseinstitutions have become heavily dependent on government contributions andgovernment-guaranteed foreign borrowings. The Government contributions haveincluded not only budgetary transfers as equity, but also National Government
/1 Firms may be exempted if they have a superior provident scheme, have anemployee housing program, or are "distressed".
/2 World Bank report no. 3732-PH, The Philippines: Housing Finance Study.
- 22 -
cash balances which are maintained on deposit, but which are effectivelyunavailable for disbursement for budgetary purposes./l
2.17 The Governmrent has recently raised the lending rates of theseinstitutions as part of the overall rationalization of interest rates in :theeconomy, and new management has been brought to DBP. Sustained and detErminedefforts will be needed to improve the loan evaluation capability and loanrecovery performance of these institutions.
2.18 The KKK Program. In August 1981, a new program known as the KKY(Livelihood Movement) was announced. This is a special credit programdesigned to promote small, employment-generating agricultural and industrialenterprises in both rural and urban areas. Priority beneficiaries includepoverty groups such as subsistence fishermen, landless rural workers, andurban slum dwellers. The KKK program has broad objectives and has not beenspecifically identified as an anti-recessionary program; however, the need tocounter the impact of recession and deteriorating external terms of trade onrural areas and on urban employment may have been a factor in the introdactionof the program at that particular time.
2.19. The administration of the program involves local governments, theMinistry of Hluman Settlements, and government banks. Local officials,particularly municipal mayors, play a role in nominating the projects; theintention is to eventually have one KKK project in each of the Philippines'approximately 1,400 municipalities. Lending decisions are made by theMinistry of Human Settlements. The funds are channeled through the threeŽmajor government banks (DBP, PNB, and LBP), but the credit risk is born )y theKKK Fund, to which an initial one billion pesos has been transferred fro:i thebudget, rather than b-y the banks. The terms are concessional, with some fundsprovided at no interest and others at 12% interest.
2.20. It will be important for the KKK program to be administered in sucha way as to be consistent with the Government's overall financial sectordevelopment objectives. There are already in existence several longstandingGovernment credit programs for small enterprises. The KKK program willsucceed in its objective of creating incremental employment to the extent: thatit brings about an increase in small enterprise credit supply, rather thi:.nsimply a redirection of small enterprise credit demand. This can beaccomplished by carefu-lly ensuring that these concessional funds are res:rvedfor poverty groups who would not be creditworthy for the existing smallenterprise credit progrrams, and that nonpoor entrepreneurs are directed :.o themore conventional credit programs charging more market-oriented interestrates.
/1 Statistical Appendix Table 5.5.

- 23 -
C. Public Sector Resource Mobilization /1
2.21 Public sector resource mobilization is a major development issuefor the Philippines. Because of a relatively low level of public sectorresource mobilization, government current expenditures are too low, projectimplementation has been deteriorating, and the public sector deficit, whichtraditionally has been relatively low, became quite high in 1981 at morethan 5% of GNP (Table 8). This primarily reflects recessionary conditionswhich would have been intensified by a lower level of public spending.However, during the 1983-87 Plan period, it will be necessary to reduce thepublic sector deficit in relative terms, as part of the overall effort toreduce the current account deficit in the balance of payments in relativeterms. A reasonable target would be to increase total public sector resourcemobilization to 17.5% of GNP by 1985. The greater part of this increase wouldhave to come from tax revenues. However, the greatest proportionate increaseover current levels should be in the area of government corporation resourcemobilization. As discussed earlier, efforts should also be made to improveloan recovery by government financial institutions.
Tax Revenues
2.22 In the Development Plan for 1978-82, a well conceived strategy forraising revenues was described: broadening the tax base; rationalizing fiscalincentives; restructuring the tax system to promote elasticity; and morevigorous tax administration. There has in fact been considerable taxlegislation during the Plan period./2 As summarized in Table 9, the major taxactions contemplated by the Development Plan have either been enacted or arelikely to be soon. It was expected that this strategy would increase nationalgovernment and local government tax revenues (excluding social securitycontributions) from an average of 12.5% of GNP in 1975-76 to an average of14.6% of GNP during 1978-82. Achievement of this target would have broughtthe Philippine tax performance to a broadly appropriate level. A statistical-ly average developing country with the Philippines' economic characteristicscollects about 14% of GNP in taxes, excluding social security contributions./3
/1 The allocation of public sector resources is discussed in Chapter 3.
/2 A listing of tax measures adopted in 1980 and 1981 is contained inStatistical Appendix Table 5.2. A listing of tax measures adoptedin 1978 and 1979 is contained in the previous economic report,World Bank report No. 2674-PH, Statistical Appendix Table 5.4.
/3 "International Comparisons of Taxation for Selected Developing Countries,"IM4F Staff Papers (March 1979). Consideration of nontax revenues wouldnot change the analysis, as central government nontax revenues are 2%of GNP in the average developing country, versus 1.3% of GNP in thePhilippines.
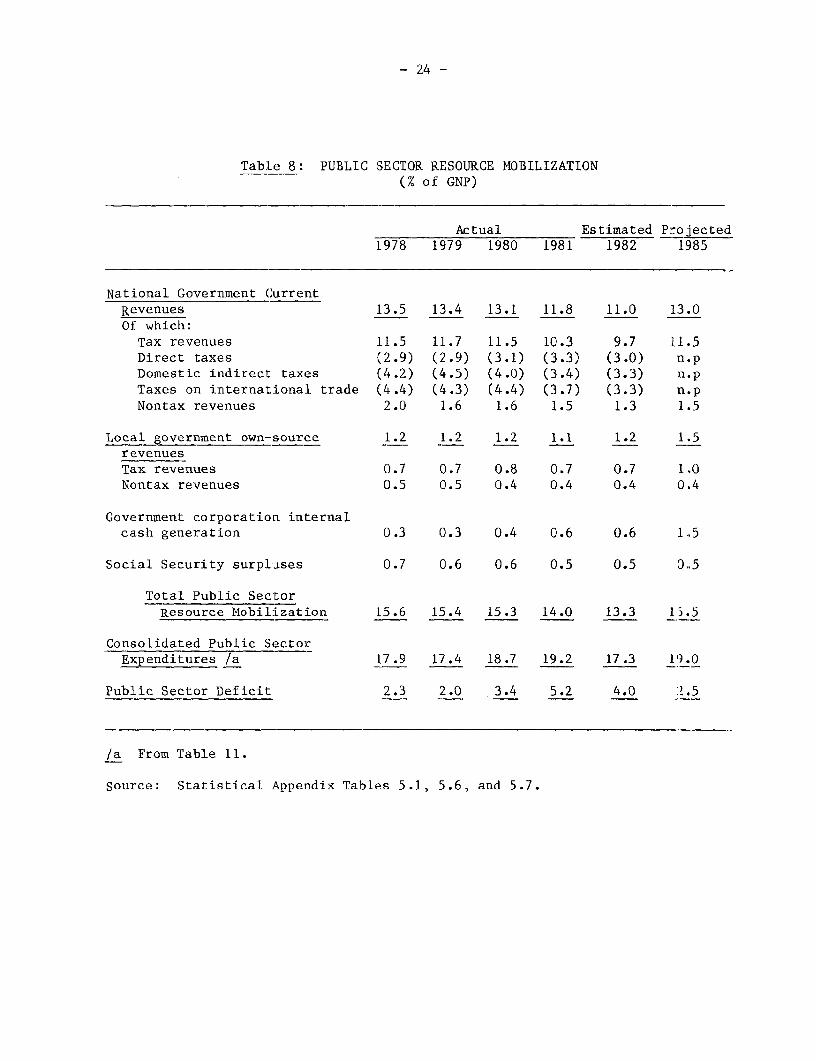
- 24 -
Table 8: PUBLIC SECTOR RESOURCE MOBILIZATION(% of GNP)
Actual Estimated Pr-ojected1978 1979 1980 1981 1982 1985
National Government CurrentRevenues 13.5 13.4 13.1 11.8 11.0 13.0Of which:Tax revenues 11.5 11.7 11.5 10.3 9.7 11.5Direct taxes (2.9) (2.9) (3.1) (3.3) (3.0) n.pDomestic indirect taxes (4.2) (4.5) (4.0) (3.4) (3.3) n.pTaxes on international trade (4.4) (4.3) (4.4) (3.7) (3.3) n.pNontax revenues 2.0 1.6 1.6 1.5 1.3 1.5
Local government own-source 1.2 1.2 1.2 1.1 1.2 1.5revenuesTax revenues 0.7 0.7 0.8 0.7 0.7 1.0Nontax revenues 0.5 0.5 0.4 0.4 0.4 0.4
Government corporation internalcash generation 0.3 0.3 0.4 0.6 0.6 1.5
Social Security surpluses 0.7 0.6 0.6 0.5 0.5 0.5
Total Public SectorResource Mobilization 15.6 15.4 15.3 14.0 13.3 13.5
Consolidated Public SectorExpenditures /a 17.9 17.4 18.7 19.2 17.3 1'.0
Public Sector Deficit 2.3 2.0 3.4 5.2 4.0 7 .5
/a From Table 11.
Source: Statistical Appendix Tables 5.1, 5.6, and 5.7.
- 25 -
2.23 However, the tax ratio was only 12.3% in 1978-80 and then fell backto 11.0% in 1981 under the impact of recessionary conditions./l Thus, taxcollections are presently about 3.5% of GNP below the Development Plan target,and more than 1% of GNP below the level of 1975-76. The shortfall from Planprojections has been primarily in the area of domestic taxation, althoughtaxes on international trade also slipped sharply in 1981. The downwarddeviation from Plan projections appears to reflect the following factors:
(a) The Plan projections implicitly assumed that the elasticityof the 1976 tax system (the inherent responsiveness of nominaltax revenues to increases in nominal GNP) was about 1.2, whereasactually this elasticity was probably about 0.9. The need fornew tax measures was therefore underestimated.
(b) Some of the contemplated Plan tax reform measures which areimportant for elasticity are either taking effect fairly latein the Plan period (reform of personal income tax and of fiscalincentives for corporate income tax) or otherwise have not beenenacted (shifting excise taxes to an ad valorem basis).
(c) Given the considerable tax legislation, the revenue performanceimplies that tax administration has not improved very much.
2.24 A substantial improvement in the Philippines' tax performance willbe needed if there is to be a reasonable chance of achieving the objectives ofthe 1983-87 Development Plan. A reasonable target would be to raise the taxratio to 12.5-13% of GNP by 1985. This would represent a substantial effort,as tax revenues would absorb about 30% of the growth of national income, andwould require both new tax measures and more effective tax administration.The Government is presently preparing a reform of the fiscal incentivessystem, and a reform of the indirect tax system with the objective of reducingits protective effect. While these reforms are being designed substantiallywith efficiency considerations in mind, in view of the revenue situation theyshould also be designed to raise revenues, or else any reductions in revenueshould be offset by other tax measures.
/1 In addition to the recessionary conditions, there were three measuresresulting in reduced revenues in 1981: (a) increased exemptions (whichhad been eroded by inflation) for personal income tax; (b) fiscalincentives for longer-term lending, and (c) the tariff reform. Thesemeasures were estimated to reduce revenues by 0.3% of GNP.
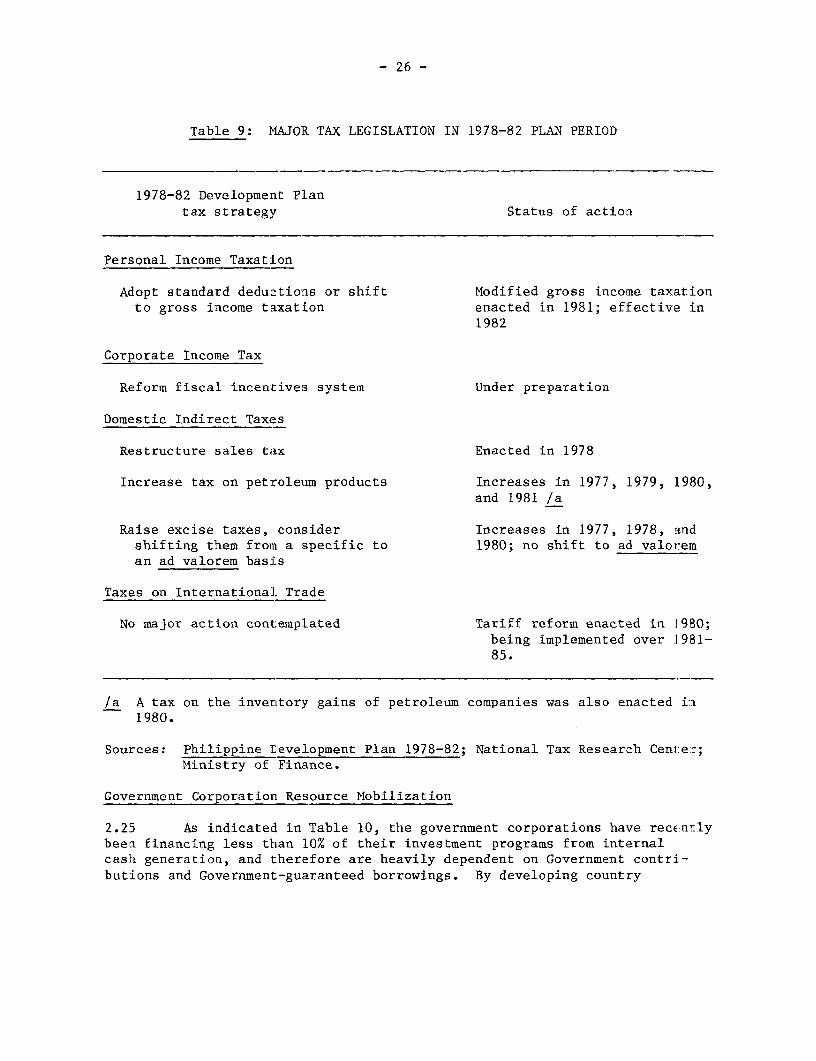
- 26 -
Table 9: MAJOR TAX LEGISLATION IN 1978-82 PLAN PERIOD
1978-82 Development Plantax strategy Status of action
Personal Income Taxation
Adopt standard deductions or shift Modified gross income taxationto gross income taxation enacted in 1981; effective in
1982
Corporate Income Tax
Reform fiscal incentives system Under preparation
Domestic Indirect Taxes
Restructure sales tax Enacted in 1978
Increase tax on petroleum products Increases in 1977, 1979, 1980,and 1981 /a
Raise excise taxes, consider Increases in 1977, 1978, andshifting them from a specific to 1980; no shift to ad valoreman ad valorem basi's
Taxes on Internationa]. Trade
No major action cont:emplated Tariff reform enacted in 1930;being implemented over 1981-85.
/a A tax on the inventory gains of petroleum companies was also enacted in1980.
Sources: Philippine Development Plan 1978-82; National Tax Research Cent:er;Ministry of Finance.
Government Corporation Resource Mobilization
2.25 As indicated in Table 10, the government corporations have recenl:lybeen financing less than 10% of their investment programs from internalcash generation, and therefore are heavily dependent on Government contri-butions and Government-guaranteed borrowings. By developing country
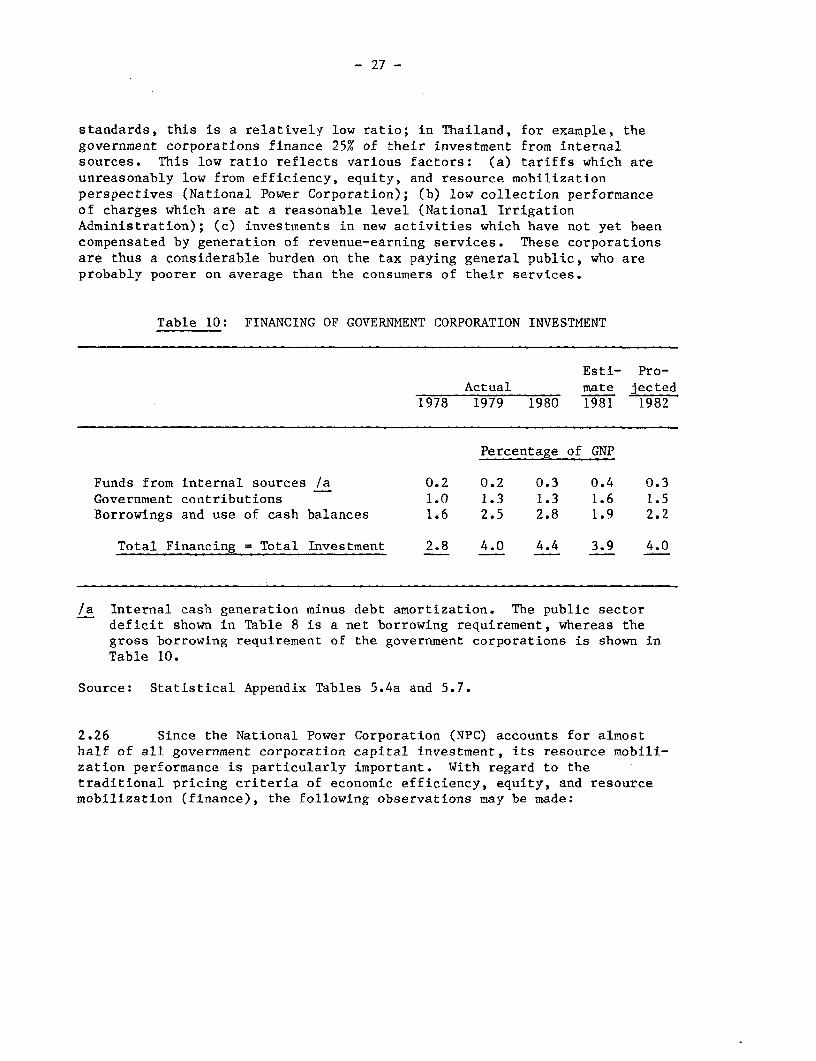
- 27 -
standards, this is a relatively low ratio; in Thailand, for example, thegovernment corporations finance 25% of their investment from internalsources. This low ratio reflects various factors: (a) tariffs which areunreasonably low from efficiency, equity, and resource mobilizationperspectives (National Power Corporation); (b) low collection performanceof charges which are at a reasonable level (National IrrigationAdministration); (c) investments in new activities which have not yet beencompensated by generation of revenue-earning services. These corporationsare thus a considerable burden on the tax paying general public, who areprobably poorer on average than the consumers of their services.
Table 10: FINANCING OF GOVERNMENT CORPORATION INVESTMENT
Esti- Pro-Actual mate jected
1978 1979 1980 1981 1982
Percentage of GNP
Funds from internal sources /a 0.2 0.2 0.3 0.4 0.3Government contributions 1.0 1.3 1.3 1.6 1.5Borrowings and use of cash balances 1.6 2.5 2.8 1.9 2.2
Total Financing = Total Investment 2.8 4.0 4.4 3.9 4.0
/a Internal cash generation minus debt amortization. The public sectordeficit shown in Table 8 is a net borrowing requirement, whereas thegross borrowing requirement of the government corporations is shown inTable 10.
Source: Statistical Appendix Tables 5.4a and 5.7.
2.26 Since the National Power Corporation (NPC) accounts for almosthalf of all government corporation capital investment, its resource mobili-zation performance is particularly important. With regard to thetraditional pricing criteria of economic efficiency, equity, and resourcemobilization (finance), the following observations may be made:
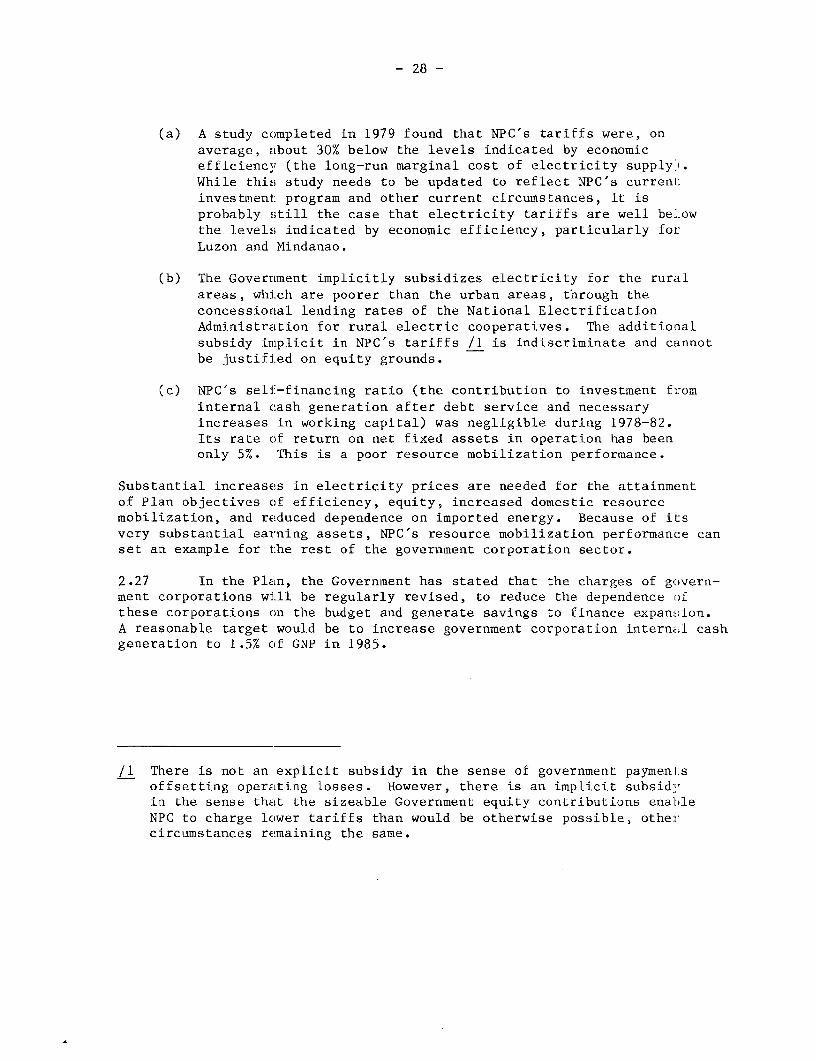
- 28 -
(a) A study completed in 1979 found that NPC's tariffs were, onaverage, about 30% below the levels indicated by economicefficiency (the long-run marginal cost of electricity supplyl.While this study needs to be updated to reflect NPC's currenltinvestment program and other current circumstances, it isprobably still the case that electricity tariffs are well beLowthe levels indicated by economic efficiency, particularly forLuzon and Mindanao.
(b) The Government implicitly subsidizes electricity for the ruralareas, which are poorer than the urban areas, through theconcessiornal lending rates of the National ElectrificationAdministration for rural electric cooperatives. The additionalsubsidy implicit in NPC's tariffs /1 is indiscriminate and ciannotbe justified on equity grounds.
(c) NPC's self--financing ratio (the contribution to investment frominternal cash generation after debt service and necessaryincreases in working capital) was negligible during 1978-82.Its rate of return on net fixed assets in operation has beenonly 5%. This is a poor resource mobilization performance.
Substantial increases in electricity prices are needed for the attainmentof Plan objectives of efficiency, equity, increased domestic resourcemobilization, and reeduced dependence on imported energy. Because of itsvery substantial earning assets, NPC's resource mobilization performance canset an example for the rest of the government corporation sector.
2.27 In the Plan, the Government has stated that the charges of govern-ment corporations will be regularly revised, to reduce the dependence )fthese corporations on the budget and generate savings to finance expan ion.A reasonable target would be to increase government corporation internLl cashgeneration to 1.5% of GNP in 1985.
/1 There is not an explicit subsidy in the sense of government paymenl:soffsetting operating losses. However, there is an implicit subsid'in the sense that the sizeable Government equity contributions enabileNPC to charge lower tariffs than would be otherwise possible, othercircumstances remaining the same.

- 29 -
3. THE PUBLIC EXPENDITURE PROGRAM
3.01 The public expenditure program is one of the most importantinstruments available to the Government for promoting development. It wasprojected in the Development Plan for 1978-82 that the ratio of consolidatednational and local government expenditures to GNP would average 21.5% duringthe Plan period./l However, because resource mobilization performance hasbeen less than projected in the Plan, this ratio has actually been onlyabout 16.5% of GNP, leading to a relatively low level of current expendi-tures and a deceleration, in the face of a much larger number of projects,in the pace of implementation of individual projects. During the next Planperiod 1983-87, it would therefore be appropriate to emphasize not onlyincreased public sector resource mobilization, as discussed in the previouschapter, but also close attention to the allocation of public expenditures,both substantively and procedurally, as discussed in the present chapter.
A. Level and Structure of Public Expenditures
By Type of Public Sector Unit
3.02 As indicated in Table 11, consolidated public expenditures(including government corporation capital expenditures) have recentlyincreased to about 18-19% of GNP. Net national government expenditures havefluctuated in the range of 12-13% of GNP, and local government expenditureshave remained stable at somewhat less than 2% of GNP. The recent growth ofpublic expenditures has therefore been entirely due to the increase in theinvestment programs of the government corporations from less than 3% of GNPin 1978 to 4% of GNP in 1981-82.
3.03 The primary factor underlying the growing role of governmentcorporations has been shifts in the sectoral distribution of the infra-structure program towards those sectors dominated by revenue-earningentities, particularly the energy sector. Secondary factors include thegrowth of a public sector role in non-infrastructure activities, such asindustrial projects, real estate development, and agricultural marketing,which traditionally have been areas of primary private sector responsibility;and the disparities in the treatment of the National Government ministriesand government corporations. The work programs and budgets of the NationalGovernment ministries are subjected to detailed control, but the BudgetMinistry and NEDA lack reliable information on the operations and financesof a significant number of the government corporations receiving budgetary
/1 The Development Plan did not contain quantitative projections for govern-ment corporations.
- 30 -
Table 11: STRUCTURE OF PUBLIC EXPENDITURES(percentage of GNP)
Actual Estimate Projected1978 1979 1980 1981 1982 1985
Gross national govt. expenditures 14.7 13.6 14.4 15.7 13.8 14.5Less: equity contributions to
government corporations 1.0 1.3 1.3 1.6 1.5 1.0Less: transfers to local government 0.5 0.5 0.6 0.5 0.6 0.5Net national govt. expenditures /a 13.3 11.7 12.5 13.6 11.6 13.0
Local government expenditures 1.8 1.7 1.7 1.7 1.6 1.6
Government corporation capitalexpenditures 2.8 4.0 4.4 3.9 4.0 4.5
Consolidated Public Expenditures 17.9 17.4 18.7 19.2 17.3 19.0Of which: Current expenditures lb 11.9 10.4 10.2 9.6 9.0 11.5Of which: Public fixed investment/c 5.5 6.5 7.8 8.2 7.6 7.0Of which: Financial investment /d 0.5 0.6 0.7 1.4 0.7 0.5
/a Expenditures of the national government net of contributions and trans-fers to nonfinancial government corporations and local governments.
/b National government and local government current expenditures./c National governmeat capital expenditures on its own account, capital
expenditures of government corporations, and capital expenditures oflocal governments.
/d Budgetary contributions to financial institutions and to NationalDevelopment Company, and net lending. For the reason indicated inpara. 2.15, financial investment is understated.
Source: Mission estimates based on data provided by Ministry of Budget,Ministry of ]inance, and government corporations. See Statistil:alAppendix TabLe 5.9. The consolidation methodology recommended ,y IMF,A Manual of Government Finance Statistics has been employed here.
contributions, including some of the largest ones. Compensation forprofessional and management level staff in the National Government minis~triesis about one-third below comparable private sector levels, whereas thegovernment corporations are permitted to match private sector compensat.>on.While it is entirely appropriate that government corporations should enjoymore operational and financial autonomy than ministries, as provided intheir charters, the width of these disparities has been one factor encolLrag-ing the number of government corporations to increase to more than onehundred.
- 31 -
3.04 The share of GNP absorbed by expenditures of the local governmentsector, on the other hand, has not increased at all, and there was noincrease in real local government spending per capita during the 1970s.This is because the local governments have not taken full advantage of thetaxing and borrowing powers legally available to them; and the resources ofthe national government available for transfer to other public sector unitshave been increasingly pre-empted by the government corporations andgovernment financial institutions, thereby reducing the availability ofnational government resources for the local government sector. In view ofthe backlog of unmet needs for construction and maintenance of small-scaleurban and rural infrastructure of the type that can most effectively beprovided by local governments, an expansion in the share of GNP devoted tolocal government expenditures in the 1983-87 Plan period would be desirable.The Provincial Development Assistance Program and the City DevelopmentAssistance Program have demonstrated the value of linked efforts to improvelocal government implementation capacity and resource mobilization.
By Current and Capital
3.05 A striking trend revealed by Table 11 is the shift in the distri-bution of public expenditures between current expenditures and publicinvestment. National government and local government current expenditureshave decreased from 13% of GNP in 1976 to 10% of GNP in 1980 and anestimated 9% of GNP in 1982. This compares with an average of 14% of GNPamong middle-income oil-importing developing countries./l To some extent,the reduction in current expenditures reflects efforts to bring abouteconomy in Government operations. However, the reduction in currentexpenditures has also resulted in inadequate maintenance of roads andirrigation systems; insufficient operating supplies in the health andeducation sectors; and civil service compensation levels which generateproblems in retaining sufficient numbers of capable professional andmanagerial staff./2
3.06 Public fixed investment, on the other hand, has increased from5.5% of GNP in 1978 to 8% of GNP in 1980-82. This principally reflects theexpansion of project preparation and implementation capacity in such areasas energy, irrigation, transportation, water supply, and industrialprojects; and in 1981 there was also a deliberate effort to offset the slumpin private investment. There has also been an expansion of Governmentfinancial investment; this reflects the need to support the liquidity ofgovernment financial institutions in the face of poor loan recovery, theIndustrial Rescue Fund, and the KKK program.
/1 World Development Report 1981, p. 142.
/2 Some major maintenance works are classified under capital expenditures,and therefore the statistics on current expenditures may understatethe expenditure on maintenance.
- 32 -
Prospects for 1985
3.07 The primary need to raise government current expenditures to a moreadequate level - perhaps to about 11.5% of GNP. In non-recessionaryconditions, public fixed investment could reasonably be about 7% of GNP.Reasonable success in improvement of loan recovery should make it possibleto cut Government financial investment back to no more than 0.5% of GNP.Then in 1985 consolidated public expenditures might be about 19% of GNP -not much more than at present, but with a more appropriate balance betweencurrent and investment expenditures.
B. Priorities Among and Within Sectors
3.08 The sectoral distribution of public expenditures is shown inTable 12. At the present time, the largest sectors are energy 3.0% of GNP;transportation, 2.5% of GNP, education, 2.0% of GNP, and agriculture, 1.5% ofGNP. The sectors which have displayed the most rapid growth during the1978-82 Plan period are energy, industry (because of the MIP program) andhousing. The sectoral distribution prevailing at the present time appears tobe broadly appropriate. Any further shift in favor of energy, industry, orhousing, would unreasonably compress agriculture, non-energy infrastructure,education and health.
Agriculture
3.09 Public expenditures on irrigation, which benefit about one-fourth ofthe farming population, absorb about 0.7% of GNP, while other agriculturalexpenditures (some of which benefit irrigated as well as rainfed farmer.;)absorb about 0.8% of GNP. The National Irrigation Administration has drafteda corporate plan which envisages the development of 800,000 ha of newirrigation and rehabilitation of a further 200,000 ha over the coming d,cade.These figures include 350,000 ha on which implementation has already be{ua.Most of this area would be in Central Luzon, which is already a fairlywell-developed agricultural region. Because rice self-sufficiency can 1.ema4ntained with a smaller irrigation investment program than envisaged l.y NIA,and also because of the implementation problems NIA has been experiencirg,NIA's program should be revised downward. Furthermore, relatively moreexpenditures should be devoted to maintenance of irrigation systems whichpresently absorbs only 2% of NIA's budget. Restraining the irrigation programcould also make available more resources available for other agriculturalactivities such as adaptive research, extension, land titling, land settlementupgrading, and forestry.
Industry, Trade, Labor and Tourism
3.12 Most of the expenditures in these sectors are for promotional,regulatory, and extension functions. The principal issue relates to theprogram of eleven major industrial projects (para. 1.25). As presently

- 33 -
Table 12: PUBLIC EXPENDITURES BY SECTOR /a(percentage of GNP)
Actual Estimate Projected1978 1979 1980 1981 1982
Economic Services 7.7 8.3 8.8 8.9 9.0Agriculture, fishery and forestry 2.2 1.6 1.3 1.5 1.5
(Of which: irrigation) (1.5) (0.9) (0.8) (0.6) (0.6)Industry, trade, labor and tourism 0.3 0.4 0.5 0.6 0.7(Of which: industrial projects) /b - - (0.2) (0.3) (0.3)
Energy 2.1 2.7 3.1 3.0 2.8Water supply 0.3 0.6 0.8 0.6 0.7Transportation 2.0 1.8 2.3 2.4 2.5Telecommunications 0.2 0.1 0.1 0.1 0.1Other infrastructure 0.5 1.0 0.7 0.7 0.7
Social Services 3.0 3.1 2.8 3.4 3.6Education 1.8 1.6 1.6 2.1 2.0Housing and community development 0.3 0.6 0.5 0.5 0.6
Health 0.6 0.5 0.5 0.7 0.7Other social services 0.3 0.3 0.3 0.3 0.3
Defense 2.5 2.2 1.8 1.5 2.1General public administration 1.5 1.6 1.9 1.2 1.4
Total 14.7 15.1 15.3 15.0 16.1
/a Includes expenditures of national government on its own account pluscapital expenditures of wholly-owned government corporations. Excludesdebt service and financial investment. Excludes expenditures of localgovernment (1.7% of GNP) due to unavailability of comparable sectoraldetail. National government expenditures are on an obligations basis(release of obligational authority from Budget Ministry to agencies) becausedata on national government expenditures by sector on a cash basis are notavailable.
/b Government equity contributions channeled through the National DevelopmentCompany to these joint public/private projects; does not show total projectcosts.
Source: Statistical Appendix Table 5.11.
- 34 -
contemplated, these projects would annually absorb $100 million, or 820million pesos, from the budget in the form of equity contributions. 1Th:Lswould not be an excessive amount provided that the projects are well-justified.
Energy
3.11 Following the sharp oil price increases during the 1970s, theGovernment has pursued a policy of developing domestic energy resources toreplace oil imports. As such, it has recently been allocating 2-3% of GNP,and about one-third of public investment, to energy development. This hasreduced country's dependence on foreign oil from 95% in 1973 to about 80% in1981. During 1978-81, nearly two-thirds of the energy-related expenditureswere absorbed by large-scale power generation and transmission administeredby the National Power Corporation, 15% by petroleum and coal development, 8%by small-scale elect:rification administetered by the National ElectrificationAdministration, and 13% by administration, regulation, and research. Withinthe power sector, the largest shares were claimed by transmission and thenuclear plant, and t:he rest by geothermal, hydroelectric, and coal-firedplants.
3.12 The Government's current plans are contained in The NationalEnergy Program, 1981-86, which proposes an outlay of 43 billion pesosin 1981 prices./l The program would claim about 2.5% of GDP and about one-third of public fixed investment. As in the past, the largest share ((3%)of the program would. go to the power sector including power generation,transmission, and electrification. Energy resource development (oil aridgas, geothermal, steam, coal, uranium, and nonconventional energy sources)would claim 27% of the investment. The remaining 10% of investment isearmarked for providing downstream facilities for coal transportation,alcohol production, coco-diesel program, and oil storage and delivery.The major targets of the program are to increase the coal output from0.4 million tons in 1981 to 3.7 million tons in 1986 and to increase poergeneration capacity from 4,800 MW to 7,700 MW. Simultaneously, oil-bas3dpower generation, which was 44% in 1980, would be almost phased out by 1986by switching to geot'hermal steam, coal, and hydroelectric sources. Theprogram is ambitious and comprehensive, covering various subsectors andupstream and downstream facilities. The various energy programs would placea considerable burden on public resources, given competing demands on tayrevenues. These programs should be supportable provided that there issubstantially increased resource mobilization from within the energy seStor(para. 2.26). Some of the targets, especially that of coal, are quiteambitious, and NPC's implementation capacity (systems planning, enginee:ingand construction) would probably need to be substantially strengthened.
/1 NPC has recently prepared an adjusted power program thereby increasL.ngthe cost of the program by about 4 billion pesos.
- 35 -
3.13 A rural electrification program is being implemented by NationalElectrification Administration (NEA) through electric cooperatives. Thisprogram includes electricity distribution and selective power generationand transmission. Although the expenditures are incurred by, or onbehalf of, the cooperatives, NEA initially requires Government equitycontribution for peso costs to be on-lent to the cooperatives who repaythe loans over 20-30 year periods. NEA's current plans would requirean equity contribution of about 4 billion pesos during 1982-86. Whetherin fact this amount is spent would depend upon demand growth, economicand technical feasibility of various projects, and implementation capacityof NEA cooperatives. Nevertheless, NEA's program would constitute asignificant claim on the budgetary resources.
Transportation
3.14 Public spending on transportation has traditionally beensubstantial because of the archipelagic and mountainous character ofthe country; it has increased from 2% of GNP in 1978 to 2.4% of GNP in1981. In the past, transportation investment planning has been relativelyweak, particularly in the area of inter-modal coordination, because ofuncoordinated institutional responsibilities. However, in 1979 a Ministryof Transportation and Communication (MOTC) was established, and an inter-ministerial Committee on Transport Policy was subsequently created toprovide coordination for those aspects of the transportation sectoradministered outside MOTC (notably highways construction and maintenancewhich remains the responsibility of the Ministry of Public Works andHighways). However, MOTC-s technical staffing will need upgrading if itis to perform the expected role. A National Transportation PlanningProject, scheduled for completion in 1982, is expected to recommenda transportation investment program for the 1983-87 Plan period.
3.15 With the sizeable investments of the past decade a reasonablycomplete network of national highways has been established. As indicatedin the Plan, the Government therefore intends to devote relatively moreresources to maintenance of the highway network, and to secondary andtertiary roads, which will require strengthening of the institutional andfinancial capacity of local governments. The operations and finances of thePhilippine National Railways have deteriorated over the past decade becauseof inadequate maintenance and competition from improved highways. The mainline from Manila southeast to Legaspi is being rehabilitated; after thecompletion of this project, no further major investments should be under-taken until operations have improved. Most of the major ports have beenupgraded by the Philippine Ports Authority over the past decade; duringthe 1983-87 Plan period relatively more resources will be devoted to theminor ports which are important for the economic development of manyisolated localities. Substantial investments in aviation have been recentlycompleted with the opening of the new Manila International Airport terminaland the expansion of Philippine Air Lines- fleet.
- 36 -
Water Supply and Sewerage
3.16 There are three agencies which are principally responsible fordevelopment of this sector: the Metropolitan Water and Sewerage System (MWSS)which provides service to Manila, the Local Water Utilities Administration(LWUA) which is a specialized agency for lending to Water Districts inmedium-sized cities; and the Rural Waterworks Development Corporation (RWDC)which similarly provides financial and technical assistance to Rural Water-works Associations. Public expenditures on water supply expanded substan--tially during the 1973-82 Plan period, from 0.3% of GNP in 1978 to 0.7% ofGNP in recent years. Given the implementation capacity of the agenciesconcerned, it would probably be inappropriate to aim at a higher level ofexpenditure in this sector. Most of the presently planned increases inexpenditures from 1981-85 are intended to finance water supply and sewerage inMetro Manila. Manila is projected to account for 50% of such outlays; citiesand towns with over 20,000 residents are earmarked 35%, and other areas 15%.Within urban areas, however, a substantial proportion is earmarked forlower-income communitjies. A necessary complement to increased water supplywill be drainage and sewerage facilities. A major sewerage and sanitationproject is underway in Manila.
Education and TrainingL
3.17 Although the Philippines enjoys the reputation of having one of themost literate populations in the world, there are recent indications thateducational achievements are substantially lower than official statisticsindicate, as a result of unadjusted enrollment ratios and understated dr:p3utrates. Public expenditures in the education sector (which have beenaveraging about 1.8% of GNP from 1978-82) have been declining as a share oftotal public expenditures since the 1960s. Recurrent expenditures are nowwithin the lower range for Asia, and allocations by category for recurrenitexpenditures are poorly balanced, with 98% allocated for salaries andadministration, and only 2% for instructional materials, teacher upgrading,and maintenance of facilities. Because it will be difficult to accommodatesignificant increases in real recurrent expenditures per student in thebudget, the Government is seeking to make substantial improvements in itscost effectiveness. It has recently revised policies and guidelines for theallocation and use of resources by type of expenditure and by region toaddress some of the inequities and inefficiencies in the system. ParticuLarattention is being paid to increasing spending in some regions (such asBicol, Eastern Visayas, and Northern and Central Mindanao) where educatioialperformance has traditionally been lower. At the same time, improvements inplanning and implementation capability within the Ministry of Education a--etaking place to provide the institutional and financial basis necessary forthe provision of textbooks, teacher retraining and other essential aspect!;of improving the qualit:y of elementary education.
3.18 The Government has stated that the focus of its educational policiesis to produce students that can be gainfully employed. It has alsorecognized that the lack of adequately skilled manpower may soon become a
- 37 -
major bottleneck to industrial development in several manufacturing sectorswhich are expected to play crucial roles in the Government's efforts torestruture the economy and accelerate industrialization. Vocational andtechnical education is therefore expected to play a significant role in thesector in the future. The Government intends to build up the capacity ofthe National Manpower and Youth Council to take leadership of the sector incoordination with the Ministry of Education and the private sector.
Housing
3.19 Most of the Government's support to housing from 1975-78 was in theform of equity contributions to the National Housing Authority (NHA), whichprovides housing to low-income households. NHA's orientation since itscreation in 1975 has been primarily on low-income housing, including theconstruction of new units, upgrading of slum and marginal settlements, sitesand services projects, land assembly, and titling. Since 1978, asignificantly larger proportion of public expenditures for housing has beendirected to the Ministry of Human Settlements (MHS),/1 which was created inthat year to be responsible for all governmental functions relating tohousing, and its auxiliary corporations. At the time of its creation in 1978,MHS's development program was centered on a program entitled Bagong LipunanSites and Services (BLISS), which was directed to housing and communitydevelopment throughout the country, although most of its investment took placein Metro Manila. The BLISS housing program, on the whole, has provided homeswhich serve middle to upper income households at highly subsidized prices.
3.20 The breakdown of government housing expenditures for 1981 includesequity contributions of P 310 million for NHA, P 500 million for outlaysof the Ministry of Human Settlements, and P 125 million for equity inother housing-related government corporations. It will be important forGovernment to look carefully at the housing policies of these relatedinstitutions, and at the total financial and economic resources (both publicand private) available for shelter. Government also needs to determine theresource framework within which the various agencies may reasonably plan,budget, and operate so that resources are utilized in a more efficient andcoordinated manner supportive of development goals. It will also beimportant to incorporate the concept of cost- recovery and financialviability into the housing program. If these steps are taken, expendituressame time providing assistance for a larger number of households.
Health
3.21 The health problems of the Philippines are broadly typical of thoseof developing countries generally: water-borne diseases related to inadequatewater supply and sanitation, and a significant incidence of infant mortality
/i In October 1981 the Government announced its intention to merge NHAinto the Human Settlements Development Corporation.
- 38 -
(63 per 1000 live births) and child undermultrition (19%) related, in part,to situations of low income and high fertility. The Government is atteimiptingto alleviate these problems not only through increased provision of watersupply, but also through extension of health care services, particularlt' torural areas through Rural Health Units and Barangay Health Stations. Publicspending on health (including population and nutrition) presently absorbsabout 0.7% of GNP. Greater efficiency in sector expenditures could beachieved by consolidating the field services for health, family planning, andnutrition. There is a need for increased staffing in the rural healthservices, and for increased provision of supplies such as pharmaceutica:Lsand vaccines.
C. Planning and Execution of Public Expenditures
3.22 Many aspects of the Government's system for planning and executionof public expenditure!s were initially designed to meet the needs of an earlierperiod, in which capital expenditures accounted for only about 10% of thenational government budget, and the role of government corporations was quitesmall. During the 19,70s, the share of capital expenditures in the nationalgovernment budget increased to about 30%, and the role of government corpora-tions expanded greatly. These developments, and the combination of greatlyexpanded project preparation capacity and stable revenue performance, haveplaced some strain on the Government's programming and budgeting system.
3.23 Because of the lack of a well-functioning medium-term framework,there has been a tendency for implementing ministries and corporationsindividually to prepare programs which collectively are well in excessof financial resource availability. For example, for the 1982 budget thaimplementing agencies submitted programs of current operations andcapital projects costing 101 billion pesos, whereas the financial resour-eavailability was only 60 billion pesos. Under these circumstances, serio)uswork programming tends to take place following preparation of the annualbudget, rather than serving as an input to annual budget preparation. Becauseof insufficient budget allocations, project implementation becomes stretizhedout over longer periods of time than would be indicated by consideration; ofeconomic efficiency. To some extent, this reflects considerations ofdevelopment management other than economic efficiency alone, such as theneed for a distribution of ongoing projects among agencies and regions.
3.24 The Government has recognized the need for strengthening of it:system, and appropriate concepts have been set out in the Budget ReformDecree (P.D. No. 1177):
(a) strengthening of planning-programming-budgeting linkages;
(b) shifting some of the weight of resource allocation decision-tali.ing,in view of the increased share of lumpy multi-year capitalprojects in the expenditure program, from an annual basis to amedium-term basis ("long-term budgeting"); and
- 39 -
(c) integrating the government corporations more effectivelyinto the public sector investment program and financialstrategy ("total resource budgeting").
In order to implement these concepts, the Government intends to adopt amedium-term financial planning system, covering the government corporationsas well as the National Government proper, during the 1983-87 Plan period.
3.25 One consequence of the current system is a chronic and substantialexcess demand for funds. Possibly as a response to this, the budget executiprocedures are quite complex and discretionary, and from the standpointof the implementing agencies, the timing and amount of release of funds fromthe approved annual budget is not highly predictable. To some extent, thisreflects the need for some flexibility to accommodate the requirements ofmonetary-fiscal stabilization policy, and the potential for revision ofpriorities during the course of the year. However, within these constraintsit should be possible to make budget execution somewhat simpler and moreautomatic, particularly as the financial planning system is strengthened.This would enhance the relevance of planning and work programming activityin the implementing agencies, and promote more effective program and projectimplementation.
D. The Role of the Public Sector
3.26 As noted earlier, the public sector has recently becomeincreasingly directly involved in activities which traditionally in thePhilippines have been areas of primarily private sector responsibility.There are well-justified rationales for some of these involvements; forexample, some of the MIPs are so large as to be quite risky for privatecapital without the assurance provided by minority Government participation.In other cases, public sector equity investment has resulted from thefinancial difficulties of private firms which have borrowed heavily fromGovernment financial institutions. These involvements, in activities whichare relatively peripheral to the public sector's fundamental responsibili-ties, have come at a time when the Government has not yet completed the taskof providing basic public services, such as rural roads and bridges orsanitary water supply, to all segments of the population, and when publicsector project implementation has been deteriorating because of lack offunds. They have also given rise to some concern in the Philippine privatesector as to the relative roles of the public and private sectors. In thenew Plan the Government has, however, reaffirmed that the private sectorwill be the leading partner in development, and that the role of publicsector is to provide direction and basic support. This should provide thebasis for a more sharply focussed but more effective public sectordevelopment effort.
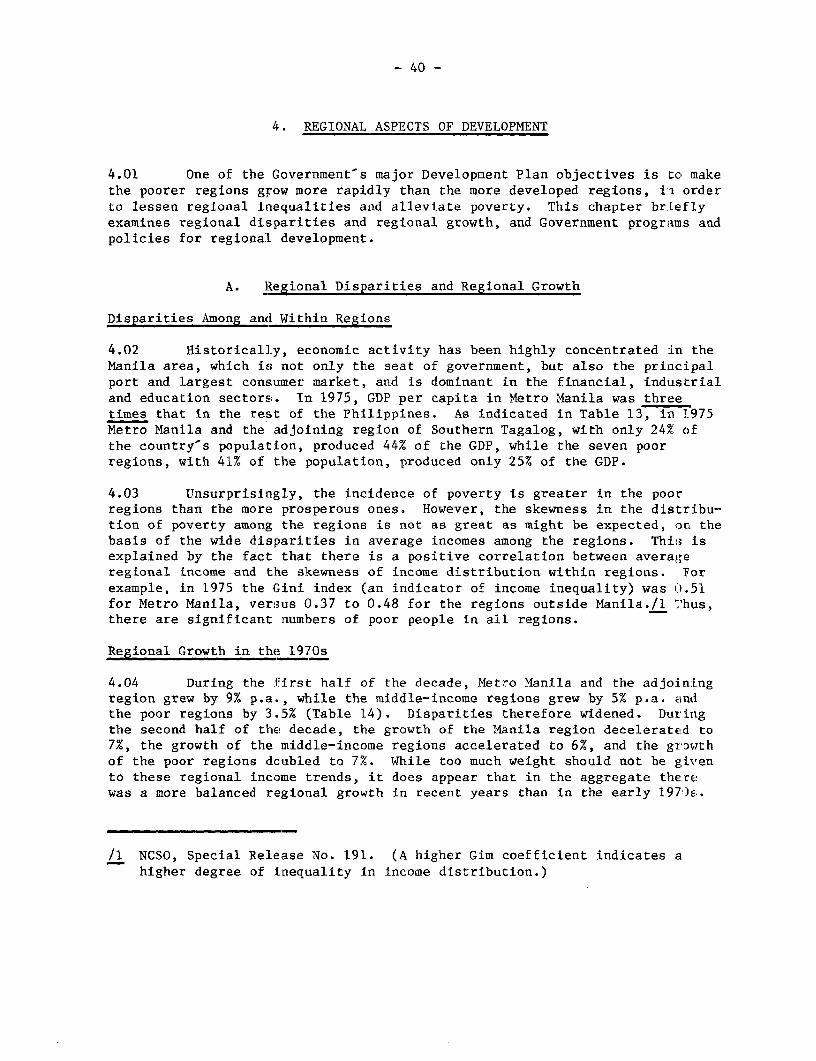
- 40 -
4. REGIONAL ASPECTS OF DEVELOPMENT
4.01 One of the Government's major Development Plan objectives is to makethe poorer regions grow more rapidly than the more developed regions, i:a orderto lessen regional inequalities and alleviate poverty. This chapter brieflyexamines regional disparities and regional growth, and Government programs andpolicies for regionaL development.
A. Regional Disparities and Regional Growth
Disparities Among and Within Regions
4.02 Historically, economic activity has been highly concentrated in theManila area, which is not only the seat of government, but also the principalport and largest consumer market, and is dominant in the financial, industrialand education sectors. In 1975, GDP per capita in Metro Manila was threetimes that in the rest of the Philippines. As indicated in Table 13, in 1975Metro Manila and the adjoining region of Southern Tagalog, with only 24%, ofthe country-s population, produced 44% of the GDP, while the seven poorregions, with 41% of the population, produced only 25% of the GDP.
4.03 Unsurprisingly, the incidence of poverty is greater in the poorregions than the more prosperous ones. However, the skewness in the distribu-tion of poverty among the regions is not as great as might be expected, on thebasis of the wide disparities in average incomes among the regions. Thi:, isexplained by the fact that there is a positive correlation between averageregional income and the skewness of income distribution within regions. Forexample, in 1975 the Gini index (an indicator of income inequality) was 1.51for Metro Manila, versus 0.37 to 0.48 for the regions outside Manila./l Thus,there are significant numbers of poor people in all regions.
Regional Growth in the 1970s
4.04 During the first half of the decade, Metro Manila and the adjoin[ngregion grew by 9% p.a., while the middle-income regions grew by 5% p.a. aIndthe poor regions by 3.5% (Table 14). Disparities therefore widened. Duringthe second half of the decade, the growth of the Manila region decelerated to7%, the growth of the middle-income regions accelerated to 6%, and the growthof the poor regions doubled to 7%. While too much weight should not be givento these regional income trends, it does appear that in the aggregate therewas a more balanced regional growth in recent years than in the early 197)s.
/1 NCSO, Special Release No. 191. (A higher Gim coefficient indicates ahigher degree of inequality in income distribution.)

- 41 -
Table 13: COMPARATIVE REGIONAL DATA, 1975
Percent distribution of:GDP per capita Total Low-income
Regional Group (pesos) GDP population population
Upper-income 4,813 43.5 24.2 20.7National Capital Region 6,500 28.7 11.8 7.6IV Southern Tagalog 3,201 14.8 12.4 13.1
Middle-income 2,501 32.0 34.4 34.0III Central Luzon 2,343 8.7 10.0 6.2VI Western Visayas 2,440 9.0 9.9 10.5VII Central Visayas 2,339 7.0 8.0 11.5XI Southern Mindanao 3,044 7.3 6.5 5.8
Lower-income 1,585 24.5 41.4 45.3I Ilocos 1,589 4.6 7.7 6.9II Cagayan Valley 1,582 2.7 4.6 4.8V Bicol 1,375 3.9 7.6 9.2
VII1 Eastern Visayas 1,360 3.1 6.2 8.0IX Western Mindanao 1,544 2.8 4.9 4.6X Northern Mindanao 2,119 4.4 5.5 8.7
XII Central Mindanao 1,631 3.0 4.9 3.1
Philippines 2,683 100 100 100
Source: Statistical Appendix Tables 12.1 and 12.2; World Bank Report No.2984-PH, Aspects of Poverty in the Philippines, Statistical AppendixTable I.5.
4.05 On a sectoral basis, it is interesting to note that, during thefirst half of the decade, the industrial growth rate closely paralleled theagricultural growth rate in the middle-income and poor regions, while this wasnot the case in the Manila region. This reflects the fact that industry inthe regions outside Manila was largely limited to agro-processing, includingwood-processing, with other types of industry being located primarily in theManila region. In the second half of the decade, there was an evening out inthe industrial growth rates of the Manila region and the middle-incomeregions, and industry in the latter regions began to grow more rapidly thanagriculture. This implies that industry in the middle-income regions began todiversify away from simple agro-processing. The acceleration of the agricul-tural and industrial growth rates of the poor regions is certainly an encoura-ging sign; however, some of this growth has been of an unsustainable nature,such as logging without reforestation, and cultivation of sloping lands withtemporary crops, leading to soil erosion.
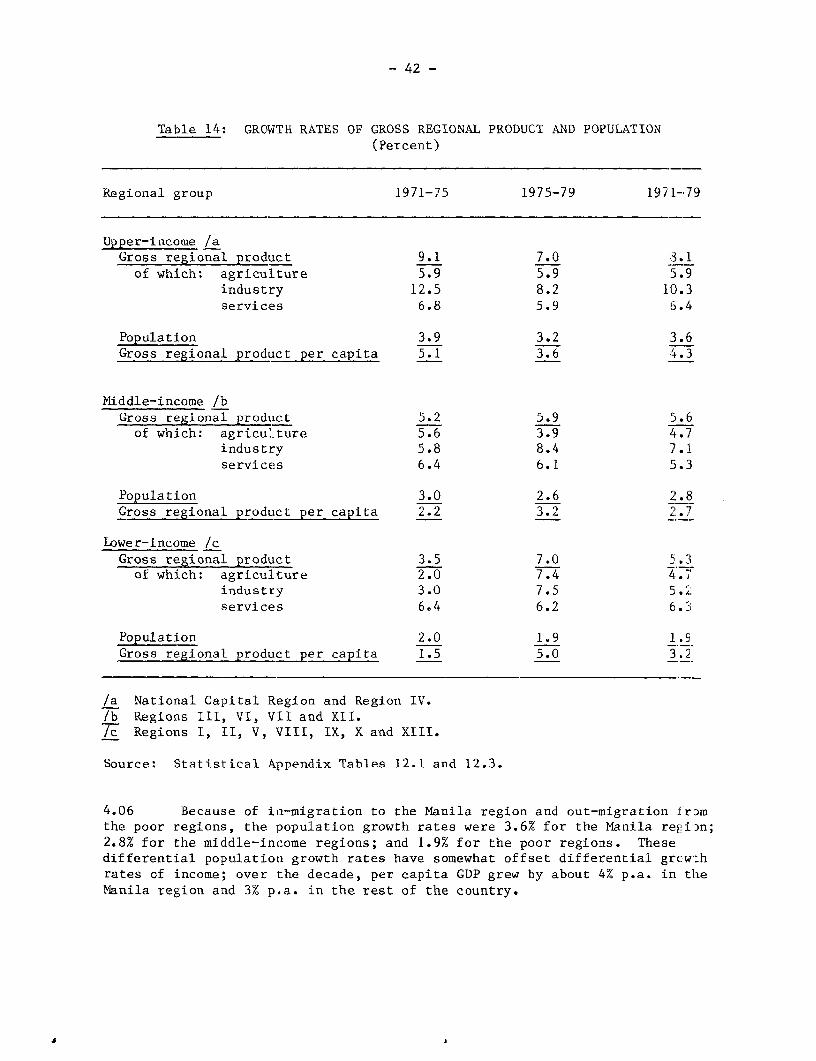
- 42 -
Table 14: GROWTH RATES OF GROSS REGIONAL PRODUCT AND POPULATION(Percent)
Regional group 1971-75 1975-79 1971-79
Upper-income /aGross regional product 9.1 7.0 3.1of which: agriculture 5.9 5.9 5.9
industry 12.5 8.2 10.3services 6.8 5.9 6.4
Population 3.9 3.2 3.6Gross regional product per capita 5.1 3.6 4.3
Middle-income /bGross regional produ1ct 5.2 5.9 5.6of which: agriculture 5.6 3.9 4.7
industry 5.8 8.4 7.1services 6.4 6.1 5.3
Population 3.0 2.6 2.8Gross regional product per capita 2.2 3.2 2.7
Lower-income /cGross regional product 3.5 7.0 5-3of which: agriculture 2.0 7.4 4.7
industry 3.0 7.5 5.2services 6.4 6.2 6.3
Population 2.0 1.9 1.SGross regional product per capita 1.5 5.0 3.2
/a National Capital Region and Region IV./b Regions III, VI, VII and XII./c Regions I, II, V, VIII, IX, X and XIII.
Source: Statistical Appendix Tables 12.1 and 12.3.
4.06 Because of in-migration to the Manila region and out-migration romthe poor regions, the population growth rates were 3.6% for the Manila rejion;2.8% for the middle-income regions; and 1.9% for the poor regions. Thesedifferential population growth rates have somewhat offset differential grc:w :hrates of income; over the decade, per capita GDP grew by about 4% p.a. in theManila region and 3% p.a. in the rest of the country.
J

- 43 -
4.07 While the regional structure of growth has improved recently, giventhe initial magnitude of the disparities, substantial reduction of the dispa-rities can be achieved only slowly. For example, the acceleration in thegrowth of the poor regions during the second half of the decade increased theratio of GDP per capita in the poor regions to that in the Manila region byonly two percentage points, from 33% to 35%. This consideration, togetherwith the congestion and other social costs that can result from large-scaleinternal migration, argue in favor of a greater effort to improve incomes inthe poorer regions, at the very least with a policy of identification and fullexploitation of development opportunities in the poor regions, and possiblywith some deliberate discrimination in economic policies in favor of thepoorer regions.
B. Government Policies for Regional Development
4.08 While there probably are no aspects of Government policy which arecompletely devoid of implications for regional development, the principalaspects of the regional development effort have been:
(a) better distribution of public investment among the regions;
(b) some decentralization of planning and programming functions,to promote more effective distribution of investment withinregions; and
(c) revision of industrial promotion policies to encourage a betterdistribution of industrial investment (the largest element ofprivate investment) among the regions.
Distribution of Public Investment
4.09 Historically, public infrastructure investment has been concentratedin Metro Manila and the adjoining regions of Central and Southern Luzon. TheILO report on the Philippines found that between 1965 and 1972, 48% ofinfrastructure investment took place in Metro Manila and Central Luzon.Similarly, in 1974 Metro Manila and Southern Luzon absorbed 41% ofinfrastructure investment and Central Luzon accounted for another 15%.
4.10 As indicated in Table 15, annual infrastructure investment as ashare of GNP in the upperincome region (Manila and Southern Luzon) hasincreased by about 50% since 1974, but this ratio approximately doubled in themiddle-income regions, and increased by a factor of two-and-a-half times inthe poor regions. The share of the upper-income region in the programdecreased from 40% to 30%, while the share of the poor regions increased fromone-third to 40%, indicating considerable progress in distributing infra-structure investment more equitably.
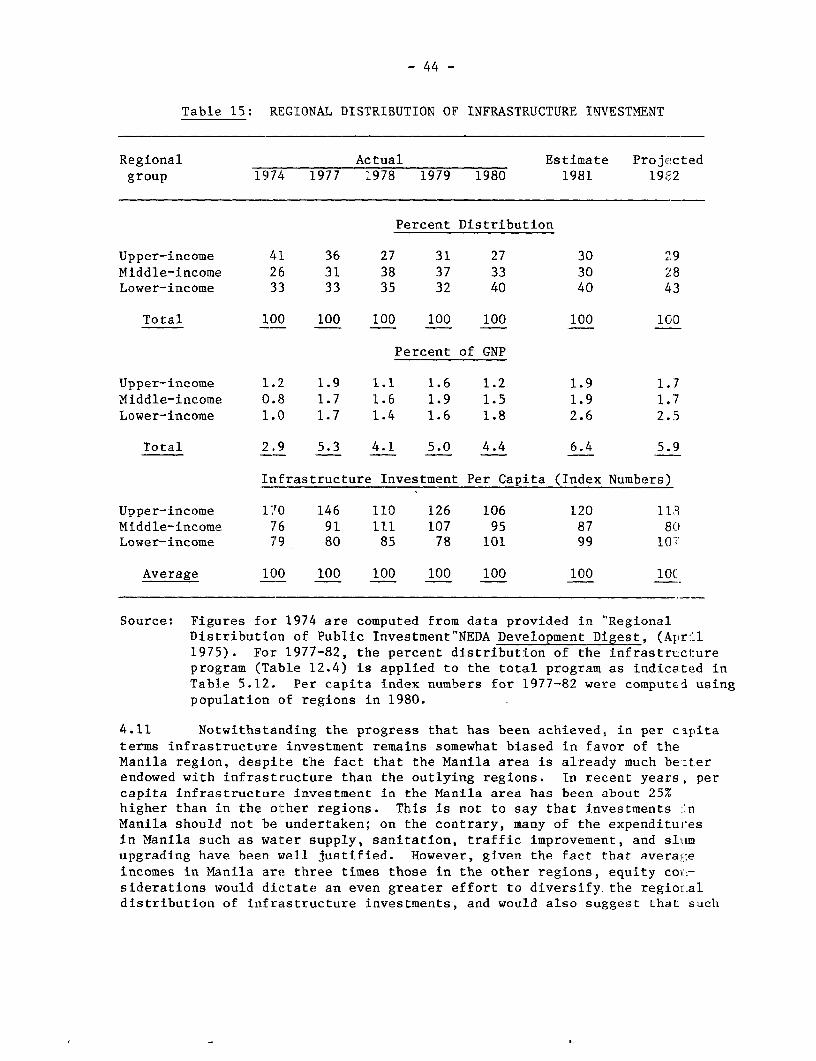
- 44 -
Table 15: REGIONAL DISTRIBUTION OF INFRASTRUCTURE INVESTMENT
Regional Actual Estimate Proje,-ctedgroup 1974 1977 1978 1979 1980 1981 1982
Percent Distribution
Upper-income 41 36 27 31 27 30 29Middle-income 26 31 38 37 33 30 28Lower-income 33 33 35 32 40 40 43
Total 100 100 100 100 100 100 100
Percent of GNP
Upper-income 1.2 1.9 1.1 1.6 1.2 1.9 1.7Middle-income 0.8 1.7 1.6 1.9 1.5 1.9 1.7Lower-income 1.0 1.7 1.4 1.6 1.8 2.6 2.5
Total 2.9 5.3 4.1 5.0 4.4 6.4 5.9
Infrastructure Investment Per Capita (Index Numbers)
Upper-income 170 146 110 126 106 120 118Middle-income ,'6 91 ill 107 95 87 810Lower-income 7'9 80 85 78 101 99 lO;'
Average 100 100 100 100 100 100 lO(
Source: Figures for 1974 are computed from data provided in "RegionalDistribution of Public Investment"NEDA Development Digest, (April1975). For 1977-82, the percent distribution of the infrastrtict:ureprogram (Table 12.4) is applied to the total program as indicated inTable 5.12. Per capita index numbers for 1977-82 were computed usingpopulation of regions in 1980.
4.11 Notwithstanding the progress that has been achieved, in per capitaterms infrastructure investment remains somewhat biased in favor of theManila region, despite the fact that the Manila area is already much be-terendowed with infrastructure than the outlying regions. In recent years, percapita infrastructure investment in the Manila area has been about 25%higher than in the other regions. This is not to say that investments I'nManila should not be undertaken; on the contrary, many of the expendituresin Manila such as water supply, sanitation, traffic improvement, and slitmupgrading have been well justified. However, given the fact that avera(:;eincomes in Manila are three times those in the other regions, equity conv-siderations would dictate an even greater effort to diversify.the regiolnaldistribution of infrastructure investments, and would also suggest that such

- 45 -
infrastructure provision in Manila should emphasize full cost recovery, andshould increasingly be financed from local taxation as well as user charges,with the national government budget reserved primarily for the middle-incomeand poor regions.
4.12 In the early 1980s a number of large-scale projects on Luzon will becompleted, such as the nuclear power plant, the Magat multipurpose project,and the Manila water supply and sewerage projects. At the same time, therewill be significant geothermal energy and industrial development on some ofthe Visayan islands; and the Government intends to develop certain secondarycities in the Visayas and Mindanao, such as Cebu, Iloilo, Davao, and Cagayande Oro, as alternative urban/industrial growth centers. A further shift inthe distribution of infrastructure investment in favor of the disadvantagedregions in the 1980s therefore appears to be not only desirable, but alsofeasible.
Regional Planning and Programming
4.13 The principal institutions engaged in regional planning andprogramming are the Regional Development Councils (RDCs) and the NEDA RegionalOffices (NROs). The RDC is a consultative body composed of Ministry regionaloffice directors, provincial governors, and city mayors. The NRO serves asthe full-time technical staff of the RDC, it reports concurrently to the RDCand to NEDA headquarters in Manila. Of course, the Ministry regional officesand the local governments in the regions also carry out planning andprogramming activities. The Integrated Reorganization Plan of 1972, whichcreated the RDCs, stated that the RDCs would extend planning and othertechnical assistance to these Ministry regional offices and local governments.However, in practice the RDCs have generally had relatively few financial andtechnical resources for doing so.
4.14 Concurrently with the preparation of the national development planfor 1978-82, the RDCs/NROs prepared five-year regional development plans whichanalyzed the development problems and potentials of the various regions. Theplans contain profiles of regional resources, economic development, and socialconditions. They include projections and targets for economic variables suchas value added by sector, crop production, and industrial investment;demographic variables such as urban and rural population, and labor force; andsocial indicators such as infant mortality, access to health facilities, andschool enrollments. The plans provide agricultural and rural development-oriented strategies for some regions, and urban-industrial oriented strategiesfor others.
4.15 As intended, the regional plans were indicative in nature. It wasrecognized that the programs and projects needed to move the regions fromtheir prevailing situations to their projected future situations had to bespecified in greater detail than in the plan documents, as a basis for planimplementation. Therefore, the RDCs/NROs have subsequently been engaged inthe preparation of Regional Development Investment Programs (RDIPs). Theseare aggregations of programs and projects suggested by local governments,

- 46 -
Ministry regional offices, the NROs and, to varying degrees in the differentregions, the private sector. The RDIPs have had the important benefit ofencouraging the Ministry regional offices and local governments to consicdersystematically the inter-relationships of their activities. In some regionsthe RDIPs are being used for the identification of regionally-based projects.
4.16 While it was an important step, the preparation of the RDIP did not,by itself, solve the implementation question, since the RDCs lack their ownfiscal resources and implementation capacity. The challenge has been to linkthe RDIP to national government and local government programming and budgetingsystems. The most important task has been to link it to the nationalgovernment system, since national government expenditures account for aboutthree-fourths of total government expenditures in the regions. This is also adifficult task, since the national government system is organizedpredominantly along sectoral (ministry and government corporation) lines.
4.17 The attempt has been made to anchor the RDIP to the national govern-ment programming and budgeting system by defining an "annual component" ofthe RDIP as the RDC's input into a "regional budget hearing". However, therelatively low correLation between this input, and the actual pattern of fundreleases to the regions (the output of the process) has led to some dissatis-faction with the regional budgeting process. This low correlation reflectsthe several opportunlties for the annual component of the RDIP to become"lost" in the system:: it may not be reflected in Ministry headquarters' budgetsubmission; if reflected, it may not make it into the approved budget program;even if in the approvred budget program, funds may not necessarily be releasedfor that purpose. Regional programming/regional budgeting thus reflects 1:heproblems of the programming and budgeting system generally: lack of financialguidelines to programming, and considerable uncertainty of budget execution.It might therefore be easier to attempt to institutionalize regionalplanning-programming-budgeting linkages only after the national/sectoralplanning-programming-budgeting system has first been better defined andstrengthened. In the interim, the RDIP could continue to be used as aframework for strengthening sector analysis, work programming, and proje:tpreparation capabilities in Ministry regional offices and local governmeits.
Regional Aspects of Industrial Promotion Policy
4.18 During the 1950s and 1960s, little attention was paid to regiolialdistribution as an objective of industrial promotion policies. In fact, anundesirable consequence of the policies pursued during that period was thieencouragement of industrial concentration in the Manila region. The policies,and their implications for regional distribution, were the following:
(a) A trade regime consisting of a cascading and generally hightariff stru,ture, and quantitative import controls. Thistrade regilie facilitated the maintenance of an exchangevalue of the peso that was higher than otherwise would have
- 47 -
been possible. The trade and exchange rate policy raised theprofitability of import-substituting consumer goods industries,and correspondingly depressed the relative profitability ofexport-oriented resource-based industries. The formerindustries located in Manila which was the port of entry forimported inputs and the principal consumer market, whereasresource-based industries would have been located more in theregions.
(b) A system of Government promotion of industry, such as alloca-tion of foreign exchange for imports by the Central Bank, allo-cation of fiscal incentives by the Board of Investments, andallocation of artifically low-cost credit by the DevelopmentBank of the Philippines, which was more readily accessible tofirms located in Manila.
(c) As noted earlier, the concentration of necessary infrastructurein the Manila area.
The consequence of these policies was that in 1975, 87% of manufacturingvalue added (excluding resource-based food and wood industries) was found inMetro Manila and the adjoining regions of Central and Southern Luzon.
4.19 In the early 1970s the Government began to take measures to promotea better regional distribution of industry. The Export Incentives Actprovided additional incentives to export-oriented firms locating away fromManila. However, studies have suggested that the incremental incentives havebeen of insufficient value to significantly influence locational decisions. A"ban" was placed on new plants, other than export-oriented ones, within 50 kmof Manila. However, the criteria for exemption from the "ban" have beenfairly liberally applied, and the benefits from the "ban" seem to have beenreceived principally by Central and Southern Luzon. A Philippine study in1979 found that a more thoroughgoing reform of the industrial promotion systemwas needed "to modify the extreme regional industrial concentration thatpresently exists"./l
4.20 As discussed in Chapter 1,during the past two years the Governmenthas embarked upon such a thoroughgoing reform, and is now addressing all ofthe factors cited in para. 4.18. In particular, the tariff structure is beinglowered and evened out; import controls are being dismantled; market-orientedexchange rate and interest rate policies are being pursued; and fiscalincentives for investment are being revised. These reforms are expected toremove artificial incentives for location in the Manila region, and therebypromote a better regional balance of industry. In addition, as noted earlier
/1 Philippine Institute of Development Studies, Industrial Promotion Policiesin the PhilippineZ(1979), p. 63.
- 48 -
the Government has expanded infrastructure investment in the regions outsideManila, and in the case of certain secondary cities is devoting particu:arattention to the needs of industry, such as ports, telecommunications,electric power, and industrial estates. The Board of Investments now payssubstantial attention to regional development objectives in projectnegotiations.
4.21 However, the benefits (from the standpoint of the individual firm,not from the social standpoint of the nation) of the industrial agglomerationthat has already taken place in the Manila region, as a consequence ofhistorical policies, may be difficult to overcome. The Government shouldtherefore monitor the regional distribution of industrial investment closely.Given the critical importance of establishing alternative urban/industrialgrowth centers the Government should not hesitate to take additional incentivemeasures, should this turn out to be necessary to achieve an economicallyefficient and socially acceptable regional distribution of industry.
- 49 -
5. THE BALANCE OF PAYMENTS
A. Recent Balance of Payments Developments
5.01 The previous economic report /1 was prepared between the two majoroil price increases of 1979, one of which took place in June and the otherin December. It thus reflected some but not all of the impact of the "secondoil crisis" of 1979. It was expected in that report that the Philippines'external terms of trade would deteriorate by 6% in 1980, remain steadyduring 1980-82, and then improve by about one percentage point a year during1982-85 , reflecting recovery of commodity prices. It was suggested thatreasonable targets for the quantitative growth of external trade would be:manufactured exports 18%; commodity exports 6%, and imports 6% (including azero growth rate for petroleum imports). It was suggested that the Govern-ment aim at containing the current account deficit at about $2 billionannually during the early 1980s, reduced to no more than $1.5 billion in1985.
5.02 The actual developments in the world economy have been substan-tially more adverse for the Philippines than foreseen in the 1979 economicreport. The full extent of the "second oil crisis" not only impacted thePhilippines directly, but also brought about recessionary conditions in theOECD countries, resulting in deflation of the Philippines' principal exportmarkets. The terms of trade deterioration from 1979 to 1981 turned out tobe 21%, or about three times what was expected in the 1979 report.Additionally, partly as a result of the revised US monetary policy, the realcost of borrowing from private sources of finance, which had been negativefor much of the 1970s, became substantially positive.
5.03 During the past two years, the Government has undertaken substan-tial measures - such as strengthening of export incentives, trade policyreform, interest rate deregulation, and a flexible exchange rate policy -to promote balance of payments adjustment. These measures will have asignificant impact over the medium term. However, in the short term thepositive impact of these measures has been exceeded by the negative impactof the terms of trade deterioration. The current account deficit has there-fore widened from $1.2 billion (4.9% of GNP) in 1978 to $2.3 billion (6.0%of GNP) in 1981. In 1982, the terms of trade are expected to stabilize, andthe current account deficit is expected to be $2.2 billion (5.4% of GNP).
/1 World Bank report No. 2674-PH, The Philippines Domestic and ExternalResources for Development (November 1979).
- 50 -
B. Adjustment in the Current Account
5.04 As the Plan recognizes, the dependence of the economy on foreignsavings must be reduced during the Plan period, in order to maintain themanageability of the debt burden. This can be accomplished through:
(a) appropriate domestic resource management (fiscal and financial)policies to reduce the excess of domestic investment overnational savings, as discussed in Chapter 2,
(b) investments and policies, including exchange rate policy, to adjustthe production structure of the economy in such a way as toincrease exports and efficiently replace imports, as discussed inthe present chapter.
Sectoral Structure of External Trade
5.05 In Tables 16 and 17, imports and exports have been arranged,to the extent possible, according to economic sector in order to illustratethe sectoral structtLre of external trade. Capital goods imports have beenallocated among the sectors in order to display the strategic role of capitalgoods imports in structural change. The tables reveal that the Philippineshas a trade surplus in the agricultural and mineral sectors, and a tradedeficit in the energy and manufacturing sectors. This is a typical patternfor a primary product-exporting, oil-importing developing country. Table 17also illustrates the two principal developments which have caused thewidening of the current account deficit: the growth of net energy impcr:s(including the energy capital goods necessary for the adjustment process)from 5.3% of GNP in 1978 to 7.0% of GNP in 1981; and the growth of interestpayments from 1.3% of GNP in 1978 to 3.3% of GNP in 1981, reflecting hcth alarger volume of debt and a higher average cost. It appears that interestpayments of more than 3% of GNP will be a permanent feature of the Philippinebalance of payments, at least for the 1980s. Meanwhile, the non-energybalance of trade has become positive, increasing from zero in 1978 to 1.2%of GNP in 1981. This indicates that there has been some adjustment in theeconomy generally to offset the higher energy prices and interest rates. Thenon-energy balance of trade will have to continue to increase, to complstethe adjustment to the higher energy prices and interest rates.
5.06 In princip!Le, a structural adjustment program could focus onincreasing the agricultural and mineral surpluses, reducing the manufac-turing and energy de.Eicits, or some combination of both. The Philippinestrategy is broadly to concentrate on reducing the manufacturing and eneirgytrade deficits, while maintaining the agricultural and mineral surpluses.This reflects the fact that there are substantial profitable opportunit.esfor reducing the manufacturing and energy deficits through manufacturedexport growth, selective and economic import substitution in manufactur .ng,and development of domestic energy production. At the same time, howevl.r,
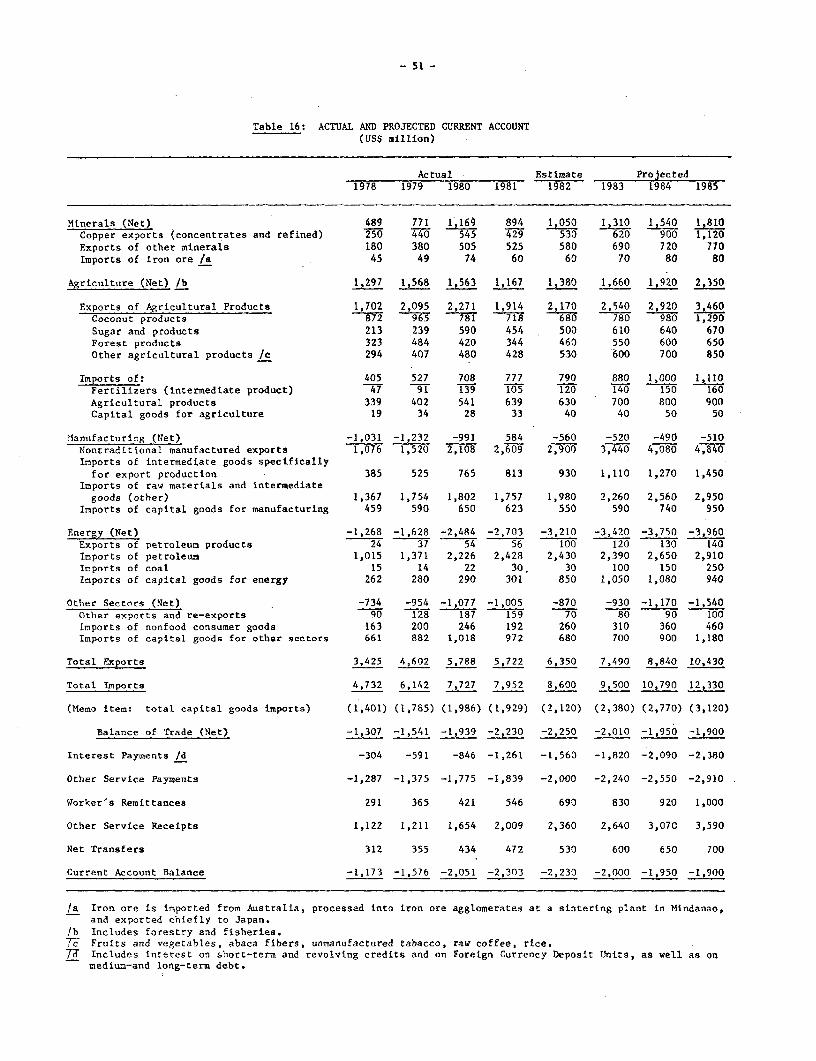
- 51 -
Table 16: ACTUAL AND PROJECTED CURRENT ACCOUNT(US$ million)
Actual Estimate 1 Projected1978 1979 1980 1981 1982 1983 1984 1985
Minerals (Net) 489 771 1,169 894 1,050 1,310 1,540 1,810Copper exports (concentrates and refined) 250 WU 545 429 530 620 900 1,120Exports of other minerals 180 380 505 525 580 690 720 770Imports of iron ore /a 45 49 74 60 60 70 80 80
Agriculture (Net) /b 1,297 1,568 1,563 1,167 1,380 1,660 1,920 2,350
Exports of Agricultural Products 1,702 2,095 2,271 1,914 2,170 2,540 2,920 3,460Coconut products 872 965 781 718 680 780 980 1,290
Sugar and products 213 239 590 454 500 610 640 670Forest products 323 484 420 344 460 550 600 650Other agricultural products /c 294 407 480 428 530 600 700 850
.Imports of: 405 527 708 777 790 880 1,000 1,110Fertilizers (intermediate product) 47 91 139 105 120 140 150 160
Agricultural products 339 402 541 639 630 700 800 900Capital goods for agriculture 19 34 28 33 40 40 50 50
l1anmfacturing (Net) -1,031 -1,232 -991 584 -560 -520 -490 -510Nontraditional manufactured exports 1,076 1,520 2,108 2,609 2,900 3,440 4,080 4,840Inports of intermediate goods specifically
for export production 385 525 765 813 930 1,110 1,270 1,450Imports of raw materials and intermediate
goods (other) 1,367 1,754 1,802 1,757 1,980 2,260 2,560 2,950Imports of capital goods for manufacturing 459 590 650 623 550 590 740 950
Energy (Net) -1,268 -1,628 -2,484 -2,703 -3,210 -3,420 -3,750 -3,960Exports of petroleum products 24 37 54 56 100 120 130 140Imports of petroleum 1,015 1,371 2,226 2,428 2,430 2,390 2,650 2,910Imports of coal 15 14 22 30. 30 100 150 250Imports of capital goods for energy 262 280 290 301 850 1,050 1,080 940
Other Sectors (Net) -734 -954 -1,077 -1,005 -870 -930 -1,170 -1,540Other exports and re-exports 90 128 187 159 70 80 90 100Imports of nonfood consumer goods 163 200 246 192 260 310 360 460Imports of capital goods for other sectors 661 882 1,018 972 680 700 900 1,180
Total Fxports 3,425 4,602 5,788 5,722 6,350 7,490 8,840 10,430
Total Imports 4,732 6,142 7,727 7,952 8,600 9,500 10,790 12,330
(Memo item: total capital goods imports) (1,401) (1,785) (1,986) (1,929) (2,120) (2,380) (2,770) (3,120)
Balance of Trade (Net) -1,307 -1,541 -1,939 -2,230 -2,250 -2,010 -1,950 -1,900
Interest Payments /d -304 -591 -846 -1,261 -1,560 -1,820 -2,090 -2,380
Other Service Payments -1,287 -1,375 -1,775 -1,839 -2,000 -2,240 -2,550 -2,910
Worker's Remittances 291 365 421 546 690 830 920 1,000
Other Service Receipts 1,122 1,211 1,654 2,009 2,360 2,640 3,070 3,590
Net Transfers 312 355 434 472 530 600 650 700
Current Account Balance -1,173 1,576 2,051 -2,303 -2,230 -2,000 -1,950 -1,900
/a Iron ore is imported from Australia, processed into iron ore agglomerates at a sintering plant in Mindanao,and exported chiefly to Japan.
lb Includes forestry and fisheries.7g Fruits and vegetables, abaca fibers, unmanufactured tabacco, raw coffee, rice.73 Includes interest on short-term and revolving credits and on Foreign Currency Deposit Units, as well as on
medium-and long-term debt.
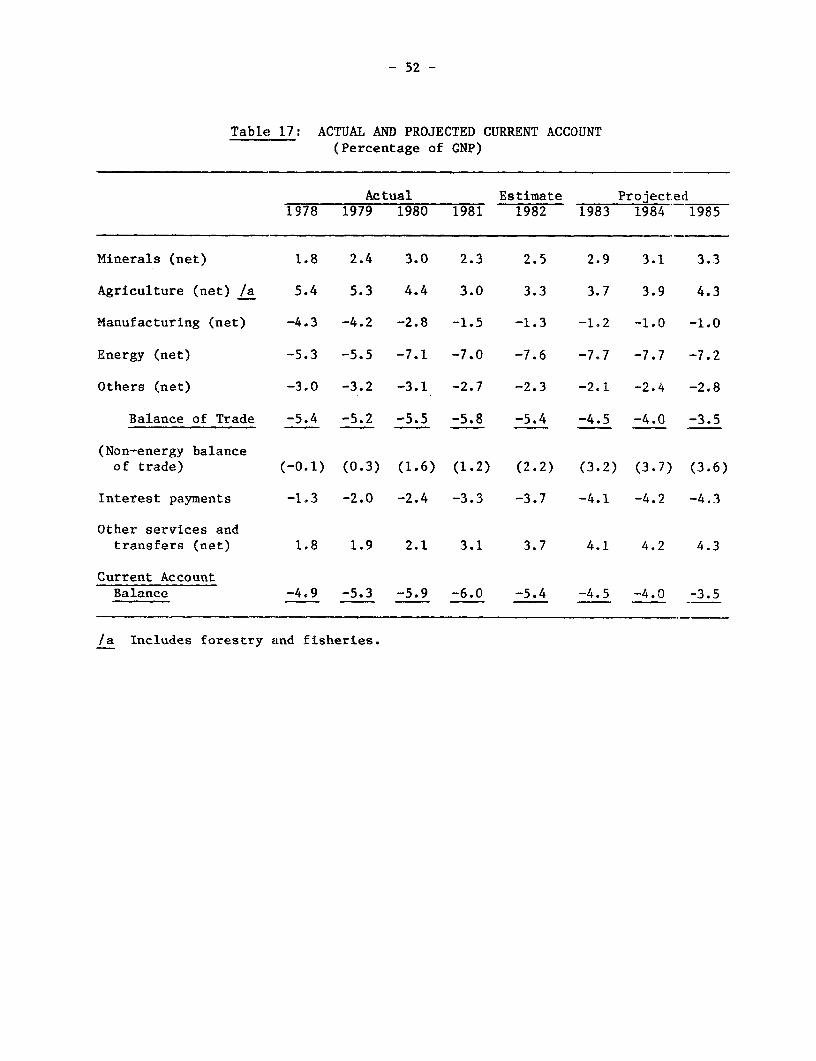
- 52 -
Table 17: ACTUAL AND PROJECTED CURRENT ACCOUNT(Percentage of GNP)
Actual Estimate Projected1978 1979 1980 1981 1982 1983 1984 1985
Minerals (net) 1.8 2.4 3.0 2.3 2.5 2.9 3.1 3.3
Agriculture (net) /a 5.4 5.3 4.4 3.0 3.3 3.7 3.9 4.3
Manufacturing (net) -4.3 -4.2 -2.8 -1.5 -1.3 -1.2 -1.0 -1.0
Energy (net) -5.3 -5.5 -7.1 -7.0 -7.6 -7.7 -7.7 -7.2
Others (net) -3.0 -3.2 -3.1 -2.7 -2.3 -2.1 -2.4 -2.8
Balance of Trade -5.4 -5.2 -5.5 -5.8 -5.4 -4.5 -4.0 -3.5
(Non-energy balanceof trade) (-0.1) (0.3) (1.6) (1.2) (2.2) (3.2) (3.7) (3.6)
Interest payments -1.3 -2.0 -2.4 -3.3 -3.7 -4.1 -4.2 -4.3
Other services andtransfers (net) 1.8 1.9 2.1 3.1 3.7 4.1 4.2 4.3
Current AccountBalance -4.9 -5.3 -5.9 -6.0 -5.4 -4.5 -4.0 -3.5
la Includes forestry and fisheries.
- 53 -
efforts are also being made to increase domestic processing of agriculturalproducts and minerals. Over the medium term, these structuraladjustment efforts will reduce the vulnerability of the Philippine economyto fluctuations in the world prices of commodities.
The Manufacturing Sector
5.07 The Philippine manufacturing sector is considerably dualistic,with a small nontraditional export sector which is effectively free-trading,and a larger home-oriented sector which has been heavily protected. Theindustrial policy reform is aimed at reducing this dualism by reducingexcessive protection for home industry and thereby promoting efficiency andlinkages in the sector as a whole. For the time being, however, it isuseful to consider the balance of payments implications of the manufacuredexport sector and the home-oriented sector separately.
5.08 Nontraditional manufactures (net). During the 1970s, grossreceipts from exports of nontraditional manufactures, of which garments andelectronics have been the most significant items, increased tenfold from$250 million in 1973 to $2.6 billion in 1981. During the past two years theGovernment has substantially strengthened export incentives, and the futuregrowth of these exports will therefore depend primarily on recovery in theOECD countries, and the ability of these countries to resist protectionistpressures. In the previous economic report, it was projected thatPhilippine nontraditional manufactured exports would increase by 18% annu-ally in volume terms. This was based on all LDC manufactured exportsgrowing by 12% annually in the Bank's global scenario, and on the assumptionthat the Philippines, because of its assets of a trainable, low-wage laborforce and vigorous entrepreneurship, could perform 50% better than theaverage LDC. The prospects for LDC manufactured exports have recently beenseen as more uncertain in the Bank's global scenario. In World DevelopmentReport 1981, both a high case with 12% LDC manufactured export growth and alow case with 5% LDC manufactured export growth were simulated. In thisreport's projections it has been assumed that the volume of Philippinenontraditional manufactured exports would increase by 12% annually.
5.09 A weakness of the Philippine manufactured export drive has beenthe high level of imported inputs. The Philippines can increase the netrevenues from manufactured exports not only by increasing the quantity ofthese exports, but also by increasing the domestic value-added. The garmentexport industry, for example, at the present time is almost entirelydependent on imported textiles under bonded warehouse arrangements, becauseof the low quality of domestically produced textiles. The Government has,however, developed a textile industry restructuring program which isexpected to enable the garment export industry to derive a substantial shareof its textile inputs from domestic production by 1985.

- 54 -
5.10 Capital goods imports for manufacturing. Capital goods impor:s,which presently amount to 6% of GNP, are the most discretionary categor,r inthe import bill./l Within this category, capital goods for manufacturinigare the largest single element, followed by capital goods for energy anAtransport./2 The economy will have to be managed in such a way that capitalgoods imports do not result in excessive absorption of foreign savingsduring the 1983-87 Plan period. There will be a significant increase i-lcapital goods imports for the energy sector; this will have implication; forthe availability of capital goods for other sectors, including the manulac-turing sector. If, for reasons of balance of payments adjustment, it turnsout to be necessary t:o restrain capital goods imports for manufacturing,priority should be given to the less capital-intensive industries because ofthe social importance of employment generation.
5.11 It is fairly difficult to predict capital goods imports, for avariety of reasons. First, the data base on industrial output, investme(nt,and employment is fairly weak. Second, the economy is presently experienc-ing recessionary conditions and low capacity utilization, and increasedoutput would not necessarily require an immediate increase in the capitalstock. Third, the reforms in trade policy, interest rate policy, and fiscalincentives are expected to result in a less capital-intensive pattern ofinvestment in the manufacturing sector. Fourth, because of the previousunderprotection of the mechanical engineering industry, there is almost nodomestic capital goods industry. During the 1983-87 Plan period, however,the Government intends to promote a domestic capital goods industry. In theprojections, capital goods have been treated as the residual item in importcapacity; after taking account of the needs of the energy sector, theremaining capital goods have been allocated among manufacturing and othersectors such as transportation. The MIP program should be phased in suca away that, given the PLiilippines' limited overall borrowing capacity, it loesnot "crowd out" imports of capital goods for more labor intensivemanufacturing activities.
5.12 Raw materials and intermediate goods for home-oriented industry.,The volume of these imports obviously reflects the level of domestic indls-trial activity. In the projections an elasicity of 0.9 has been assumed,implying some deepening oE the industrial structure with more domesticproduction of intermediate goods.
/1 Philippine imports coiisist of: food products which, for the most part,are uneconomic to produce in the Philippines; nonfood consumer goodsamounting to only 3.5% of the import bill; raw materials andintermediate goods, amounting to 66% of the import bill; and capitalgoods. The share of nonfood consumer goods in total imports is small.(and with the tariff reform should increase somewhat to provide morecompetition to domlestic industry), and raw materials and intermediat4.goods are needed t:o keep domestic industry going.
/2 Statistical Appendix Table 3.11.

- 55 -
The Energy Sector
5.13 Petroleum and Coal Imports. With appropriate progress in energypricing, it should be possible to restrain the growth of energy consumptionto about 6% annually during the Plan period, representing an eleasticity ofabout 1.0 with respect to real GNP. Given the prospects for increaseddomestic energy production arising from the energy investment program, itshould be possible to reduce petroleum imports from their recentaverage level of 79 million barrels annually,/l to about 70 millionbarrels annually, and then contain petroleum imports at that level.Payments for petroleum imports are expected to be $2.4 billion annually inthe next two years. Assuming recovery in the Philippine economy and in oilprices, payments would increase thereafter to about $2.9 billion in 1985.Coal imports will grow substantially as coal-fired generating plants arebrought into operation.
5.14 Imports of Capital Goods for Energy. Under the six-year 1981-86Energy Program, as modified by the "adjusted power program," these wouldincrease from less than $300 million annually during 1978-80, to about$1.0 billion annually during 1983 and 1984, the peak years of implementationof the energy program. Thereafter these imports might run at about $900million annually.
The Agricultural Sector
5.15 As in the past, the agriculture sector's contribution to externaltrade will rely mainly on coconut, sugar, and forest products. However,government policies aiming at increasing the value added of exports and atpromoting exports of nontraditional products will boost the importance ofthis sector.
5.16 Coconut Products. Although the Philippines is the world's largestproducer/exporter of coconut products, yields are low because of overagedtrees and a high level of taxation which has depressed farmers' incentivesfor fertilizer application and other aspects of farm management. Recentlythe coconut levy, which had been a fixed rate, was placed on a varible basisrelted to world market prices. It is now substantially less burdensome (22centavos per kg vs. 76 centavos per kg previously) and is likely to remainso. Taking into account the improvement in farmers' incentives, entry intoproduction of recently planted areas, and assuming favorable climacticconditions, the Philippine Coconut Authority (PCA) projects coconutproduction to increase by 33% betweeen 1980 and 1985. It has also initiateda program of coconut replanting with high yielding varieties, but this wouldnot have a significant impact on production until 1985-90.
/1 Statistical Appendix Table 3.12.
- 56 -
5.17 The growth of domestic coconut consumption will reflect not onlythe growth of consumer income (coconut oil being the leading edible oil),but also the development of alternative uses such as coconut-based chemicalsand coco-diesel fuel. After taking into account domestic disappearance, itwould seem that the Philippines could increase its share of the world fatsand oils market from 6% in 1980 to 8% in 1985. Prices are presentlydepressed but are expected to recover substantially during 1982-85. Thus,recipts from exports of coconut products might increase from $700 millicnin 1981 to $1.3 billion by 1985.
5.18 Sugar. The Philippines is a member of the International SugarAgreement, which sets export quotas which vary with the world price. During1978-79, world prices were low and receipts from sugar exports were onlyabout $230 million annually. Because of the low prices, planted areadecreased by about one-fourth from 1977 to 1980. Because of higher worldprices, export earnings soared in 1980 to $600 million annually. Quotaswere reimposed in May 1981 with falling world prices. Fortunately, thePhilippines had entered into some long-term contracts, which will enable itto sell about half of its exportable sugar during 1982-86 at relativelyfavorable prices. World market prices are presently relatively low at$320/MT, but are expected to recover to $523/MT by 1985. Assuming thatproduction grows suffiiciently to meet domestic demand as well as the exportquota, receipts from sugar exports should increase from $500 million in ]982to about $700 million in 1985.
5.19 Forestry prcducts. The Government's policy for the forestrysector is to promote more vertical integration of the wood industries ant.more value-added in the exports. In the past the main traditional exporle,lproducts have been logs, which have been progressively displaced by lumber,plywood and veneer, and more recently by wood manufactures and furniture.Domestic demand can be expected to grow rather quickly, because of growth indemand for intermediate products induced by further industrialization. Ioaccommodate increased domestic needs and to maintain forest products as asource of foreign exchange, reforestation efforts will have to be substar.-tially accelerated and wood industries, mainly the saw-mill subsector, willhave to be rationalized. During the projected period, current prices oninternational markets for logs and sawn wood are expected to recover fromthe fall that occurred in 1981, so that prices will increase by 45% incurrent terms between 1981 and 1985. The projections assume that the vol Wmeof logs dedicated to exports in a more or less processed stage will bemaintained at the 1980 level over the decade, while a shift toward moreprocessed products wil:L be observed in answer to the new industrial polic:i.
5.20 Minor and nontraditional agricultural exports. Government effortsto diversify exports and to increase processing of local resources areassumed to have a significant impact on exports of various other agricul-tural products. Banana, pineapple, and fish products have a potential fo
- 57 -
growth. The Philippines is already the third major exporter of bananas andcan be expected to maintain its 12% share of the market through the decade.In the projections, agricultural products other than coconut, sugar and woodproducts have been assumed to maintain their contribution to the tradeaccount.
The Mineral Sector
5.21 The Government's efforts to encourage further processing andvertical integration, as well as diversification of trading partners mayreduce the high sensitivity of this sector to international price fluctua-tions. Foreign investment and joint ventures will be promoted because ofthe high capital intensity of the mining industries. The main exports willremain copper, gold and nickel. Copper is now exported only as concen-trates, but the ongoing construction of a copper smelter will supplydomestic needs and allow exports of refined copper from 1983. This projectwill offer interesting opportunities to develop linkages with the export-oriented electronics industry as a copper products plant is contemplated.Projections of copper exports take also into consideration opening of newmines and expansion of activities. Gold production is mainly a by-productof copper mining so that projections are related to copper projections. Thecontribution of the mining sector to the external trade is projected toincrease from 2.3% of GNP in 1981 to 3.3 % of GNP in 1985. However, thesefigures assume a continuing recovery of mineral international prices.
Earnings from Services
5.22 Earnings from services have become an increasingly importantelement in the Philippine balance of payments. In 1981, receipts fromtourism were $360 million and receipts from overseas employment, principallyin the Middle East, were $550 million. The growth of tourism has sloweddown recently, and since tourism has a high income elasticity of demand, itsprospects depend considerably on economic recovery in the OECD countries.The growth of employment in the Middle East may decelerate now that thesecountries are experiencing slower growth of oil revenues.
Exchange Rate Policy
5.23 The exchange rate is, of course, the most general policy instru-ment for influencing the relative profitability of tradables (exports andimport-substitutes) and nontradables. In 1980 the Government began toimplement a flexible exchange rate policy, and the Peso/US dollar rate hasmoved from 7.4 at end-1979 to 8.2 at end-1981. However, because of theappreciation of the US dollar vis-a-vis other major currencies, and the morerapid inflation in the Philippines than in its trading partners the realeffective exchange rate appreciated significantly between 1979 and mid-1981.
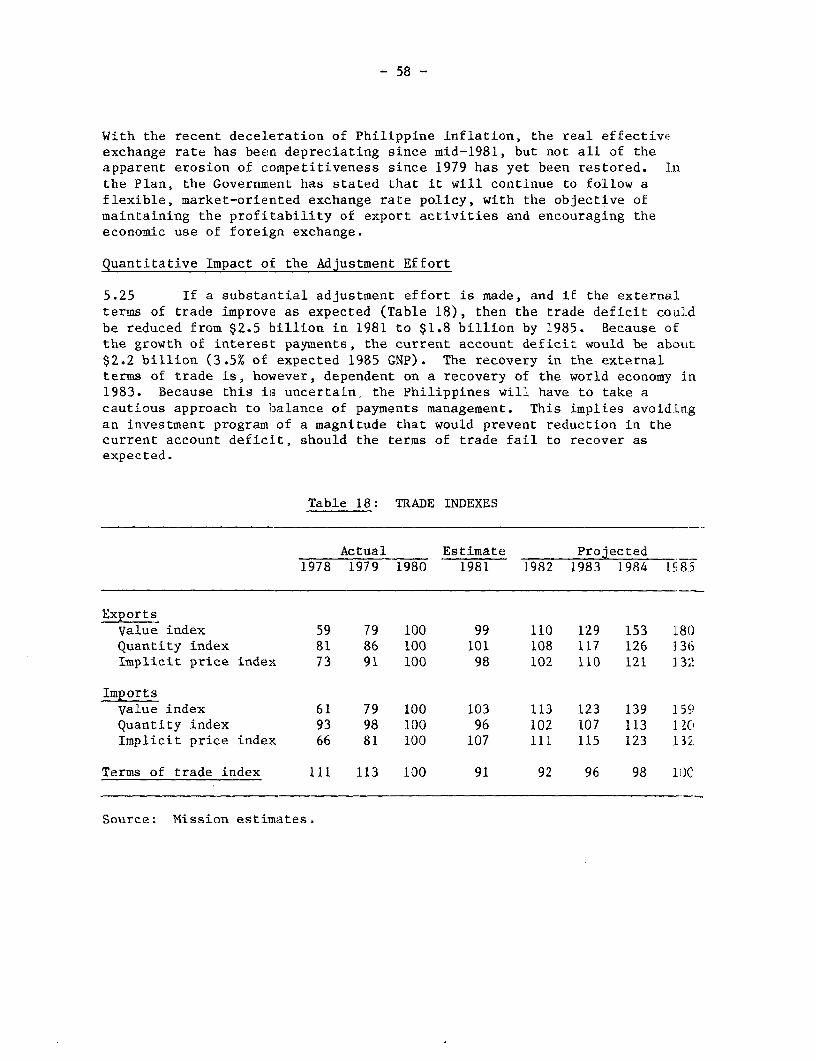
- 58 -
With the recent deceleration of Philippine inflation, the real effectivt.exchange rate has been depreciating since mid-1981, but not all of theapparent erosion of competitiveness since 1979 has yet been restored. I.nthe Plan, the Government has stated that it will continue to follow aflexible, market-oriented exchange rate policy, with the objective ofmaintaining the profitability of export activities and encouraging theeconomic use of foreign exchange.
Quantitative Impact of the Adjustment Effort
5.25 If a substantial adjustment effort is made, and if the externalterms of trade improve as expected (Table 18), then the trade deficit couldbe reduced from $2.5 billion in 1981 to $1.8 billion by 1985. Because ofthe growth of interest payments, the current account deficit would be about$2.2 billion (3.5% of expected 1985 GNP). The recovery in the externalterms of trade is, hoiwever, dependent on a recovery of the world economy in1983. Because this is uncertain, the Philippines will have to take acautious approach to balance of payments management. This implies avoidingan investment program of a magnitude that would prevent reduction in thecurrent account defic-it, should the terms of trade fail to recover asexpected.
Table 18: TRADE INDEXES
Actual Estimate Projected1978 1979 1980 1981 1982 1983 1984 P1'85
ExportsValue index 59 79 100 99 110 129 153 1.80Quantity index 81 86 100 101 108 117 126 136Implicit price index 73 91 100 98 102 110 121 332
ImportsValue index 61 79 100 103 113 123 139 159Quantity index 93 98 100 96 102 107 113 120Implicit price index 66 81 100 107 111 115 123 132.
Terms of trade index 111 113 100 91 92 96 98 1C
Source: Mission estimates.
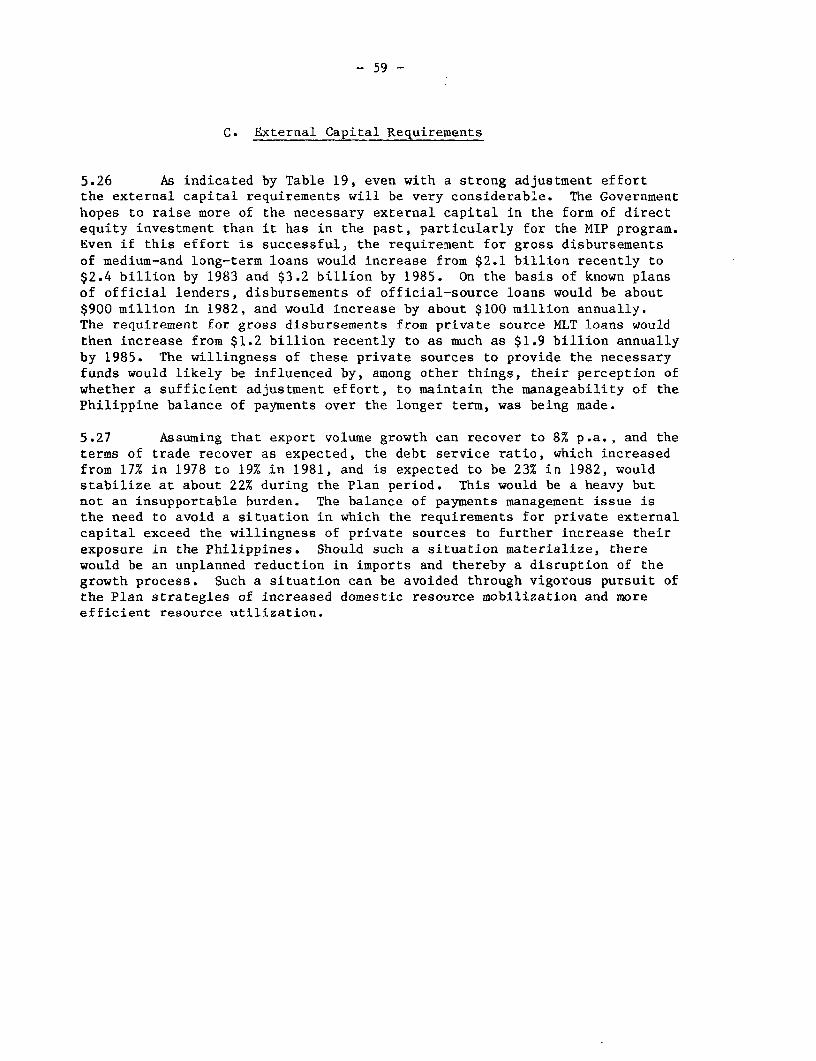
- 59 -
C. External Capital Requirements
5.26 As indicated by Table 19, even with a strong adjustment effortthe external capital requirements will be very considerable. The Governmenthopes to raise more of the necessary external capital in the form of directequity investment than it has in the past, particularly for the MIP program.Even if this effort is successful, the requirement for gross disbursementsof medium-and long-term loans would increase from $2.1 billion recently to$2.4 billion by 1983 and $3.2 billion by 1985. On the basis of known plansof official lenders, disbursements of official-source loans would be about$900 million in 1982, and would increase by about $100 million annually.The requirement for gross disbursements from private source MLT loans wouldthen increase from $1.2 billion recently to as much as $1.9 billion annuallyby 1985. The willingness of these private sources to provide the necessaryfunds would likely be influenced by, among other things, their perception ofwhether a sufficient adjustment effort, to maintain the manageability of thePhilippine balance of payments over the longer term, was being made.
5.27 Assuming that export volume growth can recover to 8% p.a., and theterms of trade recover as expected, the debt service ratio, which increasedfrom 17% in 1978 to 19% in 1981, and is expected to be 23% in 1982, wouldstabilize at about 22% during the Plan period. This would be a heavy butnot an insupportable burden. The balance of payments management issue isthe need to avoid a situation in which the requirements for private externalcapital exceed the willingness of private sources to further increase theirexposure in the Philippines. Should such a situation materialize, therewould be an unplanned reduction in imports and thereby a disruption of thegrowth process. Such a situation can be avoided through vigorous pursuit ofthe Plan strategies of increased domestic resource mobilization and moreefficient resource utilization.
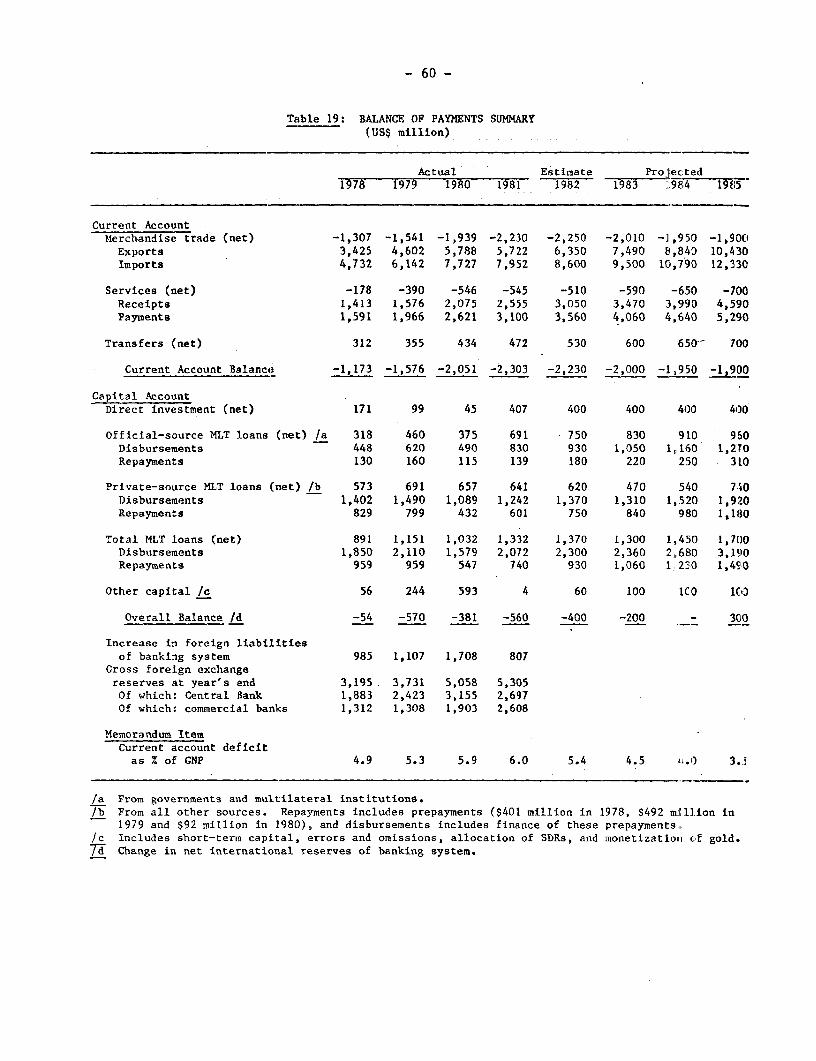
- 60 -
Table 19: BALAICE OF PAYMENTS SUMMARY(US$ million)
Actual Estimate Projected1978 1979 1980 1981 1982 1983 1984 19f;5
Current AccountMerchandise trade (net) -1,307 -1,541 -1,939 -2,230 -2,250 -2,010 -1,950 -1,900
Exports 3,425 4,602 5,788 5,722 6,350 7,490 8,840 10,430CImports 4,732 6,142 7,727 7,952 8,600 9,500 10,790 12,330
Services (net) -178 -390 -546 -545 -510 -590 -650 -700Receipts 1,413 1,576 2,075 2,555 3,050 3,470 3,990 4,590Payments 1,591 1,966 2,621 3,100 3,560 4,060 4,640 5,290
Transfers (net) 312 355 434 472 530 600 650-- 700
Current Account Balance -1,173 -1,576 -2,051 -2,303 -2,230 -2,000 -1,950 -1,900
Capital .countDirect investment (net) 171 99 45 407 400 400 400 400
Official-source MLT loans (net) /a 318 460 375 691 750 830 910; 950Disbursements 448 620 490 830 930 1,050 1,160 1,270Repayments 130 160 115 139 180 220 250 310
Private-source MLT loans (net) /b 573 691 657 641 620 470 540 740Disbursements 1,402 1,490 1,089 1,242 1,370 1,310 1,520 1,920Repayments 829 799 432 601 750 840 980 1,180
Total MLT loans (net) 891 1,151 1,032 1,332 1,370 1,300 1.450 1,700Disbursements 1,850 2,110 1,579 2,072 2,300 2,360 2,680 3,190Repayments 959 959 547 740 930 1,060 11220 1,490
Other capital _c 56 244 593 4 60 100 lCO 1(0
Overall Balance Id -54 -570 -381 -560 -400 -200 - 300
Increase in foreign liabilitiesof banking system 985 1,107 1,708 807
Gross foreign exchangereserves at year's end 3,195 3,731 5,058 5,305Of which: Central Bank 1,883 2,423 3,155 2,697Of which: commercial banks 1,312 1,308 1,903 2,608
Memorandum ItemCurrent account deficitas Z of GNP 4.9 5.3 5.9 6.0 5.4 4.5 .0 3..i
/a From governments and multilateral institutions./b From all other sources. Repayments includes prepayments ($401 million in 1978, $492 ml1llion in
1979 and $92 million in 1980), and disbursements includes finance of these prepayments.Ic Includes short-term capital, errors and omissions, allocation of SDRs, and monetizationi of gold.7T Change in net international reserves of banking system.
- 61 -
Table 20: EXTERNAL MEDIUM- AND LONG-TERM DEBT AND DEBT SERVICE /a
Actual Estimate Projected1978 1979 1980 1981 1982 1983 1984 1985
MLT debt outstanding anddisbursed (end-year) 6,200 7,137 8,554 10,028 11,400 12,700 14,150 15,850Official-source 1,894 2,265 2,710 3,354 4,110 4,940 5,850 6,810Private-source 4,306 4,872 5,844 6,674 7,290 7,760 8,300 9,040
MLT debt service 828 953 1,114 1,565 2,140 2,450 2,760 3,200Amortization /b 558 467 455 740 930 1,060 1,230 1,490Interest 270 486 659 825 1,210 1,390 1,530 1,710
Exports of goods andservices 4,838 6,178 7,863 8,277 9,400 10,960 12,830 15,020
Debt service ratio (%) Ic 17 15 14 19 23 22 22 21
/a Excludes transactions with IMF.
/b Excludes prepayments amounting to $401 million in 1978, $492 million in 1979, and$92 million in 1980.
/c Ratio of MLT debt service to receipts from exports of goods and services. Thisis the debt service ratio used in World Bank publications such as World DevelopmentReport and the World Bank's Annual Report. It differs from the statutory ratiodefined in Republic Act 6142, as amended. If repayments to IMF were to beincluded, the debt service ratio would be about two percentage points higher.

- 62 -
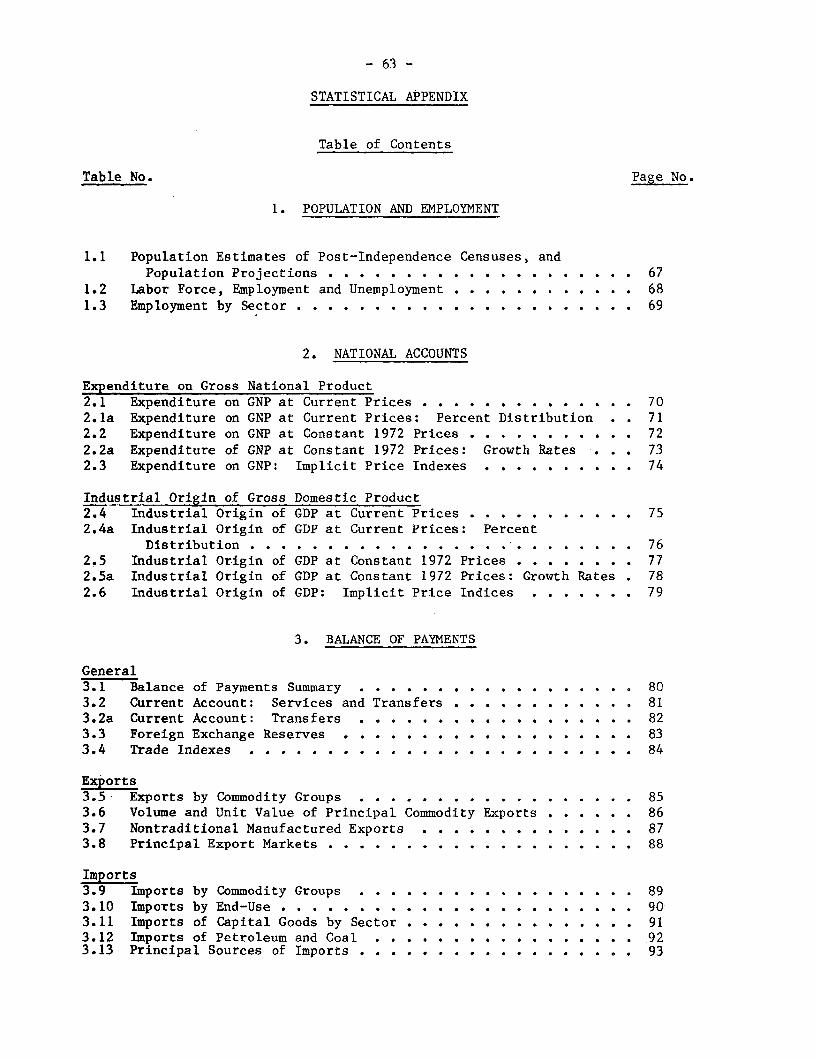
- 63 -
STATISTICAL APPENDIX
Table of Contents
Table No. Page No.
1. POPULATION AND EMPLOYMENT
1.1 Population Estimates of Post-Independence Censuses, andPopulation Projections . . . . . . . . . . . . . . . . . . . . 67
1.2 Labor Force, Employment and Unemployment . . . . . . . . . . . . 681.3 Employment by Sector . . . . . . . . . . . . . . . . . . . . . . 69
2. NATIONAL ACCOUNTS
Expenditure on Gross National Product2.1 Expenditure on GNP at Current Prices . . . . . . . . . . . . . . 702.la Expenditure on GNP at Current Prices: Percent Distribution . . 712.2 Expenditure on GNP at Constant 1972 Prices . . . . . . . . . . . 722.2a Expenditure of GNP at Constant 1972 Prices: Growth Rates . . . 732.3 Expenditure on GNP: Implicit Price Indexes . . . . . . . . . . 74
Industrial Origin of Gross Domestic Product2.4 Industrial Origin of GDP at Current Prices . . . . . . . . . . . 752.4a Industrial Origin of GDP at Current Prices: Percent
Distribution . . . . . . . . . . . . . . . . ... . . . . . . . 762.5 Industrial Origin of GDP at Constant 1972 Prices . . . . . . . . 772.5a Industrial Origin of GDP at Constant 1972 Prices: Growth Rates . 782.6 Industrial Origin of GDP: Implicit Price Indices . . . . . . . 79
3. BALANCE OF PAYMENTS
General3.1 Balance of Payments Summary . . . . . . . . . . . . . . . . . . 803.2 Current Account: Services and Transfers . . . . . . . . . . . . 813.2a Current Account: Transfers . . . . . . . . . . . . . . . . . . 823.3 Foreign Exchange Reserves . . . . . . . . . . . . . . . . . . . 833.4 Trade Indexes . . . . . . . . . . . . . . . . . . . . . . . . . 84
Exports3.5 Exports by Commodity Groups . . . . . . . . . . . . . . . . . . 853.6 Volume and Unit Value of Principal Commodity Exports . . . . . . 863.7 Nontraditional Manufactured Exports . . . . . . . . . . . . . . 873.8 Principal Export Markets . . . . . . . . . . . . . . . . . . . . 88
Imports3.9 Imports by Commodity Groups . . . . . . . . . . . . . . . . . . 893.10 Imports by End-Use . . . . . .903.11 Imports of Capital Goods by Sector .. 913.12 Imports of Petroleum and Coal . . . . . . . . . . . . . . . . 923.13 Principal Sources of Imports . . . . . . . . . . . . . . . . . . 93

- 64 -
Table No. Page No.
4. EXTERNAL DEBT
4.1 External Debt Outstanding and Disbursed at End-Yearby Maturity and Borrower . . . . . . . . . . . . . . . . . . . 94
4.2 External Medium- and Long-Term Debt Transactions,Classified by Type of Borrower . . . . . . . . . . . . . . . . 95
4.3 External Medium- and Long-Term Loan Commitments,Classified by Type of Borrower . . . . . . . . . . . . . . . . 96
5. PUBLIC FINANCE
National Government Finances5.1 Cash Operations of the National Government . . . . . . . . . . . 975.2 Estimates of (Cumulative) Revenues from New National
Government I'ax Measures in 1980 and 1981 . . . . . . . . . . . 985.3 National Government Expenditures by Sector . . . . . . . . . . . 995.3a National Government Contributions and Transfers to Other
Public Sector Units, by Sector . . . . . . . . . . . . . . . . 1005.3b National Government Expenditures on its own Account, by Sector . 1015.4 National Government Equity Contributions to Government
Financial Institutions and Corporations (Obligations Basis). . 1025.4a National Government Equity Contributions to Government Financial
Institutions and Corporations (Cash Basis) . . . . . . . . . . 1035.5 Distribution of National Government Cash Balances . . . . . . . 104
Local Government Finances5.6 Consolidated Revenues and Expenditures of Local Governments . . 105
Government Corporation Finances5.7 Level and Finanacing of Capital Investment of Major Government
Corporations .... . . . . . . . . . . . . . . . . . . . . . 106
Consolidated Public Sector Finances5.8 Government Expenditures and Revenues as Percent of GNP . . . . . 1075.9 Structure of Piblic Expenditures . . . . . . . . . . . . . . . . 1085.10 Public Investment and Public Savings . . . . . . . . . . . . . 1105.11 Consolidated Public Expenditures by Sector . . . . . . . . . . . 1ll

- 65 -
Table No. Page No.
6. MONEY AND CREDIT
6.1 The M4onetary System at Year's End . . . . . . . . . . . . . 1126.2 Reserve Money at Year's End . .. . . . . . . . . . . . . . 1136.3 Total Loans and Investments Outstanding by Institution . . 1146.4 Total Assets of the Financial System. . . . . . . . . . . . 1156.5 Selected Interest Rates . . . . . . . . . . . . . . . . . 116
7. AGRICULTURE
7.1 Coconuts: Area, Production, Yield and Disposition. . . . . 1177.2 Sugar; Area, Yield, Extraction Rate, Production and
Exports . . . . . . .... . .... . . .... . .... . ... . . .. 1187.3 Rice Supply and Disappearance . . . . . . . . . . . 1197.4 Corn Supply and Disappearance . . .. . . . . . . . . . . 1207.5 Minor Crops: Harvested Area, Production and Yields . . . . 1217.6 Production of Selected Livestock and Fishery Product . . . 1227.7 Forestry Products: Production and Exports. . . . . . . . . 1237.8 Gross Value Added in Agriculture, Fishery and Forestry
by Subsector in Current Prices. . . . . . . . . . . . . . 1247.9 Gross Value Added in Agriculture, Fishery and Forestry
by Subsector at Constant 1972 Prices . . . . . . . . . . 1257.10 Agrarian Reform Program: Operation Land Transfer
at End-Year . . . . . . . . . . . . .. . . . . 1267.11 Selected Agricultural Prices. . . . . . . . . . . . . . . . 1277.12 Support Prices for Palay and Corn Grains. . . . . . . . . . 1287.13 Selling Prices of Rice and Corn at NFA Outlets . . . . . . 1297.14 Procurement and Distribution of Palay and Corn by NFA . . . 1307.15 Average Import Price of Selected Fertilizers . . . . . . . 1317.16 Authorized Ex-Warehouse Prices of Selected Fertilizers . . 1327.17 Fertilizer Consumption, 1970-80 . . . . . . . . . . . . . . 1337.18 Terms of Trade of the Agricultural and Food Sectors . . . . 134
8. MINING AND MANUFACTURING
8.1 Mining Production, Volume of Major Products . . . . . . . . 1358.2 Major Mining Production, Value in Current Prices . . . . . 1368.3 Gross Value Added in Manufacturing by Industry Group
at Current Prices .... ... . . . . . . . . . . . . . . 1378.4 Gross Value Added in Manufacturing by Industry Group
at Constant 1972 Prices . . . . . . . . . . . . . . . . . 1388.5 The Eleven Major Industrial Projects: Tentative Project
Schedules, Costs, and Financing Plans . . . . . . . . . . 139

- 66 -
Table No. Page No.
9 . ENERGY
9.1 Sources and Uses of Energy .. .e . .. . .. . .* .. . 1409.2 Energy and Petroleum Consumption .. 1419.3 Electricity Generation by Entity . . . . . . , . . . . , . 1429.4 Selected Petroleum Product Prices . . . . . . . . . . 1439.5 Average Bulk Power Rates of the National Power Corporation. 1449.6 Average Retail Rates of the Manila Electric Company . . .*. . 145(See also Table 3.12, Imports of Petroleum and Coal)
10. SERVICES
10.1 Visitor Arrivals . . . . . . . . . . . . . . . . . . . . . . . 14610.2 Estimated Tourist Receipts . . . . . . . . . .* . . , . . 14710.3 Remittances from Filipino Workers Employed Abroad . . . . . . .L48
11. PRICES AND WAGES
11.1 Consumer Pr:ice Index for the Philippines . . . . . . .. 14911.2 Wholesale Price Indices for Manila . . . . . . . .. . 15011.3 Prices of Price-Controlled Commodities, 1976-81 . . . . . . . L5111.4 Wage Rates 'Index of Laborers in Industrial Establishments
in Manila and Suburbs.. . . ..*.*....... L5211.5 Legislated Miinimum Money and Real Daily Wage Rates . . .. . . L5311.6 Retail Ceiling Prices for Selected Commodities in
Metro Mani.la. . .. . . . . . . . . . . . . . . . . . . . . .L54
12. REGIONAL DATA
12.1 Population by Region . . . . . . . . . . . . . . . .5512.2 Gross Regionval Product at Current Prices . . . . . . . .5612.3 Gross Regional Product at Constant Prices ... . . .. -5712.4 Regional Distribution of NEDA Infrastructure Program . . . .5812.5 Investment and Employment Generation in BOI-Registered
Projects, by Region .. . . . . . . .. . . . . . . . . . .

- 67 -
Table 1.1: POPULATION ESTIMATES OF CENSUS YEARSAND POPULATION PROJECTIONS
IntercensalPopulation growth rate
Year (Millions) /a (% per annum)
Census Years
1948 19.13.0
1960 27.43.0
1970 36.82.8
1975 42.22.7
1980 48.3
Projection Years /b2.4
1985 54.42.0
1990 60.21.7
1995 65.41.3
2000 69.9
/a Mid-year (July 1) estimates. The censuses were actuallyconducted in May, but mid-year estimates are shown forcomparability with the projections.
/b Medium projection, assuming a fertility decline to aNet Reproduction Rate of 1 by the year 2000.
Source: National Census and Statistics Office.

- 68 -
Table 1.2: LABOR FORCE, EMPLOYMENT AND UNEMPLOYMENT
Labor forceSurvey Working age participa- Labor Employ- Unemploy- Unemploy-date population /a tion rate force ment ment ment rate
(Thousands) () ---- (In thousands) (Z)
1970 - Census 20,822 55.5 11,566 10,734 832 7.2
March'1971 20,333 57.7 11,733 11,101 631 5.4May 1971 20,511 59.6 12,223 11,624 599 4.9August 1971 20,886 59.0 12,325 11,680 644 5.2November 1971 21,073 59.8 12,607 11,931 676 5.4
February 1972 21,333 61.7 13,172 12,244 928 7.0May 1972 21,343 61.6 13,140 12,176 964 7.3August 1972 21,423 59.6 12,778 11,983 795 6.2November 1972 21,839 58.0 12,659 11,961 698 5.5
February 1973 21,895 58.7 12,843 12,169 674 5.2May 1973 22,372 58.2 13,016 12,407 609 4.7August 1973 22,926 60.3 13,835 13,107 728 5.3November 1973 23,081 59.9 13,823 13,141 683 4.9
February 1974 23,054 58.4 13,466 12,897 569 4.2May 1974 23,014 60.9 14,024 13,324 700 5.0August 1974 22,961 59.0 13,545 12,975 570 4.2November 1974 22,880 59.3 13,565 13,117 447 3.3
February 1975 23,047 59.0 13,598 13,090 508 3.7August 1975 23,772 60.7 14,435 13,795 639 4.4
August 1976 24,992 61.9 15,459 14,662 798 5.2Third quarter 1976 /b 25,236 59.5 15,017 14,238 779 5.2
First quarter 1977 25,251 63.3 15,989 14,985 1,004 6.3Third quarter 1977 25,787 58.2 15,002 14,334 668 4.5Fourth quarter 1977 26,048 57.6 14,993 14,323 671 4.5
First quarter 1978 26,314 58.5 15,386 14,588 798 5.2Second quarter 1978 26,757 62.6 16,758 15,699 1,059 6.3Third quarter 1978 26,997 62.3 16,812 16,118 694 4.1Fourth quarter 1978 27,403 63.4 17,363 16,668 695 4.0
First quarter 1979 27,466 61.6 16,919 16,124 795 4.7Second quarter 1979 27,770 63.2 17,578 16,769 809 4.6Third quarter 1979 28,067 61.4 17,233 16,544 689 4.0Fourth quarter 1979 28,369 65.0 18,440 17,795 645 3.5
Third quarter 1980 28,677 61.4 17,607 16,657 950 5.4Fourth quarter 1980 28,929 64.1 18,543 17,746 797 4.3
/a Working age population refers to person 15 years of age and older.
/b Prior to and including the survey of August 1976, survey respondents were askedif they had worked during the week prior to the survey. Beginning with the thirdquarter of 1976, respondents were asked if they had worked during the previousquarter.
Source: National Census and Statistics Office.

- 69 -
Table 1.3: EMPLOYMENT BY SECTOR(Thousands of persons)
Agriculture, Electri- Trans., Totalfishery and Manufac- city, gas Construc- comm., and Other ser- employ-forestry Mining turing and water tion Commerce storage vices /a ment
1970 - Census 5,614 51 1,324 33 437 815 496 1,965 10,734
Match 1971 5,287 49 1,398 55 416 1,358 526 2,013 11,101May 1971 5,686 55 1,430 58 465 1,459 517 1,953 11,624August 1971 5,579 66 1,393 57 442 1,536 499 2,107 11,680November 1971 5,874 58 1,409 49 419 1,515 526 2,081 11,931
February 1972 6,294 57 1,446 40 426 1,525 489 1,966 12,244May 1972 6,351 56 1,413 40 454 1,580 477 1,803 12,176August 1972 6,330 54 1,286 43 402 1,458 502 1,909 11,983November 1972 6,378 35 1,293 44 431 1,450 464 1,865 11,961
February 1973 6,397 72 1,327 34 474 1,469 480 1,918 12,169May 1973 6,357 61 1,375 37 518 1,602 503 1,952 12,407August 1973 6,990 5c 1,409 41 401 1,513 538 2,166 13,107November 1973 7,188 51 1,362 37 349 1,499 499 2,155 13,141
February 1974 6,893 52- 1,427 36 355 1,497 503 2,134 12,897May 1974 7,260 43 1,468 44 402 1,550 511 2,047 13,324August 1974 7,005 42 1,355 35 411 1,512 518 2,096 12,975November 1974 7,107 46 1,390 36 400 1,518 489 2,134 13,177
February 1975 6,062 44 1,406 42 417 1,537 525 2,160 13,090May 1975 7,190 54 1,609 46 456 1,591 488 2,361 13,795
August 1976 7,538 56 1,638 46 491 1,812 542 2,540 14,662Third quarter 1976 7,659 81 1,598 51 429 1,397 600 2,422 14,238
First quarter 1977 7,046 91 1,837 72 593 1,851 704 2,791 14,985Third quarter 1977 7,474 52 1,515 42 484 1,355 681 2,731 14,334Fourth quarter 1977 7,308 72 1,561 56 492 1,384 654 2,797 14,323
First quarter 1978 7,315 72 1,665 53 519 1,458 692 2,815 14,598Second quarter 1978 8,054 80 1,755 51 506 1,660 658 2,935 15,699Third quarter 1978 8,422 61 1,743 49 519 1,626 699 .2,999 16,118Fourth quarter 1978 8,702 67 1,916 35 480 1,745 681 3,022 16,668
First quarter 1979 7,643 8,481/b 16,124Second quarter 1979 7,965 8,804/b 16,769Third quarter 1979 7,875 8,6697h 16,544Fourth quarter 1979 8,969 8,R267rb 17,795
Third quarter 1980 8,745 7,912/b 16,657Fourth quarter 1980 9,441 8,3057T 17,746
/a Includes industry not reported.
/b Refers to the nonagriculture sector.
Note: 'Integrated Quarterly Survey of Households" was not conducted for the following quarters: 1976 - Fourth;1977 - Second;1980 - First and
secondSource: National Census and Statistlcs Office.

- 70 -
Table 2.1: EXPENDITURE ON GROSS NATIONAL PRODUCT AT CURRENT PRICES(Billion pesos)
1972 1973 1974 1975 1976 1977 1978 1979r 198)r 1981p
Personal consumption 39.9 48.2 67.2 76.2 87.1 102.6 118.8 144.1 178.0 205.6
General government consumption 5.3 6.2 9.0 10.9 14.0 14.5 16.6 18.2 21.4 24.6
Gross Domestic Capital FornationFixed Capital Formation
ConstructionGoverment 1.0 1.4 2.9 4.4 6.5 8.1 10.3 16.1 16.3 20.0Private 2.6 3.0 4.7 7.3 10.0 11.5 12.1 16.1 21.0 26.0
Total construction 3.5 4.4 7.6 11.7 16.5 19.6 22.4 32.2 37.4 46.0
Durable equipment 5.5 6.6 11.1 16.1 16.3 16.8 20.1 25.2 30.6 33.3
Total fixed capitalformation 8.8 11.0 18.6 27.8 32.8 36.4 42.5 57.4 68.0 79.3
Increase in stocks 2.7 4.4 8.2 7.9 8.3 7.9 9.2 11.4 13.1 14.0
Total capital foramation 11.5 15.4 26.8 35.7 41.1 44.3 51.7 68.8 81.2 93.3
Exports of goods and nonfactorservices 9.9 15.9 22.3 21.3 23.2 29.3 31.6 41.5 54.2 58.5
Imports of goods and nonfactorservices -10.3 -13.4 -25.4 -29.1 -31.8 -34.7 -41.3 -53.1 -68.9 74.0
Statistical discrepancy -0.2 -0.7 -0.3 -0.4 0.3 -0.4 1.2 0.8 0.1 -0.9
Expenditure on gross domesticproduct 56.1 71.8 99.6 114.6 133.9 155.6 178.6 220.4 266.0 307.1
Yet factor income from the restof the world -0.6 -0.2 0.3 -0.3 -1.2 -1.3 -0.5 0.5 -1.S -1.6
Expenditure on gross nationalproduct 55.5 71.6 99.9 114.3 132.7 154.3 178.1 220.9 265.) 305.5
r - Revisedp - Preliminary
Source: NEDA, National Accounts Staff, estimates as of April 16, 1982.
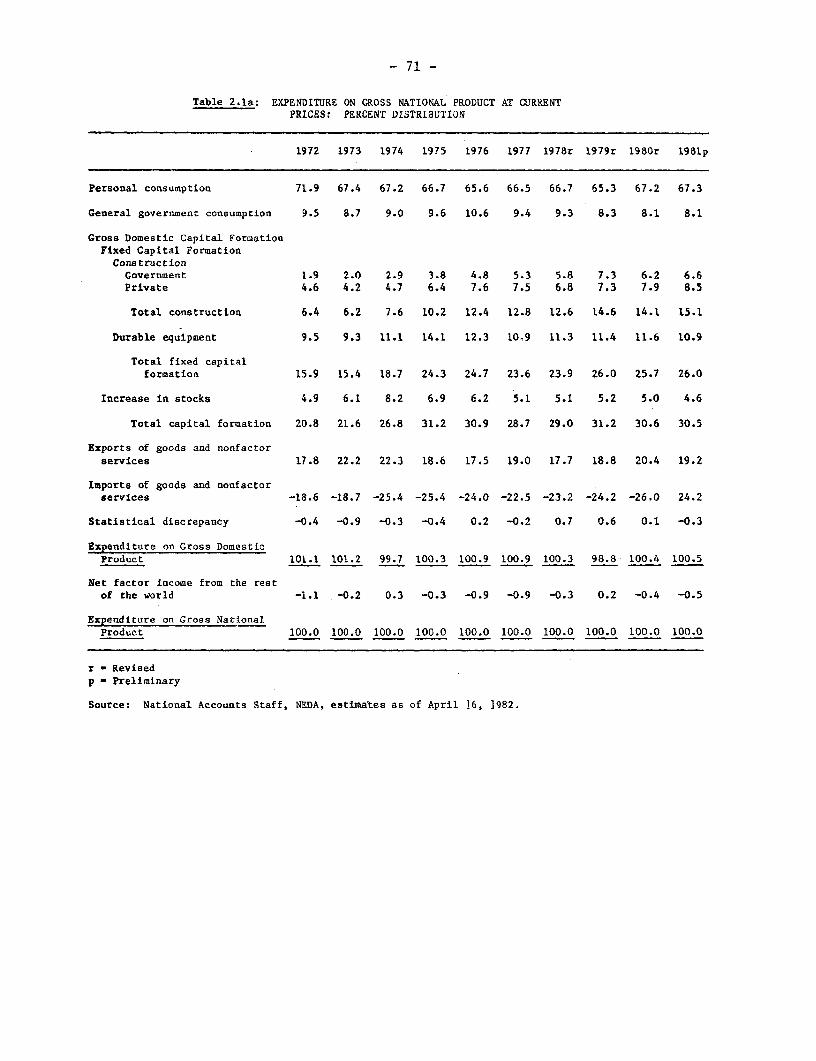
- 71 -
Table 2.1a: EXPENDITURE ON GROSS NATIONAL PRODUCT AT CURRENTPRICES: PERCENT DISTRIBUTION
1972 1973 1974 1975 1976 1977 1978r 1979r 1980r 1981p
Personal consumption 71.9 67.4 67.2 66.7 65.6 66.5 66.7 65.3 67.2 67.3
General government consumption 9.5 8.7 9.0 9.6 10.6 9.4 9.3 8.3 8.1 8.1
Gross Domestic Capital FormationFixed Capital FormationConstructionGovernment 1.9 2.0 2.9 3.8 4.8 5.3 5.8 7.3 6.2 6.6Private 4.6 4.2 4.7 6.4 7.6 7.5 6.8 7.3 7.9 8.5
Total construction 6.4 6.2 7.6 10.2 12.4 12.8 12.6 14.6 14.1 15.1
Durable equipment 9.5 9.3 11.1 14.1 12.3 10.9 11.3 11.4 11.6 10.9
Total fixed capitalformation 15.9 15.4 18.7 24.3 24.7 23.6 23.9 26.0 25.7 26.0
Increase in stocks 4.9 6.1 8.2 6.9 6.2 5.1 5.1 5.2 5.0 4.6
Total capital formation 20.8 21.6 26.8 31.2 30.9 28.7 29.0 31.2 30.6 30.5
Exports of goods and nonfactorservices 17.8 22.2 22.3 18.6 17.5 19.0 17.7 18.8 20.4 19.2
Imports of goods and nonfactorservices -18.6 -18.7 -25.4 -25.4 -24.0 -22.5 -23.2 -24.2 -26.0 24.2
Statistical discrepancy -0.4 -0.9 -0.3 -0.4 0.2 -0.2 0.7 0.6 0.1 -0.3
Expenditure on Gross DomesticProduct 101.1 101.2 99.7 100.3 100.9 100.9 100.3 98.8 100.4 100.5
Net factor iacome from the restof the world -1.1 -0.2 0.3 -0.3 -0.9 -0.9 -0.3 0.2 -0.4 -0.5
Expenditure on Gross NationalProduct 100.0 100.0 100.0 100.0 100.0 100.0 100.0 100.0 100.0 100.0
r - Revised
p - Preliminary
Source: National Accounts Staff, NEDA, estimates as of April ]6, ]982.
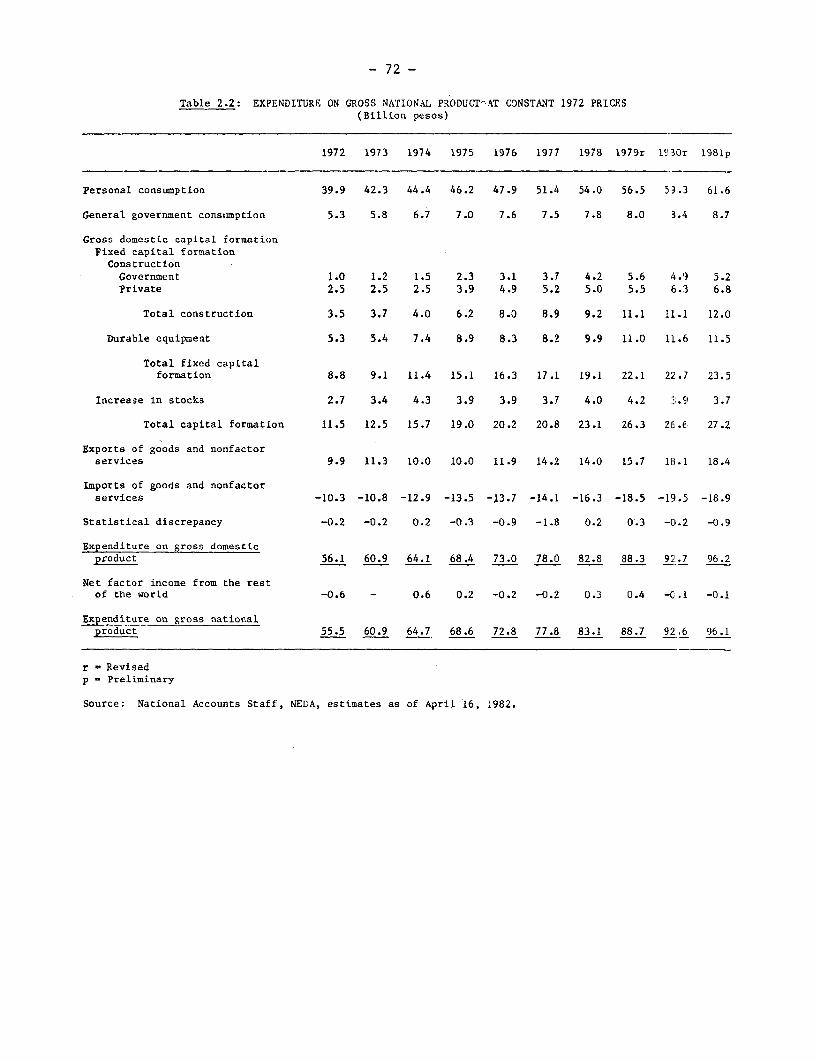
- 72 -
Table 2.2: EXPENDITURE ON GROSS NATIONAL PRODUCT-AT CONSTANT 1972 PRICES(Billion pesos)
1972 1973 1974 1975 1976 1977 1978 1979r 1930r 1981p
personal consumption 39.9 42.3 44.4 46.2 47.9 51.4 54.0 56.5 !).3 61.6
General government consumption 5.3 5.8 6.7 7.0 7.6 7.5 7.8 8.0 3.$ 8.7
Gross domestic capital formationFixed capital formationConstructionGovernment 1.0 1.2 1.5 2.3 3.1 3.7 4.2 5.6 4.9 5.2Private 2.5 2.5 2.5 3.9 4.9 5.2 5.0 5.5 6.3 6.8
Total construction 3.5 3.7 4.0 6.2 8.0 8.9 9.2 11.1 11.1 12.0
Durable equipment 5.3 5.4 7.4 8.9 8.3 8.2 9.9 11.0 11.6 11.5
Total fixed capitalformation 8.8 9.1 11.4 15.1 16.3 17.1 19.1 22.1 22.7 23.5
Increase in stocks 2.7 3.4 4.3 3.9 3.9 3.7 4.0 4.2 9.9 3.7
Total capital formation 11.5 12.5 15.7 19.0 20.2 20.8 23.1 26.3 26.6 27.2
Exports of goods and nonfactorservices 9.9 11.3 10.0 10.0 11.9 14.2 14.0 15.7 18.1 18.4
Imports of goods and nonfactorservices -10.3 -10.8 -12.9 -13.5 -13.7 -14.1 -16.3 -18.5 -19.5 -18.9
Statistical discrepancy -0.2 -0.2 0.2 -0.3 -0.9 -1.8 0.2 0.3 -0.2 -0.9
Expenditure on gross domesticproduct 56.1 60.9 64.1 68.4 73.0 78.0 82.8 88.3 9..7 96.2
Net factor income from the restof the world -0.6 - 0.6 0.2 -0.2 -0.2 0.3 0.4 -C.1 -0.1
Expenditure on gross nationalproduct 55.5 60.9 64.7 68.6 72.8 77.8 83.1 88.7 92.6 96.1
r = Revisedp - Preliminary
Source: National Accounts Staff, NEDA, estimates as of April 16, 1982.
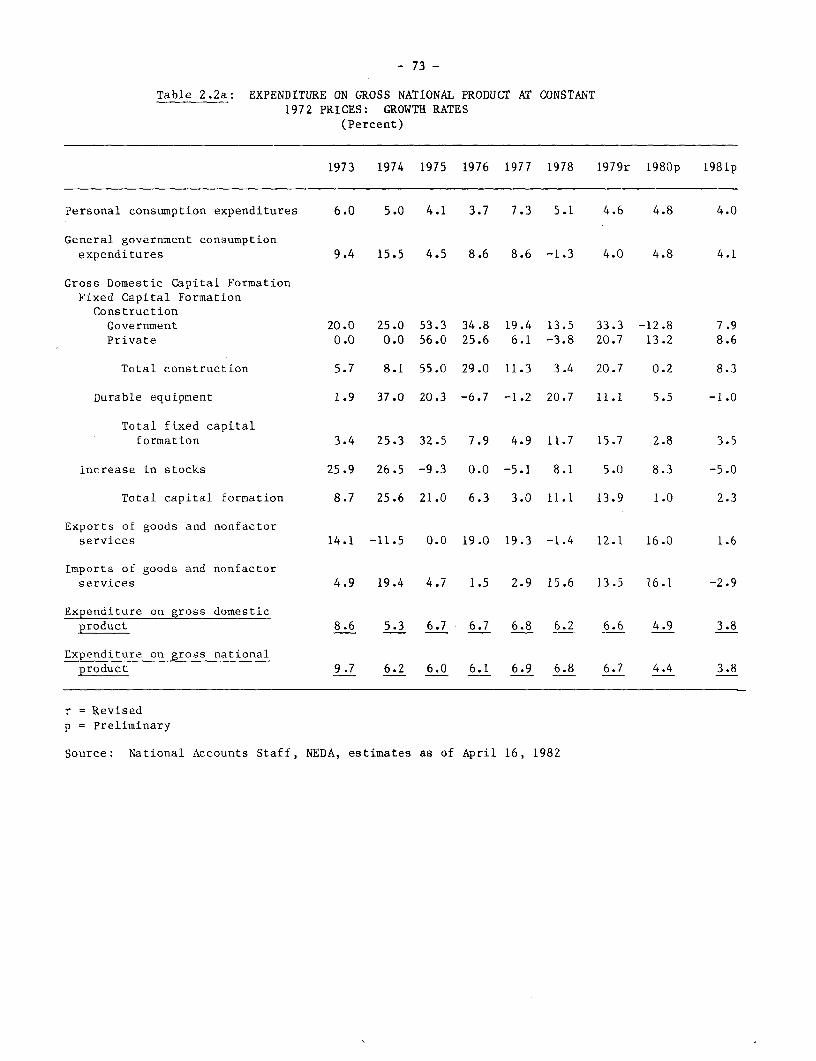
- 73 -
Table 2.2a: EXPENDITURE ON GROSS NATIONAL PRODUCT AT CONSTANT1972 PRICES: GROWTH RATES
(Percent)
1973 1974 1975 1976 1977 1978 1979r 1980p 1981p
Personal consumption expenditures 6.0 5.0 4.1 3.7 7.3 5.1 4.6 4.8 4.0
General government consumptionexpenditures 9.4 15.5 4.5 8.6 8.6 -1.3 4.0 4.8 4.1
Gross Domestic Capital FormationFixed Capital Formation
ConstructionGovernment 20.0 25.0 53.3 34.8 19.4 13.5 33.3 -12.8 7.9Private 0.0 0.0 56.0 25.6 6.1 -3.8 20.7 13.2 8.6
Total construction 5.7 8.1 55.0 29.0 11.3 3.4 20.7 0.2 8.3
Durable equipment 1.9 37.0 20.3 -6.7 -1.2 20.7 11.1 5.5 -1.0
Total fixed capitalformation 3.4 25.3 32.5 7.9 4.9 11.7 15.7 2.8 3.5
Increase in stocks 25.9 26.5 -9.3 0.0 -5.1 8.1 5.0 8.3 -5.0
Total capital formation 8.7 25.6 21.0 6.3 3.0 11.1 13.9 1.0 2.3
Exports of goods and nonfactorservices 14.1 -11.5 0.0 19.0 19.3 -1.4 12.1 16.0 1.6
Imports of goods and nonfactorservices 4.9 19.4 4.7 1.5 2.9 15.6 13.5 16.1 -2.9
Expenditure on gross domesticproduct 8.6 5.3 6.7 6.7 6.8 6.2 6.6 4.9 3.8
Expenditure on gross nationalproduct 9.7 6.2 6.0 6.1 6.9 6.8 6.7 4.4 3.8
r = Revisedp = Preliminary
Source: National Accounts Staff, NEDA, estimates as of April 16, 1982

- 74 -
Table 2.3: EXPENDITURE ON GROSS NATIONAL PRODUCT. IMPLICIT PRICE INDEXES(1972 = 100)
1972 1973 1974 1975 1976 1977 1978 1979r 1980r 19 3 1p
Personal consumption 100.0 113.9 151.4 164.9 182.0 199.6 220.0 254.9 300.3 333.7
General governiment consumption 100.0 106.9 134.3 155.7 185.6 193.3 212.8 228.6 255.8 282.6
Gross domestic capital formation'Fixed capital formation
ConstructionGovernment 100.0 116.7 193.3 191.3 209.6 218.9 245.2 289.1 335.9 381.8Private 100.0 120.0 188.0 187.2 204.1 221.2 242.0 290.9 336.0 382.1
Total construction 100.0 118.0 190.0 188.7 206.2 220.2 243.5 290.0 336.0 381.8
Durable equipment 100.0 122.2 150.0 180.9 196.3 204.9 203.0 229.5 263.7 289.4
Total fixed capital formation 100.0 120.9 163.2 184.1 200.8 212.9 222.5 259.8 299.0 336.8
Increase in stocks 100.0 125.7 190.7 202.6 212.0 213.5 230.0 269.5 340.0 380.0
Total capital formation 100.0 123.2 170.7 187.9 203.0 213.0 223.8 '261.4 305.0 342.6
Exports of goods and nonfactorservices 100.0 140.7 223.0 213.0 194.9 206.3 225.7 264.9 298.6 317.7
Imports of goods and nonfactorservices 100.0 124.1 196.9 215.6 232.8 246.1 253.4 287.8 354.4 392.3
Expenditu re on gross domesticproduct 100.0 118.5 156.6 167.5 183.4 199.5 215.7 249.4 286.9 319.3
Expenditure on gross nationalproduct 100.0 117.6 154.4 166.6 182.3 198.3 '214.3 248.9 286.2 318.0
r = Revisedp = Preliminary
Source: National Accounts Staff, NEDA, estimates as of April 16, 1982.

- 75 -
Table 2.4: INDUSTRIAL ORIGIN OF GROSS DOMESTIC PRODUCT AT CURRENT PRICES(Billion pesos)
1972 1973 1974 1975 1976 1977 1978r 1979r 1980r 1981p
Agriculture, fishery andforestry 16.0 21.1 29.4 33.0 37.3 41.7 47.3 55.5 61.7 69.2
Industrial Sector
Mining & quarrying 1.4 2.4 3.1 2.0 2.1 2.5 3.4 5.8 8.1 9.7
Manufacturing 13.4 17.7 24.6 28.5 32.5 39.3 44.4 54.0 66.0 75.2
Construction 2.2 2.7 4.7 7.1 9.8 11.4 12.5 17.8 21.3 26.2
Electricity, gas, water 0.5 0.6 0.9 1.1 1.4 1.4 1.7 2.1 2.8 3.3
Total industry 17.5 23.4 33.3 38.7 45.8 54.6 62.0 79.7 98.2 114.4
Service Sector
Transport, communi-cation & storage 2.4 2.9 3.7 4.8 6.0 8.5 9.9 12.4 16.4 19.6
Commerce 12.7 15.8 22.4 25.3 29.4 34.0 40.0 50.1 62.6 72.4
Other services 7.5 8.6 10.8 12.8 15.4 16.8 19.4 22.7 27.1 31.5
Total services 22.6 27.3 36.9 42.9 50.8 59.4 69.3 85.2 106.1 123.5
GDP at market prices 56.1 71.8 99.6 114.6 133.9 155.6 178.6 220.4 266.0 307.1
Net factor income fromthe rest of the world -0.6 -0.2 0.3 -0.3 -1.2 -1.3 -0.5 0.5 -1.0 -1.6
GNP at market prices 55.5 71.6 99.9 114.3 132.7 154.3 178.1 220.9 265.0 305.4
r = Revisedp = Preliminary
Source: National Accounts Staff, NEDA, estimates as of April 16, 1982.

- 76 -
Table 2.4a: INDUSTRIAL ORIGIN OF GROSS DOMESTIC PRODUCT ATCURRENT PRICES: PERCENT DISTRIBUTION
1972 1973 1974 1975 1976 1977 1978r 1979r 1980r 1981p
Agriculture, fishery andforestry 28.5 29.4 29.5 28.8 27.9 26.8 26.5 25.2 23.2 22.5
Industrial Sector
Mining & quarrying 2.5 3.4 3.1 1.7 1.6 1.6 1.9 2.6 3.0 3.2
Manufacturing 23.9 24.7 24.7 24.9 24.3 25.3 24.9 24.5 24.8 24.5
Construction 3.9 3.8 4.7 6.2 7.3 7.3 7.0 8.1 8.0 8.5
Electricity, gas, water 0.9 0.8 0.9 0.9 0.9 0.9 1.0 1.0 1.0 1.1
Total industry 31.1 32.7 33.5 33.7 34.1 35.1 34.7 36.2 36.9 37.2
Service Sector
Transportation, commu-nication & storage 4.3 4.1 3.7 4.2 4.5 5.5 5.5 5.6 6.2 E.4
Commerce 22.6 22.0 22.5 22.1 22.0 21.9 22.4 22.7 23.5 23.6
Other services 13.4 11.9 10.8 11.2 11.5 10.8 10.9 10.3 10.2 10.3
Total services 40.3 38.0 37.0 37.4 38.0 38.1 38.8 38.6 39.9 40.2
GDP at market price 100.0 100.0 100.0 100.0 100.0 100.0 100.0 100.0 100.0 100.0
r = Revisedp = Preliminary
Source. National Accounts Staff, NEDA.
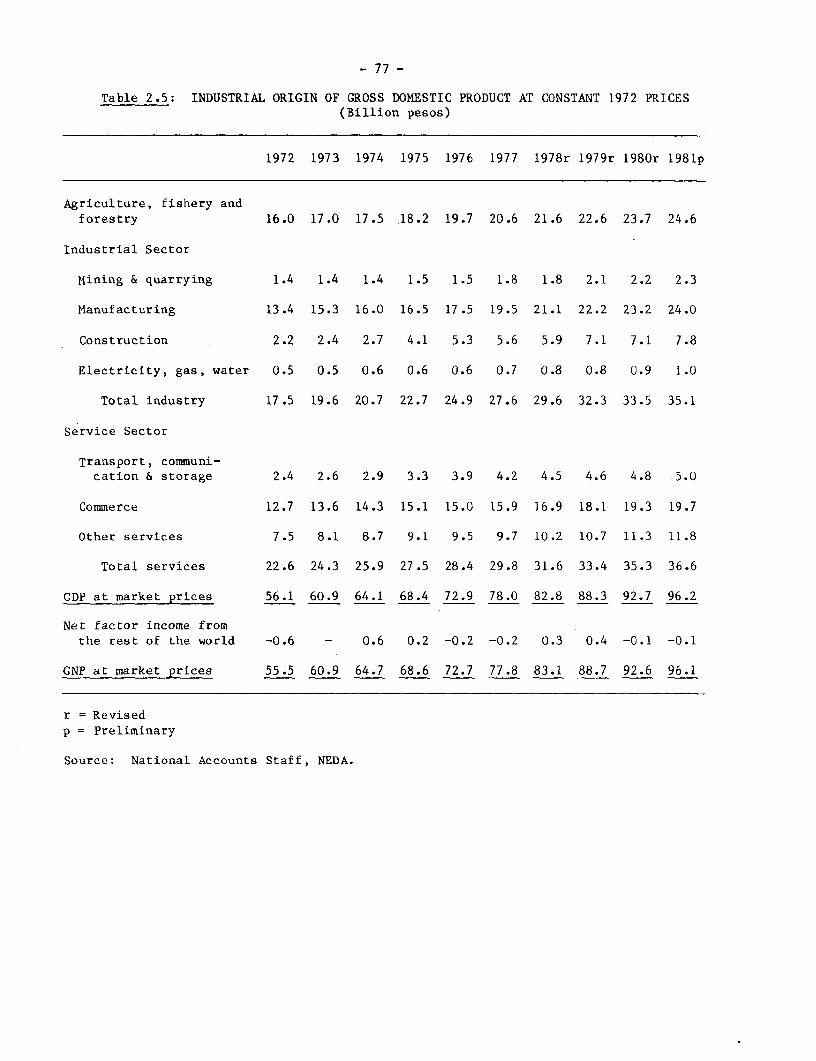
- 77 -
Table 2.5: INDUSTRIAL ORIGIN OF GROSS DOMESTIC PRODUCT AT CONSTANT 1972 PRICES(Billion pesos)
1972 1973 1974 1975 1976 1977 1978r 1979r 1980r 1981p
Agriculture, fishery andforestry 16.0 17.0 17.5 18.2 19.7 20.6 21.6 22.6 23.7 24.6
Industrial Sector
Mining & quarrying 1.4 1.4 1.4 1.5 1.5 1.8 1.8 2.1 2.2 2.3
Manufacturing 13.4 15.3 16.0 16.5 17.5 19.5 21.1 22.2 23.2 24.0
Construction 2.2 2.4 2.7 4.1 5.3 5.6 5.9 7.1 7.1 7.8
Electricity, gas, water 0.5 0.5 0.6 0.6 0.6 0.7 0.8 0.8 0.9 1.0
Total industry 17.5 19.6 20.7 22.7 24.9 27.6 29.6 32.3 33.5 35.1
Service Sector
Transport, communi-cation & storage 2.4 2.6 2.9 3.3 3.9 4.2 4.5 4.6 4.8 5.0
Commerce 12.7 13.6 14.3 15.1 15.0 15.9 16.9 18.1 19.3 19.7
Other services 7.5 8.1 8.7 9.1 9.5 9.7 10.2 10.7 11.3 11.8
Total services 22.6 24.3 25.9 27.5 28.4 29.8 31.6 33.4 35.3 36.6
GDP at market prices 56.1 60.9 64.1 68.4 72.9 78.0 82.8 88.3 92.7 96.2
Net factor income fromthe rest of the world -0.6 - 0.6 0.2 -0.2 -0.2 0.3 0.4 -0.1 -0.1
GNP at market prices 55.5 60.9 64.7 68.6 72.7 77.8 83.1 88.7 92.6 96.1
r = Revisedp = Preliminary
Source: National Accounts Staff, NEDA.
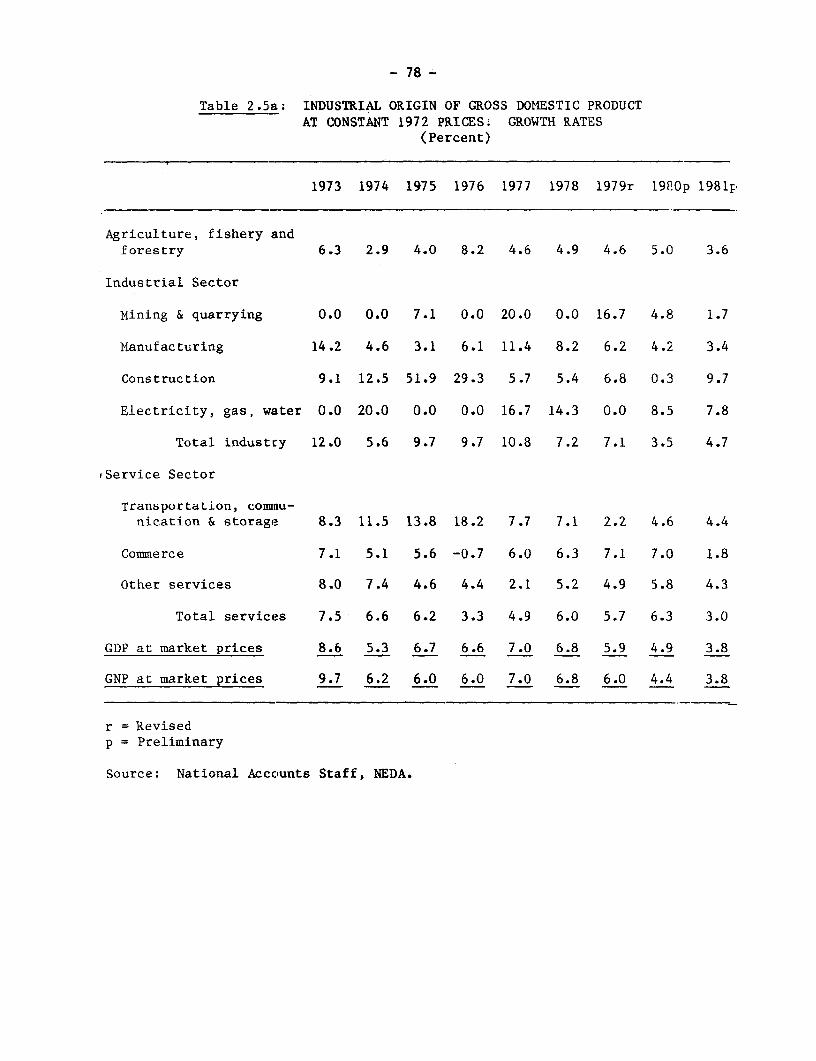
- 78 -
Table 2.5a: INDUSTRIAL ORIGIN OF GROSS DOMESTIC PRODUCTAT CONSTANT 1972 PRICES: GROWTH RATES
(Percent)
1973 1974 1975 1976 1977 1978 1979r 1920p 1981p
Agriculture, fishery andforestry 6.3 2.9 4.0 8.2 4.6 4.9 4.6 5.0 3.6
Industrial Sector
Mining & quarrying 0.0 0.0 7.1 0.0 20.0 0.0 16.7 4.8 1.7
Manufacturing 14.2 4.6 3.1 6.1 11.4 8.2 6.2 4.2 3.4
Construction 9.1 12.5 51.9 29.3 5.7 5.4 6.8 0.3 9.7
Electricity, gas, water 0.0 20.0 0.0 0.0 16.7 14.3 0.0 8.5 7.8
Total industry 12.0 5.6 9.7 9.7 10.8 7.2 7.1 3.5 4.7
iService Sector
Transportation, comiau-nication & storage 8.3 11.5 13.8 18.2 7.7 7.1 2.2 4.6 4.4
Commerce 7.1 5.1 5.6 -0.7 6.0 6.3 7.1 7.0 1.8
other services 8.0 7.4 4.6 4.4 2.1 5.2 4.9 5.8 4.3
Total services 7.5 6.6 6.2 3.3 4.9 6.0 5.7 6.3 3.0
GDP at market prices 8.6 5.3 6.7 6.6 7.0 6.8 5.9 4.9 3.8
GNP at market prices 9.7 6.2 6.0 6.0 7.0 6.8 6.0 4.4 3.8
r = Revisedp = Preliminary
Source: National Accounts Staff, NEDA.
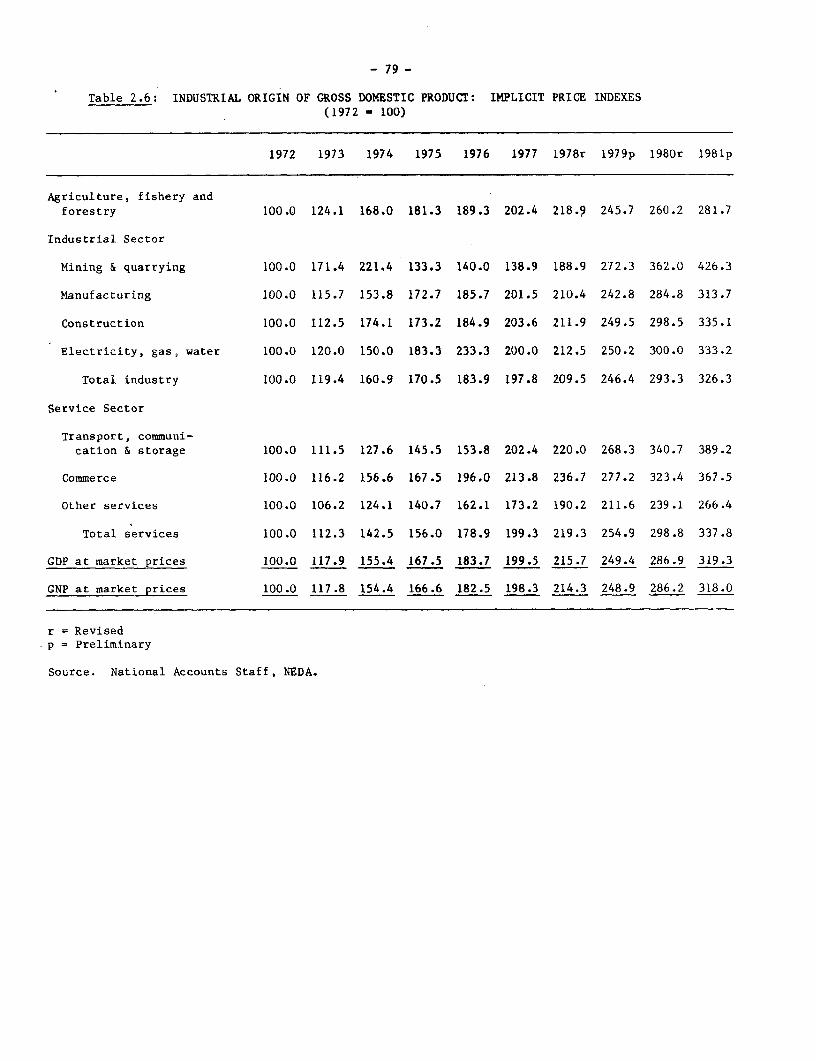
- 79 -
Table 2.6: INDUSTRIAL ORIGIN OF GROSS DOMESTIC PRODUCT: IMPLICIT PRICE INDEXES(1972 = 100)
1972 1973 1974 1975 1976 1977 1978r 1979p 1980r 1981p
Agriculture, fishery andforestry 100.0 124.1 168.0 181.3 189.3 202.4 218.9 245.7 260.2 281.7
Industrial Sector
Mining & quarrying 100.0 171.4 221.4 133.3 140.0 138.9 188.9 272.3 362.0 426.3
Manufacturing 100.0 115.7 153.8 172.7 185.7 201.5 210.4 242.8 284.8 313.7
Construction 100.0 112.5 174.1 173.2 184.9 203.6 211.9 249.5 298.5 335.1
Electricity, gas, water 100.0 120.0 150.0 183.3 233.3 200.0 212.5 250.2 300.0 333.2
Total industry 100.0 119.4 160.9 170.5 183.9 197.8 209.5 246.4 293.3 326.3
Service Sector
Transport, communi-cation & storage 100.0 111.5 127.6 145.5 153.8 202.4 220.0 268.3 340.7 389.2
Commerce 100.0 116.2 156.6 167.5 196.0 213.8 236.7 277.2 323.4 367.5
Other services 100.0 106.2 124.1 140.7 162.1 173.2 190.2 211.6 239.1 266.4
Total services 100.0 112.3 142.5 156.0 178.9 199.3 219.3 254.9 298.8 337.8
GDP at market prices 100.0 117.9 155.4 167.5 183.7 199.5 215.7 249.4 286.9 319.3
GNP at market prices 100.0 117.8 154.4 166.6 182.5 198.3 214.3 248.9 286.2 318.0
r = Revisedp = Preliminary
Source. National Accounts Staff, NEDA.

- 80 -
Table 3.1: BALANCE OF PAYMENTS SUMMARY(US$ Million)
1972 1973 1974 1975 1976 1977 1978 1979 1980 1981
Current Account
Merchandise trade (net) -124 290 -418 -1,165 -1,060 -764 -1,307 -1,541 -1,939 -2,23DExports 1,106 1,886 2,725 2,294 2,574 3,151 3,425 4,601 5,738 5,722Imports 1,230 1,596 3,143 3,459 3,634 3,915 4,743 6,142 7,727 7,952
Services (net) -55 - -34 -45 -259 -248 -178 -390 -546 -545Receipts T 6 39 1g 37 -- 87T i 1,413 15736 2 S 2,555Payments 402 639 868 952 1,130 1,333 1,591 1,966 2,621 3,103
Private transfers (net) 152 169 201 252 237 240 283 229 300 325Receipts 158 172 202 255 239 7i- 286 23T -30 j23Payments 6 3 1 3 2 4 3 5 5 3
Official transfers (net) 36 77 75 66 32 20 29 126 134 14'7Receipts 40 84 82 74 41 29 36 135 146 15'Payments 4 7 7 8 9 9 7 9 12 10
Current account balance 9 536 -176 -892 -1,050 -752 -1,173 -1,576 -2,051 -2,301
Capital Account
Direct investment (net) -22 64 28 125 144 216 171 99 45 40'
Private MLT loan capital (ael:) -17 -5 32 126 336 101 209 163 496Disbursements 137 196 76 331 338 -?74 905 90 7Repayments 154 201 244 205 202 375 696 627 374 1,332/b
=2,072Public MLT loan capital (net)l 157 76 112 231 704 561 682 988 536 74CDisbursements i35 T14 180 346 869 766 945 1,320 709Repayments 78 108 68 115 165 205 263 332 173
Short-term capital (net) /a 56 74 231 102 -96 312 168 -49 784 188Inflows 579 657 1,138 17283 1,381 2,475 3,442 4,231 7,458 8,767Outflows 523 583 907 1,181 1,477 2,163 3,274 4,280 6,514 8,579
Capital account balance 174 209 403 584 1,088 1,190 1,230 1,201 1,361 1,927
Errors and omissions -112 -81 -117 -213 -200 -274 -144 -264 - 343 -611Allocation of SDRs 16 - - - - - - 28 2' 27M:onetization of gold 7 - - - - - 32 41 L2;3 400
Overall Balance 94 664 110 -521 -161 164 -54 -570 -W8:L -560
/a- Original maturity up to and including one year.T7 Total medium- and long-term loans.
Source: Central Bank of the Philippines.

- 81 -
Table 3.2: CURRENT ACCOUNT: SERVICES(In millions of US$)
Item 1972 1973 1974 1975 1976 1977 1978 1979 1980 1981
Receipts
Freight and insurance 14 19 24 23 32 94 82 91 100 110Other transportation 21 31 47 67 67 63 57 71 106 138Travel 122 77 58 110 93 145 210 238 320 344Direct investment income. - 5 11 12 2 2 2 13 5 5Interest on loans 23 60 160 158 125 138 179 200 307 406Public sector /a n.a. n.a. n.a. n.a. 108 91 150 162 236 n.a.Private sector n.a. n.a. n.a. n.a. 17 47 29 38 71 n.a.
Government (n.i.e.) 116 185 156 181 204 190 204 193 233 259Military services 41 42 48 50 53 56 71 71 85 103Other 75 143 109 131 151 134 133 122 148 156
Personal income 5 55 118 103 III 213 291 365 421 546Other 46 207 260 245 237 240 388 405 583 747
Total 347 639 834 907 871 1,085 1,413 1,576 2,075 2,555
Payments
Freight and insurance 109 193 324 324 320 356 411 471 568 540Other transportation 13 11 18 30 37 73 91 170 192 248Travel 24 16 17 27 28 35 51 74 106 126Direct investment income 33 60 80 73 68 158 85 95 159 128Interest on loans 115 119 145 223 313 224 304 591 846 1,261Public sector n.a. n.a. n.a. n.a. 119 110 247 320 243 n.a.Private sector n.a. n.a. n.a. n.a. 139 192 193 271 603 n.a.
Government (n.i.e.) 32 47 62 75 80 62 104 32 121 110Other services 76 193 220 200 284 425 408 473 629 687
Total 402 639 868 952 1,130 1,333 1,591 1,966 2,621 3,100
n.a. not available.
/a Chiefly interest on reserves.
Source: Central Bank of the Philippines.
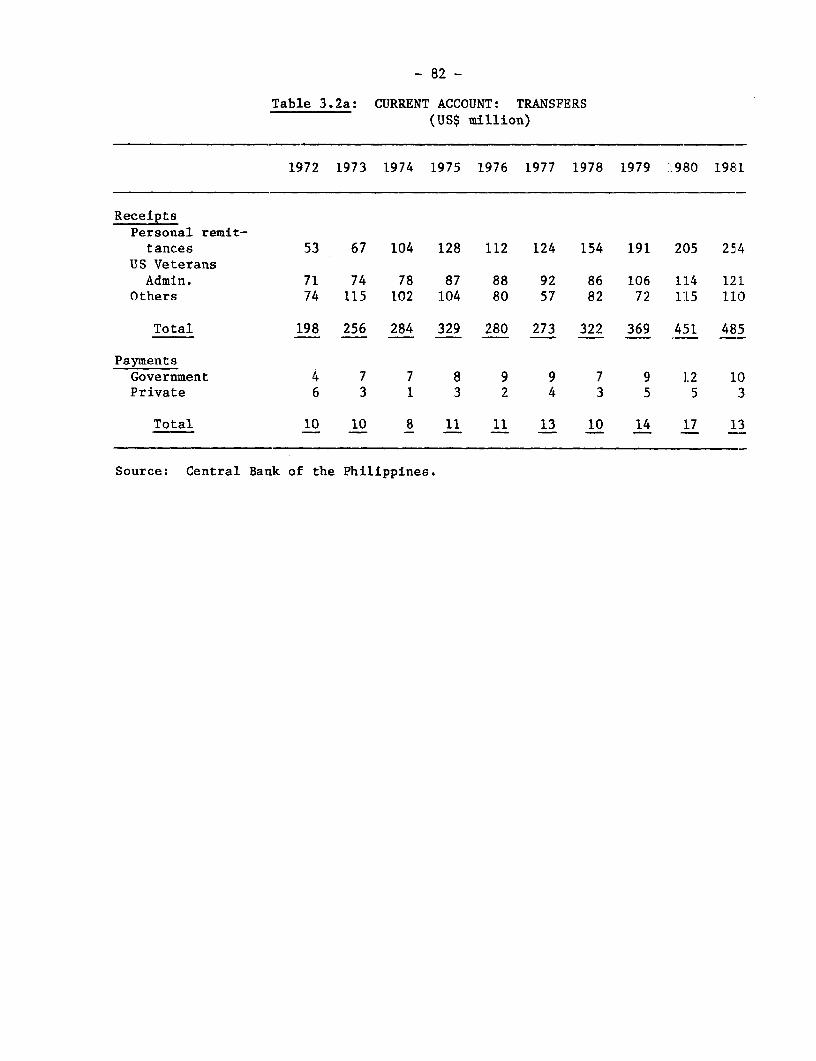
- 82 -
Table 3.2a: CURRENT ACCOUNT: TRANSFERS(US$ million)
1972 1973 1974 1975 1976 1977 1978 1979 1L980 1981
ReceiptsPersonal remit-tances 53 67 104 128 112 124 154 191 205 254
US VeteransAdmin. 71 74 78 87 88 92 86 106 114 121
Others 74 115 102 104 80 57 82 72 115 110
Total 198 256 284 329 280 273 322 369 451 485
PaymentsGovernment 4 7 7 8 9 9 7 9 1.2 10Private 6 3 1 3 2 4 3 5 5 3
Total 10 10 8 11 11 13 10 14 17 13
Source: Central Bank of the Philippines.
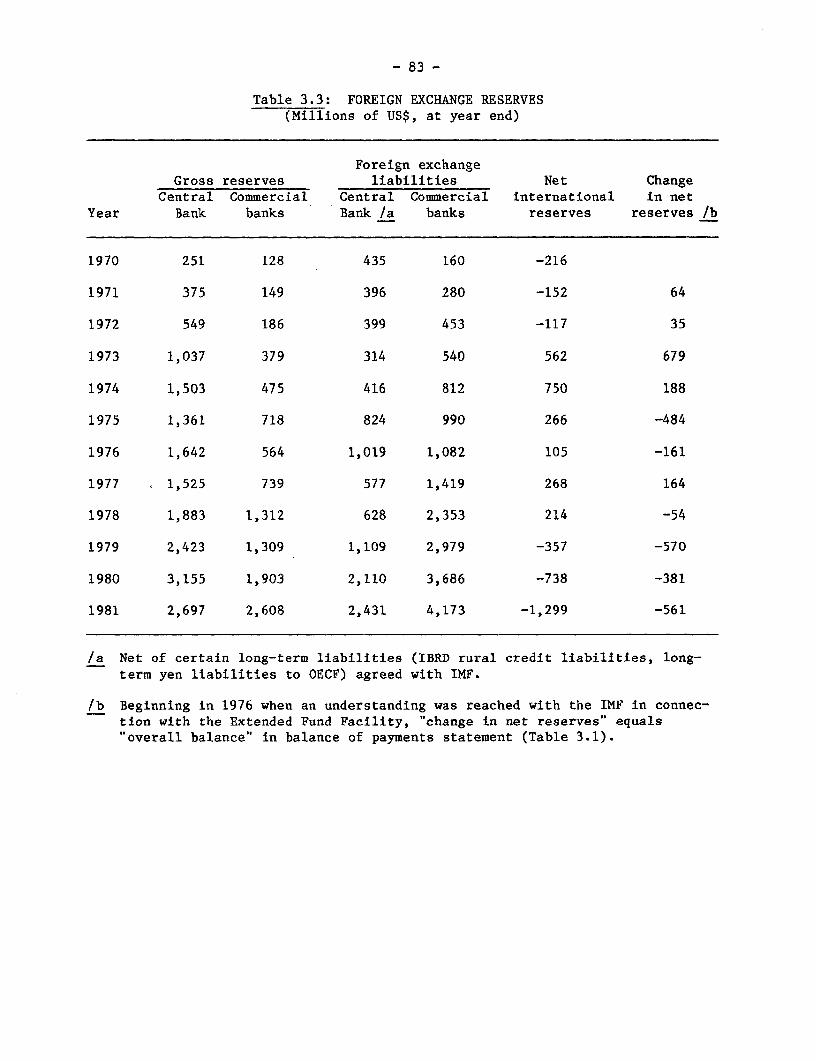
- 83 -
Table 3.3: FOREIGN EXCHANGE RESERVES(Millions of US$, at year end)
Foreign exchangeGross reserves liabilities Net Change
Central Commercial Central Commercial international in netYear Bank banks Bank /a banks reserves reserves /b
1970 251 128 435 160 -216
1971 375 149 396 280 -152 64
1972 549 186 399 453 -117 35
1973 1,037 379 314 540 562 679
1974 1,503 475 416 812 750 188
1975 1,361 718 824 990 266 -484
1976 1,642 564 1,019 1,082 105 -161
1977 1,525 739 577 1,419 268 164
1978 1,883 1,312 628 2,353 214 -54
1979 2,423 1,309 1,109 2,979 -357 -570
1980 3,155 1,903 2,110 3,686 -738 -381
1981 2,697 2,608 2,431 4,173 -1,299 -561
/a Net of certain long-term liabilities (IBRD rural credit liabilities, long-term yen liabilities to OECF) agreed with IMF.
/b Beginning in 1976 when an understanding was reached with the IMF in connec-tion with the Extended Fund Facility, "change in net reserves" equals"overall balance" in balance of payments statement (Table 3.1).
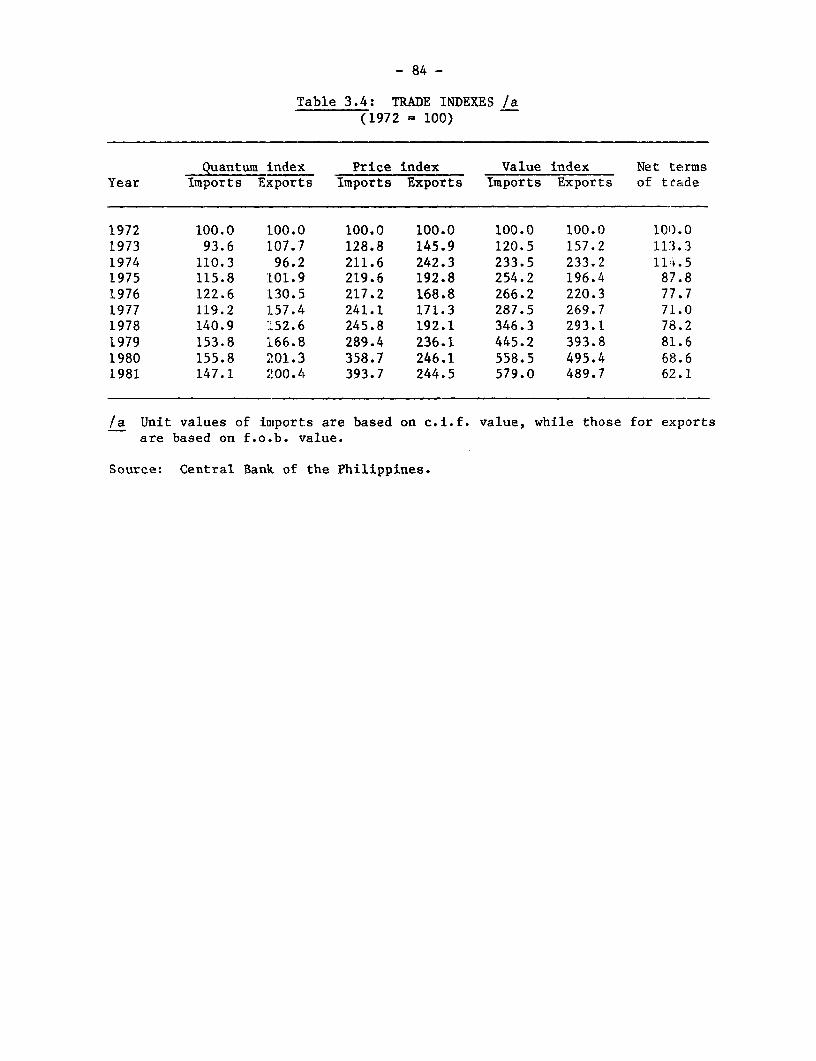
- 84 -
Table 3.4: TRADE INDEXES /a(1972 = 100)
Quantum index Price index Value index Net termsYear Imports Exports Imports Exports Imports Exports of tratde
1972 100.0 100.0 100.0 100.0 100.0 100.0 100.01973 93.6 107.7 128.8 145.9 120.5 157.2 113.31974 110.3 96.2 211.6 242.3 233.5 233.2 114.51975 115.8 101.9 219.6 192.8 254.2 196.4 87.81976 122.6 130.5 217.2 168.8 266.2 220.3 77.71977 119.2 :L57.4 241.1 171.3 287.5 269.7 71.01978 140.9 152.6 245.8 192.1 346.3 293.1 78.21979 153.8 3166.8 289.4 236.1 445.2 393.8 81.61980 155.8 201.3 358.7 246.1 558.5 495.4 68.61981 147.1 200.4 393.7 244.5 579.0 489.7 62.1
/a Unit values of imports are based on c.i.f. value, while those for exportsare based on f.o.b. value.
Source: Central Bank of the Philippines.
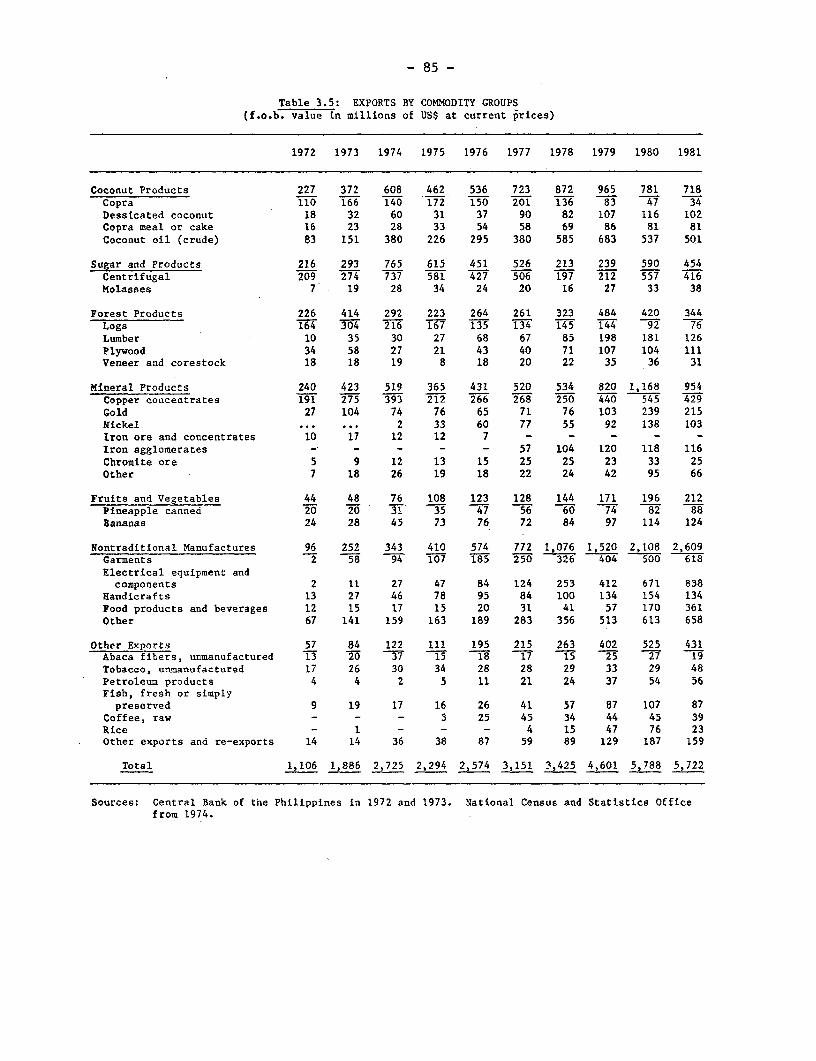
- 85 -
Table 3.5: EXPORTS BY COMMODITY GROUPS(f.o.b. value in millions of US$ at current prices)
1972 1973 1974 1975 1976 1977 1978 1979 1980 1981
Coconut Products 227 372 608 462 536 723 872 965 781 718Copra 110 166 140 172 150 201 136 83 47 34Dessicated coconut 18 32 60 31 37 90 82 107 116 102Copra meal or cake 16 23 28 33 54 58 69 86 81 81Coconut oil (crude) 83 151 380 226 295 380 585 683 537 501
Sugar and Products 216 293 765 615 451 526 213 239 590 454Centrifugal 209 274 7 377 3 7 06 197 22 57 16Molasses 7 19 28 34 24 20 16 27 33 38
Forest Products 226 414 292 223 264 261 323 484 420 344Logs 164 I 216 167 1135 3 1445 Tf 4 92 76Lumber 10 35 30 27 68 67 85 198 181 126Plywood 34 58. 27 21 43 40 71 107 104 111Veneer and corestock 18 18 19 8 18 20 22 35 36 31
Mineral Products 240 423 519 365 431 520 534 820 1,168 954Copper concentrates 191 275 93 212 266 268 250 440 545 429Gold 27 104 74 76 65 71 76 103 239 215Nickel ... ... 2 33 60 77 55 92 138 103Iron ore and concentrates 10 17 12 12 7 - - - - -
Iron agglomerates - - - - - 57 104 120 118 116Chromite ore 5 9 12 13 15 25 25 23 33 25Other 7 18 26 19 18 22 24 42 95 66
Fruits and Vegetables 44 48 76 108 123 128 144 171 196 212Pineapple canned 20 20 31 35 47 56 60 74 82 88Bananas 24 28 45 73 76 72 84 97 114 124
Nontraditional Manufactures 96 252 343 410 574 772 1,076 1,520 2,108 2,609Garments 2 58 94 107 185 250 326 404 500 618
Electrical equipment andcomponents 2 11 27 47 84 124 253 412 671 838
Handicrafts 13 27 46 78 95 84 100 134 154 134Food products and beverages 12 15 17 15 20 31 41 57 170 361Other 67 141 159 163 189 283 356 513 613 658
Other Exports 57 84 122 111 195 215 263 402 525 431Abaca fibers, unmanufactured 13 20 -7 15 18 17 15 25 27 19Tobacco, unmanufactured 17 26 30 34 28 28 29 33 29 48Petroleum products 4 4 2 5 11 21 24 37 54 56Fish, fresh or simplypreserved 9 19 17 16 26 41 57 87 107 87
Coffee, raw - - - 3 25 45 34 44 45 39Rice - 1 - - - 4 15 47 76 23Other exports and re-exports 14 14 36 38 87 59 89 129 187 159
Total 1,106 1,886 2,725 2,294 2,574 3,151 3,425 4,601 5,788 5,722
Sources: Central Bank of the Philippines in 1972 and 1973. National Census and Statistics Officefrom 1974.

- 86 -
Table 3.6: VOLUME AND UNIT VALUE OF PRINCIPAL COMMODITY EXPORTS
Category 1972 1973 1974 1975 1976 1977 1978 1979 1L980 198l1
Volume ('000 mt)Copra 926 734 268 761 823 635 365 145 121 IC8Coconut oil crude 461 427 415 606 854 714 962 743 8,73 984Dessicated coconut 76 78 64 66 81 98 91 86 87 86Copra meal or cake 352 263 271 303 498 436 535 548 545 620Sugar, centrifugal 1,224 1,470 1,542 972 1,456 2,419 1,124 1,150 1,602 953Pineapple, canned 108 91 125 116 138 154 162 189 187 173Bananas 422 466 663 823 796 693 776 859 923 869
Logs /a 7,126 7,763 4,701 4,595 2,331 2,045 2,210 1,248 715 706Lumber /a 181 427 282 254 493 455 573 915 741 546Plywood7a 431 532 162 157 261 221 361 393 322 37D
Copper concentrates 823 764 830 799 942 1,007 895 1,048 1,140 1,13BGold lb 501 536 521 491 535 513 412 367 420 475Nickel - - 2 7 12 17 13 17 23 13Iron agglomerates - - - - - 2,039 3,335 4,100 4,240 3,631)
Unit Value (US$ per mt)Copra 119 226 522 226 182 316 372 616 389 311Coconut oil crude 180 354 916 373 345 532 608 919 6515 509Dessicated coconut 231 416 944 459 463 919 902 1,247 1,33L 1,179Copra meal or cake 46 86 103 110 110 133 129 156 :149 130Sugar, centrifugal 172 186 478 597 293 210 175 184 248 436Pineapple, canned 181 217 244 298 338 362 370 391 'i39 508Bananas 58 60 69 89 95 105 108 113 :24 143
Logs /c 23 39 46 36 58 65 65 116 1.29 108Lumber /c 58 82 106 142 138 146 149 217 244 230Plywood77c 78 109 161 131 165 184 195 273 ',22 299
Copper concentrates 232 380 473 265 282 266 280 420 478 377Gold /d 54 193 143 156 122 139 184 281 57C0 452Nickel - - 602 4,735 4,914 4,469 4,180 5,327 6,0)9 5,699Iron agglomerates - - - 28 31 29 28 32
/a In thousand cubic meters.T7 In thousand troy ounces.7T Per cubic meter.75 Per troy ounce.
Sources: Central Bank of the Philippines for 1972 and 1973, National Census and Stal:isticsOffice from 1974.
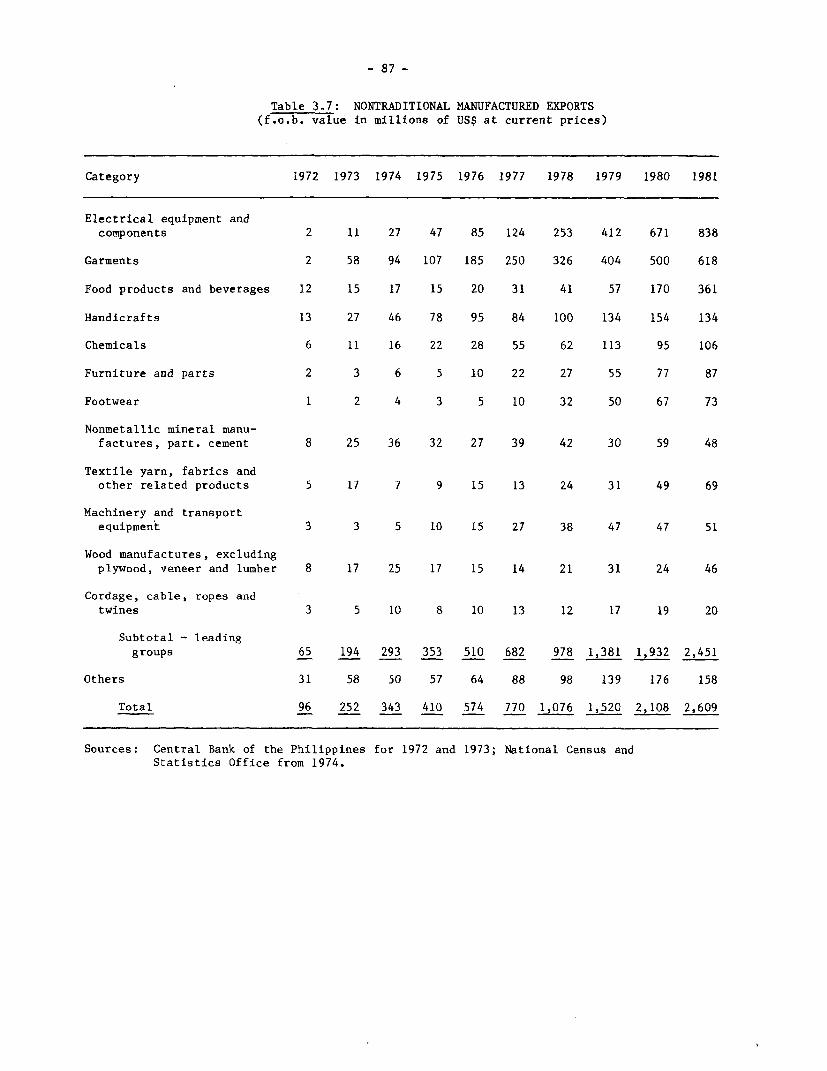
- 87 -
Table 3.7: NONTRADITIONAL MANUFACTURED EXPORTS(f.o.b. value in millions of US$ at current prices)
Category 1972 1973 1974 1975 1976 1977 1978 1979 1980 1981
Electrical equipment andcomponents 2 11 27 47 85 124 253 412 671 838
Garments 2 58 94 107 185 250 326 404 500 618
Food products and beverages 12 15 17 15 20 31 41 57 170 361
Handicrafts 13 27 46 78 95 84 100 134 154 134
Chemicals 6 11 16 22 28 55 62 113 95 106
Furniture and parts 2 3 6 5 10 22 27 55 77 87
Footwear 1 2 4 3 5 10 32 50 67 73
Nonmetallic mineral manu-factures, part. cement 8 25 36 32 27 39 42 30 59 48
Textile yarn, fabrics andother related products 5 17 7 9 15 13 24 31 49 69
Machinery and transportequipment 3 3 5 10 15 27 38 47 47 51
Wood manufactures, excludingplywood, veneer and lumber 8 17 25 17 15 14 21 31 24 46
Cordage, cable, ropes andtwines 3 5 10 8 10 13 12 17 19 20
Subtotal - leadinggroups 65 194 293 353 510 682 978 1,381 1,932 2,451
Others 31 58 50 57 64 88 98 139 176 158
Total 96 252 343 410 574 770 1,076 1,520 2,108 2,609
Sources: Central Bank of the Philippines for 1972 and 1973; National Census andStatistics Office from 1974.
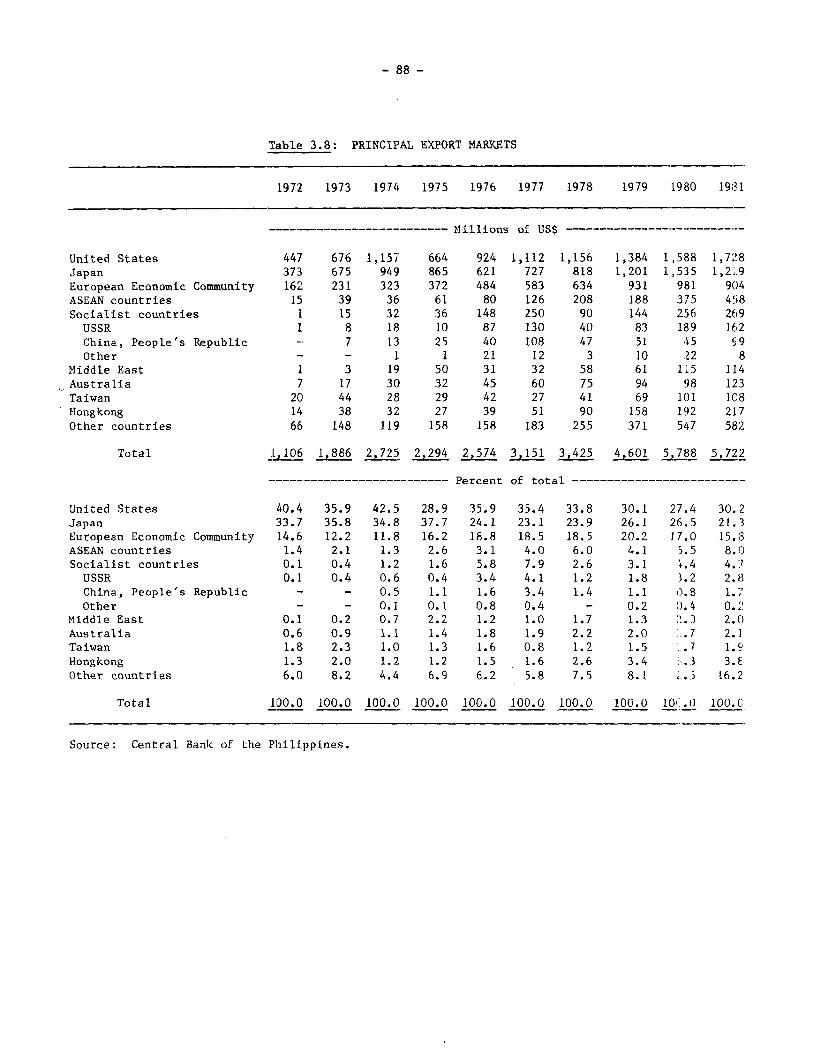
- 88 -
Table 3.8: PRINCIPAL EXPORT MARKETS
1972 1973 1974 1975 1976 1977 1978 1979 1980 19;31
-------------------------- Millions of US$ -…------------------------
United States 447 676 1,157 664 924 1,112 1,156 1,384 1,588 1,728Japan 373 675 949 865 621 727 818 1,201 1,535 1,2.9European Economic Community 162 231 323 372 484 583 634 931 981 904ASEAN countries 15 39 36 61 80 126 208 188 375 458Socialist countries 1 15 32 36 148 250 90 144 256 269
USSR 1 8 18 10 87 130 40 83 189 162China, People's Republic - 7 13 25 40 108 47 51 45 S19Other - - 1 1 21 12 3 10 22 8
Middle East 1 3 19 50 31 32 58 61 115 114Australia 7 17 30 32 45 60 75 94 98 123Taiwan 20 44 28 29 42 27 41 69 1(1 108Hongkong 14 38 32 27 39 51 90 158 192 217Other countries 66 148 119 158 158 183 255 371 547 582
Total 1,106 1,886 2,725 2,294 2,574 3,151 3,425 4,601 5,788 5,722
-------------------------- Percent of total -------------------------
United States 40.4 35.9 42.5 28.9 35.9 35.4 33.8 30.1 27.4 30.2Japan 33.7 35.8 34.8 37.7 24.1 23.1 23.9 26.1 26.5 21.3European Economic Community 14.6 12.2 11.8 16.2 18.8 18.5 18.5 20.2 17.0 15.3ASEAN countries 1.4 2.1 1.3 2.6 3.1 4.0 6.0 4.1 5.5 8.0Socialist countries 0.1 0.4 1.2 1.6 5.8 7.9 2.6 3.1 +.4 4.7
USSR 0.1 0.4 0.6 0.4 3.4 4.1 1.2 1.8 3.2 2.8China, People's Republic - - 0.5 1.1 1.6 3.4 1.4 1.1 0.8 1.;Other - - 0.1 0.1 0.8 0.4 - 0.2 0.4 0.2
Middle East 0.1 0.2 0.7 2.2 1.2 1.0 1.7 1.3 2.D 2.0Australia 0.6 0.9 1.1 1.4 1.8 1.9 2.2 2.0 -. 7 2.]Taiwan 1.8 2.3 1.0 1.3 1.6 0.8 1.2 1.5 .7 1.9Hongkong 1.3 2.0 1.2 1.2 1.5 1.6 2.6 3.4 .3 3.EOther countries 6.0 8.2 4.4 6.9 6.2 5.8 7.5 8.1 ".3 16.2
Total 1J0.0 100.0 100.0 100.0 100.0 100.0 100.0 100.0 10 .(0 100.C
Source: Central Bank of the Philippines.

- 89 -
Table 3.9: IMPORTS BY COMMODITY GROUPS(f.o.b. in millions of USS)
SITCclass Commodity group 1972 1973 1974 1975 1976 1977 1978 1979 1980 1981
O Food & Food Preparations 175 202 310 322 299 299 296 354 492 56502 Dairy products 4K 45 -7r 62 55 iO -60 -96 1 13203 Fish & fish preparations 20 20 32 33 30 22 24 20 26 30041 Wheat 34 49 39 95 113 79 85 106 149 151042 Rice 34 45 79 37 12 5 - - - -
Others 41 43 86 95 89 123 127 132 205 249
1 Beverages & Tobacco 9 10 17 23 35 44 44 48 48 54
2 Crude Materials, Inedible 70 90 145 128 133 189 219 260 269 256263 Cotton 134 6 i;37 30 -76 -a 5- -3266 Synthetic fibers 27 29 53 41 43 55 56 75 62 79
Iron ore under consignment - - - - - 30 45 49 74 60Others 24 31 58 51 53 74 74 100 89 83
3 Mineral Fuels & Lubricants 149 188 653 770 891 993 1,030 1,385 2,248 2,458Coal and coke - - - 2 2 9 15 14? 22 19
321 Petroleum, crude 134 166 573 710 801 859 907 1,115 1,857 2,081Others 15 22 80 58 87 125 108 256 369 358
4 Animal & Vegetable Oils&Fats 4 7 12 7 7 11 14 19 19 18
5 Chemicals 148 218 491 380 352 432 523 670 741 76651 Chemical compounds 48 75 216 T18 T32 TOO TON 249 267 29854 Pharmaceuticals 16 21 36 34 39 43 56 61 69 72
Urea ... ... ... 46 10 29 37 51 89 57
Fertilizer, excl. urea 12 15 84 43 11 14 11 40 50 48Others 72 107 155 149 160 186 216 269 266 291
6 Manufactured GoodsClassified Chiefly byMaterial 214 306 530 457 460 549 703 945 981 882
64 Paper & paper products 35 34 57 31 29 36 53 62 67 6465 Textile yarn & fabrics 25 47 69 66 50 80 88 117 144 158681 Iron & steel 87 115 228 176 194 237 304 438 399 32569 Metal products 23 48 60 93 81 71 107 128 133 148
Others 44 62 116 91 106 125 151 200 244 187
7 Machinery & TransportEquiprent 418 469 795 1,114 1,088 1,022 1,329 1,708 1,860 1,801
71 Nonelectrical machinery 240 296 424 655 625 589 737 935 1,015 94672 Electrical machinery 54 71 106 157 187 138 203 229 312 39273 Transport equipment 124 102 265 302 276 295 389 544 533 463
8 Miscellaneous Manufactures 34 45 61 74 80 97 128 141 200 200Professional scientific,& controlling instruments 16 22 30 36 37 55 71 77 126 128
Other 18 23 31 38 44 42 57 64 74 72
9 Commodities and Transactionsnot Classified Elsewhere 9 61 129 184 288 279 446 612 863 934Materials for manufacturingelectric & electronic equip. - - - 41 91 107 219 351 549 625
Materials for embroidery ormanufacture of garments - - - 58 115 95 121 125 142 188
Other 9 61 129 85 82 77 116 136 172 121
Total imports 1,230 1,596 3,143 3,459 3,633 3,915 4,732 6,142 7,727 7,952
Source: Central Bank of the Philippines.
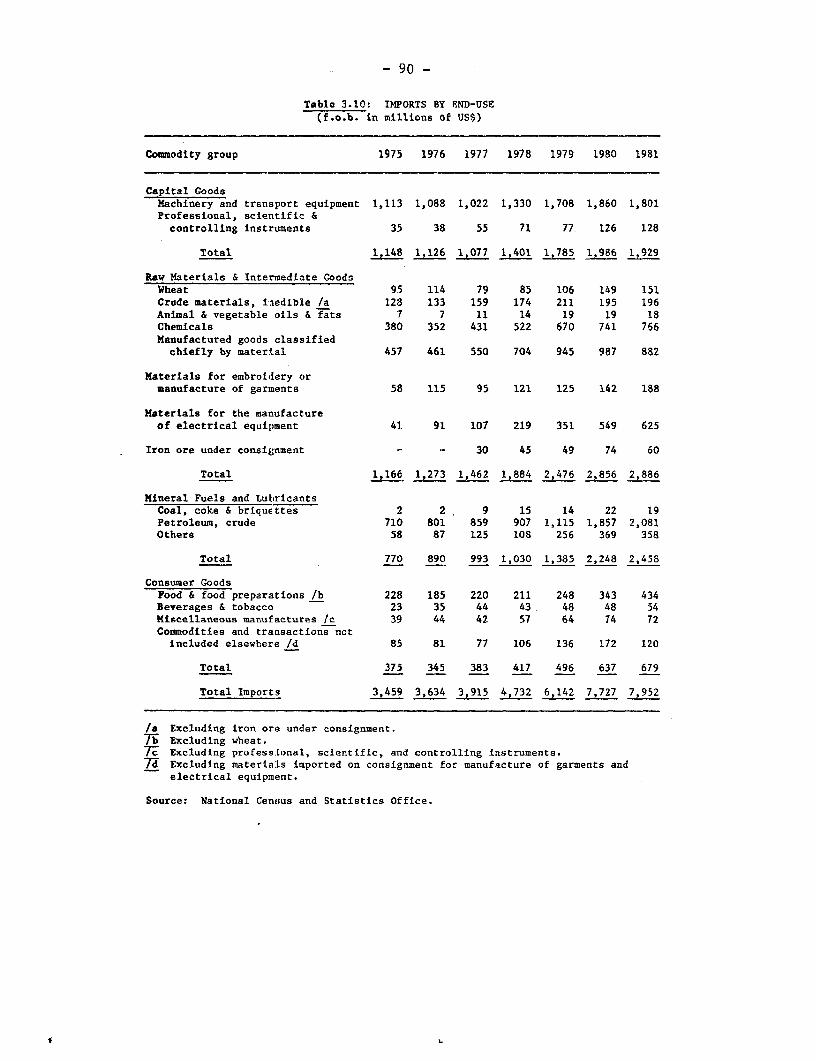
- 90 -
Table 3.10: IMPORTS BY END-USE(f.o.b. in millions of US$)
Commodity group 1975 1976 1977 1978 1979 1980 1981
Capital GoodsMachinery and transport equipment 1,113 1,088 1,022 1,330 1,708 1,860 1,801Professional, scientific &controlling instruments 35 38 55 71 77. 126 128
Total 1,148 1,126 1,077 1,401 1,785 1,986 1,929
Raw Materials & Intermediate GoodsWheat 95 114 79 85 106 149 151Crude materials, i'nedible /a 128 133 159 174 211 195 196Animal & vegetable oils & fats 7 7 11 14 19 19 18Chemicals 380 352 431 522 670 741 766Manufactured goods classified
chiefly by materiLal 457 461 550 704 945 987 882
Materials for embroidlery ormanufacture of garments 58 115 95 121 125 142 188
Materials for the manufactureof electrical equipment 41 91 107 219 351 549 625
Iron ore under consignment - - 30 45 49 74 60
Total 1,166 1,273 1,462 1,884 2,476 2,856 2,886
Mineral Fuels and LubricantsCoal, coke & briquettes 2 2 9 15 14 22 19Petroleum, crude 710 801 859 907 1,115 1,857 2,081Others 58 87 125 108 256 369 358
Total 770 890 993 1,030 1,385 2,248 2,458
Consumer GoodsFood & food preparations /b 228 185 220 211 248 343 434Beverages & tobacco 23 35 44 43 48 48 54Miscellaneous manufactures Ic 39 44 42 57 64 74 72Commodities and transactions not
included elsewhere /d 85 81 77 106 136 172 120
Total 375 345 383 417 496 637 679
Total Imports 3,459 3,634 3,915 4,732 6,142 7,727 7,952
/8 Excluding iron ore under consignment.7i Excluding wheat.7-c Excluding professional, scientific, and controlling instruments.74 Excluding materiaLs imported on consignment for manufacture of garments and
electrical equipment.
Source: National Cens;us and Statistics Office.
f
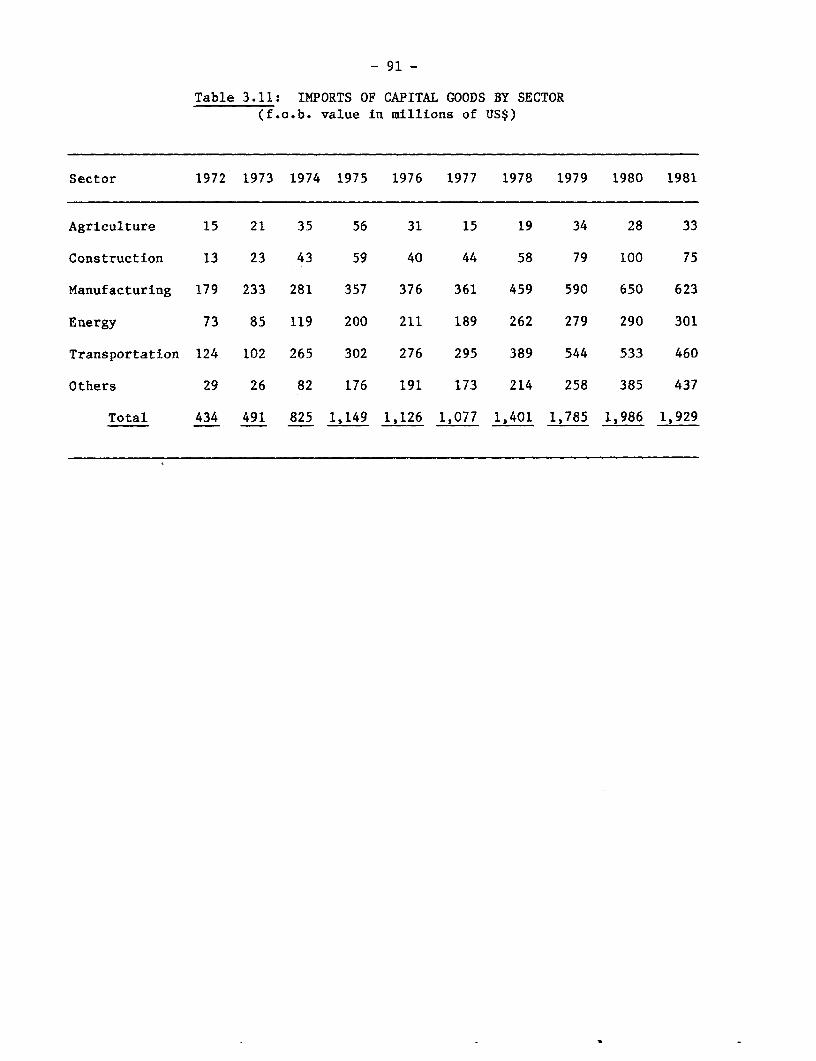
- 91 -
Table 3.11: IMPORTS OF CAPITAL GOODS BY SECTOR(f.o.b. value in millions of US$)
Sector 1972 1973 1974 1975 1976 1977 1978 1979 1980 1981
Agriculture 15 21 35 56 31 15 19 34 28 33
Construction 13 23 43 59 40 44 58 79 100 75
Manufacturing 179 233 281 357 376 361 459 590 650 623
Energy 73 85 119 200 211 189 262 279 290 301
Transportation 124 102 265 302 276 295 389 544 533 460
Others 29 26 82 176 191 173 214 258 385 437
Total 434 491 825 1,149 1,126 1,077 1,401 1,785 1,986 1,929
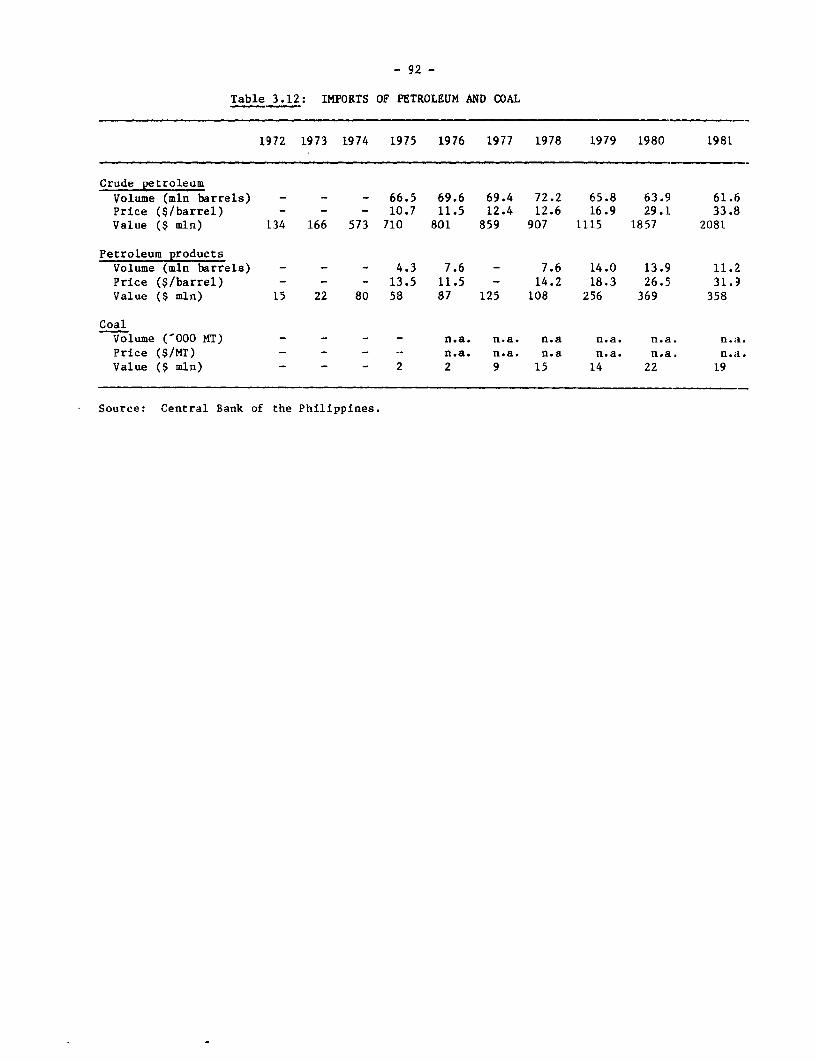
- 92 -
Table 3.12: IMPORTS OF PETROLEUM AND COAL
1972 1973 1974 1975 1976 1977 1978 1979 1980 1981
Crude petroleumVolume (mln barrels) - - - 66.5 69.6 69.4 72.2 65.8 63.9 61.6Price ($/barrel) - - - 10.7 11.5 12.4 12.6 16.9 29.1. 33.8
Value ($ mln) [34 166 573 710 801 859 907 1115 1857 2081
Petroleum productsVolume (mln barrels) - - - 4.3 7.6 - 7.6 14.0 13.9 11.2
Price ($/barrel) - - - 13.5 11.5 - 14.2 18.3 26.5 31.9
Value ($ mln) 15 22 80 58 87 125 108 256 369 358
CoalVolume ('000 MT) - - - - n.a. n.a. n.a n.a. n.a. n.a.
Price ($/MT) - - - - n.a. n.a. n.a n.a. n.a. n.a.
Value ($ mln) - - - 2 2 9 15 14 22 19
Source: Central Bank of the Philippines.
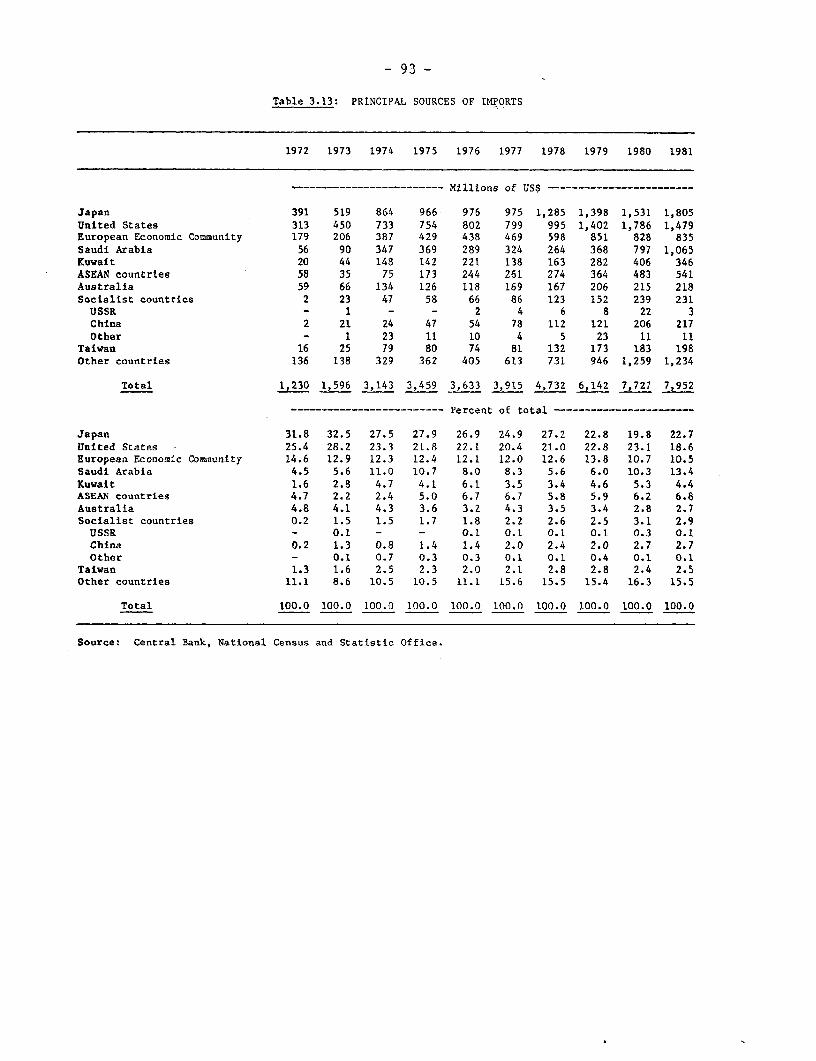
- 93 -
Table 3.13: PRINCIPAL SOURCES OF IMPORTS
1972 1973 1974 1975 1976 1977 1978 1979 1980 1981
-- …------------ Millions of US$ - ----- - - ---------
Japan 391 519 864 966 976 975 1,285 1,398 1,531 1,805United States 313 450 733 754 802 799 995 1,402 1,786 1,479European Economic Community 179 206 387 429 438 469 598 851 828 835Saudi Arabia 56 90 347 369 289 324 264 368 797 1,065Kuwait 20 44 148 142 221 138 163 282 406 346ASEAN countries 58 35 75 173 244 261 274 364 483 541Australia 59 66 134 126 118 169 167 206 215 218Socialist countries 2 23 47 58 66 86 123 152 239 231USSR - 1 - - 2 4 6 8 22 3China 2 21 24 47 54 78 112 121 206 217Other - 1 23 11 10 4 5 23 11 11
Taiwan 16 25 79 80 74 81 132 173 183 198Other countries 136 138 329 362 405 613 731 946 1,259 1,234
Total 1,230 1,596 3,143 3,459 3,633 3,915 4,732 6,142 7,727 7,952
---------------------- Percent of total -----------------------
Japan 31.8 32.5 27.5 27.9 26.9 24.9 27.2 22.8 19.8 22.7United States 25.4 28.2 23.3 21.8 22.1 20.4 21.0 22.8 23.1 18.6European Economic Community 14.6 12.9 12.3 12.4 12.1 12.0 12.6 13.8 10.7 10.5Saudi Arabia 4.5 5.6 11.0 10.7 8.0 8.3 5.6 6.0 10.3 13.4Kuwait 1.6 2.8 4.7 4.1 6.1 3.5 3.4 4.6 5.3 4.4ASEAN countries 4.7 2.2 2.4 5.0 6.7 6.7 5.8 5.9 6.2 6.8Australia 4.8 4.1 4.3 3.6 3.2 4.3 3.5 3.4 2.8 2.7Socialist countries 0.2 1.5 1.5 1.7 1.8 2.2 2.6 2.5 3.1 2.9
USSR - 0.1 - - 0.1 0.1 0.1 0.1 0.3 0.1China 0.2 1.3 0.8 1.4 1.4 2.0 2.4 2.0 2.7 2.7Other - 0.1 0.7 0.3 0.3 0.1 0.1 0.4 0.1 0.1
Taiwan 1.3 1.6 2.5 2.3 2.0 2.1 2.8 2.8 2.4 2.5Other countries 11.1 8.6 10.5 10.5 11.1 15.6 15.5 15.4 16.3 15.5
Total 100.0 100.0 100.0 100.0 100.0 100.0 100.0 100.0 100.0 100.0
Source: Central Bank, National Census and Statistic Office.
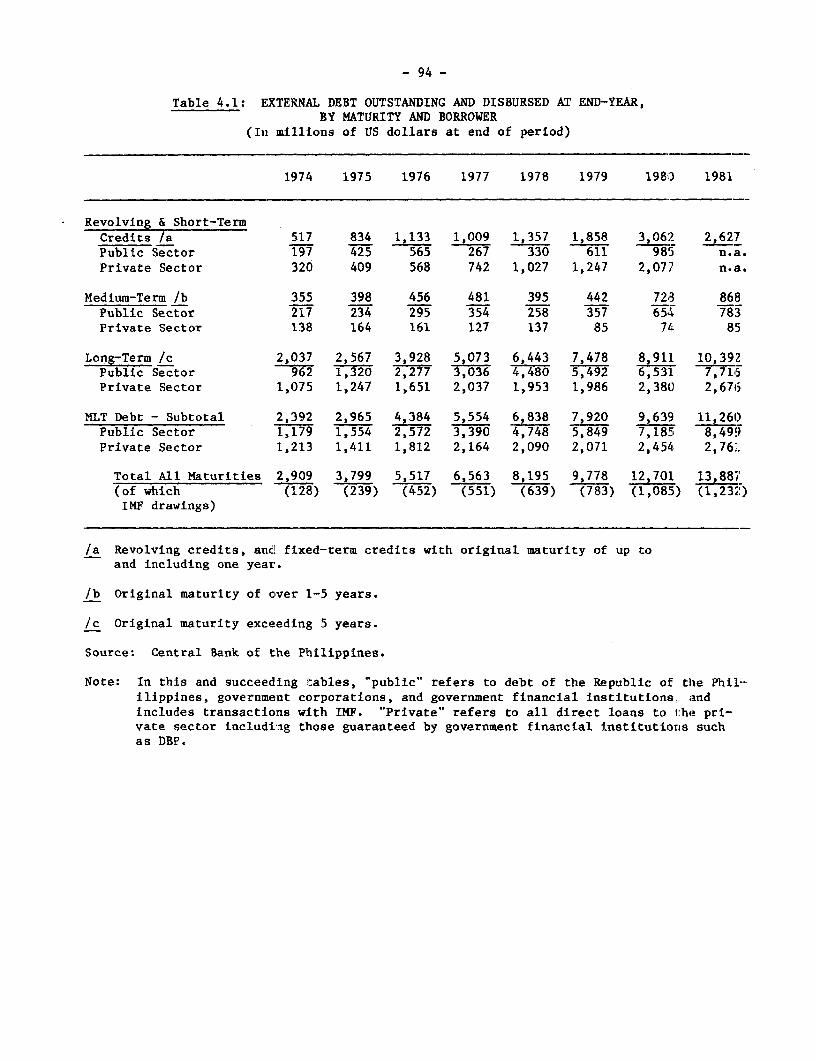
- 94 -
Table 4.1: EXTERNAL DEBT OUTSTANDING AND DISBURSED AT END-YEAR,BY MATURITY AND BORROWER
(In millions of US dollars at end of period)
1974 1975 1976 1977 1978 1979 198') 1981
Revolving & Short-TermCredits /a 517 834 1,133 1,009 1,357 1,858 3,062 2,627Public Sector 197 425 565 267 330 611 985 n.a.Private Sector 320 409 568 742 1,027 1,247 2,077 n.a.
Medium-Term /b 355 398 456 481 395 442 728 868Public Sector 217 234 295 354 258 357 654 783Private Sector 138 164 161 127 137 85 74 85
Long-Term /c 2,037 2,567 3,928 5,073 6,443 7,478 8,911 10,392Public Sector 962 1,320 2,277 3,036 4,480 5,492 6,531 7,716Private Sector 1,075 1,247 1,651 2,037 1,953 1,986 2,380 2,676
MLT Debt - Subtotal 2,392 2,965 4,384 5,554 6,838 7,920 9,639 11,261)Public Sector 1,179 1,554 2,572 3,390 4,748 5,849 7,185 8,499Private Sector 1,213 1,411 1,812 2,164 2,090 2,071 2,454 2,761.
Total All Maturities 2Z909 3,799 5,517 6,563 8,195 9,778 12,701 13,887(of which (128) (239) (452) (551) (639) (783) (1,085) (1,232)IMF drawings)
/a Revolving credits, and fixed-term credits with original maturity of up toand including one year.
/b Original maturity of cver 1-5 years.
/c Original maturity exceeding 5 years.
Source: Central Bank of the Philippines.
Note: In this and succeeding tables, "public" refers to debt of the Republic of the Phil-ilippines, government corporations, and government financial institutions, andincludes transactions with IMF. "Private" refers to all direct loans to the pri-vate sector including those guaranteed by government financial institutiorts suchas DBP.
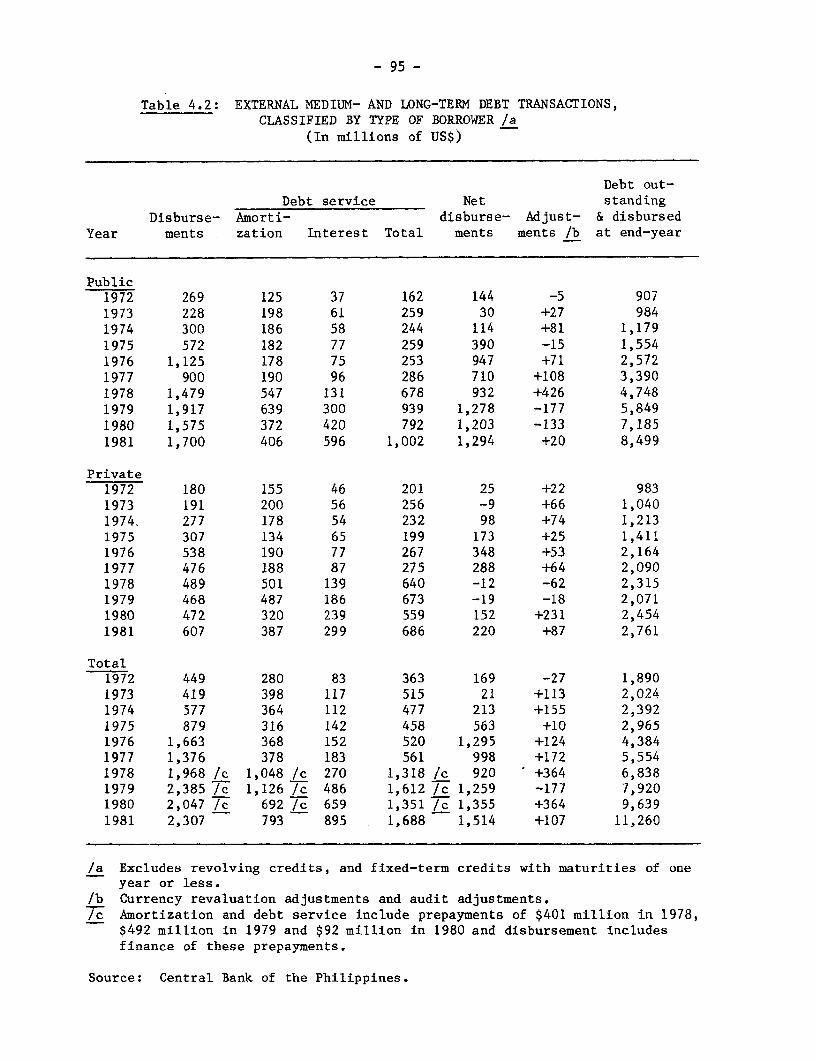
- 95 -
Table 4.2: EXTERNAL MEDIUM- AND LONG-TERM DEBT TRANSACTIONS,CLASSIFIED BY TYPE OF BORROWER /a
(In millions of US$)
Debt out-Debt service Net standing
Disburse- Amorti- disburse- Adjust- & disbursedYear ments zation Interest Total ments ments /b at end-year
Public1972 269 125 37 162 144 -5 9071973 228 198 61 259 30 +27 9841974 300 186 58 244 114 +81 1,1791975 572 182 77 259 390 -15 1,5541976 1,125 178 75 253 947 +71 2,5721977 900 190 96 286 710 +108 3,3901978 1,479 547 131 678 932 +426 4,7481979 1,917 639 300 939 1,278 -177 5,8491980 1,575 372 420 792 1,203 -133 7,1851981 1,700 406 596 1,002 1,294 +20 8,499
Private1972 180 155 46 201 25 +22 9831973 191 200 56 256 -9 +66 1,0401974. 277 178 54 232 98 +74 1,2131975 307 134 65 199 173 +25 1,4111976 538 190 77 267 348 +53 2,1641977 476 188 87 275 288 +64 2,0901978 489 501 139 640 -12 -62 2,3151979 468 487 186 673 -19 -18 2,0711980 472 320 239 559 152 +231 2,4541981 607 387 299 686 220 +87 2,761
Total1972 449 280 83 363 169 -27 1,8901973 419 398 117 515 21 +113 2,0241974 577 364 112 477 213 +155 2,3921975 879 316 142 458 563 +10 2,9651976 1,663 368 152 520 1,295 +124 4,3841977 1,376 378 183 561 998 +172 5,5541978 1,968 /c 1,048 /c 270 1,318 /c 920 +364 6,8381979 2,385 /c 1,126 /c 486 1,612 Ic 1,259 -177 7,9201980 2,047 /c 692 /c 659 1,351 /c 1,355 +364 9,6391981 2,307 793 895 1,688 1,514 +107 11,260
/a Excludes revolving credits, and fixed-term credits with maturities of oneyear or less.
/b Currency revaluation adjustments and audit adjustments.Tc Amortization and debt service include prepayments of $401 million in 1978,
$492 million in 1979 and $92 million in 1980 and disbursement includesfinance of these prepayments.
Source: Central Bank of the Philippines.

- 96 -
Table 4.3: EXTERNAL MEDIUM- AND LONG-TERM LOAN COMMITMENTS,CLASSIFIED BY TYPE OF BORROWER 1a
(In millions of US$)
TotalNew loan commitments /b Disbursed Undisbursed
Year commitments (end-year) (end-year) (end-year)
Public
1972 455 1,334 907 4271973 369 1,552 984 5681974 739 2,131 1,179 9521975 803 2,844 1,554 1,2901976 1,709 4,522 2,572 1,9501977 1,160 5,674 3,389 2,2841978 2,649 8,266 4,748 3,5181979 1,954 9,402 5,849 3,5531980 2,160 11,557 7,185 4,3721981 1,327 12,884 8,499 4,385
Private
1972 130 1,304 983 32:L1973 128 1,298 1,040 2581974 206 1,456 1,213 2431975 283 1,676 1,411 2651976 472 2,295 1,812 4331977 347 2,481 2,164 3L71978 682 2,589 2,090 4991979 583 2,823 2,071 7521980 731 3,558 2,454 1,1941981 359 3,917 2,761 1,1'i6
Total
1972 505 2,638 1,890 74;81973 477 2,850 2,024 8261974 1,045 3,586 2,392 1,91'41975 1,086 4,520 2,965 1,5551976 2,181 6,817 4,384 2,4,31977 1,507 8,155 5,554 2,6011978 3,331 10,855 6,838 4,0171979 2,537 12,225 7,920 4,3C51980 2,891 15,115 9,639 5,4751981 1,686 16,801 11,260 5,54L
/a Excludes revolving credits, and fixed-term credits with maturities inderone year.
/b Net of payments and cancellations.
Source: Central Banlc of the Philippines.
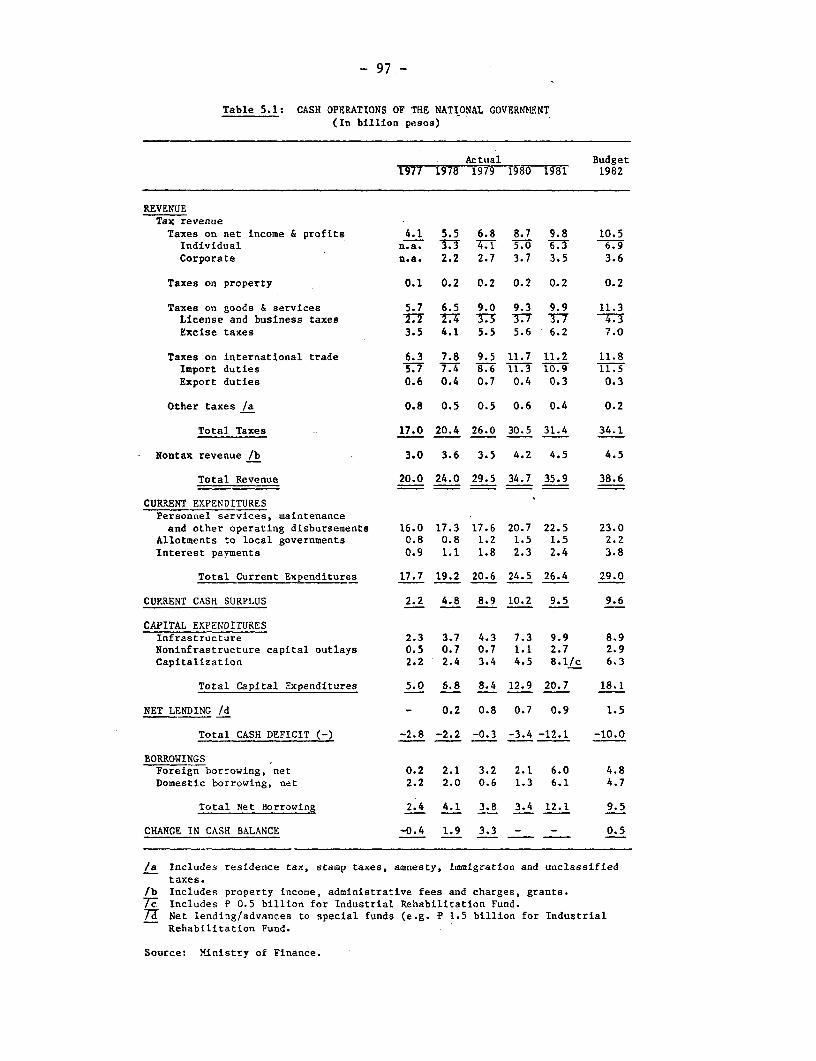
- 97 -
Table 5.1: CASH OPERATIONS OF THE NATIONAL GOVERNMENT(In billion pesos)
Actual Budget1977 1978 1979 1980 1981 1982
REVENUETax revenue
Taxes on net income & profits 4.1 5.5 6.8 8.7 9.8 10.5Individual n.a. 3.-3 T-1 5.0 6.3 6.9Corporate n.a. 2.2 2.7 3.7 3.5 3.6
Taxes on property 0.1 0.2 0.2 0.2 0.2 0.2
Taxes on goods & services 5.7 6.5 9.0 9.3 9.9 11.3License and business taxes =7 TT TS 3T 77 -T4Excise taxes 3.5 4.1 5.5 5.6 6.2 7.0
Taxes on international trade 6.3 7.8 9.5 11.7 11.2 11.8Import duties 5.7 7.4 8.6 i1.3 10.9 11.5Export duties 0.6 0.4 0.7 0.4 0.3 0.3
Other taxes /a 0.8 0.5 0.5 0.6 0.4 0.2
Total Taxes 17.0 20.4 26.0 30.5 31.4 34.1
Nontax revenue /b 3.0 3.6 3.5 4.2 4.5 4.5
Total Revenue 20.0 24.0 29.5 34.7 35.9 38.6
CURRENT EXPENDITURESPersonnel services, maintenanceand other operating disbursements 16.0 17.3 17.6 20.7 22.5 23.0
Allotments to local governments 0.8 0.8 1.2 1.5 1.5 2.2Interest payments 0.9 1.1 1.8 2.3 2.4 3.8
Total Current Expenditures 17.7 19.2 20.6 24.5 26.4 29.0
CURRENT CASH SURPLUS 2.2 4.8 8.9 10.2 9.5 9.6
CAPITAL EXPEN'DITURESInfrastructure 2.3 3.7 4.3 7.3 9.9 8.9Noninfrastructure capital outlays 0.5 0.7 0.7 1.1 2.7 2.9Capitalization 2.2 2.4 3.4 4.5 8.1/c 6.3
Total Capital Expenditures 5.0 6.8 8.4 12.9 20.7 18.1
NET LENDING /d - 0.2 0.8 0.7 0.9 1.5
Total CASH DEFICIT (-) -2.8 -2.2 -0.3 -3.4 -12.1 -10.0
BORROWINGSForeign borrowing, net 0.2 2.1 3.2 2.1 6.0 4.8Domestic borrowing, net 2.2 2.0 0.6 1.3 6.1 4.7
Total Net Borrowing 2.4 4.1 3.8 3.4 12.1 9.5
CHANGE IN CASH BALANCE -0.4 1.9 3.3 _ - 0.5
/a Includes residence tax, stamp taxes, amnesty, immigration and unclassifiedtaxes.
/b Includes property income, administrative fees and charges, grants.7-c Includes P 0.5 billion for Industrial Rehabilitation Fund.7n Net lending/advances to special funds (e.g. e 1.5 billion for Industrial
Rehabilitation Fund.
Source: Ministry of Finance.
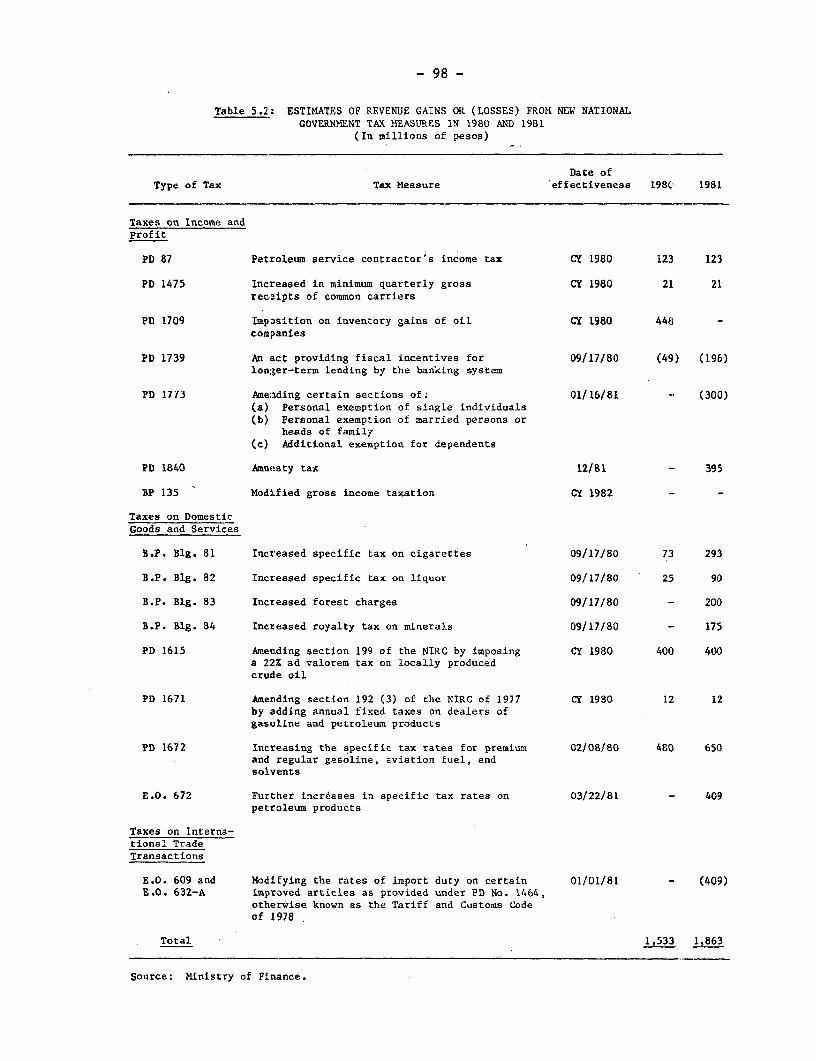
- 98 -
Table 5.2: ESTIMATES OF REVENUE GAINS OR (LOSSES) FROM NEW NATIONALGOVERNMENT TAX MEASURES IN 1980 AND 1981
(In millions of pesos)
Date ofType of Tax Tax Measure effectiveness 198:) 1981
Taxes on Income andprofit
PD 87 Petroleum service contractor's income tax CY 1980 123 123
PD 1475 Increased in minimum quarterly gross CY 1980 21 21receipts of common carriers
PD 1709 Imposition on inventory gains of oil CY 1980 448 -com;panies
PD 1739 An act providing fiscal incentives for 09/17/80 (49) (196)longer-term lending by the banking system
PD 1773 Ameniding certain sections of; 01/16/81 -- (300)(a) Personal exemption of single individuals(b) Personal exemption of married persons or
heads of family(c) Additional exemption for dependents
PD 1840 Amnesty tax 12/81 - 395
BP 135 Modified gross income taxation CY 1982 - -
Taxes on DomesticGoods and Services
B.P. Blg. 81 Increased specific tax on cigarettes 09/17/80 73 293
B.P. Blg. 82 Increased specific tax on liquor 09/17/80 25 90
B.P. Blg. 83 Increased forest charges 09/17/80 - 200
B.P. Blg. 84 Increased royalty tax on minerals 09/17/80 - 175
PD 1615 Amending section 199 of the NIRC by imposing CY 1980 400 400a 22% ad valorem tax on locally producedcrude oil
PD 1671 Amending section 192 (3) of the NIRC of 1977 CY 1980 12 12by adding annual fixed taxes on dealers ofgasoline and petroleum products
PD 1672 Increasing the specific tax rates for premium 02/08/80 480 650and regular gasoline, aviation fuel, andsolvents
E.O. 672 Further increases in specific tax rates on 03/22/81 - 409petroleum products
Taxes on Interna-tional TradeTransactions
E.O. 609 and Modifying the rates of import duty on certain 01/01/81 - (409)E.O. 632-A improved articles as provided under PD No. 1464,
otherwise known as the Tariff and Customs Codeof 1978
Total 1,533 1,863
Source: Ministry of Finance.
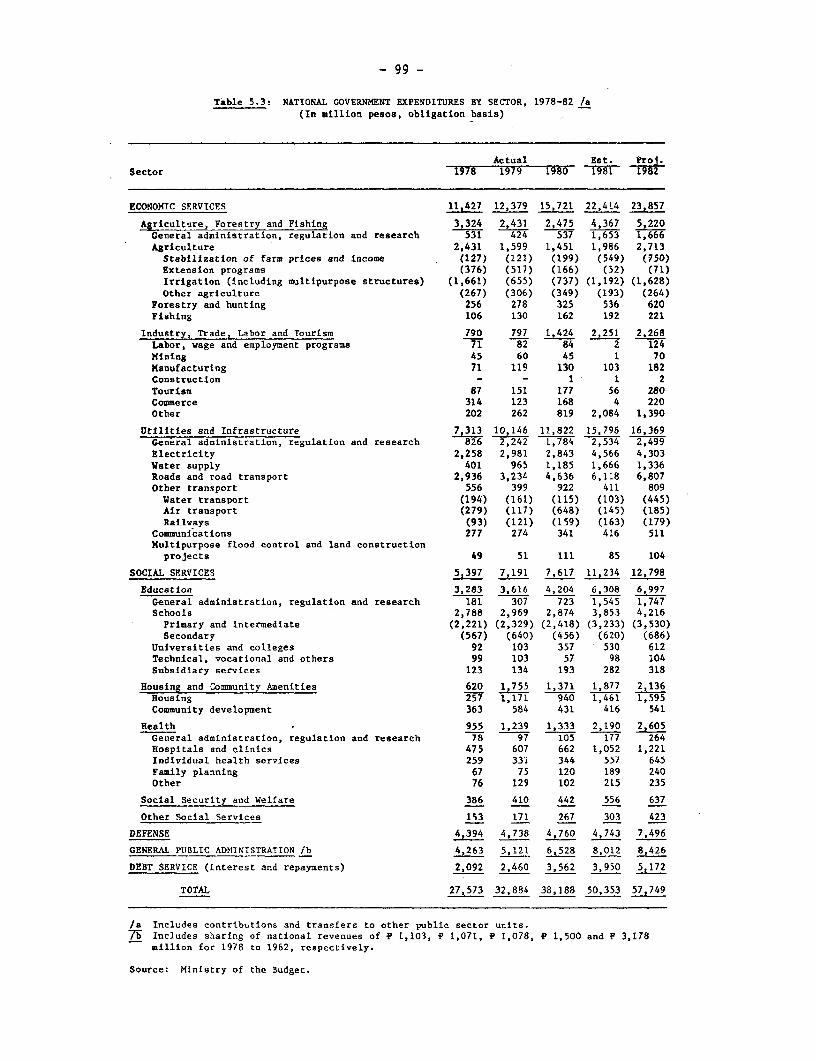
- 99 _
Table 5.3: NATIONAL GOVERNMENT EXPENDITURES BY SECTOR, 1978-82 /a(In million pesos, obligation basis)
Actual Est. Proj.Sector 1978 1979 1980 1981 1982
ECONOMTC SERVICES 11,427 12,379 15,721 22,414 23,857
Agriculture, Forestry and Fishing 3,324 2,431 2,475 4,367 5,220General administration, regulation and research 531 424 537 1,653 1,666Agriculture 2,431 1,599 1,451 1,986 2,713Stabilization of farm prices and income (127) (121) (199) (549) (750)Extension programs (376) (517) (166) (52) (71)Irrigation (including multipurpose structures) (1,661) (655) (737) (1,192) (1,628)Other agriculture (267) (306) (349) (193) (264)
Forestry and hunting 256 278 325 536 620Fishing 106 130 162 192 221
Industry, Trade, 1Labor and Tourism 790 797 1,424 2,251 2,268Labor, wage and employment programs 71 82 84 2 124Mining 45 60 45 1 70Manufacturing 71 119 130 103 182Construction - - 1 1 2Tourism 87 151 177 56 280Commerce 314 123 168 4 220Other 202 262 819 2,084 1,390
Utilities and Infrastructure 7,313 10,146 11,822 15,796 16,369General administration, regulation and research 826 242 1,784 2,534 2,499Electricity 2,258 2,981 2,843 4,566 4,303Water supply 401 965 1,185 1,666 1,336Roads and road transport 2,936 3,234 4,636 6,118 6,807Other transport 556 399 922 411 809Water transport (194) (161) (115) (103) (445)Air transport (279) (117) (648) (145) (185)Railways (93) (121) (159) (163) (179)
Communications 277 274 341 416 511Multipurpose flood control and land constructionprojects 49 51 ill 85 104
SOCIAL SERVICES 5,397 7,191 7,617 11,234 12,798
Education 3,283 3,616 4,204 6,308 6,997General administration, regulation and research 181 307 723 1,545 1,747Schools 2,788 2,969 2,874 3,853 4,216Primary and intermediate (2,221) (2,329) (2,418) (3,233) (3,530)Secondary (567) (640) (456) (620) (686)
Universities and colleges 92 103 357 530 612Technical, vocational and others 99 103 57 98 104Subsidiary services 123 134 193 282 318
Housing and Community Amenities 620 1,755 1,371 1,877 2,136Housing 257 1,171 940 1,461 1,595Community development 363 584 431 416 541
Health 955 1,239 1,333 2,190 2,605General administration, regulation and research 78 97 105 177 264Hospitals and clinics 475 607 662 1,052 1,221Individual health services 259 331 344 557 645Family planning 67 75 120 189 240Other 76 129 102 215 235
Social Security and Welfare 386 410 442 556 637
Other Social Services 153 171 267 303 423
DEFENSE 4,394 4,738 4,760 4,743 7,496
GENERAL PUBLIC ADMINISTRATION jb 4,263 5,121 6,528 8,012 8,426
DEBT SERVICE (interest and repayments) 2,092 2,460 3,562 3,950 5,172
TOTAL 27,573 32,884 38,188 50,353 57,749
/a Includes contributions and transfers to other public sector units.7-r Includes sharing of national revenues of e 1,103, f 1,071, P 1,078, e 1,500 and P 3,178
million for 1978 to 1962, respectively.
Source: Ministry of the Budget.

- 100-
Table 5.3a: NATIONAL GOVERNMFNT CONTRIBUTIONS AND TRANSFERS TOOTIIER PUBLIC SECTOR UNITS, BY SECTOR, 1978-82
(In million pesos, obligation basis)
Actual Est. Proj.Sector 1978 1979 1980 1981 19S2
ECONOMIC SERVICES 2,512 3,615 4,510 7,568 6,S92
Agriculture, Forestry and Fishing 409 207 500 1,369 1,875General administration, regulation and research 106 32 67 24 56Agriculture 288 165 411 1,294 1,763Stabilization of farm prices and income (-) (-) (-) (311) (539)Irrigation (including multipurpose structures) (233) (125) (371) (878) (1,145)Other agriculture (55) (40) (40) (105) (79)
Fishing 15 10 22 51 56
Industry, Trade, Labor and Tourism 346 195 815 2,206 1,094Manufacturing 34* 62 86 100 140Commerce 200 - 50 50 -Others 112 133 679 2,056 954
Utilities and Infrastructure 1,757 3,213 3,195 3,993 3,923General administration, regulation and research - - - 67 44Electricity 1,421 2,602 2,110 2,808 2,796Water supply 179 390 771 844 662Road and road transpoct 25 10 80 25 -Other transport 101 180 155 249 421Water transport (lo) (26) (1) (91) (250)Air transport (2) (35) (-) (-) (-)Railways (89) (119) (154) 158 171
Other utilities and infrastructure 31 31 79 - -
SOCIAL SERVICES 235 733 573 1,320 921
Education 1 1 1 1 1Secondary schools 1 T 1 1 L
Housing and Community Amenities 225 730 533 1,256 342Housing 222 730 533 1,256 :342Community development 3 - - - -
Health - - 28 43 58Hospitals and clinics - - 2
Social Security and Welfare 1 1 1 - 20
Other Social Services 8 1 10 20
DEFENSE - - - 1 _
GENERAL PUBLIC ADMINISTRATION /a 1,614 1,584 1,488 4,254 3,1 1
TOTAL 4,361 5,932 6,571 13,143 11,`124
/a Includes sharing of national revenues of e 1,103, 9 1,071, F 1,078, P 1,500 and P 3,178million for 1978 to 1982, respectively.
Source: Ministry of the Badget.
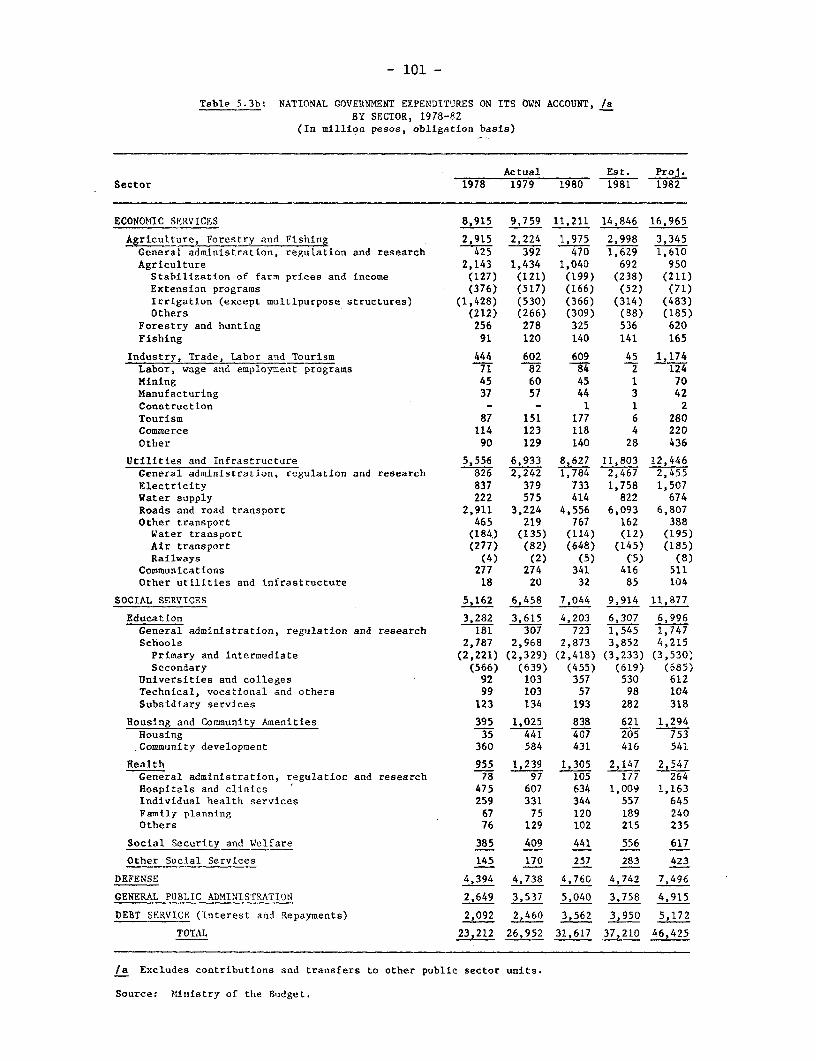
- 101 -
Table 5.3b: NATIONAL GOVERNMENT EXPENDITURES ON ITS OWN ACCOUNT, /aBY SECTOR, 1978-82
(In million pesos, obligation basis)
Actual Est. Proj.Sector 1978 1979 1980 1981 1982
ECONOMIC SERVICES 8,915 9,759 11,211 14,846 16,965
Agriculture, Forestry and Fishing 2,915 2,224 1,975 2,998 3,345General administration, regulation and research 425 392 470 1,629 1,610Agriculture 2,143 1,434 1,040 692 950
Stabilization of farm prices and income (127) (121) (199) (238) (211)Extension programs (376) (517) (166) (52) (71)Irrigation (except multipurpose structures) (1,428) (530) (366) (314) (483)Others (212) (266) (309) (88) (185)
Forestry and hunting 256 278 325 536 620Fishing 91 120 140 141 165
Industry, Trade, Labor and Tourism 444 602 609 45 1,174Labor, wage and employment programs 71 82 84 2 124Mining 45 60 45 1 70Manufacturing 37 57 44 3 42Construction - - 1 1 2
Tourism 87 151 177 6 280Commerce 114 123 118 4 220Other 90 129 140 28 436
Utilities and Infrastructure 5,556 6,933 8,627 11,803 12,446General administration, regulation and research 826 2,242 1,784 2,467 2,455Electricity 837 379 733 1,758 1,507Water supply 222 575 414 822 674Roads and road transport 2,911 3,224 4,556 6,093 6,807Other transport 465 219 767 162 388Water transport (184) (135) (114) (12) (195)Air transport (277) (82) (648) (145) (185)Railways (4) (2) (5) (5) (8)
Communications 277 274 341 416 511Other utilities and infrastructure 18 20 32 85 104
SOCIAL SERVICES 5,162 6,458 7,044 9,914 11,877
Education 3,282 3,615 4,203 6,307 6,996General administration, regulation and research 181 307 723 1,545 1,747Schools 2,787 2,968 2,873 3,852 4,215Primary and intermediate (2,221) (2,329) (2,418) (3,233) (3,530)Secondary (566) (639) (455) (619) (685)
Universities and colleges 92 103 357 530 612Technical, vocational and others 99 103 57 98 104Subsidiary services 123 134 193 282 318
Housing and Community Amenities 395 1,025 838 621 1,294Housing 35 441 407 205 753.Community development 360 584 431 416 541
Health 955 1,239 1,305 2,147 2,547General administration, regulation and research 78 97 105 177 264Hospitals and clinics 475 607 634 1,009 1,163Individual health services 259 331 344 557 645Family planning 67 75 120 189 240Others 76 129 102 215 235
Social Security and Welfare 385 409 441 556 617
Other Social Services 145 170 257 283 423
DEFENSE 4,394 4,738 4,760 4,742 7,496
GENERAL PUBLIC ADMINISTRATION 2,649 3,537 5,040 3,758 4,915
DEBT SERVICE (Interest anid Repayments) 2,092 2,460 3,562 3,950 5,172
TOTAL 23,212 26,952 31,617 37,210 46,425
/a Excludes contributions and transfers to other public sector units.
Source: Ministry of the Budget.
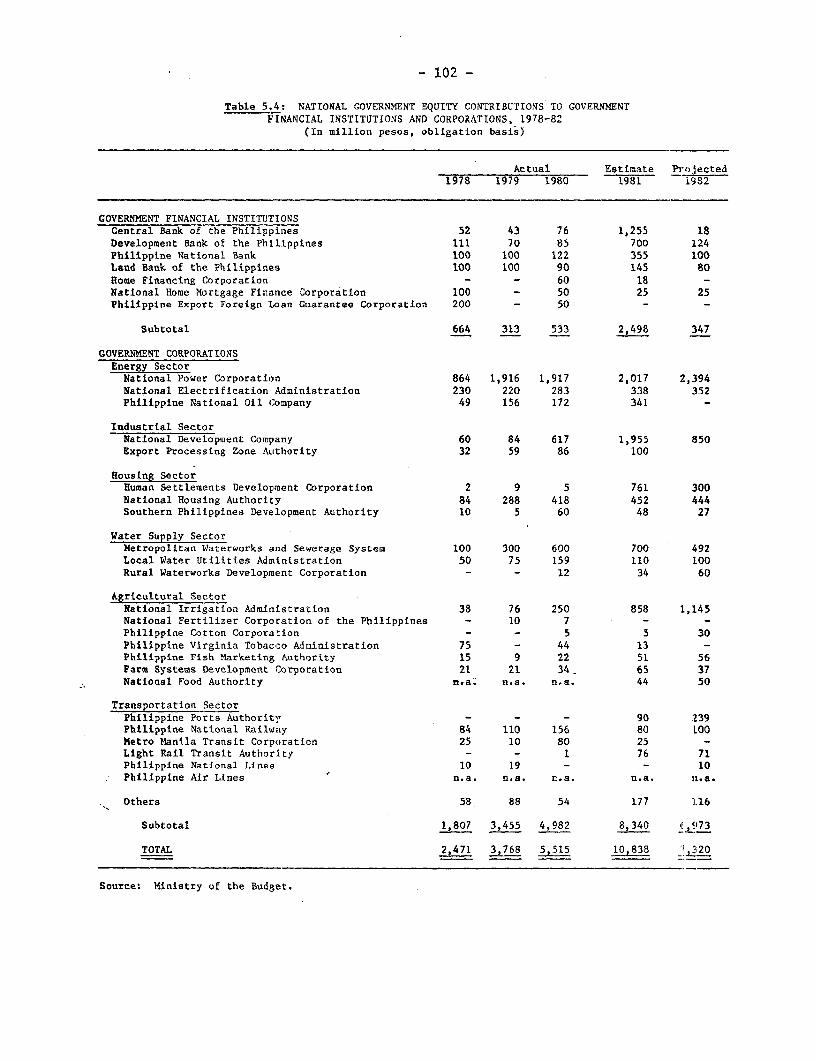
- 102 -
Table 5i.4: NATIONAL GOVERNMENT EQUITY CONTRIBUTIONS TO GOVERNMENTFINANCIAL INSTITUTIONS AND CORPORATIONS, 1978-82
(In million pesos, obligation basis)
Actual Estimate Projected1978 1979 1980 1981 1982
GOVERME NT FINANCIAL INSTITUJTIONSCentral Bank of the Philippines 52 43 76 1,255 18Development Bank of the Philippines 111 70 85 700 124Philippine National Bank 100 100 122 355 100Land Bank of the Philippines 100 100 90 145 80Rome Financing Corporation - - 60 18 -National Home Mortgage Finance Corporation 100 - 50 25 25Philippine Export Foreign Loan Guarantee Corporation 200 - 50 - -
Subtotal 664 313 533 2,498 347
GOVERNMENT CORPORATIONSEnergy SectorNational Power Corporation 864 1,916 1,917 2,017 2,394National Electrification Administration 230 220 283 338 352Philippine National Oil Company 49 156 172 341 -
Industrial SectorNational Development Company 60 84 617 1,955 850Export Processing Zone Authority 32 59 86 100
Housing SectorHuman Settlements Development Corporation 2 9 5 761 300National Housing Authority 84 288 418 452 444Southern Philippines Development Authority 10 5 60 48 27
Water Supply SectorMetropolitan Waterworks and Sewerage Syste J 100 300 600 700 492Local Water Utilities Administration 50 75 159 110 100Rural Waterworks Development Corporation - - 12 34 60
Agricultural SectorNational Irrigation Administration 38 76 250 858 1,145National Fertilizer Corporation of the Philippines - 10 7 - -Philippine Cotton Corporation - - 5 5 30Philippine Virginia Tobacco Administration 75 - 44 13 -Philippine Fish Marketing Authority 15 9 22 51 56Farm Systems Development Corporation 21 21 34- 65 37National Food Authority nra. n.a. n.a. 44 50
Transportation SectorPhilippine Ports Authority - - - 90 239
Philippine National Railway 84 110 156 80 LtOOMetro Manila Transit Corporation 25 10 S0 25 -Light Rail Transit Authority - - 1 76 71Philippine National Lines 10 19 - - 10
Philippine Air Lines n.a. n.a. n.a. n.a. n.a
Others 58 88 54 177 116
Subtotal 1,807 3,455 4,982 8,340 ,,973
TOTAL 2,471 3,768 5,515 10,838 1,-20
Source: Ministry of the Budget.
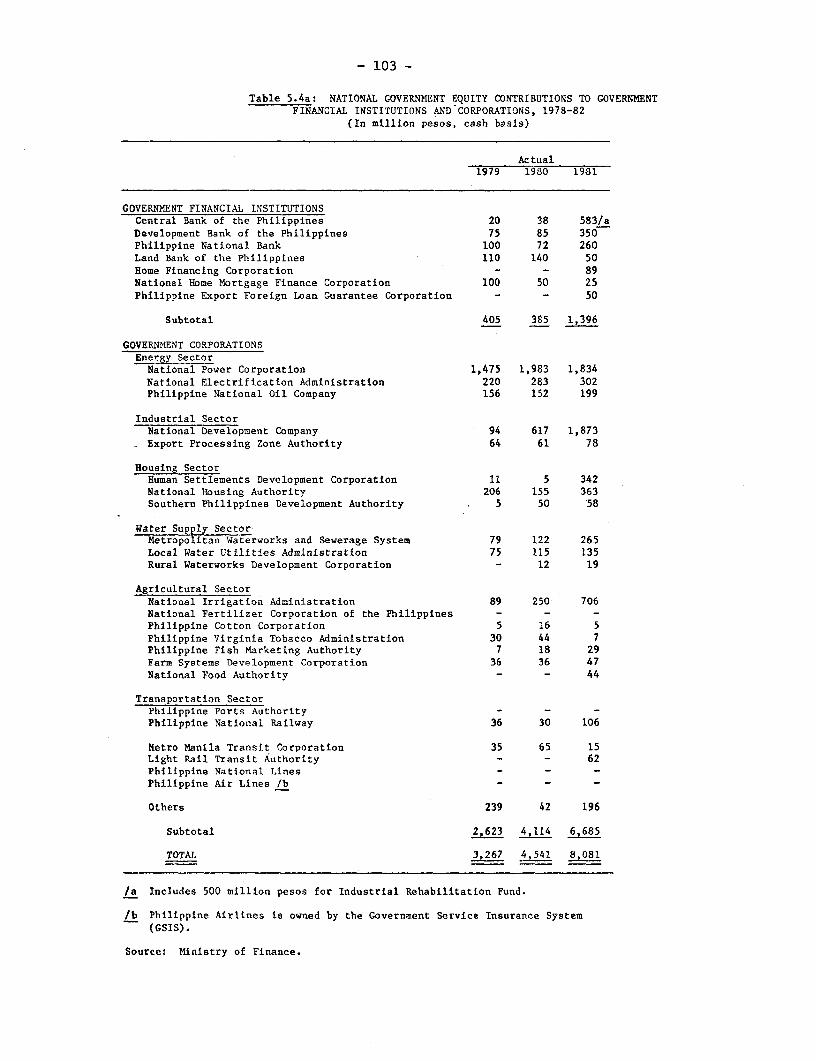
- 103 -
Table 5.4 a: NATIONAL GOVERNMENT EQUITY CONTRIBUTIONS TO GOVERNMENTFINANCIAL INSTITUTIONS AND CORPORATIONS, 1978-82
(In million pesos, cash basis)
Actual1979 1980 1981
GOVERNMENT FINANCIAL INSTITUTIONSCentral Bank of the Philippines 20 38 583/aDevelopment Bank of the Philippines 75 85 350Philippine National Bank 100 72 260Land Bank of the Philippines 110 140 50Home Financing Corporation - - 89
National Home Mortgage Finance Corporation 100 50 25Philippine Export Foreign Loan Guarantee Corporation - - 50
Subtotal 405 385 1,396
GOVERNMENT CORPORATIONSEnergy SectorNational Power Corporation 1,475 1,983 1,834National Electrification Administration 220 283 302Philippine National Oil Company 156 152 199
Industrial SectorNational Development Company 94 617 1,873Export Processing Zone Authority 64 61 78
Housing SectorHuman Settlements Development Corporation 11 5 342National Housing Authority 206 155 363Southern Philippines Development Authority 5 50 58
Water Supply SectorMetropolitan Waterworks and Sewerage System 79 122 265Local Water Utilities Administration 75 115 135Rural Waterworks Development Corporation - 12 19
Agricultural SectorNational Irrigation Administration 89 250 706National Fertilizer Corporation of the Philippines - - -Philippine Cotton Corporation 5 16 5Philippine Virginia Tobacco Administration 30 44 7Philippine Fish Marketing Authority 7 18 29Farm Systems Developnent Corporation 36 36 47National Food Authority - - 44
Transportation SectorPhilippine Ports Authority - - -Philippine National Railway 36 30 106
Metro Manila Transit Corporation 35 65 15Light Rail Transit Authority - - 62
Philippine National Lines -Philippine Air Lines /b - - -
Others 239 42 196
Subtotal 2,623 4,114 6,685
TOTAL 3,267 4,541 8,081
/a Includes 500 million pesos for Industrial Rehabilitation Fund.
/b Philippine Airlines is owned by the Government Service Insurance System(GSIS).
Source: Ministry of Finance.

- 104 -
Table 5.5: DISTRIBUTION OF TOTAL NATIONAL GOVERNMENTCASH BALANCES AT YEAR-END /a
(In million pesos)
1976 1977 1978 1979 1980 1981
Philippine National Bank 1,101 1,103 1,865 3,394 3,332 3,143
Other commercial banks 1,105 1,318 1,634 2,513 3,149 3,511
Development Bank of thePhilippines 3,323 3,200 3,629 4,406 5,862 7,988
Other depositories 941 1,485 2,173 2,244 1,651 2,673
Total 6,471 7,106 9,301 12,557 13,994 17,315
/a Includes cash balances of budgetary operations (see Table 5.1), as well ascash balances of nonbudgetary operations, as well as cash balances of othernational government funds.
Source: Ministry of Finance.
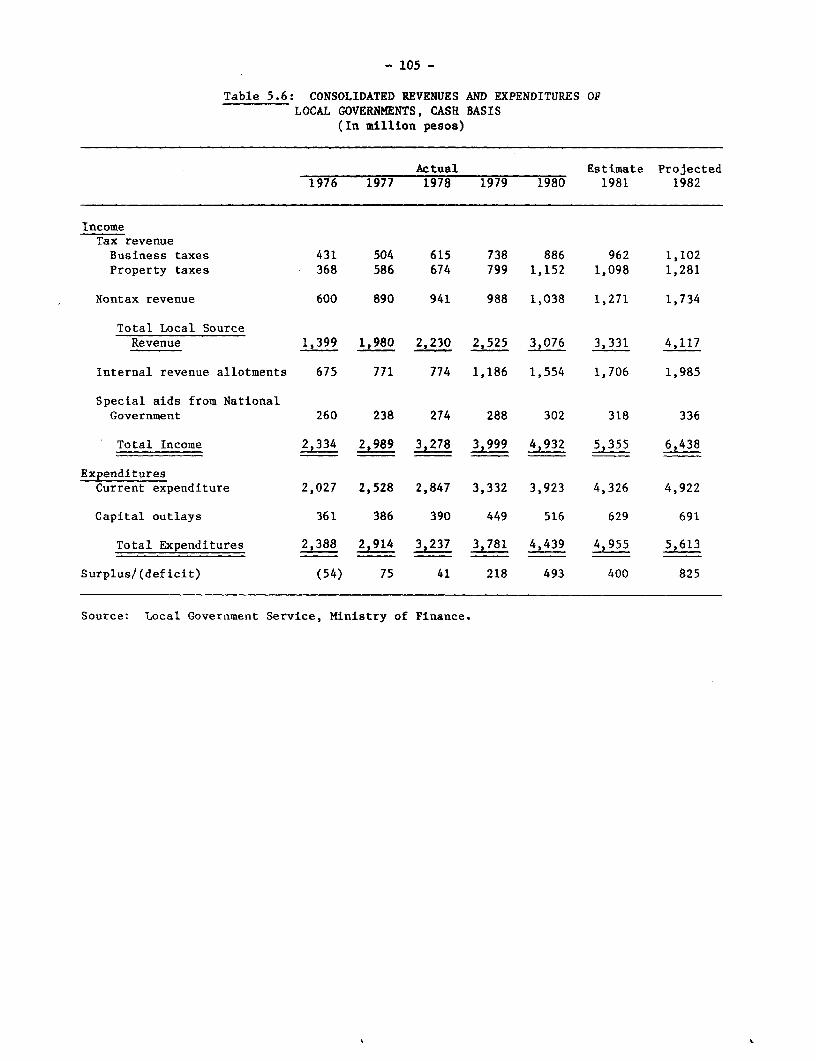
- 105 -
Table 5.6: CONSOLIDATED REVENUES AND EXPENDITURES OFLOCAL GOVERNMENTS, CASH BASIS
(In million pesos)
Actual Estimate Projected1976 1977 1978 1979 1980 1981 1982
IncomeTax revenueBusiness taxes 431 504 615 738 886 962 1,102Property taxes 368 586 674 799 1,152 1,098 1,281
Nontax revenue 600 890 941 988 1,038 1,271 1,734
Total Local SourceRevenue 1,399 1,980 2,230 2,525 3,076 3,331 4,117
Internal revenue allotments 675 771 774 1,186 1,554 1,706 1,985
Special aids from NationalGovernment 260 238 274 288 302 318 336
Total Income 2,334 2,989 3,278 3,999 4,932 5,355 6,438
ExpendituresCurrent expenditure 2,027 2,528 2,847 3,332 3,923 4,326 4,922
Capital outlays 361 386 390 449 516 629 691
Total Expenditures 2,388 2,914 3,237 3,781 4,439 4,955 5,613
Surplus/ (deficit) (54) 75 41 218 493 400 825
Source: Local Government Service, Ministry of Finance.

- 106 -
Table 5.7: LEVEL ANI) 'INANC(.NG Ol' CAPITAL. INVEiSTHENTMAJOR COVERNMENIT WIlOKATI ONS, 1978-82
(In mIlLion pesos, cash basis)
Act,sal Estimate ProjeCtedCorporation 19i7 1979 1980 1981 1982
ENFRGY SECTORPhilip_ine Nat1onal Oil Company (PROC)
Capital investmeat 562 620 1,469 777 735Financed by. Fundcts from internal sources 35 2 447 377 63
Govenrment contributions 49 156 172 200 336Grofs borrowings 478 462 850 200 336
National Power Corpcration (NPC)Capital investment 2,102 4,464 5,439 6,160 6,884Financed by: Fuads from internal sources - - - - -
Government contributions 864 1,916 1,917 1,778 2,424Gross borrowings 1,238 2,548 3,522 4,382 4,460
National Electrification Administration (NEA)Capital investment 375 462 653 560 600Financed by: Funds from internal sources - - - 4 -
Government contributions 230 220 283 302 352Gross Borrowings 145 211 38-5 254 248Otber sources - 31 35 - -
TRANSPORTATION SECTCRPhilippines Ports Au!hority (PPA)
Capital invescment 162 185 486 443 981Financed by: Funds from internal sources 135 161 139 185 119
Government contributions - - - - 193
Grosa borrowings 32 24 347 258 669
Philippine National Railways (PNR)Capital investment 95 206 350 106 102Financed by: Funds from internal sources - - - -
Government contributions - 36 30 106 , 100GrosE borrowings 95 170 320 - 2
Metro Manila Transit Corporation (RI-iTC)Capital investment 34 101 102 322 400Financed by: Funds from internal soturces 9 66 22 54 50
Government contribuitions 25 35 65 15 100Gross borrowings - - 15 253 250
AGRICULTURAL SECTORNational Irrigation Administration (NIA)
Capital investment 972 1,350 1,276 1,748 2,000Financed by: Funds from internal sources 51 60 117 92 102
Government contributions 474 238 377 1,059 1.200Gross borrowings 447 1,062 782 597 698
WATER SUPPLY SECTORmetropolitan Warerworks and Sewerage System(HSS)
Capital investment 152 544 1,052 772 1,407Financed by; Funds fror. internal sources 24 46 70 212 213
Governtment contributions 112 79 122 265 615Gross borrowings 16 419 860 295 ,\79
Local Water Utilities Administration (LWUA)Capital investment 125 240 339 328 280Financed by: Ftunds from internal sources 48 52 - - -
Goverrment contribuitions 50 75 115 135 100Gross borrowings 27 113 224 164 180
MOUSING StCTORNational lloutsin_Anthcrity (NHA)
Capital inivestment 156 270 280 340 481Finantced by. Funds from internial sources - - - 14 -
Government contributions 107 206 155 247 257Gross borrowings 49 64 125 93 224
Export Proce6sin_ Zone Authority (ElZA)Capital investmen,t 109 116 218 235 245Fituanced by: Funds from Lnternatl sources 20 28 34 140 55
Covernment contributions 32 59 86 50 100Gross borrowings 57 29 98 45 90
TOTAL CAPITAL INVESTMENTCapital tinvatmetll 4A844 8553 1664 11,77.5 14 115Financed by. Funds trom Internal soturces 322 415 829 841 602
Government contributilons 1,943 3,010 3,322 4,157 5,577Gross borrowIngs 2,439 5,133 7,178 6,341 7,736Others
Source: Governmwent corpurations; Ministry of Budget; Mini,iLry of Finatice oata.
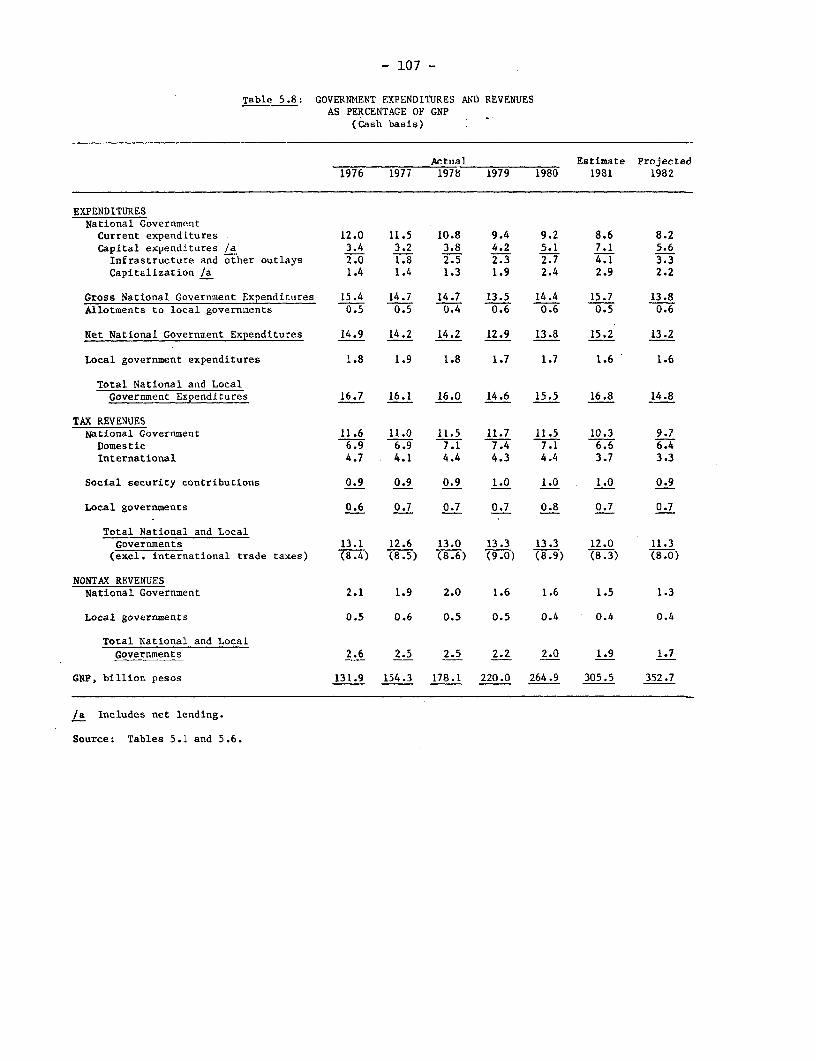
- 107 -
Table 5.8: GOVERNMENT EXPENDITURES AND REVENUESAS PERCENTAGE OF GNP
(Cash basis)
Actual Estimate Projected1976 1977 1978 1979 1980 1981 1982
EXPENDITURESNational Government
Current expenditures 12.0 11.5 10.8 9.4 9.2 8.6 8.2Capital expenditures la 3.4 3.2 3.8 4.2 5.1 7.1 5.6
Infrastructure and other outlays 2.0 1.8 2.5 2.3 2.7 4.1 3.3Capitalization /a 1.4 1.4 1.3 1.9 2.4 2.9 2.2
Gross National Government Expenditures 15.4 14.7 14.7 13.5 14.4 15.7 13.8Allotments to local governments 0.5. 5 5 0.4 0.6 0.6 0.5 0.6
Net National Government Expenditures 14.9 14.2 14.2 12.9 13.8 15.2 13.2
Local government expenditures 1.8 1.9 1.8 1.7 1.7 1.6 1.6
Total National and LocalGovernment Expenditures 16.7 16.1 16.0 14.6 15.5 16.8 14.8
TAX REVENUESNational Government 11.6 11.0 11.5 11.7 11.5 10.3 9.7
Domestic 6.9 6.9 7.1 7.4 7.1 6.6 6.4International 4.7 4.1 4.4 4.3 4.4 3.7 3.3
Social security contributions 0.9 0.9 0.9 1.0 1.0 1.0 0.9
Local governments 0.6 0.7 0.7 0.7 0.8 0.7 0.7
Total National and LocalGovernments 13.1 12.6 13.0 13.3 13.3 12.0 11.3
(excl. international trade taxes) (8.4) (8.5) (8.6) (9.0) (8.9) (8.3) (8.0)
NONTAX REVENUESNational Government 2.1 1.9 2.0 1.6 1.6 1.5 1.3
Local governments 0.5 0.6 0.5 0.5 0.4 0.4 0.4
Total National and LocalGovernments 2.6 2.5 2.5 2.2 2.0 1.9 1.7
GNP, billion pesos 131.9 154.3 178.1 220.0 264.9 305.5 352.7
/a Includes net lending.
Source: Tables 5.1 and 5.6.
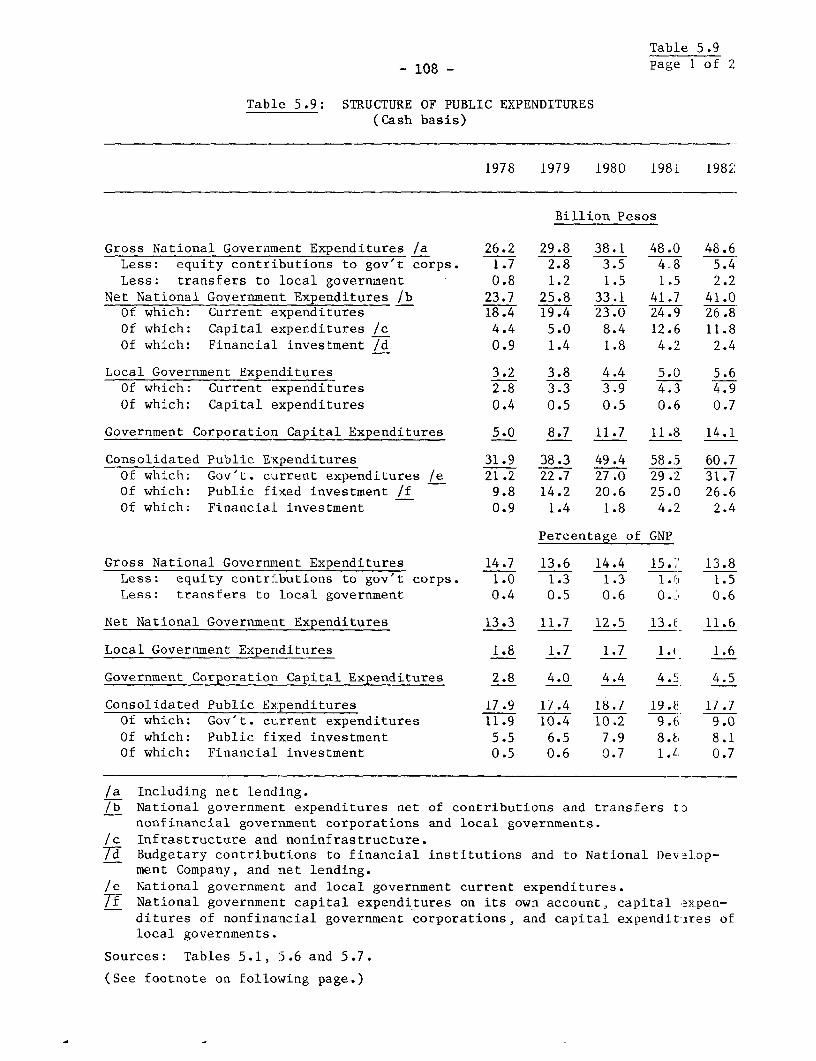
Table 5.9
- 108 - page 1 of 2
Table 5.9: STRUCTURE OF PUBLIC EXPENDITURES(Cash basis)
1978 1979 1980 1981 1982
Billion Pesos
Gross National Government Expenditures /a 26.2 29.8 38.1 48.0 48.6Less: equity contributions to gov't corps. 1-.7 2~-.8 3'~-.5 -4_.8 _5.4Less: transfers to local government 0.8 1.2 1.5 1.5 2.2
Net National Government Expenditures /b 23.7 25.8 33.1 41.7 41.0Of which: Current expenditures 18.4 19.4 23.0 24.9 26.8Of which: Capital expenditures /c 4.4 5.0 8.4 12.6 11.8Of which: Financial investment /d 0.9 1.4 1.8 4.2 2.4
Local Government Expenditures 3.2 3.8 4.4 5.0 5.6Of which: Current expenditures 2.8 3.3 3.9 4.3 4.9Of which: Capital expenditures 0.4 0.5 0.5 0.6 0.7
Government Corporation Capital Expenditures 5.0 8.7 11.7 11.8 14.1
Consolidated Public Expenditures 31.9 38.3 49.4 58.5 60.7Of which; Gov't. current expenditures /e 21.2 22.7 27.0 29.2 31.7Of which: Public fixed investment /f 9.8 14.2 20.6 25.0 26.6Of which: FinancialL investment 0.9 1.4 1.8 4.2 2.4
Percentage of GNP
Gross National Government Expenditures 14.7 13.6 14.4 15.;' 13.8Less: equity contributions to gov't corps. 1.0 1.3 1.3 1.f 1.5Less: transfers to local government 0.4 0.5 0.6 0. 0.6
Net National Government Expenditures 13.3 11.7 12.5 13.1 11.6
Local Government Expenditures 1.8 1.7 1.7 1.( 1.6
Government Corporatior Capital Expenditures 2.8 4.0 4.4 4.r; 4.5
Consolidated Public Expenditures 17.9 17.4 18.7 19.t! 17.7Of which: Gov't. current expenditures 11.9 10.4 10.2 9.( 9.0Of which: Public fixed investment 5.5 6.5 7.9 8.8 8.1Of which: Financial investment 0.5 0.6 0.7 1.L. 0.7
/a Including net lending./b National government expenditures net of contributions and transfers to
nonfinancial government corporations and local governments./c Infrastructure and noninfrastructure.7- Budgetary contributions to financial institutions and to National DevAlop-
ment Company, and net lending./e National government and local government current expenditures.If National government capital expenditures on its own account, capital axpen-
ditures of nonfinancial government corporations, and capital expenditi-res oflocal governments.
Sources: Tables 5.1, 5.6 and 5.7.
(See footnote on following page.)
Table 5.9Page 2 of 2
- 109 -
Note: The consolidation methodology recommended in the IMF lianual on GovernmentFinance Statistics has been employed in Table 5.9. "In compilingstatistics for a sector of government it is necessary to eliminatetransactions between all units within the circle of government beingmeasured and combine the sum of their 'external' transactions crossingthe circle to and from the rest of the economy. This process is referredto as consolidation." (p. 84) In the case of Table 5.9, the "circle"includes the national government, local governments, and the investmentprograms of the major government corporations. "Consolidation ofstatistics for government and nonfinancial enterprises requires theelimination of payments and receipts between them, aggregation of theirother transactions excluding enterprises operating receipts and payments(italics added), and presentation of eliminated data.... Most governmenttransactions are nonindustrial in character and represent either revenueswhich the government can dispose of freely or expenditure for eitherconsumption or capital. Enterprise receipts, however, come mainly fromthe sale of their product, with enterprise expenditures devoted toproduction of goods and services for sale. The combination of productionaccount transactions of enterprises with the income and outlay accounttransactions of government do not generally produce a useful aggregate.Consolidation of the two sectors, therefore, should be based onenterprises' income and outlay account transactions, showing instead oftheir operating receipts and operating expenditures their operatingsurplus or deficit." (p. 105)
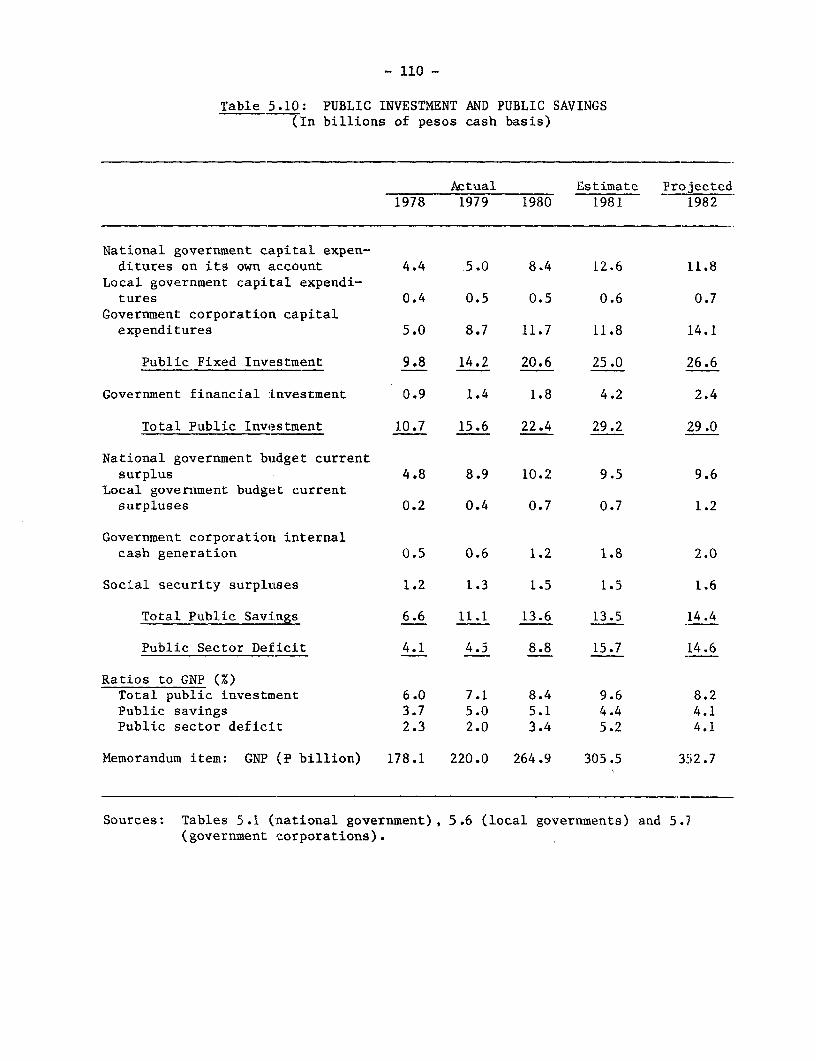
- 110 -
Table 5.10: PUBLIC INVESTMENT AND PUBLIC SAVINGS(In billions of pesos cash basis)
Actual Estimate Projected1978 1979 1980 1981 1982
National government capital expen-ditures on its own account 4.4 5.0 8.4 12.6 11.8
Local government capital expendi-tures 0.4 0.5 0.5 0.6 0.7
Government corporation capitalexpenditures 5.0 8.7 11.7 11.8 14.1
Public Fixed Investment 9.8 14.2 20.6 25.0 26.6
Government financial investment 0.9 1.4 1.8 4.2 2.4
Total Public Investment 10.7 15.6 22.4 29.2 29.0
National government budget currentsurplus 4.8 8.9 10.2 9.5 9.6
Local government budget currentsurpluses 0.2 0.4 0.7 0.7 1.2
Government corporation internalcash generation 0.5 0.6 1.2 1.8 2.0
Social security surpluses 1.2 1.3 1.5 1.5 1.6
Total Public Savings 6.6 11.1 13.6 13.5 14.4
Public Sector Deficit 4.1 4.5 8.8 15.7 14.6
Ratios to GNP (%)Total public investment 6.0 7.1 8.4 9.6 8.2Public savings 3.7 5.0 5.1 4.4 4.1Public sector deficit 2.3 2.0 3.4 5.2 4.1
Memorandum item: GNP (P billion) 178.1 220.0 264.9 305.5 352.7
Sources: Tables 5.1 (national government), 5.6 (local governments) and 5.7(government corporations).
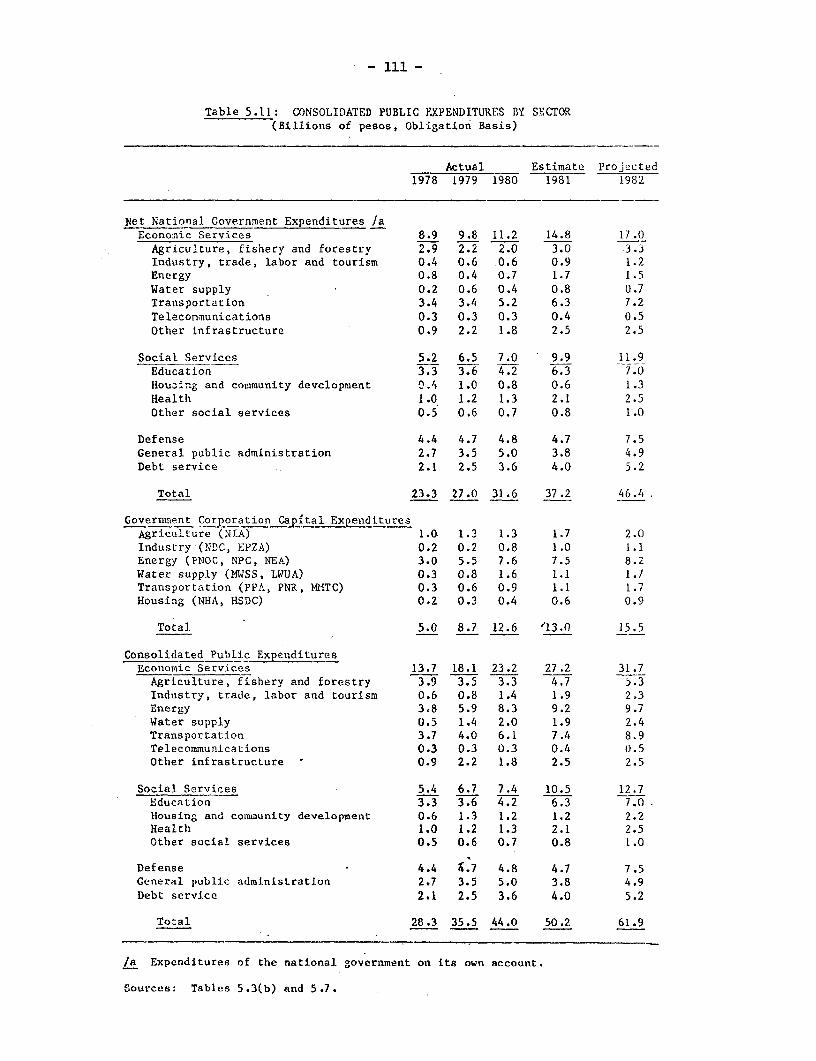
- 111 -
Table 5.11: CONSOLIDATED PUBLIC EXPENDITURES BY SECTOR(Billions of pesos, Obligation Basis)
Actual Estimate Projected1978 1979 1980 1981 1982
Net National Government Expenditures /aEconomic Services 8.9 9.8 11.2 14.8 17.0
Agriculture, fishery and forestry 2.9 2.2 2.0 3.0 3.3Industry, trade, labor and tourism 0.4 0.6 0.6 0.9 1.2Energy 0.8 0.4 0.7 1.7 1.5Water supply 0.2 0.6 0.4 0.8 0.7Transportation 3.4 3.4 5.2 6.3 7.2Telecommunications 0.3 0.3 0.3 0.4 0.5Other infrastructure 0.9 2.2 1.8 2.5 2.5
Social Services 5.2 6.5 7.0 9.9 11.9Education 3.3 3.6 4.2 6.3 7.0Houring and community development 0.4 1.0 0.8 0.6 1.3Health 1.0 1.2 1.3 2.1 2.5Other social services 0.5 0.6 0.7 0.8 1.0
Defense 4.4 4.7 4.8 4.7 7.5General public administration 2.7 3.5 5.0 3.8 4.9Debt service 2.1 2.5 3.6 4.0 5.2
Total 23.3 27.0 31.6 37.2 46.4
Governmnent Corporation Capital ExpendituresAgriculture (141A) 1.0. 1.3 1.3 1.7 2.0Industry (NDC, EPZA) 0.2 0.2 0.8 1.0 1.1Energy (PNOC, NPC, NEA) 3.0 5.5 7.6 7.5 8.2Water supply (MWSS, LWUA) 0.3 0.8 1.6 1.1 1.7Transportation (PPA, PNR, INITC) 0.3 0.6 0.9 1.1 1.7Housing (NHA, HSDC) 0.2 0.3 0.4 0.6 0.9
Total 5.0 8.7 12.6 '13.0 15.5
Consolidated Public ExpendituresEconomic Services 13.7 18.1 23.2 27.2 31.7
Agriculture, fishery and forestry 3.9 3.5 3.3 4.7 5.3Industry, trade, labor and tourism 0.6 0.8 1.4 1.9 2.3Energy 3.8 5.9 8.3 9.2 9.7Water supply 0.5 1.4 2.0 1.9 2.4Transportation 3.7 4.0 6.1 7.4 8.9Telecoimmunications 0.3 0.3 0.3 0.4 0.5Other infrastructure - 0.9 2.2 1.8 2.5 2.5
Social Services 5.4 6.7 7.4 10.5 12.7Education 3.3 3.6 4.2 6.3 7.0Housing and community development 0.6 1.3 1.2 1.2 2.2Health 1.0 1.2 1.3 2.1 2.5Other social services 0.5 0.6 0.7 0.8 1.0
Defense 4.4 4.7 4.8 4.7 7.5General public administration 2.7 3.5 5.0 3.8 4.9Debt service 2.1 2.5 3.6 4.0 5.2
Total 28.3 35.5 44.0 50.2 61.9
/a Expenditures of the national government on its own account.
Sources: Tables 5.3(b) and 5.7.
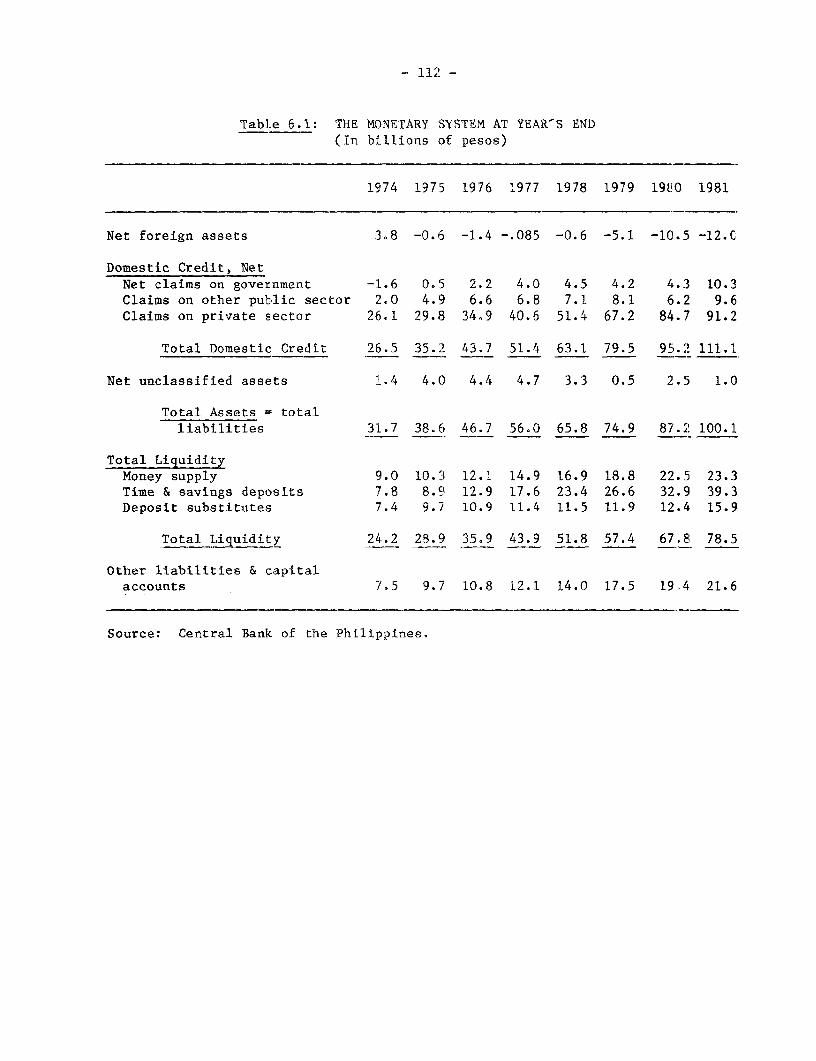
- 112 -
Table 6.1: THE MONETARY SYSTEM AT YEAR'S END(In billions of pesos)
1974 1975 1976 1977 1978 1979 19EO 1981
Net foreign assets 3.8 -0.6 -1.4 -.085 -0.6 -5.1 -10.5 -12.C
Domestic Credit, NetNet claims on government -1.6 0.5 2.2 4.0 4.5 4.2 4.3 10.3Claims on other public sector 2.0 4.9 6.6 6.8 7.1 8.1 6.2 9.6Claims on private sector 26.1 29.8 34.9 40.6 51.4 67.2 84.7 91.2
Total Domestic Credit 26.5 35.2 43.7 51.4 63.1 79.5 95.2 111.1
Net unclassified assets 1.4 4.0 4.4 4.7 3.3 0.5 2.5 1.0
Total Assets = totalliabilities 31.7 38.6 46.7 56.0 65.8 74.9 87.2 100.1
Total LiquidityMoney supply 9.0 10.3 12.1 14.9 16.9 18.8 22.5 23.3Time & savings deposits 7.8 8.9 12.9 17.6 23.4 26.6 32.9 39.3Deposit substitutes 7.4 9.7 10.9 11.4 11.5 11.9 12.4 15.9
Total Liquidity 24.2 28.9 35.9 43.9 51.8 57.4 67.E 78.5
Other liabilities & capitalaccounts 7.5 9.7 10.8 12.1 14.0 17.5 19,4 21.6
Source: Central Bank of the Philippines.

- 113 -
Table 6.2: RESERVE MONEY AT YEAR'S END(In millions of pesos)
1977 1978 1979 1980 1981
Net Foreign AssetsAssets 11,859 14,574 18,675 24,728 22,429Liabilities -6,890 -7,364 -10,932 -17,918 -20,928
Total 4,969 7,210 7,743 6,810 1,501
Net Claims on GovernmentClaims on government 4,316 5,727 6,247 6,827 11,290Government deposits -1,486 -2,630 -2,299 -2,335 -2,460
Total 2,830 3,097 3,948 4,492 8,830
Claims on official entities 806 741 682 556 460
Claims on commercial banks 2,904 3,645 6,743 10,207 12,473
Claims on other financial institutions 2,659 3,267 4,131 4,831 6,856
Bonds (CBCIs) -7,997 -9,907 -11,941 -11,439 -10,061
Other items (net) 3,643 4,040 3,333 739 -2,372
Total Reserve Money 9,814 12,093 14,629 16,196 17,687
Source: Central Bank of the Philippines.
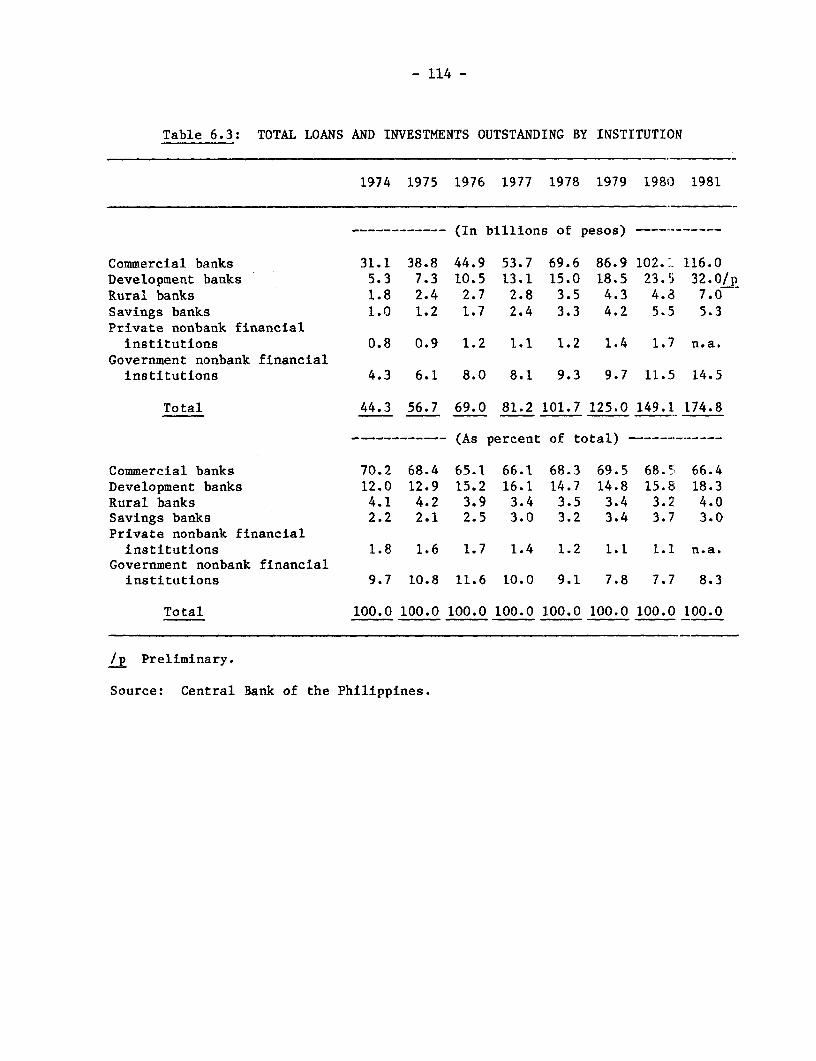
- 114 -
Table 6.3: TOTAL LOANS AND INVESTMENTS OUTSTANDING BY INSTITUTION
1974 1975 1976 1977 1978 1979 1980) 1981
---- (In billions of pesos) ---------…
Commercial banks 31.1 38.8 44.9 53.7 69.6 86.9 102.1 116.0Development banks 5.3 7.3 10.5 13.1 15.0 18.5 23.5 32.0/pRural banks 1.8 2.4 2.7 2.8 3.5 4.3 4.8 7.0Savings banks 1.0 1.2 1.7 2.4 3.3 4.2 5.5 5.3Private nonbank financialinstitutions 0.8 0.9 1.2 1.1 1.2 1.4 1.7 n.a.
Government nonbank financialinstitutions 4.3 6.1 8.0 8.1 9.3 9.7 11.5 14.5
Total 44.3 56.7 69.0 81.2 101.7 125.0 149.1 174.8
------------ (As percent of total) …
Commercial banks 70.2 68.4 65.1 66.1 68.3 69.5 68.5 66.4Development banks 12.0 12.9 15.2 16.1 14.7 14.8 15.8 18.3Rural banks 4.1 4.2 3.9 3.4 3.5 3.4 3.2 4.0Savings banks 2.2 2.1 2.5 3.0 3.2 3.4 3.7 3.0Private nonbank financialinstitutions 1.8 1.6 1.7 1.4 1.2 1.1 1.1 n.a.
Government nonbank financialinstitutions 9.7 10.8 11.6 10.0 9.1 7.8 7.7 8.3
Total 100.0 100.0 100.0 100.0 100.0 100.0 100.0 100.0
/p Preliminary.
Source: Central Bank of the Philippines.

- 115 -
Table 6.4: TOTAL ASSETS OF THE FINANCIAL SYSTEM(In billions of pesos)
1974 1975 1976 1977 1978 1979 1980 1981
Central Bank 21.4 26.1 29.0 29.0 38.4 51.0 65.4 75.6
Banking System
Commercial Banks 42.4 53.2 58.7 68.7 89.8 113.9 138.4 162.0Private 29.9 35.1 40.2 42.6 56.4 70.0 85.1 n.a.Government 12.5 18.1 18.5 18.6 22.3 28.9 34.6 -Foreign banks 7.5 11.1 15.0 18.7 -
Thrift Banks 1.7 2.1 3.0 4.1 5.8 7.7 10.6 11.1Savings 1.2 1.4 2.0 2.8 3.9 5.4 7.4 7.0Private development 0.3 0.4 0.5 0.6 0.8 1.0 1.6 2.0Savings & loan associations 0.2 0.3 0.5 0.7 0.9 1.3 1.6 2.1
Rural banks 2.1 2.8 3.0 3.4 4.1 5.0 5.6 6.4
Specialized Govt. Banks 7.9 11.8 15.2 19.1 21.7 27.4 34.2 41.2/bDevelopment Bank of the
Philippines 6.7 9.6 12.7 15.9 18.1 23.2 28.9 9Land Bank 1.2 2.1 2.4 3.1 3.5 4.1 5.2 2Philippine Amanah Bank - 0.1 0.1 0.1 0.1 0.1 0.1 1
Total Banking System 54.1 69.9 79.9 95.3 121.4 154.0 188.8 220.7
Nonbank Financial Intermediaries
Insurance Companies 10.0 11.9 15.2 17.5 21.6 24.6 28.5 31.0Governmenit /a 6.5 7.7 10.0 11.3 13.8 15.6 19.5 22.0Private 3.5 4.2 5.2 6.2 7.8 9.0 9.0p 9.0p
Investmyent Institutions 6.9 10.3 13.2 14.5 16.0 20.4 25.6 - 21.2Finance companies 2.3 3.5 4.6 5.8 6.8 9.7 11.9 11.8pInvestment companies 0.7 2.0 3.8 3.9 4.4 4.1 5.0 5.4pOthers 3.9 4.8 4.8 4.8 4.8 6.6 8.7 4.0
Trust operations 2.0 2.6 3.3 0.5 0.8 1.2 1.7 n.a.
Other Financial Intermediaries 1.52 2.03 2.12 1.72 1.92 1.92 2.12 1.72Mutual building & loan
associations 0.02 0.03 0.02 0.02 0.02 0.02 0.02 0.02Credit unions n.a. n.a. n.a. n.a. n.a. n.a. n.a. n.a.Security dealers & brokers n.a. 1.1 1.1 1.0 1.1 1.0 1.0 l.OpNonbank savings & loan
associations 0.1 0.1 0.1 0.1 0.2 0.3 0.3 n.a.Agricultural creditadministration 0.5 0.7 0.7 0.4 0.4 0.4 0.5 0.4
Pawnbrokers 0.1 0.1 0.2 0.2 0.2 0.2 0.3 0.3p
Total NonbankIntermediaries 20.3 26.8 33.8 34.2 40.3 48.1 56.9 53.92/c
/a Includes Govcrnment Service insurance Systems (GSIS) and Social SecuritySystems (SSS).
lb As of November.
/c As of June.
n.a. - not available.
p - prelimtnary.
Source: Central Bank of the Philippines.
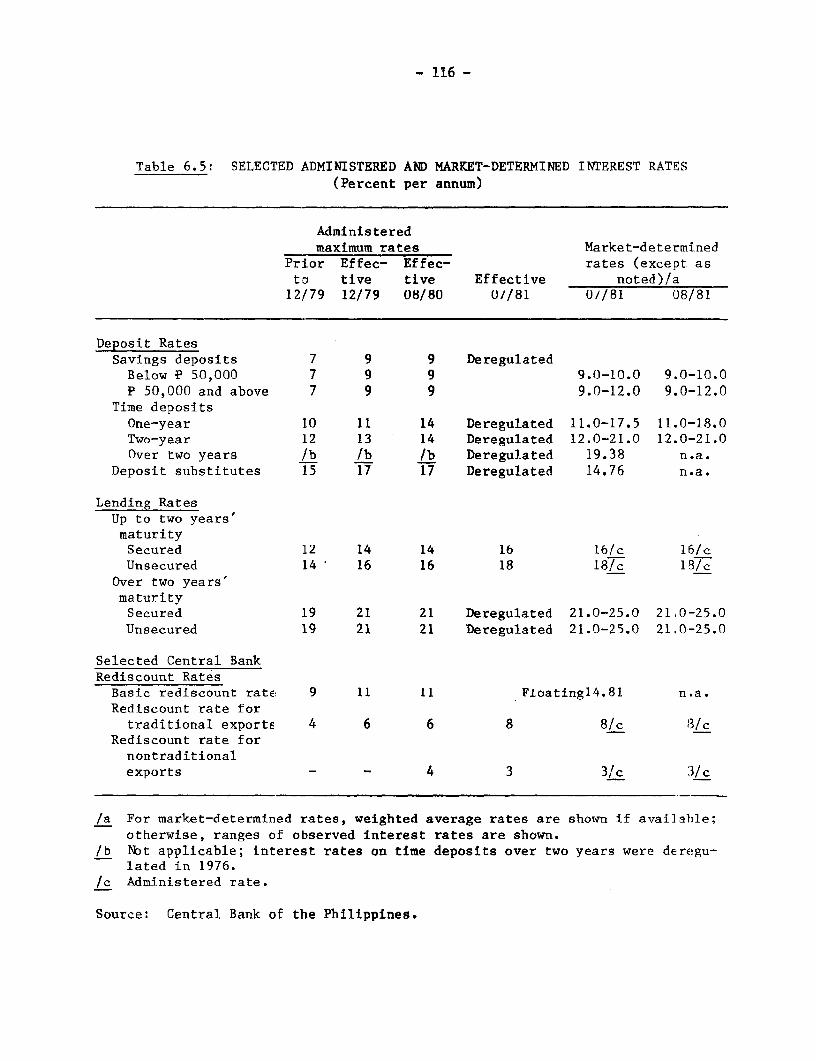
- 116 -
Table 6.5: SELECTED ADMINISTERED AND MARKET-DETERMINED INTEREST RAI'ES(Percent per annum)
Administeredmaximum rates Market-determined
Prior Effec- Effec- rates (except asto tive tive Effective noted)/a12/79 12/79 08/80 0//81 (//81 08/81
Deposit RatesSavings deposits 7 9 9 DeregulatedBelow P 50,000 7 9 9 9.()-10.0 9.0-10.0P 50,000 and above 7 9 9 9.0-12.0 9.0-12.0
Time depositsOne-year 10 11 14 Deregulated 11.0-17.5 11.0-18.0Two-year 12 13 14 Deregulated 12.0-21.0 12.0-21.0Over two years /b /b /b Deregulated 19.38 n.a.
Deposit substitutes 15 17 17 Deregulated 14.76 n.a.
Lending RatesUp to two yearsmaturitySecured 12 14 14 16 16/c 16/cUnsecured 14 16 16 18 18/c 18/c
Over two years'maturitySecured 19 21 21 Deregulated 21.0-25.0 21,0-25.0Unsecured 19 21 21 Deregulated 21.0-25.0 21,0-25.0
Selected Central BankRediscount RatesBasic rediscount rate 9 11 11 Fioatingl4.81 n.a.Rediscount rate fortraditional exports 4 6 6 8 8/c 3/c
Rediscount rate fornontraditionalexports - - 4 3 3/c 3 /c
/a For market-determined rates, weighted average rates are shown if available;otherwise, ranges of observed interest rates are shown.
/b Not applicable; interest rates on time deposits over two years were deregu-lated in 1976.
Xc Administered rate.
Source: Central Bank of the Philippines.
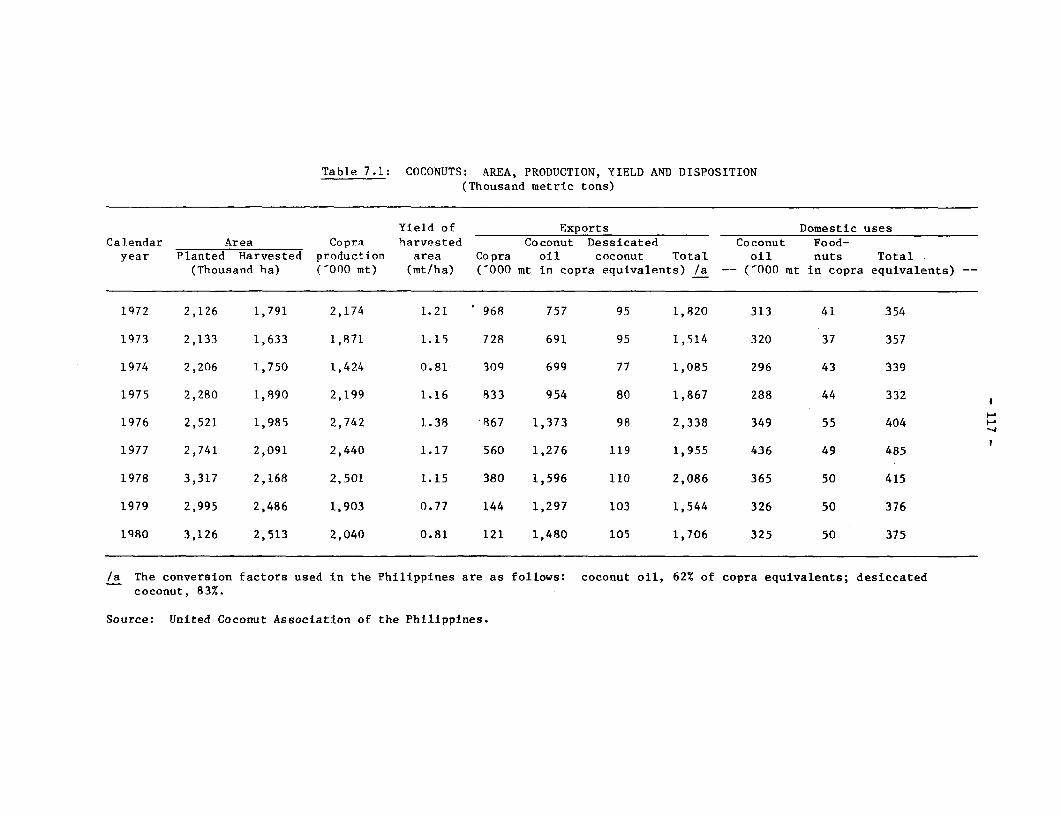
Table 7.1: COCONUTS: AREA, PRODUCTION, YIELD AND DISPOSITION(Thousand metric tons)
Yield of Exports Domestic usesCalendar Area Copra harvested Coconut Dessicated Coconut Food-
year Planted Harvested production area Copra oil coconut Total oil nuts Total(Thousand ha) (-000 mt) (mt/ha) (OOO mt in copra equivalents) /a -- VOOO mt in copra equivalents) --
1972 2,126 1,791 2,174 1.21 968 757 95 1,820 313 41 354
1973 2,133 1,633 1,871 1.15 728 691 95 1,514 320 37 357
1974 2,206 1,750 1,424 0.81 309 699 77 1,085 296 43 339
1975 2,280 1,890 2,199 1.16 833 954 80 1,867 288 44 332
1976 2,521 1,985 2,742 1.38 867 1,373 98 2,338 349 55 404
1977 2,741 2,091 2,440 1.17 560 1,276 119 1,955 436 49 485
1978 3,317 2,168 2,501 1.15 380 1,596 110 2,086 365 50 415
1979 2,995 2,486 1,903 0.77 144 1,297 103 1,544 326 50 376
1980 3,126 2,513 2,040 0.81 121 1,480 105 1,706 325 50 375
/a The conversion factors used in the Philippines are as follows: coconut oil, 62% of copra equivalents; desiccatedcoconut, 83%.
Source: United Coconut Association of the Philippines.

- 118 -
Table 7.2: SUGAR: AREA, YIELD, EXTRACTION RATE, PRODUCTION AND EXPOCTS
Exports!/cCrop Area Yield Extraction Sugar OtherYear/a Planted sane Sugar rate/b production US markets Total
(000 ha) (mt/ha) (x) ('000 mt) - -('000 mt)- -
1972 420 46.3 4.3 9.3 1,816 1,299 - 1,299
1973 435 '52.1 5.2 9.9 2,245 1,295 64 1,359
1974 468 '55.7 5.2 9.4 2,446 1,309 278 1,587
1975 514 52.2 4.7 9.7 2,394 420 645 1,065
1976 530 55.9 5.2 9.8 2,875 961 505 1,466
1977 553 52.5 6.2 9.8 3,531 1,019 1,131 2,150
1978 498 52.8 5.4 9.8 2,335 965 625 1,590
1979 436 54.6 5.6 10.0 2,287 477 521 998
1980 417 59.6 5.6 10.1 2,267 391 1,228 :L,618
/a The crop year for sugar begins September 1 and ends August 31.
/b The extraction rate used is the ratio of sugar to sugarcane.
/c Export data here is by crop year. The export data used for the balance ofpayments tables are for calendar years as reported by the customs depart:-ment.
Source: Philippine Sugar Commission.
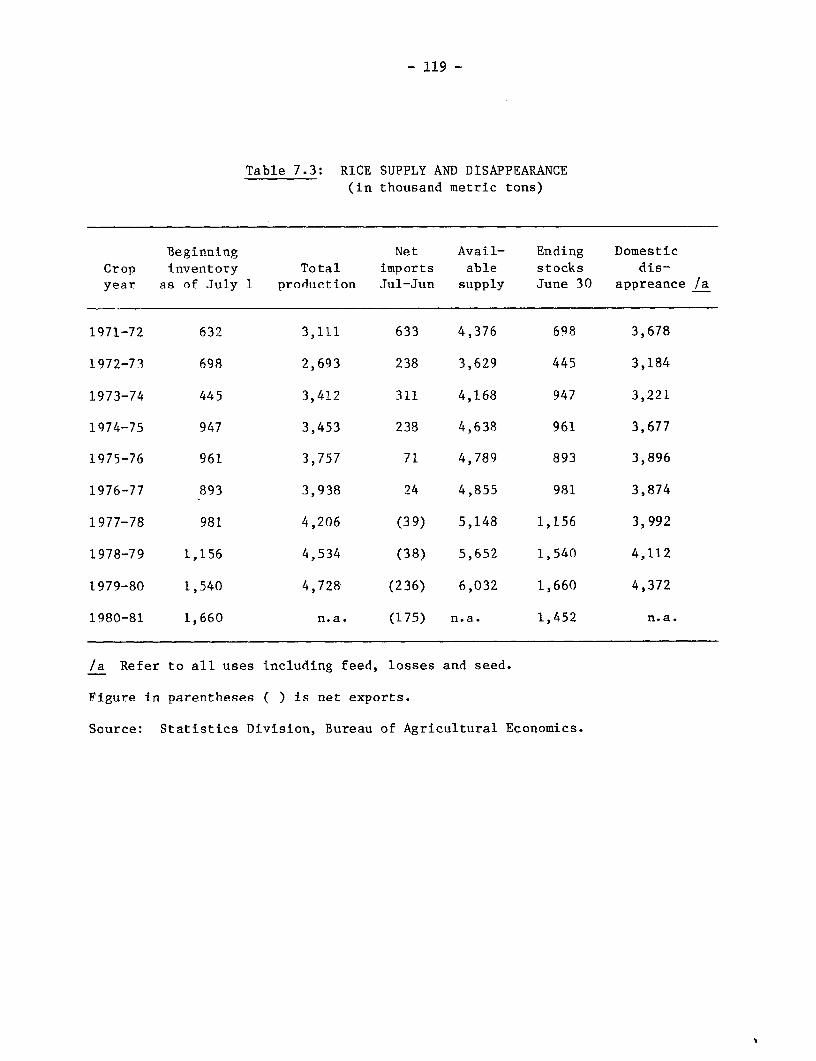
- 119 -
Table 7.3: RICE SUPPLY AND DISAPPEARANCE(in thousand metric tons)
Beginning Net Avail- Ending DomesticCrop inventory Total imports able stocks dis-year as of July 1 production Jul-Jun supply June 30 appreance /a
1971-72 632 3,111 633 4,376 698 3,678
1972-73 698 2,693 238 3,629 445 3,184
1973-74 445 3,412 311 4,168 947 3,221
1974-75 947 3,453 238 4,638 961 3,677
1975-76 961 3,757 71 4,789 893 3,896
1976-77 893 3,938 24 4,855 981 3,874
1977-78 981 4,206 (39) 5,148 1,156 3,992
1978-79 1,156 4,534 (38) 5,652 1,540 4,112
1979-80 1,540 4,728 (236) 6,032 1,660 4,372
1980-81 1,660 n.a. (175) n.a. 1,452 n.a.
/a Refer to all uses including feed, losses and seed.
Figure in parentheses ( ) is net exports.
Source: Statistics Division, Bureau of Agricultural Economics.
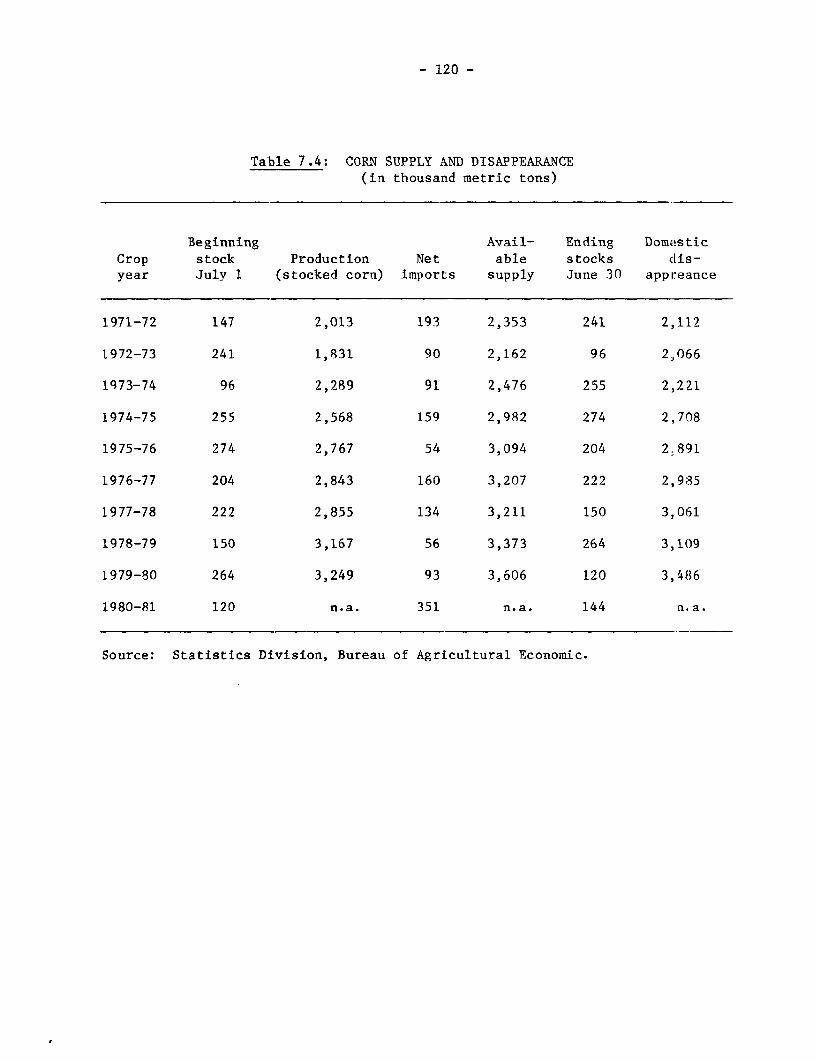
- 120 -
Table 7.4: CORN SUPPLY AND DISAPPEARANCE(in thousand metric tons)
Beginning Avail- Ending Dome,sticCrop stock Production Net able stocks dtis-
year July 1 (stocked corn) imports supply June 30 app:reance
1971-72 147 2,013 193 2,353 241 2,112
1972-73 241 1,831 90 2,162 96 2,066
1973-74 96 2,289 91 2,476 255 2,221
1974-75 255 2,568 159 2,982 274 2,708
1975-76 274 2,767 54 3,094 204 2.891
1976-77 204 2,843 160 3,207 222 2,985
1977-78 222 2,855 134 3,211 150 3,061
1978-79 150 3,167 56 3,373 264 3,109
1979-80 264 3,249 93 3,606 120 3,486
1980-81 120 n.a. 351 n.a. 144 a.a.
Source: Statistics Division, Bureau of Agricultural Economic.

- 121 -
Table 7.5: MINOR CROPS: HARVESTED AREA, PRODUCTION AND YIELD
Crop year /a 1972 1973 1974 1975 1976 1977 1978 1979 1980
Area Harvested ('000 ha)Abaca 145 163 170 180 244 250 244 234 235
Bananas 244 248 212 233 298 299 284 328 317Coffee 55 61 65 65 77 66 84 95 109Cotton ... ... ... ... ... 1 9 1 4
Mango 41 40 44 47 36 33 35 38 39Pineapple 30 28 28 31 36 37 45 55 62Rootcrops 259 266 314 351 389 426 461 480 486Tobacco 78 84 87 85 86 79 74 37 56
Vegetables 66 66 69 75 54 56 57 53 53
Production ('000 mt)Abaca 110 119 126 134 139 151 130 159 171Bananas 980 1,010 1,240 1,690 2,271 2,395 3,156 4,179 3,977Coffee 52 51 53 62 80 82 122 115 144Cotton ... ... . ... .. 1 0.6 4Mango 139 188 192 239 293 307 329 363 374Pineapple 282 293 338 424 420 427 465 605 1,280Rootcrops 1,220 1,220 1,410 1,800 1,784 2,048 3,004 3,568 3,470Tobacco 57 65 64 57 59 52 57 51 39Vegetables 306 333 400 447 359 370 384 358 397
Yield (mt/ha)Abaca 0.76 0.73 0.74 0.74 0.60 0.60 0.50 0.68 0.73Bananas 4.02 4.07 5.85 7.25 7.60 8.00 11.10 12.70 12.55Coffee 0.95 0.84 0.82 0.95 1.04 1.20 1.40 1.21 1.32Cotton ... ... ... ... 0.25 0.50 0.40 0.57 1.11Mango 3.39 4.70 4.36 5.09 8.20 9.20 9.40 9.55 9.59Pineapple 9.40 10.50 12.10 13.70 11.90 11.60 10.30 11.00 20.65Rootcrops 4.71 4.59 4.49 5.13 4.60 4.80 6.50 7.43 7.14Tobacco 0.73 0.77 0.74 0.67 0.68 0.70 0.80 1.38 0.70Vegetables 4.64 5.05 5.80 5.96 6.60 6.60 6.70 6.75 7.49
/a Crop year is July through June.
Source: Bureau of Agricultural Economics.
k ~~~~~~~~~~~~~~~~~t

- 122 -
Table 7.6: PRODUCTION OF SELECTED LIVESTOCK AND FISHERY PRODUCTS
Calendar year 1972 1973 1974 1975 1976 1977 1978 1979 1980
Livestock Population(Millions of heads)
Chickens 50.10 50.00 57.40 /a 45.70 47.78 58.89 49.32 52.76
Hogs 7.74 8.63 11.70 /a 6.49 5.73 6.91 6.44 7.99
Cattle 1.93 2.10 2.24 /a 1.74 1.84 1.82 1.83 1.83
Carabao 4.71 4.94 5.23 /a 2.72 2.92 2.96 2.80 2.87
Fisheries ('000 mt)
Commercial (marine) 425 465 471 499 532 550 541 51.6 488
Municipal (coastal) 599 640 684 732 773 801 883 468 762
Fishponds 99 100 113 106 113 116 119 1''2 28'i
/a No survey in 1975.
Source: Bureau of Agricultural Economeics, Bureau of Fislheries and Aquatic Risources.
t
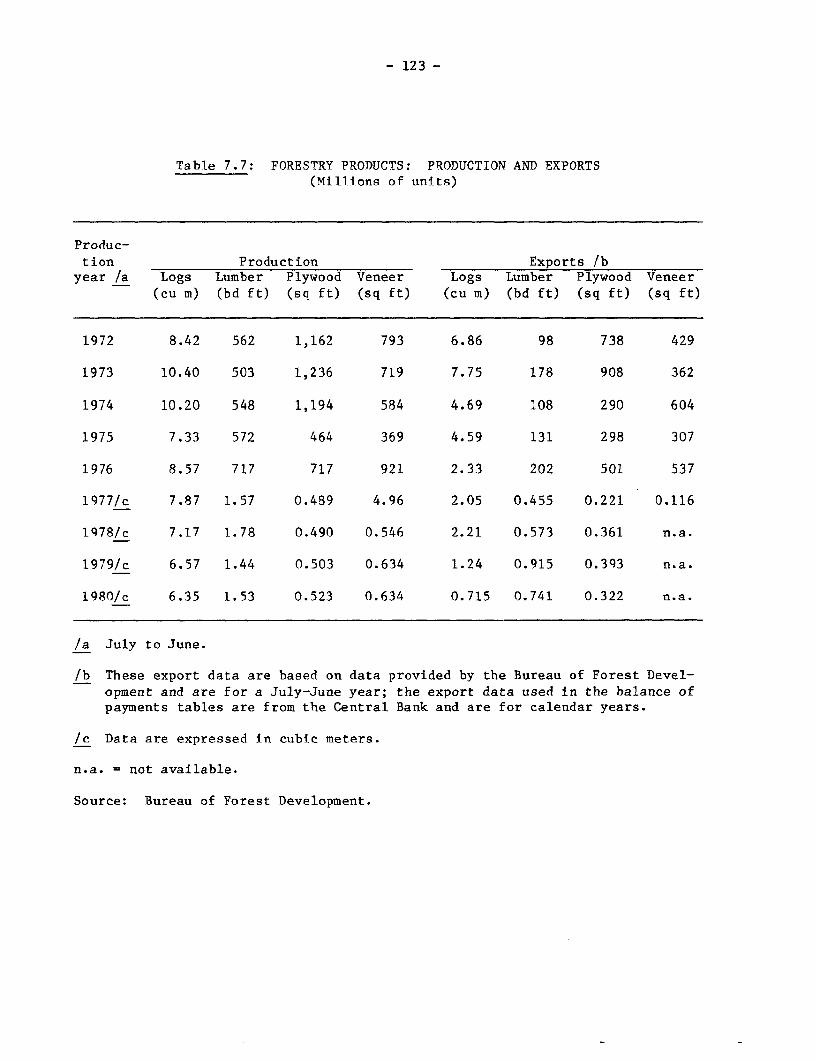
- 123 -
Table 7.7: FORESTRY PRODUCTS: PRODUCTION AND EXPORTS(Millions of units)
Produc-tion Production Exports /byear /a Logs Lumber Plywood Veneer Logs Lumber Plywood Veneer
(cu m) (bd ft) (sq ft) (sq ft) (cu m) (bd ft) (sq ft) (sq ft)
1972 8.42 562 1,162 793 6.86 98 738 429
1973 10.40 503 1,236 719 7.75 178 908 362
1974 10.20 548 1,194 584 4.69 108 290 604
1975 7.33 572 464 369 4.59 131 298 307
1976 8.57 717 717 921 2.33 202 501 537
1977/c 7.87 1.57 0.489 4.96 2.05 0.455 0.221 0.116
1978/c 7.17 1.78 0.490 0.546 2.21 0.573 0.361 n.a.
1979/c 6.57 1.44 0.503 0.634 1.24 0.915 0.393 n.a.
1980/c 6.35 1.53 0.523 0.634 0.715 0.741 0.322 n.a.
/a July to June.
/b These export data are based on data provided by the Bureau of Forest Devel-opment and are for a July-June year; the export data used in the balance ofpayments tables are from the Central Bank and are for calendar years.
/c Data are expressed in cubic meters.
n.a. = not available.
Source: Bureau of Forest Development.
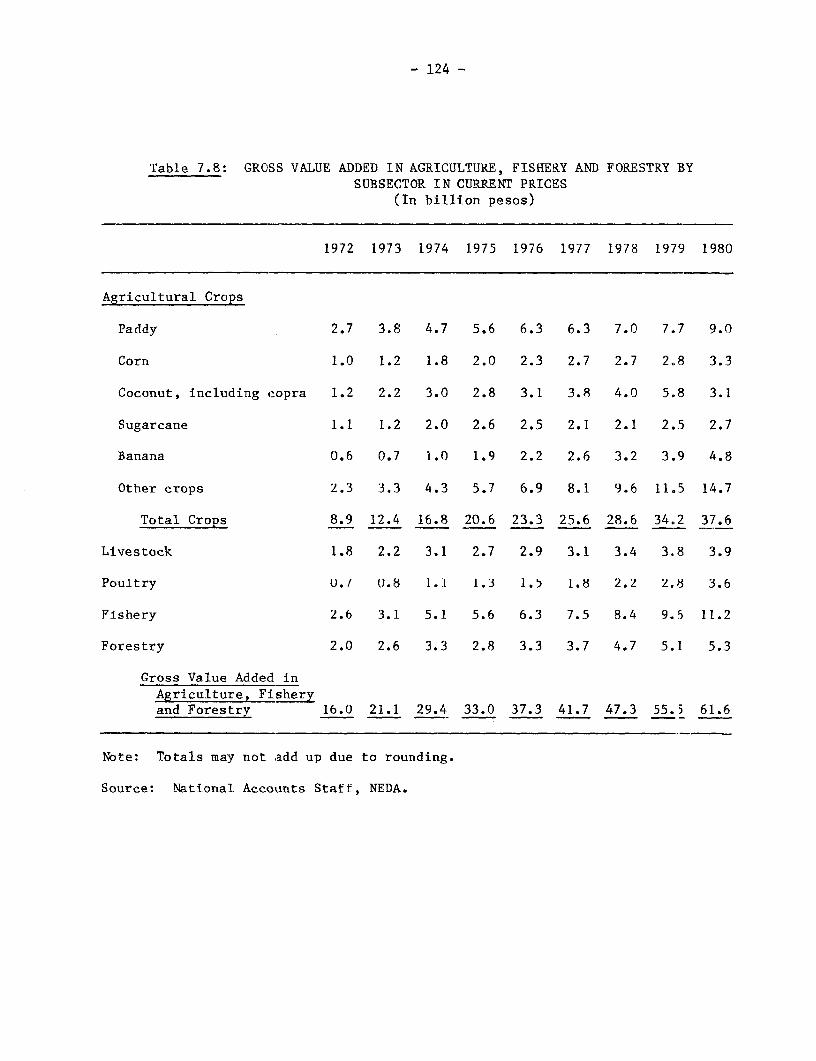
- 124 -
Table 7.8: GROSS VALUE ADDED IN AGRICULTURE, FISEERY AND FORESTRY BYSUBSECTOR IN CURRENT PRICES
(In billion pesos)
1972 1973 1974 1975 1976 1977 1978 1979 1980
Agricultural Crops
Paddy 2.7 3.8 4.7 5.6 6.3 6.3 7.0 7.7 9.0
Corn 1.0 1.2 1.8 2.0 2.3 2.7 2.7 2.8 3.3
Coconut, including copra 1.2 2.2 3.0 2.8 3.1 3.8 4.0 5.8 3.1
Sugarcane 1.1 1.2 2.0 2.6 2.5 2.1 2.1 2.5 2.7
Banana 0.6 0.7 1.0 1.9 2.2 2.6 3.2 3.9 4.8
Other crops 2.3 3.3 4.3 5.7 6.9 8.1 9.6 11.5 14.7
Total Crops 8.9 12.4 16.8 20.6 23.3 25.6 28.6 34.2 37.6
Livestock 1.8 2.2 3.1 2.7 2.9 3.1 3.4 3.8 3.9
Poultry U./ 0.8 1.1 1.3 1.5 1.8 2.2 2.8 3.6
Fishery 2.6 3.1 5.1 5.6 6.3 7.5 8.4 9.6 11.2
Forestry 2.0 2.6 3.3 2.8 3.3 3.7 4.7 5.1 5.3
Gross Value Added inAgriculture, Fisheryand Forestry 16.0 21.1 29.4 33.0 37.3 41.7 47.3 55.5 61.6
Note: Totals may not add up due to rounding.
Source: National Accounts Staff, NEDA.
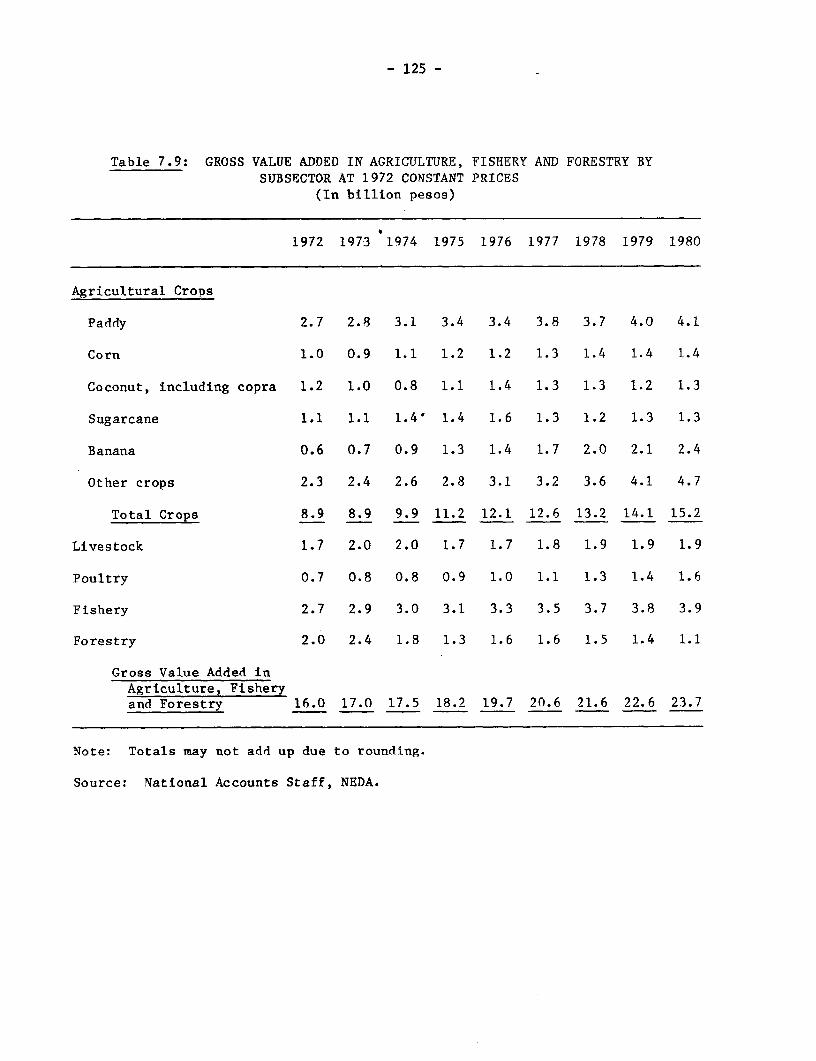
- 125 -
Table 7.9: GROSS VALUE ADDED IN AGRICULTURE, FISHERY AND FORESTRY BY
SUBSECTOR AT 1972 CONSTANT PRICES(In billion pesos)
1972 1973 1974 1975 1976 1977 1978 1979 1980
Agricultural Crops
Paddy 2.7 2.8 3.1 3.4 3.4 3.8 3.7 4.0 4.1
Corn 1.0 0.9 1.1 1.2 1.2 1.3 1.4 1.4 1.4
Coconut, including copra 1.2 1.0 0.8 1.1 1.4 1.3 1.3 1.2 1.3
Sugarcane 1.1 1.1 1.4' 1.4 1.6 1.3 1.2 1.3 1.3
Banana 0.6 0.7 0.9 1.3 1.4 1.7 2.0 2.1 2.4
Other crops 2.3 2.4 2.6 2.8 3.1 3.2 3.6 4.1 4.7
Total Crops 8.9 8.9 9.9 11.2 12.1 12.6 13.2 14.1 15.2
Livestock 1.7 2.0 2.0 1.7 1.7 1.8 1.9 1.9 1.9
Poultry 0.7 0.8 0.8 0.9 1.0 1.1 1.3 1.4 1.6
Fishery 2.7 2.9 3.0 3.1 3.3 3.5 3.7 3.8 3.9
Forestry 2.0 2.4 1.8 1.3 1.6 1.6 1.5 1.4 1.1
Gross Value Added inAgriculture, Fisheryand Forestry 16.0 17.0 17.5 18.2 19.7 20.6 21.6 22.6 23.7
Note: Totals may not add up due to rounding.
Source: National Accounts Staff, NEDA.
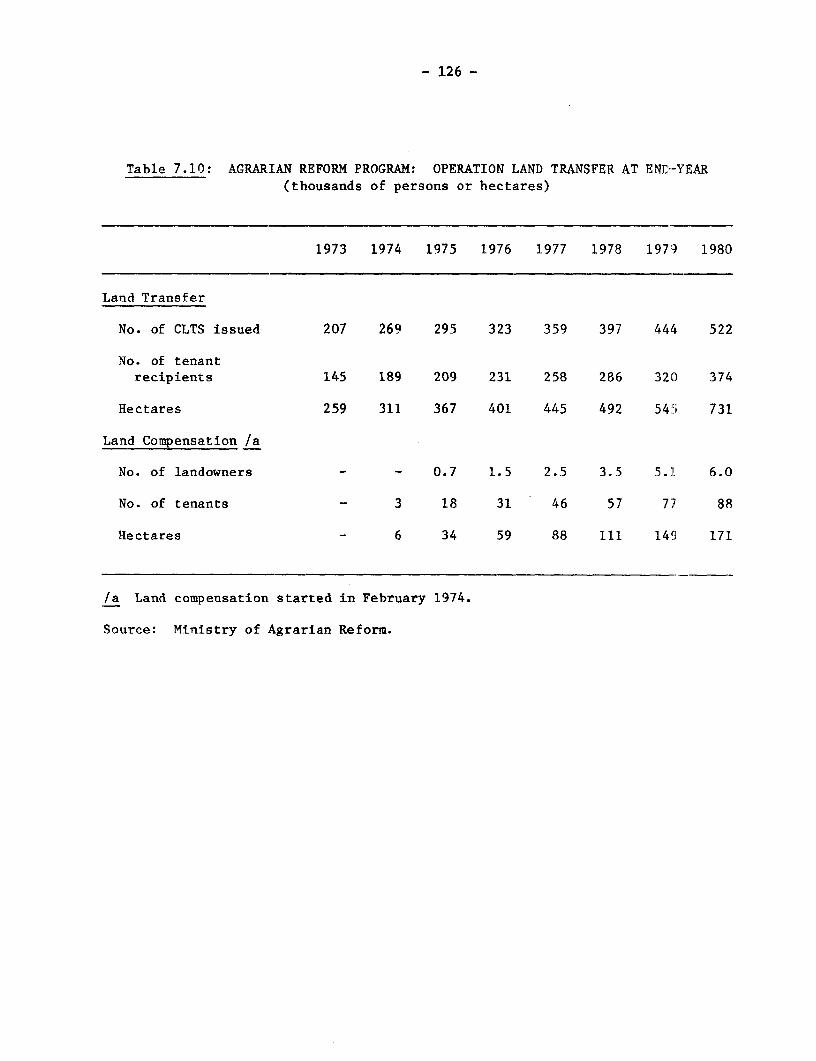
- 126 -
Table 7.10: AGRARIAN REFORM PROGRAM: OPERATION LAND TRANSFER AT END-YEAR(thousands of persons or hectares)
1973 1974 1975 1976 1977 1978 197') 1980
Land Transfer
No. of CLTS issued 207 269 295 323 359 397 444 522
No. of tenantrecipients 145 189 209 231 258 286 320 374
Hectares 259 311 367 401 445 492 54;5 731
Land Compensation /a
No. of landowners - - 0.7 1.5 2.5 3.5 5.1 6.0
No. of tenants - 3 18 31 46 57 7J' 88
Hectares - 6 34 59 88 111 149 171
/a Land compensation started in February 1974.
Source: Ministry of Agrarian Reform.
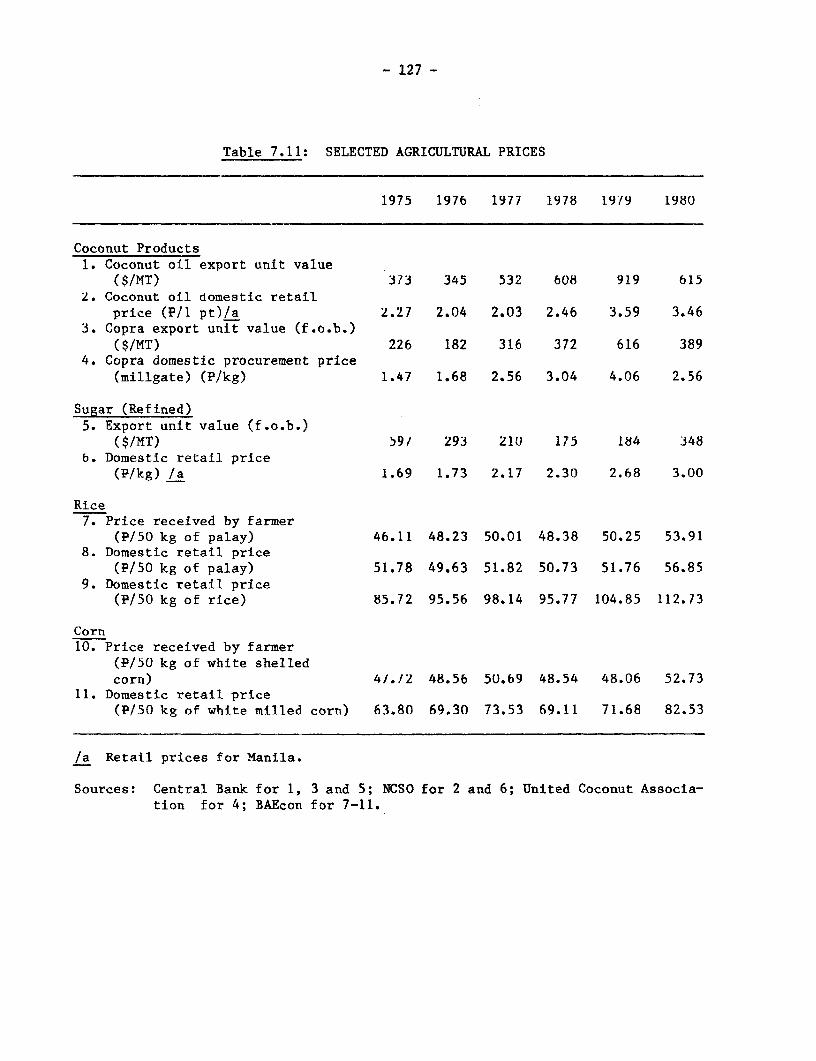
- 127 -
Table 7.11: SELECTED AGRICULTURAL PRICES
1975 1976 1977 1978 1919 1980
Coconut Products1. Coconut oil export unit value
($/MT) 373 345 532 608 919 6152. Coconut oil domestic retail
price (P/1 pt)/a 2.27 2.04 2.03 2.46 3.59 3.463. Copra export unit value (f.o.b.)
($/MT) 226 182 316 372 616 3894. Copra domestic procurement price
(millgate) (P/kg) 1.47 1.68 2.56 3.04 4.06 2.56
Sugar (Refined)5. Export unit value (f.o.b.)
($/MT) 59/ 293 210 175 184 3486. Domestic retail price
(P/kg) /a 1.69 1.73 2.17 2.30 2.68 3.00
Rice7. Price received by farmer
(P/50 kg of palay) 46.11 48.23 50.01 48.38 50.25 53.918. Domestic retail price
(P/50 kg of palay) 51.78 49.63 51.82 50.73 51.76 56.859. Domestic retail price
(P/50 kg of rice) 85.72 95.56 98.14 95.77 104.85 112.73
Corn10. Price received by farmer
(P/50 kg of white shelledcorn) 4/./2 48.5b 50.69 48.54 48.06 52.73
11. Domestic retail price(P/50 kg of white milled corn) 63.80 69.30 73.53 69.11 71.68 82.53
/a Retail prices for Manila.
Sources: Central Bank for 1, 3 and 5; NCSO for 2 and 6; United Coconut Associa-tion for 4; BAEcon for 7-11.

- 128 -
Table 7.12: SUPPORT PRICES FOR PALAY AND CORN GRAINS(P/kilo)
Price Support Effective date
Palay 1.(O Nbvember 28, 19741.00 19/51.10 May 29, 19/b1.1(0 19/71.10 19/81.30 April 1, 19791.40 July 1, 19801.45 October 21, 19801.55 June 17, 1981
Corn grains 0.80 October 15, 19740.80 19750.90 May 29, 19760.90 19770.90 19781.00 September 29, 19791.10 July 30, 19801.20 December 29, 19801.30 June 17, 1981
Source: NFA.

- 129 -
Table 7.13: SELLING PRJCES OF RICE AND CORN AT NFA OUTLETS(P/kilo)
Ric e Corn
1974 1.80 _
1975 1.80 1.05
1976 2.00 1.16
1977 2.00 1.16
1978 2.00 1.16
1979 2.10 1.23
1980 2.45 1.63
1981 2.85 2.15
Source: NFA.
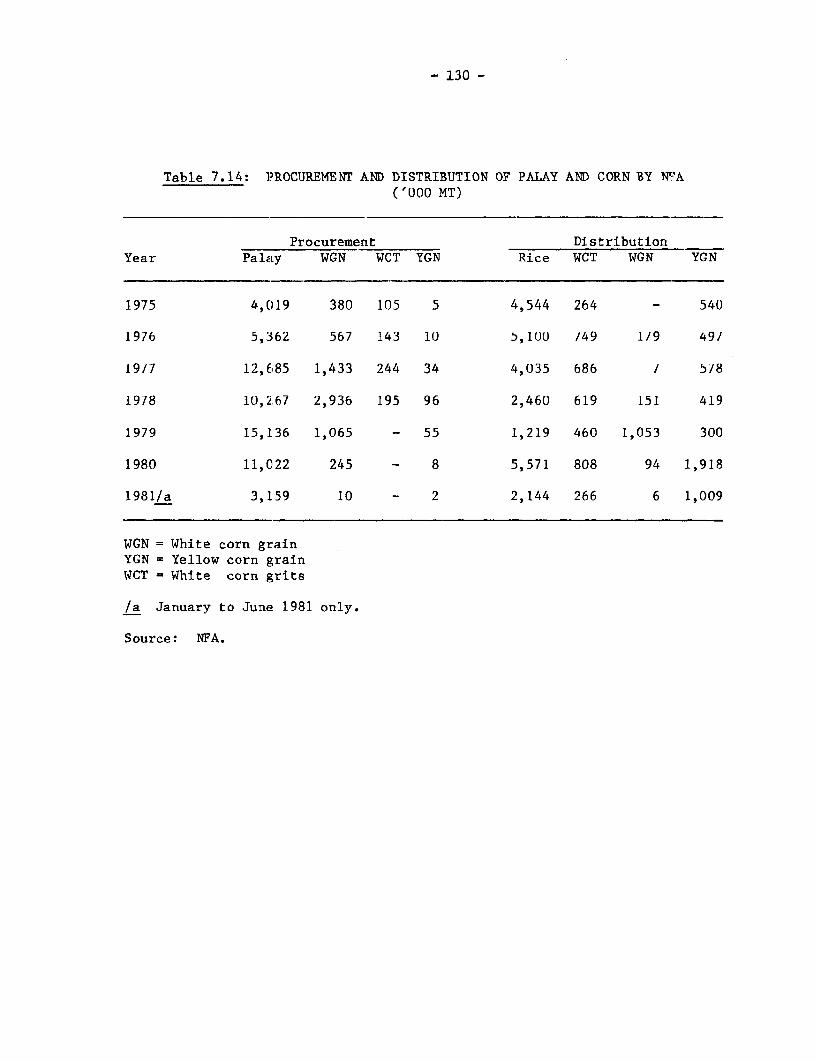
- 130 -
Table 7.14: PROCUREMENT AND DISTRIBUTION OF PALAY AND CORN BY NFA('000 MT)
Procurement DistributionYear Palay WGN WCT YGN Rice WCT WGN YGN
1975 4,(19 380 105 5 4,544 264 - 540
1976 5,-362 567 143 10 5,100 /49 1/9 497
19/7 12,685 1,433 244 34 4,035 686 / 5/8
1978 10,267 2,936 195 96 2,460 619 151 419
1979 15,136 1,065 - 55 1,219 460 1,053 300
1980 11,022 245 - 8 5,571 808 94 1,918
1981/a 3,159 10 - 2 2,144 266 6 1,009
WGN = White corn grainYGN = Yellow corn grainWCT = White corn grits
/a January to June 1981 only.
Source: NFA.

- 131 -
Table 7.15: AVERAGE IMPORT PRICE OF SELECTED FERTILIZERS($/MT C & F)
Grade 1973 1974 1975 1976 1977 1978 1979 1980
Urea 105.53 277.98 371.37 122.36 130.14 158.18 175.22 250.53
21-0-0 57.87 168.03 219.34 67.87 90.02 104.66 110.60 138.51
18-46-0 153.60 149.22 - - - 139.95 206.80 317.48
14-14-14 147.30 282.38 - - - 170.50 177.33 263.19
Note: 1973-77 - weighted average, 1978-80 - straight average.
Source: Fertilizer and Pesticide Authority.
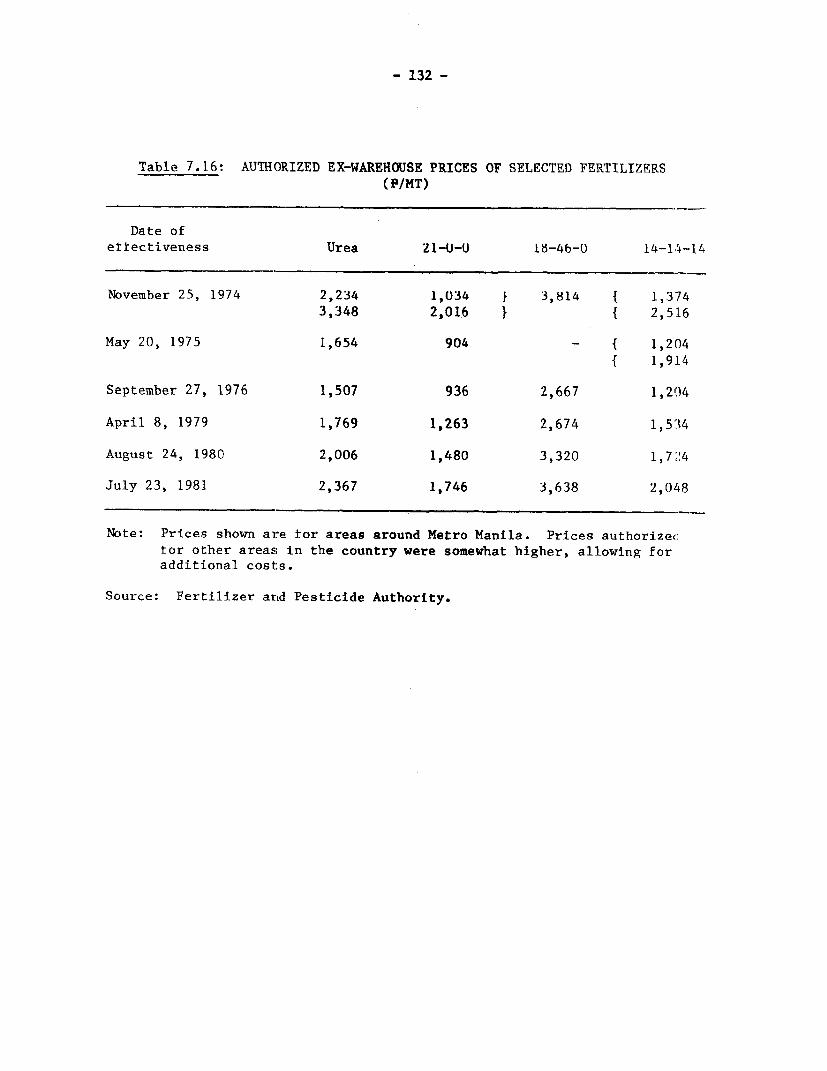
- 132 -
Table 7.16: AUTHORIZED EX-WAREHOUSE PRICES OF SELECTED FERTILIZERS(P/MT)
Date ofettectiveness Urea Z1-U-U 18-40-0 14-14-14
November 25, 1974 2,234 1,034 } 3,814 { 1,3743,348 2,016 1 { 2,516
May 20, 1975 1,654 904 - { 1,204
{ 1,914
September 27, 1976 1,507 936 2,667 1,2)4
April 8, 1979 1,769 1,263 2,674 1,5.34
August 24, 1980 2,006 1,480 3,320 1,72.4
July 23, 1981 2,367 1,746 3,638 2,048
Note: Prices shown are tor areas around Metro Manila. Prices authorizec:tor other areas in the country were somewhat higher, allowing foradditional cost:s.
Source: Fertilizer and Pesticide Authority.
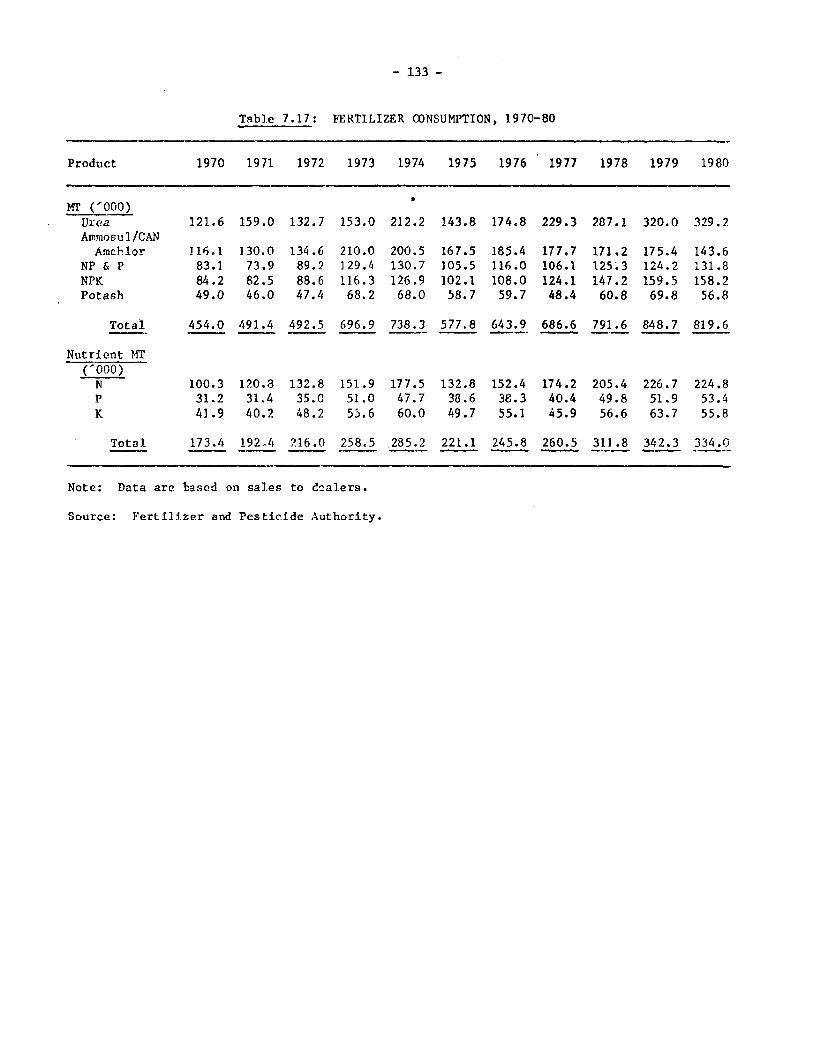
- 133 -
Table 7.17: FERTILIZER CONSUMPTION, 1970-80
Product 1970 1971 1972 1973 1974 1975 1976 1977 1978 1979 1980
MT (0ooo)Urea 121.6 159.0 132.7 153.0 212.2 143.8 174.8 229.3 287.1 320.0 329.2Anmosul/CANAmchlor l16.1 130.0 134.6 210.0 200.5 167.5 185.4 177.7 171.2 175.4 143.6
NP & P 83.1 73.9 89.2 129.4 130.7 105.5 116.0 106.1 125.3 124.2 131.8NPK 84.2 82.5 88.6 116.3 126.9 102.1 108.0 124.1 147.2 159.5 158.2Potash 49.0 46.0 47.4 68.2 68.0 58.7 59.7 48.4 60.8 69.8 56.8
Total 454.0 491.4 492.5 696.9 738.3 577.8 643.9 686.6 791.6 848.7 819.6
Nutrient MT(-000)N 100.3 120.8 132.8 151.9 177.5 132.8 152.4 174.2 205.4 226.7 224.8P 31.2 31.4 35.0 51.0 47.7 38.6 38.3 40.4 49.8 51.9 53.4K 41.9 40.2 48.2 55.6 60.0 49.7 55.1 45.9 56.6 63.7 55.8
Total 173.4 192.4 216.0 258.5 285.2 221.1 245.8 260.5 311.8 342.3 334.0
Note: Data are based oni sales to dcalers.
Source: Fertilizer and Pesticide Authority.

- 134 -
Table 7.18: TERMS OF TRADE OF THE AGRICULTURAL AND FOOD SECTORS(1972 = 100)
Agricult:ural terms of trade Food terms of tradeAgricultural Nonagricultural Terms of Food Nonfood Terms cf
Year prices /a prices /b trade prices /c prices /d trada
1960 37.0 49.6 0.746 37.0 61.2 0.6051961 37.8 51.3 0.737 39.7 62.0 0.64)1962 40.7 54.5 0.747 39.2 63.5 0.6171963 45.4 58.6 0.775 43.7 64.9 0.6731964 47.5 61.2 0.776 48.1 66.3 0.72.51965 49.5 63.8 0.776 49.3 67.9 0.7261966 52.5 67.5 0.778 54.7 70.1 0.7801967 57.6 70.5 0.817 55.8 72.3 0.7721968 64.0 72.4 0.884 55.8 74.1 0.7531969 69.8 75.2 0.928 56.4 75.3 0.7491970 79.8 85.1 0.938 68.1 84.3 0.8081971 95.7 92.7 1.032 86.6 93.0 0.9311972 100.0 100.0 1.000 100.0 100.0 1.0001973 124.4 115.1 1.081 105.2 125.9 0.8361974 170.2 150.1 1.134 148.6 166.0 0.8951975 181.3 159.7 1.135 163.1 182.0 0.8961976 187.3 180.6 1.048 172.4 198.9 0.8671977 207.2 196.3 1.056 203.6 220.6 0.9231978 218.9 214.6 1.020 221.7 240.1 0.9221979 245.7 251.1 0.978 256.9 280.5 0.914:1980 260.0 296.6 0.877 291.0 339.9 0.85i",
/a The agricultural price index is the implicit price deflator for net domesf:icproduct of agriculture, fishery and forestry.
/b Index of nonagricultural prices is a value-weighted average of the implicitprice deflator for net domestic product of the industrial and servicessector.
/c The food price indlex is the wholesale price index of locally produced foodfor home consumptiLon in Metro Manila.
/d The nonfood price index is the weighted average of consumer price indexesfor areas outside Metro Manila for clothing, housing and miscellaneousitems.
Source: Impact of Economic Policies on Agricultural Development," a PIDSresearch project underway at the University of the Philippines at LosBanos. Data sources used are as follows:
Agricultural and nonagricultural price indexes: NEDA, 1980 PhilippinzStatistical Yearbook (Manila: NEDA, 1980) and NEDA, The NationalIncome Accoun.ts CY 1978-80, Preliminary Estimates as of June 1, 1981(Manila: NEDA., 1981). Food and nonfood price indexes: Central Bank,Statistical Bulletin: 1974, 1976 and 1979 (Manila: CB-DER, 1974, 19'6and 1979); for 1980 figures: CB mimeo sheets (undated).
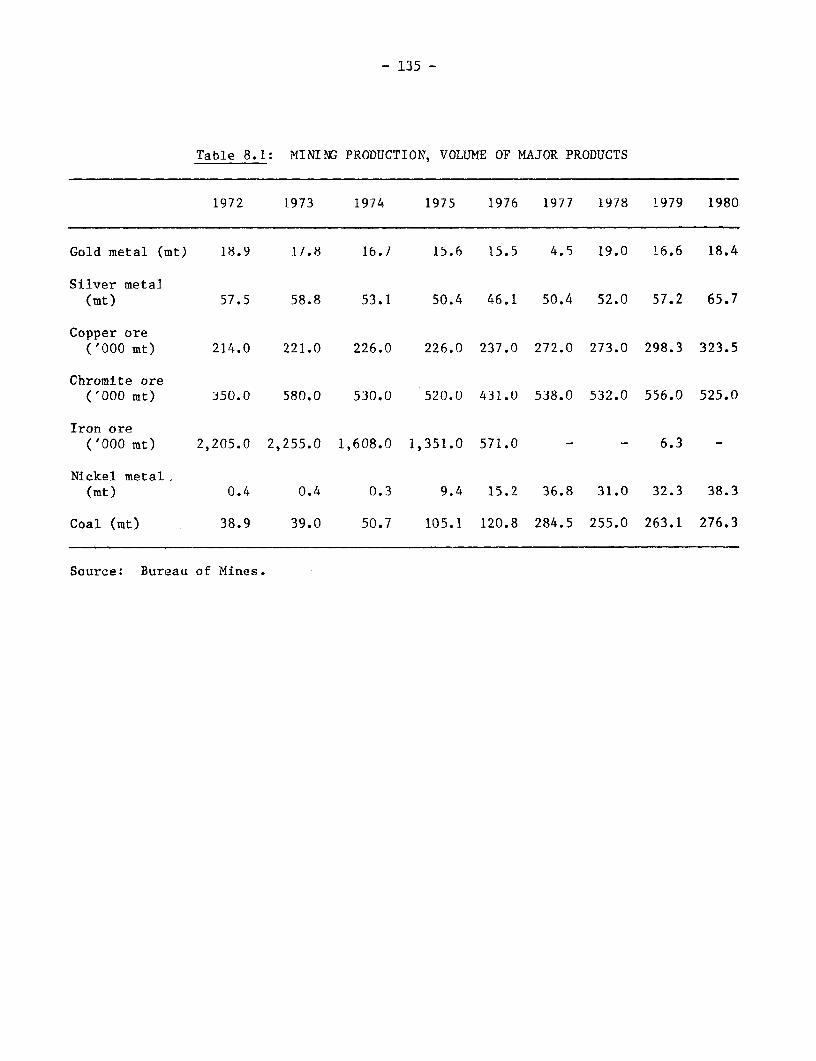
- 135 -
Table 8.1: MINING PRODUCTION, VOLUME OF MAJOR PRODUCTS
1972 1973 1974 1975 1976 1977 1978 1979 1980
Gold metal (mt) 18.9 17.8 16.7 15.6 15.5 4.5 19.0 16.6 18.4
Silver metal(mt) 57.5 58.8 53.1 50.4 46.1 50.4 52.0 57.2 65.7
Copper ore('000 mt) 214.0 221.0 226.0 226.0 237.0 272.0 273.0 298.3 323.5
Chromite ore('000 mt) J50.0 580.0 530.0 520.0 431.0 538.0 532.0 556.0 525.0
Iron ore('000 mt) 2,205.0 2,255.0 1,608.0 1,351.0 571.0 - - 6.3 -
Nickel metal.(mt) 0.4 0.4 0.3 9.4 15.2 36.8 31.0 32.3 38.3
Coal (mt) 38.9 39.0 50.7 105.1 120.8 284.5 255.0 263.1 276.3
Source: Bureau of Mines.
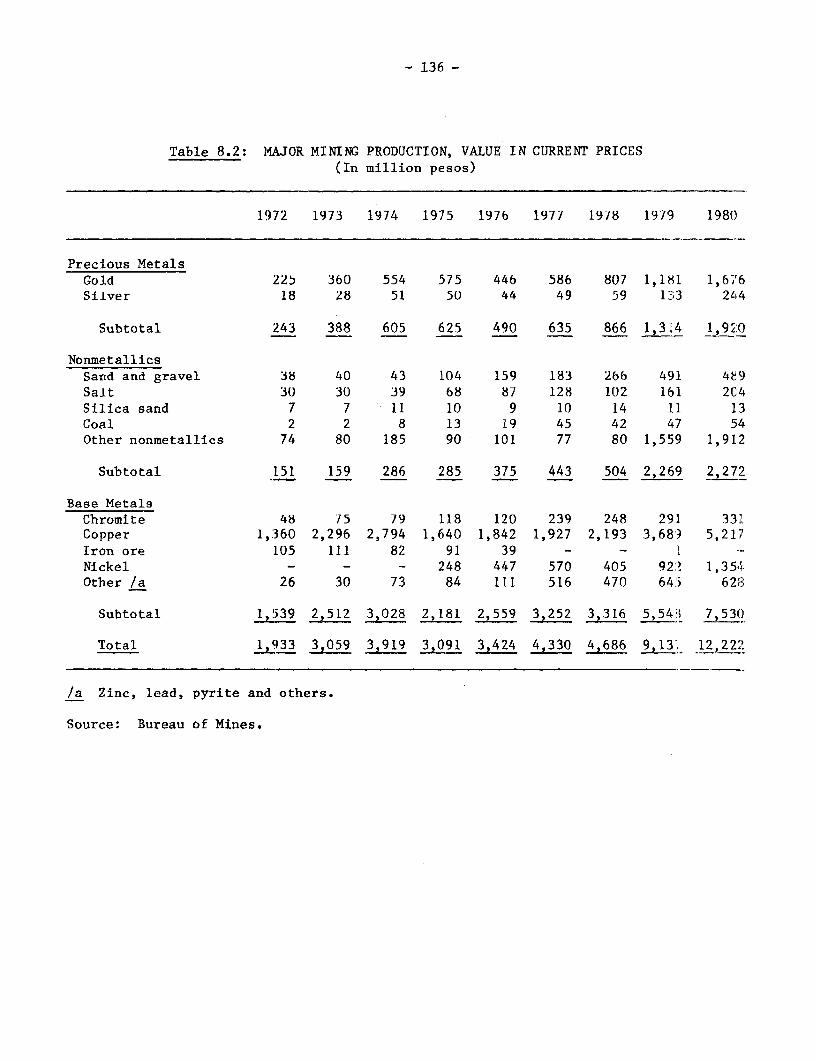
- 136 -
Table 8.2: MAJOR MINING PRODUCTION, VALUE IN CURRENT PRICES(In million pesos)
1972 1973 1974 1975 1976 1977 1978 1979 198(
Precious MetalsGold 225 360 554 575 446 586 807 1,181 1,676Silver 18 28 51 50 44 49 59 133 244
Subtotal 243 388 605 625 490 635 866 1,314 1,92f0
NonmetallicsSand and gravel 38 40 43 104 159 183 266 491 489Salt 30 30 39 68 87 128 102 161 2C4Silica sand 7 7 11 10 9 10 14 11 13Coal 2 2 8 13 19 45 42 47 54Other nonmetallics 74 80 185 90 101 77 80 1,559 1,912
Subtotal 151 159 286 285 375 443 504 2,269 2,272
Base MetalsChromite 48 75 79 118 120 239 248 291 331Copper 1,360 2,296 2,794 1,640 1,842 1,927 2,193 3,683 5,217Iron ore 105 111 82 91 39 - - L-Nickel - - - 248 447 570 405 922 1,354Other /a 26 30 73 84 111 516 470 643i 62(3
Subtotal 1,539 2,512 3,028 2,181 2,559 3,252 32316 5,54!' 7,53fl
Total 1,933 3,059 3,919 3,091 3,424 4,330 4,686 9,131 12,222
/a Zinc, lead, pyrite and others.
Source: Bureau of Mines.

Table 8.3: GROSS VALUE ADDED IN MANUFACTURING BY INDUSTRY GROUPAT CURRENT PRICES
(In millions of pesos)
Industry group 1972 1973 1974 1975 1976 1977 1978/a 1979/a 1980/a
Food manufactures 3,623 4,787 6,626 7,231 8,241 9,603 15,529 18,707 22,881Beverage industries 724 796 1,111 1,264 1,429 2,254 1,850 2,268 2,683Tobacco manufactures 950 1,434 1,723 1,875 2,084 2,193 868 1,016 1,264Textile manufactures 798 1,047 1,470 1,687 2,154 3,216 4,325 4,901 5,933Footwear, wearing apparel 431 541 723 834 982 1,107 841 1,076 1,362Wood and cork products 582 776 1,078 871 1,148 1,144 1,561 2,101 2,588Furniture and fixtures 86 99 140 131 156 223 325 369 474Paper and paper products 345 442 729 826 1,009 1,030 627 780 964Publishing and printing 265 355 473 557 608 691 450 541 660Leather and leather products 22 26 36 42 50 61 51 70 87Rubber products 220 267 369 400 398 574 558 723 871Chemicals and chemical products 1,812 2,223 3,054 3,530 4,254 5,224 4,240 5,157 6,617Products of petroleum and coal 1,048 1,713 2,723 3,526 3,625 4,170 5,871 7,690 9,682Nonmetallic mineral products 445 632 762 954 1,087 1,275 1,159 1,420 1,809Basic metal industries 409 649 883 1,373 1,629 1,631 1,444 1,960 2,708Metal products 401 476 656 678 729 1,071 1,272 1,758 2,323Machinery except electrical 184 219 279 303 336 652 922 1,130 1,518Electrical machinery 355 431 653 751 727 1,367 1,161 1,471 1,748Transport equipment 516 595 864 1,447 1,586 1,487 1,120 1,244 1,595Miscellaneous manufactures 172 207 265 264 313 345 230 307 414
Gross Value Added inManufacturing 13,388 17,715 24,608 28,544 32,545 39,318 44,404 54,689 68,181
/a Revised.
Source: NEDA.
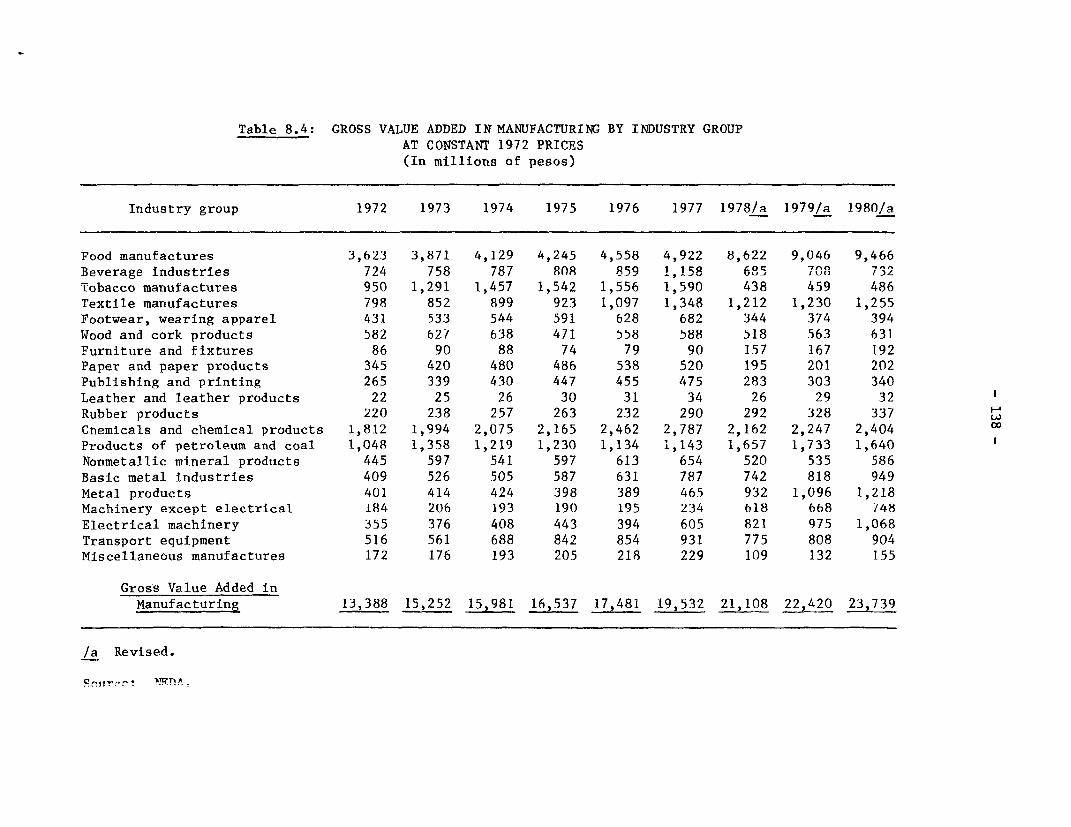
Table 8.4: GROSS VALUE ADDED IN MANUFACTURING BY INDUSTRY GROUPAT CONSTANT 1972 PRICES(In millions of pesos)
Industry group 1972 1973 1974 1975 1976 1977 1978/a 1979/a 1980/a
Food manufactures 3,623 3,871 4,129 4,245 4,558 4,922 8,622 9,046 9,466Beverage industries 724 758 787 808 859 1,158 685 7732Tobacco manufactures 950 1,291 1,457 1,542 1,556 1,590 438 459 486Textile manufactures 798 852 899 923 1,097 1,348 1,212 1,230 1,255Footwear, wearing apparel 431 533 544 591 628 682 344 374 394Wood and cork products 582 627 638 471 558 588 518 563 631Furniture and fixtures 86 90 88 74 79 90 157 167 192Paper and paper products 345 420 480 486 538 520 195 201 202Publishing and printing 265 339 430 447 455 475 283 303 340Leather and leather products 22 25 26 30 31 34 26 29 32Rubber products 220 238 257 263 232 290 292 328 337 LChemicals and chemical products 1,812 1,994 2,075 2,165 2,462 2,787 2,162 2,247 2,404Products of petroleum and coal 1,048 1,358 1,219 1,230 1,134 1,143 1,657 1,733 1,640Nonmetallic mineral products 445 597 541 597 613 654 520 535 586Basic metal industries 409 526 505 587 631 787 742 818 949Metal products 401 414 424 398 389 465 932 1,096 1,218Machinery except electrical 184 206 193 190 195 234 618 668 748Electrical machinery 355 376 408 443 394 605 821 975 1,068Transport equipment 516 561 688 842 854 931 775 808 904Miscellaneous manufactures 172 176 193 205 218 229 109 132 155
Gross Value Added inManufacturing 13,388 15,252 15,981 16,537 17,481 19,532 21,108 22,420 23,739
/a Revised.

- 139 -
Table 8.5: THE ELEVEN MAJOR INDUSTRIAL PROJECTS: TENTATIVESCHEDULE, COSTS, AND FINANCING PLANS
(US$ million)
Expected Project financing planstart of Expected Govern-construc- start of Project ment Privatetion operations cost equity equity Debt
Copper smelter 1980 1983 343 41 59 243
Phosphatic fertilizer 1981 1984 484 60 40 384
Aluminum smelter 1983 1986 515 70 67 379
Integrated steel 1982 1985 765 94 - 671
Cement expansion 1981 1985 166 - 26 140
Diesel engine -manufacturing 1981 1982 76 - 24 52
Petrochemical complex 1982 1986 920 86 223 612
Integrated pulp & paper 1982 1984 199 19 38 142
Coconut-based chemicals 1983 1984 75 - 37.5 37.5
Alcogas 1981 1982 124 11 19 931986/a
Heavy engineeringindustries 1982 1982 50 7 5 37
Total 3,717 388 538 2,791
/a Varying dates of completion for 13 distilleries.
Source: Ministry of Industry.

- 140 -
Table 9.1: SOURCES AND USES OF ENERGY(In millions of barrels of oil equivalent)
1975 1976 1977 1978 1979 1980 1981/a
Electric Power GenerationOil 16.58 17.37 19.21 20.75 20.57 20 35 20.25Hydro 3.75 4.66 3.66 4.03 4.80 5.87 6.24Coal 0.04 0.06 0.18 0.16 0.30 0.32 0.27Geothermal - - - 0.004 1.10 3.46 4.62Nuclear - - - - _Nonconventional - - - - -
Subtotal 20.37 22.09 23.06 24.94 26.77 30.00 31.38
Nonelectric EnergyOil 53.38 54.69 59.15 60.60 62.04 56.91 52.35Coal 0.26 0.32 0.63 0.62 0.50 0.72 0.73Others - - - - 0.01 0.02 0.37
Subtotal 53.64 55.01 59.78 61.22 62.55 57.65 53.45
Total Sources 74.01 77.10 82.84 86.16 89.32 87.65 84.83
Energy Use by SectorTransportation 28 29 30 31 30 29 27Industry 30 32 34 36 40 38 37Commercial 6 6 7 7 7 9 9Residential and others 10 10 12 12 12 12 12
Total Uses 74 77 83 86 89 88 55-
/a Estimate.
Source: Ministry of Energy.
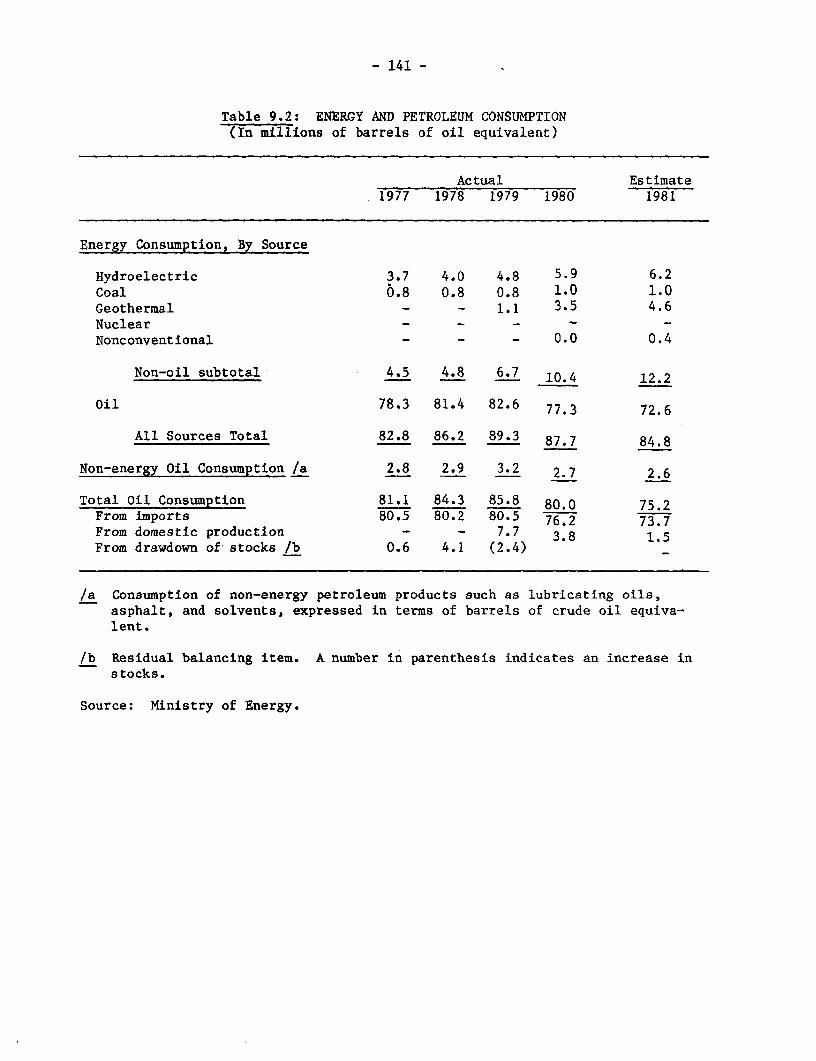
- 141 -
Table 9.2: ENERGY AND PETROLEUM CONSUMPTION(In millions of barrels of oil equivalent)
Actual Estimate1977 1978 1979 1980 1981
Energy Consumption, By Source
Hydroelectric 3.7 4.0 4.8 5.9 6.2Coal 0.8 0.8 0.8 1.0 1.0Geothermal - - 1.1 3.5 4.6Nuclear - - -Nonconventional - - - 0.0 0.4
Non-oil subtotal 4.5 4.8 6.7 10.4 12.2
Oil 78.3 81.4 82.6 77.3 72.6
All Sources Total 82.8 86.2 89.3 87.7 84.8
Non-energy Oil Consumption /a 2.8 2.9 3.2 2.7 2.6
Total Oil Consumption 81.1 84.3 85.8 80.0 75.2From imports 80.5 80.2 80.5 76.2 73.7From domestic production - - 7.7 3.8 1.5From drawdown of stocks /b 0.6 4.1 (2.4)
/a Consumption of non-energy petroleum products such as lubricating oils,asphalt, and solvents, expressed in terms of barrels of crude oil equiva-lent.
/b Residual balancing item. A number in parenthesis indicates an increase instocks.
Source: Ministry of Energy.
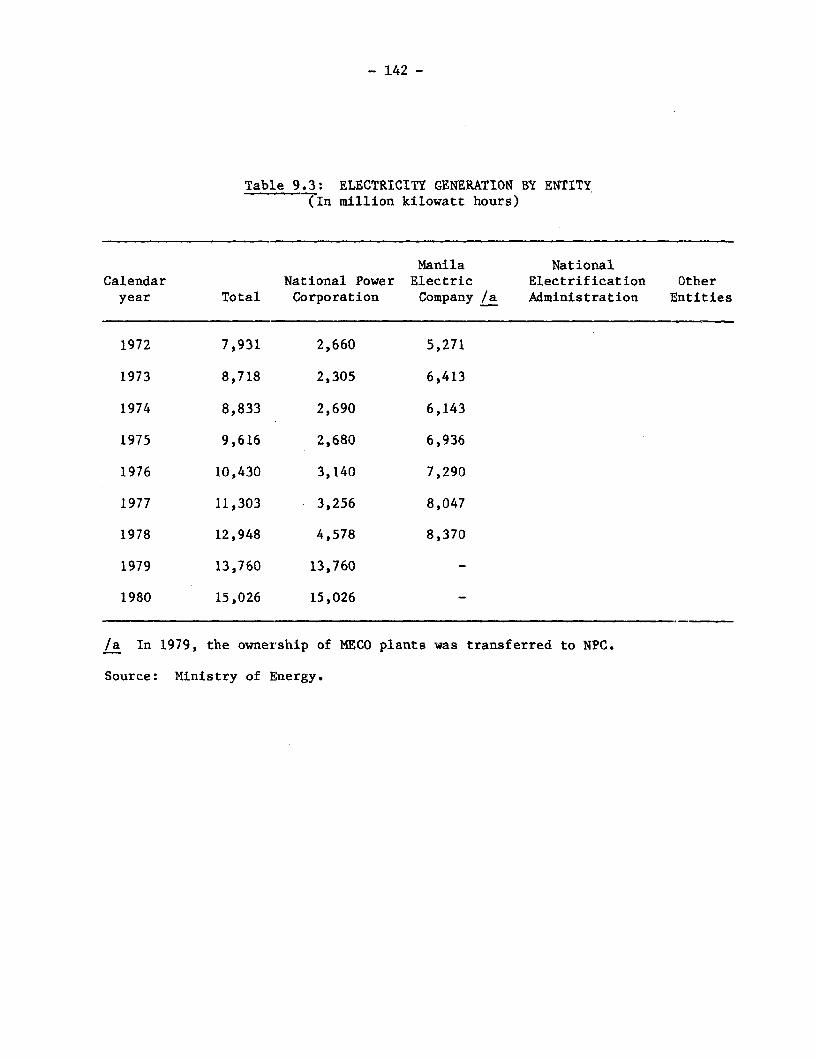
- 142 -
Table 9.3: ELECTRICITY GENERATION BY ENTITY(In million kilowatt hours)
Manila NationalCalendar National Power Electric Electrification Otheryear Total Corporation Company /a Administration Entities
1972 7,931 2,660 5,271
1973 8,718 2,305 6,413
1974 8,833 2,690 6,143
1975 9,616 2,680 6,936
1976 10,430 3,140 7,290
1977 11,303 3,256 8,047
1978 12,948 4,578 8,370
1979 13,760 13,760 -
1980 15,026 15,026
/a In 1979, the ownership of MAECO plants was transferred to NPC.
Source: Ministry of Energy.
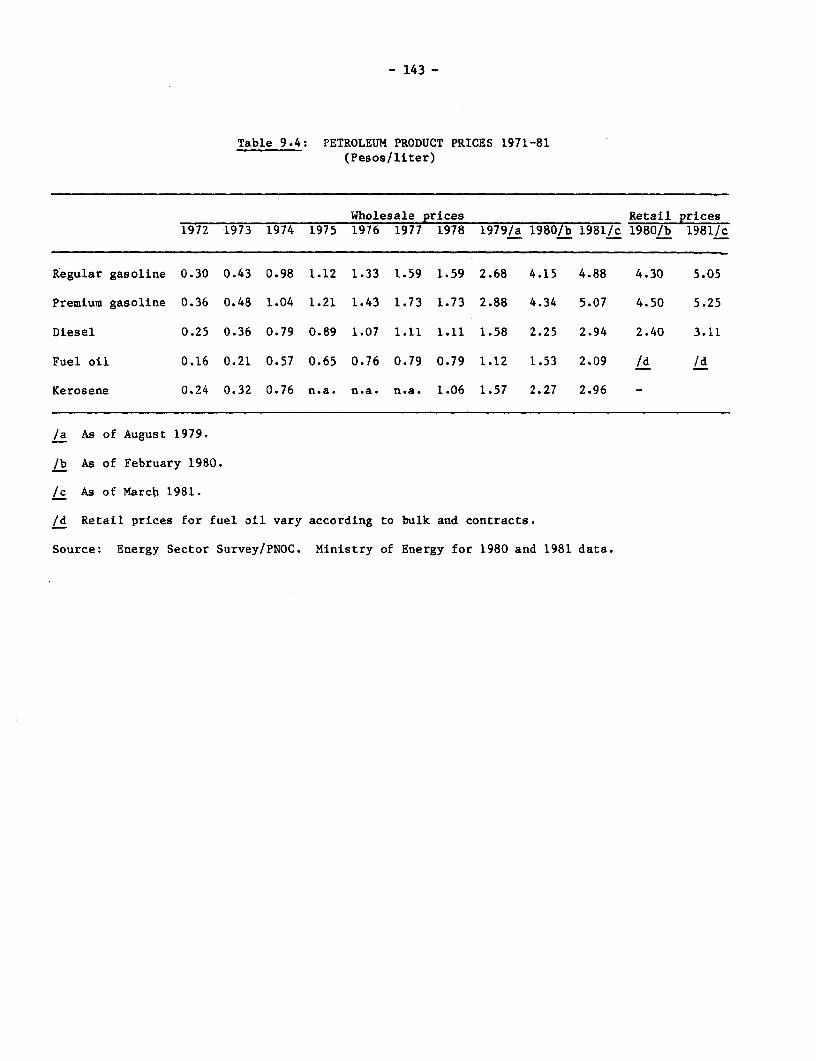
- 143 -
Table 9.4: PETROLEUM PRODUCT PRICES 1971-81(Pesos/liter)
Wholesale prices Retail prices1972 1973 1974 1975 1976 1977 1978 1979/a 1980/b 1981/c 1980/b 1981/c
Regular gasoline 0.30 0.43 0.98 1.12 1.33 1.59 1.59 2.68 4.15 4.88 4.30 5.05
Premium gasoline 0.36 0.48 1.04 1.21 1.43 1.73 1.73 2.88 4.34 5.07 4.50 5.25
Diesel 0.25 0.36 0.79 0.89 1.07 1.11 1.11 1.58 2.25 2.94 2.40 3.11
Fuel oil 0.16 0.21 0.57 0.65 0.76 0.79 0.79 1.12 1.53 2.09 /d /d
Kerosene 0.24 0.32 0.76 n.a. n.a. n.a. 1.06 1.57 2.27 2.96 -
/a As of August 1979.
/b As of February 1980.
/c As of March 1981.
/d Retail prices for fuel oil vary according to bulk and contracts.
Source: Energy Sector Survey/PNOC. Ministry of Energy for 1980 and 1981 data.

- 144 -
Table 9.5: AVERAGE BULK POWER RATES OF NATIONAL POWER CORPORATION, 1974--81 /a(Centavos/kWh)
Luzon Visayas Mindanao Total NPC
Annual Average Rates1974 7.08 7.07 2.34 6.111976 14.03 14.20 2.98 1.1.251977 18.10 29.21 4.26 14.271978 18.16 29.45 11.00 17.231979 22.77 30.61 13.80 22.12
Average Rates with Dal'esof EffectivenessDecember 1978 19.93 29.45 11.70 19.37March 1979 22.43 31.95 14.20 21.87September 1979 26.62 34.66 15.20 25.79February 1980 35.32 39.15 17.00 33:81September 1980 41.30 45.31 17.16 38.23April 1981 46.81 50.97 17.02 44.00
Share in NPC supplies,,1979 (%) 89 2 9 100
Ratio between NPC rates,1979 (Mindanao = 1) 2.1 2.3 1.0 2.0
/a Total revenue divided by kWh sold.
Source: NPC documents and Bank staff papers.
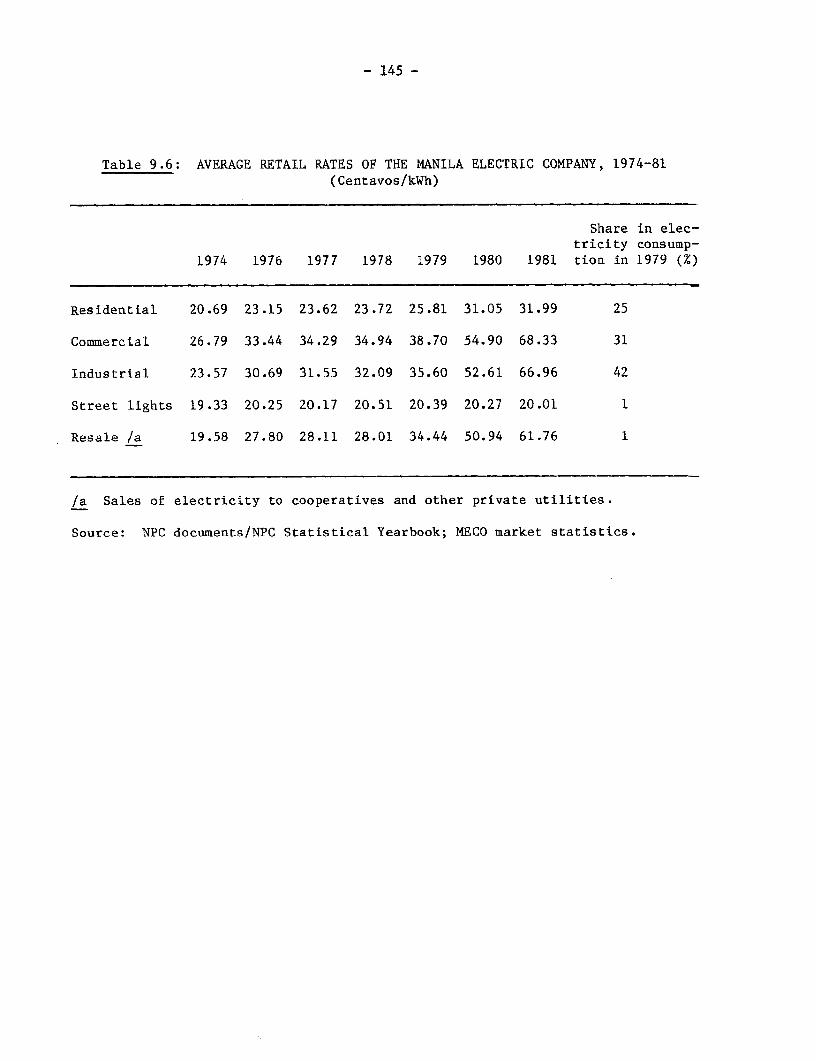
- 145 -
Table 9.6: AVERAGE RETAIL RATES OF THE MANILA ELECTRIC COMPANY, 1974-81(Centavos/kWh)
Share in elec-tricity consump-
1974 1976 1977 1978 1979 1980 1981 tion in 1979 (%)
Residential 20.69 23.15 23.62 23.72 25.81 31.05 31.99 25
Commercial 26.79 33.44 34.29 34.94 38.70 54.90 68.33 31
Industrial 23.57 30.69 31.55 32.09 35.60 52.61 66.96 42
Street lights 19.33 20.25 20.17 20.51 20.39 20.27 20.01 1
Resale /a 19.58 27.80 28.11 28.01 34.44 50.94 61.76 1
/a Sales of electricity to cooperatives and other private utilities.
Source: NPC documents/NPC Statistical Yearbook; MECO market statistics.

- 146 -
Table 10.1: VISITOR ARRIVALS /a( 000)
Other United UK & West TotalYear Japan Asia States Europe Australia Other vis.ltors
1972 26 24 49 16 13 38 166
1973 50 30 63 223 14 64 243
1974 151 46 57 23 18 115 410
1975 158 67 75 30 29 143 502
1976 138 97 88 43 33 216 615
1977 185 :151 106 56 39 193 730
1978 222 198 159 75 52 153 859
1979 254 202 179 100 53 179 967
1980 260 217 177 114 69 171 1,008
/a By country of residence.
Source: Ministry of Tourism.
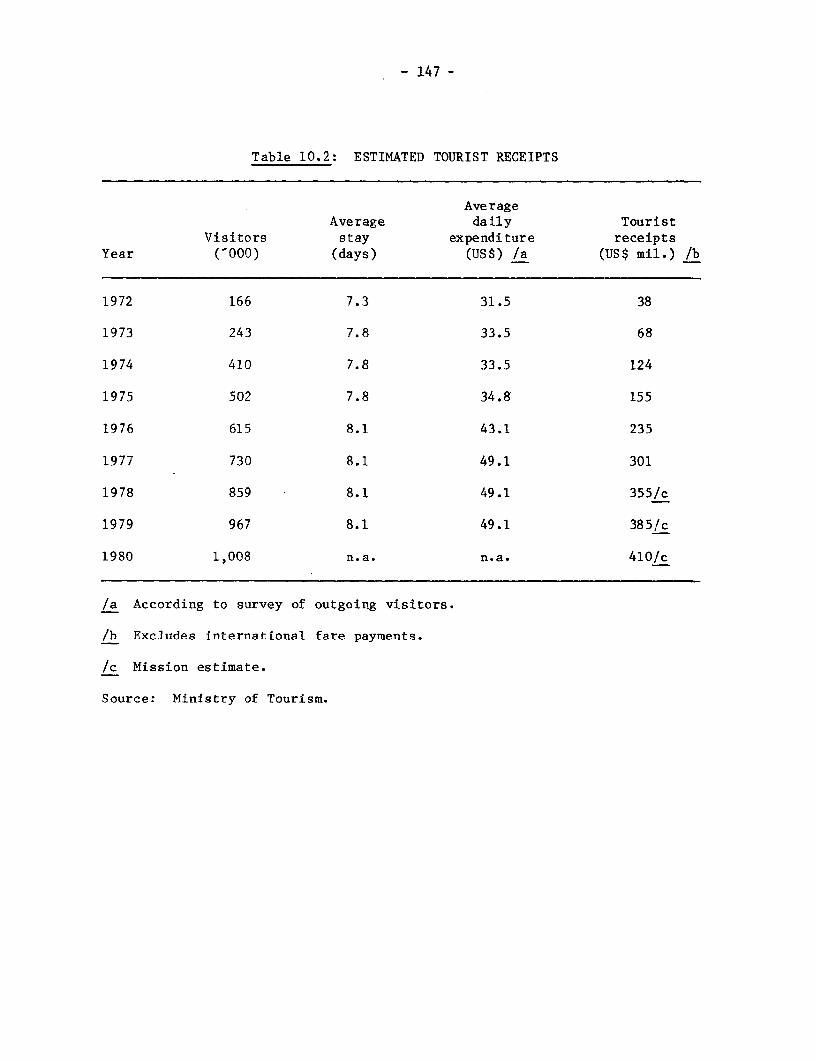
- 147 -
Table 10.2: ESTIMATED TOURIST RECEIPTS
AverageAverage daily Tourist
Visitors stay expenditure receiptsYear (-000) (days) (US$) /a (US$ mil.) /b
1972 166 7.3 31.5 38
1973 243 7.8 33.5 68
1974 410 7.8 33.5 124
1975 502 7.8 34.8 155
1976 615 8.1 43.1 235
1977 730 8.1 49.1 301
1978 859 8.1 49.1 355/c
1979 967 8.1 49.1 385/c
1980 1,008 n.a. n.a. 410/c
/a According to survey of outgoing visitors.
/b Excludes international fare payments.
/c Mission estimate.
Source: Ministry of Tourism.

- 148 -
Table 10.3: REMITTANCES FROM FILIPINO WORKERS EMPLOYED ABROAD(US$ million)
Country 1978 1979 1980
(Major employing country)
(Major employing country)
Total 384.3 588.0 664.0
Source: Overseas Employment Board.
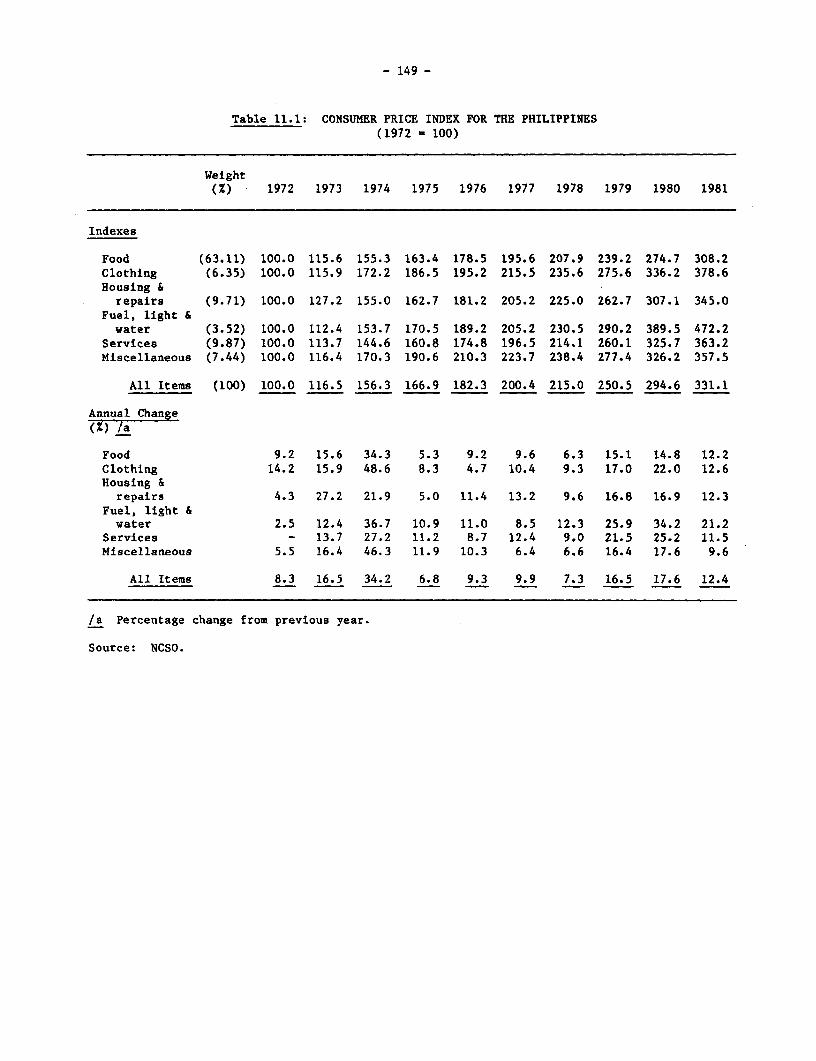
- 149 -
Table 11.1: CONSUMER PRICE INDEX FOR THE PHILIPPINES(1972 - 100)
Weight(Z) 1972 1973 1974 1975 1976 1977 1978 1979 1980 1981
Indexes
Food (63.11) 100.0 115.6 155.3 163.4 178.5 195.6 207.9 239.2 274.7 308.2Clothing (6.35) 100.0 115.9 172.2 186.5 195.2 215.5 235.6 275.6 336.2 378.6Housing &repairs (9.71) 100.0 127.2 155.0 162.7 181.2 205.2 225.0 262.7 307.1 345.0
Fuel, light &water (3.52) 100.0 112.4 153.7 170.5 189.2 205.2 230.5 290.2 389.5 472.2
Services (9.87) 100.0 113.7 144.6 160.8 174.8 196.5 214.1 260.1 325.7 363.2Miscellaneous (7.44) 100.0 116.4 170.3 190.6 210.3 223.7 238.4 277.4 326.2 357.5
All Items (100) 100.0 116.5 156.3 166.9 182.3 200.4 215.0 250.5 294.6 331.1
Annual Change(X) /a
Food 9.2 15.6 34.3 5.3 9.2 9.6 6.3 15.1 14.8 12.2Clothing 14.2 15.9 48.6 8.3 4.7 10.4 9.3 17.0 22.0 12.6Housing &
repairs 4.3 27.2 21.9 5.0 11.4 13.2 9.6 16.8 16.9 12.3Fuel, light &water 2.5 12.4 36.7 10.9 11.0 8.5 12.3 25.9 34.2 21.2
Services - 13.7 27.2 11.2 8.7 12.4 9.0 21.5 25.2 11.5Miscellaneous 5.5 16.4 46.3 11.9 10.3 6.4 6.6 16.4 17.6 9.6
All Items 8.3 16.5 34.2 6.8 9.3 9.9 7.3 16.5 17.6 12.4
/a Percentage change from previous year.
Source: NCSO.

- 15U -
Table 11.2: WHOLESALE PRICE INDICES FOR MANILA(1978 = 100)
1978 1979 1980 1981/a
IndicesFood 100.0 116.2 133.2 155.4Beverages and tobacco 100.0 123.4 134.6 146.6Crude materials, inedlible except fuel 100.0 125.3 137.9 140.2Mineral fuels 100.0 128.4 203.1 254.4Chemicals 100.0 121.1 135.4 1.37.5Manufactured goods 100.0 121.0 146.1 162.3Machinery and transport equipment 100.0 110.7 123.9 136.5Miscellaneous manufactured articles 100.0 115.3 140.0 156.9
All Items 100.0 119.0 140.8 158.9
Annual Change /bFood 16.2 14.6 17.7Beverages and tobacco 23.4 9.1 9.4Crude materials, inedible except fuel 25.3 10.1 2.1Mineral fuels 28.4 58.2 2'6.2Chemicals 21.1 11.8 2.1Manufactured goods 21.0 20.7 11.7Machinery and transport equipment 10.7 11.9 10.6Miscellaneous manufactured articles 15.3 21.4 12.5
All Items 19.0 18.3 13.6
/a As of November 1981.
/b Percentage change from previous year.
Source: Central Bank of the Philippines.
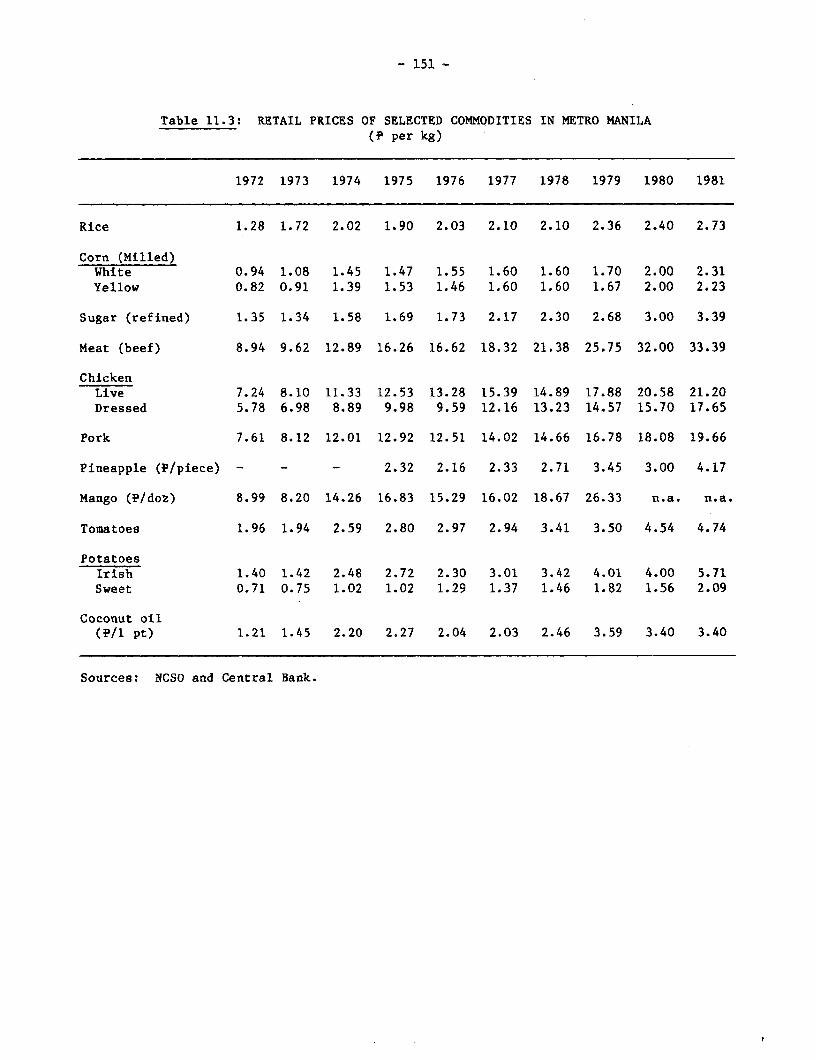
- 151 -
Table 11.3: RETAIL PRICES OF SELECTED COMMODITIES IN METRO MANILA(P per kg)
1972 1973 1974 1975 1976 1977 1978 1979 1980 1981
Rice 1.28 1.72 2.02 1.90 2.03 2.10 2.10 2.36 2.40 2.73
Corn (Milled)White 0.94 1.08 1.45 1.47 1.55 1.60 1.60 1.70 2.00 2.31Yellow 0.82 0.91 1.39 1.53 1.46 1.60 1.60 1.67 2.00 2.23
Sugar (refined) 1.35 1.34 1.58 1.69 1.73 2.17 2.30 2.68 3.00 3.39
Meat (beef) 8.94 9.62 12.89 16.26 16.62 18.32 21.38 25.75 32.00 33.39
ChickenLive 7.24 8.10 11.33 12.53 13.28 15.39 14.89 17.88 20.58 21.20Dressed 5.78 6.98 8.89 9.98 9.59 12.16 13.23 14.57 15.70 17.65
Pork 7.61 8.12 12.01 12.92 12.51 14.02 14.66 16.78 18.08 19.66
Pineapple (P/piece) - - - 2.32 2.16 2.33 2.71 3.45 3.00 4.17
Mango (P/dot) 8.99 8.20 14.26 16.83 15.29 16.02 18.67 26.33 n.a. n.a.
Tomatoes 1.96 1.94 2.59 2.80 2.97 2.94 3.41 3.50 4.54 4.74
PotatoesIrish 1.40 1.42 2.48 2.72 2.30 3.01 3.42 4.01 4.00 5.71
Sweet 0.71 0.75 1.02 1.02 1.29 1.37 1.46 1.82 1.56 2.09
Coconut oil(P/1 pt) 1.21 1.45 2.20 2.27 2.04 2.03 2.46 3.59 3.40 3.40
Sources: NCSO and Central Bank.
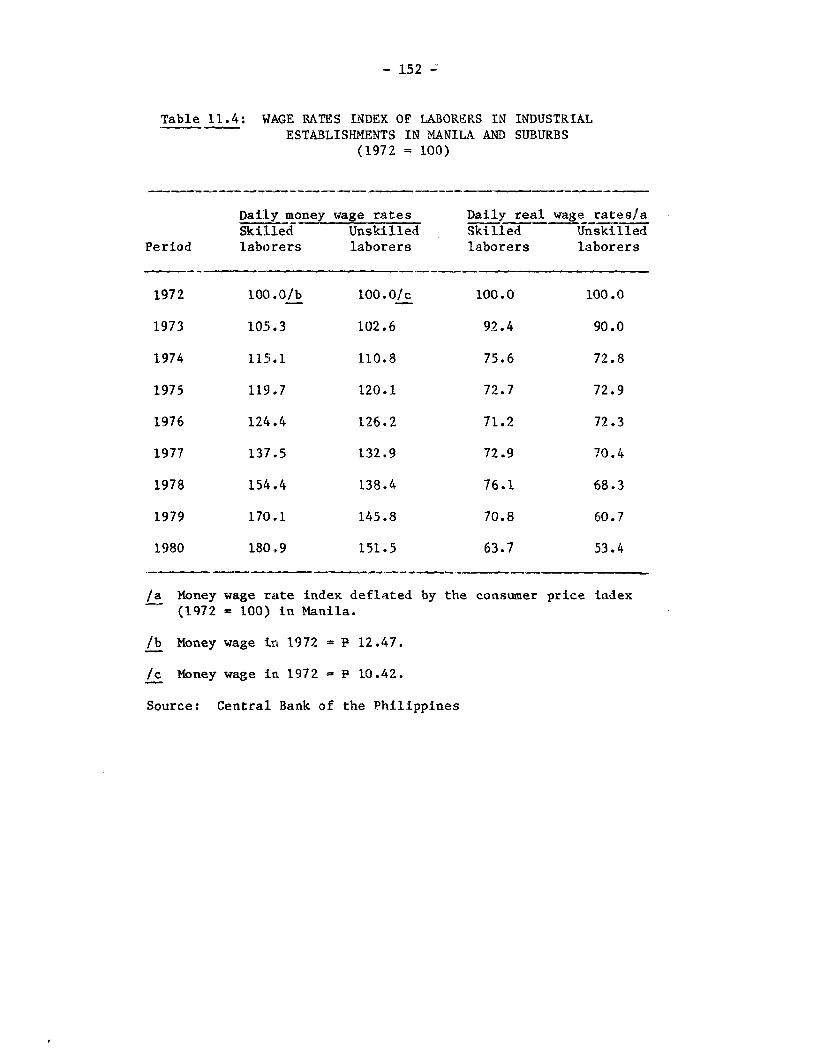
- 152 -
Table 11.4: WAGE RATES INDEX OF LABORERS IN INDUSTRIALESTABLISHMENTS IN MANILA AND SUBURBS
(1972 = 100)
Dai:Ly money wage rates Daily real wage rates/aSkilled Unskilled Skilled Unskilled
Period laborers laborers laborers laborers
1972 100.0/b 100.0/c 100.0 100.0
1973 105.3 102.6 92.4 90.0
1974 115.1 110.8 75.6 72.8
1975 119.7 120.1 72.7 72.9
1976 124.4 126.2 71.2 72.3
1977 137.5 132.9 72.9 70.4
1978 154.4 138.4 76.1 68.3
1979 170.1 145.8 70.8 60.7
1980 180.9 151.5 63.7 53.4
/a Money wage rate index deflated by the consurer price index(1972 = 100) in Manila.
/b Money wage in 1972 = P 12.47.
/c Money wage in. 1972 = P 10.42.
Source: Central Bank of the Philippines

- 153 -
Table 11.5: LEGISLATED MINIMUM MONEY AND REAL DAILY WAGE RATES /a
Metro-Manila: Highest Minimum lb Agriculture: Lowest Minimum /cMoney Wage Real Wage /d Money Wage Real Wage /d
1972 8.0 8.00 4.75 4.751973 8.0 7.02 4.75 4.061974 9.98 6.56 5.34 3.401975 10.65 6.47 5.74 3.431976 12.81 7.33 7.09 3.861977 15.18 8.05 9.47 4.681978 16.27 8.02 10.55 4.861979 23.19 9.62 13.51 5.361980 (Aug.) 29.85 10.33 17.28 5.731981 (June) 31.82 10.19 18.53 5.59
/a Minimum wage rates are set for 12 different categories - by location, typeof activity and size of firm. This table presents only the highest andlowest paying categories.
/b Minimum wage payable by a large firm (capitalization of over 1 millionpesos) in Metro-Manila.
/c Minimum wage payable by a small-scale employer in non-plantationagriculture.
Id Money wage deflated by the Consumer Price Index (1972=100).
Source: National Wages Council.
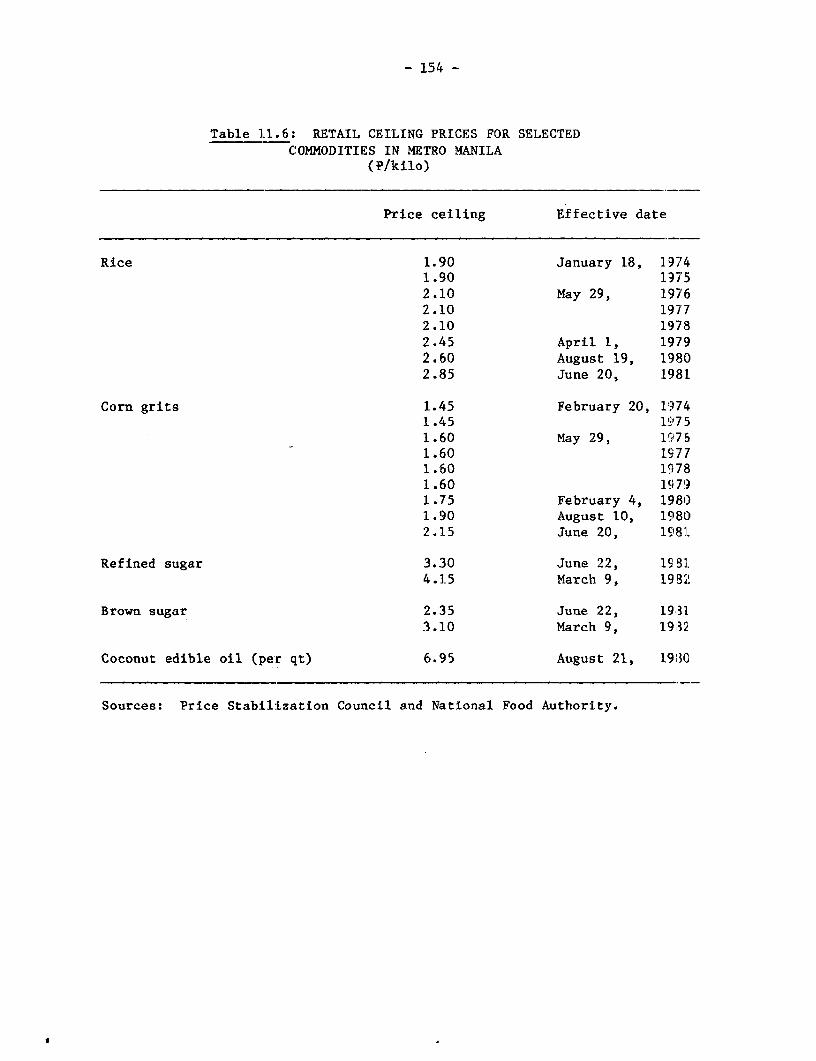
- 154 -
Table 1.1.6: RETAIL CEILING PRICES FOR SELECTEDCOMMODITIES IN METRO MANILA
(?/kilo)
Price ceiling Effective date!
Rice 1.90 January 18, 19741.90 19752.10 May 29, 19762.10 19772.10 19782.45 April 1, 19792.60 August 19, 19802.85 June 20, 1981
Corn grits 1.45 February 20, 19741.45 1!''7 51.60 May 29, 19751.60 19771.60 19731.60 19791.75 February 4, 19801.90 August 10, 19802.15 June 20, 198:L
Refined sugar 3.30 June 22, 198l.4.15 March 9, 1932
Brown sugar 2.35 June 22, 19313.10 March 9, 1932
Coconut edible oil (per qt) 6.95 August 21, 1930
Sources: Price Stabil:Lzation Council and National Food Authority.
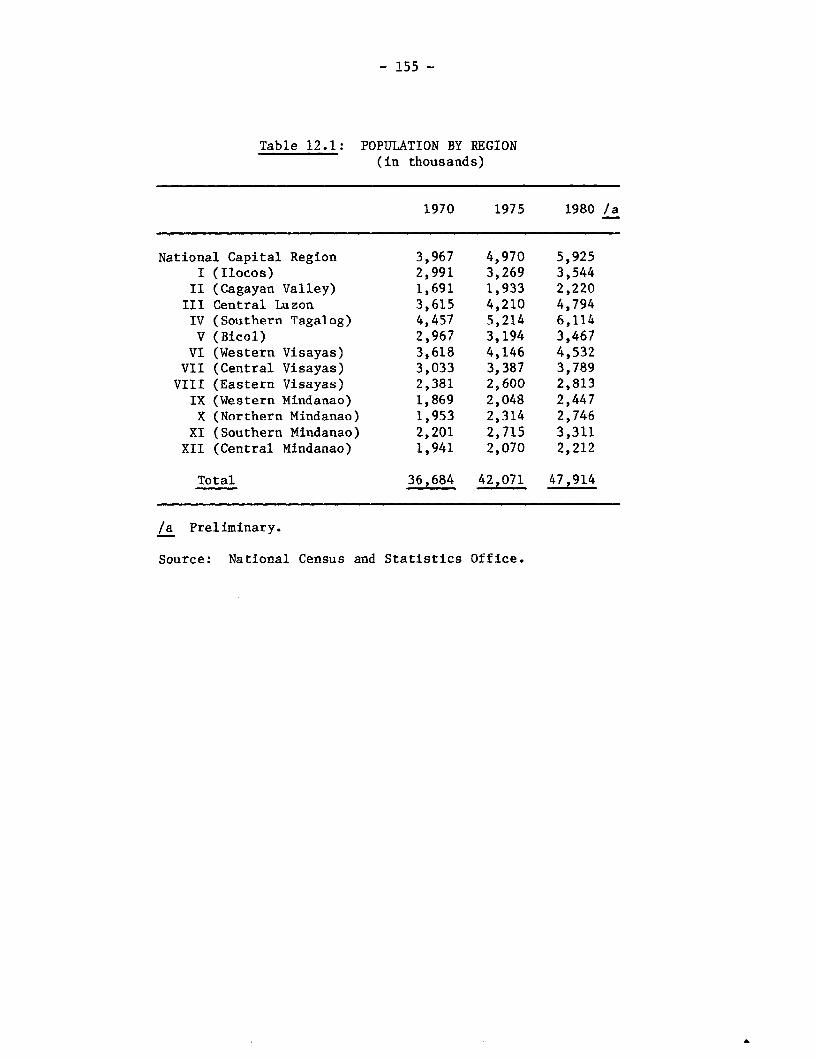
- 155 -
Table 12.1: POPULATION BY REGION(in thousands)
1970 1975 1980 /a
National Capital Region 3,967 4,970 5,925I (Ilocos) 2,991 3,269 3,544II (Cagayan Valley) 1,691 1,933 2,220III Central Luzon 3,615 4,210 4,794IV (Southern Tagalog) 4,457 5,214 6,114V (Bicol) 2,967 3,194 3,467VI (Western Visayas) 3,618 4,146 4,532VII (Central Visayas) 3,033 3,387 3,789VIII (Eastern Visayas) 2,381 2,600 2,813IX (Western Mindanao) 1,869 2,048 2,447X (Northern Mindanao) 1,953 2,314 2,746XI (Southern Mindanao) 2,201 2,715 3,311XII (Central Mindanao) 1,941 2,070 2,212
Total 36,684 42,071 47,914
/a Preliminary.
Source: National Census and Statistics Office.
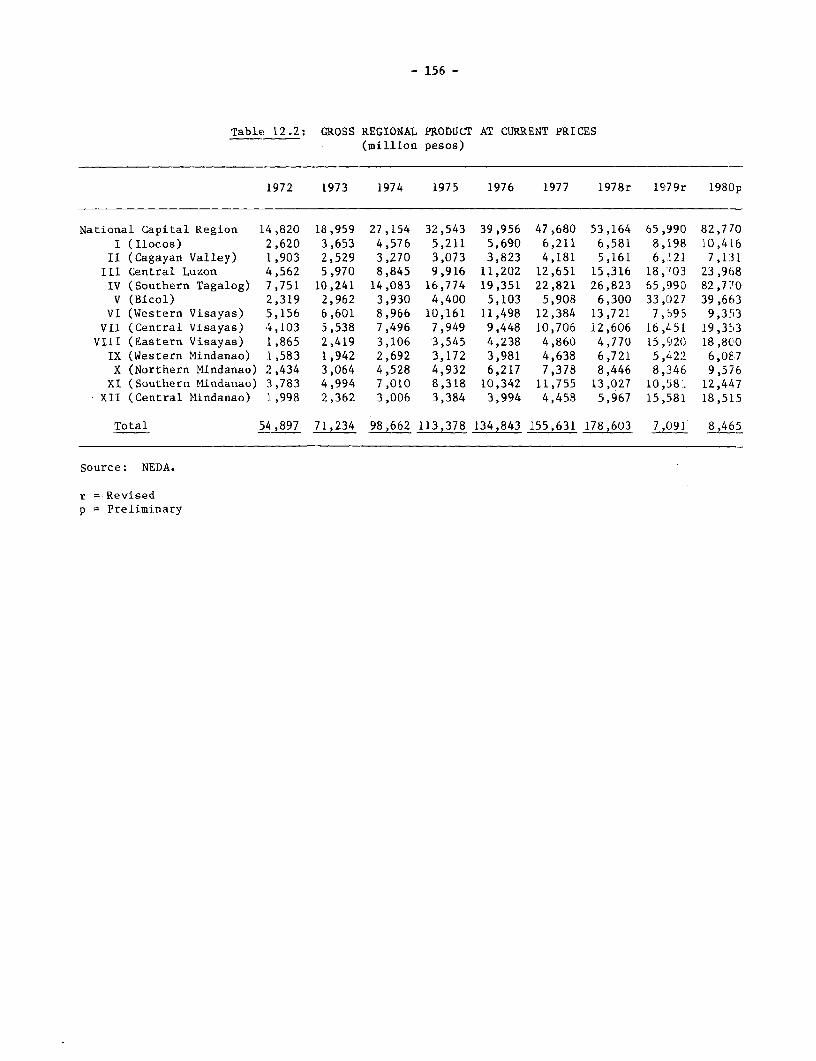
- 156 -
Table 12.2: GROSS REGIONAL PRODUCT AT CURRENT PRICES(million pesos)
1972 1973 1974 1975 1976 1977 1978r 1979r 1980p
National Capital Region 14,820 18,959 27,154 32,543 39,956 47,680 53,164 65,990 82,770I (Ilocos) 2,620 3,653 4,576 5,211 5,690 6,211 6,581 8,198 10,4L6II (Cagayan Valley) 1,903 2,529 3,270 3,073 3,823 4,181 5,161 6,121 7,131
III Central Luzon 4,562 5,970 8,845 9,916 11,202 12,651 15,316 18,703 23,968IV (Southern Tagalog) 7,751 10,241 14,083 16,774 19,351 22,821 26,823 65,990 82,770V (Bicol) 2,319 2,962 3,930 4,400 5,103 5,908 6,300 33,027 39,663VI (Western Visayas) 5,156 6,601 8,966 10,161 11,498 12,384 13,721 7,695 9,353VII (Central Visayas) 4,103 5,538 7,496 7,949 9,448 10,706 12,606 16,gL51 19,353VIII (Eastern Visayas) L,865 2,419 3,106 3,545 4,238 4,860 4,770 15,920 18,800IX (Western Mindanao) 1,583 1,942 2,692 3,172 3,981 4,638 6,721 5,422 6,0E7X (Northern Mindanao) 2,434 3,064 4,528 4,932 6,217 7,378 8,446 8,346 9,576XI (Southern Mindanao) 3,783 4,994 7,010 8,318 10,342 11,755 13,027 10,58:l 12,447XII (Central Mindanao) 1,998 2,362 3,006 3,384 3,994 4,458 5,967 15,58]. 18,515
Total 54,897 71,234 98,662 113,378 134,843 155,631 178,603 7,091. 8,465
Source: NEDA.
r = Revisedp = Preliminary
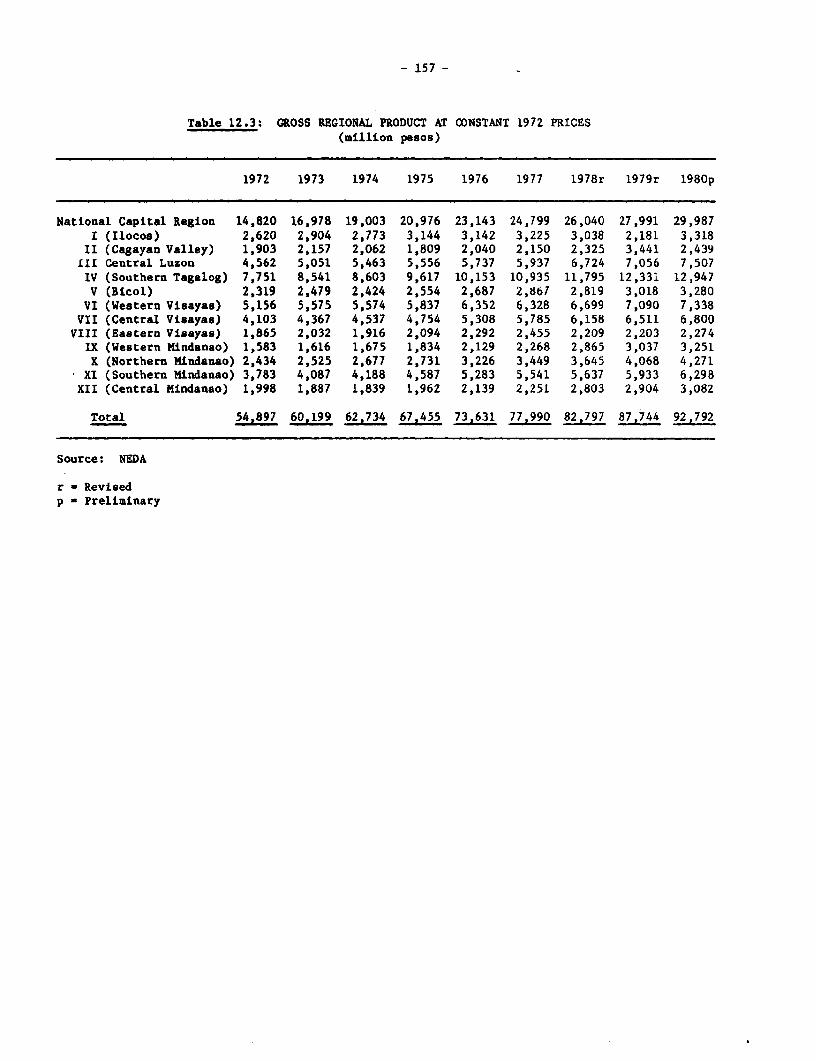
- 157 -
Table 12.3: GROSS REGIONAL PRODUCT AT CONSTANT 1972 PRICES(million pesos)
1972 1973 1974 1975 1976 1977 1978r 1979r 1980p
National Capital Region 14,820 16,978 19,003 20,976 23,143 24,799 26,040 27,991 29,987I (Ilocos) 2,620 2,904 2,773 3,144 3,142 3,225 3,038 2,181 3,318II (Cagayan Valley) 1,903 2,157 2,062 1,809 2,040 2,150 2,325 3,441 2,439I1l Central Luzon 4,562 5,051 5,463 5,556 5,737 5,937 6,724 7,056 7,507IV (Southern Tagalog) 7,751 8,541 8,603 9,617 10,153 10,935 11,795 12,331 12,947V (Blcol) 2,319 2,479 2,424 2,554 2,687 2,867 2,819 3,018 3,280VI (Western Visayas) 5,156 5,575 5,574 5,837 6,352 6,328 6,699 7,090 7,338VII (Central Visayas) 4,103 4,367 4,537 4,754 5,308 5,785 6,158 6,511 6,800VIII (Eastern Visayas) 1,865 2,032 1,916 2,094 2,292 2,455 2,209 2,203 2,274
IX (Western Nindanao) 1,583 1,616 1,675 1,834 2,129 2,268 2,865 3,037 3,251X (Northern Mindanao) 2,434 2,525 2,677 2,731 3,226 3,449 3,645 4,068 4,271
XI (Southern Mindanao) 3,783 4,087 4,188 4,587 5,283 5,541 5,637 5,933 6,298XII (Central Mindanao) 1,998 1,887 1,839 1,962 2,139 2,251 2,803 2,904 3,082
Total 54,897 60,199 62,734 67,455 73,631 77,990 82,797 87,744 92,792
Source: NEDA
r - Revisedp - Preliminary
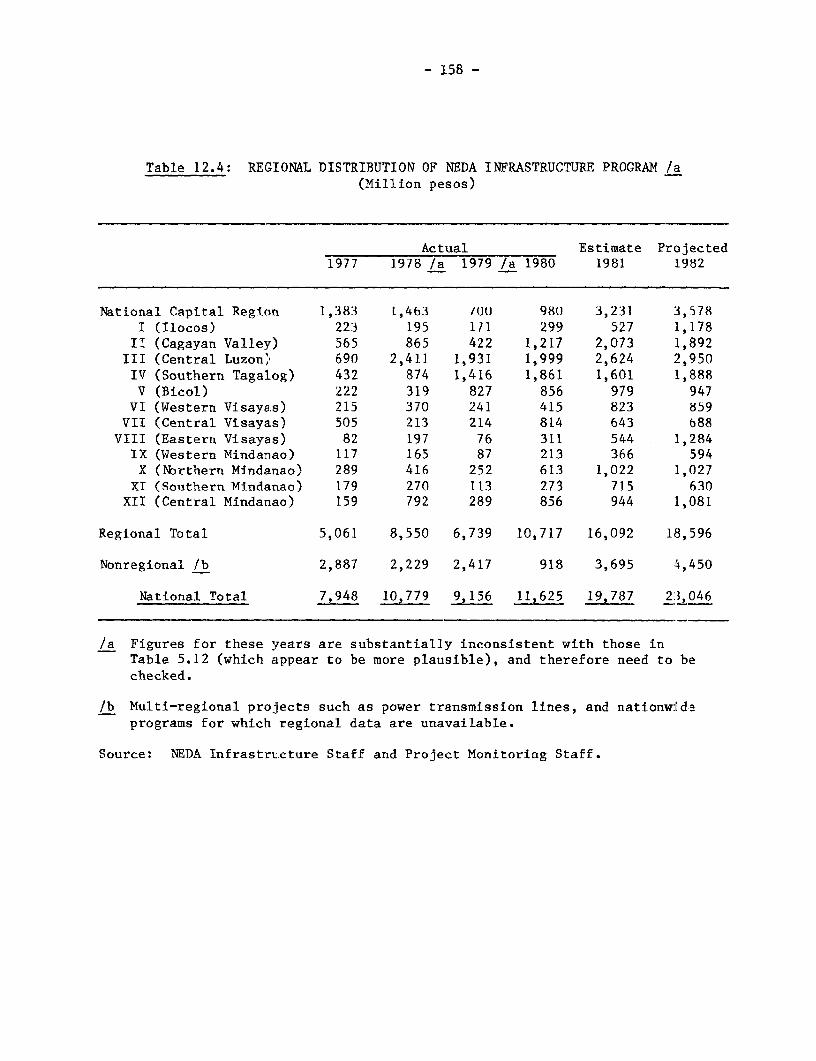
- 158 -
Table 12.4: REGIONAL DISTRIBUTION OF NEDA INFRASTRUCTURE PROGRAM /E(Million pesos)
Actual Estimate Projected1977 1978 /a 1979 /a 1980 1981 1982
National Capital Region 1,383 1,463 /00 980 3,231 3,578I (Ilocos) 223 195 171 299 527 1,178II (Cagayan Valley) 565 865 422 1,217 2,073 1,892III (Central Luzon) 690 2,411 1,931 1,999 2,624 2,950IV (Southern Tagalog) 432 874 1,416 1,861 1,601 1,888
V (Bicol) 222 319 827 856 979 947VI (Western Visayas) 215 370 241 415 823 859VII (Central Visayas) 505 213 214 814 643 688VIII (Eastern Visayas) 82 197 76 311 544 1,284IX (Western Mindanao) 117 165 87 213 366 594X (Northern Mindanao) 289 416 252 613 1,022 1,027XI (Southern Mindanao) 179 270 113 273 715 630XII (Central Mindanao) 159 792 289 856 944 1,081
Regional Total 5,061 8,550 6,739 10,717 16,092 18,596
Nonregional /b 2,887 2,229 2,417 918 3,695 '4,450
National Total 7,948 10,779 9,156 11,625 19,787 23,046
/a Figures for these years are substantially inconsistent with those inTable 5.12 (which appear to be more plausible), and therefore need to bechecked.
/b Multi-regional projects such as power transmission lines, and nationw,deprograms for which regional data are unavailable.
Source: NEDA Infrastructure Staff and Project Monitoring Staff.
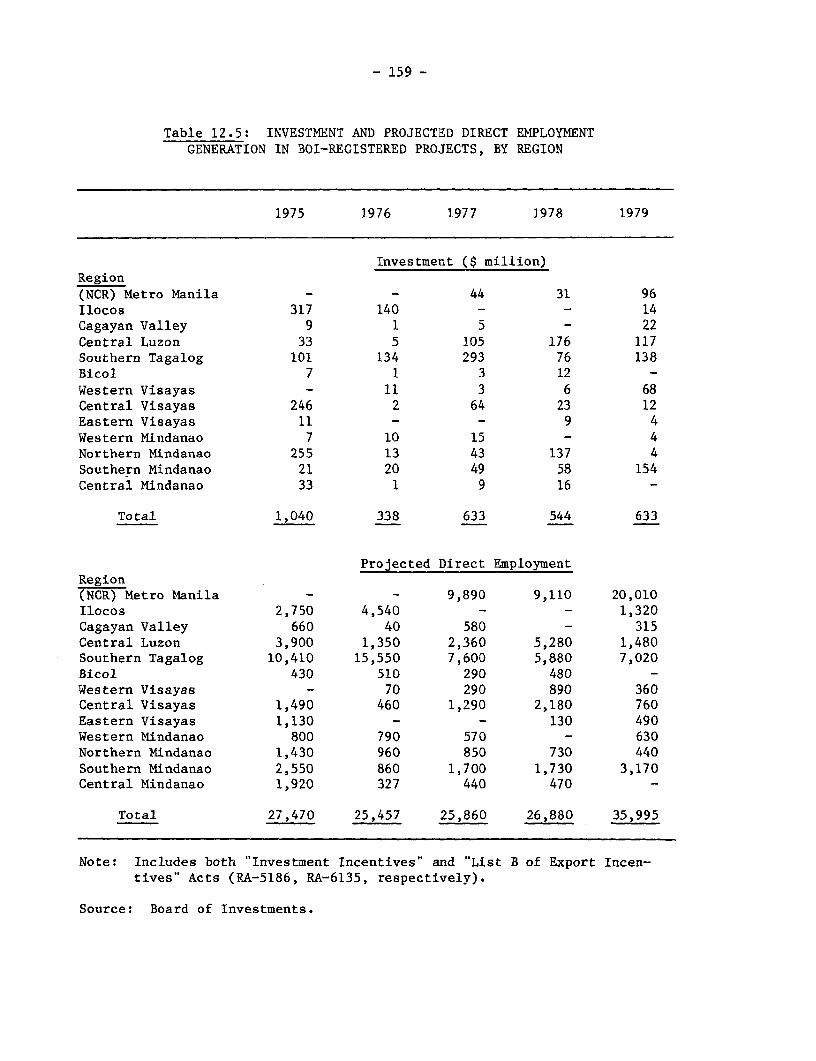
- 159 -
Table 12.5: INVESTMENT AND PROJECTED DIRECT EMPLOYMENTGENERATION IN BOI-REGISTERED PROJECTS, BY REGION
1975 1976 1977 1978 1979
Investment ($ million)Region(NCR) Metro Manila - - 44 31 96Ilocos 317 140 - - 14Cagayan Valley 9 1 5 - 22Central Luzon 33 5 105 176 117Southern Tagalog 101 134 293 76 138Bicol 7 1 3 12 -Western Visayas - 11 3 6 68Central Visayas 246 2 64 23 12Eastern Visayas 11 - - 9 4Western Mindanao 7 10 15 - 4Northern Mindanao 255 13 43 137 4Southern Mindanao 21 20 49 58 154Central Mindanao 33 1 9 16 -
Total 1,040 338 633 544 633
Projected Direct EmploymentRegion(NCR) Metro Manila - - 9,890 9,110 20,010Ilocos 2,750 4,540 - - 1,320Cagayan Valley 660 40 580 - 315Central Luzon 3,900 1,350 2,360 5,280 1,480Southern Tagalog 10,410 15,550 7,600 5,880 7,020Bicol 430 510 290 480 -Western Visayas - 70 290 890 360Central Visayas 1,490 460 1,290 2,180 760Eastern Visayas 1,130 - - 130 490Western Mindanao 800 790 570 - 630Northern Mindanao 1,430 960 850 730 440Southern Mindanao 2,550 860 1,700 1,730 3,170Central Mindanao 1,920 327 440 470 -
Total 27,470 25,457 25,860 26,880 35,995
Note: Includes both "Investment Incentives" and "List B of Export Incen-tives" Acts (RA-5186, RA-6135, respectively).
Source: Board of Investments.

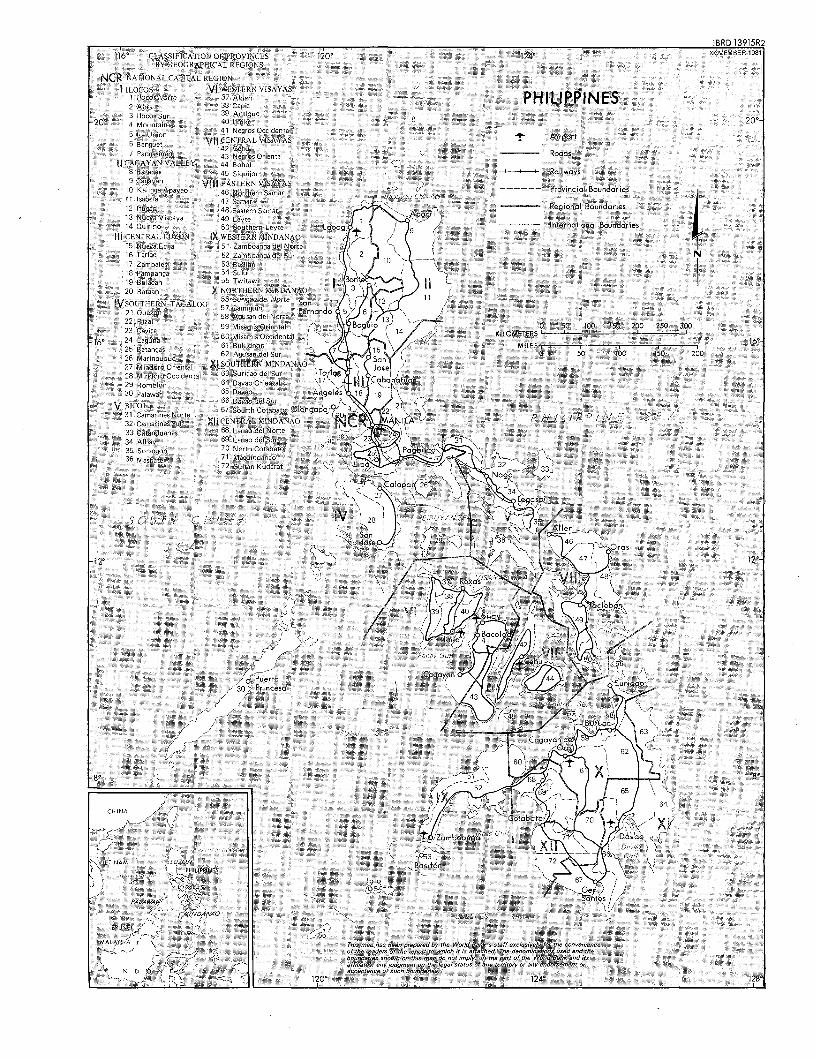
IBRD 13915R2116' CLASSIFICATION OF PROVINCES 120° 1240 NOVEMBER 1981
BY GEOGRAPHICAL REGIONS
NCR NATIONALCAPITAL REGION
I iLOCOS VI WESTERN VISAYAS1 locos Norte 37 Aklan PhILIPPINES2 Abra 38 Capiz3 llocosSur 39 Antique
20° 4 Mountain 40 Iloilo 8 20S La Un,on 41 NegrosOncidentalAipr5 Banguet VII CENTRAL VISAYAS ± Airporl
7Pagasnan42 Cebu _____ Roads7 Pangasinan 43 Negros Oriental
i CAGAYAN VALLEY 44 Bohol I8 Batanes 45 Siquijor - ---- ' Railways9 Cagayan Vi l EASTERN VISAYAS
ii Isabela4SNortherngamary. S4 aoh.lr e- - - - --- Provincial Boundaries10 Kalina-Apsyan 46 Northern SamarIt IsaIbela 47 Samar______12 Lfugao 48 Eastern Sumar 'p Regional Boundaries13 N.eva Viscaya 49 Leyte1Apri14 Quirino 50 Southern Leyte Lcoog ----- Inlernatlioral Boundaries 4
I|| CENTRAL LUZON IX WESTERN MINDANAO15 Nueva Ecija 51 Zamboanga del Norte / \16 Tarlac 52 Zam,boanga del Sur N 2 1017 Zan-bales 53 Basilan I18 Pampanga 54 Sulu N
19 Bulacan 55 Twi,a, i tolt20 Bataan X NORTHERN MINDANAO 3
IVSOUTHERN TAGALOG 57 Cariguidn reSn S 12 - 11an21 Quezon 58 Agusan del Norte Fenn - /22 MisarsOriental Xls1 0 50 100 150 200 250 30023 Cavite 59 ,snni rentl 5
60 Misamis Occidental 6 N KILOMETERS 1./16 2 Ro ln 681 Bkidnon \ MILES,
25 Batangas 6 15a0del0Sur i 10 15 226 Marinduq.ee 2Aa e a Sn
27 Mindoro Oriental XI SOUTHERN MINDANAO ' " jose23 Mindoro Occidental 63 Surigao del Sur o-s T I29 Romblon 84 Oavao Oriental \' II ibo7Io30 Pala,van 65 Davao A'iSgel~s 1 189
VBICOL 86 Davao delSur I 21131 Iamarnes orte 67 Sourth Cotabato Olongapo& '3g !ip '' '
32 CansarmnesSur XII CENTRAL MINDANAO INH33 Catanduanes 68 Lanao del Norte34 Albay 68 Lanao del Sur,O -"235 Sorsogon 70 North Cotabato36 Masbate 71 Maguindanao "
72 Sultan Kudarat \ 32
_ . 9; -_ f .a > - - 3iV ~~28 C II /7lA!SC f te
Puerto SE
82 - 4%64 80s
- VIENEAM $ -5
MAL/e9A f S~~~~ Thinsmep hass oeen prepared by the World Beak's staff naolosioeiy for the caonenience, J , ,r t. ~~~~~~~~~~~~~~~of the readers at the repon to wShich t irt atteehed. The denominations ased and thef g- 1z2= '% bo~~~~~~~~~~~~~~hundaries showne as this reap do eat irply, on the part af the World Batmk and tse
N, D 16K,-a <" atlisatee, any judgment on the legal araton af any terrheory or aay esderseasent a,N D,1
N Er SIAcsceptance af sucoth oandaries."71 N,2' > 120 124 128
l l l~~~~~~~p