The pharmacokinetic interaction between cyclosporine and ...
143
The pharmacokinetic interaction between cyclosporine and methoxsalen Miralien Bouwer B.Pharm Thesis submitted in fulfilment of the degree M.Sc. (Pharmacology) in the SCHOOL OF PHARMACY (PHARMACOLOGY) at the POTCHEFSTROOM UNIVERSITY FOR CHRISTIAN HIGHER EDUCATION Promotor: Dr. M. Rheeders
-
Upload
khangminh22 -
Category
Documents
-
view
2 -
download
0
Transcript of The pharmacokinetic interaction between cyclosporine and ...
The pharmacokinetic interaction between
cyclosporine and methoxsalen
Miralien Bouwer
B.Pharm
Thesis submitted in fulfilment of the degree
M.Sc. (Pharmacology) in the
SCHOOL OF PHARMACY (PHARMACOLOGY)
at the
POTCHEFSTROOM UNIVERSITY FOR CHRISTIAN HIGHER EDUCATION
Promotor: Dr. M. Rheeders
Abstract
Cyclosporine forms the cornerstone of therapy to prevent rejection after organ transplantation.
However, the clinical use of the drug is compromised by a narrow therapeutic window and a
wide inter- and intra-individual variation in metabolism. Cyclosporine is metabolised by the
CYP3A4 isoenzymes in both the liver and intestine, while it has been reported that the
metabolism of the drug can be inhibited by certain furocoumarin derivatives in grapefruit juice.
Methoxsalen (8-methoxypsoralen) is a furocoumarin and a potent inhibitor of the cytochrome
P450 system in both the liver and intestine. The study was conducted to investigate the
possibility whether methoxsalen may inhibit the metabolism of cyclosporine and thereby
increase the bioavailability of the drug. The interaction is of clinical relevance since both drugs
are used in the treatment of psoriases.
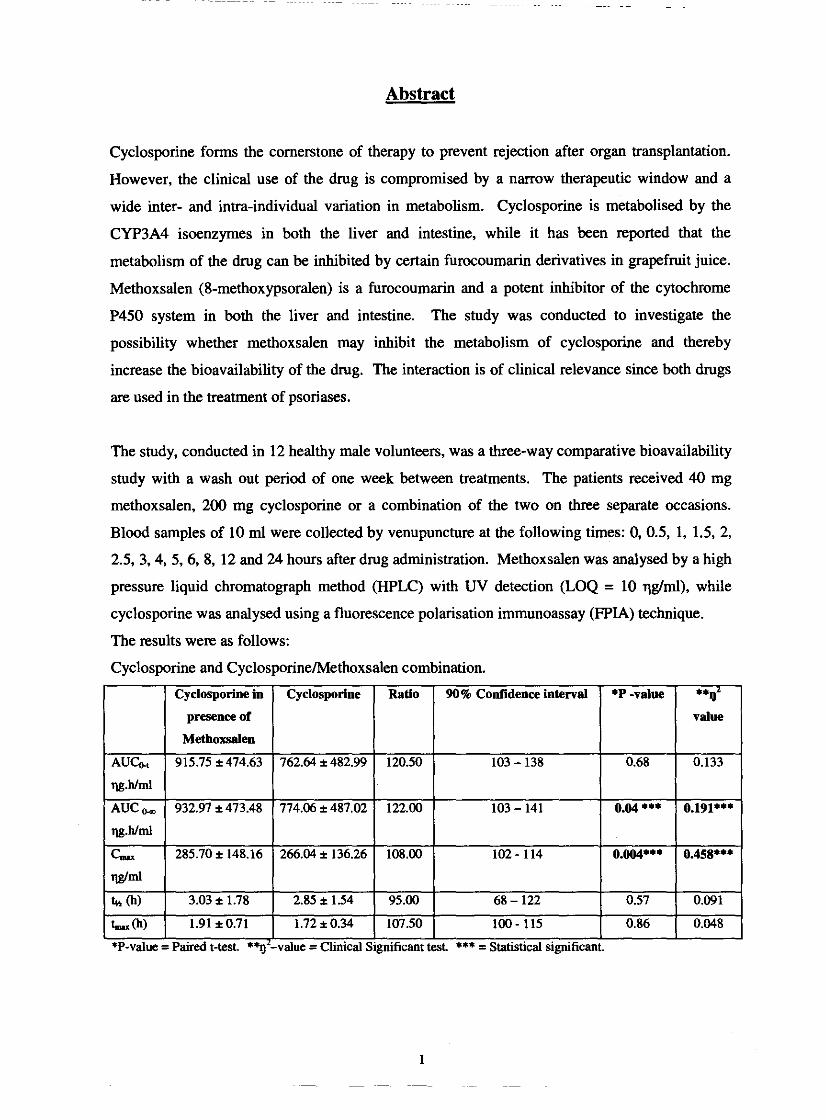
The study, conducted in 12 healthy male volunteers, was a three-way comparative bioavailability
study with a wash out period of one week between treatments. The patients received 40 mg
methoxsalen, 200 mg cyclosporine or a combination of the two on three separate occasions.
Blood samples of 10 ml were collected by venupuncture at the following times: 0, 0.5, 1, 1.5, 2,
2.5, 3.4, 5,6, 8, 12 and 24 hours after drug administration. Methoxsalen was analysed by a high
pressure liquid chromatograph method (HPLC) with UV detection (LOQ = 10 qgtml), while
cyclosporine was analysed using a fluorescence polarisation immunoassay (FPIA) technique.
The results were as follows:
Cyclosporine and Cyclosporinehlethoxsalen combination.
L I I I I
*P-value = Paired t-test. *%'-value =Clinical Significant test *** = Statistical significant. I

Methoxsalen and the Methoxsalen/Cyclosporine combination.
There was a statistical significant difference in AUCo, and C& ' for cyclosporine when
methoxsalen was added to the drug regimen. When the methoxsalen levels were compared with
those in the presence of cyclosporine, the levels were lower, although the difference was not
statistical significant. We conclude that methoxsalen increase the levels of cyclosporine by
inhibiting the P450 system enzymes in the liver and intestine. However, the absorption of
methoxsalen is highly variable in the same individual which needs to be considered before this
interaction can be regarded as being of any clinical relevance.
Key words: Cyclosporine, Methoxsalen, Furocoumarin, Grapefruit juice, Cytochrome P450,
Cytochrome P450 3A4 (CYP3A4), Intestinal metabolism, HPLC.
Siklosporien is die keusemiddel om verwerping na orgaan oorplanting te voorkom. Die kliniese
gebmik van siklosporien word ingeperk deur die nou terapeutiese reikwydte van die middel
asook die groot inter- en intra-individuele verskille in metabolisme. Die geneesmiddel word
deur die CYP3A4 iso-ensieme in die lewer en dunderm gemetaboliseer. Daar is in die literatuur
gerapporteer dat die metabolisme van siklosporien geinhibeer kan word deur sekere
furokumarien derivate wat in pomelosap voorkom. Metoksalen (8-metoksipsoraleen) is ook 'n
furokumarien derivaat en 'n sterk inhibeerder van die sitochroom P450 sisteem in die dunderm
en lewer. Die doel van hierdie studie was om ondersoekin te stel of metoksalen die metabolisme
van siklosporien kan onderdruk en dus die biobeskikbaarheid van die middel kan verhoog. Die
twee middels word beide vir die behandeling van psoriase gebmik en die interaksie kan dus
kliniese voordele inhou.
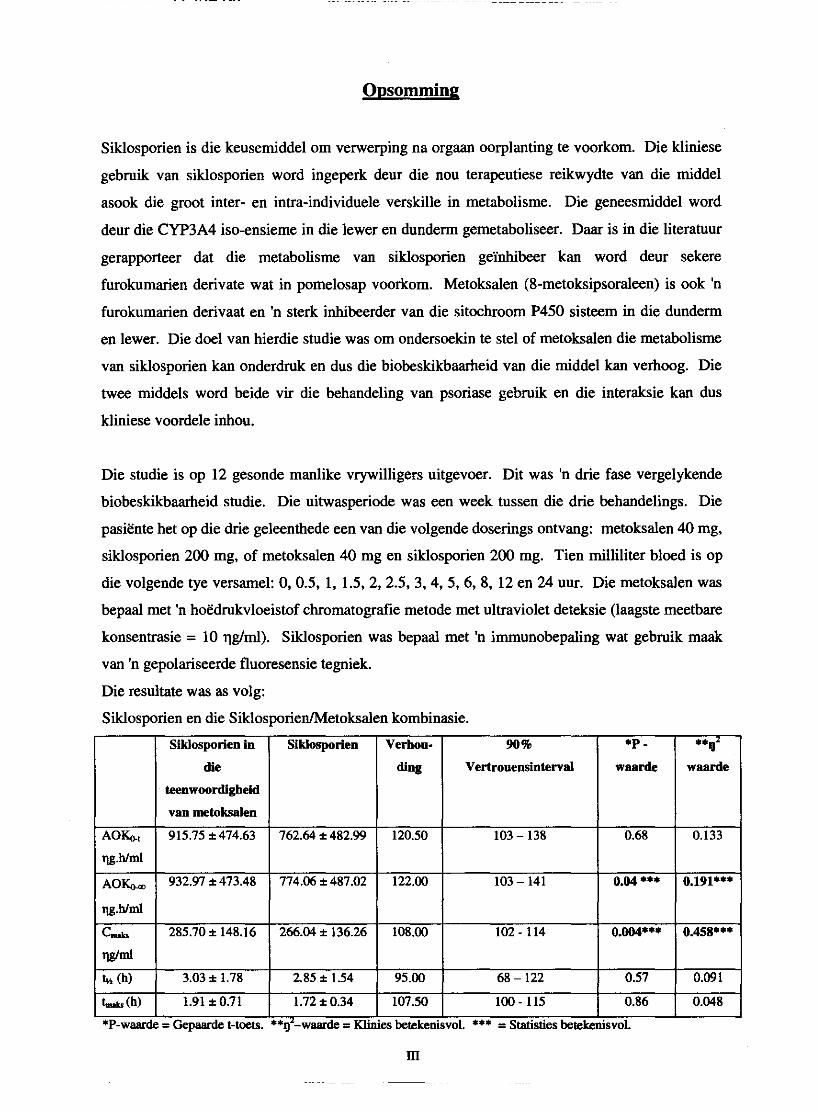
Die studie is op 12 gesonde manlike vrywilligers uitgevoer. Dit was 'n drie fase vergelykende
biobeskikbaarheid studie. Die uitwasperiode was een week tussen die drie behandelings. Die
pasiente het op die drie geleenthede een van die volgende doserings ontvang: metoksalen 40 mg,
siklosporien 200 mg, of metoksalen 40 mg en siklosporien 200 mg. Tien milliliter bloed is op
die volgende tye versamel: 0,0.5, 1, 1.5,2, 2.5, 3,4,5, 6, 8, 12 en 24 uur. Die metoksalen was
bepaal met 'n hoedrukvloeistof chromatografie metode met ultraviolet deteksie (laagste meetbare
konsentrasie = 10 qgtml). Siklosporien was bepaal met 'n immunobepaling wat gebmik maak
van 'n gepolariseerde fluoresensie tegniek.
Die resultate was as volg:
Siklosporien en die SiklosporiedMetoksalen kombinasie.
Vertrouensintewd

Metoksalen en die Metoksalen/Siklosporien kombinasie.
teenwoordigheid Vertrouensintewal
Daar was 'n statisties beduidende verskil in siklosporien AUCo, en C- wanneer metoksalen
saam met siklosporien toegedien word. Die metoksalen vlakke het verlaag wanneeer
siklosporien bygevoeg is maar hierdie verlaging was nie statisties beduidend nie. Daar kan dus
afgelei word dat metoksalen we1 die P450 ensiem sisteem in die lewer en dunderm inhibeer en
sodoende die biobeskikbaarheid van siklosporien verhoog. Die absorpsie van metoksalen is baie
wisselvallig in dieselfde persoon en dit sal aangespreek moet word voordat hierdie kombinasie
van siklosporien en metoksalen klinies lewensvatbaar kan wees.
Sleutelwoorde: Siklosporien, Metoksalen, Furokumarien, Pomelosap, Sitochroom P450,
Sitochroom P450 3A4 (CYP3A4), Ingewande metabolisme, Hoedrukvloeistofchromatografie.

Bedankings
Hiermee wil ek net my opregte dank en waardering uitspreek teenoor die volgende persone
waarsonder hierdie studie nie moontlik sou wees nie:
Dankie Goeie Vader, v u die baie wat my geleer het om te glo in die dankbaarheid.
-Eug. Laridon-
Dr. Malie Rheeders, my studieleier, vir haar bereidwilligheid om my te help met soveel
leiding, motivering en inspirasie.
Prof. Dinki Muller wat my so vriendelik gehelp het met die relings van die kliniese
proef en sy advies aangaande die resultate.
Prof. Wimpie du Plooy, Mnr. M. Vata en Me. P. Tsipa van MEDUNSA wat betrokke
was by die analise van siklosporien vir hulle vriendelikheid.
Al die personeel en vriende van die Departement Fmakologie by die Potchefstroomse
Universiteit vir Christelike H&r Onderwys, vir hulle belangstelling en ondersteuning.
'n Spesiale woord van dank aan Francois Viljoen wat so geduldig en blymoedig altyd 'n
helpende hand uitgesteek het.
Susan de Kock, vir haar omgee en unieke vriendskap.
Mev. Marie van Zyl vir haar gewilligheid om altyd te help en vir die spyseniering
tydens die kliniese proef, dit was met soveel sorg en liefde gedoen.
Mnr. Naas van Rooyen met al die hulp van die bestellings.
Die 12 proefpersone, wat so brad en positief deel was van my studie.
Dr. Paul Dikstra en sy kollegas vir die hulp en bystand tydens die kliniese proef.
Suster Frieda Hildebrand saam met wie ek so lekker gewerk het met die kliniese proef,
viral die raad en hulp.
Dr. Suria Ellis en die Statistiese Konsultasie Diens by die Potchefstroomse Universiteit
vir CHO vir die advies en hulp met die statistiese analise van die data.

Jaco, vir a1 jou motivering, raad, inspirasie en soveel liefde. Ons het dit gedoen. Jy is vir
ewig spesiaal.
My ouers, Chris en Elise, my sussie, Marita en my boetie Lood. Ek kon nie vir beter
motiveerders en ondersteuners gevra het nie. Dankie vir die belangstelling en 'n
wonderlike huis waarheen ek altyd kon te~gkeer vir asemskep en ontspan.
Die res van my familie vir hul belangstelling.
My Liewe Jesus. Niks kan begin, volhard en einding sonder U nie. Baie dankie.
"En wat besit jy wat jy nie ontvang het nie?"
1 Kor. 4:7
Table of contents
Chapter 1: Introduction
1.1. Background
1.2. Study objectives
1.3. References
Chapter 2: The cytochrome P450 (CYP) enzyme system
2.1. Introduction
2.2. CYP chemistry
23. Families, subfamilies and nomenclature of the P450 cytochrome system
2.4. Distribution
2.4.1. CYP in the liver
24.2. CYP in the intestine
2.5. Inter-individual variability of CYP and drug metabolism
2.6. CYP in drug interactions
2.6.1. Intestinal enzyme induction
2.6.2. Enzyme inhibition
2.6.2.1. Presystemic metabolism
2.6.2.2. Competitive inhibition
2.7. P-glycoprotein
2.7.1. Structure of p-glycoprotein
27.2. Drug binding sites of p-glycoprotein
2.7.3. The ATP dependence of p-glycoprotein
2.8. Cytochrome P450 and p-glycoprotein
2.9. References
Chapter 3: Methoxsalen
3.1. Introduction
3.2. Structures and clinical formulation
33. Pharmacokinetics
3.3.1. Absorption
33.2. Distribution

3.3.2.1. Protein binding
3.3.3. Metabolism
3.3.3.1. Inactivation of CYP by 8-MOP
3.3.3.2. Inter- and intraindividual variability
3.3.3.3. 8-MOP and smoking cessation
3.3.4. Elimination
3.4. References
Chapter 4: Cyclosporine
4.1. Introduction
4.2. Structure and clinical formulation
4.3. Pharmacokinetics
Absorption
Distribution
The effect of cyclosporine on the cellular distribution and content
of cyclophilin
Difference between whole blood and serum concentrations
Metabolism
Amount and number of metabolites
Variability in the oral pharmacokinetics of cyclosporine
Elimination
Drug interactions
The role of P-glycoprotein
4.4. Pharmacological actions
4.4.1. Effects on T cells
4.4.2. Effects on thymus
4.43. Effects on P cells
4.4.4. Effects on accessory cells
45. Uses of cyclosporine
4.6. Toxic effects
4.6.1. Renal toxicity
4.6.2. Vascular and haematologic complications
4.6.3. Neurologic and dermal complications
4.6.4. Hepatic toxicity
4.6.5. Respiratory side effects
4.6.6. Cardiac toxicity
4.67. Ophtalmic toxicity
4.6.8. Metabolic and humoral toxicity
4.6.9. Gastrointestinal complications
4.6.10. Effect on bone
4.6.11. Cyclosporine-related malignancy and infections
4.7. References
Chapter 5: Analytical methods 5.1. Method validation
5.1.1. Linearity
5.1.2. Range
5.1.3. Accuracy
5.1.4. Precision (repeatability)
5.15. Specificity
5.1.6. Ruggedness/robustness
5.1.7. Limit of detection
5.1.8. Limit of quantification
5.2. HPLC method
Experimental procedures
Materials
Instrumentation
Glassware
Standard solutions of 8-MOP
Standard solutions of TMP
Liquid extraction
Standard curves
Validation results
Linearity and range
Accuracy
Precision
Specificity
Ruggedness/robustness
Limit of detection
Limit of quantification
M
- --

5.3. HPLC method procedures
5.4. FPIA method
5.4.1. Background of the method
5.4.1.1. Reagents
5.4.1.2. Cyclosporine monoclonal whole blood calibrators
5.4.1.3. Cyclosporine monoclonal whole blood controls
5.4.2. Sample collection and preparations for testing analysis
5.4.3. FPIA method procedures
5.4.4. Results
5.45. Trademarks
5.5. References
Chapter 6: Methods: Clinical study and pharmacokinetic analysis
6.1. Clinical study
6.1.1. Selection of subjects
6.1.2. Inclusion and exclusion criteria
6.1.3. Subject responsibilities
6.2. Study design
6.2.1. Number of subjects
6.2.2. Study design
6.23. Dosing
6.2.4. Fasting and meals
63. Materials
63.1. Methoxsalen and cyclosporine used
6.4. Sampling schedule
6.4.1. Samples for analysis of serum methoxsalen and cyclosporine
6.5. Data analysis
65.1. Pharmacokinetic calculations
6.5.2. Statistical analysis
6.5.2.1. Analysis of variance (ANOVA)
6.5.2.2. Paired t-test
6.5.2.3. Clinical significance
6.6. References

Chapter 7: Pharmacokinetic results, discussion and conclusion
7.1. Demographic data of the volunteers
7.2. Pharmacokinetic data of cyclosporine and methoxsalen
7.2.1. Dosages
7.2.2. Individual plasma level profile of cyclosporine
7.2.3. Individual plasma level profile of methoxsalen
7.3. Pharmacokinetic parameters
7.3.1. Individual pharmacokinetic parameter of cyclosporine
7.3.2. Individual pharmacokinetic parameter of methoxsalen
7.3.3. Geometric statistical parameters of cyclosporine
7.3.4. Geometric statistical parameters of methoxsalen
7.4. Discussion
75. Conclusion
7.6. References
Appendix 1
List of Figures
P
Chapter 2 6
Fig. 2.1. Simplified model of CYP mixed function oxidase reaction sequence 7
Fig. 22. Drug metabolism by the CYP's 9
Fig. 2.3. Model of the transmembrane orientation of p-glycoprotein 19
Fig. 2.4. The ATPase cycle of p-glycoprotein binding 20
Chapter 3
Fig. 3.1. Chemical structure of the psoralens
Fig. 32. Proposed metabolic pathway of 8-MOP
Fig. 3.3. Michaelis-Menten kinetics
Chapter 4
Fig. 4.1.
Fig. 4.2.
Fig. 4.3.
Fig. 4.4.
Fig. 4.5.
Fig. 4.6.
Fig. 4.7.
Fig. 4.8.
Fig. 4.9.
The chemical structure of cyclosporine
Cyclosporine levels in blood (serum) following an oral dose
Enterohepatic cycling
Distribution of cyclosporine in whole blood at room temperature
Cyclosporine tissue levels expressed as qg/g tissue wet weight
determined on samples obtained from various organs at immediate
postmortem examination
Distribution and elimination of cyclosporine
Metabolic patterns in plasma blood cells after an oral dose of
300 mg [ 3 ~ ] cyclosporine in male healthy volunteers
Structure of isolated metabolites of cyclosporine
Individual trough cyclosporine concentrations in blood for the
three phases of the study (phase 1 = water, phase 2 = grapefruit
juice, phase 3 = water)
Chapter 5 69 Fig. 5.1. Graphic comparison of linear curve 1,2 and 3 74
Fig. 5.2. HPLC chromatogram of the mobile phase (45% ammonium
acetate buffer, pH 555% acetonitrile) 76
- ~-~ ~~~~~
Fig. 5.3.
Fig. 5.4.
Fig. 5.5.
Fig. 5.6.
Fig. 5.7.
Fig. 5.8.
Fig. 5.9.
HPLC chromatogram of pure, distilled water
HPLC chromatogram of 100% HPLC-grade acetonitrile
HPLC chromatogram of the internal standard (TMP) that
was prepared according to the method described in Section
5.2.3. but with the omission of 8-MOP 78
HPLC chromatogram of the assayed compound (8-MOP) that
was prepared according to the method described in Section 5.2.2. 78
HPLC chromatogram of a pig plasma sample that was prepared
according to the method described in Section 5.2.2. for 8-MOP,
5.2.3. for TMP and 5.2.4. for the extraction
The effect of variation in mobile phase composition on the
retention time of 8-MOP and TMP
The effect of variation in flow rate on the retention time of
8-MOP and TMP
Chapter 7
Fig. 7.1. Graph representing individual plasma levels of cyclosporine
Fig. 7.2. Graph representing individual plasma levels of cyclosporine
in the presence of methoxsalen
Fig. 7.3. Graph representing individual plasma levels of methoxsalen
Fig. 7.4. Graph representing individual plasma levels of methoxsalen
in the presence of cyclosporine
List of Tables
Chapter 2
Table 2.1. Characteristics of some human liver CYP's
Table 2.2. Functional importance of polymorphism in phase I CYP enzymes
Table 2.3. Drugs metabolised by cytochrome CYP3A4 and tbe extent of
Presystemic metabolism
Table 2.4. Inhibitors of CYP3A4
Table 2.5. Localisation of p-glycoprotein in normal human tissues
Table 2.6. Inhibitors and inducers of both CYP3A4 and p-glycoprotein
Chapter 3
Table 3.1. Pharmacokinetic parameters of 8-MOP 0.5 to 0.6 mgkg orally
in 18 psoriatic patients
Table 3.2. Factors influencing bioavailability of drugs
Chapter 4
Table 4.1.
Table 4.2.
Table 4.3.
Table 4.4.
Table 4.5.
Table 4.6.
Table 4.7.
Table 4.8.
Table 4.9.
Pharmacokinetic characteristics of cyclosporine
Factors affecting cyclosporine absorption
Pharmacokinetic data for total and unbound cyclosporine in
plasma after single doses 912 mgkg) on two occasions
Factors affecting cyclosporine elimination
Drug interactions with cyclosporine manifesting as alterations
in blood concentrations of cyclosporine
Cyclosporine dose, area-under-tbe-concentration-time curve
at steady state (AUC), maximum concentration (C-), time
to reach maximum concentration (t-) and absorption half-
lives (tn) for cyclosporine administered as the conventional
or microemulsified formulation
Pharmacokinetic parameters of some drug-grapefruit juice
interactions
Agents that interact with p-glycoprotein
Effects of cyclosporine on renal function
XIV
.-
I

Table 4.10. Neurological side effects of cyclosporine
Chapter 5
Table 5.2.6.1. Determination of linearity within the chosen range
Table 5.2.6.2. Accuracy
Table 5.2.6.3. Determination of precision
Chapter 6
Table 6.1.
Chapter 7
Table 7.1.
Table 7.2.
Table 7.3.
Table 7.4.
Table 7.5.
Table 7.6.
Table 7.7.
Table 7.8.
Table 7.9.
Table 7.10.
Illustration of the crossover study
Demographic data of 12 male volunteers
Study design
Individual plasma levels of cyclosporine in qglml
Individual plasma levels of cyclosporine in the presence of
Methoxsalen in q g h l
Individual plasma levels of methoxsalen in qg!d
Individual plasma levels of methoxsalen in the presence of
Cyclosporine in qglml
Individual pharmacokinetic parameters for cyclosporine and
The combination of cyclosporine and methoxsalen
Individual pharmacokinetic parameters for methoxsalen and
The combination of methoxsalen and cyclosporine
Geometric statistical parameters of cyclosporine
Geometric statistical parameters of methoxsalen

Glossary
The definition or meanings of the various symbols, abbreviations and terminology used in this
dissertation are as follows:
Cyclosporine:
BMI
BNF
C A
cm CHE
C1
G cv CYF'
CYP3A4
DAD
DNA
: According to the American dictionary
: percentage coefficient of variation
: 8-methoxypsoralen, methoxsalen
: 5-methoxypsoralen, bergapten
: analysis of variance
: adenosine triphosphate
: adenosine diphosphate
: aryl hydrocarbon hydroxylase
: area under the curve
: area under the curve for methoxsalen
: area under the curve for trioxsalen
: area under the curve from time 0 to the time of last blood sample
: area under the curve from time 0 to infinity
: body mass index
: P-naphtoflavone
: caffeine
: maximum concentration of drug in the plasma
: Christian higher education
: clearance
: plasma concentration at corresponding time
: coefficient of variation
: cytochrome P450
: cytochrome P450 3A4
: diode and multiple wavelength detector
: deoxyribonucleic acid
XVI
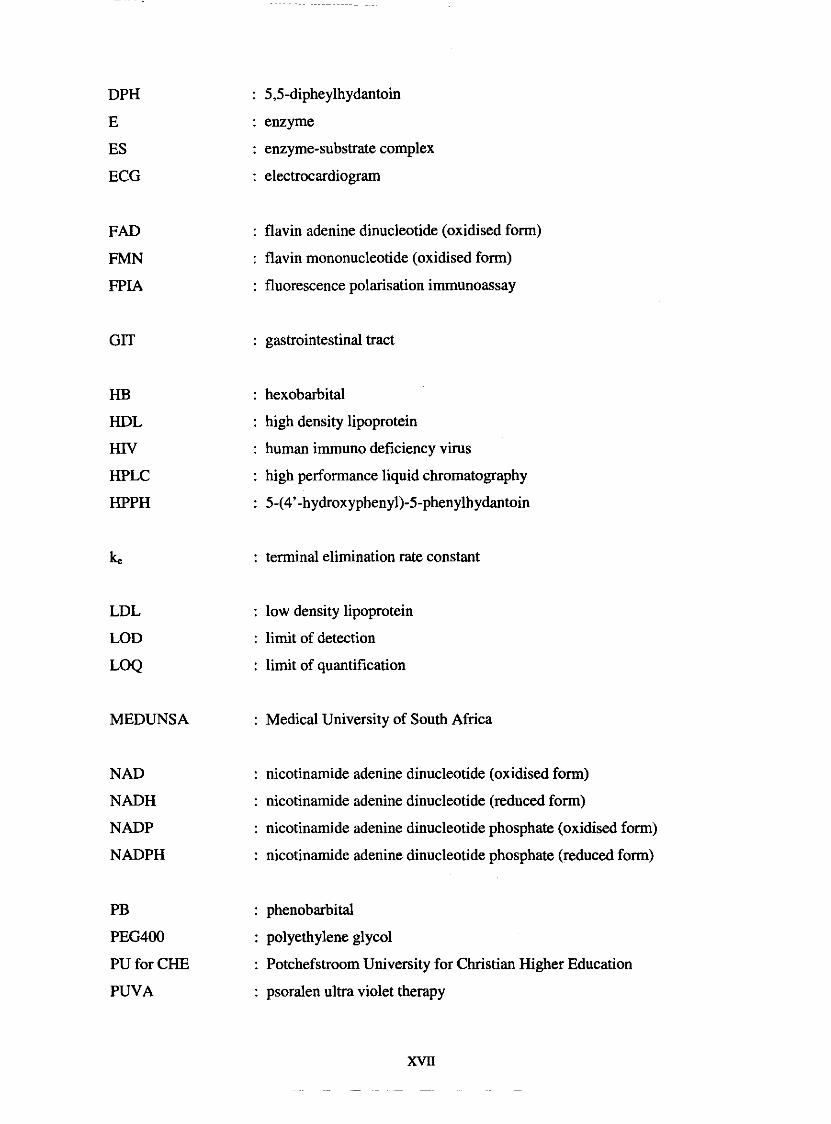
DPH
E
ES
ECG
FAD
FMN
FPIA
GlT
HB
HDL
HIV
HPLC
HPPH
LDL
LOD
LOQ
MEDUNSA
NAD
NADH
NADP
NADPH
PB
PEG400
PU for CHE
PUVA
: 5,5-dipheylhydantoin
: enzyme
: enzyme-substrate complex
: electrocardiogram
: flavin adenine dinucleotide (oxidised form)
: flavin mononucleotide (oxidised form)
: fluorescence polarisation immunoassay
: gastrointestinal tract
: hexobarbital
: high density lipoprotein
: human imrnuno deficiency virus
: high performance liquid chromatography
: 5-(4'-hydroxypheny1)-5-phenylhydantoin
: terminal elimination rate constant
: low density lipoprotein
: limit of detection
: limit of quantification
: Medical University of South Africa
: nicotinamide adenine dinucleotide (oxidised form)
: nicotinamide adenine dinuclwtide (reduced form)
: nicotinamide adenine dinucleotide phosphate (oxidised form)
: nicotinamide adenine dinucleotide phosphate (reduced form)
: phenobarbital
: polyethylene glycol
: Potchefstroom University for Christian Higher Education
: psoralen ultra violet therapy
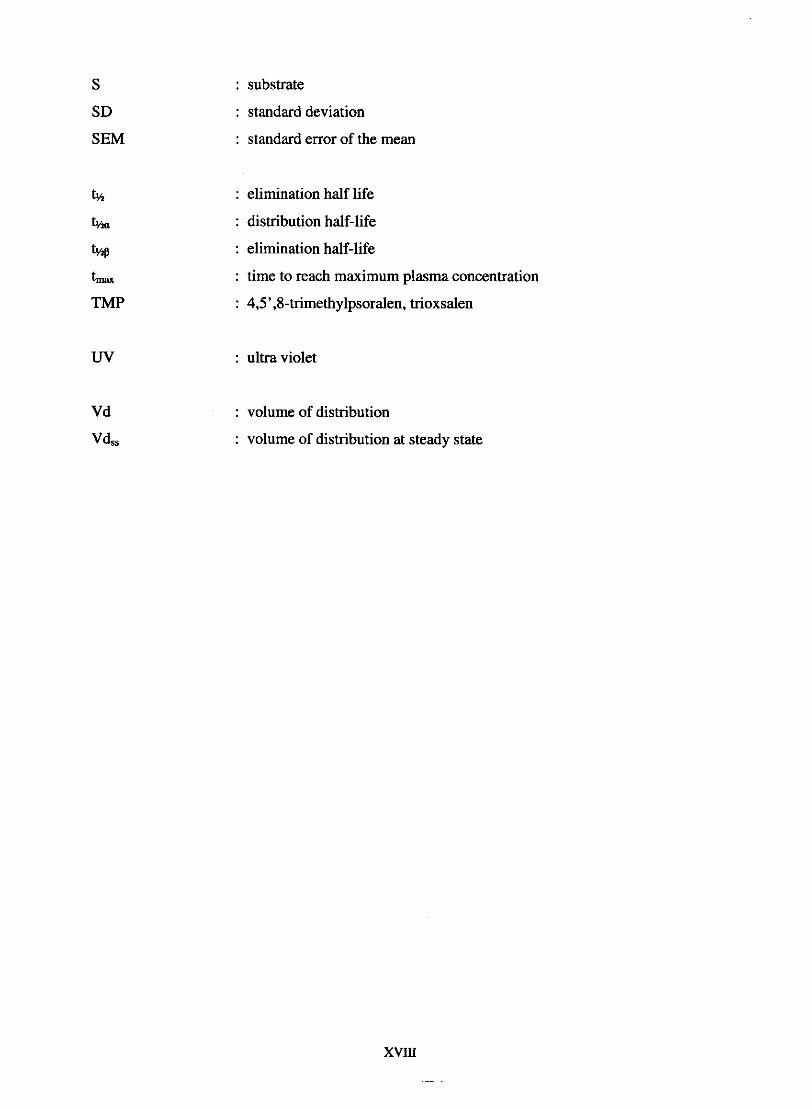
S
SD
SEM
: substrate
: standard deviation
: standard error of the mean
: elimination half life
: distribution half-life
: elimination half-life
: time to reach maximum plasma concentration
: 4,5',8-trimethylpsoralen, trioxsalen
: ultra violet
: volume of distribution
: volume of distribution at steady state

1. Introduction
1.1. Background
Cyclosporine, is a cyclic undecapeptide, highly lipid soluble compound, isolated from
Norwegian soil fungi in 1970. Cyclosporine suppresses cytokine production (especially
interleukin-2) by T cells. Less pronounced immunosuppression is the result of this selective
action, while efficacy over older agents is improved. For these reasons, it forms the cornerstone
of therapy for maintenance in immunosuppression following transplantation, while its role in a
variety of diseases which involve the immune mechanisms is increasing (Jones, 1997).
However, its clinical use is complicated by its narrow therapeutic index, the daily dose of
cyclosporine required to suppress organ rejection in some patients can cause renal and
neurologic toxicity in others (Lown et al, 1997). To maintain blood levels within a relatively
narrow range (approximately 150-400 nghl), can be a difficult task due, in large part, to the
wide inter-patient variability in oral bioavailability ranging from less than 5% to as much as 90%
(Ducharme et al, 1993).
Absorption of cyclosporine occurs only in the upper gastrointestinal tract (Jones, 1997). When
administered intravenously, the drug distributes rapidly with a bi-phasic distribution pattern.
The first phase of intravenous distribution occurs rapidly and represents distribution into
erythrocytes, where cyclosporine is bound to hemoglobin. A second distribution phenomenon
occurs as the drug distributes into peripheral tissues. Cyclosporine's elimination half-life ranges
from 3 to 40 hours. The average half-life is approximately 10 hours. When given orally, the
peak blood concentration occurs within 2-3 hours. The blood concentration then remains
statically elevated at approximately the same concentration for up to six hours, representing a
prolonged period of absorption (Moyer et al, 1986). The poor and variable bioavailability of
cyclosporine may relate to pre-systemic metabolism of cyclosporine in the gut wall @ucharme
et al, 1993).
The cytochrome P450 (CYP3A4) isoenzyme, found in both the liver and enterocytes, is the
major enzyme responsible for cyclosporine metabolism. Interindividual variability in intestinal
CYP3A4 activity has been demonstrated and that is why the metabolism of cyclosporine might
explain the huge interpatient variability in absorption. It was thought that metabolism occurred
primarily in the liver, but the importance of intestinal metabolism was established by Kolars &
1
co-workers (1991) and it may even exceed hepatic metabolism (Jones, 1997). If the extent of
intestinal first-pass metabolism is proportional to the intestinal content of CYP3A4, it would
seem to be likely that variation in intestinal CYP3A4 activity could account for a portion of the
unexplained variation in the oral pharmacokinetics of cyclosporine (Lown et al, 1997).
Another potential source of variation in oral cyclosporine pharmacokinetics may be related to the
expression of P-glycoprotein, the multi drug resistance gene (mdrl) product, a transmembrane
protein in the intestine (Edwards et al, 1999). P-glycoprotein is a versatile transporter that is
able to pump a wide variety of xenobiotics including cyclosporine. P-glycoprotein is located
almost exclusively within the brush border on the apical (luminal) surface of the enterocyte
where it pumps xenobiotics from the cytoplasm to the exterior of the cell (i.e., from the
enterocyte back into the intestinal lumen) (Lown er al, 1997). This protective function is shared
with cytochrome P450 enzymes such as CYP3A4, and many compounds have been identified as
substrates or inhibitors of both CYP3A4 and P-glycoprotein (Edwards et al, 1999). As with
CYP3A4, there is significant interindividual variation in the intestinal expression of P-
glycoprotein. High intestinal levels of P-glycoprotein may interfere with drug absorption and
contribute to the variation in cyclosporine oral pharmacokinetics (Lown et al, 1997).
Blood levels of cyclosporine are increased if taken with grapefruit juice. The mechanism by
which grapefruit juice improves cyclosporine bioavailability is of interest. Because systemically
available cyclosporine is almost entirely eliminated by hepatic metabolism and grapefruit juice
had no effect on intravenous cyclosporine, the increase in plasma concentrations and
bioavailability with oral dosing is the result of an effect on the gut rather than the liver.
Ducbarme & co-workers (1995) indicated that grapefruit juice affects cyclosporine absorption
and/or gut wall metabolism.
There is some increase of interest in the co-administration of cyclosporine with inhibitors of
CYP3A4 in order to increase concentrations, in patients having difficulty attaining therapeutic
levels and to decrease the cost of therapy with this expensive drug (Ducharme et al, 1993).
Methoxsalen (8-methoxypsoralen) is a naturally occurring tricyclic furocoumarin (Bickers et al,
1982) present in several plant species (Fouin-Fortunet et al, 1985). Methoxsalen is used
clinically in the treatment of selected dermatological diseases including vitiligo, psoriasis, and
mycosis fungoides (Bickers et al, 1982). Methoxsalen is orally administered at 0.6 mglkg for
psoralen (PUVA) therapy (Mays et al, 1987).
Tinel and co-workers (1987) reported that methoxsalen is activated by rat liver cytochrome P450
into reactive metabolites which covalently bind to microsomal proteins and inactivate
cytochrome P450. As a consequence of both competitive inhibition by methoxsalen itself, and
suicide inactivation by methoxsalen metabolites, the drug is a potent inhibitor of rat liver
cytochrome P450. They concluded that methoxsalen destroys CO-binding to cytochrome P450,
and markedly decreases monooxygenase activities in human liver microsomes (Tine1 et al,
1987). Thus effect can be extended to the inhibition of gut wall P450 enzymes. It seems, from
the literature, that the methoxsalen effect on the metabolism can be compared to the effect of
grapefruit juice on the metabolism of cyclosporin. The clearance of caffeine decreased from 110
d m i n to 34 d m i n in patients who received methoxsalen an hour before administration (Mays
et al, 1987).
1.2. Study objectives
The primary aims of this study are to:
Investigate the effects of methoxsalen (a psoralen) on the pharmacokinetics and
bioavailability of cyclosporine.
Determine the plasma levels of methoxsalen to investigate the inter-individual variation of
the drug between individuals.
To develop a HPLC method for the determination of methoxsalen concentrations in human
plasma after oral adminstration.

1.3. References
BICKERS, C.R., MUKHTAR, H., MOLICA, S.J & PATHAK, M.A. (1982). The effect of
psoralens on hepatic and cutaneous drug metabolising enzymes and cytochrome P-450. The
journal of investigative dermatology, 79:201-205.
DUCHARME, M.P., PROVENZANO, R., DEHOORNE-SMITH, M & EDWARDS, D.J.
(1993). Trough concentrations of cyclosporine in blood following administration with grapefruit
juice. British journal of clinicalpharmacology, 36:457-459.
DUCHARME, M.P., WARBASSE, L.H. & EDWARDS, D.J. (1995). Disposition of
intravenous and oral cyclosporine after administration of grapefruit juice. Clinical
pharmacology and therapeutics, 57:485-491.
EDWARDS, D.J., FITZSIMMONS, ME., SCHETZ, E.G., YASUDA, K., DUCHARME, M.P.,
WARBASSE, L.H., WOSTER, P.M., SCHUETZ, J.D. & WATKINS, P. (1999). 6'7'-
Dihydroxybergamottin in grapefruit juice and seville orange juice: Effects on cyclosporine
disposition, enterocyte CYP3A4, and P-glycoprotein. Clinical pharmacology and therapeutics,
65:237-244.
FOUlN-FORTUNET, H., TINEL, M., DESCATOIRE, V., LETTERON, P., LARREY, D.,
GENEVE, J & PESSAYRE, D. (1985). Inactivation of cytochrome P-450 by the drug
methoxsalen. The journal ofphannacology and experimental therapeutics, 236(1):237-247.
JONES, T.E. (1997). The use of other drugs to allow a lower dosage of cyclosporin to be used.
Clinicalpharmacokineries, 32(5):357-367.
KOLARS, J.C., AWN, W.M., MERION, R.M. & WATKINS, P.B. (1991). First-pass
metabolism of cyclosporin by the gut. Lancet, 338:1488-1490.
LOWN, K.S., MAYO, R.R., LEICHTMAN A.B. HSIAO H-L., TURGEON K., SCHMIEDLIN
-REN P., BROWN M.B., GUO W., ROSS1 S.J., BENET L.Z. & WATKINS P.B. (1997). Role
of intestinal P-glycoprotein (mdr 1 ) in interpatient variation in the oral bioavailability of
cyclosporine. Clinicalpharmacology and therapeutics, 62:248-260.

MAYS, D.C., CAMISA, C., CHENY, P., PACULA, C.M., NAWOOD, S. & GEBE, N. (1987).
Methoxsalen is a potent inhibitor of the metabolism of caffeine in humans. Clinical
pharmacology and therapeutics, 42 (6): 621-626.
MOYER, T.P., JOHNSON, P., FAYNOR, S.M. & STERIOFF, S. (1986). Cyclosporine: A
review of drug monitoring problems and presentation of a simple, accurate liquid
chromatographic procedure that solves these problems. Clinical biochemistry, 19:83-89.
TINEL, M., BELGHITI, J., DESCATOIRE, V., AMOUYAL, G., LETTERON, P., GENEVE, J.,
LARREY, D. & PESSAYRE, D. (1987). Inactivation of human liver cytochrome P-450 by the
drug methoxsalen and other psoralen derivatives. Biochemicalpharmacology, 36(6):95 1-955.
2. The cvtocluome P450 (CYP)enzymesystem
2.1. Introduction
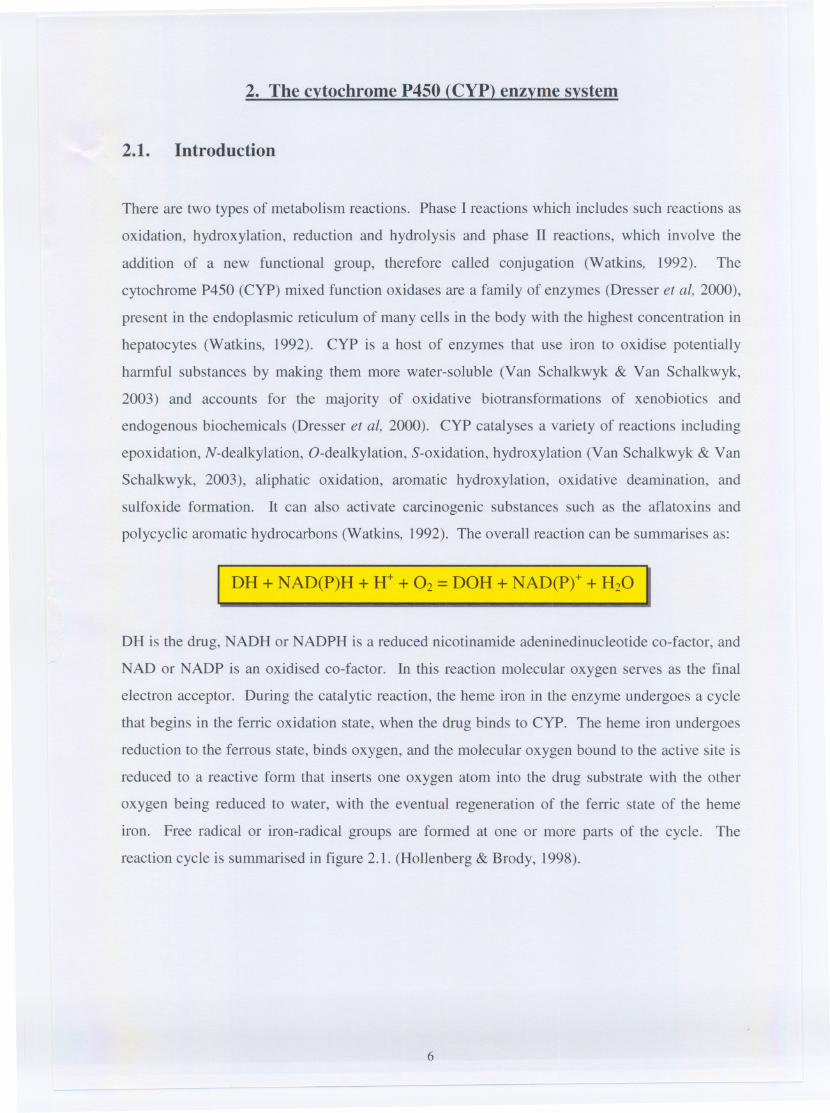
There are two types of metabolism reactions. Phase I reactions which includes such reactions as
oxidation, hydroxylation, reduction and hydrolysis and phase II reactions, which involve the
addition of a new functional group, therefore called conjugation (Watkins, 1992). The
cytochrome P450 (CYP) mixed function oxidases are a family of enzymes (Dresser et aI, 2000),
present in the endoplasmic reticulum of many cells in the body with the highest concentration in
hepatocytes (Watkins, 1992). CYP is a host of enzymes that use iron to oxidise potentially
harmful substances by making them more water-soluble (Van Schalkwyk & Van Schalkwyk,
2003) and accounts for the majority of oxidative biotransformations of xenobiotics and
endogenous biochemicals (Dresser et aI, 2000). CYP catalyses a variety of reactions including
epoxidation, N-dealkylation, O-dealkylation, S-oxidation, hydroxylation (Van Schalkwyk & Van
Schalkwyk, 2003), aliphatic oxidation, aromatic hydroxylation, oxidative deamination, and
sulfoxide formation. It can also activate carcinogenic substances such as the aflatoxins and
polycyclic aromatic hydrocarbons (Watkins, 1992). The overall reaction can be summarises as:
DH + NAD(P)H + H+ + O2=DOH + NAD(Pt + H20
DH is the drug, NADH or NADPH is a reduced nicotinamide adeninedinucleotide co-factor, and
NAD or NADP is an oxidised co-factor. In this reaction molecular oxygen serves as the final
electron acceptor. During the catalytic reaction, the heme iron in the enzyme undergoes a cycle
that begins in the ferric oxidation state, when the drug binds to CYP. The heme iron undergoes
reduction to the ferrous state, binds oxygen, and the molecular oxygen bound to the active site is
reduced to a reactive form that inserts one oxygen atom into the drug substrate with the other
oxygen being reduced to water, with the eventual regeneration of the ferric state of the heme
iron. Free radical or iron-radical groups are formed at one or more parts of the cycle. The
reaction cycle is summarised in figure 2.1. (Hollenberg & Brody, 1998).
6

------.----
NADP
NADPHorNADH
Figure 2.1: Simplified model of CYP mixed-function oxidase reaction sequence. D is the drug
undergoing oxidation to product DOH. Molecular oxygen serves as the final electron acceptor.
Flavin protein co-factor (Fp) systems are involved at several sites. The iron of the CYP is
involved in binding oxygen and electron transfer with changes in valence state (Hollenberg &
Brody, 1998)
It is known that the gene for CYP has existed for more then 3.5 billion years (Hayes, 2003). The
massive heterogeneity of these oxidases is thought to reflect the complex interdependence
between plants and animals (Van Schalkwyk & Van Schalkwyk, 2003). CYP was only capable
of reductive metabolic reactions. Gradually oxygen started to accumulate in the atmosphere and
the function of the enzyme changed. Oxidative capabilities developed which are of interest to us
in understanding drug metabolism in humans (llett, 1997). Plants develop new alkaloids to limit
their consumption by animals, and animals develop new enzymes to metabolise the plant toxins.
It appears that the number of CYP genes exploded at about the time when organisms moved
from the oceans to dry land - around 400 million years ago (Van Schalkwyk & Van Schalkwyk,
2003).
To identify the CYP component, the microsomal portion of the cell has to be extracted, resulting
in a rather opaque suspension. The microsome-containing solution is divided into two, after
adding an agent that reduces any heme that might be present. One part is exposed to carbon
monoxide, if this solution strongly absorbs light at a wavelength of 450 nm compared with the
original solution, it must contain CYP. This is called "difference spectroscopy" and
investigators are finding the "reduced CO difference spectrum". The P in P450 stands for
pigment. The reason why absorption occurs at this wavelength is related to one of the six
ligands associated with the iron atom contained in the heme (Van Schalkwyk & Van Schalkwyk,
2003).
7

2.2. CYP chemistry
The bond between the two atoms in an oxygen molecule is rather strong. This implies that a
substantial amount of energy is required to break the bond - energy that is supplied by addition
of electrons to the iron atom of heme. These electrons in turn come from the last protein in an
"electron transfer chain". There are two such chains in cells that end up at CYP. The first is in
the endoplasmic reticulum (ER), and the protein involved is called NADPH CYP reductase. The
electron flow is demonstrated below:
NADPHelectronflow .. FAD . FMN
NADPH = nicotinamide adenine dinucleotide phosphate (reduced form); FAD = flavin adenine dinucleotide
(oxidised form); FMN =flavin mononucleotide (oxidised form); CYP =cytochrome P450.
The second chain lurks within mitochondria. A complex bucket brigade of proteins hands the
electrons down to heme. NADPH passes electrons to ferredoxin reductase, thence to ferredoxin
(which itself has an iron-sulphur cluster), and from there to CYP (Van Schalkwyk & Van
Schalkwyk,2003).
2.3. Families, subfamilies and nomenclature of the P450 cytochrome system
The CYP's have been referred to as Supergenefamily for their significant homology among each
other in few regions of the proteins, suggesting a common ancestry. They comprise a
superfamily of hemeproteins that contain a single-iron protoporphyrin IX prosthetic group (Un
et ai, 1999). Nonetheless, there is heterogeneity in CYP structures with the genes distributed in
different chromosomes. 74 Gene families were known in 1996, 14families exist in all mammals
with 26 subfamilies from which 20 of these subfamilies have been mapped to the human
genome. Families have> 40% homology in their amino acid sequence while subfamilies have>
55%. The nomenclature are as follows: Root: CYP
Family:
Subfamily:
Gene:
CYP2
CYP2D
CYP2D6
(Flockhardt, 1999).
There are three gene families, CYP1, CYP2 and CYP3, thought to be responsible for drug
metabolism. CYPIA2, 2A6, 2B6, 2C, 2D6, 2El and 3A isoforms account for approximately
8
70% of human liver CYP. CYP3A (CYP3A4 and CYP3A5) and CYP2C (CYP2C8, 2C9, 2C18
and 2C19) are the most abundant subfamilies, accounting for 30% and 20% of total CYP,
respectively (Lin et ai, 1999).
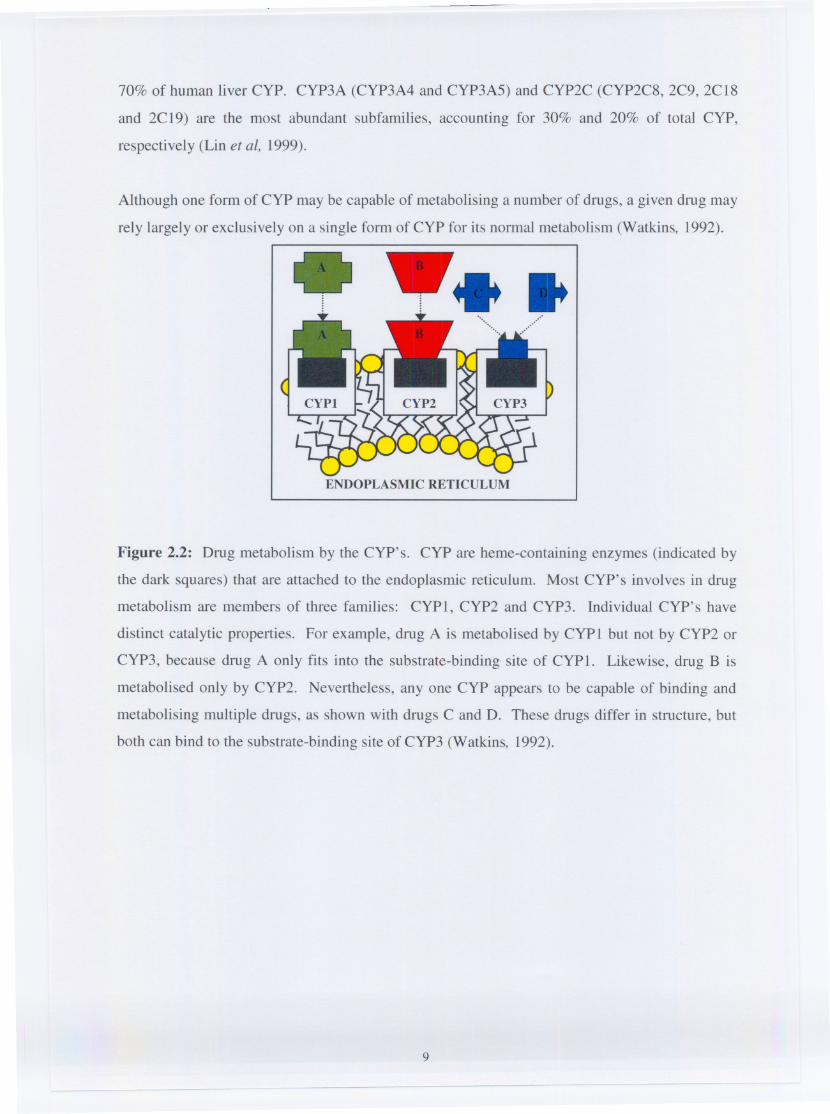
Although one form of CYP may be capable of metabolising a number of drugs, a given drug may
rely largely or exclusively on a single form of CYP for its normal metabolism (Watkins, 1992).. .. ..ENDOPLASMIC RETICULUM
Figure 2.2: Drug metabolism by the CYP's. CYP are heme-containing enzymes (indicated by
the dark squares) that are attached to the endoplasmic reticulum. Most CYP's involves in drug
metabolism are members of three families: CYPl, CYP2 and CYP3. Individual CYP's have
distinct catalytic properties. For example, drug A is metabolised by CYPI but not by CYP2 or
CYP3, because drug A only fits into the substrate-binding site of CYP1. Likewise, drug B is
metabolised only by CYP2. Nevertheless, anyone CYP appears to be capable of binding and
metabolising multiple drugs, as shown with drugs C and D. These drugs differ in structure, but
both can bind to the substrate-binding site of CYP3 (Watkins, 1992).
9
2.4. Distribution
Tissue like liver, kidneys, lungs, small intestine, brain, skin and lymphocytes contain the CYP
enzyme system (Fouin-Fortunet et al, 1986). It is not surprising that much of the CYP in man is
found in the liver, the main organ involved in drug and toxin removal, but a remarkable amount
is also found in the small intestine. Metabolic clearance of drugs is not the only function of CYP
- recently, it has been found that CYP is intimately involved in vascular autoregulation,
particularly in the brain. CYP is vital to the formation of cholesterol, steroids and arachidonic
acid metabolites (Van Schalkwyk & Van Schalkwyk, 2003).
Some isoforms are found throughout the body, for example CYP51, while other are limited to
one specific tissue (CYPllB2, found mainly if not exclusively in the glomemlosa zone of the
adrenal gland) (Van Schalkwyk & Van Schalkwyk, 2003). CYP3.45 is predominant in the lung
and stomach and is present in the small bowel and renal tissue. CYP3A7 is absent in adults but
is found in fetal livers (Watkins, 1992). CYPlA2 is not expressed in neonates, making them
particularly susceptible to toxicity from drugs such as caffeine (Van Schalkwyk & Van
Schalkwyk, 2003). CYP3A4 is the predominant isoform of CYP3A in adult humans (Watkins,
1992).
Differential expression of some CYP's in different organs may also have clinical consequences,
especially where the degradation of a drug results in a toxic metabolite. The degradation of
paracetamol by CYP2El results in a highly active intermediate product, N-acetyl-
benzoquinoneimine, which in sufficient quantities can result in fulminant liver failure by
depleting hepatic glutathione. Anti-oxidants protect against this catastrophe; in contrast, chronic
ethanol consumption induces CYP2El and may increase the likelihood of toxicity (Van
Schalkwyk & Van Schalkwyk, 2003).
2.4.1. CYP in the liver
The liver is the most important site of drug metabolism (Watkins, 1992). CYP3A4 was found to
be the most abundant CYP in both human liver and small intestine, although, the liver exhibited
a 2- to 5-fold higher level of the enzyme than the intestine (Lin et al, 1999). Table 2.1. list the
major CYP substrates and inducers in the human liver.
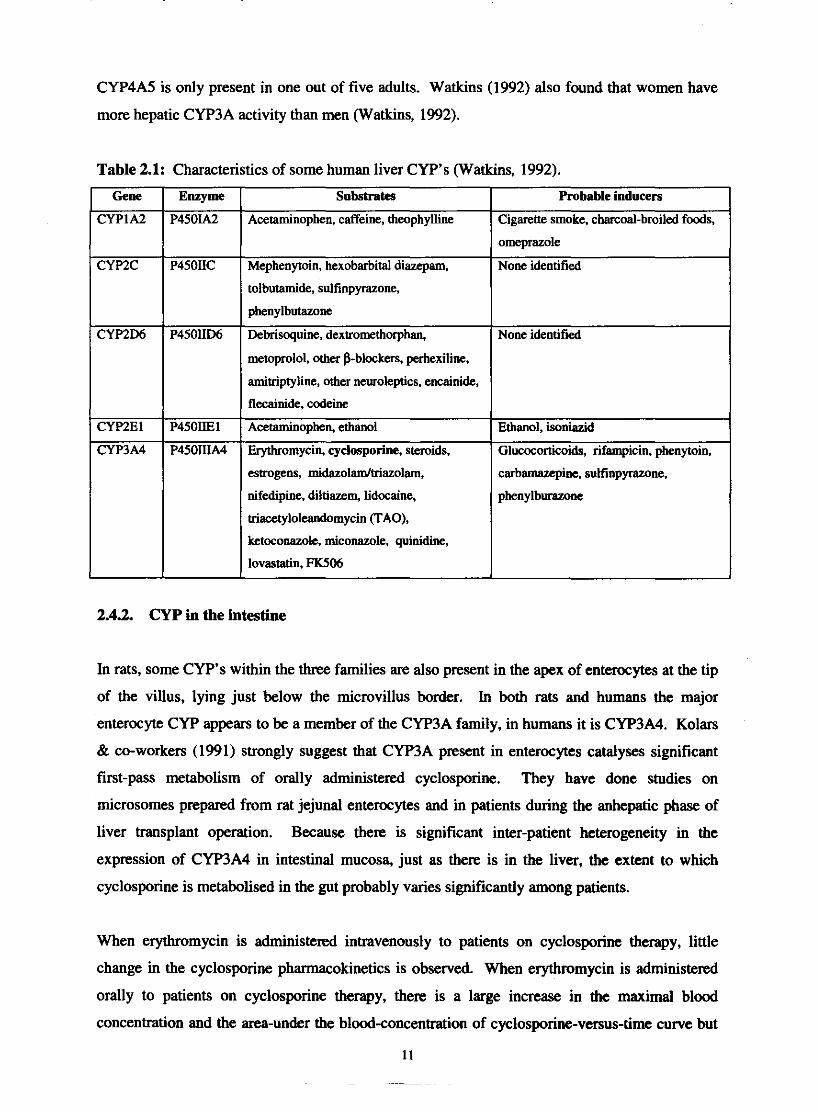
CYP4A5 is only present in one out of five adults. Watkins (1992) also found that women have
more hepatic CYP3A activity than men (Watkins, 1992).
Table 2.1: Characteristics of some human liver CYP's (Watkins, 1992).
Gene
CYPIA2
amitriptyline, othcr neusoleptics, encainide.,
estrogens, midazolamltriazolam,
nifedipine, diltiazem, lidocaine,
triacctylolcandomycin (TAO),
ketoconazok, miconazole, quinidine,
lovastatin, FK506
Enzyme
P4501.42
Mephenytoin, hexobarbital diazepam.
tolbutamide, sulfinpyrazone,
phenylbutazone
CYPZC
2.4.2. CYP in the intestine
Substrates
Acetaminophen, caffeine, theophylline
P450IIC
Probable inducers
Cigarette smoke, charcoal-broiled foods,
omeprazole
None identified
None identified
Ethanol, isoniazid
Glu~OC~rtiCOids, rifampicin, phenytoin,
In rats, some CYP's within the three families are also present in the apex of enterocytes at the tip
of the villus, lying just below the microvillus border. In both rats and humans the major
entemyte CYP appears to be a member of the CYP3A family, in humans it is CYP3A4. Kolars
& co-workers (1991) strongly suggest that CYP3A present in enterwytes catalyses significant
first-pass metabolism of orally administered cyclosporine. They have done studies on
microsomes prepared from rat jejunal enterocytes and in patients during the anhepatic phase of
liver transplant operation. Because there is s i ~ ~ c a n t inter-patient heterogeneity in the
expression of CYP3A4 in intestinal mucosa, just as there is in the liver, the extent to which
cyclosporine is metabolised in the gut probably varies significantly among patients.
When erythromycin is administered intravenously to patients on cyclosporine therapy, little
change in the cyclosporine pharmacokinetics is observed. When erythromycin is administered
orally to patients on cyclosporine therapy, there is a large increase in the maximal blood
concentration and the area-under the blood-concentration of cyclosporine-versus-ti= curve but
11

little effect on the rate of systemic clearance of cyclosporine. Erythromycin increases the oral
bioavailability of cyclosporine by inhibiting CYP3A within the enterocyte. Induction of
enterocyte CYP3A4 may also explain many drug interactions with cyclosporine (Watkins, 1992).
2.5. Inter-individual variability of CYP and drug metabolism
There is a wide interindividual variability and it is likely, in part, to be caused by ethnic or
cultural differences, perhaps related to an interaction between race and diet. Other factors known
to play a role in activity are age and the presence of small bowel or liver disease (Dresser et al,
2000). Both environmental and genetic factors can control the rate of drug disposition in the
individual patient (Van Schalkwyk & Van Schalkwyk, 2003). Genetic variability is known for
drug absorption, drug metabolism and for drug interactions with receptors. This forms the basis
for slow and rapid drug absorption, poor, efficient or ultrarapid drug metabolism and poor or
efficient receptor interactions. Environmental influence includes induction and inhibition of
drug transport and metabolism (Ingelman-Sundberg, 2001). Genetic variation in a population is
termed polymorphism when both gene variants exist with a frequency of at least one percent.
Such differences in activity may have profound clinical consequences, especially when multiple
drugs are given to a patient (Van Schalkwyk & Van Schalkwyk, 2003). Mutations of these
genes can cause the formation of an enzyme that is (i) defect or partially defect, (ii) has an
altered substrate specificity or (iii) is expressed at a lower or higher level (Ingelman-Sundberg,
1998).
The clinical importance of the different polymorphic CYP enzymes, with respect to drug
metabolism, could be surnmarised as follows:
Poor metabolisers:
diminished first pass metabolism, increased bioavailability, exaggerated response;
diminished drug elimination, side effects or toxic effects;
the active metabolite is not f o d , loss of therapeutic efficacy.
Ultraraoid metabolisers:
lack of therapeutic effect at standard doses;
too much of the active metabolite;
explanation for suspected bad compliance.
(Ingelman-Sundberg, 1998).

In table 2.2.. an overview of the polymorphic phase I enzymes of functional importance for the
metabolism of xenobiotics is given (Ingelman-Sundberg, 2001).
Table 2 2 Functional importance of polymorphism in phase I CYP enzymes (Ingelrnan-
Sundberg, 2001).
Interindividual distribution of many of the CYP forms varies strikingly and their extensive
polymorphism is likely, to a great extent, the result of dietary adaptation of different populations
in the world. No important endogenous substrates have been described for any of the
polymorphic CYP's and their primary function is in the metabolism of dietary components
(Ingelman-Sundberg, 2001).
The high expression of CYP2D6 in many persons of Ethiopian and Audi Arabian origin is very
interesting. 2D6 is not inducible, so these people have developed a different strategy to cope
with the (presumed) high load of toxic alkaloids in their diet - multiple copies of the gene.
These CYP's therefore metabolise a variety of drugs, making them ineffective - many
antidepressants and neuroleptics are an important example. Conversely, prodrugs will be
extensively activated - codeine will be turned in vast amount into morphine. In contrast, many
individuals lack functional 2D6. These subjects will be predisposed to drug toxicity caused by
antidepressants or neuroleptics, but will find codeine (and indeed tramadol) to be inefficacious
due to lack of activation. Other drugs that have caused problems in those lacking 2D6 include
dexfenflurarnine, propafenone, mexiletine, and perhexiline. Perhexiline was in fact withdrawn
from the market due to neuropathy caused in 2D6 inactive patients. Another potentially
disastrous polymorphism is deficient activity of CYP2C9. This is because patients possessing
this enzyme variant are ineffective in clearing (S)-warfarin - so much so that they may be fully
anticoagulated on just 0.5 mg of warfarin a day. The same CYP is important in removal of
phenytoin and tolbutamide, both potentially very toxic drugs in excess. The flipside is that the
prodrug losartan will be poorly activated and inefficacious with 2C9 deficiency. Azole
antifungals, sulphinpyrazone and even amiodarone may cause a similar effect by inhibiting the
enzyme. Cure rates for peptic ulcer treated with omeprazole are substantially greater in
individuals with defective CYP2C19, owing to the sustained, high plasma levels achieved (Van
Schalkwyk & Van Schalkwyk, 2003).
Each patient have a unique liver "P450 fingerprint", which may change over the time. CYP3A
activity varies at least 10-fold among patients. Liver activity of CYP3A largely predicts blood
level of cyclosporine as shown by Watkins & co-worker5 (1992). They found that patients with
higher CYP3A activity have lower blood levels of cyclosporine at any given daily dose of the
drug (Watkins, 1992).
2.6. CYP in drug interactions
CYP dependent monooxygenases are of biological importance, since the metabolism of several
drugs, intensity and duration of their pharmacological action can be determined. Reactive
metabolites can form which are often mutagens, carcinogens or cytotoxic agents (Tsamboas er
al, 1978).
The intestinal and/or hepatic CYP3A4 enzymes can be induced or inhibited which can result in
the elevating or lowering of blood cyclosporine concentrations (Jones, 1997). Induction of the
CYP enzyme system leads to increased biotransformation of cyclosporine, and therefore
decreased effect of the drug (Wideman, 1983). Inhibition of CYP3A4 increase the plasma
concentration of cyclosporine and this interaction can be of great clinical value. Cost savings
and enhanced efficacy are beneficial clinical consequences of CYP3A4 interactions (Dresser, et
al, 2000). In Chapter 4, section 4.3.5, drug interactions with cyclosporine manifesting in
alterations of blood concentrations are described completely.
2.6.1. Intestinal enzyme induction
Induction is defined as the increase in the amount and activity of drug-metabolising enzymes,
mainly CYP of the families 1 to 4 (Van Schalkwyk & Van Schalkwyk, 2003). Some mammalian

drug-metabolising enzymes like CYP3A4 are inducible. Induction may lead to an increased
fust-pass effect and, in turn, to a decreased oral bioavailability (Lin et al, 1999). When taking
with a CYP3A inducer, the substrate metabolism will increase (Watkins, 1992). The most
important inducers of CYP3A are antimicrobials such as rifampicin, and anticonvulsants like
carbamazepine and phenytoin, but potent steroids such as dexamethasone may also induce
CYP3A. The long list of agents metabolised by the enzyme include opioids, benzodiazepines
and local anaesthetics, as well as erythromycin, cyclosporine, haloperidol, calcium channel
blockers, cisapride and pimozide (Van Schalkwyk & Van Schalkwyk, 2003). Induction of
CYP3A by rifampicin may explain the failure of oral contraceptives, smokers require more
theophylline and are more tolerant to caffeine, presumably because CYPlA2 in their livers is
induced. Warfarin's metabolism is complex and is metabolised by multiple members of each of
the three families of CYP. Drugs that alter activities of individual CYP's cause an interaction
with warfarin only in those patients relying on those enzymes for warfarin metabolism (Watkins,
1992).
Since cyclosporine is a CYP3A substrate, the metabolism of the drug can increase with the
inducers mentioned above.
2.6.2. Enzyme inhibition
Inhibition of CYP means a decrease in drug metabolising enzymes. Inhibition of the CYP's can
cause clinical important, interactions between drugs on different mechanisms:
2.6.2.1. hsvstemic metabolism
If substrates with high presystemic elimination (low oral bioavailability) and which is dependent
upon CYP3A4 for elimination, is administered with an inhibitor of its metabolism, it can be
expected to produce substantial change in the substrate's pharmacokinetics under single dose
conditions. Higher drug peak plasma drug concentration (C,) will result from reduced
presystemic metabolism and a greater area under the drug concentration-time curve (AUC) will
be found possible from both lower presystemic and systemic elimination (Dresser et al, 2000).

Table 2.3: Drugs metabolised by cytochrome CYF'3A4 and the extent of presystemic
metabolism @resser et al, 2000).
nicardipine, nitrendipine, propafenone*, tacrolimus
INTERMEDIATE 30-70 I ~miodarone', amprenavir, carbamszepine, cmedilol',
Dm@ fiesystemic metabolism
nisoldipine, saquinavir, simvastatin, terfenadine
1 I cisapride, eydospnrine, diitiazem', ethinylestradiol, etoposide,
Oral bioavailability (5%)
HIGH
I I losartan', midazolam, nifedipine, nelfinavcir, ondensetron,
VERY HIGH
10-30 I ~stradiol', atmastatin, felodipine, indinavir, isradipine,
< 10 I Astemizole, buspirone, ergotarnine, lovastatin, nimodipine,
disopyramide, donepezil quidhe ' , ritonavir, teanazepam
'~etabolic pathways in addition to CYP3A4 may play a significant role.
pimozide, sildenaiil', hiazolam, verapamil'
2.6.2.2. Com~etitive inhibition.
LOW
As seen in figure 2.2.. page 9, drug C and D compete for binding to and metabolism by CYF'3.
The grade of the competitive inhibition relies on the drugs' respective relative affinities for
binding to CYP3, concentration in the endoplasmic reticulum, dependence on the CYF' for
elimination and the potential to produce toxicity. Some drugs may even bind to a certain CYF'
and act as competitive inhibitor but are not metabolised by that CYF' (Watkins, 1992). Potent
inhibitors of CYP3A4 that has been associated with clinically relevant interactions can be seen in
table 2.4., and include azole antifungals, macrolide antibiotics, nefazodone, H N protease
inhibitors and grapefruit juice.
> 70 I Alprazolam, amlodipine, dapsone, dewnetbasone,
Azole antifungals and f is t generation H N protease inhibitors appear to act via competitive
inhibition by rapid, reversible binding of the inhibitor or its metabolite to CYP3A4. Macrolide
antibacterials produce slowly reversible, non-competitive inhibition. The furanocoumarins in
grapefruit juice cause irreversible, mechanism-based (suicide) inhibition. 8-MOP is also an
Table 2.4: Inhibitors of CYP3A4 @resser et al, 2000).
Mechanism of netion
REVERSIBLE
MECHANISM-BASED
(SUICIDE)
Inhibitors
Amprenavir, clarithromycin, cydosporine, diltiazem, erythromycin, itraconazole.
indinavir, ketoconazole, mibefradil, nefazodone, nelfinavir, ritonavir
Bergamomin (grapefruit juice) dihydroxybergamottin (grapefruit juice)

inhibitor of several CYP's in the liver and grapefruit juice is also an example of an inhibitor that
appears to be clinically active against only enteric CYP3A4 (Dresser et al, 2000).
Recent studies of Piver and co-workers (2001) showed that resveratrol (RESV), present at
concentrations of about 10 pM in red wine, inhibits events associated with tumor initiation,
promotion and progression. They suspected that the mechanism involved could be the inhibition
of activities catalysed by CYP's, which activate procarcinogens. They investigated the
inhibitory effect of RESV on CYPlA, CYPZEl and CYP3A enzymatic activities and compared
it to that of non-volatile compounds present in red wine. Their study showed that red wine solids
(RWS) are particularly potent inhibitors of CYPlAlIlA2, CYP2E1 and CYP3A4 activities in
human liver microsomes. A probably mechanism-based inhibitory effect for CYP3A4 were
displayed (Piver et al, 2001)
The activity of CYP3A appears to be rate limiting in the metabolism of cyclosporine. Any drug
that binds to CYP3A has the potential to inhibit cyclosporine metabolism competitively,
resulting higher blood levels of cyclosporine and possibly toxicity. Pichard & co-workers (1990)
exposed drugs, reported to elevate cyclosporine blood levels, such as erythromycin, to cultured
human hepatocytes. The rate of cyclosporine metabolism by the bepatocytes decreased. They
found that drugs that inhibited cyclosporine metabolism in the hepatocyte usually also inhibited
cyclosporine metabolism in the microsomes in a competitive way, by binding to CYP3A.
Any drug shown to be metabolised by CYP3A should be metabolised at a reduced rate when a
patient is also taking a CYP3A inhibitor (Watkins, 1992). Non-sedating antihistamines have
resulted in fatal arrhythmias, as has occurred with cisapride administration in combination with
an inhibitor. Erythromycin in combination with theophylline may cause theophylline toxicity
(Van Schalkwyk & Van Schalkwyk, 2003).
Cross-resistance of some primary and many recurrent human tumours to multiple
chemotherapeutic drugs is a major problem in the chemotherapy of cancer. Multidrug-resistant
tumour cells have been shown to have a highly active efflux mechanism for chemotherapeutic
drugs, which prevents accumulation of these drugs in the cytoplasm of multidrug-resistant cells.
Multidrug-resistance has been shown to be due to the product of a gene (MDRI) that confers the
multidrug-resistant phenotype. A transmembrane glycoprotein has been identified and named
P170 or P-glycoprotein (Thiebaut et al, 1987). There are two types of pglycoproteins in
mammals: the drug-transporting p-glycoprotein and phospholipid-transporting p-glycoproteins
(Lin et al, 1999). P-glycoprotein has been shown to be present and function as a transporter in
the plasma membranes of many normal tissues (Terao et al, 1996). P-glycoprotein is localised on
the bile canalicular surface of hepatocytes, apical surface of proximal tubules in kidneys and
columnar epithelial cells of intestine and capillary endothelial cells of brain and testis. It can
therefore protect the body against toxic xenobiotics by excreting these compounds into bile,
urine, and the intestinal lumen, and by preventing their accumulation in brain and testis (Lin et
al, 1999). P-glycoprotein is located almost exclusively within the brush border on the apical
(luminal) surface of the enterocyte where it pumps xenobiotics from the cytoplasm to the exterior
of the cell (i.e., from the enterocyte back into the intestinal lumen.) (Lown et al, 1997).
Table 2.5. represents a summary of tissues expressing p-glycopmtein.
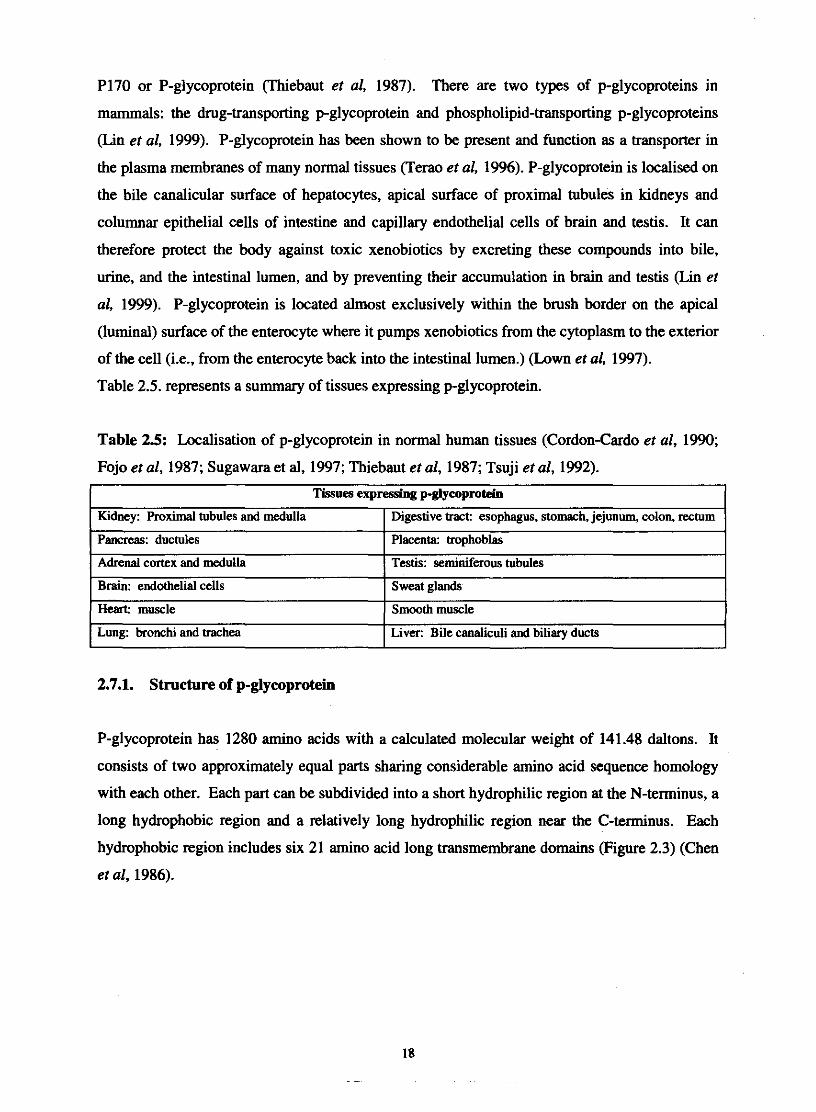
Table 25: Localisation of p-glycoprotein in normal human tissues (Cordon-Cardo et al, 1990;
Fojo et al, 1987; Sugawara et al, 1997; Thiebaut et al, 1987; Tsuji et al, 1992).
Tissues expressing p-glycoprotein 1
2.7.1. Structure of p-glycoprotein
- -
P-glycoprotein has 1280 amino acids with a calculated molecular weight of 141.48 daltons. It
consists of two approximately equal parts sharing considerable amino acid sequence homology
with each other. Each part can be subdivided into a short hydrophilic region at the N-terminus, a
long hydrophobic region and a relatively long hydrophilic region near the C-terminus. Each
hydrophobic region includes six 21 amino acid long transmembrane domains (Figure 2.3) (Chen
et al, 1986).
Kidney: Roximal tubules and medulla
Pancreas: ductules
Adrenal cortex and medulla
Brain: endothelial cells
Heart muscle
Lung: bronchi and trachea
Digestive tract: esophagus, stomach, jejunum, colon, rectum
Placenta: trophoblas
Testis: seminiferous tubules
Sweat glands
Smooth muscle
Liver: Bile canaliculi and biliary ducts
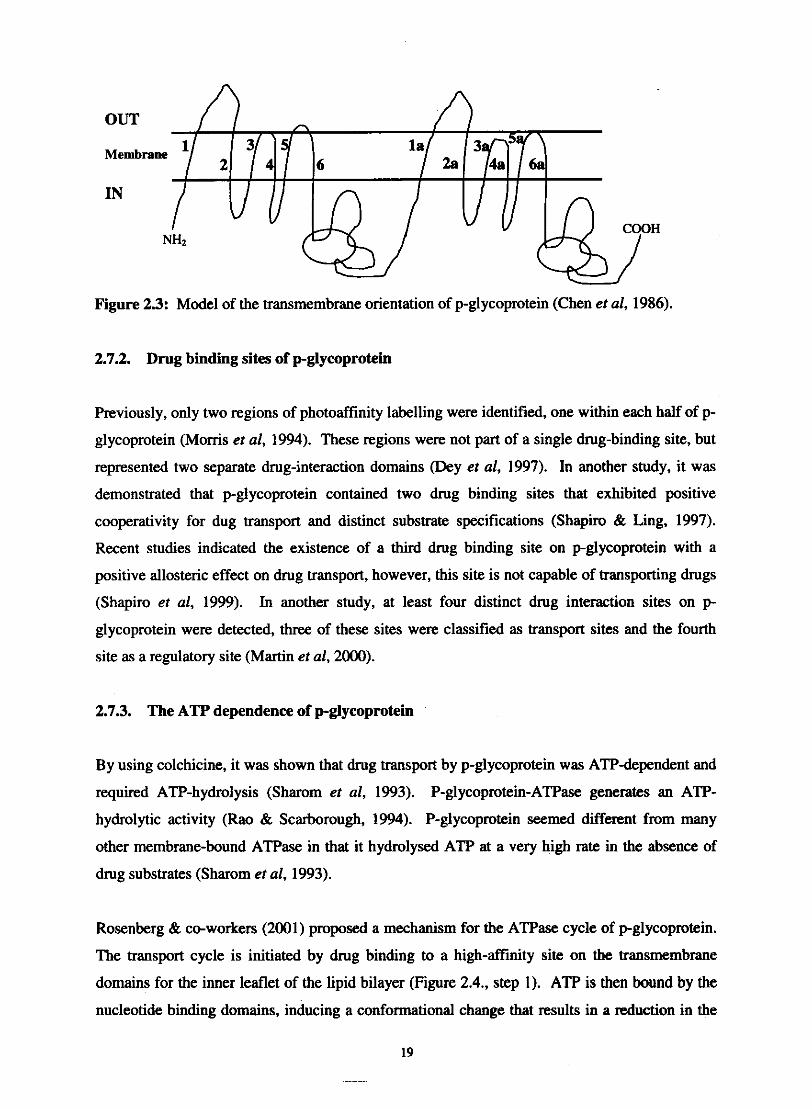
OUT n
Figure 23: Model of the transmembrane orientation of p-glycoprotein (Chen et al, 1986).
2.7.2. Drug binding sites of p-glycoprotein
Previously, only two regions of photoaffhity labelling were identified, one within each half of p-
glycoprotein (Moms et al, 1994). These regions were not part of a single drug-binding site, but
represented two separate drug-interaction domains @ey et al, 1997). In another study, it was
demonstrated that p-glycoprotein contained two drug binding sites that exhibited positive
cooperativity for dug transport and distinct substrate specifications (Shapiro & Ling, 1997).
Recent studies indicated the existence of a third drug binding site on pglycoprotein with a
positive allosteric effect on drug transport, however, this site is not capable of transporting drugs
(Shapiro et al, 1999). In another study, at least four distinct drug interaction sites on p
glycoprotein were detected, three of these sites were classified as transport sites and the fourth
site as a regulatory site (Martin et al, 2000).
2.7.3. The ATP dependence of p-glycoprotein
By using colchicine, it was shown that drug transport by p-glycoprotein was ATP-dependent and
required ATP-hydrolysis (Sharom et al, 1993). P-glycoprotein-ATPase generates an ATP-
hydrolytic activity (Rao & Scarborough, 1994). P-glycoprotein seemed different from many
other membrane-bound ATPase in that it hydrolysed ATP at a very high rate in the absence of
drug substrates (Sharom et al, 1993).
Rosenberg & co-workers (2001) proposed a mechanism for the ATPase cycle of pglycoprotein.
The transport cycle is initiated by drug binding to a high-affinity site on the transmembrane
domains for the inner leaflet of the lipid bilayer (Figure 2.4., step 1). ATP is then bound by the
nucleotide binding domains, inducing a conformational change that results in a reduction in the
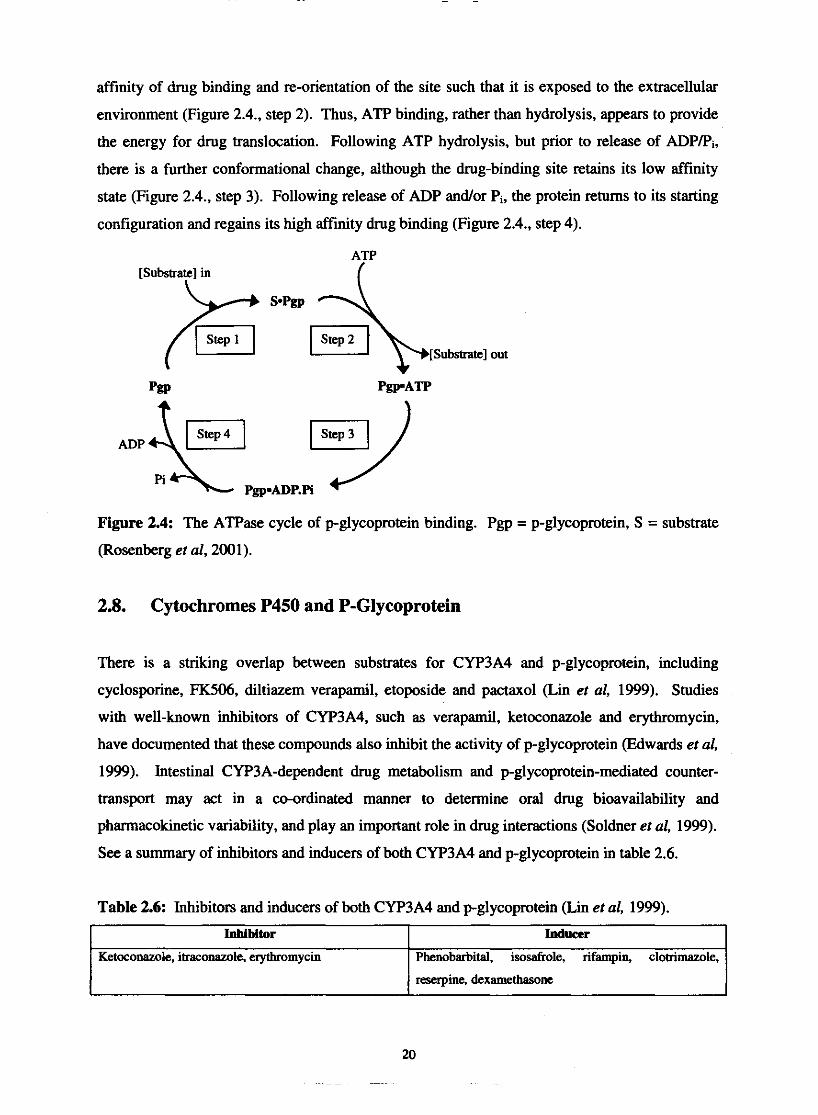
affinity of drug binding and re-orientation of the site such that it is exposed to the extracellular
environment (Figure 2.4., step 2). Thus, ATP binding, rather than hydrolysis, appears to provide
the energy for drug translocation. Following ATP hydrolysis, but prior to release of ADPPi,
there is a further conformational change, although the drug-binding site retains its low affinity
state (Figure 2.4.. step 3). Following release of ADP andlor Pi, the protein returns to its starting
configuration and regains its high affinity drug binding (Figure 2.4.. step 4).
ATP [Substrate] in
I
Figure 2.4: The ATPase cycle of p-glycoprotein binding. Pgp = p-glycoprotein, S = substrate
(Rosenberg er al, 2001).
2.8. Cytochromes P450 and P-Glycoprotein
There is a striking overlap between substrates for CYP3A4 and p-glycoprotein, including
cyclosporine, FK.506, diltiazem verapamil, etoposide and pactaxol (Lin et al, 1999). Studies
with well-known inhibitors of CYP3A4, such as verapamil, ketoconazole and erythromycin,
have documented that these compounds also inhibit the activity of p-glycoprotein (Edwards er al,
1999). Intestinal CYP3A-dependent drug metabolism and p-glycoprotein-mediated counter-
transport may act in a co-ordinated manner to determine oral drug bioavailability and
phannacokinetic variability, and play an important role in drug interactions (Soldner et al, 1999).
See a summary of inhibitors and inducers of both CYP3A4 and p-glycoprotein in table 2.6.
Table 2.6: Inhibitors and inducers of both CYP3A4 and p-glycoprotein (Lin er al, 1999).
Jnhibitor
Ketoconazole, itracwazole, erythromycin
Inducer
Phenobarbital, isosafrole, rifampin, clotimazole,
reserpine, dexarnethasone
There is however some evidence from the studies of Lown & co-workers (1997) and Schuetz &
co-workers (1995), that suggests that the expression of CYP3A4 and pglycoprotein is
independently and non-co-ordinately regulated. The combination of CYP and p-glycoprotein
reflects the perfection of Mother Nature to protect the body against toxic xenobiotics (Lin et al,
1999).
2.9. References
CHEN, C-J., CHIN, J.E., UEDA, K., CLARK, D.P., PASTAN, I., GOTTESMAN, M.M. &
RONINSON, LB. (1986). Internal duplication an homology with bacterial transport proteins in
the mdrl (P-glycoprotein) gene from multidrug-resistant human cells. Cell, 47:381-389.
CORDON-CARDO, C., O'BRIEN, J.P., BOCCIA, J., CASAL, D., BERTINO, J.R. &
MELAMED, M.R. (1990). Expression of the multidrug resistance gene product (P-
glycoprotein) in human n o d and tumor tissues. Journal of histochemistry and
cytochemishy, 38: 1277-1287.
DEY, S., RAMACHANDRA, M., PASTAN, I., GOlTESMAN, M.M. & AMBUDKAR, S.V.
(1997). Evidence for two nonidentical drug-interaction sites in the human P-glycoprotein.
Proceedings of the National Academy of Sciences of the United States of America, 9410594-
10599.
DRESSER, G.K., SPENCE, J.D. AND BAILEY, D.G. (2000). Pharrnacokinetic-
phannacodynamic consequences and clinical relevance of cytochrome P450 3A4 inhibition.
Clinicalpharmacokinetics, 38(1):41-50.
EDWARDS, D.J., FWZSIMMONS, M.E., SCHUETZ, E.G., YASUDA, K., DUCHARME,
M.P., WARBASSE, L.H., WOSTER, P.M., SCHUETZ, J.D. & WATKINS, P. (1999). 6',7'-
Diydroxybergamottin in grapefruit juice and seville orange juice: Effects on cyclosporine
disposition, enterocyte CYP3A4, and P-glycoprotein. Clinical pharmacology and therapeutics,
65:237-244.
FLOCKHARDT, D.A. (1999). Cpochrome P450. [Web:] http://www.
uchsc.edu/sm/psych/ppfr/cyp_metabolism.h. [Date of access: 2 May 20031.
FOJO, A.T., UEDA, K., SLAMON, D.J., POPLACK, D.G., GOTTESMAN, M.M. & PASTAN,
I. (1987). Expression of a multidrug-resistance gene in human tumors and tissues. Proceedings
of the National Academy of Sciences of the United States of America, 84265-269.

FOUIN-FORTUNET, H., TINEL, M., DESCATOIRE, V., LETTERON, P., LARREY, D.,
GENEVE, J. AND PESSAYRE, D. (1986). Inactivation of cytochrome P450 by the drug
methoxsalen. The journal of pharmacology and experimental therapeutics, 236(1):237-247.
HAYES, E.M. (2003). The cytochrome P450 enzyme system. [Web:]
http://www.edhayes.comlstartp45O.html. [Date of access: 27 Aug. 20031.
HOLLENBERG, P.F. & BRODY, T.M. (1998). Absorption, distribution, metabolism and
elimination. (It! BRODY, T.M., LARNER, J. & MINNIMAN, K.P., &. Human
pharmacology molecular to clinical. USA.: Mosby. p. 1200.)
ILETT, K. (1997). Cytochrome P450. [Web:]
http://www.pharm.uwa.edu.au/aussie/resear~h/to~i~0/ts1ide3.html. [Date of access: 2 May
20031.
INGELMAN-SUNDBERG, M. (1998). Functional consequences of polymorphism of
xenobiotic metabolising enzymes. Toxicology le#ers, 102-103: 155-160.
INGELMAN-SUNDBERG, M. (2001). Genetic variability in susceptibility and response to
toxicants. Toxicology letters, 120:259-268.
JONES, T.E. (1997). The use of other drugs to allow a lower dosage of cyclosporin to be used.
Clinicalphmmokineties, 32(5):357-367.
KOLARS, J.C., AWNI, W.M., MEIUON, R.M. & WATKINS, P.B. (1991). First-pass
metabolism of cyclosporin by the gut. The lancet, 338:1488-1490.
LOWN, K.S., MAYO, R.R., LEICHTMAN, A.B., HSIAO, H-L., TURGEON, K.,
SCHMIEDLIN-REN, P., BROWN, M.B., GUO, W., ROSSI, S.J., BENET, L.Z. & WATKINS,
P.B. (1997). Role of intestinal P-glycoprotein (mdrl) in interpatient variation in the oral
bioavailability of cyclosporine. Clinicalphannacology and therapeutics, 62248-260.
LIN, J.H., CHIBA, M. AND BAILLIE, T.A. (1999). Is the role of the small intestine in first-
pass metabolism overemphasized? Phurmmological reviews, Sl(2): 135-157.
MARTIN, C., BERRIDGE, G., HIGGINS, C.F., MISTRY, P., CHARLTON, P. &
CALLAGHAN, R. (2000). Communication between multiple drug binding sites on P-
glycoprotein. Molecularphumacology, 58:624-632.
MORRIS, D.I., GREENBERGER, L.M., BRUGGEMANN, E.P., CARDARELLI, C.,
GOTESMAN, M.M., PASTAN, I. & SEAMON, K.B. (1994). Localisation of the forskolin
labelling sites to both halves of P-glycoprotein: similarity of the sites labeled by forskolin and
prazosin. Molecularphannacology, 48:329-337.
PICHARD, L., FABRE, I. & FABRE, G. (1990). Cyclosporine A drug interactions: Screening
for inducers and inhibitors of cytochrome P450 (cyclosporine A oxidase) in primary cultures of
human hepatocytes and in liver microsomes. Drug metabolism and disposition, 18595.
PIVER, B., BERTHOU, F., DREANO, Y. & LUCAS, D. (2001). Inhibition of CYP3A.
CYPlA and CYP2E1 activities by resveratrol and other non volatile red wine components.
Toxicology letters, 12583-91.
RAO, U.S. & SCARBOROUGH, G.A. (1994). Direct demonstration of high affinity
interactions of immunosuppressant drugs with the drug binding site of the human P-glycoprotein.
Molecularphannacology, 45773-776.
ROSENBERG, M.F., VELARDE, G., FORD, F.C., MARTIN C., BERRIDGE, G., KERR, LD.,
CALLAGHAN, R., SCHMIDLIN, A., WOODING, C., LINTON, K.J. & HIGGINS, C.F.
(2001). Repacking of the transmembrane domains of P-glycoprotein during the transport
ATPase cycle. EMBO j o u 4 205615-5625.
SCHUETZ, E.G., FURUYA, K.N. & SCHUETZ, J.D. (1995). Interindividual variation in
expression of p-glycoprotein in normal human liver and secondary hepatic neoplasms. Journal
of pharmacology and experimental therapeutics, 275: 101 1-1018.
SHAPIRO, A.B. & LING, V. (1997). Positively cooperative sites for drug transport by P-
glycoprotein with distinct drug specificities. European j o u d of bioehemishy, 250:130-137.

SHAPIRO, A.B., FOX, K., LAM, P. & LING, V. (1999). Stimulation of P-glycoprotein-
mediated drug transport by prazosin and progesterone: evidence for a third drug-binding site.
European journal of biochemistry, 259:841-850.
SHAROM, F. J., W, X. & DOIGE, C.A. (1993). Functional reconstitution of dug transport and
ATPase activity in proteoliposomes containing partially purified P-glycoprotein. Journal of
biological chemistry, 268:24197-24202.
SOLDNER, A., CHRISTIAN, U., SUSANTO, M., WACHER, V.J., SILVERMAN, J.A. &
BENET, L.Z. (1999). Grapefruit juice activates P-glycoprotein-mediated drug transport.
Pharmaceutical research, 16(4):478-485.
SUGAWARA, I., AKIYAMA, S., SCHEPER, R.J. & ITOYAMA, S. (1997). Lung resistance
protein (LRP) expression in human normal tissues in comparison with that of MDRl and MRP.
Cancer letters, 112:23-3 1.
TERAO, T., HISANAGA, E., SAI, Y., TAMAI, I. & TSUJL A. (1996). Active secretion of
drugs from the small intestinal epithelium in rats by P-glycoprotein functioning as an absorption
barrier. Journal of phurmaceutical pharmacology, 48: 1083-1089.
THIEBAUT, F., TSURUO, T., HAMADA, H., GOl'TESMAN, M.M., PASTAN, I. &
WILLINGHAM M.C. (1987). Cellular localisation of the multidrug-resistance gene product P-
glycoprotein in normal human tissues. Proceedings of the National Academy of Sciences of the
Unites States of America, 84:7735-7738.
TSAMBOAS, D., VIZETHUM, W. AND GOERZ, G. (1978). Effect of oral 8-
methoxypsoralen on rat liver microsomal cytochrome P450. Archives of dernurtologieal
research, 263:339-342.
TSUJI, A., TERASAKI, T., TAKABATAKE, Y., TENDA, Y., TAMAI, I., YAMASHIMA, T.,
MORITANI, S., TSURUO, T. & YAMASHITA, J. (1992). P-glycoprotein as the drug efflux
pump in primary cultured bovine brain capillary endothelial cells. fife sciences, 51: 1427-1437.
VAN SCHALKWYK, L. & VAN SCHALKWYK, J. (2003). Cytochrome P450 (CYP).
[Web:] http://www.anaesthetist. com/physiovbasicslmetaboUcyp/cyp.html. [Date of access: 27
Aug. 20031.
WATKINS, P.B. (1992). Drug metabolism by cytochromes P450 in the liver and small bowel.
Gnstrointestinalphamacology, 21 (3):s 1 1-526.
WIDEMAN, C.A. (1983). Pharmacokinetic monitoring of cyclosporine. Transplantation
proceedings, 15(4):3 168-3175.

3. Methoxsalen
3.1. Introduction
Methoxsalen is a naturally occumng furocoumarin (Mays et al, 1987) present in several plants,
including some edible ones such as figs, celery, parsley or parsnip (Tinel et al, 1987). Several
psoralen derivatives including psoralen, 8-methoxsalen (methoxsalen = 8-MOP), 5-methoxsalen
(bergapten = 5-MOP) and trioxsalen (trimethylpsoralen = TMP), have photosensitising
properties (Letteron et al, 1986). Psoralens are inactive after oral or topical administration unless
combine with long-wave ultraviolet light (UVA) (de Wolff & Thomas, 1986). The dramatic
efficacy of the combination, oral psoralens (8-MOP) and UVA defined as "photochemotherapy",
was first demonstrated by Parrish and co-workers (1974) and confirmed by a large number of
subsequent clinical trials (Tsamboas et al, 1978). Psoralen UVA-therapy (PUVA) is used in the
treatment of psoriasis, vitiligo and cutaneous T-cell lymphoma (Donath et al, 1999). Vitiligo is a
amelanotic skin disease (Bickers et al, 1982) and psoriases is a chronic recurrent inflammatory
skin disease of unknown etiology. The underlying problem is one of uncontrolled epidermal cell
growth coupled with a rapid cellular turnover, which leads to the formation of thick scales or
plaques of epidermal tissue (Stolk & Siddiqui, 1988).
3.2. Structures and clinical formulation
""L~
Coumarin Methoxsalen (8-methoxypsoralen; 8-MOP) H.C'
Bergapten (5-methoxypden; 5-MOP)
Psoralen Trioxsalen (4,5',8-~imethylps0~alen; TMP)
Figure 3.1: Chemical structures of the psoralens (Koeings et al, 1997, Letteron et al, 1986, de
Wolff & Thomas, 1986).

8-MOP is poorly soluble in water, the dissolution of 8-MOP in water is therefore slow and this
may cause irregular absorption (Stolk & Siddiqui, 1988). Stolk & co-workers (1987) were the
first to demonstrate that the area under the serum concentration-time curve (AUCW,) could be
significantly increased by administering 8-MOP as an aqueous solution instead of powder in a
gelatin capsule (de Wolff & Thomas, 1986). They also found that the maximum concentrations
were higher, earlier and more predictable. Favourable results were also observed with soft
gelatin capsules containing 8-MOP dissolved in polyethylene glycol (PEG 400). With liquid
oral preparations nausea is experienced more frequently (Stolk & Siddiqui, 1988). After topical
application of a 8-MOP emulsion Neild & Scott (1982) found that the plasma concentrations
obtained are of the same order as those found following oral administration. Disadvantages of
topical administration may be local bums due to over dosage and cosmetically unacceptable
patchy pigmentation (de Wolff & Thomas, 1986). Rapid and predictable absorption and
subsequent quick elimination of 8-MOP, together with the absence of nausea, rectal
administration might have certain advantages over the oral route (Stolk & Siddiqui, 1988).
although the latter mode of administration is likely to be preferred by most patients (de Wolff &
Thomas, 1986).
3.3. Pharmacokinetics
In table 3.1. is a summary of the pharmacokinetic parameters of 8-MOP.
Table 3.1: Phannacokinetic parameters of 8-MOP 0.5 to 0.6 mgkg orallyd in 18 psoriatic
patients (de Wolff & Thomas, 1986).
I Assuming complete absorption. I
33.1. Absorption
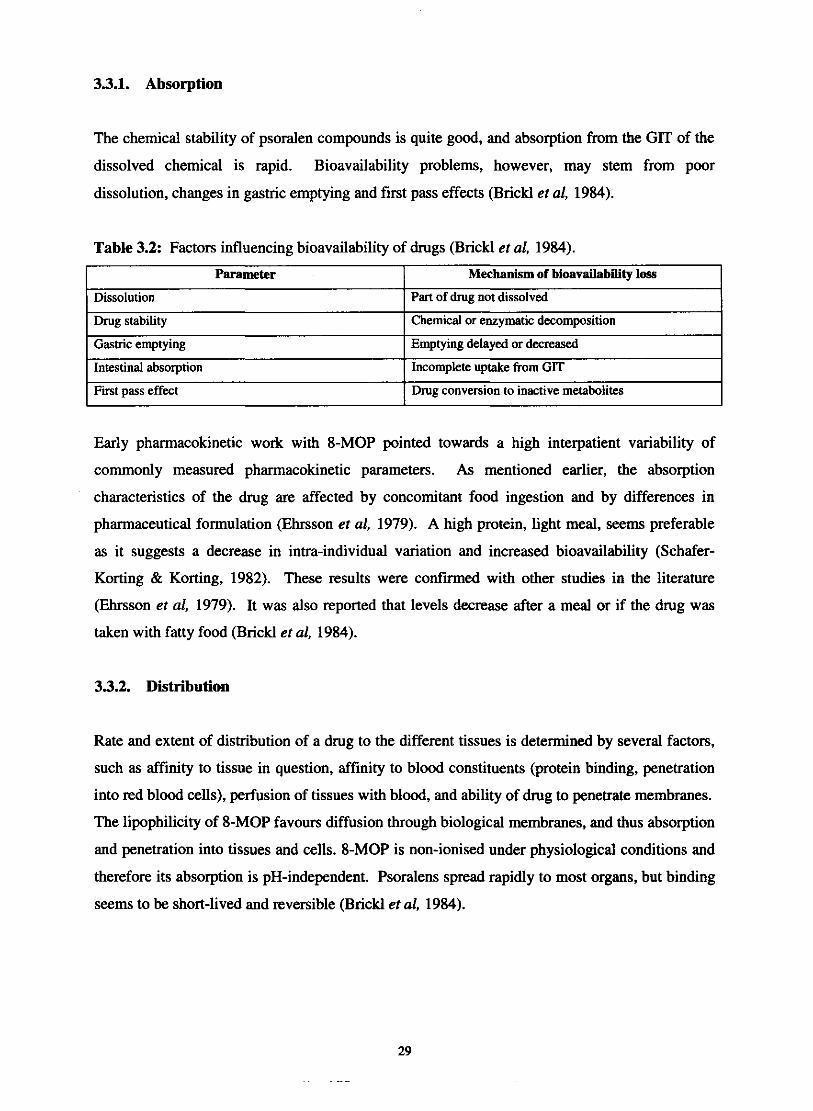
The chemical stability of psoralen compounds is quite good, and absorption from the GlT of the
dissolved chemical is rapid. Bioavailability problems, however, may stem from poor
dissolution, changes in gastric emptying and first pass effects (Brickl et al, 1984).
Table 3.2: Factors influencing bioavailability of drugs (Brickl et al, 1984).
I First pass effect I Drug conversion to inactive metabolites
Parameter
Dissolution
Drug stability
Gastric emptying
Intestinal absorption
Early pharmacokinetic work with 8-MOP pointed towards a high interpatient variability of
commonly measured pharmacokinetic parameters. As mentioned earlier, the absorption
characteristics of the drug are affected by concomitant food ingestion and by differences in
pharmaceutical formulation (Ehrsson et al, 1979). A high protein, light meal, seems preferable
as it suggests a decrease in intra-individual variation and increased bioavailability (Schafer-
Korting & Korting, 1982). These results were continned with other studies in the literature
(Ehrsson et al, 1979). It was also reported that levels decrease after a meal or if the drug was
taken with fatty food (Brickl et al, 1984).
Mechanism of bioavailability loss
Part of drug not dissolved
Chemical or enzymatic decomposition
Emptying delayed or decreased
Incomplete uptake from GIT
33.2. Distribution
Rate and extent of distribution of a drug to the different tissues is determined by several factors,
such as affinity to tissue in question, affinity to blood constituents (protein binding, penetration
into red blood cells), perfusion of tissues with blood, and ability of drug to penetrate membranes.
The lipophilicity of 8-MOP favours diffusion through biological membranes, and thus absorption
and penetration into tissues and cells. 8-MOP is non-ionised under physiological conditions and
therefore its absorption is pH-independent. Psoralens spread rapidly to most organs, but binding
seems to be short-lived and reversible (Brickl et al, 1984).

3.3.2.1. Protein binding
8-MOP was demonstrated to bind strongly to human serum albumin. The protein may work as a
carrier of the drug, it may alter the elimination and metabolism of the drug, and its affects
distribution of the drug, as usually only free drug passes biological membranes (Brickl et al,
1984). About 75-80% of the drug will be reversibly bound to serum proteins and only 20-25%
of the total concentration represents the effective (or bioavailable) drug concentration, which is
free to diffuse and equilibrate with the various skin layers (Artuc et al, 1979). At therapeutic
concentrations only tolbutamide may displace 8-MOP from its binding site to a clinically
relevant extent, the concomitant use of tolbutamide and 8-MOP may therefore lead to enhanced
photosensitivity @e Wolff & Thomas, 1986).
333. Metabolism
8-MOP is activated by CYP into chemically reactive metabolites, which bind covalently to
microsomal proteins and inactivate CYP (Letteron er al, 1986). 8-MOP is therefore a potent
suicide inhibitor of hepatic and renal CYP. Inactivation of CYP is associated with a small loss in
CO-binding capacity (Labbe et al, 1989) in the presence of an NADPH regenerating system
(Tine1 et al, 1987) and a greater decrease in monooxygenase activities in rats (Labbe et al, 1989).
Aromatic oxidations are usually mediated by the CYP via an epoxide pathway (Brickl et al,
1984). 8-MOP is extensively oxidised on its furan ring (Tinel et al, 1987) to 6-(7-hydroxy-8-
methoxycoumaryl)-acetic acid (Mays et al, 1987) with the presumed formation of a reactive
epoxide (Tine1 et al, 1987). Epoxides, which bind covalently to macromolecules and cause
tissue damage, have been proposed as reactive intermediates of other furans, including
furosemide and Cipomeanol. Furthermore, 8-MOP is also metabolised in the rat to a quinone-
hydroquinone redox pair. Redox recycling of similar compounds with concomitant production
of reactive oxygen species has been suggested as one of the mechanisms for the cytotoxic effects
of benzo(a)pyrene. An analogous quinone imine, which binds to sulphur-containing
nucleophiles, apparently causes the hepatoxicity of acetaminophen (Mays et al, 1987). Even at
low substrate concentrations, aromatic oxidations are often saturated. This is probably the
reason for the on-dose linearity of the 8-MOP plasma levels (Brickl et al, 1984). Many
monooxygenase activities are decreased markedly, as well as the metabolic activation of
acetaminophen, carbon tetrachloride and chloroform, suggesting that the inactivation process
affects, to some extent, several CYP isoenzymes (Labbe et al, 1989). 8-MOP has been shown to
undergo very little 0-demethylation in rats, dogs and humans (Letteron et al, 1986).
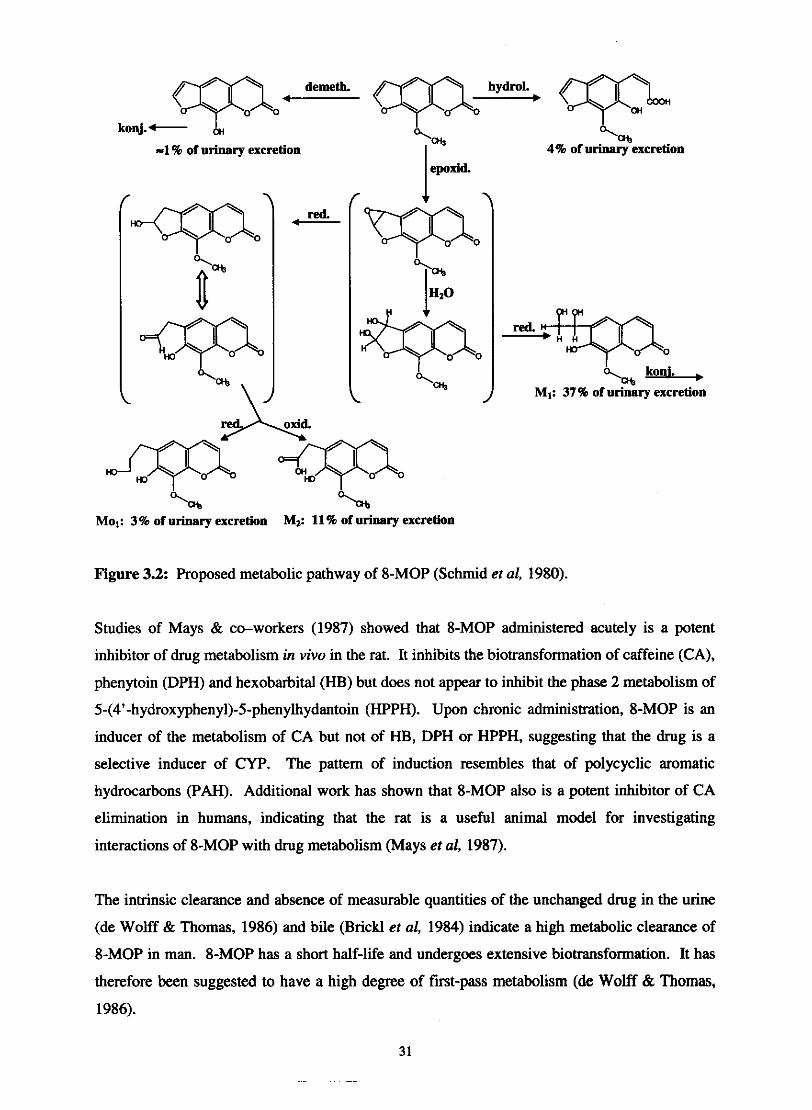
d m . q- ___, M
-1 % of urinary excretion
red. C-
%, 4% of urinary excretion
"-, koni. , MI: 37% of urinary excretion
I
="a% Mol: 3% of urinary excretion Mz: 11% of urinary excretion
Figure 3.2: Proposed metabolic pathway of 8-MOP (Schmid et al, 1980).
Studies of Mays & co-workers (1987) showed that 8-MOP administered acutely is a potent
inhibitor of drug metabolism in vivo in the rat. It inhibits the biotransformation of caffeine (CA),
phenytoin (DPH) and hexobarbital (HB) but does not appear to inhibit the phase 2 metabolism of
5-(4'-hydroxypheny1)-5-phenylhydantoin (HPPH). Upon chronic administration, 8-MOP is an
inducer of the metabolism of CA but not of HB, DPH or HPPH, suggesting that the drug is a
selective inducer of CYP. The pattern of induction resembles that of polycyclic aromatic
hydrocarbons (PAH). Additional work has shown that 8-MOP also is a potent inhibitor of CA
elimination in humans, indicating that the rat is a useful animal model for investigating
interactions of 8-MOP with drug metabolism (Mays et al, 1987).
The intrinsic clearance and absence of measurable quantities of the unchanged drug in the urine
(de Wolff & Thomas, 1986) and bile (BricM et al, 1984) indicate a high metabolic clearance of
8-MOP in man. 8-MOP has a short half-life and undergoes extensive biotransformation. It has
therefore been suggested to have a high degree of first-pass metabolism (de Wolff & Thomas,
1986).
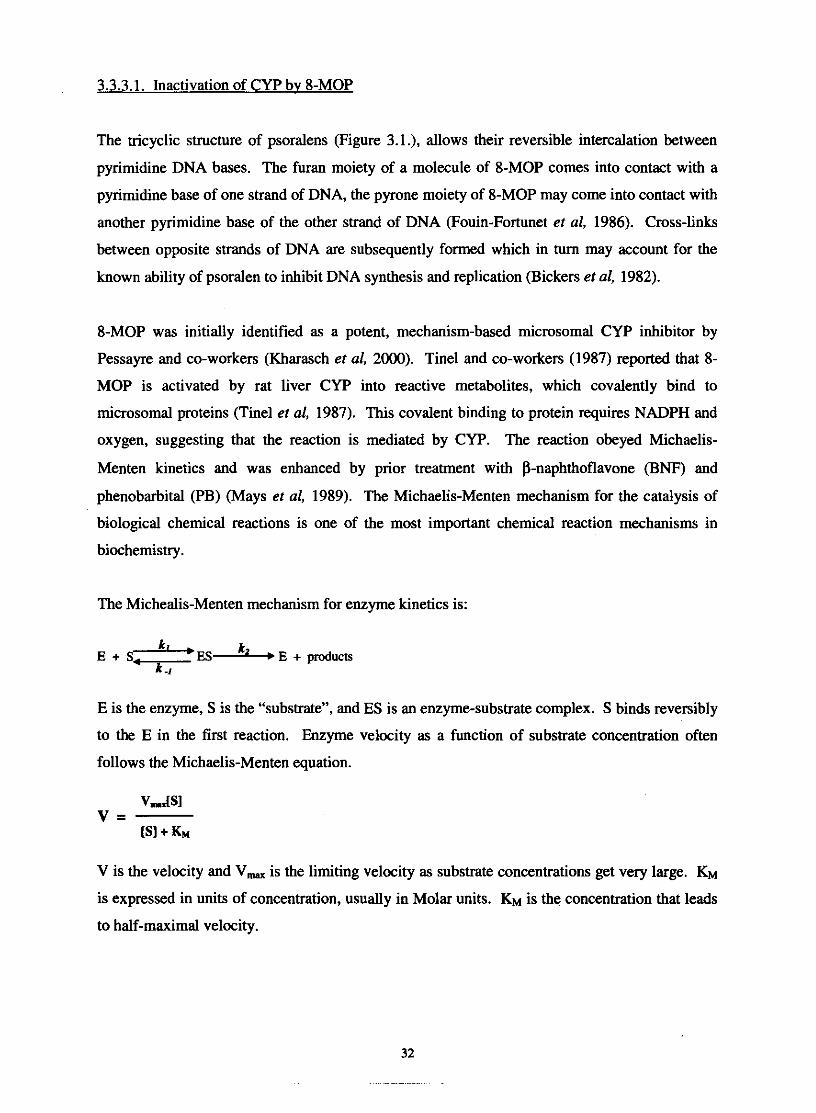
3.3.3.1. Inactivation of CYP bv 8-MOP
The tricyclic structure of psoralens (Figure 3.1.), allows their reversible intercalation between
pyrimidine DNA bases. The furan moiety of a molecule of 8-MOP comes into contact with a
pyrimidine base of one strand of DNA, the pyrone moiety of 8-MOP may come into contact with
another pyrimidine base of the other strand of DNA (Fouin-Fortunet el al, 1986). Cross-links
between opposite strands of DNA are subsequently formed which in turn may account for the
known ability of psoralen to inhibit DNA synthesis and replication (Bickers et al, 1982).
8-MOP was initially identified as a potent, mechanism-based microsomal CYP inhibitor by
Pessayre and co-workers (Kharasch et al, 2000). Tinel and co-workers (1987) reported that 8-
MOP is activated by rat liver CYP into reactive metabolites, which covalently bind to
microsomal proteins (Tinel et al, 1987). This covalent binding to protein requires NADPH and
oxygen, suggesting that the reaction is mediated by CYP. The reaction obeyed Michaelis-
Menten kinetics and was enhanced by prior treatment with P-naphthoflavone (BNF) and
phenobarbital (PB) (Mays et al, 1989). The Michaelis-Menten mechanism for the catalysis of
biological chemical reactions is one of the most important chemical reaction mechanisms in
biochemistry.
The Michealis-Menten mechanism for enzyme kinetics is:
k, , E + S v ES
A E + products
E is the enzyme, S is the "substrate", and ES is an enzyme-substrate complex. S binds reversibly
to the E in the first reaction. Enzyme velocity as a function of substrate concentration often
follows the Michaelis-Menten equation.
V is the velocity and V,, is the limiting velocity as substrate concentrations get very large. &
is expressed in units of concentration, usually in Molar units. KM is the concentration that leads
to half-maximal velocity.
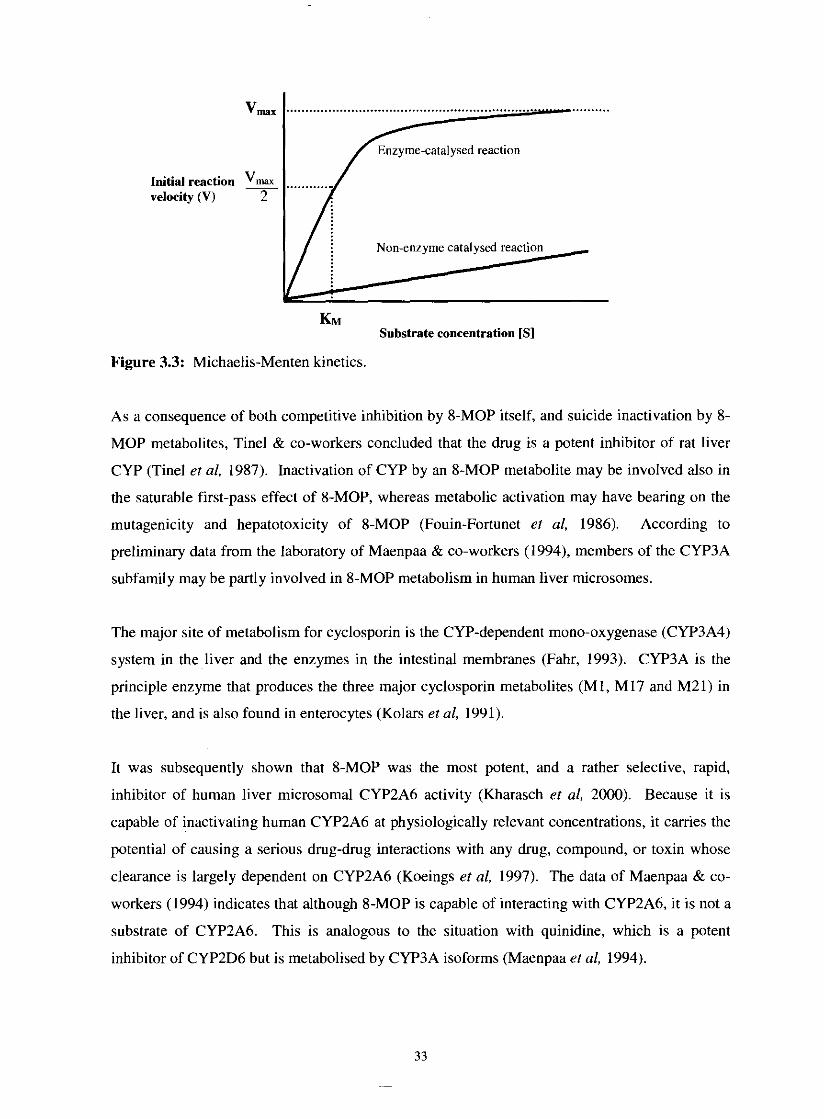
V,. . . . . . . . . . . . . . . . . . . . . . . . . . . . . . . . . . . . . . . . . . . . . . . . . . . . . . . . . . . . . . . . . . . . . . . . . . . . .
Initial reaction & velocity (V) 2
KM Substrate concentration [SI
Figure 3.3: Michaelis-Menten kinetics.
As a consequence of both competitive inhibition by 8-MOP itself, and suicide inactivation by 8-
MOP metabolites, Tine1 & co-workers concluded that the drug is a potent inhibitor of rat liver
CYP (Tinel et al, 1987). Inactivation of CYP by an 8-MOP metabolite may be involved also in
the saturable first-pass effect of 8-MOP, whereas metabolic activation may have bearing on the
mutagenicity and hepatotoxicity of 8-MOP (Fouin-Fortunet et al, 1986). According to
preliminary data from the laboratory of Maenpaa & co-workers (1994), members of the CYP3A
subfamily may be partly involved in 8-MOP metabolism in human liver microsomes.
The major site of metabolism for cyclosporin is the CYP-dependent mono-oxygenase (CYP3A4)
system in the liver and the enzymes in the intestinal membranes (Fahr, 1993). CYP3A is the
principle enzyme that produces the three major cyclosporin metabolites (MI, M17 and M21) in
the liver, and is also found in enterocytes (Kolars et al, 1991).
It was subsequently shown that 8-MOP was the most potent, and a rather selective, rapid,
inhibitor of human liver microsomal CYP2A6 activity (Kharasch et al, 2000). Because it is
capable of inactivating human CYP2A6 at physiologically relevant concentrations, it carries the
potential of causing a serious drug-drug interactions with any drug, compound, or toxin whose
clearance is largely dependent on CYP2A6 (Koeings et al, 1997). The data of Maenpaa & co-
workers (1994) indicates that although 8-MOP is capable of interacting with CYP2A6, it is not a
substrate of CYP2A6. This is analogous to the situation with quinidine, which is a potent
inhibitor of CYP2D6 but is metabolised by CYP3A isoforms (Maenpaa et al, 1994).
Data presented by Zhang & co-workers (2001) demonstrated that trypamine, tranylcypromine
(TCP) and 8-MOP have high specificity and relative selectivity for CYP2A6. Imitating the gene
defect by chemical inhibition with R-(+)-TCP may be an effective way to treat nicotine
dependence (Zhang et al, 2001).
The data of Kharasch & co-workers (2000) suggests that a single-dose 8-MOP is a partially
effective but not an optimal clinical CYP2A6 inhibitor probe. Higher or multiple oral doses
might achieve greater CYP2A6 inhibition (Kharasch et al, 2000).
3.3.3.2. Inter- and intraindividual variability
It is advisable to use doses well above the saturation process. Both inter-and intraindividual
variability in plasma levels tends to be large at doses that are in the range of the saturation
process. With 8-MOP the dose is limited by the onset of systemic side effects like nausea. 0.4-
12 m&g 8-MOP are sufficient for saturation of first pass effect, only if the release rate is very
quickly (Brickl er al, 1984).
Considerable variation of both the time (T-) and the height (C-) of the maximum serum
concentrations of 8-MOP are observed. This variation is due to the variable absorption of 8-
MOP from the different formulations and variability of the extent of first pass elimination of 8-
MOP. After oral administration, 8-MOP is subjected to extensive, saturable ' T i t pass
elimination", which means that after administration of a low 8-MOP dose, none or only small
amount of unchanged 8-MOP reaches the general circulation. With doses higher than the
"breakthrough dose", liver enzymes are saturated and serum concentration of 8-MOP rise
rapidly. Therefore no linearity exists between dose and the height of the serum concentration in
the dose range around the breakthrough dose, 0.23 m a g (Stolk & Siddiqui, 1988).
3.3.3.3. 8-MOP and smoking cessation
The primary psychoactive substance in tobacco responsible for establishing and maintaining
tobacco dependence is nicotine. It is primarily metabolised (-70%) to its inactive metabolite
cotinine by the genetically variable enzyme CYP2A6. Several procarcinogens, such as tobacco-
related nitrosamine 4-(methylnitros-amino)-1-(3-pyridy1)-1-butanone, aflatoxin B1, and
hexamethyl-phosphoramide are also activated by CYP2A6 (Zhang et al, 2001). The research of
Sellers & co -workers (2000) shows CYP2A6 inhibitors like 8-MOP increases nicotine

concentration in the blood. Two studies were performed on the effect of 8-MOP on nicotine
metabolism and craving in smokers with normal CYP2A6 metabolism not trying to quit
smoking. Those participants who received 8-MOP reported far less desire to smoke, smoked
fewer cigarettes, had longer intervals between cigarettes and took fewer puffs on each cigarette
(Zickler, 2000). By inhibiting the activity of CYP2A6 a potential component of a potent new
treatment for nicotine dependence may be represented. This inhibition could reduce smokers'
exposure to the harmful constituents of tobacco smoke while serving as part of a step-by-step
program of reduction leading to cessation of smoking. Nicotine replacement therapy (NRT) is a
method of smoking cessation that aims to reduce smokers' craving for nicotine. NRT is
available as a gum, nasal spray, inhaler, or skin patch. Because nicotine is quickly metabolised
in the liver and not enough of it gets into the bloodstream to reduce the craving, NRT does not
come in a pill. If nicotine could be combined with a drug like 8-MOP, which inhibits its
metabolism, oral replacements would be viable. Most patients prefer taking an oral medication,
and because 8-MOP eliminates almost completely the activity of CYP2A6, which varies from
person to person, its use with a nicotine pill could result in more predictable response to nicotine
replacement that is possible with either patch or gum (Zickler, 2000). Zhang & co-workers
(2001) has demonstrated that 30 mg of oral 8-MOP plus 4 mg of nicotine attenuated nicotine
clearance, increased its bioavailability and decreased cigarette smoking by 24% (Zhang et al,
2001).
3.3.4. Elimination
Elimination half-life for 8-MOP is about 1 hour (Stolk et al, 1987). Less than 5% can be
detected in the faeces and within 12 hours after oral administration more than 90% of 8-MOP
can be found in the urine primarily as glucuronides or as hydroxylated moieties (Bickers et al,
1982). This finding might suggest that the drug belongs to the group of drugs with a liver
clearance which approaches liver blood flow, in other words, 8-MOP has a high degree of fmt-
pass metabolism (Ehrsson er al, 1979).
3.4. References
ARTUC, M., STUE'lTGEN, G., SCHALLA, W., SCHAEFER, H. & GAZITH, J. (1979).
Reversible binding of 5- and 8-methoxypsoralen to human serum proteins (albumin) and to
epidermis in vitro. British journal of dermatology, 101:669-677.
BICKERS, D.R., MUKHTAR, H., MOLICA, S.J. & PATHAK, M.A. (1982). The effect of
psoralens on hepatic and cutaneous drug metabolising enzymes and CYP. The journal of
investigative dermatology, 79(3):201-205.
BRICKL, R., SCHMID, J. & KOSS, F.W. (1984). Clinical pharmacology of oral psoralen
drugs. Photodermatology, 1 : 174-185.
DE WOLFF, F.A. & THOMAS, T.V. (1986). Clinical pharmacokinetics of8-MOP and other
psoralens. Clinical phurmacokinetics, 11:62-75.
DONATH, P., BETHEA, D., AMICI, L., DELEO, K., WANG, X-M., BATTISTA, J.,
KNOBLER, R.M. & GASPARRO, F.P. (1999). Low and irreproducible8-MOP levels in
patients receiving photochemotherapy. Archives of dermatological research, 135:604-609.
EHRSSON, H., NILSSON, S-O., EHRNEBO, M., WALLIN, I. & WENNERSTEN, G. (1979).
Effect of food in kinetics of 8-methoxsalen. Clinical pharmacology and therapeutics,
25(2):167-171.
FAHR, A. (1993). Cyclosporin clinical pharmacokinetics. Clinical pharmacokinetics,
24(6):472-495.
FOUIN-FORTUNET, H., TINEL, M., DESCATOIRE, V., LETTERON, P., LARREY, D.,
GENEVE, J. & PESSAYRE, D. (1986). Inactivation of CYP by the dmg8-MOP. The journal
of pharmacology and experimental therapeutics, 236(1):237-247.
KHARASCH, E.D., HANKINS, D.C. & TARADAY, J.K. (2000). Singledose8-MOP effects
on human CYP 2A6 activity. Drug metabolism and disposition, 28(1):28-33.
KOEINGS, L.L., PETER, R.M., THOMPSON, S.J., RE'lTIE, A.E. & TRAGER, W.F. (1997).
Mechanism-based inactivation of human liver CYP 2A6 by 8-Methoxypsoralen. Drug
metabolism and disposition, 25(12): 1407-14 15.
KOLARS, J.C., AWNI, W.M., MERION, R.M. & WATKINS, P.B. (1991). First-pass
metabolism of cyclosporin by the gut. Lancet, 338:1488-1490.
LABBE, G., DESCATOIRE, V., BEAUNE, P., LETTERON, P., LARREY, D. & PESSAYRE,
D. (1989). Suicide inactivation of CYP by8-MOP. Evidence for the covalent binding of a
reactive intermediate to the protein moiety. The journal of pharmacology and experimental
therapeutics, 250(3): 1034-1042.
LETTERON, P., DESCATOIRE, C., LARREY, D., TINEL, M., GENEVE, J. & PESSAYRE,
D. (1986). Inactivation and induction of CYP by various psoralen derivatives in rats. The
journal ofpharmacology and experimental therapeutics, 238(2):685-692.
MAENPAA, J., JUVONEN, R., RAUNIO, H., RAUTIO, A. & PELKONEN, 0. (1994).
Metabolic interactions of8-MOP and coumarin in humans and mice. Biochemical
pharmacology, 48(7):1363-1369.
MAYS, D.C., NAWOOT, S., HILLIAR, J.B., PACUAL, C.M. & GERBER, N. (1987).
Inhibition and induction of drug biotransformation in vivo by 8-methoxpsoralen: Studies of
caffeine, phenytoin and hexobarbital metabolism in the rat. The journal of pharmacology and
experimental therapeutics, 243(1):227-233.
MAYS, D.C., HILLIARD, J.B., WONG, D.D. & GERBER, N. (1989). Activation of 8-
methoxypsoralen by CYP. Enzyme kinetics of covalent binding and influence of inhibitors and
inducers of drug metabolism. Biochemical pharmacology, 38(10): 1647-1655.
NEILD, V.S. & SCOTT, L.V. (1982). Plasma levels of 8-methoxsypsoralen in psoriatic patients
receiving topical 8-methoxypsoralen. British journal of dermatology, 1106: 199-203.
PARRISH, J.A., FITZF'ATRICK, T.B., TANENBAUM, L. & PATHAK, M.A. (1974).
Photochemotherapy of psoriasis with oral methoxsalen and longwave ultraviolet light. New
England journal of medicine, 29 1 : 1207-121 1.
SCHAFER-KORTING, M. & KORTING, H.Ch. (1982). Intraindividual variations of 8-
Methoxypsoralen plasma levels. Archives of dermatological research, 272: 1-7.
SCHMID, J., PROX, A., REUTER, A., ZIPP, H. & KOSS, F.W. (1980). The metabolism of 8-
methoxypsoralen in man. European journal of drug metabolism and pharmacokinetics,
5(2):81-92.
SELLERS, E.M., KAPLAN, H.L. & TYNDALE, R.F. (2000). Inhibition of CYP 2A6 increases
nicotine's oral bioavailability and decreases smoking. Clinicalpharmacology and therapeutics,
68(1):35-43.
STOLK, L.M.L. & SIDDIQUI, A.H. (1988). Biopharmaceutics, pharmacokinetics and
pharmacology of psoralens. Generalpharmacology, 19(5):649-653.
STOLK, L.M., SIDDIQUI, A.H. & CORMANE, R.H. (1987). 8-Methoxypsoralen levels in
blood. The journal of investigative dermatology.
TINEL, M., BELGHlTI, J., DESCATOIRE, V., AMOUYAL, G., LETTERON, P., GENEVE, J.,
LARREY, D. AND PESSAYRE, D. (1987). Inactivation of human liver CYP by the drug8-
MOP and other psoralen derivatives. Biochemicalpharmacology, 36(6):95 1-955.
TSAMBOAS, D., VIZETHUM, W. & GOERZ, G. (1978). Effect of oral 8-methoxypsoralen on
rat liver microsomal CYP. Archives of dermatological research, 263:339-342.
WANG, W., KILICARSLAN, T., TYNDALE, R.F. & SELLERS, E.M. (2001). Evaluation of
methoxsalen, tranylcypromine, and tryptamine as specific and selective CYP2A6 inhibitors in
vitro. Drug metabolism and disposition, 26(6):897-902.
ZICKLER, P. (2000). NIDA-Funded researchers identify compound that inhibits nicotine
metabolism, decreases urge to smoke. Nicotine research, 15(5).
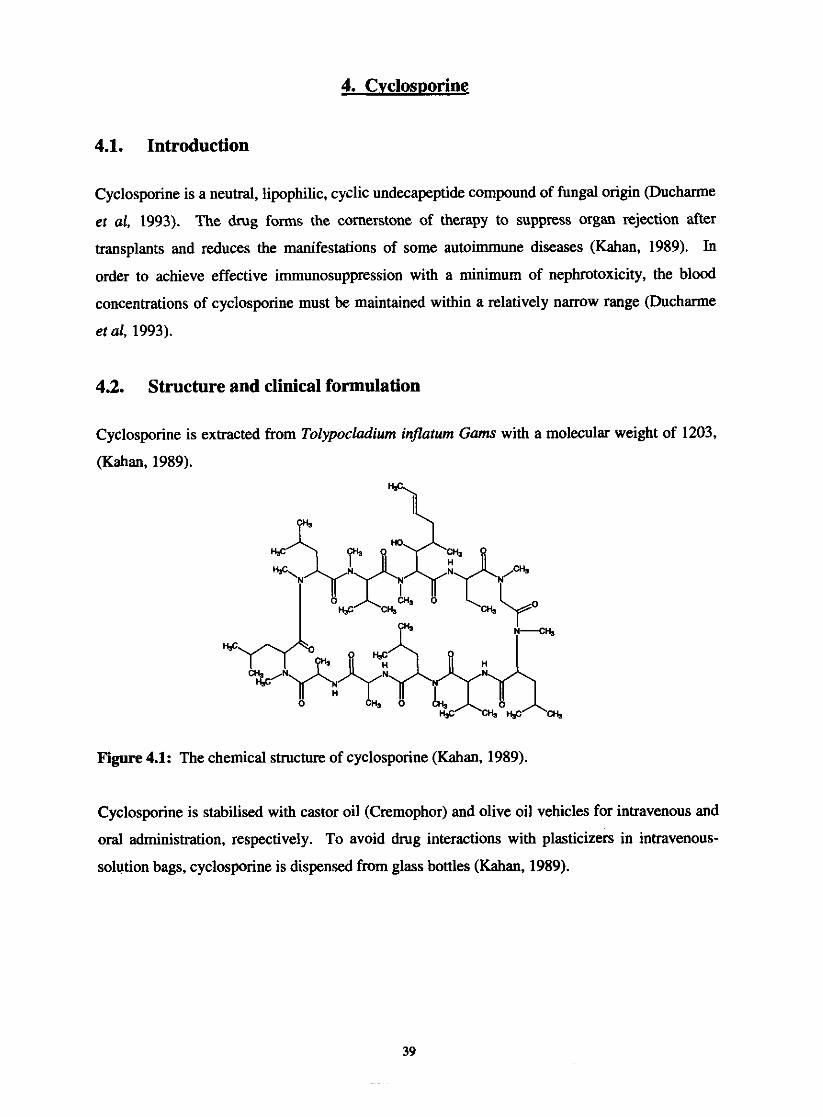
4.1. Introduction
Cyclosporine is a neutral, lipophilic, cyclic undecapeptide compound of fungal origin (Ducharme
et al, 1993). The drug forms the cornerstone of therapy to suppress organ rejection after
transplants and reduces the manifestations of some autoimmune diseases (Kahan, 1989). In
order to achieve effective immunosuppression with a minimum of nephrotoxicity, the blood
concentrations of cyclosporine must be maintained within a relatively narrow range (Ducharme
et al, 1993).
4.2. Structure and clinical formulation
Cyclosporine is extracted from Tolypocladium inflaturn Gams with a molecular weight of 1203,
(Kahan, 1989).
w
Figure 4.1: The chemical structure of cyclosporine (Kahan, 1989).
Cyclosporine is stabilised with castor oil (Cremophor) and olive oil vehicles for intravenous and
oral administration, respectively. To avoid drug interactions with plasticizers in intravenous-
solution bags, cyclosporine is dispensed from glass bottles (Kahan, 1989).

4.3. Pharmacokinetics
Table 4.1: Pharmacokinetic characteristics of cyclosporine. The range for peak plasma
concentrations is about 150 to 1000 pg/L, and the dose 5 to 12 mg/kg/day (Scott & Higenbottam,
First-pass mzabolisrn
Enmhepetic recirculation
Hepatic mzabolisrn
vd, 4r
Fs BiUiary e x d o n
Bwnd to plasma lipopmtcins (mainly HI1 I LDL) Bound to other plasma pmrcins (uwxid glyfopmein, albumin)
Found in nythrocytcs
Found in IeuMcytcs
Free drug
Vdue
- 8 - 6 0 8 - 10-274,
Nil (maabalices only) - 99%
1.8- 13.8L/Lg
0.1 - 1.7 horn
- 15.8 hours
>XI%
2 s - M B
5%
50%
5-2096
5%
Wideman (1983), analysed 245 oral pharmacokinetic profiles in 87 patients, ranging for 10- to
24-hour studies. A mean time of first serum peak was 3.46 * 1.89 h, with the mean peak level of
1241 i 841.2 qghl (Wideman, 1983). The cyclosporine levels in serum are illustrated in figure
4.2.
0 4 . 7 , , , , , , , , , , , , , 7 , ,
' n " ~ m = ~ ~ ~ " ~
Time (hours)
Figure 4.2: Cyclosporine levels in blood (serum) following an oral dose (Wideman, 1983).

43.1. Absorption
Absorption of cyclosporine occurs predominantly in the small intestine where it's also
metabolised (Fahr, 1993). After oral administration the systemic absorption of cyclosporine is
poor, highly variable (Jones, 1997), slowly and incompletely (Fahr, 1993). After absorption
from the intestine via the lymphatics, the blood circulation carries cyclosporine to the liver,
where it is extracted and excreted in the bile and eliminated through or reabsorbed from the
intestine. Reabsorption is termed enterohepatic cycling or hepatic recirculation (Wideman,
1983).
Blood c i r c u l a t i o n Y
t Extraction by
the liver I
I + LymphaticlIhoracic ~ i l ~
Duct
Intestine + Elimination of drug andor
metabolites
Figure 4.3: Enterohepatic cycling (Wideman, 1983).
The variability in the relative bioavailability is quite high, even in healthy volunteers (Fahr,
1993). Bioavailability is defined as the relative proportion of the administered dose that enters
the systemic circulation and the rate at which the drug appears in the bloodstream (Wideman,
1983). The variable absorption of cyclosporine may account for the highly variable
bioavailability and the fact that the liver mainly eliminates cyclosporine (Fahr, 1993). These
variations probably reflect differences in the ability of intestinal chyme to disperse cyclosporine
from its vehicle. The absorption process is adversely affected by biliary diversion,
cholestyramine therapy, cholestasis, and slow gastric emptying; increased gastrointestinal
motility; steatorrhea and reduced pancreatic exocrine secretion. The presence of normal serum
low-density lipoprotein levels promote the absorption of the drug (Kahan, 1989). Other factors
such as co-medication, type of transplant, amount and composition of bile in the gut, the
lipophilicity of cyclosporine (Fahr, 1993) and the lack of dispersing the drug formulation in a
drink (Grevel, 1988) may also influence the variability in absorption (Fahr, 1993).
The effects that can influence absorption are summarised in table 4.2.
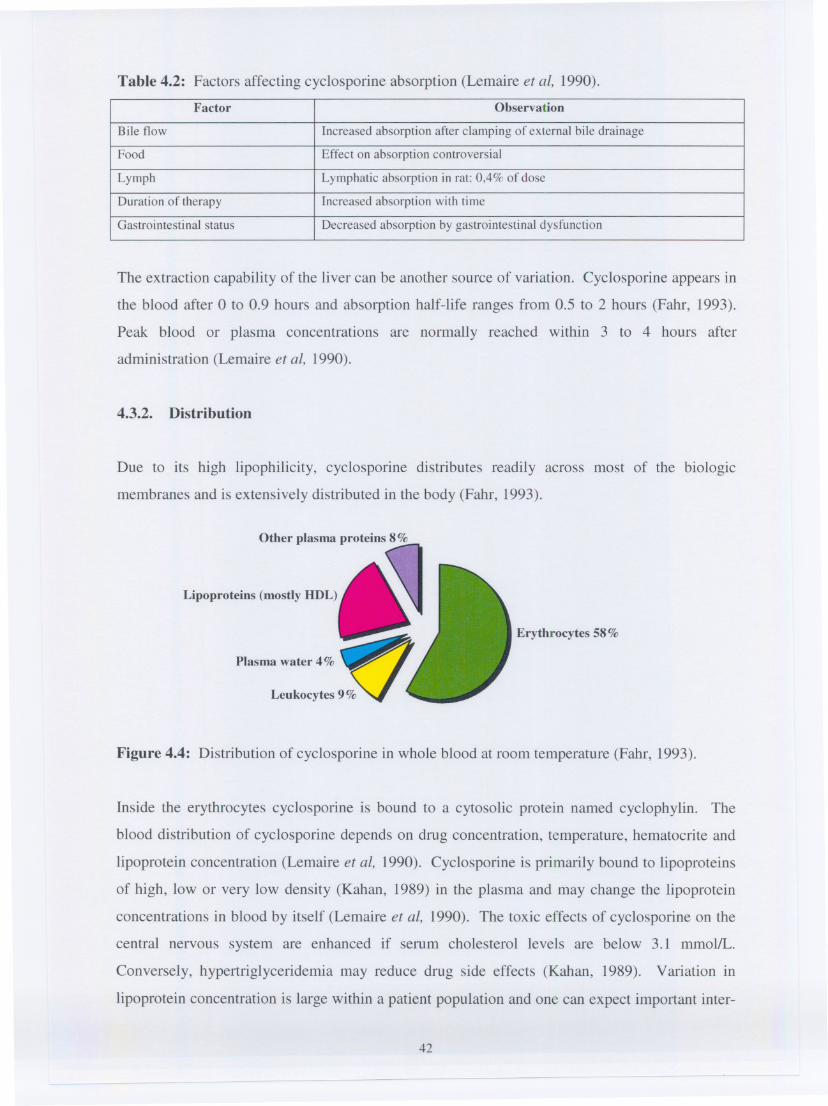
Table 4.2: Factors affecting cyclosporine absorption (Lemaire et at, 1990).
The extraction capability of the liver can be another source of variation. Cyclosporine appears in
the blood after 0 to 0.9 hours and absorption half-life ranges from 0.5 to 2 hours (Fahr, 1993).
Peak blood or plasma concentrations are normally reached within 3 to 4 hours after
administration (Lemaire et at, 1990).
4.3.2. Distribution
Due to its high lipophilicity, cyclosporine distributes readily across most of the biologic
membranes and is extensively distributed in the body (Fahr, 1993).
Other plasma proteins 8%
Upoprote;.. (mo,ay DDL)~Plasma water 4% ~
Leukocytes9~ ~
Erythrocytes 58%
Figure 4.4: Distribution of cyclosporine in whole blood at room temperature (Fahr, 1993).
Inside the erythrocytes cyclosporine is bound to a cytosolic protein named cyclophylin. The
blood distribution of cyclosporine depends on drug concentration, temperature, hematocrite and
lipoprotein concentration (Lemaire et at, 1990). Cyclosporine is primarily bound to lipoproteins
of high, low or very low density (Kahan, 1989) in the plasma and may change the lipoprotein
concentrations in blood by itself (Lemaire et at, 1990). The toxic effects of cyclosporine on the
central nervous system are enhanced if serum cholesterol levels are below 3.1 mmol/L.
Conversely, hypertriglyceridemia may reduce drug side effects (Kahan, 1989). Variation in
lipoprotein concentration is large within a patient population and one can expect important inter-
42
Factor Observation
Bile flow Increased absorption after clamping of external bile drainage
Food Effect on absorption controversial
Lymph Lymphatic absorption in rat: 0,4% of dose
Duration of therapy Increased absorption with time
Gastrointestinal status Decreased absorption by gastrointestinal dysfunction

and intra-individual variations of the overall plasma protein binding and blood distribution of
cyclosporine (Lemaire et al, 1990). The liver is the major depot for the drug, followed by the
pancreas, fat, blood, heart, lung, kidney, and neural and muscular tissue (Figure 4.5.) (Kahan,
W i a l cord
Ovaries
w c l e (leops0aS)
Duodenum
Spleen (accessory)
Breast
Figure 4.5: Cyclosporine tissue levels expressed as qglg tissue wet weight determined on
samples obtained from various organs at immediate postmortem examination (Kahan et al,
1983).
Lhgula
Rasm
Fat
Pancreas
Liver 3
Nonsignificant concentrations of cyclosporine were found in brain and cerebrospinal fluid and
significant amounts were found in placenta en breast milk (Lemaire et al, 1990). The low
passage of cyclosporine through the blood-brain barrier is surprising because of the lipophilicity
of the drug and the long durations of treatment. Pharmacokinetic studies also showed that
despite the high lipophilicity, the distribution of cyclosporine is restricted to lean body mass
(Fahr, 1993).
\
0 50 100 150 200 250 300 350 400 450 500 550 600 E50 700
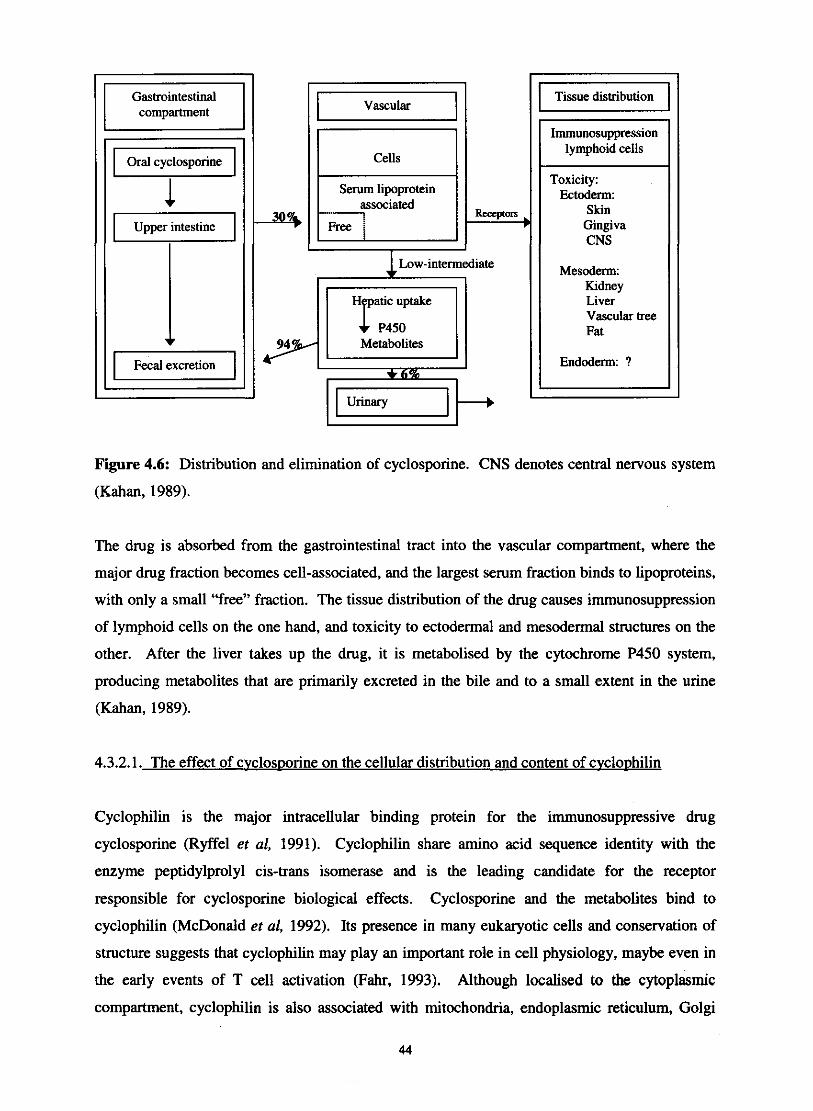
Gastrointestinal
I
Upper intestine
I Cells I Serum lipoprotein
Free ;
Metabolites
( Tissue distribution
Immunosuppression lymphoid cells
Toxicity: Ectoderm:
Gingiva
Mesoderm: Kidney Liver Vascular tree Fat
Endoderm: ?
Figure 4.6: Distribution and elimination of cyclosporine. CNS denotes central nervous system
(Kahan, 1989).
The drug is absorbed from the gastrointestinal tract into the vascular compartment, where the
major drug fraction becomes cell-associated, and the largest serum fraction binds to lipoproteins,
with only a small "free" fraction. The tissue distribution of the drug causes immunosuppression
of lymphoid cells on the one hand, and toxicity to ectodermal and mesodermal structures on the
other. After the liver takes up the drug, it is metabolised by the cytochrome P450 system,
producing metabolites that are primarily excreted in the bile and to a small extent in the urine
(Kahan, 1989).
4.3.2.1. The effect of cvclos~orine on the cellular distribution and content of cvclo~hilin
Cyclophilin is the major intracellular binding protein for the immunosuppressive drug
cyclosporine (Ryffel et al, 1991). Cyclophilin share amino acid sequence identity with the
enzyme peptidylprolyl cis-trans isomerase and is the leading candidate for the receptor
responsible for cyclosporine biological effects. Cyclosporine and the metabolites bind to
cyclophilin (McDonald et al, 1992). Its presence in many eukaryotic cells and conservation of
structure suggests that cyclophilin may play an important role in cell physiology, maybe even in
the early events of T cell activation (Fahr, 1993). Although localised to the cytoplasmic
compartment, cyclophilin is also associated with mitochondria, endoplasmic reticulum, Golgi
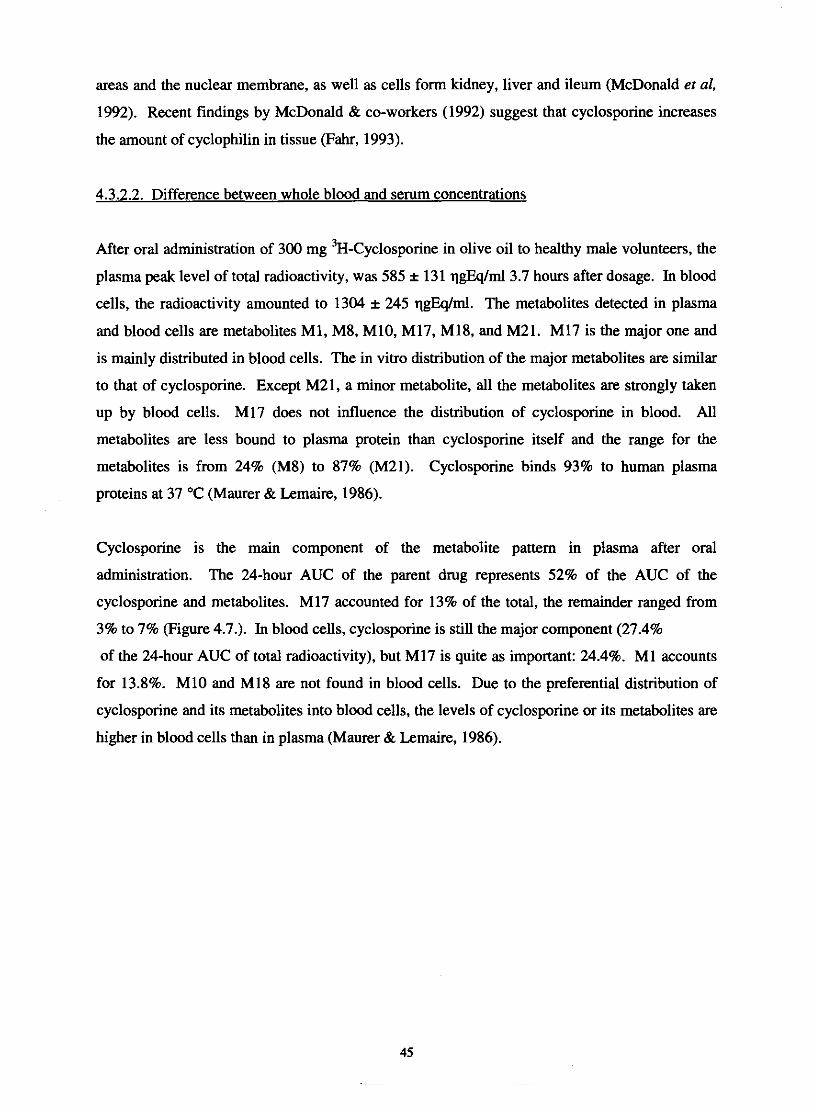
areas and the nuclear membrane, as well as cells form kidney, liver and ileum (McDonald et al,
1992). Recent findings by McDonald & co-workers (1992) suggest that cyclosporine increases
the amount of cyclophilin in tissue (Fahr, 1993).
4.3.2.2. Difference between whole blood and serum concentrations
After oral administration of 300 mg 3~-~yclosporine in olive oil to healthy male volunteers, the
plasma peak level of total radioactivity, was 585 * 131 qgEqlml3.7 hours after dosage. In blood
cells, the radioactivity amounted to 1304 i 245 qgQIml. The metabolites detected in plasma
and blood cells are metabolites MI, M8, M10, M17, M18, and M21. MI7 is the major one and
is mainly distributed in blood cells. The in vitro distribution of the major metabolites are similar
to that of cyclosporine. Except M21, a minor metabolite, all the metabolites are strongly taken
up by blood cells. MI7 does not influence the distribution of cyclosporine in blood. All
metabolites are less bound to plasma protein than cyclosporine itself and the range for the
metabolites is from 24% (M8) to 87% (M21). Cyclosporine binds 93% to human plasma
proteins at 37 OC (Maurer & Lemaire, 1986).
Cyclosporine is the main component of the metabolite pattern in plasma after oral
administration. The 24-hour AUC of the parent drug represents 52% of the AUC of the
cyclosporine and metabolites. M17 accounted for 13% of the total, the remainder ranged from
3% to 7% (Figure 4.7.). In blood cells, cyclosporine is still the major component (27.4%
of the 24-hour AUC of total radioactivity), but M17 is quite as important: 24.4%. M1 accounts
for 13.8%. MI0 and MI8 are not found in blood cells. Due to the preferential distribution of
cyclosporine and its metabolites into blood cells, the levels of cyclosporine or its metabolites are
higher in blood cells than in plasma (Maurer & Lemaire, 1986).
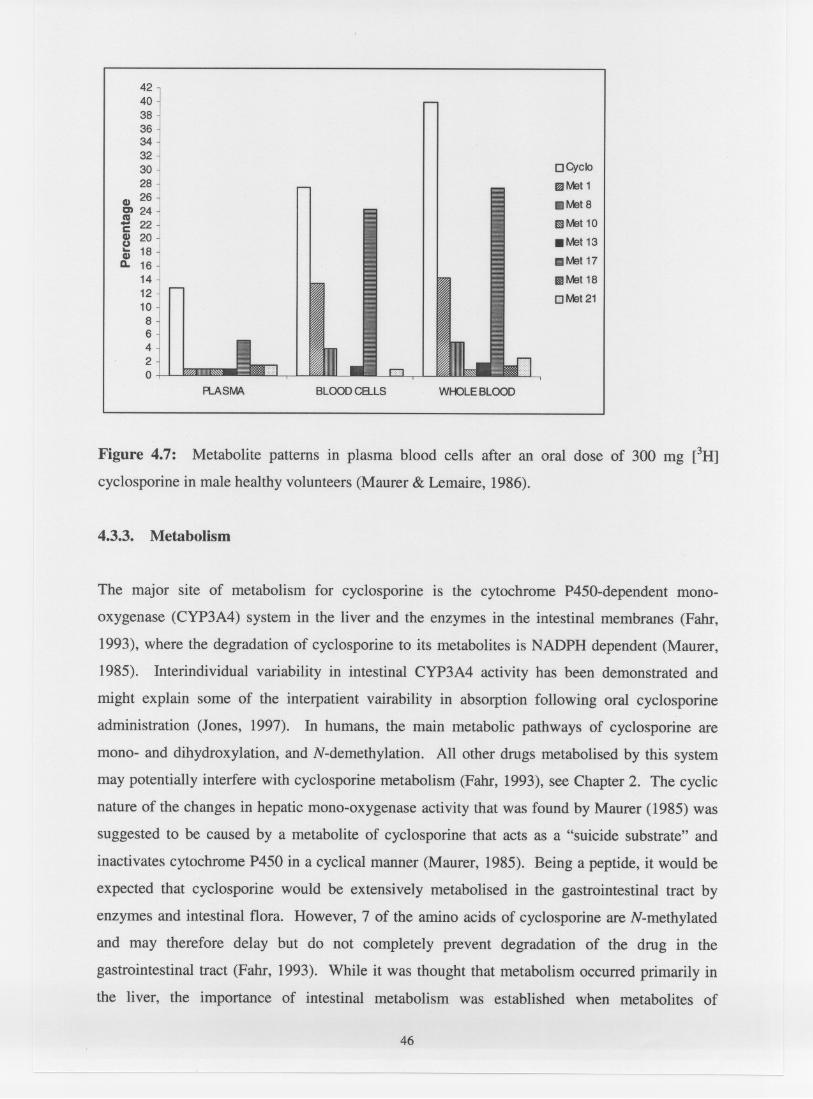
4240383634323028
CD 26C) 24S 22c~ 20i 18D. 16
1412108642o
o CyclomMet111IIMet 8
11IIMet10
. Met13mMet17
IIIMet18
o Met21
FlASMA BLOOD C8...LS WHOLEBLOOD
Figure 4.7: Metabolite patterns in plasma blood cells after an oral dose of 300 mg eH]
cyclosporine in male healthy volunteers (Maurer & Lemaire, 1986).
4.3.3. Metabolism
The major site of metabolism for cyclosporine is the cytochrome P450-dependent mono-
oxygenase (CYP3A4) system in the liver and the enzymes in the intestinal membranes (Fahr,
1993), where the degradation of cyclosporine to its metabolites is NADPH dependent (Maurer,
1985). Interindividual variability in intestinal CYP3A4 activity has been demonstrated and
might explain some of the interpatient vairability in absorption following oral cyclosporine
administration (Jones, 1997). In humans, the main metabolic pathways of cyclosporine are
mono- and dihydroxylation, and N-demethylation. All other drugs metabolised by this system
may potentially interfere with cyclosporine metabolism (Fahr, 1993), see Chapter 2. The cyclic
nature of the changes in hepatic mono-oxygenase activity that was found by Maurer (1985) was
suggested to be caused by a metabolite of cyclosporine that acts as a "suicide substrate" and
inactivates cytochrome P450 in a cyclical manner (Maurer, 1985). Being a peptide, it would be
expected that cyclosporine would be extensively metabolised in the gastrointestinal tract by
enzymes and intestinal flora. However, 7 of the amino acids of cyclosporine are N-methylated
and may therefore delay but do not completely prevent degradation of the drug in the
gastrointestinal tract (Fahr, 1993). While it was thought that metabolism occurred primarily in
the liver, the importance of intestinal metabolism was established when metabolites of
46
-- --
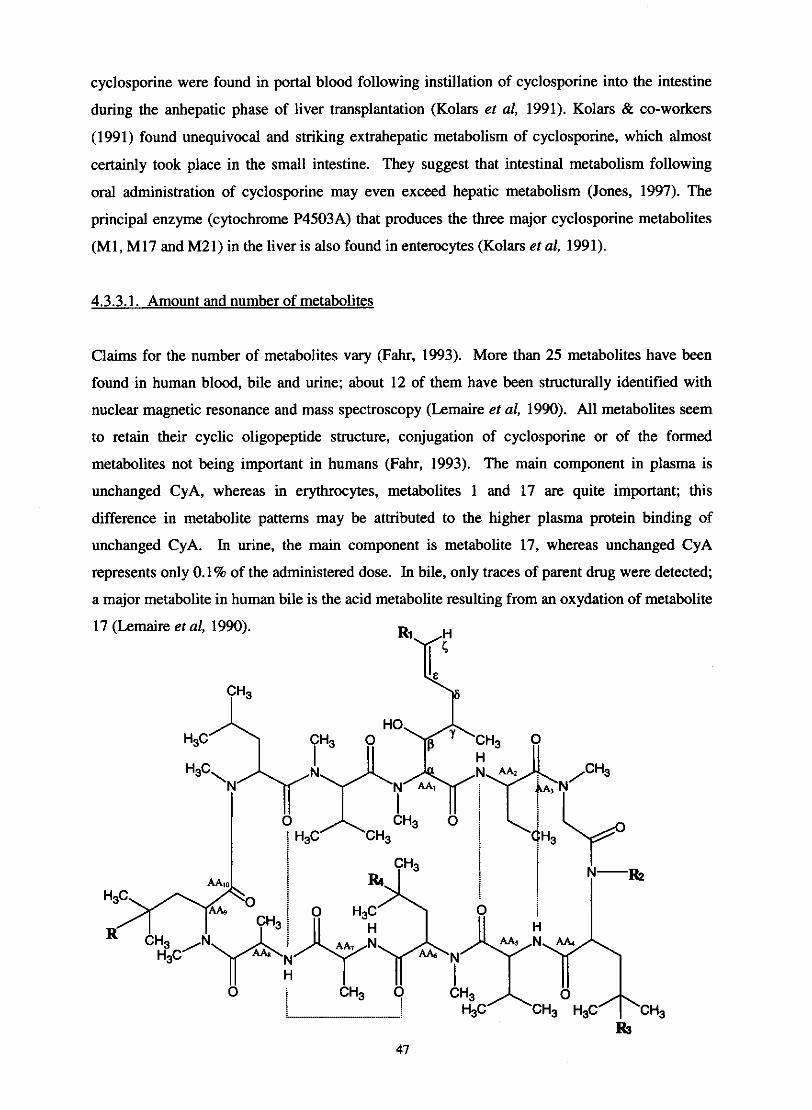
cyclosporine were found in portal blood following instillation of cyclosporine into the intestine
during the anhepatic phase of liver transplantation (Kolars et al, 1991). Kolars & co-workers
(1991) found unequivocal and striking extrahepatic metabolism of cyclosporine, which almost
certainly took place in the small intestine. They suggest that intestinal metabolism following
oral administration of cyclosporine may even exceed hepatic metabolism (Jones, 1997). The
principal enzyme (cytochrome P4503A) that produces the three major cyclosporine metabolites
(MI, M17 and M21) in the liver is also found in enterocytes (Kolars et al, 1991).
4.3.3.1. Amount and number of metabolites
Claims for the number of metabolites vary (Fahr, 1993). More than 25 metabolites have been
found in human blood, bile and urine; about 12 of them have been structurally identified with
nuclear magnetic resonance and mass spectroscopy (Lemaire et al, 1990). All metabolites seem
to retain their cyclic oligopeptide structure, conjugation of cyclosporine or of the formed
metabolites not being important in humans (Fahr, 1993). The main component in plasma is
unchanged CyA, whereas in erythrocytes, metabolites 1 and 17 are quite important; this
difference in metabolite patterns may be attributed to the higher plasma protein binding of
unchanged CyA. In urine, the main component is metabolite 17, whereas unchanged CyA
represents only 0.1% of the administered dose. In bile, only traces of parent drug were detected;
a major metabolite in human bile is the acid metabolite resulting from an oxydation of metabolite
17 (Lemaire et al, 1990).
CH3 I

13 I Hydroxylated and N-demethylated derivative of cyclosporine 1 1204.62 16 I OH I CH3 I CH3 I H I OH ( 1 1234.64 17 I H 1 CHzOH I CH3 I H I H I 1 1218.64 18 ( H ( CHzOH I CH3 ( H I H I CH-0-CH-CH20f AAl 1 1218.64
Metabolite no.
Cyclosporiw I H I CH3 I CH3 I H I H I 1 1202.64
R2 R
21 25 26
10 11 1 2 3 MeLeu MeVal : MeBmt -Abu :
j
i MeLeu ! V d
8 7 6 5 4
R3 RI
1
Figure 4.8: Structure of isolated metabolites of cyclosporine - top (Maurer & Lemaire, 1986).
Alignment of amino acids of cyclosporine - bottom. The unique structure at position 1 is
MeBmt, a novel 0-hydroxy, unsaturated, 9carbon amino acid ((4R)-4-[(E)-2-butenyl1-4, N-
H H
OH I I B E <
dimethyl-L-threonine). Abu denotes a-amino-butyric acid; Sar, sarcosine; MeLeu, N-methyl-L-
leucine; Val, valine; Ala, Lalanine; D-Ala, alanine; and MeVal, N-methyl-L-valine.
&
203-218 I H I COOH I CHI I H I H I 1 1234.64
All the amino acids in the structure have the "S" configuration of natural L amino acids with the
exception of the D-alanine in position 8, which has the "R" configuration. The amino acids 1,3,
4, 6, 9, 10 and 11 are N-methylated. Ten of the amino acids are known aliphatic amino acids,
characterised upon acidic hydrolysis of cyclosporine. Amino acid 1, a 0-hydroxy amino acid,
also called C-9 amino acid, is unknown (Maurer, 1985).
CH3 CHzOH CH20H
4.3.3.2. Variabilitv in the oral pharmacokinetics of cvclos~orine
Other modiClcatiou
There are marked interindividual differences in the concentration and activity of hepatic
CYP3A4. Thummel & co-workers (1994) showed that variation in liver content of CYP3A4 in
liver transplant recipients accounted for 66% of the interpatient variation in the clearance of
intravenously administered cyclosporine. In contrast, variation in liver CYP3A4 activity does
not appear to account for a majority of the interpatient variability in pharmacokinetics when
Molecular weight
H H
CH3
H H H
H H H
B E 6
CH-0 CH-CH2 of AAI
1188.62 1202.64 1204.62

cyclosporine is administered orally. Lown & co-workers (1997) showed that variation in liver
CYP3A4 activity predicted only about one third of the interpatient variability in the oral
clearance ( C W ) of cyclosporine in kidney transplant patients. The basis for the remaining
variation in C W is unknown. One possible explanation may be related to the abundant
expression of CYP3A4 in small bowel epithelial cells (enterocytes). Several studies have
indicated that intestinal CYP3A4 is responsible for significant first-pass metabolism of orally
administered cyclosporine. Lown & co-workers (1997) have found that the enterocyte content of
CYP3A4 protein correlates with its catalytic activity (midazolam 1'-hydroxylation) and varies up
to ten-fold among patients. Intestinal and liver CYP3A4 expression do not appear to be co-
ordinately regulated. It is possible for an individual to have relatively high liver CYP3A4
activity while having relatively low intestinal CYP3A4 activity or vica verca. Another potential
source of variation in oral cyclosporine pharmacokinetics may be related to the expression of p-
glycoprotein. As with CYP3A4, there is significant interindividual variation in the intestinal
expression of p-glycoprotein. Given its transport function, high intestinal levels of p-
glycoprotein may interfere with drug absorption and contribute to the variation in cyclosporine
oral pharmacokinetics (Lown et al, 1997).
Lindholm & co-workers (1988) measured total and unbound plasma concentrations of
cyclosporine in seven healthy men after single oral doses (12 mgtkg) on two occasions, two
weeks apart. They reported an up to two-fold intraindividual and a more than three-fold
interindividual variation in plasma AUC of both total and unbound cyclosporin after oral
administration (Table 4.3.).
4.3.4. Elimination
The major route of elimination of cyclosporine metabolites is biliary excretion. Most of the drug
is ultimately excreted in the faeces after some enterohepatic re-circulation of cyclosporine
metabolites. The clearance rate in young people is higher and they need more frequent, larger,
doses. Drug clearance rates are slower in patients with decreased levels of serum low-density
lipoprotein triglyceride and cholesterol. In the presence of elevated serum levels of bilirubin or
alanine aminotransferase, longer dosing intervals are necessary but not with higher levels of
aspartate aminotransferase, lactate dehydrogenase, or alkaline phosphatase. Renal excretion is a
minor pathway of elimination for cyclosporine (Lemaire et al, 1990), (6% of the dose appears in
the urine), therefore renal failure does not alter cyclosporine elimination (Kahan, 1989).
Factors affecting elimination can be seen in table 4.4.

Table 4.3: Pharmacokinetic data for total and unbound cyclosporine in plasma after single doses
(12 mgkg) on two occasions (Lindholm et al, 1988).
4.35. Drug interactions
Table 4.4: Factors affecting cyclosporine elimination (Lemaire, et al, 1990).
A number of drugs can influence the metabolism of cyclosporine. As discussed in Chapter 2, the
intestinal andlor hepatic CYP3A4 enzymes can be induced or inhibited which can result in the
elevating or lowering of blood cyclosporine concentrations (Jones, 1997). P450 serves as a
Factor
Age
Sex
Liver disease
Obesity
Cucardian variations
Observation
Lower clearance in old patients
Lower clearance in woman
Lower clearance in liver insufficients
No significant differences between obese and non-obese patients when dose-
nonnalised on ideal body weight
Clearance variation between day and night

primary component of the oxidative enzyme system, and when certain drugs interact to increase
the activity of this system, it represents an increased concentration of the P450, known as
enzyme induction. This leads to increased biotransformation of the cyclosporine, and therefore
decreased the effect of the drug (Wideman, 1983). Steroids such as dexamethasone, rifampin,
and phenobarbital (Kronbach et al, 1988) increase enzyme activity, subsequently increasing
formation of P450. It also increase hepatic blood flow and bile flow, all of which combine to
cause decreased blood levels of cyclosporine (Wideman, 1983). On the other hand, macrolide
antibiotics, dihydropyridine, calcium antagonists, quinidine and benzphetamine, erythromycin,
and steroids such as testosterone and estradiol or dexamethasone are inducers or substrates of
cytochrome P4503A3 and have the potential of altering cyclosporine blood levels. Substrates
that are metabolised with high affinity by this enzyme (e.g., erythromycin) presumably prolong
the elimination of cyclosporine by competing for the same site of metabolism (Kronbach et al,
1988). Giving drugs such as furosemide, aminoglycosides, ketoconazole and amphotericin B
with cyclosporine can increase the risk of nephrotoxicity. Interactions with digoxin have also
been reported where cyclosporine appears to reduce both apparent volume of distribution of
digoxin and its total plasma clearance. When the cephalosporins cefuroxime, cephradine,
claforan or cetazidime are given to patients receiving cyclosporine, a slight increase in serum
liver enzymes may occur, but there is no fall in renal function (Scott & Higenbottam, 1988).
Table 4.5. is a summary of the most important interactions.
Cyclosporine is expensive to provide and monitor and the magnitude of these costs may preclude
its use (Jones, 1997). There has been much interest in the co-administration of cyclosporine with
inhibitors of CYP3A4 in order to increase concentrations in patients having difficulty attaining
therapeutic levels and to decrease the cost of therapy with this expensive drug (Ducharme et al,
1993). Drugs which alter blood cyclosporine concentrations were initially seen as relatively
contraindicated, but once the economic potential was realised, deliberate co-prescription of drugs
which allow the dosage of cyclosporine to be reduced while maintaining blood cyclosporine
concentrations within the therapeutic range were soon advocated (Jones, 1997).
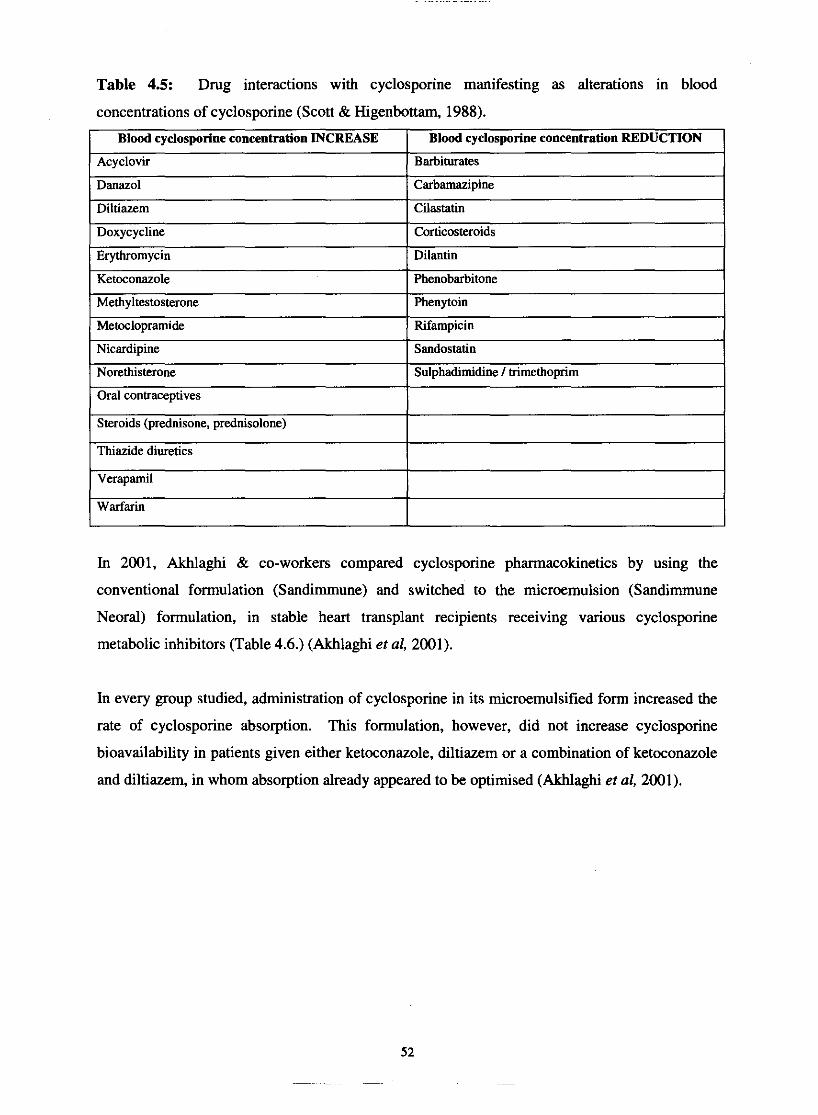
Table 4.5: Drug interactions with cyclosporine manifesting as alterations in blood
concentrations of cyclosporine (Scott & Higenbottam, 1988).
Blood cyclosporine concentration INCREASE
Acyclovir
Danazol
Diltiazem
Doxycycline
Erythromycin
Ketoconazole
Methyltestosterone
Verapamil
Warfarin
Blood cyclosporine concentration REDUCTION
Barbiturates
Carbamazipine
Ciastatin
Corticosteroids
Dilantin
Pheoobarbitone
Phenytoin
Memclopramide
Nicardipine
Norethisterone
Oral contraceptives
Steroids (prednisooe, prednisolone)
Thiazide diuretics
In 2001, Akhlaghi & co-workers compared cyclosporine pharmacokinetics by using the
conventional formulation (Sandirnmune) and switched to the microemulsion (Sandimmune
Neoral) formulation, in stable heart transplant recipients receiving various cyclosporine
metabolic inhibitors (Table 4.6.) (Akhlaghi et al, 2001).
Rifampicin
Sandostatin
Sulphadimidine 1 trinethoprim
In every group studied, administration of cyclosporine in its microemulsified form increased the
rate of cyclosporine absorption. This formulation, however, did not increase cyclosporine
bioavailability in patients given either ketoconazole, diltiazem or a combination of ketoconazole
and diltiazem, in whom absorption already appeared to be optimised (Akhlaghl et al, 2001).
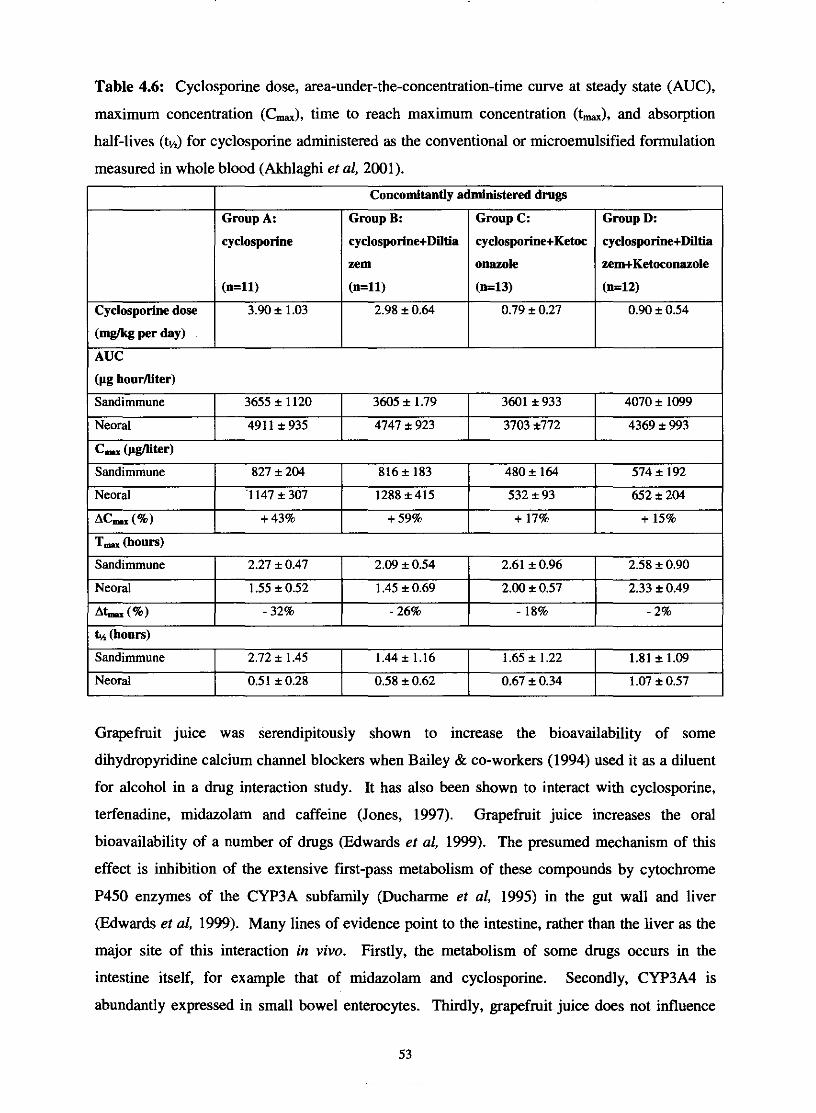
Table 4.6: Cyclosporine dose, area-under-the-concentration-time curve at steady state (AUC),
maximum concentration (C,), time to reach maximum concentration (t,), and absorption
half-lives (&) for cyclosporine administered as the conventional or microemulsified formulation
measured in whole blood (Akhlaghi et al, 2001).
Cyclosporine dose
(Wk per day)
(pg hourniter)
1 AUC
Concomitantly administered drugs
T, (hours)
Grapefruit juice was serendipitously shown to increase the bioavailability of some
dihydropyridine calcium channel blockers when Bailey & co-workers (1994) used it as a diluent
for alcohol in a drug interaction study. It has also been shown to interact with cyclosporine,
terfenadine, midazolam and caffeine (Jones, 1997). Grapefruit juice increases the oral
bioavailability of a number of drugs (Edwards et al, 1999). The presumed mechanism of this
effect is inhibition of the extensive first-pass metabolism of these compounds by cytochrome
P450 enzymes of the CYP3A subfamily @ucharme et al, 1995) in the gut wall and liver
(Edwards et al, 1999). Many lines of evidence point to the intestine, rather than the liver as the
major site of this interaction in vivo. Firstly, the metabolism of some drugs occurs in the
intestine itself, for example that of midazolam and cyclosporine. Secondly, CYP3A4 is
abundantly expressed in small bowel enterocytes. Thirdly, grapefruit juice does not influence
3601 i 933 I 4070 i 1099 Sandimmune
Sandimmune
Neoral
~~ (a) k4 (hours)
Group A:
cyclosporine
(n=ll)
3.90 i 1.03
Sandimmune
Group C:
cyclosporine+Ketoc
onazole
(1143)
0.79 i 0.27
Group B:
cyclospotine+Diltia
zem
(n=ll)
2.98 i 0.64
3655 i 1120
Neoral
2.27 i 0.47
1.55 * 0.52 - 32%
Group D:
cyclosporine+Diltia
zem+Ketoconazole
(n=12)
0.90 i 0.54
3605 i 1.79
2.72 i 1.45
491 1 i 935
2.09 i 0.54
1.45 + 0.69 - 26%
Neoral
C- @fleer)
1.44 i 1.16
4747 i 923
Sandimmune
Neoral
Ac- (%)
2.61 i 0.96
2.00 t 0.57
- 18%
0.51 * 0.28
2.58 i 0.90
2.33 i 0.49
- 2%
1.65 * 1.22
3703 i772
827 i 204
'1 147 * 307 + 43%
1.81 i 1.09
0.58 i 0.62
4369 i 993
0.67 i 0.34
574 * 192 652 i 204
+ 15%
816i 183
1288 *415
+ 59%
1.07 i 0.57
480 i 164
532 + 93 + 17%
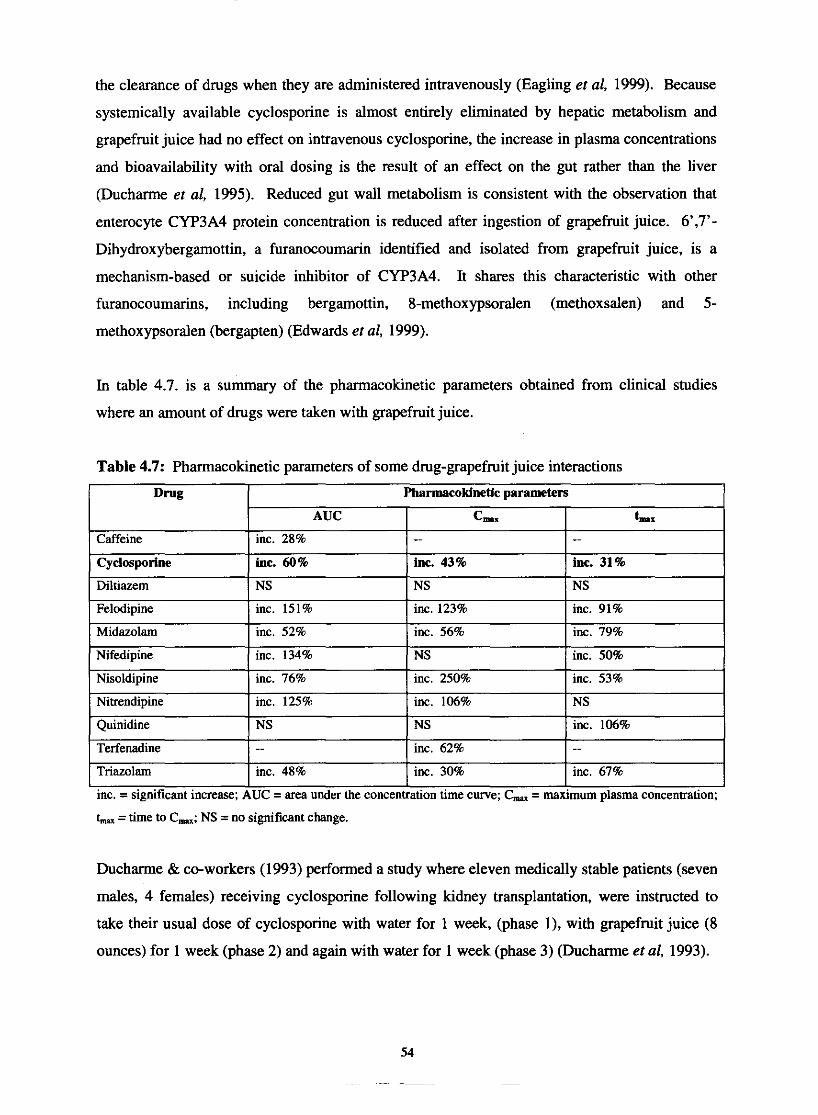
the clearance of drugs when they are administered intravenously (Eagling et al, 1999). Because
systemically available cyclosporine is almost entirely eliminated by hepatic metabolism and
grapefruit juice had no effect on intravenous cyclosporine, the increase in plasma concentrations
and bioavailability with oral dosing is the result of an effect on the gut rather than the liver
(Ducharme et al, 1995). Reduced gut wall metabolism is consistent with the observation that
enterocyte CYP3A4 protein concentration is reduced after ingestion of grapefruit juice. 6',7'-
Dihydroxybergamottin, a furanocoumarin identified and isolated from grapefruit juice, is a
mechanism-based or suicide inhibitor of CYP3A4. It shares this characteristic with other
furanocoumarins, including bergamottin, 8-methoxypsoralen (methoxsalen) and 5-
methoxypsoralen (bergapten) (Edwards et al, 1999).
In table 4.7. is a summary of the pharmacokinetic parameters obtained from clinical studies
where an amount of drugs were taken with grapefruit juice.
Table 4.7: Pharmacokinetic parameters of some drug-grapefruit juice interactions
1 Pharmacokinetlc parameters 1
inc. = significant increase; AUC = area under the concentration time curve; C, = maximum plasma concentxation;
t- =time to C,; NS =no significant change.
Ducharme & co-workers (1993) performed a study where eleven medically stable patients (seven
males, 4 females) receiving cyclosporine following kidney transplantation, were instructed to
take their usual dose of cyclosporine with water for 1 week, (phase I), with grapefruit juice (8
ounces) for 1 week (phase 2) and again with water for 1 week (phase 3) (Ducharme et al, 1993).

Figure 4.9. illustrates the individual trough cyclosporine concentrations in whole blood for each
of the three phases of the study.
1 2 3
Study phase4
Figure 4.9: Individual trough cyclosporine concentrations in blood for each of the three phases
of the study (phase 1 = water; phase 2 = grapefruit juice; phase 3 = water). Concentrations in
phase 2 were significantly higher than in either phase 1 or 3 (Ducharme et al, 1993).
4.3.6. The role of P-glycoprotein
Cyclosporine is transported by human p-glycoprotein site (Edwards et al, 1999). It was clearly
indicated by Schinkel & co-workers (1994) that p-glycoprotein played a significant role in the
overall brain penetration and elimination of cyclosporine (Lin et al, 1999). The protective
function of p-glycoprotein is shared with cytochrome P450 enzymes such as CYP3A4, and many
compounds have been identified as substrates or inhibitors of both CYP3A4 and p-glycoprotein.
Fricker & co-workers (1996) found that after administration of cyclosporine at different sites in
the gastrointestinal tract, the absorption of cyclosporine was highly correlated with the quantity
of p-glycoprotein messenger ribonucleic acid (mRNA) at that site (Edwards et al, 1999).
Cyclosporine analogues, PSC 833 and cyclosporine A were found to inhibit the drug-activated
and the basal ATPase activity of p-glycoprotein with high affinity. It was suggested that both
compete with the ATPase stimulators for p-glycoprotein-ATPase by interaction with the same or
overlapping binding site(s). The ATPase inhibito~y effects of these cyclosporine analogues were
independent of their being transported by p-glycoprotein (Watanabe et al, 1997). The affinity for
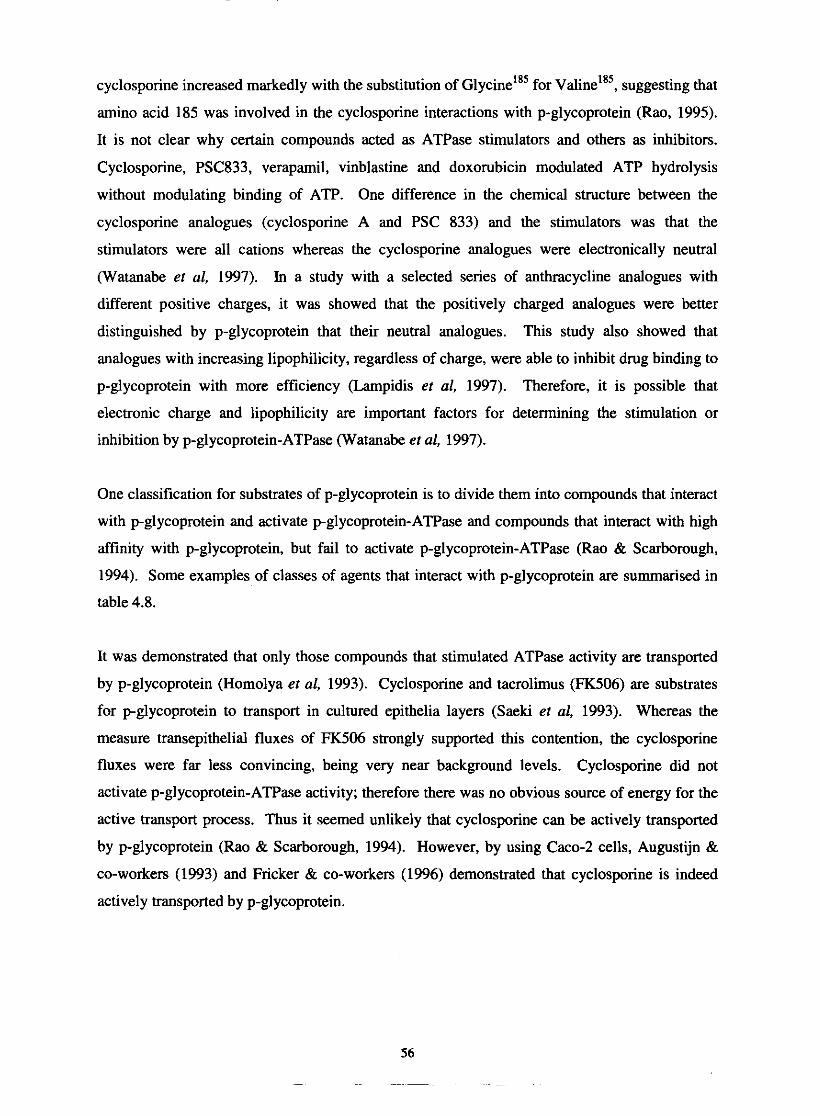
cyclosporine increased markedly with the substitution of ~ l ~ c i n e ' ~ ' for ~aline'~' , suggesting that
amino acid 185 was involved in the cyclosporine interactions with p-glycoprotein (Rao, 1995).
It is not clear why certain compounds acted as ATPase stimulators and others as inhibitors.
Cyclosporine, PSC833, verapamil, vinblastine and doxorubicin modulated ATP hydrolysis
without modulating binding of ATP. One difference in the chemical structure between the
cyclosporine analogues (cyclosporine A and PSC 833) and the stimulators was that the
stimulators were all cations whereas the cyclosporine analogues were electronically neutral
(Watanabe et al, 1997). In a study with a selected series of anthracycline analogues with
different positive charges, it was showed that the positively charged analogues were better
distinguished by p-glycoprotein that their neutral analogues. This study also showed that
analogues with increasing lipophilicity, regardless of charge, were able to inhibit drug binding to
p-glycoprotein with more efficiency (Lampidis et al, 1997). Therefore, it is possible that
electronic charge and lipophilicity are important factors for determining the stimulation or
inhibition by p-glycoprotein-ATPase (Watanabe et al, 1997).
One classification for substrates of p-glycoprotein is to divide them into compounds that interact
with p-glycoprotein and activate p-glycoprotein-ATPase and compounds that interact with high
affinity with p-glycoprotein, but fail to activate p-glycoprotein-ATPase (Rao & Scarborough,
1994). Some examples of classes of agents that interact with p-glycoprotein are summarised in
table 4.8.
It was demonstrated that only those compounds that stimulated ATPase activity are transported
by p-glycoprotein (Homolya et al, 1993). Cyclosporine and tacrolimus (FK506) are substrates
for p-glycoprotein to transport in cultured epithelia layers (Saeki et al, 1993). Whereas the
measure transepithelial fluxes of FK506 strongly supported this contention, the cyclosporine
fluxes were far less convincing, being very near background levels. Cyclosporine did not
activate p-glycoprotein-ATPase activity; therefore there was no obvious source of energy for the
active transport process. Thus it seemed unlikely that cyclosporine can be actively transported
by p-glycoprotein (Rao & Scarborough, 1994). However, by using Caco-2 cells, Augustijn &
co-workers (1993) and Fricker & co-workers (1996) demonstrated that cyclosporine is indeed
actively transported by p-glycoprotein.
azidopine, dihydroperidines
Anthracyclines, e.g. doxomhicin I Anti-arrhythmics, e.g. quinidine, amiodarone
Table 4.8: Agents that interact with p-glycoprotein (Seelig, 1998).
I Others, e.g. mitomycin C, taxol, topotecan, mithramycin I Antihistamines, e.g. terfenadine
Substrates for p-glycnprntein Agents that inhibit p-glymprotein
I
Antimicrotubule drugs, e.g. colchicine, podophyllotoxin
Detergents, e.g. Tween-80 1 Vinca alkaloids, e.g. vinblastine
Increased levels of MDRl and p-glycoprotein were observed in the human colon carcinoma cell
Calcium channel blockers, e.g. verapamil, nifedipine,
Immunosuppressants, e.g. cyclosporine, FK506,
Protein synthesis inhibitors, e.g. puromycin, emetine
DNA intercalators, e.g. ethidium bromide
Toxic peptides, e.g. valinomycin, gramicidin D, N-
acetyl-leucyl-norleucinal (ALLN)
line, LS 180, and its drug-resistant subline after treatment with verapamil, nifedipine,
rapamycin
Steroid hormones, e.g. progesterone
Diterpenes, e.g. forskolin
Modified steroids, e.g. tirilaza, tamoxifen
Lipophilic cations, e.g. tetraphenylphosphonium
Antidepressants, e.g. tioperidone - Antipsychotics, e.g. phenothizines
nicardipine, diltiazern and cyclosporine. Quinidine and chlorpromazine did not increase the
levels of MDRl and p-glycoprotein (Herzog et al, 1993). Verapamil, nifedipine, cyclosporine,
quinidine and chlorpromazine are p-glycoprotein antagonists (Gottesman & Pastan, 1993).
Treatment with cyclosporine at therapeutic concentrations also increased p-glycoprotein
expression and transport function in human arterial endothelial and rat proximal tubule cells.
However, treatment with another immunosuppressive drug, FK506, did not change p-
glycoprotein expression at therapeutic concentrations, but at higher supratherapeutic
concentrations of FK506, p-glycoprotein expression was also increase in both cell lines (Hauser
et a1 1998). After rats were treated with cyclosporine, p-glycoprotein levels were increased in
the kidney, intestine, liver, stomach, heart, lung, testis and spleen. However, the administration
of cyclosporine did not alter the level of p-glycoprotein expression in brain tissue. The induction
of p-glycoprotein overexpression was a reversible process, since after cessation of cyclosporine
administration, p-glycoprotein levels steadily declined in all tissues (Jett6 et al, 1996).
Cyclosporine and MS-209 specifically bind to p-glycoprotein, thereby reducing drug transport
mediated by this compound. Inhibition by cyclosporine was assessed by Terao & co-workers
(1996) by simultaneous intravenous administration of cyclosporine while measuring intestinal
absorption by the in-situ jejunal loop method. Cyclosporine is an effective inhibitor of p-
glycoprotein with a relatively low inhibitory constant of about 0.08 pM. From the
pharmacokinetic parameters reported and the plasma-unbound fraction of cyclosporine at steady-
state in rats, the expected intestinal epithelial-free concentration of cyclosporine at steady-state is
more that 0.4 pM according to the dosage schedule used in their study. Accordingly, the
function of p-glycoprotein-mediated transport of the test compounds should be significantly
disrupted by cyclosporine. Intestinal absorption of acebutalol and vinblastine increased 2.6 and
2.2 times, respectively, in response to administration of cyclosporine, whereas acetamide
absorption was unaffected. Accordingly, it can be said that p-glycoprotein contributes
significantly to the reduction of intestinal epithelial permeability (Terao et al, 1996).
4.4. Pharmacological actions
The pharmacological effects of cyclosporine are mostly immunosuppressive and can be
summarised as follows:
4.4.1. Effects on T cells
Cyclosporine reversibly inhibits T-cell-mediated allo- and autoimmune responses. The
inhibition of helper-inducer and cytotoxic T-cell activities by cyclosporine, along with its
promotion of suppressor-cell function, causes immunoregulatory disequilibrium, which sets the
stage for unresponsiveness rather than immunity (Kahan, 1989).
4.4.2. Effects on thymus
Cyclosporine not only decreases the total number of thymocytes but also aborts intrathymic T-
cell development (Kahan, 1989).
4.4.3. Effects on fl cells
The conclusion that cyclosporine spares T-cell-independent, antibody-mediated immunity is
based on the failure of the drug to inhibit antilipopolysaccharide (Type I) responses. However,
cyclosporine inhibits B-cell responses to some T-cell-independent (Type 2) antigens - namely,
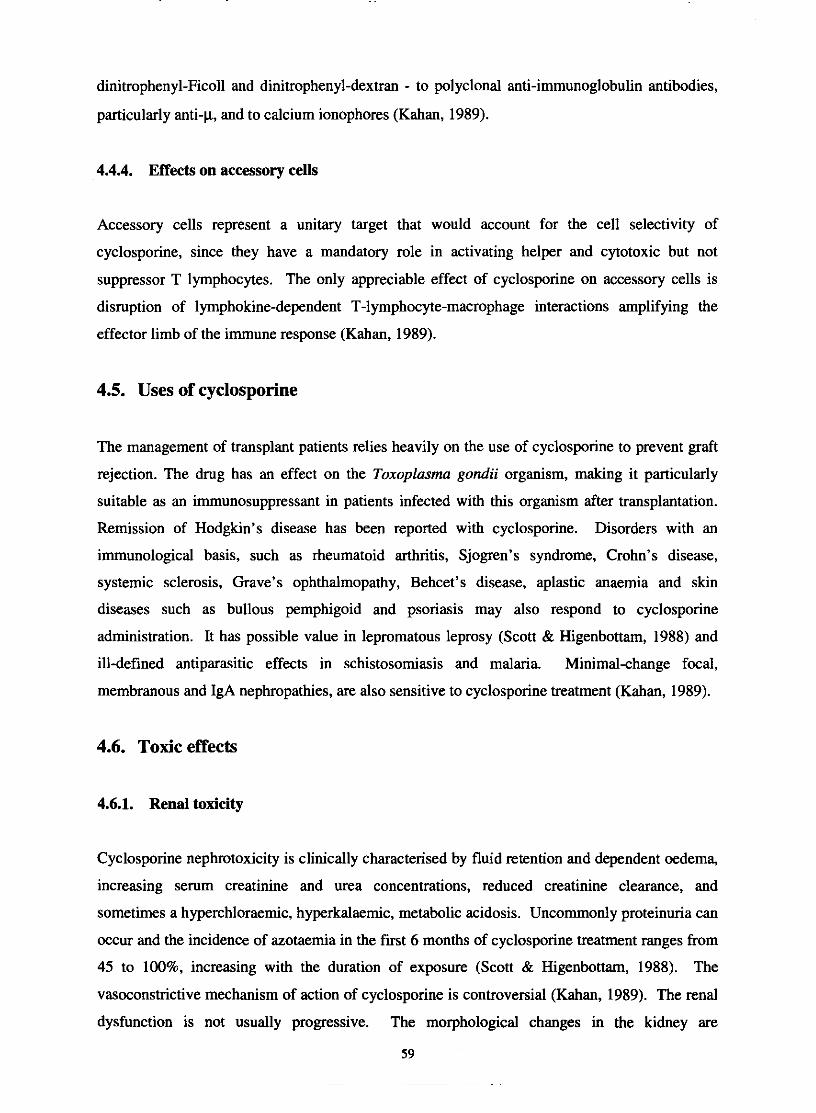
dinitrophenyl-Ficoll and dinitrophenyl-dextran - to polyclonal anti-immunoglobulin antibodies,
particularly anti-p, and to calcium ionophores (Kahan, 1989).
4.4.4. Effects on accessory cells
Accessory cells represent a unitary target that would account for the cell selectivity of
cyclosporine, since they have a mandatory role in activating helper and cytotoxic but not
suppressor T lymphocytes. The only appreciable effect of cyclosporine on accessory cells is
disruption of lymphokine-dependent T-lymphocyte-macrophage interactions amplifying the
effector limb of the immune response (Kahan, 1989).
4.5. Uses of cyclosporine
The management of transplant patients relies heavily on the use of cyclosporine to prevent graft
rejection. The drug has an effect on the Toxoplasma gondii organism, making it particularly
suitable as an immunosuppressant in patients infected with this organism after transplantation.
Remission of Hodgkin's disease has been reported with cyclosporine. Disorders with an
immunological basis, such as rheumatoid arthritis, Sjogren's syndrome, Crohn's disease,
systemic sclerosis, Grave's ophthalmopathy, Behcet's disease, aplastic anaemia and skin
diseases such as bullous pemphigoid and psoriasis may also respond to cyclosporine
administration. It has possible value in lepromatous leprosy (Scott & Higenbottam, 1988) and
ill-defined antiparasitic effects in schistosomiasis and malaria. Minimal-change focal,
membranous and IgA nephropathies, are also sensitive to cyclosporine treatment (Kahan, 1989).
4.6. Toxic effects
4.6.1. Renal toxicity
Cyclosporine nephrotoxicity is clinically characterised by fluid retention and dependent oedema,
increasing serum creatinine and urea concentrations, reduced creatinine clearance, and
sometimes a hyperchloraemic, hyperkalaemic, metabolic acidosis. Uncommonly proteinuria can
occur and the incidence of azotaemia in the first 6 months of cyclosporine treatment ranges from
45 to 100%, increasing with the duration of exposure (Scott & Higenbottam, 1988). The
vasoconstrictive mechanism of action of cyclosporine is controversial (Kahan, 1989). The renal
dysfunction is not usually progressive. The morphological changes in the kidney are
59
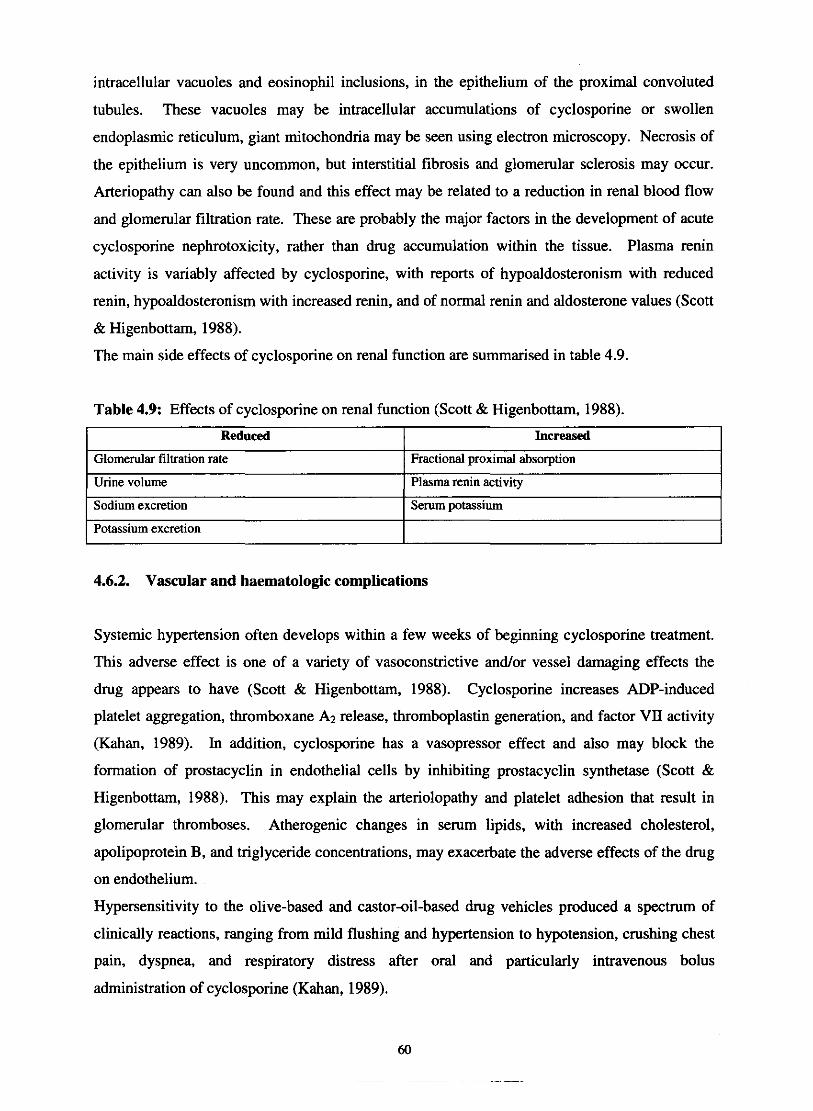
intracellular vacuoles and eosinophil inclusions, in the epithelium of the proximal convoluted
tubules. These vacuoles may be intracellular accumulations of cyclosporine or swollen
endoplasmic reticulum, giant mitochondria may be seen using electron microscopy. Necrosis of
the epithelium is very uncommon, but interstitial fibrosis and glomerular sclerosis may occur.
Arteriopathy can also be found and this effect may be related to a reduction in renal blood flow
and glomerular filtration rate. These are probably the major factors in the development of acute
cyclosporine nephrotoxicity, rather than drug accumulation within the tissue. Plasma renin
activity is variably affected by cyclosporine, with reports of hypoaldosteronism with reduced
renin, hypoaldosteronism with increased renin, and of normal renin and aldosterone values (Scott
& Higenbottam, 1988).
The main side effects of cyclosporine on renal function are summarised in table 4.9.
Table 4.9: Effects of cyclosporine on renal function (Scott & Higenbottam, 1988).
Reduced I Increased I
Glome~kU filtration rate I Fractional proximal absorption
Urine volume 1 Plasma renin activity
Sodium excretion I Serum potassium
Potassium excretion
4.6.2. Vascular and haematologic complications
Systemic hypertension often develops within a few weeks of beginning cyclosporine treatment.
This adverse effect is one of a variety of vasoconstrictive andor vessel damaging effects the
drug appears to have (Scott & Higenbottam, 1988). Cyclosporine increases ADP-induced
platelet aggregation, thromboxane A2 release, thromboplastin generation, and factor VII activity
(Kahan, 1989). In addition, cyclosporine has a vasopressor effect and also may block the
formation of prostacyclin in endothelial cells by inhibiting prostacyclin synthetase (Scott &
Higenbottam, 1988). This may explain the arteriolopathy and platelet adhesion that result in
glomerular thromboses. Atherogenic changes in serum lipids, with increased cholesterol,
apolipoprotein B, and triglyceride concentrations, may exacerbate the adverse effects of the drug
on endothelium.
Hypersensitivity to the olive-based and castor-oil-based drug vehicles produced a spectrum of
clinically reactions, ranging from mild flushing and hypertension to hypotension, crushing chest
pain, dyspnea, and respiratory distress after oral and particularly intravenous bolus
administration of cyclosporine (Kahan, 1989).
4.6.3. Neurologic and dermal complications
Although cyclosporine is not believed to cross the blood-brain barrier, neurologic side effects
occur in about 20 % of transplant patients.
The most common neurological side effects can be seen in table 4.10.
Table 4.10: Neurological side effects of cyclosporine (Scott & Higenbottam, 1988).
Seizures of new onset may be triggered by hypocbolesterolemia, hypertension (particularly in
children), intravenous methylprednisolone therapy, hypomagnesemia, infection, haemorrhage, or
cerebral infarction. Visual disorders, paresis, disorientation, and coma improve when
cyclosporine treatment is discontinued, but recur when it is reinstituted (Scott & Higenbottam,
1988).
Common
Tremor Burning palmar and plantar paresthesias Headache Flushing Depression Somnolence Irritability Confusion Neuropathies Siezures Visual hallucinations
4.6.4. Hepatic toxicity
Uncommon
Encephalopathy Cerebellar disorers Spinal cord syndromes Expressive aphasia Amnesia Mania
Cholestasis with hyperbilirubinemia (Kahan, 1989), raised levels of alakaline phosphatase and
aminotransferases can occur within the first few weeks of treatment with cyclosporine in some
patients (Scott & Higenbottam, 1988). Cyclosporine alters calcium fluxes across hepatocyte cell
membranes in vitro, elevates serum bile acids, and decreases bile flow (Kahan, 1989).
Morphological changes have been seen when cyclosporine and oral contraceptives were
combined (Scott & Higenbottam, 1988).
4.6.5. Respiratory side effects
Acute respiratory distress syndrome is the main respiratory side effect during cyclosporine use.
Several cases of pulmonary oedema, for which a capillary leak syndrome, probably related to the
cremophor EL vehicle for the intravenous form of cyclosporine, has been postulated (Scott &
Higenbottam, 1988).
4.6.6. Cardiac toxicity
There are reports of 'benign' myocardial fibrosis and of pericardial effusion. Scattered
interstitial infiltrates of lymphocytes are commonly seen on endomyocardial biopsies of heart
transplant patients taking cyclosporine and may be unrelated to rejection. Amorphous fibrous
material may be seen in the interstitium (Scott & Higenbottam, 1988).
4.6.7. Ophthalmic toxicity
Toxic retinopathy has been reported in a patient on cyclosporine with a loss of visual acuity,
cotton wool spots, intraretinal and preretinal haemorrhages and macular oedema. The patient
was normotensive and an embolism in a branch of the retinal artery has also been described
(Scott & Higenbottam, 1988).
4.6.8. Metabolic and humoral toxicity
Metabolic changes induced by cyclosporine include hyperkalaemia, hypomagnesaemia,
hyperchloraemic metabolic acidosis, hypemricaemia, hypercholesterolaemia
hypertriglyceridaemia and glucose intolerance.
Cyclosporine competes with prolactin for prolactin lymphocyte receptors and also blocks
production of thyroid receptor antibodies in Grave's disease (Scott & Higenbottam, 1988).
Cyclosporine occasionally produces hyperglycaemia (Kahan, 1989). In high doses cyclosporine
reduces insulin production in pancreatic j3 cells, in standard doses cyclosporine can reduce
insulin requirements in recent onset insulin-dependent diabetes mellitus (Scott & Higenbottam,
1988). Cyclosporine decreases testosterone levels, causing gynecomastia in men and impairing
spermatogenesis or sperm maturation in rats, with direct damage to Leydigcell mitochondria
(Kahan, 1989).
4.6.9. Gastrointestinal complications
The frequently reported anorexia, bloating, nausea, or vomiting that follows the ingestion of the
unpalatable suspension of oral cyclosporine may be ameliorated by placing the drug into soft
gelatin capsules immediately before use. Cyclosporine has no direct toxic effects on the
structure of function of gastrointestinal mucosa. Acute pancreatitis is no more frequent or severe
when transplant recipients area given cyclosporine than when they receive other
immunosuppressive agents (Kahan, 1989).
4.6.10. Effect on bone
Elevated serum levels of the skeletal alkaline phosphatase isoenzyme may be the cause of
increased bone formation. The remodelling activity is also enhanced. In rats, cyclosporine
causes dose- and duration-dependent osteoporosis with high turnover. All of these effects are
independent of serum calcium, magnesium, and calciotropic hormone levels (Kahan, 1989).
4.6.11. Cyclosporine-related malignancy and infections
Both malignancy, particularly of the skin and lymphoreticular system and opportunistic
infections, particularly cytomegalovirus, herpes simplex (and zoster) and Pneumocystis carinii,
can develop whilst patients are treated with cyclosporine (Scott & Higenbottam, 1988).
4.7. References
AKHLAGHI, F., KEOGH, A.M., MCLACHLAN, A.J. & KAAN, A. (2001). Pharmacokinetics
of cyclosporine in heart transplant recipients receiving metabolic inhibitors. The journal of
heart and lung transplantation, 20(4):431-438.
AUGUSTUNS, P.F., BRADSHAW, T.P., GAN, L-S.L., HENDREN, R.W. & THAKKER, D.R.
(1993). Evidence for a polarized efflux system in Caco-2 cells capable of modulating
cyclosporin A transport. Biochemical and biophysical research communications, 197:360-365.
BAILEY, D.G., MALCOLM, J., ARNOLD, 0. & SPENCE, D.J. (1994). Grapefruit juice and
drugs: How significant is the interaction? Clinicalpharmacokinetics, 26(2):91-98.
DUCHARME, M.P., PROVENZANO, R., DEHOORNE-SMmH, M. & EDWARDS, D.J.
(1993). Trough concentrations of cyclosporine in blood following administration with grapefruit
juice. British journal of clinicalpharmacology, 36:457-459.
DUCHARME, M.P., WARBASSE, L.H. & EDWARDS, D.J. (1995). Disposition of
intravenous and oral cyclosporin after administration with grapefruit juice. Clinical
pharmacology and therapeutics, 57(5):485-49 1.
EAGLING, V.A., PROFlT, F. & BACK, D.J. (1999). Inhibition of the CYP3A4-mediated
metabolism and p-glycoprotein-mediated transport of the HIV-I protease inhibitor saquinavir by
grapefruit juice components. British journal of clinicalpharmacology, 48543-552.
EDWARDS, D.J., FITZSIMMONS, M.E., SCHUETZ, E.G., YASUDA, K., DUCHARME,
M.P., WARBASSE, L.H., WOSTER, P.M., SCHUETZ, J.D. & WATKINS, P. (1999). 6',7'-
Dihydroxybergamottin in grapefruit juice and seville orange juice: Effects on cyclosporine
disposition, enterocyte CYP3A4, and p-glycoprotein. Clinical pharmacology and therapeutics,
65(3):237-244.
FAHR, A. (1993). Cyclosporin clinical pharmacokinetics. Clinieal pharmacokinetics,
24(6):473-495.

FRICKER, G., DREWE, J., HUWYLER, J., GUTMANN, H. & BEGLINGER, C. (1996).
Relevance of P-glycoprotein for the enteral absorption of cyclosporin A: in vitro-in vivo
correlation. British journal of pharmacology, 1 18: 1841 - 1847.
GOTTESMAN, M.M. & PASTAN, I. (1993). Biochemistry of mukidrug resistance mediated
by the multidrug transporter. Annual reviews of biochemistry, 62:385-427.
GREVEL, J. (1988). Significance of cyclosporine pharmacokinetics. Transplantation
proceedings, 20(2):428-434.
HAUSER, LA., KOZIOLEK, M., HOPER, U. & T ~ V E N O D , F. (1998). Therapeutic
concentrations of cyclosporine A, but not FK506, increase P-glycoprotein expression in
endothelial and renal tubule cells. Kidney international, 54: 1139-1 149.
HERZOG, C.E., TSOKOS, M., BATES, S.E. & FOJO, A.T. (1993). Increased mdr-1P-
glycoprotein expression after treatment of human colon carcinoma cells with P-glycoprotein
antagonists. Journal of biological chemistry, 268:2946-2952.
HOMOLYA, L., HOLL6, Z., GERMANN, U.A., PASTAN, I., GOlTESMAN, M.M. &
SARKADI, B. (1993). Fluorescent cellular indicators are extruded by the multidrug resistance
protein. Journal of biological chemistry, 268:21493-21496.
J E ~ , L., BEAULIEU, E., LECLERC, J-M. & BELIVEAU, R. (1996). Cyclosporin: A
treatment induces overexpression of P-glycoprotein in the kidney and other tissues. American
journal ofphysiology, 270:F756-F765.
JONES, T.E. (1997). The use of other drugs to allow a lower dosage of cyclosporin to be used.
Therapeutic and pharmacoeconomic considerations. Clinicalphannaeokinetics, 32(5):357-367.
KAHAN, B.D. (1989). Cyclosporine. The new England journal of medicine, 321(25):1725-
1738.
KAHAN, B.D., RED, M. & NEWBURGER, J. (1983). Pharmacokinetics of cyclosporine in
human renal transplantation. Transplantation proceedings, 15(1):446-453.

KOLARS, J.C., AWNI, W.M., MERION, R.M. & WATKINS, P.B. (1991). First-pass
metabolism of cyclosporin by the gut. Lancet, 338:1488-1490.
KRONBACH, T., FISCHER, V & MEYER, U.A. (1988). Cyclosporine metabolism in human
liver: Identification of a cytochrome P-450111 gene family as the major cyclosporine-
metabolising enzyme explains interactions of cyclosporine with other drugs. Clinical
pharmacology and therapeutics, 43(6):630-635.
LAMPIDIS, T.J., KOLONIAS, D., PDODNA, T., ISRAEL, M., SAFA, A.R., LOTHSTEIN, L.,
SAVARAGJ, N., TAPIERO, H. & PRIEBE, W. (1997). Circumvention of P-GP MDR as a
function of anthracycline lipophilicity and charge. Biochemistry, 36:2679-2685.
LEMAIRE, M., FAHR, A. & MAURER, G. (1990). Pharmacokinetics of cyclosporine: Inter-
and intra-individual variations and metabolic pathways. Transplantation proceedings,
22(3):1110-1112.
LIN, J.H., CHIBA, M. AND BAILLIE, T.A. (1999). Is the role of the small intestine in first-
pass metabolism overemphasized? Pharmacological reviews, 5 l(2): 135-1 57.
LINDHOLM, A,, HENRICSSON, S., LIND, M. & DAHLQVIST, R. (1988). Intraindividual
vairability in the relative systemic availability of cyclosporin after oral dosing. European
journal of clinicalphannacology, 34461-464.
LOWN, K.S., MAYO, R.R., LEICHTMAN, A.B., HSIAO, H-L., TURGEON, K.,
SCHMIEDLIN-REN, P., BROWN, M.B., GUO, W., ROSSI, S.J., BENET, L.Z. & WATKINS,
P.B. (1997). Role of intestinal P-glycoprotein (mdrl) in interpatient variation in the oral
bioavailability of cyclosporin. Clinicalpharmacology and therapeutics, 62(3):248-260.
MAURER, G. (1985). Metabolism of cyclosporine. Transplantation proceedings, 17(4): 19-
26.
MAURER, G. & LEMAIRE, M. (1986). Biotransformation and distribution in blood of
cyclosporin and its metabolites. Transplantation proceedings, 18(6):25-34.

MCDONALD, M.L., ARDITO, T., MARKS, W.H., KASHGARIAN, M. & LORBER, M.I.
(1992). The effect of cyclosporin administration on the cellular distribution and content of
cyclophilin. Transplantation, 53(2):460-466.
RAO, U.S. (1995). Mutation of glycine 185 to valine alters the ATPase function of the human
P-glycoprotein expressed in Sf9 cells. Journal of biological chemistry, 270:6686-6690.
RAO, U.S. & SCARBOROUGH, G.A. (1994). Direct demonstration of high affinity
interactions of immunosuppressant drugs with the drug binding site of the human P-glycoprotein.
Molecularpharmacology, 45:773-776.
RYFFEL, B., WOERLY, G., GREINER, B., HAENDLER, B., MIHATSCH, M.J. &
FOXWELL, B.M.J. (1991). Distribution of the cyclosporin binding protein cyclophilin in
human tissues. Immunology, 72:399-404.
SAEKI, T., UEDA, K., TANIGAWARA, Y., HORI, T. & KOMANO, T. (1993). Human P-
glycoprotein transports cyclosporin A and FK506. Journal of biological chemistry, 268:6077-
6080.
SCHINKEL, A.H., SMIT, J.J.M., VAN TELLINGEN, O., GEUNEN, J.H., WAGENAAR, E.,
VAN DEEMTER, L., MOL, C.A.A.M., VAN DER VALK, M.A., ROBAANS-MAANDAG,
E.C., TE RIELE, H.P.J., BERNS, A.J.M. & BORST, P. (1994). Disruption of mouse mdrla p-
glycoprotein gene leads to a deficiency in the blood-brain barrier and to increased sensitivity to
drugs. Cell, 77:491-502.
SEELIG, A. (1998). A general pattern for substrate recognition by P-glycoprotein. European
journal of biochemistry, 251 :252-261.
SCOTT, J.P. & HIGENBOTTAM, T.W. (1988). Adverse reactions and interactions of
cyclosporin. Medical toxicology, 3:107-127.
TERAO, T., HISANAGA, E., SAI, Y., TAMAI, I. & TSUJI, A. (1996). Active secretion of
drug from the small intestinal epithelium in rats by P-glycoprotein functioning as an absorption
barrier. Journal of pharmacy andpharmacology, 48:1083-1089.

THUMMEL, K.E., SHEN, D.D., PODOLL, T.D., KUNZE, K.L., TRAGER, W.F.,
HARTWELL, P.S. (1994). Use of midazolam as a human cytochrome P450 3A probe; I: in
vitro-in vivo correlations in liver transplant patients. The journal of pharmacology and
experimental therapeutics, 271:549-556.
WATANABE, T., KOKOUBU, N., CHARNICK, S.B., NAITO, M., TSURUO, T. & COHEN,
D. (1997). Interaction of cyclosporin derivatives with the ATPase activity of human P-
glycoprotein. British journal of pharmacology, 122:241-248.
WIDEMAN, C.A. (1983). Phannacokinetic monitoring of cyclosporine. Transplantation
proceedings, 15(4):3 168-3 175.
5. Analytical methods
The plasma blood sample levels of both methoxsalen and cyclosporine were determined in this
study. Methoxsalen was analysed at the Department of Pharmacology, Potchefstroom
University, using a high-pressure liquid chromatographic method (HPLC) and cyclosporine
using a fluorescence polarization immunoassay method (FHA). The cyclosporine analysis was
performed at the Department of Pharmacology, MEDUNSA. These two methods will be
discussed in this chapter.
5.1. Method validation
Method validation has to do with the certainty that a process of procedure is performing
consistently and is capable of delivering previously specified results accurately. Method
validation ensures that results are reliable and reproducible (Shah et al, 1992).
In the development of HPLC methods and specific with the method used in this study, the
following is recorded during validation:
5.1.1. Linearity
Linearity is the capability of the analytical method to produce results that are directly
proportional to the concentration of the analyte before or after mathematical transformation. The
linear range is generally taken as the range over which the procedure has been demonstrated to
give linear detector response and in the range of the expected levels (Shah et al, 1992).
5.1.2. Range
The range is the interval between the lowest and highest concentration of the analyte that has
been determined with the prescribed accuracy, precision and linearity (Jordaan et a1 2000).
5.13. Accuracy
Accuracy is the extend to which the experimental results correlate with the theoretical values
(Shah et al, 1992). A procedure is accurate if, on the average, the method provides the true
answer. Accuracy can also be determined as percentage recovery. Both blank serum and blank
69
water samples were spiked with a known concentration of 8-Methoxypsoralen (8-MOP). The
spiked samples, serum and water were extracted and analysed. The difference between the water
samples (theoretical value) and the experimental values of the spiked serum samples is an
indication of the extraction efficiency or recovery.
5.1.4. Precision (repeatability)
Precision means that the individual results of a specific method can be repeated after multiple
sampling of the same sample and under certain presented conditions. Repeatability can also be
defined as the variability within a given laboratory and can be affected by such factors as the
analyst, environmental conditions or laboratory equipment (Jordaan et al, 2000). Repeatability
can be further subdivided into within-day I intra-assay repeatability and between-day I inter-
assay repeatability (Shah et al, 1992).
5.1.5. Specificity
Specificity can be defined as the ability of an assay to assess unequivocally the analyte of interest
in the presence of compounds, which might be expected to be in the sample (Jordaan et al,
2000).
The robustness of an analytical procedure is a measure of its capacity to remain unaffected by
small, but deliberate variations in method parameters and provides an indication of its reliability
during normal use (Jordaan et al, 2000).
5.1.7. L i t of detection
The limit of detection means the lowest amount that can be differentiated reliably from
background levels, but not necessarily quantified by an analytical procedure (Shah et al, 1992).
It can be determined as the amount of analyte that will give a peak twice the height of the
baseline noise.
5.1.8. Limit of quantification
The limit of quantification can be defined as the lowest amount of analyte that can be detected
and quantified with a stated level of confidence as measured by precision and accuracy (Shah et
al, 1992).
5.2. HPLC method
Analysis of 8-MOP in pig plasma.
5.2.1. Experimental procedures
5.2.1.1. Materials
8-Methoxypsoralen and 4,5',8-trimethylpsoralen were bought from SIGMA CHEMICAL CO.,
P.O. Box 14508 ST. Louis, MO 63178 USA.
5.2.1.2. Instrumentation
8-MOP was analysed with a fully automated HPLC-system (G2175 AA 3D Chemstation)
consisting of the following:
Agilent I100 Series Autosampler (200*343*435 mm).
Agilent I100 Series G1322A vacuum degasser (30W).
Agilent 1100 Series GI31 1A Quaternary pump.
Agilent 1100 Series GI3 l5B Diode.
Multiple wavelength detector (DAD), operated at 254 and 300 nm.
Personal computer for data manipulation. Product number: G21765AA from Agilent
technologies.
Luna C18 (250x4.6 mm, 5 pm), reversed phase Phenomenex column.
5.2.1.3. Glassware
The glassware were washed with 7XPF cleaning solution from ICN biochemical technologies
inc., rinsed with de-ionised, distilled, filtered water to remove all impurities as well as acetone-
water before drying at 100 OC for 15 minutes.
5.2.2. Standard solutions of 8-MOP
A mother and daughter solution were prepared. The mother solution were freshly prepared each
week and stored at 0 OC. The daughter solutions were freshly prepared from the mother solution
each day. Each standard mother solution was prepared by weighing 1 mg of 8-MOP and diluting
it to 10 ml with 2 ml HPLC-grade acetonitrile and 8 ml distilled water in a 10 ml volumetric
flask giving a concentration of 100 pg/ml. The daughter solution was prepared by diluting 100
pl of the mother solution to 10 ml with distilled water giving a concentration of 1000 qgtml.
5.2.3. Standard solutions of TMP
A standard solution was prepared by weighmg 1 mg of TMP and diluting it to 10 ml with HPLC-
grade acetonitrile in a 10 ml volumetric flask giving a concentration of 100 pgtml. Of this
solution, 100 pl were diluted to 10 ml with HPLC-grade acetonitrile in a 10 ml volumetric flask
giving a concentration of 1000 qgtml. 300 pl of this solution were added to each 500 p1 plasma
sample as internal standard to acquire a concentration of 1000 qg TMPIml plasma.
5.2.4. Liquid extraction
300 pl of the internal standard (1000 qg TMPIml plasma) and 2 ml of HPLC-grade acetonitrile
were added to the 500 p1 plasma sample in a centrifuge tube and shaken for 2 minutes at room
temperature. The sample was centrifuged for 10 minutes at 1000 g. The clear supernatant was
transferred into another tube were 3 ml of a 60:40 n-Hexane:Chloroform were added. The
samples were shaken for 2 minutes, centrifuged at 1000 g for 10 minutes and then the clear
organic phase were transferred to another tube and evaporated at 40 OC in a water bath under dry
nitrogen. Prior to HPLC the residue was redissolved in 125 p1 of the mobile phase (4555
ammonium acetate buffer pH 5:acetonitrile HPLC-grade) and 100 pl were injected.

5.25. Standard curves
The ratio (AUCS-MO~~AUC-) was measured in this study, where 8-MOP (AUC8.~0p) is the
assayed compound and TMP (AUCW). the internal standard. The standard curves were
constructed by plotting the ratios against the 8-MOP concentrations. To construct a standard
curve, nine pig plasma samples were required. One of these plasma samples Served as a blank
(Blank 1) and was prepared according to the method described in section 5.2.4.
The tables in Appendix 1 of linearity demonstrate the origin of the values for the x- and y-axes
of the standard curve and figure 5.1. is an example of typical standard curves utilised in the
study. The curves is defined by the following equation:
y = m x + c
Where
y = AUCS.MOP/AUC-
x = concentration of 8-MOP in qg/d
m = slope of linear curve
c = y-intercept of linear curve
5.2.6. Validation results
The raw data as compiled for validation can be seen in Appendix 1.
5.2.6.1. Linearity and range
The concentration range of the linear curves was chosen the same as that for the standard curves
namely 5.0 to 1000 qg/ml.
Acceptance criteria for linearity differ from researcher to researcher. The correlation coefficient
of the best linear least squares regression model should usually be between 0.98 and 1.00. Since
we analysed biological materials, we set our acceptance level at 0.98.
The procedure and calculations for determining linearity was exactly the same as for the standard
curves, assessing nine pig plasma samples: one blank and eight standards with different
concentrations (5 qg/ml, 10 qgtrnl, 25 qg/ml, 50 qg/ml, 100 qg/ml, 250 qg/ml, 500 qglml and

1000 qglml plasma respectively). Table 5.2.6.1. contains the results for three linear curves. The
agreement between the curves was determined by calculating a mean, SD and %CV for the
regression coefficients, slopes and y-intercepts of the three curves (Figure 5.1). Since the
regression coefficient of each linear curve was greater than 0.98 and the agreement between the
linear curves were good (%CV = 0.0644% for the regression coefficients and 0% for the slopes),
the linearity of the method was considered as acceptable for this study. The relative large CV
(9.6656 %) of the y-intercept values is not significant due to the very small order of magnitude
of these values.
Table 5.2.6.1: Determination of linearity within the chosen range
Linear curve 1
Linear curve 2
a Linear curve 1
Concentration
range W m l )
Linear curve 1
Linear curve 2
Linear curve 3
Figure 5.1: Graphic comparison of linear curve
5.2.6.2. Accuracv
Accuracy was determined by preparing 3 replici
,2 and 3.
:s of four differel
Regression
coefficient
5-1000
5-1000
5-1000
it concentrations respectivt
Mean (n=3)
:ly
- 10 qglml, 50 qg/ml, 500 qglml and 1000 qgtml. The true concentrations were calculated
Slope
0.9996
0.9994
0.9984
theoretically from the standard 8-MOP solutions.
Y-intercept
0.9991
0.0018
0.0018
0.0018
0.00%
0.0103
0.01 16
0.0018 0.0105
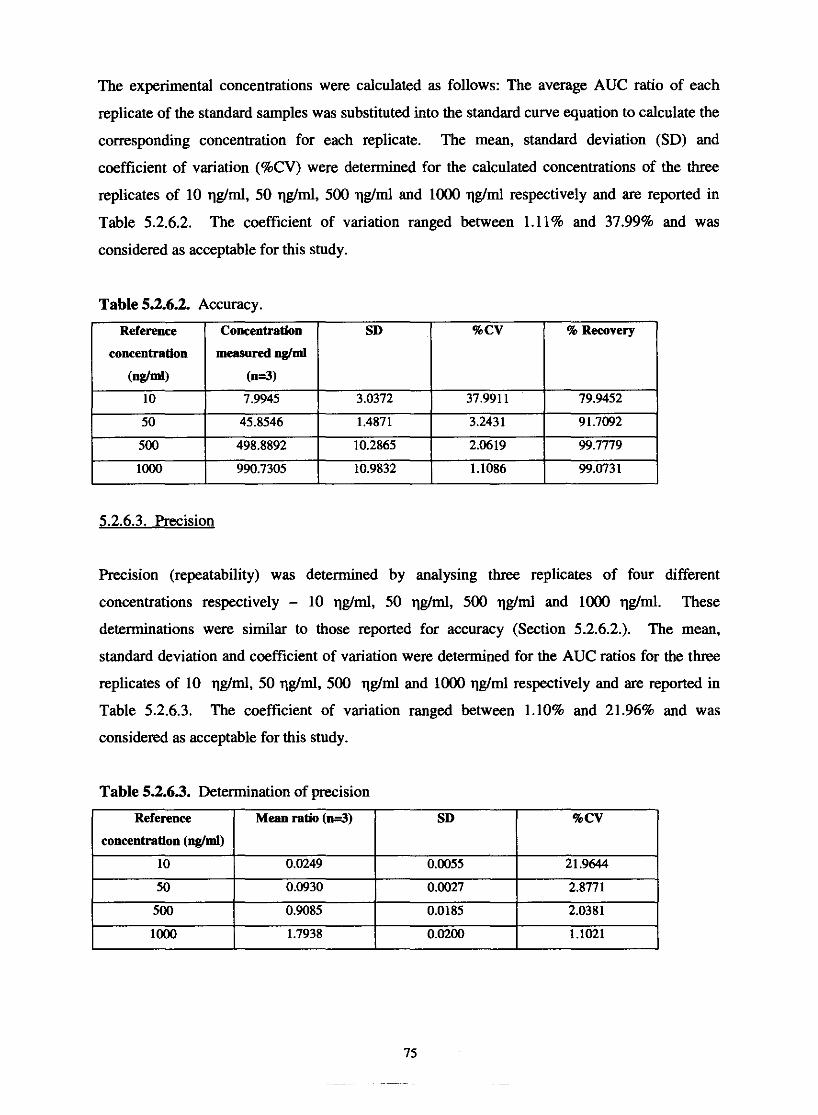
The experimental concentrations were calculated as follows: The average AUC ratio of each
replicate of the standard samples was substituted into the standard curve equation to calculate the
corresponding concentration for each replicate. The mean, standard deviation (SD) and
coefficient of variation (%CV) were determined for the calculated concentrations of the three
replicates of 10 qg/ml, 50 qg/ml, 500 qghl and 1000 qg/ml respectively and are reported in
Table 5.2.6.2. The coefficient of variation ranged between 1.11% and 37.99% and was
considered as acceptable for this study.
Table 5.2.6.2. Accuracy.
5.2.6.3. Precision
Precision (repeatability) was determined by analysing three replicates of four different
concentrations respectively - 10 qg/ml, 50 qgtml, 500 qglml and 1000 qg/ml. These
determinations were similar to those reported for accuracy (Section 5.2.6.2.). The mean,
standard deviation and coefficient of variation were determined for the AUC ratios for the three
replicates of 10 qg/ml, 50 qg/ml, 500 qg/ml and 1000 qg/ml respectively and are reported in
Table 5.2.6.3. The coefficient of variation ranged between 1.10% and 21.96% and was
Reference
concentration
(ng/ml) 10
50
500
loo0
considered as acceptable for this study.
Concentration
measured &lml
(n=3
7.9945
45.8546
498.8892
990.7305
% Recovery
79.9452
91.7092
99.7779
99.0731
SD
3.0372
1.4871
10.2865
10.9832
%CV
37.991 1
3.2431
2.0619
1.1086
Table 5.2.63. Determination of precision
Reference
concentration (ng/ml)
10
50
500
loo0
Mean ratio ( n d )
0.0249
0.0930
0.9085
1.7938
SD
0.0055
0.0027
0.0185
0.0200
%CV
21.9644
2.8771
2.0381
1.1021

Baseline separation can be seen as a critenum for specificity. A series of chromatograms were
prepared to visually compare them for interfering peaks near the peaks of interest - 8-MOP
(retention time = 6.2 min) and TMP (retention time z 14.0)(Figure 5.2 to 5.7).
The mobile uhase (45% ammonium acetate buffer. uH 5:55% acetonitrile).
An aliquot of 100 pl mobile phase was injected into the HPLC. The resulting chromatogram
(Figure 5.2.) registered a single peak at ~1 .938 min. The peak did not interfere with the peaks of
8-MOP and TMP.
Figure 5.2: HPLC chromatogram of the mobile phase (45% ammonium acetate buffer, pH
555% acetonitrile).
The solvents (uure, distilled water and 100% HPLC-wade aceronitrilel
An aliquot of 100 p1 pure, distilled water and 100 pl 100% HPLC-grade acetonitrile were
injected into the HPLC. The latest eluting peak on the resulting chromatogram (Figure 5.3. and
5.4.) was at z 2min. These peaks did not interfere with the peaks of 8-MOP and TMP.
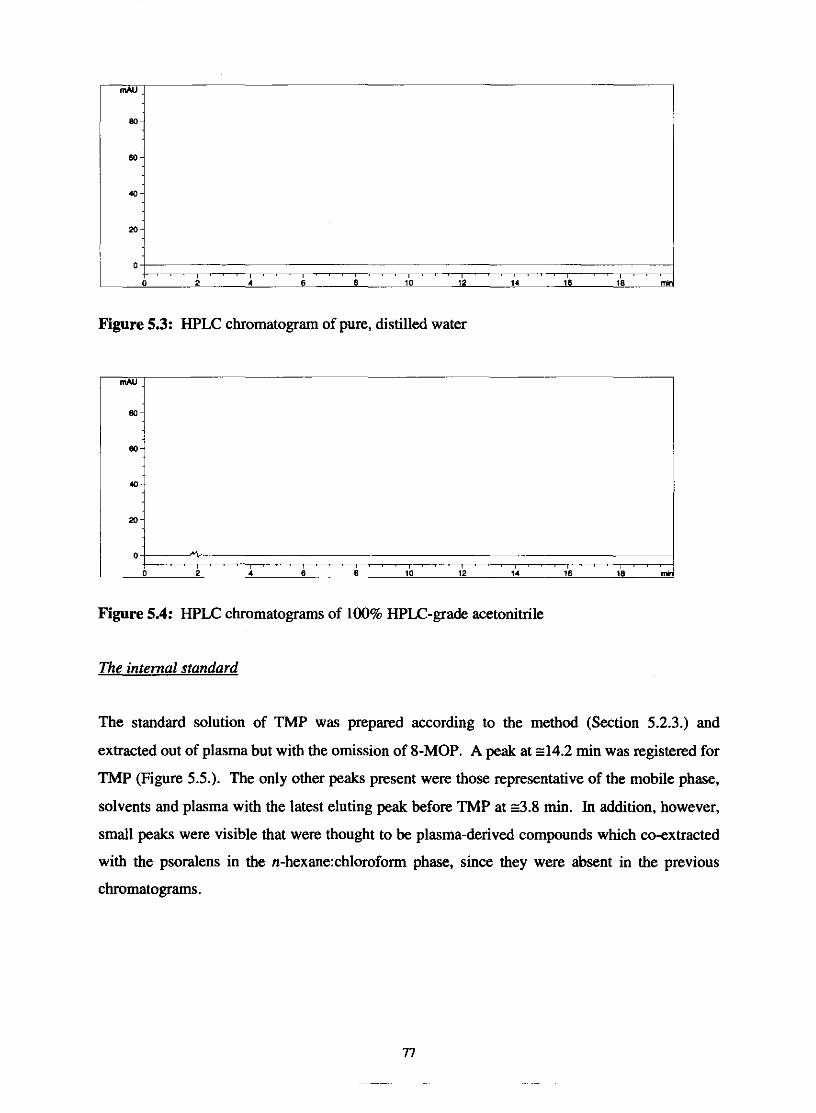
Figure 53: HPLC chromatogram of pure, distilled water
Figure 5.4: HPLC chromatograms of 100% HPLC-grade acetonitrile
The internal standard
The standard solution of TMP was prepared according to the method (Section 5.2.3.) and
extracted out of plasma but with the omission of 8-MOP. A peak at ~ 1 4 . 2 min was registered for
TMP (Figure 5.5.). The only other peaks present were those representative of the mobile phase,
solvents and plasma with the latest eluting peak hefore TMP at 3 . 8 min. In addition, however,
small peaks were visible that were thought to he plasma-derived compounds which co-extracted
with the psoralens in the n-hexane:chloroform phase, since they were absent in the previous
chromatograms.
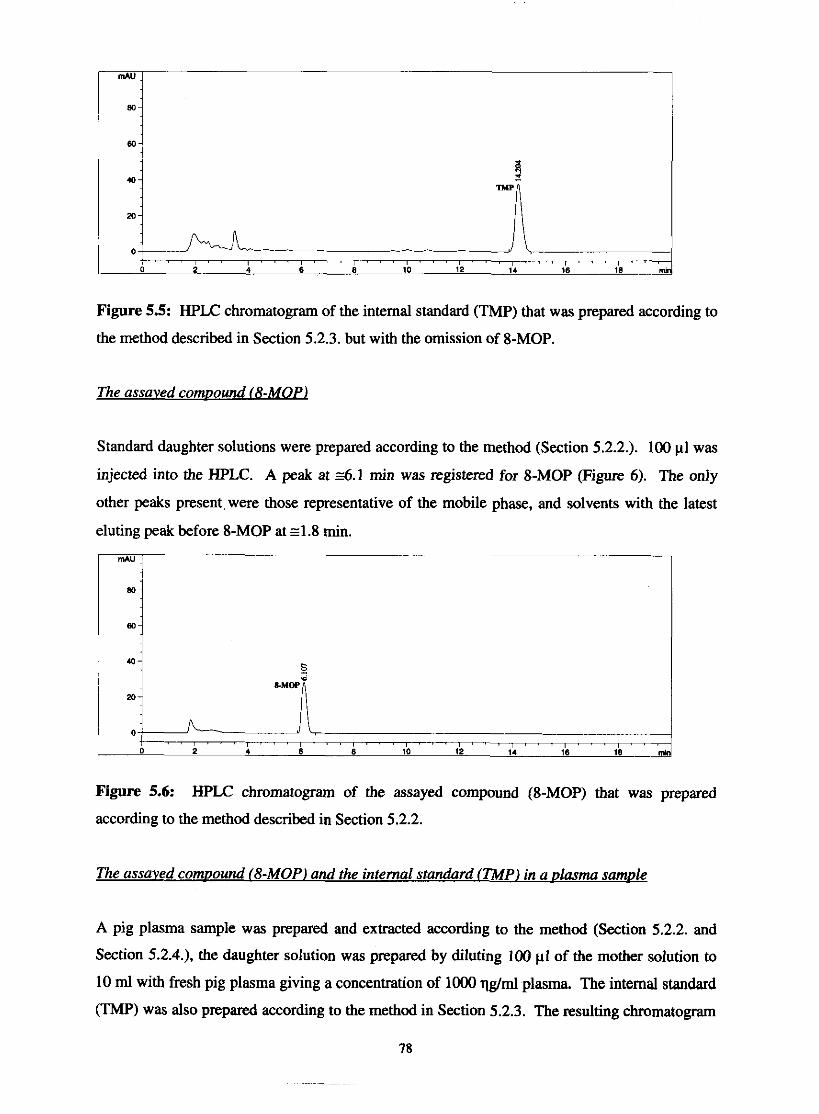
Figure 5.5: HPLC chromatogram of the internal standard (TMP) that was prepared according to
the method described in Section 5.2.3. but with the omission of 8-MOP.
The assaved comuound (8-MOP)
Standard daughter solutions were prepared according to the method (Section 5.2.2.). 100 pl was
injected into the HPLC. A peak at z6.1 min was registered for 8-MOP (Figure 6). The only
other peaks present, were those representative of the mobile phase, and solvents with the latest
eluting peak before 8-MOP at 4 . 8 min.
mAU
Figure 5.6: HPLC chromatogram of the assayed compound (8-MOP) that was prepared
according to the method described in Section 5.2.2.
The assaved comnound (8-MOP) and the internal standard (TMPJ in a olasma samule
A pig plasma sample was prepared and extracted according to the method (Section 5.2.2. and
Section 5.2.4.). the daughter solution was prepared by diluting 100 p1 of the mother solution to
10 ml with fresh pig plasma giving a concentration of 1000 qghl plasma. The internal standard
(TMP) was also prepared according to the method in Section 5.2.3. The resulting chromatogram
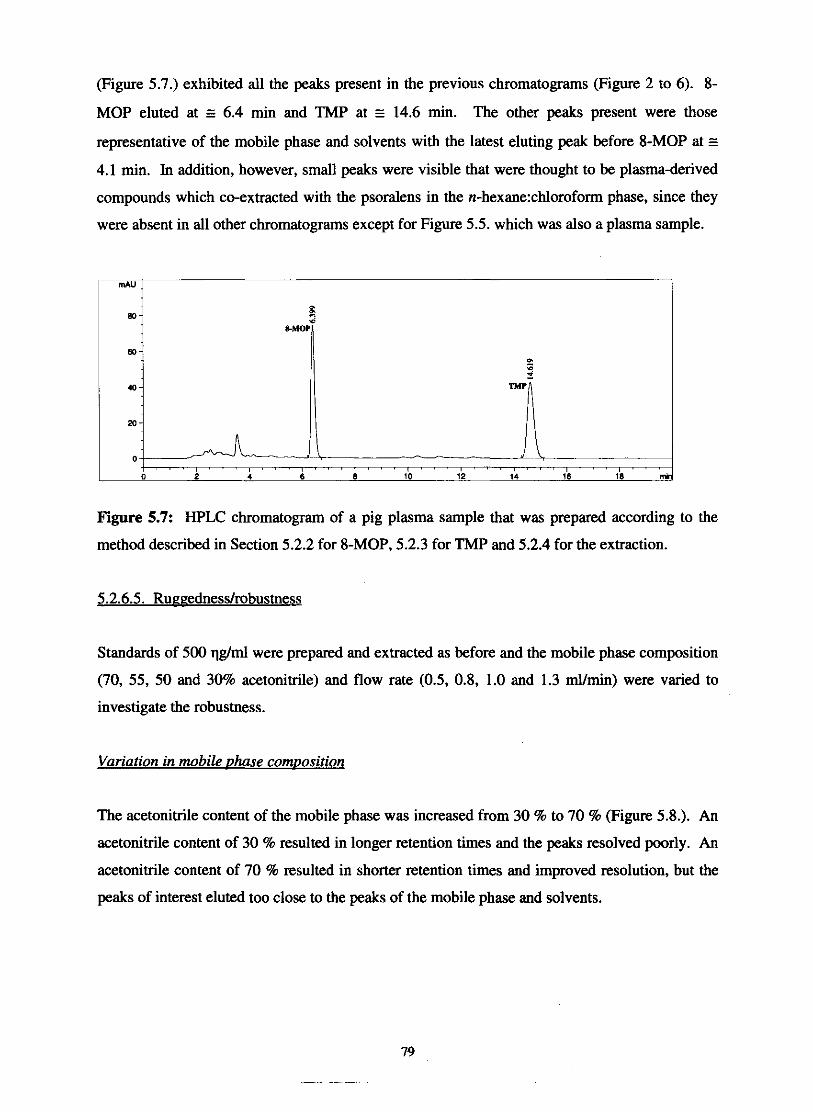
(Figure 5.7.) exhibited all the peaks present in the previous chromatograms (Figure 2 to 6). 8-
MOP eluted at E 6.4 min and TMP at E 14.6 min. The other peaks present were those
representative of the mobile phase and solvents with the latest eluting peak before 8-MOP at E
4.1 min. In addition, however, small peaks were visible that were thought to be plasma-derived
compounds which co-extracted with the psoralens in the n-hexane:chloroform phase, since they
were absent in all other chromatograms except for Figure 5.5. which was also a plasma sample.
Figure 5.7: HPLC chromatogram of a pig plasma sample that was prepared according to the
method described in Section 5.2.2 for 8-MOP, 5.2.3 for TMP and 5.2.4 for the extraction.
Standards of 500 qglml were prepared and extracted as before and the mobile phase composition
(70, 55, 50 and 30% acetonitrile) and flow rate (0.5, 0.8, 1.0 and 1.3 ml/min) were varied to
investigate the robustness.
Variation in mobile uhase comuosition
The acetonitrile content of the mobile phase was increased from 30 % to 70 % (Figure 5.8.). An
acetonitrile content of 30 % resulted in longer retention times and the peaks resolved poorly. An
acetonitrile content of 70 % resulted in shorter retention times and improved resolution, but the
peaks of interest eluted too close to the peaks of the mobile phase and solvents.

- C 'g 25 - a 20 .E - 15 g 10 'S 5 5 .d 0 - - -- - - - - -
0 20 40 60 80
Acetonitrile content (% dv) + 8-MOP + TMP --
Figure 5.8: The effect of variation in mobile phase composition on the retention times of 8-
MOP and TMP.
Variation in flow rate
The flow rate was varied from 0.8 mumin to 1.3 d m i n (Figure 5.9.). An increase of the flow
rate to 1.3 ml/min resulted in shorter retention times and sharper peaks, but increased column
pressure. A decrease in flow rate to 0.5 ml/min resulted in longer retention times and peak
broadening occurred.
- -
Flow rate (dmin) + 8-MOP --C TMP
-- -
Figure 5.9: The effect of variation in flow rate on the retention times of $-MOP and TMP.
5.2.6.6.1. Limit of detection
The lowest amount that could be detected was 5 qglml for $-MOP. The peakheight was 2-3
times that of the baseline noise.
5.2.6.6.2. Limit of auantification
The limit of detection for the method validated was 10 qglml for $-MOP.
80
- - -
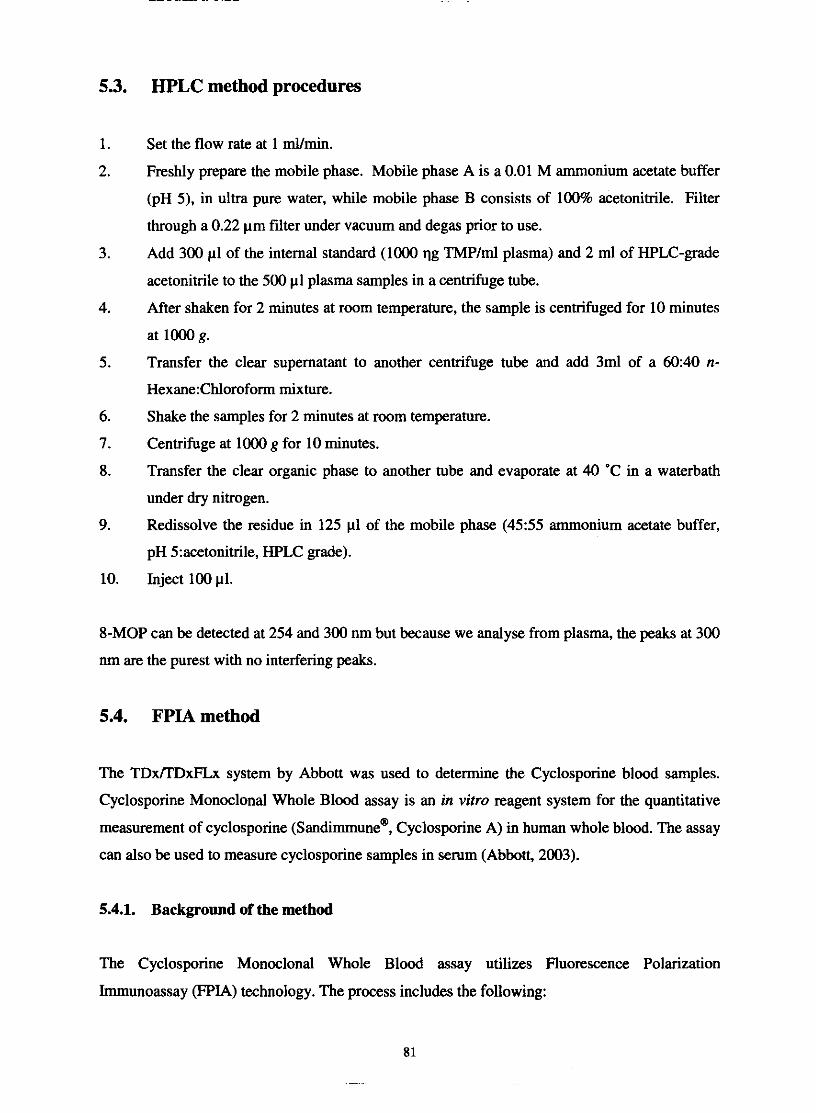
HPLC method procedures
Set the flow rate at 1 ml/min.
Freshly prepare the mobile phase. Mobile phase A is a 0.01 M ammonium acetate buffer
(pH 5), in ultra pure water, while mobile phase B consists of 100% acetonitrile. Filter
through a 0.22 pm filter under vacuum and degas prior to use.
Add 300 p1 of the internal standard (1000 qg TMPIml plasma) and 2 ml of HPUJ-grade
acetonitrile to the 500 p1 plasma samples in a centrifuge tube.
After shaken for 2 minutes at room temperature, the sample is centrifuged for 10 minutes
at 1000 g.
Transfer the clear supernatant to another centrifuge tube and add 3ml of a 60:40 n-
Hexane:Chloroform mixture.
Shake the samples for 2 minutes at mom temperature.
Centrifuge at 1000 g for 10 minutes.
Transfer the clear organic phase to another tube and evaporate at 40 'C in a waterbath
under dry nitrogen.
Redissolve the residue in 125 pl of the mobile phase (455.5 ammonium acetate buffer,
pH 5:acetonitrile, HPUJ grade).
Inject 100 p1.
8-MOP can be detected at 254 and 300 nm but because we analyse from plasma, the peaks at 300
nm are the purest with no interfering peaks.
5.4. FPIA method
The TDx/TDxFLx system by Abbott was used to determine the Cyclosporine blood samples.
Cyclosporine Monoclonal Whole Blood assay is an in vitro reagent system for the quantitative
measurement of cyclosporine (~andimmune@, Cyclosporine A) in human whole blood. The assay
can also be used to measure cyclosporine samples in serum (Abbott, 2003).
5.4.1. Background of the method
The Cyclosporine Monoclonal Whole Blood assay utilizes Fluorescence Polarization
Immunoassay (FPIA) technology. The process includes the following:
The sample, pre-treatment solution, drug (cyclosporine) antibody, and buffer are delivered to the
predilution well of the FPIA sample cartridge. The pre-treatment solution displaces cyclosporine
from protein binding sites. Variable unbound cyclosporine from the sample equilibrates with the
fixed amount of antibody. If the concentration of the cyclosporine in the sample is high, less
antibody sites remain open. An aliquot of the predilution mixture is equilibrated with
cyclosporine Fluorescein Tracer in the FPIA cuvette. Cyclosporine tracer binds to open
cyclosporine sites on the cyclosporine antibody. When excited by polarized vertical light, the
small unbound cyclosporine tracer molecule rotates rapidly, emitting light in many different
planes. The result is a decrease in the intensity of vertical polarized light. In contrast to
unbound cyclosporine tracer, antibody complexes of sample cyclosporine and cyclosporine
tracer are large molecules. Large molecules rotate slower and emit polarized light in the same
vertical plane. The result is an increase in the intensity of the vertical polarized light. FPIA
optics detects and measures the intensity of the polarized, vertical light. The change in polarized
light intensity is proportional to the concentration of the cyclosporine in the specimen (Abbott,
2003).
5.4.1.1. Reaeents
The reagents consist of the following:
S =Cyclosporine Monoclonal Whole Blood Antibody
T = Cyclosporine Monoclonal Whole Blood Fluorescein Tracer Solution.
P = Pretreatment Solution.
Zinc sulfate solution.
Surfactants in water (5 ml).
5.4.1.2. Cvclos~orine Monoclonal Whole Blood Calibrators:
6 Vials (A = 10 ml; B-F = 4 ml ) at the following concentrations: 0 qg/ml, 100 qglml, 250 qg/ml,
500 qg/ml, 1000 qg/ml and 15000 qg/ml.
5.4.1.3. Cvclos~orine Monoclonal Whole Blood Controls:
3 Vials within the following ranges:

Vial
5.4.2. Sample collection and preparations for testing analysis
Cyclosporine (qglml)
CONTROL L
CONTROL M
CONTROL H
A pre-treatment step must be performed on each cyclosporine sample (calibrators, controls, and
patient samples) before testing. The pre-treatment step rninimises the interference from
endogenous protein-bound fluorescent compounds. The pre-treatment consists of the addition of
solubilization reagent and whole blood precipitation reagentlprobe wash to the sample in order to
solubilise the cells and to precipitate protein respectively, followed by centrifugation to obtain a
clear supernatant. The cyclosporine assay is then performed on the sample supernatant.
120.00-180.00
340.00-460.00
680.00-920.00
5.4.3. FPIA method procedures
1. Pipet 150 p1 of the sample into centrifuge tube.
2. Dispense 50 p1 of solubilization reagent into centrifuge tube.
3. Dispense 300 pl of whole blood precipitation reagentlprobe wash into each centrifuge
tube.
4. Mix on a vortex mixer for 10 seconds.
5. Centrifuge the specimens for five (5) minutes at 9.500 x g. A minimum of 150 p1 of
supernatant is required to perform the cyclosporine assay.
6. After centrifugation, decant the supernatant into the sample well.
5.4.4. Results
Control and cyclosporine concentrations are automatically recorded on the printout in qgtml.
5.4.5. Trademarks
~andimmune@ is a registered trademark of Sandoz, Inc.
Sandimmune - Kit is a product of Sandoz Ltd., Basel, Switzerland
CYCLO- Trac SP 125lRIA Kit is a product of INCSTAR Corporation, Stillwater, MN.
(Abbott Laboratories, 2001).

5.5. References
ABBOTT DIAGNOSTICS. (2003). Diagnostics. [Web:] htt~://www.abbottdiamostics.com.
[Date of access: 2 September 20031.
JORDAAN, J. (2000). Grapefruit juice-felodipine interaction: The effect of bergamottin in
humans. Potchefstroom : PU vir CHO. (Dissertation - M.Sc).
SHAH, V.P., MIDHA, K.K., DIGHE, S., MCGILVERAY, I.J., SKELLY, J.P., YACOBI, A.,
LAYLOFF, T., VISWANANHAN, C.T., COOK, C.E., MCDOWALL, R.D., Pl'lTMAN, K.A.
& SPECTOR, S. (1992). Analytical methods of validation: Bioavailability, bioequivalence and
pharmacokinetic studies. Pharmaceutical research, 9(4):588-592.

6. Methods: Clinical study and pharmacokinetic analvsis
In this chapter the clinical study and pharmacokinetic analysis of the interaction between
cyclosporine and methoxsalen will be discussed.
6.1. Clinical study
The study was approved by the Ethics committee with the following number: 03M07.
61.1. Selection of subjects
Male volunteers, 20 to 25 years old, within 15 % of their ideal body weight
(BMI = massflength *; ideal 20-25) were randomly selected and only included in the study on dr.
Dijkstra's recommendation. All the subjects were in good physical condition and healthy as
judged by medical history, physical examination, and laboratory testing (biochemical en
haematologic profiles). All subjects showed a normal electrocardiogram (ECG) and normal
blood and urine chemistries, as determined prior to commencement of the study. The following
blood and urine analysis were done:
HAEMATOLOGY (Full blood count): Haemoglobin (Hb), Red blood cell count (RBC),
Haematocrit (HCT), Mean corpuscular volume (MCV), Mean corpuscular haemoglobin (MCH),
Platelets (PLT), White blood cell count (WBC) (Before and after dosing with cyclosporine),
White blood cell differential (WBC DIFFERENTIAL), neutrophiles, lymphocytes, monocytes,
eosinophiles, basophiles.
BIOCHEMISTRY: Bilirubin total, Alkaline phosphatases, Alanine aminotransferase (SGPT)
(ALT), Aspartate aminotrasferase (SGOT) (AST), Creatinine, Total protein, Albumin, Blood
glucose, Total cholesterol, Potassium, Sodium, C-reactive protein (CRP).
VIROLOGY: Hepatitis B, Hepatitis C.
MICROBIOLOGY: Urine dipstick and microscopy.
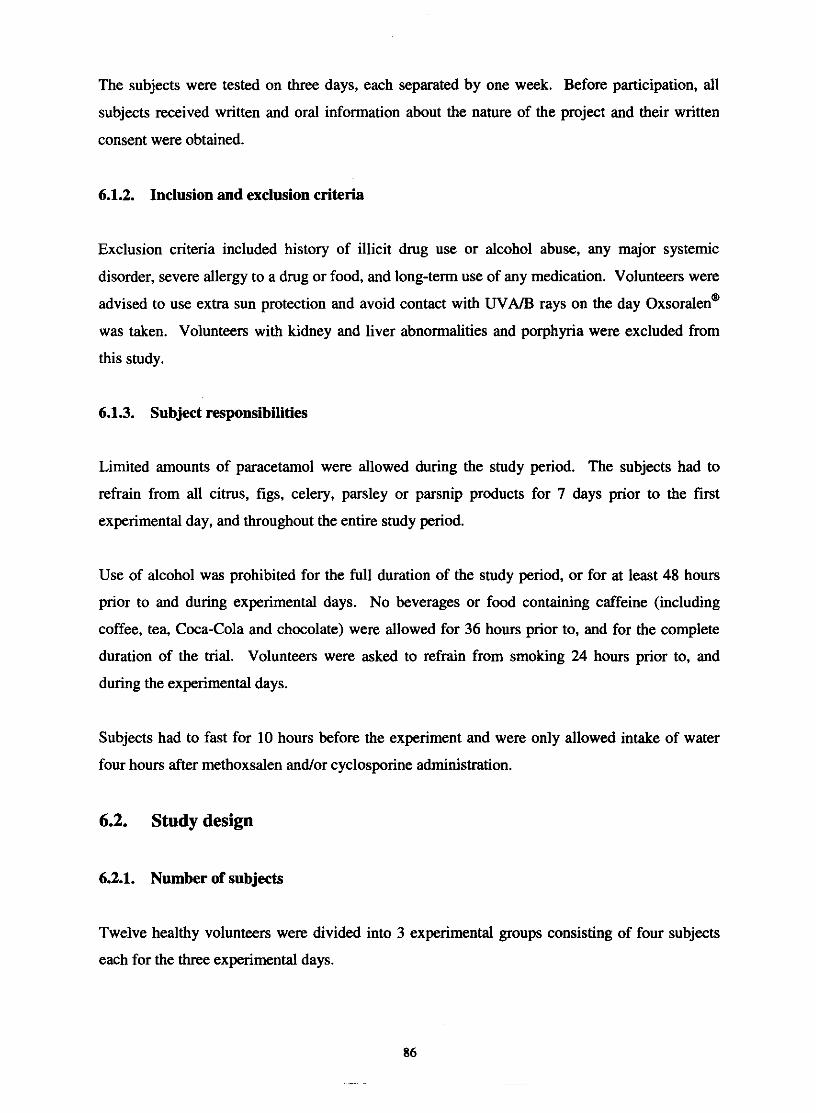
The subjects were tested on three days, each separated by one week. Before participation, all
subjects received written and oral information about the nature of the project and their written
consent were obtained.
6.1.2. Inclusion and exclusion criteria
Exclusion criteria included history of illicit drug use or alcohol abuse, any major systemic
disorder, severe allergy to a drug or food, and long-term use of any medication. Volunteers were
advised to use extra sun protection and avoid contact with UVA/B rays on the day omoralen@
was taken. Volunteers with kidney and liver abnormalities and porphyria were excluded from
this study.
6.1.3. Subject responsibilities
Limited amounts of paracetamol were allowed during the study period. The subjects had to
refrain from all citrus, figs, celery, parsley or parsnip products for 7 days prior to the first
experimental day, and throughout the entire study period.
Use of alcohol was prohibited for the full duration of the study period, or for at least 48 hours
prior to and during experimental days. No beverages or food containing caffeine (including
coffee, tea, Coca-Cola and chocolate) were allowed for 36 hours prior to, and for the complete
duration of the trial. Volunteers were asked to refrain from smoking 24 hours prior to, and
during the experimental days.
Subjects had to fast for 10 hours before the experiment and were only allowed intake of water
four hours after methoxsalen andor cyclosporine administration.
6.2. Study design
6.2.1. Number of subjects
Twelve healthy volunteers were divided into 3 experimental groups consisting of four subjects
each for the three experimental days.
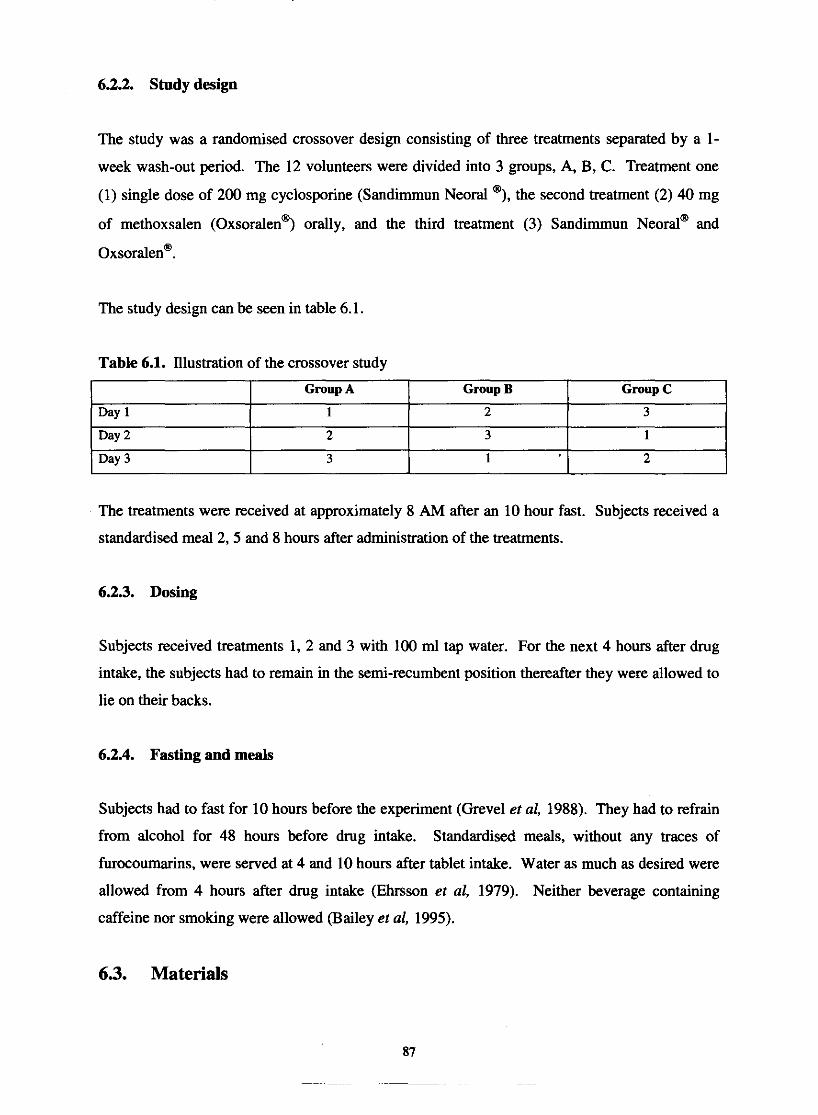
6.2.2. Study design
The study was a randomised crossover design consisting of three treatments separated by a 1-
week wash-out period. The 12 volunteers were divided into 3 groups, A, B, C. Treatment one
(1) single dose of 200 mg cyclosporine (Sandimmun Neoral @), the second treatment (2) 40 mg
of methoxsalen (~xsoralen@) orally, and the third treatment (3) Sandimmun ~ e o r a l ~ and
~xsoralen@.
The study design can be seen in table 6.1.
Table 6.1. Illustration of the crossover study
The treatments were received at approximately 8 AM after an 10 hour fast. Subjects received a
standardised meal 2,5 and 8 hours after administration of the treatments.
6.2.3. Dosing
Day 1
Day 2
Day 3
Subjects received treatments 1, 2 and 3 with 100 ml tap water. For the next 4 hours after drug
intake, the subjects had to remain in the semi-recumbent position thereafter they were allowed to
lie on their backs.
Group B
2
3
1
Group A
1
2
3
6.2.4. Fasting and meals
Group C
3
1
2
Subjects had to fast for 10 hours before the experiment (Grevel et al, 1988). They had to refrain
from alcohol for 48 hours before drug intake. Standardised meals, without any traces of
furocoumarins, were served at 4 and 10 hours after tablet intake. Water as much as desired were
allowed from 4 hours after drug intake (Ehrsson et al, 1979). Neither beverage containing
caffeine nor smoking were allowed (Bailey et al, 1995).
6.3. Materials

6.3.1. Methoxsalen and cyclosporine used
Sandimmun ~eoral" (Novartis South Africa (Pty) Ltd, 72 Steel Road, Spartan, Kempton Park)
and ~xsoralen" (Pharmaco Distribution (Pty) Ltd, Fedsure Close 2, Nonvich Close, Sandton).
6.4. Sampling schedule
6.4.1. Samples for analysis of serum methoxsalen and cyclosporine
10 ml blood samples were collected by venipuncture at 0,0.5, 1, 1.5,2,2.5, 3,4, 5,6, 8, 12 and
24 hours after the dose. Blood were drawn and collected from a forearm vein in heparinised
tubes (methoxsalen) and EDTA tubes (cyclosporine). The samples were centrifuged and the
serum collected. Serum samples were frozen at -20°C until assay determination of methoxsalen
and cyclosporine from the human plasma was done by HPLC.
Plasma samples were personally transported to MEDUNSA, for the determination of
cyclosporine.
6.5. Data analysis
65.1. Pharmacokinetic calculations
Noncompartemental analyses were performed. Plasma C,, the maximum concentration of
cyclosporine and the time to reach C, (t,) were obtained directly from the highest observed
value in the individual plasma concentration-time profiles. The pharmacokinetic parameters for
cyclosporine and methoxsalen were calculated as follow (Schuirmann et al, 1987).
i) AUCat: the area under the plasma concentration versus time curve, from 0 to the last
measurable concentration, was calculated by linear trapezoidal method.
N = number of data points, C = plasma concentration
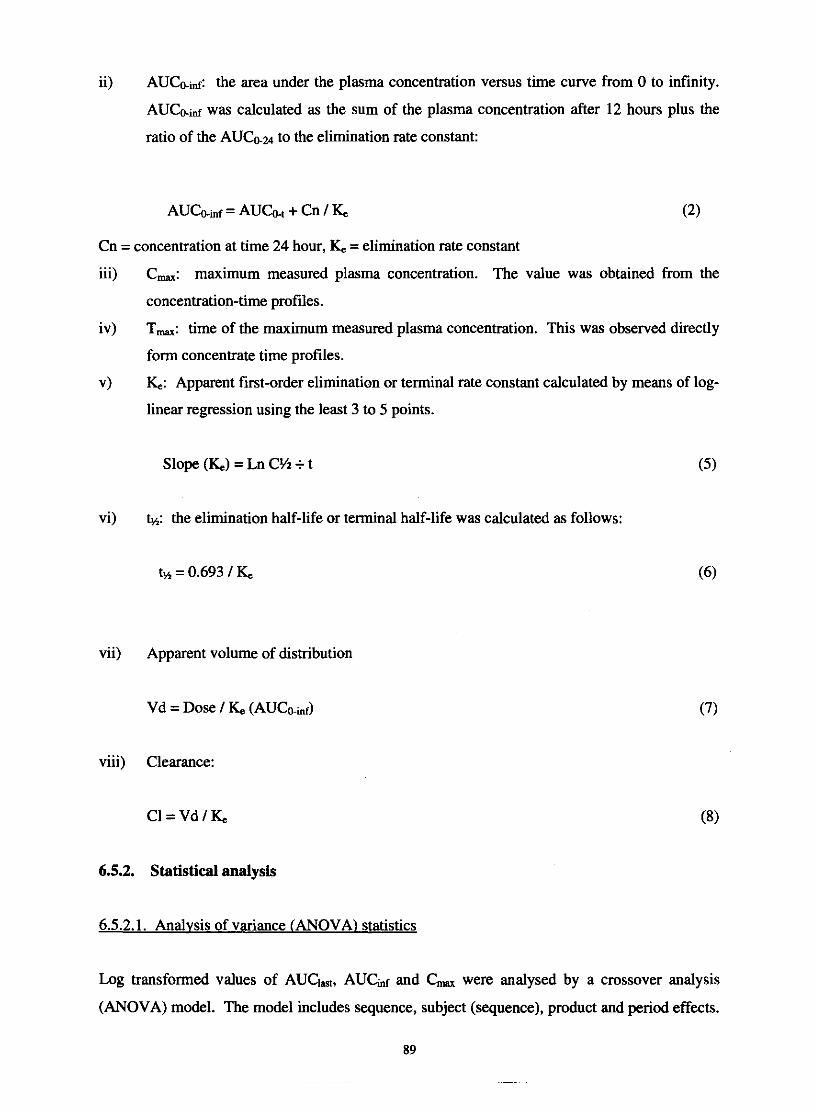
ii) AUGinf: the area under the plasma concentration versus time curve from 0 to infinity.
AUCo.illr was calculated as the sum of the plasma concentration after 12 hours plus the
ratio of the A U G u to the elimination rate constant:
AUCo.inf = AUCw + Cn I K,
Cn = concentration at time 24 hour, K, = elimination rate constant
iii)
iv)
v)
vi)
C,: maximum measured plasma concentration. The value was obtained from the
concentration-time profiles.
T,: time of the maximum measured plasma concentration. This was observed directly
form concentrate time profiles.
: Apparent first-order elimination or terminal rate constant calculated by means of log-
linear regression using the least 3 to 5 points.
Slope (%) = Ln C41 + t
&: the elimination half-life or terminal half-life was calculated as follows:
vii) Apparent volume of distribution
Vd = Dose I % (AUCo.i,,f)
viii) Clearance:
6.5.2. Statistical analysis
6.5.2.1. Analvsis of variance (ANOVAI statistics
Log transformed values of AUC,,,, A U G and C,, were analysed by a crossover analysis
(ANOVA) model. The model includes sequence, subject (sequence), product and period effects.

A 90% confidence interval of the difference was calculated. The above analysis was performed
using the SAS@ program by the Biostatic department of PU for CHE.
The data were not totally randomised and the 90% confidence interval was calculated with the
Mann-Whitney formula.
6.5.2.2. Paired t-test
The geometric means were used to calculate clinical significance. A paired t-test was also
performed. The Statistics 6 program from stasoft@ was used to perform the paired t-test.
6.5.2.3. Clinical significance
The following formula was used to calculate clinical significance ($);
Were: n = number of volunteers used
k = 2
F = F value from ANOVA results on untransformed data
When: l~~ =: 0.01 small clinical significance
l ~ ' = 0.06 medium clinical significance
IJ' =: 0.14 large clinical significance
(Steyn & Viljoen, 2002).
6.6. References
BAILEY, D.G., ARNOLD, O., BEND, J.R., TRAN, L.T. & SPENCE, J.D. (1995). Grapefruit
juice-felodipine interaction: reproducibility and characterisation with the extended release drug
formulation. British journal of pharmacology, 40: 135-140.
EHRSSON, H., NILSSON, S-O., EHRNEBO, M., WAUIN, I. & WENNERSTEN, G. (1979).
Effect of food in kinetics of 8-methoxsalen. Clinical pharmacology and therapeutics,
25(2):167-171.
GREVEL, J. (1988). Significance of cyclosporine pharmacokinetics. Transplanfation
proceedings, 20(2):428-434.
SCHULRMANN, D.J. (1987). A comparison of the two one-sided tests procedure and the
power approach for assessing the equivalence of average bioavailability. Journal of
pharmacokinetics and biopharmacology, 15:657-660.
STEYN, H.S. & VIWOEN, H. (2002) Effect sizes to determine practically significant
differences of mean vectors. Potchefstroom : PU vir CHO. 100p. (study guide S2002197.)
7. Pharmacokinetic results, discussion and conclusion
In this chapter the following will be discussed:
i) The pharmacokinetics of cyclosporine and the influence of methoxsalen on the
pharmacokinetics of cyclosporine.
ii) The pharmacokinetics of methoxsalen and the influence of cyclosporine on the
pharmacokinetics of methoxsalen.
This will be discussed as follows:
7.1. Demographic data of the volunteers.
7.2. Pharmacokinetic data of cyclosporine and methoxsalen.
7.2.1. Dosages
7.2.2. Individual plasma level profile of cyclosporine
7.2.3. Individual plasma data profile of methoxsalen
7.3. Pharmacokiietic parameters.
7.3.1. Individual pharmacokinetic parameter of cyclosporine
7.3.2. Individual pharmacokinetic parameter of methoxsalen
7.3.3. Geometric statistical parameters of cyclosporine
7.3.4. Geometric statistical parameters of methoxsalen
7.4. Discussion
75. Conclusion
7.6. References

7.1. Demographic data of the volunteers
The demographic data of the12 male volunteers can be seen in table 7.1.
Table 7.1: Demographic data of the12 male volunteers.
I
Twelfth healthy male volunteers, 20 to 25 years old, within 15 % of their ideal body weight
(BMI = massflength*; ideal 20 - 25) participated in this study after signing a consent form. The
length of the individuals ranged from 1.71 to 1.91 metres with an average of 1.8 meter. The
average weight was 79.9 kg and range from 60 to 101 kg. Subjects were healthy as judged by
medical history, physical examination, and laboratory testing (biochemical and haematologic
profiles).
14 Male volunteers were initially tested and examined but two subjects were excluded because of
haematuria and the chronic use of medication, respectively.
Subjects were refrained from alcohol and medications, including over-the-counter products,
throughout the study. All subjects had a normal electrocardiogram (ECG) and normal blood and
urine chemistries, determined prior to commencement of the study.
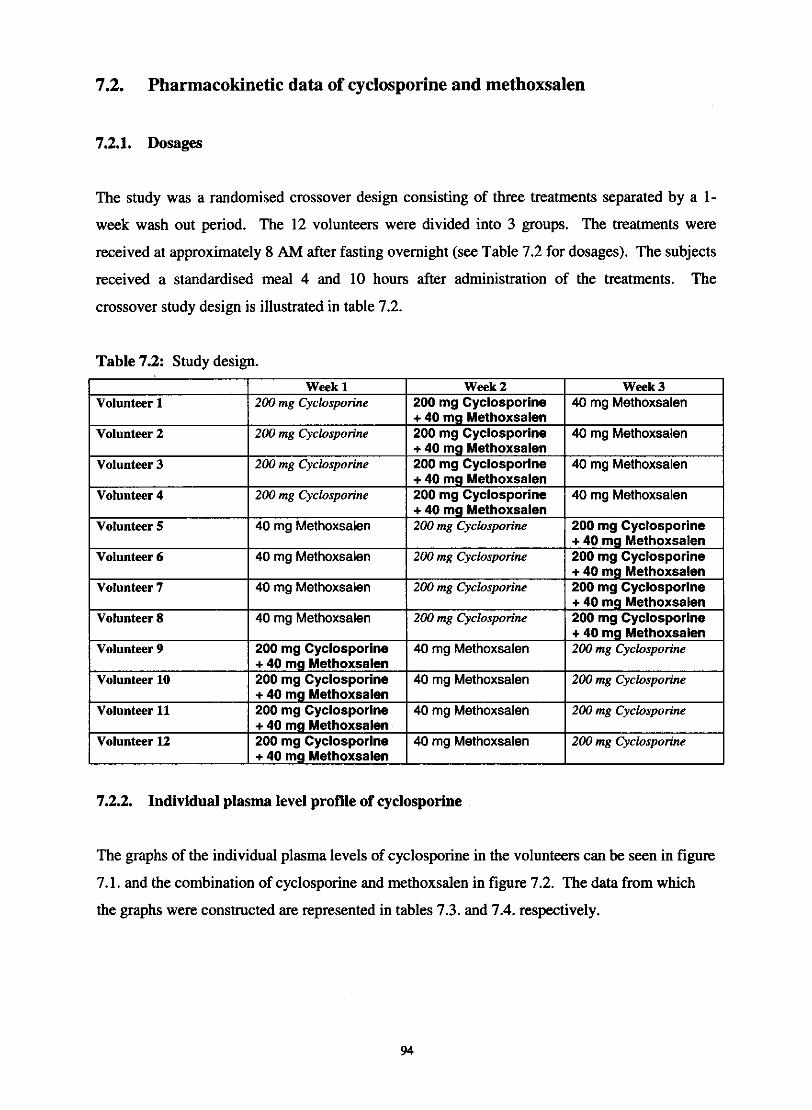
7.2. Pharmacokinetic data of cyclosporine and methoxsalen
7.2.1. Dosages
The study was a randomised crossover design consisting of three treatments separated by a 1-
week wash out period. The 12 volunteers were divided into 3 groups. The treatments were
received at approximately 8 AM after fasting overnight (see Table 7.2 for dosages). The subjects
received a standardised meal 4 and 10 hours after administration of the treatments. The
crossover study design is illustrated in table 7.2.
Table 7.2: Study design.
I Week 1 I Week 2 I Week 3 Volunteer 1 I 200 mg Cyclosporine 1 200 mg Cyclosporine 1 40 rng Methoxsalen
Volunteer 11
Volunteer 2
Volunteer 3
Volunteer 4
7.2.2. Individual plasma level profile of cyclosporine
The graphs of the individual plasma levels of cyclosporine in the volunteers can be seen in figure
. . .
200 mg Cyclosporine
200 mg Cyclosporine
200 mn Cvclosuorine
7.1. and the combination of cyclosporine and methoxsalen in figure 7.2. The data from which
the graphs were constructed are represented in tables 7.3. and 7.4. respectively.
+ 40 mg ~ethoxsalen 200 mg Cyclosporine + 40 mg Methoxsalen 200 mg Cyclosporine + 40 mg Methoxsalen 200 mg Cyclosporine
-
40 mg Methoxsalen
40 mg Methoxsalen
40 ma Methoxsalen
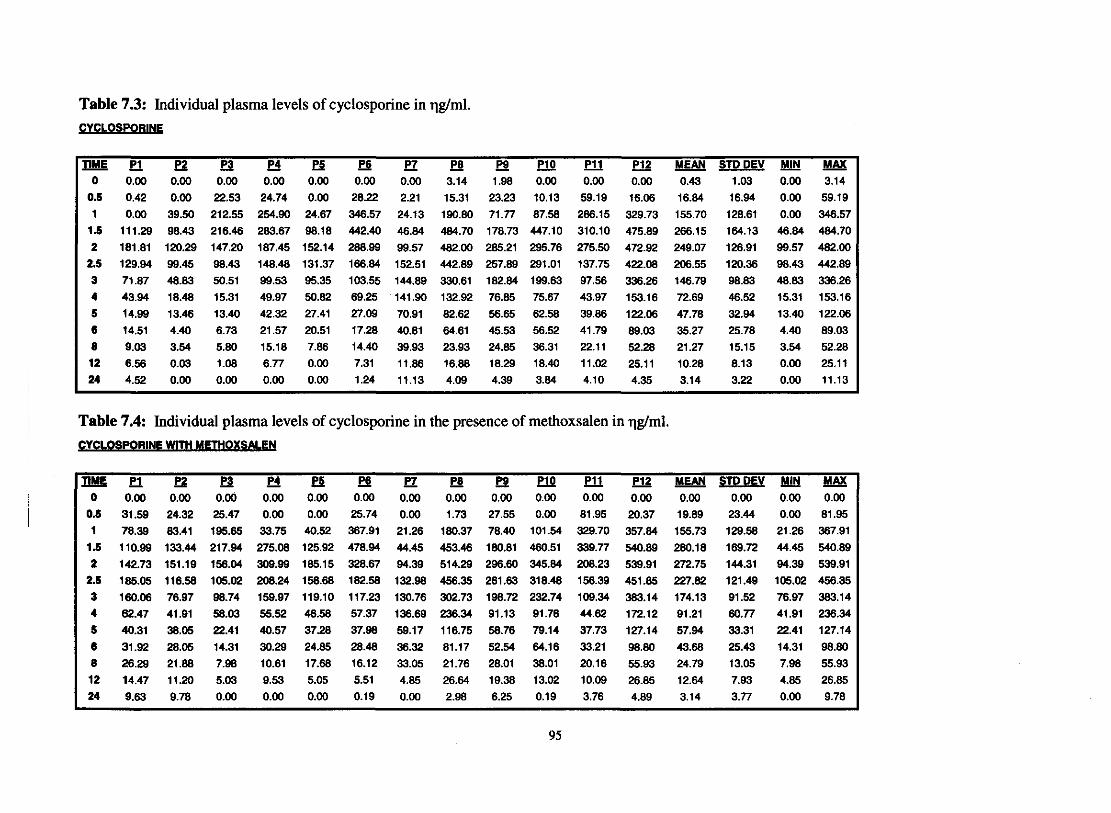
Table 7.3: Individual plasma levels of cyclosporine in qgtml. FYCLOSP-
P r J ? ? i E e P 7 - P8 - P9 W W P12 MEAN STDDEV MAX 0 0.00 0.00 0.00 0.00 0.00 0.00 0.00 3.14 1.98 0.00 0.00 0.00 0.43 1.03 0.00 3.14
0.5 0.42 0.00 22.53 24.74 0.00 28.22 2.21 15.31 23.23 10.13 59.19 16.06 16.84 16.94 0.00 59.19
1 0.00 39.50 212.55 254.90 24.67 346.57 24.13 190.80 71.77 87.58 286.15 329.73 155.70 128.61 0.00 346.57 1.5 111.29 98.43 216.46 283.67 98.18 442.40 46.84 484.70 178.73 447.10 310.10 475.89 266.15 164.13 46.84 484.70 2 181.81 120.29 147.20 187.45 152.14 288.99 99.57 482.00 285.21 295.76 275.50 472.92 249.07 126.91 99.57 482.00
2 5 129.94 99.45 98.43 148.48 131.37 186.84 152.51 442.89 257.89 291.01 137.75 422.08 206.55 120.36 98.43 442.89
3 71.87 48.83 50.51 99.53 95.35 103.55 144.89 330.61 182.84 199.63 97.56 336.26 146.79 98.83 48.83 336.26 4 43.94 18.48 15.31 49.97 50.82 69.25 141.90 132.92 76.85 75.67 43.97 153.16 72.69 46.52 15.31 153.16 5 14.99 13.46 13.40 42.32 27.41 27.09 70.91 82.62 56.65 62.58 39.86 122.06 47.78 32.94 13.40 122.06 6 14.51 4.40 6.73 21.57 20.51 17.28 40.81 64.61 45.53 56.52 41.79 89.03 35.27 25.78 4.40 89.03 8 9.03 3.54 5.80 15.18 7.86 14.40 39.93 23.93 24.85 36.31 22.11 52.28 21.27 15.15 3.54 52.28 12 6.56 0.03 1.08 6.77 0.00 7.31 11.86 16.88 18.29 18.40 11.02 25.11 10.28 8.13 0.00 25.11 24 4.52 0.00 0.00 0.00 0.00 1.24 11.13 4.09 4.39 3.84 4.10 4.35 3.14 3.22 0.00 11.13
Table 7.4: Individual plasma levels of cyclosporine in the presence of methoxsalen in qglml.

CYCLOSPORIN
------ - - - -
.P1
.P2
P3
XP4
XP5
ep6+P7
-P8
-P9
P10
P11
P12
e
xW---------X
--------
-..~ -J X~+ ~
~..- &+n: _
-' . v t." .., 't.~ ~T
,,: -""~-m0.00 ~ 5o
--------
- ----- -- ---
---~
25 3015 2010
TIME (HOURS)
Figure 7.1: Graph representing the individual plasma levels of cyclosporine. The peak levels
range from a minimum of 120.29 to a maximum of 484.7 T)g/ml. The average peak level was
296 T)g/ml.
-------
600.00
----------- - - - - - - - - --
CYCLOSPORIN + METHOXSALEN
- - - - - -- - -------
.P1
.P2
P3
XP4
XP5
ep6
- +P7
-P8
-P9
P10
P11
P12
500.00 - - - - - - - - -e
---------------------
..eX
X
~><-,,""~
I.~ +.+ .*+ . +~ _..-
000. - "-c'"
. :~- - - ...o 5
~i"';=- =- ~'-==--- - ~ - :-10 15 20 25 30
TIME (HOURS)
Figure 7.2: Graph representing individual plasma levels of cyclosporine in the presence of
methoxsalen. The peak levels range from a minimum of 136.69 to a maximum of 540.89 T)g/ml.
The average peak level was 318.08 T)g/ml.
96
600.00
500.00
400.00::J"
300.00dz0U
200.00
100.00
400.00
::J"
300.00dz0u
200.00
100.00
7.2.3. Individual plasma level profile of methoxsalen
The graphs of the individual plasma levels of methoxsalen in the volunteers can be seen in figure
7.3. and the combination of methoxsalen and cyclosporine in figure 7.4. The data from which
the graphs were ~ 0 n s t ~ c t e d are represented in tables 7.5. and 7.6. respectively.

Table 7.5: Individual plasma levels of methoxsalen in qgtml. METHOXSALEN
Table 7.6: Individual plasma levels of methoxsalen in the presence of cyclosporine in qglml.

------ --
METHOXSALEN
450.00 -
400.00+
+P18P2
P3XP4::t::P58P6+P7-P8
--P9P10P11P12
350.00 - - - - - - - -
- - -
+
10 15 20 25 30
TIME (HOURS)
Figure 7.3: Graph representing individual plasma levels of methoxsalen. The peak levels range
from a minimum of 54.1 to a maximum of 387.28 llg/ml. The average peak level was 177.69
llglml.
-METHOXSALEN+ CYCLOSPORIN
- - - - - - -
+P1
8P2
P3
XP4
::t::P5
8P6
+P7
-P8
-P9
P10
P11
P12
- ..- - - - - - - - - - --8
88
8 ..~
. +. ....!~~A __ _
-+- XI ...;xx - 1'-iII=-c
5 10
-15 20 25 30
TIME (HOURS)-- - - - - - - - ---
Figure 7.4: Graph representing individual plasma levels of methoxsalen in the presence of
cyc1osporine. The peak levels range from a minimum of 16.46to a maximum of 242.40 llg/ml.
The average peak level was 116.46llglml.
99
300.00 +:J'
250.00 "-2;.0 200.00z
+ '"'"-0U
-..150.00
....---100.00-=><+.....X+50.00
+a..0.00 --
50
300.00
250.00
200.00:J'
z- 150.000z0U
100.00
50.00
0.00
0

7.3. Pharmacokinetic parameters
73.1. Individual pharmacokinetic parameter of cyclosporine
Table 7.7. represents the individual pharmacokinetic parameters for cyclosporine alone
(reference) and the cyclosporine and methoxsalen combination (test). The table consists of the
means of each paramater, standard deviation (SD), minimum value (Min) and maximum value
(Max). The mean values of each parameter were compared with a paired t- test and the p-values
are reported in the table.
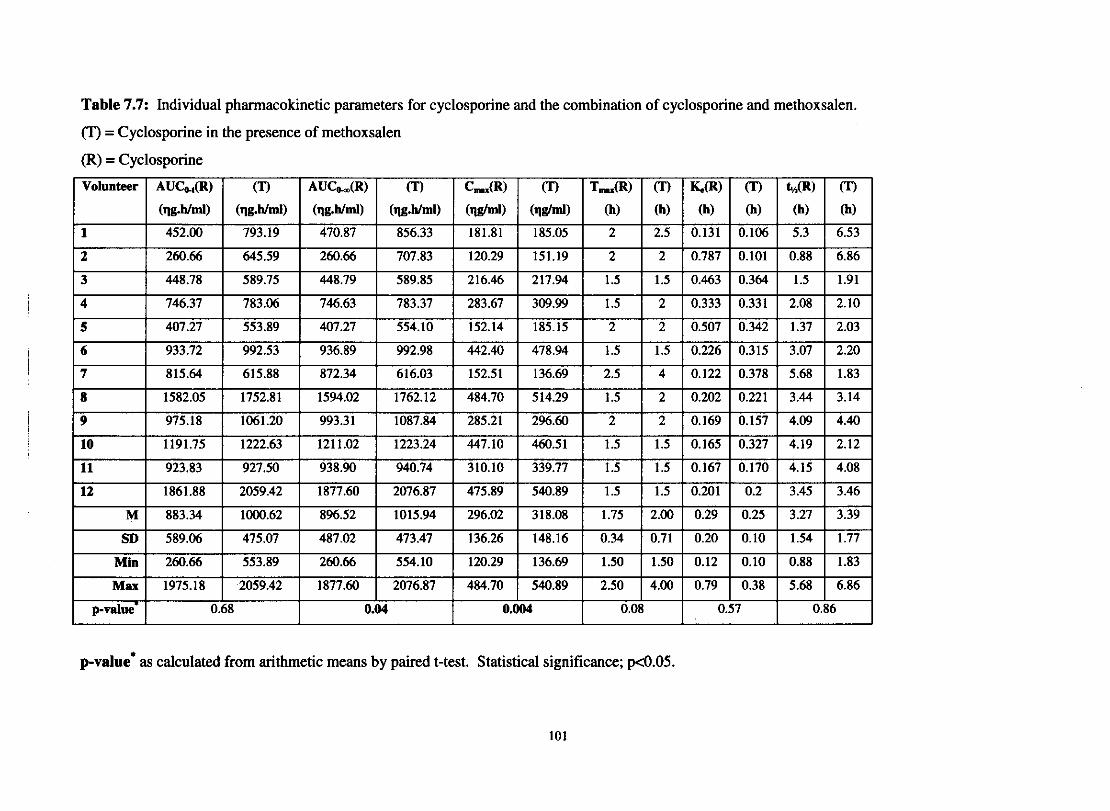
Table 7.7: Individual pharmacokinetic parameters for cyclosporine and the combination of cyclosporine and methoxsalen.
(T) = Cyclosporine in the presence of methoxsalen
(R) = Cyclosporine
p-value* as calculated from arithmetic means by paired t-test. Statistical significance; p<0.05.
101
The average mean AUCat of cyclosporine was 958.26 qg.h/ml with a SD of 589.06. The range
was from 160.66 to 1975.18 qg.h/ml. In the presence of the methoxsalen the average AUG,
increased to 1000.62 qg.h/ml while the SD declined to 475.07. The range was from 553.89 to
2059.42 qg.h/ml. The average mean AUCh of cyclosporine was 896.52 qg.h/ml with a SD of
487.02. The range was from 260.66 to 1877.60 qg/h/ml. In the presence of methoxsalen the
average AUCo, increased to 1015.94 qg.h/ml while the SD declined to 473.47. The range was
from 554.10 to 2076.87 qg.h/ml. The average C, of cyclosporine was 296.02 qg/ml with a SD
of 136.26. The range was from 120.29 to 484.70 qglml. In the presence of methoxsalen the
average C, value increased to 318.08 qg/ml and the SD was 148.16.
The p-values from table 7.7. indicated that the difference between the two treatments were
statistical significant for A U C h (p= 0.04) and C, (p=0.004). The median of T,(R) was 1.5
hours and the range was between 2 and 2.5 hours. The median of Tm(T) was 1.5 hours and
ranges from 1.5 to 4 hours.
7.3.2. Individual pharmacokinetic parameter of methoxsalen
Table 7.8. represents the individual pharmacokinetic parameters for methoxsalen alone
(reference) and methoxsalen and cyclosporine combination (test). The table consists of the
means of each paramater, standard deviation (SD), minimum value (Min) and maximum value
(Max). The mean values of each parameter were compared with a paired t- test and the p-values
are reported in the table.
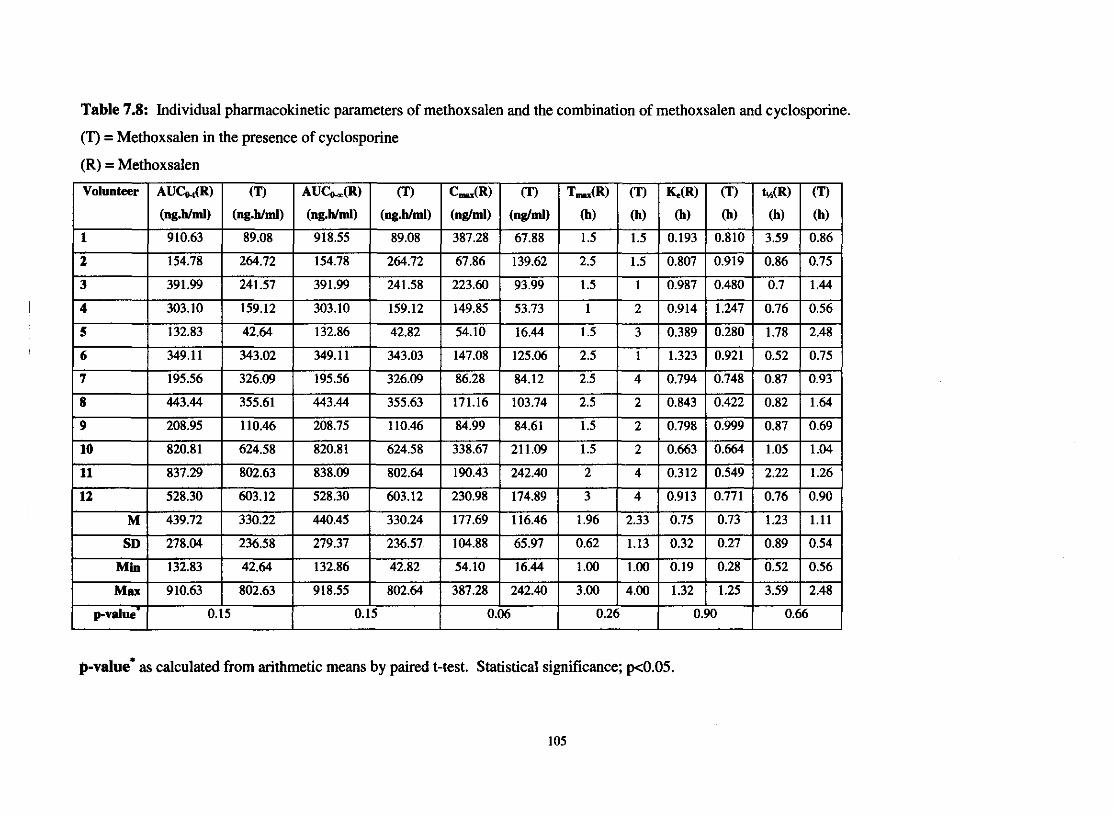
Table 7.8: Individual phannacokinetic parameters of methoxsalen and the combination of methoxsalen and cyclosporine.
(T) = Methoxsalen in the presence of cyclosporine
(R) = Methoxsalen
p-value' as calculated from arithmetic means by paired t-test. Statistical significance; pc0.05.
105
The average mean AUCo., of mehoxsalen was 439.72 qg.h/ml with a SD of 278.04. The range
was from 132.83 to910.63 qg.h/ml. In the presence of the cyclosporine the AUCo, decreased to
330.22 qg.h/ml while the SD declined to 236.58. The range was from 42.64 to 802.63 qg.h/ml.
The average mean AUCh of methoxsalen was 440.45 qg.h/ml with a SD of 279.37. The range
was from 132.86 to 918.55 qg.h/ml. In the presence of cyclosporine the average A U L
decreased to 330.24 qg.h/ml while the SD also declined to 236.57. The range was from 42.82 to
802.64 qg.h/ml. The average C, of methoxsalen was 177.69 qglml with a SD of 104.88. The
range was from 54.10 to 387.28 qglml. In the presence of cyclosporine the average C,, value
decreased to 116.46 q g / d and the SD was 65.97.
The p-values from table 7.7. indicated that the difference between the two treatments were not
statistical significant. The median of T,(R) was 1.5 hours and the range was between 1 and 3
hours. The median of T,(T) was 2 hours and ranged from 1 to 4 hour

7.3.3. Geometric statistical parameters of cyclosporine
The geometric statistical parameters of cyclosporine can be seen in table 7.9.
Test = Cyclosporine in the presence of methoxsalen
Reference = Cyclosporine
These results were calculated from the ANOVA analysis.
Table 7.9: Geometric statistical parameters of cyclosporine. .
The differences in AUCk ($ = 0.191) and C, I J ~ = 0.458) were clinical significant. The
difference in AUCo., between the two treatments was in the medium to large clinical significance
range. The 90% confidence interval for both AUG, and AUCo, fell outside the conventional
80- 125% ranges. These results confirmed the results obtained with the paired t-test (Table 7.7.).
The 90% confidence interval for the C, value was in the conventional range although the
clinical difference was significant.

7.3.4. Geometric statistical parameters of methoxsalen
The geometric statistical parameters of methoxsalen can be seen in Table 7.10.
Test = Methoxsalen in the presence of cyclosporine
Reference = Methoxsalen
These results were obtained from the ANOVA analysis.
Table 7.10: Geometric statistical parameters of methoxsalen.
The differences between the two treatments were not clinical significant for any of the
parameters. The 90 % confidence interval for all the parameters was however lower than the
conventional range of 80 to 125%.
7.4. Discussion
By serendipity it was found that grapefruit juice could increase the oral bioavailability of a
number of drugs metabolised by the CYP3A4 system (Bailey et al, 1998). A few of these drugs
reported in the literature are cyclosporine, terfenadine, midazolam and lovastatin (Fukuda et al,
2000).
The particular components in grapefruit juice responsible for the interaction and the exact
mechanism of the interaction have not been fully elucidated (Ho et al, 1998). However, the
selective down regulation of CYP3A4 content in the small intestine as proved by a decrease in
immunoreactive CYP3A4 content in enterocytes, is one of the suggested mechanism (Ohnishi et
al, 2000). From the recent findings on the inhibitory activity of nonflavonoid compounds, it is
probably that psoralens, mainly 6'7'-dihydroxybergamottin, in grapefruit juice are the
components responsible for the inhibition of the enzymes (Fuhr, 1998). Dihydroxybergamottin,
is a furancoumarin and mechanism-based or suicide inhibitor of CYP3A4 in the liver and
enterocytes. It shares this characteristic with other furancoumarins, including bergamottin, 8-
MOP and 5-MOP (Edwards et. al, 1999).
It was subsequently shown that 8-MOP was a potent, and rather selective, rapid inhibitor of
human liver microsomal cytochrome activity and is also capable of inhibiting most of the CYP
isoforms (Kaharasch et al, 2000). 8-MOP is therefore a potent suicide inhibitor of the enzyme
system (Labbe et al, 1989). Studies of Mays & co-workers (1987) showed that 8-MOP inhibits
the biotransformation of caffeine, hexobarbital and 5,s-diphenylhydantoin.
In many cases, where CYP is inhibited, p-glycoprotein inhibition may also occur (Kim et al,
1999). We speculate that 8-MOP may then also act as an inhibitor of p-glycoprotein, therefore
higher concentrations of cyclosporine stays in the body.
The present study was conducted to investigate the possibility that 8-MOP could also inhibit the
metabolism of cyclosporine and increased the bioavailability of the drug. The average AUC
of cyclosporine increased from 896.52 qg.h/ml to 1015.94 qg.h/ml (I]%), AUC at from 958.26
qg.h/ml to 1001.62 qg.h/ml (4%) and C, from 486.70 to 540.89 q g h l ( 10%) in the present
study. The t, values increased from 1.75 hours to 2.0 hours and the half-life from 3.27 to 3.39
(3%). The increase in AUCo, and C, was the only statistical significant results ( p = 0.04 and
0.004 respectively) in table 7.6. These results were confirmed with another statistical test were
both the parameters shown clinical significance (0.191 and 0.458 respectively for AUCo, and
C,) in table 7.9. Although an increase was observed it was lower than increases reported in the
literature when cyclosporine was combined with grapefruit juice. Ku & co-workers 1998 and
Yee et al, 1995 documented an increase of 45% and 30% respectively in AUC when grapefruit
juice was added to cyclosporine. The reasons for the discrepancy between the results in this
study and the literature can be one of the following:
Grapefruit iuice versus 8-MOP: It is speculated in the literature that a number of compounds in
grapefruit juice could be responsible for the effect and not the furancoumarin alone.
The dose of 8-MOP was below the saturation dose: It is advisable to use 8-MOP doses well
above the saturation process. Both inter- and intraindividual variability in plasma levels of 8-
MOP tends to be high at doses in the range of the saturation process. With 8-MOP the dose is
limited by the onset of systemic side effects like nausea. 0.4 - 12 mgkg 8-MOP are sufficient
for saturation of first-pass effect, only if the release rate is very quickly (Brick1 et al, 1984). In
this study the dose was 2.5 mgkg, which is relatively low. Considerable variation of both the
time (t,) and the height (C,) of the maximum serum concentrations of 8-MOP were observed
in the literature and this study. After oral administration, 8-MOP is subjected to extensive,
saturable 'first-pass elimination", which means that after administration of a low 8-MOP dose,
none or only small amounts of unchanged 8-MOP reaches the general circulation. With doses
higher than the "breakthrough dose", liver enzymes are saturated and serum concentrations of 8-
MOP rise rapidly (Stolk & Siddiqui, 1988).
Large interindividual variation in enzvrne activitv between individuals: Thummel & co-workers
(1994) showed that variation in liver content of CYP3A4 in liver transplant recipients accounted
for 66% of the interpatient variation in the clearance of intravenously administered cyclosporine.
In contrast, variation in liver CYP3A4 activity does not appear to account for a majority of the
interpatient variability in pharmacokinetics when cyclosporine is administered orally. Lown &
co-workers (1997) demonstrated that variation in liver CYP3A4 activity predicted only about
one third of the interpatient variability in the oral clearance ( 0 of cyclosporine in kidney
transplant patients. The basis for the remaining variation in CLlF is unknown. One possible
explanation may be related to the abundant expression of CYP3A4 in small bowel epithelial cells
(enterocytes). Several studies have indicated that intestinal CYP3A4 is responsible for
significant first-pass metabolism of orally administered cyclosporine. Lown & co-workers
(1997) have found that the enterocyte content of CYP3A4 protein correlates with its catalytic
activity (midazolam 1'-hydroxylation) and varies up to ten-fold among patients. Intestinal and
liver CYP3A4 expression does not appear to be co-ordinately regulated. It is possible for an
individual to have relatively high liver CYP3A4 activity while having relatively low intestinal
CYP3A4 activity or vica verca.
P-glyco~rotein: As with CYP3A4, there is significant interindividual variation in the intestinal
expression of p-glycoprotein. Given its transport function, high intestinal levels of p-
glycoprotein may interfere with drug absorption and contribute to the variation in cyclosporine
oral phannacokinetics (Lown et al, 1997).
The standard deviation on the pharmacokinetic parameters in this study declined when 8-MOP
was added. The SD on AUG., declined by 19% and on AUG, and C ,, by 3 and 5 %
respectively. Although the decrease was small it can be postulated that the interindividual
variation declined due to the inhibition of the enzymes both in the liver and the intestine. It was
postulated in the literature that the increase in bioavailability and decrease in variability is mainly
due to the reduction in gut wall metabolism (Duchanne et a1,1995).
An interesting observation of the study was the fact the 8-MOP levels decrease when the drug
was combined with cyclosporine. The AUCat values decreased from 439.72 to 330.22 (24%),
A U C h values from 440.45 to 330.24 (24%) and C,, values from 177.69 to 116.46 (34%)
(Table 7.8.). The 90% confidence intervals as calculated by Mann-Whitney were below the
conventional ranges. The difference was however not statistical significant for any of the
parameters. These results confirm the observation from the literature and this study that the
absorption of 8-MOP is highly variable.
The interaction between cyclosporine, 8-MOP and the p-glycoprotein played also an important
role. Cyclosporine is a p-glycoprotein inhibitor (Gottesmann & Pastan, 1993). If 8-MOP is a
substrate for p-glycoprotein, this would mean that higher concentrations of 8-MOP would remain
in the body when given together with cyclosporine resulting in higher plasma levels. The results
shown differently. The lower 8-MOP levels is either due to inconsistent absorption or that the
drug is eliminated by another transport system. We suggest that the formulation of cyclosporine
may decrease the absorption of 8-MOP, therefore, lower concentrations. We can see (Table
7.10.) that the 90% confidence interval changed, which indicated lower absorption of 8-MOP.

In the newer literature authors suggested more transport systems than p-glycoprotein. The
multidrug resistance-associated protein (MRP) is a membrane bound glycoprotein. Like p-
glycoprotein, MRP can cause resistance to a range of hydrophobic drugs (Zaman et al, 1994).
Organic anion transporting polypeptides OATl,OAT2 and OAT3 are a group of members of the
OAT-family and mediate the uptake of a variety of anionic compounds (Hosoyarnada er al, 1999,
Race er al, 1999, Sekine et al, 1998). A third transport system is the organic cation transporter
family (Holm, 2003).
It can also be speculated that another transport system takes over the elimination of 8-MOP when
cyclosporine inhibits p-glycoprotein.
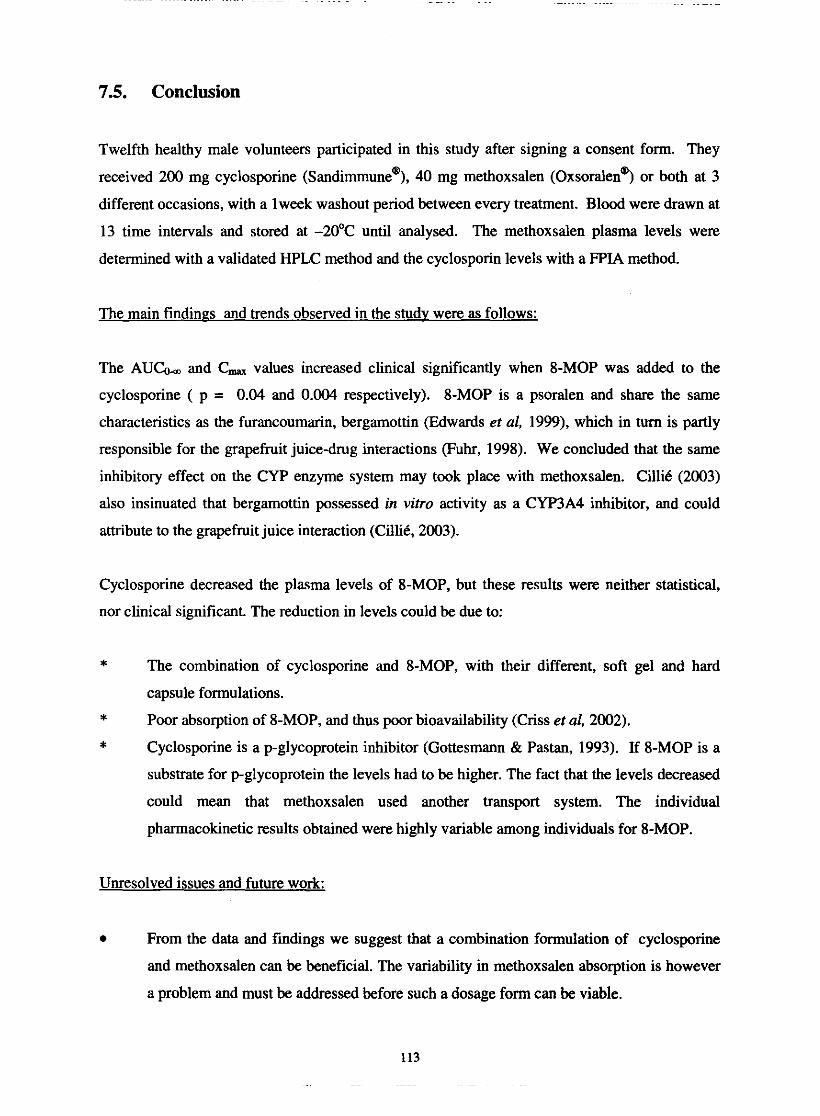
7.5. Conclusion
Twelfth healthy male volunteers participated in this study after signing a consent form. They
received 200 mg cyclosporine (~andirnmune~), 40 mg methoxsalen (Oxsoralenm) or both at 3
different occasions, with a lweek washout period between every treatment. Blood were drawn at
13 time intervals and stored at -20°C until analysed. The methoxsalen plasma levels were
determined with a validated HPLC method and the cyclosporin levels with a FPIA method.
The main findines and trends observed in the study were as follows:
The AUC@ and C,- values increased clinical significantly when 8-MOP was added to the
cyclosporine ( p = 0.04 and 0.004 respectively). 8-MOP is a psoralen and share the same
characteristics as the furancoumarin, bergamottin (Edwards et al, 1999), which in turn is partly
responsible for the grapefruit juice-drug interactions (Fuhr, 1998). We concluded that the same
inhibitory effect on the CYP enzyme system may took place with methoxsalen. Cilli6 (2003)
also insinuated that bergamottin possessed in vitro activity as a CYP3A4 inhibitor, and could
attribute to the grapefruit juice interaction (Cilli6,2003).
Cyclosporine decreased the plasma levels of 8-MOP, but these results were neither statistical,
nor clinical significant. The reduction in levels could be due to:
* The combination of cyclosporine and %MOP, with their different, soft gel and hard
capsule formulations. * Poor absorption of 8-MOP, and thus poor bioavailability (Criss et al, 2002).
* Cyclosporine is a p-glycoprotein inhibitor (Gottesmann & Pastan, 1993). If %MOP is a
substrate for p-glycoprotein the levels had to be higher. The fact that the levels decreased
could mean that methoxsalen used another transport system. The individual
pharmacokinetic results obtained were highly variable among individuals for 8-MOP.
Unresolved issues and future work:
From the data and findings we suggest that a combination formulation of cyclosporine
and methoxsalen can be beneficial. The variability in methoxsalen absorption is however
a problem and must be addressed before such a dosage form can be viable.

Investigations of the possibility of genetic polymorphism for the metabolism of
cyclosporine and methoxsalen.

7.6. References
BAILEY, C.G., KREEFT, J.H., MUNOZ, C., FREEMAN, D.J. & BEND, J.R. (1998).
Grapefruit juice-felodipine interaction: Effect of naringin and 6'7'-dihydroxybergamottin in
humans. Clinical pharmacology and therapeutics, 64(3):248-256.
BRICKL, R., SCHMID, J. & KOSS, F.W. (1984). Clinical pharmacology of oral psoralen
drugs. Photodermatology, 1 : 174- 185.
CILLI6, D. (2003). The interaction between bergamottin and felodipine: A dose-response
study. Potchefstroom : PU vir CHO. (Dissertation - MSc.) 213p.
CRISS, A.B., PAINE, M. & WATKINS, P.B. (2002). The two major furanocoumarins in
grapefruit juice have distinct absorption and protein binding characteristics. Drug metabolism
reviews, 34(1):338.
DUCHARME, M.P., WARBASSE, L.H. & EDWARDS, D.J. (1995). Disposition of
intravenous and oral cyclosporine after administration with grapefruit juice. Clinical
pharmacology and therapeutics, 57:485-491.
EDWARDS. D.J., mZSIMMONS, ME., SCHUETZ, E.G., YASUDA, K., DUCHARME,
M.P., WARBASSE, L.H., WOSTER, P.M., SCHUETZ, J.D. & WATKINS, P. (1999). 6'7'-
Dihydroxybergamottin in grapefruit juice and seville orange juice: Effects on cyclosporine
disposition, enterocyte CYP3A4, and P-glycoprotein. Clinical pharmacology and therapeutics,
651237-244.
FUHR, U. (1998). Drug interactions with grapefruit juice. Extent, probable mechanism and
clinical relevance. Drug safety, 18(4):251-272.
FUKUDA, K., GUO, L., OHASHI, N., YOSHIKAWA, M. & YAMAZOE, Y. (2000).
Amounts and variation in grapefruit juice of the main components causing grapefruit-drug
interaction. Journal of chromatography B, 741:195-203.
GO'ITESMAN, M.M. & PASTAN, I. (1993). Biochemistry of multidrug resistance mediated
by the multidrug transporter. Annual reviews of biochemisfry, 62385427.

HO, P.C., WANWIMOLRUK, S. & SAVILLE, D.J., (1998). Inhibition of CYP3A4 in human
liver microsomes by bioflavonoids and coumarin derivatives found in grapefruit juice.
Pharmacological sciences, l,S38,Suppl.
HOLM, C.A. (2003). An investigation of the effect of rifampicin on transport proteins present
in the bewo cell line. Potchefstroom : PU vir CHO. (Dissertation - D.Phil.) 136p.
HOSOYAMADA, M., SEKINE, T., KANAI, Y. & ENDOU, H. (1999). Molecular cloning and
functional expression of a multispecific organic anion transporter form human kidney.
American journal of physiology, 276:F122-F128.
KAHARASCH, E.D., HANKINS, D.C. & TARADAY, J.K. (2000). Single-dose methoxsalen
effects on human cytochrome P450 2A6 activity. Drug metabolism and disposition, 28(1):28-
33.
KIM, R.B., WANDEL, C., LEAKE, B., CVETKOVIC, M., FROMM, M.F., DEMPSEY, P.J.,
RODEN, M.M., BELAS, F., CHAUDHARY, A.K., RODEN, D.M., WOOD, A.J.J. &
WILKINSON, G.R. (1999). Interrelationship between substrates and inhibitors of human
CYP3A4 and p-glycoprotein. Pharmaceutical research, 16(3):408-414.
KU, Y.M., MIN, D.I. & FLANIGAN, M. (1998). Effect of grapefruit juice on the
pharmacokinetics of microemulsion cyclosporine and its metabolite in healthy volunteers: does
the formulation difference matter? Journal of clinicalpharmacology, 38:959-965.
LABBE, G., DESCATOIRE, V., BEAUNE, P., LElTERON, P., LARREY, D. & PESSAYRE,
D. (1989). Suicide inactivation of cytochrome P450 by methoxsalen. Evidence for the covalent
binding of a reactive intermediate to the protein moiety. The journal of pharmacology and
experimental therapeutics, 25q3): 1034-1042.
LOWN, K.S., MAYO, R.R., LEICHTMAN, A.B., HSIAO, H-L., TLJRGEON, K.,
SCHMIEDLIN-REN, P., BROWN, M.B., GUO, W., ROSSI, S.J., BENET, L.Z. & WATKINS,
P.B. (1997). Role of intestinal p-glycoprotein (mdrl) in interpatient variation in the oral
bioavailability of cycloporine. Clinical pharmacology and therapeutics, 62:248-260.
MAYS, D.C., NAWOOT, S., HILLIARD, J.B., PACULA, C.M. & GERBER, N. (1987).
Inhibition and induction of drug biotransformation in vivo by 8-methoxypsoralen: Studies of
caffeine, phenytoin and hexobarbital metabolism in the rat. The journal of pharmacology and
experimental therapeutics, 243(1):227-233.
OHNISHI, A., MATSUO, H., YAMADA, S., TAKANAGA, H., MORIMOTO, S, WKIHIRO,
S., OHTANI, H. & SAWADA, Y. (2000). Effect of furanocoumarin derivatives in grapefruit
juice on the uptake of vinblastine by caco-2 cells and on the activity of cytochrome P450 3A4.
British journal ofpharmacology, 130: 1360- 1377.
RACE, J.E., GRASSL, S.M., WILLIAMS, W.J. & HOLTZMAN, E.J. (1999). Molecular
cloning and characterisation of two novel human renal organic anion transportem (hOAT1 and
hOAT3). Biochemical and biophysical research communications, 255508-514.
SEKINE, T., CHA, S.H., TSUDA, M., APIWATTANAKUL, N., NAKAJIMA, N., KANAI, Y.
& ENDOU, H. (1998). Identification of multispecific organic anion transporter 2 expressed
predominantly in the liver. FEBS letters, 429: 179-182.
STOLK, L.M.L. & SIDDIQIU, A.H. (1988). Biopharmaceutics, pharmacokinetics and
pharmacology of psoralens. Generalpharmacology, 19(5):649-653.
THUMMEL, K.E., SHEN, D.D., PODOLL, T.D., KUNZE, K.L., TRAGER, W.F.,
HARTWELL, P.S. (1994). Use of midazolam as a human cytochrome P450 3A probe; I: in
vitro-in vivo correlations in liver transplant patients. The journal of pharmacology and
experimental therapeutics, 27 1 :549-556.
YEE, G.C., STANLEY, D.L., PESSA, L.J., DALLA COSTA, T., BELTZ S.E., RUE, J. &
LOWENTHAL, D.T. (1995). Effect of grapefruit juice on blood cyclosporin concentration.
Lancet, 345:955-956.
ZAMAN, G.J.R., FLENS, M.J., VAN LEUSDEN, M.R., DE HAAS, M., M ~ E R , H.S.,
LANKELMA, J., PINEDO, H.M., SCHEPER, R.J., BAAS, F., BROXTERMAN, H.J. &
BORST, P. (1994). The human multidrug resistance-assosiated protein MRP is a plasma
membrane drug-efflux pump. Proceedings of the National Academy of Sciences of the United
States of America, 91:8822-8826.
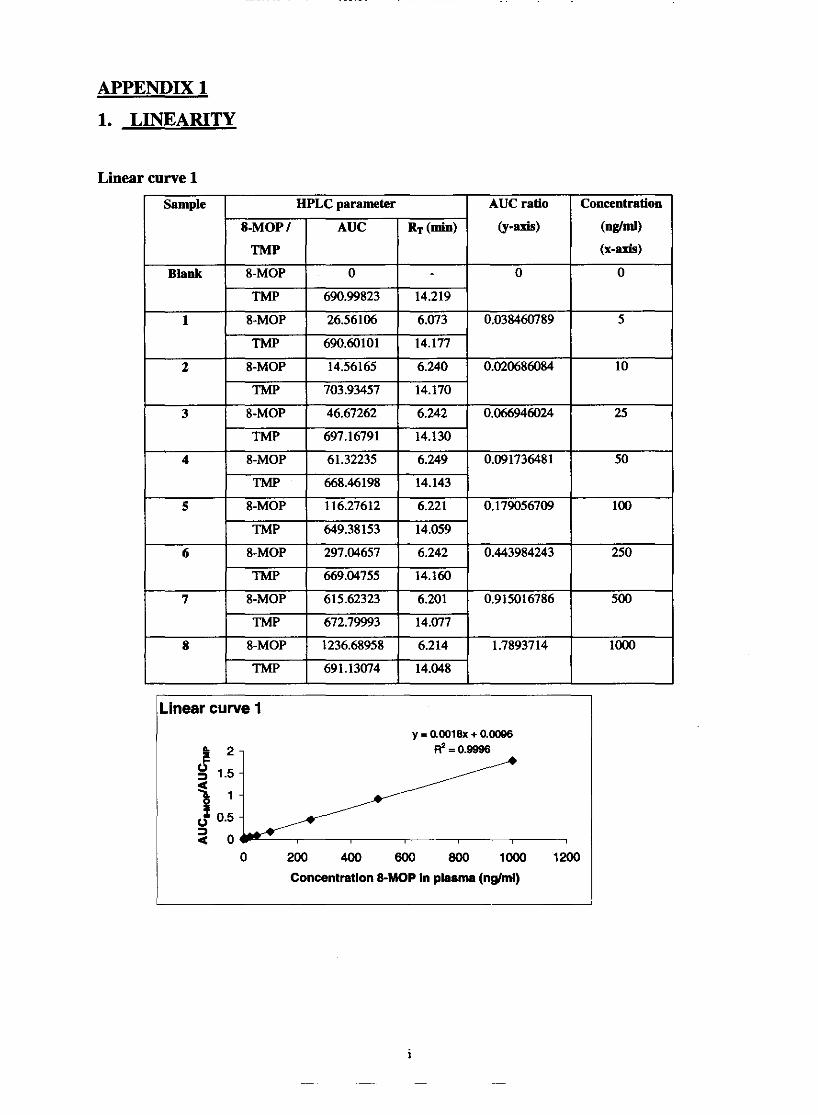
APPENDIX 1
1. LINEARITY
Linear curve 1
Linear curve 1
0 200 400 800 800 loo0 1200
Concentration 8-MOP In plasma (nglml)
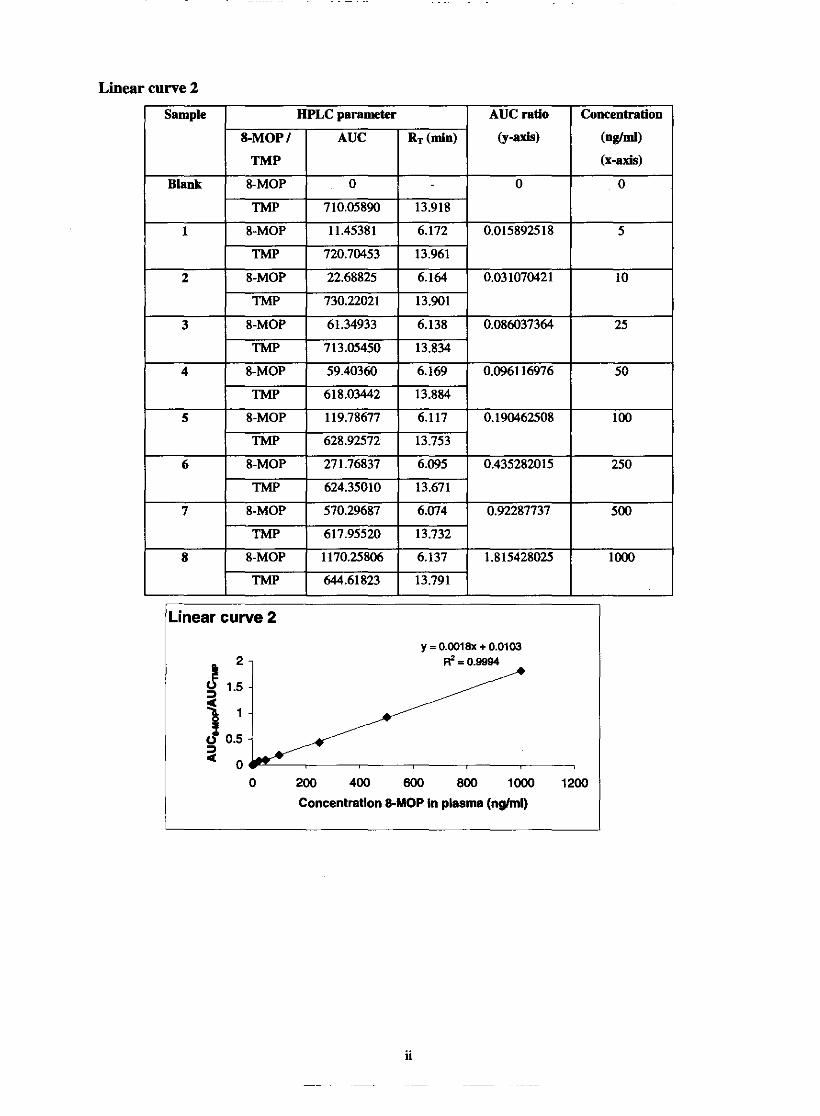
Linear curve 2
TMP 624.35010 13.671
7 8-MOP 570.29687 6.074 0.92287737 500
TMP 617.95520 13.732
8 8-MOP 1170.25806 6.137 1.815428025 lo00
TMP 644.61823 13.791
Linear curve 2
y = 0.0018X + 0.0103
0 200 400 600 800 loo0
Concentration 8-MOP in plasma (nghnl)

Linear curve 3
ine ear curve 3
0 200 400 600 800 lo00 1200
Concentration &MOP in plasma (nglml)
iii

.inear curve 4
0 200 400 600 800 1MX) 12(
Concentration &MOP in plasma (nglml)
Determination of linearity within chosen range
Y-intercept Concentration
Linear curve 1
Linear curve 2
Linear curve 3
Regression
range ( n g W
5-1000
5-1000
5-1000
Slope
Mean (n=3)
SD
%CV
cM~cient
0.99%
0.9994
0.9984
0.999133
0.00064291
0.064346788
0.0018
0.0018
0.0018
0.00%
0.0103
0.01 16
0.0018
0
0
0.0105
0.001014889
9.665609524
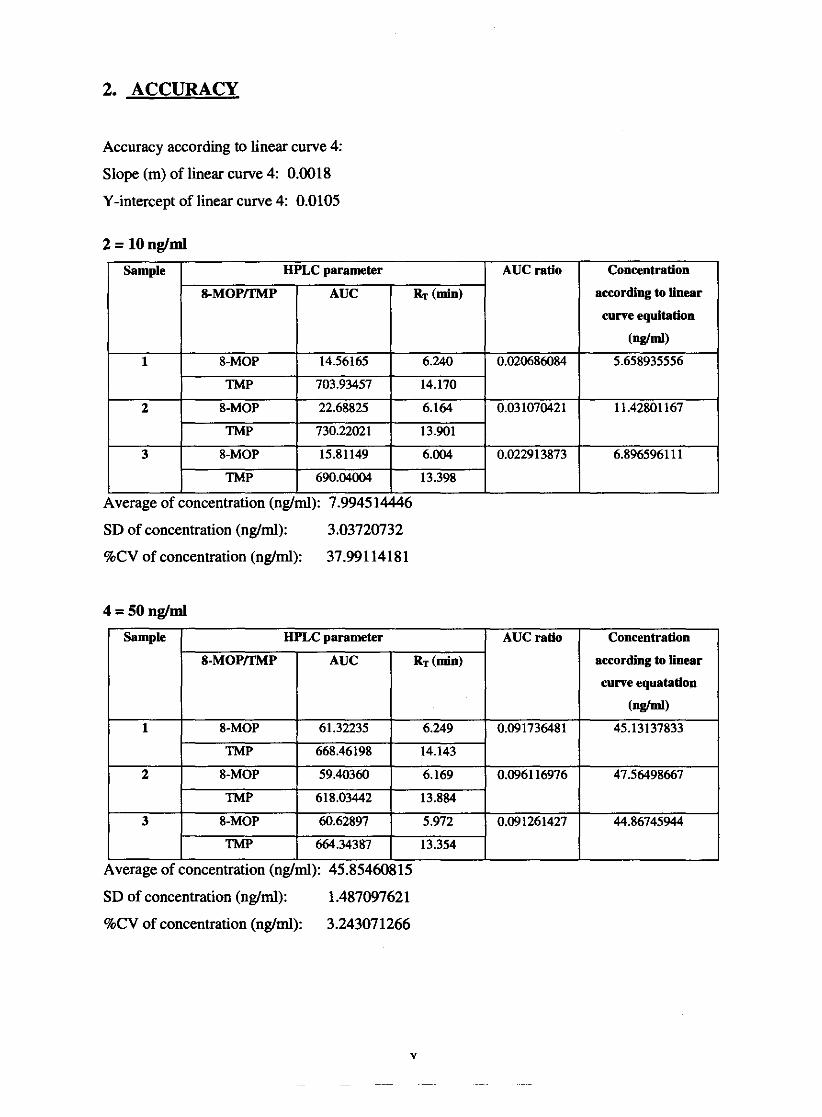
2. ACCURACY
Accuracy according to linear curve 4:
Slope (m) of linear curve 4: 0.0018
Y-intercept of linear curve 4: 0.0105
2 = 10 nglml
I Sample I HPLC parameter 1 AUCratio
8-MOP
8-MOP
8-MOP
TMP
Average of concentration (ng,
SD of concentration (nglml): 3.03720732
%CV of concentration (ngtml): 37.99114181
I I I I
Average of concentration (nglml): 45.85460815
2
3
SD of concentration (nglml): 1 A87097621
AUC ratio
TMP
8-MOP
TMP
8-MOP
TMP
Concentration
according to linear
curve equitation
(nglml)
Concentration
according to linear
curve equatation
( n g W
45.13137833
668.46198
59.40360
618.03442
60.62897
664.34387
%CV of concentration (nglml): 3.243071266
14.143
6.169
13.884
5.972
13.354

7 = 500 nglml
according to linear
curve equatation
Average of concentration (ng): 498.889233
SD of concentration (ng/ml): 10.286523 15
%CV of concentration (ng/ml)::2.061885178
8 = 1000 nglml
according to Linear
curve eqnatation
Average of concentration (ng/ml): 990.7304749
SD of concentration (nglml): 10.98314982
%CV of concentration (nglml): 1.10859 10%
Determination of accuracy -
Reference concentration
( n w ) 10 50 500 loo0
Concentration meamred ug/d
( n d ) 7.9945 14446 45.85460815 498.889233 990.7304749
SD
3.037207 1.487098 10.28652 10.98315
%CV
37.991 1378 3.243071266 2.061885178 1.108591095
% Recovery
79.945 15 91.70922 99.77785 99.07305

3. PRECISION
2 =
Average of AUC ratio: 0.024890126 SD of AUC ratio: 0.005466973 %CV of AUC ratio: 21.96442477
4 =
Average of AUC ratio: 0.093038295 SD of AUC ratio: 0.002676776 %CV of AUC ratio: 2.877069061
Sample
1
2
I I J 1.1'
Average of AUC ratio: 0.908500615 SD of AUC ratio: 0.018515742 %CV of AUC ratio: 2.038054968
1 TMP I 617.95520 1 13.732 I
8 =
Average of AUC ratio: 1.793814855
3
SD o f k c ratio: 0.01976967 %CV of AUC ratio: 1.102102034
AUC ratio
0.915016786
0.92287737
HPLC parameter
rii
8-MOP/TMP 8-MOP TMP - 8-MOP
I 705.90149 I 13.349 B
8-MOP 626.56360 5.990 71m
0.887607702
AUC 615.62323 672.79993 570.29687
RT (dn) 6.201 14.077 6.074
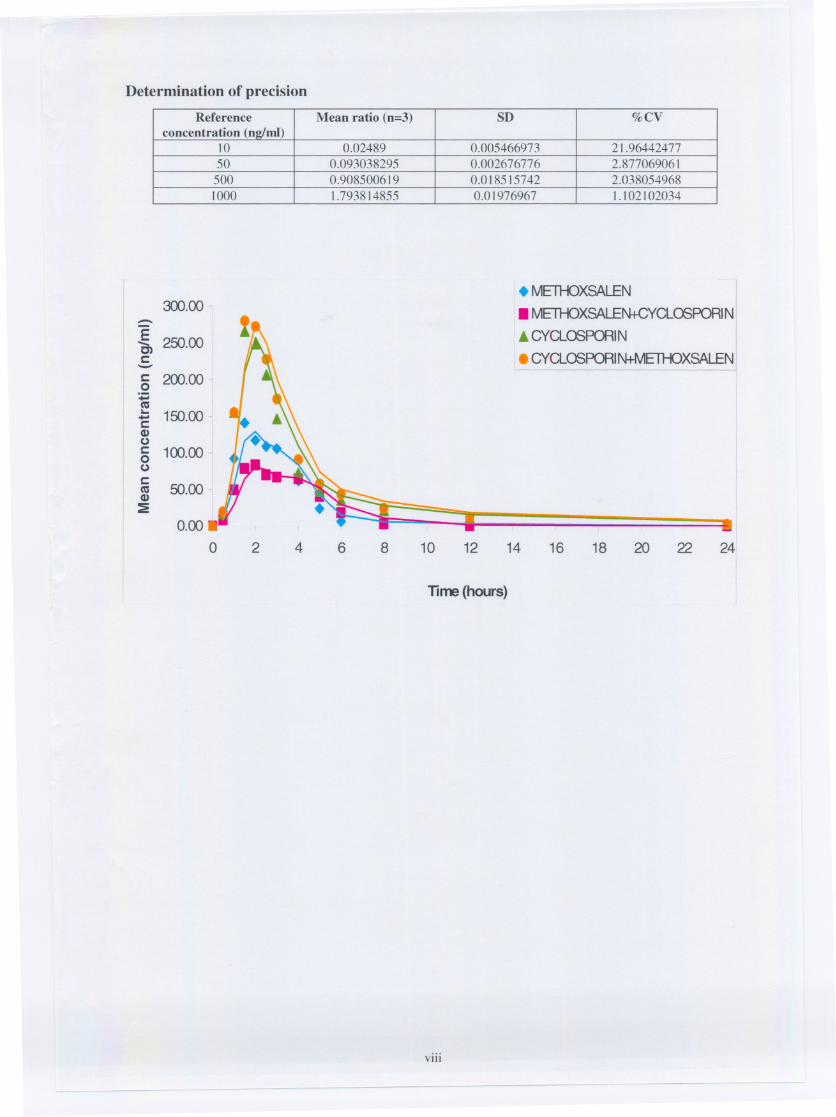
Determination of precision
. METHOXSALEN
. METHOXSALEN+CYCLOSPORIN
. CYCLOSPORIN
. CYCLOSPORIN+METHOXSALEN---------------
8 10 12 14 16 18 20 22 24
Time (hours)
VIII
-- - -
Reference Mean ratio (n=3) SD %CVconcentration (n2lml)
10 0.02489 0.005466973 21.9644247750 0.093038295 0.002676776 2.877069061500 0.908500619 0.018515742 2.0380549681000 1.793814855 0.01976967 1.102102034
300.00 -::::-Een 250.00c:-5 200.00..ca... 150.00--c:CI)uc: 100.000uc:
50.00caCI):E
0.00.
0 2 4 6